The European Club Footballing Landscape CLUB LICENSING BENCHMARKING REPORT FINANCIAL YEAR 2010

Welcome message from author
This document is posted to help you gain knowledge. Please leave a comment to let me know what you think about it! Share it to your friends and learn new things together.
Transcript

The European Club Footballing LandscapeCLUB LICENSING BENCHMARKING REPORT FINANCIAL YEAR 2010
The Europ
ean Club
Footballing Land
scape - C
LUB
LICE
NS
ING
BE
NC
HM
AR
KIN
G R
EP
OR
T FINA
NC
IAL Y
EA
R 2010
© UEFA 2011 All rights reserved.
UEFARoute de Genève 46CH-1260 Nyon 2SwitzerlandTelephone +41 848 00 27 27Telefax +41 848 01 27 27
ProductionUEFA
Authors Sefton Perry and Stephanie Leach
ContributorsMattias Grafström and Céline Bailo
Acknowledgements and special thanksThe club licensing network, in particular finance officers and licensing managers who submitted data and the UEFA Language Services.
EnquiriesEnquiries and comments to be addressed to Sefton Perry at [email protected]

BENCHMARKING REPORT FY10FOREWORD
02
Cover page: Excited supporters preparing for a match. 101 million supporters attended European top division domestic league matches in 2011, slightly below the peak of 104 million in 2009. This year sees a further development in club licensing with the introduction of a new club licensing requirement (SLO) aimed at encouraging improved communication between clubs and supporters.
This page: The image is a word cloud summarising the report content of this year’s highlights section.
HIGHLIGHTS INDEX

ForewordWelcome to the fourth edition of the Club Licensing Benchmarking Report, which analyses and comments on the governance and financial development of European club football.
This year’s edition is published amid another turbulent financial season.
Numerous football clubs, including some prestigious ones, have experienced severe financial difficulties, leading to top division clubs’ aggregate losses increasing again.
In this context, the unanimous consensus among the whole football family on the financial fair play concept becomes key in order to face the anticipated financial distress that other clubs are expected to suffer in the future. Keeping costs under control and within sustainable limits is and will continue to be the clubs’ biggest challenge.
Sustainability of the entire football sector is hence at the centre of the financial fair play philosophy, aimed
at balancing revenues with expenses and at boosting investments for the long-term health of the game.
This report provides an in-depth analysis of the current situation, allowing national associations, leagues and clubs to benchmark their performance and all readers to better understand the context in which clubs across the 53 UEFA member associations operate.
We would like to thank all member associations, leagues and clubs which provided their financial information and the whole club licensing network for their invaluable assistance. We hope you will enjoy this edition.
Michel PlatiniPresident of UEFA
03 BENCHMARKING REPORT FY10 - FOREWORDHIGHLIGHTS INDEX

INDEX
Introduction 08
Highlights 12
Club licensing and financial fair play01. Preparing for change: how is club licensing developing? 24
02. How many clubs have applied and been granted a licence to enter UEFA competitions? 26
03. When is licensing performed across Europe? 28
04. Why were clubs refused licences? 29
05. How many and which clubs have had to give up their competition places? 30
Competition profile of European club football 06. What is the most common size of top divisions and recent trends? 34
07. How are the domestic championships structured? 36
08. How many fans attended domestic championship matches across Europe? 37
09. What are the attendance trends in domestic championship matches? 38
10. How full are stadiums and how does this constrain growth? 40
11. What do club attendances tell us about league profiles? 41
12. What are the trends in UEFA club and country coefficients? 42
Long-term investment - youth football and head coaching 13. What impact have the locally trained player regulations had? 46
14. Which countries have had most success in youth football competitions? 48
15. What is the typical job length of European club head coaches and who are the great survivors? 50
16. What type and level of qualification do head coaches have? 51
17. Head coach migration – which coaches travel? 52
BENCHMARKING REPORT FY10INDEX
04HIGHLIGHTS INDEX

Financial profile of European club football: income 18. What are the five-year financial trends? 56
19. How much income did European clubs report last year? 58
20. What has been the income trend from year to year? 59
21. How do income levels differ between European top divisions? 60
22. How are the largest clubs spread across Europe? 61
23. How do average ticket prices compare across Europe? 62
Financial profile of European club football: costs and profitability 24. What did clubs spend their money on and how much did this increase? 66
25. How much did clubs spend on wages and player salaries? 68
26. How do spending levels vary between clubs in each league? 70
27. How does player spending differ between clubs? 71
28. What operating profits are clubs generating? 72
29. How do financing, divesting, non-operating items and tax impact on profits across Europe? 74
30. What proportion of clubs are loss making? 76
Financial profile of European club football: assets, debts & cash flows 31. What do we mean by debt and how do we assess it? 82
32. What are the legal structures and ownership structures of clubs and what do they own? 84
33. What value of assets and liabilities have clubs reported? 85
34. What level of transfer debts were owed by clubs? 86
35. Who are the auditors and what did they say about the clubs’ financial prospects? 87
36. How many clubs reported negative equity? 88
37. The bottom line – did club balance sheets strengthen or weaken during FY2010? 89
05 BENCHMARKING REPORT FY10 - INDEXHIGHLIGHTS INDEX

Financial profile of European club football: transfer review 38. How and when do clubs account for player transfers? 92
39. How does player accounting translate into profits and losses? 96
40. How did transfer activity impact on profits in FY2010? 98
41. What are the main trends in transfer spending over the last 16 years? 100
42. How does transfer activity in the winter and summer windows compare? 102
43. How does transfer spending compare to spending on wages? 103
44. What are the profiles (nationality, age, club) of the top 400 transfers? 104
45. Which clubs and countries have spent and made the most money from transfer activity? 106
Preparing for financial fair play 46. What are people saying about financial fair play? 110
47. How many and which clubs will have to meet the financial fair play requirements? 112
48. How are clubs currently doing on the breakeven rule? 114
49. How many clubs would currently be required to prepare updated figures? 116
50. What financial reporting dates do clubs use? 117
Appendices 118
BENCHMARKING REPORT FY10INDEX
06HIGHLIGHTS INDEX

07 BENCHMARKING REPORT FY10 - INDEXHIGHLIGHTS INDEX
BENCHMARKING REPORT FY10INTRODUCTION
8
BENCHMARKING REPORT FY10INTRODUCTION
08
IntroductionLast year we highlighted the ability of club football across Europe to continue growing during the challenging economic times. With no clear evidence that low growth in European economies is ending, it is once again reassuring to report another strong 6%+ increase in club incomes in 2010, reaching a record level of €12.8bn. Indeed if we look back between the five years from 2006 to 2010, we see that the aggregate income of football clubs increased by a remarkable 42% at a time when Europe’s economies expanded by just 1%. While the big headline figures are always heavily influenced by the development of TV deals in the larger countries, it is pleasing to report that growth in club football income was widespread, outpacing the level of national economic growth in 49 of the 53 UEFA member national associations. While it is not correct to say that football is “recession-proof”, with clear signs of pressure on gate receipts in particular emphasising the squeeze on football supporters’ disposable income, it is certainly fair to describe club football as “recession-resilient”.
For the first time in a number of years, aggregate employee salaries and costs across Europe were also kept relatively in check, growing at the same rate as income and remaining at 64% of income. However, with 78 clubs spending more than 100% of their income on salaries and many reported issues with payment, there are clearly still some major issues with clubs overstretching themselves.
Indeed, the figure for headline net losses in 2010 of €1.6bn, following on from the previous record €1.2bn losses in 2009, makes for pretty grim reading. While hundreds of clubs were able to balance their books, many others were not able or willing to do likewise. Close investigation into the losses indicates that the increase of €400m in losses arose almost exclusively from increased transfer losses, which in turn was caused by a slowdown in transfer activity during the 2010 financial year. The fact that a slowdown in transfer spending can lead to an increase in short-term losses is somewhat counter-intuitive, and we take considerable time in the report to explaining why this can be the case.
The results also highlight a couple of factors that were widely discussed during the development of financial fair play: first, that salaries may be important but they are not the only costs that football clubs face, hence the need for a break-even rule covering all costs rather than a salary cap; and second, the fact that the transfer cycle means financial results need to be looked at over a number of years rather than for a single year in isolation, as reflected in the financial fair play break-even rule, whereby clubs will be assessed across multiple years. While the increase in losses could therefore prove to be a temporary timing effect, a note of concern still needs to be expressed. The cold hard fact remains that we have now documented increasing losses for five successive years. With more than one in four clubs spending €6 for every €5 in income, the dependency of many of Europe’s clubs on benefactors remains. With results on the pitch difficult to predict and long-term employment contracts committing clubs to future costs, this reliance on someone picking up the bill does not come without risks.
This report does much more, however, than simply track the financial position and results of club football. Many of the non-financial research included in this report offers much encouragement by pointing to the in-depth strength of European football. We can see the ascendancy of many of the smaller east Europe nations in different types of analysis. For example, we can see the early benefits of UEFA EURO 2012™ for the host countries, with increases in Polish and Ukrainian club football attendances. Analysing UEFA club coefficients over ten years, we also see improvements in the situations of Romania, Belarus, Serbia and Azerbaijan. Elsewhere, we document success and participation in UEFA youth level competitions which shows that 40 different national associations have successfully reached the final stages of UEFA youth competitions in recent years. Staying with the theme of youth, our research also shows that an Under-21 player was 50% more likely to get the chance to play in the group stages of the UEFA Champions
league in 2010/11 than was the case ten years ago. Many of these developments are based on the quality of coaching, and the report highlights that 96% of head coaches in UEFA club competitions had received a UEFA-approved coaching licence from one of the 53 national associations.
In this context, the UEFA Club Licensing and Financial Fair Play Regulations continue to have a strong development role, encouraging the raising of standards across Europe in many areas, including financial, legal, youth, infrastructure and sporting areas. The financial fair play sections are aimed specifically at encouraging clubs to better manage their cost structure and to achieve a sustainable balance between income, spending and investments. If the new regulations were applied today, several clubs would fail to comply with them, in particular the break-even rule, which is the cornerstone of the financial fair play concept. It is therefore important for clubs to continue to adapt their long-term strategies very quickly because their actions today will have an impact on their financial results tomorrow. Improving standards in governance is the overall objective pursued by UEFA, and the new requirements support this aim. In addition to the financial fair play requirements, other equally important measures have been adopted, such as the obligation for clubs to disclose spending on agents’ fees, the obligation for clubs to disclose the identity of the ultimate club owners, and the obligation for clubs to appoint a supporter liaison officer to improve and manage the relationship with the fans.
The implementation of the new rules will represent a huge challenge for several clubs. Nevertheless, UEFA is convinced that only by dealing with the current difficulties in a systemic way will fair competitions be ensured and financial discipline and stability in the long term be enhanced.
Andrea TraversoHead of Club Licensing and Financial Fair Play
HIGHLIGHTS INDEX

9 BENCHMARKING REPORT FY10 - INTRODUCTION09 BENCHMARKING REPORT FY10 - INTRODUCTION
Context of the reportAs in previous versions of the club licensing benchmarking report, this edition covering the 2010 financial year (FY2010) does not profile individual clubs but represents an analysis of European club football as a whole, providing national associations, leagues and clubs with information for comparison. Information contained in this report, unless otherwise mentioned, is sourced directly from clubs that submitted financial information to their national associations as part of the club licensing requirements.
This year’s report covers figures from the financial statements of 665 (90%) of all top division clubs and almost 98% of all estimated revenues and costs. Its production was only possible thanks to the strong input and support of the national licensing managers, to whom we extend our thanks.
Chapter 1 – Club licensing and financial fair play:Explains recent developments in club licensing, licensing results, the timing of club licensing decisions across Europe and the reasons for licence refusals.
Chapter 2 – Competition profile of European club football:Presents information on the size and structure of domestic championships, average attendances, attendance hot spots and attendance trends across Europe, stadium capacity constraints, and trends in UEFA club and country coefficients.
Chapter 3 – Long-term investment – youth football and head coaching:Details trends in youth and locally trained players, national association participation and success in UEFA youth competitions, and club head coach profiles and migration.
Chapter 4 – Financial profile of European club football – income:Presents Europe-wide five-year financial trends. Outlines income split (broadcasting, advertising and sponsorship, gate receipts and other income) and trends, the spread of clubs, and average ticket prices in different countries.
Chapter 5 – Financial profile of European club football – costs and profitability:Examines employee costs and other operating costs and trends, the impact of financing and other non-operating activities on club financial results, and operating and bottom-line net profitability trends and the drivers behind these trends.
Chapter 6 – Financial profile of European club footballl – assets, debts & cash flows:Looks at the balance sheets of European football clubs, types of assets, debts and other liabilities. It provides information on how clubs are financed and on the level of capitalisation and trends.
Chapter 7 – Financial profile of European club footballl – transfer review:A new section reviewing the major transfer activity and trends over the last 16 years, the relative use of winter transfer windows, trends in transfer ratios and indices, and how transfer activity feeds into clubs’ financial statements.
Chapter 8 – Preparing for financial fair play:This chapter looks at the UEFA Club Licensing and Financial Fair Play Regulations, conducts a financial fair play break-even simulation and analyses the results to see how many and which clubs will have to meet the financial fair play requirements.
The report is structured in eight chapters that follow a brief section illustrating main highlights:
HIGHLIGHTS INDEX

BENCHMARKING REPORT FY10INTRODUCTION
10
This year, the financial analysis includes pan-European year-on-year and five-year trends (aggregate and by number of clubs), country by country data and a split of clubs within each country across a range of important financial measures. At times, peer groups of clubs and leagues are also referenced.
As in previous years, using these peer groups first enables differences to be identified and highlighted throughout the report and, second, allows more relevant comparisons to be made between countries with similar-sized clubs. UEFA licensing and financial experts typically use these types of tailored peer comparisons when meeting clubs, leagues and national associations across Europe.
For this purpose, five comparison peer groups [top, large, medium, small and micro] have been created using the same basis and thresholds as the previous year and refer either to divisions or to clubs, as presented in the chart to the right.
Peer groups divisions** refer to all the reporting clubs of a specific national association. Classification is based on the average income*** of all the clubs.
Peer group clubs**** is based on individual club income regardless of the division they play in.
The financial information included in this report derives directly from third-party audited financial statements from the 2010 financial year, which provides considerable comfort as to the accuracy and completeness of the data*. For most analyses it has been possible to collect information covering the full sample of 665 clubs and 53 top divisions. In other cases, the full details may not be available or considered robust and reliable enough to include in the analysis, in which case a slightly smaller sample of divisions and clubs is used and mentioned in the footnotes.
To use an approach that is consistent with the previous year and allows year by year development to be tracked, the thresholds of the five comparison peer groups have been kept the same***. Not surprisingly, the five countries in the “top” peer group remain the same, but there are some changes elsewhere. Poland return to the “large” group and Serbia move back up to the “medium” group, with Ireland replacing them in the “small” peer group. Elsewhere Georgia move up to the “small” group, swapping places with Estonia.
The composition of the peer group clubs has also changed slightly, with the number of “top” clubs reporting revenue >€50m increasing from 68 to 73.
Footnotes: * Despite the use of audited accounts and the specified financial disclosures required for UEFA licensing, accounting frameworks still differ between countries. In football clubs, the accounting for registration of players, income recognition from competition participation or commercial contracts and the recording of signing-on bonuses and non-salary player benefits are some of the areas where differences can occur. Work on identifying the different application of these main areas continues, but for now the only adjustment made to reported figures has been to exclude some double-counted grossed-up TV and gate revenues reported by Italian clubs to make the figures more comparable with the other four “top” leagues and clubs.
** Reference to division peer groups is used for ease of explanation rather than “member association clubs” or “average income of clubs in the top division”. For the peer group selection, an estimated average income figure has been used to cover any missing clubs.
***Average income for clubs belonging to each peer group is €50m>, €5m–€50m, €1.25–€5m, €350K–€1.25m and <€350,000 respectively.
****Although the selection is based on income rather than sporting performance, in effect most of the clubs that regularly compete in the UEFA Champions League are included in the 73 clubs that comprise the “top” club peer group, while most of the clubs competing in the UEFA Europa League are included in the 199 clubs that comprise the “large” club peer group.
HIGHLIGHTS INDEX

11 BENCHMARKING REPORT FY10 - INTRODUCTION
PEER GROUP Peer group members - by national licensor Revenue by club2010
PG Size2009
PG Size2010
PG Size2009
PG Size
MICRO 119 1188 8 < €350,000ALB AND ARM
GEO
MLT MKDSMR WAL
665 664
SMALL 136 13916 16 €350,000 - €1.25M
AZE
EST
FRO MNE BIH BULISLLVA LIELTULUX NIR MDA FIN
SRB
SVN
MED 138 15510 11 €1.25M - €5MBLR CYP CZE ISRKAZHUN
IRL
SVKCRO
POL
ROU
LARGE 199 18814 13 €5M - €50M
AUTDEN BELGRENOR POR RUSSCOSUISWE TURUKR NED
TOP
ESPFRA GERITA
€50M + 73 685 5
ENG
UEFAGroup Stage
0
80
0
7
37
36
€50m €135m
€5m €50m
€1.25m €5m
€350,000 €1.25m
€80,000 €350,000
HIGHLIGHTS INDEX

BENCHMARKING REPORT FY10HIGHLIGHTS
12
Highlights
HIGHLIGHTS INDEX
13 BENCHMARKING REPORT FY10 - HIGHLIGHTSHIGHLIGHTS INDEX

BENCHMARKING REPORT FY10HIGHLIGHTS
14HIGHLIGHTS INDEX
Club licensing
The number of club licences granted (left) and refused (right) for the UEFA seasons 2004/05 – 2011/12.
The proportion of minutes played by locally trained players during the 2010/11UEFA club competition group stages, the proportion remaining stable
over the last five seasons despite the on going globalisation of the player market.
The number of UEFA member associations whose teams havereached the final stages of UEFA youth competitions in the last 20 years (left) and
the number of associations whose teams have won those competitions (right).
The average number of months that European top division club coaches have "survived" (left) and the average age in years of these 500+ head coaches (right).
Long term investment – youth and coaching
The average number of club trained players on the pitch for each club in UEFAChampions League group matches, an increase from 2.16 in the season before
the introduction of UEFA home grown player rules. The average number fieldedduring a match was 3.2.
The proportion of European top divisionscontaining either 12 or 16 teams, the mostpopular league sizes (left) and the number
of leagues that changed their size between2011 and 2012 (right).
The number of top divisions structured in‘classical’ style with either one or two
rounds of home and away fixturesbetween all clubs. A wide variety of alternative
structures exists in the other 22 leagues.
Competition profile ofEuropean club football
The number of clubs which appealed against their licence refusal from their national first instance body. All clubs have the opportunity to appeal to an independent appeals body.
The proportion of reasons for licence refusal that were not financial criteria.Whilst financial criteria were the most commonly failed criteria type the licensing system covers many different areas.
Reported attendances at domestic top divisionchampionship matches in Europe in the last
completed season, slightly up on the previous yearbut below the 104 million peak of 2008/09.
The number of top division clubs averagingmore than 75% capacity during the last
completed season, the majority from England,Germany and the Netherlands.

15 BENCHMARKING REPORT FY10 - HIGHLIGHTSHIGHLIGHTS INDEX
Club licensing
The number of club licences granted (left) and refused (right) for the UEFA seasons 2004/05 – 2011/12.
The proportion of minutes played by locally trained players during the 2010/11UEFA club competition group stages, the proportion remaining stable
over the last five seasons despite the on going globalisation of the player market.
The number of UEFA member associations whose teams havereached the final stages of UEFA youth competitions in the last 20 years (left) and
the number of associations whose teams have won those competitions (right).
The average number of months that European top division club coaches have "survived" (left) and the average age in years of these 500+ head coaches (right).
Long term investment – youth and coaching
The average number of club trained players on the pitch for each club in UEFAChampions League group matches, an increase from 2.16 in the season before
the introduction of UEFA home grown player rules. The average number fieldedduring a match was 3.2.
The proportion of European top divisionscontaining either 12 or 16 teams, the mostpopular league sizes (left) and the number
of leagues that changed their size between2011 and 2012 (right).
The number of top divisions structured in‘classical’ style with either one or two
rounds of home and away fixturesbetween all clubs. A wide variety of alternative
structures exists in the other 22 leagues.
Competition profile ofEuropean club football
The number of clubs which appealed against their licence refusal from their national first instance body. All clubs have the opportunity to appeal to an independent appeals body.
The proportion of reasons for licence refusal that were not financial criteria.Whilst financial criteria were the most commonly failed criteria type the licensing system covers many different areas.
Reported attendances at domestic top divisionchampionship matches in Europe in the last
completed season, slightly up on the previous yearbut below the 104 million peak of 2008/09.
The number of top division clubs averagingmore than 75% capacity during the last
completed season, the majority from England,Germany and the Netherlands.

BENCHMARKING REPORT FY10HIGHLIGHTS
16HIGHLIGHTS INDEX
Europe-wide financial results and five year trends
The number of financial statements on which the club-by-club financial analysis is based, covering an estimated 98% of all top division club revenues.
Average match day revenue per spectator estimated for Spanishand English clubs. The next highest average was less than €35 per
spectator and the divisional average €11.
Club revenues
The average reported revenue of English clubs (left) comparedto the average reported revenue of clubs from San Marino (right).
The percentage of european club revenuespaid out in salaries and social charges,
the same percentage as in the previous year.
The number of clubs spending above 100% oftheir revenue on wages, increased from 73 in
the financial year 2009 and 55 in financial year 2008. The figure includes 5 clubs competing
in this season’s UEFA Champions League and UEFA Europa League group stages.
Salaries
The proportion of countries where football club income growth has outpaced the growth in their economies.
The reported income of the 734 European top division clubs in financial year 2010 (left) and the average income growth per year over the last five years (right).
The difference (top right) in net spending on transfersand salaries between the ten clubs at the top ofthe market and the next ten clubs. The amount
(bottom right) by which this net spending differenceincreased from financial year 2009 to 2010.
The reported net transfer and salary costs of the 734 European top division clubs in financial year 2010 (left) and the average growth per year over the last five years (right).
The proportion of the largest fifteen top divisions that reportedrevenue growth with clubs from Russia, Turkey and Ukraine
growing the fastest on average.

17 BENCHMARKING REPORT FY10 - HIGHLIGHTSHIGHLIGHTS INDEX
Europe-wide financial results and five year trends
The number of financial statements on which the club-by-club financial analysis is based, covering an estimated 98% of all top division club revenues.
Average match day revenue per spectator estimated for Spanishand English clubs. The next highest average was less than €35 per
spectator and the divisional average €11.
Club revenues
The average reported revenue of English clubs (left) comparedto the average reported revenue of clubs from San Marino (right).
The percentage of european club revenuespaid out in salaries and social charges,
the same percentage as in the previous year.
The number of clubs spending above 100% oftheir revenue on wages, increased from 73 in
the financial year 2009 and 55 in financial year 2008. The figure includes 5 clubs competing
in this season’s UEFA Champions League and UEFA Europa League group stages.
Salaries
The proportion of countries where football club income growth has outpaced the growth in their economies.
The reported income of the 734 European top division clubs in financial year 2010 (left) and the average income growth per year over the last five years (right).
The difference (top right) in net spending on transfersand salaries between the ten clubs at the top ofthe market and the next ten clubs. The amount
(bottom right) by which this net spending differenceincreased from financial year 2009 to 2010.
The reported net transfer and salary costs of the 734 European top division clubs in financial year 2010 (left) and the average growth per year over the last five years (right).
The proportion of the largest fifteen top divisions that reportedrevenue growth with clubs from Russia, Turkey and Ukraine
growing the fastest on average.

BENCHMARKING REPORT FY10HIGHLIGHTS
18HIGHLIGHTS INDEX
Profitability and losses
The combined net operating losses of European clubs before transfer activity, financing, divestment and tax (left). The percentage of clubs reporting operating losses (right).
The percentage of loss making clubs in European top division football (left), the same high level as previous year and the even higher percentage of loss making clubs participating in this season’s UCL and UEL group stages (right).
The combined net ‘bottom line’ losses, after all incomes and expenses, reported by top division clubs in financial year 2010, an increase of €435 million on 2009 figures mainly driven by a slow down in transfer activity.
Europe-wide financial position
The reported assets of the 734 European top division clubs in FY2010.
The reported amounts payable on transfer fees of European clubs. A reduction of €300m from the previous year.
Transfer fees scheduled to be paid in the long term in more than a year’s time, 33% of the overall transfer debts.
The proportion of clubs where the auditors expressed “going concern” doubts (whether the club could still trade normally in 12 months time).
Percentage of clubs reporting negative net equity – debts larger than reported assets; down slightly from 37% in the previous year.
The reported liabilities of the 734 European top division clubs in FY2010.
The value (left) wiped off the balance sheets of clubs in FY2010 and the value (right) injected into the balance sheets of clubs resulting in a net improvement of €150m, reversing a recent negative trend.

19 BENCHMARKING REPORT FY10 - HIGHLIGHTSHIGHLIGHTS INDEX

Preparing for financial fair-play (FFP)
The percentage of clubs participating in this years UEFA club competitions that would have been exempt from the full break even requirements on the basis of size (left). All clubs (right) in UEFA competitions must have a valid club licence and now undergo additional testing for overdue payments on transfers and salaries.
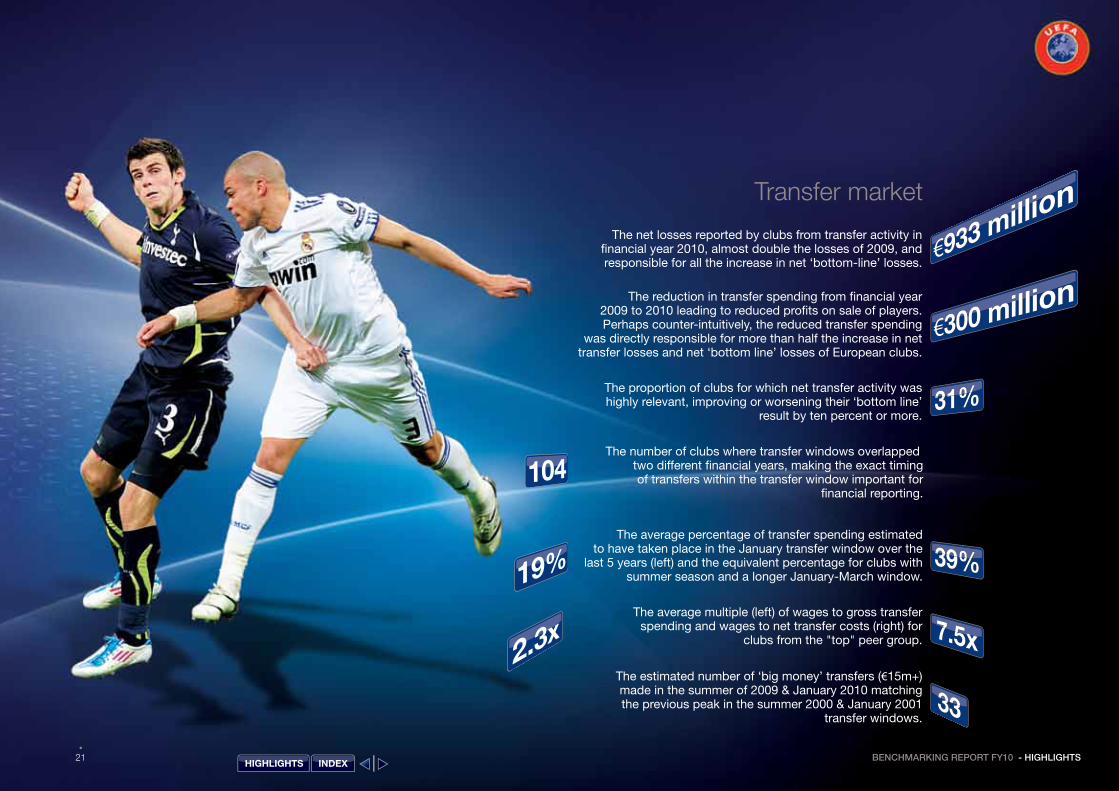
The reduction in transfer spending from financial year2009 to 2010 leading to reduced profits on sale of players.Perhaps counter-intuitively, the reduced transfer spending
was directly responsible for more than half the increase in nettransfer losses and net ‘bottom line’ losses of European clubs.
Transfer market
The net losses reported by clubs from transfer activity infinancial year 2010, almost double the losses of 2009, andresponsible for all the increase in net ‘bottom-line’ losses.The number of clubs competing in this years UEFA club competitions
that would have had cumulative break even deficits of more than €45m across the three financial years, 2008, 2009 and 2010. A further seven clubs were not in this season's competitions.
The number of clubs competing in this year’s UEFA club competitions that would have had cumulative break-even deficits of between €5m and €45m, necessitating capital injections. Twelve of these clubs fully covered their shortfall between 2008 and 2010.
The percentage of clubs participating in this years UEFA club competitions that would have failed at least one FFP indicator in financial year 2010 and hence would have been required to supply additional information (full regulations not in force until 2013).
The proportion of clubs for which net transfer activity washighly relevant, improving or worsening their ‘bottom line’
result by ten percent or more.
The number of clubs where transfer windows overlapped two different financial years, making the exact timingof transfers within the transfer window important for
financial reporting.
The average percentage of transfer spending estimatedto have taken place in the January transfer window over the
last 5 years (left) and the equivalent percentage for clubs withsummer season and a longer January-March window.
The average multiple (left) of wages to gross transferspending and wages to net transfer costs (right) for
clubs from the "top" peer group.
The estimated number of ‘big money’ transfers (€15m+)made in the summer of 2009 & January 2010 matchingthe previous peak in the summer 2000 & January 2001
transfer windows.
BENCHMARKING REPORT FY10HIGHLIGHTS
20HIGHLIGHTS INDEX
Preparing for financial fair-play (FFP)
The percentage of clubs participating in this years UEFA club competitions that would have been exempt from the full break even requirements on the basis of size (left). All clubs (right) in UEFA competitions must have a valid club licence and now undergo additional testing for overdue payments on transfers and salaries.
The reduction in transfer spending from financial year2009 to 2010 leading to reduced profits on sale of players.Perhaps counter-intuitively, the reduced transfer spending
was directly responsible for more than half the increase in nettransfer losses and net ‘bottom line’ losses of European clubs.
Transfer market
The net losses reported by clubs from transfer activity infinancial year 2010, almost double the losses of 2009, andresponsible for all the increase in net ‘bottom-line’ losses.The number of clubs competing in this years UEFA club competitions
that would have had cumulative break even deficits of more than €45m across the three financial years, 2008, 2009 and 2010. A further seven clubs were not in this season's competitions.
The number of clubs competing in this year’s UEFA club competitions that would have had cumulative break-even deficits of between €5m and €45m, necessitating capital injections. Twelve of these clubs fully covered their shortfall between 2008 and 2010.
The percentage of clubs participating in this years UEFA club competitions that would have failed at least one FFP indicator in financial year 2010 and hence would have been required to supply additional information (full regulations not in force until 2013).
The proportion of clubs for which net transfer activity washighly relevant, improving or worsening their ‘bottom line’
result by ten percent or more.
The number of clubs where transfer windows overlapped two different financial years, making the exact timingof transfers within the transfer window important for
financial reporting.
The average percentage of transfer spending estimatedto have taken place in the January transfer window over the
last 5 years (left) and the equivalent percentage for clubs withsummer season and a longer January-March window.
The average multiple (left) of wages to gross transferspending and wages to net transfer costs (right) for
clubs from the "top" peer group.
The estimated number of ‘big money’ transfers (€15m+)made in the summer of 2009 & January 2010 matchingthe previous peak in the summer 2000 & January 2001
transfer windows.
21 BENCHMARKING REPORT FY10 - HIGHLIGHTSHIGHLIGHTS INDEX

BENCHMARKING REPORT FY10CLUB LICENSING AND FINANCIAL FAIR PLAY
22HIGHLIGHTS INDEX

23 BENCHMARKING REPORT FY10 - CLUB LICENSING AND FINANCIAL FAIR PLAY
1Club licensing and financial fair play
Preparing for change: how is club licensing developing?
How many clubs have applied for and been granted a licence to enter UEFA competitions?
When is licensing performed across Europe?
Why were clubs refused licences?
How many and which clubs have had to give up their competition places?
HIGHLIGHTS INDEX

BENCHMARKING REPORT FY10CLUB LICENSING AND FINANCIAL FAIR PLAY
24
01. Preparing for change: how is club licensing developing?Q:Q
Eight years since its introduction, there is little doubt that the UEFA club licensing system and its comprehensive implementation across Europe has contributed to raising quality in almost every aspect of off-pitch football club activities. The club licensing criteria assessed in 4,922 licence applications in the last eight years have, for many clubs, raised the bar and, for all clubs, guaranteed minimum quality levels across a range of criteria, including in the legal, personnel, stadium, coaching, youth football, financial and medical fields.
While club licensing is not the solution to every area that needs improving, and some requirements remain better suited to other regulations such as competition regulations, the UEFA Club Licensing Committee agreed on 27 May 2010 to broaden the horizons further.
As already mentioned in the preface and introduction to this report, the financial monitoring requirements introduced under the moniker of “financial fair play” represent an extremely significant development, one made possible by the existence of the current licensing system. During the summer and autumn of 2011, the UEFA administration and the Club Financial Control Panel (CFCP) have been checking the status of employee and transfer payables of all clubs that have participated in UEFA club competitions. On an ongoing basis we are also reviewing the finances of clubs in the light of the breakeven rule that will first be assessed in the summer and autumn of 2013. A simulation exercise is included later in this report.
Although probably not as newsworthy or ambitious, the broadening of licensing criteria from 1 June 2011 to include supporter-club relations (Article 35) is, nonetheless, a significant long-term step in the development of club licensing.This project was launched at a successful workshop held in Berlin with experts from clubs, supporter groups and leagues sharing thoughts with project coordinators from nearly all of the 53 UEFA member associations. The nature of club and club supporter issues and the wide variety in both the number and organisation of supporters across Europe have led to a very practical approach based on dialogue and recommendations, with a limited number of broad requirements.
The map to the right illustrates the extent to which countries in Europe have embraced club licensing, with forty eight countries annually licensing clubs for domestic purposes. Whilst the focus of the UEFA administration remains the club licensing and club monitoring of clubs for UEFA competitions, we plan to do a review of the nature and extent of domestic licensing systems in the next 12 months. One area for example where we will seek greater transparency relates to the domestic licensing assessment on transfer balances and whether this extends to international transfer balances. This is of particular importance since clubs undergoing club monitoring and licensing for UEFA competitions are impacted by the actions of clubs outside the scope of UEFA competitions.
Like all good regulation, club licensing has evolved significantly over the eight years and the Club Licensing Committee continues to meet to discuss relevant and topical issues, with a view to improving and updating the UEFA Club Licensing and Financial Fair Play Regulations.
HIGHLIGHTS INDEX

No domestic licensing applied 2011/12 5x
Domestic licensing system applied 2011/12 48x
25 BENCHMARKING REPORT FY10 - CLUB LICENSING AND FINANCIAL FAIR PLAYHIGHLIGHTS INDEX
BENCHMARKING REPORT FY10CLUB LICENSING AND FINANCIAL FAIR PLAY
26
02. How many clubs have applied for and been granted a licence to enter UEFA competitions?Q:Q
Every licence applicant club in any of the 53 national associations has the right to appeal to the national appeals body (AB) if it does not agree with the decision of the first instance body (FIB). In the 2011/12 season, 50 of the 133 clubs which were refused a licence by their first instance body appealed to their national appeals body, representing nearly 9% of overall applications and 38% of first instance body refusals.
HIGHLIGHTS INDEX

27 BENCHMARKING REPORT FY10 - CLUB LICENSING AND FINANCIAL FAIR PLAY
Answer: 02For the 2011/12 UEFA competition season, a total of 591 top division clubs applied for a club licence. The total number of clubs applying for a licence remained relatively stable compared with the previous season, with the number of clubs successfully granted a licence slightly up, at 490 clubs. Approximately 17% of applicant clubs (101 compared with 123 the previous season) fell short of the minimum licensing requirements.
As in previous seasons, more than half of the 53 national licensors refused a licence to at least one applicant club, with almost a third (16, down from 19 the previous season) refusing licences to more than 2 applicant clubs.
0
100
200
300
400
500
600
700
800
730 139
591 133 83
50 18
topdivisionclubs
clubs didnot apply
for a licence
clubsappliedfor a
licenceclubs
refusedlicenceby FIB
clubs didnot appeal
clubsappeal
clubs’ appealsrejectedby AB
490
clubs in total
granted licences
32
appeals upheld by AB and licence
granted
No. of applicant clubs (591) lower than 2007/08
peak of 655 due to spread of separate domestic licensing
Of 591applicant clubs, 24 did not
complete process
Total of 50 clubs (8.5%)
appealed
Majority of clubs62% accept FIB
decision
No. of appeals same as last
season
Compliance and/or assistance visits more
likely where UEFA qualifying club received licence on appeal
2011/12 club licensing decisions - by licensor
All applications granted by FIB
All applications granted after AB
1-2 applications refused
Upto half refused
More than half refused
3; 6%
20; 38%
5; 9%12; 23%
13; 24%
Club licensing decisions - top division clubs
Licence not applied for
Licences refused
Licences granted
0
100
200
300
400
500
600
700
800
2004/05 2005/06 2006/07 2007/08 2008/09 2009/10 2010/11 2011/12
Num
ber
of t
op-d
ivis
ion
club
s
478 500 531 554 503 498 488 490
106 99 114 101
126 110 123 101
123 108 73 74 104 122 122 139
HIGHLIGHTS INDEX

BENCHMARKING REPORT FY10CLUB LICENSING AND FINANCIAL FAIR PLAY
28
03. When is licensing performed across Europe?Q:Q
Each of the 53 national association licensors sets their own timetable for their decision-making bodies and defines and communicates this to their clubs. The key core process deadline date is 31 May, by when the list of licensed clubs must be submitted to UEFA. In 2011, Lithuania and Iceland’s licensing decisions were taken considerably earlier than in other countries as the domestic season is played in the summer (starting in April/May) and a single licensing system with a single decision for domestic and UEFA competition is in place. In other countries, the decision-making bodies make their decisions in April/May.
140
120
100
80
40
60
20
0
160
Timeline of licensing decisions (UEFA licence) by WEEK
Appeals Body
Wee
k end
ing 2
7 Fe
b
Wee
k end
ing 6
Mar
Wee
k end
ing 1
3 M
ar
Wee
k end
ing 2
0 M
ar
Wee
k end
ing 2
7 M
ar
Wee
k end
ing 3
Apr
Wee
k end
ing 1
0 Apr
Wee
k end
ing 1
7 Apr
Wee
k end
ing 2
4 Apr
Wee
k end
ing 1
May
Wee
k end
ing 8
May
Wee
k end
ing 1
5 M
ay
Wee
k end
ing 2
2 M
ay
Wee
k end
ing 2
9 M
ay
30-3
1 M
ay
Unkno
wn
First Instance Body
24.02 LTU
08.03 ISL
30.03 CRO MLT
04.04 WAL 08.04 BEL LUX
15.04 SWE 17.04 ISR
18.04 GRE 19.04 ENG GER SCO 20.04 SUI
22.04 SVN
27.04 HUN MNE 28.04 AUT NOR 29.04 AZE KAZ POR SRB
02.05 DEN LIE
03.05 EST NIR SVK 04.05 BIH IRL SMR 05.05 CZE 06.05 ITA
MKD TUR
10.05 ARM 11.05 AND FIN POL 12.05 ALB BLR BUL HUN 13.05 ESP GEO LVA RUS 14.05 ROU
16.05 UKR 17.05 NED 18.05 MDA 19.05 CYP 20.05 FRO 31.05
FRA
09.03 LTU
27.04 CRO 28.04 WAL
02.05 GRE
11.05 AUT 13.05 POR
19.05 LUX 20.05 MNE 24.05
CZE ESP 25.05 AND BIH MKD 26.05 SVN 27.05 POL SVK
30.05 MDA 31.05 ROU SRB
NOR
Footnote: In some cases, the first instance body and/or appeals body made decisions across more than one day. In this case, the national association is shown in the chart by (i) the UEFA qualified clubs (ii) the date when most decisions were taken.
Answer: 03The majority of licensor core process (first instance body) decisions are spread over a five-week period, with most decisions being handed down in May. The most common timing was during the week of 2–8 May (12 national associations and 147 clubs) and the week after the second most common (13 national associations and 127 clubs.) The average period between first instance body and appeals body decisions was 20 days. There were appeals body decisions made during the final week before the deadline (25–31 May) by 11 of 20 licensors.
HIGHLIGHTS INDEX

29 BENCHMARKING REPORT FY10 - CLUB LICENSING AND FINANCIAL FAIR PLAY
04. Why were clubs refused licences?Q:Q
Feedback and transparency in the results of the licensing system are a key component in trying to build trust in the system. For the development and refinement of the licensing requirements it is also important that the reasons why clubs have been refused licences are known. In recent years, UEFA has collected and analysed the reasons why clubs have been refused licences. While the financial criteria (red in column chart) have and will continue to have a high profile, particularly with the implementation of financial fair play criteria, it is clearly evident from the number of non-financial reasons for licence refusal, that licensing is much more than just a set of financial rules. Hence, UEFA refers to its club licensing system and not its financial control system.
31
23 21
18
9 9 8
4 3 2 2 2
13 14
0
5
10
15
20
25
30
35
Pro
cess
-rel
ated
Ove
rdue
Em
plo
yee/
Tax
Pay
able
s
Aud
ited
Fin
anci
al S
tate
men
ts
Ap
pro
ved
Sta
diu
m
Ove
rdue
Tra
nsfe
r P
ayab
les
Oth
er F
inan
cial
: Bud
gets
,R
epre
sent
atio
n Le
tter
Qua
lific
atio
ns: H
ead
of y
outh
dev
elop
men
t &
you
th c
oach
es
Qua
lific
atio
ns: H
ead
Coa
ch 1
st T
eam
Qua
lific
atio
ns: G
ener
al M
anag
er,
Phy
sio
& D
octo
r
Ap
pro
ved
You
th D
evel
opm
ent
Pro
gram
me
& >
4 te
ams
Inte
rim F
inan
cial
Sta
tem
ents
Med
ical
Car
e
Mor
e Th
an 3
Crit
eria
Oth
er C
riter
ia
Num
ber
of c
lub
s
Overview of reasons provided for 2011/12 season FINAL refusals
Answer: 04The 101 clubs ultimately denied licences were refused for a wide variety of reasons as the charts on this page illustrate. From the 159 reasons* given for failure, 42% were financial reasons and 58% other reasons. The most common reason clubs did not receive licences was process-related (31 clubs), meaning clubs either did not complete the application process** or did not submit their licensing documents within the set deadline. Overdue employee and tax payments (23) and the provision of annual financial statements of satisfactory quality, detail and audit opinion (21) were the other two most common criteria for licences being refused.
Footnotes: * When the 53 licensing departments submit their list of licensed clubs to UEFA each year, they indicate the reasons for licence refusal. The responses either give up to three reasons for refusal or indicate that more than three criteria were failed.
** In some cases, clubs do not need a licence and so do not finish the process: if a club does not qualify for a UEFA competition and does not require a licence for its domestic competition, or if there is a separate domestic licence, or if the club is relegated and therefore does not need a licence for domestic purposes.
HIGHLIGHTS INDEX

BENCHMARKING REPORT FY10CLUB LICENSING AND FINANCIAL FAIR PLAY
30
05. How many and which clubs have had to give up their competition places?Q:Q
The previous analyses show that many clubs each year are refused a licence by their licensor: their national association or league. A commonly voiced criticism of the UEFA club licensing system is that the national bodies are unlikely to refuse licences when it really counts, in other words, it is fine refusing a licence to a club which in the end does not qualify for the UEFA Champions League or UEFA Europa League, but political pressure would make it difficult to refuse a licence to a club which has qualified. This perception can be refuted simply by looking at the evidence, the long list of clubs that qualified for UEFA competitions but were refused access to the competition on licensing grounds.
Answer: 05Each and every year, clubs which have qualified on sporting merit have not been able to participate because they have not had a licence. In total, 31 clubs qualifying directly* for either the UEFA Champions League (UCL) or UEFA Europa League (UEL) on sporting merit have been prevented from taking part on licensing grounds, in addition to a further 28 clubs which qualified directly for the UEFA Intertoto Cup between 2005 and 2009**. The last three seasons (2009/10–2011/12 ) have seen 15 separate cases from 10 different countries, including England and Spain, where clubs that qualified on sporting merit have not matched their on-field performance with off-field professionalism and been refused access to competitions for not meeting the minimum licensing requirements.
In addition, UEFA routinely carries out spot checks to ensure the proper application of licensing criteria. In 2010/11, there were 14 spot checks on 61 sportingly qualified clubs and, by the end of 2011/12, 68 compliance audits will have been conducted across all UEFA member associations since the UEFA club licensing system was first implemented in 2004/05.
HIGHLIGHTS INDEX

31 BENCHMARKING REPORT FY10 - CLUB LICENSING AND FINANCIAL FAIR PLAY
Footnotes: *“Directly qualifying” clubs means clubs that qualify on account of their league ranking or cup performance. This excludes “indirectly qualifying” clubs that could have competed had they had a licence since a place came open to them due to a directly qualifying club not receiving a licence. In the case of FK Zemun of Serbia, this second division club applied to UEFA directly through the extraordinary admission procedures set out in the UEFA Club Licensing and Financial Fair Play Regulations but did not meet the licensing requirements set by the UEFA administration. Reference to the UEFA Europa League also includes its predecessor, the UEFA Cup (UCUP).
** 53 separate clubs and two clubs twice.
0
1
2
3
4
5
6
7
2004/05 2005/06 2006/07 2007/08 2008/09 2009/10 2010/11 2011/12
Num
ber
of c
lub
s/ li
cens
ors
UEFA competition places lost by directly qualified clubs on licensing grounds
UCL non-admittance UEL/UCUP non-admittance
FC Olimpija(SVN)
FK Zeljeznicar
(BIH)
PAOK(GRE)
FK Zemun(SRB)
FC Lokomotiv
(KAZ)
Cork City FC(IRL)
FK Vetra(LTU)
Sp. Fingal FC(IRL)
FK Zalgiris(LTU)
FCLokomotiv
(KAZ)
FCTimisoara
(ROU)
FC Mallorca(ESP)
PortsmouthFC
(ENG)
FCLokomotiv
(KAZ)
FC Daugava(LVA)
FC Ararat(ARM)
FC Kaisar(KAZ)
FK Sloboda(BIH)
BeitarJerusalem
(ISR)
Coleraine FC(NIR)
CSKA Sofia(BUL)
Shelbourne FC
(IRL)
FC Astana(KAZ)
FK Vozdovoc
(SRB)
FK Sarajevo(BIH)
FC Taraz(KAZ)
FC Irtysh(KAZ)
FC Koper(SVN)
FC Tobol(KAZ)
FC Irtysh(KAZ)
FC Ekibastuzets
(KAZ)
2006/07 - 2011/12 refusals for sportingly qualified clubs by point of refusal
Licence refused by FIB (no appeal)
Licence refused by AB
Did not apply for a licence
Not eligible to apply
Not admitted by UEFA
2; 7%6; 19%
12; 39%6; 19%
5; 16%
HIGHLIGHTS INDEX

BENCHMARKING REPORT FY10COMPETITION PROFILE OF EUROPEAN CLUB FOOTBALL
32
2Competition profile of European club football
What is the most common size of top divisions and what are the recent trends?
How are domestic championships structured?
How many fans attended domestic championship matches across Europe?
What are the attendance trends in domestic championship matches?
How full are stadiums and how does this constrain growth?
What do club attendances tell us about the profile of leagues?
What are the trends in UEFA club and country coefficients?
HIGHLIGHTS INDEX

33 BENCHMARKING REPORT FY10 - COMPETITION PROFILE OF EUROPEAN CLUB FOOTBALLHIGHLIGHTS INDEX

BENCHMARKING REPORT FY10COMPETITION PROFILE OF EUROPEAN CLUB FOOTBALL
34
06. What is the most common size of top divisions and what are the recent trends?Q:Q
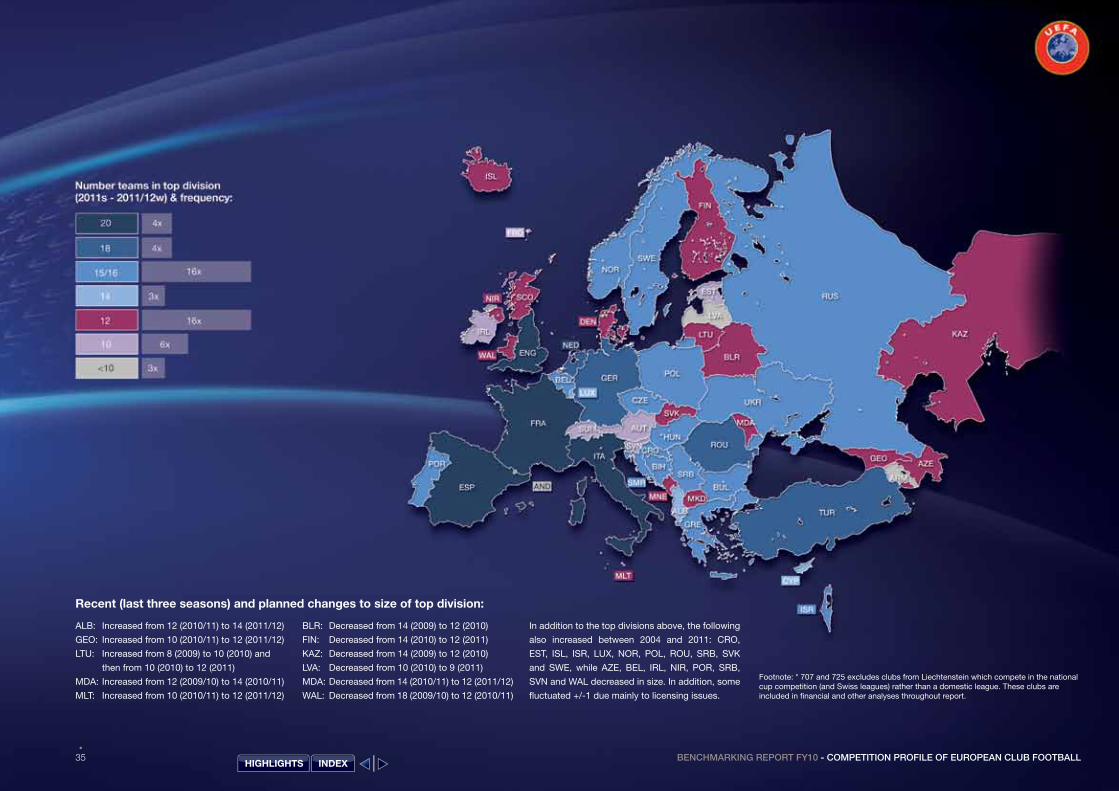
Answer: 06In the current season (2011 for those with summer championships and 2011/12 for those with winter championships), European top divisions range from 8 to 20 teams, with 12 and 16 team leagues being the most frequent. In most cases, the 12 team league consists of 3 rounds of matches and the 16 team league with 2 rounds.
In the eight years since club licensing was introduced, the number of teams competing in the top divisions has risen from 707 to 725* and changed in 28 associations (see separate box).
HIGHLIGHTS INDEX
35 BENCHMARKING REPORT FY10 - COMPETITION PROFILE OF EUROPEAN CLUB FOOTBALL
ALB: Increased from 12 (2010/11) to 14 (2011/12)
GEO: Increased from 10 (2010/11) to 12 (2011/12)
LTU: Increased from 8 (2009) to 10 (2010) and
then from 10 (2010) to 12 (2011)
MDA: Increased from 12 (2009/10) to 14 (2010/11)
MLT: Increased from 10 (2010/11) to 12 (2011/12)
BLR: Decreased from 14 (2009) to 12 (2010)
FIN: Decreased from 14 (2010) to 12 (2011)
KAZ: Decreased from 14 (2009) to 12 (2010)
LVA: Decreased from 10 (2010) to 9 (2011)
MDA: Decreased from 14 (2010/11) to 12 (2011/12)
WAL: Decreased from 18 (2009/10) to 12 (2010/11)
In addition to the top divisions above, the following
also increased between 2004 and 2011: CRO,
EST, ISL, ISR, LUX, NOR, POL, ROU, SRB, SVK
and SWE, while AZE, BEL, IRL, NIR, POR, SRB,
SVN and WAL decreased in size. In addition, some
fluctuated +/-1 due mainly to licensing issues.
Recent (last three seasons) and planned changes to size of top division:
Footnote: * 707 and 725 excludes clubs from Liechtenstein which compete in the national cup competition (and Swiss leagues) rather than a domestic league. These clubs are included in financial and other analyses throughout report.
HIGHLIGHTS INDEX

BENCHMARKING REPORT FY10COMPETITION PROFILE OF EUROPEAN CLUB FOOTBALL
36
07. How are domestic championships structured?Q:Q
Championship staged during SUMMER 12x
Championship staged during WINTER 41x
Due mainly to seasonal conditions, the countries in dark blue hold their domestic championships during the summer months. One significant change since last season is the transition from a summer to a winter championship calendar in Russia. The 2011/12 season in Russia will be a transitional one that is a continuation of the summer season. Consequently, the Russian structure will change temporarily from a traditional home and away round robin to a two-phase competition, with the second phase consisting of two groups – a champions group and a relegation group. The start of the 2012/13 Russian season will likely see a return to the two-round structure of each team playing the other home and away.
Answer: 07The traditional two-round structure where each team plays the other home and away is still* the most common in European leagues. A similar three-round structure is the second most common. However, from time to time, a league will switch temporarily to a three-round structure due to changes in division size (Belarus), a transition in league season (Russia), or to some clubs failing to receive domestic licences (Finland).
Footnote: *Analysis of league structure refers to 2011/12 season (winter) or 2011 (summer). Apart from Liechtenstein, which has no domestic championship and fields teams in the Swiss League, 11 top divisions play according to alternative structures. In San Marino, the teams are split into 2 groups at the start of the season and the top 3 from each group enter the play-offs after 3 rounds. In Scotland and Northern Ireland, there are 3 full rounds before teams in the top and bottom half play a final round within their half. Similar formats with a mid-season split after 2 rounds are in place in Andorra, Azerbaijan, Belgium, Cyprus, Israel, Kazakhstan, Malta and Wales.
BIHBULCROCZEENGESPFRAGER
ALBBLRDENFINFRO
LIE
LTUMDAMKDMNESVK
ARMAUTESTGEO
IRLLVASUISVN
2 rounds4 rounds
3 rounds
GREHUNISLITALUX NEDNORPOL
PORROUSRBSWETURUKR
ANDAZEBELCYP
NIRSCO
SMR
ISRKAZMLTWAL
RUS
HIGHLIGHTS INDEX

37 BENCHMARKING REPORT FY10 - COMPETITION PROFILE OF EUROPEAN CLUB FOOTBALL
08. How many fans attended domestic championship matches across Europe?Q:Q
After a decline in attendances between 2008/09 and 2009/10, the total number of spectators appears to have stabilised and increased slightly. Germany still maintains the highest average matchday attendance, while England generates the highest cumulative league attendance. The development and investment in stadiums in preparation for UEFA EURO 2012™ has substantially increased both the average and total attendances in Poland and Ukraine. For the first time in a couple of seasons, the average attendance in France has dropped below 20,000, although the stadium investment in the build-up to UEFA EURO 2016™ is likely to have a positive effect in the future.
Nearly half of all top division clubs (49%) attract an average of less than 3,000 spectators. This is an increase over 2009/10, when 45% of club attendances fell into this range.
The ratio of the highest club average attendance against the league average illustrates the concentration (or distribution) of spectators among clubs in a division. Finland, Iceland and Kazakhstan have more even distributions, whereas fans in Serbia, Azerbaijan and FYROM are mostly clustered around a handful of popular clubs.
Answer: 08For the second season in a row, over 101 million fans attended domestic club championship matches in Europe. This is an increase over 2009/10, driven primarily by growth in England, Turkey, and Poland. However, it is still lower than the 104 million who went through the turnstiles in 2008/09.
Source: http://www.european-football-statistics.co.uk/attn.htm, www.soccerway.com and national licensing managers. Figures cover the last completed season.
0
2
4
6
8
10
12
14
16
18
20
GE
R
EN
G
ES
P
ITA
FR
A
NE
D
BE
LP
OR
S
UI
UK
R
SC
O
TUR
R
US
G
RE
N
OR
S
WE
P
OL
AU
T IS
R
RO
U
DE
N
SR
B
AZ
E
CZ
E
KA
Z
CY
P
HU
N
ALB
C
RO
M
KD
B
UL
SV
K
BIH
FI
N
BLR
IR
L S
VN
G
EO
IS
L M
DA
N
IR
LTU
LU
X
MN
E
LVA
A
RM
W
AL
FRO
M
LT
ES
T A
ND
LI
E
Num
ber
of c
lub
s
Average attendance profile European clubs 2010/11w & 2010s
>20'000 (12%)
<1'000 (25%)
1'000-2'999 (24%)
3'000-4'999 (13%)
5'000-9'999 (13%)
10'000-19'999 (13%)
1.9
>20'000 (12%)
<1'000 (25%)
1'000-2'999 (24%)
3'000-4'999 (13%)
5'000-9'999 (13%)
10'000-19'999 (13%)
2.8
2.1
2.5
2.6
>20'000 (12%)
<1'000 (25%)
1'000-2'999 (24%)
3'000-4'999 (13%)
5'000-9'999 (13%)
10'000-19'999 (13%)
>20'000 (12%)
<1'000 (25%)
1'000-2'999 (24%)
3'000-4'999 (13%)
5'000-9'999 (13%)
10'000-19'999 (13%)
>20'000 (12%)
<1'000 (25%)
1'000-2'999 (24%)
3'000-4'999 (13%)
5'000-9'999 (13%)
10'000-19'999 (13%)
>20'000 (12%)
<1'000 (25%)
1'000-2'999 (24%)
3'000-4'999 (13%)
5'000-9'999 (13%)
10'000-19'999 (13%)
2.5
2.4
3.8
2.6
3.7
3.6
2.8
1.9
3.4
2.1
2.3
2.2
>20'000 (12%)
<1'000 (25%)
1'000-2'999 (24%)
3'000-4'999 (13%)
5'000-9'999 (13%)
10'000-19'999 (13%)
>20'000 (12%)
<1'000 (25%)
1'000-2'999 (24%)
3'000-4'999 (13%)
5'000-9'999 (13%)
10'000-19'999 (13%)
>20'000 (12%)
<1'000 (25%)
1'000-2'999 (24%)
3'000-4'999 (13%)
5'000-9'999 (13%)
10'000-19'999 (13%)
>20'000 (12%)
<1'000 (25%)
1'000-2'999 (24%)
3'000-4'999 (13%)
5'000-9'999 (13%)
10'000-19'999 (13%)
>20'000 (12%)
<1'000 (25%)
1'000-2'999 (24%)
3'000-4'999 (13%)
5'000-9'999 (13%)
10'000-19'999 (13%)
>20,000 (12%)
<1,000 (25%)
1,000-2,999(24%)
3,000-4,999(13%)
5,000-9,999(13%)
10,000-19,999 (13%)
2.0
2.6
2.2
2.5
5.4
4.4
1.9
1.7
2.9
2.0
2.9
3.5
4.7
2.2
1.8
2.7
1.6
2.0
2.4
3.0
3.1
1.6
2.7
2.1
1.8
2.6
2.2
2.7
2.1
2.4
1.8
NA
1.
8 N
A
NA
Ratio of highest club attendance to average
HIGHLIGHTS INDEX

BENCHMARKING REPORT FY10COMPETITION PROFILE OF EUROPEAN CLUB FOOTBALL
38
09. What are the attendance trends in domestic championship matches?Q:Q
Answer: 0927 of the 48 top divisions (55%) with comparable data* recorded a decrease in attendances in 2010/11 (winter) / 2010 (summer), while 22 (45%) increased. For a second consecutive season, the trend has been negative. Among the “big 5” divisions only England and Germany increased attendances (+3.3% and +0.4% respectively), while Italy experienced a 2.6% drop in average attendances. Poland reported a large increase (+62%) off the back of new or modernised stadiums planned for UEFA EURO 2012™. Out of 630 top division clubs in 2010/11, 128 increased average attendances by more than 20%. One third of these (39) were newly promoted clubs. Most of the clubs that suffered drastic declines in average attendances were also top division clubs in 2009/10.
Of the 220 stable clubs that increased attendance, almost half (48%) were clubs in the top four positions in the division.
Promoted clubs
Stable clubs
128
44
445780
229
48
2
39
41
89
40
47
44
5780
227
>+20%
+10% to +20%
+3% to +10%
0% to +3%
-3% to 0%
-10% to -3%
<-10%
Footnote: * Sample of 630 top division clubs in 2010/11. For 51 promoted clubs, the 2009/10 attendance figures are not known and are not included.
HIGHLIGHTS INDEX

39 BENCHMARKING REPORT FY10 - COMPETITION PROFILE OF EUROPEAN CLUB FOOTBALLHIGHLIGHTS INDEX
BENCHMARKING REPORT FY10COMPETITION PROFILE OF EUROPEAN CLUB FOOTBALL
40
10. How full are stadiums and how does this constrain growth?Q:Q
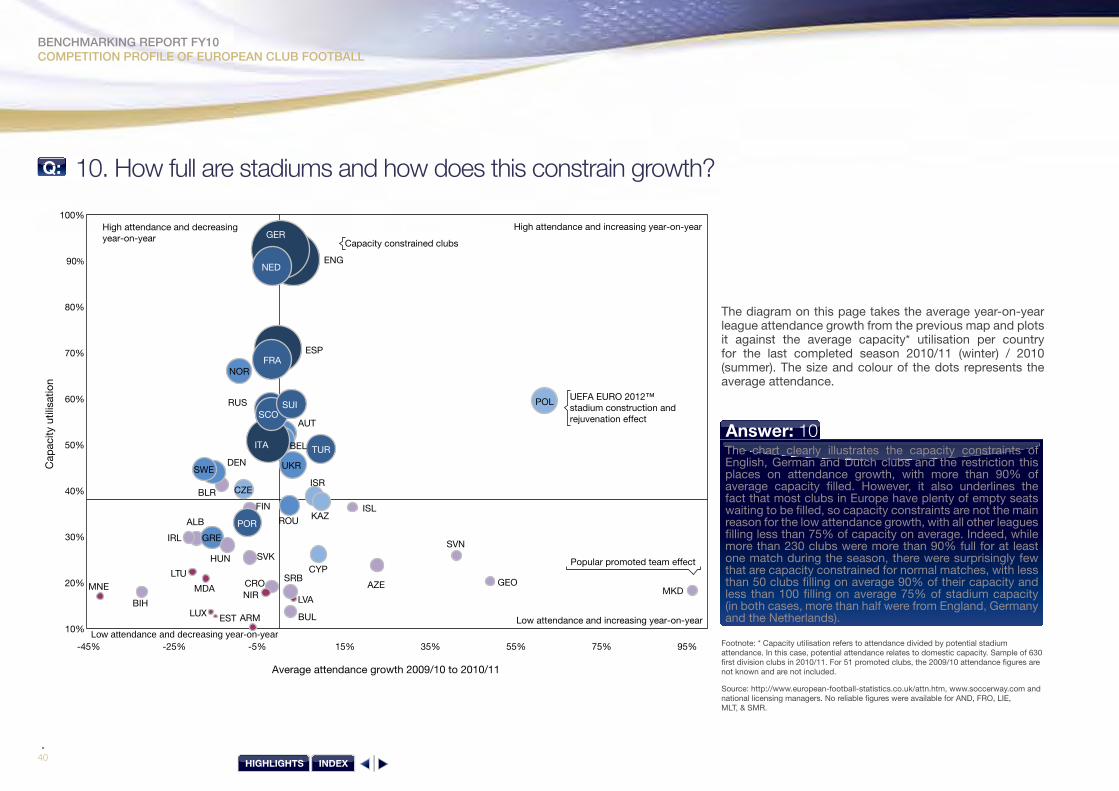
The diagram on this page takes the average year-on-year league attendance growth from the previous map and plots it against the average capacity* utilisation per country for the last completed season 2010/11 (winter) / 2010 (summer). The size and colour of the dots represents the average attendance.
ALB
ARM
AUT
AZE
BEL
BIH
BLR
BUL
CRO
CYP
CZE
DEN
ENG
ESP
EST
FIN
FRA
GEO
GER
GRE
HUN
IRL
ISL
ISR
KAZ
LTU
LUXLVA
MDA MKDMNE
NED
NIR
NOR
POL
POR ROU
RUS
SRB
SVKSVN
UKR
TUR
10%
20%
30%
40%
50%
60%
70%
80%
90%
100%
-45% -25% -5% 15% 35% 55% 75% 95%
High attendance and increasing year-on-yearHigh attendance and decreasing year-on-year
Low attendance and decreasing year-on-year Low attendance and increasing year-on-year
Capacity constrained clubs
SWE
ITA
SCOSUI
Cap
acity
util
isat
ion
Average attendance growth 2009/10 to 2010/11
UEFA EURO 2012™ stadium construction and rejuvenation effect
Popular promoted team effect
Answer: 10The chart clearly illustrates the capacity constraints of English, German and Dutch clubs and the restriction this places on attendance growth, with more than 90% of average capacity filled. However, it also underlines the fact that most clubs in Europe have plenty of empty seats waiting to be filled, so capacity constraints are not the main reason for the low attendance growth, with all other leagues filling less than 75% of capacity on average. Indeed, while more than 230 clubs were more than 90% full for at least one match during the season, there were surprisingly few that are capacity constrained for normal matches, with less than 50 clubs filling on average 90% of their capacity and less than 100 filling on average 75% of stadium capacity (in both cases, more than half were from England, Germany and the Netherlands).
Footnote: * Capacity utilisation refers to attendance divided by potential stadium attendance. In this case, potential attendance relates to domestic capacity. Sample of 630 first division clubs in 2010/11. For 51 promoted clubs, the 2009/10 attendance figures are not known and are not included.
Source: http://www.european-football-statistics.co.uk/attn.htm, www.soccerway.com and national licensing managers. No reliable figures were available for AND, FRO, LIE, MLT, & SMR.
HIGHLIGHTS INDEX

41 BENCHMARKING REPORT FY10 - COMPETITION PROFILE OF EUROPEAN CLUB FOOTBALL
11. What do club attendances tell us about league profiles?Q:Q
1st
2nd
3rd
4th
5th
6th
7th
8th
9th
10th
11th
12th
13th
14th
15th
16th
17th
18th
19th
20th
2010
/11
final
pos
ition
TOP LARGE MEDIUM SMALL MICRO
GERENG FRAITAESP NED TUR RUS BEL UKR NOR POR GRE SWE SCO DEN SUI AUT ROUPOL CZE ISR HUN CRO CYP KAZ SVK BLR IRLSRB BUL BIH FIN MDA LUX AZE ISL NIR MNE SVN LVA LTU ESTALB MKD WALGEO ARM
Answer: 11The chart above groups the divisions into relative peer groups and then maps out average attendance per club for a given position during the 2010/11 (winter) / 2010 (summer) season. As the similarly sized dots show, the top leagues generally have evenly distributed large attendances. In the “large” peer group, quite a few divisions are dominated by a handful of clubs who attract most of the crowds (e.g. Portugal, Greece, Scotland and Ukraine). There is a fairly strong correlation between average attendances and league position, showing that success breeds fan interest and vice versa. Also noticeable is the range of division size in the “large”, “medium” and “small” peer groups and the differences among similarly sized nations. For example, Switzerland, Iceland and Serbia all have roughly the same population size, but the Swiss division consists of only 10 clubs, compared with 16 in Iceland and Serbia. However, the Swiss clubs attract 1.5 times more spectators on average and slightly more in total than both the Icelandic and Serbian clubs combined. Smaller divisions like those of Switzerland and Austria can draw average attendances on a par with clubs in bigger divisions like those of Turkey and Belgium.
>=20,000
10,000 - 19,999
5,000 - 9,999
3,000 - 4,999
1,000 - 2,999
<1,000
HIGHLIGHTS INDEX

BENCHMARKING REPORT FY10COMPETITION PROFILE OF EUROPEAN CLUB FOOTBALL
42
12. What are the trends in UEFA club and country coefficients?Q:Q
The national association coefficient ranking, which is used to allocate the number of participants in UEFA’s flagship club competitions, is often used as a benchmark for the level of club football in a country. As can be seen in the adjacent graph which only highlights the major shifts in country coefficients during the last 10 years, several countries have made impressive progressions. Denmark with FC København as a front runner has taken over as the top Nordic country. The strong results of a variety of clubs have helped Romania move to a top 15 position. Belarus has been on a steady rise since the 2007/08 season with FC BATE Borisov managing to participate in both UCL and UEL group stages. Bosnia & Herzegovina and Azerbaijan have also recorded substantial moves surpassing more than 10 countries during the same period.
While the top position in the ranking of national associations coefficient for club football has switched from Spain to England in the past 10 seasons, it is reasonable to say that the top of the table has remained stable. The top 5 still consists of the same countries as it did 10 years ago, namely and in the current order: England, Spain, Germany, Italy and France.
Answer: 12While the top 5 country rankings are very stable, indeed the same as 10 years ago, a number of countries have improved their ranking considerably with Azerbaijan, Bosnia & Herzegovina, Belarus, Denmark and Romania moving up the most places in the UEFA national association coefficient ranking list.
SVN
MLT
NOR
CZE
SWE
DEN
AZE
ROU
BLR
BIH
0
10
20
30
40
50
2002 2003 2004 2005 2006 2007 2008 2009 2010 2011
Pos
ition
in n
atio
nal a
ssoc
iatio
ns c
oeff
icie
nt r
anki
ng
Top 5 increases and decreases over the past 10 seasons in the national associations coefficient ranking
HIGHLIGHTS INDEX

43 BENCHMARKING REPORT FY10 - COMPETITION PROFILE OF EUROPEAN CLUB FOOTBALL
0
50
100
150
200
250
FC B
arce
lona
Man
ches
ter U
nited
FC
AC Mila
n
Liver
pool F
C
Real M
adrid
CF
FC In
tern
azion
ale M
ilano
Arsen
al FC
Chelse
a FC
FC B
ayer
n M
ünch
en
FC P
orto
Olympique
Lyo
nnais
Valenc
ia CF
PSV Eind
hove
n
AS Rom
a
Juve
ntus
FC
Tota
l num
ber
of c
lub
coe
ffic
ient
poi
nts
The adjacent chart illustrates how many seasons clubs have managed to score points for their UEFA club coefficient during the past 10 seasons, independently of the method of calculation, which has evolved throughout the years. The club coefficient is used to determinate the seeding for UEFA’s club competitions. A total of 524 clubs have managed to gain points in these 10 seasons. Only 28 clubs (5%) have managed to score points each single season. A strong majority of clubs (67%) have only been present in the score sheets between 1 and 3 seasons showing that a large variety of clubs have been able to participate to the UEFA club competitions.
Answer: 12The 15 clubs, which have obtained the most UEFA club coefficient points in the past 10 seasons can be found in the bar chart. Unsurprisingly FC Barcelona with 3 UCL titles tops the ranking. Consistency is also rewarded as Manchester United FC with one UCL title and numerous appearances in the finals and semi-finals can be found in the second position. The leading trio is completed with AC Milan who managed to win two UCL titles but lost the famous 2005 final in Istanbul. Clubs from England, Spain, Italy are well represented with 11 clubs out of the 15. France, Germany, the Netherlands and Portugal all have a single representative. All winners of the past 10 UCL Finals are present while FC Porto and Valencia CF are the only UEL (or UEFA Cup) winners that have appeared in the ranks.
2011201020092008200720062005200420032002
107-94-62-31
Proportion of clubs scoring points between 2001/02 and 2010/11
10%
18%
32%
35%
5%
Number of seasons where points were scored between 2001/02 and 2010/11
HIGHLIGHTS INDEX

BENCHMARKING REPORT FY10LONG TERM INvESTMENT – YOUTH FOOTBALL AND HEAD COACHING
44HIGHLIGHTS INDEX

45 BENCHMARKING REPORT FY10 - LONG TERM INvESTMENT – YOUTH FOOTBALL AND HEAD COACHING
3Long-term investment – youth football and head coaching
What impact have the locally trained player regulations had?
Which countries have had most success in youth football competitions?
What is the typical job length of European club head coaches and who are the great survivors?
What type and level of qualification do head coaches have?
Head coach migration – which coaches travel?
HIGHLIGHTS INDEX

BENCHMARKING REPORT FY10LONG TERM INvESTMENT – YOUTH FOOTBALL AND HEAD COACHING
46
13. What impact have the locally trained player regulations had?Q:Q
Football has a long history of squad restrictions* and last year we presented some analysis on the use of squad size and foreign player limitations. For a period during the 1990s UEFA operated the so called “3 + 2” rule designed to encourage clubs to invest in youth development and retain a local identity but this was abolished in 1996 in the face of regulatory and legal pressure. On 21 April 2005 UEFA’s member associations unanimously approved a locally trained player** rule into its club competitions regulations, to encourage clubs to train their own young players and to prevent the hoarding of players. For the 2006/07 season, clubs competing in the UEFA Champions League or UEFA Cup had to include at least four locally trained-players, of whom only two could be association-trained. During the following two seasons the locally trained player quota increased to six in 2007/08 and then to eight in 2008/09. The rule was also meant to address competitive balance
issues within the UEFA club competitions and to help clubs to try and re-establish a ‘local’ identity within their community, in the face of a general trend towards the globalisation of the sport and a more specific trend towards greater movement of playing and coaching staff. Analysing UEFA and PFPO (Professional Football Players Observatory)*** player databases we have been able to set out a picture of the usage by clubs participating in UEFA competitions, of under-21, club trained and locally trained players across the last decade.
The average number of club-trained players on the pitch at any one time in UEFA Champions League group stage matches, has increased from 2.16 before the rules to 2.50 in the last completed season (2010/11) with the locally trained player rules. Indeed looking back further, we see that the current representation is above the level of a
decade ago. Furthermore, it seems that there has also been a secondary knock-on effect in the domestic league competitions, where the same clubs competing in the UEFA Champions League have also increased the usage of their club-trained players. Another trend we have observed has been the increase in the use of under-21 players with the chances of under-21 players playing in these important matches increasing by 50% from a decade ago. A wider assessment of locally trained players including both club-trained and association-trained in both the UEFA Champions League and UEFA Cup/UEFA Europa League indicates a less marked positive trend, with the proportion of locally trained players relatively consistent at just over 50%, all the way through the five years of implementation of the locally trained player rule.
UCL games Domestic games
Average number of club-trained playerson the pitch for UCL group stage clubs
2000/01 2010/112005/060.0
3.0
2.5
2.0
1.5
1.0
0.5
UCL games Domestic games
Average number of U-21 players onthe pitch for UCL group stage clubs
2000/01 2010/112005/060.0
0.2
0.4
0.6
0.8
1.0
1.2
1.4
Proportion of minutes played by locally trainedplayers** in the UCL & UEL group stages
2006/07 2010/112008/09 2009/102007/080%
10%
20%
30%
40%
50%
60%
53.4% 52.1%49.3%
52.3% 52.5%
HIGHLIGHTS INDEX

47 BENCHMARKING REPORT FY10 - LONG TERM INvESTMENT – YOUTH FOOTBALL AND HEAD COACHING
Answer: 13It is impossible to say with any certainty what the opportunities for locally trained players would have been without the introduction of new rules in recent years. Despite the ongoing globalisation of football and the increasing freedom of movement of football players and coaches, the proportion of minutes played by locally trained players in the UEFA Champions League has remained stable since the implementation of the new rules. The average number of club-trained players on the pitch at any one time in UEFA Champions League group stage matches has increased from 2.16 before the rules to 2.50 in the last completed season (2010/11) with the locally trained players rules. Indeed the current representation is above the level of a decade ago. Furthermore, it seems that there is also some knock-on effect in the domestic leagues in that the same clubs competing in the UEFA Champions League have also fielded their locally trained players more in the domestic championships. A complementary effect has been the increase in the use of under-21 players with the chances of under-21 players playing in these important matches increasing by 50% from a decade ago.
Disaggregating the data and examining it on a country by country basis, the locally trained player rules seem to have had a noticeable effect in some countries, with contrasting trends. Comparing the proportion of minutes played by locally trained players in 2006/07 and 2010/11, German, Dutch, Swiss and Ukrainian clubs in the UEFA Champions League and UEFA Europa League group stages have significantly increased the playing time of locally trained players, in contrast to the trend in Belgian, Portuguese and Turkish clubs. Locally trained players were most used by the Swiss and French clubs in 2010/11 with more than two-thirds of playing time coming from locally trained players.
Proportion of minutes played by locally trained players**** in UCL & UEL group stages by country
2006/07 2010/11
BEL UKRESP FRA GER GRE ITA NED POR RUS SUI TURENG0%
10%
20%
30%
40%
50%
60%
70%
80%
Footnotes: * In the 1976 case Doná v Mantero, the European Court of Justice (ECJ) accepted that in some cases (non-economic and with sporting intent), proportionate limitations on the number of foreign players could be tolerated. In 1978, UEFA negotiated with the Commission of European Communities and agreed to remove restrictions on the number of contracts of players from other countries within the European Community but that UEFA would still be allowed to limit the number of foreign players to two in any one match. In 1991, UEFA went further and introduced the “3+2” rule which required teams to restrict the number of foreign players for any one match to three plus two more foreign players who had played professionally in the domestic association of their club for a period of five continuous years, including three in youth teams. This rule was abolished in 1996 after the landmark Bosman ruling in December 1995.
** A locally trained player is either a club-trained player or an association-trained player. A club-trained player is a player who, between the age of 15 and 21, and irrespective of his nationality and age, has been registered with his current club for a period, continuous or not, of three entire seasons or of 36 months. An association-trained player is a player who, between the age of 15 and 21, and irrespective of his nationality or age, has been registered with a club or with other clubs affiliated to the same association as that of his current club for a period, continuous or not, of three entire seasons or of 36 months.
*** The PFPO is the Professional Football Players Observatory based at the University of Neuchatel in Switzerland. During the summer of 2011, cooperation between UEFA and the PFPO led to detailed analysis of player participation in domestic league matches for those clubs that competed in UEFA club competition group stages over many seasons.
**** In this context, we have included B-list players in the definition of “locally trained players.” Note: To compete in UEFA club competitions, clubs must submit an A list and a B list of eligible players. The A list may consist of no more than 25 players, eight of which must be locally trained (at least four club-trained). To qualify for the B list a player must be 21 or under and have played for his club uninterrupted for two years since his 15th birthday.
HIGHLIGHTS INDEX

BENCHMARKING REPORT FY10LONG TERM INvESTMENT – YOUTH FOOTBALL AND HEAD COACHING
48
14. Which countries have had most success in youth football competitions?Q:Q
On this page we present a high-level review of the 66 UEFA youth tournaments covering the period from 1993 to 2011*. The title of the page indicates that the analysis concerns success in youth tournaments rather than overall youth development, and we use participation in final stages of and tournament victories to measure success. In many cases, the youth tournaments are not used as a means to an end but rather treated as part of an overall development process, and alternative analyses, such as the percentage of youth players that become professionals or full internationals, might be more valid if we were to attempt an overall assessment of youth development.
The review, however highlights some interesting findings. As could be expected, the traditional larger European football countries are well represented and lead the number of participations. Spain has, in particular experienced much success in men’s/boy’s tournaments, much of which pre-dated the recent success in senior football. Likewise, Germany has been by far the most successful country in UEFA women’s youth tournaments. The reputation for success in youth development of the Portuguese and Dutch also proves to be well-deserved with six and three tournament successes respectively, and the sheer number of other countries participating and winning youth football illustrates the competitiveness of tournaments at this level, with players and coaches from many smaller national associations experiencing the final stages of UEFA youth tournaments.
Women’s youth Men's U17/U16 Men's U19/U18 Mens U21
ESP SWEITAPORFRA ENG NED IRL POL TUR RUS CZE SUI DENUKRGER0
2
4
6
8
10
12
14
16
21
5
1
2
2
4
4
1
1
1
1 2
1
1 12
1
1
11
8
1 1 1
1 1 1 1 1
6
5
3
Youth competition victories
HIGHLIGHTS INDEX

49 BENCHMARKING REPORT FY10 - LONG TERM INvESTMENT – YOUTH FOOTBALL AND HEAD COACHING
Answer: 14Looking at success in UEFA youth tournaments, Spain has both participated in the most final tournaments (46) and won the most competitions (16, including 13 boy’s and 3 women’s youth competitions). The four most successful national associations in men’s/youth tournaments have been Spain, France, Portugal & Italy, while Germany has clearly been the most successful in women’s youth competitions.
In total, 16 associations have enjoyed success in UEFA youth competitions and an encouragingly high number, forty (40), have reached the final stages.
Women’s youth Men's U17/16 Men's U19/18 Men's U21
ES
P
FRA
GE
R
EN
G
ITA
PO
R
NE
D
SU
I
CZ
E
TUR
BE
L
NO
R
RU
S
DE
N
GR
E
SW
E
SR
B
HU
N
IRL
UK
R
AU
T
CR
O
ISR
PO
L
BLR
SC
O
FIN
ISL
SV
K
RO
U
NIR
GE
O
LUX
AR
M
BU
L
CY
P
LIE
LTU
SV
N
MK
D
0
5
10
15
20
25
30
35
40
45
50
1111111111121
2
3
111312211
13
111121
1133 3
1
5
13
44
42
6
31
4
3
1
5
4
1
3
5
4
3
21
7
3
6
4
1
4
10
4
11
11
14
4
9
13
9
5
16
15
10
5
8
11
16
2
6
8
6
5
2
3
3
7
6
5
7
7
36
10
9
7
7
6
7
5
6
6
2
3
4
5
21
5
6
1
Youth competition final tournaments: participations
Footnote: * The data used in the charts above covers the 48 men’s and 18 women’s youth competitions from 1992/93 until 2010/11, section of UEFA.com. Final stages of youth competitions include eight teams in all cases, apart from the four women’s U17 competitions from 2007/08 onwards, for which we have included the four teams in the knockout stages. For 1992/93, for the purposes of the chart, for competitions in which Czechoslovakia competed, we have indicated this as an appearance by CZE, although SVK also contributed to the success.
HIGHLIGHTS INDEX

BENCHMARKING REPORT FY10LONG TERM INvESTMENT – YOUTH FOOTBALL AND HEAD COACHING
50
15. What is the typical job length of European club head coaches and who are the great survivors?Q:Q
Answer: 15In general, the answer is not very long, which will come as no surprise to people who follow football in the media. On average, coaches in European top divisions have been in place for approximately one and half seasons, but 53% of current incumbents have held their current position for less than a year and just 12% for more than three years. As can be seen in the chart on the right, the longevity varies a lot depending on the country. England and Finland have the two highest averages, with over three seasons of stability. Austria can count on over 60% of head coaches having been with the same club for at least three years. On the other hand, over 90% of coaches in Bosnia & Herzegovina, Albania and Bulgaria are still in their first year with their clubs.
The great survivors
Sir Alex Ferguson heads the pack having led Manchester United FC for over 25 seasons. He has spent nearly 15 years competing with his old rival, Arsène Wenger, from Arsenal FC who is the second longest-serving head coach in Europe. David Jeffrey started coaching already at the age of 34 but has managed to remain coach of Linfield FC for 14.5 years and is the third longest-serving coach. Guy Roux still holds the record for the longest-serving coach in modern professional football history, having coached AJ Auxerre from 1961 to 2000 for an impressive total of 39 seasons, taking Auxerre all the way up from the lower divisions to the UEFA Champions League.
A question of age
The average age of coaches across Europe is 46.7. Ukraine, England and Russia have the most senior pool of coaches, with an average age of over 50, while clubs from Portugal, Wales and Luxembourg have invested their trust in a slightly younger generation, with coaches averaging between 41 and 42.5 years of age.
The column chart illustrates the average length of time enjoyed by head coaches in their current position across Europe* as per 1 August 2011. The table underneath sets out the head coaches who have been in their current position at their current club for the longest time**.
Footnotes: * This average length in current position analysis covers the widest available sample covering 525 top division head coaches but excludes head coaches from the following countries: Andorra, Azerbaijan, Armenia, Faroe Islands, Iceland, Kazakhstan, Liechtenstein, Latvia, Lithuania, Moldova, Malta, Montenegro, FYROM, Northern Ireland, San Marino and Wales. ** The average age sample covers 566 head coaches excludes head coach statistics from the following countries: Andorra, Azerbaijan, Armenia, Faroe Islands, Kazakhstan, Liechtenstein, Moldova, Malta, Montenegro, FYROM and San Marino.
More than 3 years 2-3 years 1-2 years Less than 1 year
BIH
ALB
BU
L
GR
E
CY
P
RO
U
SV
K
SR
B
PO
L
CR
O
ITA
NE
D
TU
R
GE
O
SC
O
GE
R
ISR
ES
T
PO
R
HU
N
RU
S
SU
I
ES
P
CZ
E
DE
N
LUX
UK
R
BE
L
SW
E
EN
G
FRA
AU
T
BLR IR
L
NO
R
FIN
Ave
rage
*0
10%
20%
30%
40%
50%
60%
70%
80%
90%
100%
Sir Alex Ferguson Manchester United FC ENG 69 25.01
Arsène Wenger Arsenal FC ENG 61 14.91
David Jeffrey Linfield FC NIR 48 14.50
Thomas Schaaf Werder Bremen GER 50 12.18
Vitali Kvartsiany Volyn Lutsk UKR 58 10.09
Manolo Preciado Sporting Gijon ESP 53 10.05
Kurban Berdyev Rubin Kazan RUS 58 10.01
David Moyes Everton FC ENG 48 9.37
Pekka Lyyski IFK Mariehamm FIN 58 8.59
Nanne Bergstrand Kalmar FF SWE 55 8.59
Christian Gourcuff FC Lorient FRA 56 8.09
Name Club Club NA Age Service
HIGHLIGHTS INDEX

51 BENCHMARKING REPORT FY10 - LONG TERM INVESTMENT – YOUTH FOOTBALL AND HEAD COACHING
16. What type and level of qualification do head coaches have? Q:Q
In recent years, there has been growing acknowledgement of the need for training programmes for football club coaches. In addition to the obvious need for hands-on training through practical experience, the unique challenges of coaching mean a fundamental base of knowledge across many technical areas is a prerequesite. UEFA-approved coaching courses are run across Europe by national associations, and there are various licensing requirements at different levels for the head coach, the first team assistant coach, the head of youth development, and youth coaches.
For the first time, an analysis of 573 head coaches from clubs going through the UEFA club licensing system this season* indicated that 21 clubs had a caretaker head coach at the time of the licensing decision. In this limited number of cases, a club must then appoint a full-time head coach with the requisite qualifications within a maximum of 60 days. From the full sample of licence applicant clubs, 68% (390) head coaches held the highest UEFA Pro licence with a further 7% (42) midway through Pro licence courses while already holding the UEFA A licence. The required level of qualification is standard for all clubs in a particular league but varies between leagues depending on the level of the UEFA coaching convention to which the national association has been admitted**. Of the remaining coaches, 17% (97) had a valid UEFA A licence and 3% (19) a valid B licence. The number of head coaches relying on either an equivalent diploma from a national association of a confederation other than UEFA (10) or a recognition of competence granted by their national association (15), totalled just 4%.
Answer: 16At the moment of licensing, 4% (21) of clubs had a caretaker head coach in place. In total, 96% of club head coaches had obtained a UEFA-approved coaching licence from a European national association with 75% either holding or midway through the highest recognised UEFA Pro licence course. The number of old experienced coaches who pre-dated the coaching qualification revolution and had obtained a recognition of competence from their national association before 2009 was only 2% (15), while only 10 head coaches relied on a valid equivalent coaching diploma from another confederation.
Footnotes: * Licensing managers provided head coach details for 573 of 591 clubs on the “list of licensed clubs” template submitted to UEFA.
** The year of admittance to the UEFA Coaching Convention at Pro level per national association was set out in last year’s benchmarking report together with the total number of coaches at different coaching diploma levels per country.
2011/12 club licensing decisions - by licensor
21
552
Caretaker appointment
Permanent appointment
Status of head coach:clubs undergoing licensing
421015
19
97
390
UEFA Pro Level
UEFA A Level
UEFA B Level
Recognition of experience
Valid non-UEFA diploma
Started Pro diploma course
Head coach qualifications:clubs undergoing licensing
HIGHLIGHTS INDEX

* The chart above reflects the analysis of 535 club head coaches of the top division clubs in Europe as per 1 August 2011. Due to incomplete or limited data, this sample excludes head coaches and clubs from the following countries: Andorra, Azerbaijan, Armenia, Faroe Islands, Kazakhstan, Liechtenstein, Moldova, Malta, Montenegro, FYROM and San Marino.
BENCHMARKING REPORT FY10LONG TERM INvESTMENT – YOUTH FOOTBALL AND HEAD COACHING
52
17. Head coach migration – which coaches travel?Q:Q
Having briefly analysed the use of locally trained players, we analyse in this section the use of domestic and foreign head coaches at national team and top division club levels. Otto Rehhagel (German) is to date the only foreign coach to have won the UEFA European Football Championship, when Greece won UEFA EURO 2004 in Portugal. However, he is unlikely to be the last foreign coach to do so, as more and more national associations are opting for foreign coaches for their national team. Currently, nearly one third of European national associations have looked beyond their borders for a potential recipe for success and signed a head coach from abroad to lead their national team.
Top division clubs tend to have more faith in local coaches as more than three-quarters (82%) of top division coaches are domestic, including those with dual nationality. The column chart clearly indicates, however, that this can vary a lot depending on the league. Bosnia and Herzegovina, Georgia, Iceland and Slovenia are the only countries of this sample where all the coaches of the top league are nationals. Conversely, four leagues (England, Cyprus, Switzerland and Luxembourg) have half or more coaches of foreign origin.
We analyse head coach migration in the column chart by presenting the number of head coaches by nationality working abroad as a club or national team head coach. The blue columns indicate that Dutch, followed by Serbian, Scottish, English and Spanish nationals, are most commonly working abroad within the club game, while French and German head coaches are most commonly working as national team managers.
Head coach top division club National team head coach
Number of top-level coaches working abroad*
FRA
NE
D
SR
B
GE
R
SC
O
ITA
PO
R
EN
G
ES
P
BE
L
RU
S
CR
O
NIR
BIH
CZ
E
RO
U
BU
L
ISR
AU
T
BLR
GE
O
IRL
SW
E
WA
L
DE
N
GR
E
MN
E
PO
L
SU
I
UK
R
ES
T
FIN
HU
N
ISL
LUX
NO
R
0
18
16
14
12
10
8
6
4
2
32%
68%
Profile of national team head coaches
18%
5%
77%
Profile of club team head coaches
Domestic coach
Domestic with dual nationality
Foreign coach
HIGHLIGHTS INDEX

* The chart above reflects the analysis of 535 club head coaches of the top division clubs in Europe as per 1 August 2011. Due to incomplete or limited data, this sample excludes head coaches and clubs from the following countries: Andorra, Azerbaijan, Armenia, Faroe Islands, Kazakhstan, Liechtenstein, Moldova, Malta, Montenegro, FYROM and San Marino.
53 BENCHMARKING REPORT FY10 - LONG TERM INvESTMENT – YOUTH FOOTBALL AND HEAD COACHING
Footnote: * The charts reflect the analysis of 535 club head coaches of the top division clubs in Europe as per 1 August 2011. Due to incomplete or limited data, this sample excludes head coaches and clubs from the following countries: Andorra, Azerbaijan, Armenia, Faroe Islands, Kazakhstan, Liechtenstein, Moldova, Malta, Montenegro, FYROM and San Marino.
Answer: 17Almost one third of UEFA national team head coaches and one quarter of top division club head coaches are foreign, with considerable differences between the leagues.
France not only exports many top players but has also exported the largest number of current top level coaches (16 in total). A majority of these are national team head coaches at the helm of African teams. Dutch and Serbian head coaches also have a high international reputation and are the most commonly found nationality in top domestic club football. In general, it can be said that language skills and cultural similarities are key factors in determining where foreign coaches are recruited, with Scottish managers, for example, particularly prevalent in the English Premier League.
Foreign Dual Domestic
Origin of coaches in the top league of the country
EN
G
CY
P
SU
I
RU
S
LUX
LVA
IRL
UK
R
ES
P
GR
E
PO
L
ES
T
SC
O
WA
L
SW
E
FRA
NE
D
FIN
AU
T
LTU
BLR IT
A
SV
K
BE
L
SR
B
PO
R
AR
M
CR
O
TU
R
GE
R
RO
U
NIR
DE
N
ALB ISR
CZ
E
BU
L
HU
N
NO
R
BIH ISL
GE
O
SV
N
0
10%
20%
30%
40%
50%
60%
70%
80%
90%
100%
HIGHLIGHTS INDEX
BENCHMARKING REPORT FY10FINANCIAL PROFILE OF EUROPEAN CLUB FOOTBALL: INCOME
54
4Financial profile of European club football: income
What are the five-year financial trends?
How much income did European clubs report last year?
What has been the income trend from year to year?
How do income levels differ between European top divisions?
How are the largest clubs spread across Europe?
How do average ticket prices compare across Europe?
HIGHLIGHTS INDEX

55 BENCHMARKING REPORT FY10 - FINANCIAL PROFILE OF EUROPEAN CLUB FOOTBALL: INCOMEHIGHLIGHTS INDEX

BENCHMARKING REPORT FY10FINANCIAL PROFILE OF EUROPEAN CLUB FOOTBALL: INCOME
56
18. What are the five-year financial trends?Q:Q
Club football in Europe has boomed over the last five years (2006–2010), with average* income growth of 9.1% per year. This compares favourably with the average growth of European economies** of just 0.2%.
The principal driver of income growth has been broadcast revenues, which have increased at an annual growth rate of 12.4%. While all revenue streams have grown considerably over the period, the proportion of top division revenues from broadcasting have increased from 31% to 35% over the five-year period.
The aggregate Europe-wide broadcast income figure somewhat masks, however, the picture at national level, with the five largest income leagues (top 5) each reporting €500m+ of broadcast revenue and only one other league (Turkey) reporting more than €100m+ of revenues from this source. Indeed, excluding these six leagues, the proportion of broadcast revenue was only 13% in the 2010 financial year (FY2010).
The red chart indicates the other main story of the five-year period, with net losses increasing every year despite the income growth. Indeed if we look at the 2008–10 financial years, almost €1billion was added to the top division net losses, with cumulative losses of €1.6bn+ in 2010. Over the five-year period, the net loss margin increased from 2.4% to 12.8% of revenues.
0
2,000
4,000
6,000
8,000
10,000
12,000
14,000
2006 2007 2008 2009 2010
Evolution of Europe-wide top division revenues FY2006-2010 (€ Millions)
€9,032
€1,697
€2,059
€2,448
€2,828
€10,034
€1,785
€2,317
€2,576
€3,358
€11,393
€2,007
€2,549
€2,848
€3,989
€11,995
€2,130
€2,571
€3,063
€4,231
€12,797 CAGR 9.1%
CAGR 10.0%
CAGR 6.1%
CAGR 6.8%
CAGR 12.4%
€2,487
€2,606
€3,179
€4,516
Commercial & other Gate receipts Sponsorship Broadcasting
Total revenues
Digging down into the leagues by league results, we see that just five of the 53 failed to report income growth during this period and an impressive 49 outpaced the average growth of their economies***.
19%
31%
23%
27%
FY2006: Revenue streams FY2010: Revenue streams
20%
35%
20%
25%
Footnotes: * Average in this context refers to the compound average growth rate between FY2006 and FY2010.
** This rate refers to GDP growth across EU economies taken from the World Bank economic growth database.
*** For full table see appendices.
Broadcasting Gate receipts Sponsorship Commercial & other
HIGHLIGHTS INDEX

57 BENCHMARKING REPORT FY10 - FINANCIAL PROFILE OF EUROPEAN CLUB FOOTBALL: INCOME
-€ 2,000
-€ 1,800
-€ 1,600
-€ 1,400
-€ 1,200
-€ 1,000
-€ 800
-€ 600
-€ 400
-€ 200
€
-14%
-12%
-10%
-8%
-6%
-4%
-2%
0%2006 2007 2008 2009 2010
Top division net losses FY2006-2010
€216m
€536m
€649m
€1,206m
€1,641m
2.4%
5.3%
5.7%
10.1%
12.8%
Cum
ulat
ive
loss
es (€
m)
Net lo
ss marg
in as a % o
f revenues €339
€4,889
€3,867
€491
€5,861
€3,809
€512
€388
€7,090
€4,291
€323
€7,653
€4,583
€492
€8,167
€4,963
€365
€474
€933
Evolution of Europe-wide top division costs FY2006-2010 (€m)
CAGR 8.3%
CAGR 14.0%
Net non operating costsOperating costs Net transfer costs Personnel costs
€0
€2,000
€4,000
€6,000
€8,000
€10,000
€12,000
€14,000
2006 2007 2008 2009 2010
€16,000
The increased losses have been reported because of the steep growth in the costs of European football clubs, with combined employee and net transfer costs increasing at an average annual rate of 14.0%. Between FY2006 and FY2010, the increase in employee and net transfer costs of €3.7bn has almost entirely eaten up the revenue growth of €3.8bn, without taking into consideration the €1.5bn increase in other operating and non-operating costs.
The combined losses of €4,032m from FY2006 to FY2010 have led to a fall in the combined European balance sheet health of clubs, with net equity (assets less liabilities) falling by €632m from €2.5bn at the end of FY2006 to €1.9bn at the end of FY2010. It is possible to look at these high level five-year figures from both positive and negative angles. The fact that clubs have managed to recapitalise their balance sheets with injections of €3.4bn (covering 84% of losses) is evidence of the willingness and ability of football club owners and benefactors to support losses. On the other hand, the negative view is that balance sheets have deteriorated despite five years of record income growth.
Answer: 18Football club income has prospered during the turbulent economic period of the last five years, with club revenue growing in 48 of the 53 top divisions at an aggregate rate of more than 9% a year. However, the cost base of football clubs has increased at a faster rate, with employee and net transfer costs increasing at a rate of 14% a year, leading to a significant increase in reported losses, particularly in the last three years.
HIGHLIGHTS INDEX

BENCHMARKING REPORT FY10FINANCIAL PROFILE OF EUROPEAN CLUB FOOTBALL: INCOME
58
19. How much income did European clubs report last year?Q:Q
BroadcastingAdvertising & sponsorship
Gate receiptsCommercial & other income
19%21%25%35%
€4.5bn €3.2bn €2.6bn €2.5bn
€12.8bn
Answer: 19Between them, the 734 top division clubs in Europe are estimated*** to have generated just under €12.8bn in income in FY2010, excluding transfers. Clubs in the next two divisions below (which generally do not undergo UEFA licensing and are not considered in this report) are estimated – using a sample of club financial statements and attendance data – to have generated a further €2.8–3.3bn.
Firstly, as in previous reports, “total income” is used in this report to refer to “revenue”, which is sometimes also referred to as “income from operating activities” or “turnover”*. For the purposes of this report, we refer to revenue and income interchangeably. Profits/income from transfers is usually a large and fluctuating figure and is not included but analysed separately as net transfer activity within the profitability analysis. Financial income, divestment and tax income are also excluded and included within the profitability analysis. “Income/revenue” should also not be confused with the term “budget”, commonly used in eastern Europe to mean the financial resources available to a club, including any non-committed owner contributions.
The revision of the UEFA Club Licensing Regulations three years ago, allowed UEFA to introduce certain minimum disclosure standards in financial reporting to be met by all clubs applying for a licence. This has increased the potential to make better and more reliable comparisons between clubs within a country and also between
countries. In particular, clubs are required to split revenue into different revenue streams, providing an indication of the importance of different revenue types. Most clubs were not required to do so previously under standard financial reporting requirements which allow all revenue to be disclosed as one figure. Although revenue splits do not go as far as the commercial contract level and the distinction between sponsorship and commercial revenue in particular is not always clear**, we nonetheless believe the income stream requirement is an important step towards increased transparency in football clubs.
In FY2010, broadcast revenue accounted for 35% of the estimated €12,797m total Europe-wide top division income, with advertising and sponsorship accounting for 25%, gate receipts 21% and commercial and other income 19 %.
The importance of different revenue streams differs significantly between countries, as shown later in this report.
Footnotes: * Revenue is basically all income less the following investing and financing results: profits or income on transfer dealings, gains or income on the sale of other assets, gains or income on the sale of financial investments, financial interest, tax income or credits. These items are sometimes presented grouped together with costs and losses, but also sometimes presented separately; hence, for comparability reasons, revenue is preferable to the wider definition of income used by some clubs and reports.** Commercial income includes conferencing and merchandising, while other income includes donations, grants, solidarity payments, exceptional income and unclassified income. The split between commercial and sponsorship is not always clearly defined by
some English, Spanish and Italian clubs, so the revenue streams should be considered as indicative only. Although disclosure is generally consistent from year to year, there may have been some improvements in reporting that have influenced the results. *** “Estimated” because extrapolations used for the 10% of top division clubs not surveyed (always lower-ranked clubs which did not apply for a UEFA licence). Estimate accurate to +/-0.5% as contains 98% actual and 2% extrapolated data. Extrapolations based on average club income outside largest 4 income clubs and manual adjustments where deemed necessary.
HIGHLIGHTS INDEX
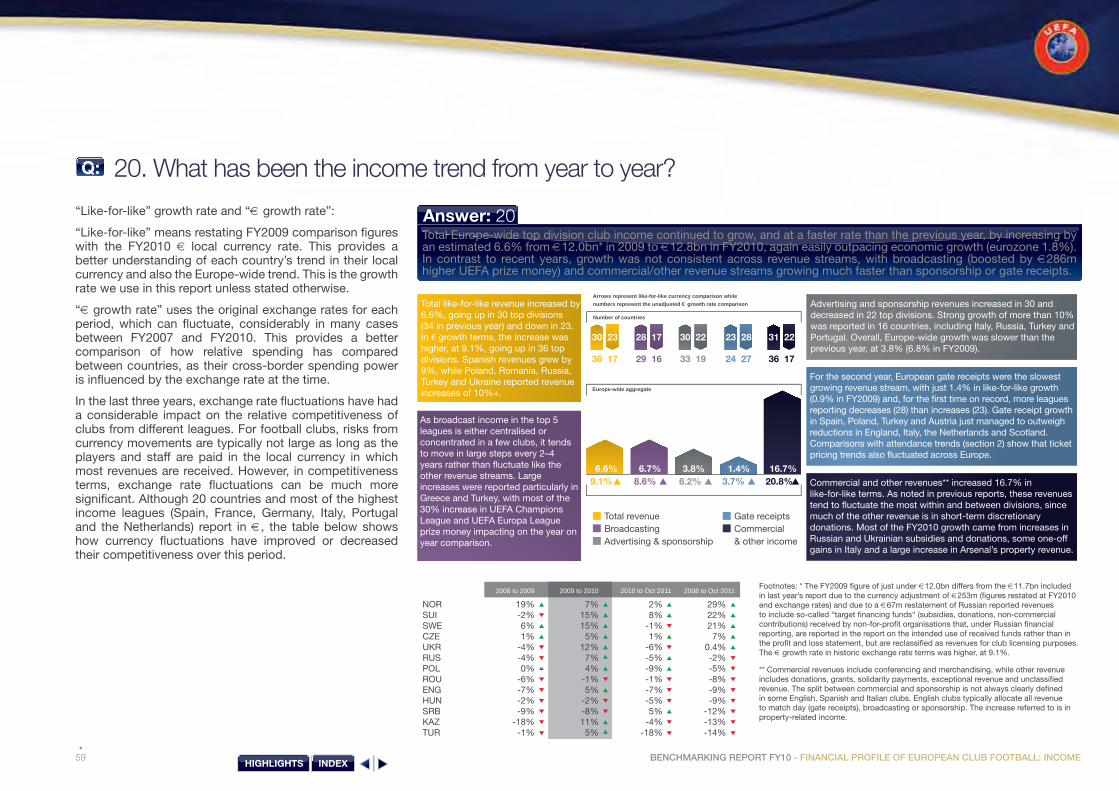
59 BENCHMARKING REPORT FY10 - FINANCIAL PROFILE OF EUROPEAN CLUB FOOTBALL: INCOME
20. What has been the income trend from year to year?Q:Q
“Like-for-like” growth rate and “€ growth rate”:
“Like-for-like” means restating FY2009 comparison figures with the FY2010 € local currency rate. This provides a better understanding of each country’s trend in their local currency and also the Europe-wide trend. This is the growth rate we use in this report unless stated otherwise.
“€ growth rate” uses the original exchange rates for each period, which can fluctuate, considerably in many cases between FY2007 and FY2010. This provides a better comparison of how relative spending has compared between countries, as their cross-border spending power is influenced by the exchange rate at the time.
In the last three years, exchange rate fluctuations have had a considerable impact on the relative competitiveness of clubs from different leagues. For football clubs, risks from currency movements are typically not large as long as the players and staff are paid in the local currency in which most revenues are received. However, in competitiveness terms, exchange rate fluctuations can be much more significant. Although 20 countries and most of the highest income leagues (Spain, France, Germany, Italy, Portugal and the Netherlands) report in €, the table below shows how currency fluctuations have improved or decreased their competitiveness over this period.
As broadcast income in the top 5 leagues is either centralised or concentrated in a few clubs, it tends to move in large steps every 2–4 years rather than fluctuate like the other revenue streams. Large increases were reported particularly in Greece and Turkey, with most of the 30% increase in UEFA Champions League and UEFA Europa League prize money impacting on the year on year comparison.
Total like-for-like revenue increased by 6.6%, going up in 30 top divisions (34 in previous year) and down in 23. In € growth terms, the increase was higher, at 9.1%, going up in 36 top divisions. Spanish revenues grew by 9%, while Poland, Romania, Russia, Turkey and Ukraine reported revenue increases of 10%+.
Advertising and sponsorship revenues increased in 30 and decreased in 22 top divisions. Strong growth of more than 10% was reported in 16 countries, including Italy, Russia, Turkey and Portugal. Overall, Europe-wide growth was slower than the previous year, at 3.8% (6.8% in FY2009).
For the second year, European gate receipts were the slowest growing revenue stream, with just 1.4% in like-for-like growth (0.9% in FY2009) and, for the first time on record, more leagues reporting decreases (28) than increases (23). Gate receipt growth in Spain, Poland, Turkey and Austria just managed to outweigh reductions in England, Italy, the Netherlands and Scotland. Comparisons with attendance trends (section 2) show that ticket pricing trends also fluctuated across Europe.
Commercial and other revenues** increased 16.7% in like-for-like terms. As noted in previous reports, these revenues tend to fluctuate the most within and between divisions, since much of the other revenue is in short-term discretionary donations. Most of the FY2010 growth came from increases in Russian and Ukrainian subsidies and donations, some one-off gains in Italy and a large increase in Arsenal’s property revenue.
Total revenueBroadcastingAdvertising & sponsorship
6.6%
30 23 28 17
6.7%
30 22
3.8%
23 28
1.4%
31 22
36 17 29 16 33 19 24 27 36 17
9.1% 8.6%
Gate receipts
Arrows represent like-for-like currency comparison while numbers represent the unadjusted € growth rate comparison
Commercial & other income
16.7%6.2% 3.7% 20.8%
Europe-wide aggregate
Number of countries
Answer: 20Total Europe-wide top division club income continued to grow, and at a faster rate than the previous year, by increasing by an estimated 6.6% from €12.0bn* in 2009 to €12.8bn in FY2010, again easily outpacing economic growth (eurozone 1.8%). In contrast to recent years, growth was not consistent across revenue streams, with broadcasting (boosted by €286m higher UEFA prize money) and commercial/other revenue streams growing much faster than sponsorship or gate receipts.
Footnotes: * The FY2009 figure of just under €12.0bn differs from the €11.7bn included in last year’s report due to the currency adjustment of €253m (figures restated at FY2010 end exchange rates) and due to a €67m restatement of Russian reported revenues to include so-called “target financing funds“ (subsidies, donations, non-commercial contributions) received by non-for-profit organisations that, under Russian financial reporting, are reported in the report on the intended use of received funds rather than in the profit and loss statement, but are reclassified as revenues for club licensing purposes. The € growth rate in historic exchange rate terms was higher, at 9.1%.
** Commercial revenues include conferencing and merchandising, while other revenue includes donations, grants, solidarity payments, exceptional revenue and unclassified revenue. The split between commercial and sponsorship is not always clearly defined in some English, Spanish and Italian clubs. English clubs typically allocate all revenue to match day (gate receipts), broadcasting or sponsorship. The increase referred to is in property-related income.
NOR 19% 7% 2% 29%SUI -2% 15% 8% 22%SWE 6% 15% -1% 21%CZE 1% 5% 1% 7%UKR -4% 12% -6% 0.4%RUS -4% 7% -5% -2%POL 0% 4% -9% -5%ROU -6% -1% -1% -8%ENG -7% 5% -7% -9%HUN -2% -2% -5% -9%SRB -9% -8% 5% -12%KAZ -18% 11% -4% -13%TUR -1% 5% -18% -14%
2008 to 2009 2009 to 2010 2010 to Oct 2011 2008 to Oct 2011
=
HIGHLIGHTS INDEX

BENCHMARKING REPORT FY10FINANCIAL PROFILE OF EUROPEAN CLUB FOOTBALL: INCOME
60
21. How do income levels differ between European top divisions?Q:Q
A number of factors dictate a club’s ability to generate income. For clubs from the top 5 and “large” divisions, the split of central revenues (broadcast, sponsorship), participation in UEFA competitions, stadium ownership, and ability to connect with the fan base are key factors. For “small” and “micro” divisions, other factors are often more relevant, including whether the main sponsor supports the club financially through sponsorship contracts or by injecting capital into the club. The end result is the same (e.g. wages are covered), but sponsorship contracts are included as income while capital injections are not. In addition, for consistency purposes, income or profits from transfers are not included in revenue but analysed separately net of transfer costs. We will see later that these amounts can be relatively large, especially for medium-sized clubs. Differing spending power (national economy) also influences commercial and gate incomes.
134
91
82 79
54
38
29 23
17 17 15 15 15 15 13 13 10 7 5 5 5 4 4 3 3 2 2 2 1 1 1 1 1 1 1 1 1 1 1 1 0 0 0 0 0 0 0 0 0 0 0 0 0
0
15
30
45
60
75
90
105
120
135
EN
G
GE
R
ES
P
ITA
FR
A
RU
S
TUR
N
ED
S
CO
P
OR
U
KR
B
EL
SU
I A
UT
DE
N
GR
E
NO
R
SW
E
PO
L IS
R
RO
U
KA
Z
CZ
E
CY
P
BLR
S
VK
C
RO
H
UN
S
RB
S
VN
FI
N
BU
L LI
E
IRL
MD
A
AZ
E
NIR
IS
L LV
A
LTU
B
IH
LUX
M
NE
FR
O
GE
O
MK
D
WA
L E
ST
MLT
A
RM
A
ND
A
LB
SM
R
Est
imat
ed*
club
ave
rage
rev
enue
FY
2010
(€m)
2.5
2.3
2.0
1.6
1.3
1.2
1.2
1.2
1.2
1.2
1.0
0.9
0.7
0.6
0.6
0.6
0.5
0.5
0.5
0.4
0.4
0.3
0.3
0.2
0.2
0.2
0.1
0.1
0.1
0.0
0.4
0.8
1.2
1.6
2.0
2.4
2.8
BLR
S
VK
C
RO
H
UN
S
RB
S
VN
FI
N
BU
L LI
E
IRL
MD
A
AZ
E
NIR
IS
L LV
A
LTU
B
IH
LUX
M
NE
FR
O
GE
O
MK
D
WA
L E
ST
MLT
A
RM
A
ND
A
LB
SM
R
Est
imat
ed*
club
ave
rage
rev
enue
FY
2010
(€m)
6 9 3 3 3231 4 0 9 40 1 1 4 1 5 1 7 14 2 162426 5 3 8 4 10103 1 9 5 221016 9 4 6 39 5 19 9 8 2 2957121920463022 85
6 9 3 3 4238 4 5 9 57 1 14 4 1 5 5 7 1914163732 5 3 8 5 1287 1 9 5 7 10 5 1 9 8 39 5 19 9 8 2 3355 8 1920643020 811
Like-for-like trend
€ currency trend
% up % down
Footnote: * “Estimated” because extrapolations used for some countries for clubs not surveyed (always lower-ranked clubs which did not apply for a UEFA licence). Extrapolations based on average club income outside the top 4 income clubs and manual adjustments where deemed necessary. Figures estimated for Albania, Armenia, FYROM and Montenegro, accurate to +/-20% due to small sample size of less than half of top division clubs and accurate to +/-10% for Greece (12 of 16), Portugal (7 of 16) and Turkey (15 of 18).
Answer: 21Club income is spread unevenly across the different top divisions. The “top” clubs represent 13% of the 734 European top division clubs but generate 67% of the €12.8bn total European revenue.
Although this share is down from 69% in FY2008 and FY2009 and the divisions with the fastest growing revenues in FY2010 (notably Russia, Turkey and Ukraine) were outside these top 5, the proportion of top 5 revenue is likely to rise again next year, when significantly better English and Italian broadcast contracts feed into their club revenues.
Revenue increase 10%+ Revenue increase 0-10% Revenue decrease 0-10% Revenue decrease 10%+
Like-for-like country trend FY2009 - FY2010 in average club revenues
13
17
15
8
HIGHLIGHTS INDEX

61 BENCHMARKING REPORT FY10 - FINANCIAL PROFILE OF EUROPEAN CLUB FOOTBALL: INCOME
22. How are the largest clubs spread across Europe?Q:Q
0
4
8
12
16
20
EN
G
GE
R
ES
P
ITA
FR
A
RU
S
TUR
N
ED
S
CO
P
OR
U
KR
B
EL
SU
I A
UT
DE
N
GR
E
NO
R
SW
E
PO
L IS
R
RO
U
KA
Z
CZ
E
CY
P
BLR
S
VK
C
RO
H
UN
S
RB
S
VN
FI
N
BU
L LI
E
IRL
MD
A
AZ
E
NIR
IS
L LV
A
LTU
B
IH
LUX
M
NE
FR
O
GE
O
MK
D
WA
L E
ST
MLT
A
RM
A
ND
A
LB
SM
R
Num
ber
of c
lub
s
The number of clubs reporting revenues of more than €50m increased from 68 in FY2009 to 73 in FY2010. Although the largest clubs in Europe remain concentrated in the top 5 divisions, with 57 of the 73 clubs classified as “top” coming from England (20), Germany (13), Italy (11), Spain (7) and France (6), the number of clubs from outside these top 5 divisions reporting revenues of more than €50m increased from 11 to 16 from 7 different countries. Looking at the club by club figures for three years (FY2008–2010), there is some clear consistency as to the make-up of this top group, with 51 clubs reporting top revenues in all three years and 61 clubs in the last two years. There were 11 clubs that reported revenues +/-10% either side of the top threshold in 2010.
There were an estimated* 162 clubs from 23 countries across Europe reporting revenues of less than €350k in FY2010. This peer group represents 22% of all European top division clubs. Clubs in this peer group are usually semi-professional, although some from less developed economies are fully professional. There are 17 countries where the majority of top division clubs were “micro”.
There were 207 clubs (195 in FY2009) from 31 countries (28 in FY2009) across Europe reporting revenues of between €5m and €50m in FY2010. This group represents 27% of all European top division clubs. Due to the new TV deal and the relatively wide distribution of this money between clubs, all English top division clubs were again in the top peer group and, therefore, none in the “large” group.
TOP (€50M+)LARGE (€5-50M)MEDIUM (€1.25-5M)SMALL (€350K-1'250K)MICRO (<€350K)
Club spread FY2010
162; 22%
73; 10%
207; 28%
149; 20%
143; 20%
Footnote: * Most of the 70 non-reporting clubs are those that finished lower down in the domestic rankings and were relegated. The charts above are a UEFA best estimate indicating a full sample of 734 clubs split between peer groups.
HIGHLIGHTS INDEX

BENCHMARKING REPORT FY10FINANCIAL PROFILE OF EUROPEAN CLUB FOOTBALL: INCOME
62
23. How do average ticket prices compare across Europe?Q:Q
Est
imat
ed m
atch
day
inco
me
per a
ttend
ee (€
)
Average attendance
ENG
ESP
FRA
GER
ITA
-
10
20
30
40
50
60
0 5,000 10,000 15,000 20,000 25,000 30,000 35,000 40,000 45,000 AVG: 30,000
AVG: 33.25
Est
imat
ed m
atch
day
inco
me
per a
ttend
ee (€
)
Average attendance
AUT
BEL
DEN
GRE
NED
NOR
POL POR
RUS
SCO
SUI
SWE
TUR
UKR
-
5
10
15
20
25
30
35
40
0 5,000 10,000 15,000 20,000 25,000
AVG: 19.31
AVG: 9,936 >=€70€50 - 70€30 - 50€20 - 30€15 - 20€10 - 15<€10
5% 6%
16%
19%23%
23%
8%
Any study on ticket prices will inevitably run up against comparability issues due to different types of tickets (season, membership, matchday ticket categories, complimentary tickets, etc.) and pricing models (segmentation of ticket prices, category of match, etc.) employed by different clubs and in different countries. The figures here should be considered indicative only but are still of value in making cross-border comparisons. The main scatter charts illustrate ticket prices by peer group and the pie charts in the upper corners indicate the percentage of clubs within each peer group that fall into the different ranges of average matchday cost per attendee.
It is no surprise that in the top peer group England and Spain generated the most income per attendee in the 2009/10 season. Both high attendances and large gate receipts helped England out-earn its rivals. In the case of Spain, membership fees contributed significantly to matchday revenues. Compared with England and Spain, Germany combines lower ticket prices with high average attendances. The pie chart shows that more than half (54%) of clubs in this peer group had an average matchday revenue per attendee of less than €20.
In the “large” peer group, Greece and Turkey tend to have higher average ticket prices but also lower attendances. The Netherlands stands out in its group as getting fans through the turnstiles and keeping prices just below the average. As already highlighted in the attendance trend analysis, the same study covering the 2010/11 financial period and season will show that attendances in Poland have caught up with some of their peers.
Footnote: * The average match-day revenue per attendee (total match-day income divided by total league attendance) is only a rough estimate used here for comparison purposes. In reality, the average revenue per attendee would be lower as the match-day income used here is for all competitions (e.g. domestic cup, UEFA and friendly matches), whereas the attendance figure is for domestic championship matches only. The extent of the distortion depends on the mix of these other competitions, which on average, taking our sample, is about 10% of match-day income. In addition, in some competitions there is revenue sharing between the home and away clubs which is not taken into account in the calculation since we use home matches only as the basis for calculation.
>=€40€30 - 40€20 - 30€15 - 20€10 - 15€5- 10<€5
6%5%
20%
16%17%
13%
23%
Peer group: Top Peer group: Large
HIGHLIGHTS INDEX
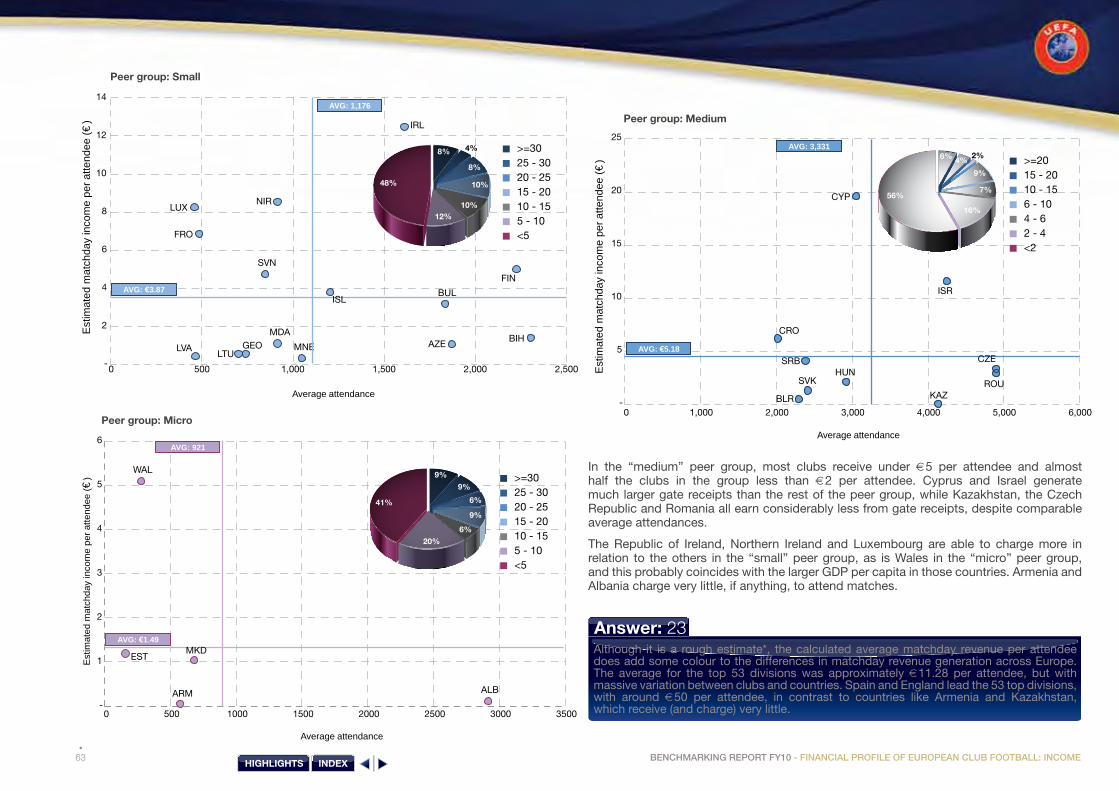
63 BENCHMARKING REPORT FY10 - FINANCIAL PROFILE OF EUROPEAN CLUB FOOTBALL: INCOME
Est
imat
ed m
atch
day
inco
me
per a
ttend
ee (€
)
Average attendance
AZE BIH
BUL
FIN
FRO
GEO
IRL
LTU
LUX
LVA
MDA
MNE
NIR
SVN
-
2
4
6
8
10
12
14
0 500 1,000 1,500 2,000 2,500
AVG: 3.87
AVG: 1,176
ISL
ALB ARM
EST
WAL
-
1
2
3
4
5
6
0 500 1000 1500 2000 2500 3000 3500
Est
imat
ed m
atch
day
inco
me
per a
ttend
ee (€
)
Average attendance
AVG: 921
AVG: 1.49 MKD
Est
imat
ed m
atch
day
inco
me
per a
ttend
ee (€
)
Average attendance
BLR
CRO
CYP
HUN
ISR
KAZ ROU
SRB
SVK
-
5
10
15
20
25
0 1,000 2,000 3,000 4,000 5,000 6,000
AVG: 3,331
AVG: 5.18 CZE
In the “medium” peer group, most clubs receive under €5 per attendee and almost half the clubs in the group less than €2 per attendee. Cyprus and Israel generate much larger gate receipts than the rest of the peer group, while Kazakhstan, the Czech Republic and Romania all earn considerably less from gate receipts, despite comparable average attendances.
The Republic of Ireland, Northern Ireland and Luxembourg are able to charge more in relation to the others in the “small” peer group, as is Wales in the “micro” peer group, and this probably coincides with the larger GDP per capita in those countries. Armenia and Albania charge very little, if anything, to attend matches.
Answer: 23Although it is a rough estimate*, the calculated average matchday revenue per attendee does add some colour to the differences in matchday revenue generation across Europe. The average for the top 53 divisions was approximately €11.28 per attendee, but with massive variation between clubs and countries. Spain and England lead the 53 top divisions, with around €50 per attendee, in contrast to countries like Armenia and Kazakhstan, which receive (and charge) very little.
>=2015 - 2010 - 156 - 104 - 62 - 4<2
6% 4%
9%
7%
2%
16%
56%
>=3025 - 3020 - 2515 - 2010 - 155 - 10<5
4%
12%10%
10%
8%
8%
48%
>=3025 - 3020 - 2515 - 2010 - 155 - 10<5
20%
6%
9%
6%
9%
9%
41%
Peer group: Small
Peer group: Micro
Peer group: Medium
HIGHLIGHTS INDEX

BENCHMARKING REPORT FY10FINANCIAL PROFILE OF EUROPEAN CLUB FOOTBALL: COSTS & PROFITABILITY
64HIGHLIGHTS INDEX
65 BENCHMARKING REPORT FY10 - FINANCIAL PROFILE OF EUROPEAN CLUB FOOTBALL: COSTS & PROFITABILITY
5Financial profile of European club football: costs and profitability
What did clubs spend their money on and how much did this increase?
How much did clubs spend on wages and player salaries?
How do spending levels vary between clubs in each league?
How does player spending differ between clubs?
What operating profits are clubs generating?
How do financing, divesting, non-operating items and tax impact on profits across Europe?
What proportion of clubs are loss making?
HIGHLIGHTS INDEX

BENCHMARKING REPORT FY10FINANCIAL PROFILE OF EUROPEAN CLUB FOOTBALL: COSTS & PROFITABILITY
66
24. What did clubs spend their money on and how much did this increase?Q:Q
Despite improvements generated by club licensing disclosure requirements, the presentation of operating expenses varies enormously between different countries and legal forms, making comparisons difficult. It is often up to the clubs to choose how to split operating expenses (sales & marketing, youth football, fixed stadium costs, variable matchday costs, training costs, etc.) and whether to split personnel costs by type (e.g. fixed salary, bonus, benefits in kind) and by category of employee (e.g. player, coach, administrative staff, director).
Answer: 24Together, the 734 top division clubs in Europe are estimated* to have incurred €14.4bn in expenses in FY2010, amounting to 113% of the €12.8bn income and representing a 9.3% increase over restated FY2009 spending levels. The particular significance of employee costs for European club football is again highlighted, absorbing 64% of all club revenues plus another 7% in net transfer costs. Indeed, while employee cost growth of 6.7% increased at the same rate as income growth, and combined operating and non-operating costs increased at 5.0% (slightly below income growth rate), it was net transfer costs that increased most significantly, almost doubling to €933m.
€8.2bn €0.9bn €5.0bn €0.4bn
113% Revenue
Employee costsNet transfer costs
Operating expensesNon operating expenses
€14.4bn
64% 7% 39% 3%
Employee costs of €8,167m include all types of payments (salaries, bonuses, benefits, social taxes, pensions, etc.) and cover all employees (players, technical staff, administrative staff, etc.).
In most countries, the financial reporting requirements do not require employee costs to be further broken down. Given their significance (€8.2bn/64% revenue) this would surely be useful. From the 489 clubs that do provide a split, the weighted ratio was 83% player to 17% other staff costs. From those that paid and disclosed variable payments, the split was 22% variable to 78% fixed player wages.
Net transfer costs of €933m includes €2,195m amortisation of past transfers (17.4% of income) and €57m write-down of transfer values (0.5%) less net profits on sale of player registrations during the year, equivalent to 10.2% of income.
Operating expenses of €4,963m are not split down further in a consistent way between countries or, in most cases, between clubs in those countries.
These expenses include cost of materials, matchday expenses, sales & marketing, administration, write-down of goodwill, depreciation & rent of facilities, and youth football.
A Europe-wide detailed breakdown cannot be given with much certainty since a split of almost half of operating costs is not disclosed. A best estimate where costs have been split is that direct allocations to youth football represented 4% of revenue (8% for smaller clubs) and fixed assets, property expenses and rent was equivalent to 5% of revenue.
Non-operating expenses of €365m includes net finance costs (3.8% revenue) less net tax income (0.3%) and net profit on sale of non-player assets (0.5%).
The analysis in this report therefore concentrates on the more comparable high-level split between employee costs, other operating expenses, specific non-operating costs and net transfer activity that can be made by all clubs.
Footnote: * Estimated because extrapolations used for the 10% of top division clubs not in the survey (always lower-ranked clubs which did not apply for UEFA licence). Estimate accurate to +/-0.5% as contains 98% actual and 2% extrapolated data. Extrapolations based on average club income outside largest four income clubs and manual adjustments where deemed necessary.
HIGHLIGHTS INDEX

67 BENCHMARKING REPORT FY10 - FINANCIAL PROFILE OF EUROPEAN CLUB FOOTBALL: COSTS & PROFITABILITYHIGHLIGHTS INDEX

25. How much did clubs spend on wages and player salaries?Q:Q
The charts here show the percentage of reported revenues paid out as employee costs, in total for each division (top column chart), clubs by division (bottom column chart), club by club across Europe (pie chart) and the year-on-year trend across clubs. Given the significance of employee costs for football clubs, in particular player salaries, the ratio is regularly used as a key performance indicator by clubs. The amount paid to players in salaries is usually not available (see opposite page) and, hence, tables presented in the media from time to time showing “the highest earners” are speculative estimates and to be taken with a pinch of salt. Generally, all direct employee (player, technical and administrative staff) costs incurred by the employer are disclosed together and this is the value used below.
For the country by country analysis, at the bottom end, clubs from San Marino (0%) are run on an amateur basis, but for some clubs in one or two other countries the disclosure between employee and other costs may not be reliable, therefore these clubs and divisions are shaded grey in the column charts.
SW
EK
AZ
ES
PB
EL
DE
NIR
LM
KD
NO
RM
LT NIR
GE
RA
ND
LVA
FRO
ALB
UK
RC
ZE
ES
TLT
UA
RM
HU
NM
DA
SM
RA
vera
ge*
Med
ian*
CR
OS
RB
GE
OS
VK
BU
LM
NE
GR
EP
OL
FIN
ITA
FRA
LUX
AZ
ER
OU
ISL
ISR
SV
NN
ED
PO
RTU
RB
IHS
UI
AU
TR
US
WA
LE
NG
BLR LI
ES
CO
CY
P
0%
20%
40%
60%
80%
100%
120%119
112
10298 96
81 81 80 77 74 74 71 71 71 71 70 70 69 68 67 67 67 67 66 65 63 63 62 61 61 61 60 59 59 58 56 56 55 53 53 5147 46
4239 37 35
32 31 3023
17
64 64
0
>= 100% 80% - 100% 70% - 80% 60% - 70% 50% - 60% 30% - 50% < 30%
0
4
8
12
16
20
SW
EK
AZ
ES
PB
EL
DE
NIR
LM
KD
NO
RM
LT NIR
GE
RA
ND
LVA
FRO
ALB
UK
RC
ZE
ES
TLT
UA
RM
HU
NM
DA
SM
R
CR
OS
RB
GE
OS
VK
BU
LM
NE
GR
EP
OL
FIN
ITA
FRA
LUX
AZ
ER
OU
ISL
ISR
SV
NN
ED
PO
RTU
RB
IHS
UI
AU
TR
US
WA
LE
NG
BLR LI
ES
CO
CY
P
BENCHMARKING REPORT FY10FINANCIAL PROFILE OF EUROPEAN CLUB FOOTBALL: COSTS & PROFITABILITY
68
Footnote: * As the ratio is purely an indicator and not an exact science, there is no standard definition of what a high employee costs ratio is. For the club by club comparison, we have taken 70%+ as a high ratio. The club by club figures represent the full sample of 663 clubs from all 53 countries.
HIGHLIGHTS INDEX

Personnel cost ratio FY2010 All clubs
78
95
81
118
99
104
88
>= 100% 80% - 100%
70% - 80% 60% - 70%
50% - 60% 30% - 50%
< 30%
The scatter charts illustrate the split between player costs (wages, salaries, social charges, including pensions) and the costs of other personnel (coaches and technical staff, directors, support and administrative staff) for a representative sample** of 45 “top” clubs and 145 “large” clubs. The relative cost of playing versus non-playing staff depends not just on the player salary policy but on many other things too, including whether the club operates its own stadium, whether the club is a multi-sports club, whether the club operates other non-core activities, and whether its commercial activities are in-house or outsourced. While this leads naturally to some variation in player cost % for clubs of all sizes, the average for “top” clubs of 85% is higher than the 77% for “large” and “medium” clubs. This tendency is also reflected in the upwards sloping regression lines within each peer group. Intuitively, all other factors being equal, the higher proportion of player costs for larger clubs would be due to the closer link between player salaries and club revenues than non-player salaries and club revenues.
5%
15%
11%
16%
16%
12%
5%
Personnel cost ratio FY2010The 80 UEFA group stage clubs
€ Personnel cost: trend by club FY2009 to FY2010
> +10% 1 to 10% -1 to -10%±1% > -10%
44% 15% 15%3% 23%
Trend by club FY2008 to FY2009 comparison
44% 15% 15%3% 23%44% 15% 15%3% 23%44% 15% 15%3% 23%44% 15% 15%3% 23%
48% 15% 10%6% 21%
69 BENCHMARKING REPORT FY10 - FINANCIAL PROFILE OF EUROPEAN CLUB FOOTBALL: COSTS & PROFITABILITY
Answer: 25The overall share of revenue spent on wages and social costs remained consistent at 64%. On a league by league basis, the trends were mixed, with the number of divisions with a ratio of more than 70% increasing again from 15 in FY2009 to 18 in FY2010, while the number of divisions with a ratio above 80% decreased from 11 in FY2009 to 7 in FY2010. In total, at least 254 individual clubs (249 in FY2009) reported a personnel cost to income ratio above 70%, and the proportion of clubs reporting over 70% is the same for the 80 clubs that qualified for either the UEFA Champions League or UEFA Europa League.
While there was some slowdown in employee cost inflation, the aggregate amount paid still increased by 6.7%, with almost half of all top division clubs (44%) reporting at least a 10% increase in employee costs and another 15% of clubs reporting increases of between 1 and 10% compared with FY2009.
More than half the countries had a club reporting a clearly unsustainable employee cost ratio above 100%; 78 clubs in total (73 in FY2009).
The share of employee costs from players of 83% indicates that their costs were €6.8bn in FY2010.
50%
60%
70%
80%
90%
100%
10 20 30 40 500
Club revenues (€’Millions)
Pla
yer
cost
s as
% o
f tot
al p
erso
nnel
cos
ts
Player costs as % overall personnel costs (clubs with revenue between €5m & €50m)
50%
60%
70%
80%
90%
100%
Pla
yer
cost
s as
% o
f tot
al p
erso
nnel
cos
ts
60 80 100 120 16040
Club revenues (€’Millions)
140
Player costs as % overall personnel costs (clubs with revenue between €50m & €150m)
Average***: 77%
Average***: 85%
Footnotes: ** The sample covers clubs from 16 of the 19 “top” or “large” top divisions, with only English, Scottish and Belgian clubs not represented (figures not disclosed in the financial statements). In the “top” scatter chart, the largest six clubs, with revenue >€150m, have been excluded to protect anonymity but their split ranged from 84% to 93% and supports the illustrated regression line in the “top” chart. *** Average is a simple average of the sample percentages rather than a weighted average, which is slightly higher.
HIGHLIGHTS INDEX

BENCHMARKING REPORT FY10FINANCIAL PROFILE OF EUROPEAN CLUB FOOTBALL: COST & PROFITABILITY
70
26. How do spending levels vary between clubs in each league?Q:Q
The next chart presents wealth differences within the European top divisions by measuring the spread of spending within each league, comparing the average combined personnel and net transfer costs of the four biggest spending clubs with the average combined costs of other clubs in each division. The colour of country code indicates the division peer group. Comparing the top four with other clubs’ combined personnel costs is just one of many measures that can be used to analyse financial balance, and last year we presented a similar comparison using income. We consider this year’s measure – the combined personnel cost – to be the most useful measure of relative wealth since it is principally in the player and coaching markets (wages and transfer fees) that clubs compete against each other.
Answer: 26The spread of each colour across the chart suggests that the overall financial size of the league is not a significant factor. In FY2010, the top four spending clubs spent on average between double and four times as much as the other clubs in about half the European top divisions. Among the “top” or “large” divisions, the amount spent on players and other staff was most even in Sweden and Poland (2.1 and 2.2x), while the relative spending of top clubs compared with smaller clubs was most different in Portugal, Ukraine, Greece and Scotland.
Footnotes: * Estonia and Serbia have been restated to zero in the chart as the average combined employee cost for the non-top four clubs was actually negative in FY2010 due to successful transfer profits outweighing employee costs. ** Combined personnel costs include all personnel costs (wages, salaries and social charges) added to the net transfer result reported in the year. This net transfer result includes amortisation costs on players purchased in recent years with profit/loss on players sold just in FY2010. ***The classification of top 4 v non-top 4 clubs in this case is calculated from the same measure (personnel costs including net transfer costs). The top four versus other club analysis covers 46 countries – excluded from this analysis are Albania, Armenia, FYROM, Montenegro (not enough non-top four clubs in sample) and Hungary, San Marino and Slovakia (comparability issues).
MD
A
LVA
PO
R
LIE
UK
R
LTU
GR
E
CR
O
SV
N
SC
O
BU
L
RU
S
ES
P
WA
L
TU
R
ITA
NE
D
AN
D
ISR
AU
T
IRL
FRA
BIH
DE
N
BE
L
CY
P
CZ
E
RO
U
GE
R
EN
G
GE
O
SU
I
NO
R
LUX
KA
Z
NIR ISL
AZ
E
FRO
BLR
SW
E
PO
L
MLT FIN
ES
T*
SR
B*
0.0x
2.0x
4.0x
6.0x
8.0x
10.0x
12.0x
14.0x
16.0x
18.0x
20.0x
16.615.8
12.812.7
9.8 9.89.2 8.9 8.6
6.86.4
5.95.1 4.9 4.6 4.5
4.1 3.9 3.7 3.5 3.4 3.4 3.4 3.3 3.1 3.1 3.1 3.0 2.9 2.6 2.5 2.5 2.5 2.5 2.3 2.3 2.2 2.2 2.2 2.11.7 1.5
0.0 0.0
+20x
Wealth spread – combined** personnel costs: top 4*** v non-top 4 clubs
HIGHLIGHTS INDEX

71 BENCHMARKING REPORT FY10 - FINANCIAL PROFILE OF EUROPEAN CLUB FOOTBALL: COST & PROFITABILITY
27. How does player spending differ between clubs?Q:Q
The next charts illustrate the large wealth differences across European clubs by ranking them from 1 to 250 based on their spending on combined personnel costs* (all personnel costs plus net cost from transfers).
The top chart reveals that the ten largest spending clubs incurred personnel costs (salaries, social security and pension payments) of €1,835m, equivalent to 99% more than the next ten largest spending clubs. Once net transfer costs of €361m are added, the combined amount of €2,196m is 96% more than clubs 11–20 which, in turn, incurred 37% more costs than clubs 21–30.
These top ten personnel costs were equivalent to 22% of the total European top division (734 clubs) personnel costs and this proportion increases to 24% when net transfer costs are added.
The bottom chart presents the year on year growth from FY2009 to FY2010 for clubs in the same ranking group * and clearly demonstrates that the gap between the largest and the large increased in absolute terms, with the combined spending increase of the top ten clubs of €343m almost double the €177m increase of the clubs ranked 11–20 which, in turn, was more than double the €85m increase in combined employee spending of clubs 21–30. While the spending gap is increasing in € terms, the relative spending between clubs 1–10 and 11–20 has remained consistent, from 95% in FY2008 to 97% in FY2009 and 96% in FY2010.
There is some further evidence that certain clubs managed to limit salary inflation from FY2009 to FY2010, with clubs ranked 21–50 reporting significantly increased net transfer costs but an increase in personnel costs of just €7m (less than 0.4%). Indeed, the €303m uplift in personnel costs from the top 20 spending clubs represents a significant proportion of the overall €380m increase in Europe-wide top division personnel costs.
Although profits on transfers can lead to year on year fluctuation in the combined employee cost, there was considerable consistency in this club ranking order, with nine of the clubs from the previous year’s top ten biggest spending clubs and 24 of the top 30** biggest spending clubs reappearing.
Footnotes: * To get a complete sample of all the top clubs, we have used all personnel costs rather than just player costs since player costs are not available for many clubs, as already mentioned in this report. The year on year growth figures in the bottom chart are based on the ranking order of clubs by combined personnel spending, regardless of the composition of clubs in each grouping (clubs 1–10, 11–20, 21–30 etc.), which varied from year to year.
** When ranked and measured by only net transfer costs, only 4 of the top 10 and 15 of the top 30 clubs from FY2009 appear in the FY2010 top 30 list, underlining the fluctuation from year to year in transfer activity. When ranked and measured by only personnel costs without transfers, 9 of the top 10 and 26 of the top 30 spending clubs were consistent between FY2009 and FY2010.
Net transfer cost
Total personnel costs
Clu
bs
1-10
Clu
bs
11-2
0
Clu
bs
21-3
0
Clu
bs
31-4
0
Clu
bs
41-5
0
Clu
bs
51-6
0
Clu
bs
61-7
0
Clu
bs
71-8
0
Clu
bs
81-9
0
Clu
bs
91-1
00
Clu
bs
101-
110
Clu
bs
111-
120
Clu
bs
121-
130
Clu
bs
131-
140
Clu
bs
141-
150
-2000
200400600800
1,0001,2001,4001,6001,8002,0002,200
1,83
5
921
632
529
466
468
370
342
292
244
209
201
181
119 121
361
201
185113 97
6 38 15 17 27 18
-7 -23
18
-1
Combined employee costs (€m) for clubs grouped and ranked by costs
Net transfer cost change FY2009-2010
Total personnel cost change FY2009-2010
Change in combined personnel costs FY2009-2010
Clu
bs
1-10
Clu
bs
11-2
0
Clu
bs
21-3
0
Clu
bs
31-4
0
Clu
bs
41-5
0
Clu
bs
51-6
0
Clu
bs
61-7
0
Clu
bs
71-8
0
Clu
bs
81-9
0
Clu
bs
91-1
00
Clu
bs
101-
110
Clu
bs
111-
120
Clu
bs
121-
130
Clu
bs
131-
140
Clu
bs
141-
150
-50
0
50
100
150
200
250
300
350
237
66
-912 4
63 646
-35
31 6 952
-32-40 -6
106
111
94
2852
7
-29
1650
3 21 1045
21
Year on year change (€m) for clubs grouped and ranked by costs Answer: 27
Player spending is polarised with the ten clubs at the top of the market spending roughly double on players than the next ten largest clubs. The gap in spending between 1–10 and 11–20 increased by a further €166m in FY2010. The top 20 spending clubs incurred 34% of the total FY2010 European personnel costs and a full 80% of the Europe-wide year on year personnel cost spending increase.
HIGHLIGHTS INDEX

BENCHMARKING REPORT FY10FINANCIAL PROFILE OF EUROPEAN CLUB FOOTBALL: COSTS & PROFITABILITY
72
28. What operating profits are clubs generating?Q:Q
As explained in previous versions of the report, the most relevant profit measures for analysing football club performance are “operating profit before player trading*” (“football operating profit”) and “net profit” or “profit before tax”. In the next Q&A we analyse net profits and net profit margins, but first we look at “operating profits”, which exclude transfer activity (depreciation and profit/loss on sale), divesting gains and losses, financing incomes and costs, non-operating items and tax gains and losses. They indicate the profits made by the clubs’ core football activities for transfer activity and financing.
The column charts show country by country football operating profits and losses.
For the third successive year, Belgium, England, Spain, Germany and Kazakhstan reported aggregate operating profits. A look at the result by number of clubs in the bottom column chart shows that most countries have a similar profile of clubs, with three or four making significant operating losses (dark red) and a number reporting operating profits (green).
EN
GG
ER
ES
PIT
AFR
AR
US
TU
RN
ED
SC
OP
OR
UK
RB
EL
SU
IA
UT
DE
NG
RE
NO
RS
WE
PO
LIS
RR
OU
KA
ZC
ZE
CY
PB
LRC
RO
HU
NS
RB
SV
NFI
NB
UL
LIE
IRL
MD
AA
ZE
NIR ISL
LVA
LTU
BIH
LUX
MN
EFR
OG
EO
MK
DW
AL
ES
TM
LTA
RM
AN
DA
LBS
MR
ME
DIA
NA
GG
**
0%
-10%
-20%
-30%
10%
20%
30%
>+20% 10% to 20% 0% to 10% 0% to -10% -10% to -20% < -20%
EN
GG
ER
ES
PIT
AFR
AR
US
TU
RN
ED
SC
OP
OR
UK
RB
EL
SU
IA
UT
DE
NG
RE
NO
RS
WE
PO
LIS
RR
OU
KA
ZC
ZE
CY
PB
LRC
RO
HU
NS
RB
SV
NFI
NB
UL
LIE
IRL
MD
AA
ZE
NIR ISL
LVA
LTU
BIH
LUX
MN
EFR
OG
EO
MK
DW
AL
ES
TM
LTA
RM
AN
DA
LBS
MR
0
8
4
12
16
20
Footnote: * References to statutory operating profit or losses are, nonetheless, often made and can be extremely misleading since this measure effectively presents only half the picture, including the cost of transfers (depreciation and impairment) but not the profits from the sale of players. As an indication of how statutory operating profit can paint a doomsday scenario, the combined net statutory losses in FY2010 were just over €2.6bn, including €2.3bn of net costs arising from transfers but excluding €1.4bn of net profits from transfers. Therefore, in all charts and analyses, references to operating profit refer to football operating profits and profit margins.
HIGHLIGHTS INDEX

73 BENCHMARKING REPORT FY10 - FINANCIAL PROFILE OF EUROPEAN CLUB FOOTBALL: COSTS & PROFITABILITY
The pie chart indicates that 220 clubs (202 in FY2009) in the sample reported operating losses equivalent to more than 20% of total revenue and a further 61 (62 in FY2009) clubs reported large operating losses of between 10% and 20% of revenue. In absolute terms, football operating results ranged from +€99m to -€69m. Again, in absolute terms the 20 largest operating profits were reported by clubs from the following: England (7), Germany, Italy and Spain (3 each), Russia (2) and Denmark and France (1 each), while the 20 largest operating losses were reported by England and Italy (5 each), Turkey (3), Germany (2), and Spain, France, Greece, Russia and Ukraine (1 each). Comparing FY2010 with the previous year shows that operating profits decreased for just over half (51%) of European top division clubs.
To some extent, the level of a club’s operating profits dictates how much transfer activity and financing costs can be absorbed. We say “to some extent”, because the operating profit is for a 12-month period only, while club strategy covers a longer period, and also because a club can sometimes source additional money if club owners or other finance providers commit money. As we have said before, an individual club’s financial performance should not just be measured on their personnel cost ratio or operating profitability, although these are good indicators for underlying performance. The fact that 46 clubs turned an operating loss of 10% or more into a bottom line profit is further evidence of this and of the unique nature and financial significance of the football transfer system.
Answer: 28European top division clubs reported** net football operating losses of €342m in FY2010, having reported net losses of €240m the previous year.
61% of European top divisions clubs reported operating losses in FY2010, the same proportion as in 2009, after the significant increases from 54% in 2008 and 51% in 2007. While a slightly lower proportion, 47%, of “top” clubs (revenue >€50m) reported operating losses, the fact that 20 of the “top” clubs reported operating losses totalling €520m (up from €400m in FY2009) indicates that many of the largest European clubs’ underlying core business did not generate operating profits in 2010 for transfer or financing items.
Footnote: ** Due to inconsistency/incompleteness in reporting of transfer activity, the operating profit analysis excludes Slovakian clubs. The sample in the pie chart and column chart therefore includes 653 clubs from 52 top divisions, while the year on year club trend (arrow chart) covers 553 clubs and excludes promoted clubs for whom previous years’ data was not available. The Europe-wide aggregate estimate of €342m football operating losses reflects both this sample (€283m operating loss) and a total estimated figure generated by modelling each missing league on the basis of profit before tax (PBT) and the clubs missing from data survey.
4953
160
110
61
220
Clubs’ operating profit result as % revenue FY2010
>+20% 10% to 20%
0% to 10% 0% to -10%
-10% to -20% < -20%
Net operating profit margin:FY2009 to FY2010
49% 51%
€342moperating
loss FY2010
€240moperating
loss FY2009
HIGHLIGHTS INDEX

BENCHMARKING REPORT FY10FINANCIAL PROFILE OF EUROPEAN CLUB FOOTBALL: COSTS & PROFITABILITY
74
29. How do financing, divesting, non-operating items and tax impact on profits across Europe?Q:Q
The column charts show the net impact of financing, divesting, non-operating and tax activities on reported results for the year, firstly in aggregate by country and secondly within thresholds by club by country. The pie chart provides the Europe-wide* picture by club grouped between thresholds, for financing/divesting/non-operating/tax items as a percentage of revenue. For all these analyses, net finance costs (interest receivable and payable in respect of cash balances, financial assets and liabilities) have been added to gains or losses from the sale of any non-player assets, tax expenses or incomes and other unusual or irregular non-operating items. While these items are not directly linked to each other, they share the characteristic that they fluctuate significantly from club to club and year to year. While on a Europe-wide basis, after gains and incomes have been netted against losses and costs, only net financing costs can be said to have a major impact on overall profitability, the different items are still worth commenting on because they effect the profitability of many individual clubs.
Across Europe, net gains from disposals of fixed assets remained low at €17m, slightly up from the €7m in FY2009 but much less significant than the €165m reported mainly by three Spanish clubs in FY2008. Net gains from disposal of non-player intangible assets (usually business spin-offs of marketing or commercial activities) increased from €19m in FY2009 to €41m in FY2010, while the net income from non-operating items remained low at €16m, slightly up on €10m in FY2009 but still significant for many clubs as the net figure reflects €69m of non-operating income and €53m of non-operating costs and represented at least 10% of revenue for 28 clubs (often related to write-off of loans and penalty charges). The total value of reported corporation tax charges was €96m, down from €162m in FY2009 and now cancelled out by tax credits, which increased from €106m to €144m in FY2010. However, financing remains the most significant value below the football operating profit line, with reported financial incomes of at least** €232m and financial expenses of €705m.
Answer: 29In total, the net financing, divestment, tax and non-operating items losses of €365m are lower than FY2009 net losses of €470m, due mainly to a reduced net corporation charge of €104m***. As in the previous year, the large English aggregate net loss of 9.7% from these items is largely due to €268m of net finance costs, of which over 60% came from one club with large finance charges connected to an earlier leveraged buy-out****.
While financing, divesting, tax and non-operating activities did not have a major impact at the aggregate European level, they did have a significant impact (more than + or - 5% of income) on 164 or 28% of the individual clubs in the reporting sample. The higher incidence of reds compared to greens in all three FY2010 charts indicates that, typically, the netting of costs/incomes, gains and losses on financing and non-operating items yielded a net cost that had to be absorbed in the clubs’ results.
HIGHLIGHTS INDEX

75 BENCHMARKING REPORT FY10 - FINANCIAL PROFILE OF EUROPEAN CLUB FOOTBALL: COSTS & PROFITABILITY
Footnotes: * The threshold and FY2010 analysis is based on 651 reporting clubs from all national associations apart from San Marino, for whom this data is not available. In all cases, the colour red and a negative figure denotes a net loss, while a positive figure and green represent a net profit from non-operating items. For the year on year trend, the dark red <-5% represents a negative impact in the non-operating cost ratio of >5% and, hence, a negative impact on net profit/loss of <-5% rather than an absolute increase in the non-operating result of 5%.** Reference to “at least” because some clubs report finance incomes netted against finance costs and, hence, gross financial incomes and expenses are in all probability higher than figures quoted. Working against this, however, are the cases where clubs report grossed-up financial transactions as income and cost, often connected to foreign exchange transactions.*** Analysis of year on year corporation tax charges and credits indicates the reduction is due mainly to the mix of Italian and English clubs reporting profits and higher losses.**** For some clubs, the level of finance costs and balance sheet liabilities varies considerably depending on where the consolidation perimeter is drawn and whether, specifically, debt held at parent or holding company level is included within the consolidation scope or not. Regardless of this, we anticipate a reduction in the English FY2011 finance charges due to ownership changes and the non-recurring nature of a €80m charge from realised and unrealised foreign exchange losses that hit FY2010 figures.
EN
GG
ER
ES
PIT
AFR
AR
US
TU
RN
ED
SC
OP
OR
UK
RB
EL
SU
IA
UT
DE
NG
RE
NO
RS
WE
PO
LIS
RR
OU
KA
ZC
ZE
CY
PB
LRS
VK
CR
OH
UN
SR
BS
VN
FIN
BU
LLI
EIR
LM
DA
AZ
EN
IR ISL
LVA
LTU
BIH
LUX
MN
EFR
OG
EO
MK
DW
AL
ES
TM
LTA
RM
AN
DA
LBM
ED
IAN
AG
G*
0%
-5%
-10%
-15%
5%
10%
15%
-5%+ -1% to -5% +/-1% 1% to 5% 5%+
EN
GG
ER
ES
PIT
AFR
AR
US
TU
RN
ED
SC
OP
OR
UK
RB
EL
SU
IA
UT
DE
NG
RE
NO
RS
WE
PO
LIS
RR
OU
KA
ZC
ZE
CY
PB
LRS
VK
CR
OH
UN
SR
BS
VN
FIN
BU
LLI
EIR
LM
DA
AZ
EN
IR ISL
LVA
LTU
BIH
LUX
MN
EFR
OG
EO
MK
DW
AL
ES
TM
LTA
RM
AN
DA
LB
0
8
4
12
16
20
-5%+
-1% to -5%
+/-1%
1% to 5%
5%+
58106
167
279
40
€365mnon operating
net cost FY2010
€470mnon operating
net cost FY2009
HIGHLIGHTS INDEX

BENCHMARKING REPORT FY10FINANCIAL PROFILE OF EUROPEAN CLUB FOOTBALL: COST & PROFITABILITY
76
30. What proportion of clubs are loss making?Q:Q
The bottom line net loss figures
The charts on this page show the aggregate ‘bottom line’ FY2010 losses and profits of the 53 top divisions across Europe and reported results for 665 top division clubs split into thresholds by league. To our knowledge, this is the largest sample of football club accounts ever reviewed to date. While football operating profits give an indication of the underlying contribution from core football activities, the net
profit/loss gives the underlying performance of the club after including transfer activity, financing and divesting results, non-operating items and tax. In other words, what is often referred to as the bottom line. On the face of it, the analysis of clubs’ ‘bottom line’ results should lead us to be able to draw fairly straightforward conclusions about the performance of club football in the year, which we do over
EN
GG
ER
ES
PIT
AFR
AR
US
TU
RN
ED
SC
OP
OR
UK
RB
EL
SU
IA
UT
DE
NG
RE
NO
RS
WE
PO
LIS
RR
OU
KA
ZC
ZE
CY
PB
LRS
VK
CR
OH
UN
SR
BS
VN
FIN
BU
LLI
EIR
LM
DA
AZ
EN
IR ISL
LVA
LTU
BIH
LUX
MN
EFR
OG
EO
MK
DW
AL
ES
TM
LTA
RM
AN
DA
LBS
MR
ME
DIA
NA
GG
*
0%
-10%
-20%
-30%
10%
20%
30%
>+20% 10% to 20% 0% to 10% 0% to -10% -10% to -20% < -20%
0
8
4
12
16
20
EN
G
GE
R
ES
P
ITA
FRA
RU
S
TU
R
NE
D
SC
O
PO
R
UK
R
BE
L
SU
I
AU
T
DE
N
GR
E
NO
R
SW
E
PO
L
ISR
RO
U
KA
Z
CZ
E
CY
P
BLR
SV
K
CR
O
HU
N
SR
B
SV
N
FIN
BU
L
LIE
IRL
MD
A
AZ
E
NIR ISL
LVA
LTU
BIH
LUX
MN
E
FRO
GE
O
MK
D
WA
L
ES
T
MLT
AR
M
AN
D
ALB
SM
R
the next two pages. However, as we often say the “devil is in the detail”, and we conclude this section on costs and profitability by stripping out the effect of transfer activity on this year’s ‘bottom line’, consider what this means for football club financial performance in this year FY2010 and profitability going forwards.
The overall financial performance is revealed when we look at the country by country aggregate result and see the proliferation of red columns, representing countries whose clubs on aggregate have spent €11+ for every €10 of revenue. Whereas in FY2008, 15 of the largest 30 divisions reported breakeven or profits, the reported financial results for FY2010 and FY2009 indicated that only 4 of the 30 divisions achieved breakeven, with only Belgium breaking even in both these years. The proliferation of red and dark red (more than €12 costs for every €10 revenue) underlines that many clubs contributed to the record €1,641m* of net losses reported by top division clubs in FY2010. This level of net losses represents a 36% increase on FY2009 and 153% increase on FY2008.
Once again, the fact that greens can be seen in the bottom chart indicate that although the bottom line performance of European clubs as a whole again deteriorated significantly, there were clubs in every one of the 53 leagues that reported breakeven or a net profit. These 289 clubs reported €395m of net profits in the year.
Footnotes: * The €1,641m aggregate losses and 12.8% loss margin (to revenue) are calculated from the €1,617m of net losses reported by 665 clubs that represent 98% of revenue/costs plus modelled results of the missing clubs.** The €1,206m loss figure for FY2009 compares with €1,179m included in last year’s report. The positive exchange rate difference of €16m when restating to like for like FY2010 exchange rates is outweighed by €43m of post-year-end restatements to FY2009 results. The net profit sample covers 665 clubs from all 53 national associations.
€1,641mNET loss FY2010
€1,206m**NET loss FY2009
HIGHLIGHTS INDEX

77 BENCHMARKING REPORT FY10 - FINANCIAL PROFILE OF EUROPEAN CLUB FOOTBALL: COST & PROFITABILITY
The pie chart covering all clubs indicates that 195 clubs (29%) in the sample reported net losses equivalent to more than 20% of total revenue, a further 53 clubs (8%) reported large net losses of between 10% and 20% of revenue, and a further 124 clubs (19%) reported net losses of between 0 and 10%***. In absolute terms, net results ranged from +€75m to -€150m and the 20 largest net profits were reported by clubs from the following: Spain (5), England (3), Italy (2), Belgium, Denmark, Germany, Hungary, Israel, Netherlands, Romania, Russia, Scotland and Turkey (1 each), while the 20 largest net losses were reported by England (7), Spain, Italy, Russia and Turkey (2 each), France, Germany, Greece, Portugal and Ukraine (1 each). The 20 most profitable clubs reported €297m profits after tax in FY2010, comparable with the €293m in FY2009. At the other end of the scale, 20 clubs reported net losses of €1,085m in FY2010, up considerably on the already massive €875m losses reported in FY2009.
The arrows indicating the evolution between FY2009 and FY2010 in reported club net profit/loss demonstrate that clubs were split evenly between an improving and a deteriorating profit or loss result. If we look at the 80 clubs that qualified for the group stages of the 2011/12 UEFA Champions League and UEFA Europa League, the development between FY2009 and FY2010 is actually slightly worse, with 56% of clubs reporting deteriorating net profits/losses.
The second pie chart shows the profile of the net profit/loss margin for the 32 clubs that qualified for the UEFA Champions League group stage and the 48 clubs that qualified for the UEFA Europa League group stage. It indicates that 29 clubs (36%) competing at the highest European level in UEFA club competitions reported net losses equivalent to more than 20% of total revenue, a further 7 clubs (9%) reported large net losses of between 10% and 20% of revenue, and a further 16 clubs (20%) reported net losses of between 0 and 10%. A comparison between the pie charts shows that an even smaller proportion of clubs (35%) competing in the 2011/12 UEFA Champions League and UEFA Europa League group stages reported breakeven or better in FY2010.
Footnote: *** In a limited number of cases (17 clubs in FY2010), the reported net result was exactly breakeven, suggesting either that the club was not breakeven but that the owner effectively contributed to cover losses or that the club was actually profitable but is a not-for-profit organisation and, hence, cannot report profits.
5746
190
124
53
195
Clubs’ NET profit result as % revenue FY2010 all clubs
55
18
167
29
Clubs’ NET profit result as % revenue FY2010 the 80 UEFA group stage clubs
Net profits/losses FY2009 to FY2010 all clubs
50% 50%
Net profits/losses FY2009 to FY2010 80 UEFA group clubs
44% 56%
>+20% 10% to 20% 0% to 10%
0% to -10% -10% to -20% < -20%
HIGHLIGHTS INDEX

BENCHMARKING REPORT FY10FINANCIAL PROFILE OF EUROPEAN CLUB FOOTBALL: COSTS & PROFITABILITY
78
The transfer impact on these bottom line net loss figures
To fully understand this year’s net loss figure and its implications, it is important to understand some accounting and how transfer activity impacts on clubs’ reported profits and losses. The figures in the right-hand box split out the European aggregate losses into the net losses excluding transfer activity and the net costs of transfer activity, and illustrate that the worsening bottom line net losses have been driven exclusively by the transfer result, which has worsened from a net cost of €474m in FY2009 to €933m in FY2010. Since the impact of transfer activity on a club’s financial performance and position is so large, we have
dedicated a specific section (section 7) this year to transfer activity and trends, where we explain the basis for player accounting and the impact on financial results.
In simplified terms, most clubs spread the cost of their paid transfer fees over the length of the player contract and recognise profits or losses when a player is transferred on for a fee. The net cost from transfer activity is the net impact on the profit and loss account each year and is calculated by adding the depreciation (€2,330****m) and impairment charges (€59m) arising on current players
Answer: 30Europe-wide, the proportion of top division clubs reporting net losses remained at 56%, with clubs split evenly between better and worse on the year-to-year trend and with total losses after tax increasing from €1,206m to €1,641m. It is notable that 75% of the “top” clubs reported losses in FY2010, with the trend worse for 63% of these clubs.
It must also be noted, however, that the driver of increased losses in FY2010 was more complicated than the salary inflation that had largely driven increased losses in recent years. In FY2010, the increased losses have largely arisen from increased net transfer costs that counterintuitively reflect a slowdown in transfer activity during FY2010 as clubs were able to realise less transfer incomes/profits on sale in a slow transfer year but still incurred the same level of transfer costs from the busier previous years (see transfer section).
Despite this potentially temporary trend, still of great concern were the underlying losses before transfers and, in particular, the 29% of clubs that reported spending €6 for every €5 revenue in FY2010. Again, the financial pain was spread across all sizes of club, with 32% (22% in FY2009) of the “top”, 32% (26%) of the “large” and 30% (32%) of smaller clubs reporting these massive losses.
€2,330mamortisationcost FY2010
€1,456m net profit player sales FY2010
€2,218mamortisationcost FY2009
€1,810m netprofit playersales FY2009
€59mimpairmentcost FY2010
€933m net lossfrom transfers
FY2010
€66mimpairmentcost FY2009
€474m net lossfrom transfers
FY2009
+
+
-
-
=
=
previously purchased (e.g. FY2006–10) to the profits on sales of players during FY2010 (€1,456****m), which nets to a €933m net cost in FY2010. We analyse this in detail in section 7, but we have been able to conclude that a major driver of increased net transfer losses, worth an estimated €218m, came from the reduced volume of transfer activity***** in FY2010 compared with FY2009. The second driver of the increased net transfer losses was a lower yield on those €2,125m of players sold, with average reported profit per transfer value dropping from 71% in FY2009 to 65% in FY2010 and reducing profits from player sales by an estimated €136m. The third driver of increased net transfer losses was the increased amortisation of €112m in FY2010 compared with FY2009, although it’s unclear whether this is due to shorter contracts and faster amortisation or due to variations in transfer activity levels during previous years.
€708m lossbefore ******
transfer FY2010
€732m loss before ******
transfer FY2009
+ +€933m loss
from transfer FY2010
€1,641m NET lossFY2010
€474m loss from transfer
FY2009
€1,206m NET loss FY2009
HIGHLIGHTS INDEX

79 BENCHMARKING REPORT FY10 - FINANCIAL PROFILE OF EUROPEAN CLUB FOOTBALL: COSTS & PROFITABILITY
Footnotes: **** As indicated in section 7, many clubs account for both transfers out and in during the year of transfer. These clubs, which represent about 5% of transfer fees, reported net income of €110m and net costs of €120m in FY2010, which have been added to the figures for profit on the sale of players and depreciation respectively in the main text.
***** Roll-forward player asset notes in the financial statements reveal the gross value of transfers during the financial year for those clubs capitalising their players. With the €110m income added by clubs that directly take transfer activity to profits, the total value of transfers in FY2010 was €2,125m compared with €2,434m in FY2009. A review of all transfer activity in FY2009 calculates that clubs made an average profit of 71% on gross sales, suggesting a €218m impact on net losses.
****** The loss before transfer and from transfer has not been adjusted for potential tax effects of restated and extracted profits.
HIGHLIGHTS INDEX

BENCHMARKING REPORT FY10FINANCIAL PROFILE OF EUROPEAN CLUB FOOTBALL: ASSETS, DEBTS & CASH FLOWS
80
6Financial profile of European club football: assets, debts & cash flows
What do we mean by debt and how do we assess it?
What are the legal and ownership structures of clubs and what do they own?
What value of assets and liabilities have clubs reported?
What level of transfer debts were owed by clubs?
Who are the auditors and what did they say about the clubs’ financial prospects?
How many clubs reported negative equity?
The bottom line – did club balance sheets strengthen or weaken during FY2010?
HIGHLIGHTS INDEX

81 BENCHMARKING REPORT FY10 - FINANCIAL PROFILE OF EUROPEAN CLUB FOOTBALL: ASSETS, DEBTS & CASH FLOWSHIGHLIGHTS INDEX

BENCHMARKING REPORT FY10FINANCIAL PROFILE OF EUROPEAN CLUB FOOTBALL: ASSETS, DEBTS & CASH FLOWS
82
31. What do we mean by debt and how do we assess it?Q:Q
The discussion of debt in football clubs has never been as prominent as it has been in the last three years. For people with a non-financial background, it can be very difficult to decipher what the wider situation actually is and what the main debt-related issues are for football and individual football clubs. Below we try to differentiate between the different phrases used and the different meanings of debt, then highlight some of the key considerations when analysing debt before setting out a more concrete picture of European football clubs’ finances through analysing their balance sheets.
In practice, the term “football club debts” has been used in many different ways with a great deal of flexibility, references ranging from the very broad, totalling all liabilities that a club has, to the narrow definition of debt financing either including or excluding interest-free owner loans. For our purposes, we use the following definitions:
Debt – “Amounts owed to people or organisations for funds borrowed.” Within this definition we include interest-free owner or related party loans, sometimes called soft loans, although on occasions these are written off and
Answer: 31To understand the debt profile of a club requires both context (in many cases there is a matching asset) and a deep understanding of the figures. This is why a typical set of financial statements includes many times more detailed notes explaining the financial position (balance sheet) as it does explanations about the financial performance (profit and loss account).
While most football clubs’ activities are relatively simple and similar to each other, the financing model they use can differ significantly, as can their liabilities, the negative part of the balance sheet which covers all debts, claims, payments received but not yet earned and potential losses, as well as financial obligations that are perhaps more obviously considered as debts.
converted to equity*. Top division club debt is estimated to total €8.4bn (€8.2bn for FY2009).
Net debt - takes the debt figure and removes any cash balances or liquid assets. Top division net debt is estimated to total €6.9bn (€6.7bn for FY2009).
Liabilities – “All financial obligations, debts, claims, and potential losses.”** Company balance sheets include assets on one side and liabilities on the other side, with the difference equalling net equity (positive net equity if recorded assets exceed recorded liabilities and negative net equity if assets are less than liabilities). Liabilities include: payables, i.e. amounts outstanding on bills for products and services received (e.g. invoices for rent); accrued expenses, the same as payables but where no bill has yet been received (e.g. wages earned by staff to be paid at end of month); provisions, i.e. estimate of probable losses arising from previous actions (e.g. ongoing legal case against the club); deferred income, i.e. payments received for work not yet done (e.g. season ticket revenue for future matches). Top division total liabilities are estimated at €19.1bn (€19.0bn for FY2009). Liabilities are referred to as short or long-term, with short-term being within 12 months from the financial year-end.
Going Concern – “The ability and intention of a company to continue trading for at least 12 months.” Of 589 reviewed year-end club audit reports, 69 (12%) had an emphasis of matter or “qualified” audit opinion regarding going concern in FY2010, a slight improvement on the 14% in FY2009).
To assess the significance of a club’s liabilities, it is essential to consider not only the amount of liabilities but also many other aspects (see the non-exhaustive list of examples below), some general and some football-specific, which is why the explanatory notes and commentary to a good set of financial statements include a lot of detail:
Type of liability/debt: Clearly, season ticket money received in advance is not in itself a bad thing and yet is it recorded as a liability as the accountants consider the cash received as not yet being fully earned until the matches take place. This is a liability but not a debt that will have to be paid back.
The (secured) assets of a club: A financial loan on its own can often be linked to an asset or set of assets, so considering debt without considering the assets is not particularly meaningful. Generally, for the lender a debt secured against assets is less risky, leading to better interest rate terms for the club. The clubs with the most assets are more likely to be able to attract finance from debt providers.
Maturity of debt: As a general rule, long-term debts should be matched to long-term assets and vice versa with short-term items. The full picture of the timing of debt repayment and payments due on other liabilities, together with the financial resources available for the clubs, is needed to assess the risk of debt default or overdue liabilities. This is why club licensing requires the submission of budgets.
Footnotes: * Debt and net debt would usually include all interest-bearing borrowings, including hire purchase or finance lease balances; however, in this report we exclude these items due to lack of availability of data since the full notes to financial statements are needed to extract this data.
** IFRS (International Financial Reporting Standards) definition is: “A liability is a present obligation of the entity arising from past events, the settlement of which is expected to result in an outflow from the entity of resources embodying economic benefits.”
*** Source: Kop Football (Holdings) Limited financial statements 2007
HIGHLIGHTS INDEX

83 BENCHMARKING REPORT FY10 - FINANCIAL PROFILE OF EUROPEAN CLUB FOOTBALL: ASSETS, DEBTS & CASH FLOWS
Differing accounting treatments: Under club licensing, clubs’ financial statements have to be prepared on the basis of the same accounting principles. Nonetheless, specific treatments or accounting interpretations can differ. For example, some clubs record significant deferred tax assets in their balance sheet to reflect the theoretical future benefit from previous losses (can be set off against future profits to be tax free), while other accounting jurisdictions only allow these assets if it can be proved that future profits are likely. Treatments of agent fees, transfer fees, signing-on bonuses, long-term commercial agreements and more complicated financial arrangements such as securitisations can also lead to differences, although most of the “top” clubs report under similar accounting frameworks.
Unrecognised assets and liabilities: The net equity/net assets should not be confused with the value of a club. Part of the reason for this is that, as a general rule, accountants do not allow assets to be included unless their value can be accurately estimated. Some of the principal assets of a club, such as a loyal supporter base, reputation/brand, membership/access rights to lucrative competitions, and home-grown players, are not included within balance sheet assets since they are extremely difficult to value, despite them unquestionably having a value. These unvalued assets tend to be greater for larger clubs. As an example,*** when Liverpool FC was purchased in 2007, the balance sheet net equity of €53m was estimated to have a fair value of €197m and, in addition, the new owners were prepared to pay an extra €73m (goodwill).
HIGHLIGHTS INDEX

BENCHMARKING REPORT FY10FINANCIAL PROFILE OF EUROPEAN CLUB FOOTBALL: ASSETS, DEBTS & CASH FLOWS
84
32. What are the legal and ownership structures of clubs and what do they own?Q:Q
The pie chart groups the European top division clubs* into broad categories of legal form. As with previous reviews, just under half of clubs (49%) take the form of associations, not-for-profit, or state funded entities. If we take just the 80 clubs in the group stages of this year’s UEFA club competitions, this percentage drops significantly to 25%.
Not-for-profit
Club legal form FY2010All clubs
Association
State-funded entity
Stock exchange listed
Sporting incorporated entity
Other company-based entity
9%
35%
5%14%
3%
34%
Single 100% owner
Club ownership structure FY2010All clubs
One or more owners with ultimate control
One or more significant investors
All smaller investors (<5%)
No ownership-members only
17%
30%3%
15%
35%
Owned
Stadium ownershipAll clubs
Other party
Part-ownership stadium operating company
Owned by local municipality
Owned by regional or state authority
17%
15%
2%
55%
11%
Owned
Training facilities ownershipAll clubs
Other party
Part-ownership of facilities
Owned by local municipality
Owned by regional or state authorities
26%
16%
9%
45%
4%
The second pie chart (below) groups the European top division clubs* into broad categories of ownership profile. Surprisingly few clubs (17%) are reported to be fully owned by a single individual, but this rises to just under half (47%) which are under the control of one or more owners. A further (15%) have one or more investors who are “significant” but without ultimate control. If we take just the 80 clubs in the group stages of this year’s UEFA club competitions, a significant majority (66%) of clubs are under the control of one or more owners.
The third pie chart (below) indicates the status of stadium ownership and shows that a majority (55%) of stadiums are owned by local municipalities, with clubs only owning or part owning their stadium in 19% of cases**. This increases to 34% if just the 80 group qualifiers are considered. The slight changes from FY2009 are primarily due to the mix of clubs (relegated/promoted)***.
The final pie chart (below) indicates the status of ownership of principal training facilities and shows that a majority (54%) are either owned by local municipalities or regional or state authorities. Direct club ownership of training facilities (26%) is slightly more common than stadium ownership and, again, increases noticeably (50%) if just the 80 group qualifiers are considered.
Footnotes: * The football club in this context is the reporting entity or group determined for club licensing purposes for 663 clubs. ** Due to anticipated changes in the consolidation perimeter of German clubs, the proportion of clubs (reporting entities) owning their stadium is expected to increase slightly next year. *** Compared with the country by country map in last year’s report, the following have increased: Croatia 0 to 1 due to club restructuring; Germany 1 to 2 due to promotion; Portugal 3-4 to 5+ due to mix of reporting clubs; Sweden 1 to 2 due to promotion; Ukraine 1 to 3-4 due to mix of reporting clubs and new ownership prior to EURO 2012.
HIGHLIGHTS INDEX

85 BENCHMARKING REPORT FY10 - FINANCIAL PROFILE OF EUROPEAN CLUB FOOTBALL: ASSETS, DEBTS & CASH FLOWS
33. What type of assets and liabilities have clubs reported?Q:Q
The pie charts on this page broadly group the reported* assets and liabilities of European top division football clubs. This grouping is possible because UEFA club licensing requires certain minimum disclosures, particularly concerning players, on both transfer amounts payable and receivable and capitalised player values. Within the licensing framework, these items are verified against detailed player by player tables for every club.
Fixed assets
Assets by type FY2010
Player assets
Other long-term assets
Cash
Transfer receivables
Other short-term assets
Assets: estimate clubs not in sample
Total reported assets
€5.9bn
€5.2bn
€3.2bn
€1.5bn
€1.5bn
€3.3bn
€0.4bn
€21.0bn
29%
25%
7%
15%
8%
16%
Bank and commercial loans
Liabilities by type FY2010
Group & related parties
Other long-term liabilites
Taxes and social charges
€5.5bn
€2.9bn
€2.3bn
€1.2bn
Transfer payables
Employee payables
Other short-term liabilites
Liabilites: estimate clubs not in sample
Total reported liabilites
€2.3bn
€0.6bn
€3.9bn
€0.4bn
€19.1bn
29%
16%6%13%
12%
21%
3%
Answer: 33Top division clubs reported just under €21.0bn* of balance sheet assets in FY2010 (an increase of €500m) and €19.1bn of liabilities (an increase of €150m) netting to positive net equity/net assets of €1.9bn (an increase of €350m).
The type of assets and liabilities reported by clubs differ considerably between countries. 70% of assets and 45% of liabilities were reported as long term (>12 months).
The largest asset category was fixed assets with over €5.9bn, most of which was owned stadium and training facilities. This probably understates the total level of infrastructure as an unknown share of the €3.5bn+ of “other long term assets” are part investments in the company owning the facilities, and many older stadium facilities have been depreciated to zero or near zero value in the balance sheet.Since only 17% of clubs directly own their stadium outright, it is not surprising that fixed assets are highly concentrated, with 20 clubs reporting €3.8bn of fixed assets. These clubs also reported €2.8bn of gross bank debt, illustrating the clear link between long term assets and debt levels further highlighted later.
Footnote: *Balance sheet profile taken from 665 reporting clubs from all countries. Reported assets of €20,553m compare to simulated Europe-wide top division assets of €20,957m, and reported liabilities of €18,655m compares to simulated Europe-wide top division liabilities of €19,068m. We anticipate the gross liabilities and assets (in particular bank loans and fixed assets) will increase next year as a result of changes to the consolidation perimeter of some German clubs.** The reported transfer payables and receivable figures have been adjusted and reallocated from non split “other long and short-term” items to reflect those clubs that do not disclose balances (see transfer section for more explanation).*** We suspect that amounts payable to employees are understated due to incomplete disclosure of some clubs – we anticipate a more accurate figure will be included in next year’s report.
Net bank and third party commercial debt totalled just over €4.0bn (bank loans €5.5bn less cash balances €1.5bn), a slight reduction compared to the previous year. Twenty clubs alone reported net bank and third-party commercial debt of €2.9bn. Likewise, group and related party debt is highly concentrated, with €2.1bn held by just ten clubs.
Outstanding amounts payable on transfers totalled just under €2.3bn**. These are analysed in more detail on the next pages.
Tax and social charge liabilities totalled €1.2bn. These are analysed in more detail on the next pages.
For the first time, we requested disclosure of amounts due to employees, which totalled just over €600m***.
HIGHLIGHTS INDEX
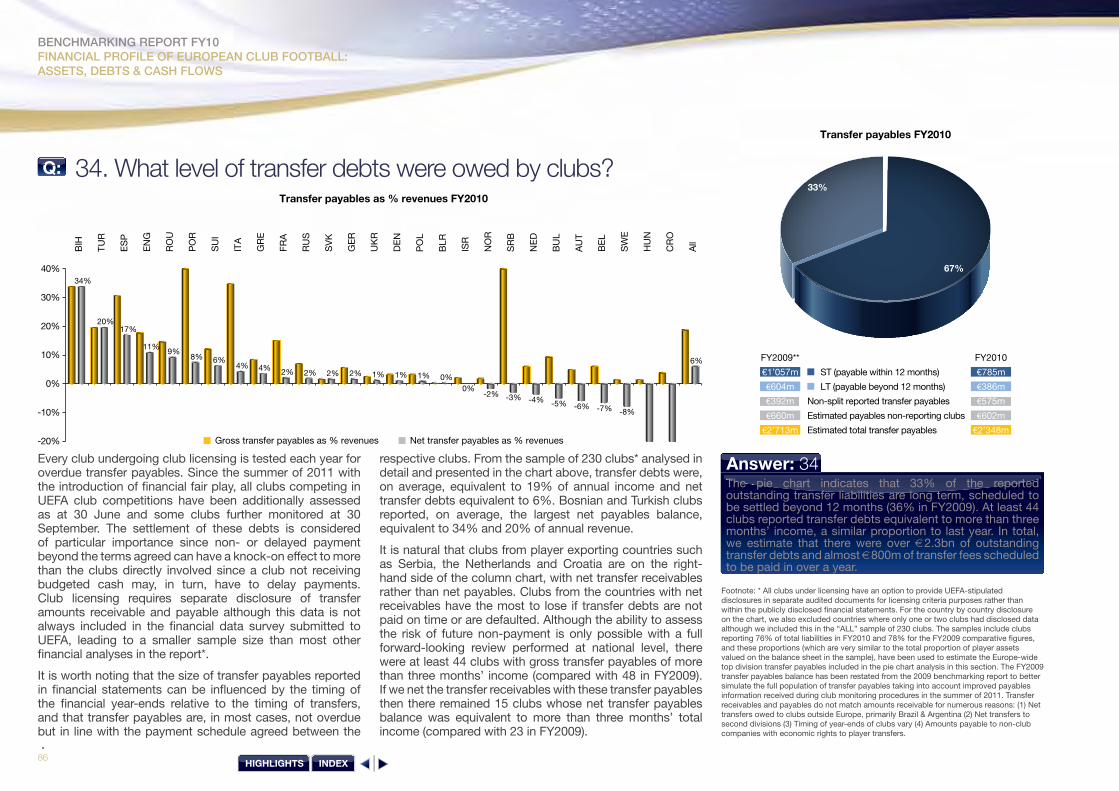
BENCHMARKING REPORT FY10FINANCIAL PROFILE OF EUROPEAN CLUB FOOTBALL: ASSETS, DEBTS & CASH FLOWS
86
34. What level of transfer debts were owed by clubs?Q:Q
Every club undergoing club licensing is tested each year for overdue transfer payables. Since the summer of 2011 with the introduction of financial fair play, all clubs competing in UEFA club competitions have been additionally assessed as at 30 June and some clubs further monitored at 30 September. The settlement of these debts is considered of particular importance since non- or delayed payment beyond the terms agreed can have a knock-on effect to more than the clubs directly involved since a club not receiving budgeted cash may, in turn, have to delay payments. Club licensing requires separate disclosure of transfer amounts receivable and payable although this data is not always included in the financial data survey submitted to UEFA, leading to a smaller sample size than most other financial analyses in the report*.
It is worth noting that the size of transfer payables reported in financial statements can be influenced by the timing of the financial year-ends relative to the timing of transfers, and that transfer payables are, in most cases, not overdue but in line with the payment schedule agreed between the
Gross transfer payables as % revenues Net transfer payables as % revenues
Transfer payables as % revenues FY2010
BIH
TU
R
ES
P
EN
G
RO
U
PO
R
SU
I
ITA
GR
E
FRA
RU
S
SV
K
GE
R
UK
R
DE
N
PO
L
BLR
ISR
NO
R
SR
B
NE
D
BU
L
AU
T
BE
L
SW
E
HU
N
CR
O
All
0%
-20%
-10%
40%
30%
20%
10%
34%
20%17%
11%9%
8% 6%4% 4% 2% 2% 2% 2% 1% 1% 1% 0%
0%-2% -3% -4% -5% -6% -7% -8%
6%
Transfer payables FY2010
ST (payable within 12 months)
LT (payable beyond 12 months)
Non-split reported transfer payables
Estimated payables non-reporting clubs
€785m
€386m
€575m
€602m
Estimated total transfer payables €2’348m
€1’057m
€604m
FY2010FY2009**
€392m
€660m
€2’713m
67%
33%
Answer: 34The pie chart indicates that 33% of the reported outstanding transfer liabilities are long term, scheduled to be settled beyond 12 months (36% in FY2009). At least 44 clubs reported transfer debts equivalent to more than three months’ income, a similar proportion to last year. In total, we estimate that there were over €2.3bn of outstanding transfer debts and almost €800m of transfer fees scheduled to be paid in over a year.
respective clubs. From the sample of 230 clubs* analysed in detail and presented in the chart above, transfer debts were, on average, equivalent to 19% of annual income and net transfer debts equivalent to 6%. Bosnian and Turkish clubs reported, on average, the largest net payables balance, equivalent to 34% and 20% of annual revenue.
It is natural that clubs from player exporting countries such as Serbia, the Netherlands and Croatia are on the right-hand side of the column chart, with net transfer receivables rather than net payables. Clubs from the countries with net receivables have the most to lose if transfer debts are not paid on time or are defaulted. Although the ability to assess the risk of future non-payment is only possible with a full forward-looking review performed at national level, there were at least 44 clubs with gross transfer payables of more than three months’ income (compared with 48 in FY2009). If we net the transfer receivables with these transfer payables then there remained 15 clubs whose net transfer payables balance was equivalent to more than three months’ total income (compared with 23 in FY2009).
Footnote: * All clubs under licensing have an option to provide UEFA-stipulated disclosures in separate audited documents for licensing criteria purposes rather than within the publicly disclosed financial statements. For the country by country disclosure on the chart, we also excluded countries where only one or two clubs had disclosed data although we included this in the “ALL” sample of 230 clubs. The samples include clubs reporting 76% of total liabilities in FY2010 and 78% for the FY2009 comparative figures, and these proportions (which are very similar to the total proportion of player assets valued on the balance sheet in the sample), have been used to estimate the Europe-wide top division transfer payables included in the pie chart analysis in this section. The FY2009 transfer payables balance has been restated from the 2009 benchmarking report to better simulate the full population of transfer payables taking into account improved payables information received during club monitoring procedures in the summer of 2011. Transfer receivables and payables do not match amounts receivable for numerous reasons: (1) Net transfers owed to clubs outside Europe, primarily Brazil & Argentina (2) Net transfers to second divisions (3) Timing of year-ends of clubs vary (4) Amounts payable to non-club companies with economic rights to player transfers.
HIGHLIGHTS INDEX

87 BENCHMARKING REPORT FY10 - FINANCIAL PROFILE OF EUROPEAN CLUB FOOTBALL: ASSETS, DEBTS & CASH FLOWS
35. Who are the auditors and what did they say about the clubs’ financial prospects?Q:Q
Every club applying for a UEFA club license is required to provide financial statements with an auditor’s report from an independent auditor. Not only must the auditor be independent in compliance with the International Federation of Accountants (IFAC) code of ethics, but also a member of one of the relevant IFAC member bodies.
When auditing the financial statements, the auditor’s report must include a statement that the audit was conducted in accordance with International Standards on Auditing (ISA) or equivalent national standards meeting the ISA requirements.
This Q&A paints the first Europe-wide profile of club auditors and once again looks at the audit opinions in the FY2010 year-end and Interim FY2011 audit reports to present the picture across Europe from an auditor’s perspective.
Club auditor general profiles
Sole practitioner Single office audit practice National audit company-multiple offices Other international firm ‘Big 4 firm’
ALB
AN
DA
RM
AU
TA
ZE
BE
LB
IHB
LRB
UL
CR
OC
YP
CZ
ED
EN
EN
GE
SP
ES
TFI
NFR
AFR
OG
EO
GE
RG
RE
HU
NIR
LIS
LIS
RIT
AK
AZ
LIE
LTU
LUX
LVA
MD
AM
KD
MLT
MN
EN
ED
NIR
NO
RP
OL
PO
RR
OU
RU
SS
CO
SM
RS
RB
SU
IS
VK
SV
NS
WE
TU
RU
KR
WA
L
0
4
8
12
16
20
Sole practitioner
Auditor profile: All clubs
Single office audit practice
National audit company-multiple offices
Other international firm
‘Big 4 firm’
6%
43%
25%
6%
20%
Answer: 35A diverse range of club auditors are used across Europe – perhaps not surprising, given the massive differences in scale of clubs. Just over a quarter use an international firm and just over half use auditors with multiple offices. The majority of clubs reviewed in Austria, Armenia, Denmark, England, Finland, Italy, Luxembourg, the Netherlands and Sweden used international firms, with half of the clubs in this year’s UEFA club competition group stage doing likewise.
The level of auditors’ reports including an adverse opinion, emphasis of matter or qualified opinion regarding going concern (the ability of a club to continue trading for 12 months) remained at a worryingly high 12% of clubs in FY2010, although this was a slight improvement from 14% in FY2009. If matters other than going concern are factored in, then more than 17% of clubs had a modified audit opinion. While assessing the trend of this is revealing, we should bear in mind when making cross-border comparisons that auditors in certain countries are more risk-averse than others and their audit opinions reflect this, particularly with regards to considering non-legally binding owner/benefactor guarantees of support**.
Footnote: * The figures presented and analysed include a sample of FY 2010 audit reports covering all 53 countries and 599 top division clubs.
** Some clubs with high negative equity can also have a clean audit opinion if the owners have long-term deals with the club. Additionally, there are some countries which may have high negative net equity on average due to a few outlier clubs.
HIGHLIGHTS INDEX

BENCHMARKING REPORT FY10FINANCIAL PROFILE OF EUROPEAN CLUB FOOTBALL: ASSETS, DEBTS & CASH FLOWS
88
36. How many clubs reported negative equity?Q:Q
EN
GG
ER
ES
PIT
AFR
AR
US
TU
RN
ED
SC
OP
OR
UK
RB
EL
SU
IA
UT
DE
NG
RE
NO
RS
WE
PO
LIS
RR
OU
KA
ZC
ZE
CY
PB
LRS
VK
CR
OH
UN
SR
BS
VN
FIN
BU
LLI
EIR
LM
DA
AZ
EN
IRIS
LLV
ALT
UB
IHLU
XM
NE
FRO
GE
OM
KD
WA
LE
ST
MLT
AR
MA
ND
ALB
SM
RM
ED
IAN
AG
GR
EG
AT
E*
0%
-20%
-10%
-40%
-30%
-50%
20%
10%
40%
30%
50%
Net equity per league FY2010 (% assets)
> 50% 20% to 50% 0% to 20% 0% to -20% -20% to -50% < -50%
EN
GG
ER
ES
PIT
AFR
AR
US
TU
RN
ED
SC
OP
OR
UK
RB
EL
SU
IA
UT
DE
NG
RE
NO
RS
WE
PO
LIS
RR
OU
KA
ZC
ZE
CY
PB
LRS
VK
CR
OH
UN
SR
BS
VN
FIN
BU
LLI
EIR
LM
DA
AZ
EN
IR ISL
LVA
LTU
BIH
LUX
MN
EFR
OG
EO
MK
DW
AL
ES
TM
LTA
RM
AN
DA
LBS
MR
0
8
4
16
12
20 Answer: 36The simple answer is that 237 or 36% of clubs reported negative equity (more liabilities than assets) in their balance sheets in FY2010*. This included top division clubs from 47 different countries and also included 20 of the 73 “top” clubs. As illustrated last year, the underlying value of some of these clubs may be higher than the net equity reported due to the conservative and prudent nature of accounting valuations. Nevertheless, weak balance sheets when combined with ongoing losses and/or negative cash flows can be extremely dangerous. Of the 237 clubs reporting negative equity, 169 also reported losses in the year.
As in previous years the aggregate level of equity compared with asset base differs considerably between countries, although the rainbow threshold chart shows that all countries have at least one club with positive equity, and hence it is difficult to generalise.
Net equity as % assets FY2010
> 50%
20% to 50%
0% to 20%
0% to -20%
-20% to -50%
< -50%
137
143
146
43
45
149
Footnote: * Net equity was analysed for 663 clubs from all 53 countries
HIGHLIGHTS INDEX

89 BENCHMARKING REPORT FY10 - FINANCIAL PROFILE OF EUROPEAN CLUB FOOTBALL: ASSETS, DEBTS & CASH FLOWS
37. The bottom line – did club balance sheets strengthen or weaken during FY2010?Q:Q
Net equity position & movement
Pro
fit &
imp
rove
dp
ositi
ve e
qui
ty
Loss
& w
orse
nega
tive
equi
ty
Pro
fit &
imp
rove
dne
gativ
e eq
uity
Pro
fit b
utw
orse
eq
uity
Eq
uity
unc
hang
ed
Loss
but
imp
rove
dp
ositi
ve e
qui
ty
Loss
but
imp
rove
dne
gativ
e eq
uity
Loss
& w
orse
pos
itive
eq
uity
35% 240
30% 200
25% 160
20% 120
15% 80
10%
405%
0% 0
23%
15%
3%1%
4% 3%
31%
17%155
98
19 28 22
204
111
Net equity weakened
Net equity strengthened
Net equity unchanged
52% 53%47%44%
3%
1%
FY2010 FY2009Answer: 37Football clubs, especially clubs in less developed economies, often rely on their owner(s) to keep the club finances balanced. In some cases, this may be through contracted sponsorship, but in many cases this will be in the form of ad hoc capital injections, to cover losses and liquidity shortfalls. The movement in net equity of a club (total assets less liabilities) reflects the financial profit/loss of the year plus any capital distributions or injections.
In total, 50 clubs reported net losses in FY2010 but improved net equity due to either capital injections, write-off of owner loans or revaluations. In total, clubs reported a net non-profit-related equity increase of €1,784m. In fact, despite the massive losses sustained by football clubs in FY2010, the bottom-line aggregate net equity of clubs actually increased by €150m, from €1,739m to €1,889m, reversing a trend that had seen balance sheet net equity diminish by €999m over the previous four years.
Our analysis indicates that despite this positive news at the aggregate level, 52% of clubs still had their balance sheet position deteriorate during FY2010 by an aggregate of €1,510m emphasising the need for regulations that encourage recapitalisation of club balance sheets.
Footnote: *Net equity movement was analysed for 644 clubs from all countries with 19 clubs excluded as first year within data survey (promoted clubs) and no equity roll forward note provided.
HIGHLIGHTS INDEX

BENCHMARKING REPORT FY10FINANCIAL PROFILE OF EUROPEAN CLUB FOOTBALL: TRANSFER REvIEW
90HIGHLIGHTS INDEX
91 BENCHMARKING REPORT FY10 - FINANCIAL PROFILE OF EUROPEAN CLUB FOOTBALL: TRANSFER REvIEW
7Financial profile of European club football: transfer review
How and when do clubs account for player transfers?
How does player accounting translate into profits and losses?
How did transfer activity impact on profits in FY2010?
What are the main trends in transfer spending over the last 16 years?
How does transfer activity in the winter and summer windows compare?
How does transfer spending compare with spending on wages?
What are the profiles (nationality, age, club) of the top 400 transfers?
Which clubs and countries have spent and made the most money from transfer activity?
HIGHLIGHTS INDEX

BENCHMARKING REPORT FY10FINANCIAL PROFILE OF EUROPEAN CLUB FOOTBALL: TRANSFER REvIEW
92
38. How and when do clubs account for player transfers?Q:Q
This year is the first time that we have included a separate section dealing purely with transfer activity. In previous benchmarking reports, we presented the impact of transfer activity on the financial statements of clubs and illustrated their impact on bottom-line profits. We present the same analysis in the next Q&A’s. We follow this by reviewing in more detail transfer activity levels and values by clubs over time.
However, as highlighted in the costs and profitability section, the impact of transfer activity on clubs’ financial statements is relatively complicated and, more often than not, financially significant in size. There are four principal features that make careful analysis necessary, which we cover in the next two Q&A’s:
1) the differences in accounting policy applied by clubs;
2) the relative timing of transfer windows and clubs’ financial periods;
3) the technical difference applied between player purchases* and sales, and;
4) the differences in accounting treatment for home- grown players.
When these features are combined, the impact can be counter-intuitive and, therefore, lead to misunderstandings. The following illustration of the four principal features of transfer activity should help understand how clubs account for player transfers, the impact that this has on the financial statements and, therefore, why observed transfer activity during a transfer window is not usually reflected directly in the financial statements.
Player accounting policy:All clubs
Capitalisation and amortisation
Income and expense
40%
60%
Player accounting policy:the 80 UEFA group stage clubs
Capitalisation and amortisation
Income and expense
9%
91%
1). Differences in accounting policy applied by clubs
The majority of our analysis of transfer activity refers to clubs which capitalise and amortise their transfer purchases, but we can see from the pie chart that 40% of European clubs actually recognise all incomes or expenses in the year of sale or purchase (“income & expense”), a more conservative approach that assigns no value to the holding of player registrations. The map further illustrates the mixed approach taken across Europe**. The second pie chart
highlights that most of the large clubs in Europe (91% of those reaching the group stages of UEFA club competitions in 2011/12) capitalise and amortise their player acquisitions. Indeed, analysis of the detailed notes of clubs’ FY2010 financial statements indicate that while they may only represent 60% of clubs in number, clubs that capitalise and amortise their transfers account for 95% of all transfer fees paid*** by value.
Footnote: * References to player purchases and sales refer to the transfer of player registrations.
HIGHLIGHTS INDEX

93 BENCHMARKING REPORT FY10 - FINANCIAL PROFILE OF EUROPEAN CLUB FOOTBALL: TRANSFER REvIEW
Accounting method for player registrationsin top division (financial year ending 2010)
All Clubs use Capitalisation & Amortisation
15x
Preponderence of Clubs useCapitalisation & Amortisation
10x
Majority of Clubs useCapitalisation & Amortisation
5x
Majority of Clubs useIncome & Expense
6x
Preponderence of Clubs useIncome & Expense
6x
All Clubs useIncome & Expense
11x
Footnotes: ** “Preponderance” in the map key refers to all clubs apart from one or two. “Majority” means more than two exceptions but still more than half of clubs.
*** Gross transfer income reported at €2,539m, of which €110m was transfer sales for clubs that “income and expense” their player acquisitions.
HIGHLIGHTS INDEX
BENCHMARKING REPORT FY10FINANCIAL PROFILE OF EUROPEAN CLUB FOOTBALL: TRANSFER REvIEW
94
2). The timing of transfer windows and clubs’ financial periods
As explained in detail in last year’s report,**** clubs have two distinct registration periods or transfer windows, the first after the sporting season finishes, lasting up to 12 weeks, and the second midway through the season, lasting up to 4 weeks. For the majority of clubs that have a winter sporting season (see Q7), the lesser used winter window takes place in January and the summer window generally runs from mid-June through to the end of August. Clubs with a summer sporting season conversely have their larger transfer window in the winter, with Russian, Swedish and Norwegian clubs being the most significant in relation to the transfer market. We investigate the relative use of these windows later in this section.
The clubs’ financial year-ends are also analysed elsewhere in the report (see Q50) and the charts here illustrate in which financial year the transfer activity from three transfer windows (summer 2009, winter 2010 and summer 2010) is recorded.
For example, the winter 2010 and summer 2010 windows overlap with FY2010 for the vast majority of the 71% of clubs with 30 November or 31 December financial year-ends, while the summer 2009 window transfer activity will be recorded within the FY2009 financial statements.
The overlap between financial years and transfer windows is more complicated for many clubs with 30 June or 31 July year-ends, with the first part of the summer window 2010 and the majority of the summer 2009 window recorded within the FY2010 financial results of some clubs. For FY2010, clubs from Austria, Netherlands and France, as well as many from Belgium, Denmark, England, Scotland and Switzerland, fell into this category, with, in total, 16% of clubs responsible for 25% of transfer income having a transfer window overlapping two financial years. Most analyses of transfer activity deal with transfer activity as measured year by year or window by window. We analyse long-term trends on this basis later in this section, but, for the first time, here we map how transfer activity overlaps with clubs’ financial year-ends across Europe. The green columns represents clubs whose transfer activity in the three different windows was included in the FY2010 financial results, the red where the transfers were either accounted for in FY2009 or FY2011, and the orange where part of the transfer window was included in FY2010 and part in FY2009 or FY2011.
**** Transfer window timings across Europe were set out in Q13 of last year’s benchmarking report.
HIGHLIGHTS INDEX

95 BENCHMARKING REPORT FY10 - FINANCIAL PROFILE OF EUROPEAN CLUB FOOTBALL: TRANSFER REvIEW
Summer 2009 transfer window
Financial year 2010 Overlap between financial years 2009 & 2010 Financial year 2009
EN
GG
ER
ES
PIT
AFR
AR
US
TUR
NE
DS
CO
PO
RU
KR
BE
LS
UI
AU
TD
EN
GR
EN
OR
SW
EP
OL
ISR
RO
UK
AZ
CZ
EC
YP
BLR
SV
KC
RO
HU
NS
RB
SV
NFI
NB
UL
LIE
IRL
MD
AA
ZE
NIR ISL
LVA
LTU
BIH
LUX
MN
EFR
OG
EO
MK
DW
AL
ES
TM
LTA
RM
AN
DA
LBS
MR
0
10
6
18
14
8
4 2
16
12
20
Timing of transfer windows and clubs' financial year 2010
Winter 2010 transfer window
Financial year 2010 Overlap between financial years 2009 & 2010 Financial year 2009
EN
GG
ER
ES
PIT
AFR
AR
US
TUR
NE
DS
CO
PO
RU
KR
BE
LS
UI
AU
TD
EN
GR
EN
OR
SW
EP
OL
ISR
RO
UK
AZ
CZ
EC
YP
BLR
SV
KC
RO
HU
NS
RB
SV
NFI
NB
UL
LIE
IRL
MD
AA
ZE
NIR ISL
LVA
LTU
BIH
LUX
MN
EFR
OG
EO
MK
DW
AL
ES
TM
LTA
RM
AN
DA
LBS
MR
0
10
6
18
14
8
4 2
16
12
20
Summer 2010 transfer window
Financial year 2010 Overlap between financial years 2010 & 2011 Financial year 2011
EN
GG
ER
ES
PIT
AFR
AR
US
TUR
NE
DS
CO
PO
RU
KR
BE
LS
UI
AU
TD
EN
GR
EN
OR
SW
EP
OL
ISR
RO
UK
AZ
CZ
EC
YP
BLR
SV
KC
RO
HU
NS
RB
SV
NFI
NB
UL
LIE
IRL
MD
AA
ZE
NIR ISL
LVA
LTU
BIH
LUX
MN
EFR
OG
EO
MK
DW
AL
ES
TM
LTA
RM
AN
DA
LBS
MR
0
10
6
18
14
8
4 2
16
12
20 Answer: 38Clubs account for player transfers in two distinct ways, with many smaller clubs not considering transfer fees paid as an asset, but most larger clubs including purchased player registrations on the balance sheet and spreading costs over the period of the player’s contract. When observing a particular transfer window, one should remember that the impact on current year profits depends on many factors, including the timing of transfer sales relative to the financial year-end.
HIGHLIGHTS INDEX

BENCHMARKING REPORT FY10FINANCIAL PROFILE OF EUROPEAN CLUB FOOTBALL: TRANSFER REvIEW
96
39. How does player accounting translate into profits and losses?Q:Q
3). The third important factor relating to transfer activity is the technical difference applied between player purchases and sales and the subsequent impact on profit/losses.
As seen in the previous Q&A, the vast majority of larger European clubs recognise purchased player registrations as assets on the balance sheet, with the transfer cost released in the future over a period of years (on a straight-line basis over the contract period*). In layman’s terms, they consider transfer fees paid as a cost that can potentially be recouped when the player is sold and, hence, has some value, as opposed to other costs such as salaries that will never be recovered. However, as they are not certain of the future value or, indeed, whether the player will eventually move onto another club for a fee, the accountants make sure that the cost of the transfer is still included but spread over time (amortisation – purple in examples 1 and 2) or, occasionally, written off straight away (impairment – mauve in example 2) if a player, for example, suffers a career-ending injury. Then when, and if, the player registration is sold, the sale price (green circle) is compared with the remaining value (net book value – light blue in examples) in the balance sheet and the difference (grey in examples 1 and 3) taken as profit in the financial period during which the player is sold.
The income part arising from these transfer accounting treatments is that each club will have a profit or loss when they sell a player. More often than not, this is a profit, which is taken in the accounting period of sale. The cost part are the amortisation or impairment charges (example 2) from transfer signings made not just in the current year but also in previous years.
4). Differences in accounting treatment for home-grown players.
International financial reporting does not allow home-grown players or players that arrived as “free agents” with no transfer fees paid, to be valued on the balance sheet. This means that no transfer amortisation charges will be applied and that the full sale price will be included as profit when the player is sold. Therefore, the profit recognised in the financial statements for a player sold for €20m can vary significantly if he is home-grown or was previously purchased. The impact can be seen most obviously when looking at the net transfer profits of Serbian and Croatian clubs or, indeed, any clubs where home-grown players are regularly sold on for profits.
Footnote: * UEFA Club Licensing and Financial Fair Play Regulations (2010 edition) require, for consistency purposes, a specific “straight-line” accounting approach for player transfers where clubs “capitalise and amortise transfer fees”, as outlined on this page and in the illustrations. If a club chooses to use a different method in their published financial statements, they must provide a restated set of financial statements for club licensing purposes.
Valu
e
TimeExample 1
Valu
e
TimeExample 2
Valu
e
TimeExample 3
“Market value”: depends on a number of factors, concrete and soft, measurable and non-measurable, some relating to a player’s characteristics, some to his contractual characteristics and some to the club characteristics of the clubs involved. This makes it extremely difficult to model accurately. A non-exhaustive list of contributing factors include:
“Player characteristics”: Age, experience, Injury record, playing position(s), ‘reputation’, desire to represent new/current club.
“Contractual factors”: Time remaining time on contract,
buy-out clauses, expected/current remuneration & signing bonus, agent fee structure, start/end of transfer window, significant legal cases (e.g. Bosman/ Webster).
“Club factors”: Number & type interested clubs, buying power, ‘need’ to sign, ‘need’ to sell, other activity in transfer window, availability of alternative players, promises made & loan/buy preferences.
In general for a player mid way through his career, with “club factors” and “player characteristics” remaining the same, the “market value” will approximate to the dark blue curve due to “contractual factors”.
Simplified representation with player signed on four year contract and sold near end of 3rd year.
25% of transfer fee of purchased player charged as a cost (amortization) each year across the 4 year contract.
The player is valued as an asset in the club balance sheet, at the original cost less amortization charges.
“Market value” reduces slowly in first years and then accelerates when player nears end of contract. If player sold whilst ‘market value’ is above ‘book value’ then a profit recorded as the difference between transfer fee and value left in balance sheet.
Simplified representation with transfer value of player with serious injury:
Player signed and recorded on the same basis until he suffers serious injury leading to a loss in market value. An “impairment” charge cost is then booked covering the difference between estimated new reduced market value and the amount left in balance sheet.
Note: For a player signed on a four year contract who half way through this contract extends by adding another two years to his contract, the remaining 50% balance sheet value (light blue) and amortization charges will be spread over the four years left on his new contract.
Simplified representation of well established home grown player or player signed as free agent without a transfer fee:
No book value or depreciation charges and hence the full value of any transfer fee on sale is booked as a profit.
Note: For a player who’s reputation is improving the dark blue “market value” will actually be moving upwards rather than downwards until his contract nears to an end.
HIGHLIGHTS INDEX
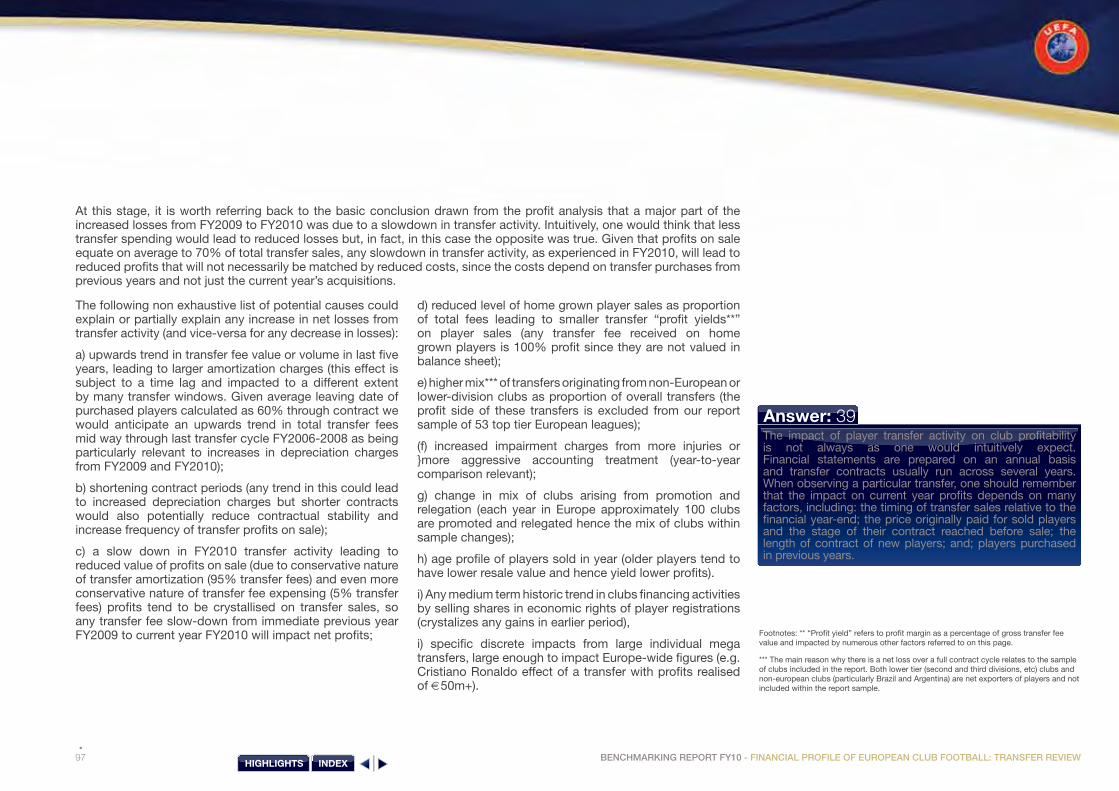
97 BENCHMARKING REPORT FY10 - FINANCIAL PROFILE OF EUROPEAN CLUB FOOTBALL: TRANSFER REvIEW
At this stage, it is worth referring back to the basic conclusion drawn from the profit analysis that a major part of the increased losses from FY2009 to FY2010 was due to a slowdown in transfer activity. Intuitively, one would think that less transfer spending would lead to reduced losses but, in fact, in this case the opposite was true. Given that profits on sale equate on average to 70% of total transfer sales, any slowdown in transfer activity, as experienced in FY2010, will lead to reduced profits that will not necessarily be matched by reduced costs, since the costs depend on transfer purchases from previous years and not just the current year’s acquisitions.
The following non exhaustive list of potential causes could explain or partially explain any increase in net losses from transfer activity (and vice-versa for any decrease in losses):
a) upwards trend in transfer fee value or volume in last five years, leading to larger amortization charges (this effect is subject to a time lag and impacted to a different extent by many transfer windows. Given average leaving date of purchased players calculated as 60% through contract we would anticipate an upwards trend in total transfer fees mid way through last transfer cycle FY2006-2008 as being particularly relevant to increases in depreciation charges from FY2009 and FY2010);
b) shortening contract periods (any trend in this could lead to increased depreciation charges but shorter contracts would also potentially reduce contractual stability and increase frequency of transfer profits on sale);
c) a slow down in FY2010 transfer activity leading to reduced value of profits on sale (due to conservative nature of transfer amortization (95% transfer fees) and even more conservative nature of transfer fee expensing (5% transfer fees) profits tend to be crystallised on transfer sales, so any transfer fee slow-down from immediate previous year FY2009 to current year FY2010 will impact net profits;
d) reduced level of home grown player sales as proportion of total fees leading to smaller transfer “profit yields**” on player sales (any transfer fee received on home grown players is 100% profit since they are not valued in balance sheet);
e) higher mix*** of transfers originating from non-European or lower-division clubs as proportion of overall transfers (the profit side of these transfers is excluded from our report sample of 53 top tier European leagues);
(f) increased impairment charges from more injuries or }more aggressive accounting treatment (year-to-year comparison relevant);
g) change in mix of clubs arising from promotion and relegation (each year in Europe approximately 100 clubs are promoted and relegated hence the mix of clubs within sample changes);
h) age profile of players sold in year (older players tend to have lower resale value and hence yield lower profits).
i) Any medium term historic trend in clubs financing activities by selling shares in economic rights of player registrations (crystalizes any gains in earlier period),
i) specific discrete impacts from large individual mega transfers, large enough to impact Europe-wide figures (e.g. Cristiano Ronaldo effect of a transfer with profits realised of €50m+).
Footnotes: ** “Profit yield” refers to profit margin as a percentage of gross transfer fee value and impacted by numerous other factors referred to on this page.
*** The main reason why there is a net loss over a full contract cycle relates to the sample of clubs included in the report. Both lower tier (second and third divisions, etc) clubs and non-european clubs (particularly Brazil and Argentina) are net exporters of players and not included within the report sample.
Answer: 39The impact of player transfer activity on club profitability is not always as one would intuitively expect. Financial statements are prepared on an annual basis and transfer contracts usually run across several years. When observing a particular transfer, one should remember that the impact on current year profits depends on many factors, including: the timing of transfer sales relative to the financial year-end; the price originally paid for sold players and the stage of their contract reached before sale; the length of contract of new players; and; players purchased in previous years.
HIGHLIGHTS INDEX

BENCHMARKING REPORT FY10FINANCIAL PROFILE OF EUROPEAN CLUB FOOTBALL: TRANSFER REvIEW
98
40. How did transfer activity impact on profits in FY2010?Q:Q
Having explained the basis for player transfer accounting we now analyse the net impact for the financial year 2010. As previously highlighted, the net cost from transfer activity is the net impact on the profit and loss account each year and is calculated by adding the “amortization” (€2,330m) and impairment charges (€59m) arising on current players previously purchased (e.g. FY2006-2010) with the profits on sales of players during FY2010 (€1,456m) which nets to a €933m* net cost in FY2010, a significant increase in net costs compared to the FY2008 and FY2009 results, as forecasted in last year’s benchmarking report**.
EN
GG
ER
ES
PIT
AFR
AR
US
TU
RN
ED
SC
OP
OR
UK
RB
EL
SU
IA
UT
DE
NG
RE
NO
RS
WE
PO
LIS
RR
OU
KA
ZC
ZE
CY
PB
LRC
RO
HU
NS
RB
SV
NFI
NB
UL
LIE
IRL
MD
AA
ZE
NIR ISL
LVA
LTU
BIH
LUX
MN
EFR
OG
EO
MK
DW
AL
ES
TM
LTA
RM
AN
DA
LBS
MR
AG
G
0%
-10%
-20%
-30%
10%
20%
30%
-10%+ -1% to -10% +/-1% 1% to 10% 10%+
EN
GG
ER
ES
PIT
AFR
AR
US
TU
RN
ED
SC
OP
OR
UK
RB
EL
SU
IA
UT
DE
NG
RE
NO
RS
WE
PO
LIS
RR
OU
KA
ZC
ZE
CY
PB
LRC
RO
HU
NS
RB
SV
NFI
NB
UL
LIE
IRL
MD
AA
ZE
NIR ISL
LVA
LTU
BIH
LUX
MN
EFR
OG
EO
MK
DW
AL
ES
TM
LTA
RM
AN
DA
LBS
MR
0
4
8
12
16
20
The column charts on this page show the net impact of transfer activity as a percentage of revenue on reported results for the year, firstly in aggregate by country, and secondly by the number of clubs within certain defined thresholds for each country.
The country aggregate chart with the reds to the left and greens to the middle and right, clearly illustrates that the transfer system acts as a strong and important financial solidarity mechanism towards clubs in the small and medium income divisions.
The chart below also shows clearly that whilst in aggregate terms the larger leagues are net “importers” of talent and hence tend towards reporting a net financial cost from transfer activity, there are still clubs in these larger leagues that are net “exporters” of players that report net income from transfers.
€933 net lossfrom transfers
FY2010
€474 net loss from transfers
FY2009
€340 net loss from transfers
FY2008
Footnotes: * Due to inconsistency/incompleteness in reporting, all the FY2010 transfer analysis excludes Slovakian clubs and includes 650 clubs from 52 countries. The year on year arrow chart is based on the two year results of 567 clubs that were in their top division both seasons.
** “A look at an agent website’s transfer market estimations indicates that spending by clubs from the four largest leagues slowed down by an estimated €180m in the season 08/09 compared to 07/08. This trend continued into 09/10 season with a further decrease of €135m and this should be reflected in the next few years’ financial results.” (The European club footballing landscape report FY2009 Q&A 38 page 82).
HIGHLIGHTS INDEX

99 BENCHMARKING REPORT FY10 - FINANCIAL PROFILE OF EUROPEAN CLUB FOOTBALL: TRANSFER REvIEW
The transfer system gives football clubs a unique ability to control their financial destiny, both in rebalancing shortfalls and utilising surpluses. The state of the transfer market, the relative buoyancy in market prices and number of active buyers and sellers, can therefore have a considerable impact on clubs’ financial results and strategy.
The pie charts provide the Europe-wide club picture grouped between the same thresholds, firstly for transfer activity of all clubs and secondly for transfer activity of the 80 clubs that qualified for UEFA cup competitions and illustrates that transfer activity can be financially “highly significant”, equivalent to more than 10% of total revenue, as net income for 110 (17%) clubs and net costs for 94 (14%) clubs respectively.
The right hand chart further illustrates that transfers were a “highly significant” net financial cost for 32 (40%) of the clubs that qualified for the UEFA Champions League and Europa League group stages.
Finally the arrow chart indicates the proportion of clubs whose financial results were negatively (red) and positively (green) impacted by their transfer result in FY2010 compared to the previous year FY2009, indicating a fairly even split by number of clubs (not transfer value).
Establishing the significance of transfer activity on the net losses of European clubs is the first important step to explaining the year-on-year change between FY2009 and FY2010. It is only possible to consider the drivers of increased transfer net losses with careful analysis of many years worth of the detailed notes on player assets at the back of club financial statements, a place that people don’t usually venture by choice. This data is not collected or available anywhere and would necessitate a major financial modelling exercise and many years of detailed data, but
UEFA started analysing this last year and can make some initial conclusions on the probable causes of this year’s increased losses and likely future development of net transfer losses***.
In section 5 we stated that the first half of the reduction in transfer profits was driven by a reduction of approximately €300m of gross transfer fees received during the FY2010 in comparison to previous years which given the 65% average profit margin on sales would lead to reduced net profits of just over €200m. The second half of the reduction in transfer profits was due to a lower yield on those €2,125m of players sold with average reported profit per transfer value dropping from 71% to 65%. This highlighted some useful trends figures and transfer market ratios that can be tracked on a club-by-club or league-by-league basis and we include these with two year’s figures within the appendices and will further analyse next year.
Answer: 40The column charts, with reds to the left and greens to the right, clearly illustrate that the transfer system acts as a strong and important financial solidarity mechanism towards clubs in the small and medium income divisions with all larger leagues being net importers in FY2010 with the exception of Portugal. Transfers improved the bottom line profit margin by over 10% for 110 individual clubs and 9 leagues and worsened it by over 10% for 94 clubs and 6 leagues across Europe in FY2010.
Transfer net losses increased significantly by €459m in FY2010, due partly to lower average profits on players sold which was partly due to a slow down of €300m in transfer activity predicted in last year’s report, with reduced spending from clubs in all the major leagues (except Germany and Portugal) and English clubs in particular.
Net transfer activity as % revenue FY2010All clubs
94
225
13883
110
Net transfer activity as % revenue FY2010the 80 UEFA group stage clubs
24
4
329
11
-1% to -10%
-10%+
+/-1%
1% to 10%
10%+
Net transfer cost: trend by clubsFY2009 to FY2010 (All clubs)
19%41% 40%
Footnote: *** By tracking transfer spending as estimated through agent websites, we are able to get a feel for the likely net profits and costs from transfer results before they are reported in financial statements. For all the reasons indicated earlier in this section, this is not an exact science, with many elements of uncertainty, and requires an element of judgement. However, all things being equal, we expect the net profits on transfer sales in FY2011 to be above those reported in FY2010, but this to be largely ,but not fully, cancelled out by higher depreciation charges in FY2011.
The higher forecast profits on sale are due to increased transfer activity in the January 2011 transfer window, when transfer income is estimated to have increased by more than €320m, from the quietest (2010) to the busiest (2011) winter transfer window in recent times. The impact of the summer 2010 transfer window, which was relatively quiet compared with 2009 and 2011, is far more difficult to predict as it depends on the exact timing of transfers and the financial year-ends of many of the largest selling clubs.
However, with the opening book value of player intangible assets €260m higher at the start of FY2011, we would anticipate depreciation to be higher in FY2011 and this to counteract part of the expected increased profits on player sales.
HIGHLIGHTS INDEX
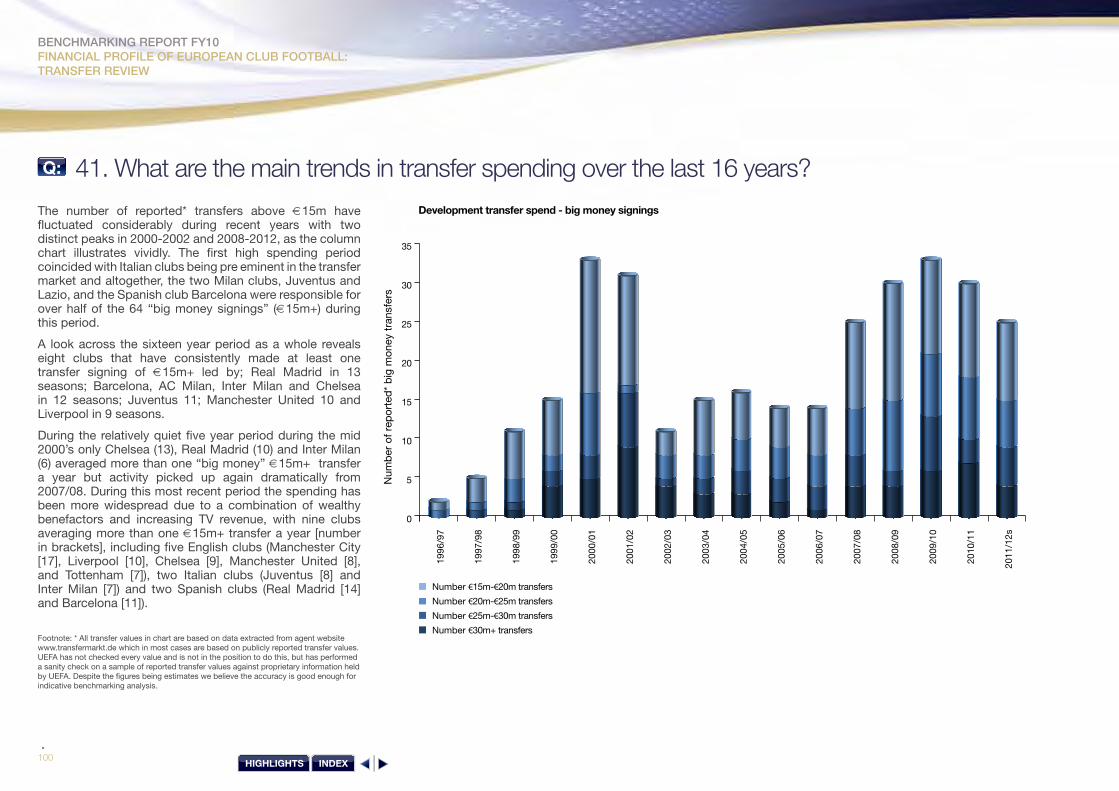
BENCHMARKING REPORT FY10FINANCIAL PROFILE OF EUROPEAN CLUB FOOTBALL: TRANSFER REvIEW
100
41. What are the main trends in transfer spending over the last 16 years?Q:Q
The number of reported* transfers above €15m have fluctuated considerably during recent years with two distinct peaks in 2000-2002 and 2008-2012, as the column chart illustrates vividly. The first high spending period coincided with Italian clubs being pre eminent in the transfer market and altogether, the two Milan clubs, Juventus and Lazio, and the Spanish club Barcelona were responsible for over half of the 64 “big money signings” (€15m+) during this period.
A look across the sixteen year period as a whole reveals eight clubs that have consistently made at least one transfer signing of €15m+ led by; Real Madrid in 13 seasons; Barcelona, AC Milan, Inter Milan and Chelsea in 12 seasons; Juventus 11; Manchester United 10 and Liverpool in 9 seasons.
During the relatively quiet five year period during the mid 2000’s only Chelsea (13), Real Madrid (10) and Inter Milan (6) averaged more than one “big money” €15m+ transfer a year but activity picked up again dramatically from 2007/08. During this most recent period the spending has been more widespread due to a combination of wealthy benefactors and increasing TV revenue, with nine clubs averaging more than one €15m+ transfer a year [number in brackets], including five English clubs (Manchester City [17], Liverpool [10], Chelsea [9], Manchester United [8], and Tottenham [7]), two Italian clubs (Juventus [8] and Inter Milan [7]) and two Spanish clubs (Real Madrid [14] and Barcelona [11]).
Number €15m-€20m transfers
Number €20m-€25m transfers
Number €25m-€30m transfers
Number €30m+ transfers
1996
/97
1997
/98
1998
/99
1999
/00
2000
/01
2001
/02
2002
/03
2003
/04
2004
/05
2005
/06
2006
/07
2007
/08
2008
/09
2009
/10
2010
/11
2011
/12s
0
5
10
15
20
25
30
35
Development transfer spend - big money signings
Num
ber
of r
epor
ted
* b
ig m
oney
tra
nsfe
rs
Footnote: * All transfer values in chart are based on data extracted from agent website www.transfermarkt.de which in most cases are based on publicly reported transfer values. UEFA has not checked every value and is not in the position to do this, but has performed a sanity check on a sample of reported transfer values against proprietary information held by UEFA. Despite the figures being estimates we believe the accuracy is good enough for indicative benchmarking analysis.
HIGHLIGHTS INDEX

101 BENCHMARKING REPORT FY10 - FINANCIAL PROFILE OF EUROPEAN CLUB FOOTBALL: TRANSFER REvIEW
The transfers in excess of €15m+ represent just less than a quarter** of overall headline transfer spend although they are important since any receipts multiply further with follow on transfer spending. These charts go beyond just these “big money” transfers to look at total transfer spending covering all clubs from the 24 largest top divisions*** over the last fifteen transfer windows.
The blue and gold lines indicate that the peak of transfer spending was actually during 2007/08 rather than the peak of “big money” transfers in 2009/10. Indeed total spending in the two “transfer seasons” 2009/10 and 2010/11 was 15% lower than in 2007/08 and 2008/09.
The aggregate transfer spending of clubs from each of the largest six leagues is highlighted in the right-hand chart and we can see English and Spanish transfer spending in particular peaked during these two years and were the principal drivers of the overall European transfer spending trend.
Most recently, the summer transfer window of 2011 saw estimated total transfer spending of €2,290m representing an 18% increase on summer 2010 spending but below the previous three summers and 10% below the summer 2007 peak of €2,548m.
Footnotes: ** Between 2003/04 and 2010/11 the proportion of €15m+ transfer spend to overall transfer spend was 23% although this varied between 16% and 34%.
*** The 24 countries included in sample are: Austria, Belgium, Croatia, Czech Republic, Denmark, England, France, Germany, Greece, Israel, Italy, Netherlands, Norway, Poland, Portugal, Romania, Russia, Scotland, Serbia, Sweden, Switzerland, Turkey and Ukraine. The transfer spending of the clubs from the 29 top divisions not included in FY2010 was €24m equivalent to less than 1% total top division transfer spending. These figures are not structured by financial year but by “transfer seasons” with all summer 2010 and January 2011 transfers included within the 2010/11 “transfer season” for example. We have not included the transfer spending of second or lower tier leagues as the report covers only top division clubs ( broadly the club licensing scope) – notwithstanding this the second tiers of largest five leagues are also significant transfer spenders calculated to be responsible for 6% and 18% of transfer spending and transfer revenues respectively.
Summer & winter transfer spendSummer transfer spendSummer & winter net transfer spend
2004
/05
2005
/06
2006
/07
2007
/08
2008
/09
2009
/10
2010
/11
2011
/12
(S)
0
1,500
500
2,000
2,500
3,000
3,500
€’m
illio
ns
Development transfer spend [24 European top divisions]
1,000
ENGESPITAGERFRARUS
2004
/05
2005
/06
2006
/07
2007
/08
2008
/09
2009
/10
2010
/11
2011
/12
0
400
100
600 500
800 700
900 1,000
€’m
illio
ns
Total transfer spend estimate
300 200
Answer: 41There have been two main peaks in transfer activity over the last sixteen years 2000-2002 and 2007-2009.
HIGHLIGHTS INDEX
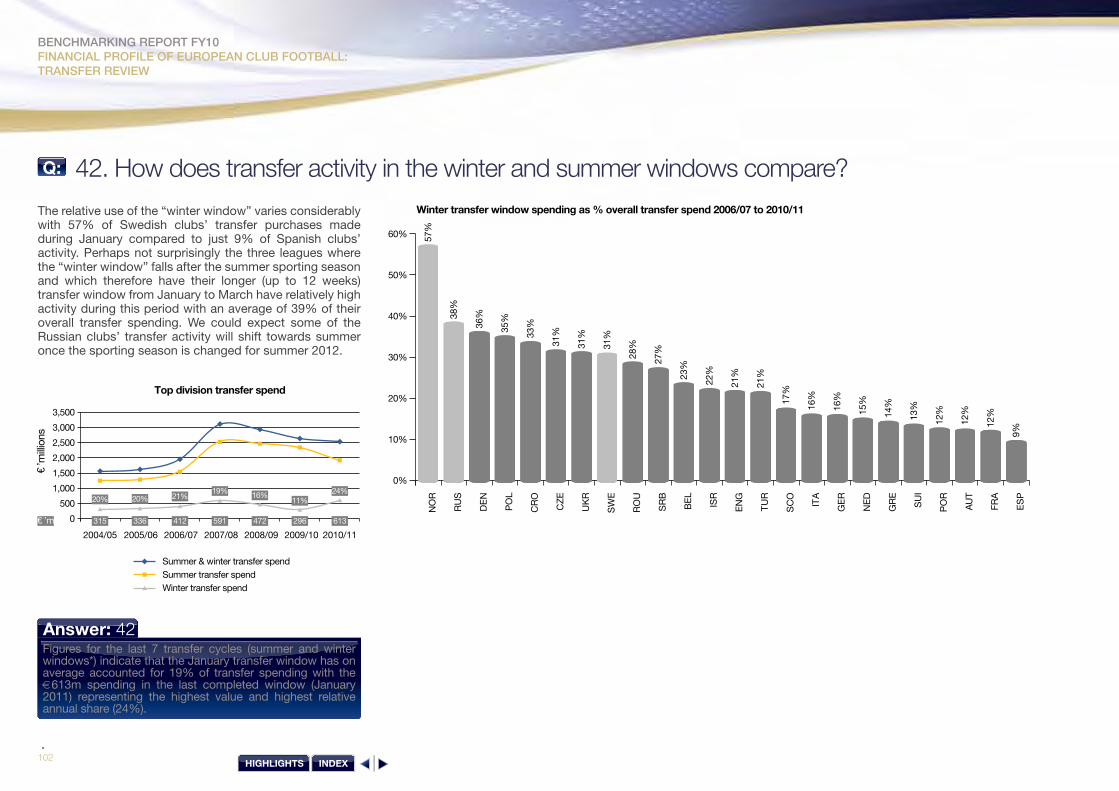
BENCHMARKING REPORT FY10FINANCIAL PROFILE OF EUROPEAN CLUB FOOTBALL: TRANSFER REvIEW
102
42. How does transfer activity in the winter and summer windows compare?Q:Q
The relative use of the “winter window” varies considerably with 57% of Swedish clubs’ transfer purchases made during January compared to just 9% of Spanish clubs’ activity. Perhaps not surprisingly the three leagues where the “winter window” falls after the summer sporting season and which therefore have their longer (up to 12 weeks) transfer window from January to March have relatively high activity during this period with an average of 39% of their overall transfer spending. We could expect some of the Russian clubs’ transfer activity will shift towards summer once the sporting season is changed for summer 2012.
0
1,500
2,500
2,000
3,500
3,000
€’m
illio
ns
Top division transfer spend
1,000
500
€’m
Summer & winter transfer spendSummer transfer spendWinter transfer spend
2004/05 2005/06 2006/07 2007/08 2008/09 2010/112009/10
20% 20% 21%19% 16% 24%
11%
315 336 412 591 472 613296
NO
R
RU
S
DE
N
PO
L
CR
O
CZ
E
UK
R
SW
E
RO
U
SR
B
BE
L
EN
G
TU
R
SC
O
GE
R
NE
D
GR
E
PO
R
AU
T
FRA
ES
P
ISR
ITA
SU
I
0%
10%
20%
30%
40%
50%
60%
Winter transfer window spending as % overall transfer spend 2006/07 to 2010/11
57%
38%
36%
35%
33%
31%
31%
31%
28%
27%
23%
21%
21%
17%
16%
15%
14%
12%
12%
12%
9%
22%
16%
13%
Answer: 42Figures for the last 7 transfer cycles (summer and winter windows*) indicate that the January transfer window has on average accounted for 19% of transfer spending with the €613m spending in the last completed window (January 2011) representing the highest value and highest relative annual share (24%).
HIGHLIGHTS INDEX
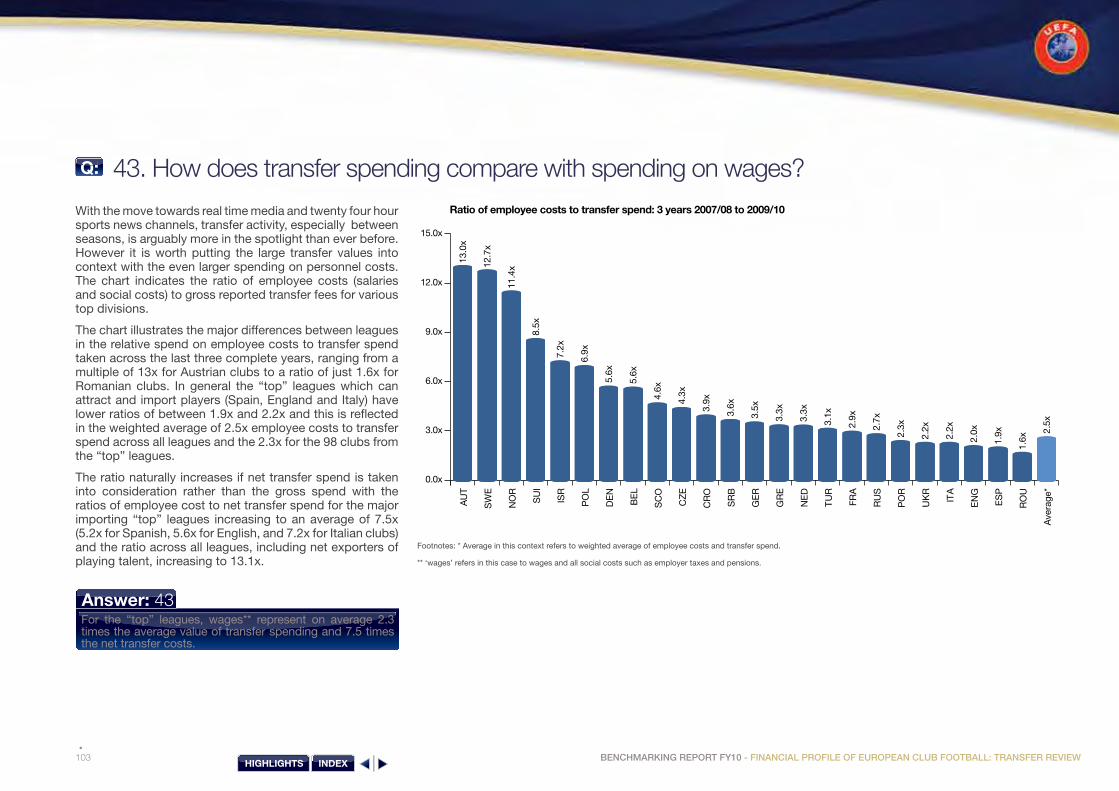
103 BENCHMARKING REPORT FY10 - FINANCIAL PROFILE OF EUROPEAN CLUB FOOTBALL: TRANSFER REvIEW
Footnotes: * Average in this context refers to weighted average of employee costs and transfer spend.
** ‘wages’ refers in this case to wages and all social costs such as employer taxes and pensions.
43. How does transfer spending compare with spending on wages?Q:Q
With the move towards real time media and twenty four hour sports news channels, transfer activity, especially between seasons, is arguably more in the spotlight than ever before. However it is worth putting the large transfer values into context with the even larger spending on personnel costs. The chart indicates the ratio of employee costs (salaries and social costs) to gross reported transfer fees for various top divisions.
The chart illustrates the major differences between leagues in the relative spend on employee costs to transfer spend taken across the last three complete years, ranging from a multiple of 13x for Austrian clubs to a ratio of just 1.6x for Romanian clubs. In general the “top” leagues which can attract and import players (Spain, England and Italy) have lower ratios of between 1.9x and 2.2x and this is reflected in the weighted average of 2.5x employee costs to transfer spend across all leagues and the 2.3x for the 98 clubs from the “top” leagues.
The ratio naturally increases if net transfer spend is taken into consideration rather than the gross spend with the ratios of employee cost to net transfer spend for the major importing “top” leagues increasing to an average of 7.5x (5.2x for Spanish, 5.6x for English, and 7.2x for Italian clubs) and the ratio across all leagues, including net exporters of playing talent, increasing to 13.1x.
AU
T
SW
E
NO
R
SU
I
ISR
PO
L
DE
N
BE
L
SC
O
CZ
E
CR
O
SR
B
GE
R
GR
E
NE
D
TU
R
FRA
RU
S
PO
R
UK
R
ITA
EN
G
ES
P
RO
U
Ave
rage
*
0.0x
3.0x
6.0x
9.0x
12.0x
15.0x
Ratio of employee costs to transfer spend: 3 years 2007/08 to 2009/10
12.7
x
13.0
x
11.4
x
8.5x
7.2x
6.9x
5.6x
5.6x
4.6x
4.3x
3.9x
3.6x
3.3x
3.3x
3.1x
2.7x
2.3x
2.2x
2.0x
1.9x
1.6x
2.5x
3.5x
2.9x
2.2x
Answer: 43For the “top” leagues, wages** represent on average 2.3 times the average value of transfer spending and 7.5 times the net transfer costs.
HIGHLIGHTS INDEX

BENCHMARKING REPORT FY10FINANCIAL PROFILE OF EUROPEAN CLUB FOOTBALL: TRANSFER REvIEW
104
44. What are the profiles (nationality, age, club) of the top 400 transfers?Q:Q
To provide a high-level retrospective review of transfer activity, we have analysed the top 25 reported transfer fees for each of the last 16 years to get a sample of 400 transfers.*
ITA
EN
G
ES
P
FRA
PO
R
GE
R
NE
D
AR
G
BR
A
RU
S
TU
R
UK
R
BE
L
CR
O
SC
O
JAP
NO
R
QA
T
SR
B
UR
U
0
25
50
75
100
125
150
Nationality of selling clubtop 400 transfers 1996-2011
9690
63
3627
17 17 14 147 4 4 2 2 2 1 1 1 1 1
EN
G
ITA
ES
P
FRA
GE
R
RU
S
BR
A
GR
E
NE
D
PO
R
QA
T
SC
O
TU
R
UK
R
0
25
50
75
100
125
150
Nationality of buying clubtop 400 transfers 1996-2011
146
116
93
179 8
2 2 2 1 1 1 1 1
16 17 18 19 20 21 22 23 24 25 26 27 28 29 30 31 32
Number in TOP 25
Transfer Value
0
800
600
400
200
1,000
1,200
1,400
Tota
l fee
s €
‘m b
y pl
ayer
age
Player age at transfer
Num
ber t
op 2
5 tr
ansf
ers
by p
laye
r age
60
50
40
30
20
10
0
Spread of transfers by age(value & number of top 25 transfers from last 16 years)
Answer: 44‘Big money’ transfers over the last sixteen years have most commonly involved: twenty four year olds; Brazilians; forward players, and; English and Italian clubs.
HIGHLIGHTS INDEX

105 BENCHMARKING REPORT FY10 - FINANCIAL PROFILE OF EUROPEAN CLUB FOOTBALL: TRANSFER REvIEW
Footnotes: * All transfer values in chart are based on data extracted from agent website www.transfermarkt.de which in most cases are based on publicly reported transfer values. UEFA has not checked every value and is not in the position to do so, but has performed a sanity check on a sample of reported transfer values. Despite the figures being estimates, we believe the accuracy is good enough for indicative benchmarking analysis but should not be relied upon for any other purposes.
** Age is estimated as data-provided age at April 2011. To estimate the age at transfer date ,we have initially subtracted one year from April age on basis that 80% of transfers were summer transfers, which is 8-10 months before age provided. However, to then more accurately estimate spread of top 25 transfers by age ,we have taken 65% of this estimated transfer value and number per year and attributed 35% to one year older. For summer 2011 transfers, the age is based on actual birth date.
*** “Others” includes 113 players of 37 different nationalities.
Appearances of individual playerswithin top 400 sample
Four
Five
Three
Two
One
15%
80%
3%
1%1%
Position of top 400 transfers1996-2011
Midfielder
Striker
Defender
Goalkeeper
184
149
1057
Nationality of top 400 transfers1996-2011
ENG
BRA
ARG
ITA
ESP
FRA
POR
NED
Others***
41
39
352726
26
113
50
43
Confederation of nationality oftop 400 transfers 1996-2011
AFC
UEFA
CONMEBOL
CONCACAF
CAF268
106
23 2 1
HIGHLIGHTS INDEX

BENCHMARKING REPORT FY10FINANCIAL PROFILE OF EUROPEAN CLUB FOOTBALL: TRANSFER REvIEW
106
45. Which clubs and countries have spent and made the most money from transfer activity?Q:Q
The map presents per country the net transfer result as a percentage of revenues for the three year period FY2008-2010. It is the same type of analysis presented previously for the FY2010 results but expanded to cover more of a complete transfer cycle. Oranges and reds indicate transfer activity yielded a net cost whilst greens indicate a net income. Green countries such as France, the Netherlands, Belgium, Portugal and the Scandinavian countries, are often referred to as “net exporters of talent”.
In the additional call-out boxes we present an estimated net transfer spend or net transfer gain for selected clubs for the last decade 2001/02 to 2010/11 based not on the financial figures (our recorded figures do not stretch back that far) but on the estimates of the agent website www.transfermarkt.de. These figures are clearly indicative only but provide a useful benchmark for understanding transfer flows. In many cases clubs with high transfer profits tend towards having high relative wages whilst some of the largest net transfer spenders have relatively low wages to income ratios. In other words there are many potential player resource strategies available to club decision makers. For further analysis on player mobility, focusing on squad profiles and transfer trends we would further refer to the PFPO publications (www.eurofootplayers.org).
Answer: 45The chart colours provide an indication that clubs from France, the Netherlands, Belgium, Portugal, the Scandinavian countries and the Balkan countries tend to report transfer profits.
HIGHLIGHTS INDEX
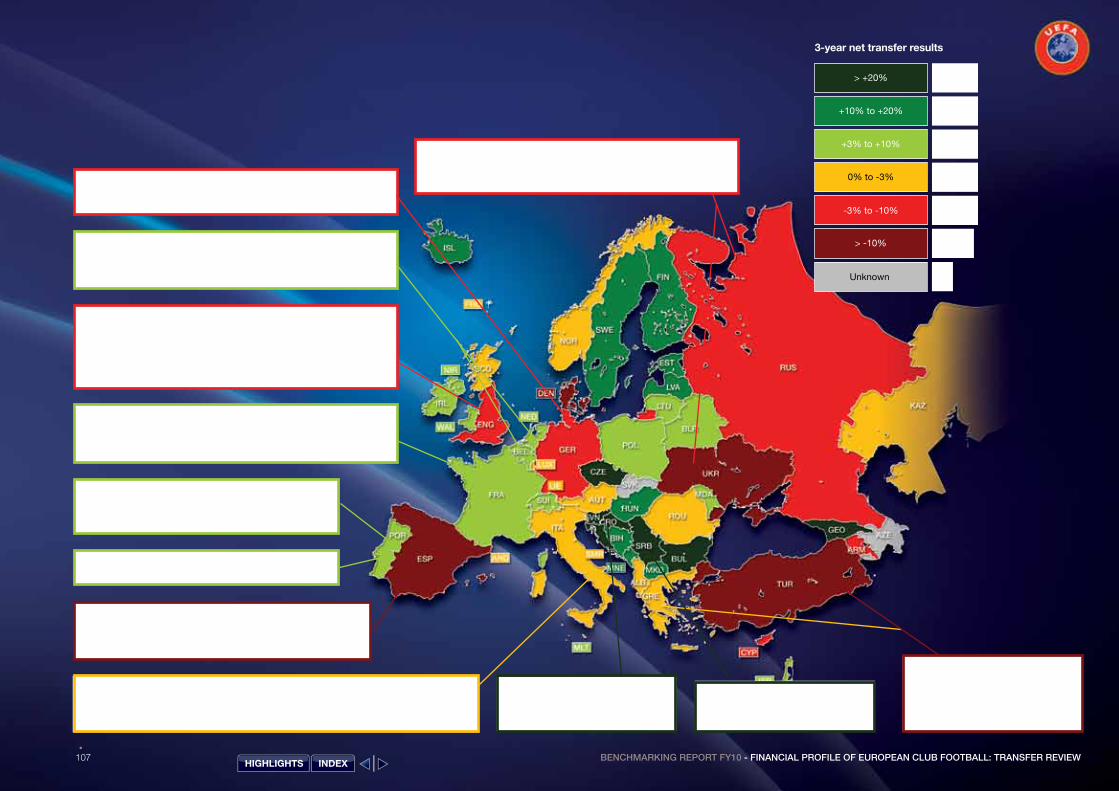
107 BENCHMARKING REPORT FY10 - FINANCIAL PROFILE OF EUROPEAN CLUB FOOTBALL: TRANSFER REvIEW
3-year net transfer results
> +20% 6x
+3% to +10%
+10% to +20%
5x-3% to -10%
> -10%
Unknown
4x
0% to -3%
14x
13x
9x
2x
Most of the Premier League clubs are net importers in the transfer market with 7 of the top 20 European net spenders. Two of the English clubs are ranked first and third in net transfer spend, with one also the fifth highest net earning club at €91m, due exclusively to sales in the last 18 months. The second top league in England benefits as one of the three most profitable leagues for transfer activity.
The majority of French clubs are transfer neutral or exporters of talent, with one ranked 8th with net transfer receipts of €69m. Two clubs are net spenders but outside the top 20, with one club particularly active with high gross transfer payments and gross receipts (6th).
The majority of Dutch and Belgian clubs are exporters of talent, with one Dutch club estimated to have generated net transfer income of €94m (third place), one Belgian club €36m (15th) and, between them, three other Dutch clubs another €85m in net receipts.
Pride of place goes to a Portuguese club, who is estimated to have generated net transfer profits of €223m, with profits nine years out of ten, while winning the UEFA Champions League and UEFA Europa League during this period.
Elsewhere in Portugal, two other clubs were both also in the top 15 net exporters, with an estimated €50m and €40m.
From Spain, two clubs are both among the top 5 net transfer spenders with an estimated €622m and €338m. On the other hand, two other Spanish clubs are among the top 10 for generating net transfer income (€79m and €49m).
Italian clubs are also found at both ends of the scale. Whilst two clubs are in the top 10 of net transfer spenders with an estimated €219m and €161m, one is 2nd in terms of net transfer profits with €129m, including net income in the last seven years. Two other clubs are in the top 15 for total spend but also in the top 10 for transfer receipts.
Croatian clubs report large transfer profits each year, with one estimated to have generated net income of €72m, ranking 7th in Europe.
Two Serbian clubs are estimated to have generated net transfer incomes of €47m and €88m, with one ranked 5th across Europe.
The major Turkish and Greek clubs are also net spenders, with two Turkish clubs among the top 50 net spenders, (ranked 14th and 17th) spending an estimated €129m and €99m over the ten-year period.
Most of the major Russian and Ukrainian clubs are net importers in the transfer market, with 8 of the top 30 European net spenders but none in the top15. In recent years, two clubs have been especially active, with net spend close to €100m each.In general, German clubs are small net importers, with the second highest
German net transfer spending club ranked as low as 37th in European terms. One club is the exception, with an estimated net spend of €233m (6th).
HIGHLIGHTS INDEX

BENCHMARKING REPORT FY10PREPARING FOR FINANCIAL FAIR PLAY
108
8Preparing for financial fair play
What are people saying about financial fair play?
How many and which clubs will have to meet the financial fair play requirements?
How are clubs currently doing on the breakeven rule?
How many clubs would currently be required to prepare updated figures?
What financial reporting dates do clubs use?
HIGHLIGHTS INDEX

109 BENCHMARKING REPORT FY10 - PREPARING FOR FINANCIAL FAIR PLAYHIGHLIGHTS INDEX

BENCHMARKING REPORT FY10PREPARING FOR FINANCIAL FAIR PLAY
110
46. What are people saying about Financial Fair Play?Q:Q
I think it [FFP] will attract strong, very capable ownership into clubs that are, at the moment, struggling to attract investment. There are many clubs in this country that have enormous potential that could be unlocked. But is it going to be done in a year by buying players? No. There has to be a longer term plan. I don’t agree it locks in the hierarchy; I think what we have now is more predictable. No club wants a system that locks in the current hierarchy forever.(Arsenal Chief Executive, Ivan Gazidis, at Leaders in Football 2011, London)
“
” This programme [FFP] is important not just for us, but for the entire football community, since European football financial affairs are in need of a serious health check, with 90% of clubs making a loss…Therefore the centralised policy of UEFA and the measures to impose limits under the financial fair play programme are, I think, the only way out of the situation as it now stands.(CSKA Moscow President, Evgeny Giner, as quoted in insideworldfootball, 16 June 2011)
“
” We are all fully behind the financial fair play rules because we need to make some changes in European football. European clubs were in deficit by more than €1bn last season, so we need action. (Internzionale Milano Chief Executive and ECA board member, Ernesto Paolillo, as quoted in the Guardian, 7 September 2011)
“”
Je trouve que tout cet argent dans le foot est irrationnel: il y en a trop! C’est pour cela que je soutiens fortement le fair-play financier prôné par Michel Platini - le président de l’UEFA - , et j’espère que ça va marcher. Car si ça continue comme cela le foot ne sera plus un sport.“It’s crazy all the money there is in football; there’s too much of it! That’s why I strongly support the financial fair play advocated by Michel Platini, the UEFA president, and I hope it will work. Because if it carries on as it is, football won’t be a sport any more.”
(Owner of Olympique Marseille, Margarita Louis-Dreyfus, as quoted in Le Monde, 8 October 2011)
“”
HIGHLIGHTS INDEX

111 BENCHMARKING REPORT FY10 - PREPARING FOR FINANCIAL FAIR PLAY
There has been a great deal of excess in building up squads, clubs have not kept their spending in check and the situation has spiralled out of control.(President of CA Osasuna, Francisco Izco, as quoted in the Irish Examiner, 15 November 2009)
“”
Trotzdem: Der Ansatz des FFP ist absolut richtig. Wir müssen dahin kommen, dass nur so viel ausgegeben werden darf, wie eingenommen wird.“Nevertheless, the FFP [financial fair play] approach is absolutely right. We must get to the point where you can only spend as much as you earn.”
(Borussia Dortmund Chairman, Hans-Joachim Watzke, as quoted in Der Spiegel, 1 September 2011)
“”
HIGHLIGHTS INDEX

BENCHMARKING REPORT FY10PREPARING FOR FINANCIAl FAIR PlAY
112
47. How many and which clubs will have to meet the financial fair play requirementsQ:Q
On 27 May 2010, the UEFA Executive Committee approved the UEFA Club Licensing and Financial Fair Play Regulations (2010 edition) which included the financial fair play measures developed over the previous 18 months by UEFA together with all the stakeholders represented in the Professional Football Strategy Council (national associations, clubs, leagues, players’ unions). Part III of the regulations, UEFA Club Monitoring, and the annexes provide more detailed requirements of the various financial fair play criteria.
We have run a simulation based on historic club by club financial data which gives an idea of the scope of application of the club monitoring requirements* and provides an indication of where clubs presently stand in relation to the breakeven rule and in relation to the indicators which dictate whether clubs have to provide updated financial information.
This is the first time such a large Europe-wide assessment has been published and we believe the results of the simulation are extremely interesting and provide food for thought. In this report we have provided just some highlight aggregate figures. Please note that before full financial fair play implementation, UEFA will show licensors and clubs where they stand and assist them.
However, the results must be considered indicative for three main reasons:
1. The footnote (see next page), which explains the approach taken for the simulation, indicates the number of judgements required to perform the simulation. This does not necessarily mean the breakeven calculation itself is overly complex; in fact, during its development it was decided to keep it as simple as practical as possible. The footnote is so extensive because our reporting templates only cover the primary profit and loss, balance sheet and cash flow statements (approximately 150 line items) and not the detailed notes that add explanations and colour to these numbers and would usually determine the appropriate approach in these areas. Therefore, we have made some assumptions that may not hold true for all clubs within the simulation.
2. The scope differs from the figures that will be assessed for financial fair play. The financial results in the simulation cover (in the majority of cases) three years, although the initial financial fair play assessment is for two years, after this the assessment will always be over three years.
3. There is a considerable difference in the timeframe of the simulated results and the first financial fair play results. A club’s FY2008, FY2009 and FY2010 figures may be considerably different to the figures assessed for financial fair play, the first of which will be three years later, in FY2012 and FY2013. Indeed, this simulated data covers financial reporting periods that either pre-date or overlap the very start of the approval of the financial fair play regulations and, hence, does not reflect the impact that the regulations will have on clubs’ approaches to their discretionary spending (players wages and transfer fees) before and once the financial fair play assessment begins.
Answer: 47All clubs participating in UEFA club competitions (235–237 under current competition formats) will require a licence granted by their licensor (in most cases the national association) as they do today.
In addition, all participating clubs, once granted a licence and access to the competitions, are now subject to financial monitoring by the Club Financial Control Panel . This means that all 236 participating clubs competing in the 2011/12 UEFA club competitions were monitored in summer 2011 to ensure that they had met their transfer payments and salary obligations to their staff.
In the future, clubs above a certain size will also fall within the scope of the breakeven rule, providing historic breakeven information. Those low-risk clubs that report a positive breakeven result each year and pass other risk indicators will not have to provide any more information.
Those that breach a risk indicator will have to provide current information and also future financial information, including a future plan for compliance with the breakeven calculation.
HIGHLIGHTS INDEX
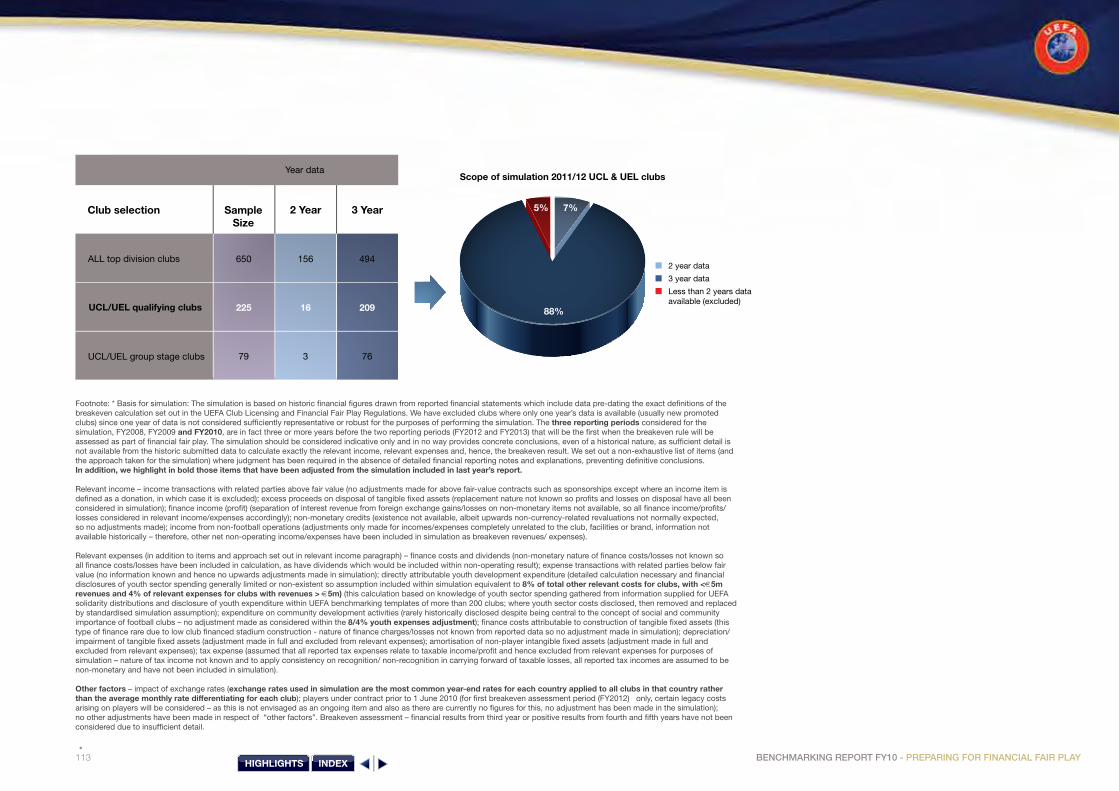
113 BENCHMARKING REPORT FY10 - PREPARING FOR FINANCIAL FAIR PLAY
Footnote: * Basis for simulation: The simulation is based on historic financial figures drawn from reported financial statements which include data pre-dating the exact definitions of the breakeven calculation set out in the UEFA Club Licensing and Financial Fair Play Regulations. We have excluded clubs where only one year’s data is available (usually new promoted clubs) since one year of data is not considered sufficiently representative or robust for the purposes of performing the simulation. The three reporting periods considered for the simulation, FY2008, FY2009 and FY2010, are in fact three or more years before the two reporting periods (FY2012 and FY2013) that will be the first when the breakeven rule will be assessed as part of financial fair play. The simulation should be considered indicative only and in no way provides concrete conclusions, even of a historical nature, as sufficient detail is not available from the historic submitted data to calculate exactly the relevant income, relevant expenses and, hence, the breakeven result. We set out a non-exhaustive list of items (and the approach taken for the simulation) where judgment has been required in the absence of detailed financial reporting notes and explanations, preventing definitive conclusions. In addition, we highlight in bold those items that have been adjusted from the simulation included in last year’s report.
Relevant income – income transactions with related parties above fair value (no adjustments made for above fair-value contracts such as sponsorships except where an income item is defined as a donation, in which case it is excluded); excess proceeds on disposal of tangible fixed assets (replacement nature not known so profits and losses on disposal have all been considered in simulation); finance income (profit) (separation of interest revenue from foreign exchange gains/losses on non-monetary items not available, so all finance income/profits/losses considered in relevant income/expenses accordingly); non-monetary credits (existence not available, albeit upwards non-currency-related revaluations not normally expected, so no adjustments made); income from non-football operations (adjustments only made for incomes/expenses completely unrelated to the club, facilities or brand, information not available historically – therefore, other net non-operating income/expenses have been included in simulation as breakeven revenues/ expenses).
Relevant expenses (in addition to items and approach set out in relevant income paragraph) – finance costs and dividends (non-monetary nature of finance costs/losses not known so all finance costs/losses have been included in calculation, as have dividends which would be included within non-operating result); expense transactions with related parties below fair value (no information known and hence no upwards adjustments made in simulation); directly attributable youth development expenditure (detailed calculation necessary and financial disclosures of youth sector spending generally limited or non-existent so assumption included within simulation equivalent to 8% of total other relevant costs for clubs, with <€5m revenues and 4% of relevant expenses for clubs with revenues > €5m) (this calculation based on knowledge of youth sector spending gathered from information supplied for UEFA solidarity distributions and disclosure of youth expenditure within UEFA benchmarking templates of more than 200 clubs; where youth sector costs disclosed, then removed and replaced by standardised simulation assumption); expenditure on community development activities (rarely historically disclosed despite being central to the concept of social and community importance of football clubs – no adjustment made as considered within the 8/4% youth expenses adjustment); finance costs attributable to construction of tangible fixed assets (this type of finance rare due to low club financed stadium construction - nature of finance charges/losses not known from reported data so no adjustment made in simulation); depreciation/impairment of tangible fixed assets (adjustment made in full and excluded from relevant expenses); amortisation of non-player intangible fixed assets (adjustment made in full and excluded from relevant expenses); tax expense (assumed that all reported tax expenses relate to taxable income/profit and hence excluded from relevant expenses for purposes of simulation – nature of tax income not known and to apply consistency on recognition/ non-recognition in carrying forward of taxable losses, all reported tax incomes are assumed to be non-monetary and have not been included in simulation).
Other factors – impact of exchange rates (exchange rates used in simulation are the most common year-end rates for each country applied to all clubs in that country rather than the average monthly rate differentiating for each club); players under contract prior to 1 June 2010 (for first breakeven assessment period (FY2012) only, certain legacy costs arising on players will be considered – as this is not envisaged as an ongoing item and also as there are currently no figures for this, no adjustment has been made in the simulation); no other adjustments have been made in respect of “other factors”. Breakeven assessment – financial results from third year or positive results from fourth and fifth years have not been considered due to insufficient detail.
Club selection
Year data
SampleSize
2 Year 3 Year
ALL top division clubs
UCL/UEL qualifying clubs
UCL/UEL group stage clubs
650
225
79
156
16
3
494
209
76
Scope of simulation 2011/12 UCL & UEL clubs
2 year data
3 year data
Less than 2 years dataavailable (excluded)
7%5%
88%
HIGHLIGHTS INDEX

Breakeven result FY2008, FY2009 & FY2010 2011/12 UCL & UEL clubs
42%
34%
8%
13%
3%
Exempt
BE surplus
BE deficit €0m to €5m (within AD)
BE deficit up to €45m(requires contributions)
BE deficit >�€45m (break even not fulfilled)
Complete Terminology Abbreviation
Financial Fair Play FFP
Break-Even BE
Club Financial Control Panel CFCP
Relevant Income RI
Relevant Expenses RE
Acceptable Deviation AD
Financial Fair Play Terminology
Sample
Break-even historic (2 or 3year) assessment
Exempt
RI & RE <€5m
BE surplus BE deficit €0 to 5m(within AD)
BE deficit >€45m(break-even not
fulfilled)
BE deficit up to €45m
(requires contributions)
RI and/or RE >€5m
Within thescope
All top division clubs
UCL/UEL qualifying clubs
UCL/UEL group stage clubs
344
95
2
306
130
77
179
77
44
60
18
9
54
29
19
13
6
5
53%
42%
3%
47%
58%
97%
28%
34%
56%
9%
8%
11%
8%
13%
24%
2%
3%
6%
BENCHMARKING REPORT FY10PREPARING FOR FINANCIAL FAIR PLAY
114
48. How are clubs currently doing on the breakeven rule?Q:Q
For this year’s simulation we have assessed the individual results of 650 clubs (top row in tables), the majority of which we have assessed using three years of data, FY2008, FY2009 and FY2010. The charts and tables provide figures covering three financial years, since all breakeven assessments (apart from the first one in 2013/14) will eventually cover three financial years. While the second row, detailing the results of 225 of the 236 clubs which qualified for the 2011/12 UEFA club competitions, is perhaps the most relevant indication of the scope and number of clubs that will be assessed, the composition of UEFA participating clubs today and in 2013/14 is likely to vary considerably, hence the reason for looking at the full sample of top division clubs as well. The third row further narrows the selection down to the clubs which qualified for the group stages of the 2011/12 UEFA Champions League and UEFA Europa League (all 80 clubs). All charts relate to the clubs that qualified for the 2011/12 UEFA club competitions.
HIGHLIGHTS INDEX

115 BENCHMARKING REPORT FY10 - PREPARING FOR FINANCIAL FAIR PLAY
Answer: 48The table and charts indicate that 42% of the clubs in this year’s UEFA competitions would have been exempt from the breakeven requirements, but only two of the clubs that reached the knockout stage. The chart indicates that on this historic basis, even in the non-financial fair play environment, 84% of clubs competing in UEFA club competitions would either be exempt or definitely satisfy the breakeven criteria.
In this year’s simulation covering FY2008, FY2009 and FY2010, six of the clubs participating in the UEFA Champions League or UEFA Europa League reported cumulative breakeven deficits in excess of €45m. This number is lower than last year’s simulation mainly due to the mix of clubs that qualified for the two seasons’ competitions as the total number of top division clubs (including those not in this season’s UEFA Champions League and UEFA Europa League) reporting cumulative three year deficits in excess of €45m has increased to thirteen clubs*.
In this year’s simulation, a further 29 qualifying clubs reported cumulative breakeven losses of between €5m and €45m, necessitating equity investments/recapitalisation before the year-end of up to €40m. The total of 29 clubs, represents a significant increase on the 22 competing clubs that would have required capitalisation in the simulation performed last year (based on FY2008 and FY2009) and this negative trend reflects the worsening financial results, in particular the reduced transfer profits, rather than a change in the mix of clubs playing in UEFA competitions. When equity contributions are taken into account in this year’s simulation, sufficient equity contributions were recorded in 12 of the 29 clubs during the period and, hence, the breakeven requirements would have been satisfied.
While the two years between the last simulation period data and the period to be assessed under financial fair play seems like a long time, the average player contract and commercial cycle mean clubs need to assess the future impact of their contract agreements as these will almost certainly (unless a player is subsequently sold before the breakeven assessment) impact on the FY2012 and FY2013 financial results.
The map provides an indication of the scope and reach of the break-even rule by highlighting in orange the countries which had one or more clubs with simulated break-even deficits of more than €5m between financial years 2008-10. If these pre-financial fair play results were replicated in the future and these clubs qualified for UEFA club competitions, then these 67 clubs from 22 countries would either not fulfil the break-even result (13 clubs) or require contributions from equity participants and/or related parties covering their deficit (54 clubs). During the period 2008-10 twenty of the 54 clubs did receive sufficient equity contributions, which means the other 34 would be added to the 13 clubs above €45m to give a total of 47* clubs that did not satisfy the break-even criteria.
3-year break-even result
All clubs BE surplusor exempt
One or more clubs BE deficit >€5m (requires contributions)
All clubs exempt
12x
22x
19x
Footnote: * If we had performed a like for like simulation (just two years rather than three) the number of all clubs (including clubs not competing in UEFA club competitions) with a break even deficit of over €45m has increased from 8 clubs to 10 clubs whilst the number of clubs with a break even deficit of over €45m competing in UEFA competitions has decreased from 7 clubs to 5 clubs. The number of UEFA competing clubs in excess of the acceptable deviation and hence requiring recapitalisation has increased from 22 clubs to 34.
HIGHLIGHTS INDEX

BENCHMARKING REPORT FY10PREPARING FOR FINANCIAL FAIR PLAY
116
49. How many clubs would currently be required to prepare updated figures?Q:Q
The new requirements introduced in the UEFA Club Licensing and Financial Fair Play Regulations go beyond the breakeven rule and enhanced payables rules to also take a forward-looking approach. The requirements set out in Article 64 extend beyond the minimum future financial information historically required under club licensing to include a post-season financial forecast update, and require a plan for future compliance with the breakeven requirements and the requisite information for this calculation.
Once again, the method is a risk-based approach using a series of indicators and some additional discretionary ratios to help the Club Financial Control Panel assess risks and put recent financial fair play performance into context. Those clubs self-sustained by their operations and not triggering indicators will neither have to provide budgeted information nor have to provide current-year financial information.
Sample
Requirement for current breakeven data and updated/new forecasts (indicator = requires; ratio = may require)
Numberof clubs
Indicator 2 Indicator 3 Ratio 2Indicator 4 Ratio 1Indicator 1
One ofindicatorsbreached
Goingconcern
Worse negativeequity
Wages >70%revenue
Overduepayables
Net debt >100% revenues
BE deficit in one or both years
All top division clubs
UCL/UEL qualifying clubs
UCL/UEL group stage clubs
585
225
79
62
23
8
149
56
22
181
85
51
29
31
11
296
125
56
230
82
31
92
47
19
100%
100%
100%
11%
10%
10%
25%
25%
28%
31%
38%
65%
5%
13%
14%
51%
56%
71%
39%
36%
39%
16%
21%
24%
Answer: 49In total, 51% of European clubs (296 out of 585*) breached at least one indicator including 31 clubs which were deemed to have triggered the overdue payables indicator and hence required to provide additional information to the panel with regards to transfer and/or employee balances during 2011.
Looking just at the clubs that qualified for this year’s UEFA club competitions (2011/12), that figure was slightly higher, at 56% (125 out of 225), which would mean (if the results were repeated in future) that the 100 clubs competing in this year’s UEFA Champions League and UEFA Europa League which did not breach any indicator would be exempted from providing any current breakeven data and from providing updated future financial information, underlining the risk-based approach of financial fair play. The majority of clubs breaching indicators breached just one indicator, but there were 13 clubs that breached three or four indicators in the simulation.
2011/12 club licensing decisions - by licensor
No indicators breached
One indicator breached
Two indicators breached
Three indicators breached
All four indicators breached
44%
32%
18%
5%
1%
Simulation - number of indicator breaches by 2011/12 UCL & UEL clubs
Footnote: * For the indicator simulation, a reduced sample size of 585 clubs has been used, comprising only clubs that provided the latest FY2010 financial figures and at least two years of financial figures from the last three years. The going-concern indicator is based purely on the year-end financial statements and does not include any review of audit opinion for interim financial statements. The breakeven deficit indicator is based on the same calculations and assumptions as those applied in the previous breakeven Q&A and excludes clubs that fall outside the scope of needing to provide full breakeven data on the basis of size (Article 57(2)). The overdue payables is based on the assessment made on 30 June 2011 and corresponds to those clubs with payables necessitating further information (e.g. indicator 4 breach) rather than those clubs which were ultimately penalised.
HIGHLIGHTS INDEX

117 BENCHMARKING REPORT FY10 - PREPARING FOR FINANCIAL FAIR PLAY
50. What financial reporting dates do clubs use?Q:Q
This is not part of the simulation exercise but it, nonetheless, is relevant for the consideration of financial fair play since the financial year-end timing impacts on information delivery* and assessments.
As would be expected, the position has not changed much from FY2009, with only three clubs** changing their financial reporting date during 2010. The majority of clubs have a 31 December financial year-end and this includes all CIS and Baltic clubs. As the second pie chart indicates, a small majority (52%) of clubs have a financial year-end that does not match their sporting season, although all clubs that play during summer and finish just before winter have a matching 30 November or 31 December year-end. Over a period of years, the date of financial closing makes little difference to the aggregate financial results, although it is necessary to know a club’s financial year-end in order to predict the impact that sporting performance and transfer activity will have on a particular set of financial statements.
Answer: 5031 December is the most common financial year-end, used by 67% of top division clubs, including all CIS and Baltic clubs, followed by 30 June, used by 24% of clubs.
The financial year-end is consistent for all top division clubs in 39 countries. Different year-ends occur in Belgium, Cyprus, Czech Republic, Denmark, England, Germany, Italy, Liechtenstein, Northern Ireland, Scotland, Switzerland, Slovakia, Turkey and Wales***.
The end effect is that 52% of clubs do not have their sporting and financial seasons aligned; in other words, the financial figures reflect part of two sporting seasons.
Among the “top” clubs with revenue > €50m, 17 of 73 clubs had December financial year-ends.
0
4
8
12
16
20
EN
G
GE
R
ES
P
ITA
FR
A
RU
S
TUR
N
ED
S
CO
P
OR
U
KR
B
EL
SU
I A
UT
DE
N
GR
E
NO
R
SW
E
PO
L IS
R
RO
U
KA
Z
CZ
E
CY
P
BLR
S
VK
C
RO
H
UN
S
RB
S
VN
FI
N
BU
L LI
E
IRL
MD
A
AZ
E
NIR
IS
L LV
A
LTU
B
IH
LUX
M
NE
FR
O
GE
O
MK
D
WA
L E
ST
MLT
A
RM
A
ND
A
LB
SM
R
Financial year-ends of European clubs
April May June July November December
Footnotes: * Club licensing requires up-to-date financial information. If the financial year-end is less than six months from the date of the next licence assessment, then the requirement to provide interim financial statements is waived. ** These were one English and two Italian clubs.
*** In the cases of England, Scotland and Wales, the financial year ends in different months but all close in a summer month.
Financial year-end FY2010
December
November
July
June
May
April
67%4%1%
24%
4%0%
Financial and sporting year-ends
Winter financial year-end & summer sporting year-end
Winter financial year-end & sporting year-end
Summer financial year-end & sporting year-end
Summer financial year-end & winter sporting year-end
67%
4%
24%
4%
0%
52%
29%
19%
HIGHLIGHTS INDEX

BENCHMARKING REPORT FY10APPENDICES
118
Appendices
HIGHLIGHTS INDEX

119 BENCHMARKING REPORT FY10 - APPENDICESHIGHLIGHTS INDEX

BENCHMARKING REPORT FY10APPENDICES
120
APPENDIX: Attendance data
Leagueaverage
2010s - 2010/11w attendance
NAEstimated
totalattendance
Largest clubaverage
attendance
Leagueaverage
last seasonGERENGESPITAFRANEDSCORUSSUITURPORUKRBELPOLNORAUTDENSWEGREROUISRCZEKAZCYPHUNSRBALB
42,66535,29428,22124,30619,74219,29613,67012,25011,36511,01310,0809,2258,7208,4968,1177,9537,0496,5476,4245,0224,6024,4924,1373,3442,5682,4532,349
42,50034,15128,28624,95720,08919,60813,92012,51711,05910,03410,9018,9438,6805,2478,9567,8738,3137,9287,6174,9024,2334,8953,7673,0882,9202,3902,917
13,055,59213,411,72010,723,790
9,236,3757,501,9985,904,6953,116,7602,939,9402,045,7723,369,9042,419,0952,214,1052,616,0012,039,0701,948,1251,431,5221,395,7461,571,3701,541,8651,535,8651,270,1431,078,080
794,288728,978616,365588,675460,454
79,15175,10979,26859,69751,08147,31648,97823,45029,04431,16838,14633,89721,00018,63516,91115,82517,32515,19422,09911,05912,148
8,6656,8889,6115,233
13,2506,738
Leagueaverage
2010s - 2010/11w attendance
NAEstimated
totalattendance
Largest clubaverage
attendance
Leagueaverage
last seasonBLRAZESVKFINCROBULIRLBIHMKDISLSVNGEONIRMDALTUMNEARMFROLVALUXWALLIEANDESTMLTSMRTOTAL
2,3022,2992,2512,2251,9911,8831,6121,5631,3341,2051,2001,110
887759701610575487465387339316200160n/a
8,887
2,6611,8712,4172,3892,0251,8342,0432,303
7571,029
848743917917880
1,048614400448461276n/an/a188n/a
9,136
455,697441,472445,679404,924477,900451,875290,124375,060262,700159,115216,036199,746202,260207,141105,906120,786
64,40065,69862,83870,10465,1365,000
16,00028,782
130,373
100,881,045
4,53010,1884,1233,6586,9334,0843,9184,1676,2061,9233,5893,4331,8632,0681,2871,3591,196
8951,2711,026
797n/an/a289n/a
17,667
APPENDIX: GDP & Club revenue growth data
GDPCAGR06-10
UEFANA
Club revenueCAGR06-10
Comments
ALBANDARMAUTAZEBELBIHBLRBULCROCYPCZEDENENGESPESTFINFRAFROGEOGERGREHUNIRLISLISRITA
5.1%1.2%1.3%1.0%
12.3%0.8%2.4%7.1%1.7%
-0.1%1.7%1.6%
-0.7%-0.3%0.1%
-2.9%0.2%0.2%0.0%4.1%0.6%
-0.4%-1.0%-1.8%-0.9%3.7%
-1.0%
GDP CAGR growth 06-08
GDP CAGR growth 06-09
-7.6%22.6%
8.7%4.3%
15.9%7.1%
27.8%19.7%14.4%
4.4%12.3%-4.2%11.1%13.1%
9.1%-0.8%5.3%4.2%
16.5%3.0%8.3%
15.6%23.1%
0.9%29.8%
3.9%4.4%
GDPCAGR06-10
UEFANA
Club revenueCAGR06-10
Comments
KAZLIELTULUXLVAMDAMKDMLTMNENEDNIRNORPOLPORROURUSSCOSMRSRBSUISVKSVNSWETURUKRWAL
5.1%1.0%
-0.6%1.9%
-3.7%2.8%2.6%1.4%3.1%0.9%
-0.3%0.6%4.3%0.3%1.7%2.3%
-0.3%1.8%2.7%1.5%2.6%0.8%0.6%2.2%
-0.6%-0.3%
GDP CAGR growth 06-09
GDP CAGR growth 06-09
Revenue/GDP growth 06-08
26.6%8.9%
-18.1%5.9%1.6%
66.1%33.6%10.0%11.1%
4.1%17.9%
9.2%10.8%
9.7%31.3%
5.9%-0.3%12.0%78.2%11.8%
6.7%5.9%4.9%
27.6%36.7%
5.1%
HIGHLIGHTS INDEX

121 BENCHMARKING REPORT FY10 - APPENDICES
APPENDIX: Transfer analysis ratios and results
Key figures or ratios
Profit on player sales
Amortisation charge
Impairment charge
Total transfer sales
Total transfer purchases
Transfer yield
Asset cover
Player turnover
% written down
Player mark-up
Calculation
Sale price less net book value in balance sheet
Figure from profit and loss statement
Figure from profit and loss statement
Net profit on sale plus net book value in balance sheet
Gross value from notes to financial statements
Profit on transfers / total gross value of transfer fees
Balance sheet value of player assets / annual depreciation charge
Accumulated depreciation on players sold/ original cost of players sold
Net book value / original cost of players in balance sheet
Gross value of transfer fees / original cost of players sold
FY2010
€1,456m
€2,330m
€59m
€2,236m**
€3,368m
65%
2.37
60%
50%
1.13
(€1,566m)*
(€2,126m)
(€3,251m)
FY2009
€1,810m
€2,218m
€66m
€2,540m**
€3,182m
71%
2.40
65%
55%
1.18
(€1,916m)*
(€2,434m)
(€3,063m)
Footnotes: * These figures include income or costs of transfers from clubs that do not capitalise their players in their balance sheets.** Ratios in both years exclude figures from Slovakian clubs and certain ratios exclude Polish and Hungarian clubs. Proportion of European transfer activity of these countries less than 0.5% based on balance sheet values so exclusion not significant. In addition UEFA have simulated some missing detailed FY2009 gross additions (part Russia, Portugal, Greece & Switzerland) and gross disposals (German, French, part Russia, Portugal, Greece & Switzerland) data based on submitted net data and country ratio’s for FY2010.
APPENDIX: FY2010 Exchange rates used
Mostcommonyear end
NACommon or
differentyear end
Currency
ALBANDARMAUTAZEBELBIHBLRBULCROCYPCZEDENENGESPESTFINFRAFROGEOGERGREHUNIRLISLISRITA
DecDecDec
JuneDec
JuneDecDecDecDecDecDecDec
JuneJuneDecNov
JuneDecDec
JuneJuneDecNovDecDec
June
LEK€DRAM€MANAT€MARKBYRLEVKUNA€KRONERKRONEGBP€KROON€€KRONELARI€€FORINT€KRONASHEKEL€
CommonCommonCommonCommonCommon
VariousCommonCommonCommonCommon
VariousVariousVariousVarious
CommonCommon
VariousCommonCommonCommonCommonCommonCommonCommonCommonCommon
Various
Mostcommonyear end
NA
KAZLIELTULUXLVAMDAMKDMLTMNENEDNIRNORPOLPORROURUSSCOSMRSRBSUISVKSVNSWETURUKRWAL
DecDecDecDecDecDecDecMayDec
JuneJuneDecDec
JuneDecDec
JuneDecDec
JuneDecDecDecDecDecDec
FY2010
0.00741.00000.00211.00000.94641.00000.51180.00030.51190.13581.00000.03960.13421.23481.00000.06391.00001.00000.13420.42571.00001.00000.00361.00000.00650.21271.0000
Common ordifferentyear end
Currency
TENGECHFLITAS€LATSLEUDENAR€€€GBPKRONERZLOTY€LEUROUBLEGBP€DINARCHF€€SEKLIRAHRYVNIAGBP
CommonVarious
CommonCommonCommonCommonCommonCommonCommonCommon
VariousCommonCommonCommonCommonCommon
VariousCommonCommon
VariousVarious
CommonCommon
VariousCommon
Various
FY2010
0.00510.75510.29001.00001.41380.06330.01621.00001.00001.00001.23480.12800.25231.00000.23400.02471.23481.00000.00950.75511.00001.00000.11120.48600.09601.16751.0000
HIGHLIGHTS INDEX

BENCHMARKING REPORT FY10APPENDICES
122
APPENDIX: Data sources and abbreviations
HIGHLIGHTS INDEX
Data sources
Unless otherwise stated in the report footnotes or elaborated further underneath in this appendix, the financial figures used in the review have been taken directly from figures submitted by clubs within the club licensing cycle covering the UEFA club competition season 2011/12. These figures refer to the financial year ending in 2010, in most cases 31 December 2010. The figures have been extracted from financial statements prepared either using national accounting practices or International Financial Reporting Standards and audited according to International Auditing Standards. The licensor in each country has extracted figures from the submitted financial statements and completed a standardised template issued by the UEFA club licensing unit.
With the exception of checking the fundamental soundness of the information and getting brief descriptions of major items, UEFA has not sought to verify the figures provided by the licensors to the source financial statements or get more detailed explanations as to survey responses.
Financial statement disclosures and accounting policies and interpretations of these policies differ tremendously within and between countries. This makes the comparison of financial data extremely challenging and hence the use of a standardised template to improve comparisons. The definition of items in this template takes into account the following: (a) A minimum level of financial disclosure is specifically included in the UEFA Club Licensing and Financial Fair Play Regulations and hence should be available for all clubs, this forms the base for template; (b) To this base is added some additional financial disclosures, beyond the UEFA defined minimum and hence available in some but not all cases, which are considered relevant and able to increase transparency (e.g. split of personnel costs between playing staff and other staff and also between social charges and base remuneration; split of income source between UEFA and national competitions; split of investing cash flows between player transfer payments/receipts and longer term fixed asset investments or sales); (c) From year to year template changes are kept to a minimum as licensors get used to the template and also to assist with year on year comparisons; (d) A limit is placed on the level of detail included in the template to stop the exercise becoming too time consuming for licensors.
Financial data covers the audited financial statements of financial year 2010 with the exception of three non licensed Spanish clubs (Almeria, Gijon & Malaga) for which data was sourced from the Professor Gay report and covers FY2009 and Portsmouth, where figures sourced from non audited creditors report (annualised 9 month figures for profit and loss account and balance sheet as at 26th Feb 2010).
Financial periods cover 12 months with the exception of: Livorno & Atalanta (6 months due to change in year-end); Birmingham (10 months due to change in year-end), and; Israeli clubs data is annualised 7 month interim data.
Underlying source of financial analysis
Standardised 2011 UEFA template: Rationale
Exceptions
Licensing Q&As – Data extracted from the list of licensing decisions submitted by the 53 national associations to UEFA.
League structures and trends – taken from uefa.com.
Attendances and trends - Website http://www.european-football-statistics.co.uk/attn.htm verified in some cases by licensors and by UEFA databases.
UEFA coefficients – taken from UEFA databases.
Home grown and youth players – data for UEFA competitions taken from UEFA databases. Data covering clubs that competed in UEFA competitions but relating to domestic competitions sourced from the PFPO Neuchatel as part of a cooperation project.
Youth competition data – UEFA databases.
Head coach migration and profiles - compiled from www.transfermarkt.de and verified in some cases to survey of national associations undertaken in 2011 by UEFA’s football development unit.
Head coach qualifications – Data extracted from the list of licensing decisions submitted by the 53 national associations to UEFA.
Club Licensing and Financial Fair Play
Competition Profile of European Club Football
Long-Term Investment: youth and head coaching
Financial Profile of European Club Football:
Income;
Costs & Profitability;
Assets, Debts & Cashflows;
Preparing for Financial Fair Play
The submitted data covering 665 clubs was used to make extrapolations for the remaining 68 European top division clubs. The general approach was to use the average income of smaller clubs from each division (excluding the 4 largest income clubs) to calculate the estimated Europe-wide total and the peer groups. This best but not perfect approach reflects the fact that the missing clubs not included in data submission are always the lower ranked clubs and usually these also have lower finances, an assumption validated by many countries which submitted financial figures in conjunction with finishing league position.
The year-on-year income and cost growth prepared using FY2009 data restated to FY2010 rates (appendix table) rather than the rates applicable at end of FY2009. Although in some cases the actual average income may differ, the Europe-wide total is unlikely to differ by more than +/-1% as the estimations are for smaller clubs. In addition the composition of the division peer groups should also be accurate.
Explanation of sources
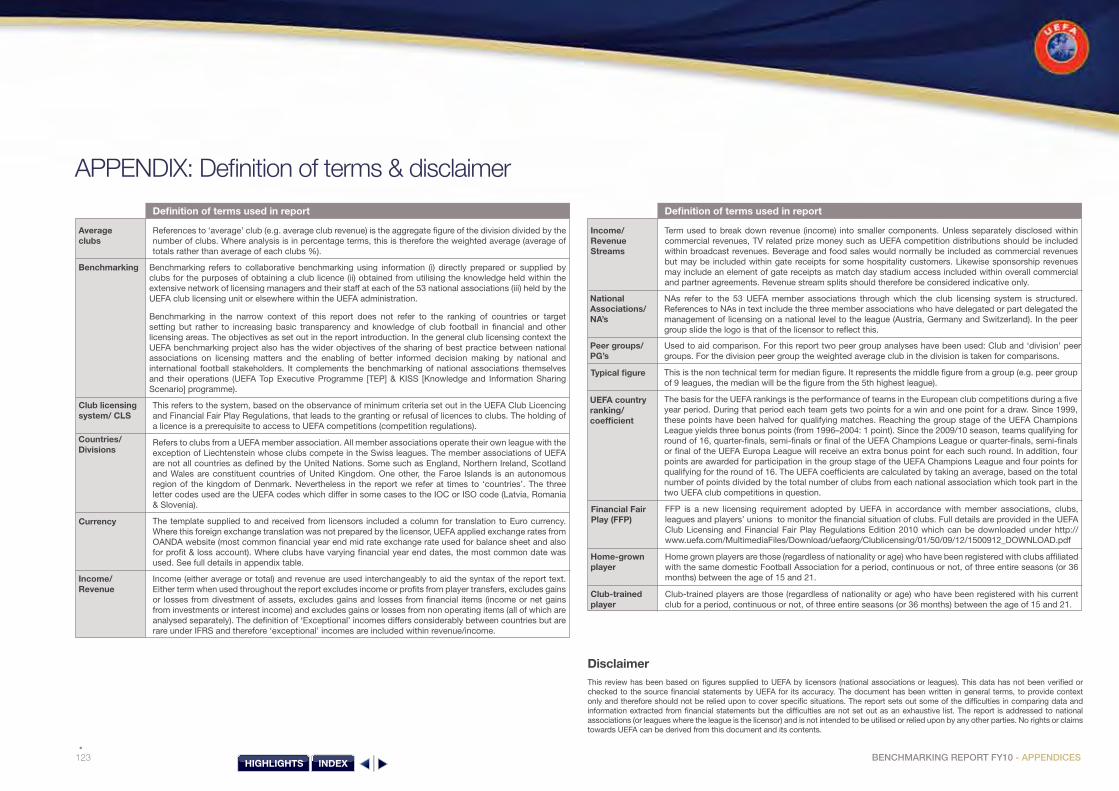
123 BENCHMARKING REPORT FY10 - APPENDICES
APPENDIX: Definition of terms & disclaimer
DisclaimerThis review has been based on figures supplied to UEFA by licensors (national associations or leagues). This data has not been verified or checked to the source financial statements by UEFA for its accuracy. The document has been written in general terms, to provide context only and therefore should not be relied upon to cover specific situations. The report sets out some of the difficulties in comparing data and information extracted from financial statements but the difficulties are not set out as an exhaustive list. The report is addressed to national associations (or leagues where the league is the licensor) and is not intended to be utilised or relied upon by any other parties. No rights or claims towards UEFA can be derived from this document and its contents.
HIGHLIGHTS INDEX
References to ‘average’ club (e.g. average club revenue) is the aggregate figure of the division divided by the number of clubs. Where analysis is in percentage terms, this is therefore the weighted average (average of totals rather than average of each clubs %).
Benchmarking refers to collaborative benchmarking using information (i) directly prepared or supplied by clubs for the purposes of obtaining a club licence (ii) obtained from utilising the knowledge held within the extensive network of licensing managers and their staff at each of the 53 national associations (iii) held by the UEFA club licensing unit or elsewhere within the UEFA administration.
Benchmarking in the narrow context of this report does not refer to the ranking of countries or target setting but rather to increasing basic transparency and knowledge of club football in financial and other licensing areas. The objectives as set out in the report introduction. In the general club licensing context the UEFA benchmarking project also has the wider objectives of the sharing of best practice between national associations on licensing matters and the enabling of better informed decision making by national and international football stakeholders. It complements the benchmarking of national associations themselves and their operations (UEFA Top Executive Programme [TEP] & KISS [Knowledge and Information Sharing Scenario] programme).
This refers to the system, based on the observance of minimum criteria set out in the UEFA Club Licencing and Financial Fair Play Regulations, that leads to the granting or refusal of licences to clubs. The holding of a licence is a prerequisite to access to UEFA competitions (competition regulations).
Average clubs
Benchmarking
Club licensing system/ CLS
Countries/ Divisions
Refers to clubs from a UEFA member association. All member associations operate their own league with the exception of Liechtenstein whose clubs compete in the Swiss leagues. The member associations of UEFA are not all countries as defined by the United Nations. Some such as England, Northern Ireland, Scotland and Wales are constituent countries of United Kingdom. One other, the Faroe Islands is an autonomous region of the kingdom of Denmark. Nevertheless in the report we refer at times to ‘countries’. The three letter codes used are the UEFA codes which differ in some cases to the IOC or ISO code (Latvia, Romania & Slovenia).
Definition of terms used in report
The template supplied to and received from licensors included a column for translation to Euro currency. Where this foreign exchange translation was not prepared by the licensor, UEFA applied exchange rates from OANDA website (most common financial year end mid rate exchange rate used for balance sheet and also for profit & loss account). Where clubs have varying financial year end dates, the most common date was used. See full details in appendix table.
Income (either average or total) and revenue are used interchangeably to aid the syntax of the report text. Either term when used throughout the report excludes income or profits from player transfers, excludes gains or losses from divestment of assets, excludes gains and losses from financial items (income or net gains from investments or interest income) and excludes gains or losses from non operating items (all of which are analysed separately). The definition of ‘Exceptional’ incomes differs considerably between countries but are rare under IFRS and therefore ‘exceptional’ incomes are included within revenue/income.
Term used to break down revenue (income) into smaller components. Unless separately disclosed within commercial revenues, TV related prize money such as UEFA competition distributions should be included within broadcast revenues. Beverage and food sales would normally be included as commercial revenues but may be included within gate receipts for some hospitality customers. Likewise sponsorship revenues may include an element of gate receipts as match day stadium access included within overall commercial and partner agreements. Revenue stream splits should therefore be considered indicative only.
Currency
Income/ Revenue
NAs refer to the 53 UEFA member associations through which the club licensing system is structured. References to NAs in text include the three member associations who have delegated or part delegated the management of licensing on a national level to the league (Austria, Germany and Switzerland). In the peer group slide the logo is that of the licensor to reflect this.
Used to aid comparison. For this report two peer group analyses have been used: Club and ‘division’ peer groups. For the division peer group the weighted average club in the division is taken for comparisons.
This is the non technical term for median figure. It represents the middle figure from a group (e.g. peer group of 9 leagues, the median will be the figure from the 5th highest league).
National Associations/NA’s
Peer groups/ PG’s
Typical figure
UEFA country ranking/ coefficient
The basis for the UEFA rankings is the performance of teams in the European club competitions during a five year period. During that period each team gets two points for a win and one point for a draw. Since 1999, these points have been halved for qualifying matches. Reaching the group stage of the UEFA Champions League yields three bonus points (from 1996–2004: 1 point). Since the 2009/10 season, teams qualifying for round of 16, quarter-finals, semi-finals or final of the UEFA Champions League or quarter-finals, semi-finals or final of the UEFA Europa League will receive an extra bonus point for each such round. In addition, four points are awarded for participation in the group stage of the UEFA Champions League and four points for qualifying for the round of 16. The UEFA coefficients are calculated by taking an average, based on the total number of points divided by the total number of clubs from each national association which took part in the two UEFA club competitions in question.
Definition of terms used in report
FFP is a new licensing requirement adopted by UEFA in accordance with member associations, clubs, leagues and players’ unions to monitor the financial situation of clubs. Full details are provided in the UEFA Club Licensing and Financial Fair Play Regulations Edition 2010 which can be downloaded under http://www.uefa.com/MultimediaFiles/Download/uefaorg/Clublicensing/01/50/09/12/1500912_DOWNLOAD.pdf
Financial Fair Play (FFP)
Club-trained player
Home-grown player
Home grown players are those (regardless of nationality or age) who have been registered with clubs affiliated with the same domestic Football Association for a period, continuous or not, of three entire seasons (or 36 months) between the age of 15 and 21.
Club-trained players are those (regardless of nationality or age) who have been registered with his current club for a period, continuous or not, of three entire seasons (or 36 months) between the age of 15 and 21.
Income/Revenue Streams

The European Club Footballing LandscapeCLUB LICENSING BENCHMARKING REPORT FINANCIAL YEAR 2010
The Europ
ean Club
Footballing Land
scape - C
LUB
LICE
NS
ING
BE
NC
HM
AR
KIN
G R
EP
OR
T FINA
NC
IAL Y
EA
R 2010
© UEFA 2011 All rights reserved.
UEFARoute de Genève 46CH-1260 Nyon 2SwitzerlandTelephone +41 848 00 27 27Telefax +41 848 01 27 27
ProductionUEFA
Authors Sefton Perry and Stephanie Leach
ContributorsMattias Grafström and Céline Bailo
Acknowledgements and special thanksThe club licensing network, in particular finance officers and licensing managers who submitted data and the UEFA Language Services.
EnquiriesEnquiries and comments to be addressed to Sefton Perry at [email protected]
Related Documents