FOOLPROOF COMPLETIONS FOR HIGH RATE PRODUCTION WELLS A Thesis by SLAVKO TOSIC Submitted to the Office of Graduate Studies of Texas A&M University in partial fulfillment of the requirements for the degree of MASTER OF SCIENCE December 2007 Major Subject: Petroleum Engineering

Welcome message from author
This document is posted to help you gain knowledge. Please leave a comment to let me know what you think about it! Share it to your friends and learn new things together.
Transcript
FOOLPROOF COMPLETIONS FOR HIGH RATE PRODUCTION WELLS
A Thesis
by
SLAVKO TOSIC
Submitted to the Office of Graduate Studies of Texas A&M University
in partial fulfillment of the requirements for the degree of
MASTER OF SCIENCE
December 2007
Major Subject: Petroleum Engineering
FOOLPROOF COMPLETIONS FOR HIGH RATE PRODUCTION WELLS
A Thesis
by
SLAVKO TOSIC
Submitted to the Office of Graduate Studies of Texas A&M University
in partial fulfillment of the requirements for the degree of
MASTER OF SCIENCE
Approved by:
Chair of Committee, Christine A. Ehlig-Economides Committee Member, Maria Barrufet Peter P. Valko Head of Department, Stephen A. Holditch
December 2007
Major Subject: Petroleum Engineering

iii
ABSTRACT
Foolproof Completions for High Rate Production Wells. (December 2007)
Slavko Tosic, B.S., University of Belgrade
Chair of Advisory Committee: Dr. Christine A. Ehlig-Economides
Operators, especially those managing production from deepwater reservoirs, are striving to produce
hydrocarbons at higher and higher rates without exposing the wells to completion failure risk. To avoid
screen failures, recent studies have favored gravel pack (GP) and high rate water pack (HRWP)
completions over high-permeability fracturing (HPF), known in the vernacular as a frac&pack (FP) for
very high rate wells. While a properly designed GP completion may prevent sand production, it does not
stop formation fines migration, and, over time, fines accumulation in the GP will lead to increasing
completion skin. Although, and not always, the skin can be removed by acidizing, it is not practical to
perform repeated acid treatments on deepwater wells, particularly those with subsea wellheads, and the
alternative has been to subject the completion to increasingly high drawdown, accepting a high skin effect.
A far better solution is to use a HPF completion. Of course the execution of a successful HPF is not a
trivial exercise, and frequently, there is a steep learning curve for such a practice.
This work explains the importance to HPF completions of the well trajectory through the interval to be
hydraulically fractured, for production, not execution, reasons. A new model quantifies the effect of the
well inclination on the connectivity between the fracture and the well via perforations. Guidelines based
on the maximum target production rate, including forecasts of multiphase flow, are provided to size the
HPF completion to avoid common completion failures that may result from high fluid rate and/or fines
movement. Skin model will be developed for both vertical and deviated wells. Once the HPF is properly
designed and executed, the operators should end up with a long term low skin good completion quality
well. The well will be safely produced at the maximum flow rates, with no need for well surveillance and
monitoring.

iv
ACKNOWLEDGMENTS
I would like to express deep gratitude to Dr. Christine Economides for always challenging me and
encouraging me throughout my academic studies at Texas A&M. Dr. Economides’ continuous support
and patient guidance during the thesis writing process have significantly helped me to complete this work.
Dr. Economides always made sure I stayed on track during the research and writing stages and her
continuous support and involvement are greatly admired and appreciated.
She also introduced me to the fascinating world of Pressure Transient Analysis that I continuingly apply in
both academic and professional settings. This is an area that I will further explore throughout my career.
Many thanks to Dr. Michael Economides for great discussions and our collaboration on this work. His
fascinating engineering knowledge has been a great resource to me during this project.
I would like to thank Randy Harbaugh for introducing me to this topic while working together on the deep
water well projects in the Gulf of Mexico. Randy encouraged me to explore this topic.
v
TABLE OF CONTENTS
Page
ABSTRACT ......................................................................................................................................... iii
ACKNOWLEDGMENTS.................................................................................................................... iv
TABLE OF CONTENTS ..................................................................................................................... v
LIST OF FIGURES.............................................................................................................................. vii
CHAPTER
I INTRODUCTION ............................................................................................................ 1
1.1 Research Problem............................................................................................ 1 1.2 Research Objectives ........................................................................................ 2 1.3 Previous Work................................................................................................. 2 1.4 Summary ......................................................................................................... 8
II COMPARISON BETWEEN IDEAL GRAVEL PACK AND HIGH PERMEABILITY FRACTURE COMPLETIONS........................................................... 9
2.1 Preliminary Discussion.................................................................................... 9 2.2 Gravel Pack and High Rate Water Pack Completions..................................... 9 2.3 High Permeability Fracture Completions ........................................................ 11 2.4 Formation Face Flow Velocity Comparison for Ideal GP and HPF
Completions .................................................................................................... 12 2.5 Skin Comparison for Ideal GO and HPF Completions ................................... 17 2.6 Completion Failure Mechanisms..................................................................... 21 2.7 Chapter Summary............................................................................................ 23
III WELL TRAJECTORY AND GEOLOGY IMPORTANCE (IMPACT) TO HPF COMPLETIONS............................................................................................................... 25
3.1 Preliminary Discussion.................................................................................... 25 3.2 Production from a Fractured Deviated Well.................................................... 26 3.3 Estimating the Skin for a High Permeability Fracture in a Deviated
Wellbore.......................................................................................................... 30 3.4 Potential for Screen Erosion for a HPF Well in a Deviated Wellbore............. 31 3.5 HPF in Dipping Reservoirs ............................................................................. 33 3.6 Should OHGP Be Recommended in High Rate Gas Wells? ........................... 33 3.7 Chapter Summary............................................................................................ 34
IV SUMMARY, CONCLUSIONS, AND RECOMMENDATIONS FOR FUTURE WORK .............................................................................................................................. 35
vi
Page
4.1 Summary and Conclusions ............................................................................. 35 4.2 Recommendations, Comments and Future Work............................................ 36
NOMENCLATURE............................................................................................................................. 37
REFERENCES..................................................................................................................................... 39
VITA ...................................................................................................................................................... 42
vii
LIST OF FIGURES
FIGURE Page
1.1 Schematic of typical fracture-to-well connection, 30 degree perforation phasing, 12
rows of holes, fracture half length=40ft, fracture width=0.2 ft, and shot patter for 7” casing, 12 SPF, 30 ° phasing (from Welling10) ............................................................................ 4
1.2 HRWP model, radial flow to all perforations (from Welling10)................................................... 4
1.3 Drawdown data and well failure from 200 wells database (from Tiffin et al.3)........................... 6
1.4 Completion components and flow schematics for cased-hole gravel packs (from Wong et al.1) ................................................................................................................................ 7
2.1 HPF completion flow geometry.................................................................. ……………………. 12 2.2 Halo effect interpretation (Modified Welling10 Figure) .............................. ……………………. 13
2.3 Comparison of gas production rates from non-fractured wells, wells with negative skin and fractured wells (from Wang et al.19) .............................................................................. 22
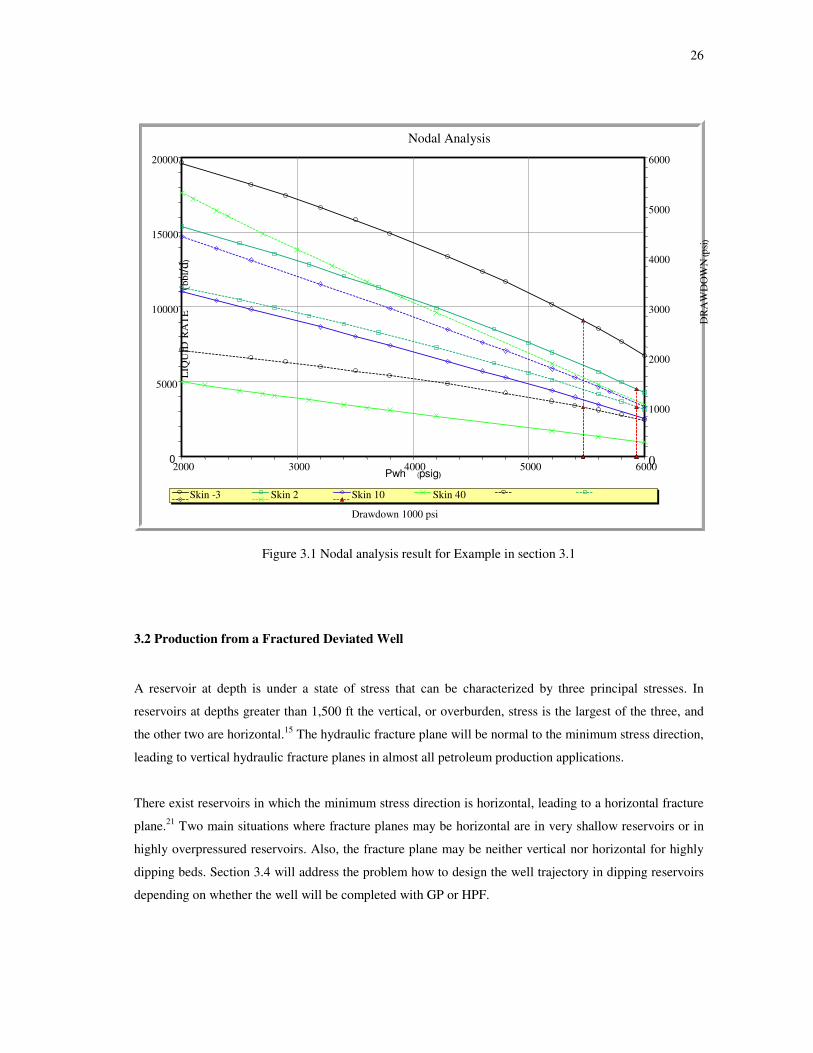
3.1 Nodal analysis result for Example in section 3.1 ......................................................................... 26
3.2 Twisted fracture aligned with the preferred direction (from Economides et al.20) ..................... 27
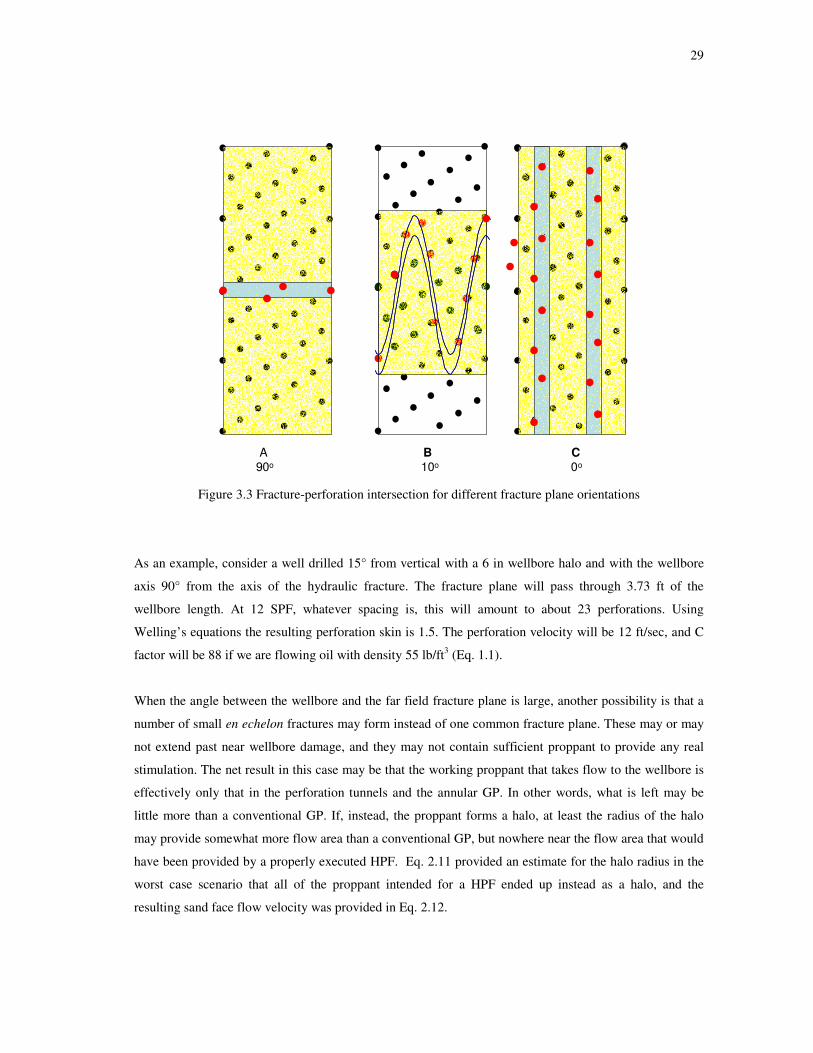
3.3 Fracture-perforation intersection for different fracture plane orientations .................................. 29
3.4 FP perforation skin and screen velocity for larger perforation densities, assuming 90o angle between wellbore and main fracture planes ....................................................................... 32

1
CHAPTER I
INTRODUCTION
1.1 Research Problem
In the last decade the need for downhole completion stability has became paramount. It is not uncommon
for a new deepwater completion to produce over 30,000 STBOPD or more than 100 MMSCFD from
reservoirs less than 100 ft thick. Typically high rate wells have high permeability and the formations
usually require sand control to avoid production of formation fines. Sand control is achieved either by GP
or FP, and today HRWP is a frequently used GP technology that ensures successful placement of the
gravel in perforation tunnels and the entire annulus between the GP screen and the well casing. Many GP
and FP wells have been lost, reportedly due to destabilization of the annular pack,1 erosion or collapse
of the gravel pack screen2, and/or formation compaction.3
The current emphasis in the literature is on controlling the well flow rate to avoid exceeding estimated
velocity or drawdown limits. This is a form of sand management when what is really needed is reliable
sand exclusion at target production rates. In general, deepwater reservoirs are capable of delivering high
rates with very little drawdown when the completion skin is less than or equal to zero, and the estimated
velocity or drawdown limits are highly dependent on the completion design and execution. The problem is
how to design a fool proof completion that can sustain target rates without failing.
_________________________
This thesis follows the style and format of the SPE Journal.

2
1.2 Research Objectives
Instead of focusing on determining the maximum rate at which a well can flow based on the velocity limit
calculation and well monitoring, a reactive approach that yields undesirable choices, the objective of this
work is to show how to design a high permeability fracture well completion that will ensure safe well
operation for the target design flow rate, and will not require considerable reservoir surveillance, if any.
Based on the reservoir, fluid, rock properties, and the reservoir geology, the indicated completion design
will ensure that the well is safely produced at the target flow rates. In this work special attention will be
paid to the angle between the well trajectory and the far field HPF plane orientation dictated by regional
stresses, and hence the connectivity of the fracture to the wellbore.
1.3 Previous Work
The industry has been focused more on clarification and solution of existing problems and their possible
causes, than on the root of the problem and its avoidance. Nearly all work related to this topic in the
literature was about the drawdown and downhole velocity guidelines for high rate well producers.
The fracture will initiate in the plane of the wellbore in response to drilling induced near wellbore stresses.
Then the fracture will turn in the span of a few wellbore radii to align normally to the minimum stress
direction.3 In this work the term fracture plane refers to the main fracture plane that is aligned with far
field or regional stresses.
Veeken et al.5 emphasized the importance of close alignment between the wellbore axis and the far field
fracture plane. Unless the well is deliberately drilled to align with the fracture plane, their experiments
showed that the well would have limited entry effects and reduced productivity due to poor
communication between the wellbore and the hydraulic fracture. They stated that communication between
the fracture and wellbore is determined by the orientation of wellbore and perforations with respect to the
in-situ stresses. There is also a possibility of forming of multiple fractures. Furthermore, they did a
combined theoretical and experimental study to investigate key parameters for well-to-fracture
connectivity. Their findings were compelling and highly relevant to this work even though their study
emphasized aspects of the hydraulic fracturing execution, while this study is focused on production
implications.
A key conclusion in the work by Veeken et al.5 was a recommendation that the wellbore trajectory be
drilled to align normal to minimum horizontal stress, either by drilling vertically through the productive

3
interval or by turning the inclined well to this alignment. Since then many operators and service providers
have rejected this advice for various reasons. Cleary, et al.6 have recommended pumping strategies that
tend to avoid multiple fractures. Also, many of the operators simply overlooked well trajectory importance
altogether.
Furgier et al.7 boast that they were able to place the fracture planes in highly deviated wells, as though that
were the sole objective, but they also report skins that are consistently well above zero. Furthermore,
Furgier et al.7 concluded that FP completions are common practice in 65° deviated wells and good
completion efficiency is achieved (mechanical skin less than 5). This paper is focused only on hydraulic
fracture execution and does not indicate the production rates at which the wells have been flowed, or
whether the wells must be monitored to avoid completion failures.
Behrmann et al.8 concluded that fractures initially unaligned with the far field stress become aligned within
one wellbore diameter. They also stated that in order for fractures to initiate at a perforation and then to
extend, the perforation must be oriented at a small angle to the plane normal to the minimum far field
stress. Based on the testing that they performed this angle should be less than 10°.
Abass et al.9 listed possible causes of formation sand failure. They categorized sand formations that
potentially exhibit sand failure and sand production. They concluded that a short conductive fracture
alleviates formation sand failure and sand production. In most cases the formation sand failure is caused
by poor completion (e.g. excessive drawdown, high flow velocity). Although formation sand failure is not
by itself a completion failure, it greatly impacts the completion stability. Destabilization of the near
wellbore region results in fines movement leading to gravel pack plugging, skin increase, and well
productivity loss.
By estimating an average skin for various completion strategies, Welling10 recommended the best
completion practices based on the reservoir permeability. Claiming that only a few perforations per foot
may have to carry all of the flow from the fracture in the FP case, or from the reservoir in the GP case,
Welling10 concluded that the HRWP and open hole gravel pack (OHGP) completions are preferred if the
reservoir permeability is above 900 md for oil or 600 md for natural gas. This decision was based on
calculation of an average normalized pressure drop of 257 psi for HRWP wells compared to 322 psi for
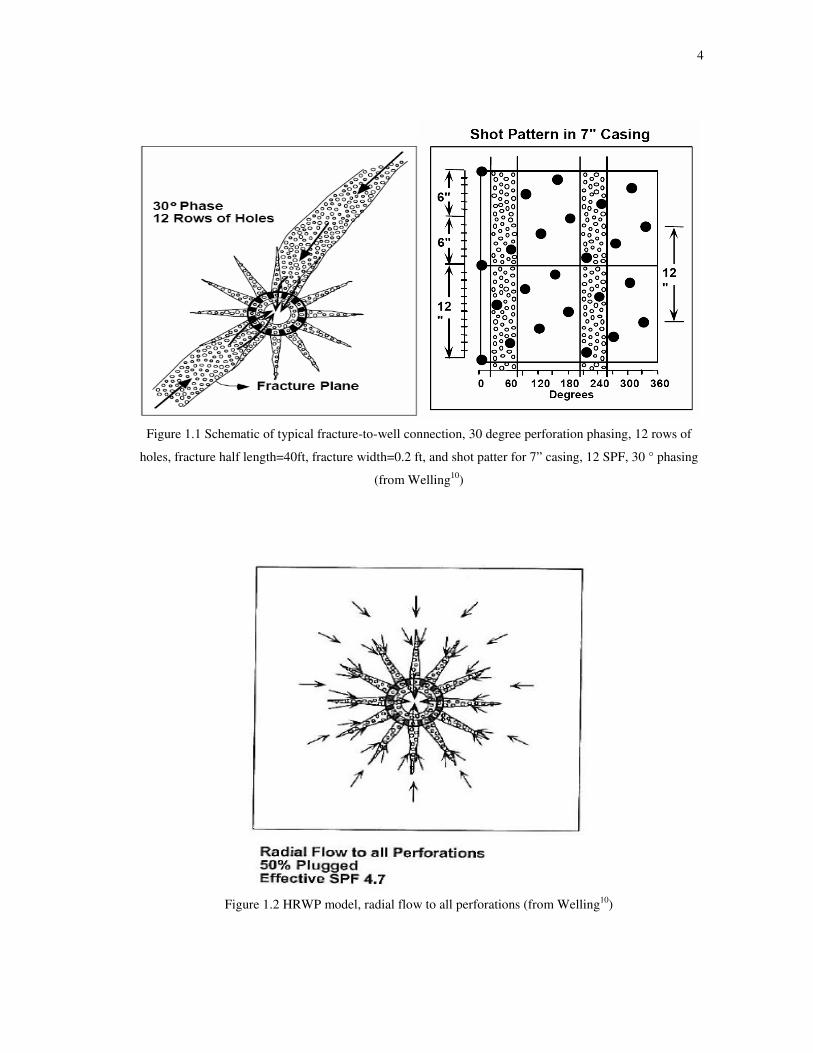
the FP oil wells. Fig. 1.1 (from Welling10) shows the typical fracture-to-well connection. Welling10 stated
that the field matches showed that in general 0.7 to 2.3 shot per foot (SPF) are in connection with the
fracture. Fig. 1.2 (from Welling10) shows the HRWP with radial flow to all perforations providing on
average 5 SPF.
4
Figure 1.1 Schematic of typical fracture-to-well connection, 30 degree perforation phasing, 12 rows of
holes, fracture half length=40ft, fracture width=0.2 ft, and shot patter for 7” casing, 12 SPF, 30 ° phasing
(from Welling10)
Figure 1.2 HRWP model, radial flow to all perforations (from Welling10)

5
The following table summaries Welling10 completion selection for oil and gas wells, based on the reservoir
permeability, k, and the gas rate, Q, for gas wells.
Table 1.1 Optimum completion ranges for varying reservoir permeabilities and flow rates
FP OHGP HRWP
Oil Wells k<900 md k>900 md
Gas Wells
(Q <200 MSCFD)
k<300 md k>300 md
Gas Wells
(Q >200 MSCFD)
k<200 md k>200 md
Gas Wells
(Q >500 MSCFD)
k<150 md k>600 md k>150 md
Tiffin et al.3 moved from the “old school” drawdown guidelines to downhole velocity limits across the
annulus packed area, and the screen. The Tiffin et al.3 work focused on case studies of failed completions
and what remedial or surveillance action should have been taken. This paper detailed a method for
determining maximum safe production rates for sand control wells. The method was developed from a
thorough compilation of data from over 200 sand control wells. The authors offered a simple method to
optimize and safely operate sand control wells (cased-hole FP and cased-hole GP completions) based on a
function of flux through the screen. The flux definition in this case, and in this work, is defined as a
volumetric rate per unit area of screen. Furthermore, the authors3 stated that too high a rate results in an
unacceptable well failure rate and too low a rate results in lost production.
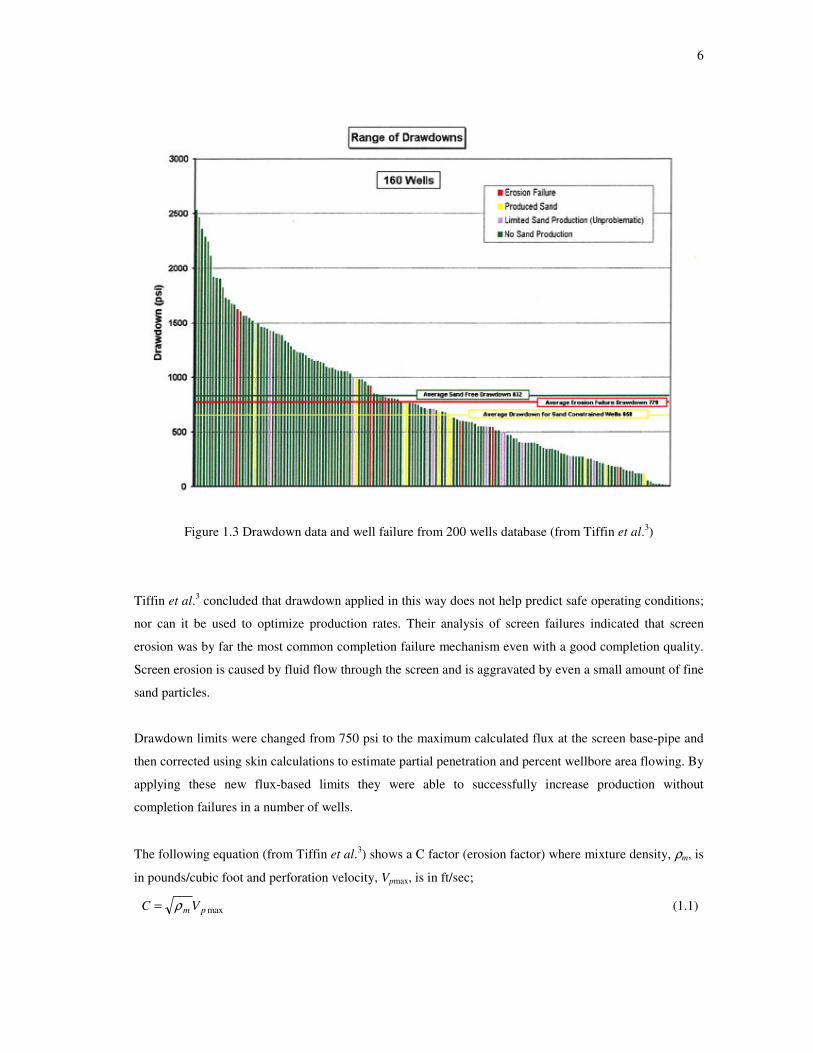
Fig. 1.3 (from Tiffin et al.3) is a valuable input for this work. It shows a database of 160 wells. The
selected wells were pre screened and only the wells with good completion quality were selected. From this
figure it can be seen that drawdown does not correlate with the well failure. Some wells had a drawdown
of 2,500 psi and did not fail, while the other failed with a drawdown of only 250 psi.
6
Figure 1.3 Drawdown data and well failure from 200 wells database (from Tiffin et al.3)
Tiffin et al.3 concluded that drawdown applied in this way does not help predict safe operating conditions;
nor can it be used to optimize production rates. Their analysis of screen failures indicated that screen
erosion was by far the most common completion failure mechanism even with a good completion quality.
Screen erosion is caused by fluid flow through the screen and is aggravated by even a small amount of fine
sand particles.
Drawdown limits were changed from 750 psi to the maximum calculated flux at the screen base-pipe and
then corrected using skin calculations to estimate partial penetration and percent wellbore area flowing. By
applying these new flux-based limits they were able to successfully increase production without
completion failures in a number of wells.
The following equation (from Tiffin et al.3) shows a C factor (erosion factor) where mixture density, ρm, is
in pounds/cubic foot and perforation velocity, Vpmax, is in ft/sec;
maxpm VC ρ= (1.1)
7
Mixture density is obtained by weighting each phase density by its volume percent of flow. The resulting
C factor is basically the square root of the kinetic energy of the fluids that carry sand into the screen.
Tiffin et al.3 indicated that downhole fluid flow rates are relatively easy to determine from the surface
rates, but that many assumptions are required to calculate the actual area of the screen taking most of the
fluid flow. They therefore concluded that it is not realistically possible to analytically calculate flux
through a downhole screen, and advocated instead use of a sand detector to warn of any sand production
and a downhole pressure gauge and well test analysis to monitor the flux directly.
Wong et al.1 presented their work at the same time as Tiffin et al.3. Their work is based on the same
approach as Tiffin et al.3, but they provided more elaboration on the flux calculation method. The
proposed well surveillance method was fully developed for cased-hole GP and FP completions assuming
the gravel-filled perforations dominate flow within the completion. Their well surveillance method
monitors downhole flowing velocity and completion pressure drop to operate the well without introducing
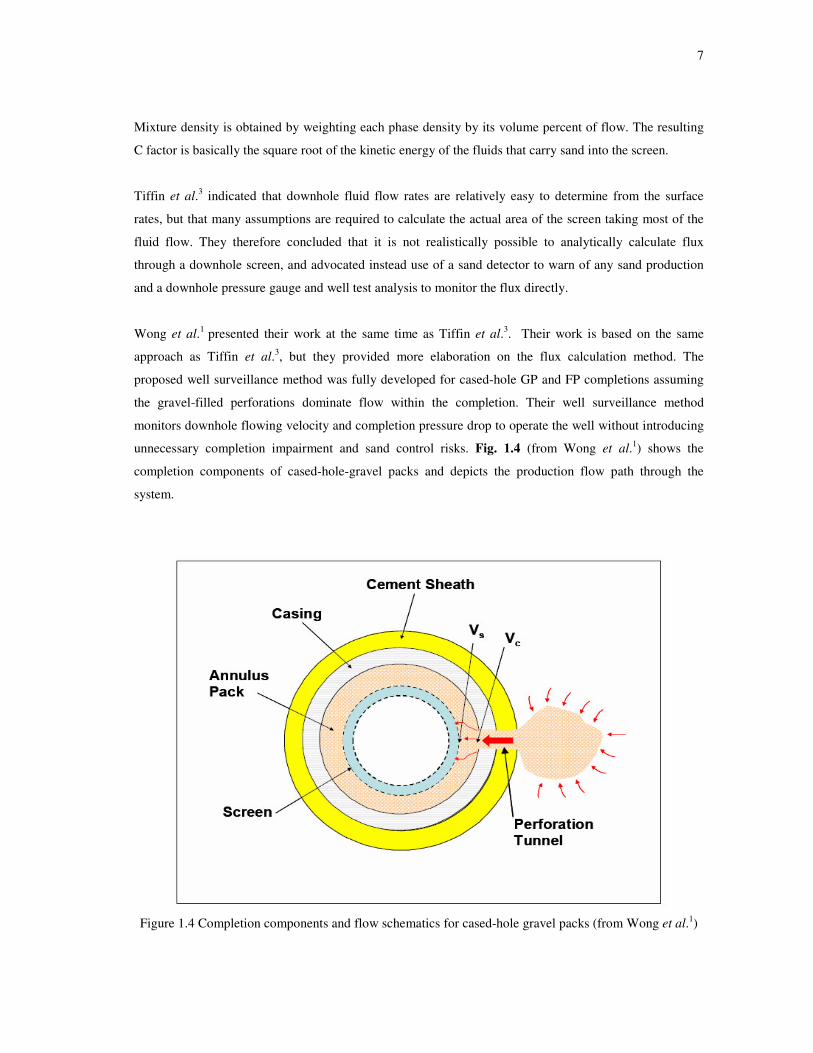
unnecessary completion impairment and sand control risks. Fig. 1.4 (from Wong et al.1) shows the
completion components of cased-hole-gravel packs and depicts the production flow path through the
system.
Figure 1.4 Completion components and flow schematics for cased-hole gravel packs (from Wong et al.1)

8
Fig. 1.4 illustrates the highest flowing velocity is through the perforations where the flow converges. The
average flowing velocity exiting the perforation at the casing inside diameter (ID) is labeled as Vc, and the
flowing velocity on the screen surface directly across the perforation is labeled as Vs. Wong et al.1 stated
that the destabilization of the annular pack is an instability failure that occurs when the perforation
velocity at the casing ID (Vc) is high enough to “fluidize” the granular pack in the annular region around
the perforations. They recommended a conservative maximum velocity limit of 10 ft/sec to avoid
destabilization of the annular pack, and 1 ft/sec for a maximum velocity to avoid screen erosion. Although
the Wong et al.1 study was about GP and FP completions only, in this work the approach for computing Vc
can be considered for HPF as well. Wong et al.1 then calculated downhole flowing velocity with a realistic
completion model that describes the flow in the dominant failure mode. However, these computations are
not straightforward tasks, numerous assumptions are needed, the result and outcome are almost always
subjective, and they depend on the empirical data. It is though true that the industry does not have many
choices. For the existing wells they can either use a flux surveillance method based on the velocities over
different areas, or they can apply “old school” drawdown practices. The flux surveillance method is useful
to predict whether and where fines will be moving. It is useful also for estimating the theoretical skin.
Keck et al.11 mentioned that they measured mechanical skin from build-ups in Na Kika wells in deepwater
Gulf of Mexico (GOM), but here the meaning of mechanical skin is the total skin determined from
pressure transient analysis (PTA), not a component of the total skin. While well “productivity quality”
could be measured by skin, the well completion quality requires more (especially completion hardware).
For these wells, a low skin factor did not always guarantee a good completion, and vice versa. Keck et
al.11 mentioned that the well deviation for Na Kika wells had no correlation with skin. Moreover, they
mentioned that the well failure generally could not be correlated with the skin.
1.4 Summary
The eight studies mentioned in this introduction all focus on modern sand exclusion completion practices,
but each ends with suboptimal recommendations. Welling10 looked only at inclined wells and concluded
that because OHGP completions will have the most perforations taking the flow from the reservoir to the
wellbore this should be the completion choice for highest rate wells. Tiffin et al.3 developed a flux criteria
for determining the safe well production rate based on the flow velocity through perforation tunnels. Wong
et al.1 spelled out the way to compute the flow velocity needed for the flux criteria. None of these studies
addresses a way to design a completion that avoids the need to monitor flux. This work will show that a
properly designed HPF is the best choice for high rate wells, and that it will maintain target rates through
the life of the well.

9
CHAPTER II
COMPARISON BETWEEN IDEAL GRAVEL PACK AND HIGH
PERMEABILITY FRACTURE COMPLETIONS
2.1 Preliminary Discussion
As the deepwater operations evolve, operators are trying to produce wells at maximum rates and achieve
payback in a minimum time. Many wells are still GP completed, and this is concerning as several authors
already demonstrated that GP is not an optimum choice by far. Dusterhoff et al.12 mentioned that the GP
wells inherently create the damage situation and thus lower the potential production in most instances.
Tiner et al.13 noted that one of the major production companies has estimated that over 50 % of their
production capability is lost through GP completions.
The flow geometries for GP and HPF wells are different and will cause different drawdown and different
flow velocity for the same flow rate. Also, the resulting skin in HPF wells should be negative while a GP
completion will always have positive skin. All of the above mentioned points will greatly impact the well
productivity index and overall well performance and completion stability. Clearly the lower skin will give
better well performance. Lower velocity at the annulus pack and the screen will have lower risks for well
failure. This chapter explains the fundamentals of different completion types and shows the skin and
velocity calculation for an ideal GP and HPF wells. The possible completion failure mechanisms will also
be addressed.
2.2 Gravel Pack and High Rate Water Pack Completions
The execution of a GP should be a straightforward process. In cased-hole well completions, gravel is
placed in the perforations and in the annular area between the screen and the casing. In OHGP completions
the gravel is placed between the screen and the open borehole. From the production point of view there
may be significant differences in the well performance for cased-hole and OHGP wells because flow into
the cased-hole gravel pack must pass through the perforations. To avoid creating a fracture during the GP
execution, the formation fracture gradient must not be exceeded.

10
The rationale for GP completions is to prevent production of fines into the well. Operators dealing with
subsea flowlines cannot tolerate even minimal fines production. Reasons include possibilities of fines
build up, erosion of subsea chokes and hardware, and in severe instances even flowline plugging. Complex
flow assurance will worsen these problems. Remediation of any of these problems would require an
expensive workover.
If there was a need for sand control in the first place, over time formation fines will gradually collect in the
GP and will cause an increasing pressure drop (skin) across the GP. The tendency for fines to accumulate
in perforation tunnels is dependent on drawdown and flux in the formation around the perforations.
Generally, a flow rate low enough to avoid fines movement into the perforations will be too low to be
economic. Therefore, gradual increase in skin over time is to be expected and is a sign of a successful and
necessary GP completion. Acid stimulation can dissolve accumulated fines in the GP and restore the well
productivity. However, acid treatments can be detrimental in reservoirs with zeolite content, and for this
reason they are not usually recommended for deepwater GOM reservoirs. Also, most of the wells in
deepwater GOM have wet trees where complex completion hardware making acid stimulation very
challenging and not always feasible.
It should be relevant to note that a successful GP filtering function begins at the perforation cavities. As
fines collect in the perforation cavities it is easy to see that this is the likely source of increasing GP skin.
However, perforation cavities do not plug uniformly, and over time fewer and fewer perforations may be
open to flow. Continued production at the same high flow rate will cause increasing flux across fewer
perforations as the completion skin increases. Excessive drawdown and/or flux can cause destabilization
of the annular pack or screen collapse.1 This happens when the pack is damaged over time causing the
expected increase in skin, but the operator continues to produce at high rate, causing failure due to
excessive drawdown. A critical element in a GP performance is a proper sizing of the gravel and a screen.
Even a perfect GP will accumulate fines over time, and remedial work is considered necessary.
Many problems in GP wells with excessive sand production, high skin, gravel plugging, and completion
failure motivated introduction of the high rate water pack (HRWP) completion method. HRWP
completions are GP completions packed at a high rate to ensure that gravel is placed in all of the
perforation tunnels, and all “debris” is pushed away in the reservoir. This is no small matter because
without high rate gravel placement, it is difficult to pack all the perforation tunnels, particularly in over
pressured formations, and those left unpacked will soon be plugged with fines once the well is put on
production. For this reason historically gravel packs had very high skins, and modern HRWP’s have much
lower skins. However, it has been commonly reported that over time well productivity declines in HRWP
11
completions.13 Therefore, remedial work is required for all GP completions, including HRWP’s. In the
case of subsea wells with wet trees the workover would cost in the range of 20 million USD, and as
already said, the procedure would not always be successful.
Based on the author’s information from different service companies, the number of acid jobs has fallen
drastically since the FP became a trend in GOM. This fact supports a conclusion that the even perfect GP
will plug over time and that FP’s do not accumulate fines.
2.3 High Permeability Fracture Completions
Originally FP’s were GP’s with fracture geometry. In a FP, a fracture plane is formed by injecting gravel
at pressures above the formation fracture gradient. Aggour14 stated that FP completions allow for more
complete zonal coverage which can be beneficial in laminated reservoirs and non-perforated zones.
High permeability fracturing (HPF) are generally FP completions employing a tip screenout (TSO) design
to control the fracture length and width, and using high conductivity proppant instead of gravel. Today, it
is understood that the fracture can be designed with a flow area large enough to keep the flow velocity at
the fracture face below the critical sand flow velocity. Therefore, instead of gravel pack material designed
to stop formation fines from flowing into the wellbore, high permeability proppant can be used to
maximize the fracture conductivity. As such, the term high permeability fracture is more descriptive of
modern hydraulic fractures in high permeability formations. The main distinction between the HPF and FP
wells is that FP in early times used gravel with grain sizes like what would be used in a gravel pack, and
HPF now uses high permeability proppant without concern for stopping formation fines. In effect, the
HPF is desirable as a means to eliminate sand production at high production rates.
The HPF is intended both to provide sand control and to extend past drilling and completion damage. If
this is not achieved then damage will not be bypassed and the well will have a higher skin. It has been
shown15 that when the fracture half length extends beyond the radial damage skin due to drilling mud
filtrate invasion or a certain type of completion fluids invasion, there will be no contribution from this
component to the overall HPF skin.
The flow geometry is different in GP and HPF wells. With a HPF well, reservoir fluids flow linearly to the
fracture plane, and from there to the wellbore in a slab of high permeability. Fig. 2.1 shows the inflow

12
geometry for the HPF completions. In contrast, flow to a GP or HRWP well is radial, as was shown in Fig.
1.2.
Figure 2.1 HPF completion flow geometry
Furthermore, there is very likely a radial zone of reduced permeability in high permeability reservoirs
(gray radial zone in Fig. 2.1). Radial flow to a GP must pass through this lower permeability zone, thereby
causing additional pressure drop or skin near the wellbore. In contrast, with sufficient half-length, flow
through the fracture bypasses the near wellbore radial skin.
Modern HPF should be based on unified fracture design (UFD).16 HPF execution in high permeability
reservoirs should employ the TSO procedure. TSO enables propagating the fracture to the design fracture
half length, and then inflating it to the designed conductivity. Field experience indicates that the TSO can
be difficult to model and detect.15 The problem is that an apparent TSO may be only a halo effect. The so-
called halo effect occurs when some of the proppant forms an annulus between the cement and the
formation, as diagrammed in Fig. 2.2 (red dots are perforations). What may happen instead is that most of
the injected proppant ends up in the halo, with little in the fracture, and unfortunately, this can appear to
show an injection history characteristic of TSO.17 The halo effect may be limited mainly to
unconsolidated formations, such as are common in the GOM.
2.4 Formation Face Flow Velocity Comparison for Ideal GP and HPF Completions
Fig. 1.2 shows the radial flow from the reservoir to the wellbore in GP and HRWP wells. The flow area at
the formation face is less than the area of a cylinder with radius equal to the wellbore radius and height
equal to the drilled length of the productive interval because in reality flow to the well is only through the
perforations. As it can be seen from Fig. 2.1 in HPF completions flow from the formation to the fracture
Damage zone

13
is linear. In this case the flow area is the product of four times the fracture half length times the fracture
height. Since the flow velocity is simply the flow rate over the flow area, it is obvious that the formation
flow velocity in HPF wells is much smaller than in GP wells.
Figure 2.2 Halo effect interpretation (Modified Welling10 Figure)
The following example will clarify the benefits of HPF completions. If we use a field example with a
perforated interval 100 ft thick, having 16 SPF, wellbore radius of 0.3 ft, with an average perforation
diameter of 1 in, and the perforation length of 1 ft, the total cylindrical perforation area would be 418.9 ft2
(Eq. 2.2). This example was extremely conservative assuming that all perforations were initiated and were
open for flow. In reality this will not be the case. Some of the shots will be misfired; some will not be
created, and some will get plugged. For the HPF completions the fracture face area will be completely
open for flow. If the fracture height is 90 ft and the fracture half length of 30 ft (typical for soft reservoirs),
the surface of the fracture flow would be 10,800 ft2 (Eq. 2.4). The outcome is compelling. The flow area
for HPF completion in this example is 25 times more than the flow area for GP or HRWP completions.
The velocity for GP or HRWP completions in this example will be higher for 25 times than for HPF
completions. Since this was an oil well making 10,000 STBOPD, the flow velocity for the HPF case
would be 0.00006 ft/sec, while for the GP or HRWP case the flow velocity would be 0.00155 ft/sec. For
14
this particular formation the core test reveled that the critical velocity to initiate fines movement is
0.00095 ft/sec. The flow velocity for HPF completions calculated above will not likely move any fines.
However, if this well was HRWP completion, with the same rate fines would have been moved. This
would mean that the well could not have been making 10,000 STBOPD without formation fines
movement.
The linear flow will cause much smaller pressure drop in the formation than the radial flow due to the
higher flow area for the linear flow. Also, by comparing Fig. 1.1 and Fig. 2.1 (radial vs. linear flow to the
wellbore) it is apparent that much less turbulence occurs in HPF wells than in GP wells because the HPF
avoids convergent radial flow. This is especially important for gas wells.
One of the most important objectives in HPF design is to determine what fracture half length will ensure
that the formation flow velocity opposite the fracture face will not exceed the velocity at which formation
fines would flow. The importance of the flux at the formation face is to determine whether formation fines
will move. Depending on the formation sand type (particularly sand mineralogy and sand consolidation)
different flow velocities are needed to initiate fines movement. Each reservoir has a unique flow rate at
which it starts migrating fines. The minimum required flow velocity for the fines movement can be
determined from a lab test. However, if fines move, they will be stopped by a properly designed GP,
probably in the perforations and thereby plugging them. The HPF can be designed to supply sufficient
flow area to ensure that the formation flux is never great enough to flow formation fines. In that case, the
HPF well will never be plugged over time. In fact, while the GP grain size distribution must ensure that
formation fines will not flow through the GP to the screen, the HPF proppant grain size distribution need
not stop the fines because they will never flow in the first place. Hence, modern HPF designs are using
very large proppant diameters without concern.
Flow velocity at the formation sand face for GP or HRWP wells will be;
GP
5
AqB106.5 −⋅=SFv (2.1)
where qB is the downhole flow rate in BOPD, and AGP is the flow area at the sand face in ft2. While in the
GP or HRWP completion the flow area is a cylindrical perforation area, in reality perforation tunnel is a
cone like area but for simplicity cylindrical area will be used in this work.
For GP and HRWP wells the flow area, AGP, will be;
SPFLrA ppGP π2= (2.2)
where rp is perforation radius, and Lp is the perforation length.
15
The function of the GP is to prevent the formation fines from flowing into the wellbore. However, this
velocity is expected to be large enough to flow formation fines into the GP, especially after water
breakthrough since the relative permabillites will be changed. This will mean that GP will be doing its job
and the formation fines are being moved and produced. Consequently, the completion skin will increase.
For HPF wells the flow velocity at the fracture face should always be lower than a critical flow velocity
for fines movement. To avoid formation fines movement and bypass near wellbore damage, the following
criteria should be applied for HPF wells:
1. The critical flux velocity for single phase liquid, vc,SF,, must be determined for the formation in
question. This velocity can be determined from the core lab test or based on the analog reservoirs.
The sand face velocity, vSF, must be less than the critical flux velocity;
SFcHPF
SF vA
qBv ,
5105.6 <⋅=−
(2.3)
where qB is the downhole flow rate in BOPD, and AHPF is the flow area of the fracture faces, which for
HPF wells is given by;
ffHPF hxA 4= (2.4)
where xf is fracture half length, and hf is fracture height.
2. The velocity at the fracture face is given by;
SFcff
SF vhx
qBv ,
5
4105.6 <⋅=
− (2.5)
3. The fracture half length must be longer that the radius of drilling and completion induced
damage, rd,;
fx dr> (2.6)
4. The fracture flow area, xfA, must be sufficient that the formation flux is less than what would
induce fines movement at the fracture face;
SFcfA hv
qBx
,
5
4105.6 −⋅> (2.7)
5. Given the target flow rate, q, the critical flux velocity inducing fines movement, and a margin of
error in the velocity of 2, and the minimum fracture half length should be the larger of the criteria
in Eq. 2.3and Eq. 2.4;
)2,max( fAdf xrx ≥ (2.8)
16
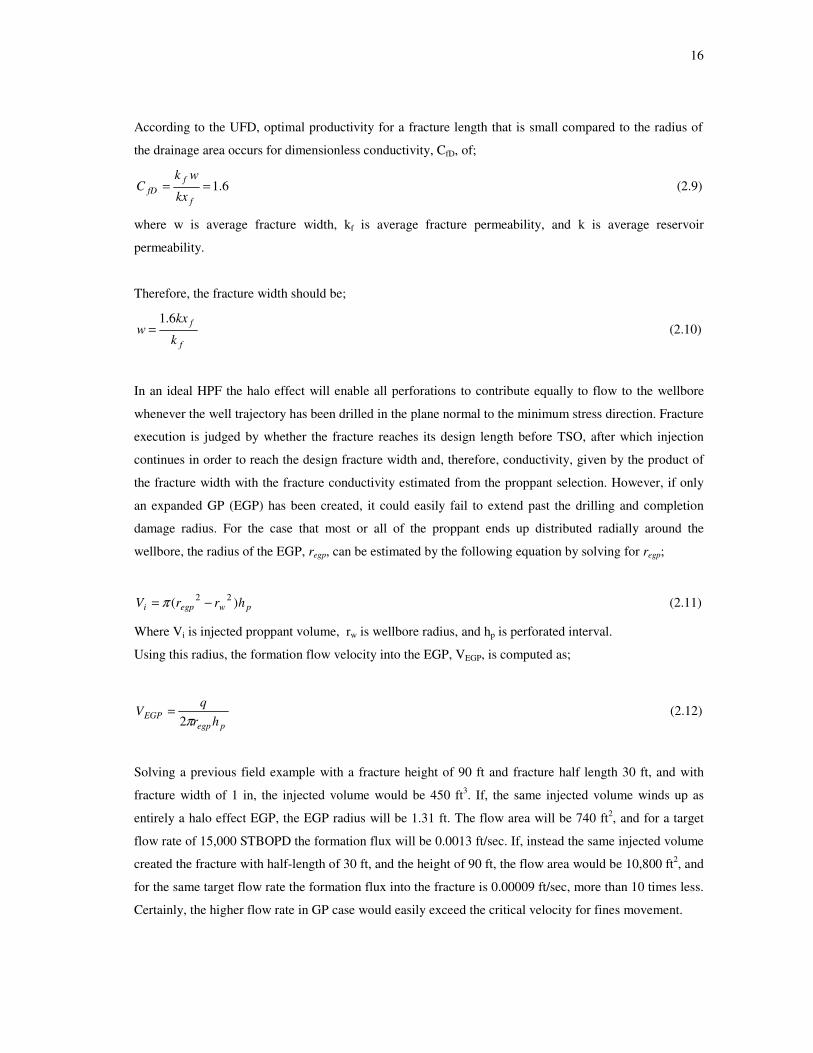
According to the UFD, optimal productivity for a fracture length that is small compared to the radius of
the drainage area occurs for dimensionless conductivity, CfD, of;
6.1==f
ffD kx
wkC (2.9)
where w is average fracture width, kf is average fracture permeability, and k is average reservoir
permeability.
Therefore, the fracture width should be;
f
f
k
kxw
6.1= (2.10)
In an ideal HPF the halo effect will enable all perforations to contribute equally to flow to the wellbore
whenever the well trajectory has been drilled in the plane normal to the minimum stress direction. Fracture
execution is judged by whether the fracture reaches its design length before TSO, after which injection
continues in order to reach the design fracture width and, therefore, conductivity, given by the product of
the fracture width with the fracture conductivity estimated from the proppant selection. However, if only
an expanded GP (EGP) has been created, it could easily fail to extend past the drilling and completion
damage radius. For the case that most or all of the proppant ends up distributed radially around the
wellbore, the radius of the EGP, regp, can be estimated by the following equation by solving for regp;
pwegpi hrrV )( 22 −= π (2.11)
Where Vi is injected proppant volume, rw is wellbore radius, and hp is perforated interval.
Using this radius, the formation flow velocity into the EGP, VEGP, is computed as;
pegpEGP hr
qV
π2= (2.12)
Solving a previous field example with a fracture height of 90 ft and fracture half length 30 ft, and with
fracture width of 1 in, the injected volume would be 450 ft3. If, the same injected volume winds up as
entirely a halo effect EGP, the EGP radius will be 1.31 ft. The flow area will be 740 ft2, and for a target
flow rate of 15,000 STBOPD the formation flux will be 0.0013 ft/sec. If, instead the same injected volume
created the fracture with half-length of 30 ft, and the height of 90 ft, the flow area would be 10,800 ft2, and
for the same target flow rate the formation flux into the fracture is 0.00009 ft/sec, more than 10 times less.
Certainly, the higher flow rate in GP case would easily exceed the critical velocity for fines movement.
17
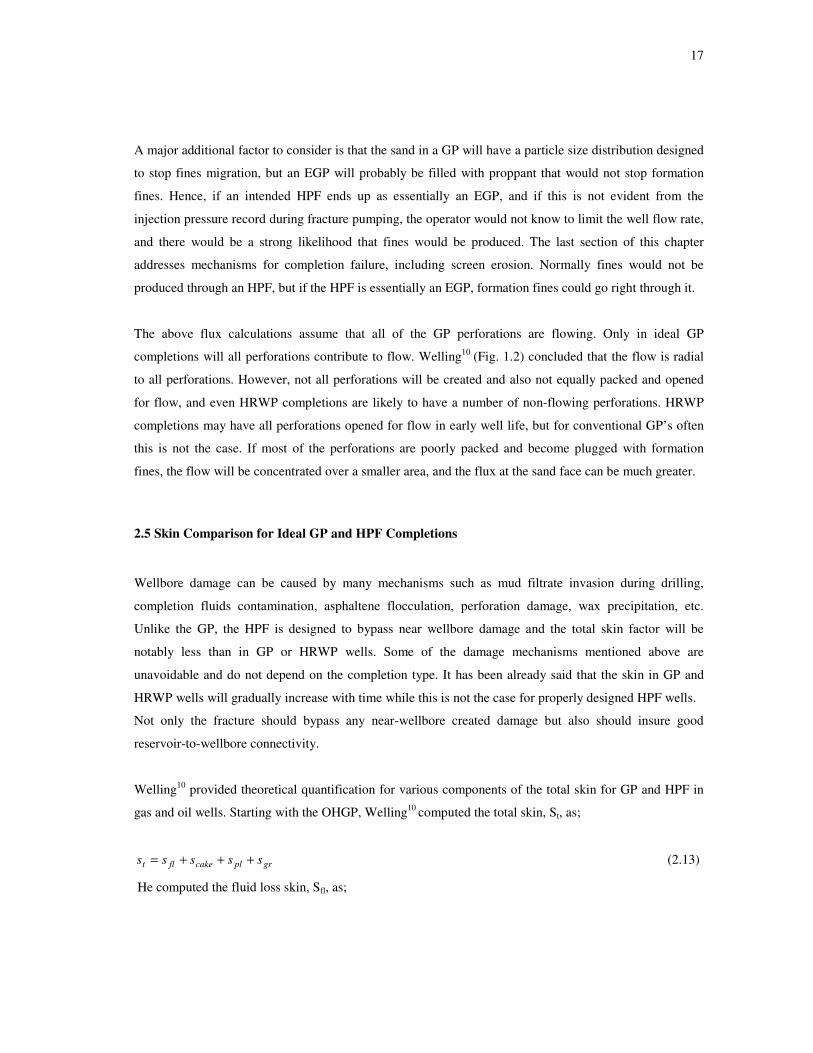
A major additional factor to consider is that the sand in a GP will have a particle size distribution designed
to stop fines migration, but an EGP will probably be filled with proppant that would not stop formation
fines. Hence, if an intended HPF ends up as essentially an EGP, and if this is not evident from the
injection pressure record during fracture pumping, the operator would not know to limit the well flow rate,
and there would be a strong likelihood that fines would be produced. The last section of this chapter
addresses mechanisms for completion failure, including screen erosion. Normally fines would not be
produced through an HPF, but if the HPF is essentially an EGP, formation fines could go right through it.
The above flux calculations assume that all of the GP perforations are flowing. Only in ideal GP
completions will all perforations contribute to flow. Welling10 (Fig. 1.2) concluded that the flow is radial
to all perforations. However, not all perforations will be created and also not equally packed and opened
for flow, and even HRWP completions are likely to have a number of non-flowing perforations. HRWP
completions may have all perforations opened for flow in early well life, but for conventional GP’s often
this is not the case. If most of the perforations are poorly packed and become plugged with formation
fines, the flow will be concentrated over a smaller area, and the flux at the sand face can be much greater.
2.5 Skin Comparison for Ideal GP and HPF Completions
Wellbore damage can be caused by many mechanisms such as mud filtrate invasion during drilling,
completion fluids contamination, asphaltene flocculation, perforation damage, wax precipitation, etc.
Unlike the GP, the HPF is designed to bypass near wellbore damage and the total skin factor will be
notably less than in GP or HRWP wells. Some of the damage mechanisms mentioned above are
unavoidable and do not depend on the completion type. It has been already said that the skin in GP and
HRWP wells will gradually increase with time while this is not the case for properly designed HPF wells.
Not only the fracture should bypass any near-wellbore created damage but also should insure good
reservoir-to-wellbore connectivity.
Welling10 provided theoretical quantification for various components of the total skin for GP and HPF in
gas and oil wells. Starting with the OHGP, Welling10 computed the total skin, St, as;
grplcakeflt sssss +++= (2.13)
He computed the fluid loss skin, Sfl, as;
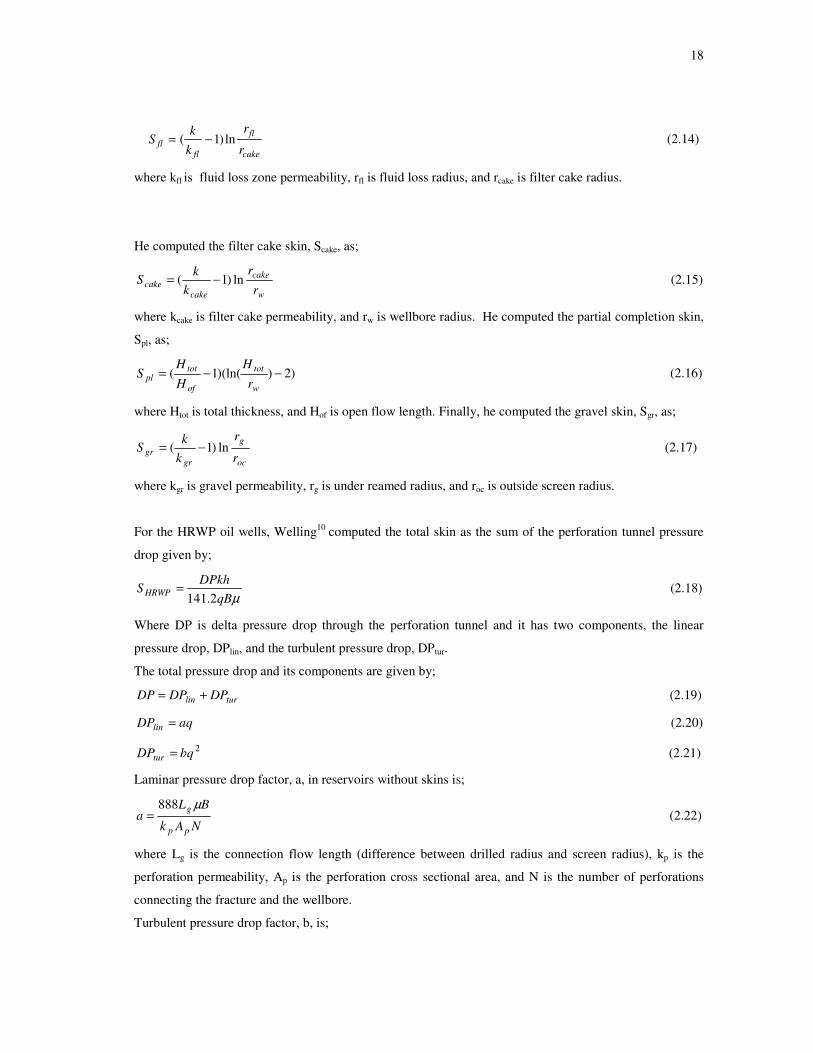
18
cake
fl
flfl r
r
kk
S ln)1( −= (2.14)
where kfl is fluid loss zone permeability, rfl is fluid loss radius, and rcake is filter cake radius.
He computed the filter cake skin, Scake, as;
w
cake
cakecake r
rk
kS ln)1( −= (2.15)
where kcake is filter cake permeability, and rw is wellbore radius. He computed the partial completion skin,
Spl, as;
)2))(ln(1( −−=w
tot
of
totpl r
HHH
S (2.16)
where Htot is total thickness, and Hof is open flow length. Finally, he computed the gravel skin, Sgr, as;
oc
g
grgr r
r
kk
S ln)1( −= (2.17)
where kgr is gravel permeability, rg is under reamed radius, and roc is outside screen radius.
For the HRWP oil wells, Welling10 computed the total skin as the sum of the perforation tunnel pressure
drop given by;
µqBDPkh
S HRWP 2.141= (2.18)
Where DP is delta pressure drop through the perforation tunnel and it has two components, the linear
pressure drop, DPlin, and the turbulent pressure drop, DPtur.
The total pressure drop and its components are given by;
turlin DPDPDP += (2.19)
aqDPlin = (2.20)
2bqDPtur = (2.21)
Laminar pressure drop factor, a, in reservoirs without skins is;
NAk
BLa
pp
g µ888= (2.22)
where Lg is the connection flow length (difference between drilled radius and screen radius), kp is the
perforation permeability, Ap is the perforation cross sectional area, and N is the number of perforations
connecting the fracture and the wellbore.
Turbulent pressure drop factor, b, is;

19
22
281008.9
NA
BLxb
p
mgg ρβ= (2.23)
where �goil is turbulence factor for gravel given by;
996.0
4105.6
k
xgoil =β (2.24)
Welling10 stated that the turbulence factor for gravel was determined by in-house lab measurement.
Welling10 computed the total skin for the HPF as the sum of the fracture skin and the perforation skin,
where the fracture skin, Sf, was computed as;
��
�
�
��
�
� +=
f
FDwf x
Crs
)2/1(ln (2.25)
The perforation skin, Sp, was computed as the sum of a laminar flow term and a turbulent flow term. With
negligible turbulent flow for single phase oil flow, the perforation skin is;
NAk
khLs
pp
gp
π2= (2.26)
The perforation skin for HPF well can be also computed using the same equations for HRWP wells.
Welling10 also provided skin equations for gas wells for all three completion geometries. For OHGP gas
wells the total skin is computed by using Eq. 2.13 and its components by using Eq.2.14 to Eq. 2.17.
For HRWP and HPF gas wells Welling10 used the same equations as for oil wells but for the linear and
turbulent pressure drop calculations he used different constants.
In the case of the GP, there is a good chance the radius of damage is greater than the radius of GP, rgp, or
even greater than the radius of EGP, regp, increasing further the overall GP skin. Welling10 did not account
for this skin component.
Neumann et al.17 in their study mentioned that the GP completions had disappointingly high skins even
using the best completion practices. Then they started using FP completions and the resulting skin was
much lower. They observed that a bad FP job was always better or, at least, as good as a good GP in
Campos Basin soft formations.
20
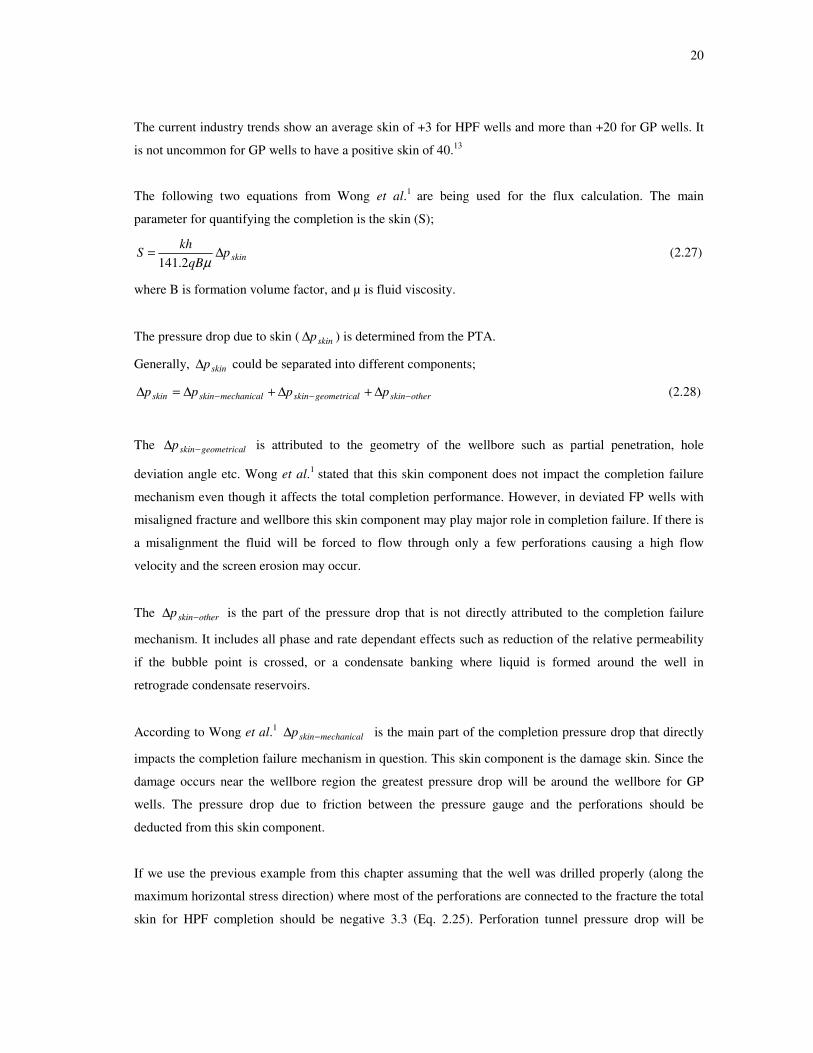
The current industry trends show an average skin of +3 for HPF wells and more than +20 for GP wells. It
is not uncommon for GP wells to have a positive skin of 40.13
The following two equations from Wong et al.1 are being used for the flux calculation. The main
parameter for quantifying the completion is the skin (S);
skinpqB
khS ∆=
µ2.141 (2.27)
where B is formation volume factor, and µ is fluid viscosity.
The pressure drop due to skin ( skinp∆ ) is determined from the PTA.
Generally, skinp∆ could be separated into different components;
otherskinlgeometricaskinmechanicalskinskin pppp −−− ∆+∆+∆=∆ (2.28)
The lgeometricaskinp −∆ is attributed to the geometry of the wellbore such as partial penetration, hole
deviation angle etc. Wong et al.1 stated that this skin component does not impact the completion failure
mechanism even though it affects the total completion performance. However, in deviated FP wells with
misaligned fracture and wellbore this skin component may play major role in completion failure. If there is
a misalignment the fluid will be forced to flow through only a few perforations causing a high flow
velocity and the screen erosion may occur.
The otherskinp −∆ is the part of the pressure drop that is not directly attributed to the completion failure
mechanism. It includes all phase and rate dependant effects such as reduction of the relative permeability
if the bubble point is crossed, or a condensate banking where liquid is formed around the well in
retrograde condensate reservoirs.
According to Wong et al.1 mechanicalskinp −∆ is the main part of the completion pressure drop that directly
impacts the completion failure mechanism in question. This skin component is the damage skin. Since the
damage occurs near the wellbore region the greatest pressure drop will be around the wellbore for GP
wells. The pressure drop due to friction between the pressure gauge and the perforations should be
deducted from this skin component.
If we use the previous example from this chapter assuming that the well was drilled properly (along the
maximum horizontal stress direction) where most of the perforations are connected to the fracture the total
skin for HPF completion should be negative 3.3 (Eq. 2.25). Perforation tunnel pressure drop will be

21
negligible if the perforation gravel permeability is not significantly reduced by some damage. The GP or
HRWP completion will have a skin as low as 3 (assuming all perforations are open for flow and well
packed) and as high as 30 if 10 percent of perforations are open for flow.
Clearly, the higher the formation flow velocity the faster and more fines movement. Consequently, GP and
HRWP wells will result in the skin increase over time, while HPF wells skin will remain the same over a
well life. As already mentioned the screen failure is caused by high fluid velocity and fines movement. Yet
again, HPF completions should not have any fines and hence the screen erosion should not occur.
One more advantage of FP completions is the occurrence of high turbulence for high rate gas wells. It is
not uncommon to have reservoirs with more than 200 STBOPD/ft or 1 MMSCFD/ft. With these high rates
the turbulence is dominant in the gas wells, and also in high rate oil wells. Wang et al.19 concluded that to
combat the strong turbulence that plagues high rate gas wells, extensive hydraulic fracturing is a must. If
the reservoir permeability is more than 5 md, turbulence overwhelms practically all other factors,
including damage. The turbulence effect is more pronounced in GP and HRWP wells than in HPF wells.
Fig. 2.3 is from Wang et al.19 work showing the fractured well (linear flow geometry to the wellbore) vs.
a radial flow (e.g. GP or HRWP). It is apparent that the radial flow GP geometry cannot compete with the
hydraulically fractured wells. Due to the difference in the reservoir vs. fracture conductivity, and the flow
geometry, the pressure drop is greater for the radial flow than for the linear flow. In the previous section
we already explained the downhole velocity difference for GP and FP completions.
2.6 Completion Failure Mechanisms
Completion failures can have detrimental consequences especially for subsea wells with expensive
hardware and workover. Small sand production can cause choke erosion and cutting, flowline plugging,
and in some instances environmental disaster can take place caused by fluid leak.
Completion failure mechanisms can be classified in two categories. The first and most frequently
occurring category is screen erosion caused by high flux. If the GP is properly designed and executed, the
screen should not erode, provided the well production rate does not exceed rate or drawdown limits that
can cause destabilization of the annular pack.

22
If we take a look at Eq. 1.1 it is clear that the erosion is dependant on the flow velocity and the flow
mixture density. This would mean that formation fines will aggravate the screen erosion process. For
cased hole GP’s the purpose of the screen is to hold the gravel pack, and the purpose of the GP is act as a
filter that stops fines migration. However, the GP must have as high permeability as possible to avoid
imposing excessive pressure drop through the completion. Therefore, the GP grain size distribution must
be carefully designed to provide as high permeability as possible while stopping fines from flowing into
the wellbore. If the GP is working properly, no fines should reach the screen. Yet several papers1,2,3,11 are
reporting that a common reason for failure in GP completions is erosion of the screen. It is not always
obvious whether the screen eroded due to formation fines produced with reservoir fluids, or whether
erosion was due only to high velocity fluid flow. Once the screen fails, the pack itself can flow to the
surface with sufficient fluid flow rate.
�
Figure 2.3 Comparison of gas production rates from non-fractured wells, wells with negative
skin and fractured wells (from Wang et al.19)
23
The second category would include mechanical failures such as completion collapse caused by excessive
differential pressure over the completion hardware or caused by formation compaction. An abrupt high
pressure gradient can cause formation sand unconsolidation and the sand failure. Once failed, formation
sand can plug the GP. Then if the well continues to flow at high rate, high pressure gradient in the GP can
cause it to destabilize and result in sufficient stress to collapse the completion. Another reason that
formation sand may plug the GP is after water breakthrough. Other reasons for completion failures may be
due to completion execution problems such as poor well cementing or poor GP placement.
Completion failures in the second category can also result from screen plugging. Organic deposits
(asphaltenes or paraffins) may precipitate as the pressure or temperature is reduced.20 This form of damage
is typically located in the tubing, perforations, or formation. Perforation or screen plugging can occur
which may cause completion failure.
Tiffin et al.3 noted that a series of wells failed in a GOM field because of massive reservoir depletion and
compaction forces. Well failure was due to casing collapse, screen collapse, and other problems. This is
typically the case with high permeability reservoirs as they usually have high compressibility. For
completion failures caused by formation compaction there are no major differences between GP and HPF
wells. Deviated wells are more sensitive to casing damage due to overburden stress and compaction forces
induced to the casing. The vertical wells will have much less chances for the casing failure. Since the
reservoir depletion and compaction are unavoidable, the risk to lose the well due to the casing/tubing
failure is high. This is a good reason for wells to be drilled vertically in high compressibility reservoirs.
Apart from completion failures related to compaction, it is evident that GP wells should be more
vulnerable than HPF wells to completion failure.
24
2.7 Chapter Summary
A comparison between ideal GP and FP completions was made. The HPF was distinguished from FP.
HPF is using a proppant while FP is using gravel as the injected material. While HRWP completion
performance is initially better than GP completion, the overall mid and late well performance is often
similar. This is due to the fact that both completion types will result in fines movement and plugging of the
perforations and annular pack. A remedial work (an acid treatment or well recompletion) will be needed to
restore the well productivity.
HPF completions are superior to any other completions. The flow area of the HPF completion is much
higher than the flow area of GP or HRWP completion. This will result in the lower formation flow
velocity at the fracture face for the HPF completions. Since the flow velocity is low enough, it will ensure
that fines do not move, and, hence, the skin should remain unchanged over the well life.
The resulting completion skin for ideal HPF wells is significantly smaller than for GP or HRWP wells,
hence the well productivity for HPF wells will be considerably higher than for GP or HRWP wells. The
well productivity for HPF wells should remain the same throughout the well life.
Equations were given to calculate HPF design parameters that should ensure low skin, no fines movement,
and bypass of near wellbore region damage. Because the resulting formation flow velocity will be below
the critical velocity, the well can be operated at the maximum achievable flow rates without being put at
the risk for fines movement, screen erosion, or screen collapse.
Different completion failures will impact the well performance. Depending on the completion failure
seriousness, the well may be jeopardized. However, properly designed and executed HPF completion
should not be prone to the listed failure mechanisms and should not have any of the completion failures
mentioned above.

25
CHAPTER III
WELL TRAJECTORY AND GEOLOGY IMPORTANCE (IMPACT) TO HPF
COMPLETIONS
3.1 Preliminary Discussion
The previous chapter explained why ideal HPF completions should out perform any GP or HRWP
completions. Unfortunately, operators do not necessarily strive for ideal HPF completions. The HPF
choice is not justified merely to avoid remedial work. As we saw in the example from the previous
chapter, the post treatment skin for HPF completions should always be considerably smaller than GP or
HRWP completions. Some would ask why we need an ideal HPF when the well performance has
significantly improved over the last decade or so. A positive skin factor for oil wells of +10 used to be an
excellent post treatment stimulation result, and now we are targeting up to +2 or less. Yet the following
example shows that production could double or even triple with a negative skin factor.
Assuming a typical GOM well reservoir permeability of 300 md and a thickness of 100 ft, the nodal
analysis in Fig. 3.1 shows that a nearly ideal GP skin of +10 would result in a production rate of around
2,700 STBOPD and a drawdown of 1,000 psi. An average GP well with a skin of +40 would produce less
than 1,000 STBOPD for the same drawdown. A commonly occurring HPF skin equal to +2 would lead to
a production rate of over 5,000 STBOPD, certainly a considerable improvement over GP wells. However
an ideal HPF with a negative skin of -3 would result in a production rate of nearly 10,000 STBOPD. It is
apparent that HPF could more than triple the rate of a modern GP completion.
This example answers the question why operators should select the HPF completion, properly design it
and execute it. The production increase would be enormous compared to the current HPF completion
trends. Prominently getting an ideal HPF well should not be a big challenge if the well trajectory is
considered during the well planning phase. The next section explains the reason why many HPF
completions have a positive skin and why more than a reduced flow rate may be at stake.
26
Figure 3.1 Nodal analysis result for Example in section 3.1
3.2 Production from a Fractured Deviated Well
A reservoir at depth is under a state of stress that can be characterized by three principal stresses. In
reservoirs at depths greater than 1,500 ft the vertical, or overburden, stress is the largest of the three, and
the other two are horizontal.15 The hydraulic fracture plane will be normal to the minimum stress direction,
leading to vertical hydraulic fracture planes in almost all petroleum production applications.
There exist reservoirs in which the minimum stress direction is horizontal, leading to a horizontal fracture
plane.21 Two main situations where fracture planes may be horizontal are in very shallow reservoirs or in
highly overpressured reservoirs. Also, the fracture plane may be neither vertical nor horizontal for highly
dipping beds. Section 3.4 will address the problem how to design the well trajectory in dipping reservoirs
depending on whether the well will be completed with GP or HPF.
Skin -3 Skin 2 Skin 10 Skin 40 Drawdown 1000 psi
Pwh (psig) 6000 5000 4000 3000 2000
LIQ
UID
RA
TE
(b
bl/d
)
20000
15000
10000
5000
0
DR
AW
DO
WN
(psi
)
6000
5000
4000
3000
2000
1000
0
Nodal Analysis

27
The original hydraulic fractures were in hard rock and typically in wells drilled on land with a strictly
vertical trajectory. In contrast, many HPF completions are in offshore wells drilled from a platform at high
deviation to achieve the extended reach required to reach the target reservoir location. While many
operators request S-shaped22 wells in order to penetrate the reservoir with a vertical trajectory, some
operators insist that this is not necessary.
From the production point of view a critical HPF characteristic is fracture to-well connectivity. Since this
study assumes the maximum stress is vertical, the trajectory of a vertical well will always align with the
final and main plane of the hydraulic fracture. However, the well azimuth of an inclined well usually does
not coincide with the final fracture plane, and the fracture plane will initiate in the plane of the well and
twist, causing “tortuosity” in its path to the final azimuth normal to the minimum stress direction. This is
the major problem with current trends in HPF, and Section 3.3 explains why HPF wells do not have
negative skin as they should. Fig. 3.2 depicts an unaligned fracture with a deviated wellbore.
Figure 3.2 Twisted fracture aligned with the preferred direction (From Economides et al.20)

28
Welling10 states that the wells are all inclined for their study, but he never explains why. Except in the
very unlikely event that the well path is in the plane of the fracture, hydraulic fracturing in a deviated well
is sure to severely limit the number of perforations connecting with the fracture. Therefore, Fig.1.1 (from
Welling10) is misleading for deviated wells unless the fracture plane coincides with the well trajectory.
The number of perforations connecting the fracture to the wellbore may be a lot fewer than indicated by
Welling.10 Since typically inclined wells are perforated along the entire productive length before fracturing
usually without any knowledge of the far field stresses, during the initial HPF injection some or all of the
perforations may take injected proppant. While some of the proppant may fill an annulus between the
cement and the formation as a so-called halo effect, the plan is that most of the proppant manages to form
a single plane that starts in the plane of the well and ends up in the plane normal to the minimum stress
direction. If the final fracture plane is at an angle with the well trajectory, it is not unreasonable to expect
that flow to the well will be established in the easiest paths from the fracture to the well, which would very
likely be through a few perforations.
Fig. 3.3 shows fracture-perforation intersection for different fracture plane orientations. Fig. 3.3 A shows
the case where the fracture plane is normal to the plane of the wellbore axis, giving an angle of 90o
between the wellbore and the far field fracture plane. Obviously, this is one of the worst possibilities. In
this case the connection will be poor with connection to only a few perforations (total of four). Fig. 3.3 B
shows a fracture plane at an angle of about 10o intersecting the opened wellbore as a sine wave. The
fracture plane will probably intersect the maximum possible perforations, in this case, perhaps as many as
10 (red perforations), but via the halo effect, there may be connection to all perforations from the
maximum to the minimum of the sine wave, giving a total of 31, as shown in yellow. Fig. 3.3 C shows the
full fracture-to-well connectivity where less than seven shots per foot times the thickness in feet is
connected. If the perforation phase were 180° with perforations oriented to be in the plane of the fracture,
then the connectivity would be even better, or with halo effect, perhaps all perforations are connected even
without oriented perforating.
A general equation for the number of perforations connected to fracture is;
SPFr
hN hinc ⋅= )
),sin(min(,min(
βα (3.1)
where hinc is the total measured thickness, rh is the halo radius, α is the wellbore deviation from vertical,
and β is the angle between the fracture plane and the plane of the wellbore axis.
29
A B C90o 10o 0o
Figure 3.3 Fracture-perforation intersection for different fracture plane orientations
As an example, consider a well drilled 15° from vertical with a 6 in wellbore halo and with the wellbore
axis 90° from the axis of the hydraulic fracture. The fracture plane will pass through 3.73 ft of the
wellbore length. At 12 SPF, whatever spacing is, this will amount to about 23 perforations. Using
Welling’s equations the resulting perforation skin is 1.5. The perforation velocity will be 12 ft/sec, and C
factor will be 88 if we are flowing oil with density 55 lb/ft3 (Eq. 1.1).
When the angle between the wellbore and the far field fracture plane is large, another possibility is that a
number of small en echelon fractures may form instead of one common fracture plane. These may or may
not extend past near wellbore damage, and they may not contain sufficient proppant to provide any real
stimulation. The net result in this case may be that the working proppant that takes flow to the wellbore is
effectively only that in the perforation tunnels and the annular GP. In other words, what is left may be
little more than a conventional GP. If, instead, the proppant forms a halo, at least the radius of the halo
may provide somewhat more flow area than a conventional GP, but nowhere near the flow area that would
have been provided by a properly executed HPF. Eq. 2.11 provided an estimate for the halo radius in the
worst case scenario that all of the proppant intended for a HPF ended up instead as a halo, and the
resulting sand face flow velocity was provided in Eq. 2.12.
30
Yew et al.23 have indicated that as the initial fracture grows, it deviates from the initial plane formed along
the wellbore because of the influence of off-shear stresses. Then, the twisting of the fracture occurs in a
short distance, estimated at only a few well diameters.
A rule of thumb for successful fracture execution is to avoid letting the angle between the well axis and
the final fracture plane exceed 15°.24 However, this pertains to fracture execution, not flow to the fracture
during production. In reality, if the well is deviated and the wellbore axis is not aligned with the final
fracture plane, the fracture-to-well connectivity will be poor, and logically the fracture will be connected
effectively with only those perforations near the intersection between the wellbore axis and the final
fracture plane. Perforations more distant from the final fracture plane will have been abandoned during
execution as proppant flow followed the preferential shorter flow paths to the final fracture plane.
Likewise, during production, flow to the well will be preferentially through the fracture, thereby bypassing
perforations no longer connected to the final fracture plane.
3.3 Estimating the Skin for a High Permeability Fracture in a Deviated Wellbore
Chen et al.25 considered the effect of fracture tortuosity as narrowed fracture width at the connection
between the final fracture plane and the wellbore produced a choked fracture. Alternatively, using the
approach of Welling 10 the number of perforations connecting the final fracture plane to the wellbore can
be estimated as the product of the well length intersected by the fracture plane multiplied by the
perforation HPF. Because of the halo effect, all of the perforations in that interval may be counted. The
total skin for a deviated well will be computed from combined Eq.2.25, Eq.2.26, and Eq. 3.1. The resulting
skin in oilfield units is;
��
�
�
��
�
� ++=
f
FDwdw x
CrqB
DPkhS
)2/1(ln
2.141 µ (3.2)
The total pressure drop through peroration tunnels, DP, will be computed by using Eq. 2.19 where number
of flowing perforations, N, will be computed by using Eq. 3.1.

31
If we consider field example from Chapter II, knowing that the well deviation angle from vertical was 20°,
the fracture plane azimuth was 40°, the well azimuth 340°, and no halo, then the total number of flowing
perforations would be 18 (Eq.3.1). The resulting skin would be 1.6 (Eq.3.2). The resulting skin is positive
even though the well was HPF. The initial pressure build-up done on this well gave a skin of 1.3. There is
no significant difference between the calculated skin and the measured skin by PTA. This example seems
to confirm that HPF wells end up with positive skin due to poor fracture to well connectivity. With current
technology, proppant damage should be small and should not account for additional positive skin.
3.4 Potential for Screen Erosion for a HPF Well in a Deviated Wellbore
As was shown in Eq. 1.1 the C factor is basically the square root of the kinetic energy of the fluids flowing
into the screen. As was mentioned in Chapter I Tiffin et al.3 emphasized the importance of this parameter
for high rate production wells and related it to screen erosion. The current recommendation to avoid screen
erosion is to ensure that the screen velocity is less than 1 ft/sec. The research to establish screen erosion
velocity is ongoing and currently it is proprietary information. Clearly, the denser fluid the faster erosion
will occur. Also, a greater amount of fines in the fluid mixture will erode the screen faster.
In a HPF well it is unlikely that fines will be flowing to the screen. If the screen erodes in a HPF well very
likely this occurred because of high fluid flow velocity without fines. Section 3.2 explains that very few
perforations may be connecting the fracture to the wellbore and section 3.3 shows that observed skins in
HPF wells are consistent with a skin calculation using a small number of perforations. Furthermore, the
interval through which this flow is occurring is computed as the length of the fracture-perforation-
intersection, hint. Therefore, the screen velocity, Vs, is computed as;
int2 hrq
Vs
s π= (3.3)
where rs is the screen radius.
This shows that even with a negative skin there may still be high velocity flow through few perforations
(hot spots) which could lead to screen erosion, or annular pack destabilization. Once the annular pack is
“destabilized” the flow velocity at the screen face will be higher and the screen will be exposed to high
failure risk.
Fig. 3.4 shows a sensitivity study for a 20,000 STBOPD oil well. The perforation permeability is assumed
to be 200,000 md, and the halo radius is assumed to be 0.5 ft. Even at a 45o deviation, the total skin may
32
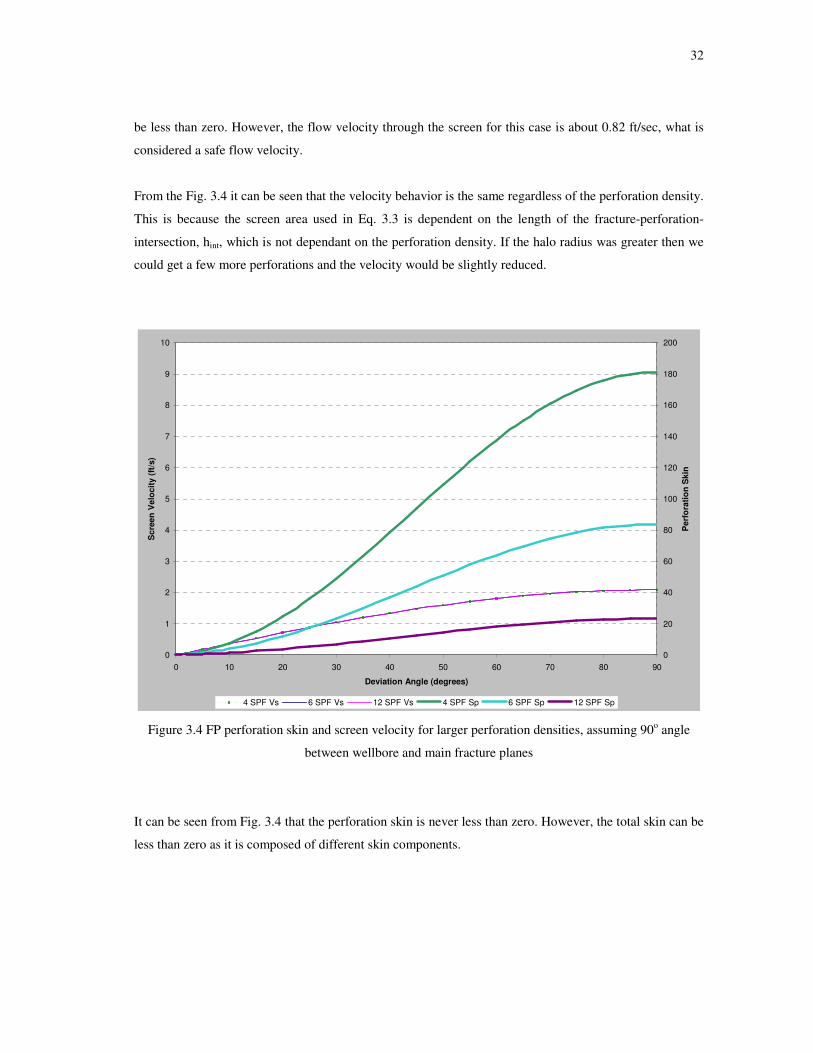
be less than zero. However, the flow velocity through the screen for this case is about 0.82 ft/sec, what is
considered a safe flow velocity.
From the Fig. 3.4 it can be seen that the velocity behavior is the same regardless of the perforation density.
This is because the screen area used in Eq. 3.3 is dependent on the length of the fracture-perforation-
intersection, hint, which is not dependant on the perforation density. If the halo radius was greater then we
could get a few more perforations and the velocity would be slightly reduced.
0
1
2
3
4
5
6
7
8
9
10
0 10 20 30 40 50 60 70 80 90
Deviation Angle (degrees)
Scr
een
Vel
ocity
(ft
/s)
0
20
40
60
80
100
120
140
160
180
200
Per
fora
tion
Ski
n
4 SPF Vs 6 SPF Vs 12 SPF Vs 4 SPF Sp 6 SPF Sp 12 SPF Sp
Figure 3.4 FP perforation skin and screen velocity for larger perforation densities, assuming 90o angle
between wellbore and main fracture planes
It can be seen from Fig. 3.4 that the perforation skin is never less than zero. However, the total skin can be
less than zero as it is composed of different skin components.

33
For the field example from Chapter II the screen velocity is 0.7 ft/sec. Therefore, this well is not at risk.
However, the literature indicates that a number of HPF wells have failed due to screen erosion. A close
look revels that in most or all of the reported cases the wells were inclined.
3.5 HPF in Dipping Reservoirs
Welling10 indicates that field matches for FP completions suggest that 0.7 to 2.3 SPF are flowing in
deviated wells and concludes that flow in high rate oil and gas wells in high permeability reservoirs is
perforation limited. Therefore, he prefers HRWP completions because field matches show on average 5
SPF are flowing except for highest permeability reservoirs, in which he recommends OHGP. Fig. 1.1
assumes that the fracture plane is completely aligned with the wellbore with both fracture wings. This will
only be true when the wellbore and the fracture plane coincide. For deviated wells, in order to have
wellbore totally connected with the fracture; the well azimuth must normal to the minimum horizontal
stress. Because of this we find very compelling the logic of drilling wellbores strategically to be in the
fracture plane, so that it does not need to turn from the local wellbore stress to the far field stress. In most
cases this would normally mean drilling the well vertically through the productive formation.
For dipping reservoirs, the generalization that maximum stress is likely to be vertical may not always hold.
If the maximum stress direction is not vertical in a dipping reservoir, then geomechanical analysis must be
done to determine the well trajectory that will ensure that the wellbore is aligned with the created fracture.
The geomechanical analysis for dipping beds is considered beyond the scope of this study. However, what
this work implies is that once a geomechanical study has determined the stress magnitudes and directions,
then the well trajectory can be designed such that the wellbore will align with the hydraulic fracture plane.
3.6 Should OHGP Be Recommended in High Rate Gas Wells?
Welling10 recommended using OHGP completion for oil wells if the reservoir permeability is above 900
md, and if it is above 600 md for high rate gas wells. This work shows that the Welling10 equations are
correct but he makes two errors in applying them. The first error is that his perforation count is not correct.
For HPF in inclined wells the perforation count can be much less than he assumes. The second error was
when matching field behavior Welling10 reduced the gravel permeability to compensate for the excessive
number of perforations. The model in this work agrees with the field case shown.
If the number of perforations connected to fracture are properly counted (by using Eq. 3.1) then HPF
would result in lower skin than OHGP completion skin. This confirms that the HPF completion is a better
34
choice than OHGP completion. Also, OHGP completions are not practicable in high permeability
unconsolidated formations due to the wellbore instability.
3.7 Chapter Summary
If the wellbore trajectory is vertical through the pay zone almost always the wellbore will be aligned with
the hydraulic fracture plane. For deviated wells, in order to have wellbore entirely connected with the
fracture; the well azimuth must be normal to the minimum horizontal stress. Therefore the horizontal
stress measurement must be determined before drilling the wellbore section through the productive
interval.
If the well is deviated and not drilled perpendicularly to the minimum horizontal stress direction then
potential for screen erosion and annular pack destabilization is high because of limited fracture to well
connectivity. All flow will be forced to pass through a few perforations. Equations were developed
showing the number of perforations connecting the fracture and the wellbore, and the total skin for HPF
deviated well.
In inclined wells it is important to properly count number of perforations connected to fracture. HPF
completion will result in lower skin than a OHGP completion.
For dipping beds, the maximum stress may not be strictly vertical. However, advanced geomechanical
study can reveal the minimum stress direction so that the well can be drilled normal to this direction. With
this strategy the wellbore will be aligned with the hydraulic fracture.
35
CHAPTER IV
SUMMARY, CONCLUSIONS, AND
RECOMMENDATIONS FOR FUTURE WORK
4.1 Summary and Conclusions
Often existing completion practices do not lead to optimal well performance, and well production is
constrained to avoid high velocity and drawdown which could cause premature completion failure. The
resulting skin in HPF wells was almost always positive which is contradictory to the theoretical skin
definition for hydraulically fractured wells. The main reason for poor completion and high mechanical
skin in HPF wells was the fracture-to-well connectivity. Most of the wells in deepwater GOM are deviated
and are not drilled perpendicularly to the minimum horizontal stress.
In this work we recommended high permeability fracture (HPF) completions. HPF completions are
superior to any other, provided the far-field fracture is in the plane of the wellbore. By selecting, properly
designing and executing the HPF the resulting mechanical skin should be negative. The well productivity
is increased; the well is safely produced at its maximum achievable flow rate, the risk of sand production
is minimal, or even impossible. Also, high rate gas wells will benefit from HPF by minimizing the
turbulence effects. The full set of equations was given for proper HPF well design. The deviation between
the proposed model and the real well performance should be negligible, unless some obvious details were
overlooked or the HPF execution phase did not go as planned. A new and more accurate calculation of the
theoretical skin and flow velocity for HPF completion for deviated wells was given.
The vertical well through the net pay is the best option. In most cases, this will ensure that the fracture
plane and the wellbore are aligned, and that, therefore, fracture-to-well connectivity is good. Since the
high permeability reservoirs are usually prone to compaction, the vertical well will be a better choice than
a deviated well. If the vertical well trajectory can not be selected, then the stress measurement should be
done and the well should be drilled along the maximum horizontal stress. If the well is inclined it is
important to properly count number of perforations connected to fracture. If the stress measurement was
not interpreted and applied it must not be assumed that the fracture is connected entirely to the wellbore.

36
4.2 Recommendations, Comments, and Future Work
The future work on this topic should consider mechanisms for further improvements in selected
completion design. In order to ensure that the HPF is properly designed, this method should be checked
against the empirical data from the wells. A halo effect possibility is still in research. Even though the halo
effect existence is confirmed in soft reservoirs, drilling the vertical wells would be preferred over inclined
in this case.
As an alternative the new well surveillance method can be developed which would ensure that the well is
operated safely in the case that the completion method is not selected properly, or the completion
execution was not successful. The current surveillance method has many assumptions, it is not applicable
to various applications, and is not reliable in most cases. With the industry evolution there might be new
screen which could withstand higher erosion velocity. If so, the well flow rate could be increased.
Since a significant number of wells are inclined without a stress measurement, the fracture choking is
likely. There is no satisfactory PTA model for choked fracture flow. Development of this model would
help operators to properly examine existing wells performance.
Correlations for critical fines movement for different formations should be developed. Correlation would
help to determine critical fines movement velocity. Since many wells are not cored having the critical
velocity result prior to well completion would aid for further well completion decisions.
37
NOMENCLATURE
a = Laminar pressure drop factor in reservoirs without skins, dimensionless
b = Turbulent pressure drop factor, dimensionless
AGP = Flow area at the sand face for gravel pack completion, ft2
AHPF = Flow area of the fracture face, ft2
Ap = Perforation cross sectional area, ft2
B = Oil formation volume factor, RB/STB
C = Erosion factor, dimensionless
CfD = Dimensionless fracture conductivity, dimensionless
hf = Fracture height, ft
hinc = Total measured thickness, ft
hint = Length of the fracture-perforation-intersection, ft
Hof = Open flow length, ft
hp = Perforated interval ft
Htot = Total thickness, ft
K = Reservoir permeability, md
kcake = Filter cake permeability, md.
kf = Average fracture permeability, md
kfl = Fluid loss zone permeability, md
kgr = Gravel permeability, md
kp = Perforation permeability, md
Lg = Connection flow length (difference between drilled radius and screen radius), ft
Lp = Perforation length, ft
Q = Volumetric gas production rate, MSCFD
Q = Volumetric oil production rate, BOPD
rcake = Filter cake radius, ft
rd = Radius of drilling and completion induced damage, ft
regp = Radius of extended gravel pack, ft
rfl = Fluid loss radius, ft
rg = Under reamed radius, ft
rh = Halo radius, ft
roc = Outside screen radius, ft
rp = Perforation radius, ft
rs = Screen radius, ft

38
rw = Wellbore radius, ft
Scake = Filter cake skin, dimensionless
Sfl = Fluid loss skin, dimensionless
Sgr = Gravel skin, dimensionless
Spl = Partial completion skin, dimensionless
Vc = Flow velocity existing casing, ft/sec
vc,SF = Critical flow velocity for single phase fluid, ft/sec
VEGP = Formation flow velocity into the extended gravel pack completion, ft/sec
Vi = Injected proppant volume,ft3
Vpmax = Maximum perforation velocity, ft/sec
Vs = Flow velocity at the screen surface, ft/sec
VSF = Velocity at the fracture face, ft/sec
W = Average fracture width, ft
xf = Fracture half length, ft
xfA = Fracture flow area, ft2
Greek Letters
� = Angle between the fracture plane and the plane of the wellbore axes, degree
�goil = Turbulence factor for gravel when oil is flowing, 1/ft
µ = Fluid viscosity, cp
α = Wellbore deviation from vertical, degree
ρm = Fluid mixture density, lbs/ft3
39
REFERENCES
1. Wong, G.K., Fair, P.S., Bland, K.F., and Sherwood, R.S.: “Balancing Act: Gulf of Mexico Sand
Control Completions, Peak Rate Versus Risk of Sand Control Failure,” Paper SPE 84497
presented at the 2003 SPE Annual Technical Conference and Exhibition, Denver, CO, 5-8
October.
2. Colwart, G., Burton, R.C., Eaton, L.F., Hodge, R.M., and Blake, K.: "Lessons learned on Sand-
Control Failure, and subsequent Workover at Magnolia Deepwater Development," Paper SPE
105542 presented at the 2007 SPE/IADC Drilling Conference, Amsterdam, Netherlands, 20-22
February.
3. Tiffin, D.L, Stein, M.H., and Wang, X.: “Drawdown Guidelines for Sand Control Completions,”
Paper SPE 84495 presented at the 2003 SPE Annual Technical Conference and Exhibition,
Denver, CO, 5-8 October.
4. Yew, C.H. and Li, Y.: “Fracturing of a Deviated Well,” Paper SPE 16930 presented at the 1987
SPE Annual Technical Conference and Exhibition, Dallas, TX, 27-30 September.
5. Veeken, C.A.M., Davies, D.R., and Walters, J.V.: “Limited Communication Between Hydraulic
Fracture and (Deviated) wellbore,” Paper SPE 18982 presented at the 1989 SPE Joint Rocky
Mountain Regional/Low Permeability Reservoirs Symposium and Exhibition, Denver, CO, 6-8
March.
6. Cleary, M.P., Johnson, E.D., Kogsboll, H.H., et al.: “Field Implementation of Proppant Slugs To
Avoid Premature Screen-Out of Hydraulic Fractures With Adequate Proppant Concentration,”
Paper SPE 25892 presented at the 1993 SPE Joint Rocky Mountain Regional/Low Permeability
Reservoirs Symposium and Exhibition, Denver, CO, 12-14 April.
7. Furgier, J.N., Lavoix, F., and Lemesnager, F.: ”Pushing the Limits of Frac-Pack Operating
Envelope,” Paper SPE 107699 presented at the 2007 SPE European Formation Damage
Conference, Scheveningen, The Netherlands, 30 May-1 June.
8. Behrmann, L.A. and Elbel, J.L.: “Effect on Perforations on Fracture Initiation,” Paper SPE 20661
presented at the 1990 SPE Annual Technical Conference and Exhibition, New Orleans, LA, 23-
26 September.
9. Abass, H.H., Nasr-El-Din, H.R., and Ba Taweel, M.H.: “Sand Control: Sand Characterization,
Failure Mechanisms, and Completion Methods,” Paper SPE 77686 presented at the 2002 Annual
Technical Conference and Exhibition, San Antonio, TX, 29 September-2 October.

40
10. Welling, R.W.F.: “Conventional High Rate Well Completions: Limitations of Frac&Pack, High
Rate Water Pack and Open Hole Gravel Pack Completions,” Paper SPE 39475 presented at the
1998 SPE International Symposium on Formation Damage Control, Lafayette, LA, 18-19
February.
11. Keck, R.G., Colbert, J.R., and Hardham, W.D.: “The Application of Flux-Bases Sand-Control
Guidelines to the Na Kika Deepwater Fields,” Paper SPE 95294 presented at the 2005 SPE
Annual Technical Conference and Exhibition, Dallas, TX, 9-12 October.
12. Dusterhoff, R.G. and Chapman, B.J.: “Fracturing High Permeability Reservoirs Increases
Productivity,” Oil and Gas Journal (1994) 92, 25.
13. Tiner, R.L., Elly, J.W., and Schraufnagel, R.: “Frac Packs-State of the Art,” Paper SPE 36456
presented at the 1996 SPE Annual Technical Conference and Exhibition, Denver, CO, 6-10
October.
14. Aggour, T.: “Optimization Strategies for Hydraulic Fracturing in High Permeability Reservoirs,”
Paper SPE 68131 presented at the 2001 SPE Middle East Oil Show, Bahrain, 17-20 March.
15. Mathur, A.K., Ning, X., Marcineau, R.B., Ehlig-Economides, C.A., and Economides, M.J.:
"Hydraulic Fracture Stimulation of Highly Permeable Formations: The Effect of Critical Fracture
Parameters on Oilwell Production," Paper SPE 30652 presented at the 1995 SPE Annual
Technical Conference and Exhibition, Dallas, TX, 22-25 October.
16. Economides, M. J., Oligney, R.E., and Valkó, P.P.: Unified Fracture Design (hardbound) Orsa
Press, Houston (2002).
17. Upchurch, E.R.: “Near-Wellbore Halo Effect Resulting From Tip-Screenout Fracturing: Direct
Measurement and Implication for Sand Contol,” Oil and Gas Journal (2001) 16, 1.
18. Neumann, L.F., Pedroso, C.A., Moreira, L., and Bezerra de Melo, R.C.: “Lessons Learned from a
Hundred Frac Packs in the Campos Basin,” Paper SPE 73722 presented at the 2002 SPE
International Symposium and Exhibition on Formation Damage Control, Lafayette, LA, 20-21
February.
19. Wang, X. and Economides, M.J.: “Aggressive Fracturing Slashes Turbulence in High-
permeability Gas Wells,” World Oil (2004) 225, 7.
20. Economides, M.J. and Nolte, K.G.: Reservoir Stimulation, Third Edition, 750 p. (hardbound)
John Wiley, New York (2000).

41
21. Gidley, J.L., Holditch, S.A., Nierode, D.A., and Veatch, R.W.: Recent Advances in Hydraulic
Fracturing, Monograph Series, SPE, Richardson, TX (2001).
22. Martins, J.P., Abel, J.C., Dyke, C.G., Michel, C.M., and Stewart G.: “Deviated Well Fracturing
and Proppant Production Control in the Prudhoe Bay Field,” Paper SPE 24858 presented at the
1992 Annual Technical Conference and Exhibition, Washington, DC, 4-7 October.
23. Yew, C.H. and Schmidt, J.H.: “On Fracture Design of Deviated Wells,” Paper SPE 19722
presented at the 1989 SPE Annual Technical Conference and Exhibition, San Antonio, TX, 8-11
October.
24. Economides, M. J., and Nolte, K.G.: Reservoir Stimulation, Second Edition, Prentice Hall, New
Jersey (1989).
25. Chen, Z. and Economides, M.J.: “Effect of Near-Wellbore Fracture Geometry on Fracture
Execution and Post-Treatment Well Production of Deviated and Horizontal Wells, “ Paper SPE
39425 presented at the 1998 SPE Formation Damage Control Conference, Lafayette, LA, 18-19
February.

42
VITA
Name: Slavko Tosic
Permanent Address: Dr. Christine A. Ehlig-Economides
3116 TAMU-710BA Richardson Building
College Station, TX 77843-3116
USA
E-mail Address: [email protected]
Education: Texas A&M University, College Station, Texas, USA
Master of Science Degree in Petroleum Engineering
October 2007
University of Mining and Geology, Belgrade, Serbia and Montenegro
B.S. in Petroleum Engineering
April 2001
Affiliations: Society of Petroleum Engineers
Related Documents