Fool Me Once: An Experiment on Credibility and Leadership David J. Cooper Department of Economics Florida State University and University of East Anglia John R. Hamman Department of Economics Florida State University Roberto A. Weber Department of Economics University of Zurich May 24, 2019 * Abstract We investigate ‘social credibility,’ a leader’s ability to convince followers that conditions are favourable and that others will follow the leader’s advice. To do so, we study an experimental joint venture with three key properties: returns are uncertain, investments are complements, and investment is often more beneficial for the leader than the followers. The leader has private information about investment returns and can facilitate coordination through cheap-talk recommendations. We find that leaders manage social credibility by forgoing potentially profitable advice to invest, increasing the likelihood that subsequent recommendations are followed. We identify factors that affect the persistence of social credibility. Keywords: Leadership, Coordination, Complementary Investment, Experiment JEL Codes: C72, C92, D82 Cooper: Dept. of Economics, Florida State University, 113 Collegiate Loop, Tallahassee, Florida, 32306-2180, USA, [email protected] and School of Economics, 2.27, Registry, University of East Anglia, Norwich Research Park, Norwich NR4 7TJ, UK, [email protected]; Hamman: Dept. of Economics, Florida State University, 113 Collegiate Loop, Tallahassee, Florida, 32306-2180, USA, [email protected]; Weber: Dept. of Economics, University of Zurich, Blumlisalpstrasse 10, 8006 Zurich, Switzerland, [email protected]. * We thank the editor and two anonymous reviewers, as well as participants at several conferences and seminars for helpful suggestions. Roberto Weber gratefully acknowledges financial support from the Swiss National Science Foundation (Project 100018_140571). Cooper and Hamman thank the National Science Foundation for financial support (SES-1127704).

Welcome message from author
This document is posted to help you gain knowledge. Please leave a comment to let me know what you think about it! Share it to your friends and learn new things together.
Transcript

Fool Me Once: An Experiment on Credibility and Leadership
David J. Cooper Department of Economics
Florida State University and University of East Anglia
John R. Hamman Department of Economics Florida State University
Roberto A. Weber
Department of Economics University of Zurich
May 24, 2019*
Abstract We investigate ‘social credibility,’ a leader’s ability to convince followers that conditions are favourable and that others will follow the leader’s advice. To do so, we study an experimental joint venture with three key properties: returns are uncertain, investments are complements, and investment is often more beneficial for the leader than the followers. The leader has private information about investment returns and can facilitate coordination through cheap-talk recommendations. We find that leaders manage social credibility by forgoing potentially profitable advice to invest, increasing the likelihood that subsequent recommendations are followed. We identify factors that affect the persistence of social credibility. Keywords: Leadership, Coordination, Complementary Investment, Experiment JEL Codes: C72, C92, D82
Cooper: Dept. of Economics, Florida State University, 113 Collegiate Loop, Tallahassee, Florida, 32306-2180, USA, [email protected] and School of Economics, 2.27, Registry, University of East Anglia, Norwich Research Park, Norwich NR4 7TJ, UK, [email protected]; Hamman: Dept. of Economics, Florida State University, 113 Collegiate Loop, Tallahassee, Florida, 32306-2180, USA, [email protected]; Weber: Dept. of Economics, University of Zurich, Blumlisalpstrasse 10, 8006 Zurich, Switzerland, [email protected]. * We thank the editor and two anonymous reviewers, as well as participants at several conferences and seminars for helpful suggestions. Roberto Weber gratefully acknowledges financial support from the Swiss National Science Foundation (Project 100018_140571). Cooper and Hamman thank the National Science Foundation for financial support (SES-1127704).

‘Youcanfoolsomeofthepeopleallofthetime,andallofthepeoplesomeofthetime,but
youcannotfoolallofthepeopleallofthetime.’
-- Abraham Lincoln (probably apocryphal)
Palm Incorporated, pioneering manufacturer of the PalmPilot, was in deep trouble by early
2010. It faced dismal earnings, poor sales of its new smartphone, and loads of bad press. In an
attempt to rally employees, CEO Jon Rubinstein sent an email explaining management’s plan
for a turnaround. He described numerous positive developments and predicted a rosy future.
The email concluded, ‘Our goals are taking longer than expected to achieve, but I am still
confident that our talented team has what it takes to get the job done …. Go team!!!’1 Palm’s
future depended on employees believing that they were better off working hard to turn the firm
around, rather than spending their time printing resumes and lining up job interviews. Yet, why
would Palm’s employees have found Rubinstein’s statements persuasive? The company had
been struggling for years and had a history of glossing over firm struggles. For instance, in a
press tour promoting the firm’s new phone in March of 2009, Roger McNamee, a prominent
investor in Palm, told Bloomberg, ‘June 29, 2009, is the two-year anniversary of the first
shipment of the iPhone. Not one of those people will still be using an iPhone a month later.’2
Even if employees found Rubinstein’s email personally persuasive, they may still have
invested their time in job hunting if individual employees’ contributions to the firm were
complements; in such a case, investing time in the firm only made sense if one believed that
other workers were persuaded by the email. Unsurprisingly, Rubinstein had lost his job by the
end of 2011 and Palm no longer exists.
1 ‘Palm CEO’s Letter to Employees,’ The Wall Street Journal, February 25, 2010, http://blogs.wsj.com/digits/2010/02/25/palm-ceos-letter-to-employees/. 2 ‘Pre to Win iPhone Users After Contracts, McNamee Says,’ Bloomberg, March 5, 2009. http://www.bloomberg.com/apps/news?pid=newsarchive&sid=a2SkDk7Tu5Mw

Persuasiveness is an essential element of leadership. Leaders frequently need to
convince followers that it is in their interest to take a costly action, often using their superior
private information to justify their recommendations (Hermalin, 1998). In settings where
followers’ actions are complements, a leader may need to convince followers that conditions
are favourable and that others will follow the leader’s advice. In other words, a leader must be
both credible and socially credible. In dynamic settings, both types of credibility can be fragile.
A leader may gain in the short run by encouraging actions that do not benefit the followers, but
lose in the long run if this destroys his credibility, social or otherwise. Our paper presents
laboratory experiments studying how leaders manage this tradeoff.
We frame the problem facing leaders and followers in terms of investment in a project.
Several ‘investors’ independently decide whether or not to invest. Their return depends on the
number of active investors and on an exogenous variable, investment quality, about which
investors are uninformed. In some states investment is never profitable for investors (even if
everyone invests) while in other states investment is profitable as long as some threshold
number of investors is met.3
To study leadership and social credibility we introduce an ‘advisor,’ who receives a
noisy estimate of the investment quality and then makes a recommendation of either ‘invest’
or ‘don’t invest’ to the investors. Relative to investors’ preferences, the advisor’s incentives
are biassed towards investment. That is, the advisor prefers full investment in every state in
which investors can benefit from investment, but also benefits from full investment in some
states in which the investors cannot benefit from it.
3 Our work is related to the literature on ‘global games’ (Carlsson and van Damme, 1993; Morris and Shin, 2002; Heinemann, Nagel, and Ockenfels, 2004) which studies the relationship between information and existence of a unique equilibrium in coordination games. We do not directly provide players with information, but instead provide information indirectly through an external leader with possibly conflicting incentives. The information structure in our game does not provide investors with the private signals necessary to induce a unique equilibrium (the dominance arguments used in the global games literature do not apply). Studying advice and credibility in a global-games setting is a valuable opportunity for future research.

In addition to babbling equilibria, the one-shot game with an advisor has an informative
equilibrium where the advisor calls for investment when the state of the world is such that full
investment is to his advantage. The informative equilibrium Pareto dominates the babbling
equilibria, but leads to full investment for states of the world where investors would be better
off with no investment. With finite repetition, it is also possible to support equilibria in which
investment only takes place (until the last few periods) when full investment is to the advantage
of investors. These equilibria require advisors to exercise restraint to maintain their social
credibility, advising against investment in states of the world where full investment benefits
them but not investors. Foregoing the short run gains of full investment is worthwhile for an
advisor to avoid the long run cost of being punished by play of a babbling equilibrium with no
investment. Compared to the informative stage-game equilibrium, the repeated-game equilibria
in which advisors are conservative about advising investment yield higher payoffs for investors
and lower payoffs for the advisor.
In the experiment, observed behaviour is more consistent with the repeated-game
equilibria than with any stage game equilibria. Advisors are conservative in recommending
investment. They typically forgo recommending investment when followers are certain to be
harmed by it and often forgo advising investment even when followers can potentially benefit
from investment if success is difficult (i.e., in ‘challenging’ states in which many investors
must invest for investment to be profitable). We interpret this as concern for social credibility.
Making recommendations that prove unprofitable—either because of poor quality or, critically,
because not enough others followed the advice—significantly harms a leader’s subsequent
efficacy. Foregoing advising investment enhances social credibility since advice to invest is
followed by more investors when advisors less frequently recommend it. An important
conclusion of our research is that social credibility is strongly responsive to history and can be
managed by a leader’s actions.

Additional treatments investigate whether various factors—improving the accuracy of
advisors’ information, allowing advisors to report their private information as well as giving
advice, or allowing followers to verify ex post the quality of advisors’ advice—make leaders
more effective at maintaining social credibility and eliciting desirable actions among followers.
Improving the accuracy of the advisor’s information is by far the most powerful treatment.
This reflects the direct effect of having fewer mistaken signals as well as the indirect effect of
changes in advisors’ and investors’ underlying strategies.4 Well-informed advisors seem to
benefit from a perception by investors of inherently greater social credibility.
Clearly, advice benefits investors. Compared with an initial phase without advice,
investor payoffs jump when advisors are introduced. The conservatism of advisors increases
their benefit to investors. We demonstrate this with an additional treatment in which automated
advisors follow the informative equilibrium from the stage game. Investors know that advisors
follow a fixed strategy but do not know the specific strategy used. Investor payoffs are
significantly lower with automated advisors, and the payoffs of automated advisors are no
higher than those of real advisors. For advisors, any benefits of being more aggressive by
following the informative stage-game equilibrium are offset by the damage to social credibility
from giving bad advice.5
Advisors in our experiment act both as a conduit for information and as leaders who
coordinate followers’ actions. While the former role is linked to their credibility in relaying
private information, the latter rests on their social credibility. To isolate the importance of the
latter role, we conduct a final treatment in which we eliminate the informational role. Investors
in this final treatment receive the same information as advisors at the beginning of each round.
4 Advisors with better quality information are less likely to mistakenly give bad advice because they have received an inaccurate estimate. In the repeated game equilibrium, this has a direct effect (e.g., it is less likely the advisor calls for investment when this is bad for investors) and an indirect effect (it is less likely that bad advice triggers a punishment). 5 This is the treatment with the highest rate of coordination failure—observations where investors do not all choose the same action—at 41.3%. Other treatments have coordination failure rates between 22.1% and 33.8%.

This implies that the sole role of advisors is to provide leadership. The effect of eliminating
asymmetric information is surprisingly small; investor payoffs rise relative to the Baseline
treatment, but there is no significant effect on advisor earnings. Most importantly, even without
asymmetric information, investors still respond strongly to the suggestions of their advisors.
These results emphasise the role advisors play as leaders and their ability to coordinate
followers’ actions through social credibility, even when informational credibility is irrelevant.
Finally, to study whether social credibility follows an individual leader across groups,
we have a final stage of the experiment where we rematch advisors with new groups. Investors
in these new groups are aware of the advisor’s previous history. We find that investors are less
likely to follow advice from advisors who have given more bad advice to their previous group,
controlling for outcomes with their current group. Thus, social credibility is persistent.
Our paper is structured as follows. Section 1 reviews related research. Section 2
presents and analyses the ‘investment game’ used in the experiment. Sections 3 and 4 present
the experimental design and results, respectively. Section 5 concludes.
1. Review of related literature
Hermalin (1998) develops a theoretical model of leadership-by-example in an environment
where leaders and followers have potentially misaligned incentives. He identifies two ways a
leader may be effective: sacrifice, in the form of side payments to followers, and leading by
example, wherein the leader will move first and take a costly action. Komai, Stegeman, and
Hermalin (2007) extend this model to include informational asymmetries between the leader
and followers. In addition to sacrifice and leading by example, the leader can reveal part of her
information set to the group. Meidinger and Villeval (2002) use an experiment to test
predictions of the original Hermalin model. They find that sacrifice is more effective when side
payments are ‘burned’ rather than transferred, and the positive effects of leading by example
are driven more by reciprocity than signaling.

Other experimental papers study the effectiveness of leading by example in public good
games where the leader makes her decision publicly before the rest of the group (Moxnes and
van der Heijden, 2003, 2007; Potters, Sefton, and Vesterlund, 2007; Grossman, Komai, and
Jensen, 2015; Arbak and Villeval, 2013). These papers find that sequential play reduces free
riding. Cartwright, Gillet, and van Vugt (2009; 2013) similarly find that sequential play in a
coordination game improves group outcomes. Brandts, Cooper, and Fatas (2007) find that cost
differences can give rise to leadership in coordination games even without sequential play.
Many studies have shown that public messages can be effective in improving
coordination in groups.6 Wilson and Rhodes (1997) find that leadership via a suggested action
improves coordination in pure coordination games, although the effect decreases as it becomes
more likely that the leader can gain by deceiving followers.7 Brandts and Cooper (2007) and
Brandts, Cooper and Weber (2015) find that public messages often work better than financial
incentives at inducing change to more efficient equilibria. In games where the leader has private
information, Agranov and Schotter (2012; 2013) find that vague or ambiguous language may
improve coordination when the leader and group face potential conflicts of interest. Brandts,
Cooper, and Weber (2015) find the effect of communication depends in part on how the group
leader was appointed, with elected leaders doing better than randomly assigned leaders.8
Our focus on a leader’s credibility when giving advice overlaps with the literature on
reputation building in games with asymmetric information (e.g., Kreps and Wilson, 1982;
Milgrom and Roberts, 1982; Ely and Välimäki, 2003; Grosskopf and Sarin, 2010). This
literature largely focuses on asymmetric information about the informed player’s type (i.e., a
6 For evidence on the limits of communication for inducing efficient coordination, see Weber, Camerer, Rottenstreich and Knez (2001) and Kriss, Blume and Weber (2016). 7 See, Kuang, Weber and Dana (2007) and Dickson (2011) for related evidence. 8 Related work studies messages from leaders in public good games. Serra-Garcia, van Damme and Potters (2011 and 2013) find that public good contributions may be raised by using vague language or focusing on one’s own contribution. d’Adda, Darai, Pavanini and Weber (2017) show that leaders who are more likely to act dishonestly yield groups with more dishonest and socially harmful behaviour. Antonakis et al. (2019) show that the style in which a leader delivers a message can be important.

high vs. low cost monopolist, a self-interested vs. a cooperative individual). Our setup has some
of this flavor, as advisors could be described as maintaining a reputation for honesty, although
our focus on social credibility and coordination is novel.
2. The Investment Game
2.1. The Stage Game: The game involves six players: five ‘investors’ and one ‘advisor.’ In all
versions of the game, the five investors have an initial endowment, w = 7. The investors
simultaneously make a binary choice of whether to invest or keep their entire endowment.
If an investor chooses not to invest, her payoff is the initial endowment. If she invests,
her payoff is the sum of the total number of investors choosing to invest, n, and a state variable,
θ, which represents the quality of the investment opportunity. The value of θ is uniformly
distributed over the integers {0, 1, 2, 3, 4, 5}. The payoff function𝜋(𝐼, 𝑛, 𝜃) is summarised by
the following equation, where I is an indicator variable for whether the investor chose to invest:
𝜋(𝐼, 𝑛, 𝜃) = 7(1 − 𝐼) + 𝐼(𝑛 + 𝜃) (1)
Table 1 summarises investor payoffs. Shaded cells indicate combinations of investment quality
and total investment such that an investor prefers no investment (𝑛 + 𝜃 < 7). The remaining
cells show cases in which an investor weakly prefers investing (𝑛 + 𝜃 ≥ 7). The payoff from
investing increases in 𝜃andinvestmentsarecomplements. Investors can only earn a profit
from investing if the quality of the investment is high and other investors choose to invest. An
investor never gains by unilaterally investing with the highest quality (𝜃 = 5), or from full
investment under lower quality levels (θ = 0, 1, or 2).

Table 1: Payoffs to an investor from investing
Total Investment (n)
1 2 3 4 5
Quality of
Investment
Opportunity
(θ)
0 1 2 3 4 5
1 2 3 4 5 6
2 3 4 5 6 7
3 4 5 6 7 8
4 5 6 7 8 9
5 6 7 8 9 10
Note: Shaded area leaves investor worse off than outside option of 7 ECU
The payoff for the advisor also depends on n and θ. The advisor’s payoff function is
extreme by design; for θ = 0 the advisor earns 10 if no investment occurs and 2 otherwise. For
all other values of θ the advisor earns 10 if all investors choose to invest and 2 otherwise.
Thus, the advisor’s incentives are imperfectly aligned with those of the investors. Like
investors, the advisor prefers that no investment occur when θ = 0. For high quality levels (θ =
3, 4, or 5), the advisor and investors both want full investment. When 𝜃 ∈ {1,2}, the advisor
benefits a great deal from getting full investment while investors cannot gain from investment.
This misalignment of incentives creates the tension between the advisor’s and investors’
interests. Even with higher quality, where investors can also benefit from investment, the
advisor still stands to gain more from convincing investors to abandon their safe outside option.
This misalignment of incentives between leaders and followers is a natural feature of
organisational environments where management is more invested in and better rewarded for
the success of a specific project than any of the participants.
Information plays a central role in the investment game. Investors only know the
distribution of θ. The advisor receives a noisy signal 𝜃C about the value of θ. With probability
p, 𝜃C = 𝜃. Otherwise, each of the five possible incorrect signals is equally likely—i.e., the

probability of each of the five possible incorrect signals equals (1 - p)/5. The value of p is fixed
and commonly known.
The advisor’s sole action in the baseline version of the investment game is to send a
message to investors. This message is sent after the advisor receives her signal and before
investors choose whether or not to invest. In the baseline, the advisor sends a binary message,
‘Invest’ or ‘Don’t Invest.’ The instructions refer to this message as a ‘recommendation.’
Implicitly it contains advice based on the advisor’s private information.9 Advisors are free to
use the messages deceptively and, as will be seen, frequently advise investment when it cannot
possibly benefit investors.
2.2. Investment Game, Stage-game Equilibria: Without advice, the stage game has two pure-
strategy equilibria, one where investors never invest and one where investors always invest.
We refer to these respectively as the ‘Never Invest’ equilibrium and ‘Always Invest’
equilibrium. The Never Invest equilibrium yields an expected payoff of 7 for investors and 3DE
for advisors, and the Always Invest equilibrium yields an expected payoff of 7.5 for investors
and 8FE for advisors. Due to the complementarity of investment, no pure-strategy equilibria exist
in which some investors invest while others do not.10
When advisors may send messages, the set of pure-strategy equilibria expands to
include babbling equilibria where advisors send any message, which is ignored by investors
who then play one of the two equilibria described above. There is also an informative
equilibrium in which the advisor recommends investment if and only if 𝜃C > 0, and investors
always follow the advice. Expected payoffs from this equilibrium Pareto dominate either type
of babbling equilibrium (7.73 and 9.47 for investors and advisors, respectively). Since this
9 The messages are chosen to have a natural meaning. While subjects are free to ignore the natural meanings, there is no reason to do so and we find no evidence that subjects interpreted the messages in any other way. 10 The investment game has a symmetric mixed-strategy equilibrium in which investors invest with probability 7/8. This equilibrium is not stable and is unlikely to be empirically relevant.

equilibrium always yields the best possible outcome for the advisor, conditional on the signal,
we refer to it as the ‘Advisor Optimal’ equilibrium.
2.3. Investment Game, Repeated Game Equilibria: In the baseline treatment of our experiment,
subjects repeat the game with messages twenty times in fixed groups of one advisor and five
investors. After each game, investors observe the quality, how many others invested, and what
message the advisor sent. Advisors observe all of the preceding as well as their signal. Because
there are multiple equilibria in the stage game, the set of equilibria expands even with finite
repetition (Benoit and Krishna, 1985).11
Fixing terminology, let T be the number of periods in the game. For our experiment, T
= 20. Let OJK = LnJ, θJ, θCJ, mJNbe the advisor’s observed outcome for period t. This consists of
the number of investors choosing to invest (nt), the quality of the investment opportunity (θt),
the signal ( θCJ ), and the advisor’s message ( mJ ∈ {Invest, DonQtInvest} ). Let HJK =
OSK × OUK × …× OJWSK be the advisor’s history entering period t. Let σJKYHJK, θCJZ →
{Invest, DonQtInvest} be the advisor’s strategy for period t.
In an analogueous fashion, let OJ\,] = {IJ], nJ, θJ, mJ}be the nth investor’s observed
outcome for period t. This consists of whether the nth investor chose to invest ( IJ] ∈
{Invest, DonQtInvest}), the total number of investors choosing to invest (nt), the quality of the
investment opportunity (θt), and the advisor’s message (mJ ∈ {Invest, DonQtInvest}). Let
HJ\,] = OS
\,] × OU\,] × …× OJWS
\,] be the nth investor’s history entering period t. Let
σJ\,]YHJ
\,], mJZ → {Invest, DonQtInvest} be the nth investor’s strategy for period t.
Rather than considering the full set of possible (perfect Bayesian) equilibria, we instead
initially restrict our attention to a set of ‘cutoff’ equilibria that are tractable and relevant for our
11 Repetition does not change the set of equilibria in the game without messages. To see this, note that if four or fewer investors choose to invest, the expected payoff falls below 7. The result follows directly.

experiments. In a cutoff equilibrium, the advisor initially uses a threshold rule (cutoff) to
determine what advice is sent and investors follow his advice. This continues until a deviation,
intentional or otherwise, is observed or the terminal phase is entered. If a deviation occurs, play
for all subsequent periods reverts to a punishment equilibrium. If the terminal phase is reached
(τ ≥ T) without any deviations occurring, play switches to a reward equilibrium.
More formally, strategies in a cutoff equilibrium are defined by an integer k ∈
{0,1,2,3,4,5}, a terminal period 1 < τ < T, a reward equilibrium, and a punishment equilibrium.
We narrow the set of cutoff equilibria by restricting attention to the reward (punishment)
equilibrium that is best (worst) for advisors. This implies that the reward equilibrium is the
stage-game equilibrium that maximises the advisor’s expected payoff, the Advisor Optimal
equilibrium, and the punishment equilibrium is the stage game equilibrium that minimises the
advisor’s expected payoff, the Never Invest equilibrium. For t > 1, define an advisor as having
previously ‘deviated’ if there exists s < min[t,τ] for which ms = ‘Invest’ and θa < k. The
strategies for each role within a cutoff equilibrium are defined as follows.
1) Advisors: If 1 < t < τ and the advisor has not previously deviated, then σJKYHJK, θCJZ =
‘Invest’ if θCJ ≥ k and ‘Don’t Invest’ otherwise. If τ ≤ t ≤ T and an advisor has not deviated
prior to period τ, he plays consistent with the reward equilibrium. If he has deviated in
period s < t, he plays consistent with the punishment equilibrium in period t.
2) Investors: Abusing notation, let I1 = m1. If 1 < t < τ and the advisor has not previously
deviated, It = mt. If τ ≤ t ≤ T and the advisor has not deviated prior to period τ , investors
play consistent with the reward equilibrium. If the advisor has deviated in period s < t,
investors play consistent with the punishment equilibrium in period t.
It is trivially true that there exist (perfect Bayesian) equilibria with k = 0 or 1, as in both
cases the equilibrium implements repeated play of a stage-game equilibrium. The more
interesting cases are when k = 2, 3, 4, or 5. For these values of k, play of a cutoff equilibrium
does not initially involve play of a stage-game equilibrium.
PROPOSITION 1: For p > ½, there exists a cutoff equilibrium for 2 ≤ k ≤ 5 with T ≥ 3 and τ
= T – 1. There does not exist any cutoff equilibrium for 2 ≤ k ≤ 5 with τ = T.
PROOF: See Online Appendix A.
We have thus far shown that there exist equilibria where advisors offer conservative
advice relative to the ‘Advisor Optimal’ equilibrium, initially recommending investment in
round t only for cases where 𝜃Cb ≥ k > 1. These equilibria are undesirable because of the high
probability that punishment is triggered, combined with the ‘grim’ nature of punishment. For
the parameter values in our experiments, the ‘Advisor Optimal’ equilibrium is better for both
advisors and investors than any of the cutoff equilibria described above. This raises the
question of whether an equilibrium can be constructed that uses conservative advice and
increases investor payoffs. This is indeed possible by setting k = 2 and only punishing
deviations for a two-period phase. The only case where the advisor can potentially gain from
deviating is when θC = 1, since he advises ‘Don’t Invest’ when he would prefer full investment.
The loss from playing the Never Invest equilibrium for two periods is sufficiently large to offset
the gains from this deviation (see Online Appendix A for details). Henceforth, we refer to the
equilibrium with k = 2 and two periods of punishment as the ‘Investor Optimal’ equilibrium.
This increases investors’ expected payoffs relative to the Advisor Optimal equilibrium (7.76
vs. 7.73).
Greater efficiency could be achieved if only a single period of punishment was
necessary, but this is insufficient to support an equilibrium with k = 2.12 There are similar
12 Efficiency can be improved by only punishing if the message ‘Invest’ is sent when θ = 1, rather than punishing if the message ‘Invest’ is sent when θ = 0 or θ = 1. This reduces the probability of punishment and increases the expected payoff of investors to 7.79. This equilibrium is more complex that the Investor Optimal equilibrium and does not appear to be empirically relevant in our data.
equilibria with k ≥ 3, but three periods of punishment are necessary because the future benefit
from not cheating and not being punished is lower. The need for punishment on the equilibrium
path as part of a repeated equilibrium with k = 2 therefore limits the benefits of conservative
advice. If advisors had perfect information, implying that no punishment took place on the
equilibrium path, investor payoffs would be 8 and 8.5 in the Advisor Optimal and Investor
Optimal equilibrium, respectively. This resembles the observation that punishment in public
goods games substantially increases contributions, but individual benefits take longer to appear
due to the costs of punishments (Gürerk et al., 2006; Gächter et al., 2008), and may never
appear (Nikiforakis, 2008).
Generally speaking, supporting an equilibrium that involves the conservative use of
advice requires that aggressive advice (calling for investment when θC ≤ 1) be punished. The
Investor Optimal equilibrium is a Green-Porter (1984) style equilibrium consisting of long
periods of play of the investor optimal outcome (investment if θC > 1) interspersed with
randomly occurring two-period punishment phases with no investment. In equilibrium,
punishment takes place even though the investors do not believe the advisor is being deceptive.
It is part of the path of play needed to keep the advisor from calling for investment when it
does not benefit investors. Hence, social credibility is an equilibrium phenomenon.
In examining our data, note that play of an Investor Optimal equilibrium involves both
conservative advice and use of punishment. If the Advisor calls for investment and the resulting
state is θ = 0 or θ = 1, investors should subsequently respond by becoming unwilling to follow
advice. As we showed above, if they are playing optimally then this punishment should last
two periods. However, there also exist equilibria with longer punishment spells, as well as
equilibria involving more conservative advice.
3. Experimental design

All experimental sessions were conducted at the xs/fs laboratory of Florida State University.
We used ORSEE to recruit subjects (Greiner, 2015) and zTree to implement the experiment
(Fischbacher, 2007). Sessions had between 12 and 24 subjects, and a total of 690 subjects
participated.
Subjects were told that the experiment would be divided into three stages for a total of
50 periods. Subjects received instructions for each stage before beginning that stage (see Online
Appendix E). Subjects completed a comprehension quiz after the Stage 1 instructions to ensure
they understood how payoffs were calculated. Payoffs were given in terms of Experimental
Currency Units (ECU) with a conversion rate of $1 = 25 ECU. To facilitate comprehension,
we framed the game as an investment problem. Each session lasted about 90 minutes and
average earnings were $23.57, including a $10 show-up fee.
3.1. Description of Stage 1: Stage 1 of each session lasted for 10 periods, during which the five
investors played the investment game and the advisor observed outcomes passively. After
completing the instructions for Stage 1, subjects were randomly assigned to six-person groups,
with five group members assigned the role of investor and the sixth group member given the
role of ‘observer’—this group member would later play the role of advisor. Groups remained
fixed throughout Stage 1.
In every period, investors decided simultaneously whether or not to invest and received
payoffs as described in Section 3. While investors made their decisions, they saw a screen
showing them the investment payoff table, a reminder that not investing guaranteed them their
endowment of 7 ECU, and the advisor’s (‘observer’s’) payoff table. Investors knew the
distribution of investment qualities, but not the realised quality, before deciding.
Observers did not actively participate in Stage 1, but received information and payoffs
in the same way as active advisors. Specifically, at the beginning of each period observers
received a noisy signal of the true state. This signal was accurate with probability p = 0.8 in all

conditions, except a High Precision treatment, described shortly. Observers’ payoffs were
based on the realised quality and the number of active investors in their group, as described in
Section 3.
At the end of each round, participants saw the results for their group, including the
number of participants who invested, their own payoff, and the realised quality for that period.
Investors never saw the observer’s signal in Stage 1.
Stage 1 serves three purposes. First, it allows investors to gain familiarity with the game
before advisors take an active role. Second, Stage 1 lets us observe the outcome of the
investment game in the absence of a leader (i.e., with an inactive advisor). The Never Invest
equilibrium is the secure equilibrium for the Investment Game without an active advisor, and
we anticipated that play in Stage 1 would converge to this equilibrium. Lastly, facing a stable
precedent of non-investment from investors makes the advisors’ problem more challenging
when they become active for Stage 2.
3.2. Description of Stage 2: Stage 2 continued for twenty additional periods (Periods 11 – 30)
after the conclusion of Stage 1. All subjects remained in the same fixed groups as in Stage 1,
but the observer’s passive role changed to that of an active ‘advisor.’
Advisors saw the same information and received payoffs in the same manner as in Stage
1. However, they now sent a recommendation of either ‘Invest’ or ‘Don’t Invest’ to their group
of investors after seeing the quality signal. The five investors in a group saw the
recommendation in large bold print at the top of their screen. Investors knew that the advisors
were free to give whatever recommendation they wanted, regardless of their signal, and that
all investors in their group received the same recommendation. After seeing the
recommendation, investors made their binary investment decision as in Stage 1. At the end of
each period, participants saw the same information as in Stage 1, in addition to being reminded
of their advisor's recommendation.

Stage 2 is the heart of the experimental design, as it allows us to see how adding an
active leader affects the group’s performance. The distinct experimental treatments, described
below, allow us to study how either varying the information available to advisors and investors
or expanding the message space available to advisors changes the behaviour and effectiveness
of advisors and outcomes for the groups.
3.3. Description of Stage 3: Stage 3 consisted of an additional twenty periods (periods 31 –
50). Stage 3 was identical to Stage 2 except that, before period 31, advisors were randomly
assigned to a new group of investors. Investors remained in the same group as in Stages 1 and
2, and this was all common knowledge.
Stage 3 allows us to study a pair of questions. First, can advisors learn from their
experiences in Stage 2? Given a new group to lead, will they use the same approach as in Stage
2 or will they adjust their behaviour? Second, is social credibility primarily a feature of a
particular advisor or a characteristic of a group? When advisors move to a new group, does
their reputation come with them or will the investors largely continue to do what they have
done in Stage 2, especially in terms of how they respond to advice?
At the beginning of Stage 3, advisors saw a table that summarised the Stage 1 decisions
for their new group. This was done to give advisors the same information about their Stage 3
group that advisors had at the beginning of Stage 2. We did not give them information about
their new group’s outcomes in Stage 2, so any changes in their behaviour cannot be attributed
to learning from another advisor’s experiences. Investors were given a table that summarised
the Stage 2 decisions and outcomes obtained by their new Advisor, which allows the Advisor's
reputation to potentially carry over to a new group.

3.4. Description of Experimental Treatments: Table 2 summarises the five treatment conditions
in our experimental design. Stage 1 is identical across all treatments, with the treatments taking
effect for Stages 2 and 3.
The Baseline treatment is, as the title indicates, the baseline for our experiment. It is
the basic version of the experiment as described above, with p = .8.
Each of the five other treatments varies from the Baseline treatment by changing a
single element. For the first three treatments, the variations are intended to study factors that
potentially make it easier for the leaders to develop social credibility. The final two treatments
were added subsequently to better understand the role of advisors.
Table 2: Treatment differences, stages 2 and 3 (Periods 11-50)
Treatment Active Leader
Signal Accuracy Available Messages Signal Observed
Ex Post
Baseline (21 groups) Yes p = 0.8 ‘Invest’ or ‘Don’t Invest’ No
Signal Report (23 groups) Yes p = 0.8 ‘Invest’ or ‘Don’t Invest’
& Signal Report No
Signal Revealed (21 groups) Yes p = 0.8 ‘Invest’ or ‘Don’t Invest’ Yes
High Precision (19 groups) Yes p = 0.9 ‘Invest’ or ‘Don’t Invest’ No
Automated Advisor (16 groups) No p = 0.8 ‘Invest’ or ‘Don’t Invest’ No
Symmetric Info (15 groups) Yes p = 0.8 ‘Invest or Don’t Invest’ Ex Ante
The Signal Report treatment is identical to the Baseline treatment, except advisors in
Stages 2 and 3 have the option to send a cheap-talk report of their signal along with their
recommendation to either invest or not invest. The report could be any integer from ‘0’ to ‘5’
and did not need to be the actual signal the Advisor received. The investors saw the report sent
(if any) just below the recommendation at the top of their screen in large bold print. If an
Advisor chose not to send a report, investors saw ‘No Report Sent’ in this space.

Expanding the message space has no effect on outcomes supported by either a stage
game or repeated game equilibria. Nonetheless, the expanded message space could prove
useful for advisors. Consider an advisor facing a history of little or no investment. Rather than
attempting an immediate jump to the Advisor Optimal equilibrium, this advisor might try to
gradually work his way towards this by encouraging investment following signals that the
investment is high quality (θ = 3, 4, or 5). Sending a signal report allows an advisor to make a
more precise and hopefully persuasive recommendation, though this logic relies on the signal
reports being both credible and socially credible.
The Signal Revealed treatment added one piece of information to the investors’ results
screen at the end of each period in Stages 2 and 3, the actual signal received by the advisor.
For the stage game, this change cannot affect the equilibrium since it occurs after all decisions
have been made. But in the repeated version of the game, ex post observation of the signal by
investors changes the nature of the Investor Optimal equilibrium. It is no longer a Green-Porter
(1984) style equilibrium, with periods of punishment even when no deviations have taken
place, because investors can now perfectly discern whether or not the advisor deviated from
the equilibrium. The basic structure of the equilibrium remains similar, with two periods of
punishment still required to support a message of ‘Don’t Invest’ when θC = 1, but the Investor
Optimal equilibrium becomes more attractive for both roles since there aren’t any punishment
phases in equilibrium. Moreover, the Investor Optimal equilibrium becomes safer (i.e., there is
lower variance in payoffs) with the elimination of unwarranted punishments.
As with the Signal Report treatment, we expected that the Signal Revealed treatment
would make it easier to overcome a history of little or no investment. Revealing the advisor's
signal makes her advice verifiable, reducing the possibility that establishing credibility will be
disrupted by an incorrect signal.

The High Precision treatment increased the probability of receiving an accurate signal
from p = 0.8 to p = 0.9. This does not affect the equilibrium predictions for either the stage or
finitely-repeated versions of the investment game. For either the Advisor Optimal or Investor
Optimal equilibria, payoffs are predicted to be higher for both roles relative to the Baseline
treatment. In part this reflects a direct effect, as it is less likely that an incorrect signal leads to
the advisor recommending investment accidentally when investment quality is low (or not
recommending investment when quality is high). Additionally, there is an indirect effect, as a
reduction in incorrect signals reduces the probability that a punishment phase is triggered in
the Investor Optimal equilibrium.
We expected that the High Precision treatment would ease the advisor’s task in
overcoming a history of low investment. If successful leadership requires building trust and
credibility, bad advice due to inaccurate signals can only undermine the development of social
credibility by advisors.
We also conducted two follow-up treatments to further examine how advice influences
behaviour and outcomes. The Automated Advisor treatment explores how effective and
profitable the Advisor Optimal equilibrium might be in practise, if advisors attempted to pursue
it. While it is straightforward to compare outcomes in the Baseline treatment with the
theoretical predictions for the Advisor Optimal equilibrium, such comparisons are somewhat
misleading. In theory the equilibrium being played is common knowledge, but in practise there
is no way for investors to immediately know which of the many possible equilibria, if any, is
being played. The Automated Advisor treatment provides a behavioural benchmark for what
would happen if advisors played the Advisor Optimal equilibrium, but investors did not possess
any more information regarding the advisor’s strategy than in the Baseline. This treatment took
away the ability of advisors to control their recommendations. While there was still a subject
in the advisor role, a message of ‘Don’t Invest’ was automatically sent following a signal of 0

and a message of ‘Invest’ was automatically sent otherwise—i.e., the messages sent in the
Advisor Optimal equilibrium.13 Investors knew that their advisor had no control over the
recommendations, but did not know the precise rule generating recommendations, only that the
automated advisors followed a fixed rule.
Finally, the Symmetric Information treatment isolates social credibility by allowing
investors in Stages 2 and 3 to see the same information as the advisor. Investors and advisors
knew that they all saw the same signal about quality at the beginning of the period. Otherwise
the treatment is identical to the Baseline treatment, with advisors choosing whether to send
‘Invest’ or ‘Don’t Invest’ messages and investors then choosing whether to invest. Advisors in
the Baseline treatment have a dual role, serving as a conduit for information and also as a
coordinating device for their group. Social credibility is largely about the latter role—if an
advisor calls for investment, do investors believe that others will follow this advice and thus
choose investment themselves? By eliminating the informational role, the Symmetric
Information treatment lets us explore the importance of advisors’ social credibility in isolation.
Despite having complete access to all of the information on which the advisor’s
recommendation is based, a group in the Symmetric Information may nevertheless use an
advisor’s recommendations to solve the problem of equilibrium selection.
3.5. Predictions: Before presenting the results, we briefly summarise some expectations. While
there are many possible metrics we could use for measuring performance, we focus on how
payoffs for advisors and investors vary across versions of the game.14
First, we expect payoffs for both investors and advisors in all treatments to increase in
Stages 2 and 3, relative to Stage 1. Stage 1 was designed to trap investors in the Never Invest
13 We had a subject play the advisor role to make this treatment directly comparable to the other treatments. In each round, the passive advisor clicked a button confirming the recommendation choice made by the computer. 14 Total investment is another possibility, but less investment isn’t necessarily bad. The Investor Optimal equilibrium leads to less investment than the Advisor Optimal equilibrium but is better for investors.

equilibrium, and we expect a shift in Stage 2 to either the Advisor Optimal or Investor Optimal
equilibrium, which benefits both advisors and investors. That said, the Never Invest
equilibrium remains an equilibrium and prior studies (e.g., Van Huyck, Battalio and Beil, 1990)
show that overcoming a history of coordination failure can be a non-trivial task.
Second, relative to the Baseline treatment, we expect all three of our primary treatments
(Signal Report, Signal Revealed, High Precision) to increase the likelihood of playing an
equilibrium in which investors follow advisors’ recommendations (e.g., the Advisor Optimal
or Investor Optimal equilibria), rather than a babbling equilibrium with no investment. That is,
we expect that all three treatments will facilitate the development of social credibility by the
advisor, and therefore raise earnings for both the advisor and investors, albeit through differing
channels. Signal Report makes it possible to give more nuanced advice, Signal Revealed
eliminates the need to punish in equilibrium, and High Precision makes informative advice
more valuable and accidental punishment less likely. We anticipate the main determinant of
performance will be whether any equilibrium emerges in which investors follow the advisor’s
recommendations, rather than which non-babbling equilibrium emerges. We do not predict any
particular ranking of payoffs between the Signal Report, Signal Revealed, and High Precision
treatments, as all three treatments are designed to have an effect relative to the Baseline.
The Automated Advisor treatment explores the effect on behaviour and payoffs if
advisors were to pursue the Advisor Optimal equilibrium. We expect that payoffs will be lower
for both roles than when the advisor has the flexibility to manage social credibility, as in the
Baseline treatment. Finally, the Symmetric Information treatment provides a setting in which
the advisor’s influence operates solely through social credibility. This allows us to test whether
advisors have any effect on group outcomes when their advice contains no informational value.
Because social credibility is important for coordination, we expect that investors will continue
to respond to advice even when it has no informational value.

4. Results
In presenting the results, we first study whether the introduction of active leaders in Stages 2
and 3 improved matters in the primary treatments (Baseline, Signal Report, Signal Revealed,
and High Precision) and whether this improvement varied by treatment. We then explore how
advisors in the primary treatments tried to lead their groups—i.e., whether they attempted to
manage their social credibility—and how this influenced the observed treatment effects. We
also explore whether behaviour is consistent with play of an equilibrium. Finally, we test for
carryover effects between Stages 2 and 3 and compare behaviour in the Baseline with the
Automated Advisor and Symmetric Information treatments.
Stage 1 was intended to induce low investment, giving advisors a history of
coordination failure to overcome. This largely worked. Pooling all six treatments, which are
identical in Stage 1, Investment is chosen by 51% of investors in Period 1, making investment
unprofitable in expectation.15 By Period 10, only 25% of investors are still investing and 73%
of the groups have a total investment of 0 or 1. Our regressions control for the variation in
Stage 1 outcomes across groups and treatments.
4.1. Overview of Results from Primary Treatments: With the introduction of active advisors in
our four primary treatments, average total investment is slightly higher in Stage 2 (2.20) and
Stage 3 (2.08) than in Stage 1 (1.73). Total investment is generally quite stable across Stages
2 and 3 (see Online Appendix B for a figure showing investment over time). More telling is
how investment responds to the quality of the investment opportunity. To illustrate this, we
divide the data into ‘bad quality,’ the low qualities where investment never pays for investors
(quality = 0 or 1), and ‘good quality’ (quality = 2, 3, 4, or 5). In Stage 1, total investment is
15 As expected, there is no systematic variation in Stage 1 across treatments. If we regress total investment on treatment dummies and period dummies, the treatment dummies are not jointly significant (p = .315).

roughly the same with bad and good quality (1.90 vs. 1.64), as expected given the lack of
advice. However, with the introduction of advice, the level of investment is sharply lower with
bad quality than good quality in Stage 2 (0.81 vs. 2.87) and Stage 3 (0.49 vs 2.81).
The strong positive relationship between total investment and investment quality
suggests that information is being transmitted from the advisors to the investors. Figure 1
provides a detailed picture of how this works. We include data from all four principal
treatments, pooled over Stages 2 and 3.
Figure 1: Relationship between Investment, Quality, and Advice
Note: Data pooled from Stages 2 and 3
Panel A shows the relationship between advice and investment quality. The cluster of
bars on the left shows the percentage of advisors recommending investment as a function of
0%
25%
50%
75%
100%
Signal True Quality
Panel A: Frequency of "Invest" Advice by Signal or True Quality
Qual 0 Qual 1 Qual 2 Qual 3 Qual 4 Qual 5
0%
25%
50%
75%
100%
Don't Invest Invest
Panel B: Total Investment by Advice
Total = 0 Total = 1 Total = 2 Total = 3 Total = 4 Total = 5

the advisor’s signal; the cluster on the right shows the same information substituting the true
value of the investment’s quality for the advisor’s signal. In both cases there is a strong positive
relationship between the signal/quality and advice to invest. The relationship between signals
and advice is unsurprisingly stronger than the relationship between true quality and advice.
Panel B of Figure 1 shows that investors respond to advice. It displays the distribution
of total investment as a function of the advisor’s recommendation.16 When the advisor does
not recommend investment, very little investment occurs. A recommendation to invest yields
more mixed results: investment by all five investors is the modal outcome, but roughly half of
the cases yield lower total investment, with a great deal of heterogeneity. An interesting
question is whether this reflects heterogeneity across groups or, alternatively, whether all
groups vary over time in their tendency to follow an advisor. To address this question Online
Appendix C presents, separately for each treatment and group, the mean frequency of
investment following the two possible recommendations. Not surprisingly, practically every
group follows a recommendation not to invest. However, following a recommendation to
invest, there is considerable heterogeneity across groups: some groups almost always invest
fully, while others have very little investment. Across all treatments, roughly half of the groups
have high average investment following a recommendation to invest.17
The generally successful transmission of information from advisors to investors
translates into higher profits for both roles. Figure 2 shows the average earnings of investors
(Panel A) and advisors (Panel B) over time. The figure pools data from all four primary
treatments and uses five-period averages to smooth variation. As benchmarks, each panel also
provides the expected payoffs under the equilibria described above (Always Invest, Advisor
16 Appendix B provides a figure and tables showing mean investment levels conditional on advice and on signals, as well as a table indicating the frequency of profitable investment outcomes for investors. 17 To quantify this observation, the proportions of groups in each treatment in which recommendations to invest produce investment of at least 4, on average, are 43% (Baseline), 57% (Signal Revealed), 48% (Signal Report) and 68% (High Precision).

Optimal, and Investor Optimal). As Figure 2 shows, both investor and advisor payoffs jump at
the beginning of Stage 2, relative to Stage 1, and remain fairly stable subsequently. Online
Appendix Figures B2 through B5 shows that this pattern is similar in all four primary
treatments. The figure also shows that the changes are substantial, relative to the range of
possible equilibrium payoffs. Figure 2A suggests that average earnings for investors converge
to those expected in the ‘Always Invest’ babbling equilibrium in Stages 2 and 3, while Figure
2B suggests that advisor average payoffs converge to expected payoffs for none of the
equilibria. However, as we as we show later, there is substantial heterogeneity in behaviour
and earnings across groups.
At this point, we can draw some initial conclusions. With the introduction of advisors,
play departs from the Never Invest equilibrium. Total investment, advisor payoffs, and investor
payoffs all increase between Stages 1 and 2, and this difference is statistically significant—
pooling data from all four primary treatments, the null is rejected for all three measures at the
1% level using two-tailed Wilcoxon signed-rank tests (z = 2.95, 7.46, and 7.66, respectively,
for total investment, advisor payoffs and investor payoffs).18
Result 1: Average payoffs for both investors and advisors increase for Stages 2 and 3
relative to Stage 1.
18 These tests treat each group as a single observation. For investor payoffs, this means we calculate average payoffs for the group rather than the individual investors, as investors within the same group are not independent observations. We use only Stage 2 data, and exclude Stage 3, since the re-matching destroys independence between groups; however, average payoffs for both roles remain above the Stage 1 averages. A slightly different question is whether, in the long run, investors do better with a leader than without one. To address this, we conducted analogueous Wilcoxon signed-rank tests comparing behaviour in the last five periods of Stage 1 and the last five periods of Stage 2. Pooling all of the primary treatments, the difference is significant at the 1% level (z = 6.32). This is also true by treatment (z = 2.72, 3.54, 3.12, and 3.31 for the Baseline, Signal Report, Signal Revealed, and High Precision treatments respectively).
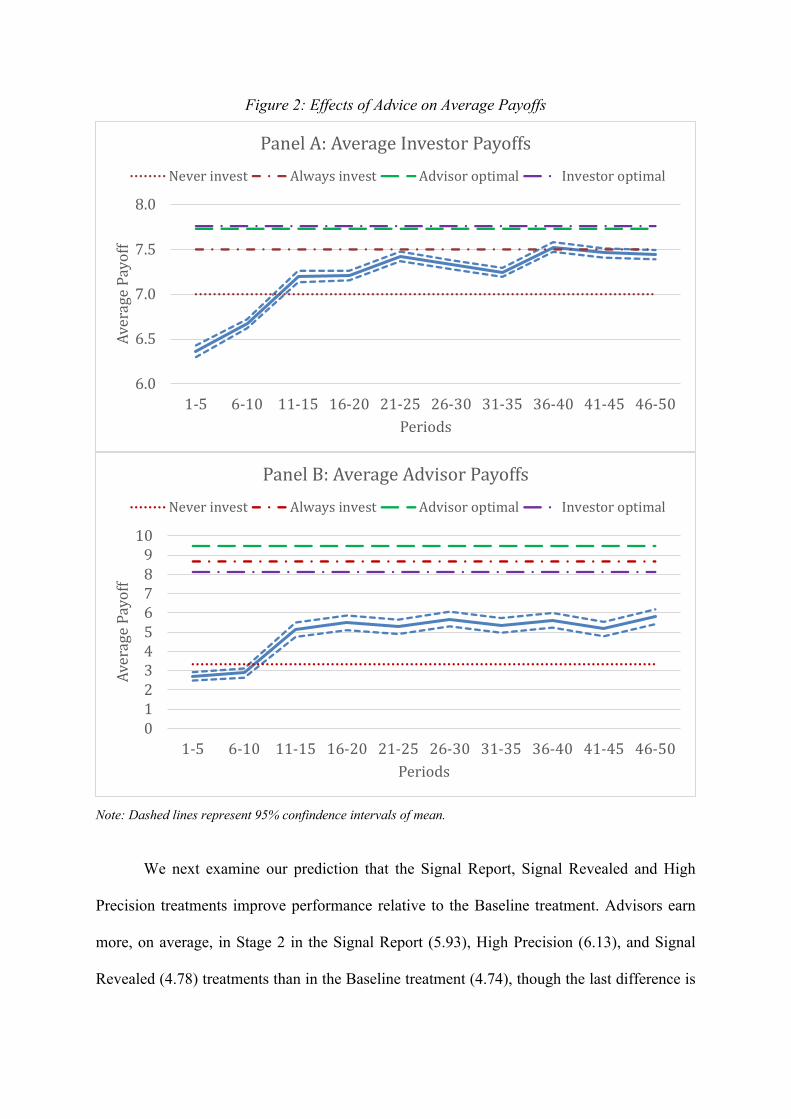
Figure 2: Effects of Advice on Average Payoffs
Note: Dashed lines represent 95% confindence intervals of mean.
We next examine our prediction that the Signal Report, Signal Revealed and High
Precision treatments improve performance relative to the Baseline treatment. Advisors earn
more, on average, in Stage 2 in the Signal Report (5.93), High Precision (6.13), and Signal
Revealed (4.78) treatments than in the Baseline treatment (4.74), though the last difference is
6.0
6.5
7.0
7.5
8.0
1-5 6-10 11-15 16-20 21-25 26-30 31-35 36-40 41-45 46-50
AveragePayoff
Periods
PanelA:AverageInvestorPayoffsNeverinvest Alwaysinvest Advisoroptimal Investoroptimal
012345678910
1-5 6-10 11-15 16-20 21-25 26-30 31-35 36-40 41-45 46-50
AveragePayoff
Periods
PanelB:AverageAdvisorPayoffsNeverinvest Alwaysinvest Advisoroptimal Investoroptimal
very small.19 A similar pattern is present for investor payoffs, with higher payoffs for Stage 2
in the Signal Report (7.37), High Precision (7.43) and Signal Revealed (7.19) treatments than
in the Baseline treatment (7.17), albeit barely in the last case.
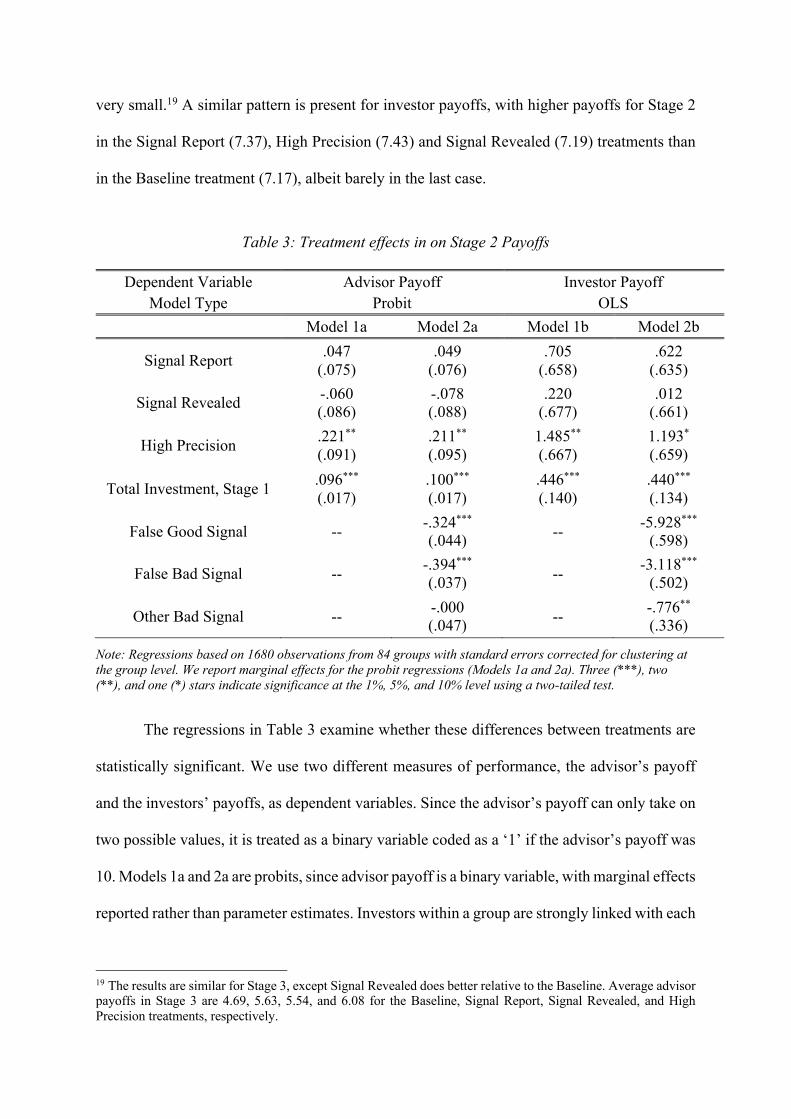
Table 3: Treatment effects in on Stage 2 Payoffs
Dependent Variable Advisor Payoff Investor Payoff Model Type Probit OLS
Model 1a Model 2a Model 1b Model 2b
Signal Report .047 (.075)
.049 (.076)
.705 (.658)
.622 (.635)
Signal Revealed -.060 (.086)
-.078 (.088)
.220 (.677)
.012 (.661)
High Precision .221** (.091)
.211** (.095)
1.485** (.667)
1.193* (.659)
Total Investment, Stage 1 .096*** (.017)
.100*** (.017)
.446*** (.140)
.440*** (.134)
False Good Signal -- -.324*** (.044) -- -5.928***
(.598)
False Bad Signal -- -.394*** (.037) -- -3.118***
(.502)
Other Bad Signal -- -.000 (.047) -- -.776**
(.336)
Note: Regressions based on 1680 observations from 84 groups with standard errors corrected for clustering at the group level. We report marginal effects for the probit regressions (Models 1a and 2a). Three (***), two (**), and one (*) stars indicate significance at the 1%, 5%, and 10% level using a two-tailed test.
The regressions in Table 3 examine whether these differences between treatments are
statistically significant. We use two different measures of performance, the advisor’s payoff
and the investors’ payoffs, as dependent variables. Since the advisor’s payoff can only take on
two possible values, it is treated as a binary variable coded as a ‘1’ if the advisor’s payoff was
10. Models 1a and 2a are probits, since advisor payoff is a binary variable, with marginal effects
reported rather than parameter estimates. Investors within a group are strongly linked with each
19 The results are similar for Stage 3, except Signal Revealed does better relative to the Baseline. Average advisor payoffs in Stage 3 are 4.69, 5.63, 5.54, and 6.08 for the Baseline, Signal Report, Signal Revealed, and High Precision treatments, respectively.

other, so the dependent variable in Models 1b and 2b is the sum of payoffs for investors within
a group. We use standard OLS regressions in these models.
All of the groups are statistically independent in Stage 2. In Stage 3, after advisors
switch groups, groups sharing a common advisor between Stages 2 and 3 are no longer
independent. Therefore, we restrict our statistical analyses of treatment effects to Stage 2 and
adjust standard errors for clustering at the group level.
The independent variables in Models 1a and 1b are treatment dummies (with the
Baseline treatment serving as the omitted category), the average total investment for the group
in Stage 1, dummies for investment quality, and dummies for the current five-period block.
The parameter estimates for the investment quality and block dummies are not of direct interest
and are not reported in Table 3 to save space. For Models 2a and 2b, we add controls for bad
signals (the signal does not equal the true quality). These are broken down into three categories:
‘False Good Signal’ for cases where the signal is in the range 2 – 5 and the quality is 0 or 1,
‘False Bad Signal’ for cases where the signal is either 0 or 1 and the quality is in the range 2 –
5, and ‘Other Bad’ for all other bad signals.20
Looking at the results, the High Precision treatment has a significant positive effect
relative to the Baseline treatment for both advisor and investor payoffs. This is true even after
controlling for the direct effects of bad signals—i.e., advisors and investors earn higher payoffs
with high precision signals even after controlling for the immediate effect of having fewer bad
signals in the High Precision treatment. This suggests that the High Precision treatment has
both a direct and indirect effect, as discussed in Section 3.4.
20A false good (bad) signal is likely to yield a mistaken recommendation to invest (not invest). Thus, these two types of false signal are likely to have opposite effects on total investment, but the same effects on advisor payoffs and investor payoffs.

Result 2: Payoffs for advisors and investors increase in the High Precision treatment
relative to the Baseline treatment. These changes are not solely due to the direct effect
of a lower frequency of bad signals.
The other two treatments do not yield significant differences from the Baseline
treatment. The coefficients for the Signal Report treatment have the predicted sign, but are
much smaller in magnitude than for the High Precision treatment and not statistically
significant. The effect of the Signal Report treatment looks large in the raw data, but this is
driven in part by relatively high total investment in Stage 1 of the Signal Report treatment.
4.2. Behaviour of Advisors and Investors: This section begins by looking at what rules advisors
adopted and how successful these rules were at increasing their payoffs.21 We then examine
investors’ responses to bad advice and how this affects the rules adopted by advisors. We finish
by exploring whether the advice given by advisors and the responses by investors differ across
treatments. Our analysis of these issues focuses on Stage 2, where the advisors are independent,
and we provide only minimal descriptive statistics for Stage 3.22
Table 4: Classification of Advisor Types
Stage 2 Stage 3
Advisor Optimal 12 (14%) 6 (7%) Investor Optimal 24 (29%) 23 (28%)
Conservative 20 (24%) 29 (35%)
Unclassified 28 (33%) 25 (30%) Note: Data pooled from four primary treatments
21 We use the term ‘rule’ to make it clear that we are not identifying strategies in the game-theoretic sense. An advisors’ strategy is (potentially) contingent on the past history as well as the current signal. 22 In Stage 3, what an advisor does and how it works is influenced both by what his previous group of investors did and by what the previous advisor of his Stage 3 group did in Stage 2.

Define a cutoff rule for an advisor as a rule that calls advising ‘Invest’ if and only if
Signal ≥ k, for some k ∈ {0,1,2,3,4,5,6}. We classified each recommendation by an advisor in
a specific period according to all the cutoff rules with which it was consistent—note that most
recommendations were classified as consistent with multiple cutoff rules. We then assigned to
each advisor the cutoff rule with which her recommendations were consistent for the most
periods in the stage. We used these assignments to generate three cutoff types: Advisor Optimal
(k = 1), Investor Optimal (k = 2), and Conservative (k ≥ 3).23 Ties were broken in favour of the
least conservative type. Finally, if an advisor’s recommendations were not consistent with
some cutoff rule in at least 95% (19 of 20) of the periods in the stage, they were assigned to
the Unclassified type. This demands a high level of consistency from advisors, leading to a
relatively large number being labelled as ‘Unclassified.’ Table 4 breaks down the distribution
of types for Stages 2 and 3 in the four primary treatments.24
A high proportion of advisors are assigned a type that is more conservative than the
Advisor Optimal rule, a proportion that grows slightly between Stages 2 and 3. There is good
reason for this, as Figure 3 makes clear. This figure looks at advisors’ performance along two
dimensions. Data for this figure is drawn from the four primary treatments as well as the
Automated Advisor treatment for Periods 21–30—the last 10 periods of Stage 2, after group
behaviour has some time to settle down.25 We limit the sample to groups that entered Stage 2
with a history of low investment, specifically total investment of 0 or 1 for Period 10.26 This
yields 73 groups. The first cluster of bars, on the left, shows the percentage of advisors, by
type, who had earnings above the median (for advisors in the sample) for Periods 21-30. The
23 There were no subjects most consistent with k = 0. 24 There was one advisor who left after Period 38. This advisor is not included in the typology for Stage 3.25 Data from the Automated Advisor treatment is added to increase the sample size for the Advisor Optimal category from seven observations to twenty observations. The average period earnings in Periods 21 – 30 are statistically indistinguishable for the human advisors categorised as using the Advisor Optimal rule and the automated advisors (5.20 vs. 4.52; z = .481; p = .630). 26 For groups with a history of low investment, advisors have reason to be conservative. In groups already investing prior to having an advisor, advice is more readily followed. In these groups advisors should be aggressive in giving advice, which is what we see, but the low sample size prevents more detailed analysis.

second cluster shows the percentage of periods, by advisor type, in which the advisor earned
the high payoff of 10 ECU. Consistently following the Investor Optimal rule more than doubles
the chance of having earnings above the median, relative to the other advisor types, and yields
substantially higher advisor payoffs than the three other advisor types.27
Figure 3: What makes an advisor successful?
Note: Groups with low Stage 1 investment (Total Investment < 2) in Period 10. Data pooled from Periods 21 – 30 in four primary treatments, plus the Automated Advisor treatment.
Our goal in the preceding analysis is to identify how well advisors did as a function of
the rules they used for sending advice. Ideally we would be able to directly observe the
advisor’s full strategy, but we cannot. 28 It is unlikely we have many advisors who are
incorrectly assigned within the three specified advisor types (i.e., an individual following the
Advisor Optimal rule is classified as Investor Optimal) since we demand a high degree of
27 Measures of statistical significance should be interpreted cautiously, since advisor types cannot be considered truly exogenous. Nevertheless, if we limit the data to groups with a history of low investment and use Mann-Whitney tests, payoffs in Periods 21-30 are significantly higher for advisors classified as Investor Optimal types than for those classified as Advisor Optimal (z = 2.14; p = 0.033) or Conservative types (z = 2.56; p = 0.011). 28 Using the strategy method would not fix this problem. We could observe a subject’s strategy for the stage game, but not their full strategy for the repeated game, which is the more important issue.
0%
25%
50%
75%
100%
% Advisors Above Median Payoff % Periods Earn Payoff of 10
No Identified Strategy Advisor Optimal Investor Optimal Conservative

consistency to assign an advisor to a type. The bigger issue is that we have a large number of
unclassified advisors. This could be a problem if, for instance, Unclassified advisors initially
followed the Investor Optimal rule but did poorly and then changed their behaviour. This would
imply that advisors classified as Investor Optimal types are a selected sample, who were lucky
or successful for other reasons. To see how the behaviour of Unclassified advisors might affect
our conclusions, we need to know more about these advisors. In Online Appendix D, we
examine the behaviour of the Unclassified advisors. The main conclusions of this analysis are
that (i) the above results are robust to a more lax classification system (a 90% rule instead of a
95% rule) that reduces the number of Unclassified advisors, (ii) Unclassified advisors do not
seem to arise from different circumstances than classified advisors, such as lower investment
in Stage 1 or more frequent inaccurate signals in the early parts of Stage 2, and (iii) Unclassified
advisors appear to be particularly prone to random errors. To the extent that we can identify
Unclassified advisors with another type, they appear to be advisors who started as Advisor
Optimal and shifted to more conservative behaviour. Nothing suggests that our conclusions
about the performance of different types of advisors is driven by how advisors are assigned to
the Unclassified category.
To summarise, the evidence strongly indicates that the Investor Optimal rule yields
higher payoffs for advisors than the Advisor Optimal rule. Consistent with this, most advisors
choose more conservative rules than the Advisor Optimal rule in Stage 2, and advisors whose
behaviour changes between Stages 2 and 3 tend to move to more conservative rules.29
29 The reports sent in the Signal Report treatment provide another example of the conservative approach taken by advisors. There are clear benefits to exaggeration, reporting a higher quality than the signal. Nonetheless, the majority of reports are truthful (86% in Stage 2 and 82% in Stage 3), which is consistent with advisors managing their social credibility through truthful reports. This behaviour is also consistent with the literature on ‘lie aversion’ (e.g. Ellingsen and Johannesson, 2004; Gneezy, 2005; Kartik, 2009; Erat and Gneezy, 2012).

Result 3: The majority of advisors consistently use a cutoff rule that is more conservative
than the Advisor Optimal equilibrium. The highest advisor payoffs are obtained under
the Investor Optimal rule.
Use of conservative cutoff rules does not necessarily imply advisors are playing a
repeated game equilibrium like those described in Section 3.3. Recall that the Investor Optimal
equilibrium calls for two periods of reversion to the No Investment equilibrium if the advisor
recommends investment and the quality turns out to be low (θ ≤ 1). This punishment is what
disciplines advisors, in equilibrium, from pursuing the Advisor Optimal equilibrium. If the
relatively conservative play of many advisors reflects fear of such equilibrium punishment,
then investors should invest less following bad advice (calling for investment when θ ≤ 1) and
the effect should persist for more than a single period.
Figure 4: Bad Advice and the Credibility of Future Advice
Note: Data from periods in Stage 2 in which advisors recommends investment, pooled from four primary treatments.
2.0
2.5
3.0
3.5
4.0
4.5
0 1 2 3 4 5 θ ≤ 1 θ ≥ 2
Aver
age
Tota
l Inv
estm
ent
Current Quality of Investment
Current Lead Twice-lead

Figure 4 displays data from periods in Stage 2 in which the advisor recommended
investment. The light grey, textured and black bars show, respectively, the total investment for
the group in the current period (‘current’), the next period in which investment is recommended
(‘lead’), and the second period in the future in which investment is recommended (‘twice-
lead’). Observations where the next two recommendations to invest did not occur in Stage 2
are dropped. The data is broken down by the current quality of the investment. It is easier to
see the patterns in the data if we pool states into bad (θ ≤ 1) or good (θ ≥ 2) quality, as shown
to the right of the graph. Consistent with equilibrium punishment, if investment is
recommended and the quality is bad (θ ≤ 1), total investment declines in the next two periods
in which advice is recommended. If current quality is good (θ ≥ 2), total investment changes
little in the future.
Table 5: Effects of Bad Advice Model 1 Model 2 Model 3 # Leads 1 2 3 # Observations 896 812 728 Bad Current Quality (θ ≤ 1)
-0.679** -0.682** -0.390 (0.281) (0.300) (0.388)
Total Investment, Current Period 1.291*** 1.370*** 1.384*** (0.099) (0.110) (0.144)
Total Investment, Stage 1 0.351*** 0.340*** 0.438*** (0.103) (0.108) (0.154)
Signal Report -0.067 0.106 0.213 (0.302) (0.365) (0.496)
Signal Revealed 0.057 0.105 0.182 (0.322) (0.384) (0.538)
High Precision 0.795* 0.829* 1.153* (0.438) (0.485) (0.661)
Note: Standard errors, reported in parentheses, are corrected for clustering at the group level. Three (***), two (**), and one (*) stars indicate significance at the 1%, 5%, and 10% level using a two-tailed test.
The regressions in Table 5 provide a statistical complement for the preceding
observations using tobit models. The dependent variable in all three models is future total
investment, with the models varying how far into the future is considered. Model 1 shows
effects on total investment the next time the advisor recommends investment (i.e., ‘Lead’ in

Figure 4), Model 2 looks at the second time in the future that the advisor recommends
investment, and Model 3 looks at the third time in the future that investment is recommended.
The data include periods in Stage 2 in which the advisor recommended investment and the
relevant future period also falls within Stage 2. The regressions control for the current total
investment, the group’s average investment in Stage 1, the treatment (the Baseline treatment is
the omitted category), and the current five-period block (not reported to save space). The
independent variable of interest, though, is a dummy for bad current quality (θ ≤ 1).
If the advisor gives bad advice in the current period (i.e., recommending investment
when θ ≤ 1), total investment is significantly reduced the next two times the advisor calls for
investment. Consistent with Figure 4, the estimated sise of this reduction is virtually identical
the first two times investment is recommended in the future (compare Models 1 and 2). After
this, the effect begins to die out. The third time investment is recommended, the effect of bad
advice is still negative but the magnitude is almost halved and the effect is no longer
statistically significant. The estimated effects are not as large as would occur in the investor
optimal equilibrium and likely mask a great deal of heterogeneity, but this analysis indicates
that investors’ responses to bad advice are roughly consistent with equilibrium: there is a
negative reaction to bad advice that lasts for more than one period, but fades out over time.
Finally, we find an interaction between the responses chosen by investors and the
strategies chosen by advisors. This can be seen by comparing the experiences of advisors
classified as ‘Advisor Optimal’ and those classified as ‘Unclassified.’ As we note previously,
to the extent that we can identify a systematic pattern in behaviour for Unclassified types, they
tend to start as Advisor Optimal types and shift towards more conservative behaviour. This is
supported by differences in responses to the two classes of advisors in the first half of Stage 2.
Following bad advice, as defined above, the decrease in lead investment is more than three
times larger for Unclassified types (-0.61) than Advisor Optimal types (-0.19). Thus, for

Unclassified types we appear to observe a process of equilibration, whereby they become more
conservative in response to the behaviour of investors.
Figure 5: Advisor types by treatment in Stage 2
4.3. Interaction Effects: Advisor and Investor Behaviour by Treatment: Figure 5 shows the
distribution of advisor types in Stage 2 for the four primary treatments. These distributions
differ across treatments. In particular, the Signal Report and High Precision treatments have
fewer Conservative types and more Investor Optimal types.
Table 6 reports regressions examining the effect of each treatment on both giving and
following advice. In the first model, the dependent variable is a dummy for whether or not the
advisor recommends investment. The independent variables are dummies for the advisor’s
signal, dummies for the current five-period block, treatment dummies with the Baseline serving
as the omitted category, and the average total investment for the group in Stage 1. To save
space we do not report the signal dummies or the block dummies. Consistent with Figure 5,
both the Signal Report and High Precision treatments make advisors significantly more
aggressive (more willing to recommend investment) relative to the Baseline. The magnitude of
0%
10%
20%
30%
40%
50%
Baseline Signal Report Signal Revealed High Precision
Unclassified Advisor Optimal Investor Optimal Conservative
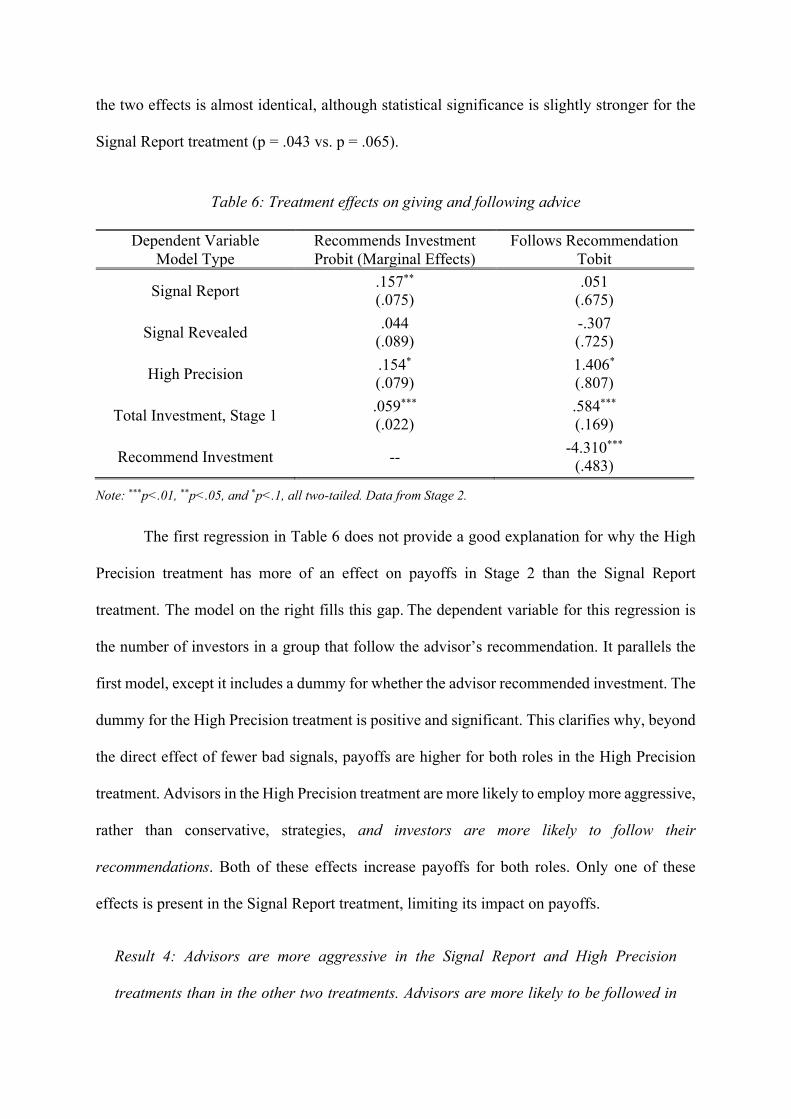
the two effects is almost identical, although statistical significance is slightly stronger for the
Signal Report treatment (p = .043 vs. p = .065).
Table 6: Treatment effects on giving and following advice
Dependent Variable Recommends Investment Follows Recommendation Model Type Probit (Marginal Effects) Tobit
Signal Report .157** (.075)
.051 (.675)
Signal Revealed .044 (.089)
-.307 (.725)
High Precision .154* (.079)
1.406*
(.807)
Total Investment, Stage 1 .059*** (.022)
.584***
(.169)
Recommend Investment -- -4.310***
(.483)
Note: ***p<.01, **p<.05, and *p<.1, all two-tailed. Data from Stage 2.
The first regression in Table 6 does not provide a good explanation for why the High
Precision treatment has more of an effect on payoffs in Stage 2 than the Signal Report
treatment. The model on the right fills this gap. The dependent variable for this regression is
the number of investors in a group that follow the advisor’s recommendation. It parallels the
first model, except it includes a dummy for whether the advisor recommended investment. The
dummy for the High Precision treatment is positive and significant. This clarifies why, beyond
the direct effect of fewer bad signals, payoffs are higher for both roles in the High Precision
treatment. Advisors in the High Precision treatment are more likely to employ more aggressive,
rather than conservative, strategies, and investors are more likely to follow their
recommendations. Both of these effects increase payoffs for both roles. Only one of these
effects is present in the Signal Report treatment, limiting its impact on payoffs.
Result 4: Advisors are more aggressive in the Signal Report and High Precision
treatments than in the other two treatments. Advisors are more likely to be followed in

the High Precision treatment than in the other treatments. These effects combine to yield
higher payoffs in the High Precision treatment, even when controlling for the direct
effects of bad signals.
4.4 Stage 3 Spillovers: Following Stage 2, advisors rotated to new investor groups. The primary
goal of Stage 3 is to study how advisors change their behaviour when given a fresh start and
whether advisors’ credibility (or lack thereof) carries over from Stage 2 into Stage 3.
The behaviour of advisors is fairly stable over time. Half of the advisors (42 of 84) are
assigned to the same type in Stages 2 and 3 and the distribution of types does not change much
between Stages 2 and 3 (see Table 4). To the extent that advisors change their behaviour, they
tend to become more conservative. There are 15 advisors who can be assigned a type (i.e. not
Unclassified) for both stages and switch types between Stages 2 and 3. Twelve of these
advisors move to a more conservative type. Given that conservative strategies are associated
with higher advisor payoffs, this is consistent with advisors learning from experience (similar
to the movement towards more conservative strategies by Unclassified types within Stage 2).
To examine whether advisors’ credibility carries across stages, we look at the
relationship between how frequently an advisor gave bad advice (i.e., recommending
investment when θ ≤ 1) in Stage 2 and the advisor’s success in Stage 3. We can classify advisors
by whether they gave bad advice 0, 1, or 2 (or more) times in Stage 2. This divides the advisors
into three roughly equal groups with 27, 27, and 30 advisors respectively. Looking at periods
in Stage 3 in which the advisors recommend investment, the average total investment levels
for these three groups are, respectively, 4.08, 3.83, and 2.92. Hence, advisors who give more
bad advice in Stage 2 are followed less by their new groups in Stage 3—social credibility, or
lack thereof, seems to follow advisors across groups.
The obvious objection to the preceding analysis is the lack of a clear causal link.
Advisors who are more aggressive in Stage 2 will necessarily give more bad advice. If they

also give more bad advice in Stage 3, the negative correlation with bad advice in Stage 2 may
simply reflect a negative reaction to continued bad advice in Stage 3. To address this, we ran a
tobit regression with Stage 3 data using total investment as the dependent variable. Independent
variables include controls for the treatment, the five-round block, total investment by the group
in Stage 1, the current advice, and lagged false good and false bad signals. We instrument for
bad advice in Stage 2 with the total number of false good signals in Stage 2 (periods with
quality ≤ 1 and signal ≥ 2). This is exogenous but strongly correlated with the amount of bad
advice in Stage 2. The parameter estimate for the amount of bad advice in Stage 2 is negative
and significant at the 5% level.30 Hence, the negative relationship between bad advice in Stage
2 and following advice to invest in Stage 3 is not an artifact of the correlation between advisor
behaviour in Stages 2 and 3. Instead, there is a persistent loss of credibility when an advisor
has a history of giving bad advice.
Result 5: Advisors who give less bad advice in Stage 2 are more likely to have their advice
followed in Stage 3.
4.5 Follow-up Treatments: The majority of advisors are classified as either Investor Optimal
or Conservative types, and Unclassified types become steadily more conservative with
experience. Theoretically, advisors should do better under the Advisor Optimal equilibrium,
but the theoretical benchmark may not accurately predict how well advisors attempting to
implement this strategy would actually do given the underlying assumption that the equilibrium
is common knowledge. The Automated Advisor treatment addresses this question by
30 The parameter estimate is -1.234 (st. err. = .582, p = .034). We omit the remaining estimates to save space. Standard errors are corrected for clustering, defined as follows. Define Groups A and B as sharing a common advisor if the advisor for Group A in Stage 2 became the advisor for Group B in Stage 3 (or vice versa). Groups that are not in the same cluster never share a common advisor. Groups in different sessions never share a cluster. Groups in the same session may or may not be in the same cluster, depending on how advisors shifted between groups. This yields a total of 30 clusters (as opposed to 23 clusters if each session is a cluster).

exogenously implementing the Advisor Optimal equilibrium without imposing common
knowledge of the advisor’s strategy.
Comparing Stage 2 outcomes, there is little difference between the Baseline and
Automated Advisor treatments. Advisor payoffs are slightly higher with automated advisors
(5.05 vs. 4.74) and investor payoffs are a bit lower (6.91 vs. 7.17). Controlling for different
outcomes in Stage 1 and differences in the realizations of signals and states, advisors do no
better with automated advisors while investors do worse.31
It is surprising that consistent play of the Advisor Optimal equilibrium does not increase
advisors’ payoffs. The problem lies in social credibility. Advisors play two roles; they serve as
a conduit for information and act as a coordinating device. Automated advisors do poorly on
the second dimension. Consider ‘coordination failure,’ defined as an observation where all
investors did not make the same choice. Coordination failure is significantly more frequent in
the Automated Advisor treatment (41%) than the Baseline treatment (31%). Indeed,
coordination failure is more common in the Automated Advisor treatment than in any other
treatment. Along similar lines, investors are less likely to follow advice in the Automated
Advisor treatment (67%) than the Baseline treatment (80%), and, more generally, follow
advice less in the Automated Advisor treatment than any other treatment; these differences are
statistically significant at the 10% level or better.32 The Automated Advisor treatment thus
underlines the value of conservative play in maintaining social credibility. In our study, being
conservative in order to facilitate coordination among followers yields far more benefit for a
leader than the potential gains from recommending investment more aggressively.
31 We reran Models 2a and 2b from Table 3 using data from all six treatments and adding dummies for the two follow-up treatments (Automated Advisors and Full Information). The estimated effect of the Automated Advisor treatment is -.005 with a standard error of .102 for advisor payoffs and -1.154 with a standard error of .669 for the sum of investor payoffs in a group (p = .087). 32 Statements about statistical significance are based on regressions equivalent to Model 2a from Table 3, but with coordination failure and following advice as the dependent variables. For coordination failure, the estimated effect for the Automated Advisor treatment is -.140 with a standard error of .083 (p = .078) and for following advice the estimated effect is -.179 with a standard error of .083 (p = .014).

The Symmetric Information treatment only allows an advisor to serve as a coordinating
device rather than serving as a conduit for information. Looking at the raw data, it appears that
eliminating asymmetric information has a positive effect for both roles relative to the Baseline
treatment, increasing both advisor payoffs (5.79 vs 4.74) and Investor Payoffs (7.83 vs 7.17)
in Stage 2. However, by chance, high quality (θ ≥ 4) was relatively common in the Symmetric
Information treatment. In regressions that control for quality, the change in Advisor payoffs is
not statistically significant, stemming solely from the prevalence of high quality, but the effect
on Investor payoffs is significant.33
Digging deeper, it is striking how little the Symmetric Information treatment differs
from the Baseline treatment. Advisors are more likely to advise investment in the Symmetric
Information treatment than in the Baseline (66% vs 56%), but this difference vanishes once we
control for the current signal. Moreover, the likelihood of calling for investment is no more
sensitive to the signal with Symmetric Information.34
Most importantly, investors are equally responsive to advisors in the Symmetric
Information treatment as in the Baseline treatment. The average number of investors following
the advisor’s advice to invest is almost identical in the two treatments (4.01 for Baseline, 4.00
for Symmetric Information). Regressions controlling for a large number of factors that might
drive responsiveness to advice confirm that there is no difference between the responsiveness
to advice in the Baseline and Symmetric Information treatments.35
33 The estimated effect of the Symmetric Information treatment is .067 with a standard error of .088 for advisor payoffs and 1.560 with a standard error of .633 for investor payoffs (p = .015). 34 These statements are based on probits with a dummy for advising investment as the dependent variable. These regressions include controls for Stage 1 investment, the current signal, and the current five-period block. The first regression just includes treatment dummies (the Baseline is the omitted category). The estimate for Symmetric Information is .094 with a standard error of .100. The second regression includes treatment dummies as well as interactions between the treatment dummies and the current signal. The parameter estimate for Symmetric Information is .013 with a standard error of .160 and the interaction term has an estimate of .027 with a standard error of .062. None of these estimates are significant. 35 Specifically, we estimate the responsiveness to advice controlling for lagged total investment, lagged signal, and the interaction of these two variables. The estimated effects of advising investment on total investment are almost identical in the two treatments (2.81 vs 3.24). Both estimates are significant at the 1% level and do not differ significantly from each other. These conclusions are robust to a wide variety of specifications.

Behaviour isn’t completely identical in these treatments—the higher Investor payoffs
with Symmetric Information are driven by a lower tendency to invest when θ = 1 or 2—but it
is nevertheless notable how similar the Symmetric Information treatment is to the primary
treatments, and particularly the extent to which investors follow advisors’ recommendations
even when there is no informational asymmetry. This strongly suggests that the advisor’s role
as a coordinating device is highly important, independently from their role as a conduit of
information, highlighting the importance of social credibility.
5. Conclusion
We study an investment game designed to capture critical features of leadership in many
organisational settings. Investments are complementary—only profitable when the state of the
world is good and others are investing. There is an advisor who has private information about
the state of the world and an interest in fostering full investment in most states of the world.
Critically, there exist states where full investment benefits the advisor but not the investors,
tempting the advisor to give the investors bad advice.
The repeated investment game has many equilibria, including ones in which the advisor
is ignored and no investment takes place as well as one in which the advisor always calls for
investment in cases where full investment is to her benefit and investors follow her advice. Of
particular interest are repeated-game equilibria where the advisors exercise restraint in giving
advice due to the threat of punishment through reduced investment by investors. In these
equilibria, an advisor’s deviation from the equilibrium is punished not so much due to a loss
of credibility, as even truthful advisors are punished in equilibrium due to bad luck, but rather
due to a loss of social credibility. If investors are in a punishment phase, it is not in an investor’s
interest to invest because he does not expect others to invest. His beliefs about the state of the
world or the advisor’s veracity are irrelevant.

We find that introducing active advisors increases payoffs for both roles. Advisors’
recommendations are strongly correlated with their private information and investors often
follow their advice. Leadership by active advisors is most successful when leaders ‘manage’
their social credibility. Specifically, despite the leaders’ myopic incentives to aggressively
recommend investment in states where followers have little or nothing to gain from it, leaders
often opt for more conservative recommendations to maintain their social credibility.
Consistent with the equilibrium we describe above, giving bad advice reduces future
responsiveness to advice calling for investment. Thus, play consistent with a relatively
conservative ‘Investor Optimal’ equilibrium yields higher payoffs for advisors than more
aggressive courses of action in line with an ‘Advisor Optimal’ equilibrium.
The interpretation of our results depend in part on the nature of the advisor’s role. If the
advisor was already a member of the group, as we model here, the improvement in overall
payoffs and investment are clearly a positive for the group of investors. However, suppose
instead that the advisor must be hired from outside? In this case the benefit is less obvious from
our data, as the experiment was not designed to compare welfare impacts between the two
roles. Ultimately, we recognise the critical need to weigh the benefits of advice against any
potential costs of hiring an advisor, although this issue is beyond the scope of the current
experiment.
Our design includes four primary treatments that vary the quality of information and
the richness of signals an advisor can send. While there are some treatment effects, especially
from improving the accuracy of the signal, the overall picture is that the details of what
information advisors and investors have is less important than how well advisors manage their
social credibility. This point is reinforced by two follow-up treatments, one exogenously
imposing the Advisor Optimal equilibrium and one eliminating asymmetric information
between investors and advisors. Imposing the Advisor Optimal equilibrium does not help

advisors because it results in a loss of social credibility. Likewise, eliminating asymmetric
information has remarkably little effect as investors still respond strongly to advice,
underlining the importance of the advisor’s role as a coordinating device.
From a practical point of view, our findings highlight the importance for leadership of
being sensitive to the long-term impacts on credibility of aggressively requesting costly
investment and effort from followers, particularly when such efforts are complementary. The
behaviour of our most successful advisors suggests that leaders may be most effective by
prioritizing the need to maintain social credibility.
Cooper: Department of Economics, Florida State University and School of Economics, University of East Anglia Hamman: Department of Economics, Florida State University Weber: Department of Economics, University of Zurich

References
Agranov, M. and Schotter, A. (2012). ‘Ignorance is bliss: An experimental study of the use of
ambiguity and vagueness in coordination games with asymmetric payoffs’, American
Economic Journal: Microeconomics, vol. 4, pp. 77-103.
Agranov, M. and Schotter, A. (2013). ‘Language and government coordination: An
experimental study of communication in the announcement game’, Journal of Public
Economics, vol. 104, pp. 26-39.
Ahlquist, J. and Levi, M. (2011) ‘Leadership: What it means, what it does, and what we want
to know about it’, Annual Review of Political Science, vol. 14, pp. 1-24.
Antonakis, J., d’Adda, G., Weber, R.A. and Zehnder, C. (2019). ‘Just words, just speeches?
On the economic value of charismatic leadership’, Working Paper, University of
Zurich.
Arbak, E. and Villeval, M.C. (2013). ‘Voluntary leadership: motivation and influence’, Social
Choice and Welfare, vol. 40, pp. 635-662.
Benoit, J-P, and Krishna, V. (1985). ‘Finitely repeated games’, Econometrica, vol. 53, pp. 905-
922.
Blume, A. and Ortmann, A. (2007). ‘The effects of costless pre-play communication:
Experimental evidence from games with Pareto-ranked equilibria’, Journal of
Economic Theory, vol. 132(1), pp. 274–290.
Brandts, J. and Cooper, D. (2007). ‘It’s what you say, not what you pay: An experimental study
of manager-employee relationships in overcoming coordination failure’, Journal of the
European Economic Association, vol. 5, pp. 1223-1268.
Brandts, J., Cooper, D. and Fatas, E. (2007) ‘Leadership and overcoming coordination failure
with asymmetric costs’, Experimental Economics, vol. 10, pp. 269-284.

Brandts, J., Cooper, D. and Weber, R. (2015). ‘Legitimacy, Communication, and Leadership
in the Turnaround Game’, Management Science, vol. 61(11), pp. 2627-2645.
Carlsson, H. and van Damme, E. (1993). ‘Global Games and Equilibrium Selection,’
Econometrica, vol. 61, pp. 989-1018.
Cartwright, E., Gillet, J. and van Vugt, M. (2009).‘Endogenousleadershipinacooperation
gamewith conflict of interest and asymmetric information’, Discussion paper,
UniversityofKent.
Cartwright, E., Gillet, J. and van Vugt, M. (2013). ‘Leadership by example in the weak-link
game, Economic Inquiry’, vol. 51, pp. 2028-2043.
Cooper, R., DeJong, D., Forsythe, R. and Ross, T. (1992). ‘Communication in coordination
games’, Quarterly Journal of Economics, vol. 107, pp. 739-771.
d’Adda, G., Darai, D., Pavanini, N. and Weber, R.A. (2017). ‘Do leader affect ethical
conduct?’, Journal of the European Economic Association, vol. 15, pp. 1177-1213.
Dickson, E. (2011). ‘Leadership, followership, and beliefs about the world: An experiment’,
Working Paper, New York University.
Ellingsen, T. and Johannesson, M. (2004) ‘Promises, threats, and fairness’, Economic Journal,
vol. 114, pp. 397-420.
Fischbacher, U. (2007). ‘z-Tree - Zurich Toolbox for Readymade Economic Experiments’,
Experimental Economics, vol. 10, pp. 171-178.
Gächter, S., Renner, E. and Sefton, M. (2008). ‘The Long-Run Benefits of Punishment’,
Science, vol. 322, pp. 1510.
Gneezy, U. (2005). ‘Deception: The role of consequences’, American Economic Review, vol.
95, pp. 384-394.

Green, E. and Porter, R. (1984). ‘Noncooperative collusion under imperfect price information’,
Econometrica, vol. 52, pp. 87-100.
Greiner, B. (2015). ‘Subject pool recruitment procedures: organising experiments with
ORSEE’, Journal of the Economic Science Association, vol. 1(1), pp. 114–125.
Grossman, P., Komai, M. and Jensen, J. (2015) ‘Leadership and gender in groups: an
experiment’, Canadian Journal of Economics, vol. 48, pp. 368-388.
Gürerk, O., Irlendbusch, B. and Rochenbach, B. (2006). ‘The competitive advantage of
sanctioning institutions’, Science, vol. 312, pp. 108-111.
Hamman, J., Webber, R. and Woon, J. (2011). ‘An Experimental Investigation of Electoral
Delegation and the Provision of Public Goods’, American Journal of Political Science,
vol. 55(4), pp. 738-752.
Heinemann, F., Nagel, R., and Ockenfels, P. (2004). ‘The theory of global games on test:
Experimental analysis of coordination games with public and private information’,
Econometrica, vol. 72, pp. 1583-1599.
Hermalin, B. (1998). ‘Toward and economic theory of leadership: Leading by example’,
American Economic Review, vol. 88, pp. 1188-1206.
Kartik, N. (2009). ‘Strategic communication with lying costs’, Review of Economic Studies,
vol. 76, pp. 1359-1395.
Komai, M., Stegeman, M. and Hermalin, B. (2007). ‘Leadership and information’, American
Economic Review, vol. 97, pp. 944-947.
Kriss, P. H., Blume, A. and Weber, R.A. (2016). ‘Coordination with decentralised costly
communication’, The Journal of Economic Behaviour and Organisation, vol. 130, pp.
225-241.

Kuang, J. X., Weber, R.A. and Dana J. (2007). ‘How effective is advice from interested
parties? An experimental test using a pure coordination game’, Journal of Economic
Behaviour and Organisation, vol. 62(4), pp. 591-604.
Meidinger, C. and Villeval, M.C. (2002). ‘Leadership in teams: signaling or reciprocating?’
Working paper, GATE.
Morris S. and Shin, H.S. (2002). ‘Social value of public information’, American Economic
Review, vol. 92, pp. 1521-1534.
Moxnes, E. and Van der Heijden, E. (2003). ‘The effect of leadership in a public bad
experiment’, Journal of Conflict Resolution, vol. 47, pp. 773-795.
Moxnes, E. and Van der Heijden, E. (2007). ‘Leading by example with and without exclusion
power in voluntary contribution experiments’, Journal of Public Economics, vol. 91,
pp. 1023-1042.
Nikiforakis, N. (2008). ‘Punishment and counter-punishment in public goods games: Can we
really govern ourselves?’, Journal of Public Economics, vol. 92, pp. 91-112.
Potters, J., Sefton, M. and Vesterlund, L. (2007). ‘Leading-by-example and signaling in
voluntary contribution games: An experimental study’, Economic Theory, vol. 33, pp.
169-182.
Rosenstein-Rodan, P. (1943). ‘Problems of Industrialization of Eastern and South-eastern
Europe’, Economic Journal, vol. 53, pp. 202-211.
Serra-Garcia, M., van Damme, E. and Potters, J. (2011). ‘Hiding an inconvenient truth: Lies
and vagueness’, Games and Economic Behaviour, vol. 73, pp. 244-261.
Serra-Garcia, M., van Damme, E. and Potters, J. (2013). ‘Lying about what you know or what
you do?’, Journal of the European Economic Association, vol. 11, pp. 1204-1229.

Van Huyck, J., Battalio, R. and Beil, R. (1990). ‘Tacit coordination games, strategic uncertainty,
and coordination failure’, American Economic Review, vol. 80(1), pp. 234-248.
Weber, R. A., Camerer, C., Rottenstreich, Y. and Knez, M. (2001). ‘The illusion of leadership:
Misattribution of cause in coordination games’, Organisation Science, vol. 12(5), pp.
582-598.
Wilson, R. and Rhodes, C. (1997). ‘Leadership and credibility in N-person coordination
games’, Journal of Conflict Resolution, vol. 41, pp. 767-791.
Related Documents