Foods Commonly Eaten in the United States Quantities Consumed Per Eating Occasion and in a Day, 1994-96 Helen Smiciklas-Wright 1 , Diane C. Mitchell 1 , Sharon J. Mickle 2 , Annetta J. Cook 3 , Joseph D. Goldman 2 1 The Pennsylvania State University, Nutrition Department, Diet Assessment Center, University Park, PA 2 U.S. Department of Agriculture, Agriculture Research Service, Beltsville Human Nutrition Research Center, Food Surveys Research Group 3 U.S. Department of Agriculture, Agriculture Research Service, Beltsville Human Nutrition Research Center, Community Nutrition Research Group

Welcome message from author
This document is posted to help you gain knowledge. Please leave a comment to let me know what you think about it! Share it to your friends and learn new things together.
Transcript

Foods Commonly Eaten in the United States
Quantities Consumed Per Eating Occasion and in a Day, 1994-96
Helen Smiciklas-Wright1, Diane C. Mitchell1, Sharon J. Mickle2, Annetta J. Cook3, Joseph D. Goldman2
1 The Pennsylvania State University, Nutrition Department, Diet Assessment Center, University Park, PA
2 U.S. Department of Agriculture, Agriculture Research Service, Beltsville Human Nutrition Research Center, Food Surveys Research Group
3 U.S. Department of Agriculture, Agriculture Research Service, Beltsville Human Nutrition Research Center, Community Nutrition Research Group

ii
ABSTRACT
Smiciklas-Wright, H., D.C. Mitchell, S.J. Mickle, A.J.Cook, and J.D. Goldman. 2002. Foods Commonly Eatenin the United States: Quantities Consumed Per EatingOccasion and in a Day, 1994-1996. U.S. Department ofAgriculture NFS Report No. 96-5, pre-publication version,252 pp. Available onlinewww.barc.usda.gov/bhnrc/foodsurvey/Products9496.html
This report contains estimates of food intakes byindividuals residing in households in the entire UnitedStates. The estimates were based on informationobtained from 14,262 non-breast fed individuals ages 2and above who provided 2 days of dietary intakeinformation in the 1994-96 Continuing Survey of FoodIntakes by Individuals (CSFII 1994-96), conducted by theU.S. Department of Agriculture. Food intake data werecollected by in-person interviews from 1994 through1996.
This report includes 2 sets of tables with food intakeestimates tabulated by sex and age. Table Set 1provides estimates for the percentage of persons whoconsumed 111 foods and food groups and the quantitiesconsumed per eating occasion. Table Set 2 providesestimates for the quantities of 96 foods and food groupseaten per individual in a day.
January 2002
Acknowledgments
The authors would like to acknowledge Christopher D.Coleman and Mary Ann Fosmire, both from ThePennsylvania State University, for their assistance in theproduction of this report.

iii
Contents Page
Introduction…………………………………………………………………………………………….………….. 1Methods……………………………………………………………………………………………………………. 2
Data Collection and Processing………………………………………………………………………… 2Analysis…………………………………………………………………………………………………… 3Limitations………………………………………………………………………………………………… 7
Tables Set 1: Quantities Consumed Per Eating Occasion…………………………………………………… 9 Set 2: Quantities Consumed in a Day………………………………………………………………… 120Table Notes……………………………………………………………………………………………………… 216 Explanation of Symbols Used in Tables……………………………………………………………… 216 Description of Foods in Table Set 1: Quantities Consumed per Eating Occasion……………… 216 Description of Foods in Table Set 2: Quantities Consumed in a Day………………………………. 225Appendix A. Statistical Notes…………………………………………………………………………………… 233Appendix B. Mean Quantities Consumed Per Person Per Day…………………………………………… 235Appendix C. Minimum and Maximum Values for Foods Reported by Subgroups for Which Percentiles Could Not Be Interpolated……………………………………………………………………………… 245References………………………………………………………………………………………………………… 252
iv
List of Tables Table Number Page
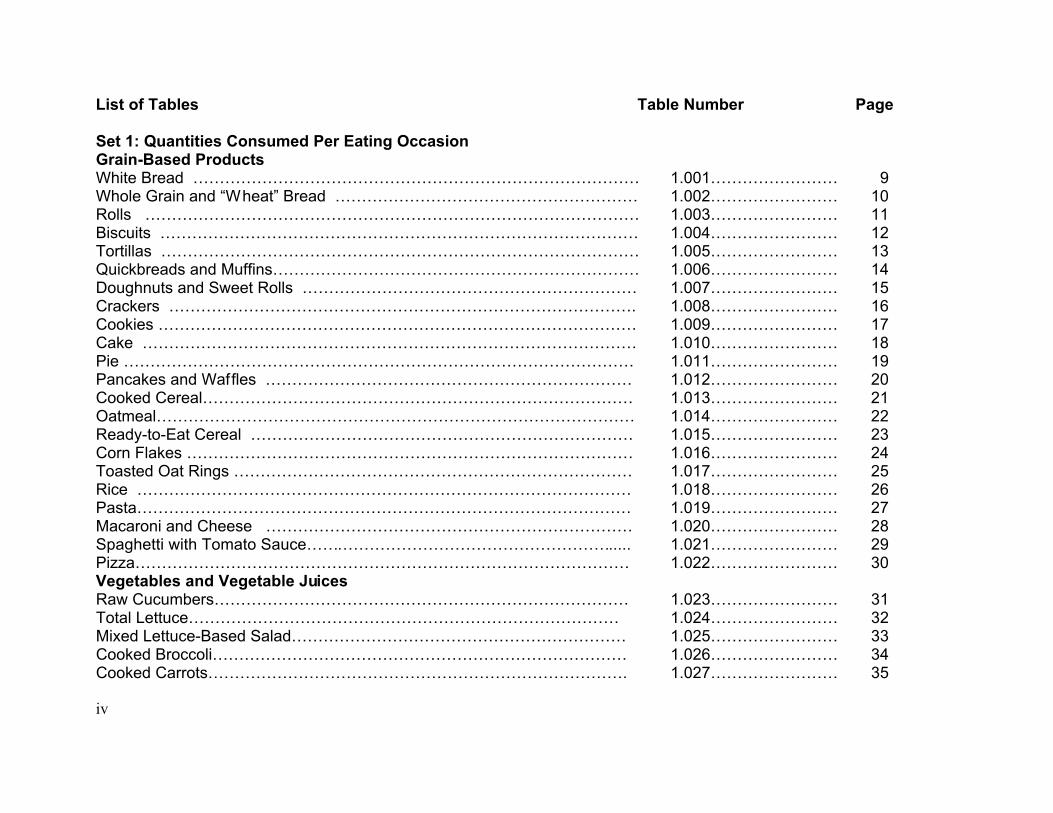
Set 1: Quantities Consumed Per Eating Occasion Grain-Based ProductsWhite Bread ………………………………………………………………………… 1.001…………………… 9Whole Grain and “Wheat” Bread ………………………………………………… 1.002…………………… 10Rolls ………………………………………………………………………………… 1.003…………………… 11Biscuits ……………………………………………………………………………… 1.004…………………… 12Tortillas ……………………………………………………………………………… 1.005…………………… 13Quickbreads and Muffins…………………………………………………………… 1.006…………………… 14Doughnuts and Sweet Rolls ……………………………………………………… 1.007…………………… 15Crackers ……………………………………………………………………………. 1.008…………………… 16Cookies ……………………………………………………………………………… 1.009…………………… 17Cake ………………………………………………………………………………… 1.010…………………… 18Pie …………………………………………………………………………………… 1.011…………………… 19Pancakes and Waffles …………………………………………………………… 1.012…………………… 20Cooked Cereal……………………………………………………………………… 1.013…………………… 21Oatmeal……………………………………………………………………………… 1.014…………………… 22Ready-to-Eat Cereal ……………………………………………………………… 1.015…………………… 23Corn Flakes ………………………………………………………………………… 1.016…………………… 24Toasted Oat Rings ………………………………………………………………… 1.017…………………… 25Rice ………………………………………………………………………………… 1.018…………………… 26Pasta………………………………………………………………………………… 1.019…………………… 27Macaroni and Cheese …………………………………………………………… 1.020…………………… 28Spaghetti with Tomato Sauce…………………………………………………..... 1.021…………………… 29Pizza………………………………………………………………………………… 1.022…………………… 30Vegetables and Vegetable JuicesRaw Cucumbers…………………………………………………………………… 1.023…………………… 31Total Lettuce……………………………………………………………………… 1.024…………………… 32Mixed Lettuce-Based Salad……………………………………………………… 1.025…………………… 33Cooked Broccoli…………………………………………………………………… 1.026…………………… 34Cooked Carrots……………………………………………………………………. 1.027…………………… 35

v
Table Number Page
Raw Carrots………………………………………………………………………… 1.028…………………… 36Raw Tomatoes …………………………………………………………………… 1.029…………………… 37Total Tomato Sauce ……………………………………………………………… 1.030…………………… 38Cooked String Beans……………………………………………………………… 1.031…………………… 39Coleslaw …………………………………………………………………………… 1.032…………………… 40Cooked Peas ……………………………………………………………………… 1.033…………………… 41Cooked Corn ……………………………………………………………………… 1.034…………………… 42Raw Onions………………………………………………………………………… 1.035…………………… 43French-fried Potatoes……………………………………………………………… 1.036…………………… 44Home-Fried and Hash-Browned Potatoes……………………………………… 1.037…………………… 45Baked Potatoes …………………………………………………………………… 1.038…………………… 46Boiled Potatoes …………………………………………………………………… 1.039…………………… 47Mashed Potatoes ………………………………………………………………… 1.040…………………… 48Cooked Dried Beans and Peas ………………………………………………… 1.041…………………… 49Baked Beans ……………………………………………………………………… 1.042…………………… 50Fruits and Fruit JuicesRaw Oranges ……………………………………………………………………… 1.043…………………… 51Orange Juice ……………………………………………………………………… 1.044…………………… 52Raw Apples ………………………………………………………………………… 1.045…………………… 53Applesauce and Cooked Apples ………………………………………………… 1.046…………………… 54Apple Juice ………………………………………………………………………… 1.047…………………… 55Raw Bananas ……………………………………………………………………… 1.048…………………… 56Milk and Milk ProductsFluid Milk …………………………………………………………………………… 1.049…………………… 57Fluid Milk Consumed with Cereal………………………………………………… 1.050…………………… 58Whole Milk ………………………………………………………………………… 1.051…………………… 59Whole Milk Consumed with Cereal……………………………………………… 1.052…………………… 60Lowfat Milk ………………………………………………………………………… 1.053…………………… 61Lowfat Milk Consumed with Cereal……………………………………………… 1.054…………………… 62Skim Milk…………………………………………………………………………… 1.055…………………… 63
vi
Table Number Page
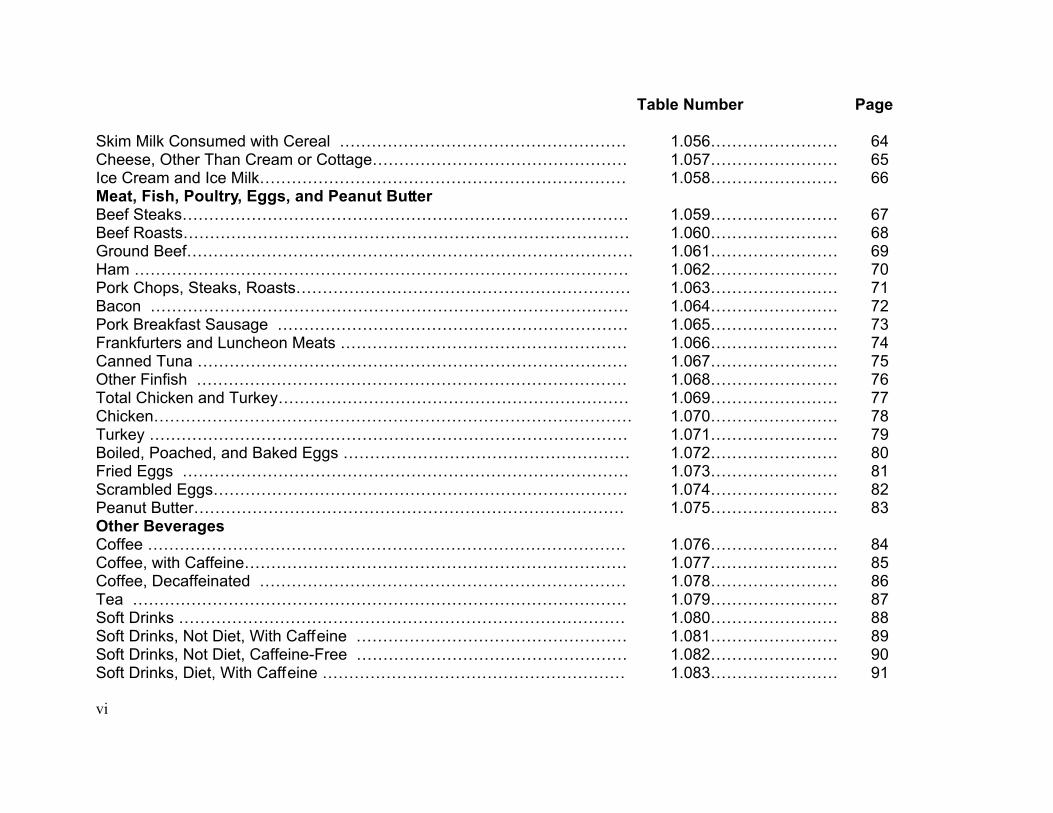
Skim Milk Consumed with Cereal ……………………………………………… 1.056…………………… 64Cheese, Other Than Cream or Cottage………………………………………… 1.057…………………… 65Ice Cream and Ice Milk…………………………………………………………… 1.058…………………… 66Meat, Fish, Poultry, Eggs, and Peanut ButterBeef Steaks………………………………………………………………………… 1.059…………………… 67Beef Roasts………………………………………………………………………… 1.060…………………… 68Ground Beef………………………………………………………………………… 1.061…………………… 69Ham ………………………………………………………………………………… 1.062…………………… 70Pork Chops, Steaks, Roasts……………………………………………………… 1.063…………………… 71Bacon ……………………………………………………………………………… 1.064…………………… 72Pork Breakfast Sausage ………………………………………………………… 1.065…………………… 73Frankfurters and Luncheon Meats ……………………………………………… 1.066…………………… 74Canned Tuna ……………………………………………………………………… 1.067…………………… 75Other Finfish ……………………………………………………………………… 1.068…………………… 76Total Chicken and Turkey………………………………………………………… 1.069…………………… 77Chicken……………………………………………………………………………… 1.070…………………… 78Turkey ……………………………………………………………………………… 1.071…………………… 79Boiled, Poached, and Baked Eggs ……………………………………………… 1.072…………………… 80Fried Eggs ………………………………………………………………………… 1.073…………………… 81Scrambled Eggs…………………………………………………………………… 1.074…………………… 82Peanut Butter……………………………………………………………………… 1.075…………………… 83Other BeveragesCoffee ……………………………………………………………………………… 1.076…………………… 84Coffee, with Caffeine……………………………………………………………… 1.077…………………… 85Coffee, Decaffeinated …………………………………………………………… 1.078…………………… 86Tea ………………………………………………………………………………… 1.079…………………… 87Soft Drinks ………………………………………………………………………… 1.080…………………… 88Soft Drinks, Not Diet, With Caffeine …………………………………………… 1.081…………………… 89Soft Drinks, Not Diet, Caffeine-Free …………………………………………… 1.082…………………… 90Soft Drinks, Diet, With Caffeine ………………………………………………… 1.083…………………… 91

vii
Table Number Page
Soft Drinks, Diet, Caffeine-Free ………………………………………………… 1.084…………………… 92Fruit Drinks………………………………………………………………………… 1.085…………………… 93Beer………………………………………………………………………………… 1.086…………………… 94Wine………………………………………………………………………………… 1.087…………………… 95SoupsSoups ……………………………………………………………………………… 1.088…………………… 96Chips and PopcornPotato Chips……………………………………………………………………… 1.089…………………… 97Corn Chips………………………………………………………………………… 1.090…………………… 98Popcorn…………………………………………………………………………… 1.091…………………… 99Condiments, Gravies, and FatsPrepared Mustard………………………………………………………………… 1.092…………………… 100Tomato Catsup…………………………………………………………………… 1.093…………………… 101Total Soy-Based Sauces………………………………………………………… 1.094…………………… 102Cucumber Pickles………………………………………………………………… 1.095…………………… 103Fluid Cream………………………………………………………………………… 1.096…………………… 104Powdered Cream Substitute……………………………………………………… 1.097…………………… 105Margarine, All Types……………………………………………………………… 1.098…………………… 106Margarine, Stick…………………………………………………………………… 1.099…………………… 107Margarine, Soft……………………………………………………………………… 1.100…………………… 108Margarine, Imitation………………………………………………………………… 1.101…………………… 109Butter………………………………………………………………………………… 1.102…………………… 110Pourable Salad Dressing………………………………………………………… 1.103…………………… 111Mayonnaise………………………………………………………………………… 1.104…………………… 112Mayonnaise-Type Dressing……………………………………………………… 1.105…………………… 113Gravy………………………………………………………………………………… 1.106…………………… 114Sugars, Candies, and JelliesSyrup………………………………………………………………………………… 1.107…………………… 115Sugar………………………………………………………………………………… 1.108…………………… 116Candy Containing Chocolate……………………………………………………... 1.109…………………… 117
viii
Table Number Page
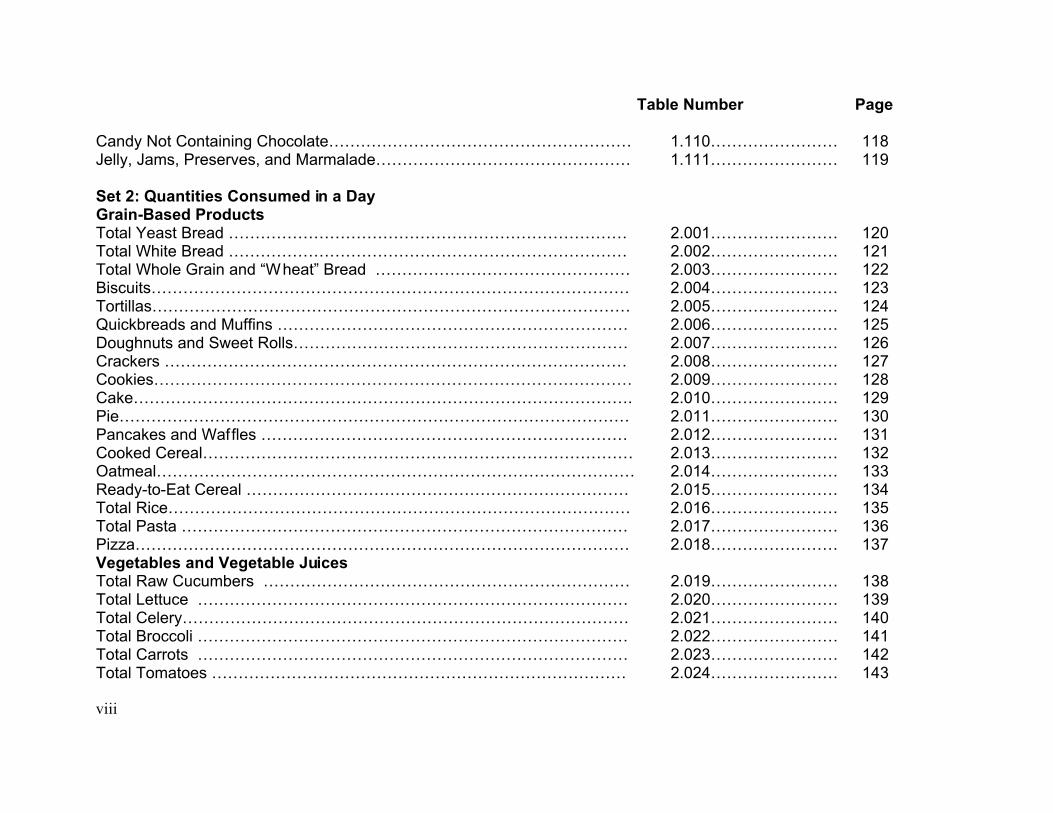
Candy Not Containing Chocolate………………………………………………… 1.110…………………… 118Jelly, Jams, Preserves, and Marmalade………………………………………… 1.111…………………… 119
Set 2: Quantities Consumed in a DayGrain-Based ProductsTotal Yeast Bread ………………………………………………………………… 2.001…………………… 120Total White Bread ………………………………………………………………… 2.002…………………… 121Total Whole Grain and “Wheat” Bread ………………………………………… 2.003…………………… 122Biscuits……………………………………………………………………………… 2.004…………………… 123Tortillas……………………………………………………………………………… 2.005…………………… 124Quickbreads and Muffins ………………………………………………………… 2.006…………………… 125Doughnuts and Sweet Rolls……………………………………………………… 2.007…………………… 126Crackers …………………………………………………………………………… 2.008…………………… 127Cookies……………………………………………………………………………… 2.009…………………… 128Cake…………………………………………………………………………………. 2.010…………………… 129Pie…………………………………………………………………………………… 2.011…………………… 130Pancakes and Waffles …………………………………………………………… 2.012…………………… 131Cooked Cereal……………………………………………………………………… 2.013…………………… 132Oatmeal……………………………………………………………………………… 2.014…………………… 133Ready-to-Eat Cereal ……………………………………………………………… 2.015…………………… 134Total Rice…………………………………………………………………………… 2.016…………………… 135Total Pasta ………………………………………………………………………… 2.017…………………… 136Pizza………………………………………………………………………………… 2.018…………………… 137Vegetables and Vegetable JuicesTotal Raw Cucumbers …………………………………………………………… 2.019…………………… 138Total Lettuce ……………………………………………………………………… 2.020…………………… 139Total Celery………………………………………………………………………… 2.021…………………… 140Total Broccoli ……………………………………………………………………… 2.022…………………… 141Total Carrots ……………………………………………………………………… 2.023…………………… 142Total Tomatoes …………………………………………………………………… 2.024…………………… 143

ix
Table Number Page
Total Tomato Sauce ……………………………………………………………… 2.025…………………… 144Total String Beans………………………………………………………………… 2.026…………………… 145Total Cabbage …………………………………………………………………… 2.027…………………… 146Total Peas ………………………………………………………………………… 2.028…………………… 147Total Corn ………………………………………………………………………… 2.029…………………… 148Total Onions ……………………………………………………………………… 2.030…………………… 149Total Peppers……………………………………………………………………… 2.031…………………… 150Total White Potatoes……………………………………………………………… 2.032…………………… 151Total Dried Beans and Peas……………………………………………………… 2.033…………………… 152Fruits and Fruit JuicesTotal Oranges……………………………………………………………………… 2.034…………………… 153Total Orange Juice………………………………………………………………… 2.035…………………… 154Total Grapefruit …………………………………………………………………… 2.036…………………… 155Total Lemons……………………………………………………………………… 2.037…………………… 156Total Lemon Juice………………………………………………………………… 2.038…………………… 157Total Apples………………………………………………………………………… 2.039…………………… 158Total Apple Juice…………………………………………………………………… 2.040…………………… 159Total Peaches……………………………………………………………………… 2.041…………………… 160Total Bananas……………………………………………………………………… 2.042…………………… 161Total Strawberries………………………………………………………………… 2.043…………………… 162Total Grapes ……………………………………………………………………… 2.044…………………… 163Milk and Milk ProductsTotal Milk…………………………………………………………………………… 2.045…………………… 164Fluid Milk with Cereal……………………………………………………………… 2.046…………………… 165Total Cheese Other than Cream or Cottage…………………………………… 2.047…………………… 166Total Cottage Cheese …………………………………………………………… 2.048…………………… 167Ice Cream and Ice Milk…………………………………………………………… 2.049…………………… 168Meat, Fish, Poultry, Eggs, and Peanut ButterTotal Beef…………………………………………………………………………… 2.050…………………… 169Total Pork…………………………………………………………………………… 2.051…………………… 170
x
Table Number Page
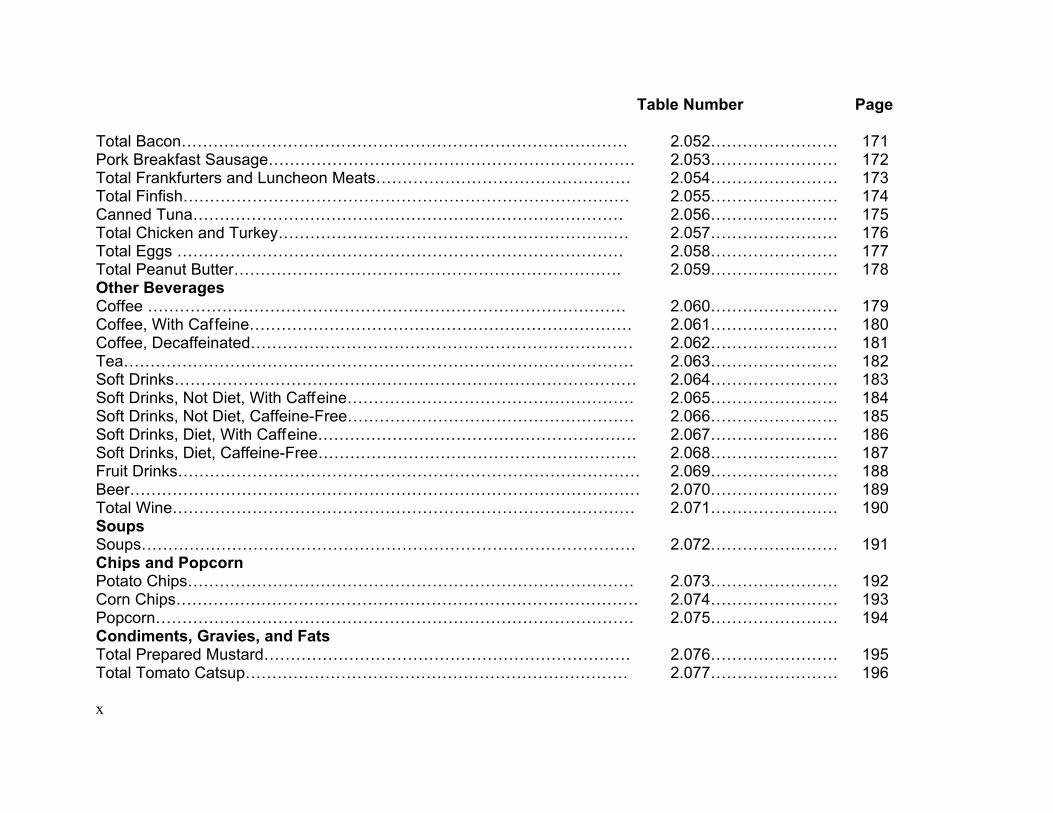
Total Bacon………………………………………………………………………… 2.052…………………… 171Pork Breakfast Sausage…………………………………………………………… 2.053…………………… 172Total Frankfurters and Luncheon Meats………………………………………… 2.054…………………… 173Total Finfish………………………………………………………………………… 2.055…………………… 174Canned Tuna……………………………………………………………………… 2.056…………………… 175Total Chicken and Turkey………………………………………………………… 2.057…………………… 176Total Eggs ………………………………………………………………………… 2.058…………………… 177Total Peanut Butter………………………………………………………………. 2.059…………………… 178Other BeveragesCoffee ……………………………………………………………………………… 2.060…………………… 179Coffee, With Caffeine……………………………………………………………… 2.061…………………… 180Coffee, Decaffeinated……………………………………………………………… 2.062…………………… 181Tea…………………………………………………………………………………… 2.063…………………… 182Soft Drinks…………………………………………………………………………… 2.064…………………… 183Soft Drinks, Not Diet, With Caffeine……………………………………………… 2.065…………………… 184Soft Drinks, Not Diet, Caffeine-Free……………………………………………… 2.066…………………… 185Soft Drinks, Diet, With Caffeine…………………………………………………… 2.067…………………… 186Soft Drinks, Diet, Caffeine-Free…………………………………………………… 2.068…………………… 187Fruit Drinks…………………………………………………………………………… 2.069…………………… 188Beer…………………………………………………………………………………… 2.070…………………… 189Total Wine…………………………………………………………………………… 2.071…………………… 190SoupsSoups………………………………………………………………………………… 2.072…………………… 191Chips and PopcornPotato Chips………………………………………………………………………… 2.073…………………… 192Corn Chips…………………………………………………………………………… 2.074…………………… 193Popcorn……………………………………………………………………………… 2.075…………………… 194Condiments, Gravies, and FatsTotal Prepared Mustard…………………………………………………………… 2.076…………………… 195Total Tomato Catsup……………………………………………………………… 2.077…………………… 196

xi
Table Number Page
Total Soy-Based Sauces ………………………………………………………… 2.078…………………… 197Total Cucumber Pickles…………………………………………………………… 2.079…………………… 198Total Sour Cream ………………………………………………………………… 2.080…………………… 199Total Fluid Cream ………………………………………………………………… 2.081…………………… 200Powdered Cream Substitute……………………………………………………… 2.082…………………… 201Total Margarine …………………………………………………………………… 2.083…………………… 202Margarine, All Types, Reported Separately…………………………………… 2.084…………………… 203Total Butter………………………………………………………………………… 2.085…………………… 204Total Vegetable Oil………………………………………………………………… 2.086…………………… 205Pourable Salad Dressing………………………………………………………… 2.087…………………… 206Total Mayonnaise and Mayonnaise-Type Dressing…………………………… 2.088…………………… 207Gravy………………………………………………………………………………… 2.089…………………… 208Sugars, Candies, and JelliesSyrup………………………………………………………………………………… 2.090…………………… 209Total Sugar………………………………………………………………………… 2.091…………………… 210Total Honey………………………………………………………………………… 2.092…………………… 211Candy Containing Chocolate……………………………………………………… 2.093…………………… 212Candy Not Containing Chocolate………………………………………………… 2.094…………………… 213Jelly, Jams, Preserves, and Marmalade………………………………………… 2.095…………………… 214Total Artificial Sweetener………………………………………………………… 2.096…………………… 215

xii
1
Introduction
The purpose of this report is to provide estimates ofquantities consumed by users of specified foods duringan eating occasion and during a day. Unlike traditionalpublished mean intakes (see appendix C), the data inthese tables are based on users of the specified foodonly rather than on all individuals in the survey - bothusers and nonusers of the food. Estimates provided are(1) means and percentiles of quantities consumed duringan eating occasion and (2) means and percentiles ofquantities consumed during a day.
Data such as these are important for many purposes,including development of food guidance programs andeducation materials, assessments related to foodmarketing and labeling, food safety exposureassessments, risk assessments, and development ofdietary assessment tools. For example, mean andmedian intakes, as well as distributions of intakes, canbe useful in reassessing appropriate serving sizes fordietary guidance. Quantities consumed at the upperpercentiles may facilitate risk assessment related todietary contaminants from particular foods, whiledistributions of intake may be more useful for microbialrisk assessment.
The data are provided in two sets of tables. Set 1 (tables1.001 to 1.111) provides estimated amounts of foodsconsumed by users at a single time, while Set 2 (tables2.001 to 2.096) provides estimated amounts of foodsconsumed by users on a single day. For both sets of
tables, food intake estimates are tabulated for individualsby sex and age.
The report is a result of a collaborative effort by ThePennsylvania State University and the AgriculturalResearch Service. It is based on data from 14,262individuals ages 2 and over collected in the 1994-96Continuing Survey of Food Intakes by Individuals(CSFII), conducted by the U.S. Department of Agriculture(USDA 1998). The survey provides estimates of foodintakes by individuals residing in households in anationally representative sample of the United States.
This report is the latest in a series of reports on the samesubject (Pao and Burk 1975, Pao et al. 1982, Krebs-Smith et al. 1997). The first of these provided data on theamounts consumed in a day and per eating occasion, aswell as the frequency of consumption, of 49 foods orgroups of foods, based on a survey conducted in 1965.The second provided similar data on the frequency andquantities of 200 foods eaten over a 3-day period, basedon a survey conducted in 1977-78. Both of these reportswere limited in the ability to quantify individual foodsconsumed as ingredients of mixed foods. The third report(Krebs-Smith et al. 1997) provided data based on asurvey conducted in 1989-91. That report benefited fromtwo important methodological advances. First, the mixedfoods reported in the survey were disaggregated viarecipe files so that the components of these foods couldbe placed with similar foods whenever preferable.Second, there were advances in the statistical analysismethods and software, which account for the complex

2
sample and non-response adjustments. These advancesresulted in better estimates of population parameters andtheir variances.
This report provides reasonable comparability to the1989-91 report despite some methodological differences. These differences include a different distribution ofsample persons by sex-age categories, specificallyyoung children and the elderly. Other differences aremainly due to improvements in dietary data collectionprocedures and to modifications and updates to the fooddatabases. Also, this report is based on 2 days ofdietary data whereas the previous report was based on 3days. Although there were no significant changes in thetables or foods included in each table, 4 new tables wereadded in Set 1 and 1 new table was added in Set 2 tocapture the consumption of milk consumed with cereal.
METHODS
Data Collection and Processing
Data Collection. Data were collected from January1994 to January 1997 by Westat, Inc., Rockville, MDunder contract with the USDA. Two 24-hour dietaryrecalls separated by 3 or more days were completed by95 percent of the participating sample persons. Details ofthe design of the CSFII 1994-96 sample and datacollection protocols are described elsewhere (Tippett andCypel, eds. 1998).
Food Coding and Editing. Food survey intake dataprocessing was facilitated by Survey Net, a computer-assisted food coding and data management systemtailored specifically to the questions, quality controlneeds, and data processing needs of the CSFII 1994-96.It contains three central databases:
1. a food coding database containing fooddescriptions and food measures withcorresponding gram weights,
2. a predefined recipe data base3. the Survey Nutrient Database (not used in
analyses of this report)
In preparation for the CSFII 1994-96, the food codingdatabase used for CSFII 1989-91 was expanded andupdated to capture important food processing andnutritional information that was to be collected during thefood intake interviews. Some expanded food groupswere vegetables; infant formulas; baby foods;margarines, spreads, and butters; fast-food sandwiches;and home-prepared soups. Ethnic foods and new foodsreported during the course of the survey or duringNHANES III were added to all food groups. Anotherchange in the food database that impacts this report wasthe expansion of the list of food measures and theircorresponding weights in grams. These included cubicinch weights of meats, fluid weights of beverages, anddimensions for raw fruits and vegetables.
Food codes in the database of Survey Net were chosento match the descriptions of the foods eaten by the
3
sample persons. Once a matching food description wasfound and selected, Survey Net provided a list ofcommon household measures appropriate for that food. Food descriptions and quantities not present in the foodcoding database were resolved by ARS.
Survey Net automatically performed gram weight checksof food quantities entered against maximum andminimum values established by ARS for each food. Thisweight check allowed coders to correct entry errorsimmediately. Coders recorded any questions regardingtheir food and quantity selections in a notepad withinSurvey Net, which coding supervisors then reviewed andanswered.
Combination codes. Greater flexibility and specificity infood coding was possible through the use of combinationcodes. Combinations were often instances of one foodbeing added to another, such as margarine to toast ormilk to cereal. Other combinations are foods made up ofseveral components that are relatively easy to describeand quantify separately, such as sandwiches and salads. Still another type of combination is a mixed dish wheretwo or more food codes linked together in a foodcombination present a more precise picture of what waseaten by the respondent than if a single food code isused, such as coding a frozen meal when the meat orvegetable was not eaten. Foods coded separately buteaten in combination at the same eating occasion wereassigned a common sequential combination number andwere classified with a categorical combination type. There were 11 combination types: beverage, cereal,
bread/baked product, salad, sandwich, soup, frozenmeal, ice cream/frozen yogurt, vegetable, fruit, and othermixture.
The presence of combination codes in the CSFII94-96data set may be useful in planning analyses, especiallythose related to salads, sandwiches, or foods combined“at the table” such as cereal and milk or corn chips andsalsa. A familiarity with the different ways a food mixturemight be reported, recorded, and coded into the foodcoding database would provide insights into the analysisof food consumption patterns, reported frequencies, andmean intakes of various foods. This report contains fournew tables that describe the intake of milk with cereal,generated with the aid of combination codes.
Analysis
Comparability of analysis. A major objective in planningthis report was to mirror the analysis conducted with theCSFII 1989-91 data (Krebs-Smith et al. 1997). Thesame criteria were applied in disaggregating recipes andin selecting and grouping foods. The criteria that a foodbe reported by at least 7 percent of the population wasrelaxed slightly in order to provide continuity between thereports. The percentage of individuals reporting a foodor food group is presented in the tables. The statisticalanalyses were conducted using the most currentversions of software designed to account for complexsample designs and the sampling weights were appliedto produce population estimates as was done in

4
preparing the 1989-91 report. As noted in theintroduction, the difference in the number of days ofintakes reported in 1989-91 and in 1994-96 should beconsidered in comparing percentages of individualsreporting a food between the two reports.
Disaggregation of mixed foods. Many of the foods inthe CSFII data set are mixed foods – that is, foodscomposed of more than one ingredient, such assandwiches and soups. As in the previous report (Krebs-Smith et al. 1997), mixed foods were disaggregated sothat the individual ingredients could be grouped togetherwith similar foods that were reported separately. Therefore, weights of foods consumed as ingredients ofmixed foods could be combined with weights of foodsreported separately in order to complete the data foreach table. This approach provides a more thoroughrepresentation of the consumption of many foodsespecially for the tables on quantities consumed in a day.The types of mixed foods from which ingredients wereextracted are identified in the Table Notes section of thisreport. For example, the definition for Pasta (Table1.019) includes all pasta whether reported separately oras part of a mixed dish.
Selection and grouping of foods for tables. Foodswere selected for inclusion in this report based on thepercentage of persons who reported eating them in thesurvey. The criterion was that a minimum of 7 percent ofthe population age 2 years and over be users of a food. The percentage was determined to provide estimates formost sex and age groups without reservation as to their
statistical reliability. (See below for discussion ofreporting guidelines.)
Four new tables were added to Table Set 1 and includefluid milk with cereal, whole milk with cereal, low fat milkwith cereal and skim milk with cereal. There was alsoone new table added to Table Set 2, fluid milk withcereal. These new tables were included because of thehigh consumption of these food mixtures.
Similar foods were grouped together in the same table iftheir gram weights for a given household measure wereapproximately the same. So, for example, many kinds ofrice are grouped together in one table because theweight per cup is approximately the same for all, whileraw tomatoes and tomato sauce are separated intodifferent tables because their weights per ½ cup aredifferent. As a result, the gram weight data in the tables,when considered together with the volume/weightequivalents, can be translated into estimates of commonmeasures.
Statistical procedures. Table Set 1 provides data onthe means and percentiles consumed during an eatingoccasion per user of the food. These values representall relevant reports by each person consuming the food.
Table Set 2 provides data on means and percentiles oftotal quantities consumed by consumers during a singleday. The purpose of these tables is to reveal dailyintakes. To maximize the number of individuals included,but not allow frequent consumers more weight than

5
infrequent consumers, only a single day on which thefood was reported was included for each individual. If arespondent reported the food only on 1 of 2 days, thatday of intake was selected for analysis. If the food wasreported on both days, one of the two days was randomlyselected.
While some foods may be eaten in discrete commonunits, it is assumed that the underlying distributions ofmost food intake data are continuous. Therefore,quantities consumed at various percentiles wereestimated using a linear interpolation method.
Appendix A shows the calculations used in deriving theestimates. Means, standard errors, quantities consumedat various percentiles, and estimates of percent ofpersons using a food at least once in a 2-day period werecalculated using SUDAAN, version 7.5.1 (Shah 1997). SAS, version 6.12 (SAS Institute 1996) was used inpreparing the data and controlling the calls to SUDAANand in the generation of the tables. Coefficients ofvariation (CVs), though not provided in the tables, weregenerated using SUDAAN and examined, along withrelevant sample sizes, to determine whether or not to flaga particular value. See rules used for flagging estimatesbelow.
Reporting guidelines. Data presented in this reportfollow the guidelines issued in a joint policy statement onvariance estimation and statistical reporting standardsprepared by a USDA/National Center for Health StatisticsAnalytic Working Group (Federation of AmericanSocieties for Experimental Biology 1995). The guidelinescall for an estimate to be flagged when the reliability of
the estimate might be affected by a small sample size orhigh variability relative to the mean. The guidelines (listedbelow) for determining when a small sample size mightaffect the reliability of an estimate take into account theeffect of the sampling method on estimation through a“broadly calculated” design effect. The variance inflationfactor (VIF) has been used in this role, where VIF = 1 +CV², and CV is the coefficient of variation of the full set ofsampling weights. For 2-day respondents of CSFII 1994-96, the VIF = 1.60.
Asterisks are used in the tables to flag estimates thatmay tend to be less statistically reliable than those thatare not flagged. The rules used for flagging estimates areas follows:
1. An estimated mean is flagged when it is based ona cell size of less than 30 times the averagedesign effect or when its coefficient of variation(CV) is equal to or greater than 30 percent. TheCV is the ratio of the estimated standard error ofthe mean to the estimated mean, expressed as apercentage.
2. An estimated proportion (percent) that falls above25 percent and below 75 percent is flagged whenit is based on a cell size of less than 30 times theaverage design effect (VIF) or when the CV isequal to or greater than 30 percent.
3. An estimated proportion of 25 percent or lower or75 percent or higher is flagged when the smallerof np and n( 1- p) is less than 8 times the VIF,
6
where "n" is the cell size on which the estimate isbased and "p" is the proportion expressed as afraction.
The rules for flagging percentiles follow the rules usedwith proportions with the exception that the CV of thepercentile is not considered. The following table providesthe minimum sample sizes for the presentation of thepercentiles in these tables without flags:
Minimum sample size
5th percentile 25610th percentile 12825th percentile 5250th percentile (median) 4875th percentile 5290th percentile 12895th percentile 256
The survey design and operations report (Tippett andCypel, eds. 1998) provides additional information on thesample design and weighting. Appendix A providesadditional statistical notes.
How to use the data in tables. The explanations for thesymbols used and the sections providing the descriptionof foods in each of the table sets (Table Notes) shouldbe consulted before using any of the tables. Theyprovide details about how to interpret the data andwhether all uses of a food, or only a selection, areincluded.
Table Set 1 represents quantities of food eaten during aneating occasion. This information was intended to beuseful when considering serving sizes for food guidance,for food labeling purposes, and for development ofdietary assessment tools. These tables include foodsreported separately and foods eaten as part of mixedfoods, but generally only if the ingredient of the mixturewould tend to be eaten in an amount equivalent to theportions reported separately.
Table Set 2 was designed to address the needs ofdietary assessments in the food safety, marketing,nutrition education, and other arenas which consider theamount of food consumed during an entire day. Therefore, these tables include more foods for whichevery kind of use is represented because the totalconsumption of a food is of interest. In summary, TableSet 1 generally includes foods eaten separately or readilyidentifiable in mixtures, such as the eggs in potato salador peanut butter on a sandwich, whereas Table Set 2generally includes uses similar to those just mentionedas well as ingredient uses, such as the peanut butter andeggs contained in cookies.
The two main sets of tables present amounts of foodsconsumed over short periods of time by consumers onlyduring the 3-year period, 1994-1996. Appendix Bpresents data from the same survey as average amountsconsumed per day by the target population, includingboth consumers and nonconsumers.
The number of persons in the sample, provided on eachtable, represents both users and non-users of the food.

7
Below that, on Table Sets 1 and 2, are the estimatedpercentages of persons using the food at least once in 2days, on 1 of 2 days, and on 2 of 2 days. For each groupof persons, the latter 2 percentages total to thepercentage using the food at least once in 2 days (anydifferences due to rounding). For example, about 93percent of all persons over age 2 used total yeast bread(Table 2.001) at least once in 2 days, with 28 percent ofpersons using it on 1 of the 2 days and 65 percent ofpersons using it on both days.
The quantities consumed per eating occasion (Table Set1) and in a day (Table Set 2) are quantities consumed byusers only and are reported in terms of gram weights. The weights can be translated into common householdmeasures using the conversions on the tables and in thetable notes. For example, it is estimated that among allconsumers of white bread age 2 and older, the meanquantity consumed during an eating occasion (Table1.001) is 50 g, or about 2 slices. The median value isestimated to be 46 g, that is, it is estimated that half thepopulation consuming white bread has 46 g or less pereating occasion, while the other half has 46 g or more. The conversion of household measures to gram weightsare reflective of those used in the 1994-96 survey and donot reflect changes in the market or in methodology sincethat time.
Appendix B contains estimates of mean quantities offoods consumed per person per day for all individuals,that is, consumers and nonconsumers, over all days. Although an individual’s usual (that is, long-run average)daily intake cannot be estimated, each of these means isan estimate of the population’s (or subpopulation’s)
mean usual daily intake. For example, the estimatedmean usual daily intake of total white bread is 50 g, whilethat of total yeast bread is 63 g. The difference in thesevalues is in part a reflection of the wider variety of breadsand range of uses included in total yeast bread and inpart a reflection of the greater percentage of personsusing total yeast bread than white bread.
Appendix C provides the minimum and maximum valuesof foods for which percentiles could not be interpolated inTable Sets 1 and 2 because the sample size was toosmall or because too many reports were of exactly thesame magnitude.
Limitations of the Data
The data, which are represented in the various tables,are subject to the following limitations. Respondentsfrequently were not expected to or could not providerecipes for mixed foods they had eaten, necessitating theuse of standard recipes. Therefore, the foodsrepresented in the tables are, in part, based onassumptions about the types and quantities ofingredients consumed as part of mixed foods. In addition,occasionally the ingredients of mixed foods were codedas individual foods to address unusual ingredientcombinations. Therefore, even though a table descriptionmay state that the table includes only particular foods ifreported separately and not as part of mixed foods, thismay include some foods which were consumed as partof mixed foods. However it is assumed this would have aminor impact on the results presented here because ofthe low frequency of occurrence.
8
Many of the tables in Set 2 represent the intake of allforms of a particular food, including those that are rawand cooked. Sometimes the gram weight of a particularhousehold measure varies for different forms of the food. For example, one half cup of raw onions weighs 80grams, while one half cup of cooked onions weighs 108grams. The gram weights presented will be influenced bythe relative contribution of the different forms of the food
and do not represent the raw commodity weights. Finally, the data are subject to the kinds of errors whichare common to all food intake data - imprecision in thequantities reported due to such factors as an inability toestimate portions precisely and imperfect memory.However, the survey procedures were designed tominimize these types of errors.

9
Table 1.001. White Bread: Percentage of persons using food in 2 days and quantities consumed per eating occasion.
)))))))))))))))))))))))))))))))))))))))))))))))))))))))))))))))))))))))))))))))))))))))))))))))))))))))))))))))))))))))))))))))))))
* * Age (years) and sex* *)))))))))))))))))))))))))))))))))))))))))))))))))))))))))))))))))))))))))))))))))
* * 2-5 6-11 12-19 20-39 40-59 60 and older* *)))))) )))))) ))))))))))))))) ))))))))))))))) ))))))))))))))) )))))))))))))))
Statistic * All individuals * Males Males* age 2 and over * and and Males Females Males Females Males Females Males Females* *females females
)))))))))))))))))))))))))))))))))))))))))))))))))))))))))))))))))))))))))))))))))))))))))))))))))))))))))))))))))))))))))))))))))))
Number in sample 14,262 2,109 1,432 696 702 1,543 1,449 1,663 1,694 1,545 1,429
Percent of persons using ))))))))))))))))))))))))))))))))))))))))))))%)))))))))))))))))))))))))))))))))))))))))))))
at least once in 2 days 59.6 66.9 67.1 61.3 57.9 63.0 54.9 59.7 55.3 59.3 54.8 on 1 of 2 days 37.4 40.8 42.2 35.7 38.8 36.6 37.5 38.1 37.3 32.5 34.6 on both days 22.2 26.2 24.9 25.6 19.1 26.4 17.4 21.6 18.0 26.8 20.2
Quantity consumed per eating occasion ))))))))))))))))))))))))))))))))))))))))))))g)))))))))))))))))))))))))))))))))))))))))))))(1 slice = 26 g)
Mean 50 34 42 56 47 63 47 59 46 51 41 SEM 1 # 1 1 1 2 1 2 1 1 1
5th percentile 21 11 20 26 19 26 20 25 20 23 20 10th percentile 24 16 23 31 24 33 24 30 23 25 23 25th percentile 33 23 27 42 32 43 32 42 32 35 26 50th percentile 46 31 40 51 43 52 44 52 44 46 40 75th percentile 52 46 52 63 52 70 52 62 52 52 50 90th percentile 78 52 54 86 75 104 65 97 62 78 54 95th percentile 104 54 70 104 95 138 90 117 85 104 72
)))))))))))))))))))))))))))))))))))))))))))))))))))))))))))))))))))))))))))))))))))))))))))))))))))))))))))))))))))))))))))))))))))
* Indicates a statistic that is potentially unreliable because of small sample size or large coefficient of variation.# Indicates a percentage that is greater than 0 but less than 0.05 or a mean, SEM, or percentile that is greater than 0 but less than 0.5.--- Indicates a percentile that could not be estimated.Note: See "Table notes."Source: USDA's Continuing Survey of Food Intakes by Individuals, 1994-96, 2 days.

10
Table 1.002. Whole Grain and "Wheat" Bread: Percentage of persons using food in 2 days and quantities consumed per eating occasion.
)))))))))))))))))))))))))))))))))))))))))))))))))))))))))))))))))))))))))))))))))))))))))))))))))))))))))))))))))))))))))))))))))))
* * Age (years) and sex* *)))))))))))))))))))))))))))))))))))))))))))))))))))))))))))))))))))))))))))))))))
* * 2-5 6-11 12-19 20-39 40-59 60 and older* *)))))) )))))) ))))))))))))))) ))))))))))))))) ))))))))))))))) )))))))))))))))
Statistic * All individuals * Males Males* age 2 and over * and and Males Females Males Females Males Females Males Females* *females females
)))))))))))))))))))))))))))))))))))))))))))))))))))))))))))))))))))))))))))))))))))))))))))))))))))))))))))))))))))))))))))))))))))
Number in sample 14,262 2,109 1,432 696 702 1,543 1,449 1,663 1,694 1,545 1,429
Percent of persons using ))))))))))))))))))))))))))))))))))))))))))))%)))))))))))))))))))))))))))))))))))))))))))))
at least once in 2 days 28.1 24.3 20.5 14.5 17.6 25.3 25.2 32.8 32.3 39.8 43.1 on 1 of 2 days 19.6 16.8 15.4 9.5 14.0 19.2 19.7 22.3 22.2 23.8 25.9 on both days 8.5 7.5 5.1 5.0 3.7 6.0 5.5 10.5 10.1 16.0 17.2
Quantity consumed per eating occasion ))))))))))))))))))))))))))))))))))))))))))))g)))))))))))))))))))))))))))))))))))))))))))))(1 slice = 28 g)
Mean 50 37 44 60 53 63 48 57 46 48 41 SEM 1 1 1 2 2 1 1 1 2 1 1
5th percentile 24 14 23 38 * 25 * 30 24 25 23 24 23 10th percentile 25 19 24 46 * 27 * 42 26 30 24 25 24 25th percentile 37 25 27 50 42 50 37 48 28 38 26 50th percentile 50 34 49 54 52 56 50 52 46 50 42 75th percentile 56 49 55 65 56 70 55 57 52 55 52 90th percentile 72 56 56 83 * 72 * 104 61 88 57 63 56 95th percentile 92 56 63 109 * 89 * 111 76 103 80 75 58
)))))))))))))))))))))))))))))))))))))))))))))))))))))))))))))))))))))))))))))))))))))))))))))))))))))))))))))))))))))))))))))))))))
* Indicates a statistic that is potentially unreliable because of small sample size or large coefficient of variation.# Indicates a percentage that is greater than 0 but less than 0.05 or a mean, SEM, or percentile that is greater than 0 but less than 0.5.--- Indicates a percentile that could not be estimated.Note: See "Table notes."Source: USDA's Continuing Survey of Food Intakes by Individuals, 1994-96, 2 days.

11
Table 1.003. Rolls: Percentage of persons using food in 2 days and quantities consumed per eating occasion.
)))))))))))))))))))))))))))))))))))))))))))))))))))))))))))))))))))))))))))))))))))))))))))))))))))))))))))))))))))))))))))))))))))
* * Age (years) and sex* *)))))))))))))))))))))))))))))))))))))))))))))))))))))))))))))))))))))))))))))))))
* * 2-5 6-11 12-19 20-39 40-59 60 and older* *)))))) )))))) ))))))))))))))) ))))))))))))))) ))))))))))))))) )))))))))))))))
Statistic * All individuals * Males Males* age 2 and over * and and Males Females Males Females Males Females Males Females* *females females
)))))))))))))))))))))))))))))))))))))))))))))))))))))))))))))))))))))))))))))))))))))))))))))))))))))))))))))))))))))))))))))))))))
Number in sample 14,262 2,109 1,432 696 702 1,543 1,449 1,663 1,694 1,545 1,429
Percent of persons using ))))))))))))))))))))))))))))))))))))))))))))%)))))))))))))))))))))))))))))))))))))))))))))
at least once in 2 days 48.0 40.0 53.5 61.9 48.8 62.0 46.4 47.9 43.4 37.8 30.6 on 1 of 2 days 36.9 33.0 41.7 44.5 37.4 43.7 36.7 36.8 35.5 29.3 25.8 on both days 11.1 7.0 11.9 17.3 11.4 18.3 9.7 11.1 7.9 8.5 4.9
Quantity consumed per eating occasion ))))))))))))))))))))))))))))))))))))))))))))g)))))))))))))))))))))))))))))))))))))))))))))(1 dinner roll = 28 g)
Mean 58 39 48 69 51 73 53 65 52 54 43 SEM 1 1 1 2 1 4 1 1 1 1 1
5th percentile 27 16 21 36 23 36 27 35 27 27 21 10th percentile 33 21 28 43 31 43 33 39 30 34 26 25th percentile 43 27 37 43 43 43 43 43 43 39 34 50th percentile 48 42 43 63 44 66 46 60 43 43 42 75th percentile 70 45 53 85 61 86 65 80 61 65 47 90th percentile 89 56 73 114 79 111 80 99 81 85 65 95th percentile 110 69 86 135 86 135 90 129 92 94 72
)))))))))))))))))))))))))))))))))))))))))))))))))))))))))))))))))))))))))))))))))))))))))))))))))))))))))))))))))))))))))))))))))))
* Indicates a statistic that is potentially unreliable because of small sample size or large coefficient of variation.# Indicates a percentage that is greater than 0 but less than 0.05 or a mean, SEM, or percentile that is greater than 0 but less than 0.5.--- Indicates a percentile that could not be estimated.Note: See "Table notes."Source: USDA's Continuing Survey of Food Intakes by Individuals, 1994-96, 2 days.

12
Table 1.004. Biscuits: Percentage of persons using food in 2 days and quantities consumed per eating occasion.
)))))))))))))))))))))))))))))))))))))))))))))))))))))))))))))))))))))))))))))))))))))))))))))))))))))))))))))))))))))))))))))))))))
* * Age (years) and sex* *)))))))))))))))))))))))))))))))))))))))))))))))))))))))))))))))))))))))))))))))))
* * 2-5 6-11 12-19 20-39 40-59 60 and older* *)))))) )))))) ))))))))))))))) ))))))))))))))) ))))))))))))))) )))))))))))))))
Statistic * All individuals * Males Males* age 2 and over * and and Males Females Males Females Males Females Males Females* *females females
)))))))))))))))))))))))))))))))))))))))))))))))))))))))))))))))))))))))))))))))))))))))))))))))))))))))))))))))))))))))))))))))))))
Number in sample 14,262 2,109 1,432 696 702 1,543 1,449 1,663 1,694 1,545 1,429
Percent of persons using ))))))))))))))))))))))))))))))))))))))))))))%)))))))))))))))))))))))))))))))))))))))))))))
at least once in 2 days 10.9 8.3 9.7 12.2 10.3 11.5 9.4 13.4 11.2 13.0 9.8 on 1 of 2 days 9.5 7.8 9.2 10.6 9.5 9.8 8.7 11.7 9.1 10.1 8.3 on both days 1.4 0.5 * 0.6 * 1.6 * 0.8 * 1.7 0.7 * 1.7 2.1 2.9 1.5
Quantity consumed per eating occasion ))))))))))))))))))))))))))))))))))))))))))))g)))))))))))))))))))))))))))))))))))))))))))))(1 biscuit = 30 g)
Mean 61 38 48 72 55 73 55 80 56 58 48 SEM 1 2 3 4 4 3 2 3 2 3 3
5th percentile 19 8 * 10 * 18 * 17 * 29 * 18 * 21 * 19 * 19 * 15 * 10th percentile 19 13 15 29 * 18 * 33 19 30 19 26 19 25th percentile 35 19 19 40 29 49 30 49 31 36 23 50th percentile 57 30 38 60 43 66 51 61 54 55 38 75th percentile 76 50 59 94 74 82 68 99 67 70 59 90th percentile 104 74 85 120 * 100 * 128 91 150 87 98 84 95th percentile 139 82 * 104 * 136 * 130 * 157 * 119 * 174 * 118 * 123 * 117 *
)))))))))))))))))))))))))))))))))))))))))))))))))))))))))))))))))))))))))))))))))))))))))))))))))))))))))))))))))))))))))))))))))))
* Indicates a statistic that is potentially unreliable because of small sample size or large coefficient of variation.# Indicates a percentage that is greater than 0 but less than 0.05 or a mean, SEM, or percentile that is greater than 0 but less than 0.5.--- Indicates a percentile that could not be estimated.Note: See "Table notes."Source: USDA's Continuing Survey of Food Intakes by Individuals, 1994-96, 2 days.

13
Table 1.005. Tortillas: Percentage of persons using food in 2 days and quantities consumed per eating occasion.
)))))))))))))))))))))))))))))))))))))))))))))))))))))))))))))))))))))))))))))))))))))))))))))))))))))))))))))))))))))))))))))))))))
* * Age (years) and sex* *)))))))))))))))))))))))))))))))))))))))))))))))))))))))))))))))))))))))))))))))))
* * 2-5 6-11 12-19 20-39 40-59 60 and older* *)))))) )))))) ))))))))))))))) ))))))))))))))) ))))))))))))))) )))))))))))))))
Statistic * All individuals * Males Males* age 2 and over * and and Males Females Males Females Males Females Males Females* *females females
)))))))))))))))))))))))))))))))))))))))))))))))))))))))))))))))))))))))))))))))))))))))))))))))))))))))))))))))))))))))))))))))))))
Number in sample 14,262 2,109 1,432 696 702 1,543 1,449 1,663 1,694 1,545 1,429
Percent of persons using ))))))))))))))))))))))))))))))))))))))))))))%)))))))))))))))))))))))))))))))))))))))))))))
at least once in 2 days 15.5 14.6 16.4 22.9 20.1 20.6 20.1 13.4 12.7 4.2 5.4 on 1 of 2 days 12.5 12.2 13.6 17.7 17.2 15.6 16.1 11.2 10.8 3.3 4.6 on both days 3.0 2.4 2.9 5.2 2.8 5.0 4.0 2.2 1.9 0.9 0.8 *
Quantity consumed per eating occasion ))))))))))))))))))))))))))))))))))))))))))))g)))))))))))))))))))))))))))))))))))))))))))))(1 7-inch round corn tortilla = 25 g)
Mean 60 32 47 76 56 79 53 67 52 47 41 SEM 1 2 2 5 3 4 2 3 2 4 2
5th percentile 14 7 12 25 * 19 * 24 19 15 * 13 * 14 * 17 * 10th percentile 21 12 14 28 22 32 23 23 20 17 * 19 * 25th percentile 32 17 24 40 33 42 32 35 30 24 26 50th percentile 48 26 40 63 51 70 48 57 45 43 35 75th percentile 79 40 56 98 73 96 67 85 66 57 50 90th percentile 107 54 90 128 92 146 96 123 92 80 * 70 * 95th percentile 135 77 105 172 * 120 * 170 109 163 * 119 * 89 * 83 *
)))))))))))))))))))))))))))))))))))))))))))))))))))))))))))))))))))))))))))))))))))))))))))))))))))))))))))))))))))))))))))))))))))
* Indicates a statistic that is potentially unreliable because of small sample size or large coefficient of variation.# Indicates a percentage that is greater than 0 but less than 0.05 or a mean, SEM, or percentile that is greater than 0 but less than 0.5.--- Indicates a percentile that could not be estimated.Note: See "Table notes."Source: USDA's Continuing Survey of Food Intakes by Individuals, 1994-96, 2 days.

14
Table 1.006. Quickbreads and Muffins: Percentage of persons using food in 2 days and quantities consumed per eating occasion.
)))))))))))))))))))))))))))))))))))))))))))))))))))))))))))))))))))))))))))))))))))))))))))))))))))))))))))))))))))))))))))))))))))
* * Age (years) and sex* *)))))))))))))))))))))))))))))))))))))))))))))))))))))))))))))))))))))))))))))))))
* * 2-5 6-11 12-19 20-39 40-59 60 and older* *)))))) )))))) ))))))))))))))) ))))))))))))))) ))))))))))))))) )))))))))))))))
Statistic * All individuals * Males Males* age 2 and over * and and Males Females Males Females Males Females Males Females* *females females
)))))))))))))))))))))))))))))))))))))))))))))))))))))))))))))))))))))))))))))))))))))))))))))))))))))))))))))))))))))))))))))))))))
Number in sample 14,262 2,109 1,432 696 702 1,543 1,449 1,663 1,694 1,545 1,429
Percent of persons using ))))))))))))))))))))))))))))))))))))))))))))%)))))))))))))))))))))))))))))))))))))))))))))
at least once in 2 days 12.5 9.6 9.6 11.0 11.0 8.0 11.3 15.7 14.9 17.4 18.3 on 1 of 2 days 10.9 9.1 8.3 9.9 10.7 7.3 10.2 13.0 13.3 13.8 15.1 on both days 1.6 0.6 * 1.3 1.0 * 0.3 * 0.7 * 1.1 2.6 1.7 3.6 3.1
Quantity consumed per eating occasion ))))))))))))))))))))))))))))))))))))))))))))g)))))))))))))))))))))))))))))))))))))))))))))(1 medium bran muffin = 57 g)
Mean 82 55 67 125 79 93 79 93 72 86 72 SEM 2 4 5 12 10 7 5 7 4 5 4
5th percentile 21 10 * 13 * 37 * 11 * 24 * 23 * 28 22 * 21 13 10th percentile 28 14 26 * 50 * 19 * 44 * 36 39 28 27 21 25th percentile 52 28 46 57 43 57 57 56 45 48 42 50th percentile 60 51 57 88 61 71 57 71 57 61 57 75th percentile 94 63 72 140 98 113 77 113 85 105 90 90th percentile 142 105 120 * 231 * 143 * 156 * 124 165 114 146 121 95th percentile 187 123 * 152 * 340 * 173 * 177 * 154 * 241 134 * 233 170
)))))))))))))))))))))))))))))))))))))))))))))))))))))))))))))))))))))))))))))))))))))))))))))))))))))))))))))))))))))))))))))))))))
* Indicates a statistic that is potentially unreliable because of small sample size or large coefficient of variation.# Indicates a percentage that is greater than 0 but less than 0.05 or a mean, SEM, or percentile that is greater than 0 but less than 0.5.--- Indicates a percentile that could not be estimated.Note: See "Table notes."Source: USDA's Continuing Survey of Food Intakes by Individuals, 1994-96, 2 days.

15
Table 1.007. Doughnuts and Sweet Rolls: Percentage of persons using food in 2 days and quantities consumed per eating occasion.
)))))))))))))))))))))))))))))))))))))))))))))))))))))))))))))))))))))))))))))))))))))))))))))))))))))))))))))))))))))))))))))))))))
* * Age (years) and sex* *)))))))))))))))))))))))))))))))))))))))))))))))))))))))))))))))))))))))))))))))))
* * 2-5 6-11 12-19 20-39 40-59 60 and older* *)))))) )))))) ))))))))))))))) ))))))))))))))) ))))))))))))))) )))))))))))))))
Statistic * All individuals * Males Males* age 2 and over * and and Males Females Males Females Males Females Males Females* *females females
)))))))))))))))))))))))))))))))))))))))))))))))))))))))))))))))))))))))))))))))))))))))))))))))))))))))))))))))))))))))))))))))))))
Number in sample 14,262 2,109 1,432 696 702 1,543 1,449 1,663 1,694 1,545 1,429
Percent of persons using ))))))))))))))))))))))))))))))))))))))))))))%)))))))))))))))))))))))))))))))))))))))))))))
at least once in 2 days 12.4 11.3 13.4 17.3 13.8 13.3 11.2 13.4 11.0 11.4 10.4 on 1 of 2 days 11.3 10.7 12.5 15.4 13.1 11.9 10.5 12.1 9.5 10.2 9.1 on both days 1.1 0.6 * 0.9 1.9 0.7 * 1.4 0.6 * 1.3 1.5 1.2 1.2
Quantity consumed per eating occasion ))))))))))))))))))))))))))))))))))))))))))))g)))))))))))))))))))))))))))))))))))))))))))))(1 medium sweet roll = 60 g)
Mean 77 59 69 102 78 94 68 88 72 65 56 SEM 1 2 2 12 5 5 2 4 4 2 2
5th percentile 26 21 * 26 * 40 * 23 * 28 * 26 * 30 * 21 * 26 * 16 * 10th percentile 36 26 36 45 * 28 * 39 36 42 39 32 24 25th percentile 47 38 47 53 47 55 47 53 50 47 40 50th percentile 65 52 59 73 60 83 60 75 60 55 55 75th percentile 93 69 83 120 98 119 82 109 84 82 65 90th percentile 133 108 109 178 * 148 * 162 117 150 114 109 83 95th percentile 164 126 * 120 * 253 * 154 * 178 * 130 * 166 * 127 * 120 * 94 *
)))))))))))))))))))))))))))))))))))))))))))))))))))))))))))))))))))))))))))))))))))))))))))))))))))))))))))))))))))))))))))))))))))
* Indicates a statistic that is potentially unreliable because of small sample size or large coefficient of variation.# Indicates a percentage that is greater than 0 but less than 0.05 or a mean, SEM, or percentile that is greater than 0 but less than 0.5.--- Indicates a percentile that could not be estimated.Note: See "Table notes."Source: USDA's Continuing Survey of Food Intakes by Individuals, 1994-96, 2 days.

16
Table 1.008. Crackers: Percentage of persons using food in 2 days and quantities consumed per eating occasion.
)))))))))))))))))))))))))))))))))))))))))))))))))))))))))))))))))))))))))))))))))))))))))))))))))))))))))))))))))))))))))))))))))))
* * Age (years) and sex* *)))))))))))))))))))))))))))))))))))))))))))))))))))))))))))))))))))))))))))))))))
* * 2-5 6-11 12-19 20-39 40-59 60 and older* *)))))) )))))) ))))))))))))))) ))))))))))))))) ))))))))))))))) )))))))))))))))
Statistic * All individuals * Males Males* age 2 and over * and and Males Females Males Females Males Females Males Females* *females females
)))))))))))))))))))))))))))))))))))))))))))))))))))))))))))))))))))))))))))))))))))))))))))))))))))))))))))))))))))))))))))))))))))
Number in sample 14,262 2,109 1,432 696 702 1,543 1,449 1,663 1,694 1,545 1,429
Percent of persons using ))))))))))))))))))))))))))))))))))))))))))))%)))))))))))))))))))))))))))))))))))))))))))))
at least once in 2 days 17.4 25.4 17.2 10.6 14.2 11.9 15.6 16.6 17.5 25.6 25.9 on 1 of 2 days 14.9 20.8 15.4 9.4 12.0 11.3 13.6 13.9 15.6 19.7 20.9 on both days 2.5 4.6 1.8 1.2 * 2.2 0.6 * 2.0 2.7 1.9 5.9 5.0
Quantity consumed per eating occasion ))))))))))))))))))))))))))))))))))))))))))))g)))))))))))))))))))))))))))))))))))))))))))))(4 saltines = 12 g)
Mean 26 17 26 39 26 36 28 30 24 23 17 SEM 1 1 2 5 3 3 2 1 1 1 1
5th percentile 6 6 6 * 5 * 5 * 8 * 6 * 9 6 6 6 10th percentile 9 6 8 10 * 6 * 11 9 11 8 9 6 25th percentile 12 11 12 15 12 17 12 16 12 12 11 50th percentile 18 13 19 30 18 26 23 24 18 18 14 75th percentile 30 19 29 46 29 40 35 38 29 28 22 90th percentile 47 28 49 76 * 51 * 74 51 45 44 40 29 95th percentile 62 32 61 * 97 * 68 * 98 * 71 * 60 55 47 35
)))))))))))))))))))))))))))))))))))))))))))))))))))))))))))))))))))))))))))))))))))))))))))))))))))))))))))))))))))))))))))))))))))
* Indicates a statistic that is potentially unreliable because of small sample size or large coefficient of variation.# Indicates a percentage that is greater than 0 but less than 0.05 or a mean, SEM, or percentile that is greater than 0 but less than 0.5.--- Indicates a percentile that could not be estimated.Note: See "Table notes."Source: USDA's Continuing Survey of Food Intakes by Individuals, 1994-96, 2 days.

17
Table 1.009. Cookies: Percentage of persons using food in 2 days and quantities consumed per eating occasion.
)))))))))))))))))))))))))))))))))))))))))))))))))))))))))))))))))))))))))))))))))))))))))))))))))))))))))))))))))))))))))))))))))))
* * Age (years) and sex* *)))))))))))))))))))))))))))))))))))))))))))))))))))))))))))))))))))))))))))))))))
* * 2-5 6-11 12-19 20-39 40-59 60 and older* *)))))) )))))) ))))))))))))))) ))))))))))))))) ))))))))))))))) )))))))))))))))
Statistic * All individuals * Males Males* age 2 and over * and and Males Females Males Females Males Females Males Females* *females females
)))))))))))))))))))))))))))))))))))))))))))))))))))))))))))))))))))))))))))))))))))))))))))))))))))))))))))))))))))))))))))))))))))
Number in sample 14,262 2,109 1,432 696 702 1,543 1,449 1,663 1,694 1,545 1,429
Percent of persons using ))))))))))))))))))))))))))))))))))))))))))))%)))))))))))))))))))))))))))))))))))))))))))))
at least once in 2 days 30.7 51.0 46.7 29.0 31.8 20.8 26.5 27.6 29.0 29.7 32.2 on 1 of 2 days 23.4 37.9 35.0 21.5 24.6 15.9 21.2 21.6 23.4 20.5 23.5 on both days 7.3 13.1 11.8 7.4 7.2 4.8 5.2 6.0 5.7 9.2 8.8
Quantity consumed per eating occasion ))))))))))))))))))))))))))))))))))))))))))))g)))))))))))))))))))))))))))))))))))))))))))))(1 medium = 10 g)
Mean 40 28 37 53 42 56 39 47 36 40 30 SEM 1 1 2 3 2 4 2 2 1 2 1
5th percentile 9 7 9 10 * 8 * 10 9 10 8 10 8 10th percentile 12 10 11 16 12 16 13 14 12 13 11 25th percentile 20 15 19 28 24 28 19 25 20 21 16 50th percentile 31 24 30 44 33 43 30 40 30 32 25 75th percentile 50 33 43 63 56 66 46 60 44 45 36 90th percentile 75 48 64 87 76 110 74 79 66 77 57 95th percentile 96 63 84 116 * 86 * 141 89 99 81 114 65
)))))))))))))))))))))))))))))))))))))))))))))))))))))))))))))))))))))))))))))))))))))))))))))))))))))))))))))))))))))))))))))))))))
* Indicates a statistic that is potentially unreliable because of small sample size or large coefficient of variation.# Indicates a percentage that is greater than 0 but less than 0.05 or a mean, SEM, or percentile that is greater than 0 but less than 0.5.--- Indicates a percentile that could not be estimated.Note: See "Table notes."Source: USDA's Continuing Survey of Food Intakes by Individuals, 1994-96, 2 days.

18
Table 1.010. Cake: Percentage of persons using food in 2 days and quantities consumed per eating occasion.
)))))))))))))))))))))))))))))))))))))))))))))))))))))))))))))))))))))))))))))))))))))))))))))))))))))))))))))))))))))))))))))))))))
* * Age (years) and sex* *)))))))))))))))))))))))))))))))))))))))))))))))))))))))))))))))))))))))))))))))))
* * 2-5 6-11 12-19 20-39 40-59 60 and older* *)))))) )))))) ))))))))))))))) ))))))))))))))) ))))))))))))))) )))))))))))))))
Statistic * All individuals * Males Males* age 2 and over * and and Males Females Males Females Males Females Males Females* *females females
)))))))))))))))))))))))))))))))))))))))))))))))))))))))))))))))))))))))))))))))))))))))))))))))))))))))))))))))))))))))))))))))))))
Number in sample 14,262 2,109 1,432 696 702 1,543 1,449 1,663 1,694 1,545 1,429
Percent of persons using ))))))))))))))))))))))))))))))))))))))))))))%)))))))))))))))))))))))))))))))))))))))))))))
at least once in 2 days 16.2 14.6 19.7 15.1 15.5 13.5 14.9 16.5 16.8 19.2 18.3 on 1 of 2 days 14.7 13.6 18.4 13.8 14.0 12.4 13.3 14.4 15.6 17.3 16.3 on both days 1.5 1.0 1.3 1.4 * 1.5 * 1.0 1.6 2.2 1.3 2.0 1.9
Quantity consumed per eating occasion ))))))))))))))))))))))))))))))))))))))))))))g)))))))))))))))))))))))))))))))))))))))))))))(1/12 of a frosted cake = 109 g)
Mean 92 70 79 99 85 113 94 108 83 85 87 SEM 3 3 4 9 8 9 7 6 4 4 7
5th percentile 22 13 22 34 * 22 * 32 * 22 * 24 15 20 18 10th percentile 28 25 27 40 * 30 * 39 25 37 26 30 24 25th percentile 41 39 39 40 40 57 40 54 40 41 40 50th percentile 77 51 57 80 75 84 63 81 65 70 66 75th percentile 116 91 108 118 109 160 120 122 109 109 108 90th percentile 181 129 160 185 * 138 * 201 171 216 150 152 158 95th percentile 217 163 202 259 * 198 * 253 * 228 * 246 204 182 216
)))))))))))))))))))))))))))))))))))))))))))))))))))))))))))))))))))))))))))))))))))))))))))))))))))))))))))))))))))))))))))))))))))
* Indicates a statistic that is potentially unreliable because of small sample size or large coefficient of variation.# Indicates a percentage that is greater than 0 but less than 0.05 or a mean, SEM, or percentile that is greater than 0 but less than 0.5.--- Indicates a percentile that could not be estimated.Note: See "Table notes."Source: USDA's Continuing Survey of Food Intakes by Individuals, 1994-96, 2 days.

19
Table 1.011. Pie: Percentage of persons using food in 2 days and quantities consumed per eating occasion.
)))))))))))))))))))))))))))))))))))))))))))))))))))))))))))))))))))))))))))))))))))))))))))))))))))))))))))))))))))))))))))))))))))
* * Age (years) and sex* *)))))))))))))))))))))))))))))))))))))))))))))))))))))))))))))))))))))))))))))))))
* * 2-5 6-11 12-19 20-39 40-59 60 and older* *)))))) )))))) ))))))))))))))) ))))))))))))))) ))))))))))))))) )))))))))))))))
Statistic * All individuals * Males Males* age 2 and over * and and Males Females Males Females Males Females Males Females* *females females
)))))))))))))))))))))))))))))))))))))))))))))))))))))))))))))))))))))))))))))))))))))))))))))))))))))))))))))))))))))))))))))))))))
Number in sample 14,262 2,109 1,432 696 702 1,543 1,449 1,663 1,694 1,545 1,429
Percent of persons using ))))))))))))))))))))))))))))))))))))))))))))%)))))))))))))))))))))))))))))))))))))))))))))
at least once in 2 days 8.5 2.9 5.6 6.6 4.8 5.8 7.2 11.8 9.9 16.4 13.3 on 1 of 2 days 7.9 2.8 5.5 6.5 4.7 5.6 6.9 11.1 9.3 14.2 12.1 on both days 0.5 0.1 * 0.2 * 0.1 * 0.1 * 0.1 * 0.3 * 0.7 * 0.5 * 2.3 1.3
Quantity consumed per eating occasion ))))))))))))))))))))))))))))))))))))))))))))g)))))))))))))))))))))))))))))))))))))))))))))(1/8 of a 9-inch cream pie = 144 g)
Mean 150 76 116 188 138 * 161 150 162 151 154 137 SEM 3 8 8 15 12 * 7 9 6 8 7 5
5th percentile 52 3 * 40 * 70 * 49 * 55 * 50 * 70 * 50 * 56 * 46 * 10th percentile 72 8 * 53 * 86 * 73 * 83 * 76 * 91 71 75 70 25th percentile 102 37 76 116 * 107 * 114 105 119 102 108 98 50th percentile 143 69 110 144 128 148 146 144 145 144 132 75th percentile 168 101 148 243 * 154 * 213 175 181 157 170 153 90th percentile 246 150 * 168 * 309 * 182 * 248 * 224 * 289 254 228 201 95th percentile 300 196 * 205 * 343 * 190 * 301 * 281 * 305 * 300 * 292 * 258 *
)))))))))))))))))))))))))))))))))))))))))))))))))))))))))))))))))))))))))))))))))))))))))))))))))))))))))))))))))))))))))))))))))))
* Indicates a statistic that is potentially unreliable because of small sample size or large coefficient of variation.# Indicates a percentage that is greater than 0 but less than 0.05 or a mean, SEM, or percentile that is greater than 0 but less than 0.5.--- Indicates a percentile that could not be estimated.Note: See "Table notes."Source: USDA's Continuing Survey of Food Intakes by Individuals, 1994-96, 2 days.

20
Table 1.012. Pancakes and Waffles: Percentage of persons using food in 2 days and quantities consumed per eating occasion.
)))))))))))))))))))))))))))))))))))))))))))))))))))))))))))))))))))))))))))))))))))))))))))))))))))))))))))))))))))))))))))))))))))
* * Age (years) and sex* *)))))))))))))))))))))))))))))))))))))))))))))))))))))))))))))))))))))))))))))))))
* * 2-5 6-11 12-19 20-39 40-59 60 and older* *)))))) )))))) ))))))))))))))) ))))))))))))))) ))))))))))))))) )))))))))))))))
Statistic * All individuals * Males Males* age 2 and over * and and Males Females Males Females Males Females Males Females* *females females
)))))))))))))))))))))))))))))))))))))))))))))))))))))))))))))))))))))))))))))))))))))))))))))))))))))))))))))))))))))))))))))))))))
Number in sample 14,262 2,109 1,432 696 702 1,543 1,449 1,663 1,694 1,545 1,429
Percent of persons using ))))))))))))))))))))))))))))))))))))))))))))%)))))))))))))))))))))))))))))))))))))))))))))
at least once in 2 days 10.3 19.1 21.5 13.5 8.2 8.0 7.4 7.5 8.0 10.8 8.2 on 1 of 2 days 9.1 15.7 18.2 12.2 7.5 7.4 6.5 6.8 7.0 8.8 7.3 on both days 1.3 3.4 3.3 1.3 * 0.6 * 0.6 * 0.8 * 0.8 * 1.0 2.0 0.8 *
Quantity consumed per eating occasion ))))))))))))))))))))))))))))))))))))))))))))g)))))))))))))))))))))))))))))))))))))))))))))(1 5-inch pancake = 40 g)
Mean 85 49 77 96 74 126 80 117 74 99 68 SEM 3 1 3 6 5 15 6 8 5 5 4
5th percentile 21 13 23 31 * 17 * 39 * 18 * 38 * 20 * 37 * 18 * 10th percentile 35 20 36 40 * 24 * 42 * 29 * 40 33 41 21 * 25th percentile 42 31 42 74 41 69 40 63 39 61 40 50th percentile 75 40 74 79 75 107 72 102 63 92 55 75th percentile 109 63 98 112 89 160 101 148 88 117 79 90th percentile 158 80 120 164 * 122 * 215 * 123 * 203 130 159 120 * 95th percentile 205 103 148 205 * 141 * 220 * 165 * 302 * 161 * 195 * 162 *
)))))))))))))))))))))))))))))))))))))))))))))))))))))))))))))))))))))))))))))))))))))))))))))))))))))))))))))))))))))))))))))))))))
* Indicates a statistic that is potentially unreliable because of small sample size or large coefficient of variation.# Indicates a percentage that is greater than 0 but less than 0.05 or a mean, SEM, or percentile that is greater than 0 but less than 0.5.--- Indicates a percentile that could not be estimated.Note: See "Table notes."Source: USDA's Continuing Survey of Food Intakes by Individuals, 1994-96, 2 days.

21
Table 1.013. Cooked Cereal: Percentage of persons using food in 2 days and quantities consumed per eating occasion.
)))))))))))))))))))))))))))))))))))))))))))))))))))))))))))))))))))))))))))))))))))))))))))))))))))))))))))))))))))))))))))))))))))
* * Age (years) and sex* *)))))))))))))))))))))))))))))))))))))))))))))))))))))))))))))))))))))))))))))))))
* * 2-5 6-11 12-19 20-39 40-59 60 and older* *)))))) )))))) ))))))))))))))) ))))))))))))))) ))))))))))))))) )))))))))))))))
Statistic * All individuals * Males Males* age 2 and over * and and Males Females Males Females Males Females Males Females* *females females
)))))))))))))))))))))))))))))))))))))))))))))))))))))))))))))))))))))))))))))))))))))))))))))))))))))))))))))))))))))))))))))))))))
Number in sample 14,262 2,109 1,432 696 702 1,543 1,449 1,663 1,694 1,545 1,429
Percent of persons using ))))))))))))))))))))))))))))))))))))))))))))%)))))))))))))))))))))))))))))))))))))))))))))
at least once in 2 days 10.3 16.8 9.0 5.2 6.0 5.2 7.3 9.7 10.3 20.9 20.2 on 1 of 2 days 7.9 13.8 7.3 4.3 4.7 4.0 6.4 7.3 8.1 13.1 14.5 on both days 2.5 3.0 1.7 0.9 * 1.2 * 1.3 0.9 2.4 2.1 7.8 5.7
Quantity consumed per eating occasion ))))))))))))))))))))))))))))))))))))))))))))g)))))))))))))))))))))))))))))))))))))))))))))(1/2 cup of oatmeal = 117 g)
Mean 248 211 245 310 * 256 * 313 219 300 243 255 216 SEM 6 10 14 29 * 31 * 30 11 16 11 8 8
5th percentile 81 49 58 * 118 * 55 * 93 * 67 * 102 * 73 * 78 101 10th percentile 117 83 116 119 * 71 * 121 * 92 * 122 116 115 118 25th percentile 157 118 174 181 * 119 * 177 123 225 157 175 155 50th percentile 233 208 219 252 236 242 231 246 231 234 228 75th percentile 291 242 271 426 * 352 * 410 245 409 262 301 242 90th percentile 455 352 456 480 * 466 * 499 * 350 * 474 448 448 313 95th percentile 484 453 478 * 559 * 481 * 616 * 415 * 498 * 485 * 478 351
)))))))))))))))))))))))))))))))))))))))))))))))))))))))))))))))))))))))))))))))))))))))))))))))))))))))))))))))))))))))))))))))))))
* Indicates a statistic that is potentially unreliable because of small sample size or large coefficient of variation.# Indicates a percentage that is greater than 0 but less than 0.05 or a mean, SEM, or percentile that is greater than 0 but less than 0.5.--- Indicates a percentile that could not be estimated.Note: See "Table notes."Source: USDA's Continuing Survey of Food Intakes by Individuals, 1994-96, 2 days.
22
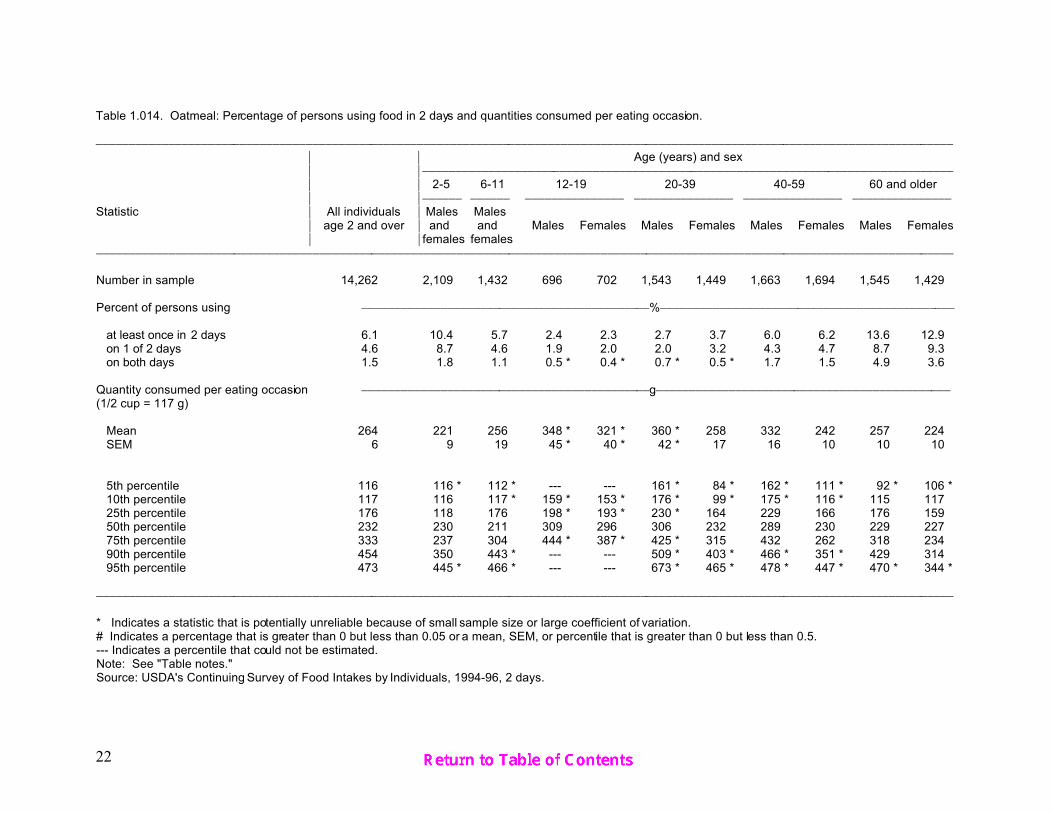
Table 1.014. Oatmeal: Percentage of persons using food in 2 days and quantities consumed per eating occasion.
)))))))))))))))))))))))))))))))))))))))))))))))))))))))))))))))))))))))))))))))))))))))))))))))))))))))))))))))))))))))))))))))))))
* * Age (years) and sex* *)))))))))))))))))))))))))))))))))))))))))))))))))))))))))))))))))))))))))))))))))
* * 2-5 6-11 12-19 20-39 40-59 60 and older* *)))))) )))))) ))))))))))))))) ))))))))))))))) ))))))))))))))) )))))))))))))))
Statistic * All individuals * Males Males* age 2 and over * and and Males Females Males Females Males Females Males Females* *females females
)))))))))))))))))))))))))))))))))))))))))))))))))))))))))))))))))))))))))))))))))))))))))))))))))))))))))))))))))))))))))))))))))))
Number in sample 14,262 2,109 1,432 696 702 1,543 1,449 1,663 1,694 1,545 1,429
Percent of persons using ))))))))))))))))))))))))))))))))))))))))))))%)))))))))))))))))))))))))))))))))))))))))))))
at least once in 2 days 6.1 10.4 5.7 2.4 2.3 2.7 3.7 6.0 6.2 13.6 12.9 on 1 of 2 days 4.6 8.7 4.6 1.9 2.0 2.0 3.2 4.3 4.7 8.7 9.3 on both days 1.5 1.8 1.1 0.5 * 0.4 * 0.7 * 0.5 * 1.7 1.5 4.9 3.6
Quantity consumed per eating occasion ))))))))))))))))))))))))))))))))))))))))))))g)))))))))))))))))))))))))))))))))))))))))))))(1/2 cup = 117 g)
Mean 264 221 256 348 * 321 * 360 * 258 332 242 257 224 SEM 6 9 19 45 * 40 * 42 * 17 16 10 10 10
5th percentile 116 116 * 112 * --- --- 161 * 84 * 162 * 111 * 92 * 106 * 10th percentile 117 116 117 * 159 * 153 * 176 * 99 * 175 * 116 * 115 117 25th percentile 176 118 176 198 * 193 * 230 * 164 229 166 176 159 50th percentile 232 230 211 309 296 306 232 289 230 229 227 75th percentile 333 237 304 444 * 387 * 425 * 315 432 262 318 234 90th percentile 454 350 443 * --- --- 509 * 403 * 466 * 351 * 429 314 95th percentile 473 445 * 466 * --- --- 673 * 465 * 478 * 447 * 470 * 344 *
)))))))))))))))))))))))))))))))))))))))))))))))))))))))))))))))))))))))))))))))))))))))))))))))))))))))))))))))))))))))))))))))))))
* Indicates a statistic that is potentially unreliable because of small sample size or large coefficient of variation.# Indicates a percentage that is greater than 0 but less than 0.05 or a mean, SEM, or percentile that is greater than 0 but less than 0.5.--- Indicates a percentile that could not be estimated.Note: See "Table notes."Source: USDA's Continuing Survey of Food Intakes by Individuals, 1994-96, 2 days.

23
Table 1.015. Ready-to-Eat Cereal: Percentage of persons using food in 2 days and quantities consumed per eating occasion.
)))))))))))))))))))))))))))))))))))))))))))))))))))))))))))))))))))))))))))))))))))))))))))))))))))))))))))))))))))))))))))))))))))
* * Age (years) and sex* *)))))))))))))))))))))))))))))))))))))))))))))))))))))))))))))))))))))))))))))))))
* * 2-5 6-11 12-19 20-39 40-59 60 and older* *)))))) )))))) ))))))))))))))) ))))))))))))))) ))))))))))))))) )))))))))))))))
Statistic * All individuals * Males Males* age 2 and over * and and Males Females Males Females Males Females Males Females* *females females
)))))))))))))))))))))))))))))))))))))))))))))))))))))))))))))))))))))))))))))))))))))))))))))))))))))))))))))))))))))))))))))))))))
Number in sample 14,262 2,109 1,432 696 702 1,543 1,449 1,663 1,694 1,545 1,429
Percent of persons using ))))))))))))))))))))))))))))))))))))))))))))%)))))))))))))))))))))))))))))))))))))))))))))
at least once in 2 days 40.6 72.9 67.3 45.6 46.3 26.9 34.7 29.8 29.7 44.6 44.0 on 1 of 2 days 25.1 39.3 38.1 27.8 33.3 18.1 25.0 18.5 20.0 22.2 24.9 on both days 15.5 33.6 29.3 17.8 13.0 8.8 9.8 11.3 9.6 22.4 19.1
Quantity consumed per eating occasion ))))))))))))))))))))))))))))))))))))))))))))g)))))))))))))))))))))))))))))))))))))))))))))(1 cup corn flakes = 25 g)
Mean 54 33 47 72 52 77 55 68 51 53 41 SEM 1 1 1 3 2 3 1 2 1 1 1
5th percentile 18 12 19 27 22 27 25 25 19 19 14 10th percentile 24 14 24 32 26 30 27 29 22 24 19 25th percentile 30 22 30 45 33 46 34 42 29 30 25 50th percentile 46 30 41 62 47 65 49 58 47 47 36 75th percentile 67 40 57 90 61 93 70 85 62 69 51 90th percentile 93 56 75 123 81 133 86 112 89 90 73 95th percentile 113 67 92 145 107 157 111 135 104 107 85
)))))))))))))))))))))))))))))))))))))))))))))))))))))))))))))))))))))))))))))))))))))))))))))))))))))))))))))))))))))))))))))))))))
* Indicates a statistic that is potentially unreliable because of small sample size or large coefficient of variation.# Indicates a percentage that is greater than 0 but less than 0.05 or a mean, SEM, or percentile that is greater than 0 but less than 0.5.--- Indicates a percentile that could not be estimated.Note: See "Table notes."Source: USDA's Continuing Survey of Food Intakes by Individuals, 1994-96, 2 days.

24
Table 1.016. Corn Flakes: Percentage of persons using food in 2 days and quantities consumed per eating occasion.
)))))))))))))))))))))))))))))))))))))))))))))))))))))))))))))))))))))))))))))))))))))))))))))))))))))))))))))))))))))))))))))))))))
* * Age (years) and sex* *)))))))))))))))))))))))))))))))))))))))))))))))))))))))))))))))))))))))))))))))))
* * 2-5 6-11 12-19 20-39 40-59 60 and older* *)))))) )))))) ))))))))))))))) ))))))))))))))) ))))))))))))))) )))))))))))))))
Statistic * All individuals * Males Males* age 2 and over * and and Males Females Males Females Males Females Males Females* *females females
)))))))))))))))))))))))))))))))))))))))))))))))))))))))))))))))))))))))))))))))))))))))))))))))))))))))))))))))))))))))))))))))))))
Number in sample 14,262 2,109 1,432 696 702 1,543 1,449 1,663 1,694 1,545 1,429
Percent of persons using ))))))))))))))))))))))))))))))))))))))))))))%)))))))))))))))))))))))))))))))))))))))))))))
at least once in 2 days 8.1 11.2 13.1 10.4 8.7 6.5 5.3 5.9 5.2 12.4 10.4 on 1 of 2 days 6.6 9.6 11.7 8.3 7.4 5.4 4.9 4.4 4.2 8.5 7.3 on both days 1.5 1.6 1.5 2.1 1.3 * 1.1 0.3 * 1.5 1.0 3.9 3.1
Quantity consumed per eating occasion ))))))))))))))))))))))))))))))))))))))))))))g)))))))))))))))))))))))))))))))))))))))))))))(1 cup = 25 g)
Mean 46 33 42 62 49 73 43 49 40 37 30 SEM 1 2 2 4 4 6 2 3 3 2 1
5th percentile 17 12 * 17 * 21 * 18 * 16 * 20 * 24 * 18 * 13 * 10 * 10th percentile 22 12 22 26 * 22 * 22 * 23 * 24 * 21 * 19 17 25th percentile 25 21 25 49 32 37 33 31 24 24 23 50th percentile 37 27 37 55 41 61 37 39 30 31 25 75th percentile 56 37 53 74 61 83 52 55 47 50 37 90th percentile 75 51 64 104 * 73 * 133 * 70 * 87 * 70 * 61 42 95th percentile 100 62 * 80 * 111 * 81 * 142 * 74 * 99 * 84 * 72 * 54 *
)))))))))))))))))))))))))))))))))))))))))))))))))))))))))))))))))))))))))))))))))))))))))))))))))))))))))))))))))))))))))))))))))))
* Indicates a statistic that is potentially unreliable because of small sample size or large coefficient of variation.# Indicates a percentage that is greater than 0 but less than 0.05 or a mean, SEM, or percentile that is greater than 0 but less than 0.5.--- Indicates a percentile that could not be estimated.Note: See "Table notes."Source: USDA's Continuing Survey of Food Intakes by Individuals, 1994-96, 2 days.

25
Table 1.017. Toasted Oat Rings: Percentage of persons using food in 2 days and quantities consumed per eating occasion.
)))))))))))))))))))))))))))))))))))))))))))))))))))))))))))))))))))))))))))))))))))))))))))))))))))))))))))))))))))))))))))))))))))
* * Age (years) and sex* *)))))))))))))))))))))))))))))))))))))))))))))))))))))))))))))))))))))))))))))))))
* * 2-5 6-11 12-19 20-39 40-59 60 and older* *)))))) )))))) ))))))))))))))) ))))))))))))))) ))))))))))))))) )))))))))))))))
Statistic * All individuals * Males Males* age 2 and over * and and Males Females Males Females Males Females Males Females* *females females
)))))))))))))))))))))))))))))))))))))))))))))))))))))))))))))))))))))))))))))))))))))))))))))))))))))))))))))))))))))))))))))))))))
Number in sample 14,262 2,109 1,432 696 702 1,543 1,449 1,663 1,694 1,545 1,429
Percent of persons using ))))))))))))))))))))))))))))))))))))))))))))%)))))))))))))))))))))))))))))))))))))))))))))
at least once in 2 days 6.8 20.6 12.5 7.3 8.1 4.2 5.4 4.8 4.1 4.3 4.9 on 1 of 2 days 5.4 16.1 10.3 5.9 6.7 3.7 4.3 3.9 3.4 2.9 3.8 on both days 1.3 4.5 2.2 1.3 * 1.4 * 0.5 * 1.1 0.9 0.8 * 1.4 1.1
Quantity consumed per eating occasion ))))))))))))))))))))))))))))))))))))))))))))g)))))))))))))))))))))))))))))))))))))))))))))(1 cup = 30 g)
Mean 42 30 45 62 42 62 42 46 35 36 27 SEM 1 1 2 5 3 4 2 2 2 3 2
5th percentile 14 7 14 * 23 * 19 * 26 * 13 * 23 * 12 * 11 * 9 * 10th percentile 16 14 21 27 * 25 * 29 * 16 * 26 * 15 * 13 * 11 * 25th percentile 27 19 26 43 28 41 28 34 26 26 21 50th percentile 38 27 38 56 39 56 41 42 29 29 25 75th percentile 54 32 56 64 53 69 54 54 45 48 30 90th percentile 65 53 75 89 * 59 * 96 * 62 * 63 * 57 * 59 * 41 * 95th percentile 83 60 85 * 114 * 75 * 117 * 65 * 66 * 59 * 71 * 42 *
)))))))))))))))))))))))))))))))))))))))))))))))))))))))))))))))))))))))))))))))))))))))))))))))))))))))))))))))))))))))))))))))))))
* Indicates a statistic that is potentially unreliable because of small sample size or large coefficient of variation.# Indicates a percentage that is greater than 0 but less than 0.05 or a mean, SEM, or percentile that is greater than 0 but less than 0.5.--- Indicates a percentile that could not be estimated.Note: See "Table notes."Source: USDA's Continuing Survey of Food Intakes by Individuals, 1994-96, 2 days.

26
Table 1.018. Rice: Percentage of persons using food in 2 days and quantities consumed per eating occasion.
)))))))))))))))))))))))))))))))))))))))))))))))))))))))))))))))))))))))))))))))))))))))))))))))))))))))))))))))))))))))))))))))))))
* * Age (years) and sex* *)))))))))))))))))))))))))))))))))))))))))))))))))))))))))))))))))))))))))))))))))
* * 2-5 6-11 12-19 20-39 40-59 60 and older* *)))))) )))))) ))))))))))))))) ))))))))))))))) ))))))))))))))) )))))))))))))))
Statistic * All individuals * Males Males* age 2 and over * and and Males Females Males Females Males Females Males Females* *females females
)))))))))))))))))))))))))))))))))))))))))))))))))))))))))))))))))))))))))))))))))))))))))))))))))))))))))))))))))))))))))))))))))))
Number in sample 14,262 2,109 1,432 696 702 1,543 1,449 1,663 1,694 1,545 1,429
Percent of persons using ))))))))))))))))))))))))))))))))))))))))))))%)))))))))))))))))))))))))))))))))))))))))))))
at least once in 2 days 28.0 29.6 24.6 24.2 28.8 30.8 32.1 29.4 28.8 23.1 21.4 on 1 of 2 days 21.8 22.2 19.6 18.3 23.8 24.1 24.7 22.6 22.2 18.1 16.9 on both days 6.2 7.4 5.0 5.9 5.0 6.7 7.4 6.8 6.6 5.0 4.5
Quantity consumed per eating occasion ))))))))))))))))))))))))))))))))))))))))))))g)))))))))))))))))))))))))))))))))))))))))))))(1/2 cup regular rice = 79 g)
Mean 150 84 124 203 157 199 139 167 130 147 118 SEM 3 3 6 10 10 9 6 5 4 6 5
5th percentile 27 18 17 33 * 16 * 41 23 37 31 31 25 10th percentile 40 24 25 75 36 61 40 53 49 45 37 25th percentile 76 40 66 114 61 101 77 88 78 76 52 50th percentile 131 76 112 169 137 158 121 156 118 146 85 75th percentile 192 114 158 262 229 268 176 220 158 192 157 90th percentile 312 158 236 362 315 335 249 315 236 305 235 95th percentile 334 182 311 476 * 379 * 459 315 364 286 316 268
)))))))))))))))))))))))))))))))))))))))))))))))))))))))))))))))))))))))))))))))))))))))))))))))))))))))))))))))))))))))))))))))))))
* Indicates a statistic that is potentially unreliable because of small sample size or large coefficient of variation.# Indicates a percentage that is greater than 0 but less than 0.05 or a mean, SEM, or percentile that is greater than 0 but less than 0.5.--- Indicates a percentile that could not be estimated.Note: See "Table notes."Source: USDA's Continuing Survey of Food Intakes by Individuals, 1994-96, 2 days.
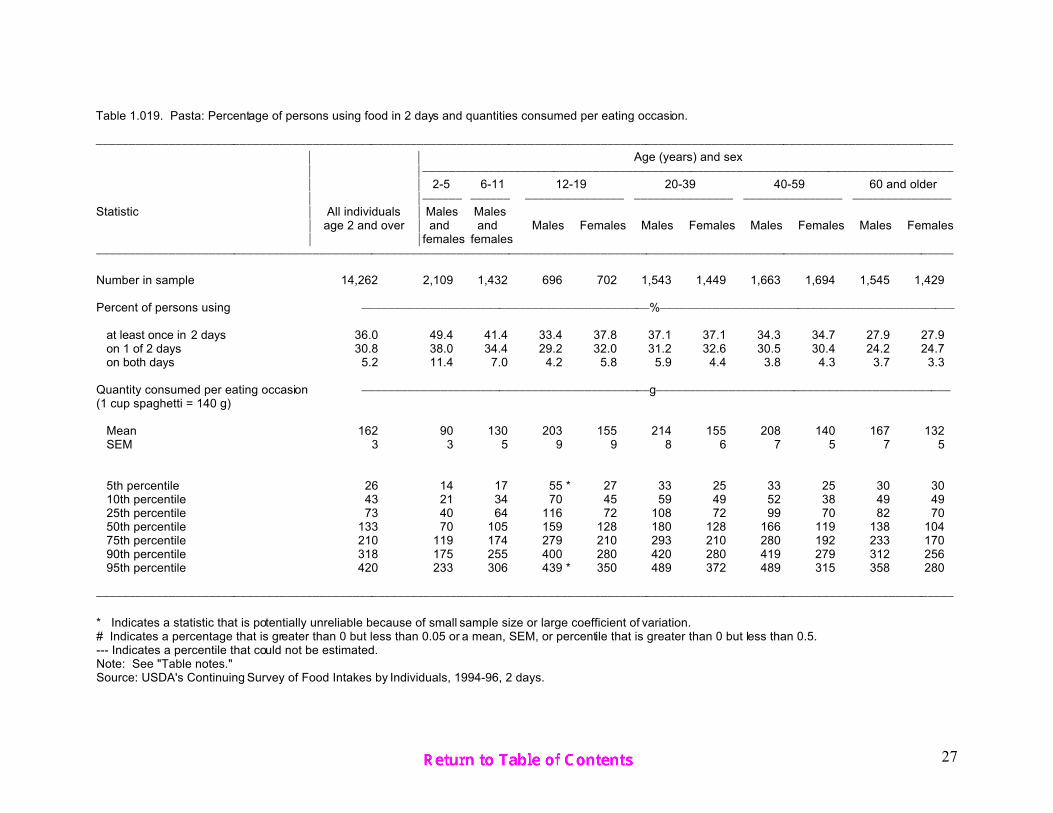
27
Table 1.019. Pasta: Percentage of persons using food in 2 days and quantities consumed per eating occasion.
)))))))))))))))))))))))))))))))))))))))))))))))))))))))))))))))))))))))))))))))))))))))))))))))))))))))))))))))))))))))))))))))))))
* * Age (years) and sex* *)))))))))))))))))))))))))))))))))))))))))))))))))))))))))))))))))))))))))))))))))
* * 2-5 6-11 12-19 20-39 40-59 60 and older* *)))))) )))))) ))))))))))))))) ))))))))))))))) ))))))))))))))) )))))))))))))))
Statistic * All individuals * Males Males* age 2 and over * and and Males Females Males Females Males Females Males Females* *females females
)))))))))))))))))))))))))))))))))))))))))))))))))))))))))))))))))))))))))))))))))))))))))))))))))))))))))))))))))))))))))))))))))))
Number in sample 14,262 2,109 1,432 696 702 1,543 1,449 1,663 1,694 1,545 1,429
Percent of persons using ))))))))))))))))))))))))))))))))))))))))))))%)))))))))))))))))))))))))))))))))))))))))))))
at least once in 2 days 36.0 49.4 41.4 33.4 37.8 37.1 37.1 34.3 34.7 27.9 27.9 on 1 of 2 days 30.8 38.0 34.4 29.2 32.0 31.2 32.6 30.5 30.4 24.2 24.7 on both days 5.2 11.4 7.0 4.2 5.8 5.9 4.4 3.8 4.3 3.7 3.3
Quantity consumed per eating occasion ))))))))))))))))))))))))))))))))))))))))))))g)))))))))))))))))))))))))))))))))))))))))))))(1 cup spaghetti = 140 g)
Mean 162 90 130 203 155 214 155 208 140 167 132 SEM 3 3 5 9 9 8 6 7 5 7 5
5th percentile 26 14 17 55 * 27 33 25 33 25 30 30 10th percentile 43 21 34 70 45 59 49 52 38 49 49 25th percentile 73 40 64 116 72 108 72 99 70 82 70 50th percentile 133 70 105 159 128 180 128 166 119 138 104 75th percentile 210 119 174 279 210 293 210 280 192 233 170 90th percentile 318 175 255 400 280 420 280 419 279 312 256 95th percentile 420 233 306 439 * 350 489 372 489 315 358 280
)))))))))))))))))))))))))))))))))))))))))))))))))))))))))))))))))))))))))))))))))))))))))))))))))))))))))))))))))))))))))))))))))))
* Indicates a statistic that is potentially unreliable because of small sample size or large coefficient of variation.# Indicates a percentage that is greater than 0 but less than 0.05 or a mean, SEM, or percentile that is greater than 0 but less than 0.5.--- Indicates a percentile that could not be estimated.Note: See "Table notes."Source: USDA's Continuing Survey of Food Intakes by Individuals, 1994-96, 2 days.

28
Table 1.020. Macaroni and Cheese: Percentage of persons using food in 2 days and quantities consumed per eating occasion.
)))))))))))))))))))))))))))))))))))))))))))))))))))))))))))))))))))))))))))))))))))))))))))))))))))))))))))))))))))))))))))))))))))
* * Age (years) and sex* *)))))))))))))))))))))))))))))))))))))))))))))))))))))))))))))))))))))))))))))))))
* * 2-5 6-11 12-19 20-39 40-59 60 and older* *)))))) )))))) ))))))))))))))) ))))))))))))))) ))))))))))))))) )))))))))))))))
Statistic * All individuals * Males Males* age 2 and over * and and Males Females Males Females Males Females Males Females* *females females
)))))))))))))))))))))))))))))))))))))))))))))))))))))))))))))))))))))))))))))))))))))))))))))))))))))))))))))))))))))))))))))))))))
Number in sample 14,262 2,109 1,432 696 702 1,543 1,449 1,663 1,694 1,545 1,429
Percent of persons using ))))))))))))))))))))))))))))))))))))))))))))%)))))))))))))))))))))))))))))))))))))))))))))
at least once in 2 days 8.5 17.8 13.2 7.5 10.7 7.8 7.8 6.1 6.0 7.1 6.5 on 1 of 2 days 8.0 16.3 12.8 7.2 10.2 7.3 7.4 5.7 5.6 6.8 6.3 on both days 0.5 1.5 0.3 * 0.3 * 0.5 * 0.5 * 0.4 * 0.4 * 0.4 * 0.3 * 0.2 *
Quantity consumed per eating occasion ))))))))))))))))))))))))))))))))))))))))))))g)))))))))))))))))))))))))))))))))))))))))))))(1 cup = 243 g)
Mean 244 159 217 408 260 301 235 302 210 230 215 SEM 9 8 13 46 30 19 19 31 12 13 18
5th percentile 53 30 48 * 110 * 28 * 78 * 61 * 82 * 25 * 53 * 72 * 10th percentile 81 47 61 183 * 68 * 112 * 85 * 98 * 55 * 76 * 93 * 25th percentile 121 80 109 191 * 153 186 122 182 115 121 121 50th percentile 191 120 186 339 201 268 189 218 188 231 191 75th percentile 324 190 281 482 * 312 377 297 374 243 272 239 90th percentile 477 286 379 915 * 476 * 485 * 448 * 557 * 373 * 364 * 363 * 95th percentile 556 427 481 * 949 * 643 * 579 * 483 * 629 * --- 437 * 436 *
)))))))))))))))))))))))))))))))))))))))))))))))))))))))))))))))))))))))))))))))))))))))))))))))))))))))))))))))))))))))))))))))))))
* Indicates a statistic that is potentially unreliable because of small sample size or large coefficient of variation.# Indicates a percentage that is greater than 0 but less than 0.05 or a mean, SEM, or percentile that is greater than 0 but less than 0.5.--- Indicates a percentile that could not be estimated.Note: See "Table notes."Source: USDA's Continuing Survey of Food Intakes by Individuals, 1994-96, 2 days.

29
Table 1.021. Spaghetti with Tomato Sauce: Percentage of persons using food in 2 days and quantities consumed per eating occasion.
)))))))))))))))))))))))))))))))))))))))))))))))))))))))))))))))))))))))))))))))))))))))))))))))))))))))))))))))))))))))))))))))))))
* * Age (years) and sex* *)))))))))))))))))))))))))))))))))))))))))))))))))))))))))))))))))))))))))))))))))
* * 2-5 6-11 12-19 20-39 40-59 60 and older* *)))))) )))))) ))))))))))))))) ))))))))))))))) ))))))))))))))) )))))))))))))))
Statistic * All individuals * Males Males* age 2 and over * and and Males Females Males Females Males Females Males Females* *females females
)))))))))))))))))))))))))))))))))))))))))))))))))))))))))))))))))))))))))))))))))))))))))))))))))))))))))))))))))))))))))))))))))))
Number in sample 14,262 2,109 1,432 696 702 1,543 1,449 1,663 1,694 1,545 1,429
Percent of persons using ))))))))))))))))))))))))))))))))))))))))))))%)))))))))))))))))))))))))))))))))))))))))))))
at least once in 2 days 8.0 16.8 11.5 10.1 8.5 8.6 7.8 5.5 5.4 5.0 4.5 on 1 of 2 days 7.6 15.4 11.1 10.0 7.8 8.4 7.6 5.1 5.2 4.9 4.3 on both days 0.3 1.4 0.4 * 0.1 * 0.6 * 0.2 * 0.2 * 0.4 * 0.2 * # 0.2 *
Quantity consumed per eating occasion ))))))))))))))))))))))))))))))))))))))))))))g)))))))))))))))))))))))))))))))))))))))))))))(1 cup with sauce = 248 g)
Mean 436 242 322 583 479 630 385 543 386 450 379 SEM 15 11 18 46 51 48 22 59 18 22 33
5th percentile 122 83 114 * --- 126 * 209 * 123 * 121 * 85 * 139 * 63 * 10th percentile 124 121 124 --- 191 * 245 * 131 * 229 * 115 * 183 * 156 * 25th percentile 246 124 230 386 237 354 231 340 246 257 209 50th percentile 371 244 248 480 414 485 367 489 361 374 298 75th percentile 494 249 419 668 504 745 490 614 478 491 490 90th percentile 740 399 488 975 * 762 * 1,023 * 561 * 773 * 625 * 742 * 676 * 95th percentile 983 491 503 * 989 * 1,053 * 1,357 * 722 * 1,223 * 725 * 884 * 751 *
)))))))))))))))))))))))))))))))))))))))))))))))))))))))))))))))))))))))))))))))))))))))))))))))))))))))))))))))))))))))))))))))))))
* Indicates a statistic that is potentially unreliable because of small sample size or large coefficient of variation.# Indicates a percentage that is greater than 0 but less than 0.05 or a mean, SEM, or percentile that is greater than 0 but less than 0.5.--- Indicates a percentile that could not be estimated.Note: See "Table notes."Source: USDA's Continuing Survey of Food Intakes by Individuals, 1994-96, 2 days.

30
Table 1.022. Pizza: Percentage of persons using food in 2 days and quantities consumed per eating occasion.
)))))))))))))))))))))))))))))))))))))))))))))))))))))))))))))))))))))))))))))))))))))))))))))))))))))))))))))))))))))))))))))))))))
* * Age (years) and sex* *)))))))))))))))))))))))))))))))))))))))))))))))))))))))))))))))))))))))))))))))))
* * 2-5 6-11 12-19 20-39 40-59 60 and older* *)))))) )))))) ))))))))))))))) ))))))))))))))) ))))))))))))))) )))))))))))))))
Statistic * All individuals * Males Males* age 2 and over * and and Males Females Males Females Males Females Males Females* *females females
)))))))))))))))))))))))))))))))))))))))))))))))))))))))))))))))))))))))))))))))))))))))))))))))))))))))))))))))))))))))))))))))))))
Number in sample 14,262 2,109 1,432 696 702 1,543 1,449 1,663 1,694 1,545 1,429
Percent of persons using ))))))))))))))))))))))))))))))))))))))))))))%)))))))))))))))))))))))))))))))))))))))))))))
at least once in 2 days 19.9 23.7 32.8 39.6 30.5 23.7 20.2 13.0 14.5 5.3 4.7 on 1 of 2 days 18.1 21.7 27.5 34.1 27.9 21.8 18.9 12.6 13.9 5.0 4.5 on both days 1.8 2.1 5.3 5.5 2.6 2.0 1.3 0.4 * 0.6 * 0.3 * 0.2 *
Quantity consumed per eating occasion ))))))))))))))))))))))))))))))))))))))))))))g)))))))))))))))))))))))))))))))))))))))))))))(1 slice, thin crust = 71 g)
Mean 169 86 108 205 143 253 150 220 147 187 109 SEM 5 3 6 13 8 12 6 13 8 18 8
5th percentile 36 20 32 52 34 * 50 43 69 * 42 * 45 * 30 * 10th percentile 52 27 44 70 42 71 54 85 52 62 * 31 * 25th percentile 78 46 63 85 65 150 85 124 76 90 51 50th percentile 140 76 85 155 121 211 139 189 126 144 84 75th percentile 214 106 139 254 177 344 189 276 189 228 158 90th percentile 338 158 195 411 281 488 277 395 280 377 * 189 * 95th percentile 422 209 252 531 335 * 577 315 504 * 316 * 395 * 212 *
)))))))))))))))))))))))))))))))))))))))))))))))))))))))))))))))))))))))))))))))))))))))))))))))))))))))))))))))))))))))))))))))))))
* Indicates a statistic that is potentially unreliable because of small sample size or large coefficient of variation.# Indicates a percentage that is greater than 0 but less than 0.05 or a mean, SEM, or percentile that is greater than 0 but less than 0.5.--- Indicates a percentile that could not be estimated.Note: See "Table notes."Source: USDA's Continuing Survey of Food Intakes by Individuals, 1994-96, 2 days.

31
Table 1.023. Raw Cucumbers: Percentage of persons using food in 2 days and quantities consumed per eating occasion.
)))))))))))))))))))))))))))))))))))))))))))))))))))))))))))))))))))))))))))))))))))))))))))))))))))))))))))))))))))))))))))))))))))
* * Age (years) and sex* *)))))))))))))))))))))))))))))))))))))))))))))))))))))))))))))))))))))))))))))))))
* * 2-5 6-11 12-19 20-39 40-59 60 and older* *)))))) )))))) ))))))))))))))) ))))))))))))))) ))))))))))))))) )))))))))))))))
Statistic * All individuals * Males Males* age 2 and over * and and Males Females Males Females Males Females Males Females* *females females
)))))))))))))))))))))))))))))))))))))))))))))))))))))))))))))))))))))))))))))))))))))))))))))))))))))))))))))))))))))))))))))))))))
Number in sample 14,262 2,109 1,432 696 702 1,543 1,449 1,663 1,694 1,545 1,429
Percent of persons using ))))))))))))))))))))))))))))))))))))))))))))%)))))))))))))))))))))))))))))))))))))))))))))
at least once in 2 days 10.8 6.4 6.6 6.1 6.8 10.5 10.4 12.5 15.7 14.2 13.2 on 1 of 2 days 9.5 6.0 5.8 5.3 6.0 9.8 9.4 11.2 13.9 10.7 11.0 on both days 1.3 0.4 * 0.8 * 0.9 * 0.8 * 0.8 * 1.0 1.3 1.8 3.5 2.1
Quantity consumed per eating occasion ))))))))))))))))))))))))))))))))))))))))))))g)))))))))))))))))))))))))))))))))))))))))))))(1/2 cup = 60 g)
Mean 48 32 39 71 * 48 62 45 47 41 51 45 SEM 3 4 6 22 * 11 12 5 4 3 4 3
5th percentile 7 3 * 6 * --- 7 * 7 * 12 * 9 * 12 * 11 * 7 * 10th percentile 14 5 * 7 * 13 * 7 * 13 14 14 14 14 12 25th percentile 16 7 11 15 * 14 * 20 20 21 15 19 15 50th percentile 29 15 21 34 27 29 29 29 28 29 29 75th percentile 54 29 41 84 * 41 * 65 46 55 41 59 57 90th percentile 100 76 * 97 * 206 * 108 * 200 77 98 92 118 99 95th percentile 157 131 * 126 * --- 170 * 201 * 124 * 137 * 120 * 150 * 128 *
)))))))))))))))))))))))))))))))))))))))))))))))))))))))))))))))))))))))))))))))))))))))))))))))))))))))))))))))))))))))))))))))))))
* Indicates a statistic that is potentially unreliable because of small sample size or large coefficient of variation.# Indicates a percentage that is greater than 0 but less than 0.05 or a mean, SEM, or percentile that is greater than 0 but less than 0.5.--- Indicates a percentile that could not be estimated.Note: See "Table notes."Source: USDA's Continuing Survey of Food Intakes by Individuals, 1994-96, 2 days.

32
Table 1.024. Lettuce: Percentage of persons using food in 2 days and quantities consumed per eating occasion.
)))))))))))))))))))))))))))))))))))))))))))))))))))))))))))))))))))))))))))))))))))))))))))))))))))))))))))))))))))))))))))))))))))
* * Age (years) and sex* *)))))))))))))))))))))))))))))))))))))))))))))))))))))))))))))))))))))))))))))))))
* * 2-5 6-11 12-19 20-39 40-59 60 and older* *)))))) )))))) ))))))))))))))) ))))))))))))))) ))))))))))))))) )))))))))))))))
Statistic * All individuals * Males Males* age 2 and over * and and Males Females Males Females Males Females Males Females* *females females
)))))))))))))))))))))))))))))))))))))))))))))))))))))))))))))))))))))))))))))))))))))))))))))))))))))))))))))))))))))))))))))))))))
Number in sample 14,262 2,109 1,432 696 702 1,543 1,449 1,663 1,694 1,545 1,429
Percent of persons using ))))))))))))))))))))))))))))))))))))))))))))%)))))))))))))))))))))))))))))))))))))))))))))
at least once in 2 days 53.3 34.0 40.8 56.0 52.3 63.4 57.6 55.5 59.1 48.1 46.1 on 1 of 2 days 37.7 29.8 32.9 43.1 37.4 40.8 42.8 37.3 40.9 32.0 31.5 on both days 15.5 4.2 7.9 12.9 15.0 22.5 14.9 18.2 18.2 16.1 14.6
Quantity consumed per eating occasion ))))))))))))))))))))))))))))))))))))))))))))g)))))))))))))))))))))))))))))))))))))))))))))(1 cup = 55 g)
Mean 41 17 26 32 34 40 44 48 48 47 42 SEM 1 1 1 3 2 2 2 2 1 2 2
5th percentile 7 2 6 8 6 8 7 8 7 7 6 10th percentile 8 4 7 8 8 8 8 8 8 8 8 25th percentile 13 7 9 12 10 14 12 14 16 16 15 50th percentile 27 10 17 18 17 24 27 31 41 41 34 75th percentile 55 21 34 43 49 54 55 60 66 55 55 90th percentile 91 41 55 74 81 98 107 108 105 96 82 95th percentile 110 54 73 104 106 110 138 127 109 110 109
)))))))))))))))))))))))))))))))))))))))))))))))))))))))))))))))))))))))))))))))))))))))))))))))))))))))))))))))))))))))))))))))))))
* Indicates a statistic that is potentially unreliable because of small sample size or large coefficient of variation.# Indicates a percentage that is greater than 0 but less than 0.05 or a mean, SEM, or percentile that is greater than 0 but less than 0.5.--- Indicates a percentile that could not be estimated.Note: See "Table notes."Source: USDA's Continuing Survey of Food Intakes by Individuals, 1994-96, 2 days.

33
Table 1.025. Mixed Lettuce-Based Salad: Percentage of persons using food in 2 days and quantities consumed per eating occasion.
)))))))))))))))))))))))))))))))))))))))))))))))))))))))))))))))))))))))))))))))))))))))))))))))))))))))))))))))))))))))))))))))))))
* * Age (years) and sex* *)))))))))))))))))))))))))))))))))))))))))))))))))))))))))))))))))))))))))))))))))
* * 2-5 6-11 12-19 20-39 40-59 60 and older* *)))))) )))))) ))))))))))))))) ))))))))))))))) ))))))))))))))) )))))))))))))))
Statistic * All individuals * Males Males* age 2 and over * and and Males Females Males Females Males Females Males Females* *females females
)))))))))))))))))))))))))))))))))))))))))))))))))))))))))))))))))))))))))))))))))))))))))))))))))))))))))))))))))))))))))))))))))))
Number in sample 14,262 2,109 1,432 696 702 1,543 1,449 1,663 1,694 1,545 1,429
Percent of persons using ))))))))))))))))))))))))))))))))))))))))))))%)))))))))))))))))))))))))))))))))))))))))))))
at least once in 2 days 2.2 2.6 3.2 1.3 * 1.9 1.5 1.7 2.9 2.9 2.0 2.4 on 1 of 2 days 2.2 2.6 3.2 1.3 * 1.9 1.4 1.7 2.8 2.7 1.8 2.4 on both days 0.1 * 0.0 * 0.0 * 0.0 * 0.1 * 0.1 * 0.0 * 0.1 * 0.2 * 0.2 * 0.0 *
Quantity consumed per eating occasion ))))))))))))))))))))))))))))))))))))))))))))g)))))))))))))))))))))))))))))))))))))))))))))(1 cup = 73 g)
Mean 97 31 71 * 67 * 94 * 126 * 123 * 115 * 103 110 * 83 * SEM 6 4 12 * 13 * 20 * 16 * 11 * 13 * 10 16 * 12 *
5th percentile 11 4 * 13 * --- 2 * --- 26 * 12 * 11 * 14 * --- 10th percentile 18 4 * 18 * --- 6 * 68 * 39 * 50 * 20 * 21 * 17 * 25th percentile 55 8 * 31 * 13 * 27 * 71 * 69 * 67 * 58 * 43 * 28 * 50th percentile 74 28 57 73 67 100 109 101 86 96 71 75th percentile 123 35 * 75 * 86 * 147 * 151 * 146 * 142 * 138 * 113 * 100 * 90th percentile 167 62 * 148 * 103 * 153 * 166 * 222 * 214 * 197 * 200 * 147 * 95th percentile 229 68 * 172 * 108 * --- 197 * 266 * 249 * 233 * 300 * 167 *
)))))))))))))))))))))))))))))))))))))))))))))))))))))))))))))))))))))))))))))))))))))))))))))))))))))))))))))))))))))))))))))))))))
* Indicates a statistic that is potentially unreliable because of small sample size or large coefficient of variation.# Indicates a percentage that is greater than 0 but less than 0.05 or a mean, SEM, or percentile that is greater than 0 but less than 0.5.--- Indicates a percentile that could not be estimated.Note: See "Table notes."Source: USDA's Continuing Survey of Food Intakes by Individuals, 1994-96, 2 days.

34
Table 1.026. Cooked Broccoli: Percentage of persons using food in 2 days and quantities consumed per eating occasion.
)))))))))))))))))))))))))))))))))))))))))))))))))))))))))))))))))))))))))))))))))))))))))))))))))))))))))))))))))))))))))))))))))))
* * Age (years) and sex* *)))))))))))))))))))))))))))))))))))))))))))))))))))))))))))))))))))))))))))))))))
* * 2-5 6-11 12-19 20-39 40-59 60 and older* *)))))) )))))) ))))))))))))))) ))))))))))))))) ))))))))))))))) )))))))))))))))
Statistic * All individuals * Males Males* age 2 and over * and and Males Females Males Females Males Females Males Females* *females females
)))))))))))))))))))))))))))))))))))))))))))))))))))))))))))))))))))))))))))))))))))))))))))))))))))))))))))))))))))))))))))))))))))
Number in sample 14,262 2,109 1,432 696 702 1,543 1,449 1,663 1,694 1,545 1,429
Percent of persons using ))))))))))))))))))))))))))))))))))))))))))))%)))))))))))))))))))))))))))))))))))))))))))))
at least once in 2 days 7.3 7.2 5.6 3.9 5.7 7.6 6.7 7.8 7.6 8.5 10.9 on 1 of 2 days 6.8 6.7 5.5 3.8 5.6 7.1 6.2 7.4 7.1 7.7 10.2 on both days 0.5 0.5 * 0.1 * 0.2 * 0.1 * 0.6 * 0.5 * 0.3 * 0.6 * 0.8 * 0.7 *
Quantity consumed per eating occasion ))))))))))))))))))))))))))))))))))))))))))))g)))))))))))))))))))))))))))))))))))))))))))))(1/2 cup = 92 g)
Mean 119 61 102 127 * 109 * 152 129 127 114 117 107 SEM 4 3 16 17 * 14 * 13 13 7 7 7 6
5th percentile 23 10 * 13 * --- 18 * 33 * 26 * 30 * 22 * 24 * 21 * 10th percentile 35 19 23 * 48 * 18 * 46 * 37 * 37 * 34 * 33 38 25th percentile 61 37 39 64 * 44 * 78 75 61 49 52 74 50th percentile 92 46 73 120 78 139 104 94 92 92 89 75th percentile 156 78 109 172 * 161 * 225 156 183 156 157 156 90th percentile 232 117 184 * 184 * 184 * 234 * 216 * 232 * 184 * 233 183 95th percentile 275 155 * 341 * 222 * 283 * 302 * 242 * 259 * 234 * 241 * 227 *
)))))))))))))))))))))))))))))))))))))))))))))))))))))))))))))))))))))))))))))))))))))))))))))))))))))))))))))))))))))))))))))))))))
* Indicates a statistic that is potentially unreliable because of small sample size or large coefficient of variation.# Indicates a percentage that is greater than 0 but less than 0.05 or a mean, SEM, or percentile that is greater than 0 but less than 0.5.--- Indicates a percentile that could not be estimated.Note: See "Table notes."Source: USDA's Continuing Survey of Food Intakes by Individuals, 1994-96, 2 days.

35
Table 1.027. Cooked Carrots: Percentage of persons using food in 2 days and quantities consumed per eating occasion.
)))))))))))))))))))))))))))))))))))))))))))))))))))))))))))))))))))))))))))))))))))))))))))))))))))))))))))))))))))))))))))))))))))
* * Age (years) and sex* *)))))))))))))))))))))))))))))))))))))))))))))))))))))))))))))))))))))))))))))))))
* * 2-5 6-11 12-19 20-39 40-59 60 and older* *)))))) )))))) ))))))))))))))) ))))))))))))))) ))))))))))))))) )))))))))))))))
Statistic * All individuals * Males Males* age 2 and over * and and Males Females Males Females Males Females Males Females* *females females
)))))))))))))))))))))))))))))))))))))))))))))))))))))))))))))))))))))))))))))))))))))))))))))))))))))))))))))))))))))))))))))))))))
Number in sample 14,262 2,109 1,432 696 702 1,543 1,449 1,663 1,694 1,545 1,429
Percent of persons using ))))))))))))))))))))))))))))))))))))))))))))%)))))))))))))))))))))))))))))))))))))))))))))
at least once in 2 days 5.8 6.0 3.8 2.8 2.1 5.0 5.3 6.7 6.4 9.6 9.0 on 1 of 2 days 5.4 5.8 3.6 2.8 1.8 * 4.7 4.8 6.5 6.3 8.4 8.3 on both days 0.4 0.2 * 0.2 * 0.0 * 0.3 * 0.3 * 0.4 * 0.3 * 0.1 * 1.3 0.7 *
Quantity consumed per eating occasion ))))))))))))))))))))))))))))))))))))))))))))g)))))))))))))))))))))))))))))))))))))))))))))(1/2 cup = 73 g)
Mean 72 48 46 81 * 75 * 79 69 83 66 78 75 SEM 2 4 5 16 * 17 * 7 6 7 4 4 4
5th percentile 13 8 * 8 * --- 3 * 17 * 11 * 18 * 17 * 19 * 19 * 10th percentile 19 9 * 12 * --- 8 * 24 * 19 * 24 * 18 * 26 26 * 25th percentile 36 20 25 * 31 * 23 * 38 36 46 28 50 42 50th percentile 65 39 40 73 58 66 53 73 60 73 66 75th percentile 78 73 57 * 122 * 88 * 94 78 84 78 100 80 90th percentile 146 81 * 76 * 156 * 140 * 146 * 134 * 156 * 119 * 146 146 * 95th percentile 156 112 * 90 * --- --- 160 * 155 * 225 * 154 * 156 * 156 *
)))))))))))))))))))))))))))))))))))))))))))))))))))))))))))))))))))))))))))))))))))))))))))))))))))))))))))))))))))))))))))))))))))
* Indicates a statistic that is potentially unreliable because of small sample size or large coefficient of variation.# Indicates a percentage that is greater than 0 but less than 0.05 or a mean, SEM, or percentile that is greater than 0 but less than 0.5.--- Indicates a percentile that could not be estimated.Note: See "Table notes."Source: USDA's Continuing Survey of Food Intakes by Individuals, 1994-96, 2 days.

36
Table 1.028. Raw Carrots: Percentage of persons using food in 2 days and quantities consumed per eating occasion.
)))))))))))))))))))))))))))))))))))))))))))))))))))))))))))))))))))))))))))))))))))))))))))))))))))))))))))))))))))))))))))))))))))
* * Age (years) and sex* *)))))))))))))))))))))))))))))))))))))))))))))))))))))))))))))))))))))))))))))))))
* * 2-5 6-11 12-19 20-39 40-59 60 and older* *)))))) )))))) ))))))))))))))) ))))))))))))))) ))))))))))))))) )))))))))))))))
Statistic * All individuals * Males Males* age 2 and over * and and Males Females Males Females Males Females Males Females* *females females
)))))))))))))))))))))))))))))))))))))))))))))))))))))))))))))))))))))))))))))))))))))))))))))))))))))))))))))))))))))))))))))))))))
Number in sample 14,262 2,109 1,432 696 702 1,543 1,449 1,663 1,694 1,545 1,429
Percent of persons using ))))))))))))))))))))))))))))))))))))))))))))%)))))))))))))))))))))))))))))))))))))))))))))
at least once in 2 days 14.1 10.4 17.8 9.2 11.9 12.3 15.4 14.4 18.1 13.6 12.7 on 1 of 2 days 12.2 9.5 15.6 8.4 10.6 10.7 13.3 12.7 16.1 10.7 10.5 on both days 1.8 0.9 2.2 0.7 * 1.3 * 1.5 2.1 1.7 2.0 2.8 2.3
Quantity consumed per eating occasion ))))))))))))))))))))))))))))))))))))))))))))g)))))))))))))))))))))))))))))))))))))))))))))(1/2 cup = 64 g)
Mean 33 27 32 35 32 35 38 35 31 29 27 SEM 1 2 2 6 4 4 4 2 2 2 1
5th percentile 5 2 * 4 * 6 * 3 * 6 * 5 * 6 * 5 3 * 6 * 10th percentile 7 3 7 7 * 5 * 6 6 6 6 6 6 25th percentile 14 7 10 13 13 13 12 13 14 13 12 50th percentile 27 20 23 23 24 25 26 27 26 21 21 75th percentile 40 39 39 35 42 40 48 49 34 30 33 90th percentile 61 61 61 61 * 73 * 59 70 61 60 60 49 95th percentile 100 66 * 99 * 96 * 89 * 120 * 100 * 83 * 103 77 * 59 *
)))))))))))))))))))))))))))))))))))))))))))))))))))))))))))))))))))))))))))))))))))))))))))))))))))))))))))))))))))))))))))))))))))
* Indicates a statistic that is potentially unreliable because of small sample size or large coefficient of variation.# Indicates a percentage that is greater than 0 but less than 0.05 or a mean, SEM, or percentile that is greater than 0 but less than 0.5.--- Indicates a percentile that could not be estimated.Note: See "Table notes."Source: USDA's Continuing Survey of Food Intakes by Individuals, 1994-96, 2 days.
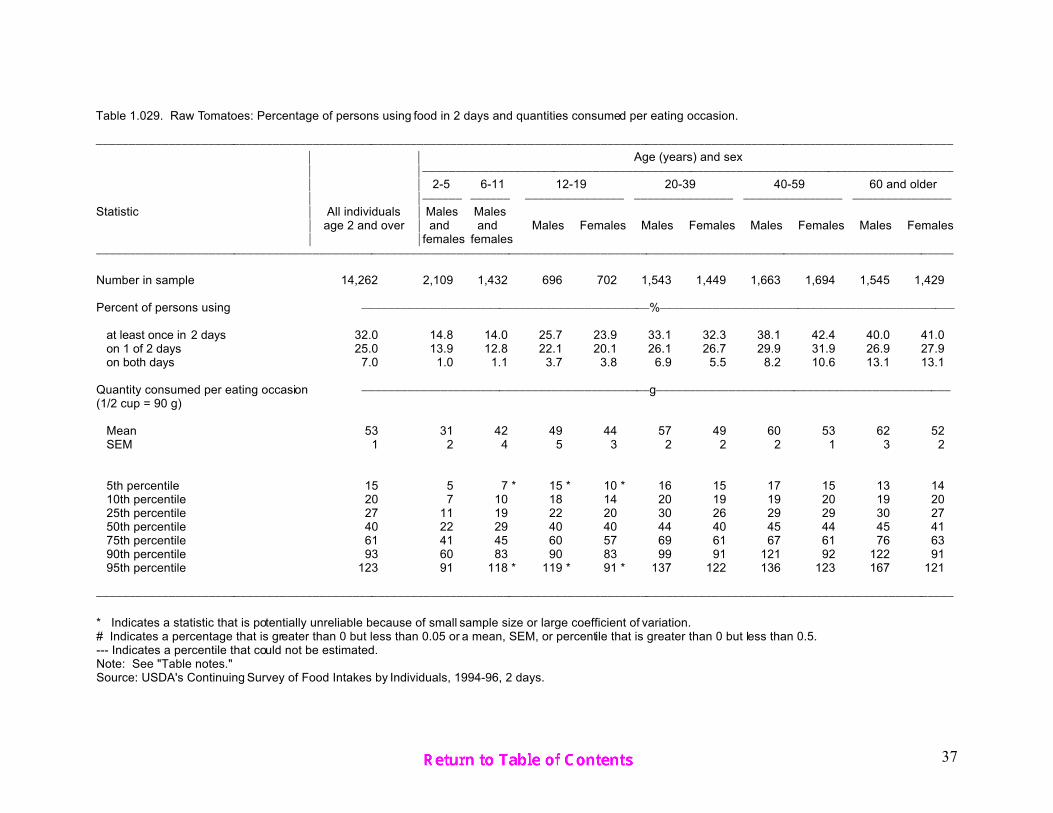
37
Table 1.029. Raw Tomatoes: Percentage of persons using food in 2 days and quantities consumed per eating occasion.
)))))))))))))))))))))))))))))))))))))))))))))))))))))))))))))))))))))))))))))))))))))))))))))))))))))))))))))))))))))))))))))))))))
* * Age (years) and sex* *)))))))))))))))))))))))))))))))))))))))))))))))))))))))))))))))))))))))))))))))))
* * 2-5 6-11 12-19 20-39 40-59 60 and older* *)))))) )))))) ))))))))))))))) ))))))))))))))) ))))))))))))))) )))))))))))))))
Statistic * All individuals * Males Males* age 2 and over * and and Males Females Males Females Males Females Males Females* *females females
)))))))))))))))))))))))))))))))))))))))))))))))))))))))))))))))))))))))))))))))))))))))))))))))))))))))))))))))))))))))))))))))))))
Number in sample 14,262 2,109 1,432 696 702 1,543 1,449 1,663 1,694 1,545 1,429
Percent of persons using ))))))))))))))))))))))))))))))))))))))))))))%)))))))))))))))))))))))))))))))))))))))))))))
at least once in 2 days 32.0 14.8 14.0 25.7 23.9 33.1 32.3 38.1 42.4 40.0 41.0 on 1 of 2 days 25.0 13.9 12.8 22.1 20.1 26.1 26.7 29.9 31.9 26.9 27.9 on both days 7.0 1.0 1.1 3.7 3.8 6.9 5.5 8.2 10.6 13.1 13.1
Quantity consumed per eating occasion ))))))))))))))))))))))))))))))))))))))))))))g)))))))))))))))))))))))))))))))))))))))))))))(1/2 cup = 90 g)
Mean 53 31 42 49 44 57 49 60 53 62 52 SEM 1 2 4 5 3 2 2 2 1 3 2
5th percentile 15 5 7 * 15 * 10 * 16 15 17 15 13 14 10th percentile 20 7 10 18 14 20 19 19 20 19 20 25th percentile 27 11 19 22 20 30 26 29 29 30 27 50th percentile 40 22 29 40 40 44 40 45 44 45 41 75th percentile 61 41 45 60 57 69 61 67 61 76 63 90th percentile 93 60 83 90 83 99 91 121 92 122 91 95th percentile 123 91 118 * 119 * 91 * 137 122 136 123 167 121
)))))))))))))))))))))))))))))))))))))))))))))))))))))))))))))))))))))))))))))))))))))))))))))))))))))))))))))))))))))))))))))))))))
* Indicates a statistic that is potentially unreliable because of small sample size or large coefficient of variation.# Indicates a percentage that is greater than 0 but less than 0.05 or a mean, SEM, or percentile that is greater than 0 but less than 0.5.--- Indicates a percentile that could not be estimated.Note: See "Table notes."Source: USDA's Continuing Survey of Food Intakes by Individuals, 1994-96, 2 days.
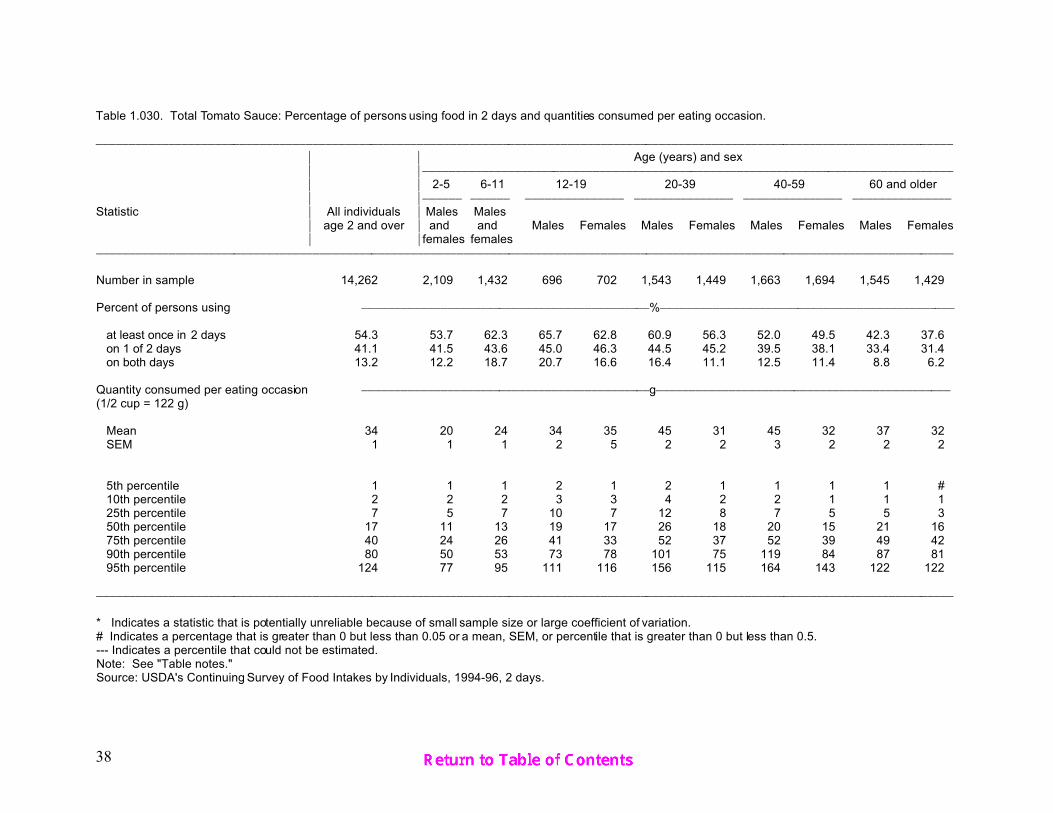
38
Table 1.030. Total Tomato Sauce: Percentage of persons using food in 2 days and quantities consumed per eating occasion.
)))))))))))))))))))))))))))))))))))))))))))))))))))))))))))))))))))))))))))))))))))))))))))))))))))))))))))))))))))))))))))))))))))
* * Age (years) and sex* *)))))))))))))))))))))))))))))))))))))))))))))))))))))))))))))))))))))))))))))))))
* * 2-5 6-11 12-19 20-39 40-59 60 and older* *)))))) )))))) ))))))))))))))) ))))))))))))))) ))))))))))))))) )))))))))))))))
Statistic * All individuals * Males Males* age 2 and over * and and Males Females Males Females Males Females Males Females* *females females
)))))))))))))))))))))))))))))))))))))))))))))))))))))))))))))))))))))))))))))))))))))))))))))))))))))))))))))))))))))))))))))))))))
Number in sample 14,262 2,109 1,432 696 702 1,543 1,449 1,663 1,694 1,545 1,429
Percent of persons using ))))))))))))))))))))))))))))))))))))))))))))%)))))))))))))))))))))))))))))))))))))))))))))
at least once in 2 days 54.3 53.7 62.3 65.7 62.8 60.9 56.3 52.0 49.5 42.3 37.6 on 1 of 2 days 41.1 41.5 43.6 45.0 46.3 44.5 45.2 39.5 38.1 33.4 31.4 on both days 13.2 12.2 18.7 20.7 16.6 16.4 11.1 12.5 11.4 8.8 6.2
Quantity consumed per eating occasion ))))))))))))))))))))))))))))))))))))))))))))g)))))))))))))))))))))))))))))))))))))))))))))(1/2 cup = 122 g)
Mean 34 20 24 34 35 45 31 45 32 37 32 SEM 1 1 1 2 5 2 2 3 2 2 2
5th percentile 1 1 1 2 1 2 1 1 1 1 # 10th percentile 2 2 2 3 3 4 2 2 1 1 1 25th percentile 7 5 7 10 7 12 8 7 5 5 3 50th percentile 17 11 13 19 17 26 18 20 15 21 16 75th percentile 40 24 26 41 33 52 37 52 39 49 42 90th percentile 80 50 53 73 78 101 75 119 84 87 81 95th percentile 124 77 95 111 116 156 115 164 143 122 122
)))))))))))))))))))))))))))))))))))))))))))))))))))))))))))))))))))))))))))))))))))))))))))))))))))))))))))))))))))))))))))))))))))
* Indicates a statistic that is potentially unreliable because of small sample size or large coefficient of variation.# Indicates a percentage that is greater than 0 but less than 0.05 or a mean, SEM, or percentile that is greater than 0 but less than 0.5.--- Indicates a percentile that could not be estimated.Note: See "Table notes."Source: USDA's Continuing Survey of Food Intakes by Individuals, 1994-96, 2 days.

39
Table 1.031. Cooked String Beans: Percentage of persons using food in 2 days and quantities consumed per eating occasion.
)))))))))))))))))))))))))))))))))))))))))))))))))))))))))))))))))))))))))))))))))))))))))))))))))))))))))))))))))))))))))))))))))))
* * Age (years) and sex* *)))))))))))))))))))))))))))))))))))))))))))))))))))))))))))))))))))))))))))))))))
* * 2-5 6-11 12-19 20-39 40-59 60 and older* *)))))) )))))) ))))))))))))))) ))))))))))))))) ))))))))))))))) )))))))))))))))
Statistic * All individuals * Males Males* age 2 and over * and and Males Females Males Females Males Females Males Females* *females females
)))))))))))))))))))))))))))))))))))))))))))))))))))))))))))))))))))))))))))))))))))))))))))))))))))))))))))))))))))))))))))))))))))
Number in sample 14,262 2,109 1,432 696 702 1,543 1,449 1,663 1,694 1,545 1,429
Percent of persons using ))))))))))))))))))))))))))))))))))))))))))))%)))))))))))))))))))))))))))))))))))))))))))))
at least once in 2 days 13.2 16.8 12.1 8.3 7.6 10.6 12.5 13.7 13.4 18.3 19.7 on 1 of 2 days 12.2 15.2 11.1 7.8 7.2 10.1 11.8 12.4 12.5 16.5 17.6 on both days 1.0 1.6 1.0 0.5 * 0.4 * 0.6 * 0.7 * 1.3 0.9 1.8 2.1
Quantity consumed per eating occasion ))))))))))))))))))))))))))))))))))))))))))))g)))))))))))))))))))))))))))))))))))))))))))))(1/2 cup = 68 g)
Mean 90 50 71 85 78 111 89 114 93 99 78 SEM 2 2 6 9 5 5 6 6 4 4 3
5th percentile 17 8 8 * 31 * 32 * 24 * 8 * 33 * 17 * 21 16 10th percentile 31 14 19 32 * 34 * 43 16 49 32 34 26 25th percentile 52 31 34 65 56 67 45 67 45 62 52 50th percentile 68 34 67 68 68 117 68 101 68 80 67 75th percentile 125 67 68 101 101 135 134 135 135 135 100 90th percentile 136 90 134 135 * 135 * 187 136 202 182 178 135 95th percentile 202 134 135 * 154 * 135 * 203 * 200 * 236 * 202 * 203 136
)))))))))))))))))))))))))))))))))))))))))))))))))))))))))))))))))))))))))))))))))))))))))))))))))))))))))))))))))))))))))))))))))))
* Indicates a statistic that is potentially unreliable because of small sample size or large coefficient of variation.# Indicates a percentage that is greater than 0 but less than 0.05 or a mean, SEM, or percentile that is greater than 0 but less than 0.5.--- Indicates a percentile that could not be estimated.Note: See "Table notes."Source: USDA's Continuing Survey of Food Intakes by Individuals, 1994-96, 2 days.

40
Table 1.032. Coleslaw: Percentage of persons using food in 2 days and quantities consumed per eating occasion.
)))))))))))))))))))))))))))))))))))))))))))))))))))))))))))))))))))))))))))))))))))))))))))))))))))))))))))))))))))))))))))))))))))
* * Age (years) and sex* *)))))))))))))))))))))))))))))))))))))))))))))))))))))))))))))))))))))))))))))))))
* * 2-5 6-11 12-19 20-39 40-59 60 and older* *)))))) )))))) ))))))))))))))) ))))))))))))))) ))))))))))))))) )))))))))))))))
Statistic * All individuals * Males Males* age 2 and over * and and Males Females Males Females Males Females Males Females* *females females
)))))))))))))))))))))))))))))))))))))))))))))))))))))))))))))))))))))))))))))))))))))))))))))))))))))))))))))))))))))))))))))))))))
Number in sample 14,262 2,109 1,432 696 702 1,543 1,449 1,663 1,694 1,545 1,429
Percent of persons using ))))))))))))))))))))))))))))))))))))))))))))%)))))))))))))))))))))))))))))))))))))))))))))
at least once in 2 days 5.0 2.1 1.8 2.6 2.3 3.8 3.7 7.2 7.4 9.8 8.2 on 1 of 2 days 4.8 2.1 1.8 2.6 2.2 3.7 3.5 6.8 7.1 9.0 7.6 on both days 0.2 0.0 * 0.0 * 0.0 * 0.1 * 0.1 * 0.1 * 0.5 * 0.3 * 0.7 * 0.5 *
Quantity consumed per eating occasion ))))))))))))))))))))))))))))))))))))))))))))g)))))))))))))))))))))))))))))))))))))))))))))(1/2 cup = 92 g)
Mean 102 55 * 80 * 94 * 69 * 116 88 135 101 100 88 SEM 3 9 * 10 * 14 * 14 * 11 7 7 9 5 5
5th percentile 18 2 * --- 19 * --- 19 * 12 * 35 * 16 * 14 * 14 * 10th percentile 32 4 * 11 * 27 * 5 * 39 * 23 * 43 * 33 * 35 21 25th percentile 55 14 * 34 * 43 * 22 * 61 48 80 45 58 43 50th percentile 91 41 64 63 64 90 68 115 76 86 90 75th percentile 134 72 * 86 * 84 * 82 * 144 86 172 129 92 92 90th percentile 179 86 * --- 150 * 101 * 173 * 136 * 183 * 178 * 166 149 95th percentile 183 90 * --- --- 131 * 183 * 172 * 242 * 183 * 180 * 170 *
)))))))))))))))))))))))))))))))))))))))))))))))))))))))))))))))))))))))))))))))))))))))))))))))))))))))))))))))))))))))))))))))))))
* Indicates a statistic that is potentially unreliable because of small sample size or large coefficient of variation.# Indicates a percentage that is greater than 0 but less than 0.05 or a mean, SEM, or percentile that is greater than 0 but less than 0.5.--- Indicates a percentile that could not be estimated.Note: See "Table notes."Source: USDA's Continuing Survey of Food Intakes by Individuals, 1994-96, 2 days.

41
Table 1.033. Cooked Peas: Percentage of persons using food in 2 days and quantities consumed per eating occasion.
)))))))))))))))))))))))))))))))))))))))))))))))))))))))))))))))))))))))))))))))))))))))))))))))))))))))))))))))))))))))))))))))))))
* * Age (years) and sex* *)))))))))))))))))))))))))))))))))))))))))))))))))))))))))))))))))))))))))))))))))
* * 2-5 6-11 12-19 20-39 40-59 60 and older* *)))))) )))))) ))))))))))))))) ))))))))))))))) ))))))))))))))) )))))))))))))))
Statistic * All individuals * Males Males* age 2 and over * and and Males Females Males Females Males Females Males Females* *females females
)))))))))))))))))))))))))))))))))))))))))))))))))))))))))))))))))))))))))))))))))))))))))))))))))))))))))))))))))))))))))))))))))))
Number in sample 14,262 2,109 1,432 696 702 1,543 1,449 1,663 1,694 1,545 1,429
Percent of persons using ))))))))))))))))))))))))))))))))))))))))))))%)))))))))))))))))))))))))))))))))))))))))))))
at least once in 2 days 6.1 8.4 6.8 3.6 2.4 4.4 4.9 7.4 6.3 8.4 9.4 on 1 of 2 days 5.8 7.6 6.5 3.6 2.2 4.0 4.6 7.2 6.0 8.0 8.6 on both days 0.3 0.8 0.3 * 0.0 * 0.1 * 0.4 * 0.2 * 0.2 * 0.3 * 0.4 * 0.8 *
Quantity consumed per eating occasion ))))))))))))))))))))))))))))))))))))))))))))g)))))))))))))))))))))))))))))))))))))))))))))(1/2 cup = 80 g)
Mean 86 48 72 115 * 93 * 109 82 113 79 88 73 SEM 3 3 9 15 * 17 * 10 9 7 7 7 5
5th percentile 11 7 * 13 * --- 10 * 20 * 10 * 20 * 6 * 20 * 10 * 10th percentile 21 10 20 * 34 * 13 * 21 * 15 * 24 * 20 * 21 19 25th percentile 40 21 40 72 * 61 * 52 40 50 40 53 40 50th percentile 80 42 54 86 80 85 78 116 80 80 80 75th percentile 120 59 85 160 * 85 * 160 116 160 85 85 85 90th percentile 167 85 131 * 170 * 140 * 215 * 167 * 170 * 159 * 160 124 95th percentile 170 85 * 158 * --- --- 252 * 170 * 223 * 166 * 170 * 159 *
)))))))))))))))))))))))))))))))))))))))))))))))))))))))))))))))))))))))))))))))))))))))))))))))))))))))))))))))))))))))))))))))))))
* Indicates a statistic that is potentially unreliable because of small sample size or large coefficient of variation.# Indicates a percentage that is greater than 0 but less than 0.05 or a mean, SEM, or percentile that is greater than 0 but less than 0.5.--- Indicates a percentile that could not be estimated.Note: See "Table notes."Source: USDA's Continuing Survey of Food Intakes by Individuals, 1994-96, 2 days.

42
Table 1.034. Cooked Corn: Percentage of persons using food in 2 days and quantities consumed per eating occasion.
)))))))))))))))))))))))))))))))))))))))))))))))))))))))))))))))))))))))))))))))))))))))))))))))))))))))))))))))))))))))))))))))))))
* * Age (years) and sex* *)))))))))))))))))))))))))))))))))))))))))))))))))))))))))))))))))))))))))))))))))
* * 2-5 6-11 12-19 20-39 40-59 60 and older* *)))))) )))))) ))))))))))))))) ))))))))))))))) ))))))))))))))) )))))))))))))))
Statistic * All individuals * Males Males* age 2 and over * and and Males Females Males Females Males Females Males Females* *females females
)))))))))))))))))))))))))))))))))))))))))))))))))))))))))))))))))))))))))))))))))))))))))))))))))))))))))))))))))))))))))))))))))))
Number in sample 14,262 2,109 1,432 696 702 1,543 1,449 1,663 1,694 1,545 1,429
Percent of persons using ))))))))))))))))))))))))))))))))))))))))))))%)))))))))))))))))))))))))))))))))))))))))))))
at least once in 2 days 15.1 18.9 22.2 12.8 12.3 12.7 15.3 17.1 13.5 14.2 13.0 on 1 of 2 days 13.8 17.2 20.0 11.6 11.8 11.8 13.7 15.3 13.2 12.8 11.7 on both days 1.3 1.7 2.3 1.2 * 0.4 * 1.0 1.6 1.9 0.3 * 1.4 1.3
Quantity consumed per eating occasion ))))))))))))))))))))))))))))))))))))))))))))g)))))))))))))))))))))))))))))))))))))))))))))(1/2 cup = 82 g)
Mean 101 68 79 125 100 122 98 133 90 109 83 SEM 2 3 4 9 6 5 5 6 3 4 5
5th percentile 20 10 10 39 * 37 * 25 * 20 * 41 20 * 31 * 16 * 10th percentile 33 15 21 53 * 41 * 41 35 53 23 41 21 25th percentile 55 41 41 82 67 82 55 82 51 62 41 50th percentile 82 55 78 106 82 100 82 113 82 86 82 75th percentile 123 82 85 163 123 164 123 164 112 143 100 90th percentile 171 123 163 205 * 164 * 215 164 204 164 174 163 95th percentile 228 164 164 294 * 227 * 256 * 209 * 288 181 * 236 * 199 *
)))))))))))))))))))))))))))))))))))))))))))))))))))))))))))))))))))))))))))))))))))))))))))))))))))))))))))))))))))))))))))))))))))
* Indicates a statistic that is potentially unreliable because of small sample size or large coefficient of variation.# Indicates a percentage that is greater than 0 but less than 0.05 or a mean, SEM, or percentile that is greater than 0 but less than 0.5.--- Indicates a percentile that could not be estimated.Note: See "Table notes."Source: USDA's Continuing Survey of Food Intakes by Individuals, 1994-96, 2 days.

43
Table 1.035. Raw Onions: Percentage of persons using food in 2 days and quantities consumed per eating occasion.
)))))))))))))))))))))))))))))))))))))))))))))))))))))))))))))))))))))))))))))))))))))))))))))))))))))))))))))))))))))))))))))))))))
* * Age (years) and sex* *)))))))))))))))))))))))))))))))))))))))))))))))))))))))))))))))))))))))))))))))))
* * 2-5 6-11 12-19 20-39 40-59 60 and older* *)))))) )))))) ))))))))))))))) ))))))))))))))) ))))))))))))))) )))))))))))))))
Statistic * All individuals * Males Males* age 2 and over * and and Males Females Males Females Males Females Males Females* *females females
)))))))))))))))))))))))))))))))))))))))))))))))))))))))))))))))))))))))))))))))))))))))))))))))))))))))))))))))))))))))))))))))))))
Number in sample 14,262 2,109 1,432 696 702 1,543 1,449 1,663 1,694 1,545 1,429
Percent of persons using ))))))))))))))))))))))))))))))))))))))))))))%)))))))))))))))))))))))))))))))))))))))))))))
at least once in 2 days 14.4 3.9 4.5 11.1 7.9 17.9 14.7 19.6 18.3 19.0 15.6 on 1 of 2 days 12.8 3.8 4.3 10.6 7.2 15.6 13.8 16.7 16.6 16.3 13.5 on both days 1.5 0.2 * 0.2 * 0.6 * 0.6 * 2.3 0.8 * 3.0 1.8 2.7 2.1
Quantity consumed per eating occasion ))))))))))))))))))))))))))))))))))))))))))))g)))))))))))))))))))))))))))))))))))))))))))))(1/2 cup = 80 g)
Mean 23 9 17 28 23 27 22 26 19 23 19 SEM 1 2 2 4 4 2 1 1 1 1 1
5th percentile 3 1 * --- 6 * 3 * 7 3 * 3 3 4 3 * 10th percentile 7 1 * 4 * 8 * 7 * 10 6 7 5 7 5 25th percentile 10 2 8 11 10 * 14 10 10 10 10 10 50th percentile 15 5 13 18 13 20 15 18 14 17 14 75th percentile 28 9 18 27 23 * 38 28 35 20 28 24 90th percentile 41 15 * 38 * 67 * 45 * 42 40 53 38 41 38 95th percentile 60 26 * 40 * 78 * 74 * 64 54 * 75 44 65 40 *
)))))))))))))))))))))))))))))))))))))))))))))))))))))))))))))))))))))))))))))))))))))))))))))))))))))))))))))))))))))))))))))))))))
* Indicates a statistic that is potentially unreliable because of small sample size or large coefficient of variation.# Indicates a percentage that is greater than 0 but less than 0.05 or a mean, SEM, or percentile that is greater than 0 but less than 0.5.--- Indicates a percentile that could not be estimated.Note: See "Table notes."Source: USDA's Continuing Survey of Food Intakes by Individuals, 1994-96, 2 days.

44
Table 1.036. French-Fried Potatoes: Percentage of persons using food in 2 days and quantities consumed per eating occasion.
)))))))))))))))))))))))))))))))))))))))))))))))))))))))))))))))))))))))))))))))))))))))))))))))))))))))))))))))))))))))))))))))))))
* * Age (years) and sex* *)))))))))))))))))))))))))))))))))))))))))))))))))))))))))))))))))))))))))))))))))
* * 2-5 6-11 12-19 20-39 40-59 60 and older* *)))))) )))))) ))))))))))))))) ))))))))))))))) ))))))))))))))) )))))))))))))))
Statistic * All individuals * Males Males* age 2 and over * and and Males Females Males Females Males Females Males Females* *females females
)))))))))))))))))))))))))))))))))))))))))))))))))))))))))))))))))))))))))))))))))))))))))))))))))))))))))))))))))))))))))))))))))))
Number in sample 14,262 2,109 1,432 696 702 1,543 1,449 1,663 1,694 1,545 1,429
Percent of persons using ))))))))))))))))))))))))))))))))))))))))))))%)))))))))))))))))))))))))))))))))))))))))))))
at least once in 2 days 25.5 32.7 33.7 41.7 38.1 35.3 23.9 20.6 16.8 11.2 8.1 on 1 of 2 days 22.0 28.3 29.3 32.2 32.7 29.6 21.5 18.4 15.4 9.9 7.7 on both days 3.4 4.4 4.3 9.5 5.4 5.7 2.4 2.2 1.4 1.3 0.5 *
Quantity consumed per eating occasion ))))))))))))))))))))))))))))))))))))))))))))g)))))))))))))))))))))))))))))))))))))))))))))(10 medium = 50 g)
Mean 83 52 67 97 81 107 79 89 72 76 58 SEM 1 1 2 3 4 2 3 2 3 3 3
5th percentile 28 18 21 42 28 54 28 34 25 28 * 25 * 10th percentile 35 25 28 53 40 56 35 56 30 34 26 * 25th percentile 57 34 42 60 57 78 55 57 48 55 36 50th percentile 70 50 67 99 69 106 68 85 69 69 55 75th percentile 112 68 85 122 99 123 100 114 100 99 70 90th percentile 125 70 113 125 122 146 123 123 120 113 99 * 95th percentile 140 85 124 170 131 171 125 125 124 124 * 100 *
)))))))))))))))))))))))))))))))))))))))))))))))))))))))))))))))))))))))))))))))))))))))))))))))))))))))))))))))))))))))))))))))))))
* Indicates a statistic that is potentially unreliable because of small sample size or large coefficient of variation.# Indicates a percentage that is greater than 0 but less than 0.05 or a mean, SEM, or percentile that is greater than 0 but less than 0.5.--- Indicates a percentile that could not be estimated.Note: See "Table notes."Source: USDA's Continuing Survey of Food Intakes by Individuals, 1994-96, 2 days.

45
Table 1.037. Home-Fried and Hash-Browned Potatoes: Percentage of persons using food in 2 days and quantities consumed per eating occasion.
)))))))))))))))))))))))))))))))))))))))))))))))))))))))))))))))))))))))))))))))))))))))))))))))))))))))))))))))))))))))))))))))))))
* * Age (years) and sex* *)))))))))))))))))))))))))))))))))))))))))))))))))))))))))))))))))))))))))))))))))
* * 2-5 6-11 12-19 20-39 40-59 60 and older* *)))))) )))))) ))))))))))))))) ))))))))))))))) ))))))))))))))) )))))))))))))))
Statistic * All individuals * Males Males* age 2 and over * and and Males Females Males Females Males Females Males Females* *females females
)))))))))))))))))))))))))))))))))))))))))))))))))))))))))))))))))))))))))))))))))))))))))))))))))))))))))))))))))))))))))))))))))))
Number in sample 14,262 2,109 1,432 696 702 1,543 1,449 1,663 1,694 1,545 1,429
Percent of persons using ))))))))))))))))))))))))))))))))))))))))))))%)))))))))))))))))))))))))))))))))))))))))))))
at least once in 2 days 8.9 9.3 10.1 10.1 6.1 9.5 8.8 11.2 6.4 10.4 7.1 on 1 of 2 days 8.3 8.6 9.5 9.5 5.7 8.6 8.4 10.4 5.7 9.5 6.9 on both days 0.6 0.7 0.6 * 0.7 * 0.4 * 0.9 0.4 * 0.8 0.7 * 0.9 0.2 *
Quantity consumed per eating occasion ))))))))))))))))))))))))))))))))))))))))))))g)))))))))))))))))))))))))))))))))))))))))))))(1/2 cup hash-browned = 78 g)
Mean 135 85 93 145 138 160 129 174 119 152 110 SEM 3 5 6 13 13 10 7 10 7 8 9
5th percentile 36 23 * 30 * 53 * 36 * 48 * 33 * 48 * 36 * 48 * 22 * 10th percentile 47 30 38 61 * 48 * 53 39 53 48 * 63 35 * 25th percentile 70 39 47 78 73 * 78 53 76 64 77 62 50th percentile 105 65 78 110 101 144 104 145 96 131 96 75th percentile 192 101 127 192 168 * 195 156 232 150 184 145 90th percentile 284 158 192 279 * 232 * 292 221 310 192 * 285 188 * 95th percentile 308 193 * 194 * 323 * 306 * 311 * 289 * 366 * 276 * 333 * 276 *
)))))))))))))))))))))))))))))))))))))))))))))))))))))))))))))))))))))))))))))))))))))))))))))))))))))))))))))))))))))))))))))))))))
* Indicates a statistic that is potentially unreliable because of small sample size or large coefficient of variation.# Indicates a percentage that is greater than 0 but less than 0.05 or a mean, SEM, or percentile that is greater than 0 but less than 0.5.--- Indicates a percentile that could not be estimated.Note: See "Table notes."Source: USDA's Continuing Survey of Food Intakes by Individuals, 1994-96, 2 days.

46
Table 1.038. Baked Potatoes: Percentage of persons using food in 2 days and quantities consumed per eating occasion.
)))))))))))))))))))))))))))))))))))))))))))))))))))))))))))))))))))))))))))))))))))))))))))))))))))))))))))))))))))))))))))))))))))
* * Age (years) and sex* *)))))))))))))))))))))))))))))))))))))))))))))))))))))))))))))))))))))))))))))))))
* * 2-5 6-11 12-19 20-39 40-59 60 and older* *)))))) )))))) ))))))))))))))) ))))))))))))))) ))))))))))))))) )))))))))))))))
Statistic * All individuals * Males Males* age 2 and over * and and Males Females Males Females Males Females Males Females* *females females
)))))))))))))))))))))))))))))))))))))))))))))))))))))))))))))))))))))))))))))))))))))))))))))))))))))))))))))))))))))))))))))))))))
Number in sample 14,262 2,109 1,432 696 702 1,543 1,449 1,663 1,694 1,545 1,429
Percent of persons using ))))))))))))))))))))))))))))))))))))))))))))%)))))))))))))))))))))))))))))))))))))))))))))
at least once in 2 days 12.4 7.6 8.2 8.6 8.8 11.4 11.1 13.0 16.5 17.9 18.1 on 1 of 2 days 11.5 7.5 7.8 8.4 8.5 10.4 10.1 12.3 15.8 16.1 16.0 on both days 0.9 0.1 * 0.4 * 0.1 * 0.3 * 1.0 1.1 0.7 * 0.7 * 1.8 2.1
Quantity consumed per eating occasion ))))))))))))))))))))))))))))))))))))))))))))g)))))))))))))))))))))))))))))))))))))))))))))(1 medium, peel eaten = 122 g)
Mean 120 70 95 152 115 154 126 133 112 115 100 SEM 2 4 6 15 10 7 5 3 3 3 4
5th percentile 48 15 * 23 * 52 * 19 * 81 * 50 * 51 * 49 49 36 * 10th percentile 61 23 43 * 68 * 39 * 95 65 84 62 73 48 25th percentile 92 40 63 95 * 74 97 95 96 92 96 74 50th percentile 106 62 93 122 100 142 113 118 97 98 97 75th percentile 143 93 109 184 * 148 184 148 155 122 124 119 90th percentile 184 114 158 * 215 * 184 * 236 203 193 171 180 142 95th percentile 217 147 * 171 * 369 * 194 * 284 * 219 * 223 * 184 188 178 *
)))))))))))))))))))))))))))))))))))))))))))))))))))))))))))))))))))))))))))))))))))))))))))))))))))))))))))))))))))))))))))))))))))
* Indicates a statistic that is potentially unreliable because of small sample size or large coefficient of variation.# Indicates a percentage that is greater than 0 but less than 0.05 or a mean, SEM, or percentile that is greater than 0 but less than 0.5.--- Indicates a percentile that could not be estimated.Note: See "Table notes."Source: USDA's Continuing Survey of Food Intakes by Individuals, 1994-96, 2 days.

47
Table 1.039. Boiled Potatoes: Percentage of persons using food in 2 days and quantities consumed per eating occasion.
)))))))))))))))))))))))))))))))))))))))))))))))))))))))))))))))))))))))))))))))))))))))))))))))))))))))))))))))))))))))))))))))))))
* * Age (years) and sex* *)))))))))))))))))))))))))))))))))))))))))))))))))))))))))))))))))))))))))))))))))
* * 2-5 6-11 12-19 20-39 40-59 60 and older* *)))))) )))))) ))))))))))))))) ))))))))))))))) ))))))))))))))) )))))))))))))))
Statistic * All individuals * Males Males* age 2 and over * and and Males Females Males Females Males Females Males Females* *females females
)))))))))))))))))))))))))))))))))))))))))))))))))))))))))))))))))))))))))))))))))))))))))))))))))))))))))))))))))))))))))))))))))))
Number in sample 14,262 2,109 1,432 696 702 1,543 1,449 1,663 1,694 1,545 1,429
Percent of persons using ))))))))))))))))))))))))))))))))))))))))))))%)))))))))))))))))))))))))))))))))))))))))))))
at least once in 2 days 5.3 4.8 2.7 2.0 3.2 3.9 2.9 6.3 7.0 11.0 10.2 on 1 of 2 days 5.0 4.6 2.7 1.7 * 3.0 3.7 2.8 6.1 6.7 9.8 9.3 on both days 0.3 0.1 * 0.1 * 0.3 * 0.2 * 0.3 * 0.1 * 0.2 * 0.3 * 1.3 0.9 *
Quantity consumed per eating occasion ))))))))))))))))))))))))))))))))))))))))))))g)))))))))))))))))))))))))))))))))))))))))))))(1/2 cup = 78 g)
Mean 157 81 103 * 250 * 144 * 185 162 209 142 166 131 SEM 5 9 17 * 40 * 16 * 16 15 12 9 6 5
5th percentile 34 10 * --- 77 * 39 * 37 * 19 * 57 * 39 * 39 * 45 * 10th percentile 52 12 * 19 * 78 * 44 * 51 * 25 * 86 * 61 * 60 60 25th percentile 91 39 46 * 121 * 93 * 113 52 * 141 92 92 78 50th percentile 123 77 93 216 123 156 127 184 122 125 122 75th percentile 197 108 141 * 310 * 171 * 264 236 * 250 183 215 156 90th percentile 308 156 * 184 * 420 * 217 * 359 * 308 * 368 * 251 * 311 214 95th percentile 368 184 * 227 * --- --- 368 * 360 * 416 * 303 * 368 * 266 *
)))))))))))))))))))))))))))))))))))))))))))))))))))))))))))))))))))))))))))))))))))))))))))))))))))))))))))))))))))))))))))))))))))
* Indicates a statistic that is potentially unreliable because of small sample size or large coefficient of variation.# Indicates a percentage that is greater than 0 but less than 0.05 or a mean, SEM, or percentile that is greater than 0 but less than 0.5.--- Indicates a percentile that could not be estimated.Note: See "Table notes."Source: USDA's Continuing Survey of Food Intakes by Individuals, 1994-96, 2 days.

48
Table 1.040. Mashed Potatoes: Percentage of persons using food in 2 days and quantities consumed per eating occasion.
)))))))))))))))))))))))))))))))))))))))))))))))))))))))))))))))))))))))))))))))))))))))))))))))))))))))))))))))))))))))))))))))))))
* * Age (years) and sex* *)))))))))))))))))))))))))))))))))))))))))))))))))))))))))))))))))))))))))))))))))
* * 2-5 6-11 12-19 20-39 40-59 60 and older* *)))))) )))))) ))))))))))))))) ))))))))))))))) ))))))))))))))) )))))))))))))))
Statistic * All individuals * Males Males* age 2 and over * and and Males Females Males Females Males Females Males Females* *females females
)))))))))))))))))))))))))))))))))))))))))))))))))))))))))))))))))))))))))))))))))))))))))))))))))))))))))))))))))))))))))))))))))))
Number in sample 14,262 2,109 1,432 696 702 1,543 1,449 1,663 1,694 1,545 1,429
Percent of persons using ))))))))))))))))))))))))))))))))))))))))))))%)))))))))))))))))))))))))))))))))))))))))))))
at least once in 2 days 15.0 14.8 13.3 14.6 11.9 14.7 13.5 16.0 14.3 19.7 18.1 on 1 of 2 days 13.9 13.8 12.8 13.6 11.5 13.8 12.9 14.6 13.4 17.4 16.0 on both days 1.0 1.0 0.5 * 0.9 * 0.4 * 0.9 0.5 * 1.3 0.8 2.3 2.1
Quantity consumed per eating occasion ))))))))))))))))))))))))))))))))))))))))))))g)))))))))))))))))))))))))))))))))))))))))))))(1/2 cup = 105 g)
Mean 188 118 162 245 170 269 167 225 156 173 140 SEM 3 6 12 16 17 12 5 11 7 6 5
5th percentile 46 19 18 * 51 * 38 * 63 * 42 * 69 39 39 23 10th percentile 61 26 44 91 * 62 * 104 68 100 51 70 54 25th percentile 105 51 90 103 83 139 101 113 99 100 104 50th percentile 156 101 104 194 117 204 154 186 120 153 105 75th percentile 207 144 202 293 182 373 202 272 196 203 194 90th percentile 397 201 299 405 * 283 * 411 216 407 249 307 208 95th percentile 413 257 354 * 582 * 437 * 484 * 313 * 419 313 370 246
)))))))))))))))))))))))))))))))))))))))))))))))))))))))))))))))))))))))))))))))))))))))))))))))))))))))))))))))))))))))))))))))))))
* Indicates a statistic that is potentially unreliable because of small sample size or large coefficient of variation.# Indicates a percentage that is greater than 0 but less than 0.05 or a mean, SEM, or percentile that is greater than 0 but less than 0.5.--- Indicates a percentile that could not be estimated.Note: See "Table notes."Source: USDA's Continuing Survey of Food Intakes by Individuals, 1994-96, 2 days.

49
Table 1.041. Cooked Dried Beans and Peas: Percentage of persons using food in 2 days and quantities consumed per eating occasion.
)))))))))))))))))))))))))))))))))))))))))))))))))))))))))))))))))))))))))))))))))))))))))))))))))))))))))))))))))))))))))))))))))))
* * Age (years) and sex* *)))))))))))))))))))))))))))))))))))))))))))))))))))))))))))))))))))))))))))))))))
* * 2-5 6-11 12-19 20-39 40-59 60 and older* *)))))) )))))) ))))))))))))))) ))))))))))))))) ))))))))))))))) )))))))))))))))
Statistic * All individuals * Males Males* age 2 and over * and and Males Females Males Females Males Females Males Females* *females females
)))))))))))))))))))))))))))))))))))))))))))))))))))))))))))))))))))))))))))))))))))))))))))))))))))))))))))))))))))))))))))))))))))
Number in sample 14,262 2,109 1,432 696 702 1,543 1,449 1,663 1,694 1,545 1,429
Percent of persons using ))))))))))))))))))))))))))))))))))))))))))))%)))))))))))))))))))))))))))))))))))))))))))))
at least once in 2 days 8.0 8.6 5.9 5.8 5.6 8.0 8.2 10.0 8.4 9.1 8.0 on 1 of 2 days 6.9 7.3 5.3 5.0 4.8 6.6 7.3 8.9 7.0 7.9 7.1 on both days 1.1 1.3 0.6 * 0.8 * 0.7 * 1.4 0.9 1.2 1.4 1.2 0.9 *
Quantity consumed per eating occasion ))))))))))))))))))))))))))))))))))))))))))))g)))))))))))))))))))))))))))))))))))))))))))))(1/2 cup kidney beans = 86 g)
Mean 133 71 95 144 164 * 173 119 156 109 162 117 SEM 3 4 11 15 22 * 14 11 7 5 16 6
5th percentile 22 12 * 3 * 17 * 26 * 23 * 23 * 40 * 21 * 22 * 11 * 10th percentile 33 22 22 * 42 * 34 * 42 32 * 44 30 46 33 * 25th percentile 64 33 44 65 * 65 * 81 44 81 64 66 65 50th percentile 101 53 86 117 139 131 88 130 86 130 108 75th percentile 173 86 112 194 * 222 * 205 157 183 165 195 162 90th percentile 259 164 171 * 255 * 279 * 345 214 * 320 176 289 193 * 95th percentile 345 189 * 176 * 368 * 322 * 439 * 334 * 376 * 242 * 356 * 250 *
)))))))))))))))))))))))))))))))))))))))))))))))))))))))))))))))))))))))))))))))))))))))))))))))))))))))))))))))))))))))))))))))))))
* Indicates a statistic that is potentially unreliable because of small sample size or large coefficient of variation.# Indicates a percentage that is greater than 0 but less than 0.05 or a mean, SEM, or percentile that is greater than 0 but less than 0.5.--- Indicates a percentile that could not be estimated.Note: See "Table notes."Source: USDA's Continuing Survey of Food Intakes by Individuals, 1994-96, 2 days.

50
Table 1.042. Baked Beans: Percentage of persons using food in 2 days and quantities consumed per eating occasion.
)))))))))))))))))))))))))))))))))))))))))))))))))))))))))))))))))))))))))))))))))))))))))))))))))))))))))))))))))))))))))))))))))))
* * Age (years) and sex* *)))))))))))))))))))))))))))))))))))))))))))))))))))))))))))))))))))))))))))))))))
* * 2-5 6-11 12-19 20-39 40-59 60 and older* *)))))) )))))) ))))))))))))))) ))))))))))))))) ))))))))))))))) )))))))))))))))
Statistic * All individuals * Males Males* age 2 and over * and and Males Females Males Females Males Females Males Females* *females females
)))))))))))))))))))))))))))))))))))))))))))))))))))))))))))))))))))))))))))))))))))))))))))))))))))))))))))))))))))))))))))))))))))
Number in sample 14,262 2,109 1,432 696 702 1,543 1,449 1,663 1,694 1,545 1,429
Percent of persons using ))))))))))))))))))))))))))))))))))))))))))))%)))))))))))))))))))))))))))))))))))))))))))))
at least once in 2 days 4.7 3.9 5.2 3.6 4.4 4.5 3.2 5.5 5.1 6.9 5.4 on 1 of 2 days 4.6 3.8 5.2 3.6 4.3 4.3 3.0 5.4 5.1 6.5 5.3 on both days 0.1 0.1 * 0.0 * 0.0 * 0.1 * 0.2 * 0.2 * 0.1 * 0.0 * 0.3 * 0.1 *
Quantity consumed per eating occasion ))))))))))))))))))))))))))))))))))))))))))))g)))))))))))))))))))))))))))))))))))))))))))))(1/2 cup = 126 g)
Mean 171 103 127 181 * 173 * 230 143 204 150 196 149 SEM 6 13 13 22 * 16 * 19 21 14 12 14 9
5th percentile 24 6 * 7 * 35 * 53 * 38 * --- 35 * 25 * 32 * 23 * 10th percentile 47 13 * 16 * 51 * 63 * 59 * 11 * 69 * 44 * 63 * 49 * 25th percentile 84 39 59 94 * 126 * 120 59 93 84 120 82 50th percentile 126 66 126 127 127 173 117 180 123 182 123 75th percentile 235 117 127 230 * 216 * 257 170 248 170 245 220 90th percentile 314 223 * 230 * 256 * 251 * 461 * 253 * 369 * 248 * 280 * 248 * 95th percentile 385 253 * 253 * --- 309 * 487 * 380 * 416 * 295 * 381 * 254 *
)))))))))))))))))))))))))))))))))))))))))))))))))))))))))))))))))))))))))))))))))))))))))))))))))))))))))))))))))))))))))))))))))))
* Indicates a statistic that is potentially unreliable because of small sample size or large coefficient of variation.# Indicates a percentage that is greater than 0 but less than 0.05 or a mean, SEM, or percentile that is greater than 0 but less than 0.5.--- Indicates a percentile that could not be estimated.Note: See "Table notes."Source: USDA's Continuing Survey of Food Intakes by Individuals, 1994-96, 2 days.

51
Table 1.043. Raw Oranges: Percentage of persons using food in 2 days and quantities consumed per eating occasion.
)))))))))))))))))))))))))))))))))))))))))))))))))))))))))))))))))))))))))))))))))))))))))))))))))))))))))))))))))))))))))))))))))))
* * Age (years) and sex* *)))))))))))))))))))))))))))))))))))))))))))))))))))))))))))))))))))))))))))))))))
* * 2-5 6-11 12-19 20-39 40-59 60 and older* *)))))) )))))) ))))))))))))))) ))))))))))))))) ))))))))))))))) )))))))))))))))
Statistic * All individuals * Males Males* age 2 and over * and and Males Females Males Females Males Females Males Females* *females females
)))))))))))))))))))))))))))))))))))))))))))))))))))))))))))))))))))))))))))))))))))))))))))))))))))))))))))))))))))))))))))))))))))
Number in sample 14,262 2,109 1,432 696 702 1,543 1,449 1,663 1,694 1,545 1,429
Percent of persons using ))))))))))))))))))))))))))))))))))))))))))))%)))))))))))))))))))))))))))))))))))))))))))))
at least once in 2 days 7.9 11.1 10.5 4.3 5.4 6.6 6.3 7.4 8.3 8.9 11.2 on 1 of 2 days 6.4 9.4 9.7 3.7 4.9 4.6 5.5 6.3 6.8 6.2 7.9 on both days 1.5 1.7 0.8 * 0.7 * 0.5 * 2.1 0.8 * 1.1 1.5 2.7 3.2
Quantity consumed per eating occasion ))))))))))))))))))))))))))))))))))))))))))))g)))))))))))))))))))))))))))))))))))))))))))))(1 medium = 131 g)
Mean 132 103 114 187 * 109 * 153 126 148 132 133 129 SEM 2 5 5 38 * 8 * 8 6 8 5 5 4
5th percentile 42 23 * 34 * 71 * 31 * 87 * 35 * 46 * 39 * 38 * 51 * 10th percentile 64 45 49 91 * 39 * 94 * 50 * 66 * 65 48 * 70 25th percentile 95 59 64 115 * 91 * 118 94 111 108 95 95 50th percentile 127 94 121 123 120 126 119 123 123 121 123 75th percentile 131 128 128 151 * 127 * 166 130 176 131 131 129 90th percentile 183 165 158 310 * 131 * 191 * 183 * 232 * 177 183 * 182 95th percentile 253 183 * 192 * --- 149 * 262 * 192 * 281 * 190 * 249 * 217 *
)))))))))))))))))))))))))))))))))))))))))))))))))))))))))))))))))))))))))))))))))))))))))))))))))))))))))))))))))))))))))))))))))))
* Indicates a statistic that is potentially unreliable because of small sample size or large coefficient of variation.# Indicates a percentage that is greater than 0 but less than 0.05 or a mean, SEM, or percentile that is greater than 0 but less than 0.5.--- Indicates a percentile that could not be estimated.Note: See "Table notes."Source: USDA's Continuing Survey of Food Intakes by Individuals, 1994-96, 2 days.

52
Table 1.044. Orange Juice: Percentage of persons using food in 2 days and quantities consumed per eating occasion.
)))))))))))))))))))))))))))))))))))))))))))))))))))))))))))))))))))))))))))))))))))))))))))))))))))))))))))))))))))))))))))))))))))
* * Age (years) and sex* *)))))))))))))))))))))))))))))))))))))))))))))))))))))))))))))))))))))))))))))))))
* * 2-5 6-11 12-19 20-39 40-59 60 and older* *)))))) )))))) ))))))))))))))) ))))))))))))))) ))))))))))))))) )))))))))))))))
Statistic * All individuals * Males Males* age 2 and over * and and Males Females Males Females Males Females Males Females* *females females
)))))))))))))))))))))))))))))))))))))))))))))))))))))))))))))))))))))))))))))))))))))))))))))))))))))))))))))))))))))))))))))))))))
Number in sample 14,262 2,109 1,432 696 702 1,543 1,449 1,663 1,694 1,545 1,429
Percent of persons using ))))))))))))))))))))))))))))))))))))))))))))%)))))))))))))))))))))))))))))))))))))))))))))
at least once in 2 days 27.2 34.4 30.9 30.8 29.5 24.3 23.2 24.1 25.2 30.2 31.7 on 1 of 2 days 17.3 24.7 20.5 21.5 21.5 16.9 17.0 14.5 15.1 13.1 14.5 on both days 9.9 9.7 10.5 9.3 8.0 7.3 6.1 9.6 10.1 17.1 17.2
Quantity consumed per eating occasion ))))))))))))))))))))))))))))))))))))))))))))g)))))))))))))))))))))))))))))))))))))))))))))(6 fluid ounces = 187 g)
Mean 268 190 224 354 305 373 289 285 231 213 196 SEM 4 4 6 16 11 20 12 10 6 5 5
5th percentile 124 93 124 124 * 124 * 181 124 124 124 124 124 10th percentile 124 124 124 187 124 187 156 143 124 124 124 25th percentile 187 124 156 248 218 249 187 187 166 147 124 50th percentile 249 186 209 298 249 311 249 249 223 187 187 75th percentile 311 249 249 430 373 407 311 311 249 249 249 90th percentile 447 249 332 622 498 552 497 436 312 311 258 95th percentile 498 333 373 713 * 498 * 739 499 498 436 373 311
)))))))))))))))))))))))))))))))))))))))))))))))))))))))))))))))))))))))))))))))))))))))))))))))))))))))))))))))))))))))))))))))))))
* Indicates a statistic that is potentially unreliable because of small sample size or large coefficient of variation.# Indicates a percentage that is greater than 0 but less than 0.05 or a mean, SEM, or percentile that is greater than 0 but less than 0.5.--- Indicates a percentile that could not be estimated.Note: See "Table notes."Source: USDA's Continuing Survey of Food Intakes by Individuals, 1994-96, 2 days.

53
Table 1.045. Raw Apples: Percentage of persons using food in 2 days and quantities consumed per eating occasion.
)))))))))))))))))))))))))))))))))))))))))))))))))))))))))))))))))))))))))))))))))))))))))))))))))))))))))))))))))))))))))))))))))))
* * Age (years) and sex* *)))))))))))))))))))))))))))))))))))))))))))))))))))))))))))))))))))))))))))))))))
* * 2-5 6-11 12-19 20-39 40-59 60 and older* *)))))) )))))) ))))))))))))))) ))))))))))))))) ))))))))))))))) )))))))))))))))
Statistic * All individuals * Males Males* age 2 and over * and and Males Females Males Females Males Females Males Females* *females females
)))))))))))))))))))))))))))))))))))))))))))))))))))))))))))))))))))))))))))))))))))))))))))))))))))))))))))))))))))))))))))))))))))
Number in sample 14,262 2,109 1,432 696 702 1,543 1,449 1,663 1,694 1,545 1,429
Percent of persons using ))))))))))))))))))))))))))))))))))))))))))))%)))))))))))))))))))))))))))))))))))))))))))))
at least once in 2 days 15.6 26.8 21.9 11.7 12.4 12.1 12.9 14.1 16.2 17.6 16.1 on 1 of 2 days 12.1 20.0 16.9 10.1 10.0 9.5 10.4 10.8 13.0 11.8 12.2 on both days 3.5 6.7 5.0 1.6 * 2.4 2.6 2.5 3.3 3.3 5.8 3.9
Quantity consumed per eating occasion ))))))))))))))))))))))))))))))))))))))))))))g)))))))))))))))))))))))))))))))))))))))))))))(1 medium = 138 g)
Mean 135 106 123 149 129 161 134 145 136 145 128 SEM 2 2 3 9 5 6 3 3 4 8 3
5th percentile 46 34 48 64 * 51 * 70 * 42 * 48 * 37 46 * 42 * 10th percentile 68 53 65 77 * 70 * 105 68 104 68 68 64 25th percentile 105 69 103 122 104 125 106 121 105 105 104 50th percentile 134 105 133 129 125 132 134 130 131 128 127 75th percentile 137 131 136 137 134 208 137 138 137 137 135 90th percentile 209 137 159 191 * 173 * 212 201 209 209 202 192 95th percentile 211 159 209 211 * 200 * 263 * 207 * 211 * 211 212 * 202 *
)))))))))))))))))))))))))))))))))))))))))))))))))))))))))))))))))))))))))))))))))))))))))))))))))))))))))))))))))))))))))))))))))))
* Indicates a statistic that is potentially unreliable because of small sample size or large coefficient of variation.# Indicates a percentage that is greater than 0 but less than 0.05 or a mean, SEM, or percentile that is greater than 0 but less than 0.5.--- Indicates a percentile that could not be estimated.Note: See "Table notes."Source: USDA's Continuing Survey of Food Intakes by Individuals, 1994-96, 2 days.

54
Table 1.046. Applesauce and Cooked Apples: Percentage of persons using food in 2 days and quantities consumed per eating occasion.
)))))))))))))))))))))))))))))))))))))))))))))))))))))))))))))))))))))))))))))))))))))))))))))))))))))))))))))))))))))))))))))))))))
* * Age (years) and sex* *)))))))))))))))))))))))))))))))))))))))))))))))))))))))))))))))))))))))))))))))))
* * 2-5 6-11 12-19 20-39 40-59 60 and older* *)))))) )))))) ))))))))))))))) ))))))))))))))) ))))))))))))))) )))))))))))))))
Statistic * All individuals * Males Males* age 2 and over * and and Males Females Males Females Males Females Males Females* *females females
)))))))))))))))))))))))))))))))))))))))))))))))))))))))))))))))))))))))))))))))))))))))))))))))))))))))))))))))))))))))))))))))))))
Number in sample 14,262 2,109 1,432 696 702 1,543 1,449 1,663 1,694 1,545 1,429
Percent of persons using ))))))))))))))))))))))))))))))))))))))))))))%)))))))))))))))))))))))))))))))))))))))))))))
at least once in 2 days 4.6 10.1 9.0 2.3 2.6 1.3 2.4 3.1 3.9 8.1 9.2 on 1 of 2 days 4.1 8.7 8.5 2.0 2.6 1.2 2.2 2.8 3.5 7.2 7.3 on both days 0.5 1.4 0.5 * 0.3 * 0.0 * 0.1 * 0.2 * 0.3 * 0.4 * 1.0 1.9
Quantity consumed per eating occasion ))))))))))))))))))))))))))))))))))))))))))))g)))))))))))))))))))))))))))))))))))))))))))))(1/2 cup = 128 g)
Mean 134 118 130 153 * 200 * 153 * 155 * 142 125 135 121 SEM 4 5 7 19 * 47 * 31 * 21 * 12 10 10 7
5th percentile 31 35 * 48 * --- --- --- 40 * 31 * 16 * 31 * 16 * 10th percentile 59 58 62 * --- 61 * --- 67 * 38 * 27 * 54 * 31 * 25th percentile 85 63 82 107 * 86 * 74 * 86 * 81 * 74 73 64 50th percentile 121 117 118 125 122 115 124 120 118 121 119 75th percentile 142 127 126 170 * 250 * 183 * 187 * 179 * 139 160 126 90th percentile 249 183 230 * --- --- 285 * 258 * 244 * 239 * 250 * 249 * 95th percentile 254 246 * 251 * --- --- --- 327 * 271 * 250 * 254 * 254 *
)))))))))))))))))))))))))))))))))))))))))))))))))))))))))))))))))))))))))))))))))))))))))))))))))))))))))))))))))))))))))))))))))))
* Indicates a statistic that is potentially unreliable because of small sample size or large coefficient of variation.# Indicates a percentage that is greater than 0 but less than 0.05 or a mean, SEM, or percentile that is greater than 0 but less than 0.5.--- Indicates a percentile that could not be estimated.Note: See "Table notes."Source: USDA's Continuing Survey of Food Intakes by Individuals, 1994-96, 2 days.

55
Table 1.047. Apple Juice: Percentage of persons using food in 2 days and quantities consumed per eating occasion.
)))))))))))))))))))))))))))))))))))))))))))))))))))))))))))))))))))))))))))))))))))))))))))))))))))))))))))))))))))))))))))))))))))
* * Age (years) and sex* *)))))))))))))))))))))))))))))))))))))))))))))))))))))))))))))))))))))))))))))))))
* * 2-5 6-11 12-19 20-39 40-59 60 and older* *)))))) )))))) ))))))))))))))) ))))))))))))))) ))))))))))))))) )))))))))))))))
Statistic * All individuals * Males Males* age 2 and over * and and Males Females Males Females Males Females Males Females* *females females
)))))))))))))))))))))))))))))))))))))))))))))))))))))))))))))))))))))))))))))))))))))))))))))))))))))))))))))))))))))))))))))))))))
Number in sample 14,262 2,109 1,432 696 702 1,543 1,449 1,663 1,694 1,545 1,429
Percent of persons using ))))))))))))))))))))))))))))))))))))))))))))%)))))))))))))))))))))))))))))))))))))))))))))
at least once in 2 days 7.0 26.3 12.2 7.8 8.5 4.2 4.7 4.7 3.2 4.8 5.0 on 1 of 2 days 5.4 16.9 10.1 7.1 6.7 3.1 3.9 4.0 2.9 3.5 4.0 on both days 1.6 9.5 2.0 0.7 * 1.8 1.1 0.8 * 0.7 * 0.3 * 1.3 1.1
Quantity consumed per eating occasion ))))))))))))))))))))))))))))))))))))))))))))g)))))))))))))))))))))))))))))))))))))))))))))(6 fluid ounces = 186 g)
Mean 271 207 223 346 360 345 302 358 259 233 225 SEM 7 5 10 22 44 20 19 33 21 11 13
5th percentile 117 103 110 * 77 * --- 162 * 105 * 107 * 47 * 95 * 81 * 10th percentile 120 118 114 144 * --- 217 * 162 * 173 * 83 * 106 * 92 * 25th percentile 182 124 130 210 * 190 234 235 220 155 167 131 50th percentile 242 184 185 292 257 293 246 297 214 233 214 75th percentile 307 242 246 478 * 425 357 349 449 294 248 240 90th percentile 481 294 319 493 * 535 * 532 * 456 * 569 * 398 * 344 * 300 * 95th percentile 525 370 447 * 591 * 659 * 617 * 514 * 672 * --- --- 364 *
)))))))))))))))))))))))))))))))))))))))))))))))))))))))))))))))))))))))))))))))))))))))))))))))))))))))))))))))))))))))))))))))))))
* Indicates a statistic that is potentially unreliable because of small sample size or large coefficient of variation.# Indicates a percentage that is greater than 0 but less than 0.05 or a mean, SEM, or percentile that is greater than 0 but less than 0.5.--- Indicates a percentile that could not be estimated.Note: See "Table notes."Source: USDA's Continuing Survey of Food Intakes by Individuals, 1994-96, 2 days.

56
Table 1.048. Raw Bananas: Percentage of persons using food in 2 days and quantities consumed per eating occasion.
)))))))))))))))))))))))))))))))))))))))))))))))))))))))))))))))))))))))))))))))))))))))))))))))))))))))))))))))))))))))))))))))))))
* * Age (years) and sex* *)))))))))))))))))))))))))))))))))))))))))))))))))))))))))))))))))))))))))))))))))
* * 2-5 6-11 12-19 20-39 40-59 60 and older* *)))))) )))))) ))))))))))))))) ))))))))))))))) ))))))))))))))) )))))))))))))))
Statistic * All individuals * Males Males* age 2 and over * and and Males Females Males Females Males Females Males Females* *females females
)))))))))))))))))))))))))))))))))))))))))))))))))))))))))))))))))))))))))))))))))))))))))))))))))))))))))))))))))))))))))))))))))))
Number in sample 14,262 2,109 1,432 696 702 1,543 1,449 1,663 1,694 1,545 1,429
Percent of persons using ))))))))))))))))))))))))))))))))))))))))))))%)))))))))))))))))))))))))))))))))))))))))))))
at least once in 2 days 20.8 25.0 16.5 10.3 8.4 14.4 18.5 21.9 24.4 36.5 34.0 on 1 of 2 days 15.2 20.1 14.4 8.4 7.8 10.6 14.6 15.2 18.4 20.3 22.1 on both days 5.7 4.9 2.1 2.0 0.6 * 3.9 3.9 6.7 6.0 16.2 11.9
Quantity consumed per eating occasion ))))))))))))))))))))))))))))))))))))))))))))g)))))))))))))))))))))))))))))))))))))))))))))(1 medium = 118 g)
Mean 111 95 105 122 119 126 112 125 111 105 96 SEM 1 2 3 6 5 2 2 3 2 2 2
5th percentile 55 39 30 * 54 * 53 * 88 * 51 * 52 55 55 48 10th percentile 58 55 53 92 * 66 * 99 62 99 58 57 56 25th percentile 100 59 90 110 104 113 99 113 101 86 59 50th percentile 117 101 112 114 110 116 115 116 116 117 107 75th percentile 118 115 116 122 117 126 117 125 118 118 116 90th percentile 135 118 130 134 * 130 * 136 131 135 133 127 118 95th percentile 136 130 134 * 180 * --- 211 * 134 * 223 135 134 131
)))))))))))))))))))))))))))))))))))))))))))))))))))))))))))))))))))))))))))))))))))))))))))))))))))))))))))))))))))))))))))))))))))
* Indicates a statistic that is potentially unreliable because of small sample size or large coefficient of variation.# Indicates a percentage that is greater than 0 but less than 0.05 or a mean, SEM, or percentile that is greater than 0 but less than 0.5.--- Indicates a percentile that could not be estimated.Note: See "Table notes."Source: USDA's Continuing Survey of Food Intakes by Individuals, 1994-96, 2 days.

57
Table 1.049. Fluid Milk: Percentage of persons using food in 2 days and quantities consumed per eating occasion.
)))))))))))))))))))))))))))))))))))))))))))))))))))))))))))))))))))))))))))))))))))))))))))))))))))))))))))))))))))))))))))))))))))
* * Age (years) and sex* *)))))))))))))))))))))))))))))))))))))))))))))))))))))))))))))))))))))))))))))))))
* * 2-5 6-11 12-19 20-39 40-59 60 and older* *)))))) )))))) ))))))))))))))) ))))))))))))))) ))))))))))))))) )))))))))))))))
Statistic * All individuals * Males Males* age 2 and over * and and Males Females Males Females Males Females Males Females* *females females
)))))))))))))))))))))))))))))))))))))))))))))))))))))))))))))))))))))))))))))))))))))))))))))))))))))))))))))))))))))))))))))))))))
Number in sample 14,262 2,109 1,432 696 702 1,543 1,449 1,663 1,694 1,545 1,429
Percent of persons using ))))))))))))))))))))))))))))))))))))))))))))%)))))))))))))))))))))))))))))))))))))))))))))
at least once in 2 days 67.8 92.5 89.2 72.3 64.4 58.0 61.3 60.5 60.2 73.9 71.6 on 1 of 2 days 25.4 17.1 24.5 27.2 32.5 29.5 27.4 24.5 23.9 21.5 22.3 on both days 42.3 75.4 64.7 45.1 31.8 28.4 33.9 36.0 36.3 52.5 49.3
Quantity consumed per eating occasion ))))))))))))))))))))))))))))))))))))))))))))g)))))))))))))))))))))))))))))))))))))))))))))(1 cup lowfat milk = 244 g)
Mean 226 196 241 337 262 291 209 238 169 189 154 SEM 3 3 4 8 8 9 6 6 5 5 4
5th percentile 30 90 121 122 103 18 14 21 15 29 15 10th percentile 61 119 122 181 116 53 42 55 30 46 30 25th percentile 122 142 181 240 179 161 120 122 81 106 82 50th percentile 220 182 242 301 237 244 208 240 163 181 133 75th percentile 274 242 264 405 304 366 259 306 241 244 220 90th percentile 367 285 361 487 421 490 361 425 286 307 245 95th percentile 483 330 403 606 490 606 446 481 367 392 296
)))))))))))))))))))))))))))))))))))))))))))))))))))))))))))))))))))))))))))))))))))))))))))))))))))))))))))))))))))))))))))))))))))
* Indicates a statistic that is potentially unreliable because of small sample size or large coefficient of variation.# Indicates a percentage that is greater than 0 but less than 0.05 or a mean, SEM, or percentile that is greater than 0 but less than 0.5.--- Indicates a percentile that could not be estimated.Note: See "Table notes."Source: USDA's Continuing Survey of Food Intakes by Individuals, 1994-96, 2 days.
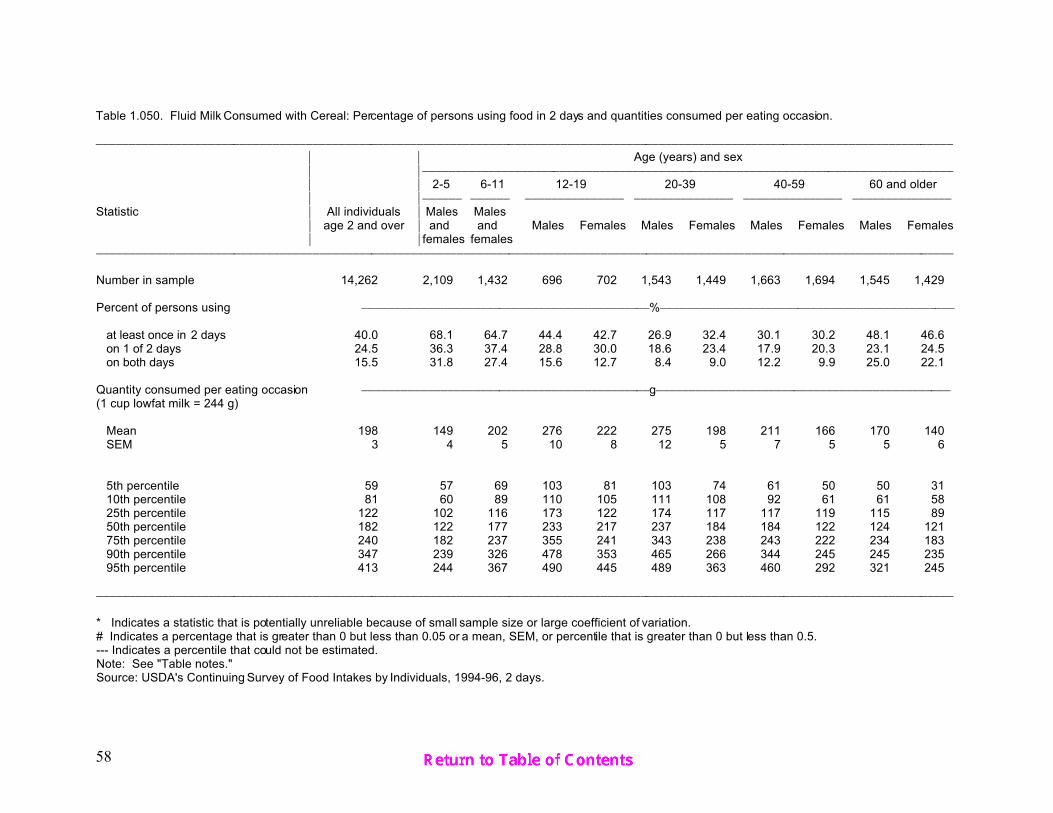
58
Table 1.050. Fluid Milk Consumed with Cereal: Percentage of persons using food in 2 days and quantities consumed per eating occasion.
)))))))))))))))))))))))))))))))))))))))))))))))))))))))))))))))))))))))))))))))))))))))))))))))))))))))))))))))))))))))))))))))))))
* * Age (years) and sex* *)))))))))))))))))))))))))))))))))))))))))))))))))))))))))))))))))))))))))))))))))
* * 2-5 6-11 12-19 20-39 40-59 60 and older* *)))))) )))))) ))))))))))))))) ))))))))))))))) ))))))))))))))) )))))))))))))))
Statistic * All individuals * Males Males* age 2 and over * and and Males Females Males Females Males Females Males Females* *females females
)))))))))))))))))))))))))))))))))))))))))))))))))))))))))))))))))))))))))))))))))))))))))))))))))))))))))))))))))))))))))))))))))))
Number in sample 14,262 2,109 1,432 696 702 1,543 1,449 1,663 1,694 1,545 1,429
Percent of persons using ))))))))))))))))))))))))))))))))))))))))))))%)))))))))))))))))))))))))))))))))))))))))))))
at least once in 2 days 40.0 68.1 64.7 44.4 42.7 26.9 32.4 30.1 30.2 48.1 46.6 on 1 of 2 days 24.5 36.3 37.4 28.8 30.0 18.6 23.4 17.9 20.3 23.1 24.5 on both days 15.5 31.8 27.4 15.6 12.7 8.4 9.0 12.2 9.9 25.0 22.1
Quantity consumed per eating occasion ))))))))))))))))))))))))))))))))))))))))))))g)))))))))))))))))))))))))))))))))))))))))))))(1 cup lowfat milk = 244 g)
Mean 198 149 202 276 222 275 198 211 166 170 140 SEM 3 4 5 10 8 12 5 7 5 5 6
5th percentile 59 57 69 103 81 103 74 61 50 50 31 10th percentile 81 60 89 110 105 111 108 92 61 61 58 25th percentile 122 102 116 173 122 174 117 117 119 115 89 50th percentile 182 122 177 233 217 237 184 184 122 124 121 75th percentile 240 182 237 355 241 343 238 243 222 234 183 90th percentile 347 239 326 478 353 465 266 344 245 245 235 95th percentile 413 244 367 490 445 489 363 460 292 321 245
)))))))))))))))))))))))))))))))))))))))))))))))))))))))))))))))))))))))))))))))))))))))))))))))))))))))))))))))))))))))))))))))))))
* Indicates a statistic that is potentially unreliable because of small sample size or large coefficient of variation.# Indicates a percentage that is greater than 0 but less than 0.05 or a mean, SEM, or percentile that is greater than 0 but less than 0.5.--- Indicates a percentile that could not be estimated.Note: See "Table notes."Source: USDA's Continuing Survey of Food Intakes by Individuals, 1994-96, 2 days.

59
Table 1.051. Whole Milk: Percentage of persons using food in 2 days and quantities consumed per eating occasion.
)))))))))))))))))))))))))))))))))))))))))))))))))))))))))))))))))))))))))))))))))))))))))))))))))))))))))))))))))))))))))))))))))))
* * Age (years) and sex* *)))))))))))))))))))))))))))))))))))))))))))))))))))))))))))))))))))))))))))))))))
* * 2-5 6-11 12-19 20-39 40-59 60 and older* *)))))) )))))) ))))))))))))))) ))))))))))))))) ))))))))))))))) )))))))))))))))
Statistic * All individuals * Males Males* age 2 and over * and and Males Females Males Females Males Females Males Females* *females females
)))))))))))))))))))))))))))))))))))))))))))))))))))))))))))))))))))))))))))))))))))))))))))))))))))))))))))))))))))))))))))))))))))
Number in sample 14,262 2,109 1,432 696 702 1,543 1,449 1,663 1,694 1,545 1,429
Percent of persons using ))))))))))))))))))))))))))))))))))))))))))))%)))))))))))))))))))))))))))))))))))))))))))))
at least once in 2 days 25.4 50.0 39.5 30.0 22.4 22.9 22.4 20.3 19.0 22.3 19.7 on 1 of 2 days 13.5 17.5 18.7 17.2 12.4 14.7 13.8 11.5 11.2 10.5 9.5 on both days 11.8 32.4 20.8 12.8 10.0 8.2 8.6 8.8 7.8 11.8 10.2
Quantity consumed per eating occasion ))))))))))))))))))))))))))))))))))))))))))))g)))))))))))))))))))))))))))))))))))))))))))))(1 cup = 244 g)
Mean 222 202 244 333 258 278 202 223 142 188 137 SEM 4 3 7 13 7 11 10 15 7 9 8
5th percentile 15 88 110 97 * 90 * 14 11 13 10 13 10 10th percentile 30 119 118 175 112 29 15 17 13 27 15 25th percentile 121 137 181 225 181 122 75 69 29 83 41 50th percentile 239 189 237 288 229 240 181 238 120 181 118 75th percentile 272 241 244 416 297 362 256 304 232 240 212 90th percentile 375 289 349 484 373 481 363 434 266 321 240 95th percentile 479 340 447 613 * 471 * 582 466 479 341 384 274
)))))))))))))))))))))))))))))))))))))))))))))))))))))))))))))))))))))))))))))))))))))))))))))))))))))))))))))))))))))))))))))))))))
* Indicates a statistic that is potentially unreliable because of small sample size or large coefficient of variation.# Indicates a percentage that is greater than 0 but less than 0.05 or a mean, SEM, or percentile that is greater than 0 but less than 0.5.--- Indicates a percentile that could not be estimated.Note: See "Table notes."Source: USDA's Continuing Survey of Food Intakes by Individuals, 1994-96, 2 days.

60
Table 1.052. Whole Milk Consumed with Cereal: Percentage of persons using food in 2 days and quantities consumed per eating occasion.
)))))))))))))))))))))))))))))))))))))))))))))))))))))))))))))))))))))))))))))))))))))))))))))))))))))))))))))))))))))))))))))))))))
* * Age (years) and sex* *)))))))))))))))))))))))))))))))))))))))))))))))))))))))))))))))))))))))))))))))))
* * 2-5 6-11 12-19 20-39 40-59 60 and older* *)))))) )))))) ))))))))))))))) ))))))))))))))) ))))))))))))))) )))))))))))))))
Statistic * All individuals * Males Males* age 2 and over * and and Males Females Males Females Males Females Males Females* *females females
)))))))))))))))))))))))))))))))))))))))))))))))))))))))))))))))))))))))))))))))))))))))))))))))))))))))))))))))))))))))))))))))))))
Number in sample 14,262 2,109 1,432 696 702 1,543 1,449 1,663 1,694 1,545 1,429
Percent of persons using ))))))))))))))))))))))))))))))))))))))))))))%)))))))))))))))))))))))))))))))))))))))))))))
at least once in 2 days 12.1 33.8 26.2 14.8 14.1 7.9 8.7 6.2 6.1 10.1 9.9 on 1 of 2 days 8.4 19.9 16.9 10.1 9.8 5.9 7.3 4.8 5.3 6.0 6.5 on both days 3.7 13.9 9.3 4.6 4.3 2.0 1.4 1.5 0.8 4.1 3.3
Quantity consumed per eating occasion ))))))))))))))))))))))))))))))))))))))))))))g)))))))))))))))))))))))))))))))))))))))))))))(1 cup = 244 g)
Mean 207 161 212 265 235 272 216 216 183 177 156 SEM 6 5 11 18 13 16 14 16 10 10 13
5th percentile 58 57 59 54 * 92 * 58 * --- --- 36 * 47 * 25 * 10th percentile 81 60 87 97 * 106 * 87 * 93 91 * 63 * 58 49 25th percentile 122 122 114 161 140 168 109 108 109 116 103 50th percentile 182 122 182 229 222 226 188 216 137 140 117 75th percentile 239 207 238 335 240 318 230 239 227 226 219 90th percentile 350 240 347 431 * 339 * 448 * 345 344 * 242 * 241 236 95th percentile 435 275 404 464 * 404 * 475 * 437 * --- 332 * 320 * 242 *
)))))))))))))))))))))))))))))))))))))))))))))))))))))))))))))))))))))))))))))))))))))))))))))))))))))))))))))))))))))))))))))))))))
* Indicates a statistic that is potentially unreliable because of small sample size or large coefficient of variation.# Indicates a percentage that is greater than 0 but less than 0.05 or a mean, SEM, or percentile that is greater than 0 but less than 0.5.--- Indicates a percentile that could not be estimated.Note: See "Table notes."Source: USDA's Continuing Survey of Food Intakes by Individuals, 1994-96, 2 days.

61
Table 1.053. Lowfat Milk: Percentage of persons using food in 2 days and quantities consumed per eating occasion.
)))))))))))))))))))))))))))))))))))))))))))))))))))))))))))))))))))))))))))))))))))))))))))))))))))))))))))))))))))))))))))))))))))
* * Age (years) and sex* *)))))))))))))))))))))))))))))))))))))))))))))))))))))))))))))))))))))))))))))))))
* * 2-5 6-11 12-19 20-39 40-59 60 and older* *)))))) )))))) ))))))))))))))) ))))))))))))))) ))))))))))))))) )))))))))))))))
Statistic * All individuals * Males Males* age 2 and over * and and Males Females Males Females Males Females Males Females* *females females
)))))))))))))))))))))))))))))))))))))))))))))))))))))))))))))))))))))))))))))))))))))))))))))))))))))))))))))))))))))))))))))))))))
Number in sample 14,262 2,109 1,432 696 702 1,543 1,449 1,663 1,694 1,545 1,429
Percent of persons using ))))))))))))))))))))))))))))))))))))))))))))%)))))))))))))))))))))))))))))))))))))))))))))
at least once in 2 days 35.0 47.5 52.8 39.6 32.4 29.4 29.4 31.2 27.7 40.2 37.8 on 1 of 2 days 16.0 15.0 21.5 17.0 19.3 16.4 15.1 15.3 12.6 14.6 16.0 on both days 19.0 32.4 31.3 22.6 13.1 13.0 14.2 15.8 15.1 25.6 21.8
Quantity consumed per eating occasion ))))))))))))))))))))))))))))))))))))))))))))g)))))))))))))))))))))))))))))))))))))))))))))(1 cup = 244 g)
Mean 225 189 238 326 262 298 198 242 159 189 161 SEM 4 3 4 8 13 15 7 7 5 5 6
5th percentile 30 76 110 118 80 * 15 14 22 14 29 21 10th percentile 61 106 120 181 103 58 37 61 23 53 39 25th percentile 122 122 178 231 176 165 112 122 63 105 83 50th percentile 219 179 242 299 236 240 183 240 152 181 145 75th percentile 263 242 258 365 299 364 243 302 236 244 231 90th percentile 365 272 343 482 390 549 329 436 266 338 246 95th percentile 482 342 402 586 487 * 648 367 479 344 408 304
)))))))))))))))))))))))))))))))))))))))))))))))))))))))))))))))))))))))))))))))))))))))))))))))))))))))))))))))))))))))))))))))))))
* Indicates a statistic that is potentially unreliable because of small sample size or large coefficient of variation.# Indicates a percentage that is greater than 0 but less than 0.05 or a mean, SEM, or percentile that is greater than 0 but less than 0.5.--- Indicates a percentile that could not be estimated.Note: See "Table notes."Source: USDA's Continuing Survey of Food Intakes by Individuals, 1994-96, 2 days.

62
Table 1.054. Lowfat Milk Consumed with Cereal: Percentage of persons using food in 2 days and quantities consumed per eating occasion.
)))))))))))))))))))))))))))))))))))))))))))))))))))))))))))))))))))))))))))))))))))))))))))))))))))))))))))))))))))))))))))))))))))
* * Age (years) and sex* *)))))))))))))))))))))))))))))))))))))))))))))))))))))))))))))))))))))))))))))))))
* * 2-5 6-11 12-19 20-39 40-59 60 and older* *)))))) )))))) ))))))))))))))) ))))))))))))))) ))))))))))))))) )))))))))))))))
Statistic * All individuals * Males Males* age 2 and over * and and Males Females Males Females Males Females Males Females* *females females
)))))))))))))))))))))))))))))))))))))))))))))))))))))))))))))))))))))))))))))))))))))))))))))))))))))))))))))))))))))))))))))))))))
Number in sample 14,262 2,109 1,432 696 702 1,543 1,449 1,663 1,694 1,545 1,429
Percent of persons using ))))))))))))))))))))))))))))))))))))))))))))%)))))))))))))))))))))))))))))))))))))))))))))
at least once in 2 days 20.1 31.5 32.7 24.3 21.1 14.0 15.2 16.1 13.1 26.5 24.4 on 1 of 2 days 12.8 17.8 19.5 16.7 16.1 10.0 11.1 10.5 8.9 13.6 13.9 on both days 7.2 13.7 13.1 7.6 5.1 4.1 4.1 5.7 4.2 12.9 10.5
Quantity consumed per eating occasion ))))))))))))))))))))))))))))))))))))))))))))g)))))))))))))))))))))))))))))))))))))))))))))(1 cup = 244 g)
Mean 194 136 198 277 227 284 181 212 151 165 134 SEM 4 4 4 12 12 22 5 10 7 5 5
5th percentile 58 52 69 97 * 82 * 92 * 74 * 77 * 35 * 49 31 10th percentile 81 57 94 105 95 101 94 88 52 58 50 25th percentile 115 90 115 172 115 160 106 114 107 112 79 50th percentile 182 117 175 231 216 225 166 178 119 122 117 75th percentile 237 174 235 352 239 313 225 234 182 232 182 90th percentile 302 227 297 473 365 471 240 327 233 242 228 95th percentile 417 238 365 487 * 456 * 566 * 264 * 387 * 242 * 306 240
)))))))))))))))))))))))))))))))))))))))))))))))))))))))))))))))))))))))))))))))))))))))))))))))))))))))))))))))))))))))))))))))))))
* Indicates a statistic that is potentially unreliable because of small sample size or large coefficient of variation.# Indicates a percentage that is greater than 0 but less than 0.05 or a mean, SEM, or percentile that is greater than 0 but less than 0.5.--- Indicates a percentile that could not be estimated.Note: See "Table notes."Source: USDA's Continuing Survey of Food Intakes by Individuals, 1994-96, 2 days.

63
Table 1.055. Skim Milk: Percentage of persons using food in 2 days and quantities consumed per eating occasion.
)))))))))))))))))))))))))))))))))))))))))))))))))))))))))))))))))))))))))))))))))))))))))))))))))))))))))))))))))))))))))))))))))))
* * Age (years) and sex* *)))))))))))))))))))))))))))))))))))))))))))))))))))))))))))))))))))))))))))))))))
* * 2-5 6-11 12-19 20-39 40-59 60 and older* *)))))) )))))) ))))))))))))))) ))))))))))))))) ))))))))))))))) )))))))))))))))
Statistic * All individuals * Males Males* age 2 and over * and and Males Females Males Females Males Females Males Females* *females females
)))))))))))))))))))))))))))))))))))))))))))))))))))))))))))))))))))))))))))))))))))))))))))))))))))))))))))))))))))))))))))))))))))
Number in sample 14,262 2,109 1,432 696 702 1,543 1,449 1,663 1,694 1,545 1,429
Percent of persons using ))))))))))))))))))))))))))))))))))))))))))))%)))))))))))))))))))))))))))))))))))))))))))))
at least once in 2 days 14.3 7.8 11.1 9.7 13.5 9.3 15.5 15.1 19.2 17.7 21.6 on 1 of 2 days 6.7 3.5 4.7 4.9 6.7 5.3 8.4 6.9 8.8 6.5 8.0 on both days 7.6 4.3 6.4 4.8 6.8 3.9 7.1 8.2 10.4 11.2 13.5
Quantity consumed per eating occasion ))))))))))))))))))))))))))))))))))))))))))))g)))))))))))))))))))))))))))))))))))))))))))))(1 cup = 245 g)
Mean 226 171 225 375 255 318 235 244 193 186 154 SEM 5 9 9 38 14 13 11 12 7 9 9
5th percentile 31 61 * 62 * 119 * 98 * 48 * 29 * 29 * 27 24 * 13 10th percentile 61 62 122 147 * 122 * 106 70 75 49 41 29 25th percentile 122 122 162 228 141 222 125 125 122 108 85 50th percentile 225 163 225 367 245 286 245 245 184 184 141 75th percentile 275 215 245 453 366 404 276 327 245 245 225 90th percentile 367 245 357 551 * 425 * 490 367 409 325 306 245 95th percentile 490 292 * 382 * 731 * 490 * 568 * 490 * 490 * 367 367 * 267
)))))))))))))))))))))))))))))))))))))))))))))))))))))))))))))))))))))))))))))))))))))))))))))))))))))))))))))))))))))))))))))))))))
* Indicates a statistic that is potentially unreliable because of small sample size or large coefficient of variation.# Indicates a percentage that is greater than 0 but less than 0.05 or a mean, SEM, or percentile that is greater than 0 but less than 0.5.--- Indicates a percentile that could not be estimated.Note: See "Table notes."Source: USDA's Continuing Survey of Food Intakes by Individuals, 1994-96, 2 days.

64
Table 1.056. Skim Milk Consumed with Cereal: Percentage of persons using food in 2 days and quantities consumed per eating occasion.
)))))))))))))))))))))))))))))))))))))))))))))))))))))))))))))))))))))))))))))))))))))))))))))))))))))))))))))))))))))))))))))))))))
* * Age (years) and sex* *)))))))))))))))))))))))))))))))))))))))))))))))))))))))))))))))))))))))))))))))))
* * 2-5 6-11 12-19 20-39 40-59 60 and older* *)))))) )))))) ))))))))))))))) ))))))))))))))) ))))))))))))))) )))))))))))))))
Statistic * All individuals * Males Males* age 2 and over * and and Males Females Males Females Males Females Males Females* *females females
)))))))))))))))))))))))))))))))))))))))))))))))))))))))))))))))))))))))))))))))))))))))))))))))))))))))))))))))))))))))))))))))))))
Number in sample 14,262 2,109 1,432 696 702 1,543 1,449 1,663 1,694 1,545 1,429
Percent of persons using ))))))))))))))))))))))))))))))))))))))))))))%)))))))))))))))))))))))))))))))))))))))))))))
at least once in 2 days 8.9 4.9 7.5 6.5 8.3 5.6 9.3 8.7 11.8 12.4 14.2 on 1 of 2 days 5.8 3.2 5.2 4.7 5.7 4.0 6.8 5.1 7.7 6.3 8.3 on both days 3.2 1.7 2.3 1.9 2.7 1.6 2.5 3.7 4.1 6.1 5.9
Quantity consumed per eating occasion ))))))))))))))))))))))))))))))))))))))))))))g)))))))))))))))))))))))))))))))))))))))))))))(1 cup = 245 g)
Mean 190 131 188 285 * 181 260 207 197 173 174 135 SEM 4 11 14 23 * 13 12 10 11 7 9 9
5th percentile 61 31 * 61 * --- 75 * 73 * 74 * 50 * 57 * 61 * 31 * 10th percentile 81 38 * 78 * 92 * 82 * 107 * 122 90 92 65 61 25th percentile 122 61 122 150 * 122 184 122 122 122 122 89 50th percentile 184 122 155 230 160 245 212 184 148 126 122 75th percentile 245 170 209 365 * 209 308 245 245 245 229 171 90th percentile 306 233 * 331 * 490 * 242 * 381 * 290 306 245 243 228 95th percentile 360 245 * 357 * --- 306 * 454 * 345 * 359 * 289 * 325 * 238 *
)))))))))))))))))))))))))))))))))))))))))))))))))))))))))))))))))))))))))))))))))))))))))))))))))))))))))))))))))))))))))))))))))))
* Indicates a statistic that is potentially unreliable because of small sample size or large coefficient of variation.# Indicates a percentage that is greater than 0 but less than 0.05 or a mean, SEM, or percentile that is greater than 0 but less than 0.5.--- Indicates a percentile that could not be estimated.Note: See "Table notes."Source: USDA's Continuing Survey of Food Intakes by Individuals, 1994-96, 2 days.

65
Table 1.057. Cheese, Other Than Cream or Cottage: Percentage of persons using food in 2 days and quantities consumed per eating occasion.
)))))))))))))))))))))))))))))))))))))))))))))))))))))))))))))))))))))))))))))))))))))))))))))))))))))))))))))))))))))))))))))))))))
* * Age (years) and sex* *)))))))))))))))))))))))))))))))))))))))))))))))))))))))))))))))))))))))))))))))))
* * 2-5 6-11 12-19 20-39 40-59 60 and older* *)))))) )))))) ))))))))))))))) ))))))))))))))) ))))))))))))))) )))))))))))))))
Statistic * All individuals * Males Males* age 2 and over * and and Males Females Males Females Males Females Males Females* *females females
)))))))))))))))))))))))))))))))))))))))))))))))))))))))))))))))))))))))))))))))))))))))))))))))))))))))))))))))))))))))))))))))))))
Number in sample 14,262 2,109 1,432 696 702 1,543 1,449 1,663 1,694 1,545 1,429
Percent of persons using ))))))))))))))))))))))))))))))))))))))))))))%)))))))))))))))))))))))))))))))))))))))))))))
at least once in 2 days 51.1 53.2 50.4 61.1 53.9 63.8 52.6 48.3 46.3 40.9 35.4 on 1 of 2 days 36.8 37.1 37.3 41.1 37.7 43.2 39.1 33.8 35.2 30.6 28.5 on both days 14.3 16.1 13.1 20.0 16.2 20.6 13.6 14.5 11.2 10.3 6.9
Quantity consumed per eating occasion ))))))))))))))))))))))))))))))))))))))))))))g)))))))))))))))))))))))))))))))))))))))))))))(1-1/2 ounces = 43 g)
Mean 32 24 29 38 27 39 30 36 29 33 26 SEM 1 1 1 2 1 2 1 1 1 2 1
5th percentile 7 5 7 13 7 11 6 9 6 7 3 10th percentile 11 7 11 18 12 16 9 14 7 9 6 25th percentile 20 13 16 21 17 23 17 21 17 17 14 50th percentile 26 21 24 28 23 30 24 28 24 26 21 75th percentile 39 28 35 43 31 43 34 43 34 42 34 90th percentile 57 42 56 63 45 65 56 60 52 59 53 95th percentile 77 57 68 85 57 101 71 85 68 81 58
)))))))))))))))))))))))))))))))))))))))))))))))))))))))))))))))))))))))))))))))))))))))))))))))))))))))))))))))))))))))))))))))))))
* Indicates a statistic that is potentially unreliable because of small sample size or large coefficient of variation.# Indicates a percentage that is greater than 0 but less than 0.05 or a mean, SEM, or percentile that is greater than 0 but less than 0.5.--- Indicates a percentile that could not be estimated.Note: See "Table notes."Source: USDA's Continuing Survey of Food Intakes by Individuals, 1994-96, 2 days.

66
Table 1.058. Ice Cream and Ice Milk: Percentage of persons using food in 2 days and quantities consumed per eating occasion.
)))))))))))))))))))))))))))))))))))))))))))))))))))))))))))))))))))))))))))))))))))))))))))))))))))))))))))))))))))))))))))))))))))
* * Age (years) and sex* *)))))))))))))))))))))))))))))))))))))))))))))))))))))))))))))))))))))))))))))))))
* * 2-5 6-11 12-19 20-39 40-59 60 and older* *)))))) )))))) ))))))))))))))) ))))))))))))))) ))))))))))))))) )))))))))))))))
Statistic * All individuals * Males Males* age 2 and over * and and Males Females Males Females Males Females Males Females* *females females
)))))))))))))))))))))))))))))))))))))))))))))))))))))))))))))))))))))))))))))))))))))))))))))))))))))))))))))))))))))))))))))))))))
Number in sample 14,262 2,109 1,432 696 702 1,543 1,449 1,663 1,694 1,545 1,429
Percent of persons using ))))))))))))))))))))))))))))))))))))))))))))%)))))))))))))))))))))))))))))))))))))))))))))
at least once in 2 days 16.6 18.4 21.1 14.2 15.2 14.7 13.6 18.0 14.2 22.7 18.9 on 1 of 2 days 14.2 15.6 18.9 12.4 13.7 13.2 12.5 15.3 12.1 17.1 14.2 on both days 2.4 2.8 2.2 1.8 * 1.4 * 1.5 1.1 2.8 2.1 5.5 4.8
Quantity consumed per eating occasion ))))))))))))))))))))))))))))))))))))))))))))g)))))))))))))))))))))))))))))))))))))))))))))(1/2 cup hard ice cream = 66 g)
Mean 151 92 135 221 187 200 136 173 141 138 107 SEM 4 3 4 12 14 20 6 6 8 5 4
5th percentile 44 33 51 66 * 39 * 44 * 39 * 63 37 * 42 32 10th percentile 66 37 66 110 * 64 * 66 66 70 44 66 44 25th percentile 77 66 86 133 98 131 74 129 66 66 66 50th percentile 133 66 132 197 142 172 132 133 132 132 100 75th percentile 198 132 166 266 265 265 152 212 197 197 133 90th percentile 266 136 199 378 * 368 * 397 224 267 265 264 175 95th percentile 349 198 263 411 * 397 * 422 * 271 * 332 267 * 266 200
)))))))))))))))))))))))))))))))))))))))))))))))))))))))))))))))))))))))))))))))))))))))))))))))))))))))))))))))))))))))))))))))))))
* Indicates a statistic that is potentially unreliable because of small sample size or large coefficient of variation.# Indicates a percentage that is greater than 0 but less than 0.05 or a mean, SEM, or percentile that is greater than 0 but less than 0.5.--- Indicates a percentile that could not be estimated.Note: See "Table notes."Source: USDA's Continuing Survey of Food Intakes by Individuals, 1994-96, 2 days.

67
Table 1.059. Beef Steaks: Percentage of persons using food in 2 days and quantities consumed per eating occasion.
)))))))))))))))))))))))))))))))))))))))))))))))))))))))))))))))))))))))))))))))))))))))))))))))))))))))))))))))))))))))))))))))))))
* * Age (years) and sex* *)))))))))))))))))))))))))))))))))))))))))))))))))))))))))))))))))))))))))))))))))
* * 2-5 6-11 12-19 20-39 40-59 60 and older* *)))))) )))))) ))))))))))))))) ))))))))))))))) ))))))))))))))) )))))))))))))))
Statistic * All individuals * Males Males* age 2 and over * and and Males Females Males Females Males Females Males Females* *females females
)))))))))))))))))))))))))))))))))))))))))))))))))))))))))))))))))))))))))))))))))))))))))))))))))))))))))))))))))))))))))))))))))))
Number in sample 14,262 2,109 1,432 696 702 1,543 1,449 1,663 1,694 1,545 1,429
Percent of persons using ))))))))))))))))))))))))))))))))))))))))))))%)))))))))))))))))))))))))))))))))))))))))))))
at least once in 2 days 12.8 11.1 11.3 9.5 9.4 17.1 11.8 18.3 10.7 13.4 9.5 on 1 of 2 days 12.1 10.6 10.9 9.2 9.0 16.0 11.1 17.0 10.3 12.2 8.9 on both days 0.7 0.5 * 0.4 * 0.2 * 0.4 * 1.1 0.7 * 1.2 0.4 * 1.2 0.7 *
Quantity consumed per eating occasion ))))))))))))))))))))))))))))))))))))))))))))g)))))))))))))))))))))))))))))))))))))))))))))(1 ounce = 28 g)
Mean 139 58 87 168 112 202 121 159 117 129 95 SEM 6 4 9 14 10 20 8 7 6 7 6
5th percentile 25 6 * 15 * 33 * 14 * 44 * 34 * 36 32 * 37 * 19 * 10th percentile 38 8 25 58 * 33 * 67 37 60 45 42 30 25th percentile 67 25 49 81 63 120 57 101 60 65 51 50th percentile 119 50 63 150 96 173 105 151 106 120 78 75th percentile 183 80 99 206 153 251 160 202 155 178 130 90th percentile 256 124 158 270 * 210 * 353 207 265 191 219 165 95th percentile 319 138 * 205 * 396 * 222 * 500 * 269 * 311 238 * 266 * 185 *
)))))))))))))))))))))))))))))))))))))))))))))))))))))))))))))))))))))))))))))))))))))))))))))))))))))))))))))))))))))))))))))))))))
* Indicates a statistic that is potentially unreliable because of small sample size or large coefficient of variation.# Indicates a percentage that is greater than 0 but less than 0.05 or a mean, SEM, or percentile that is greater than 0 but less than 0.5.--- Indicates a percentile that could not be estimated.Note: See "Table notes."Source: USDA's Continuing Survey of Food Intakes by Individuals, 1994-96, 2 days.

68
Table 1.060. Beef Roasts: Percentage of persons using food in 2 days and quantities consumed per eating occasion.
)))))))))))))))))))))))))))))))))))))))))))))))))))))))))))))))))))))))))))))))))))))))))))))))))))))))))))))))))))))))))))))))))))
* * Age (years) and sex* *)))))))))))))))))))))))))))))))))))))))))))))))))))))))))))))))))))))))))))))))))
* * 2-5 6-11 12-19 20-39 40-59 60 and older* *)))))) )))))) ))))))))))))))) ))))))))))))))) ))))))))))))))) )))))))))))))))
Statistic * All individuals * Males Males* age 2 and over * and and Males Females Males Females Males Females Males Females* *females females
)))))))))))))))))))))))))))))))))))))))))))))))))))))))))))))))))))))))))))))))))))))))))))))))))))))))))))))))))))))))))))))))))))
Number in sample 14,262 2,109 1,432 696 702 1,543 1,449 1,663 1,694 1,545 1,429
Percent of persons using ))))))))))))))))))))))))))))))))))))))))))))%)))))))))))))))))))))))))))))))))))))))))))))
at least once in 2 days 7.4 5.2 4.8 5.1 5.5 6.9 5.8 9.9 9.6 11.7 8.8 on 1 of 2 days 7.1 5.1 4.7 4.9 5.5 6.6 5.8 8.8 9.3 10.9 8.6 on both days 0.3 0.1 * 0.2 * 0.2 * 0.0 * 0.3 * 0.0 * 1.1 0.3 * 0.8 * 0.2 *
Quantity consumed per eating occasion ))))))))))))))))))))))))))))))))))))))))))))g)))))))))))))))))))))))))))))))))))))))))))))(1 ounce = 28 g)
Mean 101 49 67 233 * 97 * 132 85 119 74 102 80 SEM 7 5 7 149 * 16 * 14 8 8 5 6 4
5th percentile 16 3 * 8 * 11 * --- 23 * 13 * 25 * 12 * 22 * 11 * 10th percentile 25 8 * 17 * 13 * 14 * 41 * 20 * 35 21 27 24 25th percentile 45 17 34 39 * 24 * 56 41 63 41 52 41 50th percentile 76 33 51 84 80 103 78 99 66 80 68 75th percentile 121 67 83 127 * 131 * 170 113 142 87 135 102 90th percentile 185 101 * 136 * 136 * 206 * 233 * 134 * 221 134 191 142 95th percentile 229 140 * 161 * 281 * 267 * 264 * 154 * 259 * 162 * 226 * 170 *
)))))))))))))))))))))))))))))))))))))))))))))))))))))))))))))))))))))))))))))))))))))))))))))))))))))))))))))))))))))))))))))))))))
* Indicates a statistic that is potentially unreliable because of small sample size or large coefficient of variation.# Indicates a percentage that is greater than 0 but less than 0.05 or a mean, SEM, or percentile that is greater than 0 but less than 0.5.--- Indicates a percentile that could not be estimated.Note: See "Table notes."Source: USDA's Continuing Survey of Food Intakes by Individuals, 1994-96, 2 days.
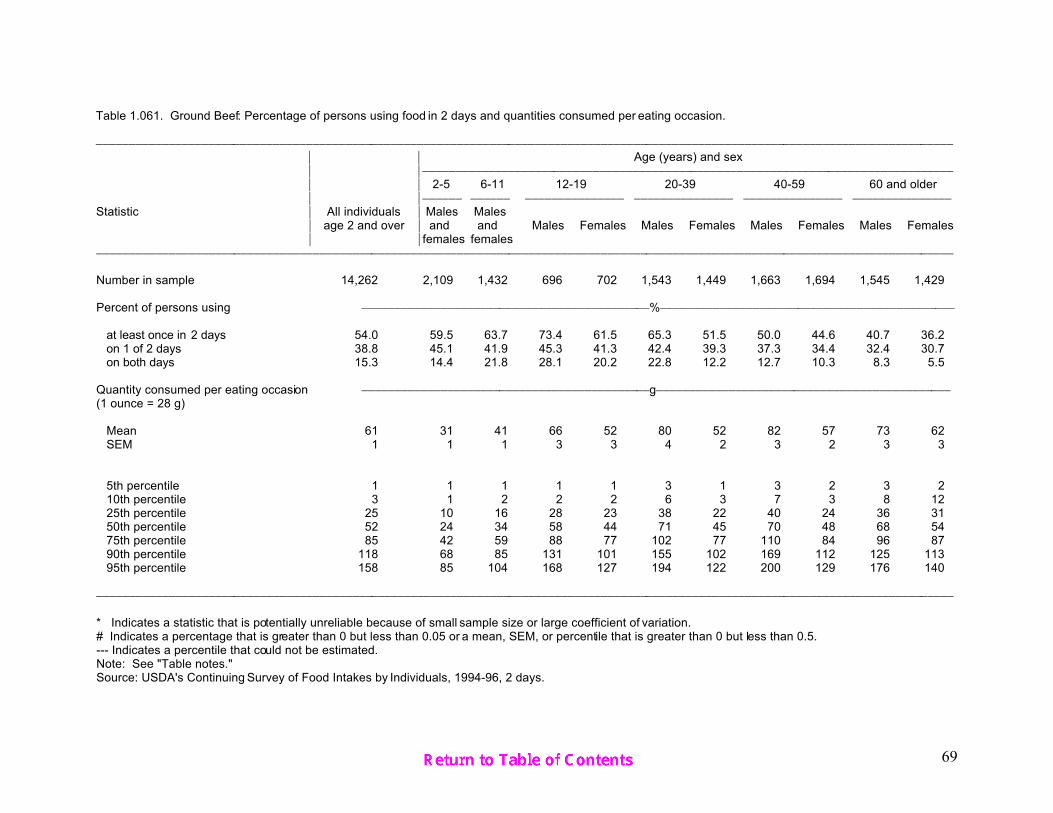
69
Table 1.061. Ground Beef: Percentage of persons using food in 2 days and quantities consumed per eating occasion.
)))))))))))))))))))))))))))))))))))))))))))))))))))))))))))))))))))))))))))))))))))))))))))))))))))))))))))))))))))))))))))))))))))
* * Age (years) and sex* *)))))))))))))))))))))))))))))))))))))))))))))))))))))))))))))))))))))))))))))))))
* * 2-5 6-11 12-19 20-39 40-59 60 and older* *)))))) )))))) ))))))))))))))) ))))))))))))))) ))))))))))))))) )))))))))))))))
Statistic * All individuals * Males Males* age 2 and over * and and Males Females Males Females Males Females Males Females* *females females
)))))))))))))))))))))))))))))))))))))))))))))))))))))))))))))))))))))))))))))))))))))))))))))))))))))))))))))))))))))))))))))))))))
Number in sample 14,262 2,109 1,432 696 702 1,543 1,449 1,663 1,694 1,545 1,429
Percent of persons using ))))))))))))))))))))))))))))))))))))))))))))%)))))))))))))))))))))))))))))))))))))))))))))
at least once in 2 days 54.0 59.5 63.7 73.4 61.5 65.3 51.5 50.0 44.6 40.7 36.2 on 1 of 2 days 38.8 45.1 41.9 45.3 41.3 42.4 39.3 37.3 34.4 32.4 30.7 on both days 15.3 14.4 21.8 28.1 20.2 22.8 12.2 12.7 10.3 8.3 5.5
Quantity consumed per eating occasion ))))))))))))))))))))))))))))))))))))))))))))g)))))))))))))))))))))))))))))))))))))))))))))(1 ounce = 28 g)
Mean 61 31 41 66 52 80 52 82 57 73 62 SEM 1 1 1 3 3 4 2 3 2 3 3
5th percentile 1 1 1 1 1 3 1 3 2 3 2 10th percentile 3 1 2 2 2 6 3 7 3 8 12 25th percentile 25 10 16 28 23 38 22 40 24 36 31 50th percentile 52 24 34 58 44 71 45 70 48 68 54 75th percentile 85 42 59 88 77 102 77 110 84 96 87 90th percentile 118 68 85 131 101 155 102 169 112 125 113 95th percentile 158 85 104 168 127 194 122 200 129 176 140
)))))))))))))))))))))))))))))))))))))))))))))))))))))))))))))))))))))))))))))))))))))))))))))))))))))))))))))))))))))))))))))))))))
* Indicates a statistic that is potentially unreliable because of small sample size or large coefficient of variation.# Indicates a percentage that is greater than 0 but less than 0.05 or a mean, SEM, or percentile that is greater than 0 but less than 0.5.--- Indicates a percentile that could not be estimated.Note: See "Table notes."Source: USDA's Continuing Survey of Food Intakes by Individuals, 1994-96, 2 days.

70
Table 1.062. Ham: Percentage of persons using food in 2 days and quantities consumed per eating occasion.
)))))))))))))))))))))))))))))))))))))))))))))))))))))))))))))))))))))))))))))))))))))))))))))))))))))))))))))))))))))))))))))))))))
* * Age (years) and sex* *)))))))))))))))))))))))))))))))))))))))))))))))))))))))))))))))))))))))))))))))))
* * 2-5 6-11 12-19 20-39 40-59 60 and older* *)))))) )))))) ))))))))))))))) ))))))))))))))) ))))))))))))))) )))))))))))))))
Statistic * All individuals * Males Males* age 2 and over * and and Males Females Males Females Males Females Males Females* *females females
)))))))))))))))))))))))))))))))))))))))))))))))))))))))))))))))))))))))))))))))))))))))))))))))))))))))))))))))))))))))))))))))))))
Number in sample 14,262 2,109 1,432 696 702 1,543 1,449 1,663 1,694 1,545 1,429
Percent of persons using ))))))))))))))))))))))))))))))))))))))))))))%)))))))))))))))))))))))))))))))))))))))))))))
at least once in 2 days 11.3 6.9 8.5 11.6 9.9 10.8 9.7 13.5 12.2 15.2 14.4 on 1 of 2 days 10.5 6.4 8.0 11.6 9.1 9.8 9.2 12.7 11.4 14.1 12.9 on both days 0.8 0.4 * 0.5 * 0.1 * 0.8 * 1.0 0.6 * 0.8 0.8 1.1 1.5
Quantity consumed per eating occasion ))))))))))))))))))))))))))))))))))))))))))))g)))))))))))))))))))))))))))))))))))))))))))))(1 ounce = 28 g)
Mean 56 35 40 68 40 78 47 68 50 56 45 SEM 2 4 4 7 5 7 4 5 4 3 3
5th percentile 6 3 * 3 * 9 * 4 * 8 * 6 * 6 * 3 * 6 * 6 * 10th percentile 9 6 7 * 13 * 6 * 16 9 13 8 11 8 25th percentile 22 13 13 25 15 27 22 26 19 23 17 50th percentile 38 26 33 42 31 51 33 42 32 41 38 75th percentile 71 45 51 90 56 90 60 84 60 77 62 90th percentile 119 68 91 * 155 * 85 * 167 102 149 106 104 85 95th percentile 154 85 * 120 * 196 * 97 * 258 * 116 * 185 * 141 * 149 * 107 *
)))))))))))))))))))))))))))))))))))))))))))))))))))))))))))))))))))))))))))))))))))))))))))))))))))))))))))))))))))))))))))))))))))
* Indicates a statistic that is potentially unreliable because of small sample size or large coefficient of variation.# Indicates a percentage that is greater than 0 but less than 0.05 or a mean, SEM, or percentile that is greater than 0 but less than 0.5.--- Indicates a percentile that could not be estimated.Note: See "Table notes."Source: USDA's Continuing Survey of Food Intakes by Individuals, 1994-96, 2 days.

71
Table 1.063. Pork Chops, Steaks, Roasts: Percentage of persons using food in 2 days and quantities consumed per eating occasion.
)))))))))))))))))))))))))))))))))))))))))))))))))))))))))))))))))))))))))))))))))))))))))))))))))))))))))))))))))))))))))))))))))))
* * Age (years) and sex* *)))))))))))))))))))))))))))))))))))))))))))))))))))))))))))))))))))))))))))))))))
* * 2-5 6-11 12-19 20-39 40-59 60 and older* *)))))) )))))) ))))))))))))))) ))))))))))))))) ))))))))))))))) )))))))))))))))
Statistic * All individuals * Males Males* age 2 and over * and and Males Females Males Females Males Females Males Females* *females females
)))))))))))))))))))))))))))))))))))))))))))))))))))))))))))))))))))))))))))))))))))))))))))))))))))))))))))))))))))))))))))))))))))
Number in sample 14,262 2,109 1,432 696 702 1,543 1,449 1,663 1,694 1,545 1,429
Percent of persons using ))))))))))))))))))))))))))))))))))))))))))))%)))))))))))))))))))))))))))))))))))))))))))))
at least once in 2 days 12.6 11.0 10.1 11.6 8.5 12.8 12.5 14.3 13.0 16.4 13.1 on 1 of 2 days 11.6 10.2 9.3 10.3 7.9 11.9 11.9 13.1 12.0 15.1 12.2 on both days 0.9 0.8 0.9 * 1.3 * 0.6 * 0.9 0.7 * 1.2 1.0 1.3 0.9
Quantity consumed per eating occasion ))))))))))))))))))))))))))))))))))))))))))))g)))))))))))))))))))))))))))))))))))))))))))))(1 ounce = 28 g)
Mean 83 48 62 100 72 117 71 108 67 89 62 SEM 3 3 4 8 7 8 4 6 4 3 3
5th percentile 8 5 * 14 * 16 * 8 * 11 * 7 * 10 * 7 * 10 * 7 * 10th percentile 17 11 25 20 * 13 * 26 10 20 13 25 9 25th percentile 37 26 34 50 34 57 34 48 29 46 33 50th percentile 67 40 56 85 66 100 66 87 55 83 52 75th percentile 109 63 79 127 89 165 90 159 89 123 83 90th percentile 167 84 100 170 * 127 * 213 129 196 136 166 115 95th percentile 202 104 * 129 * 265 * 157 * 251 * 159 * 258 * 168 * 186 * 141 *
)))))))))))))))))))))))))))))))))))))))))))))))))))))))))))))))))))))))))))))))))))))))))))))))))))))))))))))))))))))))))))))))))))
* Indicates a statistic that is potentially unreliable because of small sample size or large coefficient of variation.# Indicates a percentage that is greater than 0 but less than 0.05 or a mean, SEM, or percentile that is greater than 0 but less than 0.5.--- Indicates a percentile that could not be estimated.Note: See "Table notes."Source: USDA's Continuing Survey of Food Intakes by Individuals, 1994-96, 2 days.

72
Table 1.064. Bacon: Percentage of persons using food in 2 days and quantities consumed per eating occasion.
)))))))))))))))))))))))))))))))))))))))))))))))))))))))))))))))))))))))))))))))))))))))))))))))))))))))))))))))))))))))))))))))))))
* * Age (years) and sex* *)))))))))))))))))))))))))))))))))))))))))))))))))))))))))))))))))))))))))))))))))
* * 2-5 6-11 12-19 20-39 40-59 60 and older* *)))))) )))))) ))))))))))))))) ))))))))))))))) ))))))))))))))) )))))))))))))))
Statistic * All individuals * Males Males* age 2 and over * and and Males Females Males Females Males Females Males Females* *females females
)))))))))))))))))))))))))))))))))))))))))))))))))))))))))))))))))))))))))))))))))))))))))))))))))))))))))))))))))))))))))))))))))))
Number in sample 14,262 2,109 1,432 696 702 1,543 1,449 1,663 1,694 1,545 1,429
Percent of persons using ))))))))))))))))))))))))))))))))))))))))))))%)))))))))))))))))))))))))))))))))))))))))))))
at least once in 2 days 14.3 10.4 9.7 14.9 11.1 14.1 12.4 17.5 14.8 20.6 17.4 on 1 of 2 days 12.3 9.4 8.7 13.0 10.6 12.5 11.1 15.4 12.4 16.0 14.0 on both days 2.0 1.0 1.0 2.0 0.6 * 1.6 1.3 2.1 2.5 4.7 3.4
Quantity consumed per eating occasion ))))))))))))))))))))))))))))))))))))))))))))g)))))))))))))))))))))))))))))))))))))))))))))(1 strip = 5 g)
Mean 20 15 19 25 18 26 18 22 18 19 16 SEM # 1 2 2 1 1 1 1 1 1 1
5th percentile 5 4 * 3 * 8 * 2 * 6 * 4 * 7 5 8 5 * 10th percentile 8 5 7 10 * 6 * 9 7 8 8 8 8 25th percentile 12 8 10 15 10 15 10 14 10 10 9 50th percentile 16 13 16 22 16 23 16 18 16 16 16 75th percentile 24 20 23 31 23 31 23 27 23 24 17 90th percentile 34 24 33 45 * 31 * 46 31 36 30 32 24 95th percentile 42 32 * 39 * 47 * 35 * 48 * 37 * 45 32 39 33 *
)))))))))))))))))))))))))))))))))))))))))))))))))))))))))))))))))))))))))))))))))))))))))))))))))))))))))))))))))))))))))))))))))))
* Indicates a statistic that is potentially unreliable because of small sample size or large coefficient of variation.# Indicates a percentage that is greater than 0 but less than 0.05 or a mean, SEM, or percentile that is greater than 0 but less than 0.5.--- Indicates a percentile that could not be estimated.Note: See "Table notes."Source: USDA's Continuing Survey of Food Intakes by Individuals, 1994-96, 2 days.

73
Table 1.065. Pork Breakfast Sausage: Percentage of persons using food in 2 days and quantities consumed per eating occasion.
)))))))))))))))))))))))))))))))))))))))))))))))))))))))))))))))))))))))))))))))))))))))))))))))))))))))))))))))))))))))))))))))))))
* * Age (years) and sex* *)))))))))))))))))))))))))))))))))))))))))))))))))))))))))))))))))))))))))))))))))
* * 2-5 6-11 12-19 20-39 40-59 60 and older* *)))))) )))))) ))))))))))))))) ))))))))))))))) ))))))))))))))) )))))))))))))))
Statistic * All individuals * Males Males* age 2 and over * and and Males Females Males Females Males Females Males Females* *females females
)))))))))))))))))))))))))))))))))))))))))))))))))))))))))))))))))))))))))))))))))))))))))))))))))))))))))))))))))))))))))))))))))))
Number in sample 14,262 2,109 1,432 696 702 1,543 1,449 1,663 1,694 1,545 1,429
Percent of persons using ))))))))))))))))))))))))))))))))))))))))))))%)))))))))))))))))))))))))))))))))))))))))))))
at least once in 2 days 6.1 5.3 6.0 6.3 3.3 6.6 5.1 6.6 5.8 10.7 5.5 on 1 of 2 days 5.6 5.1 5.5 6.0 3.1 6.3 4.8 6.0 5.4 8.9 5.1 on both days 0.5 0.3 * 0.5 * 0.2 * 0.1 * 0.4 * 0.3 * 0.6 * 0.4 * 1.8 0.4 *
Quantity consumed per eating occasion ))))))))))))))))))))))))))))))))))))))))))))g)))))))))))))))))))))))))))))))))))))))))))))(1 ounce = 28 g)
Mean 43 33 32 40 * 40 * 57 37 48 38 48 34 SEM 2 2 3 4 * 5 * 4 3 4 4 4 3
5th percentile 13 11 * 12 * --- 14 * 13 * 13 * 13 * 10 * 13 * 9 * 10th percentile 13 11 * 12 * --- 15 * 19 * 13 * 17 * 11 * 21 11 * 25th percentile 25 13 13 25 * 26 * 26 24 25 13 27 20 50th percentile 27 26 27 27 27 49 27 32 26 32 27 75th percentile 54 39 38 53 * 49 * 54 45 53 47 54 49 90th percentile 80 54 * 53 * 55 * 69 * 108 * 54 * 78 * 64 * 84 54 * 95th percentile 108 83 * 73 * 67 * 79 * 157 * 75 * 108 * 85 * 116 * 68 *
)))))))))))))))))))))))))))))))))))))))))))))))))))))))))))))))))))))))))))))))))))))))))))))))))))))))))))))))))))))))))))))))))))
* Indicates a statistic that is potentially unreliable because of small sample size or large coefficient of variation.# Indicates a percentage that is greater than 0 but less than 0.05 or a mean, SEM, or percentile that is greater than 0 but less than 0.5.--- Indicates a percentile that could not be estimated.Note: See "Table notes."Source: USDA's Continuing Survey of Food Intakes by Individuals, 1994-96, 2 days.

74
Table 1.066. Frankfurters and Luncheon Meats: Percentage of persons using food in 2 days and quantities consumed per eating occasion.
)))))))))))))))))))))))))))))))))))))))))))))))))))))))))))))))))))))))))))))))))))))))))))))))))))))))))))))))))))))))))))))))))))
* * Age (years) and sex* *)))))))))))))))))))))))))))))))))))))))))))))))))))))))))))))))))))))))))))))))))
* * 2-5 6-11 12-19 20-39 40-59 60 and older* *)))))) )))))) ))))))))))))))) ))))))))))))))) ))))))))))))))) )))))))))))))))
Statistic * All individuals * Males Males* age 2 and over * and and Males Females Males Females Males Females Males Females* *females females
)))))))))))))))))))))))))))))))))))))))))))))))))))))))))))))))))))))))))))))))))))))))))))))))))))))))))))))))))))))))))))))))))))
Number in sample 14,262 2,109 1,432 696 702 1,543 1,449 1,663 1,694 1,545 1,429
Percent of persons using ))))))))))))))))))))))))))))))))))))))))))))%)))))))))))))))))))))))))))))))))))))))))))))
at least once in 2 days 41.8 51.7 50.9 46.7 38.5 46.2 35.6 44.9 34.3 41.6 33.9 on 1 of 2 days 32.5 39.1 36.8 36.2 30.3 34.7 29.7 35.8 28.3 30.4 26.9 on both days 9.3 12.5 14.0 10.5 8.2 11.5 6.0 9.1 6.0 11.2 7.0
Quantity consumed per eating occasion ))))))))))))))))))))))))))))))))))))))))))))g)))))))))))))))))))))))))))))))))))))))))))))(1 ounce = 28 g)
Mean 67 49 57 76 57 88 61 79 59 62 51 SEM 2 1 2 3 3 6 2 2 2 2 2
5th percentile 21 14 19 27 15 28 23 24 21 20 14 10th percentile 28 21 28 33 21 33 28 28 28 27 21 25th percentile 42 28 36 47 35 56 36 55 35 38 28 50th percentile 57 47 56 57 56 71 56 63 56 56 46 75th percentile 84 57 64 102 66 112 71 103 69 83 57 90th percentile 114 83 107 130 104 159 110 125 104 113 85 95th percentile 140 112 114 157 114 218 114 169 114 127 113
)))))))))))))))))))))))))))))))))))))))))))))))))))))))))))))))))))))))))))))))))))))))))))))))))))))))))))))))))))))))))))))))))))
* Indicates a statistic that is potentially unreliable because of small sample size or large coefficient of variation.# Indicates a percentage that is greater than 0 but less than 0.05 or a mean, SEM, or percentile that is greater than 0 but less than 0.5.--- Indicates a percentile that could not be estimated.Note: See "Table notes."Source: USDA's Continuing Survey of Food Intakes by Individuals, 1994-96, 2 days.

75
Table 1.067. Canned Tuna: Percentage of persons using food in 2 days and quantities consumed per eating occasion.
)))))))))))))))))))))))))))))))))))))))))))))))))))))))))))))))))))))))))))))))))))))))))))))))))))))))))))))))))))))))))))))))))))
* * Age (years) and sex* *)))))))))))))))))))))))))))))))))))))))))))))))))))))))))))))))))))))))))))))))))
* * 2-5 6-11 12-19 20-39 40-59 60 and older* *)))))) )))))) ))))))))))))))) ))))))))))))))) ))))))))))))))) )))))))))))))))
Statistic * All individuals * Males Males* age 2 and over * and and Males Females Males Females Males Females Males Females* *females females
)))))))))))))))))))))))))))))))))))))))))))))))))))))))))))))))))))))))))))))))))))))))))))))))))))))))))))))))))))))))))))))))))))
Number in sample 14,262 2,109 1,432 696 702 1,543 1,449 1,663 1,694 1,545 1,429
Percent of persons using ))))))))))))))))))))))))))))))))))))))))))))%)))))))))))))))))))))))))))))))))))))))))))))
at least once in 2 days 7.8 6.6 5.4 5.1 7.5 6.7 8.2 8.5 10.0 8.4 9.5 on 1 of 2 days 7.4 6.2 5.3 4.7 7.0 6.4 7.8 8.1 9.8 7.8 9.0 on both days 0.4 0.4 * 0.2 * 0.4 * 0.5 * 0.3 * 0.4 * 0.4 * 0.3 * 0.6 * 0.5 *
Quantity consumed per eating occasion ))))))))))))))))))))))))))))))))))))))))))))g)))))))))))))))))))))))))))))))))))))))))))))(1 ounce = 28 g)
Mean 65 38 57 84 * 64 84 60 69 60 63 65 SEM 2 3 8 12 * 6 7 5 4 4 5 4
5th percentile 14 7 * 14 * --- 14 * 15 * 14 * 14 * 13 * 10 * 12 * 10th percentile 18 8 20 * 18 * 18 * 27 * 14 * 27 15 17 * 23 25th percentile 32 15 26 49 * 28 * 49 34 37 28 35 42 50th percentile 56 29 49 74 56 57 56 56 56 56 56 75th percentile 80 55 59 97 * 77 * 113 74 82 74 77 83 90th percentile 124 73 99 * 162 * 105 * 160 * 105 * 124 112 114 * 112 95th percentile 161 85 * 157 * --- 156 * 168 * 142 * 168 * 141 * 150 * 153 *
)))))))))))))))))))))))))))))))))))))))))))))))))))))))))))))))))))))))))))))))))))))))))))))))))))))))))))))))))))))))))))))))))))
* Indicates a statistic that is potentially unreliable because of small sample size or large coefficient of variation.# Indicates a percentage that is greater than 0 but less than 0.05 or a mean, SEM, or percentile that is greater than 0 but less than 0.5.--- Indicates a percentile that could not be estimated.Note: See "Table notes."Source: USDA's Continuing Survey of Food Intakes by Individuals, 1994-96, 2 days.

76
Table 1.068. Other Finfish: Percentage of persons using food in 2 days and quantities consumed per eating occasion.
)))))))))))))))))))))))))))))))))))))))))))))))))))))))))))))))))))))))))))))))))))))))))))))))))))))))))))))))))))))))))))))))))))
* * Age (years) and sex* *)))))))))))))))))))))))))))))))))))))))))))))))))))))))))))))))))))))))))))))))))
* * 2-5 6-11 12-19 20-39 40-59 60 and older* *)))))) )))))) ))))))))))))))) ))))))))))))))) ))))))))))))))) )))))))))))))))
Statistic * All individuals * Males Males* age 2 and over * and and Males Females Males Females Males Females Males Females* *females females
)))))))))))))))))))))))))))))))))))))))))))))))))))))))))))))))))))))))))))))))))))))))))))))))))))))))))))))))))))))))))))))))))))
Number in sample 14,262 2,109 1,432 696 702 1,543 1,449 1,663 1,694 1,545 1,429
Percent of persons using ))))))))))))))))))))))))))))))))))))))))))))%)))))))))))))))))))))))))))))))))))))))))))))
at least once in 2 days 10.1 7.7 7.8 7.1 5.7 9.6 8.6 12.3 10.8 15.0 14.4 on 1 of 2 days 9.3 7.4 7.3 6.4 5.3 9.3 7.9 11.2 9.9 13.9 13.1 on both days 0.7 0.3 * 0.6 * 0.7 * 0.4 * 0.4 * 0.7 * 1.1 0.9 1.1 1.3
Quantity consumed per eating occasion ))))))))))))))))))))))))))))))))))))))))))))g)))))))))))))))))))))))))))))))))))))))))))))(1 ounce = 28 g)
Mean 110 64 93 119 * 89 * 117 111 130 107 111 108 SEM 2 4 8 11 * 13 * 8 10 7 9 6 6
5th percentile 28 8 * 17 * 40 * 20 * 37 * 26 * 29 * 29 * 37 * 33 * 10th percentile 40 16 31 * 50 * 26 * 47 36 * 47 42 45 42 25th percentile 57 33 50 64 * 47 * 68 50 75 51 57 57 50th percentile 90 58 77 89 67 100 85 110 85 90 90 75th percentile 131 77 119 170 * 124 * 138 129 153 123 133 130 90th percentile 203 124 171 * 185 * 164 * 205 209 * 243 174 220 200 95th percentile 259 128 * 232 * 249 * 199 * 256 * 289 * 287 * 244 * 261 * 229 *
)))))))))))))))))))))))))))))))))))))))))))))))))))))))))))))))))))))))))))))))))))))))))))))))))))))))))))))))))))))))))))))))))))
* Indicates a statistic that is potentially unreliable because of small sample size or large coefficient of variation.# Indicates a percentage that is greater than 0 but less than 0.05 or a mean, SEM, or percentile that is greater than 0 but less than 0.5.--- Indicates a percentile that could not be estimated.Note: See "Table notes."Source: USDA's Continuing Survey of Food Intakes by Individuals, 1994-96, 2 days.

77
Table 1.069. Total Chicken and Turkey: Percentage of persons using food in 2 days and quantities consumed per eating occasion.
)))))))))))))))))))))))))))))))))))))))))))))))))))))))))))))))))))))))))))))))))))))))))))))))))))))))))))))))))))))))))))))))))))
* * Age (years) and sex* *)))))))))))))))))))))))))))))))))))))))))))))))))))))))))))))))))))))))))))))))))
* * 2-5 6-11 12-19 20-39 40-59 60 and older* *)))))) )))))) ))))))))))))))) ))))))))))))))) ))))))))))))))) )))))))))))))))
Statistic * All individuals * Males Males* age 2 and over * and and Males Females Males Females Males Females Males Females* *females females
)))))))))))))))))))))))))))))))))))))))))))))))))))))))))))))))))))))))))))))))))))))))))))))))))))))))))))))))))))))))))))))))))))
Number in sample 14,262 2,109 1,432 696 702 1,543 1,449 1,663 1,694 1,545 1,429
Percent of persons using ))))))))))))))))))))))))))))))))))))))))))))%)))))))))))))))))))))))))))))))))))))))))))))
at least once in 2 days 57.3 63.8 53.8 58.4 54.1 57.3 57.8 56.8 58.7 53.8 57.8 on 1 of 2 days 41.9 46.7 42.3 45.5 40.1 40.6 42.0 39.0 42.7 40.0 43.3 on both days 15.4 17.1 11.5 12.8 14.0 16.7 15.8 17.8 16.0 13.8 14.5
Quantity consumed per eating occasion ))))))))))))))))))))))))))))))))))))))))))))g)))))))))))))))))))))))))))))))))))))))))))))(1 ounce = 28 g)
Mean 85 46 62 100 71 112 78 111 80 87 71 SEM 1 1 2 4 2 4 2 4 2 3 2
5th percentile 6 1 3 # 3 10 5 12 8 5 6 10th percentile 17 7 13 11 15 27 15 25 20 15 16 25th percentile 43 23 35 45 42 60 42 63 42 45 39 50th percentile 73 43 55 85 62 92 69 92 74 78 64 75th percentile 105 60 82 138 94 141 100 138 102 105 92 90th percentile 162 84 110 197 128 195 140 203 147 166 122 95th percentile 203 102 140 255 157 253 194 256 178 204 155
)))))))))))))))))))))))))))))))))))))))))))))))))))))))))))))))))))))))))))))))))))))))))))))))))))))))))))))))))))))))))))))))))))
* Indicates a statistic that is potentially unreliable because of small sample size or large coefficient of variation.# Indicates a percentage that is greater than 0 but less than 0.05 or a mean, SEM, or percentile that is greater than 0 but less than 0.5.--- Indicates a percentile that could not be estimated.Note: See "Table notes."Source: USDA's Continuing Survey of Food Intakes by Individuals, 1994-96, 2 days.
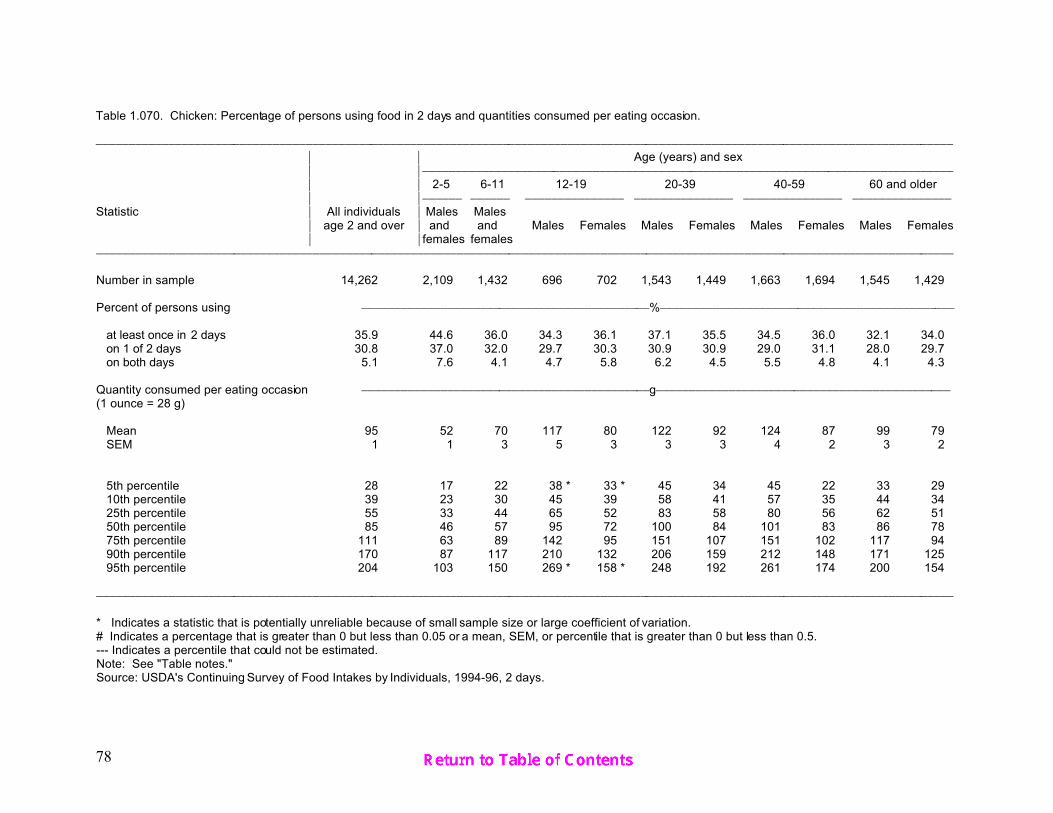
78
Table 1.070. Chicken: Percentage of persons using food in 2 days and quantities consumed per eating occasion.
)))))))))))))))))))))))))))))))))))))))))))))))))))))))))))))))))))))))))))))))))))))))))))))))))))))))))))))))))))))))))))))))))))
* * Age (years) and sex* *)))))))))))))))))))))))))))))))))))))))))))))))))))))))))))))))))))))))))))))))))
* * 2-5 6-11 12-19 20-39 40-59 60 and older* *)))))) )))))) ))))))))))))))) ))))))))))))))) ))))))))))))))) )))))))))))))))
Statistic * All individuals * Males Males* age 2 and over * and and Males Females Males Females Males Females Males Females* *females females
)))))))))))))))))))))))))))))))))))))))))))))))))))))))))))))))))))))))))))))))))))))))))))))))))))))))))))))))))))))))))))))))))))
Number in sample 14,262 2,109 1,432 696 702 1,543 1,449 1,663 1,694 1,545 1,429
Percent of persons using ))))))))))))))))))))))))))))))))))))))))))))%)))))))))))))))))))))))))))))))))))))))))))))
at least once in 2 days 35.9 44.6 36.0 34.3 36.1 37.1 35.5 34.5 36.0 32.1 34.0 on 1 of 2 days 30.8 37.0 32.0 29.7 30.3 30.9 30.9 29.0 31.1 28.0 29.7 on both days 5.1 7.6 4.1 4.7 5.8 6.2 4.5 5.5 4.8 4.1 4.3
Quantity consumed per eating occasion ))))))))))))))))))))))))))))))))))))))))))))g)))))))))))))))))))))))))))))))))))))))))))))(1 ounce = 28 g)
Mean 95 52 70 117 80 122 92 124 87 99 79 SEM 1 1 3 5 3 3 3 4 2 3 2
5th percentile 28 17 22 38 * 33 * 45 34 45 22 33 29 10th percentile 39 23 30 45 39 58 41 57 35 44 34 25th percentile 55 33 44 65 52 83 58 80 56 62 51 50th percentile 85 46 57 95 72 100 84 101 83 86 78 75th percentile 111 63 89 142 95 151 107 151 102 117 94 90th percentile 170 87 117 210 132 206 159 212 148 171 125 95th percentile 204 103 150 269 * 158 * 248 192 261 174 200 154
)))))))))))))))))))))))))))))))))))))))))))))))))))))))))))))))))))))))))))))))))))))))))))))))))))))))))))))))))))))))))))))))))))
* Indicates a statistic that is potentially unreliable because of small sample size or large coefficient of variation.# Indicates a percentage that is greater than 0 but less than 0.05 or a mean, SEM, or percentile that is greater than 0 but less than 0.5.--- Indicates a percentile that could not be estimated.Note: See "Table notes."Source: USDA's Continuing Survey of Food Intakes by Individuals, 1994-96, 2 days.

79
Table 1.071. Turkey: Percentage of persons using food in 2 days and quantities consumed per eating occasion.
)))))))))))))))))))))))))))))))))))))))))))))))))))))))))))))))))))))))))))))))))))))))))))))))))))))))))))))))))))))))))))))))))))
* * Age (years) and sex* *)))))))))))))))))))))))))))))))))))))))))))))))))))))))))))))))))))))))))))))))))
* * 2-5 6-11 12-19 20-39 40-59 60 and older* *)))))) )))))) ))))))))))))))) ))))))))))))))) ))))))))))))))) )))))))))))))))
Statistic * All individuals * Males Males* age 2 and over * and and Males Females Males Females Males Females Males Females* *females females
)))))))))))))))))))))))))))))))))))))))))))))))))))))))))))))))))))))))))))))))))))))))))))))))))))))))))))))))))))))))))))))))))))
Number in sample 14,262 2,109 1,432 696 702 1,543 1,449 1,663 1,694 1,545 1,429
Percent of persons using ))))))))))))))))))))))))))))))))))))))))))))%)))))))))))))))))))))))))))))))))))))))))))))
at least once in 2 days 7.0 5.1 5.7 8.2 5.8 6.8 5.6 8.5 8.8 7.7 7.2 on 1 of 2 days 6.5 4.8 5.6 8.0 5.5 6.0 5.1 7.4 8.2 7.3 7.0 on both days 0.5 0.3 * 0.1 * 0.1 * 0.3 * 0.8 0.5 * 1.0 0.6 * 0.5 * 0.2 *
Quantity consumed per eating occasion ))))))))))))))))))))))))))))))))))))))))))))g)))))))))))))))))))))))))))))))))))))))))))))(1 ounce = 28 g)
Mean 92 63 66 117 60 * 131 76 115 81 80 77 SEM 5 7 5 14 9 * 21 6 12 8 7 7
5th percentile 14 11 * 11 * 24 * 9 * 14 * 13 * 22 * 14 * 11 * 12 * 10th percentile 22 13 * 14 * 27 * 15 * 20 * 16 * 28 25 22 * 21 * 25th percentile 41 26 28 45 30 * 45 37 51 34 34 34 50th percentile 59 45 55 84 47 83 56 76 56 63 57 75th percentile 111 83 89 169 69 * 134 85 127 111 102 84 90th percentile 188 134 * 141 * 255 * 134 * 298 * 138 * 203 152 151 * 137 * 95th percentile 268 139 * 153 * 291 * 162 * 556 * 203 * 276 * 203 * 203 * 220 *
)))))))))))))))))))))))))))))))))))))))))))))))))))))))))))))))))))))))))))))))))))))))))))))))))))))))))))))))))))))))))))))))))))
* Indicates a statistic that is potentially unreliable because of small sample size or large coefficient of variation.# Indicates a percentage that is greater than 0 but less than 0.05 or a mean, SEM, or percentile that is greater than 0 but less than 0.5.--- Indicates a percentile that could not be estimated.Note: See "Table notes."Source: USDA's Continuing Survey of Food Intakes by Individuals, 1994-96, 2 days.

80
Table 1.072. Boiled, Poached, and Baked Eggs: Percentage of persons using food in 2 days and quantities consumed per eating occasion.
)))))))))))))))))))))))))))))))))))))))))))))))))))))))))))))))))))))))))))))))))))))))))))))))))))))))))))))))))))))))))))))))))))
* * Age (years) and sex* *)))))))))))))))))))))))))))))))))))))))))))))))))))))))))))))))))))))))))))))))))
* * 2-5 6-11 12-19 20-39 40-59 60 and older* *)))))) )))))) ))))))))))))))) ))))))))))))))) ))))))))))))))) )))))))))))))))
Statistic * All individuals * Males Males* age 2 and over * and and Males Females Males Females Males Females Males Females* *females females
)))))))))))))))))))))))))))))))))))))))))))))))))))))))))))))))))))))))))))))))))))))))))))))))))))))))))))))))))))))))))))))))))))
Number in sample 14,262 2,109 1,432 696 702 1,543 1,449 1,663 1,694 1,545 1,429
Percent of persons using ))))))))))))))))))))))))))))))))))))))))))))%)))))))))))))))))))))))))))))))))))))))))))))
at least once in 2 days 11.0 8.0 8.2 5.0 7.7 9.4 10.4 12.0 14.2 15.7 16.1 on 1 of 2 days 9.9 7.5 7.7 4.5 6.9 8.5 9.4 10.7 13.5 13.4 14.0 on both days 1.0 0.5 * 0.5 * 0.5 * 0.8 * 0.8 1.0 1.2 0.6 * 2.3 2.1
Quantity consumed per eating occasion ))))))))))))))))))))))))))))))))))))))))))))g)))))))))))))))))))))))))))))))))))))))))))))(1 large, boiled = 50 g)
Mean 42 36 34 44 * 45 50 39 45 38 45 39 SEM 1 3 3 9 * 7 4 3 3 2 3 2
5th percentile 6 3 * 4 * 6 * 4 * 9 * 6 * 5 * 6 * 5 * 4 * 10th percentile 8 6 6 * 8 * 8 * 12 9 8 9 8 8 25th percentile 17 12 12 14 * 17 * 25 17 22 17 19 17 50th percentile 34 32 26 31 28 35 33 36 33 38 37 75th percentile 50 49 48 49 * 76 * 61 45 64 50 57 50 90th percentile 87 57 66 * 103 * 96 * 98 79 94 80 99 82 95th percentile 99 99 * 83 * 127 * 106 * 116 * 97 * 99 * 87 * 99 * 94 *
)))))))))))))))))))))))))))))))))))))))))))))))))))))))))))))))))))))))))))))))))))))))))))))))))))))))))))))))))))))))))))))))))))
* Indicates a statistic that is potentially unreliable because of small sample size or large coefficient of variation.# Indicates a percentage that is greater than 0 but less than 0.05 or a mean, SEM, or percentile that is greater than 0 but less than 0.5.--- Indicates a percentile that could not be estimated.Note: See "Table notes."Source: USDA's Continuing Survey of Food Intakes by Individuals, 1994-96, 2 days.

81
Table 1.073. Fried Eggs: Percentage of persons using food in 2 days and quantities consumed per eating occasion.
)))))))))))))))))))))))))))))))))))))))))))))))))))))))))))))))))))))))))))))))))))))))))))))))))))))))))))))))))))))))))))))))))))
* * Age (years) and sex* *)))))))))))))))))))))))))))))))))))))))))))))))))))))))))))))))))))))))))))))))))
* * 2-5 6-11 12-19 20-39 40-59 60 and older* *)))))) )))))) ))))))))))))))) ))))))))))))))) ))))))))))))))) )))))))))))))))
Statistic * All individuals * Males Males* age 2 and over * and and Males Females Males Females Males Females Males Females* *females females
)))))))))))))))))))))))))))))))))))))))))))))))))))))))))))))))))))))))))))))))))))))))))))))))))))))))))))))))))))))))))))))))))))
Number in sample 14,262 2,109 1,432 696 702 1,543 1,449 1,663 1,694 1,545 1,429
Percent of persons using ))))))))))))))))))))))))))))))))))))))))))))%)))))))))))))))))))))))))))))))))))))))))))))
at least once in 2 days 16.9 17.3 14.0 14.9 13.5 15.2 14.6 20.9 17.5 24.6 18.3 on 1 of 2 days 14.0 14.2 11.5 12.4 12.1 12.4 12.6 16.8 15.2 19.4 14.2 on both days 2.9 3.0 2.5 2.4 1.5 * 2.8 2.0 4.1 2.3 5.2 4.0
Quantity consumed per eating occasion ))))))))))))))))))))))))))))))))))))))))))))g)))))))))))))))))))))))))))))))))))))))))))))(1 large = 46 g)
Mean 68 48 58 83 59 86 61 83 60 70 56 SEM 1 1 2 5 3 2 3 2 2 2 2
5th percentile 34 22 28 * 38 * 35 * 39 21 * 38 33 38 33 10th percentile 38 33 36 38 * 37 * 43 34 40 38 39 38 25th percentile 43 38 39 45 38 66 40 66 39 43 41 50th percentile 75 43 43 75 43 82 58 79 47 75 43 75th percentile 87 54 76 89 76 87 79 87 77 87 75 90th percentile 98 78 87 130 * 87 * 130 89 130 89 97 87 95th percentile 130 87 91 * 153 * 89 * 173 100 * 131 98 111 92
)))))))))))))))))))))))))))))))))))))))))))))))))))))))))))))))))))))))))))))))))))))))))))))))))))))))))))))))))))))))))))))))))))
* Indicates a statistic that is potentially unreliable because of small sample size or large coefficient of variation.# Indicates a percentage that is greater than 0 but less than 0.05 or a mean, SEM, or percentile that is greater than 0 but less than 0.5.--- Indicates a percentile that could not be estimated.Note: See "Table notes."Source: USDA's Continuing Survey of Food Intakes by Individuals, 1994-96, 2 days.

82
Table 1.074. Scrambled Eggs: Percentage of persons using food in 2 days and quantities consumed per eating occasion.
)))))))))))))))))))))))))))))))))))))))))))))))))))))))))))))))))))))))))))))))))))))))))))))))))))))))))))))))))))))))))))))))))))
* * Age (years) and sex* *)))))))))))))))))))))))))))))))))))))))))))))))))))))))))))))))))))))))))))))))))
* * 2-5 6-11 12-19 20-39 40-59 60 and older* *)))))) )))))) ))))))))))))))) ))))))))))))))) ))))))))))))))) )))))))))))))))
Statistic * All individuals * Males Males* age 2 and over * and and Males Females Males Females Males Females Males Females* *females females
)))))))))))))))))))))))))))))))))))))))))))))))))))))))))))))))))))))))))))))))))))))))))))))))))))))))))))))))))))))))))))))))))))
Number in sample 14,262 2,109 1,432 696 702 1,543 1,449 1,663 1,694 1,545 1,429
Percent of persons using ))))))))))))))))))))))))))))))))))))))))))))%)))))))))))))))))))))))))))))))))))))))))))))
at least once in 2 days 9.2 10.4 7.1 8.9 6.9 10.7 7.8 11.1 8.0 12.0 9.3 on 1 of 2 days 8.4 9.3 6.9 8.0 6.1 9.8 7.0 10.2 7.3 10.6 8.1 on both days 0.9 1.1 0.2 * 0.9 * 0.7 * 1.0 0.8 * 0.9 0.7 * 1.4 1.2
Quantity consumed per eating occasion ))))))))))))))))))))))))))))))))))))))))))))g)))))))))))))))))))))))))))))))))))))))))))))(1 large = 60 g)
Mean 76 59 72 103 66 89 74 83 66 73 64 SEM 2 4 5 9 4 4 3 3 3 4 5
5th percentile 24 17 * 26 * 28 * 24 * 28 * 23 * 29 * 21 * 30 * 19 * 10th percentile 33 24 38 * 34 * 33 * 33 38 38 24 33 28 * 25th percentile 44 38 42 68 46 * 51 43 55 40 46 40 50th percentile 77 44 67 91 70 80 77 85 64 76 60 75th percentile 89 77 85 128 82 * 107 87 91 85 85 83 90th percentile 127 101 120 * 182 * 91 * 148 110 128 111 106 93 * 95th percentile 149 131 * 154 * 227 * 97 * 183 * 147 * 147 * 121 * 128 * 132 *
)))))))))))))))))))))))))))))))))))))))))))))))))))))))))))))))))))))))))))))))))))))))))))))))))))))))))))))))))))))))))))))))))))
* Indicates a statistic that is potentially unreliable because of small sample size or large coefficient of variation.# Indicates a percentage that is greater than 0 but less than 0.05 or a mean, SEM, or percentile that is greater than 0 but less than 0.5.--- Indicates a percentile that could not be estimated.Note: See "Table notes."Source: USDA's Continuing Survey of Food Intakes by Individuals, 1994-96, 2 days.
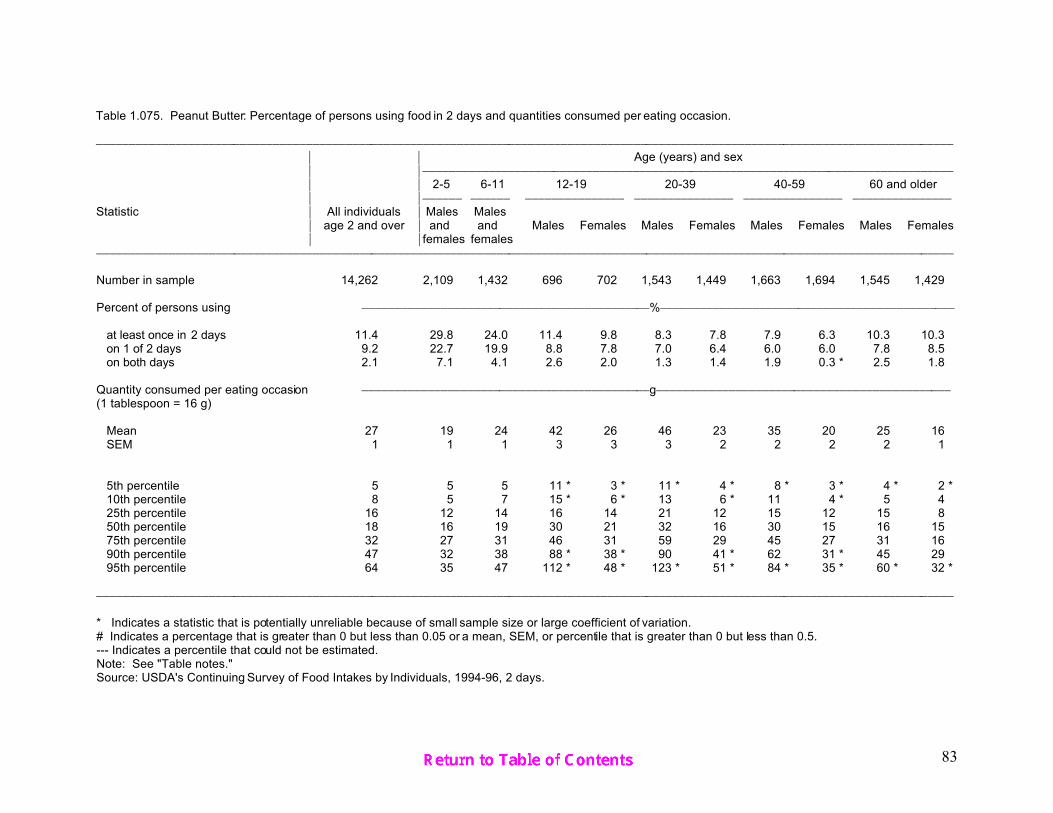
83
Table 1.075. Peanut Butter: Percentage of persons using food in 2 days and quantities consumed per eating occasion.
)))))))))))))))))))))))))))))))))))))))))))))))))))))))))))))))))))))))))))))))))))))))))))))))))))))))))))))))))))))))))))))))))))
* * Age (years) and sex* *)))))))))))))))))))))))))))))))))))))))))))))))))))))))))))))))))))))))))))))))))
* * 2-5 6-11 12-19 20-39 40-59 60 and older* *)))))) )))))) ))))))))))))))) ))))))))))))))) ))))))))))))))) )))))))))))))))
Statistic * All individuals * Males Males* age 2 and over * and and Males Females Males Females Males Females Males Females* *females females
)))))))))))))))))))))))))))))))))))))))))))))))))))))))))))))))))))))))))))))))))))))))))))))))))))))))))))))))))))))))))))))))))))
Number in sample 14,262 2,109 1,432 696 702 1,543 1,449 1,663 1,694 1,545 1,429
Percent of persons using ))))))))))))))))))))))))))))))))))))))))))))%)))))))))))))))))))))))))))))))))))))))))))))
at least once in 2 days 11.4 29.8 24.0 11.4 9.8 8.3 7.8 7.9 6.3 10.3 10.3 on 1 of 2 days 9.2 22.7 19.9 8.8 7.8 7.0 6.4 6.0 6.0 7.8 8.5 on both days 2.1 7.1 4.1 2.6 2.0 1.3 1.4 1.9 0.3 * 2.5 1.8
Quantity consumed per eating occasion ))))))))))))))))))))))))))))))))))))))))))))g)))))))))))))))))))))))))))))))))))))))))))))(1 tablespoon = 16 g)
Mean 27 19 24 42 26 46 23 35 20 25 16 SEM 1 1 1 3 3 3 2 2 2 2 1
5th percentile 5 5 5 11 * 3 * 11 * 4 * 8 * 3 * 4 * 2 * 10th percentile 8 5 7 15 * 6 * 13 6 * 11 4 * 5 4 25th percentile 16 12 14 16 14 21 12 15 12 15 8 50th percentile 18 16 19 30 21 32 16 30 15 16 15 75th percentile 32 27 31 46 31 59 29 45 27 31 16 90th percentile 47 32 38 88 * 38 * 90 41 * 62 31 * 45 29 95th percentile 64 35 47 112 * 48 * 123 * 51 * 84 * 35 * 60 * 32 *
)))))))))))))))))))))))))))))))))))))))))))))))))))))))))))))))))))))))))))))))))))))))))))))))))))))))))))))))))))))))))))))))))))
* Indicates a statistic that is potentially unreliable because of small sample size or large coefficient of variation.# Indicates a percentage that is greater than 0 but less than 0.05 or a mean, SEM, or percentile that is greater than 0 but less than 0.5.--- Indicates a percentile that could not be estimated.Note: See "Table notes."Source: USDA's Continuing Survey of Food Intakes by Individuals, 1994-96, 2 days.

84
Table 1.076. Coffee: Percentage of persons using food in 2 days and quantities consumed per eating occasion.
)))))))))))))))))))))))))))))))))))))))))))))))))))))))))))))))))))))))))))))))))))))))))))))))))))))))))))))))))))))))))))))))))))
* * Age (years) and sex* *)))))))))))))))))))))))))))))))))))))))))))))))))))))))))))))))))))))))))))))))))
* * 2-5 6-11 12-19 20-39 40-59 60 and older* *)))))) )))))) ))))))))))))))) ))))))))))))))) ))))))))))))))) )))))))))))))))
Statistic * All individuals * Males Males* age 2 and over * and and Males Females Males Females Males Females Males Females* *females females
)))))))))))))))))))))))))))))))))))))))))))))))))))))))))))))))))))))))))))))))))))))))))))))))))))))))))))))))))))))))))))))))))))
Number in sample 14,262 2,109 1,432 696 702 1,543 1,449 1,663 1,694 1,545 1,429
Percent of persons using ))))))))))))))))))))))))))))))))))))))))))))%)))))))))))))))))))))))))))))))))))))))))))))
at least once in 2 days 45.4 0.9 1.8 7.5 5.1 45.8 43.6 72.5 71.0 80.8 76.6 on 1 of 2 days 11.0 0.9 1.4 4.5 4.1 15.9 14.7 14.1 14.1 11.6 12.2 on both days 34.5 0.0 * 0.4 * 3.0 1.0 * 29.8 28.9 58.4 56.9 69.2 64.4
Quantity consumed per eating occasion ))))))))))))))))))))))))))))))))))))))))))))g)))))))))))))))))))))))))))))))))))))))))))))(8 fluid ounces = 237 g)
Mean 463 79 * 198 * 326 * 346 * 536 476 536 458 408 359 SEM 10 12 * 24 * 28 * 37 * 21 19 18 15 11 12
5th percentile 178 --- --- 123 * 96 * 195 177 184 178 175 178 10th percentile 218 --- 76 * 215 * 121 * 229 179 237 219 209 207 25th percentile 237 30 * 108 * 236 * 202 * 238 235 268 238 237 237 50th percentile 355 52 169 244 238 391 329 403 355 316 273 75th percentile 476 104 * 238 * 355 * 439 * 552 476 590 477 474 414 90th percentile 799 119 * 297 * 463 * 594 * 931 815 947 787 710 592 95th percentile 1,066 119 * --- 474 * --- 1,369 1,179 1,267 1,066 918 714
)))))))))))))))))))))))))))))))))))))))))))))))))))))))))))))))))))))))))))))))))))))))))))))))))))))))))))))))))))))))))))))))))))
* Indicates a statistic that is potentially unreliable because of small sample size or large coefficient of variation.# Indicates a percentage that is greater than 0 but less than 0.05 or a mean, SEM, or percentile that is greater than 0 but less than 0.5.--- Indicates a percentile that could not be estimated.Note: See "Table notes."Source: USDA's Continuing Survey of Food Intakes by Individuals, 1994-96, 2 days.

85
Table 1.077. Coffee, with Caffeine: Percentage of persons using food in 2 days and quantities consumed per eating occasion.
)))))))))))))))))))))))))))))))))))))))))))))))))))))))))))))))))))))))))))))))))))))))))))))))))))))))))))))))))))))))))))))))))))
* * Age (years) and sex* *)))))))))))))))))))))))))))))))))))))))))))))))))))))))))))))))))))))))))))))))))
* * 2-5 6-11 12-19 20-39 40-59 60 and older* *)))))) )))))) ))))))))))))))) ))))))))))))))) ))))))))))))))) )))))))))))))))
Statistic * All individuals * Males Males* age 2 and over * and and Males Females Males Females Males Females Males Females* *females females
)))))))))))))))))))))))))))))))))))))))))))))))))))))))))))))))))))))))))))))))))))))))))))))))))))))))))))))))))))))))))))))))))))
Number in sample 14,262 2,109 1,432 696 702 1,543 1,449 1,663 1,694 1,545 1,429
Percent of persons using ))))))))))))))))))))))))))))))))))))))))))))%)))))))))))))))))))))))))))))))))))))))))))))
at least once in 2 days 40.8 0.9 1.5 7.3 4.7 44.4 41.8 67.7 62.5 66.9 60.9 on 1 of 2 days 11.6 0.9 1.1 4.3 3.9 15.8 15.2 16.2 14.3 15.2 12.9 on both days 29.3 0.0 * 0.4 * 3.0 0.9 * 28.6 26.6 51.5 48.2 51.7 48.0
Quantity consumed per eating occasion ))))))))))))))))))))))))))))))))))))))))))))g)))))))))))))))))))))))))))))))))))))))))))))(8 fluid ounces = 237 g)
Mean 469 80 * 193 * 327 * 355 * 535 476 536 451 423 370 SEM 10 12 * 28 * 29 * 40 * 22 19 18 15 12 14
5th percentile 178 --- --- 123 * 95 * 179 177 178 177 177 177 10th percentile 217 --- 69 * 213 * 117 * 229 179 237 217 207 207 25th percentile 237 30 * 102 * 236 * 200 * 238 233 254 237 237 237 50th percentile 355 54 145 238 238 395 317 403 355 317 296 75th percentile 477 106 * 227 * 355 * 450 * 551 474 590 505 474 467 90th percentile 829 119 * 310 * 464 * 595 * 931 824 947 775 710 592 95th percentile 1,130 119 * --- 474 * --- 1,361 1,178 1,257 1,063 936 755
)))))))))))))))))))))))))))))))))))))))))))))))))))))))))))))))))))))))))))))))))))))))))))))))))))))))))))))))))))))))))))))))))))
* Indicates a statistic that is potentially unreliable because of small sample size or large coefficient of variation.# Indicates a percentage that is greater than 0 but less than 0.05 or a mean, SEM, or percentile that is greater than 0 but less than 0.5.--- Indicates a percentile that could not be estimated.Note: See "Table notes."Source: USDA's Continuing Survey of Food Intakes by Individuals, 1994-96, 2 days.

86
Table 1.078. Coffee, Decaffeinated: Percentage of persons using food in 2 days and quantities consumed per eating occasion.
)))))))))))))))))))))))))))))))))))))))))))))))))))))))))))))))))))))))))))))))))))))))))))))))))))))))))))))))))))))))))))))))))))
* * Age (years) and sex* *)))))))))))))))))))))))))))))))))))))))))))))))))))))))))))))))))))))))))))))))))
* * 2-5 6-11 12-19 20-39 40-59 60 and older* *)))))) )))))) ))))))))))))))) ))))))))))))))) ))))))))))))))) )))))))))))))))
Statistic * All individuals * Males Males* age 2 and over * and and Males Females Males Females Males Females Males Females* *females females
)))))))))))))))))))))))))))))))))))))))))))))))))))))))))))))))))))))))))))))))))))))))))))))))))))))))))))))))))))))))))))))))))))
Number in sample 14,262 2,109 1,432 696 702 1,543 1,449 1,663 1,694 1,545 1,429
Percent of persons using ))))))))))))))))))))))))))))))))))))))))))))%)))))))))))))))))))))))))))))))))))))))))))))
at least once in 2 days 8.8 # 0.3 * 0.2 * 0.5 * 3.0 4.8 12.6 15.5 24.0 25.9 on 1 of 2 days 4.2 # 0.3 * 0.2 * 0.5 * 1.9 3.5 6.6 7.4 8.5 10.5 on both days 4.6 0.0 * 0.0 * 0.0 * 0.0 * 1.1 1.4 6.0 8.1 15.5 15.4
Quantity consumed per eating occasion ))))))))))))))))))))))))))))))))))))))))))))g)))))))))))))))))))))))))))))))))))))))))))))(8 fluid ounces = 237 g)
Mean 360 59 * 227 * 296 * 237 * 382 * 380 417 393 334 310 SEM 12 0 * 29 * 0 * # 40 * 41 22 29 15 13
5th percentile 134 --- --- --- --- 131 * 118 * 133 * 133 150 125 10th percentile 178 --- --- --- --- 192 * 166 * 177 178 179 178 25th percentile 237 --- --- --- --- 237 * 226 224 232 237 237 50th percentile 253 --- --- --- --- 289 252 304 294 238 238 75th percentile 427 --- --- --- --- 376 * 462 477 474 385 355 90th percentile 592 --- --- --- --- 579 * 683 * 701 577 571 474 95th percentile 714 --- --- --- --- 837 * 892 * 966 * 930 701 684
)))))))))))))))))))))))))))))))))))))))))))))))))))))))))))))))))))))))))))))))))))))))))))))))))))))))))))))))))))))))))))))))))))
* Indicates a statistic that is potentially unreliable because of small sample size or large coefficient of variation.# Indicates a percentage that is greater than 0 but less than 0.05 or a mean, SEM, or percentile that is greater than 0 but less than 0.5.--- Indicates a percentile that could not be estimated.Note: See "Table notes."Source: USDA's Continuing Survey of Food Intakes by Individuals, 1994-96, 2 days.

87
Table 1.079. Tea: Percentage of persons using food in 2 days and quantities consumed per eating occasion.
)))))))))))))))))))))))))))))))))))))))))))))))))))))))))))))))))))))))))))))))))))))))))))))))))))))))))))))))))))))))))))))))))))
* * Age (years) and sex* *)))))))))))))))))))))))))))))))))))))))))))))))))))))))))))))))))))))))))))))))))
* * 2-5 6-11 12-19 20-39 40-59 60 and older* *)))))) )))))) ))))))))))))))) ))))))))))))))) ))))))))))))))) )))))))))))))))
Statistic * All individuals * Males Males* age 2 and over * and and Males Females Males Females Males Females Males Females* *females females
)))))))))))))))))))))))))))))))))))))))))))))))))))))))))))))))))))))))))))))))))))))))))))))))))))))))))))))))))))))))))))))))))))
Number in sample 14,262 2,109 1,432 696 702 1,543 1,449 1,663 1,694 1,545 1,429
Percent of persons using ))))))))))))))))))))))))))))))))))))))))))))%)))))))))))))))))))))))))))))))))))))))))))))
at least once in 2 days 31.8 13.2 15.0 21.6 26.1 31.9 38.4 35.8 42.4 32.2 40.1 on 1 of 2 days 17.2 9.8 10.1 16.0 17.4 17.8 22.6 18.5 20.8 13.6 15.3 on both days 14.6 3.4 4.9 5.6 8.6 14.1 15.8 17.3 21.6 18.6 24.8
Quantity consumed per eating occasion ))))))))))))))))))))))))))))))))))))))))))))g)))))))))))))))))))))))))))))))))))))))))))))(8 fluid ounces = 237 g)
Mean 397 198 247 498 361 533 391 440 375 355 310 SEM 10 7 9 43 40 25 11 20 13 12 10
5th percentile 118 61 65 * 116 * 106 * 171 144 140 105 125 133 10th percentile 177 83 117 211 158 236 186 187 173 172 172 25th percentile 237 121 181 237 221 321 236 237 236 237 225 50th percentile 323 177 234 370 293 450 318 354 296 295 237 75th percentile 474 236 295 539 412 621 474 474 450 420 354 90th percentile 709 305 383 952 553 894 678 741 630 559 472 95th percentile 930 372 450 * 1,350 * 702 * 1,061 927 947 848 700 608
)))))))))))))))))))))))))))))))))))))))))))))))))))))))))))))))))))))))))))))))))))))))))))))))))))))))))))))))))))))))))))))))))))
* Indicates a statistic that is potentially unreliable because of small sample size or large coefficient of variation.# Indicates a percentage that is greater than 0 but less than 0.05 or a mean, SEM, or percentile that is greater than 0 but less than 0.5.--- Indicates a percentile that could not be estimated.Note: See "Table notes."Source: USDA's Continuing Survey of Food Intakes by Individuals, 1994-96, 2 days.

88
Table 1.080. Soft Drinks: Percentage of persons using food in 2 days and quantities consumed per eating occasion.
)))))))))))))))))))))))))))))))))))))))))))))))))))))))))))))))))))))))))))))))))))))))))))))))))))))))))))))))))))))))))))))))))))
* * Age (years) and sex* *)))))))))))))))))))))))))))))))))))))))))))))))))))))))))))))))))))))))))))))))))
* * 2-5 6-11 12-19 20-39 40-59 60 and older* *)))))) )))))) ))))))))))))))) ))))))))))))))) ))))))))))))))) )))))))))))))))
Statistic * All individuals * Males Males* age 2 and over * and and Males Females Males Females Males Females Males Females* *females females
)))))))))))))))))))))))))))))))))))))))))))))))))))))))))))))))))))))))))))))))))))))))))))))))))))))))))))))))))))))))))))))))))))
Number in sample 14,262 2,109 1,432 696 702 1,543 1,449 1,663 1,694 1,545 1,429
Percent of persons using ))))))))))))))))))))))))))))))))))))))))))))%)))))))))))))))))))))))))))))))))))))))))))))
at least once in 2 days 66.3 52.5 62.0 83.8 78.3 81.0 74.2 68.6 64.7 43.2 38.9 on 1 of 2 days 29.9 33.6 35.9 30.7 32.9 30.2 31.5 31.5 28.2 22.6 21.2 on both days 36.4 18.9 26.1 53.0 45.4 50.8 42.7 37.1 36.5 20.6 17.7
Quantity consumed per eating occasion ))))))))))))))))))))))))))))))))))))))))))))g)))))))))))))))))))))))))))))))))))))))))))))(12 fluid ounces regular = 369 g)
Mean 423 224 329 523 411 527 445 441 373 350 317 SEM 6 5 6 20 10 13 10 9 5 6 5
5th percentile 184 92 132 248 199 309 238 231 186 179 125 10th percentile 237 122 183 310 247 340 248 248 238 186 180 25th percentile 310 147 245 370 312 370 335 355 300 248 240 50th percentile 370 186 322 429 372 416 372 371 359 360 332 75th percentile 459 269 372 577 454 578 478 475 372 372 368 90th percentile 648 368 491 825 596 824 653 654 496 477 432 95th percentile 861 372 614 991 759 991 917 927 653 613 494
)))))))))))))))))))))))))))))))))))))))))))))))))))))))))))))))))))))))))))))))))))))))))))))))))))))))))))))))))))))))))))))))))))
* Indicates a statistic that is potentially unreliable because of small sample size or large coefficient of variation.# Indicates a percentage that is greater than 0 but less than 0.05 or a mean, SEM, or percentile that is greater than 0 but less than 0.5.--- Indicates a percentile that could not be estimated.Note: See "Table notes."Source: USDA's Continuing Survey of Food Intakes by Individuals, 1994-96, 2 days.

89
Table 1.081. Soft Drinks, Not Diet, With Caffeine: Percentage of persons using food in 2 days and quantities consumed per eating occasion.
)))))))))))))))))))))))))))))))))))))))))))))))))))))))))))))))))))))))))))))))))))))))))))))))))))))))))))))))))))))))))))))))))))
* * Age (years) and sex* *)))))))))))))))))))))))))))))))))))))))))))))))))))))))))))))))))))))))))))))))))
* * 2-5 6-11 12-19 20-39 40-59 60 and older* *)))))) )))))) ))))))))))))))) ))))))))))))))) ))))))))))))))) )))))))))))))))
Statistic * All individuals * Males Males* age 2 and over * and and Males Females Males Females Males Females Males Females* *females females
)))))))))))))))))))))))))))))))))))))))))))))))))))))))))))))))))))))))))))))))))))))))))))))))))))))))))))))))))))))))))))))))))))
Number in sample 14,262 2,109 1,432 696 702 1,543 1,449 1,663 1,694 1,545 1,429
Percent of persons using ))))))))))))))))))))))))))))))))))))))))))))%)))))))))))))))))))))))))))))))))))))))))))))
at least once in 2 days 41.2 30.8 39.6 70.0 60.4 61.9 44.5 38.7 29.4 19.0 13.7 on 1 of 2 days 22.9 22.9 28.2 34.1 32.2 29.4 23.8 22.3 16.7 12.3 9.0 on both days 18.3 7.9 11.4 35.9 28.1 32.5 20.7 16.4 12.7 6.7 4.7
Quantity consumed per eating occasion ))))))))))))))))))))))))))))))))))))))))))))g)))))))))))))))))))))))))))))))))))))))))))))(12 fluid ounces = 369 g)
Mean 442 225 327 537 423 534 440 465 375 366 347 SEM 7 6 7 22 11 15 12 13 9 8 10
5th percentile 185 84 118 243 186 310 179 239 169 185 185 * 10th percentile 247 116 166 318 247 346 228 278 247 246 186 25th percentile 331 124 247 372 337 372 340 369 280 296 247 50th percentile 372 186 323 433 371 433 372 372 371 371 363 75th percentile 495 268 372 581 471 577 455 495 372 372 372 90th percentile 680 371 493 830 600 863 662 670 495 493 493 95th percentile 926 393 554 1,052 800 991 924 985 651 613 496 *
)))))))))))))))))))))))))))))))))))))))))))))))))))))))))))))))))))))))))))))))))))))))))))))))))))))))))))))))))))))))))))))))))))
* Indicates a statistic that is potentially unreliable because of small sample size or large coefficient of variation.# Indicates a percentage that is greater than 0 but less than 0.05 or a mean, SEM, or percentile that is greater than 0 but less than 0.5.--- Indicates a percentile that could not be estimated.Note: See "Table notes."Source: USDA's Continuing Survey of Food Intakes by Individuals, 1994-96, 2 days.

90
Table 1.082. Soft Drinks, Not Diet, Caffeine-Free: Percentage of persons using food in 2 days and quantities consumed per eating occasion.
)))))))))))))))))))))))))))))))))))))))))))))))))))))))))))))))))))))))))))))))))))))))))))))))))))))))))))))))))))))))))))))))))))
* * Age (years) and sex* *)))))))))))))))))))))))))))))))))))))))))))))))))))))))))))))))))))))))))))))))))
* * 2-5 6-11 12-19 20-39 40-59 60 and older* *)))))) )))))) ))))))))))))))) ))))))))))))))) ))))))))))))))) )))))))))))))))
Statistic * All individuals * Males Males* age 2 and over * and and Males Females Males Females Males Females Males Females* *females females
)))))))))))))))))))))))))))))))))))))))))))))))))))))))))))))))))))))))))))))))))))))))))))))))))))))))))))))))))))))))))))))))))))
Number in sample 14,262 2,109 1,432 696 702 1,543 1,449 1,663 1,694 1,545 1,429
Percent of persons using ))))))))))))))))))))))))))))))))))))))))))))%)))))))))))))))))))))))))))))))))))))))))))))
at least once in 2 days 21.3 25.5 30.0 32.1 28.2 23.6 22.5 18.5 16.1 10.7 11.2 on 1 of 2 days 16.8 21.2 22.9 22.5 23.5 19.8 17.7 13.8 12.8 7.8 8.6 on both days 4.6 4.3 7.2 9.6 4.7 3.8 4.7 4.7 3.3 2.9 2.6
Quantity consumed per eating occasion ))))))))))))))))))))))))))))))))))))))))))))g)))))))))))))))))))))))))))))))))))))))))))))(12 fluid ounces = 369 g)
Mean 389 231 328 488 391 486 414 398 344 311 293 SEM 6 7 8 18 13 20 15 16 11 9 9
5th percentile 151 92 123 236 * 184 * 244 183 183 113 145 * 122 * 10th percentile 184 123 180 305 245 278 228 218 184 182 170 25th percentile 246 151 245 368 306 368 301 308 244 222 210 50th percentile 368 190 314 370 368 369 368 368 367 318 305 75th percentile 372 277 369 491 430 492 489 372 369 369 368 90th percentile 614 368 491 741 556 738 568 589 490 372 370 95th percentile 739 370 614 982 * 675 * 989 743 739 613 491 * 422 *
)))))))))))))))))))))))))))))))))))))))))))))))))))))))))))))))))))))))))))))))))))))))))))))))))))))))))))))))))))))))))))))))))))
* Indicates a statistic that is potentially unreliable because of small sample size or large coefficient of variation.# Indicates a percentage that is greater than 0 but less than 0.05 or a mean, SEM, or percentile that is greater than 0 but less than 0.5.--- Indicates a percentile that could not be estimated.Note: See "Table notes."Source: USDA's Continuing Survey of Food Intakes by Individuals, 1994-96, 2 days.

91
Table 1.083. Soft Drinks, Diet, With Caffeine: Percentage of persons using food in 2 days and quantities consumed per eating occasion.
)))))))))))))))))))))))))))))))))))))))))))))))))))))))))))))))))))))))))))))))))))))))))))))))))))))))))))))))))))))))))))))))))))
* * Age (years) and sex* *)))))))))))))))))))))))))))))))))))))))))))))))))))))))))))))))))))))))))))))))))
* * 2-5 6-11 12-19 20-39 40-59 60 and older* *)))))) )))))) ))))))))))))))) ))))))))))))))) ))))))))))))))) )))))))))))))))
Statistic * All individuals * Males Males* age 2 and over * and and Males Females Males Females Males Females Males Females* *females females
)))))))))))))))))))))))))))))))))))))))))))))))))))))))))))))))))))))))))))))))))))))))))))))))))))))))))))))))))))))))))))))))))))
Number in sample 14,262 2,109 1,432 696 702 1,543 1,449 1,663 1,694 1,545 1,429
Percent of persons using ))))))))))))))))))))))))))))))))))))))))))))%)))))))))))))))))))))))))))))))))))))))))))))
at least once in 2 days 12.6 4.0 5.7 4.3 8.8 12.4 17.3 16.1 21.3 11.4 10.4 on 1 of 2 days 7.6 3.3 4.4 3.4 5.4 6.7 10.1 9.1 12.3 7.6 7.1 on both days 5.0 0.7 1.4 0.8 * 3.4 5.6 7.1 7.1 8.9 3.7 3.3
Quantity consumed per eating occasion ))))))))))))))))))))))))))))))))))))))))))))g)))))))))))))))))))))))))))))))))))))))))))))(12 fluid ounces = 355 g)
Mean 420 217 297 445 * 367 511 474 442 391 357 301 SEM 8 11 19 33 * 16 30 21 15 11 10 11
5th percentile 179 86 * 66 * 266 * 198 * 237 * 231 * 240 * 239 179 * 105 * 10th percentile 239 99 * 141 * 307 * 226 * 299 298 299 267 237 128 25th percentile 352 149 180 357 * 299 359 358 355 328 292 210 50th percentile 359 179 272 359 358 360 359 359 359 358 329 75th percentile 420 239 355 525 * 360 536 479 478 360 359 359 90th percentile 660 357 * 390 * 658 * 453 * 903 714 701 513 475 360 95th percentile 870 360 * 478 * 703 * 699 * 1,084 * 958 * 891 * 700 599 * 478 *
)))))))))))))))))))))))))))))))))))))))))))))))))))))))))))))))))))))))))))))))))))))))))))))))))))))))))))))))))))))))))))))))))))
* Indicates a statistic that is potentially unreliable because of small sample size or large coefficient of variation.# Indicates a percentage that is greater than 0 but less than 0.05 or a mean, SEM, or percentile that is greater than 0 but less than 0.5.--- Indicates a percentile that could not be estimated.Note: See "Table notes."Source: USDA's Continuing Survey of Food Intakes by Individuals, 1994-96, 2 days.

92
Table 1.084. Soft Drinks, Diet, Caffeine-Free: Percentage of persons using food in 2 days and quantities consumed per eating occasion.
)))))))))))))))))))))))))))))))))))))))))))))))))))))))))))))))))))))))))))))))))))))))))))))))))))))))))))))))))))))))))))))))))))
* * Age (years) and sex* *)))))))))))))))))))))))))))))))))))))))))))))))))))))))))))))))))))))))))))))))))
* * 2-5 6-11 12-19 20-39 40-59 60 and older* *)))))) )))))) ))))))))))))))) ))))))))))))))) ))))))))))))))) )))))))))))))))
Statistic * All individuals * Males Males* age 2 and over * and and Males Females Males Females Males Females Males Females* *females females
)))))))))))))))))))))))))))))))))))))))))))))))))))))))))))))))))))))))))))))))))))))))))))))))))))))))))))))))))))))))))))))))))))
Number in sample 14,262 2,109 1,432 696 702 1,543 1,449 1,663 1,694 1,545 1,429
Percent of persons using ))))))))))))))))))))))))))))))))))))))))))))%)))))))))))))))))))))))))))))))))))))))))))))
at least once in 2 days 8.1 3.2 5.1 4.4 4.6 5.0 9.6 11.5 13.8 9.2 9.2 on 1 of 2 days 5.7 2.8 4.4 3.9 4.3 3.7 6.9 8.0 8.8 5.7 5.5 on both days 2.4 0.4 * 0.7 * 0.5 * 0.3 * 1.2 2.8 3.5 5.0 3.5 3.8
Quantity consumed per eating occasion ))))))))))))))))))))))))))))))))))))))))))))g)))))))))))))))))))))))))))))))))))))))))))))(12 fluid ounces = 355 g)
Mean 368 191 301 368 * 306 * 456 398 381 382 344 301 SEM 8 10 20 27 * 22 * 37 18 20 13 18 9
5th percentile 133 87 * 117 * 169 * --- 185 * 194 * 115 * 174 * 121 * 120 * 10th percentile 180 102 * 120 * 221 * --- 240 * 237 226 232 179 178 25th percentile 259 119 180 296 * 202 * 355 299 299 296 237 214 50th percentile 355 178 257 355 355 358 355 355 355 354 335 75th percentile 360 214 355 355 * 356 * 461 360 360 360 359 358 90th percentile 526 342 * 465 * 483 * 360 * 658 * 538 475 523 474 360 95th percentile 707 359 * 539 * 599 * 447 * 982 * 749 * 756 * 710 * 545 * 430 *
)))))))))))))))))))))))))))))))))))))))))))))))))))))))))))))))))))))))))))))))))))))))))))))))))))))))))))))))))))))))))))))))))))
* Indicates a statistic that is potentially unreliable because of small sample size or large coefficient of variation.# Indicates a percentage that is greater than 0 but less than 0.05 or a mean, SEM, or percentile that is greater than 0 but less than 0.5.--- Indicates a percentile that could not be estimated.Note: See "Table notes."Source: USDA's Continuing Survey of Food Intakes by Individuals, 1994-96, 2 days.

93
Table 1.085. Fruit Drinks: Percentage of persons using food in 2 days and quantities consumed per eating occasion.
)))))))))))))))))))))))))))))))))))))))))))))))))))))))))))))))))))))))))))))))))))))))))))))))))))))))))))))))))))))))))))))))))))
* * Age (years) and sex* *)))))))))))))))))))))))))))))))))))))))))))))))))))))))))))))))))))))))))))))))))
* * 2-5 6-11 12-19 20-39 40-59 60 and older* *)))))) )))))) ))))))))))))))) ))))))))))))))) ))))))))))))))) )))))))))))))))
Statistic * All individuals * Males Males* age 2 and over * and and Males Females Males Females Males Females Males Females* *females females
)))))))))))))))))))))))))))))))))))))))))))))))))))))))))))))))))))))))))))))))))))))))))))))))))))))))))))))))))))))))))))))))))))
Number in sample 14,262 2,109 1,432 696 702 1,543 1,449 1,663 1,694 1,545 1,429
Percent of persons using ))))))))))))))))))))))))))))))))))))))))))))%)))))))))))))))))))))))))))))))))))))))))))))
at least once in 2 days 28.3 52.0 52.0 42.0 41.1 25.1 24.9 21.0 17.7 14.7 16.1 on 1 of 2 days 19.8 30.5 32.8 27.2 29.2 19.4 19.1 16.6 13.9 9.2 10.2 on both days 8.5 21.5 19.2 14.8 11.9 5.7 5.9 4.3 3.8 5.5 5.9
Quantity consumed per eating occasion ))))))))))))))))))))))))))))))))))))))))))))g)))))))))))))))))))))))))))))))))))))))))))))(8 fluid ounces = 248 g)
Mean 373 235 290 489 386 512 394 467 321 323 256 SEM 8 5 5 19 19 24 19 37 18 23 9
5th percentile 124 95 125 216 185 187 165 150 123 113 * 122 * 10th percentile 180 122 169 240 187 236 196 235 125 126 125 25th percentile 240 166 209 264 248 309 248 249 191 190 186 50th percentile 287 219 250 412 311 459 320 372 250 249 247 75th percentile 477 250 339 549 476 561 486 498 372 371 295 90th percentile 620 372 478 820 595 947 683 743 498 493 372 95th percentile 925 478 515 993 803 1,005 948 1,169 618 843 * 435 *
)))))))))))))))))))))))))))))))))))))))))))))))))))))))))))))))))))))))))))))))))))))))))))))))))))))))))))))))))))))))))))))))))))
* Indicates a statistic that is potentially unreliable because of small sample size or large coefficient of variation.# Indicates a percentage that is greater than 0 but less than 0.05 or a mean, SEM, or percentile that is greater than 0 but less than 0.5.--- Indicates a percentile that could not be estimated.Note: See "Table notes."Source: USDA's Continuing Survey of Food Intakes by Individuals, 1994-96, 2 days.

94
Table 1.086. Beer: Percentage of persons using food in 2 days and quantities consumed per eating occasion.
)))))))))))))))))))))))))))))))))))))))))))))))))))))))))))))))))))))))))))))))))))))))))))))))))))))))))))))))))))))))))))))))))))
* * Age (years) and sex* *)))))))))))))))))))))))))))))))))))))))))))))))))))))))))))))))))))))))))))))))))
* * 2-5 6-11 12-19 20-39 40-59 60 and older* *)))))) )))))) ))))))))))))))) ))))))))))))))) ))))))))))))))) )))))))))))))))
Statistic * All individuals * Males Males* age 2 and over * and and Males Females Males Females Males Females Males Females* *females females
)))))))))))))))))))))))))))))))))))))))))))))))))))))))))))))))))))))))))))))))))))))))))))))))))))))))))))))))))))))))))))))))))))
Number in sample 14,262 2,109 1,432 696 702 1,543 1,449 1,663 1,694 1,545 1,429
Percent of persons using ))))))))))))))))))))))))))))))))))))))))))))%)))))))))))))))))))))))))))))))))))))))))))))
at least once in 2 days 10.9 0.0 * 0.1 * 3.4 1.8 * 28.7 9.2 22.5 6.5 11.3 2.4 on 1 of 2 days 7.5 0.0 * 0.1 * 2.3 1.8 * 19.3 7.3 14.5 5.0 6.4 1.9 on both days 3.4 0.0 * 0.0 * 1.1 * 0.0 * 9.4 1.9 8.0 1.4 4.9 0.4 *
Quantity consumed per eating occasion ))))))))))))))))))))))))))))))))))))))))))))g)))))))))))))))))))))))))))))))))))))))))))))(12 fluid ounces = 360 g)
Mean 885 --- 15 * 1,382 * 579 * 1,021 741 868 633 719 461 * SEM 32 --- 0 * 348 * 161 * 55 63 45 64 65 43 *
5th percentile 315 --- --- --- --- 324 153 * 342 156 * 250 * 149 * 10th percentile 360 --- --- --- 183 * 331 240 345 326 * 333 200 * 25th percentile 360 --- --- --- 231 * 353 360 356 340 344 330 * 50th percentile 677 --- --- 769 310 704 523 662 357 441 345 75th percentile 1,069 --- --- 1,258 * 583 * 1,183 889 947 703 718 399 * 90th percentile 1,794 --- --- 3,791 * 711 * 2,133 1,385 1,686 1,372 * 1,344 794 * 95th percentile 2,371 --- --- --- --- 2,779 1,900 * 2,144 1,727 * 1,952 * 1,045 *
)))))))))))))))))))))))))))))))))))))))))))))))))))))))))))))))))))))))))))))))))))))))))))))))))))))))))))))))))))))))))))))))))))
* Indicates a statistic that is potentially unreliable because of small sample size or large coefficient of variation.# Indicates a percentage that is greater than 0 but less than 0.05 or a mean, SEM, or percentile that is greater than 0 but less than 0.5.--- Indicates a percentile that could not be estimated.Note: See "Table notes."Source: USDA's Continuing Survey of Food Intakes by Individuals, 1994-96, 2 days.

95
Table 1.087. Wine: Percentage of persons using food in 2 days and quantities consumed per eating occasion.
)))))))))))))))))))))))))))))))))))))))))))))))))))))))))))))))))))))))))))))))))))))))))))))))))))))))))))))))))))))))))))))))))))
* * Age (years) and sex* *)))))))))))))))))))))))))))))))))))))))))))))))))))))))))))))))))))))))))))))))))
* * 2-5 6-11 12-19 20-39 40-59 60 and older* *)))))) )))))) ))))))))))))))) ))))))))))))))) ))))))))))))))) )))))))))))))))
Statistic * All individuals * Males Males* age 2 and over * and and Males Females Males Females Males Females Males Females* *females females
)))))))))))))))))))))))))))))))))))))))))))))))))))))))))))))))))))))))))))))))))))))))))))))))))))))))))))))))))))))))))))))))))))
Number in sample 14,262 2,109 1,432 696 702 1,543 1,449 1,663 1,694 1,545 1,429
Percent of persons using ))))))))))))))))))))))))))))))))))))))))))))%)))))))))))))))))))))))))))))))))))))))))))))
at least once in 2 days 5.3 0.0 * 0.0 * 0.3 * 0.4 * 4.9 6.1 8.6 9.4 9.5 6.8 on 1 of 2 days 3.7 0.0 * 0.0 * 0.3 * 0.4 * 4.0 4.7 6.2 6.8 6.3 3.1 on both days 1.6 0.0 * 0.0 * 0.0 * 0.0 * 0.9 1.5 2.4 2.6 3.2 3.7
Quantity consumed per eating occasion ))))))))))))))))))))))))))))))))))))))))))))g)))))))))))))))))))))))))))))))))))))))))))))(3 1/2 fluid ounces = 103 g)
Mean 240 --- --- 154 * 291 * 279 264 243 234 210 188 SEM 8 --- --- 2 * 59 * 22 20 12 14 16 17
5th percentile 59 --- --- --- --- 92 * 85 * 75 * 45 * 34 * --- 10th percentile 99 --- --- --- --- 111 * 111 * 91 101 82 * 46 * 25th percentile 141 --- --- --- --- 165 152 129 126 114 103 50th percentile 197 --- --- --- --- 216 225 196 186 177 143 75th percentile 296 --- --- --- --- 312 329 317 288 231 221 90th percentile 465 --- --- --- --- 472 * 429 * 452 453 344 * 332 * 95th percentile 518 --- --- --- --- 584 * 546 * 471 * 471 * 491 * 406 *
)))))))))))))))))))))))))))))))))))))))))))))))))))))))))))))))))))))))))))))))))))))))))))))))))))))))))))))))))))))))))))))))))))
* Indicates a statistic that is potentially unreliable because of small sample size or large coefficient of variation.# Indicates a percentage that is greater than 0 but less than 0.05 or a mean, SEM, or percentile that is greater than 0 but less than 0.5.--- Indicates a percentile that could not be estimated.Note: See "Table notes."Source: USDA's Continuing Survey of Food Intakes by Individuals, 1994-96, 2 days.

96
Table 1.088. Soups: Percentage of persons using food in 2 days and quantities consumed per eating occasion.
)))))))))))))))))))))))))))))))))))))))))))))))))))))))))))))))))))))))))))))))))))))))))))))))))))))))))))))))))))))))))))))))))))
* * Age (years) and sex* *)))))))))))))))))))))))))))))))))))))))))))))))))))))))))))))))))))))))))))))))))
* * 2-5 6-11 12-19 20-39 40-59 60 and older* *)))))) )))))) ))))))))))))))) ))))))))))))))) ))))))))))))))) )))))))))))))))
Statistic * All individuals * Males Males* age 2 and over * and and Males Females Males Females Males Females Males Females* *females females
)))))))))))))))))))))))))))))))))))))))))))))))))))))))))))))))))))))))))))))))))))))))))))))))))))))))))))))))))))))))))))))))))))
Number in sample 14,262 2,109 1,432 696 702 1,543 1,449 1,663 1,694 1,545 1,429
Percent of persons using ))))))))))))))))))))))))))))))))))))))))))))%)))))))))))))))))))))))))))))))))))))))))))))
at least once in 2 days 22.1 23.7 17.6 17.2 17.2 18.5 21.4 22.7 22.9 30.2 31.3 on 1 of 2 days 18.3 19.5 15.3 15.3 15.0 15.6 17.4 17.9 19.8 23.6 25.1 on both days 3.8 4.2 2.3 1.9 2.1 2.9 4.0 4.8 3.1 6.5 6.2
Quantity consumed per eating occasion ))))))))))))))))))))))))))))))))))))))))))))g)))))))))))))))))))))))))))))))))))))))))))))(1 cup, chunky chicken noodle = 240 g)
Mean 369 238 314 462 384 450 362 403 346 391 329 SEM 5 8 18 27 23 18 11 13 11 9 7
5th percentile 118 74 61 * 148 * 120 * 177 118 161 117 168 77 10th percentile 165 105 120 217 * 122 237 184 228 152 230 164 25th percentile 241 121 227 290 241 247 244 244 241 244 241 50th percentile 358 238 247 461 364 422 358 361 348 361 303 75th percentile 482 301 427 541 483 524 479 484 480 482 426 90th percentile 593 414 492 723 * 599 749 512 608 499 596 487 95th percentile 723 481 584 * 933 * 722 * 930 619 754 593 722 585
)))))))))))))))))))))))))))))))))))))))))))))))))))))))))))))))))))))))))))))))))))))))))))))))))))))))))))))))))))))))))))))))))))
* Indicates a statistic that is potentially unreliable because of small sample size or large coefficient of variation.# Indicates a percentage that is greater than 0 but less than 0.05 or a mean, SEM, or percentile that is greater than 0 but less than 0.5.--- Indicates a percentile that could not be estimated.Note: See "Table notes."Source: USDA's Continuing Survey of Food Intakes by Individuals, 1994-96, 2 days.

97
Table 1.089. Potato Chips: Percentage of persons using food in 2 days and quantities consumed per eating occasion.
)))))))))))))))))))))))))))))))))))))))))))))))))))))))))))))))))))))))))))))))))))))))))))))))))))))))))))))))))))))))))))))))))))
* * Age (years) and sex* *)))))))))))))))))))))))))))))))))))))))))))))))))))))))))))))))))))))))))))))))))
* * 2-5 6-11 12-19 20-39 40-59 60 and older* *)))))) )))))) ))))))))))))))) ))))))))))))))) ))))))))))))))) )))))))))))))))
Statistic * All individuals * Males Males* age 2 and over * and and Males Females Males Females Males Females Males Females* *females females
)))))))))))))))))))))))))))))))))))))))))))))))))))))))))))))))))))))))))))))))))))))))))))))))))))))))))))))))))))))))))))))))))))
Number in sample 14,262 2,109 1,432 696 702 1,543 1,449 1,663 1,694 1,545 1,429
Percent of persons using ))))))))))))))))))))))))))))))))))))))))))))%)))))))))))))))))))))))))))))))))))))))))))))
at least once in 2 days 17.1 23.8 25.0 20.2 20.7 20.1 16.0 16.9 14.8 8.8 6.7 on 1 of 2 days 14.7 20.4 20.9 16.8 18.2 17.3 14.4 14.6 12.2 7.7 5.8 on both days 2.4 3.4 4.1 3.5 2.5 2.8 1.6 2.3 2.6 1.2 0.9
Quantity consumed per eating occasion ))))))))))))))))))))))))))))))))))))))))))))g)))))))))))))))))))))))))))))))))))))))))))))(10 chips = 14 g)
Mean 39 24 29 52 37 57 38 43 35 29 22 SEM 1 1 2 5 3 5 3 3 3 3 2
5th percentile 8 6 7 10 * 9 * 14 10 * 10 8 * 7 * 4 * 10th percentile 10 8 10 18 14 20 10 14 10 9 6 * 25th percentile 20 10 14 27 20 25 19 20 14 15 10 50th percentile 27 19 20 38 28 39 23 28 21 20 19 75th percentile 40 27 30 57 40 57 40 44 36 29 25 90th percentile 80 40 54 108 68 110 79 84 72 56 41 * 95th percentile 111 57 79 122 * 96 * 166 109 * 117 110 * 70 * 56 *
)))))))))))))))))))))))))))))))))))))))))))))))))))))))))))))))))))))))))))))))))))))))))))))))))))))))))))))))))))))))))))))))))))
* Indicates a statistic that is potentially unreliable because of small sample size or large coefficient of variation.# Indicates a percentage that is greater than 0 but less than 0.05 or a mean, SEM, or percentile that is greater than 0 but less than 0.5.--- Indicates a percentile that could not be estimated.Note: See "Table notes."Source: USDA's Continuing Survey of Food Intakes by Individuals, 1994-96, 2 days.

98
Table 1.090. Corn Chips: Percentage of persons using food in 2 days and quantities consumed per eating occasion.
)))))))))))))))))))))))))))))))))))))))))))))))))))))))))))))))))))))))))))))))))))))))))))))))))))))))))))))))))))))))))))))))))))
* * Age (years) and sex* *)))))))))))))))))))))))))))))))))))))))))))))))))))))))))))))))))))))))))))))))))
* * 2-5 6-11 12-19 20-39 40-59 60 and older* *)))))) )))))) ))))))))))))))) ))))))))))))))) ))))))))))))))) )))))))))))))))
Statistic * All individuals * Males Males* age 2 and over * and and Males Females Males Females Males Females Males Females* *females females
)))))))))))))))))))))))))))))))))))))))))))))))))))))))))))))))))))))))))))))))))))))))))))))))))))))))))))))))))))))))))))))))))))
Number in sample 14,262 2,109 1,432 696 702 1,543 1,449 1,663 1,694 1,545 1,429
Percent of persons using ))))))))))))))))))))))))))))))))))))))))))))%)))))))))))))))))))))))))))))))))))))))))))))
at least once in 2 days 16.0 19.6 25.6 26.9 25.1 16.2 17.9 12.8 12.0 4.8 5.3 on 1 of 2 days 14.0 17.3 21.6 24.7 19.9 13.8 16.1 11.3 11.0 4.3 4.7 on both days 2.0 2.3 3.9 2.2 5.2 2.4 1.8 1.5 1.0 0.5 * 0.6 *
Quantity consumed per eating occasion ))))))))))))))))))))))))))))))))))))))))))))g)))))))))))))))))))))))))))))))))))))))))))))(1 cup = 26 g)
Mean 42 29 33 58 44 61 35 47 33 30 21 SEM 1 2 2 5 3 5 2 4 2 3 2
5th percentile 8 6 5 13 * 7 * 13 * 7 * 11 * 7 * 7 * 5 * 10th percentile 11 9 9 17 13 18 9 13 9 11 * 7 * 25th percentile 18 13 18 26 26 26 17 21 18 14 11 50th percentile 28 18 26 39 30 43 26 31 26 25 17 75th percentile 52 32 36 64 52 70 43 52 39 35 26 90th percentile 80 59 56 104 85 111 67 80 64 52 * 39 * 95th percentile 109 75 77 151 * 108 * 167 * 84 * 107 * 70 * 62 * 46 *
)))))))))))))))))))))))))))))))))))))))))))))))))))))))))))))))))))))))))))))))))))))))))))))))))))))))))))))))))))))))))))))))))))
* Indicates a statistic that is potentially unreliable because of small sample size or large coefficient of variation.# Indicates a percentage that is greater than 0 but less than 0.05 or a mean, SEM, or percentile that is greater than 0 but less than 0.5.--- Indicates a percentile that could not be estimated.Note: See "Table notes."Source: USDA's Continuing Survey of Food Intakes by Individuals, 1994-96, 2 days.

99
Table 1.091. Popcorn: Percentage of persons using food in 2 days and quantities consumed per eating occasion.
)))))))))))))))))))))))))))))))))))))))))))))))))))))))))))))))))))))))))))))))))))))))))))))))))))))))))))))))))))))))))))))))))))
* * Age (years) and sex* *)))))))))))))))))))))))))))))))))))))))))))))))))))))))))))))))))))))))))))))))))
* * 2-5 6-11 12-19 20-39 40-59 60 and older* *)))))) )))))) ))))))))))))))) ))))))))))))))) ))))))))))))))) )))))))))))))))
Statistic * All individuals * Males Males* age 2 and over * and and Males Females Males Females Males Females Males Females* *females females
)))))))))))))))))))))))))))))))))))))))))))))))))))))))))))))))))))))))))))))))))))))))))))))))))))))))))))))))))))))))))))))))))))
Number in sample 14,262 2,109 1,432 696 702 1,543 1,449 1,663 1,694 1,545 1,429
Percent of persons using ))))))))))))))))))))))))))))))))))))))))))))%)))))))))))))))))))))))))))))))))))))))))))))
at least once in 2 days 9.5 11.6 12.7 7.8 10.5 8.1 9.7 9.6 10.9 6.1 7.6 on 1 of 2 days 8.7 10.9 11.3 7.4 9.6 7.6 9.0 9.0 10.0 5.6 6.9 on both days 0.7 0.7 1.4 0.4 * 0.9 * 0.5 * 0.7 * 0.6 * 1.0 0.5 * 0.8 *
Quantity consumed per eating occasion ))))))))))))))))))))))))))))))))))))))))))))g)))))))))))))))))))))))))))))))))))))))))))))(1 cup unbuttered popcorn = 11 g)
Mean 41 20 31 54 37 63 35 50 39 52 34 SEM 1 1 2 5 4 6 2 4 3 4 3
5th percentile 7 4 * 6 * 10 * 6 * 11 * 6 * 8 * 6 * 12 * 7 * 10th percentile 11 6 11 14 * 8 * 15 * 10 13 11 15 * 9 * 25th percentile 18 9 14 22 17 28 18 22 17 28 15 50th percentile 29 14 23 51 28 42 28 39 30 43 24 75th percentile 53 28 36 70 44 84 42 66 44 63 44 90th percentile 87 33 57 86 * 74 * 99 * 66 87 85 88 * 74 * 95th percentile 99 43 * 74 * 108 * 93 * 150 * 85 * 102 * 101 * 135 * 84 *
)))))))))))))))))))))))))))))))))))))))))))))))))))))))))))))))))))))))))))))))))))))))))))))))))))))))))))))))))))))))))))))))))))
* Indicates a statistic that is potentially unreliable because of small sample size or large coefficient of variation.# Indicates a percentage that is greater than 0 but less than 0.05 or a mean, SEM, or percentile that is greater than 0 but less than 0.5.--- Indicates a percentile that could not be estimated.Note: See "Table notes."Source: USDA's Continuing Survey of Food Intakes by Individuals, 1994-96, 2 days.

100
Table 1.092. Prepared Mustard: Percentage of persons using food in 2 days and quantities consumed per eating occasion.
)))))))))))))))))))))))))))))))))))))))))))))))))))))))))))))))))))))))))))))))))))))))))))))))))))))))))))))))))))))))))))))))))))
* * Age (years) and sex* *)))))))))))))))))))))))))))))))))))))))))))))))))))))))))))))))))))))))))))))))))
* * 2-5 6-11 12-19 20-39 40-59 60 and older* *)))))) )))))) ))))))))))))))) ))))))))))))))) ))))))))))))))) )))))))))))))))
Statistic * All individuals * Males Males* age 2 and over * and and Males Females Males Females Males Females Males Females* *females females
)))))))))))))))))))))))))))))))))))))))))))))))))))))))))))))))))))))))))))))))))))))))))))))))))))))))))))))))))))))))))))))))))))
Number in sample 14,262 2,109 1,432 696 702 1,543 1,449 1,663 1,694 1,545 1,429
Percent of persons using ))))))))))))))))))))))))))))))))))))))))))))%)))))))))))))))))))))))))))))))))))))))))))))
at least once in 2 days 22.2 16.6 21.0 27.8 20.6 29.7 21.6 25.5 18.3 19.9 15.5 on 1 of 2 days 18.9 14.7 17.6 23.1 18.5 24.5 18.9 21.3 16.3 16.4 13.7 on both days 3.3 1.9 3.4 4.7 2.2 5.2 2.7 4.2 2.0 3.4 1.8
Quantity consumed per eating occasion ))))))))))))))))))))))))))))))))))))))))))))g)))))))))))))))))))))))))))))))))))))))))))))(1 teaspoon = 5 g)
Mean 8 4 6 11 7 10 7 10 6 7 5 SEM # # # 1 1 1 # 1 # # #
5th percentile 1 1 1 3 * 1 * 3 1 2 1 1 1 * 10th percentile 2 1 2 3 2 4 2 3 2 2 1 25th percentile 4 2 3 5 4 5 4 5 3 3 3 50th percentile 5 3 5 8 5 7 5 6 5 5 5 75th percentile 9 5 5 10 8 10 9 10 6 6 5 90th percentile 16 5 10 21 15 16 16 16 16 16 9 95th percentile 21 8 16 29 * 16 * 31 16 30 16 16 15 *
)))))))))))))))))))))))))))))))))))))))))))))))))))))))))))))))))))))))))))))))))))))))))))))))))))))))))))))))))))))))))))))))))))
* Indicates a statistic that is potentially unreliable because of small sample size or large coefficient of variation.# Indicates a percentage that is greater than 0 but less than 0.05 or a mean, SEM, or percentile that is greater than 0 but less than 0.5.--- Indicates a percentile that could not be estimated.Note: See "Table notes."Source: USDA's Continuing Survey of Food Intakes by Individuals, 1994-96, 2 days.

101
Table 1.093. Tomato Catsup: Percentage of persons using food in 2 days and quantities consumed per eating occasion.
)))))))))))))))))))))))))))))))))))))))))))))))))))))))))))))))))))))))))))))))))))))))))))))))))))))))))))))))))))))))))))))))))))
* * Age (years) and sex* *)))))))))))))))))))))))))))))))))))))))))))))))))))))))))))))))))))))))))))))))))
* * 2-5 6-11 12-19 20-39 40-59 60 and older* *)))))) )))))) ))))))))))))))) ))))))))))))))) ))))))))))))))) )))))))))))))))
Statistic * All individuals * Males Males* age 2 and over * and and Males Females Males Females Males Females Males Females* *females females
)))))))))))))))))))))))))))))))))))))))))))))))))))))))))))))))))))))))))))))))))))))))))))))))))))))))))))))))))))))))))))))))))))
Number in sample 14,262 2,109 1,432 696 702 1,543 1,449 1,663 1,694 1,545 1,429
Percent of persons using ))))))))))))))))))))))))))))))))))))))))))))%)))))))))))))))))))))))))))))))))))))))))))))
at least once in 2 days 26.5 40.1 39.6 42.4 38.6 35.8 22.6 21.0 14.9 13.3 9.0 on 1 of 2 days 22.3 32.3 32.3 32.0 32.6 29.8 20.6 18.1 13.7 11.7 8.1 on both days 4.1 7.8 7.4 10.4 6.1 6.0 2.0 2.9 1.2 1.6 0.9
Quantity consumed per eating occasion ))))))))))))))))))))))))))))))))))))))))))))g)))))))))))))))))))))))))))))))))))))))))))))(1 tablespoon = 15 g)
Mean 18 13 16 27 19 22 17 20 15 15 13 SEM # 1 1 2 1 1 1 1 1 1 2
5th percentile 3 2 3 4 4 5 2 4 2 * 2 * 1 * 10th percentile 5 3 5 6 5 5 5 5 5 3 2 * 25th percentile 7 5 6 12 7 12 6 10 5 5 5 50th percentile 15 8 12 16 15 15 15 15 10 10 7 75th percentile 22 15 17 32 24 30 19 28 15 15 15 90th percentile 37 30 29 59 41 44 30 37 28 30 25 * 95th percentile 58 31 45 72 54 59 40 49 40 * 41 * 33 *
)))))))))))))))))))))))))))))))))))))))))))))))))))))))))))))))))))))))))))))))))))))))))))))))))))))))))))))))))))))))))))))))))))
* Indicates a statistic that is potentially unreliable because of small sample size or large coefficient of variation.# Indicates a percentage that is greater than 0 but less than 0.05 or a mean, SEM, or percentile that is greater than 0 but less than 0.5.--- Indicates a percentile that could not be estimated.Note: See "Table notes."Source: USDA's Continuing Survey of Food Intakes by Individuals, 1994-96, 2 days.

102
Table 1.094. Total Soy-Based Sauces: Percentage of persons using food in 2 days and quantities consumed per eating occasion.
)))))))))))))))))))))))))))))))))))))))))))))))))))))))))))))))))))))))))))))))))))))))))))))))))))))))))))))))))))))))))))))))))))
* * Age (years) and sex* *)))))))))))))))))))))))))))))))))))))))))))))))))))))))))))))))))))))))))))))))))
* * 2-5 6-11 12-19 20-39 40-59 60 and older* *)))))) )))))) ))))))))))))))) ))))))))))))))) ))))))))))))))) )))))))))))))))
Statistic * All individuals * Males Males* age 2 and over * and and Males Females Males Females Males Females Males Females* *females females
)))))))))))))))))))))))))))))))))))))))))))))))))))))))))))))))))))))))))))))))))))))))))))))))))))))))))))))))))))))))))))))))))))
Number in sample 14,262 2,109 1,432 696 702 1,543 1,449 1,663 1,694 1,545 1,429
Percent of persons using ))))))))))))))))))))))))))))))))))))))))))))%)))))))))))))))))))))))))))))))))))))))))))))
at least once in 2 days 15.8 15.4 13.6 17.5 14.0 19.0 20.3 15.3 14.9 10.5 10.7 on 1 of 2 days 14.3 14.2 12.7 16.9 12.1 16.5 17.9 14.3 13.7 9.9 10.1 on both days 1.5 1.2 0.9 0.6 * 1.9 2.5 2.4 1.0 1.2 0.6 * 0.6 *
Quantity consumed per eating occasion ))))))))))))))))))))))))))))))))))))))))))))g)))))))))))))))))))))))))))))))))))))))))))))(1 teaspoon = 5 g)
Mean 10 3 6 10 7 16 10 11 10 9 7 SEM # # 1 2 1 2 1 1 1 1 1
5th percentile # # # # # # # 1 * # # # 10th percentile 1 # # 1 * # 1 1 1 1 1 # 25th percentile 2 1 1 2 1 3 2 3 2 2 1 50th percentile 4 1 3 3 3 8 5 6 5 4 3 75th percentile 14 3 7 11 10 20 14 16 15 13 10 90th percentile 26 6 15 27 * 20 * 41 25 25 25 20 21 95th percentile 38 11 22 * 45 * 30 * 64 37 31 * 33 * 29 * 30 *
)))))))))))))))))))))))))))))))))))))))))))))))))))))))))))))))))))))))))))))))))))))))))))))))))))))))))))))))))))))))))))))))))))
* Indicates a statistic that is potentially unreliable because of small sample size or large coefficient of variation.# Indicates a percentage that is greater than 0 but less than 0.05 or a mean, SEM, or percentile that is greater than 0 but less than 0.5.--- Indicates a percentile that could not be estimated.Note: See "Table notes."Source: USDA's Continuing Survey of Food Intakes by Individuals, 1994-96, 2 days.
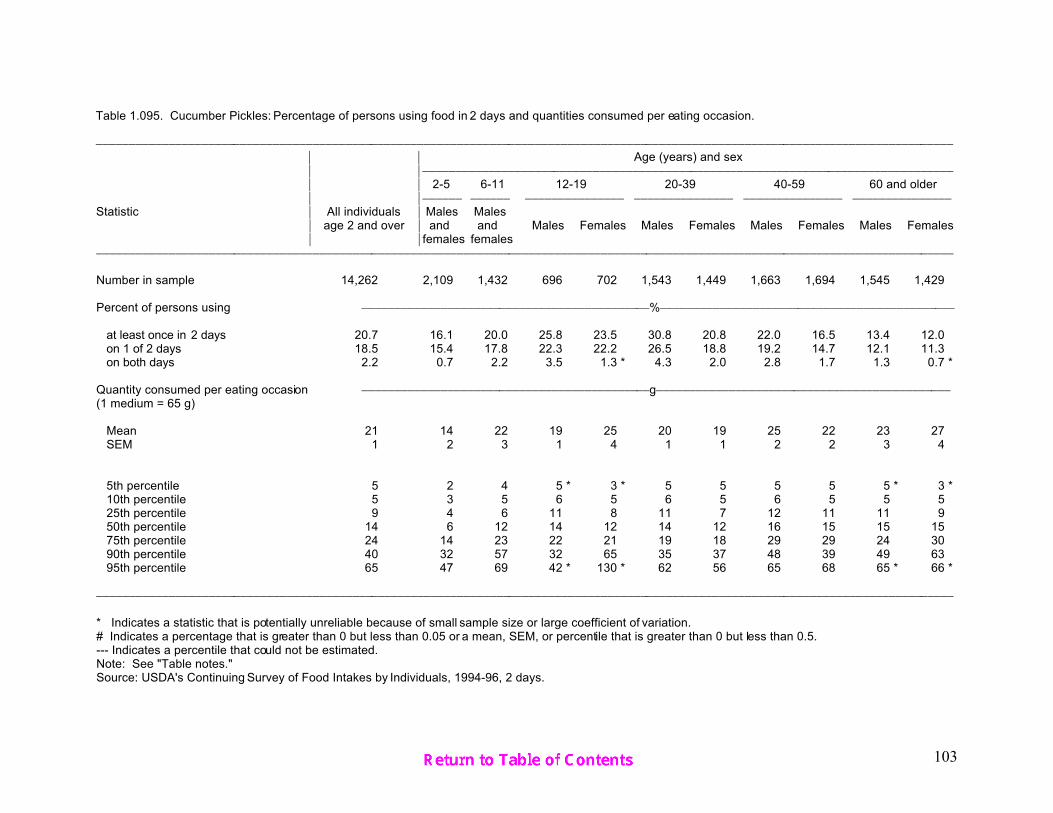
103
Table 1.095. Cucumber Pickles: Percentage of persons using food in 2 days and quantities consumed per eating occasion.
)))))))))))))))))))))))))))))))))))))))))))))))))))))))))))))))))))))))))))))))))))))))))))))))))))))))))))))))))))))))))))))))))))
* * Age (years) and sex* *)))))))))))))))))))))))))))))))))))))))))))))))))))))))))))))))))))))))))))))))))
* * 2-5 6-11 12-19 20-39 40-59 60 and older* *)))))) )))))) ))))))))))))))) ))))))))))))))) ))))))))))))))) )))))))))))))))
Statistic * All individuals * Males Males* age 2 and over * and and Males Females Males Females Males Females Males Females* *females females
)))))))))))))))))))))))))))))))))))))))))))))))))))))))))))))))))))))))))))))))))))))))))))))))))))))))))))))))))))))))))))))))))))
Number in sample 14,262 2,109 1,432 696 702 1,543 1,449 1,663 1,694 1,545 1,429
Percent of persons using ))))))))))))))))))))))))))))))))))))))))))))%)))))))))))))))))))))))))))))))))))))))))))))
at least once in 2 days 20.7 16.1 20.0 25.8 23.5 30.8 20.8 22.0 16.5 13.4 12.0 on 1 of 2 days 18.5 15.4 17.8 22.3 22.2 26.5 18.8 19.2 14.7 12.1 11.3 on both days 2.2 0.7 2.2 3.5 1.3 * 4.3 2.0 2.8 1.7 1.3 0.7 *
Quantity consumed per eating occasion ))))))))))))))))))))))))))))))))))))))))))))g)))))))))))))))))))))))))))))))))))))))))))))(1 medium = 65 g)
Mean 21 14 22 19 25 20 19 25 22 23 27 SEM 1 2 3 1 4 1 1 2 2 3 4
5th percentile 5 2 4 5 * 3 * 5 5 5 5 5 * 3 * 10th percentile 5 3 5 6 5 6 5 6 5 5 5 25th percentile 9 4 6 11 8 11 7 12 11 11 9 50th percentile 14 6 12 14 12 14 12 16 15 15 15 75th percentile 24 14 23 22 21 19 18 29 29 24 30 90th percentile 40 32 57 32 65 35 37 48 39 49 63 95th percentile 65 47 69 42 * 130 * 62 56 65 68 65 * 66 *
)))))))))))))))))))))))))))))))))))))))))))))))))))))))))))))))))))))))))))))))))))))))))))))))))))))))))))))))))))))))))))))))))))
* Indicates a statistic that is potentially unreliable because of small sample size or large coefficient of variation.# Indicates a percentage that is greater than 0 but less than 0.05 or a mean, SEM, or percentile that is greater than 0 but less than 0.5.--- Indicates a percentile that could not be estimated.Note: See "Table notes."Source: USDA's Continuing Survey of Food Intakes by Individuals, 1994-96, 2 days.

104
Table 1.096. Fluid Cream: Percentage of persons using food in 2 days and quantities consumed per eating occasion.
)))))))))))))))))))))))))))))))))))))))))))))))))))))))))))))))))))))))))))))))))))))))))))))))))))))))))))))))))))))))))))))))))))
* * Age (years) and sex* *)))))))))))))))))))))))))))))))))))))))))))))))))))))))))))))))))))))))))))))))))
* * 2-5 6-11 12-19 20-39 40-59 60 and older* *)))))) )))))) ))))))))))))))) ))))))))))))))) ))))))))))))))) )))))))))))))))
Statistic * All individuals * Males Males* age 2 and over * and and Males Females Males Females Males Females Males Females* *females females
)))))))))))))))))))))))))))))))))))))))))))))))))))))))))))))))))))))))))))))))))))))))))))))))))))))))))))))))))))))))))))))))))))
Number in sample 14,262 2,109 1,432 696 702 1,543 1,449 1,663 1,694 1,545 1,429
Percent of persons using ))))))))))))))))))))))))))))))))))))))))))))%)))))))))))))))))))))))))))))))))))))))))))))
at least once in 2 days 6.5 1.0 0.7 * 0.8 * 1.3 * 8.1 7.1 10.2 8.2 11.1 8.7 on 1 of 2 days 4.2 0.9 0.6 * 0.5 * 1.3 * 5.7 4.0 6.5 5.2 6.9 6.0 on both days 2.3 # 0.1 * 0.3 * 0.0 * 2.4 3.0 3.7 3.0 4.2 2.7
Quantity consumed per eating occasion ))))))))))))))))))))))))))))))))))))))))))))g)))))))))))))))))))))))))))))))))))))))))))))(1 tablespoon = 15 g)
Mean 32 33 * 29 * 30 * 47 * 38 31 31 28 36 25 SEM 2 9 * 7 * 10 * 17 * 4 3 3 4 4 2
5th percentile 5 --- --- --- --- 8 * 5 * 5 * 5 * 4 * 4 * 10th percentile 8 --- 8 * --- --- 10 * 8 * 7 7 5 5 * 25th percentile 15 15 * 15 * --- 9 * 15 15 14 14 11 10 50th percentile 22 15 17 --- 15 30 22 24 15 18 15 75th percentile 38 23 * 28 * --- 69 * 60 41 30 30 30 28 90th percentile 60 60 * 59 * --- --- 60 * 60 * 50 45 94 47 * 95th percentile 90 --- --- --- --- 90 * 65 * 90 * 60 * 159 * 76 *
)))))))))))))))))))))))))))))))))))))))))))))))))))))))))))))))))))))))))))))))))))))))))))))))))))))))))))))))))))))))))))))))))))
* Indicates a statistic that is potentially unreliable because of small sample size or large coefficient of variation.# Indicates a percentage that is greater than 0 but less than 0.05 or a mean, SEM, or percentile that is greater than 0 but less than 0.5.--- Indicates a percentile that could not be estimated.Note: See "Table notes."Source: USDA's Continuing Survey of Food Intakes by Individuals, 1994-96, 2 days.

105
Table 1.097. Powdered Cream Substitute: Percentage of persons using food in 2 days and quantities consumed per eating occasion.
)))))))))))))))))))))))))))))))))))))))))))))))))))))))))))))))))))))))))))))))))))))))))))))))))))))))))))))))))))))))))))))))))))
* * Age (years) and sex* *)))))))))))))))))))))))))))))))))))))))))))))))))))))))))))))))))))))))))))))))))
* * 2-5 6-11 12-19 20-39 40-59 60 and older* *)))))) )))))) ))))))))))))))) ))))))))))))))) ))))))))))))))) )))))))))))))))
Statistic * All individuals * Males Males* age 2 and over * and and Males Females Males Females Males Females Males Females* *females females
)))))))))))))))))))))))))))))))))))))))))))))))))))))))))))))))))))))))))))))))))))))))))))))))))))))))))))))))))))))))))))))))))))
Number in sample 14,262 2,109 1,432 696 702 1,543 1,449 1,663 1,694 1,545 1,429
Percent of persons using ))))))))))))))))))))))))))))))))))))))))))))%)))))))))))))))))))))))))))))))))))))))))))))
at least once in 2 days 7.2 0.1 * 0.4 * 1.3 * 0.6 * 6.2 9.1 12.5 12.8 8.9 9.5 on 1 of 2 days 3.6 0.1 * 0.3 * 1.2 * 0.4 * 4.1 4.9 6.4 5.9 3.2 3.8 on both days 3.5 0.0 * 0.1 * 0.1 * 0.2 * 2.1 4.2 6.1 6.9 5.7 5.7
Quantity consumed per eating occasion ))))))))))))))))))))))))))))))))))))))))))))g)))))))))))))))))))))))))))))))))))))))))))))(1 teaspoon = 2 g)
Mean 6 1 * 4 * 4 * 7 * 5 7 8 5 3 3 SEM # 0 * 1 * 1 * 2 * 1 1 1 1 # #
5th percentile 1 --- --- --- --- 1 * 1 * 1 * 1 * 1 * 1 * 10th percentile 2 --- --- --- --- 2 * 2 1 2 1 1 25th percentile 2 --- --- 3 * --- 2 2 2 2 2 2 50th percentile 4 --- --- 3 --- 3 4 4 4 2 3 75th percentile 6 --- --- 5 * --- 6 7 7 6 4 4 90th percentile 11 --- --- --- --- 9 * 16 15 9 6 6 95th percentile 16 --- --- --- --- 13 * 20 * 22 * 14 * 9 * 7 *
)))))))))))))))))))))))))))))))))))))))))))))))))))))))))))))))))))))))))))))))))))))))))))))))))))))))))))))))))))))))))))))))))))
* Indicates a statistic that is potentially unreliable because of small sample size or large coefficient of variation.# Indicates a percentage that is greater than 0 but less than 0.05 or a mean, SEM, or percentile that is greater than 0 but less than 0.5.--- Indicates a percentile that could not be estimated.Note: See "Table notes."Source: USDA's Continuing Survey of Food Intakes by Individuals, 1994-96, 2 days.
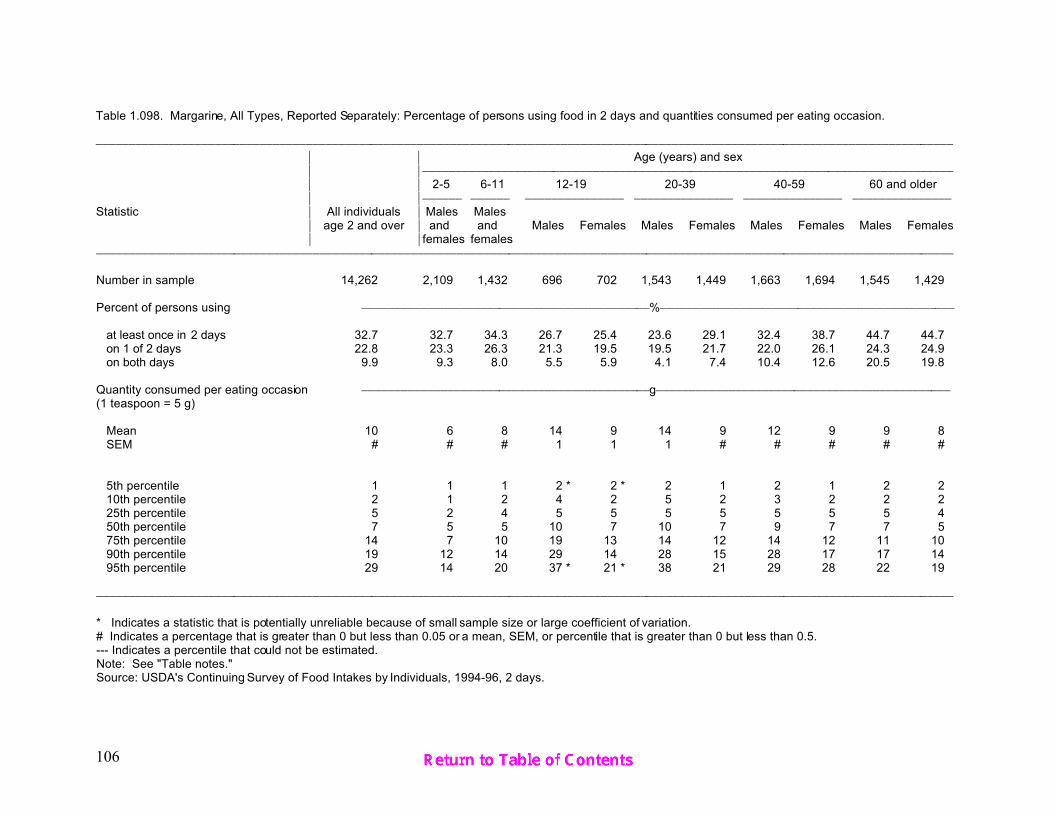
106
Table 1.098. Margarine, All Types, Reported Separately: Percentage of persons using food in 2 days and quantities consumed per eating occasion.
)))))))))))))))))))))))))))))))))))))))))))))))))))))))))))))))))))))))))))))))))))))))))))))))))))))))))))))))))))))))))))))))))))
* * Age (years) and sex* *)))))))))))))))))))))))))))))))))))))))))))))))))))))))))))))))))))))))))))))))))
* * 2-5 6-11 12-19 20-39 40-59 60 and older* *)))))) )))))) ))))))))))))))) ))))))))))))))) ))))))))))))))) )))))))))))))))
Statistic * All individuals * Males Males* age 2 and over * and and Males Females Males Females Males Females Males Females* *females females
)))))))))))))))))))))))))))))))))))))))))))))))))))))))))))))))))))))))))))))))))))))))))))))))))))))))))))))))))))))))))))))))))))
Number in sample 14,262 2,109 1,432 696 702 1,543 1,449 1,663 1,694 1,545 1,429
Percent of persons using ))))))))))))))))))))))))))))))))))))))))))))%)))))))))))))))))))))))))))))))))))))))))))))
at least once in 2 days 32.7 32.7 34.3 26.7 25.4 23.6 29.1 32.4 38.7 44.7 44.7 on 1 of 2 days 22.8 23.3 26.3 21.3 19.5 19.5 21.7 22.0 26.1 24.3 24.9 on both days 9.9 9.3 8.0 5.5 5.9 4.1 7.4 10.4 12.6 20.5 19.8
Quantity consumed per eating occasion ))))))))))))))))))))))))))))))))))))))))))))g)))))))))))))))))))))))))))))))))))))))))))))(1 teaspoon = 5 g)
Mean 10 6 8 14 9 14 9 12 9 9 8 SEM # # # 1 1 1 # # # # #
5th percentile 1 1 1 2 * 2 * 2 1 2 1 2 2 10th percentile 2 1 2 4 2 5 2 3 2 2 2 25th percentile 5 2 4 5 5 5 5 5 5 5 4 50th percentile 7 5 5 10 7 10 7 9 7 7 5 75th percentile 14 7 10 19 13 14 12 14 12 11 10 90th percentile 19 12 14 29 14 28 15 28 17 17 14 95th percentile 29 14 20 37 * 21 * 38 21 29 28 22 19
)))))))))))))))))))))))))))))))))))))))))))))))))))))))))))))))))))))))))))))))))))))))))))))))))))))))))))))))))))))))))))))))))))
* Indicates a statistic that is potentially unreliable because of small sample size or large coefficient of variation.# Indicates a percentage that is greater than 0 but less than 0.05 or a mean, SEM, or percentile that is greater than 0 but less than 0.5.--- Indicates a percentile that could not be estimated.Note: See "Table notes."Source: USDA's Continuing Survey of Food Intakes by Individuals, 1994-96, 2 days.

107
Table 1.099. Margarine, Stick: Percentage of persons using food in 2 days and quantities consumed per eating occasion.
)))))))))))))))))))))))))))))))))))))))))))))))))))))))))))))))))))))))))))))))))))))))))))))))))))))))))))))))))))))))))))))))))))
* * Age (years) and sex* *)))))))))))))))))))))))))))))))))))))))))))))))))))))))))))))))))))))))))))))))))
* * 2-5 6-11 12-19 20-39 40-59 60 and older* *)))))) )))))) ))))))))))))))) ))))))))))))))) ))))))))))))))) )))))))))))))))
Statistic * All individuals * Males Males* age 2 and over * and and Males Females Males Females Males Females Males Females* *females females
)))))))))))))))))))))))))))))))))))))))))))))))))))))))))))))))))))))))))))))))))))))))))))))))))))))))))))))))))))))))))))))))))))
Number in sample 14,262 2,109 1,432 696 702 1,543 1,449 1,663 1,694 1,545 1,429
Percent of persons using ))))))))))))))))))))))))))))))))))))))))))))%)))))))))))))))))))))))))))))))))))))))))))))
at least once in 2 days 12.1 12.4 13.5 9.4 8.4 8.0 10.5 12.2 13.1 18.6 18.3 on 1 of 2 days 9.7 10.3 11.2 8.2 7.5 7.2 8.6 9.9 10.7 12.5 12.6 on both days 2.4 2.2 2.3 1.3 * 0.9 * 0.8 * 1.9 2.3 2.4 6.1 5.7
Quantity consumed per eating occasion ))))))))))))))))))))))))))))))))))))))))))))g)))))))))))))))))))))))))))))))))))))))))))))(1 teaspoon = 5 g)
Mean 10 6 7 13 11 15 9 12 9 9 7 SEM # # 1 2 2 2 1 1 1 1 #
5th percentile 1 1 1 * 1 * 1 * 3 * 1 * 2 * 1 * 2 2 10th percentile 2 1 2 2 * 2 * 5 2 4 2 2 2 25th percentile 5 2 4 4 4 5 5 5 4 5 4 50th percentile 7 5 5 9 7 9 7 9 7 7 5 75th percentile 14 7 7 15 13 14 11 14 12 12 9 90th percentile 19 14 14 28 * 19 * 29 18 28 14 16 14 95th percentile 28 14 20 * 29 * 29 * 40 * 21 * 29 * 28 * 28 14
)))))))))))))))))))))))))))))))))))))))))))))))))))))))))))))))))))))))))))))))))))))))))))))))))))))))))))))))))))))))))))))))))))
* Indicates a statistic that is potentially unreliable because of small sample size or large coefficient of variation.# Indicates a percentage that is greater than 0 but less than 0.05 or a mean, SEM, or percentile that is greater than 0 but less than 0.5.--- Indicates a percentile that could not be estimated.Note: See "Table notes."Source: USDA's Continuing Survey of Food Intakes by Individuals, 1994-96, 2 days.

108
Table 1.100. Margarine, Soft: Percentage of persons using food in 2 days and quantities consumed per eating occasion.
)))))))))))))))))))))))))))))))))))))))))))))))))))))))))))))))))))))))))))))))))))))))))))))))))))))))))))))))))))))))))))))))))))
* * Age (years) and sex* *)))))))))))))))))))))))))))))))))))))))))))))))))))))))))))))))))))))))))))))))))
* * 2-5 6-11 12-19 20-39 40-59 60 and older* *)))))) )))))) ))))))))))))))) ))))))))))))))) ))))))))))))))) )))))))))))))))
Statistic * All individuals * Males Males* age 2 and over * and and Males Females Males Females Males Females Males Females* *females females
)))))))))))))))))))))))))))))))))))))))))))))))))))))))))))))))))))))))))))))))))))))))))))))))))))))))))))))))))))))))))))))))))))
Number in sample 14,262 2,109 1,432 696 702 1,543 1,449 1,663 1,694 1,545 1,429
Percent of persons using ))))))))))))))))))))))))))))))))))))))))))))%)))))))))))))))))))))))))))))))))))))))))))))
at least once in 2 days 17.8 19.3 18.1 15.2 16.2 13.4 15.9 18.4 21.5 23.0 20.1 on 1 of 2 days 13.3 14.5 14.4 13.3 12.2 11.4 12.7 14.0 14.6 15.1 12.8 on both days 4.5 4.7 3.7 2.0 4.0 2.1 3.3 4.4 6.9 8.0 7.4
Quantity consumed per eating occasion ))))))))))))))))))))))))))))))))))))))))))))g)))))))))))))))))))))))))))))))))))))))))))))(1 teaspoon = 5 g)
Mean 10 6 8 15 8 14 9 12 9 10 7 SEM # # 1 1 1 1 # 1 1 1 #
5th percentile 1 1 1 4 * 2 * 2 * 1 * 2 1 2 1 10th percentile 2 1 2 4 * 2 * 5 2 2 2 2 2 25th percentile 5 2 5 6 4 5 4 5 4 5 4 50th percentile 7 5 5 10 6 10 7 9 6 7 5 75th percentile 14 7 10 20 11 14 12 14 14 12 10 90th percentile 19 12 14 28 * 14 * 28 14 28 19 18 14 95th percentile 29 14 20 38 * 17 * 34 * 21 * 29 28 28 19
)))))))))))))))))))))))))))))))))))))))))))))))))))))))))))))))))))))))))))))))))))))))))))))))))))))))))))))))))))))))))))))))))))
* Indicates a statistic that is potentially unreliable because of small sample size or large coefficient of variation.# Indicates a percentage that is greater than 0 but less than 0.05 or a mean, SEM, or percentile that is greater than 0 but less than 0.5.--- Indicates a percentile that could not be estimated.Note: See "Table notes."Source: USDA's Continuing Survey of Food Intakes by Individuals, 1994-96, 2 days.

109
Table 1.101. Margarine, Imitation: Percentage of persons using food in 2 days and quantities consumed per eating occasion.
)))))))))))))))))))))))))))))))))))))))))))))))))))))))))))))))))))))))))))))))))))))))))))))))))))))))))))))))))))))))))))))))))))
* * Age (years) and sex* *)))))))))))))))))))))))))))))))))))))))))))))))))))))))))))))))))))))))))))))))))
* * 2-5 6-11 12-19 20-39 40-59 60 and older* *)))))) )))))) ))))))))))))))) ))))))))))))))) ))))))))))))))) )))))))))))))))
Statistic * All individuals * Males Males* age 2 and over * and and Males Females Males Females Males Females Males Females* *females females
)))))))))))))))))))))))))))))))))))))))))))))))))))))))))))))))))))))))))))))))))))))))))))))))))))))))))))))))))))))))))))))))))))
Number in sample 14,262 2,109 1,432 696 702 1,543 1,449 1,663 1,694 1,545 1,429
Percent of persons using ))))))))))))))))))))))))))))))))))))))))))))%)))))))))))))))))))))))))))))))))))))))))))))
at least once in 2 days 5.3 3.8 4.5 3.3 2.3 3.2 4.2 5.5 7.1 9.0 10.8 on 1 of 2 days 4.0 3.0 3.9 2.5 2.0 2.7 3.5 4.1 5.3 5.8 6.5 on both days 1.4 0.7 0.6 * 0.8 * 0.3 * 0.5 * 0.7 * 1.4 1.8 3.2 4.3
Quantity consumed per eating occasion ))))))))))))))))))))))))))))))))))))))))))))g)))))))))))))))))))))))))))))))))))))))))))))(1 teaspoon = 5 g)
Mean 10 5 7 18 * 8 * 13 9 13 8 9 9 SEM 1 1 1 5 * 2 * 2 1 2 1 1 2
5th percentile 2 1 * 1 * --- --- 2 * --- 2 * 2 * 2 * 1 * 10th percentile 2 2 * 2 * 3 * 2 * 2 * 1 * 3 * 2 * 2 2 25th percentile 5 2 3 4 * 4 * 4 * 5 4 5 5 4 50th percentile 6 3 5 9 5 9 5 10 5 7 5 75th percentile 11 5 10 28 * 12 * 15 * 14 14 10 10 10 90th percentile 19 7 * 13 * 38 * 15 * 27 * 15 * 27 * 14 * 15 15 95th percentile 29 12 * 15 * --- --- 39 * 28 * 29 * 14 * 21 * 29 *
)))))))))))))))))))))))))))))))))))))))))))))))))))))))))))))))))))))))))))))))))))))))))))))))))))))))))))))))))))))))))))))))))))
* Indicates a statistic that is potentially unreliable because of small sample size or large coefficient of variation.# Indicates a percentage that is greater than 0 but less than 0.05 or a mean, SEM, or percentile that is greater than 0 but less than 0.5.--- Indicates a percentile that could not be estimated.Note: See "Table notes."Source: USDA's Continuing Survey of Food Intakes by Individuals, 1994-96, 2 days.

110
Table 1.102. Butter: Percentage of persons using food in 2 days and quantities consumed per eating occasion.
)))))))))))))))))))))))))))))))))))))))))))))))))))))))))))))))))))))))))))))))))))))))))))))))))))))))))))))))))))))))))))))))))))
* * Age (years) and sex* *)))))))))))))))))))))))))))))))))))))))))))))))))))))))))))))))))))))))))))))))))
* * 2-5 6-11 12-19 20-39 40-59 60 and older* *)))))) )))))) ))))))))))))))) ))))))))))))))) ))))))))))))))) )))))))))))))))
Statistic * All individuals * Males Males* age 2 and over * and and Males Females Males Females Males Females Males Females* *females females
)))))))))))))))))))))))))))))))))))))))))))))))))))))))))))))))))))))))))))))))))))))))))))))))))))))))))))))))))))))))))))))))))))
Number in sample 14,262 2,109 1,432 696 702 1,543 1,449 1,663 1,694 1,545 1,429
Percent of persons using ))))))))))))))))))))))))))))))))))))))))))))%)))))))))))))))))))))))))))))))))))))))))))))
at least once in 2 days 14.6 13.0 13.6 11.2 10.7 15.0 12.5 17.1 15.6 19.6 16.4 on 1 of 2 days 11.6 10.7 11.1 10.2 9.3 12.8 10.7 12.8 12.0 13.6 11.6 on both days 3.0 2.4 2.5 0.9 * 1.4 * 2.3 1.8 4.3 3.6 6.0 4.8
Quantity consumed per eating occasion ))))))))))))))))))))))))))))))))))))))))))))g)))))))))))))))))))))))))))))))))))))))))))))(1 teaspoon = 5 g)
Mean 11 6 9 14 9 17 10 12 10 11 8 SEM 1 1 1 2 1 2 1 1 1 1 1
5th percentile 2 1 * --- --- 2 * 3 * 2 * 2 2 * 2 1 * 10th percentile 2 2 2 4 * 3 * 4 2 3 2 3 2 25th percentile 5 2 4 5 5 6 5 5 5 5 4 50th percentile 7 5 7 8 5 14 7 9 7 9 5 75th percentile 14 8 14 14 13 21 14 14 13 14 9 90th percentile 21 14 14 28 * 15 * 38 16 23 15 21 14 95th percentile 28 15 * 19 * 49 * --- 45 * 28 * 36 27 * 28 20 *
)))))))))))))))))))))))))))))))))))))))))))))))))))))))))))))))))))))))))))))))))))))))))))))))))))))))))))))))))))))))))))))))))))
* Indicates a statistic that is potentially unreliable because of small sample size or large coefficient of variation.# Indicates a percentage that is greater than 0 but less than 0.05 or a mean, SEM, or percentile that is greater than 0 but less than 0.5.--- Indicates a percentile that could not be estimated.Note: See "Table notes."Source: USDA's Continuing Survey of Food Intakes by Individuals, 1994-96, 2 days.

111
Table 1.103. Pourable Salad Dressing: Percentage of persons using food in 2 days and quantities consumed per eating occasion.
)))))))))))))))))))))))))))))))))))))))))))))))))))))))))))))))))))))))))))))))))))))))))))))))))))))))))))))))))))))))))))))))))))
* * Age (years) and sex* *)))))))))))))))))))))))))))))))))))))))))))))))))))))))))))))))))))))))))))))))))
* * 2-5 6-11 12-19 20-39 40-59 60 and older* *)))))) )))))) ))))))))))))))) ))))))))))))))) ))))))))))))))) )))))))))))))))
Statistic * All individuals * Males Males* age 2 and over * and and Males Females Males Females Males Females Males Females* *females females
)))))))))))))))))))))))))))))))))))))))))))))))))))))))))))))))))))))))))))))))))))))))))))))))))))))))))))))))))))))))))))))))))))
Number in sample 14,262 2,109 1,432 696 702 1,543 1,449 1,663 1,694 1,545 1,429
Percent of persons using ))))))))))))))))))))))))))))))))))))))))))))%)))))))))))))))))))))))))))))))))))))))))))))
at least once in 2 days 21.3 9.4 12.4 12.4 15.3 21.4 21.7 26.0 29.7 28.0 24.3 on 1 of 2 days 17.9 8.9 11.1 11.5 14.0 19.0 18.7 21.6 24.0 20.9 19.5 on both days 3.3 0.5 * 1.3 0.9 * 1.4 * 2.4 3.0 4.3 5.7 7.0 4.8
Quantity consumed per eating occasion ))))))))))))))))))))))))))))))))))))))))))))g)))))))))))))))))))))))))))))))))))))))))))))(1 tablespoon Italian = 15 g)
Mean 37 16 27 43 37 45 38 42 35 33 29 SEM 1 1 3 3 4 2 2 2 1 1 1
5th percentile 5 2 * 5 * 5 * 4 * 8 5 13 6 7 6 10th percentile 11 3 5 12 * 7 * 15 9 15 14 11 11 25th percentile 16 5 15 29 15 28 16 28 17 16 15 50th percentile 31 14 24 36 30 31 31 31 31 29 29 75th percentile 47 21 31 60 58 59 51 58 45 44 33 90th percentile 62 31 56 64 * 67 * 83 65 73 62 60 58 95th percentile 88 44 * 62 * 86 * 82 * 111 89 92 78 63 62
)))))))))))))))))))))))))))))))))))))))))))))))))))))))))))))))))))))))))))))))))))))))))))))))))))))))))))))))))))))))))))))))))))
* Indicates a statistic that is potentially unreliable because of small sample size or large coefficient of variation.# Indicates a percentage that is greater than 0 but less than 0.05 or a mean, SEM, or percentile that is greater than 0 but less than 0.5.--- Indicates a percentile that could not be estimated.Note: See "Table notes."Source: USDA's Continuing Survey of Food Intakes by Individuals, 1994-96, 2 days.

112
Table 1.104. Mayonnaise: Percentage of persons using food in 2 days and quantities consumed per eating occasion.
)))))))))))))))))))))))))))))))))))))))))))))))))))))))))))))))))))))))))))))))))))))))))))))))))))))))))))))))))))))))))))))))))))
* * Age (years) and sex* *)))))))))))))))))))))))))))))))))))))))))))))))))))))))))))))))))))))))))))))))))
* * 2-5 6-11 12-19 20-39 40-59 60 and older* *)))))) )))))) ))))))))))))))) ))))))))))))))) ))))))))))))))) )))))))))))))))
Statistic * All individuals * Males Males* age 2 and over * and and Males Females Males Females Males Females Males Females* *females females
)))))))))))))))))))))))))))))))))))))))))))))))))))))))))))))))))))))))))))))))))))))))))))))))))))))))))))))))))))))))))))))))))))
Number in sample 14,262 2,109 1,432 696 702 1,543 1,449 1,663 1,694 1,545 1,429
Percent of persons using ))))))))))))))))))))))))))))))))))))))))))))%)))))))))))))))))))))))))))))))))))))))))))))
at least once in 2 days 22.7 14.0 15.9 31.2 23.9 33.4 22.8 26.4 20.6 15.5 14.0 on 1 of 2 days 18.8 12.3 13.8 26.3 20.1 25.4 19.7 21.9 17.4 12.4 12.0 on both days 3.9 1.7 2.1 4.9 3.8 8.1 3.1 4.5 3.2 3.1 2.0
Quantity consumed per eating occasion ))))))))))))))))))))))))))))))))))))))))))))g)))))))))))))))))))))))))))))))))))))))))))))(1 tablespoon = 14 g)
Mean 12 8 9 16 10 13 11 13 11 11 11 SEM # # # 1 # # 1 # 1 1 1
5th percentile 2 1 2 * 4 * 2 * 5 2 2 2 2 * 1 * 10th percentile 5 2 2 4 4 5 5 4 3 3 2 25th percentile 6 3 5 9 5 9 5 9 5 4 4 50th percentile 10 5 9 14 10 13 9 12 9 9 8 75th percentile 14 11 13 21 13 14 14 14 14 14 13 90th percentile 22 14 14 28 15 26 16 26 18 24 24 95th percentile 28 14 20 * 28 * 18 * 27 26 28 26 27 * 28 *
)))))))))))))))))))))))))))))))))))))))))))))))))))))))))))))))))))))))))))))))))))))))))))))))))))))))))))))))))))))))))))))))))))
* Indicates a statistic that is potentially unreliable because of small sample size or large coefficient of variation.# Indicates a percentage that is greater than 0 but less than 0.05 or a mean, SEM, or percentile that is greater than 0 but less than 0.5.--- Indicates a percentile that could not be estimated.Note: See "Table notes."Source: USDA's Continuing Survey of Food Intakes by Individuals, 1994-96, 2 days.

113
Table 1.105. Mayonnaise-Type Dressing: Percentage of persons using food in 2 days and quantities consumed per eating occasion.
)))))))))))))))))))))))))))))))))))))))))))))))))))))))))))))))))))))))))))))))))))))))))))))))))))))))))))))))))))))))))))))))))))
* * Age (years) and sex* *)))))))))))))))))))))))))))))))))))))))))))))))))))))))))))))))))))))))))))))))))
* * 2-5 6-11 12-19 20-39 40-59 60 and older* *)))))) )))))) ))))))))))))))) ))))))))))))))) ))))))))))))))) )))))))))))))))
Statistic * All individuals * Males Males* age 2 and over * and and Males Females Males Females Males Females Males Females* *females females
)))))))))))))))))))))))))))))))))))))))))))))))))))))))))))))))))))))))))))))))))))))))))))))))))))))))))))))))))))))))))))))))))))
Number in sample 14,262 2,109 1,432 696 702 1,543 1,449 1,663 1,694 1,545 1,429
Percent of persons using ))))))))))))))))))))))))))))))))))))))))))))%)))))))))))))))))))))))))))))))))))))))))))))
at least once in 2 days 8.0 6.9 8.6 8.1 8.6 9.7 8.5 8.6 7.6 5.9 5.0 on 1 of 2 days 6.9 6.2 7.5 6.9 7.5 8.3 8.1 7.1 6.5 5.0 4.1 on both days 1.0 0.8 1.1 1.1 * 1.1 * 1.5 0.4 * 1.5 1.2 1.0 0.9 *
Quantity consumed per eating occasion ))))))))))))))))))))))))))))))))))))))))))))g)))))))))))))))))))))))))))))))))))))))))))))(1 tablespoon = 15 g)
Mean 12 7 10 18 11 16 10 14 12 11 9 SEM # # 1 3 1 1 1 1 1 1 1
5th percentile 2 1 * 2 * 2 * --- 4 * 2 * 2 * 2 * 2 * 2 * 10th percentile 3 2 2 3 * 3 * 5 3 * 3 4 3 * 2 * 25th percentile 5 2 4 5 4 9 5 4 4 4 4 50th percentile 10 5 9 13 9 15 9 13 10 10 7 75th percentile 15 9 15 28 15 19 15 15 15 15 15 90th percentile 26 15 15 29 * 18 * 29 15 * 29 25 23 * 15 * 95th percentile 29 15 * 23 * 40 * 24 * 29 * 23 * 36 * 29 * 27 * 17 *
)))))))))))))))))))))))))))))))))))))))))))))))))))))))))))))))))))))))))))))))))))))))))))))))))))))))))))))))))))))))))))))))))))
* Indicates a statistic that is potentially unreliable because of small sample size or large coefficient of variation.# Indicates a percentage that is greater than 0 but less than 0.05 or a mean, SEM, or percentile that is greater than 0 but less than 0.5.--- Indicates a percentile that could not be estimated.Note: See "Table notes."Source: USDA's Continuing Survey of Food Intakes by Individuals, 1994-96, 2 days.

114
Table 1.106. Gravy: Percentage of persons using food in 2 days and quantities consumed per eating occasion.
)))))))))))))))))))))))))))))))))))))))))))))))))))))))))))))))))))))))))))))))))))))))))))))))))))))))))))))))))))))))))))))))))))
* * Age (years) and sex* *)))))))))))))))))))))))))))))))))))))))))))))))))))))))))))))))))))))))))))))))))
* * 2-5 6-11 12-19 20-39 40-59 60 and older* *)))))) )))))) ))))))))))))))) ))))))))))))))) ))))))))))))))) )))))))))))))))
Statistic * All individuals * Males Males* age 2 and over * and and Males Females Males Females Males Females Males Females* *females females
)))))))))))))))))))))))))))))))))))))))))))))))))))))))))))))))))))))))))))))))))))))))))))))))))))))))))))))))))))))))))))))))))))
Number in sample 14,262 2,109 1,432 696 702 1,543 1,449 1,663 1,694 1,545 1,429
Percent of persons using ))))))))))))))))))))))))))))))))))))))))))))%)))))))))))))))))))))))))))))))))))))))))))))
at least once in 2 days 9.4 7.5 8.1 8.8 8.2 9.5 8.0 11.5 8.5 13.9 10.8 on 1 of 2 days 8.8 7.1 7.9 8.4 7.8 8.8 7.6 10.6 7.9 12.3 10.4 on both days 0.6 0.4 * 0.2 * 0.4 * 0.4 * 0.6 * 0.4 * 0.9 0.6 * 1.6 0.4 *
Quantity consumed per eating occasion ))))))))))))))))))))))))))))))))))))))))))))g)))))))))))))))))))))))))))))))))))))))))))))(1/4 cup = 58 g)
Mean 76 33 65 100 79 98 66 90 68 76 58 SEM 4 2 10 9 14 8 8 7 7 4 4
5th percentile 13 4 * 5 * 28 * 15 * 15 * 5 * 15 * 7 * 13 * 13 * 10th percentile 14 10 13 * 29 * 15 * 29 11 * 27 11 15 14 25th percentile 29 14 29 36 29 54 24 30 29 29 29 50th percentile 58 29 52 71 57 73 44 59 58 58 45 75th percentile 116 46 77 119 116 117 79 117 82 109 68 90th percentile 152 59 116 * 207 * 168 * 176 121 * 198 144 136 118 95th percentile 222 79 * 172 * 237 * 224 * 235 * 204 * 234 * 197 * 208 * 119 *
)))))))))))))))))))))))))))))))))))))))))))))))))))))))))))))))))))))))))))))))))))))))))))))))))))))))))))))))))))))))))))))))))))
* Indicates a statistic that is potentially unreliable because of small sample size or large coefficient of variation.# Indicates a percentage that is greater than 0 but less than 0.05 or a mean, SEM, or percentile that is greater than 0 but less than 0.5.--- Indicates a percentile that could not be estimated.Note: See "Table notes."Source: USDA's Continuing Survey of Food Intakes by Individuals, 1994-96, 2 days.

115
Table 1.107. Syrup: Percentage of persons using food in 2 days and quantities consumed per eating occasion.
)))))))))))))))))))))))))))))))))))))))))))))))))))))))))))))))))))))))))))))))))))))))))))))))))))))))))))))))))))))))))))))))))))
* * Age (years) and sex* *)))))))))))))))))))))))))))))))))))))))))))))))))))))))))))))))))))))))))))))))))
* * 2-5 6-11 12-19 20-39 40-59 60 and older* *)))))) )))))) ))))))))))))))) ))))))))))))))) ))))))))))))))) )))))))))))))))
Statistic * All individuals * Males Males* age 2 and over * and and Males Females Males Females Males Females Males Females* *females females
)))))))))))))))))))))))))))))))))))))))))))))))))))))))))))))))))))))))))))))))))))))))))))))))))))))))))))))))))))))))))))))))))))
Number in sample 14,262 2,109 1,432 696 702 1,543 1,449 1,663 1,694 1,545 1,429
Percent of persons using ))))))))))))))))))))))))))))))))))))))))))))%)))))))))))))))))))))))))))))))))))))))))))))
at least once in 2 days 8.8 15.7 19.7 12.3 7.6 7.5 5.7 7.1 6.1 8.4 5.8 on 1 of 2 days 7.8 13.4 16.8 10.9 7.0 7.1 4.8 6.1 5.2 7.3 5.6 on both days 1.1 2.3 2.9 1.4 * 0.6 * 0.4 * 0.9 1.0 0.8 1.1 0.2 *
Quantity consumed per eating occasion ))))))))))))))))))))))))))))))))))))))))))))g)))))))))))))))))))))))))))))))))))))))))))))(1 tablespoon = 20 g)
Mean 71 40 56 93 93 120 61 75 56 68 53 SEM 5 4 4 7 17 29 4 5 4 6 6
5th percentile 13 5 7 19 * 16 * 20 * 15 * 13 * 14 * 7 * 8 * 10th percentile 18 6 13 20 * 20 * 23 * 17 * 20 * 16 * 13 14 * 25th percentile 30 18 20 40 31 61 33 39 20 35 20 50th percentile 59 30 40 72 60 78 60 65 38 54 40 75th percentile 79 51 71 104 98 149 78 81 72 79 65 90th percentile 136 78 103 171 * 186 * --- 100 * 130 * 114 * 134 86 * 95th percentile 162 82 124 --- 267 * --- 121 * 147 * 134 * 158 * 114 *
)))))))))))))))))))))))))))))))))))))))))))))))))))))))))))))))))))))))))))))))))))))))))))))))))))))))))))))))))))))))))))))))))))
* Indicates a statistic that is potentially unreliable because of small sample size or large coefficient of variation.# Indicates a percentage that is greater than 0 but less than 0.05 or a mean, SEM, or percentile that is greater than 0 but less than 0.5.--- Indicates a percentile that could not be estimated.Note: See "Table notes."Source: USDA's Continuing Survey of Food Intakes by Individuals, 1994-96, 2 days.

116
Table 1.108. Sugar: Percentage of persons using food in 2 days and quantities consumed per eating occasion.
)))))))))))))))))))))))))))))))))))))))))))))))))))))))))))))))))))))))))))))))))))))))))))))))))))))))))))))))))))))))))))))))))))
* * Age (years) and sex* *)))))))))))))))))))))))))))))))))))))))))))))))))))))))))))))))))))))))))))))))))
* * 2-5 6-11 12-19 20-39 40-59 60 and older* *)))))) )))))) ))))))))))))))) ))))))))))))))) ))))))))))))))) )))))))))))))))
Statistic * All individuals * Males Males* age 2 and over * and and Males Females Males Females Males Females Males Females* *females females
)))))))))))))))))))))))))))))))))))))))))))))))))))))))))))))))))))))))))))))))))))))))))))))))))))))))))))))))))))))))))))))))))))
Number in sample 14,262 2,109 1,432 696 702 1,543 1,449 1,663 1,694 1,545 1,429
Percent of persons using ))))))))))))))))))))))))))))))))))))))))))))%)))))))))))))))))))))))))))))))))))))))))))))
at least once in 2 days 38.1 26.4 26.6 31.0 30.6 43.0 42.8 45.2 41.6 40.3 35.3 on 1 of 2 days 19.5 20.3 19.2 22.1 22.1 21.2 22.0 18.4 18.1 15.7 14.6 on both days 18.7 6.1 7.4 8.9 8.5 21.8 20.8 26.8 23.6 24.6 20.7
Quantity consumed per eating occasion ))))))))))))))))))))))))))))))))))))))))))))g)))))))))))))))))))))))))))))))))))))))))))))(1 teaspoon granulated = 4 g)
Mean 14 8 10 21 17 19 15 14 12 12 10 SEM # # # 2 2 1 1 1 1 1 1
5th percentile 2 1 2 3 * 4 * 4 3 3 2 2 2 10th percentile 4 2 4 4 4 4 4 4 4 3 2 25th percentile 6 4 4 8 7 8 6 6 5 4 4 50th percentile 10 6 8 14 12 15 11 10 8 8 8 75th percentile 18 10 13 25 19 24 18 18 15 13 12 90th percentile 27 14 19 40 29 35 29 26 24 24 20 95th percentile 36 18 25 73 * 43 * 47 38 34 26 30 24
)))))))))))))))))))))))))))))))))))))))))))))))))))))))))))))))))))))))))))))))))))))))))))))))))))))))))))))))))))))))))))))))))))
* Indicates a statistic that is potentially unreliable because of small sample size or large coefficient of variation.# Indicates a percentage that is greater than 0 but less than 0.05 or a mean, SEM, or percentile that is greater than 0 but less than 0.5.--- Indicates a percentile that could not be estimated.Note: See "Table notes."Source: USDA's Continuing Survey of Food Intakes by Individuals, 1994-96, 2 days.

117
Table 1.109. Candy Containing Chocolate: Percentage of persons using food in 2 days and quantities consumed per eating occasion.
)))))))))))))))))))))))))))))))))))))))))))))))))))))))))))))))))))))))))))))))))))))))))))))))))))))))))))))))))))))))))))))))))))
* * Age (years) and sex* *)))))))))))))))))))))))))))))))))))))))))))))))))))))))))))))))))))))))))))))))))
* * 2-5 6-11 12-19 20-39 40-59 60 and older* *)))))) )))))) ))))))))))))))) ))))))))))))))) ))))))))))))))) )))))))))))))))
Statistic * All individuals * Males Males* age 2 and over * and and Males Females Males Females Males Females Males Females* *females females
)))))))))))))))))))))))))))))))))))))))))))))))))))))))))))))))))))))))))))))))))))))))))))))))))))))))))))))))))))))))))))))))))))
Number in sample 14,262 2,109 1,432 696 702 1,543 1,449 1,663 1,694 1,545 1,429
Percent of persons using ))))))))))))))))))))))))))))))))))))))))))))%)))))))))))))))))))))))))))))))))))))))))))))
at least once in 2 days 15.8 16.9 23.8 19.5 18.4 15.3 14.9 14.1 16.4 11.0 9.8 on 1 of 2 days 13.5 14.4 20.8 16.7 16.3 13.3 12.8 11.6 14.6 8.6 8.4 on both days 2.2 2.6 3.0 2.9 2.1 2.1 2.1 2.5 1.8 2.5 1.4
Quantity consumed per eating occasion ))))))))))))))))))))))))))))))))))))))))))))g)))))))))))))))))))))))))))))))))))))))))))))(1 ounce = 28 g)
Mean 44 28 36 60 43 48 46 55 41 43 35 SEM 1 3 2 5 2 3 6 7 2 4 3
5th percentile 7 5 7 11 * 9 * 9 * 7 * 10 * 8 9 * 6 * 10th percentile 10 6 9 22 11 11 10 14 11 11 9 25th percentile 20 10 15 36 21 26 20 27 20 19 15 50th percentile 37 19 28 51 41 44 34 44 29 34 27 75th percentile 57 36 51 64 57 57 53 57 46 54 41 90th percentile 79 54 60 103 69 83 84 85 83 67 59 95th percentile 109 65 90 113 * 99 * 106 * 128 * 131 * 110 129 * 82 *
)))))))))))))))))))))))))))))))))))))))))))))))))))))))))))))))))))))))))))))))))))))))))))))))))))))))))))))))))))))))))))))))))))
* Indicates a statistic that is potentially unreliable because of small sample size or large coefficient of variation.# Indicates a percentage that is greater than 0 but less than 0.05 or a mean, SEM, or percentile that is greater than 0 but less than 0.5.--- Indicates a percentile that could not be estimated.Note: See "Table notes."Source: USDA's Continuing Survey of Food Intakes by Individuals, 1994-96, 2 days.

118
Table 1.110. Candy Not Containing Chocolate: Percentage of persons using food in 2 days and quantities consumed per eating occasion.
)))))))))))))))))))))))))))))))))))))))))))))))))))))))))))))))))))))))))))))))))))))))))))))))))))))))))))))))))))))))))))))))))))
* * Age (years) and sex* *)))))))))))))))))))))))))))))))))))))))))))))))))))))))))))))))))))))))))))))))))
* * 2-5 6-11 12-19 20-39 40-59 60 and older* *)))))) )))))) ))))))))))))))) ))))))))))))))) ))))))))))))))) )))))))))))))))
Statistic * All individuals * Males Males* age 2 and over * and and Males Females Males Females Males Females Males Females* *females females
)))))))))))))))))))))))))))))))))))))))))))))))))))))))))))))))))))))))))))))))))))))))))))))))))))))))))))))))))))))))))))))))))))
Number in sample 14,262 2,109 1,432 696 702 1,543 1,449 1,663 1,694 1,545 1,429
Percent of persons using ))))))))))))))))))))))))))))))))))))))))))))%)))))))))))))))))))))))))))))))))))))))))))))
at least once in 2 days 11.0 22.9 28.2 14.1 18.3 5.4 8.1 6.4 8.8 6.2 5.9 on 1 of 2 days 9.2 18.2 23.1 11.1 16.4 5.1 7.1 5.5 7.3 4.9 5.1 on both days 1.7 4.7 5.1 3.0 1.9 0.4 * 1.0 0.9 1.5 1.2 0.8 *
Quantity consumed per eating occasion ))))))))))))))))))))))))))))))))))))))))))))g)))))))))))))))))))))))))))))))))))))))))))))(1 ounce = 28 g)
Mean 33 24 27 49 33 46 32 39 34 37 23 SEM 1 1 2 6 4 6 4 5 4 7 2
5th percentile 3 4 3 3 * 3 * 5 * 4 * 4 * 5 * 3 * 3 * 10th percentile 6 6 5 6 * 5 6 * 5 * 5 * 6 4 * 3 * 25th percentile 11 12 12 15 14 12 8 10 10 6 7 50th percentile 21 19 18 32 22 28 18 26 21 16 13 75th percentile 41 28 29 57 42 46 45 53 43 43 28 90th percentile 68 45 59 116 * 82 84 * 71 * 80 * 76 78 * 58 * 95th percentile 102 58 72 156 * 103 * 115 * 125 * 115 * 102 * 136 * 68 *
)))))))))))))))))))))))))))))))))))))))))))))))))))))))))))))))))))))))))))))))))))))))))))))))))))))))))))))))))))))))))))))))))))
* Indicates a statistic that is potentially unreliable because of small sample size or large coefficient of variation.# Indicates a percentage that is greater than 0 but less than 0.05 or a mean, SEM, or percentile that is greater than 0 but less than 0.5.--- Indicates a percentile that could not be estimated.Note: See "Table notes."Source: USDA's Continuing Survey of Food Intakes by Individuals, 1994-96, 2 days.

119
Table 1.111. Jelly, Jams, Preserves, and Marmalade: Percentage of persons using food in 2 days and quantities consumed per eating occasion.
)))))))))))))))))))))))))))))))))))))))))))))))))))))))))))))))))))))))))))))))))))))))))))))))))))))))))))))))))))))))))))))))))))
* * Age (years) and sex* *)))))))))))))))))))))))))))))))))))))))))))))))))))))))))))))))))))))))))))))))))
* * 2-5 6-11 12-19 20-39 40-59 60 and older* *)))))) )))))) ))))))))))))))) ))))))))))))))) ))))))))))))))) )))))))))))))))
Statistic * All individuals * Males Males* age 2 and over * and and Males Females Males Females Males Females Males Females* *females females
)))))))))))))))))))))))))))))))))))))))))))))))))))))))))))))))))))))))))))))))))))))))))))))))))))))))))))))))))))))))))))))))))))
Number in sample 14,262 2,109 1,432 696 702 1,543 1,449 1,663 1,694 1,545 1,429
Percent of persons using ))))))))))))))))))))))))))))))))))))))))))))%)))))))))))))))))))))))))))))))))))))))))))))
at least once in 2 days 17.3 27.0 21.8 13.4 13.7 11.5 14.1 15.3 16.6 25.2 24.0 on 1 of 2 days 13.6 22.0 18.1 10.5 11.5 9.6 11.2 12.0 14.0 17.9 16.0 on both days 3.7 5.0 3.7 2.9 2.3 1.9 3.0 3.2 2.6 7.4 8.0
Quantity consumed per eating occasion ))))))))))))))))))))))))))))))))))))))))))))g)))))))))))))))))))))))))))))))))))))))))))))(1 tablespoon jam = 21 g)
Mean 20 16 19 36 20 34 18 22 16 18 14 SEM 1 1 1 4 2 3 2 1 1 1 1
5th percentile 3 3 5 6 * 4 * 5 * 3 * 3 3 3 3 10th percentile 6 3 6 10 * 5 * 6 6 6 6 6 4 25th percentile 7 6 9 16 9 12 6 12 7 7 6 50th percentile 14 12 18 19 16 19 13 18 12 13 12 75th percentile 20 19 19 38 24 39 20 25 19 20 19 90th percentile 38 35 36 75 * 38 * 77 37 39 29 38 27 95th percentile 56 37 39 79 * 43 * 102 * 41 * 55 39 40 36
)))))))))))))))))))))))))))))))))))))))))))))))))))))))))))))))))))))))))))))))))))))))))))))))))))))))))))))))))))))))))))))))))))
* Indicates a statistic that is potentially unreliable because of small sample size or large coefficient of variation.# Indicates a percentage that is greater than 0 but less than 0.05 or a mean, SEM, or percentile that is greater than 0 but less than 0.5.--- Indicates a percentile that could not be estimated.Note: See "Table notes."Source: USDA's Continuing Survey of Food Intakes by Individuals, 1994-96, 2 days.

120
Table 2.001. Total Yeast Bread: Percentage of persons using food in 2 days and quantities consumed in a day.
)))))))))))))))))))))))))))))))))))))))))))))))))))))))))))))))))))))))))))))))))))))))))))))))))))))))))))))))))))))))))))))))))))
* * Age (years) and sex* *)))))))))))))))))))))))))))))))))))))))))))))))))))))))))))))))))))))))))))))))))
* * 2-5 6-11 12-19 20-39 40-59 60 and older* *)))))) )))))) ))))))))))))))) ))))))))))))))) ))))))))))))))) )))))))))))))))
Statistic * All individuals * Males Males* age 2 and over * and and Males Females Males Females Males Females Males Females* *females females
)))))))))))))))))))))))))))))))))))))))))))))))))))))))))))))))))))))))))))))))))))))))))))))))))))))))))))))))))))))))))))))))))))
Number in sample 14,262 2,109 1,432 696 702 1,543 1,449 1,663 1,694 1,545 1,429
Percent of persons using ))))))))))))))))))))))))))))))))))))))))))))%)))))))))))))))))))))))))))))))))))))))))))))
at least once in 2 days 92.9 92.1 94.7 93.2 90.4 94.9 90.8 93.4 91.8 94.4 93.3 on 1 of 2 days 28.0 30.5 28.1 27.8 32.9 26.7 34.8 25.5 26.0 21.4 24.2 on both days 65.0 61.5 66.7 65.4 57.5 68.3 56.1 67.9 65.8 73.0 69.1
Quantity consumed in a day ))))))))))))))))))))))))))))))))))))))))))))g)))))))))))))))))))))))))))))))))))))))))))))(1 slice = 26 g)
Mean 79 51 65 95 68 110 71 91 71 80 63 SEM 2 1 2 3 2 9 1 3 1 2 1
5th percentile 13 8 11 18 9 20 10 15 15 17 12 10th percentile 24 15 23 33 20 35 22 28 24 26 23 25th percentile 43 26 40 52 42 52 43 50 43 46 34 50th percentile 62 48 54 86 55 89 56 75 57 69 52 75th percentile 102 67 87 123 90 135 95 114 94 104 83 90th percentile 145 95 114 183 124 190 132 164 123 143 110 95th percentile 181 108 141 213 148 253 155 199 153 175 135
)))))))))))))))))))))))))))))))))))))))))))))))))))))))))))))))))))))))))))))))))))))))))))))))))))))))))))))))))))))))))))))))))))
* Indicates a statistic that is potentially unreliable because of small sample size or large coefficient of variation.# Indicates a percentage that is greater than 0 but less than 0.05 or a mean, SEM, or percentile that is greater than 0 but less than 0.5.--- Indicates a percentile that could not be estimated.Note: See "Table notes."Source: USDA's Continuing Survey of Food Intakes by Individuals, 1994-96, 2 days.

121
Table 2.002. Total White Bread: Percentage of persons us ing food in 2 days and quantities consumed in a day.
)))))))))))))))))))))))))))))))))))))))))))))))))))))))))))))))))))))))))))))))))))))))))))))))))))))))))))))))))))))))))))))))))))
* * Age (years) and sex* *)))))))))))))))))))))))))))))))))))))))))))))))))))))))))))))))))))))))))))))))))
* * 2-5 6-11 12-19 20-39 40-59 60 and older* *)))))) )))))) ))))))))))))))) ))))))))))))))) ))))))))))))))) )))))))))))))))
Statistic * All individuals * Males Males* age 2 and over * and and Males Females Males Females Males Females Males Females* *females females
)))))))))))))))))))))))))))))))))))))))))))))))))))))))))))))))))))))))))))))))))))))))))))))))))))))))))))))))))))))))))))))))))))
Number in sample 14,262 2,109 1,432 696 702 1,543 1,449 1,663 1,694 1,545 1,429
Percent of persons using ))))))))))))))))))))))))))))))))))))))))))))%)))))))))))))))))))))))))))))))))))))))))))))
at least once in 2 days 86.1 86.5 89.9 90.7 85.8 89.6 83.3 86.3 83.3 85.2 81.9 on 1 of 2 days 35.6 37.9 33.5 33.3 38.6 33.9 39.7 34.8 33.9 32.9 36.5 on both days 50.5 48.6 56.4 57.5 47.3 55.7 43.6 51.5 49.4 52.3 45.4
Quantity consumed in a day ))))))))))))))))))))))))))))))))))))))))))))g)))))))))))))))))))))))))))))))))))))))))))))(1 slice = 26 g)
Mean 70 45 61 88 62 93 65 81 61 68 51 SEM 1 1 1 2 2 2 2 3 1 2 1
5th percentile 8 4 8 11 6 12 8 9 7 7 5 10th percentile 16 9 17 24 15 26 16 18 16 13 10 25th percentile 36 23 36 46 36 46 39 43 34 32 24 50th percentile 53 43 52 75 52 79 52 64 52 52 47 75th percentile 93 58 83 114 86 124 86 104 82 93 70 90th percentile 135 86 110 174 114 176 127 153 111 133 98 95th percentile 170 102 138 213 141 221 144 189 136 166 115
)))))))))))))))))))))))))))))))))))))))))))))))))))))))))))))))))))))))))))))))))))))))))))))))))))))))))))))))))))))))))))))))))))
* Indicates a statistic that is potentially unreliable because of small sample size or large coefficient of variation.# Indicates a percentage that is greater than 0 but less than 0.05 or a mean, SEM, or percentile that is greater than 0 but less than 0.5.--- Indicates a percentile that could not be estimated.Note: See "Table notes."Source: USDA's Continuing Survey of Food Intakes by Individuals, 1994-96, 2 days.

122
Table 2.003. Total Whole Gra in and "Wheat" Bread: Percentage of persons using food in 2 days and quantities consumed in a day.
)))))))))))))))))))))))))))))))))))))))))))))))))))))))))))))))))))))))))))))))))))))))))))))))))))))))))))))))))))))))))))))))))))
* * Age (years) and sex* *)))))))))))))))))))))))))))))))))))))))))))))))))))))))))))))))))))))))))))))))))
* * 2-5 6-11 12-19 20-39 40-59 60 and older* *)))))) )))))) ))))))))))))))) ))))))))))))))) ))))))))))))))) )))))))))))))))
Statistic * All individuals * Males Males* age 2 and over * and and Males Females Males Females Males Females Males Females* *females females
)))))))))))))))))))))))))))))))))))))))))))))))))))))))))))))))))))))))))))))))))))))))))))))))))))))))))))))))))))))))))))))))))))
Number in sample 14,262 2,109 1,432 696 702 1,543 1,449 1,663 1,694 1,545 1,429
Percent of persons using ))))))))))))))))))))))))))))))))))))))))))))%)))))))))))))))))))))))))))))))))))))))))))))
at least once in 2 days 32.6 26.2 24.3 20.0 21.2 31.4 30.5 36.7 38.0 42.9 45.8 on 1 of 2 days 22.3 17.9 18.1 14.3 15.6 23.6 23.3 24.5 24.9 25.6 26.8 on both days 10.2 8.4 6.2 5.7 5.7 7.9 7.2 12.2 13.1 17.3 19.1
Quantity consumed in a day ))))))))))))))))))))))))))))))))))))))))))))g)))))))))))))))))))))))))))))))))))))))))))))(1 slice = 28 g)
Mean 61 43 52 73 58 74 57 70 56 66 52 SEM 1 1 2 4 3 3 2 2 2 1 2
5th percentile 24 12 20 32 * 24 * 27 23 24 23 24 23 10th percentile 25 18 24 38 * 27 35 25 28 25 26 24 25th percentile 42 25 27 49 46 49 39 49 31 46 27 50th percentile 52 39 50 55 54 56 52 55 50 52 49 75th percentile 72 56 56 97 58 94 64 84 63 82 56 90th percentile 105 73 84 115 * 95 122 91 113 96 108 92 95th percentile 128 99 111 143 * 109 * 156 109 158 106 130 105
)))))))))))))))))))))))))))))))))))))))))))))))))))))))))))))))))))))))))))))))))))))))))))))))))))))))))))))))))))))))))))))))))))
* Indicates a statistic that is potentially unreliable because of small sample size or large coefficient of variation.# Indicates a percentage that is greater than 0 but less than 0.05 or a mean, SEM, or percentile that is greater than 0 but less than 0.5.--- Indicates a percentile that could not be estimated.Note: See "Table notes."Source: USDA's Continuing Survey of Food Intakes by Individuals, 1994-96, 2 days.

123
Table 2.004. Biscuits: Percentage of persons using food in 2 days and quanti ties consumed in a day.
)))))))))))))))))))))))))))))))))))))))))))))))))))))))))))))))))))))))))))))))))))))))))))))))))))))))))))))))))))))))))))))))))))
* * Age (years) and sex* *)))))))))))))))))))))))))))))))))))))))))))))))))))))))))))))))))))))))))))))))))
* * 2-5 6-11 12-19 20-39 40-59 60 and older* *)))))) )))))) ))))))))))))))) ))))))))))))))) ))))))))))))))) )))))))))))))))
Statistic * All individuals * Males Males* age 2 and over * and and Males Females Males Females Males Females Males Females* *females females
)))))))))))))))))))))))))))))))))))))))))))))))))))))))))))))))))))))))))))))))))))))))))))))))))))))))))))))))))))))))))))))))))))
Number in sample 14,262 2,109 1,432 696 702 1,543 1,449 1,663 1,694 1,545 1,429
Percent of persons using ))))))))))))))))))))))))))))))))))))))))))))%)))))))))))))))))))))))))))))))))))))))))))))
at least once in 2 days 10.9 8.3 9.7 12.2 10.3 11.5 9.4 13.4 11.2 13.0 9.8 on 1 of 2 days 9.5 7.8 9.2 10.6 9.5 9.8 8.7 11.7 9.1 10.1 8.3 on both days 1.4 0.5 * 0.6 * 1.6 * 0.8 * 1.7 0.7 * 1.7 2.1 2.9 1.5
Quantity consumed in a day ))))))))))))))))))))))))))))))))))))))))))))g)))))))))))))))))))))))))))))))))))))))))))))(1 biscuit = 30 g)
Mean 64 39 49 71 59 78 57 83 59 62 53 SEM 1 2 3 4 6 3 3 3 2 3 4
5th percentile 19 7 * 12 * 17 * 17 * 29 * 18 * 21 * 19 * 19 * 15 * 10th percentile 19 11 19 28 * 18 * 30 19 30 19 19 19 25th percentile 37 19 19 39 29 44 30 49 30 37 28 50th percentile 57 30 38 59 38 67 50 66 57 57 38 75th percentile 77 50 60 90 75 89 74 102 67 75 66 90th percentile 118 77 92 118 * 100 * 150 97 153 98 108 93 95th percentile 152 92 * 110 * 136 * 132 * 162 * 122 * 195 * 145 * 125 * 128 *
)))))))))))))))))))))))))))))))))))))))))))))))))))))))))))))))))))))))))))))))))))))))))))))))))))))))))))))))))))))))))))))))))))
* Indicates a statistic that is potentially unreliable because of small sample size or large coefficient of variation.# Indicates a percentage that is greater than 0 but less than 0.05 or a mean, SEM, or percentile that is greater than 0 but less than 0.5.--- Indicates a percentile that could not be estimated.Note: See "Table notes."Source: USDA's Continuing Survey of Food Intakes by Individuals, 1994-96, 2 days.

124
Table 2.005. Torti llas: Percentage of persons using food in 2 days and quanti ties consumed in a day.
)))))))))))))))))))))))))))))))))))))))))))))))))))))))))))))))))))))))))))))))))))))))))))))))))))))))))))))))))))))))))))))))))))
* * Age (years) and sex* *)))))))))))))))))))))))))))))))))))))))))))))))))))))))))))))))))))))))))))))))))
* * 2-5 6-11 12-19 20-39 40-59 60 and older* *)))))) )))))) ))))))))))))))) ))))))))))))))) ))))))))))))))) )))))))))))))))
Statistic * All individuals * Males Males* age 2 and over * and and Males Females Males Females Males Females Males Females* *females females
)))))))))))))))))))))))))))))))))))))))))))))))))))))))))))))))))))))))))))))))))))))))))))))))))))))))))))))))))))))))))))))))))))
Number in sample 14,262 2,109 1,432 696 702 1,543 1,449 1,663 1,694 1,545 1,429
Percent of persons using ))))))))))))))))))))))))))))))))))))))))))))%)))))))))))))))))))))))))))))))))))))))))))))
at least once in 2 days 15.5 14.6 16.4 22.9 20.1 20.6 20.1 13.4 12.7 4.2 5.4 on 1 of 2 days 12.5 12.2 13.6 17.7 17.2 15.6 16.1 11.2 10.8 3.3 4.6 on both days 3.0 2.4 2.9 5.2 2.8 5.0 4.0 2.2 1.9 0.9 0.8 *
Quantity consumed in a day ))))))))))))))))))))))))))))))))))))))))))))g)))))))))))))))))))))))))))))))))))))))))))))(1 7-inch round corn tortilla = 25 g)
Mean 68 36 52 87 59 94 61 75 57 56 44 SEM 2 3 3 7 3 4 2 4 3 4 3
5th percentile 14 7 13 24 * 19 * 24 15 15 * 13 * 14 * 17 * 10th percentile 21 11 14 27 22 32 23 24 22 17 * 20 * 25th percentile 33 18 24 40 33 43 33 38 31 25 26 50th percentile 50 26 43 68 50 75 48 57 45 43 38 75th percentile 86 43 67 108 78 111 75 92 71 67 51 90th percentile 133 67 100 184 103 179 114 143 97 117 * 80 * 95th percentile 177 88 145 225 * 129 * 226 135 191 * 126 * 146 * 100 *
)))))))))))))))))))))))))))))))))))))))))))))))))))))))))))))))))))))))))))))))))))))))))))))))))))))))))))))))))))))))))))))))))))
* Indicates a statistic that is potentially unreliable because of small sample size or large coefficient of variation.# Indicates a percentage that is greater than 0 but less than 0.05 or a mean, SEM, or percentile that is greater than 0 but less than 0.5.--- Indicates a percentile that could not be estimated.Note: See "Table notes."Source: USDA's Continuing Survey of Food Intakes by Individuals, 1994-96, 2 days.

125
Table 2.006. Quickbreads and Muff ins: Percentage of persons using food in 2 days and quantit ies consumed in a day.
)))))))))))))))))))))))))))))))))))))))))))))))))))))))))))))))))))))))))))))))))))))))))))))))))))))))))))))))))))))))))))))))))))
* * Age (years) and sex* *)))))))))))))))))))))))))))))))))))))))))))))))))))))))))))))))))))))))))))))))))
* * 2-5 6-11 12-19 20-39 40-59 60 and older* *)))))) )))))) ))))))))))))))) ))))))))))))))) ))))))))))))))) )))))))))))))))
Statistic * All individuals * Males Males* age 2 and over * and and Males Females Males Females Males Females Males Females* *females females
)))))))))))))))))))))))))))))))))))))))))))))))))))))))))))))))))))))))))))))))))))))))))))))))))))))))))))))))))))))))))))))))))))
Number in sample 14,262 2,109 1,432 696 702 1,543 1,449 1,663 1,694 1,545 1,429
Percent of persons using ))))))))))))))))))))))))))))))))))))))))))))%)))))))))))))))))))))))))))))))))))))))))))))
at least once in 2 days 12.5 9.6 9.6 11.0 11.0 8.0 11.3 15.7 14.9 17.4 18.3 on 1 of 2 days 10.9 9.1 8.3 9.9 10.7 7.3 10.2 13.0 13.3 13.8 15.1 on both days 1.6 0.6 * 1.3 1.0 * 0.3 * 0.7 * 1.1 2.6 1.7 3.6 3.1
Quantity consumed in a day ))))))))))))))))))))))))))))))))))))))))))))g)))))))))))))))))))))))))))))))))))))))))))))(1 medium bran muffin = 57 g)
Mean 87 59 71 137 82 101 82 102 74 93 78 SEM 3 4 5 13 10 8 5 8 4 7 4
5th percentile 21 10 * 13 * 37 * 11 * 24 * 23 * 28 20 * 21 12 10th percentile 28 15 26 * 45 * 19 * 42 * 36 41 28 28 21 25th percentile 55 28 48 63 44 57 56 56 45 49 44 50th percentile 63 54 57 111 62 71 57 71 57 61 60 75th percentile 112 70 85 168 107 114 85 116 89 113 100 90th percentile 157 112 120 * 291 * 149 * 171 * 140 171 114 168 128 95th percentile 220 126 * 152 * 352 * 177 * 237 * 178 * 241 139 * 243 193
)))))))))))))))))))))))))))))))))))))))))))))))))))))))))))))))))))))))))))))))))))))))))))))))))))))))))))))))))))))))))))))))))))
* Indicates a statistic that is potentially unreliable because of small sample size or large coefficient of variation.# Indicates a percentage that is greater than 0 but less than 0.05 or a mean, SEM, or percentile that is greater than 0 but less than 0.5.--- Indicates a percentile that could not be estimated.Note: See "Table notes."Source: USDA's Continuing Survey of Food Intakes by Individuals, 1994-96, 2 days.

126
Table 2.007. Doughnuts and Sweet Rolls: Percentage of persons using food in 2 days and quantit ies consumed in a day.
)))))))))))))))))))))))))))))))))))))))))))))))))))))))))))))))))))))))))))))))))))))))))))))))))))))))))))))))))))))))))))))))))))
* * Age (years) and sex* *)))))))))))))))))))))))))))))))))))))))))))))))))))))))))))))))))))))))))))))))))
* * 2-5 6-11 12-19 20-39 40-59 60 and older* *)))))) )))))) ))))))))))))))) ))))))))))))))) ))))))))))))))) )))))))))))))))
Statistic * All individuals * Males Males* age 2 and over * and and Males Females Males Females Males Females Males Females* *females females
)))))))))))))))))))))))))))))))))))))))))))))))))))))))))))))))))))))))))))))))))))))))))))))))))))))))))))))))))))))))))))))))))))
Number in sample 14,262 2,109 1,432 696 702 1,543 1,449 1,663 1,694 1,545 1,429
Percent of persons using ))))))))))))))))))))))))))))))))))))))))))))%)))))))))))))))))))))))))))))))))))))))))))))
at least once in 2 days 12.4 11.3 13.4 17.3 13.8 13.3 11.2 13.4 11.0 11.4 10.4 on 1 of 2 days 11.3 10.7 12.5 15.4 13.1 11.9 10.5 12.1 9.5 10.2 9.1 on both days 1.1 0.6 * 0.9 1.9 0.7 * 1.4 0.6 * 1.3 1.5 1.2 1.2
Quantity consumed in a day ))))))))))))))))))))))))))))))))))))))))))))g)))))))))))))))))))))))))))))))))))))))))))))(1 medium sweet roll = 60 g)
Mean 83 63 73 109 90 102 74 93 75 72 58 SEM 2 4 3 12 8 6 3 3 4 3 2
5th percentile 26 22 * 26 * 40 * 23 * 28 * 26 * 30 * 21 * 26 * 16 * 10th percentile 37 26 36 44 * 28 * 40 37 41 36 32 25 25th percentile 49 38 47 53 47 59 47 54 52 46 41 50th percentile 65 53 59 74 64 83 62 74 60 59 55 75th percentile 101 71 83 120 113 121 84 117 86 83 71 90th percentile 146 109 119 266 * 150 * 174 133 163 118 117 85 95th percentile 180 126 * 153 * 280 * 179 * 244 * 160 * 198 * 144 * 158 * 111 *
)))))))))))))))))))))))))))))))))))))))))))))))))))))))))))))))))))))))))))))))))))))))))))))))))))))))))))))))))))))))))))))))))))
* Indicates a statistic that is potentially unreliable because of small sample size or large coefficient of variation.# Indicates a percentage that is greater than 0 but less than 0.05 or a mean, SEM, or percentile that is greater than 0 but less than 0.5.--- Indicates a percentile that could not be estimated.Note: See "Table notes."Source: USDA's Continuing Survey of Food Intakes by Individuals, 1994-96, 2 days.
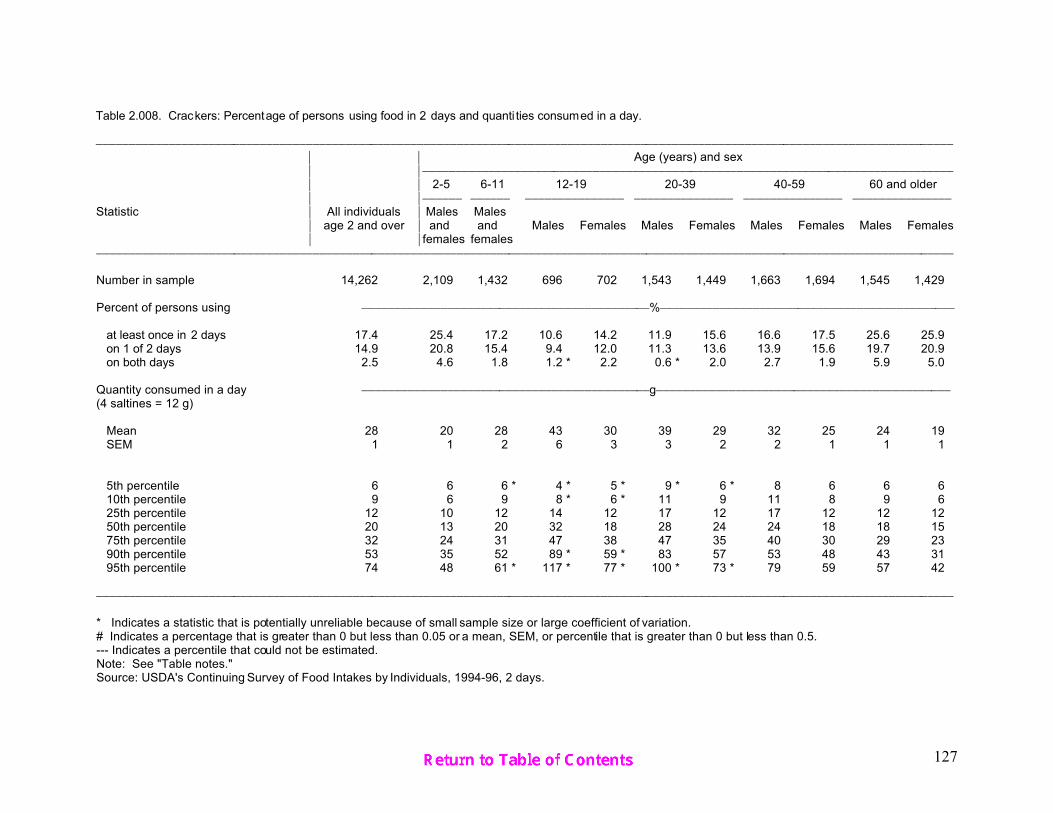
127
Table 2.008. Crackers: Percentage of persons using food in 2 days and quanti ties consumed in a day.
)))))))))))))))))))))))))))))))))))))))))))))))))))))))))))))))))))))))))))))))))))))))))))))))))))))))))))))))))))))))))))))))))))
* * Age (years) and sex* *)))))))))))))))))))))))))))))))))))))))))))))))))))))))))))))))))))))))))))))))))
* * 2-5 6-11 12-19 20-39 40-59 60 and older* *)))))) )))))) ))))))))))))))) ))))))))))))))) ))))))))))))))) )))))))))))))))
Statistic * All individuals * Males Males* age 2 and over * and and Males Females Males Females Males Females Males Females* *females females
)))))))))))))))))))))))))))))))))))))))))))))))))))))))))))))))))))))))))))))))))))))))))))))))))))))))))))))))))))))))))))))))))))
Number in sample 14,262 2,109 1,432 696 702 1,543 1,449 1,663 1,694 1,545 1,429
Percent of persons using ))))))))))))))))))))))))))))))))))))))))))))%)))))))))))))))))))))))))))))))))))))))))))))
at least once in 2 days 17.4 25.4 17.2 10.6 14.2 11.9 15.6 16.6 17.5 25.6 25.9 on 1 of 2 days 14.9 20.8 15.4 9.4 12.0 11.3 13.6 13.9 15.6 19.7 20.9 on both days 2.5 4.6 1.8 1.2 * 2.2 0.6 * 2.0 2.7 1.9 5.9 5.0
Quantity consumed in a day ))))))))))))))))))))))))))))))))))))))))))))g)))))))))))))))))))))))))))))))))))))))))))))(4 saltines = 12 g)
Mean 28 20 28 43 30 39 29 32 25 24 19 SEM 1 1 2 6 3 3 2 2 1 1 1
5th percentile 6 6 6 * 4 * 5 * 9 * 6 * 8 6 6 6 10th percentile 9 6 9 8 * 6 * 11 9 11 8 9 6 25th percentile 12 10 12 14 12 17 12 17 12 12 12 50th percentile 20 13 20 32 18 28 24 24 18 18 15 75th percentile 32 24 31 47 38 47 35 40 30 29 23 90th percentile 53 35 52 89 * 59 * 83 57 53 48 43 31 95th percentile 74 48 61 * 117 * 77 * 100 * 73 * 79 59 57 42
)))))))))))))))))))))))))))))))))))))))))))))))))))))))))))))))))))))))))))))))))))))))))))))))))))))))))))))))))))))))))))))))))))
* Indicates a statistic that is potentially unreliable because of small sample size or large coefficient of variation.# Indicates a percentage that is greater than 0 but less than 0.05 or a mean, SEM, or percentile that is greater than 0 but less than 0.5.--- Indicates a percentile that could not be estimated.Note: See "Table notes."Source: USDA's Continuing Survey of Food Intakes by Individuals, 1994-96, 2 days.

128
Table 2.009. Cook ies: Percentage of persons using food in 2 days and quantit ies consumed in a day.
)))))))))))))))))))))))))))))))))))))))))))))))))))))))))))))))))))))))))))))))))))))))))))))))))))))))))))))))))))))))))))))))))))
* * Age (years) and sex* *)))))))))))))))))))))))))))))))))))))))))))))))))))))))))))))))))))))))))))))))))
* * 2-5 6-11 12-19 20-39 40-59 60 and older* *)))))) )))))) ))))))))))))))) ))))))))))))))) ))))))))))))))) )))))))))))))))
Statistic * All individuals * Males Males* age 2 and over * and and Males Females Males Females Males Females Males Females* *females females
)))))))))))))))))))))))))))))))))))))))))))))))))))))))))))))))))))))))))))))))))))))))))))))))))))))))))))))))))))))))))))))))))))
Number in sample 14,262 2,109 1,432 696 702 1,543 1,449 1,663 1,694 1,545 1,429
Percent of persons using ))))))))))))))))))))))))))))))))))))))))))))%)))))))))))))))))))))))))))))))))))))))))))))
at least once in 2 days 30.7 51.0 46.7 29.0 31.8 20.8 26.5 27.6 29.0 29.7 32.2 on 1 of 2 days 23.4 37.9 35.0 21.5 24.6 15.9 21.2 21.6 23.4 20.5 23.5 on both days 7.3 13.1 11.8 7.4 7.2 4.8 5.2 6.0 5.7 9.2 8.8
Quantity consumed in a day ))))))))))))))))))))))))))))))))))))))))))))g)))))))))))))))))))))))))))))))))))))))))))))(1 medium = 10 g)
Mean 45 33 42 59 46 63 43 51 39 45 32 SEM 1 1 2 4 2 4 2 2 2 2 1
5th percentile 9 6 7 10 * 8 * 10 9 10 8 9 8 10th percentile 11 10 10 15 10 14 11 15 11 12 10 25th percentile 20 15 19 29 23 28 20 26 20 21 16 50th percentile 32 28 32 47 39 50 30 42 31 32 28 75th percentile 57 41 50 72 60 77 55 64 49 57 43 90th percentile 84 60 78 112 86 126 83 92 73 96 63 95th percentile 114 81 100 132 * 109 * 163 112 128 90 119 74
)))))))))))))))))))))))))))))))))))))))))))))))))))))))))))))))))))))))))))))))))))))))))))))))))))))))))))))))))))))))))))))))))))
* Indicates a statistic that is potentially unreliable because of small sample size or large coefficient of variation.# Indicates a percentage that is greater than 0 but less than 0.05 or a mean, SEM, or percentile that is greater than 0 but less than 0.5.--- Indicates a percentile that could not be estimated.Note: See "Table notes."Source: USDA's Continuing Survey of Food Intakes by Individuals, 1994-96, 2 days.

129
Table 2.010. Cake: Percentage of persons using food in 2 days and quantities consumed in a day.
)))))))))))))))))))))))))))))))))))))))))))))))))))))))))))))))))))))))))))))))))))))))))))))))))))))))))))))))))))))))))))))))))))
* * Age (years) and sex* *)))))))))))))))))))))))))))))))))))))))))))))))))))))))))))))))))))))))))))))))))
* * 2-5 6-11 12-19 20-39 40-59 60 and older* *)))))) )))))) ))))))))))))))) ))))))))))))))) ))))))))))))))) )))))))))))))))
Statistic * All individuals * Males Males* age 2 and over * and and Males Females Males Females Males Females Males Females* *females females
)))))))))))))))))))))))))))))))))))))))))))))))))))))))))))))))))))))))))))))))))))))))))))))))))))))))))))))))))))))))))))))))))))
Number in sample 14,262 2,109 1,432 696 702 1,543 1,449 1,663 1,694 1,545 1,429
Percent of persons using ))))))))))))))))))))))))))))))))))))))))))))%)))))))))))))))))))))))))))))))))))))))))))))
at least once in 2 days 16.2 14.6 19.7 15.1 15.5 13.5 14.9 16.5 16.8 19.2 18.3 on 1 of 2 days 14.7 13.6 18.4 13.8 14.0 12.4 13.3 14.4 15.6 17.3 16.3 on both days 1.5 1.0 1.3 1.4 * 1.5 * 1.0 1.6 2.2 1.3 2.0 1.9
Quantity consumed in a day ))))))))))))))))))))))))))))))))))))))))))))g)))))))))))))))))))))))))))))))))))))))))))))(1/12 of a frosted cake = 109 g)
Mean 100 73 85 109 92 123 103 122 91 90 95 SEM 3 3 6 10 8 9 8 7 5 4 7
5th percentile 22 15 20 37 * 22 * 31 * 22 * 25 15 20 15 10th percentile 28 25 27 40 * 29 * 39 25 36 25 29 24 25th percentile 40 39 39 44 40 58 40 53 40 41 40 50th percentile 80 53 57 80 76 103 80 88 73 71 66 75th percentile 122 102 109 150 114 172 131 149 121 117 109 90th percentile 194 142 161 189 * 162 * 221 215 229 177 162 176 95th percentile 251 169 203 283 * 218 * 316 * 254 * 321 216 217 281
)))))))))))))))))))))))))))))))))))))))))))))))))))))))))))))))))))))))))))))))))))))))))))))))))))))))))))))))))))))))))))))))))))
* Indicates a statistic that is potentially unreliable because of small sample size or large coefficient of variation.# Indicates a percentage that is greater than 0 but less than 0.05 or a mean, SEM, or percentile that is greater than 0 but less than 0.5.--- Indicates a percentile that could not be estimated.Note: See "Table notes."Source: USDA's Continuing Survey of Food Intakes by Individuals, 1994-96, 2 days.

130
Table 2.011. Pie: Percentage of persons using food in 2 days and quantities consumed in a day.
)))))))))))))))))))))))))))))))))))))))))))))))))))))))))))))))))))))))))))))))))))))))))))))))))))))))))))))))))))))))))))))))))))
* * Age (years) and sex* *)))))))))))))))))))))))))))))))))))))))))))))))))))))))))))))))))))))))))))))))))
* * 2-5 6-11 12-19 20-39 40-59 60 and older* *)))))) )))))) ))))))))))))))) ))))))))))))))) ))))))))))))))) )))))))))))))))
Statistic * All individuals * Males Males* age 2 and over * and and Males Females Males Females Males Females Males Females* *females females
)))))))))))))))))))))))))))))))))))))))))))))))))))))))))))))))))))))))))))))))))))))))))))))))))))))))))))))))))))))))))))))))))))
Number in sample 14,262 2,109 1,432 696 702 1,543 1,449 1,663 1,694 1,545 1,429
Percent of persons using ))))))))))))))))))))))))))))))))))))))))))))%)))))))))))))))))))))))))))))))))))))))))))))
at least once in 2 days 8.5 2.9 5.6 6.6 4.8 5.8 7.2 11.8 9.9 16.4 13.3 on 1 of 2 days 7.9 2.8 5.5 6.5 4.7 5.6 6.9 11.1 9.3 14.2 12.1 on both days 0.5 0.1 * 0.2 * 0.1 * 0.1 * 0.1 * 0.3 * 0.7 * 0.5 * 2.3 1.3
Quantity consumed in a day ))))))))))))))))))))))))))))))))))))))))))))g)))))))))))))))))))))))))))))))))))))))))))))(1/8 of a 9-inch cream pie = 144 g)
Mean 162 80 132 194 164 * 176 158 177 158 168 148 SEM 4 10 14 17 17 * 10 10 8 9 7 5
5th percentile 51 3 * 40 * 70 * 49 * 55 * 50 * 76 * 47 * 56 * 43 * 10th percentile 72 8 * 53 * 86 * 73 * 83 * 76 * 93 68 75 70 25th percentile 108 38 76 116 * 107 * 115 108 120 111 113 100 50th percentile 144 69 110 144 129 149 148 149 146 147 143 75th percentile 189 101 151 269 * 160 * 219 184 217 168 195 158 90th percentile 288 150 * 202 * 326 * 273 * 297 * 271 * 300 258 289 236 95th percentile 336 206 * 276 * 357 * 352 * 330 * 361 * 328 * 307 * 350 * 303 *
)))))))))))))))))))))))))))))))))))))))))))))))))))))))))))))))))))))))))))))))))))))))))))))))))))))))))))))))))))))))))))))))))))
* Indicates a statistic that is potentially unreliable because of small sample size or large coefficient of variation.# Indicates a percentage that is greater than 0 but less than 0.05 or a mean, SEM, or percentile that is greater than 0 but less than 0.5.--- Indicates a percentile that could not be estimated.Note: See "Table notes."Source: USDA's Continuing Survey of Food Intakes by Individuals, 1994-96, 2 days.

131
Table 2.012. Pancakes and W affles: Percentage of persons using food in 2 days and quantities consumed in a day.
)))))))))))))))))))))))))))))))))))))))))))))))))))))))))))))))))))))))))))))))))))))))))))))))))))))))))))))))))))))))))))))))))))
* * Age (years) and sex* *)))))))))))))))))))))))))))))))))))))))))))))))))))))))))))))))))))))))))))))))))
* * 2-5 6-11 12-19 20-39 40-59 60 and older* *)))))) )))))) ))))))))))))))) ))))))))))))))) ))))))))))))))) )))))))))))))))
Statistic * All individuals * Males Males* age 2 and over * and and Males Females Males Females Males Females Males Females* *females females
)))))))))))))))))))))))))))))))))))))))))))))))))))))))))))))))))))))))))))))))))))))))))))))))))))))))))))))))))))))))))))))))))))
Number in sample 14,262 2,109 1,432 696 702 1,543 1,449 1,663 1,694 1,545 1,429
Percent of persons using ))))))))))))))))))))))))))))))))))))))))))))%)))))))))))))))))))))))))))))))))))))))))))))
at least once in 2 days 10.3 19.1 21.5 13.5 8.2 8.0 7.4 7.5 8.0 10.8 8.2 on 1 of 2 days 9.1 15.7 18.2 12.2 7.5 7.4 6.5 6.8 7.0 8.8 7.3 on both days 1.3 3.4 3.3 1.3 * 0.6 * 0.6 * 0.8 * 0.8 * 1.0 2.0 0.8 *
Quantity consumed in a day ))))))))))))))))))))))))))))))))))))))))))))g)))))))))))))))))))))))))))))))))))))))))))))(1 5-inch pancake = 40 g)
Mean 86 50 77 97 76 127 80 114 74 100 69 SEM 3 2 3 7 6 15 6 7 5 6 4
5th percentile 21 13 21 29 * 17 * 38 * 17 * 38 * 20 * 34 * 18 * 10th percentile 34 20 34 40 * 24 * 42 * 29 * 40 30 40 21 * 25th percentile 42 32 41 64 41 74 40 63 39 57 39 50th percentile 75 40 72 80 75 107 73 91 63 90 55 75th percentile 109 67 101 112 93 160 99 151 88 120 79 90th percentile 158 81 120 163 * 138 * 215 * 126 * 196 131 159 126 * 95th percentile 205 106 148 205 * 143 * 220 * 165 * 276 * 162 * 195 * 162 *
)))))))))))))))))))))))))))))))))))))))))))))))))))))))))))))))))))))))))))))))))))))))))))))))))))))))))))))))))))))))))))))))))))
* Indicates a statistic that is potentially unreliable because of small sample size or large coefficient of variation.# Indicates a percentage that is greater than 0 but less than 0.05 or a mean, SEM, or percentile that is greater than 0 but less than 0.5.--- Indicates a percentile that could not be estimated.Note: See "Table notes."Source: USDA's Continuing Survey of Food Intakes by Individuals, 1994-96, 2 days.

132
Table 2.013. Cooked Cereal: Percentage of persons using food in 2 days and quantities consumed in a day.
)))))))))))))))))))))))))))))))))))))))))))))))))))))))))))))))))))))))))))))))))))))))))))))))))))))))))))))))))))))))))))))))))))
* * Age (years) and sex* *)))))))))))))))))))))))))))))))))))))))))))))))))))))))))))))))))))))))))))))))))
* * 2-5 6-11 12-19 20-39 40-59 60 and older* *)))))) )))))) ))))))))))))))) ))))))))))))))) ))))))))))))))) )))))))))))))))
Statistic * All individuals * Males Males* age 2 and over * and and Males Females Males Females Males Females Males Females* *females females
)))))))))))))))))))))))))))))))))))))))))))))))))))))))))))))))))))))))))))))))))))))))))))))))))))))))))))))))))))))))))))))))))))
Number in sample 14,262 2,109 1,432 696 702 1,543 1,449 1,663 1,694 1,545 1,429
Percent of persons using ))))))))))))))))))))))))))))))))))))))))))))%)))))))))))))))))))))))))))))))))))))))))))))
at least once in 2 days 10.3 16.8 9.0 5.2 6.0 5.2 7.3 9.7 10.3 20.9 20.2 on 1 of 2 days 7.9 13.8 7.3 4.3 4.7 4.0 6.4 7.3 8.1 13.1 14.5 on both days 2.5 3.0 1.7 0.9 * 1.2 * 1.3 0.9 2.4 2.1 7.8 5.7
Quantity consumed in a day ))))))))))))))))))))))))))))))))))))))))))))g)))))))))))))))))))))))))))))))))))))))))))))(1/2 cup oatmeal = 117 g)
Mean 252 212 250 313 * 263 * 321 223 301 243 259 220 SEM 6 10 16 31 * 32 * 32 11 17 11 8 8
5th percentile 80 52 60 * 118 * 91 * 93 * 50 * 88 * 59 * 78 80 10th percentile 117 81 117 119 * 117 * 120 * 88 * 119 116 117 113 25th percentile 156 117 167 180 * 120 * 177 122 227 157 175 156 50th percentile 233 215 215 246 236 242 204 245 231 235 228 75th percentile 293 242 317 415 * 352 * 375 248 426 259 313 246 90th percentile 458 353 459 493 * 472 * 498 * 361 * 472 445 454 330 95th percentile 488 459 489 * 604 * 489 * 671 * 428 * 498 * 485 * 487 424
)))))))))))))))))))))))))))))))))))))))))))))))))))))))))))))))))))))))))))))))))))))))))))))))))))))))))))))))))))))))))))))))))))
* Indicates a statistic that is potentially unreliable because of small sample size or large coefficient of variation.# Indicates a percentage that is greater than 0 but less than 0.05 or a mean, SEM, or percentile that is greater than 0 but less than 0.5.--- Indicates a percentile that could not be estimated.Note: See "Table notes."Source: USDA's Continuing Survey of Food Intakes by Individuals, 1994-96, 2 days.

133
Table 2.014. Oatmeal: Percentage of persons using food in 2 days and quantit ies consumed in a day.
)))))))))))))))))))))))))))))))))))))))))))))))))))))))))))))))))))))))))))))))))))))))))))))))))))))))))))))))))))))))))))))))))))
* * Age (years) and sex* *)))))))))))))))))))))))))))))))))))))))))))))))))))))))))))))))))))))))))))))))))
* * 2-5 6-11 12-19 20-39 40-59 60 and older* *)))))) )))))) ))))))))))))))) ))))))))))))))) ))))))))))))))) )))))))))))))))
Statistic * All individuals * Males Males* age 2 and over * and and Males Females Males Females Males Females Males Females* *females females
)))))))))))))))))))))))))))))))))))))))))))))))))))))))))))))))))))))))))))))))))))))))))))))))))))))))))))))))))))))))))))))))))))
Number in sample 14,262 2,109 1,432 696 702 1,543 1,449 1,663 1,694 1,545 1,429
Percent of persons using ))))))))))))))))))))))))))))))))))))))))))))%)))))))))))))))))))))))))))))))))))))))))))))
at least once in 2 days 6.1 10.4 5.7 2.4 2.3 2.7 3.7 6.0 6.2 13.6 12.9 on 1 of 2 days 4.6 8.7 4.6 1.9 2.0 2.0 3.2 4.3 4.7 8.7 9.3 on both days 1.5 1.8 1.1 0.5 * 0.4 * 0.7 * 0.5 * 1.7 1.5 4.9 3.6
Quantity consumed in a day ))))))))))))))))))))))))))))))))))))))))))))g)))))))))))))))))))))))))))))))))))))))))))))(1/2 cup = 117 g)
Mean 267 225 265 364 * 326 * 379 * 263 320 242 255 228 SEM 6 10 20 51 * 39 * 48 * 18 15 10 10 10
5th percentile 116 116 * 114 * --- --- 165 * 84 * 102 * 76 * 90 * 98 * 10th percentile 117 116 117 * 159 * --- 176 * 97 * 175 * 116 * 115 116 25th percentile 176 117 176 198 * 193 * 230 * 164 229 166 175 161 50th percentile 232 231 200 328 310 317 217 267 230 229 228 75th percentile 345 236 337 428 * 387 * 449 * 321 416 253 312 234 90th percentile 456 352 441 * 566 * --- 485 * 418 * 459 * 369 * 404 324 95th percentile 469 448 * 490 * --- --- 919 * 472 * 473 * 436 * 470 * 353 *
)))))))))))))))))))))))))))))))))))))))))))))))))))))))))))))))))))))))))))))))))))))))))))))))))))))))))))))))))))))))))))))))))))
* Indicates a statistic that is potentially unreliable because of small sample size or large coefficient of variation.# Indicates a percentage that is greater than 0 but less than 0.05 or a mean, SEM, or percentile that is greater than 0 but less than 0.5.--- Indicates a percentile that could not be estimated.Note: See "Table notes."Source: USDA's Continuing Survey of Food Intakes by Individuals, 1994-96, 2 days.

134
Table 2.015. Ready-to-Eat Cereal: Percentage of persons using food in 2 days and quantities consumed in a day.
)))))))))))))))))))))))))))))))))))))))))))))))))))))))))))))))))))))))))))))))))))))))))))))))))))))))))))))))))))))))))))))))))))
* * Age (years) and sex* *)))))))))))))))))))))))))))))))))))))))))))))))))))))))))))))))))))))))))))))))))
* * 2-5 6-11 12-19 20-39 40-59 60 and older* *)))))) )))))) ))))))))))))))) ))))))))))))))) ))))))))))))))) )))))))))))))))
Statistic * All individuals * Males Males* age 2 and over * and and Males Females Males Females Males Females Males Females* *females females
)))))))))))))))))))))))))))))))))))))))))))))))))))))))))))))))))))))))))))))))))))))))))))))))))))))))))))))))))))))))))))))))))))
Number in sample 14,262 2,109 1,432 696 702 1,543 1,449 1,663 1,694 1,545 1,429
Percent of persons using ))))))))))))))))))))))))))))))))))))))))))))%)))))))))))))))))))))))))))))))))))))))))))))
at least once in 2 days 40.6 72.9 67.3 45.6 46.3 26.9 34.7 29.8 29.7 44.6 44.0 on 1 of 2 days 25.1 39.3 38.1 27.8 33.3 18.1 25.0 18.5 20.0 22.2 24.9 on both days 15.5 33.6 29.3 17.8 13.0 8.8 9.8 11.3 9.6 22.4 19.1
Quantity consumed in a day ))))))))))))))))))))))))))))))))))))))))))))g)))))))))))))))))))))))))))))))))))))))))))))(1 cup corn flakes = 25 g)
Mean 56 36 50 77 55 78 58 72 53 55 42 SEM 1 1 1 4 2 3 2 2 2 2 1
5th percentile 16 10 16 26 21 26 24 24 18 19 14 10th percentile 23 14 23 30 26 30 27 28 22 23 18 25th percentile 30 21 29 45 32 46 33 40 29 29 25 50th percentile 48 30 42 62 50 65 51 57 49 47 37 75th percentile 70 42 61 89 63 97 73 90 62 70 54 90th percentile 104 61 85 125 86 140 94 120 93 97 79 95th percentile 122 82 111 165 112 166 119 150 111 112 90
)))))))))))))))))))))))))))))))))))))))))))))))))))))))))))))))))))))))))))))))))))))))))))))))))))))))))))))))))))))))))))))))))))
* Indicates a statistic that is potentially unreliable because of small sample size or large coefficient of variation.# Indicates a percentage that is greater than 0 but less than 0.05 or a mean, SEM, or percentile that is greater than 0 but less than 0.5.--- Indicates a percentile that could not be estimated.Note: See "Table notes."Source: USDA's Continuing Survey of Food Intakes by Individuals, 1994-96, 2 days.

135
Table 2.016. Total Rice: Percentage of persons using food in 2 days and quantit ies consumed in a day.
)))))))))))))))))))))))))))))))))))))))))))))))))))))))))))))))))))))))))))))))))))))))))))))))))))))))))))))))))))))))))))))))))))
* * Age (years) and sex* *)))))))))))))))))))))))))))))))))))))))))))))))))))))))))))))))))))))))))))))))))
* * 2-5 6-11 12-19 20-39 40-59 60 and older* *)))))) )))))) ))))))))))))))) ))))))))))))))) ))))))))))))))) )))))))))))))))
Statistic * All individuals * Males Males* age 2 and over * and and Males Females Males Females Males Females Males Females* *females females
)))))))))))))))))))))))))))))))))))))))))))))))))))))))))))))))))))))))))))))))))))))))))))))))))))))))))))))))))))))))))))))))))))
Number in sample 14,262 2,109 1,432 696 702 1,543 1,449 1,663 1,694 1,545 1,429
Percent of persons using ))))))))))))))))))))))))))))))))))))))))))))%)))))))))))))))))))))))))))))))))))))))))))))
at least once in 2 days 31.1 32.7 28.0 26.4 31.9 33.1 35.0 32.3 32.2 27.6 25.4 on 1 of 2 days 23.9 24.5 22.1 19.3 25.6 25.7 26.8 24.4 24.4 21.4 19.3 on both days 7.3 8.2 5.9 7.1 6.3 7.5 8.2 7.9 7.8 6.3 6.1
Quantity consumed in a day ))))))))))))))))))))))))))))))))))))))))))))g)))))))))))))))))))))))))))))))))))))))))))))(1/2 cup regular rice = 79 g)
Mean 152 86 124 207 156 209 139 176 129 138 113 SEM 4 4 6 20 9 11 7 7 5 9 6
5th percentile 13 9 12 20 * 11 * 22 12 18 7 8 9 10th percentile 24 18 22 39 17 40 21 32 19 18 13 25th percentile 58 39 51 78 51 82 58 75 59 49 39 50th percentile 117 76 99 156 118 156 115 153 109 104 78 75th percentile 183 111 156 239 229 297 161 234 156 162 156 90th percentile 312 159 245 462 341 416 312 328 236 311 241 95th percentile 397 206 312 621 * 464 * 610 345 461 313 319 313
)))))))))))))))))))))))))))))))))))))))))))))))))))))))))))))))))))))))))))))))))))))))))))))))))))))))))))))))))))))))))))))))))))
* Indicates a statistic that is potentially unreliable because of small sample size or large coefficient of variation.# Indicates a percentage that is greater than 0 but less than 0.05 or a mean, SEM, or percentile that is greater than 0 but less than 0.5.--- Indicates a percentile that could not be estimated.Note: See "Table notes."Source: USDA's Continuing Survey of Food Intakes by Individuals, 1994-96, 2 days.

136
Table 2.017. Total Pasta: Percentage of persons using food in 2 days and quanti ties consumed in a day.
)))))))))))))))))))))))))))))))))))))))))))))))))))))))))))))))))))))))))))))))))))))))))))))))))))))))))))))))))))))))))))))))))))
* * Age (years) and sex* *)))))))))))))))))))))))))))))))))))))))))))))))))))))))))))))))))))))))))))))))))
* * 2-5 6-11 12-19 20-39 40-59 60 and older* *)))))) )))))) ))))))))))))))) ))))))))))))))) ))))))))))))))) )))))))))))))))
Statistic * All individuals * Males Males* age 2 and over * and and Males Females Males Females Males Females Males Females* *females females
)))))))))))))))))))))))))))))))))))))))))))))))))))))))))))))))))))))))))))))))))))))))))))))))))))))))))))))))))))))))))))))))))))
Number in sample 14,262 2,109 1,432 696 702 1,543 1,449 1,663 1,694 1,545 1,429
Percent of persons using ))))))))))))))))))))))))))))))))))))))))))))%)))))))))))))))))))))))))))))))))))))))))))))
at least once in 2 days 45.6 61.2 50.3 43.3 47.3 45.6 47.2 43.5 42.1 38.2 40.9 on 1 of 2 days 36.5 43.4 39.7 37.5 36.4 35.5 38.6 35.0 34.6 31.6 33.8 on both days 9.2 17.8 10.6 5.8 11.0 10.1 8.6 8.4 7.4 6.6 7.1
Quantity consumed in a day ))))))))))))))))))))))))))))))))))))))))))))g)))))))))))))))))))))))))))))))))))))))))))))(1 cup spaghetti = 140 g)
Mean 148 89 126 193 140 202 139 181 130 139 111 SEM 3 3 4 9 7 9 6 7 5 7 4
5th percentile 13 9 16 22 19 21 10 13 12 6 4 10th percentile 23 16 23 40 30 34 23 25 23 17 16 25th percentile 53 33 50 99 67 78 55 68 52 44 39 50th percentile 112 70 99 155 116 147 105 139 106 99 84 75th percentile 203 128 165 265 185 280 186 269 171 189 151 90th percentile 318 189 259 398 278 418 278 417 277 296 256 95th percentile 417 240 314 466 341 522 387 509 320 388 280
)))))))))))))))))))))))))))))))))))))))))))))))))))))))))))))))))))))))))))))))))))))))))))))))))))))))))))))))))))))))))))))))))))
* Indicates a statistic that is potentially unreliable because of small sample size or large coefficient of variation.# Indicates a percentage that is greater than 0 but less than 0.05 or a mean, SEM, or percentile that is greater than 0 but less than 0.5.--- Indicates a percentile that could not be estimated.Note: See "Table notes."Source: USDA's Continuing Survey of Food Intakes by Individuals, 1994-96, 2 days.

137
Table 2.018. Pizza: Percentage of persons using food in 2 days and quantities consumed in a day.
)))))))))))))))))))))))))))))))))))))))))))))))))))))))))))))))))))))))))))))))))))))))))))))))))))))))))))))))))))))))))))))))))))
* * Age (years) and sex* *)))))))))))))))))))))))))))))))))))))))))))))))))))))))))))))))))))))))))))))))))
* * 2-5 6-11 12-19 20-39 40-59 60 and older* *)))))) )))))) ))))))))))))))) ))))))))))))))) ))))))))))))))) )))))))))))))))
Statistic * All individuals * Males Males* age 2 and over * and and Males Females Males Females Males Females Males Females* *females females
)))))))))))))))))))))))))))))))))))))))))))))))))))))))))))))))))))))))))))))))))))))))))))))))))))))))))))))))))))))))))))))))))))
Number in sample 14,262 2,109 1,432 696 702 1,543 1,449 1,663 1,694 1,545 1,429
Percent of persons using ))))))))))))))))))))))))))))))))))))))))))))%)))))))))))))))))))))))))))))))))))))))))))))
at least once in 2 days 19.9 23.7 32.8 39.6 30.5 23.7 20.2 13.0 14.5 5.3 4.7 on 1 of 2 days 18.1 21.7 27.5 34.1 27.9 21.8 18.9 12.6 13.9 5.0 4.5 on both days 1.8 2.1 5.3 5.5 2.6 2.0 1.3 0.4 * 0.6 * 0.3 * 0.2 *
Quantity consumed in a day ))))))))))))))))))))))))))))))))))))))))))))g)))))))))))))))))))))))))))))))))))))))))))))(1 slice, thin crust = 71 g)
Mean 175 92 115 220 148 264 151 220 149 188 108 SEM 5 4 6 13 8 13 6 13 9 18 8
5th percentile 34 19 30 49 34 * 46 42 65 * 40 * 45 * 30 * 10th percentile 51 27 41 64 40 68 54 87 51 62 * 31 * 25th percentile 77 45 63 83 65 152 85 125 76 89 48 50th percentile 142 76 86 158 124 213 142 187 138 147 84 75th percentile 216 118 142 283 202 354 186 276 189 228 158 90th percentile 351 166 213 440 284 508 278 397 280 377 * 189 * 95th percentile 455 231 269 562 338 * 601 315 504 * 316 * 395 * 212 *
)))))))))))))))))))))))))))))))))))))))))))))))))))))))))))))))))))))))))))))))))))))))))))))))))))))))))))))))))))))))))))))))))))
* Indicates a statistic that is potentially unreliable because of small sample size or large coefficient of variation.# Indicates a percentage that is greater than 0 but less than 0.05 or a mean, SEM, or percentile that is greater than 0 but less than 0.5.--- Indicates a percentile that could not be estimated.Note: See "Table notes."Source: USDA's Continuing Survey of Food Intakes by Individuals, 1994-96, 2 days.

138
Table 2.019. Total Raw Cucumbers: Percentage of persons using food in 2 days and quantities consumed in a day.
)))))))))))))))))))))))))))))))))))))))))))))))))))))))))))))))))))))))))))))))))))))))))))))))))))))))))))))))))))))))))))))))))))
* * Age (years) and sex* *)))))))))))))))))))))))))))))))))))))))))))))))))))))))))))))))))))))))))))))))))
* * 2-5 6-11 12-19 20-39 40-59 60 and older* *)))))) )))))) ))))))))))))))) ))))))))))))))) ))))))))))))))) )))))))))))))))
Statistic * All individuals * Males Males* age 2 and over * and and Males Females Males Females Males Females Males Females* *females females
)))))))))))))))))))))))))))))))))))))))))))))))))))))))))))))))))))))))))))))))))))))))))))))))))))))))))))))))))))))))))))))))))))
Number in sample 14,262 2,109 1,432 696 702 1,543 1,449 1,663 1,694 1,545 1,429
Percent of persons using ))))))))))))))))))))))))))))))))))))))))))))%)))))))))))))))))))))))))))))))))))))))))))))
at least once in 2 days 12.1 6.9 8.0 7.3 8.4 12.0 11.6 14.2 17.0 15.2 14.3 on 1 of 2 days 10.6 6.5 7.2 6.4 7.5 11.2 10.3 12.3 15.1 11.7 12.2 on both days 1.4 0.4 * 0.8 * 1.0 * 0.9 * 0.8 * 1.3 1.8 1.9 3.5 2.2
Quantity consumed in a day ))))))))))))))))))))))))))))))))))))))))))))g)))))))))))))))))))))))))))))))))))))))))))))(1/2 cup = 60 g)
Mean 46 33 35 61 * 44 58 44 45 41 51 45 SEM 3 5 6 21 * 10 11 5 4 3 4 4
5th percentile 5 3 * 2 * 4 * 2 * 7 * 7 * 4 * 7 7 * 7 * 10th percentile 7 4 3 * 7 * 5 * 8 9 7 11 13 7 25th percentile 15 7 7 14 * 13 15 15 15 14 15 15 50th percentile 29 14 15 23 21 29 29 29 27 29 28 75th percentile 50 28 37 58 * 36 58 45 56 43 57 56 90th percentile 100 80 87 * 256 * 109 * 187 70 98 89 116 99 95th percentile 164 124 * 120 * --- 188 * 200 * 145 * 133 * 134 157 * 143 *
)))))))))))))))))))))))))))))))))))))))))))))))))))))))))))))))))))))))))))))))))))))))))))))))))))))))))))))))))))))))))))))))))))
* Indicates a statistic that is potentially unreliable because of small sample size or large coefficient of variation.# Indicates a percentage that is greater than 0 but less than 0.05 or a mean, SEM, or percentile that is greater than 0 but less than 0.5.--- Indicates a percentile that could not be estimated.Note: See "Table notes."Source: USDA's Continuing Survey of Food Intakes by Individuals, 1994-96, 2 days.

139
Table 2.020. Total Lettuce: Percentage of persons using food in 2 days and quantities consumed in a day.
)))))))))))))))))))))))))))))))))))))))))))))))))))))))))))))))))))))))))))))))))))))))))))))))))))))))))))))))))))))))))))))))))))
* * Age (years) and sex* *)))))))))))))))))))))))))))))))))))))))))))))))))))))))))))))))))))))))))))))))))
* * 2-5 6-11 12-19 20-39 40-59 60 and older* *)))))) )))))) ))))))))))))))) ))))))))))))))) ))))))))))))))) )))))))))))))))
Statistic * All individuals * Males Males* age 2 and over * and and Males Females Males Females Males Females Males Females* *females females
)))))))))))))))))))))))))))))))))))))))))))))))))))))))))))))))))))))))))))))))))))))))))))))))))))))))))))))))))))))))))))))))))))
Number in sample 14,262 2,109 1,432 696 702 1,543 1,449 1,663 1,694 1,545 1,429
Percent of persons using ))))))))))))))))))))))))))))))))))))))))))))%)))))))))))))))))))))))))))))))))))))))))))))
at least once in 2 days 53.3 34.0 40.8 56.2 52.3 63.4 57.8 55.5 59.1 48.1 46.1 on 1 of 2 days 37.8 29.8 32.9 43.4 37.4 40.8 42.9 37.3 40.9 32.0 31.5 on both days 15.5 4.2 7.9 12.9 15.0 22.5 14.9 18.2 18.3 16.2 14.6
Quantity consumed in a day ))))))))))))))))))))))))))))))))))))))))))))g)))))))))))))))))))))))))))))))))))))))))))))(1 cup = 55 g)
Mean 46 19 29 37 37 45 48 55 55 52 47 SEM 1 1 1 3 3 2 2 3 2 2 2
5th percentile 7 2 6 7 6 8 7 8 7 7 6 10th percentile 8 4 7 8 7 8 8 8 8 8 8 25th percentile 12 7 9 12 9 14 11 14 14 15 14 50th percentile 27 10 18 21 16 22 27 31 51 43 40 75th percentile 55 27 39 47 54 55 63 82 81 75 55 90th percentile 109 54 58 81 100 109 109 111 110 109 108 95th percentile 137 55 81 122 115 142 162 165 142 120 113
)))))))))))))))))))))))))))))))))))))))))))))))))))))))))))))))))))))))))))))))))))))))))))))))))))))))))))))))))))))))))))))))))))
* Indicates a statistic that is potentially unreliable because of small sample size or large coefficient of variation.# Indicates a percentage that is greater than 0 but less than 0.05 or a mean, SEM, or percentile that is greater than 0 but less than 0.5.--- Indicates a percentile that could not be estimated.Note: See "Table notes."Source: USDA's Continuing Survey of Food Intakes by Individuals, 1994-96, 2 days.

140
Table 2.021. Total Celery: Percentage of persons using food in 2 days and quantit ies consumed in a day.
)))))))))))))))))))))))))))))))))))))))))))))))))))))))))))))))))))))))))))))))))))))))))))))))))))))))))))))))))))))))))))))))))))
* * Age (years) and sex* *)))))))))))))))))))))))))))))))))))))))))))))))))))))))))))))))))))))))))))))))))
* * 2-5 6-11 12-19 20-39 40-59 60 and older* *)))))) )))))) ))))))))))))))) ))))))))))))))) ))))))))))))))) )))))))))))))))
Statistic * All individuals * Males Males* age 2 and over * and and Males Females Males Females Males Females Males Females* *females females
)))))))))))))))))))))))))))))))))))))))))))))))))))))))))))))))))))))))))))))))))))))))))))))))))))))))))))))))))))))))))))))))))))
Number in sample 14,262 2,109 1,432 696 702 1,543 1,449 1,663 1,694 1,545 1,429
Percent of persons using ))))))))))))))))))))))))))))))))))))))))))))%)))))))))))))))))))))))))))))))))))))))))))))
at least once in 2 days 42.9 35.8 35.3 33.2 38.4 40.8 43.5 49.1 45.9 48.8 51.0 on 1 of 2 days 34.2 30.5 29.6 28.1 32.1 33.8 35.7 38.8 35.6 34.7 36.7 on both days 8.7 5.3 5.7 5.1 6.3 7.0 7.8 10.3 10.3 14.1 14.3
Quantity consumed in a day ))))))))))))))))))))))))))))))))))))))))))))g)))))))))))))))))))))))))))))))))))))))))))))(1/2 cup = 60 g)
Mean 14 7 9 15 12 17 13 17 14 18 14 SEM # # 1 1 1 1 1 1 # 1 1
5th percentile 1 # # 1 * 1 1 1 1 1 1 1 10th percentile 2 1 1 2 1 2 1 2 2 2 1 25th percentile 4 2 2 4 3 4 3 5 4 5 4 50th percentile 9 4 4 9 8 10 8 12 9 11 10 75th percentile 18 9 11 22 14 20 18 22 17 21 17 90th percentile 32 15 23 33 30 39 30 40 31 38 30 95th percentile 45 24 32 46 * 40 51 45 52 43 55 43
)))))))))))))))))))))))))))))))))))))))))))))))))))))))))))))))))))))))))))))))))))))))))))))))))))))))))))))))))))))))))))))))))))
* Indicates a statistic that is potentially unreliable because of small sample size or large coefficient of variation.# Indicates a percentage that is greater than 0 but less than 0.05 or a mean, SEM, or percentile that is greater than 0 but less than 0.5.--- Indicates a percentile that could not be estimated.Note: See "Table notes."Source: USDA's Continuing Survey of Food Intakes by Individuals, 1994-96, 2 days.

141
Table 2.022. Total Broccoli: Percentage of persons using food in 2 days and quantities consumed in a day.
)))))))))))))))))))))))))))))))))))))))))))))))))))))))))))))))))))))))))))))))))))))))))))))))))))))))))))))))))))))))))))))))))))
* * Age (years) and sex* *)))))))))))))))))))))))))))))))))))))))))))))))))))))))))))))))))))))))))))))))))
* * 2-5 6-11 12-19 20-39 40-59 60 and older* *)))))) )))))) ))))))))))))))) ))))))))))))))) ))))))))))))))) )))))))))))))))
Statistic * All individuals * Males Males* age 2 and over * and and Males Females Males Females Males Females Males Females* *females females
)))))))))))))))))))))))))))))))))))))))))))))))))))))))))))))))))))))))))))))))))))))))))))))))))))))))))))))))))))))))))))))))))))
Number in sample 14,262 2,109 1,432 696 702 1,543 1,449 1,663 1,694 1,545 1,429
Percent of persons using ))))))))))))))))))))))))))))))))))))))))))))%)))))))))))))))))))))))))))))))))))))))))))))
at least once in 2 days 14.0 11.0 10.3 7.7 10.1 12.1 15.0 15.3 18.4 15.4 19.5 on 1 of 2 days 12.7 10.2 9.7 7.6 9.4 10.5 13.5 14.3 16.7 13.5 17.1 on both days 1.4 0.8 0.6 * 0.2 * 0.6 * 1.7 1.6 1.0 1.7 2.0 2.4
Quantity consumed in a day ))))))))))))))))))))))))))))))))))))))))))))g)))))))))))))))))))))))))))))))))))))))))))))(1/2 cup = 92 g)
Mean 81 49 67 82 82 114 77 90 65 82 78 SEM 2 3 9 10 10 10 6 5 5 5 4
5th percentile 8 4 * 5 * --- 6 * 11 * 8 * 11 * 6 10 * 9 10th percentile 12 9 10 10 * 15 * 21 12 17 8 12 16 25th percentile 25 19 16 21 26 39 25 32 22 26 29 50th percentile 56 38 39 62 72 90 50 68 41 52 71 75th percentile 110 72 84 135 95 155 98 131 88 111 92 90th percentile 183 92 177 182 * 183 * 233 159 183 154 183 155 95th percentile 232 147 * 197 * 183 * 183 * 273 * 191 * 231 * 172 231 * 186
)))))))))))))))))))))))))))))))))))))))))))))))))))))))))))))))))))))))))))))))))))))))))))))))))))))))))))))))))))))))))))))))))))
* Indicates a statistic that is potentially unreliable because of small sample size or large coefficient of variation.# Indicates a percentage that is greater than 0 but less than 0.05 or a mean, SEM, or percentile that is greater than 0 but less than 0.5.--- Indicates a percentile that could not be estimated.Note: See "Table notes."Source: USDA's Continuing Survey of Food Intakes by Individuals, 1994-96, 2 days.

142
Table 2.023. Total Carrots: Percentage of persons using food in 2 days and quanti ties consumed in a day.
)))))))))))))))))))))))))))))))))))))))))))))))))))))))))))))))))))))))))))))))))))))))))))))))))))))))))))))))))))))))))))))))))))
* * Age (years) and sex* *)))))))))))))))))))))))))))))))))))))))))))))))))))))))))))))))))))))))))))))))))
* * 2-5 6-11 12-19 20-39 40-59 60 and older* *)))))) )))))) ))))))))))))))) ))))))))))))))) ))))))))))))))) )))))))))))))))
Statistic * All individuals * Males Males* age 2 and over * and and Males Females Males Females Males Females Males Females* *females females
)))))))))))))))))))))))))))))))))))))))))))))))))))))))))))))))))))))))))))))))))))))))))))))))))))))))))))))))))))))))))))))))))))
Number in sample 14,262 2,109 1,432 696 702 1,543 1,449 1,663 1,694 1,545 1,429
Percent of persons using ))))))))))))))))))))))))))))))))))))))))))))%)))))))))))))))))))))))))))))))))))))))))))))
at least once in 2 days 50.6 45.2 46.1 38.3 40.6 48.5 49.7 54.3 55.9 59.0 60.2 on 1 of 2 days 37.6 35.6 35.3 31.8 34.0 37.3 37.0 37.7 40.9 39.3 42.6 on both days 13.1 9.6 10.8 6.5 6.6 11.2 12.8 16.6 15.0 19.7 17.5
Quantity consumed in a day ))))))))))))))))))))))))))))))))))))))))))))g)))))))))))))))))))))))))))))))))))))))))))))(1/2 cup, raw = 64 g)
Mean 30 19 23 30 27 32 32 34 29 34 30 SEM 1 1 1 4 3 2 2 2 1 1 1
5th percentile 1 # 1 1 1 1 1 2 1 1 1 10th percentile 2 1 1 2 2 2 2 3 3 3 3 25th percentile 6 3 4 5 5 5 6 8 7 7 7 50th percentile 16 9 12 14 15 17 18 19 18 19 15 75th percentile 38 25 29 39 33 40 40 46 36 48 38 90th percentile 73 56 59 68 64 73 75 78 66 87 71 95th percentile 103 71 73 83 96 119 112 114 100 114 103
)))))))))))))))))))))))))))))))))))))))))))))))))))))))))))))))))))))))))))))))))))))))))))))))))))))))))))))))))))))))))))))))))))
* Indicates a statistic that is potentially unreliable because of small sample size or large coefficient of variation.# Indicates a percentage that is greater than 0 but less than 0.05 or a mean, SEM, or percentile that is greater than 0 but less than 0.5.--- Indicates a percentile that could not be estimated.Note: See "Table notes."Source: USDA's Continuing Survey of Food Intakes by Individuals, 1994-96, 2 days.

143
Table 2.024. Total Tomatoes: Percentage of persons using food in 2 days and quantities consumed in a day.
)))))))))))))))))))))))))))))))))))))))))))))))))))))))))))))))))))))))))))))))))))))))))))))))))))))))))))))))))))))))))))))))))))
* * Age (years) and sex* *)))))))))))))))))))))))))))))))))))))))))))))))))))))))))))))))))))))))))))))))))
* * 2-5 6-11 12-19 20-39 40-59 60 and older* *)))))) )))))) ))))))))))))))) ))))))))))))))) ))))))))))))))) )))))))))))))))
Statistic * All individuals * Males Males* age 2 and over * and and Males Females Males Females Males Females Males Females* *females females
)))))))))))))))))))))))))))))))))))))))))))))))))))))))))))))))))))))))))))))))))))))))))))))))))))))))))))))))))))))))))))))))))))
Number in sample 14,262 2,109 1,432 696 702 1,543 1,449 1,663 1,694 1,545 1,429
Percent of persons using ))))))))))))))))))))))))))))))))))))))))))))%)))))))))))))))))))))))))))))))))))))))))))))
at least once in 2 days 85.9 85.7 87.2 90.3 88.9 89.9 87.3 85.0 83.9 79.5 79.6 on 1 of 2 days 39.9 40.7 38.3 32.0 40.7 35.8 43.7 40.5 41.4 39.4 42.9 on both days 46.0 44.9 48.8 58.2 48.2 54.1 43.5 44.5 42.5 40.0 36.6
Quantity consumed in a day ))))))))))))))))))))))))))))))))))))))))))))g)))))))))))))))))))))))))))))))))))))))))))))(1/2 cup = 90 g)
Mean 67 38 44 72 56 82 64 83 66 78 67 SEM 1 2 1 4 4 3 2 3 2 3 3
5th percentile 2 1 2 2 2 3 2 2 1 2 2 10th percentile 4 3 4 6 4 7 5 6 4 4 5 25th percentile 17 7 11 19 14 21 20 22 20 20 19 50th percentile 41 21 26 46 33 52 41 52 42 45 45 75th percentile 89 51 54 92 71 108 83 109 90 100 91 90th percentile 157 88 102 155 126 191 153 197 156 182 152 95th percentile 217 124 148 216 170 270 193 275 209 247 201
)))))))))))))))))))))))))))))))))))))))))))))))))))))))))))))))))))))))))))))))))))))))))))))))))))))))))))))))))))))))))))))))))))
* Indicates a statistic that is potentially unreliable because of small sample size or large coefficient of variation.# Indicates a percentage that is greater than 0 but less than 0.05 or a mean, SEM, or percentile that is greater than 0 but less than 0.5.--- Indicates a percentile that could not be estimated.Note: See "Table notes."Source: USDA's Continuing Survey of Food Intakes by Individuals, 1994-96, 2 days.
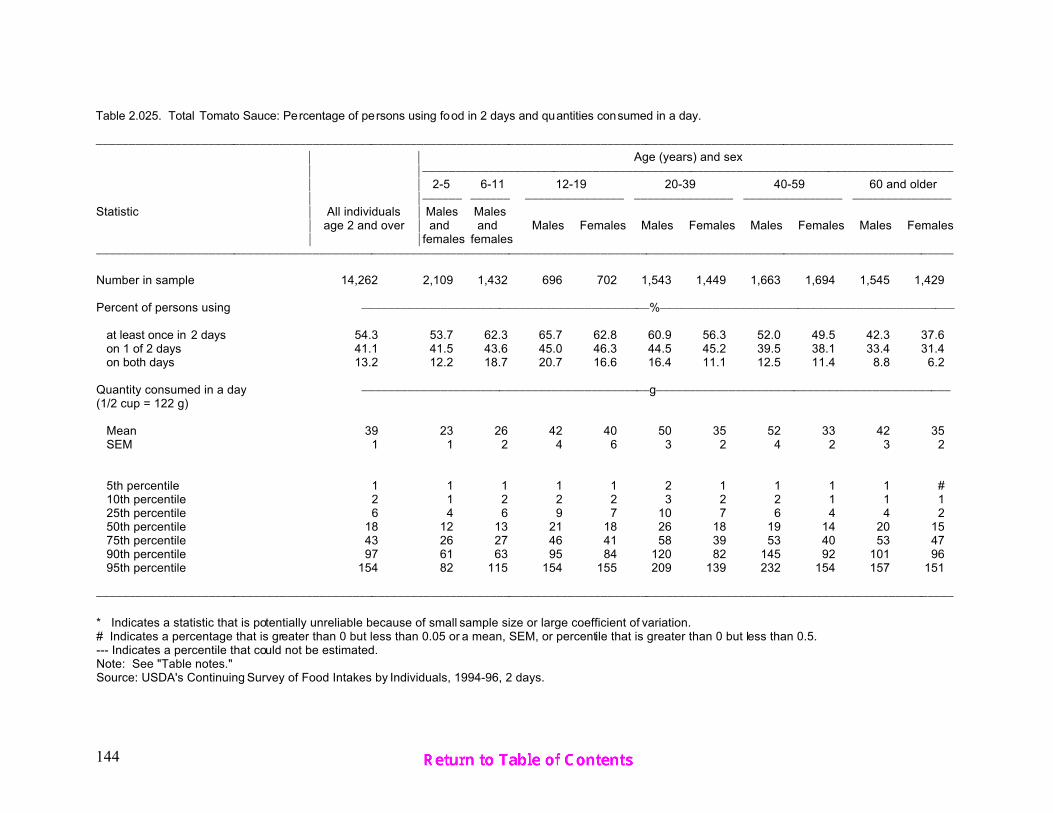
144
Table 2.025. Total Tomato Sauce: Percentage of persons using food in 2 days and quantities consumed in a day.
)))))))))))))))))))))))))))))))))))))))))))))))))))))))))))))))))))))))))))))))))))))))))))))))))))))))))))))))))))))))))))))))))))
* * Age (years) and sex* *)))))))))))))))))))))))))))))))))))))))))))))))))))))))))))))))))))))))))))))))))
* * 2-5 6-11 12-19 20-39 40-59 60 and older* *)))))) )))))) ))))))))))))))) ))))))))))))))) ))))))))))))))) )))))))))))))))
Statistic * All individuals * Males Males* age 2 and over * and and Males Females Males Females Males Females Males Females* *females females
)))))))))))))))))))))))))))))))))))))))))))))))))))))))))))))))))))))))))))))))))))))))))))))))))))))))))))))))))))))))))))))))))))
Number in sample 14,262 2,109 1,432 696 702 1,543 1,449 1,663 1,694 1,545 1,429
Percent of persons using ))))))))))))))))))))))))))))))))))))))))))))%)))))))))))))))))))))))))))))))))))))))))))))
at least once in 2 days 54.3 53.7 62.3 65.7 62.8 60.9 56.3 52.0 49.5 42.3 37.6 on 1 of 2 days 41.1 41.5 43.6 45.0 46.3 44.5 45.2 39.5 38.1 33.4 31.4 on both days 13.2 12.2 18.7 20.7 16.6 16.4 11.1 12.5 11.4 8.8 6.2
Quantity consumed in a day ))))))))))))))))))))))))))))))))))))))))))))g)))))))))))))))))))))))))))))))))))))))))))))(1/2 cup = 122 g)
Mean 39 23 26 42 40 50 35 52 33 42 35 SEM 1 1 2 4 6 3 2 4 2 3 2
5th percentile 1 1 1 1 1 2 1 1 1 1 # 10th percentile 2 1 2 2 2 3 2 2 1 1 1 25th percentile 6 4 6 9 7 10 7 6 4 4 2 50th percentile 18 12 13 21 18 26 18 19 14 20 15 75th percentile 43 26 27 46 41 58 39 53 40 53 47 90th percentile 97 61 63 95 84 120 82 145 92 101 96 95th percentile 154 82 115 154 155 209 139 232 154 157 151
)))))))))))))))))))))))))))))))))))))))))))))))))))))))))))))))))))))))))))))))))))))))))))))))))))))))))))))))))))))))))))))))))))
* Indicates a statistic that is potentially unreliable because of small sample size or large coefficient of variation.# Indicates a percentage that is greater than 0 but less than 0.05 or a mean, SEM, or percentile that is greater than 0 but less than 0.5.--- Indicates a percentile that could not be estimated.Note: See "Table notes."Source: USDA's Continuing Survey of Food Intakes by Individuals, 1994-96, 2 days.

145
Table 2.026. Total String Beans: Percentage of persons using food in 2 days and quantities consumed in a day.
)))))))))))))))))))))))))))))))))))))))))))))))))))))))))))))))))))))))))))))))))))))))))))))))))))))))))))))))))))))))))))))))))))
* * Age (years) and sex* *)))))))))))))))))))))))))))))))))))))))))))))))))))))))))))))))))))))))))))))))))
* * 2-5 6-11 12-19 20-39 40-59 60 and older* *)))))) )))))) ))))))))))))))) ))))))))))))))) ))))))))))))))) )))))))))))))))
Statistic * All individuals * Males Males* age 2 and over * and and Males Females Males Females Males Females Males Females* *females females
)))))))))))))))))))))))))))))))))))))))))))))))))))))))))))))))))))))))))))))))))))))))))))))))))))))))))))))))))))))))))))))))))))
Number in sample 14,262 2,109 1,432 696 702 1,543 1,449 1,663 1,694 1,545 1,429
Percent of persons using ))))))))))))))))))))))))))))))))))))))))))))%)))))))))))))))))))))))))))))))))))))))))))))
at least once in 2 days 22.4 23.5 19.8 12.2 12.7 17.8 20.8 24.5 25.2 30.8 35.1 on 1 of 2 days 20.0 20.2 18.3 11.5 12.0 16.6 19.0 20.9 22.6 26.3 30.6 on both days 2.4 3.3 1.5 0.6 * 0.7 * 1.2 1.9 3.6 2.6 4.5 4.5
Quantity consumed in a day ))))))))))))))))))))))))))))))))))))))))))))g)))))))))))))))))))))))))))))))))))))))))))))(1/2 cup = 68 g)
Mean 62 37 49 65 48 82 62 71 60 69 53 SEM 1 2 5 8 5 4 4 5 3 3 2
5th percentile 1 1 1 6 * # 2 2 1 1 1 1 10th percentile 3 3 3 11 * 1 * 6 4 2 3 3 2 25th percentile 17 9 11 29 8 23 14 17 17 17 15 50th percentile 45 34 34 67 44 68 45 62 41 62 39 75th percentile 79 62 67 68 68 126 74 123 82 104 68 90th percentile 135 68 68 134 * 117 * 172 135 136 135 135 124 95th percentile 186 112 134 135 * 134 * 215 201 201 186 185 135
)))))))))))))))))))))))))))))))))))))))))))))))))))))))))))))))))))))))))))))))))))))))))))))))))))))))))))))))))))))))))))))))))))
* Indicates a statistic that is potentially unreliable because of small sample size or large coefficient of variation.# Indicates a percentage that is greater than 0 but less than 0.05 or a mean, SEM, or percentile that is greater than 0 but less than 0.5.--- Indicates a percentile that could not be estimated.Note: See "Table notes."Source: USDA's Continuing Survey of Food Intakes by Individuals, 1994-96, 2 days.
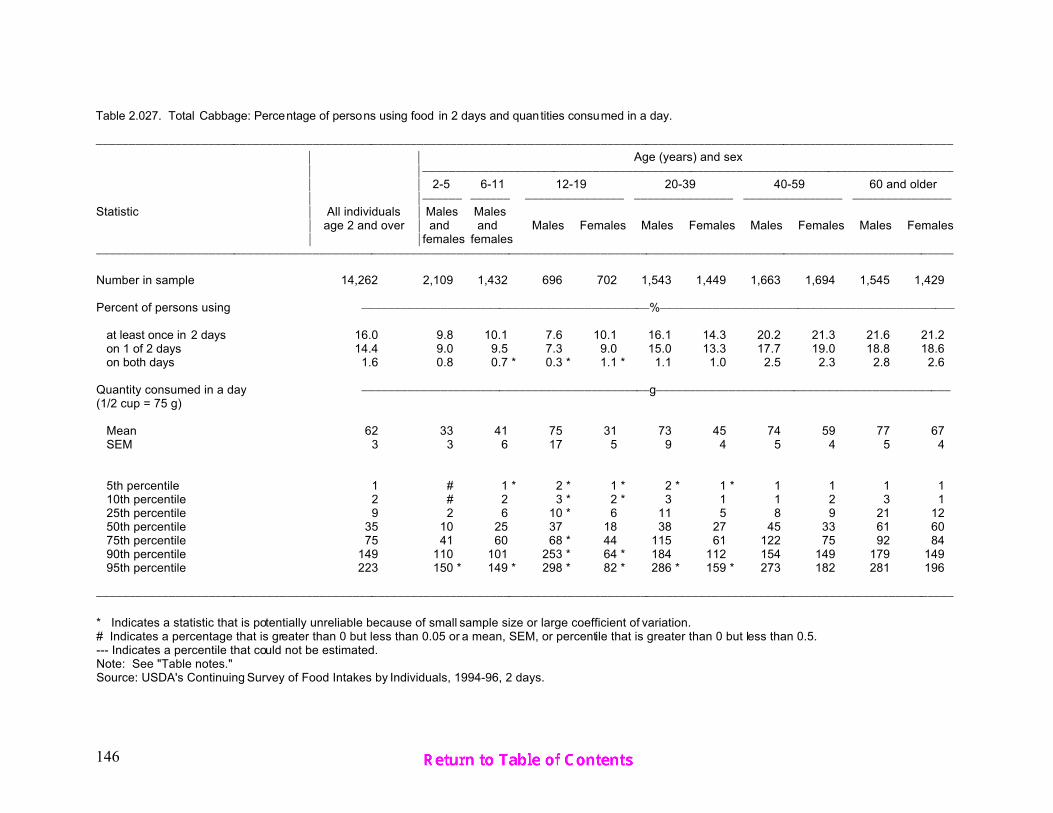
146
Table 2.027. Total Cabbage: Percentage of persons using food in 2 days and quantities consumed in a day.
)))))))))))))))))))))))))))))))))))))))))))))))))))))))))))))))))))))))))))))))))))))))))))))))))))))))))))))))))))))))))))))))))))
* * Age (years) and sex* *)))))))))))))))))))))))))))))))))))))))))))))))))))))))))))))))))))))))))))))))))
* * 2-5 6-11 12-19 20-39 40-59 60 and older* *)))))) )))))) ))))))))))))))) ))))))))))))))) ))))))))))))))) )))))))))))))))
Statistic * All individuals * Males Males* age 2 and over * and and Males Females Males Females Males Females Males Females* *females females
)))))))))))))))))))))))))))))))))))))))))))))))))))))))))))))))))))))))))))))))))))))))))))))))))))))))))))))))))))))))))))))))))))
Number in sample 14,262 2,109 1,432 696 702 1,543 1,449 1,663 1,694 1,545 1,429
Percent of persons using ))))))))))))))))))))))))))))))))))))))))))))%)))))))))))))))))))))))))))))))))))))))))))))
at least once in 2 days 16.0 9.8 10.1 7.6 10.1 16.1 14.3 20.2 21.3 21.6 21.2 on 1 of 2 days 14.4 9.0 9.5 7.3 9.0 15.0 13.3 17.7 19.0 18.8 18.6 on both days 1.6 0.8 0.7 * 0.3 * 1.1 * 1.1 1.0 2.5 2.3 2.8 2.6
Quantity consumed in a day ))))))))))))))))))))))))))))))))))))))))))))g)))))))))))))))))))))))))))))))))))))))))))))(1/2 cup = 75 g)
Mean 62 33 41 75 31 73 45 74 59 77 67 SEM 3 3 6 17 5 9 4 5 4 5 4
5th percentile 1 # 1 * 2 * 1 * 2 * 1 * 1 1 1 1 10th percentile 2 # 2 3 * 2 * 3 1 1 2 3 1 25th percentile 9 2 6 10 * 6 11 5 8 9 21 12 50th percentile 35 10 25 37 18 38 27 45 33 61 60 75th percentile 75 41 60 68 * 44 115 61 122 75 92 84 90th percentile 149 110 101 253 * 64 * 184 112 154 149 179 149 95th percentile 223 150 * 149 * 298 * 82 * 286 * 159 * 273 182 281 196
)))))))))))))))))))))))))))))))))))))))))))))))))))))))))))))))))))))))))))))))))))))))))))))))))))))))))))))))))))))))))))))))))))
* Indicates a statistic that is potentially unreliable because of small sample size or large coefficient of variation.# Indicates a percentage that is greater than 0 but less than 0.05 or a mean, SEM, or percentile that is greater than 0 but less than 0.5.--- Indicates a percentile that could not be estimated.Note: See "Table notes."Source: USDA's Continuing Survey of Food Intakes by Individuals, 1994-96, 2 days.

147
Table 2.028. Total Peas: Percentage of persons using food in 2 days and quantit ies consumed in a day.
)))))))))))))))))))))))))))))))))))))))))))))))))))))))))))))))))))))))))))))))))))))))))))))))))))))))))))))))))))))))))))))))))))
* * Age (years) and sex* *)))))))))))))))))))))))))))))))))))))))))))))))))))))))))))))))))))))))))))))))))
* * 2-5 6-11 12-19 20-39 40-59 60 and older* *)))))) )))))) ))))))))))))))) ))))))))))))))) ))))))))))))))) )))))))))))))))
Statistic * All individuals * Males Males* age 2 and over * and and Males Females Males Females Males Females Males Females* *females females
)))))))))))))))))))))))))))))))))))))))))))))))))))))))))))))))))))))))))))))))))))))))))))))))))))))))))))))))))))))))))))))))))))
Number in sample 14,262 2,109 1,432 696 702 1,543 1,449 1,663 1,694 1,545 1,429
Percent of persons using ))))))))))))))))))))))))))))))))))))))))))))%)))))))))))))))))))))))))))))))))))))))))))))
at least once in 2 days 20.1 20.8 16.7 14.2 12.4 17.4 18.7 22.8 21.4 26.9 28.2 on 1 of 2 days 18.0 19.1 15.1 13.2 11.8 16.1 17.0 20.2 19.0 23.0 24.3 on both days 2.1 1.7 1.6 1.0 * 0.6 * 1.4 1.7 2.6 2.4 3.9 4.0
Quantity consumed in a day ))))))))))))))))))))))))))))))))))))))))))))g)))))))))))))))))))))))))))))))))))))))))))))(1/2 cup = 80 g)
Mean 45 30 41 56 35 49 41 59 42 50 40 SEM 2 2 4 7 5 5 4 4 3 3 2
5th percentile 3 3 2 * 6 * 1 * 6 * 3 4 3 3 2 10th percentile 7 4 6 9 * 2 * 8 6 8 6 7 5 25th percentile 14 9 14 17 11 16 10 15 13 16 13 50th percentile 28 19 26 40 23 33 27 34 25 34 26 75th percentile 57 40 48 79 37 59 50 80 60 74 57 90th percentile 96 76 85 138 * 80 * 102 96 159 85 105 84 95th percentile 158 85 121 * 167 * 96 * 168 * 128 170 120 140 119
)))))))))))))))))))))))))))))))))))))))))))))))))))))))))))))))))))))))))))))))))))))))))))))))))))))))))))))))))))))))))))))))))))
* Indicates a statistic that is potentially unreliable because of small sample size or large coefficient of variation.# Indicates a percentage that is greater than 0 but less than 0.05 or a mean, SEM, or percentile that is greater than 0 but less than 0.5.--- Indicates a percentile that could not be estimated.Note: See "Table notes."Source: USDA's Continuing Survey of Food Intakes by Individuals, 1994-96, 2 days.

148
Table 2.029. Total Corn: Percentage of persons us ing food in 2 days and quantities consumed in a day.
)))))))))))))))))))))))))))))))))))))))))))))))))))))))))))))))))))))))))))))))))))))))))))))))))))))))))))))))))))))))))))))))))))
* * Age (years) and sex* *)))))))))))))))))))))))))))))))))))))))))))))))))))))))))))))))))))))))))))))))))
* * 2-5 6-11 12-19 20-39 40-59 60 and older* *)))))) )))))) ))))))))))))))) ))))))))))))))) ))))))))))))))) )))))))))))))))
Statistic * All individuals * Males Males* age 2 and over * and and Males Females Males Females Males Females Males Females* *females females
)))))))))))))))))))))))))))))))))))))))))))))))))))))))))))))))))))))))))))))))))))))))))))))))))))))))))))))))))))))))))))))))))))
Number in sample 14,262 2,109 1,432 696 702 1,543 1,449 1,663 1,694 1,545 1,429
Percent of persons using ))))))))))))))))))))))))))))))))))))))))))))%)))))))))))))))))))))))))))))))))))))))))))))
at least once in 2 days 24.1 26.3 29.4 17.3 17.7 19.3 24.1 27.1 24.9 26.5 27.2 on 1 of 2 days 21.6 22.9 26.5 15.8 16.8 18.0 21.3 23.1 23.1 23.2 23.8 on both days 2.5 3.4 2.8 1.5 * 0.9 * 1.3 2.8 3.9 1.8 3.3 3.4
Quantity consumed in a day ))))))))))))))))))))))))))))))))))))))))))))g)))))))))))))))))))))))))))))))))))))))))))))(1/2 cup = 82 g)
Mean 77 54 66 109 78 93 79 101 64 77 55 SEM 2 2 4 11 5 4 4 6 2 4 3
5th percentile 8 5 8 10 * 8 * 9 7 15 9 7 8 10th percentile 14 7 10 14 * 16 15 10 19 14 14 13 25th percentile 25 14 25 48 40 30 25 30 23 25 19 50th percentile 56 41 51 82 79 82 75 82 45 55 33 75th percentile 100 82 82 123 100 121 100 156 87 103 82 90th percentile 164 102 163 191 * 163 164 164 189 124 164 113 95th percentile 199 163 164 329 * 172 * 245 199 252 164 198 163
)))))))))))))))))))))))))))))))))))))))))))))))))))))))))))))))))))))))))))))))))))))))))))))))))))))))))))))))))))))))))))))))))))
* Indicates a statistic that is potentially unreliable because of small sample size or large coefficient of variation.# Indicates a percentage that is greater than 0 but less than 0.05 or a mean, SEM, or percentile that is greater than 0 but less than 0.5.--- Indicates a percentile that could not be estimated.Note: See "Table notes."Source: USDA's Continuing Survey of Food Intakes by Individuals, 1994-96, 2 days.

149
Table 2.030. Total Onions: Percentage of persons using food in 2 days and quanti ties consumed in a day.
)))))))))))))))))))))))))))))))))))))))))))))))))))))))))))))))))))))))))))))))))))))))))))))))))))))))))))))))))))))))))))))))))))
* * Age (years) and sex* *)))))))))))))))))))))))))))))))))))))))))))))))))))))))))))))))))))))))))))))))))
* * 2-5 6-11 12-19 20-39 40-59 60 and older* *)))))) )))))) ))))))))))))))) ))))))))))))))) ))))))))))))))) )))))))))))))))
Statistic * All individuals * Males Males* age 2 and over * and and Males Females Males Females Males Females Males Females* *females females
)))))))))))))))))))))))))))))))))))))))))))))))))))))))))))))))))))))))))))))))))))))))))))))))))))))))))))))))))))))))))))))))))))
Number in sample 14,262 2,109 1,432 696 702 1,543 1,449 1,663 1,694 1,545 1,429
Percent of persons using ))))))))))))))))))))))))))))))))))))))))))))%)))))))))))))))))))))))))))))))))))))))))))))
at least once in 2 days 92.5 92.1 93.3 94.5 95.0 95.7 93.4 91.6 91.4 88.8 88.0 on 1 of 2 days 31.0 33.7 30.1 26.3 29.5 26.1 32.5 29.2 34.5 32.7 36.2 on both days 61.5 58.4 63.2 68.1 65.6 69.6 60.9 62.4 56.8 56.1 51.8
Quantity consumed in a day ))))))))))))))))))))))))))))))))))))))))))))g)))))))))))))))))))))))))))))))))))))))))))))(1/2 cup, cooked = 105 g)
Mean 16 5 8 16 13 22 15 20 16 19 14 SEM # # # 1 1 1 1 1 1 1 1
5th percentile # # # # # # # # # # # 10th percentile # # # # # 1 # 1 # # # 25th percentile 2 # 1 2 1 3 2 3 2 2 2 50th percentile 7 2 3 6 5 12 7 11 8 10 8 75th percentile 20 7 9 20 15 30 19 28 20 27 19 90th percentile 40 14 20 43 33 52 37 49 38 45 35 95th percentile 57 20 31 65 47 76 52 73 54 65 51
)))))))))))))))))))))))))))))))))))))))))))))))))))))))))))))))))))))))))))))))))))))))))))))))))))))))))))))))))))))))))))))))))))
* Indicates a statistic that is potentially unreliable because of small sample size or large coefficient of variation.# Indicates a percentage that is greater than 0 but less than 0.05 or a mean, SEM, or percentile that is greater than 0 but less than 0.5.--- Indicates a percentile that could not be estimated.Note: See "Table notes."Source: USDA's Continuing Survey of Food Intakes by Individuals, 1994-96, 2 days.
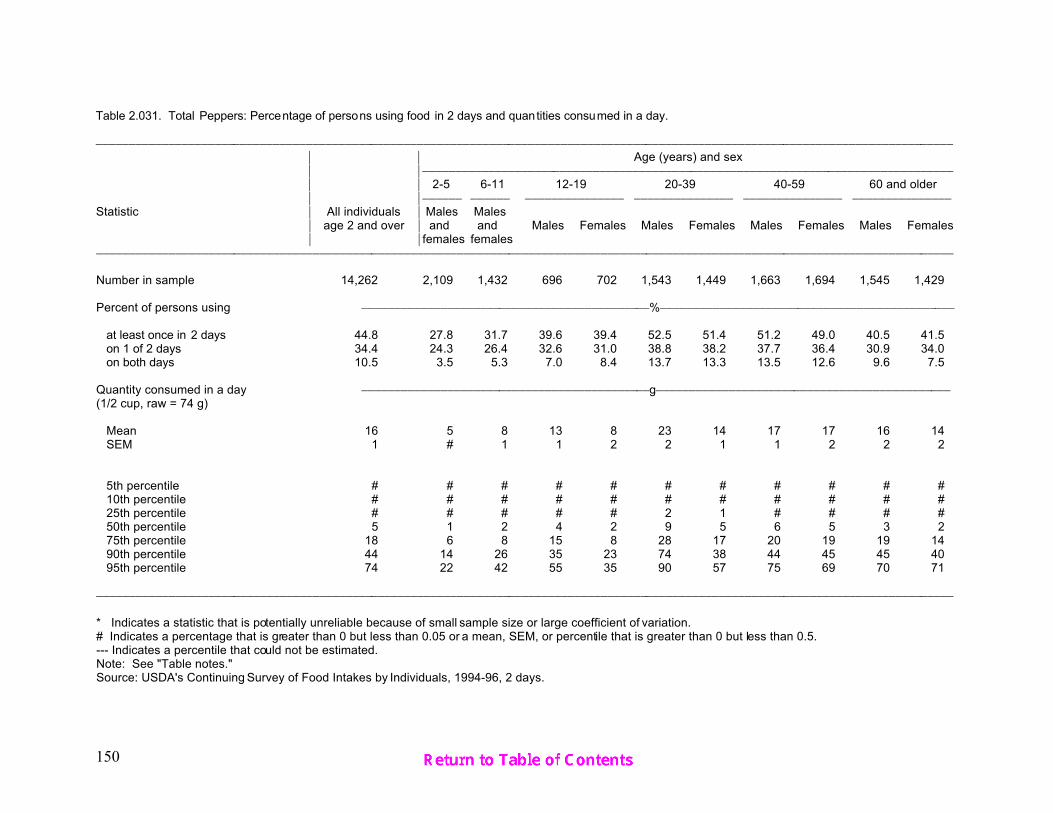
150
Table 2.031. Total Peppers: Percentage of persons using food in 2 days and quantities consumed in a day.
)))))))))))))))))))))))))))))))))))))))))))))))))))))))))))))))))))))))))))))))))))))))))))))))))))))))))))))))))))))))))))))))))))
* * Age (years) and sex* *)))))))))))))))))))))))))))))))))))))))))))))))))))))))))))))))))))))))))))))))))
* * 2-5 6-11 12-19 20-39 40-59 60 and older* *)))))) )))))) ))))))))))))))) ))))))))))))))) ))))))))))))))) )))))))))))))))
Statistic * All individuals * Males Males* age 2 and over * and and Males Females Males Females Males Females Males Females* *females females
)))))))))))))))))))))))))))))))))))))))))))))))))))))))))))))))))))))))))))))))))))))))))))))))))))))))))))))))))))))))))))))))))))
Number in sample 14,262 2,109 1,432 696 702 1,543 1,449 1,663 1,694 1,545 1,429
Percent of persons using ))))))))))))))))))))))))))))))))))))))))))))%)))))))))))))))))))))))))))))))))))))))))))))
at least once in 2 days 44.8 27.8 31.7 39.6 39.4 52.5 51.4 51.2 49.0 40.5 41.5 on 1 of 2 days 34.4 24.3 26.4 32.6 31.0 38.8 38.2 37.7 36.4 30.9 34.0 on both days 10.5 3.5 5.3 7.0 8.4 13.7 13.3 13.5 12.6 9.6 7.5
Quantity consumed in a day ))))))))))))))))))))))))))))))))))))))))))))g)))))))))))))))))))))))))))))))))))))))))))))(1/2 cup, raw = 74 g)
Mean 16 5 8 13 8 23 14 17 17 16 14 SEM 1 # 1 1 2 2 1 1 2 2 2
5th percentile # # # # # # # # # # # 10th percentile # # # # # # # # # # # 25th percentile # # # # # 2 1 # # # # 50th percentile 5 1 2 4 2 9 5 6 5 3 2 75th percentile 18 6 8 15 8 28 17 20 19 19 14 90th percentile 44 14 26 35 23 74 38 44 45 45 40 95th percentile 74 22 42 55 35 90 57 75 69 70 71
)))))))))))))))))))))))))))))))))))))))))))))))))))))))))))))))))))))))))))))))))))))))))))))))))))))))))))))))))))))))))))))))))))
* Indicates a statistic that is potentially unreliable because of small sample size or large coefficient of variation.# Indicates a percentage that is greater than 0 but less than 0.05 or a mean, SEM, or percentile that is greater than 0 but less than 0.5.--- Indicates a percentile that could not be estimated.Note: See "Table notes."Source: USDA's Continuing Survey of Food Intakes by Individuals, 1994-96, 2 days.

151
Table 2.032. Total White Potatoes: Percentage of persons using food in 2 days and quantities consumed in a day.
)))))))))))))))))))))))))))))))))))))))))))))))))))))))))))))))))))))))))))))))))))))))))))))))))))))))))))))))))))))))))))))))))))
* * Age (years) and sex* *)))))))))))))))))))))))))))))))))))))))))))))))))))))))))))))))))))))))))))))))))
* * 2-5 6-11 12-19 20-39 40-59 60 and older* *)))))) )))))) ))))))))))))))) ))))))))))))))) ))))))))))))))) )))))))))))))))
Statistic * All individuals * Males Males* age 2 and over * and and Males Females Males Females Males Females Males Females* *females females
)))))))))))))))))))))))))))))))))))))))))))))))))))))))))))))))))))))))))))))))))))))))))))))))))))))))))))))))))))))))))))))))))))
Number in sample 14,262 2,109 1,432 696 702 1,543 1,449 1,663 1,694 1,545 1,429
Percent of persons using ))))))))))))))))))))))))))))))))))))))))))))%)))))))))))))))))))))))))))))))))))))))))))))
at least once in 2 days 71.3 72.1 72.5 76.0 70.6 74.6 68.0 70.7 69.4 72.7 69.4 on 1 of 2 days 44.8 44.1 44.9 46.6 44.7 45.6 46.5 42.3 46.0 42.0 43.0 on both days 26.6 28.0 27.5 29.4 25.9 29.0 21.5 28.4 23.5 30.7 26.5
Quantity consumed in a day ))))))))))))))))))))))))))))))))))))))))))))g)))))))))))))))))))))))))))))))))))))))))))))(1/2 cup = 78 g)
Mean 103 59 72 118 94 135 93 126 92 118 91 SEM 1 2 2 6 6 4 3 4 3 3 2
5th percentile 12 7 8 18 13 14 11 13 9 13 9 10th percentile 17 9 12 22 20 26 15 20 15 20 15 25th percentile 40 21 25 49 39 59 38 50 38 50 39 50th percentile 84 46 59 94 72 104 78 97 81 97 85 75th percentile 132 80 97 153 108 170 127 171 125 169 123 90th percentile 210 119 157 238 176 290 185 274 183 240 177 95th percentile 279 168 185 343 251 357 228 341 236 281 213
)))))))))))))))))))))))))))))))))))))))))))))))))))))))))))))))))))))))))))))))))))))))))))))))))))))))))))))))))))))))))))))))))))
* Indicates a statistic that is potentially unreliable because of small sample size or large coefficient of variation.# Indicates a percentage that is greater than 0 but less than 0.05 or a mean, SEM, or percentile that is greater than 0 but less than 0.5.--- Indicates a percentile that could not be estimated.Note: See "Table notes."Source: USDA's Continuing Survey of Food Intakes by Individuals, 1994-96, 2 days.

152
Table 2.033. Total Dried Beans and Peas: Percentage of persons using food in 2 days and quantit ies consumed in a day.
)))))))))))))))))))))))))))))))))))))))))))))))))))))))))))))))))))))))))))))))))))))))))))))))))))))))))))))))))))))))))))))))))))
* * Age (years) and sex* *)))))))))))))))))))))))))))))))))))))))))))))))))))))))))))))))))))))))))))))))))
* * 2-5 6-11 12-19 20-39 40-59 60 and older* *)))))) )))))) ))))))))))))))) ))))))))))))))) ))))))))))))))) )))))))))))))))
Statistic * All individuals * Males Males* age 2 and over * and and Males Females Males Females Males Females Males Females* *females females
)))))))))))))))))))))))))))))))))))))))))))))))))))))))))))))))))))))))))))))))))))))))))))))))))))))))))))))))))))))))))))))))))))
Number in sample 14,262 2,109 1,432 696 702 1,543 1,449 1,663 1,694 1,545 1,429
Percent of persons using ))))))))))))))))))))))))))))))))))))))))))))%)))))))))))))))))))))))))))))))))))))))))))))
at least once in 2 days 29.5 24.4 24.2 27.3 28.4 30.8 32.0 33.8 30.0 31.2 25.9 on 1 of 2 days 24.6 21.4 21.1 22.1 23.9 24.5 27.4 28.2 25.3 25.3 22.0 on both days 4.8 3.0 3.1 5.2 4.5 6.4 4.6 5.6 4.7 5.9 3.9
Quantity consumed in a day ))))))))))))))))))))))))))))))))))))))))))))g)))))))))))))))))))))))))))))))))))))))))))))(1/2 cup kidney beans = 86 g)
Mean 96 58 75 117 90 118 81 117 82 113 84 SEM 2 4 4 8 7 6 5 5 3 6 3
5th percentile 8 5 4 10 * 7 * 9 8 13 8 12 4 10th percentile 14 9 10 16 12 18 11 21 12 22 9 25th percentile 34 22 26 34 37 43 30 47 31 54 29 50th percentile 68 43 58 71 68 92 61 98 65 87 67 75th percentile 131 69 98 170 131 163 111 161 109 138 118 90th percentile 197 126 161 223 174 262 168 238 167 233 170 95th percentile 263 170 193 374 * 241 * 344 212 323 236 302 201
)))))))))))))))))))))))))))))))))))))))))))))))))))))))))))))))))))))))))))))))))))))))))))))))))))))))))))))))))))))))))))))))))))
* Indicates a statistic that is potentially unreliable because of small sample size or large coefficient of variation.# Indicates a percentage that is greater than 0 but less than 0.05 or a mean, SEM, or percentile that is greater than 0 but less than 0.5.--- Indicates a percentile that could not be estimated.Note: See "Table notes."Source: USDA's Continuing Survey of Food Intakes by Individuals, 1994-96, 2 days.

153
Table 2.034. Total Oranges: Percentage of persons using food in 2 days and quantities consumed in a day.
)))))))))))))))))))))))))))))))))))))))))))))))))))))))))))))))))))))))))))))))))))))))))))))))))))))))))))))))))))))))))))))))))))
* * Age (years) and sex* *)))))))))))))))))))))))))))))))))))))))))))))))))))))))))))))))))))))))))))))))))
* * 2-5 6-11 12-19 20-39 40-59 60 and older* *)))))) )))))) ))))))))))))))) ))))))))))))))) ))))))))))))))) )))))))))))))))
Statistic * All individuals * Males Males* age 2 and over * and and Males Females Males Females Males Females Males Females* *females females
)))))))))))))))))))))))))))))))))))))))))))))))))))))))))))))))))))))))))))))))))))))))))))))))))))))))))))))))))))))))))))))))))))
Number in sample 14,262 2,109 1,432 696 702 1,543 1,449 1,663 1,694 1,545 1,429
Percent of persons using ))))))))))))))))))))))))))))))))))))))))))))%)))))))))))))))))))))))))))))))))))))))))))))
at least once in 2 days 44.3 63.5 61.4 49.0 51.1 37.5 38.5 38.4 38.4 41.9 45.7 on 1 of 2 days 26.6 34.7 35.6 31.2 35.1 24.2 26.9 23.3 23.5 18.9 21.6 on both days 17.7 28.8 25.8 17.9 16.0 13.3 11.6 15.0 14.9 23.0 24.1
Quantity consumed in a day ))))))))))))))))))))))))))))))))))))))))))))g)))))))))))))))))))))))))))))))))))))))))))))(1 medium = 131 g)
Mean 171 107 122 218 172 249 175 190 160 161 145 SEM 5 4 6 23 14 18 10 12 8 8 6
5th percentile 5 3 3 5 4 7 4 5 5 10 5 10th percentile 7 5 5 7 5 10 7 10 12 27 23 25th percentile 36 18 12 29 21 71 36 53 53 53 53 50th percentile 124 62 64 124 86 184 129 130 130 128 124 75th percentile 249 157 187 261 249 372 249 249 248 248 187 90th percentile 373 249 310 498 497 498 373 398 310 308 252 95th percentile 498 323 439 752 498 744 498 516 373 373 372
)))))))))))))))))))))))))))))))))))))))))))))))))))))))))))))))))))))))))))))))))))))))))))))))))))))))))))))))))))))))))))))))))))
* Indicates a statistic that is potentially unreliable because of small sample size or large coefficient of variation.# Indicates a percentage that is greater than 0 but less than 0.05 or a mean, SEM, or percentile that is greater than 0 but less than 0.5.--- Indicates a percentile that could not be estimated.Note: See "Table notes."Source: USDA's Continuing Survey of Food Intakes by Individuals, 1994-96, 2 days.

154
Table 2.035. Total Orange Juice: Percentage of persons using food in 2 days and quantities consumed in a day.
)))))))))))))))))))))))))))))))))))))))))))))))))))))))))))))))))))))))))))))))))))))))))))))))))))))))))))))))))))))))))))))))))))
* * Age (years) and sex* *)))))))))))))))))))))))))))))))))))))))))))))))))))))))))))))))))))))))))))))))))
* * 2-5 6-11 12-19 20-39 40-59 60 and older* *)))))) )))))) ))))))))))))))) ))))))))))))))) ))))))))))))))) )))))))))))))))
Statistic * All individuals * Males Males* age 2 and over * and and Males Females Males Females Males Females Males Females* *females females
)))))))))))))))))))))))))))))))))))))))))))))))))))))))))))))))))))))))))))))))))))))))))))))))))))))))))))))))))))))))))))))))))))
Number in sample 14,262 2,109 1,432 696 702 1,543 1,449 1,663 1,694 1,545 1,429
Percent of persons using ))))))))))))))))))))))))))))))))))))))))))))%)))))))))))))))))))))))))))))))))))))))))))))
at least once in 2 days 30.5 47.8 46.7 37.2 39.2 25.6 26.7 24.5 23.6 25.8 28.6 on 1 of 2 days 20.3 30.7 30.7 25.4 29.0 18.8 20.2 15.6 15.1 12.8 15.7 on both days 10.2 17.1 15.9 11.8 10.2 6.7 6.5 8.9 8.5 12.9 12.8
Quantity consumed in a day ))))))))))))))))))))))))))))))))))))))))))))g)))))))))))))))))))))))))))))))))))))))))))))(6 fluid ounces = 187 g)
Mean 200 114 132 245 187 299 210 235 199 204 171 SEM 6 5 7 24 12 19 12 19 13 8 6
5th percentile 9 7 3 12 7 12 9 9 8 12 7 10th percentile 14 11 12 17 13 26 16 17 17 35 17 25th percentile 32 17 17 34 18 85 39 50 102 124 124 50th percentile 186 52 51 173 124 249 187 187 187 187 156 75th percentile 249 187 221 372 249 373 249 311 249 249 249 90th percentile 441 249 311 498 498 498 488 498 311 372 262 95th percentile 498 361 496 817 498 746 498 631 498 469 373
)))))))))))))))))))))))))))))))))))))))))))))))))))))))))))))))))))))))))))))))))))))))))))))))))))))))))))))))))))))))))))))))))))
* Indicates a statistic that is potentially unreliable because of small sample size or large coefficient of variation.# Indicates a percentage that is greater than 0 but less than 0.05 or a mean, SEM, or percentile that is greater than 0 but less than 0.5.--- Indicates a percentile that could not be estimated.Note: See "Table notes."Source: USDA's Continuing Survey of Food Intakes by Individuals, 1994-96, 2 days.

155
Table 2.036. Total Grapefruit: Percentage of persons using food in 2 days and quantities consumed in a day.
)))))))))))))))))))))))))))))))))))))))))))))))))))))))))))))))))))))))))))))))))))))))))))))))))))))))))))))))))))))))))))))))))))
* * Age (years) and sex* *)))))))))))))))))))))))))))))))))))))))))))))))))))))))))))))))))))))))))))))))))
* * 2-5 6-11 12-19 20-39 40-59 60 and older* *)))))) )))))) ))))))))))))))) ))))))))))))))) ))))))))))))))) )))))))))))))))
Statistic * All individuals * Males Males* age 2 and over * and and Males Females Males Females Males Females Males Females* *females females
)))))))))))))))))))))))))))))))))))))))))))))))))))))))))))))))))))))))))))))))))))))))))))))))))))))))))))))))))))))))))))))))))))
Number in sample 14,262 2,109 1,432 696 702 1,543 1,449 1,663 1,694 1,545 1,429
Percent of persons using ))))))))))))))))))))))))))))))))))))))))))))%)))))))))))))))))))))))))))))))))))))))))))))
at least once in 2 days 7.1 4.9 5.0 4.1 3.8 3.5 6.9 6.7 9.3 13.6 13.8 on 1 of 2 days 5.4 4.1 4.3 3.2 3.1 2.9 5.7 4.7 7.8 9.4 8.8 on both days 1.7 0.8 0.7 * 0.9 * 0.7 * 0.7 * 1.2 2.0 1.4 4.3 5.0
Quantity consumed in a day ))))))))))))))))))))))))))))))))))))))))))))g)))))))))))))))))))))))))))))))))))))))))))))(1/2 medium = 128 g)
Mean 129 24 41 * 154 * 118 * 185 * 91 209 142 132 127 SEM 9 4 14 * 38 * 23 * 79 * 18 24 13 8 6
5th percentile # # # 1 * --- # # 1 * # 1 * # 10th percentile 1 # # 1 * 1 * 1 * # 1 * 1 5 6 25th percentile 10 3 6 4 * 9 * 2 6 62 29 57 52 50th percentile 120 6 10 33 78 9 29 159 125 126 126 75th percentile 183 27 17 295 * 166 * 195 161 249 196 163 163 90th percentile 271 70 * 126 * 368 * 311 * 422 * 250 * 346 * 312 254 247 95th percentile 362 121 * 193 * 445 * --- 703 * 313 * 667 * 349 * 302 * 273 *
)))))))))))))))))))))))))))))))))))))))))))))))))))))))))))))))))))))))))))))))))))))))))))))))))))))))))))))))))))))))))))))))))))
* Indicates a statistic that is potentially unreliable because of small sample size or large coefficient of variation.# Indicates a percentage that is greater than 0 but less than 0.05 or a mean, SEM, or percentile that is greater than 0 but less than 0.5.--- Indicates a percentile that could not be estimated.Note: See "Table notes."Source: USDA's Continuing Survey of Food Intakes by Individuals, 1994-96, 2 days.

156
Table 2.037. Total Lemons: Percentage of persons using food in 2 days and quantities consumed in a day.
)))))))))))))))))))))))))))))))))))))))))))))))))))))))))))))))))))))))))))))))))))))))))))))))))))))))))))))))))))))))))))))))))))
* * Age (years) and sex* *)))))))))))))))))))))))))))))))))))))))))))))))))))))))))))))))))))))))))))))))))
* * 2-5 6-11 12-19 20-39 40-59 60 and older* *)))))) )))))) ))))))))))))))) ))))))))))))))) ))))))))))))))) )))))))))))))))
Statistic * All individuals * Males Males* age 2 and over * and and Males Females Males Females Males Females Males Females* *females females
)))))))))))))))))))))))))))))))))))))))))))))))))))))))))))))))))))))))))))))))))))))))))))))))))))))))))))))))))))))))))))))))))))
Number in sample 14,262 2,109 1,432 696 702 1,543 1,449 1,663 1,694 1,545 1,429
Percent of persons using ))))))))))))))))))))))))))))))))))))))))))))%)))))))))))))))))))))))))))))))))))))))))))))
at least once in 2 days 54.7 36.2 39.5 51.3 51.5 59.9 54.7 63.3 60.8 56.3 57.6 on 1 of 2 days 37.2 28.8 31.0 36.2 35.8 39.0 39.4 41.1 39.5 36.0 36.4 on both days 17.6 7.4 8.5 15.1 15.6 20.9 15.3 22.3 21.3 20.3 21.3
Quantity consumed in a day ))))))))))))))))))))))))))))))))))))))))))))g)))))))))))))))))))))))))))))))))))))))))))))(1 fluid ounce juice = 30 g)
Mean 6 4 5 7 8 7 7 6 5 5 3 SEM # # 1 1 2 1 1 1 1 1 #
5th percentile # # # # # # # # # # # 10th percentile # # # # # # # # # # # 25th percentile # # # # # # # # # # # 50th percentile # # # # # # # # # # # 75th percentile 2 1 1 1 1 1 3 2 2 2 3 90th percentile 14 14 15 25 26 19 22 14 10 10 8 95th percentile 34 27 38 43 49 50 43 29 27 24 17
)))))))))))))))))))))))))))))))))))))))))))))))))))))))))))))))))))))))))))))))))))))))))))))))))))))))))))))))))))))))))))))))))))
* Indicates a statistic that is potentially unreliable because of small sample size or large coefficient of variation.# Indicates a percentage that is greater than 0 but less than 0.05 or a mean, SEM, or percentile that is greater than 0 but less than 0.5.--- Indicates a percentile that could not be estimated.Note: See "Table notes."Source: USDA's Continuing Survey of Food Intakes by Individuals, 1994-96, 2 days.

157
Table 2.038. Total Lemon Juice: Percentage of persons using food in 2 days and quantities consumed in a day.
)))))))))))))))))))))))))))))))))))))))))))))))))))))))))))))))))))))))))))))))))))))))))))))))))))))))))))))))))))))))))))))))))))
* * Age (years) and sex* *)))))))))))))))))))))))))))))))))))))))))))))))))))))))))))))))))))))))))))))))))
* * 2-5 6-11 12-19 20-39 40-59 60 and older* *)))))) )))))) ))))))))))))))) ))))))))))))))) ))))))))))))))) )))))))))))))))
Statistic * All individuals * Males Males* age 2 and over * and and Males Females Males Females Males Females Males Females* *females females
)))))))))))))))))))))))))))))))))))))))))))))))))))))))))))))))))))))))))))))))))))))))))))))))))))))))))))))))))))))))))))))))))))
Number in sample 14,262 2,109 1,432 696 702 1,543 1,449 1,663 1,694 1,545 1,429
Percent of persons using ))))))))))))))))))))))))))))))))))))))))))))%)))))))))))))))))))))))))))))))))))))))))))))
at least once in 2 days 52.8 35.2 38.2 49.8 49.7 58.0 52.5 61.0 58.6 54.5 55.4 on 1 of 2 days 36.9 28.2 30.3 36.4 34.9 38.8 38.7 41.1 39.0 35.5 37.3 on both days 15.9 7.0 7.8 13.4 14.8 19.1 13.8 19.9 19.6 19.0 18.1
Quantity consumed in a day ))))))))))))))))))))))))))))))))))))))))))))g)))))))))))))))))))))))))))))))))))))))))))))(1 fluid ounce juice = 30 g)
Mean 5 3 5 8 7 7 6 5 4 4 3 SEM # 1 1 1 1 1 1 1 1 1 #
5th percentile # # # # # # # # # # # 10th percentile # # # # # # # # # # # 25th percentile # # # # # # # # # # # 50th percentile # # # # # # # # # # # 75th percentile 1 1 1 1 1 1 2 1 1 1 2 90th percentile 11 14 15 26 18 13 16 11 8 7 7 95th percentile 33 27 32 52 48 46 41 27 26 23 17
)))))))))))))))))))))))))))))))))))))))))))))))))))))))))))))))))))))))))))))))))))))))))))))))))))))))))))))))))))))))))))))))))))
* Indicates a statistic that is potentially unreliable because of small sample size or large coefficient of variation.# Indicates a percentage that is greater than 0 but less than 0.05 or a mean, SEM, or percentile that is greater than 0 but less than 0.5.--- Indicates a percentile that could not be estimated.Note: See "Table notes."Source: USDA's Continuing Survey of Food Intakes by Individuals, 1994-96, 2 days.

158
Table 2.039. Total Apples: Percentage of persons using food in 2 days and quanti ties consumed in a day.
)))))))))))))))))))))))))))))))))))))))))))))))))))))))))))))))))))))))))))))))))))))))))))))))))))))))))))))))))))))))))))))))))))
* * Age (years) and sex* *)))))))))))))))))))))))))))))))))))))))))))))))))))))))))))))))))))))))))))))))))
* * 2-5 6-11 12-19 20-39 40-59 60 and older* *)))))) )))))) ))))))))))))))) ))))))))))))))) ))))))))))))))) )))))))))))))))
Statistic * All individuals * Males Males* age 2 and over * and and Males Females Males Females Males Females Males Females* *females females
)))))))))))))))))))))))))))))))))))))))))))))))))))))))))))))))))))))))))))))))))))))))))))))))))))))))))))))))))))))))))))))))))))
Number in sample 14,262 2,109 1,432 696 702 1,543 1,449 1,663 1,694 1,545 1,429
Percent of persons using ))))))))))))))))))))))))))))))))))))))))))))%)))))))))))))))))))))))))))))))))))))))))))))
at least once in 2 days 35.9 62.9 53.0 30.6 31.7 25.4 31.4 31.1 32.4 39.4 39.8 on 1 of 2 days 25.6 33.9 36.5 23.6 23.7 19.9 24.5 22.9 24.3 26.5 27.8 on both days 10.2 28.9 16.5 6.9 8.1 5.5 6.9 8.1 8.1 12.9 12.0
Quantity consumed in a day ))))))))))))))))))))))))))))))))))))))))))))g)))))))))))))))))))))))))))))))))))))))))))))(1 medium = 138 g)
Mean 148 185 136 178 192 175 135 156 117 135 113 SEM 3 6 6 13 24 10 8 10 6 6 5
5th percentile 2 3 2 1 * 1 * 2 1 3 2 2 2 10th percentile 5 10 3 2 2 7 3 9 4 7 6 25th percentile 41 69 42 37 32 45 33 50 32 44 30 50th percentile 124 138 114 130 125 137 108 128 105 121 105 75th percentile 205 248 180 245 248 223 161 210 137 186 137 90th percentile 310 372 270 431 463 374 275 372 221 261 247 95th percentile 457 507 398 492 * 709 * 568 372 496 276 367 287
)))))))))))))))))))))))))))))))))))))))))))))))))))))))))))))))))))))))))))))))))))))))))))))))))))))))))))))))))))))))))))))))))))
* Indicates a statistic that is potentially unreliable because of small sample size or large coefficient of variation.# Indicates a percentage that is greater than 0 but less than 0.05 or a mean, SEM, or percentile that is greater than 0 but less than 0.5.--- Indicates a percentile that could not be estimated.Note: See "Table notes."Source: USDA's Continuing Survey of Food Intakes by Individuals, 1994-96, 2 days.

159
Table 2.040. Total Apple Juice: Percentage of persons using food in 2 days and quantities consumed in a day.
)))))))))))))))))))))))))))))))))))))))))))))))))))))))))))))))))))))))))))))))))))))))))))))))))))))))))))))))))))))))))))))))))))
* * Age (years) and sex* *)))))))))))))))))))))))))))))))))))))))))))))))))))))))))))))))))))))))))))))))))
* * 2-5 6-11 12-19 20-39 40-59 60 and older* *)))))) )))))) ))))))))))))))) ))))))))))))))) ))))))))))))))) )))))))))))))))
Statistic * All individuals * Males Males* age 2 and over * and and Males Females Males Females Males Females Males Females* *females females
)))))))))))))))))))))))))))))))))))))))))))))))))))))))))))))))))))))))))))))))))))))))))))))))))))))))))))))))))))))))))))))))))))
Number in sample 14,262 2,109 1,432 696 702 1,543 1,449 1,663 1,694 1,545 1,429
Percent of persons using ))))))))))))))))))))))))))))))))))))))))))))%)))))))))))))))))))))))))))))))))))))))))))))
at least once in 2 days 12.8 38.8 21.8 12.1 13.0 8.0 11.5 9.7 7.7 9.6 10.0 on 1 of 2 days 9.8 24.3 17.6 10.7 10.0 6.4 9.2 8.2 6.3 7.1 7.3 on both days 3.0 14.5 4.2 1.4 * 3.1 1.6 2.2 1.5 1.4 2.4 2.7
Quantity consumed in a day ))))))))))))))))))))))))))))))))))))))))))))g)))))))))))))))))))))))))))))))))))))))))))))(6 fluid ounces = 186 g)
Mean 207 223 178 290 265 278 181 238 139 152 137 SEM 6 7 12 25 34 25 23 27 16 15 9
5th percentile 8 21 21 2 * 7 * 20 * 2 * 5 * 2 * 1 * 4 * 10th percentile 21 43 32 34 * 36 * 30 * 15 13 7 14 13 25th percentile 53 100 66 118 109 102 44 49 28 32 28 50th percentile 150 186 124 248 188 248 102 153 76 115 95 75th percentile 250 263 248 433 363 372 248 372 226 241 211 90th percentile 496 476 371 620 * 496 * 616 * 380 615 302 372 262 95th percentile 618 599 496 666 * 620 * 744 * 529 * 671 * 427 * 496 * 319 *
)))))))))))))))))))))))))))))))))))))))))))))))))))))))))))))))))))))))))))))))))))))))))))))))))))))))))))))))))))))))))))))))))))
* Indicates a statistic that is potentially unreliable because of small sample size or large coefficient of variation.# Indicates a percentage that is greater than 0 but less than 0.05 or a mean, SEM, or percentile that is greater than 0 but less than 0.5.--- Indicates a percentile that could not be estimated.Note: See "Table notes."Source: USDA's Continuing Survey of Food Intakes by Individuals, 1994-96, 2 days.
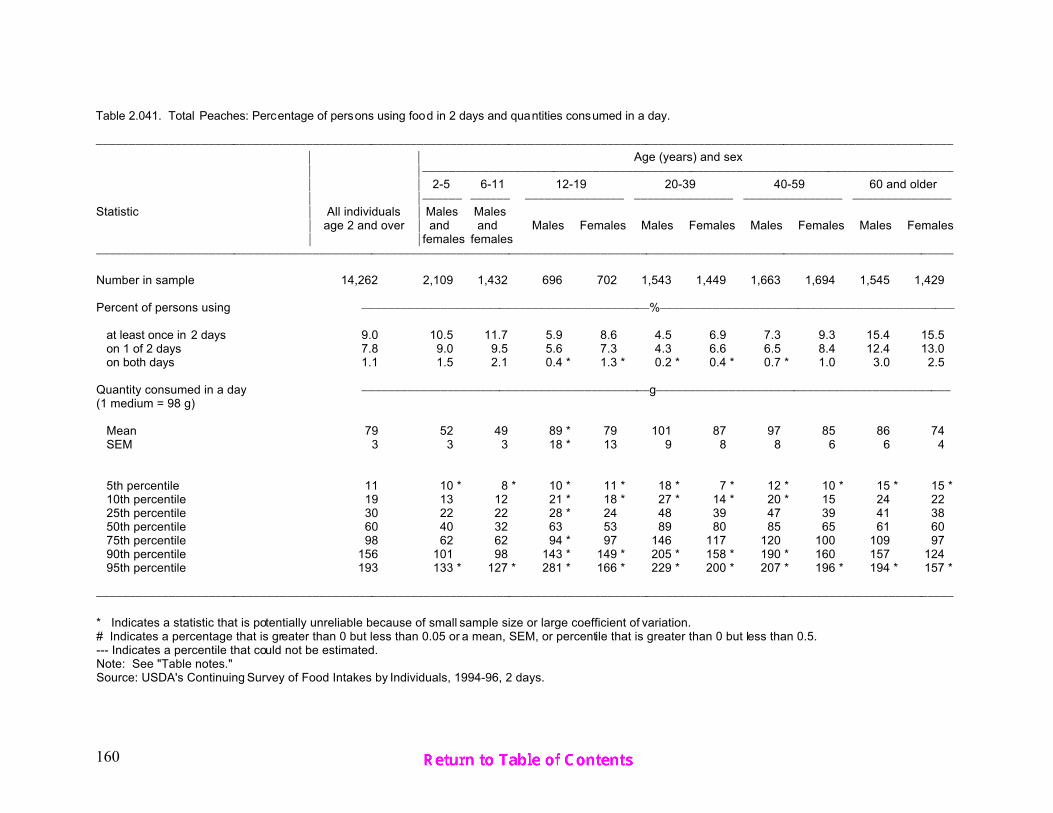
160
Table 2.041. Total Peaches: Percentage of persons using food in 2 days and quantities consumed in a day.
)))))))))))))))))))))))))))))))))))))))))))))))))))))))))))))))))))))))))))))))))))))))))))))))))))))))))))))))))))))))))))))))))))
* * Age (years) and sex* *)))))))))))))))))))))))))))))))))))))))))))))))))))))))))))))))))))))))))))))))))
* * 2-5 6-11 12-19 20-39 40-59 60 and older* *)))))) )))))) ))))))))))))))) ))))))))))))))) ))))))))))))))) )))))))))))))))
Statistic * All individuals * Males Males* age 2 and over * and and Males Females Males Females Males Females Males Females* *females females
)))))))))))))))))))))))))))))))))))))))))))))))))))))))))))))))))))))))))))))))))))))))))))))))))))))))))))))))))))))))))))))))))))
Number in sample 14,262 2,109 1,432 696 702 1,543 1,449 1,663 1,694 1,545 1,429
Percent of persons using ))))))))))))))))))))))))))))))))))))))))))))%)))))))))))))))))))))))))))))))))))))))))))))
at least once in 2 days 9.0 10.5 11.7 5.9 8.6 4.5 6.9 7.3 9.3 15.4 15.5 on 1 of 2 days 7.8 9.0 9.5 5.6 7.3 4.3 6.6 6.5 8.4 12.4 13.0 on both days 1.1 1.5 2.1 0.4 * 1.3 * 0.2 * 0.4 * 0.7 * 1.0 3.0 2.5
Quantity consumed in a day ))))))))))))))))))))))))))))))))))))))))))))g)))))))))))))))))))))))))))))))))))))))))))))(1 medium = 98 g)
Mean 79 52 49 89 * 79 101 87 97 85 86 74 SEM 3 3 3 18 * 13 9 8 8 6 6 4
5th percentile 11 10 * 8 * 10 * 11 * 18 * 7 * 12 * 10 * 15 * 15 * 10th percentile 19 13 12 21 * 18 * 27 * 14 * 20 * 15 24 22 25th percentile 30 22 22 28 * 24 48 39 47 39 41 38 50th percentile 60 40 32 63 53 89 80 85 65 61 60 75th percentile 98 62 62 94 * 97 146 117 120 100 109 97 90th percentile 156 101 98 143 * 149 * 205 * 158 * 190 * 160 157 124 95th percentile 193 133 * 127 * 281 * 166 * 229 * 200 * 207 * 196 * 194 * 157 *
)))))))))))))))))))))))))))))))))))))))))))))))))))))))))))))))))))))))))))))))))))))))))))))))))))))))))))))))))))))))))))))))))))
* Indicates a statistic that is potentially unreliable because of small sample size or large coefficient of variation.# Indicates a percentage that is greater than 0 but less than 0.05 or a mean, SEM, or percentile that is greater than 0 but less than 0.5.--- Indicates a percentile that could not be estimated.Note: See "Table notes."Source: USDA's Continuing Survey of Food Intakes by Individuals, 1994-96, 2 days.

161
Table 2.042. Total Bananas: Percentage of persons using food in 2 days and quantities consumed in a day.
)))))))))))))))))))))))))))))))))))))))))))))))))))))))))))))))))))))))))))))))))))))))))))))))))))))))))))))))))))))))))))))))))))
* * Age (years) and sex* *)))))))))))))))))))))))))))))))))))))))))))))))))))))))))))))))))))))))))))))))))
* * 2-5 6-11 12-19 20-39 40-59 60 and older* *)))))) )))))) ))))))))))))))) ))))))))))))))) ))))))))))))))) )))))))))))))))
Statistic * All individuals * Males Males* age 2 and over * and and Males Females Males Females Males Females Males Females* *females females
)))))))))))))))))))))))))))))))))))))))))))))))))))))))))))))))))))))))))))))))))))))))))))))))))))))))))))))))))))))))))))))))))))
Number in sample 14,262 2,109 1,432 696 702 1,543 1,449 1,663 1,694 1,545 1,429
Percent of persons using ))))))))))))))))))))))))))))))))))))))))))))%)))))))))))))))))))))))))))))))))))))))))))))
at least once in 2 days 24.2 28.1 21.3 14.6 12.4 16.8 21.3 24.5 28.1 40.3 38.2 on 1 of 2 days 17.8 22.3 18.7 11.9 11.7 12.6 16.8 17.1 21.9 22.3 24.6 on both days 6.4 5.8 2.6 2.7 0.7 * 4.2 4.5 7.5 6.2 18.0 13.6
Quantity consumed in a day ))))))))))))))))))))))))))))))))))))))))))))g)))))))))))))))))))))))))))))))))))))))))))))(1 medium = 118 g)
Mean 106 91 94 110 94 124 104 127 109 102 93 SEM 2 2 5 13 7 6 2 5 3 2 2
5th percentile 11 6 # 5 * 1 * 14 14 17 13 20 12 10th percentile 24 17 6 18 * 14 * 24 37 46 35 40 29 25th percentile 59 58 41 43 35 101 86 113 96 58 57 50th percentile 117 98 102 112 108 115 117 116 116 114 100 75th percentile 118 116 115 119 115 120 118 134 118 117 116 90th percentile 136 134 134 200 * 133 * 210 133 219 136 136 134 95th percentile 234 140 179 249 * 184 * 236 151 235 223 167 140
)))))))))))))))))))))))))))))))))))))))))))))))))))))))))))))))))))))))))))))))))))))))))))))))))))))))))))))))))))))))))))))))))))
* Indicates a statistic that is potentially unreliable because of small sample size or large coefficient of variation.# Indicates a percentage that is greater than 0 but less than 0.05 or a mean, SEM, or percentile that is greater than 0 but less than 0.5.--- Indicates a percentile that could not be estimated.Note: See "Table notes."Source: USDA's Continuing Survey of Food Intakes by Individuals, 1994-96, 2 days.

162
Table 2.043. Total Strawberries: Percentage of persons using food in 2 days and quantities consumed in a day.
)))))))))))))))))))))))))))))))))))))))))))))))))))))))))))))))))))))))))))))))))))))))))))))))))))))))))))))))))))))))))))))))))))
* * Age (years) and sex* *)))))))))))))))))))))))))))))))))))))))))))))))))))))))))))))))))))))))))))))))))
* * 2-5 6-11 12-19 20-39 40-59 60 and older* *)))))) )))))) ))))))))))))))) ))))))))))))))) ))))))))))))))) )))))))))))))))
Statistic * All individuals * Males Males* age 2 and over * and and Males Females Males Females Males Females Males Females* *females females
)))))))))))))))))))))))))))))))))))))))))))))))))))))))))))))))))))))))))))))))))))))))))))))))))))))))))))))))))))))))))))))))))))
Number in sample 14,262 2,109 1,432 696 702 1,543 1,449 1,663 1,694 1,545 1,429
Percent of persons using ))))))))))))))))))))))))))))))))))))))))))))%)))))))))))))))))))))))))))))))))))))))))))))
at least once in 2 days 13.3 16.3 14.6 8.6 13.7 9.2 14.9 11.5 17.0 12.0 14.8 on 1 of 2 days 11.3 13.1 12.8 7.9 13.0 7.8 12.5 10.2 14.3 9.9 11.7 on both days 2.0 3.2 1.8 0.7 * 0.7 * 1.4 2.4 1.3 2.7 2.1 3.1
Quantity consumed in a day ))))))))))))))))))))))))))))))))))))))))))))g)))))))))))))))))))))))))))))))))))))))))))))(1/2 cup = 83 g)
Mean 44 26 34 45 41 45 48 52 46 51 46 SEM 2 3 4 10 6 7 6 4 4 6 5
5th percentile # # # # # # # 1 * # 1 * 1 * 10th percentile 1 # # # # 2 2 4 3 2 2 25th percentile 6 3 2 2 2 10 8 10 8 8 8 50th percentile 17 7 13 12 13 17 16 35 26 35 28 75th percentile 60 30 45 61 67 56 60 71 60 72 70 90th percentile 114 72 73 136 * 119 * 113 120 128 102 136 110 95th percentile 154 110 120 * 161 * 161 * 151 * 192 * 180 * 149 160 * 150 *
)))))))))))))))))))))))))))))))))))))))))))))))))))))))))))))))))))))))))))))))))))))))))))))))))))))))))))))))))))))))))))))))))))
* Indicates a statistic that is potentially unreliable because of small sample size or large coefficient of variation.# Indicates a percentage that is greater than 0 but less than 0.05 or a mean, SEM, or percentile that is greater than 0 but less than 0.5.--- Indicates a percentile that could not be estimated.Note: See "Table notes."Source: USDA's Continuing Survey of Food Intakes by Individuals, 1994-96, 2 days.

163
Table 2.044. Total Grapes: Percentage of persons using food in 2 days and quanti ties consumed in a day.
)))))))))))))))))))))))))))))))))))))))))))))))))))))))))))))))))))))))))))))))))))))))))))))))))))))))))))))))))))))))))))))))))))
* * Age (years) and sex* *)))))))))))))))))))))))))))))))))))))))))))))))))))))))))))))))))))))))))))))))))
* * 2-5 6-11 12-19 20-39 40-59 60 and older* *)))))) )))))) ))))))))))))))) ))))))))))))))) ))))))))))))))) )))))))))))))))
Statistic * All individuals * Males Males* age 2 and over * and and Males Females Males Females Males Females Males Females* *females females
)))))))))))))))))))))))))))))))))))))))))))))))))))))))))))))))))))))))))))))))))))))))))))))))))))))))))))))))))))))))))))))))))))
Number in sample 14,262 2,109 1,432 696 702 1,543 1,449 1,663 1,694 1,545 1,429
Percent of persons using ))))))))))))))))))))))))))))))))))))))))))))%)))))))))))))))))))))))))))))))))))))))))))))
at least once in 2 days 43.4 61.8 60.5 36.0 42.2 33.3 37.2 41.2 40.4 48.8 49.9 on 1 of 2 days 31.1 38.8 43.6 26.1 33.4 27.0 27.2 29.9 29.8 31.0 32.4 on both days 12.3 23.0 16.9 9.9 8.8 6.4 10.0 11.2 10.5 17.7 17.5
Quantity consumed in a day ))))))))))))))))))))))))))))))))))))))))))))g)))))))))))))))))))))))))))))))))))))))))))))(1/2 cup = 80 g)
Mean 42 60 45 41 41 51 39 42 38 34 29 SEM 2 4 3 9 5 6 3 4 4 3 3
5th percentile 1 1 1 1 # 1 1 1 1 1 1 10th percentile 2 2 2 2 2 2 2 2 2 2 2 25th percentile 4 5 4 3 3 3 4 4 4 4 4 50th percentile 9 14 10 10 9 9 9 9 9 9 9 75th percentile 37 78 48 31 40 36 36 35 30 24 26 90th percentile 125 168 125 105 130 149 120 107 128 78 80 95th percentile 196 250 223 160 187 253 167 187 182 159 150
)))))))))))))))))))))))))))))))))))))))))))))))))))))))))))))))))))))))))))))))))))))))))))))))))))))))))))))))))))))))))))))))))))
* Indicates a statistic that is potentially unreliable because of small sample size or large coefficient of variation.# Indicates a percentage that is greater than 0 but less than 0.05 or a mean, SEM, or percentile that is greater than 0 but less than 0.5.--- Indicates a percentile that could not be estimated.Note: See "Table notes."Source: USDA's Continuing Survey of Food Intakes by Individuals, 1994-96, 2 days.

164
Table 2.045. Total Milk: Percentage of persons using food in 2 days and quantities consumed in a day.
)))))))))))))))))))))))))))))))))))))))))))))))))))))))))))))))))))))))))))))))))))))))))))))))))))))))))))))))))))))))))))))))))))
* * Age (years) and sex* *)))))))))))))))))))))))))))))))))))))))))))))))))))))))))))))))))))))))))))))))))
* * 2-5 6-11 12-19 20-39 40-59 60 and older* *)))))) )))))) ))))))))))))))) ))))))))))))))) ))))))))))))))) )))))))))))))))
Statistic * All individuals * Males Males* age 2 and over * and and Males Females Males Females Males Females Males Females* *females females
)))))))))))))))))))))))))))))))))))))))))))))))))))))))))))))))))))))))))))))))))))))))))))))))))))))))))))))))))))))))))))))))))))
Number in sample 14,262 2,109 1,432 696 702 1,543 1,449 1,663 1,694 1,545 1,429
Percent of persons using ))))))))))))))))))))))))))))))))))))))))))))%)))))))))))))))))))))))))))))))))))))))))))))
at least once in 2 days 97.9 99.8 * 99.8 * 98.6 * 97.8 97.5 96.7 97.0 97.6 98.1 98.3 on 1 of 2 days 11.5 3.6 3.8 8.8 16.5 15.5 14.9 11.9 12.6 8.1 10.6 on both days 86.4 96.2 96.0 89.8 81.3 82.0 81.8 85.1 85.0 90.0 87.7
Quantity consumed in a day ))))))))))))))))))))))))))))))))))))))))))))g)))))))))))))))))))))))))))))))))))))))))))))(1 cup lowfat milk = 244 g)
Mean 288 395 422 457 294 280 225 266 205 281 227 SEM 4 8 11 22 12 14 7 10 8 8 7
5th percentile 4 21 14 5 3 3 3 4 3 11 5 10th percentile 10 68 62 13 5 6 7 8 9 22 15 25th percentile 52 191 229 75 48 32 34 37 30 78 53 50th percentile 216 354 372 369 243 162 144 165 122 227 158 75th percentile 426 539 601 642 390 411 328 383 299 403 341 90th percentile 671 756 823 998 689 687 528 653 523 615 521 95th percentile 854 930 961 1,356 979 974 706 870 671 779 629
)))))))))))))))))))))))))))))))))))))))))))))))))))))))))))))))))))))))))))))))))))))))))))))))))))))))))))))))))))))))))))))))))))
* Indicates a statistic that is potentially unreliable because of small sample size or large coefficient of variation.# Indicates a percentage that is greater than 0 but less than 0.05 or a mean, SEM, or percentile that is greater than 0 but less than 0.5.--- Indicates a percentile that could not be estimated.Note: See "Table notes."Source: USDA's Continuing Survey of Food Intakes by Individuals, 1994-96, 2 days.

165
Table 2.046. Flu id Milk Consumed with Cereal: Percentage of persons using food in 2 days and quantities consumed in a day.
)))))))))))))))))))))))))))))))))))))))))))))))))))))))))))))))))))))))))))))))))))))))))))))))))))))))))))))))))))))))))))))))))))
* * Age (years) and sex* *)))))))))))))))))))))))))))))))))))))))))))))))))))))))))))))))))))))))))))))))))
* * 2-5 6-11 12-19 20-39 40-59 60 and older* *)))))) )))))) ))))))))))))))) ))))))))))))))) ))))))))))))))) )))))))))))))))
Statistic * All individuals * Males Males* age 2 and over * and and Males Females Males Females Males Females Males Females* *females females
)))))))))))))))))))))))))))))))))))))))))))))))))))))))))))))))))))))))))))))))))))))))))))))))))))))))))))))))))))))))))))))))))))
Number in sample 14,262 2,109 1,432 696 702 1,543 1,449 1,663 1,694 1,545 1,429
Percent of persons using ))))))))))))))))))))))))))))))))))))))))))))%)))))))))))))))))))))))))))))))))))))))))))))
at least once in 2 days 40.0 68.1 64.7 44.4 42.7 26.9 32.4 30.1 30.2 48.1 46.6 on 1 of 2 days 24.5 36.3 37.4 28.8 30.0 18.6 23.4 17.9 20.3 23.1 24.5 on both days 15.5 31.8 27.4 15.6 12.7 8.4 9.0 12.2 9.9 25.0 22.1
Quantity consumed in a day ))))))))))))))))))))))))))))))))))))))))))))g)))))))))))))))))))))))))))))))))))))))))))))(1 cup lowfat milk = 244 g)
Mean 205 158 213 292 230 280 206 214 170 173 142 SEM 4 5 6 13 7 13 7 7 6 5 6
5th percentile 59 57 58 94 80 87 61 57 49 49 30 10th percentile 81 59 102 103 90 102 94 81 60 60 51 25th percentile 117 112 113 174 122 165 111 112 108 98 81 50th percentile 177 119 178 224 221 220 184 184 122 122 117 75th percentile 244 216 234 352 242 337 240 242 213 229 183 90th percentile 350 241 354 486 364 464 316 352 245 245 244 95th percentile 453 321 458 673 461 489 367 455 348 357 245
)))))))))))))))))))))))))))))))))))))))))))))))))))))))))))))))))))))))))))))))))))))))))))))))))))))))))))))))))))))))))))))))))))
* Indicates a statistic that is potentially unreliable because of small sample size or large coefficient of variation.# Indicates a percentage that is greater than 0 but less than 0.05 or a mean, SEM, or percentile that is greater than 0 but less than 0.5.--- Indicates a percentile that could not be estimated.Note: See "Table notes."Source: USDA's Continuing Survey of Food Intakes by Individuals, 1994-96, 2 days.

166
Table 2.047. Total Cheese Other than Cream or Cottage: Percentage of persons using food in 2 days and quantities consumed in a day.
)))))))))))))))))))))))))))))))))))))))))))))))))))))))))))))))))))))))))))))))))))))))))))))))))))))))))))))))))))))))))))))))))))
* * Age (years) and sex* *)))))))))))))))))))))))))))))))))))))))))))))))))))))))))))))))))))))))))))))))))
* * 2-5 6-11 12-19 20-39 40-59 60 and older* *)))))) )))))) ))))))))))))))) ))))))))))))))) ))))))))))))))) )))))))))))))))
Statistic * All individuals * Males Males* age 2 and over * and and Males Females Males Females Males Females Males Females* *females females
)))))))))))))))))))))))))))))))))))))))))))))))))))))))))))))))))))))))))))))))))))))))))))))))))))))))))))))))))))))))))))))))))))
Number in sample 14,262 2,109 1,432 696 702 1,543 1,449 1,663 1,694 1,545 1,429
Percent of persons using ))))))))))))))))))))))))))))))))))))))))))))%)))))))))))))))))))))))))))))))))))))))))))))
at least once in 2 days 75.9 82.9 84.8 86.5 83.1 83.9 79.0 71.4 70.9 59.7 56.6 on 1 of 2 days 40.2 39.9 41.6 34.5 39.0 39.5 42.7 40.3 42.4 37.4 39.7 on both days 35.7 42.9 43.2 52.0 44.2 44.4 36.3 31.1 28.5 22.4 16.9
Quantity consumed in a day ))))))))))))))))))))))))))))))))))))))))))))g)))))))))))))))))))))))))))))))))))))))))))))(1-1/2 ounces = 43 g)
Mean 37 23 29 49 34 53 34 39 29 32 26 SEM 1 1 1 2 2 3 1 2 1 1 1
5th percentile 1 1 1 6 1 4 1 1 1 1 1 10th percentile 4 2 4 9 6 9 5 4 4 3 2 25th percentile 13 7 11 21 14 22 13 15 12 12 8 50th percentile 26 16 21 35 26 37 26 28 23 24 21 75th percentile 47 32 39 59 47 63 42 51 41 42 36 90th percentile 77 54 63 96 71 113 69 84 61 66 57 95th percentile 105 70 81 132 99 147 97 108 85 91 68
)))))))))))))))))))))))))))))))))))))))))))))))))))))))))))))))))))))))))))))))))))))))))))))))))))))))))))))))))))))))))))))))))))
* Indicates a statistic that is potentially unreliable because of small sample size or large coefficient of variation.# Indicates a percentage that is greater than 0 but less than 0.05 or a mean, SEM, or percentile that is greater than 0 but less than 0.5.--- Indicates a percentile that could not be estimated.Note: See "Table notes."Source: USDA's Continuing Survey of Food Intakes by Individuals, 1994-96, 2 days.

167
Table 2.048. Total Cottage Cheese: Percentage of persons using food in 2 days and quantities consumed in a day.
)))))))))))))))))))))))))))))))))))))))))))))))))))))))))))))))))))))))))))))))))))))))))))))))))))))))))))))))))))))))))))))))))))
* * Age (years) and sex* *)))))))))))))))))))))))))))))))))))))))))))))))))))))))))))))))))))))))))))))))))
* * 2-5 6-11 12-19 20-39 40-59 60 and older* *)))))) )))))) ))))))))))))))) ))))))))))))))) ))))))))))))))) )))))))))))))))
Statistic * All individuals * Males Males* age 2 and over * and and Males Females Males Females Males Females Males Females* *females females
)))))))))))))))))))))))))))))))))))))))))))))))))))))))))))))))))))))))))))))))))))))))))))))))))))))))))))))))))))))))))))))))))))
Number in sample 14,262 2,109 1,432 696 702 1,543 1,449 1,663 1,694 1,545 1,429
Percent of persons using ))))))))))))))))))))))))))))))))))))))))))))%)))))))))))))))))))))))))))))))))))))))))))))
at least once in 2 days 9.0 7.8 7.5 6.9 8.0 8.5 8.0 8.9 11.0 10.1 12.2 on 1 of 2 days 8.3 7.4 7.2 6.8 7.5 8.2 7.2 8.5 10.4 8.6 10.3 on both days 0.7 0.4 * 0.3 * 0.1 * 0.6 * 0.3 * 0.8 * 0.4 * 0.6 * 1.5 1.9
Quantity consumed in a day ))))))))))))))))))))))))))))))))))))))))))))g)))))))))))))))))))))))))))))))))))))))))))))(1/2 cup = 105 g)
Mean 75 44 51 89 81 76 66 91 73 95 83 SEM 4 5 7 17 20 10 7 7 7 9 4
5th percentile 5 # 3 * 1 * 10 * 1 * 3 * 7 * 6 * 13 * 7 * 10th percentile 12 1 6 * 13 * 14 * 10 8 * 19 11 19 14 25th percentile 26 9 20 34 * 31 26 23 32 26 27 30 50th percentile 50 26 32 51 45 49 38 61 51 70 66 75th percentile 105 59 61 116 * 93 90 90 112 104 111 108 90th percentile 206 106 108 * 213 * 151 * 153 120 * 210 209 208 170 95th percentile 225 122 * 177 * 226 * 280 * 218 * 209 * 222 * 214 * 226 * 217 *
)))))))))))))))))))))))))))))))))))))))))))))))))))))))))))))))))))))))))))))))))))))))))))))))))))))))))))))))))))))))))))))))))))
* Indicates a statistic that is potentially unreliable because of small sample size or large coefficient of variation.# Indicates a percentage that is greater than 0 but less than 0.05 or a mean, SEM, or percentile that is greater than 0 but less than 0.5.--- Indicates a percentile that could not be estimated.Note: See "Table notes."Source: USDA's Continuing Survey of Food Intakes by Individuals, 1994-96, 2 days.

168
Table 2.049. Ice Cream and Ice Milk : Percentage of persons using food in 2 days and quantities consumed in a day.
)))))))))))))))))))))))))))))))))))))))))))))))))))))))))))))))))))))))))))))))))))))))))))))))))))))))))))))))))))))))))))))))))))
* * Age (years) and sex* *)))))))))))))))))))))))))))))))))))))))))))))))))))))))))))))))))))))))))))))))))
* * 2-5 6-11 12-19 20-39 40-59 60 and older* *)))))) )))))) ))))))))))))))) ))))))))))))))) ))))))))))))))) )))))))))))))))
Statistic * All individuals * Males Males* age 2 and over * and and Males Females Males Females Males Females Males Females* *females females
)))))))))))))))))))))))))))))))))))))))))))))))))))))))))))))))))))))))))))))))))))))))))))))))))))))))))))))))))))))))))))))))))))
Number in sample 14,262 2,109 1,432 696 702 1,543 1,449 1,663 1,694 1,545 1,429
Percent of persons using ))))))))))))))))))))))))))))))))))))))))))))%)))))))))))))))))))))))))))))))))))))))))))))
at least once in 2 days 16.6 18.4 21.1 14.2 15.2 14.7 13.6 18.0 14.2 22.7 18.9 on 1 of 2 days 14.2 15.6 18.9 12.4 13.7 13.2 12.5 15.3 12.1 17.1 14.2 on both days 2.4 2.8 2.2 1.8 * 1.4 * 1.5 1.1 2.8 2.1 5.5 4.8
Quantity consumed in a day ))))))))))))))))))))))))))))))))))))))))))))g)))))))))))))))))))))))))))))))))))))))))))))(1/2 cup hard ice cream = 67 g)
Mean 157 96 140 229 206 202 138 184 145 144 112 SEM 4 4 5 13 20 20 7 8 8 5 5
5th percentile 44 33 51 63 * 39 * 44 * 39 * 64 43 * 33 30 10th percentile 66 35 66 66 * 58 * 66 66 69 50 66 43 25th percentile 74 61 83 132 98 132 68 131 66 66 66 50th percentile 132 66 132 198 134 172 132 133 132 132 100 75th percentile 199 132 171 293 265 265 163 264 197 198 133 90th percentile 266 175 248 385 * 363 * 398 251 304 265 265 198 95th percentile 370 199 265 477 * 398 * 422 * 297 * 396 275 * 293 232
)))))))))))))))))))))))))))))))))))))))))))))))))))))))))))))))))))))))))))))))))))))))))))))))))))))))))))))))))))))))))))))))))))
* Indicates a statistic that is potentially unreliable because of small sample size or large coefficient of variation.# Indicates a percentage that is greater than 0 but less than 0.05 or a mean, SEM, or percentile that is greater than 0 but less than 0.5.--- Indicates a percentile that could not be estimated.Note: See "Table notes."Source: USDA's Continuing Survey of Food Intakes by Individuals, 1994-96, 2 days.

169
Table 2.050. Total Beef: Percentage of persons using food in 2 days and quantit ies consumed in a day.
)))))))))))))))))))))))))))))))))))))))))))))))))))))))))))))))))))))))))))))))))))))))))))))))))))))))))))))))))))))))))))))))))))
* * Age (years) and sex* *)))))))))))))))))))))))))))))))))))))))))))))))))))))))))))))))))))))))))))))))))
* * 2-5 6-11 12-19 20-39 40-59 60 and older* *)))))) )))))) ))))))))))))))) ))))))))))))))) ))))))))))))))) )))))))))))))))
Statistic * All individuals * Males Males* age 2 and over * and and Males Females Males Females Males Females Males Females* *females females
)))))))))))))))))))))))))))))))))))))))))))))))))))))))))))))))))))))))))))))))))))))))))))))))))))))))))))))))))))))))))))))))))))
Number in sample 14,262 2,109 1,432 696 702 1,543 1,449 1,663 1,694 1,545 1,429
Percent of persons using ))))))))))))))))))))))))))))))))))))))))))))%)))))))))))))))))))))))))))))))))))))))))))))
at least once in 2 days 74.0 76.3 79.3 83.8 77.0 82.0 69.8 74.3 68.0 69.0 63.7 on 1 of 2 days 42.9 46.3 44.4 42.2 44.2 41.1 42.7 40.1 44.1 42.1 44.8 on both days 31.1 30.0 34.9 41.6 32.8 40.9 27.2 34.3 24.0 26.9 18.9
Quantity consumed in a day ))))))))))))))))))))))))))))))))))))))))))))g)))))))))))))))))))))))))))))))))))))))))))))(1 ounce = 28 g)
Mean 90 43 60 112 77 127 79 117 78 95 73 SEM 2 2 2 9 4 5 3 3 2 3 2
5th percentile 3 2 3 4 4 6 3 5 3 3 1 10th percentile 7 3 4 7 6 13 6 12 6 11 3 25th percentile 30 13 21 29 26 55 30 45 29 41 32 50th percentile 71 32 46 83 63 99 63 91 67 82 63 75th percentile 120 61 84 154 108 175 110 163 105 124 100 90th percentile 198 92 128 224 163 276 168 246 167 206 146 95th percentile 258 120 165 305 222 342 214 309 203 258 179
)))))))))))))))))))))))))))))))))))))))))))))))))))))))))))))))))))))))))))))))))))))))))))))))))))))))))))))))))))))))))))))))))))
* Indicates a statistic that is potentially unreliable because of small sample size or large coefficient of variation.# Indicates a percentage that is greater than 0 but less than 0.05 or a mean, SEM, or percentile that is greater than 0 but less than 0.5.--- Indicates a percentile that could not be estimated.Note: See "Table notes."Source: USDA's Continuing Survey of Food Intakes by Individuals, 1994-96, 2 days.

170
Table 2.051. Total Pork: Percentage of persons using food in 2 days and quantit ies consumed in a day.
)))))))))))))))))))))))))))))))))))))))))))))))))))))))))))))))))))))))))))))))))))))))))))))))))))))))))))))))))))))))))))))))))))
* * Age (years) and sex* *)))))))))))))))))))))))))))))))))))))))))))))))))))))))))))))))))))))))))))))))))
* * 2-5 6-11 12-19 20-39 40-59 60 and older* *)))))) )))))) ))))))))))))))) ))))))))))))))) ))))))))))))))) )))))))))))))))
Statistic * All individuals * Males Males* age 2 and over * and and Males Females Males Females Males Females Males Females* *females females
)))))))))))))))))))))))))))))))))))))))))))))))))))))))))))))))))))))))))))))))))))))))))))))))))))))))))))))))))))))))))))))))))))
Number in sample 14,262 2,109 1,432 696 702 1,543 1,449 1,663 1,694 1,545 1,429
Percent of persons using ))))))))))))))))))))))))))))))))))))))))))))%)))))))))))))))))))))))))))))))))))))))))))))
at least once in 2 days 50.3 43.9 47.3 59.2 47.5 56.2 48.1 52.6 47.3 54.1 45.7 on 1 of 2 days 37.6 34.3 34.5 42.1 35.0 42.4 37.3 39.9 36.0 37.6 33.2 on both days 12.7 9.6 12.8 17.1 12.5 13.7 10.8 12.7 11.3 16.4 12.5
Quantity consumed in a day ))))))))))))))))))))))))))))))))))))))))))))g)))))))))))))))))))))))))))))))))))))))))))))(1 ounce = 28 g)
Mean 50 27 34 50 36 63 42 68 47 63 45 SEM 1 2 2 4 3 4 2 4 2 3 2
5th percentile 4 2 3 4 2 5 4 5 4 7 3 10th percentile 5 3 4 5 4 8 6 9 6 10 7 25th percentile 12 5 7 12 10 15 10 16 12 17 13 50th percentile 26 13 18 24 18 32 24 37 26 41 29 75th percentile 64 36 42 55 49 78 58 86 57 90 65 90th percentile 122 70 83 124 99 167 101 172 115 140 97 95th percentile 172 93 119 182 118 232 128 240 166 180 120
)))))))))))))))))))))))))))))))))))))))))))))))))))))))))))))))))))))))))))))))))))))))))))))))))))))))))))))))))))))))))))))))))))
* Indicates a statistic that is potentially unreliable because of small sample size or large coefficient of variation.# Indicates a percentage that is greater than 0 but less than 0.05 or a mean, SEM, or percentile that is greater than 0 but less than 0.5.--- Indicates a percentile that could not be estimated.Note: See "Table notes."Source: USDA's Continuing Survey of Food Intakes by Individuals, 1994-96, 2 days.

171
Table 2.052. Total Bacon: Percentage of persons using food in 2 days and quanti ties consumed in a day.
)))))))))))))))))))))))))))))))))))))))))))))))))))))))))))))))))))))))))))))))))))))))))))))))))))))))))))))))))))))))))))))))))))
* * Age (years) and sex* *)))))))))))))))))))))))))))))))))))))))))))))))))))))))))))))))))))))))))))))))))
* * 2-5 6-11 12-19 20-39 40-59 60 and older* *)))))) )))))) ))))))))))))))) ))))))))))))))) ))))))))))))))) )))))))))))))))
Statistic * All individuals * Males Males* age 2 and over * and and Males Females Males Females Males Females Males Females* *females females
)))))))))))))))))))))))))))))))))))))))))))))))))))))))))))))))))))))))))))))))))))))))))))))))))))))))))))))))))))))))))))))))))))
Number in sample 14,262 2,109 1,432 696 702 1,543 1,449 1,663 1,694 1,545 1,429
Percent of persons using ))))))))))))))))))))))))))))))))))))))))))))%)))))))))))))))))))))))))))))))))))))))))))))
at least once in 2 days 15.7 10.8 10.6 15.5 13.3 15.3 13.9 18.7 16.3 22.8 19.2 on 1 of 2 days 13.5 9.7 9.7 13.6 12.6 13.3 12.3 16.5 13.7 18.0 15.8 on both days 2.1 1.0 0.9 * 2.0 0.7 * 2.0 1.6 2.2 2.6 4.8 3.5
Quantity consumed in a day ))))))))))))))))))))))))))))))))))))))))))))g)))))))))))))))))))))))))))))))))))))))))))))(1 strip = 5 g)
Mean 19 15 18 25 17 25 17 22 17 18 15 SEM # 1 2 2 2 1 1 1 1 1 1
5th percentile 2 4 * 2 * 8 * 1 * 2 * 2 * 4 3 2 1 10th percentile 5 5 4 10 * 2 * 5 5 6 5 5 5 25th percentile 10 8 8 15 9 12 9 11 10 10 8 50th percentile 16 12 15 20 16 20 15 16 16 16 15 75th percentile 24 20 23 33 23 31 23 30 23 24 18 90th percentile 36 25 33 45 * 32 * 47 32 40 31 32 27 95th percentile 47 35 * 40 * 47 * 37 * 54 * 36 * 47 37 39 33
)))))))))))))))))))))))))))))))))))))))))))))))))))))))))))))))))))))))))))))))))))))))))))))))))))))))))))))))))))))))))))))))))))
* Indicates a statistic that is potentially unreliable because of small sample size or large coefficient of variation.# Indicates a percentage that is greater than 0 but less than 0.05 or a mean, SEM, or percentile that is greater than 0 but less than 0.5.--- Indicates a percentile that could not be estimated.Note: See "Table notes."Source: USDA's Continuing Survey of Food Intakes by Individuals, 1994-96, 2 days.

172
Table 2.053. Pork Breakfast Sausage: Percentage of persons using food in 2 days and quantit ies consumed in a day.
)))))))))))))))))))))))))))))))))))))))))))))))))))))))))))))))))))))))))))))))))))))))))))))))))))))))))))))))))))))))))))))))))))
* * Age (years) and sex* *)))))))))))))))))))))))))))))))))))))))))))))))))))))))))))))))))))))))))))))))))
* * 2-5 6-11 12-19 20-39 40-59 60 and older* *)))))) )))))) ))))))))))))))) ))))))))))))))) ))))))))))))))) )))))))))))))))
Statistic * All individuals * Males Males* age 2 and over * and and Males Females Males Females Males Females Males Females* *females females
)))))))))))))))))))))))))))))))))))))))))))))))))))))))))))))))))))))))))))))))))))))))))))))))))))))))))))))))))))))))))))))))))))
Number in sample 14,262 2,109 1,432 696 702 1,543 1,449 1,663 1,694 1,545 1,429
Percent of persons using ))))))))))))))))))))))))))))))))))))))))))))%)))))))))))))))))))))))))))))))))))))))))))))
at least once in 2 days 6.1 5.3 6.0 6.3 3.3 6.6 5.1 6.6 5.8 10.7 5.5 on 1 of 2 days 5.6 5.1 5.5 6.0 3.1 6.3 4.8 6.0 5.4 8.9 5.1 on both days 0.5 0.3 * 0.5 * 0.2 * 0.1 * 0.4 * 0.3 * 0.6 * 0.4 * 1.8 0.4 *
Quantity consumed in a day ))))))))))))))))))))))))))))))))))))))))))))g)))))))))))))))))))))))))))))))))))))))))))))(1 ounce = 28 g)
Mean 44 33 32 40 * 42 * 59 39 49 39 51 34 SEM 2 2 3 4 * 5 * 5 4 4 4 4 3
5th percentile 13 11 * 12 * --- 14 * 13 * 13 * 13 * 10 * 12 * 9 * 10th percentile 13 11 * 12 * --- 15 * 19 * 13 * 18 * 11 * 21 10 * 25th percentile 25 13 13 25 * 26 * 26 24 26 13 26 17 50th percentile 27 26 26 27 27 49 27 37 26 33 26 75th percentile 54 39 38 53 * 53 * 54 51 53 48 54 53 90th percentile 80 54 * 53 * 55 * 78 * 113 * 55 * 80 * 64 * 84 54 * 95th percentile 109 83 * 73 * 67 * 84 * 167 * 75 * 108 * 85 * 116 * 68 *
)))))))))))))))))))))))))))))))))))))))))))))))))))))))))))))))))))))))))))))))))))))))))))))))))))))))))))))))))))))))))))))))))))
* Indicates a statistic that is potentially unreliable because of small sample size or large coefficient of variation.# Indicates a percentage that is greater than 0 but less than 0.05 or a mean, SEM, or percentile that is greater than 0 but less than 0.5.--- Indicates a percentile that could not be estimated.Note: See "Table notes."Source: USDA's Continuing Survey of Food Intakes by Individuals, 1994-96, 2 days.

173
Table 2.054. Total Frankfurters and Luncheon Meats: Percentage of persons us ing food in 2 days and quantities consumed in a day.
)))))))))))))))))))))))))))))))))))))))))))))))))))))))))))))))))))))))))))))))))))))))))))))))))))))))))))))))))))))))))))))))))))
* * Age (years) and sex* *)))))))))))))))))))))))))))))))))))))))))))))))))))))))))))))))))))))))))))))))))
* * 2-5 6-11 12-19 20-39 40-59 60 and older* *)))))) )))))) ))))))))))))))) ))))))))))))))) ))))))))))))))) )))))))))))))))
Statistic * All individuals * Males Males* age 2 and over * and and Males Females Males Females Males Females Males Females* *females females
)))))))))))))))))))))))))))))))))))))))))))))))))))))))))))))))))))))))))))))))))))))))))))))))))))))))))))))))))))))))))))))))))))
Number in sample 14,262 2,109 1,432 696 702 1,543 1,449 1,663 1,694 1,545 1,429
Percent of persons using ))))))))))))))))))))))))))))))))))))))))))))%)))))))))))))))))))))))))))))))))))))))))))))
at least once in 2 days 50.7 60.5 62.7 61.0 49.2 57.9 45.6 51.8 42.5 45.0 36.6 on 1 of 2 days 37.3 42.5 41.0 41.6 35.3 40.9 36.3 39.4 33.9 32.3 28.9 on both days 13.4 17.9 21.7 19.3 13.9 16.9 9.3 12.4 8.5 12.7 7.6
Quantity consumed in a day ))))))))))))))))))))))))))))))))))))))))))))g)))))))))))))))))))))))))))))))))))))))))))))(1 ounce = 28 g)
Mean 63 47 51 68 52 85 52 82 53 65 51 SEM 2 1 2 5 3 11 2 2 2 2 2
5th percentile 4 2 3 4 3 6 4 8 4 13 8 10th percentile 7 4 4 6 6 10 6 15 7 18 14 25th percentile 28 21 17 21 18 28 19 38 26 28 27 50th percentile 56 42 45 56 46 57 55 57 48 56 45 75th percentile 84 57 63 92 66 110 64 112 57 84 57 90th percentile 114 105 114 140 112 168 112 168 113 114 85 95th percentile 169 114 126 174 126 227 114 210 135 170 114
)))))))))))))))))))))))))))))))))))))))))))))))))))))))))))))))))))))))))))))))))))))))))))))))))))))))))))))))))))))))))))))))))))
* Indicates a statistic that is potentially unreliable because of small sample size or large coefficient of variation.# Indicates a percentage that is greater than 0 but less than 0.05 or a mean, SEM, or percentile that is greater than 0 but less than 0.5.--- Indicates a percentile that could not be estimated.Note: See "Table notes."Source: USDA's Continuing Survey of Food Intakes by Individuals, 1994-96, 2 days.

174
Table 2.055. Total Finfish: Percentage of persons using food in 2 days and quantities consumed in a day.
)))))))))))))))))))))))))))))))))))))))))))))))))))))))))))))))))))))))))))))))))))))))))))))))))))))))))))))))))))))))))))))))))))
* * Age (years) and sex* *)))))))))))))))))))))))))))))))))))))))))))))))))))))))))))))))))))))))))))))))))
* * 2-5 6-11 12-19 20-39 40-59 60 and older* *)))))) )))))) ))))))))))))))) ))))))))))))))) ))))))))))))))) )))))))))))))))
Statistic * All individuals * Males Males* age 2 and over * and and Males Females Males Females Males Females Males Females* *females females
)))))))))))))))))))))))))))))))))))))))))))))))))))))))))))))))))))))))))))))))))))))))))))))))))))))))))))))))))))))))))))))))))))
Number in sample 14,262 2,109 1,432 696 702 1,543 1,449 1,663 1,694 1,545 1,429
Percent of persons using ))))))))))))))))))))))))))))))))))))))))))))%)))))))))))))))))))))))))))))))))))))))))))))
at least once in 2 days 20.3 14.9 14.9 13.9 15.2 19.6 20.0 22.9 24.1 27.3 25.0 on 1 of 2 days 18.1 13.9 13.6 12.5 13.5 18.4 17.8 20.0 21.6 23.7 20.8 on both days 2.2 0.9 1.3 1.3 * 1.7 * 1.1 2.2 2.9 2.5 3.6 4.2
Quantity consumed in a day ))))))))))))))))))))))))))))))))))))))))))))g)))))))))))))))))))))))))))))))))))))))))))))(1 ounce = 28 g)
Mean 85 50 72 104 69 95 74 102 78 93 93 SEM 2 3 6 10 7 5 5 6 5 4 5
5th percentile 1 4 3 * # 4 * # 2 1 # 7 3 10th percentile 11 8 14 # 9 * 7 7 14 5 21 21 25th percentile 38 21 28 49 28 49 28 48 31 49 48 50th percentile 67 43 57 82 57 77 56 85 57 78 76 75th percentile 113 68 85 170 85 126 95 126 104 121 121 90th percentile 170 99 155 181 * 160 * 185 147 199 142 183 165 95th percentile 222 125 203 * 246 * 177 * 237 187 281 180 248 227
)))))))))))))))))))))))))))))))))))))))))))))))))))))))))))))))))))))))))))))))))))))))))))))))))))))))))))))))))))))))))))))))))))
* Indicates a statistic that is potentially unreliable because of small sample size or large coefficient of variation.# Indicates a percentage that is greater than 0 but less than 0.05 or a mean, SEM, or percentile that is greater than 0 but less than 0.5.--- Indicates a percentile that could not be estimated.Note: See "Table notes."Source: USDA's Continuing Survey of Food Intakes by Individuals, 1994-96, 2 days.

175
Table 2.056. Canned Tuna: Percentage of persons using food in 2 days and quanti ties consumed in a day.
)))))))))))))))))))))))))))))))))))))))))))))))))))))))))))))))))))))))))))))))))))))))))))))))))))))))))))))))))))))))))))))))))))
* * Age (years) and sex* *)))))))))))))))))))))))))))))))))))))))))))))))))))))))))))))))))))))))))))))))))
* * 2-5 6-11 12-19 20-39 40-59 60 and older* *)))))) )))))) ))))))))))))))) ))))))))))))))) ))))))))))))))) )))))))))))))))
Statistic * All individuals * Males Males* age 2 and over * and and Males Females Males Females Males Females Males Females* *females females
)))))))))))))))))))))))))))))))))))))))))))))))))))))))))))))))))))))))))))))))))))))))))))))))))))))))))))))))))))))))))))))))))))
Number in sample 14,262 2,109 1,432 696 702 1,543 1,449 1,663 1,694 1,545 1,429
Percent of persons using ))))))))))))))))))))))))))))))))))))))))))))%)))))))))))))))))))))))))))))))))))))))))))))
at least once in 2 days 7.8 6.6 5.4 5.1 7.5 6.7 8.2 8.5 10.0 8.4 9.5 on 1 of 2 days 7.4 6.2 5.3 4.7 7.0 6.4 7.8 8.1 9.8 7.8 9.0 on both days 0.4 0.4 * 0.2 * 0.4 * 0.5 * 0.3 * 0.4 * 0.4 * 0.3 * 0.6 * 0.5 *
Quantity consumed in a day ))))))))))))))))))))))))))))))))))))))))))))g)))))))))))))))))))))))))))))))))))))))))))))(1 ounce = 28 g)
Mean 66 37 58 98 * 64 84 61 72 60 64 67 SEM 2 3 8 16 * 6 7 5 4 4 5 4
5th percentile 14 5 * 14 * --- 14 * 15 * 14 * 14 * 13 * 12 * 12 * 10th percentile 18 8 20 * 18 * 18 * 27 * 14 * 27 15 17 * 23 25th percentile 32 14 28 49 * 28 * 49 34 37 28 37 42 50th percentile 56 29 49 84 56 57 56 57 56 56 57 75th percentile 84 56 60 162 * 77 * 113 74 96 74 81 85 90th percentile 131 73 99 * 170 * 105 * 160 * 110 * 127 112 114 * 112 95th percentile 167 85 * 157 * 186 * 156 * 168 * 142 * 168 * 144 * 150 * 153 *
)))))))))))))))))))))))))))))))))))))))))))))))))))))))))))))))))))))))))))))))))))))))))))))))))))))))))))))))))))))))))))))))))))
* Indicates a statistic that is potentially unreliable because of small sample size or large coefficient of variation.# Indicates a percentage that is greater than 0 but less than 0.05 or a mean, SEM, or percentile that is greater than 0 but less than 0.5.--- Indicates a percentile that could not be estimated.Note: See "Table notes."Source: USDA's Continuing Survey of Food Intakes by Individuals, 1994-96, 2 days.

176
Table 2.057. Total Chicken and Turkey: Percentage of persons using food in 2 days and quantities consumed in a day.
)))))))))))))))))))))))))))))))))))))))))))))))))))))))))))))))))))))))))))))))))))))))))))))))))))))))))))))))))))))))))))))))))))
* * Age (years) and sex* *)))))))))))))))))))))))))))))))))))))))))))))))))))))))))))))))))))))))))))))))))
* * 2-5 6-11 12-19 20-39 40-59 60 and older* *)))))) )))))) ))))))))))))))) ))))))))))))))) ))))))))))))))) )))))))))))))))
Statistic * All individuals * Males Males* age 2 and over * and and Males Females Males Females Males Females Males Females* *females females
)))))))))))))))))))))))))))))))))))))))))))))))))))))))))))))))))))))))))))))))))))))))))))))))))))))))))))))))))))))))))))))))))))
Number in sample 14,262 2,109 1,432 696 702 1,543 1,449 1,663 1,694 1,545 1,429
Percent of persons using ))))))))))))))))))))))))))))))))))))))))))))%)))))))))))))))))))))))))))))))))))))))))))))
at least once in 2 days 57.3 63.8 53.8 58.4 54.1 57.3 57.8 56.8 58.7 53.8 57.8 on 1 of 2 days 41.9 46.7 42.3 45.5 40.1 40.6 42.0 39.0 42.7 40.0 43.3 on both days 15.4 17.1 11.5 12.8 14.0 16.7 15.8 17.8 16.0 13.8 14.5
Quantity consumed in a day ))))))))))))))))))))))))))))))))))))))))))))g)))))))))))))))))))))))))))))))))))))))))))))(1 ounce = 28 g)
Mean 96 51 70 116 84 131 88 122 87 96 78 SEM 2 1 3 5 3 6 3 4 2 3 2
5th percentile 2 # # # 1 9 1 10 6 2 5 10th percentile 13 4 11 6 13 22 12 21 16 12 12 25th percentile 43 22 35 47 42 63 42 65 44 46 39 50th percentile 80 44 55 92 73 100 80 97 80 83 69 75th percentile 121 67 96 164 109 169 108 159 113 122 100 90th percentile 194 100 138 255 162 246 185 232 161 197 152 95th percentile 244 130 169 324 214 320 242 296 194 241 190
)))))))))))))))))))))))))))))))))))))))))))))))))))))))))))))))))))))))))))))))))))))))))))))))))))))))))))))))))))))))))))))))))))
* Indicates a statistic that is potentially unreliable because of small sample size or large coefficient of variation.# Indicates a percentage that is greater than 0 but less than 0.05 or a mean, SEM, or percentile that is greater than 0 but less than 0.5.--- Indicates a percentile that could not be estimated.Note: See "Table notes."Source: USDA's Continuing Survey of Food Intakes by Individuals, 1994-96, 2 days.

177
Table 2.058. Total Eggs: Percentage of persons using food in 2 days and quantit ies consumed in a day.
)))))))))))))))))))))))))))))))))))))))))))))))))))))))))))))))))))))))))))))))))))))))))))))))))))))))))))))))))))))))))))))))))))
* * Age (years) and sex* *)))))))))))))))))))))))))))))))))))))))))))))))))))))))))))))))))))))))))))))))))
* * 2-5 6-11 12-19 20-39 40-59 60 and older* *)))))) )))))) ))))))))))))))) ))))))))))))))) ))))))))))))))) )))))))))))))))
Statistic * All individuals * Males Males* age 2 and over * and and Males Females Males Females Males Females Males Females* *females females
)))))))))))))))))))))))))))))))))))))))))))))))))))))))))))))))))))))))))))))))))))))))))))))))))))))))))))))))))))))))))))))))))))
Number in sample 14,262 2,109 1,432 696 702 1,543 1,449 1,663 1,694 1,545 1,429
Percent of persons using ))))))))))))))))))))))))))))))))))))))))))))%)))))))))))))))))))))))))))))))))))))))))))))
at least once in 2 days 88.6 87.3 88.6 88.1 88.8 87.6 86.9 90.5 89.4 91.0 89.2 on 1 of 2 days 35.0 38.9 37.0 34.2 39.7 32.2 40.8 29.4 36.1 31.5 31.1 on both days 53.6 48.4 51.6 53.9 49.0 55.4 46.1 61.2 53.2 59.5 58.1
Quantity consumed in a day ))))))))))))))))))))))))))))))))))))))))))))g)))))))))))))))))))))))))))))))))))))))))))))(1 large, boiled = 50 g)
Mean 26 19 19 29 19 31 22 32 22 33 26 SEM # 1 1 2 2 2 1 1 1 1 1
5th percentile # # # 1 # # # # # # # 10th percentile 1 # # 1 # 1 1 1 # 1 1 25th percentile 2 1 2 2 1 2 1 2 1 3 2 50th percentile 7 4 5 7 5 8 6 11 7 12 10 75th percentile 39 33 22 34 24 45 31 51 37 55 43 90th percentile 83 52 64 89 68 88 75 91 76 90 76 95th percentile 98 77 87 128 87 120 90 119 91 106 91
)))))))))))))))))))))))))))))))))))))))))))))))))))))))))))))))))))))))))))))))))))))))))))))))))))))))))))))))))))))))))))))))))))
* Indicates a statistic that is potentially unreliable because of small sample size or large coefficient of variation.# Indicates a percentage that is greater than 0 but less than 0.05 or a mean, SEM, or percentile that is greater than 0 but less than 0.5.--- Indicates a percentile that could not be estimated.Note: See "Table notes."Source: USDA's Continuing Survey of Food Intakes by Individuals, 1994-96, 2 days.

178
Table 2.059. Total Peanut Butter: Percentage of persons using food in 2 days and quantities consumed in a day.
)))))))))))))))))))))))))))))))))))))))))))))))))))))))))))))))))))))))))))))))))))))))))))))))))))))))))))))))))))))))))))))))))))
* * Age (years) and sex* *)))))))))))))))))))))))))))))))))))))))))))))))))))))))))))))))))))))))))))))))))
* * 2-5 6-11 12-19 20-39 40-59 60 and older* *)))))) )))))) ))))))))))))))) ))))))))))))))) ))))))))))))))) )))))))))))))))
Statistic * All individuals * Males Males* age 2 and over * and and Males Females Males Females Males Females Males Females* *females females
)))))))))))))))))))))))))))))))))))))))))))))))))))))))))))))))))))))))))))))))))))))))))))))))))))))))))))))))))))))))))))))))))))
Number in sample 14,262 2,109 1,432 696 702 1,543 1,449 1,663 1,694 1,545 1,429
Percent of persons using ))))))))))))))))))))))))))))))))))))))))))))%)))))))))))))))))))))))))))))))))))))))))))))
at least once in 2 days 24.8 39.6 38.1 25.4 21.3 24.3 20.4 22.4 20.9 24.1 19.9 on 1 of 2 days 20.0 29.9 29.7 19.8 17.0 20.9 16.9 17.8 18.6 17.5 16.4 on both days 4.7 9.7 8.4 5.6 4.3 3.3 3.5 4.6 2.4 6.6 3.5
Quantity consumed in a day ))))))))))))))))))))))))))))))))))))))))))))g)))))))))))))))))))))))))))))))))))))))))))))(1 tablespoon = 16 g)
Mean 24 19 20 25 18 33 19 34 20 25 16 SEM 1 1 1 2 2 3 2 2 2 1 1
5th percentile 2 3 3 3 * 2 * 2 2 3 2 2 2 10th percentile 3 3 4 6 3 3 3 5 3 3 3 25th percentile 8 8 8 11 7 11 6 11 6 9 5 50th percentile 16 16 16 15 12 16 12 20 11 16 12 75th percentile 32 25 28 30 23 32 19 41 22 32 16 90th percentile 49 34 36 48 32 73 39 73 42 63 33 95th percentile 73 48 57 82 * 48 * 126 50 109 69 78 48
)))))))))))))))))))))))))))))))))))))))))))))))))))))))))))))))))))))))))))))))))))))))))))))))))))))))))))))))))))))))))))))))))))
* Indicates a statistic that is potentially unreliable because of small sample size or large coefficient of variation.# Indicates a percentage that is greater than 0 but less than 0.05 or a mean, SEM, or percentile that is greater than 0 but less than 0.5.--- Indicates a percentile that could not be estimated.Note: See "Table notes."Source: USDA's Continuing Survey of Food Intakes by Individuals, 1994-96, 2 days.

179
Table 2.060. Coffee: Percentage of persons us ing food in 2 days and quantities consumed in a day.
)))))))))))))))))))))))))))))))))))))))))))))))))))))))))))))))))))))))))))))))))))))))))))))))))))))))))))))))))))))))))))))))))))
* * Age (years) and sex* *)))))))))))))))))))))))))))))))))))))))))))))))))))))))))))))))))))))))))))))))))
* * 2-5 6-11 12-19 20-39 40-59 60 and older* *)))))) )))))) ))))))))))))))) ))))))))))))))) ))))))))))))))) )))))))))))))))
Statistic * All individuals * Males Males* age 2 and over * and and Males Females Males Females Males Females Males Females* *females females
)))))))))))))))))))))))))))))))))))))))))))))))))))))))))))))))))))))))))))))))))))))))))))))))))))))))))))))))))))))))))))))))))))
Number in sample 14,262 2,109 1,432 696 702 1,543 1,449 1,663 1,694 1,545 1,429
Percent of persons using ))))))))))))))))))))))))))))))))))))))))))))%)))))))))))))))))))))))))))))))))))))))))))))
at least once in 2 days 45.4 0.9 1.8 7.5 5.1 45.8 43.6 72.5 71.0 80.8 76.6 on 1 of 2 days 11.0 0.9 1.4 4.5 4.1 15.9 14.7 14.1 14.1 11.6 12.2 on both days 34.5 0.0 * 0.4 * 3.0 1.0 * 29.8 28.9 58.4 56.9 69.2 64.4
Quantity consumed in a day ))))))))))))))))))))))))))))))))))))))))))))g)))))))))))))))))))))))))))))))))))))))))))))(8 fluid ounces = 237 g)
Mean 616 79 * 187 * 318 * 370 * 689 580 762 592 589 497 SEM 14 12 * 21 * 29 * 49 * 40 23 24 15 17 20
5th percentile 177 --- --- 104 * 107 * 179 177 209 177 178 177 10th percentile 237 --- --- 171 * 121 * 198 209 221 212 237 210 25th percentile 238 30 * 103 * 236 * 196 * 238 234 306 238 238 235 50th percentile 474 52 161 237 238 474 473 477 460 467 448 75th percentile 710 104 * 238 * 336 * 372 * 710 677 927 710 710 593 90th percentile 1,167 119 * --- 431 * --- 1,179 1,093 1,421 1,146 1,066 929 95th percentile 1,595 119 * --- 471 * --- 1,895 1,489 2,126 1,408 1,421 1,172
)))))))))))))))))))))))))))))))))))))))))))))))))))))))))))))))))))))))))))))))))))))))))))))))))))))))))))))))))))))))))))))))))))
* Indicates a statistic that is potentially unreliable because of small sample size or large coefficient of variation.# Indicates a percentage that is greater than 0 but less than 0.05 or a mean, SEM, or percentile that is greater than 0 but less than 0.5.--- Indicates a percentile that could not be estimated.Note: See "Table notes."Source: USDA's Continuing Survey of Food Intakes by Individuals, 1994-96, 2 days.

180
Table 2.061. Coffee, With Caffeine: Percentage of persons using food in 2 days and quantities consumed in a day.
)))))))))))))))))))))))))))))))))))))))))))))))))))))))))))))))))))))))))))))))))))))))))))))))))))))))))))))))))))))))))))))))))))
* * Age (years) and sex* *)))))))))))))))))))))))))))))))))))))))))))))))))))))))))))))))))))))))))))))))))
* * 2-5 6-11 12-19 20-39 40-59 60 and older* *)))))) )))))) ))))))))))))))) ))))))))))))))) ))))))))))))))) )))))))))))))))
Statistic * All individuals * Males Males* age 2 and over * and and Males Females Males Females Males Females Males Females* *females females
)))))))))))))))))))))))))))))))))))))))))))))))))))))))))))))))))))))))))))))))))))))))))))))))))))))))))))))))))))))))))))))))))))
Number in sample 14,262 2,109 1,432 696 702 1,543 1,449 1,663 1,694 1,545 1,429
Percent of persons using ))))))))))))))))))))))))))))))))))))))))))))%)))))))))))))))))))))))))))))))))))))))))))))
at least once in 2 days 40.8 0.9 1.5 7.3 4.7 44.4 41.8 67.7 62.5 66.9 60.9 on 1 of 2 days 11.6 0.9 1.1 4.3 3.9 15.8 15.2 16.2 14.3 15.2 12.9 on both days 29.3 0.0 * 0.4 * 3.0 0.9 * 28.6 26.6 51.5 48.2 51.7 48.0
Quantity consumed in a day ))))))))))))))))))))))))))))))))))))))))))))g)))))))))))))))))))))))))))))))))))))))))))))(8 fluid ounces = 237 g)
Mean 615 80 * 237 * 351 * 389 * 677 586 751 573 583 507 SEM 13 12 * 69 * 39 * 52 * 32 28 23 19 15 22
5th percentile 177 --- --- 102 * --- 181 119 208 177 177 177 10th percentile 237 --- --- 162 * 119 * 199 179 221 215 237 212 25th percentile 238 30 * 101 * 236 * 197 * 241 226 322 236 238 233 50th percentile 474 54 119 238 238 474 473 476 455 466 415 75th percentile 710 106 * 227 * 366 * 513 * 710 685 925 710 710 596 90th percentile 1,167 119 * 334 * 465 * --- 1,161 1,145 1,421 1,076 1,042 935 95th percentile 1,633 119 * --- 821 * --- 1,843 1,647 2,133 1,386 1,400 1,184
)))))))))))))))))))))))))))))))))))))))))))))))))))))))))))))))))))))))))))))))))))))))))))))))))))))))))))))))))))))))))))))))))))
* Indicates a statistic that is potentially unreliable because of small sample size or large coefficient of variation.# Indicates a percentage that is greater than 0 but less than 0.05 or a mean, SEM, or percentile that is greater than 0 but less than 0.5.--- Indicates a percentile that could not be estimated.Note: See "Table notes."Source: USDA's Continuing Survey of Food Intakes by Individuals, 1994-96, 2 days.

181
Table 2.062. Coffee, Decaffeinated: Percentage of persons using food in 2 days and quanti ties consumed in a day.
)))))))))))))))))))))))))))))))))))))))))))))))))))))))))))))))))))))))))))))))))))))))))))))))))))))))))))))))))))))))))))))))))))
* * Age (years) and sex* *)))))))))))))))))))))))))))))))))))))))))))))))))))))))))))))))))))))))))))))))))
* * 2-5 6-11 12-19 20-39 40-59 60 and older* *)))))) )))))) ))))))))))))))) ))))))))))))))) ))))))))))))))) )))))))))))))))
Statistic * All individuals * Males Males* age 2 and over * and and Males Females Males Females Males Females Males Females* *females females
)))))))))))))))))))))))))))))))))))))))))))))))))))))))))))))))))))))))))))))))))))))))))))))))))))))))))))))))))))))))))))))))))))
Number in sample 14,262 2,109 1,432 696 702 1,543 1,449 1,663 1,694 1,545 1,429
Percent of persons using ))))))))))))))))))))))))))))))))))))))))))))%)))))))))))))))))))))))))))))))))))))))))))))
at least once in 2 days 8.8 # 0.3 * 0.2 * 0.5 * 3.0 4.8 12.6 15.5 24.0 25.9 on 1 of 2 days 4.2 # 0.3 * 0.2 * 0.5 * 1.9 3.5 6.6 7.4 8.5 10.5 on both days 4.6 0.0 * 0.0 * 0.0 * 0.0 * 1.1 1.4 6.0 8.1 15.5 15.4
Quantity consumed in a day ))))))))))))))))))))))))))))))))))))))))))))g)))))))))))))))))))))))))))))))))))))))))))))(8 fluid ounces = 237 g)
Mean 450 59 * 227 * 296 * 237 * 451 * 444 529 481 459 378 SEM 16 0 * 29 * 0 * # 57 * 39 32 34 24 15
5th percentile 128 --- --- --- --- 140 * 118 * 121 * 145 130 119 10th percentile 178 --- --- --- --- 192 * 178 * 177 177 179 178 25th percentile 231 --- --- --- --- 237 * 219 218 228 237 229 50th percentile 354 --- --- --- --- 307 303 357 348 355 238 75th percentile 476 --- --- --- --- 476 * 479 593 490 572 464 90th percentile 888 --- --- --- --- 794 * 891 * 1,051 900 781 710 95th percentile 1,053 --- --- --- --- 1,101 * 1,000 * 1,419 * 1,068 951 774
)))))))))))))))))))))))))))))))))))))))))))))))))))))))))))))))))))))))))))))))))))))))))))))))))))))))))))))))))))))))))))))))))))
* Indicates a statistic that is potentially unreliable because of small sample size or large coefficient of variation.# Indicates a percentage that is greater than 0 but less than 0.05 or a mean, SEM, or percentile that is greater than 0 but less than 0.5.--- Indicates a percentile that could not be estimated.Note: See "Table notes."Source: USDA's Continuing Survey of Food Intakes by Individuals, 1994-96, 2 days.

182
Table 2.063. Tea: Percentage of persons using food in 2 days and quantities consumed in a day.
)))))))))))))))))))))))))))))))))))))))))))))))))))))))))))))))))))))))))))))))))))))))))))))))))))))))))))))))))))))))))))))))))))
* * Age (years) and sex* *)))))))))))))))))))))))))))))))))))))))))))))))))))))))))))))))))))))))))))))))))
* * 2-5 6-11 12-19 20-39 40-59 60 and older* *)))))) )))))) ))))))))))))))) ))))))))))))))) ))))))))))))))) )))))))))))))))
Statistic * All individuals * Males Males* age 2 and over * and and Males Females Males Females Males Females Males Females* *females females
)))))))))))))))))))))))))))))))))))))))))))))))))))))))))))))))))))))))))))))))))))))))))))))))))))))))))))))))))))))))))))))))))))
Number in sample 14,262 2,109 1,432 696 702 1,543 1,449 1,663 1,694 1,545 1,429
Percent of persons using ))))))))))))))))))))))))))))))))))))))))))))%)))))))))))))))))))))))))))))))))))))))))))))
at least once in 2 days 31.8 13.2 15.0 21.6 26.1 31.9 38.4 35.8 42.4 32.2 40.1 on 1 of 2 days 17.2 9.8 10.1 16.0 17.4 17.8 22.6 18.5 20.8 13.6 15.3 on both days 14.6 3.4 4.9 5.6 8.6 14.1 15.8 17.3 21.6 18.6 24.8
Quantity consumed in a day ))))))))))))))))))))))))))))))))))))))))))))g)))))))))))))))))))))))))))))))))))))))))))))(8 fluid ounces = 237 g)
Mean 507 236 307 604 424 667 485 569 498 468 430 SEM 9 11 25 56 45 27 18 22 18 18 17
5th percentile 118 63 65 * 116 * 109 * 171 163 140 118 89 143 10th percentile 177 91 117 202 158 236 195 198 175 175 177 25th percentile 236 121 176 297 236 333 236 238 236 236 236 50th percentile 357 195 233 434 326 473 380 441 355 354 325 75th percentile 592 245 354 680 463 870 591 684 579 591 474 90th percentile 947 410 532 1,123 695 1,232 938 1,119 946 927 767 95th percentile 1,339 481 663 * 1,373 * 906 * 1,681 1,152 1,460 1,413 1,127 1,051
)))))))))))))))))))))))))))))))))))))))))))))))))))))))))))))))))))))))))))))))))))))))))))))))))))))))))))))))))))))))))))))))))))
* Indicates a statistic that is potentially unreliable because of small sample size or large coefficient of variation.# Indicates a percentage that is greater than 0 but less than 0.05 or a mean, SEM, or percentile that is greater than 0 but less than 0.5.--- Indicates a percentile that could not be estimated.Note: See "Table notes."Source: USDA's Continuing Survey of Food Intakes by Individuals, 1994-96, 2 days.

183
Table 2.064. Soft Drinks: Percentage of persons using food in 2 days and quanti ties consumed in a day.
)))))))))))))))))))))))))))))))))))))))))))))))))))))))))))))))))))))))))))))))))))))))))))))))))))))))))))))))))))))))))))))))))))
* * Age (years) and sex* *)))))))))))))))))))))))))))))))))))))))))))))))))))))))))))))))))))))))))))))))))
* * 2-5 6-11 12-19 20-39 40-59 60 and older* *)))))) )))))) ))))))))))))))) ))))))))))))))) ))))))))))))))) )))))))))))))))
Statistic * All individuals * Males Males* age 2 and over * and and Males Females Males Females Males Females Males Females* *females females
)))))))))))))))))))))))))))))))))))))))))))))))))))))))))))))))))))))))))))))))))))))))))))))))))))))))))))))))))))))))))))))))))))
Number in sample 14,262 2,109 1,432 696 702 1,543 1,449 1,663 1,694 1,545 1,429
Percent of persons using ))))))))))))))))))))))))))))))))))))))))))))%)))))))))))))))))))))))))))))))))))))))))))))
at least once in 2 days 66.3 52.5 62.0 83.8 78.3 81.0 74.2 68.6 64.7 43.2 38.9 on 1 of 2 days 29.9 33.6 35.9 30.7 32.9 30.2 31.5 31.5 28.2 22.6 21.2 on both days 36.4 18.9 26.1 53.0 45.4 50.8 42.7 37.1 36.5 20.6 17.7
Quantity consumed in a day ))))))))))))))))))))))))))))))))))))))))))))g)))))))))))))))))))))))))))))))))))))))))))))(12 fluid ounces, regular = 369 g)
Mean 609 278 446 814 590 804 630 642 529 451 377 SEM 10 7 11 29 23 22 20 18 13 14 9
5th percentile 184 92 124 247 186 309 238 239 186 178 126 10th percentile 240 122 184 355 247 360 248 301 240 185 180 25th percentile 358 150 247 371 368 371 368 368 337 248 245 50th percentile 372 246 370 680 372 619 479 488 371 368 358 75th percentile 741 368 558 991 740 990 740 742 719 490 372 90th percentile 1,115 493 743 1,603 1,108 1,484 1,115 1,115 989 743 613 95th percentile 1,486 620 990 1,916 1,475 1,964 1,557 1,485 1,116 1,065 736
)))))))))))))))))))))))))))))))))))))))))))))))))))))))))))))))))))))))))))))))))))))))))))))))))))))))))))))))))))))))))))))))))))
* Indicates a statistic that is potentially unreliable because of small sample size or large coefficient of variation.# Indicates a percentage that is greater than 0 but less than 0.05 or a mean, SEM, or percentile that is greater than 0 but less than 0.5.--- Indicates a percentile that could not be estimated.Note: See "Table notes."Source: USDA's Continuing Survey of Food Intakes by Individuals, 1994-96, 2 days.

184
Table 2.065. Soft Drinks, Not Diet , With Caf feine: Percentage of persons using food in 2 days and quanti ties consumed in a day.
)))))))))))))))))))))))))))))))))))))))))))))))))))))))))))))))))))))))))))))))))))))))))))))))))))))))))))))))))))))))))))))))))))
* * Age (years) and sex* *)))))))))))))))))))))))))))))))))))))))))))))))))))))))))))))))))))))))))))))))))
* * 2-5 6-11 12-19 20-39 40-59 60 and older* *)))))) )))))) ))))))))))))))) ))))))))))))))) ))))))))))))))) )))))))))))))))
Statistic * All individuals * Males Males* age 2 and over * and and Males Females Males Females Males Females Males Females* *females females
)))))))))))))))))))))))))))))))))))))))))))))))))))))))))))))))))))))))))))))))))))))))))))))))))))))))))))))))))))))))))))))))))))
Number in sample 14,262 2,109 1,432 696 702 1,543 1,449 1,663 1,694 1,545 1,429
Percent of persons using ))))))))))))))))))))))))))))))))))))))))))))%)))))))))))))))))))))))))))))))))))))))))))))
at least once in 2 days 41.2 30.8 39.6 70.0 60.4 61.9 44.5 38.7 29.4 19.0 13.7 on 1 of 2 days 22.9 22.9 28.2 34.1 32.2 29.4 23.8 22.3 16.7 12.3 9.0 on both days 18.3 7.9 11.4 35.9 28.1 32.5 20.7 16.4 12.7 6.7 4.7
Quantity consumed in a day ))))))))))))))))))))))))))))))))))))))))))))g)))))))))))))))))))))))))))))))))))))))))))))(12 fluid ounces = 369 g)
Mean 602 266 406 787 587 752 595 636 481 441 399 SEM 8 8 12 29 26 21 21 25 14 17 20
5th percentile 185 86 114 233 155 306 168 247 185 185 162 * 10th percentile 246 111 185 324 209 368 230 303 246 246 179 25th percentile 369 138 226 370 369 371 369 370 294 300 247 50th percentile 372 246 370 575 372 617 371 398 371 370 370 75th percentile 742 371 493 984 742 989 741 742 618 372 385 90th percentile 1,114 440 742 1,553 1,108 1,363 1,110 1,115 800 740 546 95th percentile 1,487 496 864 1,979 1,443 1,732 1,585 1,485 992 1,033 742 *
)))))))))))))))))))))))))))))))))))))))))))))))))))))))))))))))))))))))))))))))))))))))))))))))))))))))))))))))))))))))))))))))))))
* Indicates a statistic that is potentially unreliable because of small sample size or large coefficient of variation.# Indicates a percentage that is greater than 0 but less than 0.05 or a mean, SEM, or percentile that is greater than 0 but less than 0.5.--- Indicates a percentile that could not be estimated.Note: See "Table notes."Source: USDA's Continuing Survey of Food Intakes by Individuals, 1994-96, 2 days.

185
Table 2.066. Soft Drinks, Not Diet , Caffeine-Free: Percentage of persons using food in 2 days and quantities consumed in a day.
)))))))))))))))))))))))))))))))))))))))))))))))))))))))))))))))))))))))))))))))))))))))))))))))))))))))))))))))))))))))))))))))))))
* * Age (years) and sex* *)))))))))))))))))))))))))))))))))))))))))))))))))))))))))))))))))))))))))))))))))
* * 2-5 6-11 12-19 20-39 40-59 60 and older* *)))))) )))))) ))))))))))))))) ))))))))))))))) ))))))))))))))) )))))))))))))))
Statistic * All individuals * Males Males* age 2 and over * and and Males Females Males Females Males Females Males Females* *females females
)))))))))))))))))))))))))))))))))))))))))))))))))))))))))))))))))))))))))))))))))))))))))))))))))))))))))))))))))))))))))))))))))))
Number in sample 14,262 2,109 1,432 696 702 1,543 1,449 1,663 1,694 1,545 1,429
Percent of persons using ))))))))))))))))))))))))))))))))))))))))))))%)))))))))))))))))))))))))))))))))))))))))))))
at least once in 2 days 21.3 25.5 30.0 32.1 28.2 23.6 22.5 18.5 16.1 10.7 11.2 on 1 of 2 days 16.8 21.2 22.9 22.5 23.5 19.8 17.7 13.8 12.8 7.8 8.6 on both days 4.6 4.3 7.2 9.6 4.7 3.8 4.7 4.7 3.3 2.9 2.6
Quantity consumed in a day ))))))))))))))))))))))))))))))))))))))))))))g)))))))))))))))))))))))))))))))))))))))))))))(12 fluid ounces = 369 g)
Mean 457 264 388 595 464 570 471 490 403 364 330 SEM 7 11 12 23 16 24 15 22 16 15 12
5th percentile 137 92 123 244 * 186 * 244 183 183 127 141 * 123 * 10th percentile 184 122 184 312 245 276 208 215 184 184 183 25th percentile 248 147 245 368 353 368 338 366 246 232 234 50th percentile 368 246 368 491 368 370 368 368 368 366 354 75th percentile 493 367 484 737 496 737 492 525 392 370 368 90th percentile 742 430 734 985 815 983 739 858 720 679 491 95th percentile 985 542 742 1,160 * 982 * 1,208 985 1,106 836 738 * 612 *
)))))))))))))))))))))))))))))))))))))))))))))))))))))))))))))))))))))))))))))))))))))))))))))))))))))))))))))))))))))))))))))))))))
* Indicates a statistic that is potentially unreliable because of small sample size or large coefficient of variation.# Indicates a percentage that is greater than 0 but less than 0.05 or a mean, SEM, or percentile that is greater than 0 but less than 0.5.--- Indicates a percentile that could not be estimated.Note: See "Table notes."Source: USDA's Continuing Survey of Food Intakes by Individuals, 1994-96, 2 days.

186
Table 2.067. Soft Drinks, Diet, W ith Caffeine: Percentage of persons using food in 2 days and quantities consumed in a day.
)))))))))))))))))))))))))))))))))))))))))))))))))))))))))))))))))))))))))))))))))))))))))))))))))))))))))))))))))))))))))))))))))))
* * Age (years) and sex* *)))))))))))))))))))))))))))))))))))))))))))))))))))))))))))))))))))))))))))))))))
* * 2-5 6-11 12-19 20-39 40-59 60 and older* *)))))) )))))) ))))))))))))))) ))))))))))))))) ))))))))))))))) )))))))))))))))
Statistic * All individuals * Males Males* age 2 and over * and and Males Females Males Females Males Females Males Females* *females females
)))))))))))))))))))))))))))))))))))))))))))))))))))))))))))))))))))))))))))))))))))))))))))))))))))))))))))))))))))))))))))))))))))
Number in sample 14,262 2,109 1,432 696 702 1,543 1,449 1,663 1,694 1,545 1,429
Percent of persons using ))))))))))))))))))))))))))))))))))))))))))))%)))))))))))))))))))))))))))))))))))))))))))))
at least once in 2 days 12.6 4.0 5.7 4.3 8.8 12.4 17.3 16.1 21.3 11.4 10.4 on 1 of 2 days 7.6 3.3 4.4 3.4 5.4 6.7 10.1 9.1 12.3 7.6 7.1 on both days 5.0 0.7 1.4 0.8 * 3.4 5.6 7.1 7.1 8.9 3.7 3.3
Quantity consumed in a day ))))))))))))))))))))))))))))))))))))))))))))g)))))))))))))))))))))))))))))))))))))))))))))(12 fluid ounces = 355 g)
Mean 578 228 385 638 * 470 773 616 638 557 436 356 SEM 16 14 36 74 * 30 50 29 26 26 16 16
5th percentile 179 91 * 66 * 323 * 151 * 232 * 213 * 238 * 198 179 * 93 * 10th percentile 238 98 * 145 * 355 * 202 * 299 314 310 268 237 132 25th percentile 355 122 187 357 * 355 357 357 356 355 297 237 50th percentile 359 179 312 393 358 450 474 360 359 357 356 75th percentile 716 266 476 719 * 598 935 718 719 715 477 359 90th percentile 1,076 358 * 679 * 1,069 * 762 * 1,575 1,070 1,181 1,015 717 612 95th percentile 1,430 431 * 717 * 1,475 * 954 * 2,029 * 1,295 * 1,438 * 1,303 951 * 718 *
)))))))))))))))))))))))))))))))))))))))))))))))))))))))))))))))))))))))))))))))))))))))))))))))))))))))))))))))))))))))))))))))))))
* Indicates a statistic that is potentially unreliable because of small sample size or large coefficient of variation.# Indicates a percentage that is greater than 0 but less than 0.05 or a mean, SEM, or percentile that is greater than 0 but less than 0.5.--- Indicates a percentile that could not be estimated.Note: See "Table notes."Source: USDA's Continuing Survey of Food Intakes by Individuals, 1994-96, 2 days.

187
Table 2.068. Soft Drinks, Diet, Caffeine-Free: Percentage of persons using food in 2 days and quantities consumed in a day.
)))))))))))))))))))))))))))))))))))))))))))))))))))))))))))))))))))))))))))))))))))))))))))))))))))))))))))))))))))))))))))))))))))
* * Age (years) and sex* *)))))))))))))))))))))))))))))))))))))))))))))))))))))))))))))))))))))))))))))))))
* * 2-5 6-11 12-19 20-39 40-59 60 and older* *)))))) )))))) ))))))))))))))) ))))))))))))))) ))))))))))))))) )))))))))))))))
Statistic * All individuals * Males Males* age 2 and over * and and Males Females Males Females Males Females Males Females* *females females
)))))))))))))))))))))))))))))))))))))))))))))))))))))))))))))))))))))))))))))))))))))))))))))))))))))))))))))))))))))))))))))))))))
Number in sample 14,262 2,109 1,432 696 702 1,543 1,449 1,663 1,694 1,545 1,429
Percent of persons using ))))))))))))))))))))))))))))))))))))))))))))%)))))))))))))))))))))))))))))))))))))))))))))
at least once in 2 days 8.1 3.2 5.1 4.4 4.6 5.0 9.6 11.5 13.8 9.2 9.2 on 1 of 2 days 5.7 2.8 4.4 3.9 4.3 3.7 6.9 8.0 8.8 5.7 5.5 on both days 2.4 0.4 * 0.7 * 0.5 * 0.3 * 1.2 2.8 3.5 5.0 3.5 3.8
Quantity consumed in a day ))))))))))))))))))))))))))))))))))))))))))))g)))))))))))))))))))))))))))))))))))))))))))))(12 fluid ounces = 355 g)
Mean 491 216 328 412 * 341 * 665 542 524 523 458 365 SEM 17 13 22 44 * 38 * 69 36 25 32 30 17
5th percentile 149 87 * 117 * 133 * --- 179 * 194 * 117 * 180 * 140 * 119 * 10th percentile 180 101 * 122 * 159 * --- 266 * 237 218 219 178 178 25th percentile 297 119 194 288 * 202 * 355 309 355 336 238 237 50th percentile 359 178 313 355 355 396 357 359 358 355 355 75th percentile 650 224 358 360 * 356 * 710 710 710 695 705 360 90th percentile 930 359 * 533 * 698 * 475 * 1,305 * 1,028 957 973 766 710 95th percentile 1,140 479 * 628 * 906 * 628 * 1,839 * 1,408 * 1,074 * 1,207 * 1,074 * 718 *
)))))))))))))))))))))))))))))))))))))))))))))))))))))))))))))))))))))))))))))))))))))))))))))))))))))))))))))))))))))))))))))))))))
* Indicates a statistic that is potentially unreliable because of small sample size or large coefficient of variation.# Indicates a percentage that is greater than 0 but less than 0.05 or a mean, SEM, or percentile that is greater than 0 but less than 0.5.--- Indicates a percentile that could not be estimated.Note: See "Table notes."Source: USDA's Continuing Survey of Food Intakes by Individuals, 1994-96, 2 days.

188
Table 2.069. Fru it Drinks: Percentage of persons using food in 2 days and quantities consumed in a day.
)))))))))))))))))))))))))))))))))))))))))))))))))))))))))))))))))))))))))))))))))))))))))))))))))))))))))))))))))))))))))))))))))))
* * Age (years) and sex* *)))))))))))))))))))))))))))))))))))))))))))))))))))))))))))))))))))))))))))))))))
* * 2-5 6-11 12-19 20-39 40-59 60 and older* *)))))) )))))) ))))))))))))))) ))))))))))))))) ))))))))))))))) )))))))))))))))
Statistic * All individuals * Males Males* age 2 and over * and and Males Females Males Females Males Females Males Females* *females females
)))))))))))))))))))))))))))))))))))))))))))))))))))))))))))))))))))))))))))))))))))))))))))))))))))))))))))))))))))))))))))))))))))
Number in sample 14,262 2,109 1,432 696 702 1,543 1,449 1,663 1,694 1,545 1,429
Percent of persons using ))))))))))))))))))))))))))))))))))))))))))))%)))))))))))))))))))))))))))))))))))))))))))))
at least once in 2 days 28.3 52.0 52.0 42.0 41.1 25.1 24.9 21.0 17.7 14.7 16.1 on 1 of 2 days 19.8 30.5 32.8 27.2 29.2 19.4 19.1 16.6 13.9 9.2 10.2 on both days 8.5 21.5 19.2 14.8 11.9 5.7 5.9 4.3 3.8 5.5 5.9
Quantity consumed in a day ))))))))))))))))))))))))))))))))))))))))))))g)))))))))))))))))))))))))))))))))))))))))))))(8 fluid ounces = 248 g)
Mean 466 325 375 675 483 624 465 529 400 406 319 SEM 12 8 9 43 32 46 20 39 32 29 23
5th percentile 124 95 125 186 182 186 166 142 123 123 * 122 * 10th percentile 184 122 186 236 187 237 227 238 125 126 126 25th percentile 247 186 240 309 248 314 248 250 195 189 187 50th percentile 360 249 261 480 372 494 371 374 251 253 248 75th percentile 500 427 490 750 507 743 506 550 482 494 371 90th percentile 934 613 691 1,124 932 1,081 941 984 751 747 602 95th percentile 1,130 749 755 1,815 1,210 1,501 1,001 1,487 1,013 973 * 737 *
)))))))))))))))))))))))))))))))))))))))))))))))))))))))))))))))))))))))))))))))))))))))))))))))))))))))))))))))))))))))))))))))))))
* Indicates a statistic that is potentially unreliable because of small sample size or large coefficient of variation.# Indicates a percentage that is greater than 0 but less than 0.05 or a mean, SEM, or percentile that is greater than 0 but less than 0.5.--- Indicates a percentile that could not be estimated.Note: See "Table notes."Source: USDA's Continuing Survey of Food Intakes by Individuals, 1994-96, 2 days.
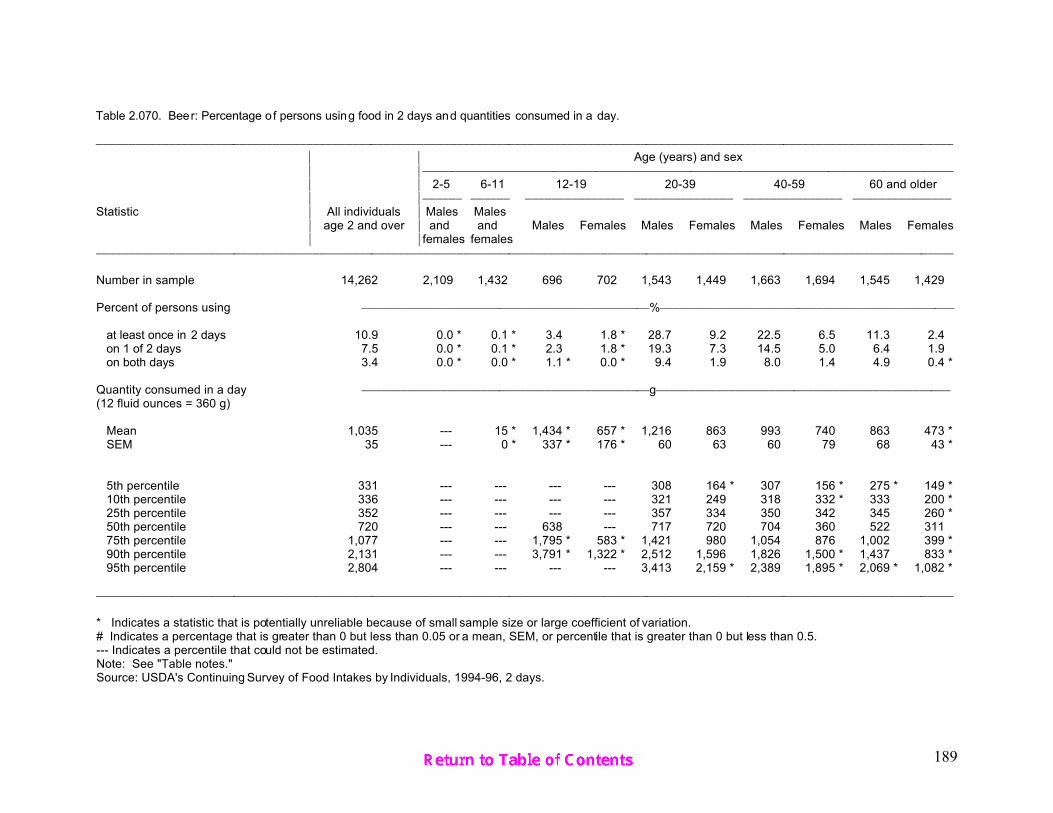
189
Table 2.070. Beer: Percentage of persons using food in 2 days and quantities consumed in a day.
)))))))))))))))))))))))))))))))))))))))))))))))))))))))))))))))))))))))))))))))))))))))))))))))))))))))))))))))))))))))))))))))))))
* * Age (years) and sex* *)))))))))))))))))))))))))))))))))))))))))))))))))))))))))))))))))))))))))))))))))
* * 2-5 6-11 12-19 20-39 40-59 60 and older* *)))))) )))))) ))))))))))))))) ))))))))))))))) ))))))))))))))) )))))))))))))))
Statistic * All individuals * Males Males* age 2 and over * and and Males Females Males Females Males Females Males Females* *females females
)))))))))))))))))))))))))))))))))))))))))))))))))))))))))))))))))))))))))))))))))))))))))))))))))))))))))))))))))))))))))))))))))))
Number in sample 14,262 2,109 1,432 696 702 1,543 1,449 1,663 1,694 1,545 1,429
Percent of persons using ))))))))))))))))))))))))))))))))))))))))))))%)))))))))))))))))))))))))))))))))))))))))))))
at least once in 2 days 10.9 0.0 * 0.1 * 3.4 1.8 * 28.7 9.2 22.5 6.5 11.3 2.4 on 1 of 2 days 7.5 0.0 * 0.1 * 2.3 1.8 * 19.3 7.3 14.5 5.0 6.4 1.9 on both days 3.4 0.0 * 0.0 * 1.1 * 0.0 * 9.4 1.9 8.0 1.4 4.9 0.4 *
Quantity consumed in a day ))))))))))))))))))))))))))))))))))))))))))))g)))))))))))))))))))))))))))))))))))))))))))))(12 fluid ounces = 360 g)
Mean 1,035 --- 15 * 1,434 * 657 * 1,216 863 993 740 863 473 * SEM 35 --- 0 * 337 * 176 * 60 63 60 79 68 43 *
5th percentile 331 --- --- --- --- 308 164 * 307 156 * 275 * 149 * 10th percentile 336 --- --- --- --- 321 249 318 332 * 333 200 * 25th percentile 352 --- --- --- --- 357 334 350 342 345 260 * 50th percentile 720 --- --- 638 --- 717 720 704 360 522 311 75th percentile 1,077 --- --- 1,795 * 583 * 1,421 980 1,054 876 1,002 399 * 90th percentile 2,131 --- --- 3,791 * 1,322 * 2,512 1,596 1,826 1,500 * 1,437 833 * 95th percentile 2,804 --- --- --- --- 3,413 2,159 * 2,389 1,895 * 2,069 * 1,082 *
)))))))))))))))))))))))))))))))))))))))))))))))))))))))))))))))))))))))))))))))))))))))))))))))))))))))))))))))))))))))))))))))))))
* Indicates a statistic that is potentially unreliable because of small sample size or large coefficient of variation.# Indicates a percentage that is greater than 0 but less than 0.05 or a mean, SEM, or percentile that is greater than 0 but less than 0.5.--- Indicates a percentile that could not be estimated.Note: See "Table notes."Source: USDA's Continuing Survey of Food Intakes by Individuals, 1994-96, 2 days.

190
Table 2.071. Total Wine: Percentage of persons using food in 2 days and quantities consumed in a day.
)))))))))))))))))))))))))))))))))))))))))))))))))))))))))))))))))))))))))))))))))))))))))))))))))))))))))))))))))))))))))))))))))))
* * Age (years) and sex* *)))))))))))))))))))))))))))))))))))))))))))))))))))))))))))))))))))))))))))))))))
* * 2-5 6-11 12-19 20-39 40-59 60 and older* *)))))) )))))) ))))))))))))))) ))))))))))))))) ))))))))))))))) )))))))))))))))
Statistic * All individuals * Males Males* age 2 and over * and and Males Females Males Females Males Females Males Females* *females females
)))))))))))))))))))))))))))))))))))))))))))))))))))))))))))))))))))))))))))))))))))))))))))))))))))))))))))))))))))))))))))))))))))
Number in sample 14,262 2,109 1,432 696 702 1,543 1,449 1,663 1,694 1,545 1,429
Percent of persons using ))))))))))))))))))))))))))))))))))))))))))))%)))))))))))))))))))))))))))))))))))))))))))))
at least once in 2 days 8.9 1.9 2.3 3.1 3.6 9.3 11.6 11.9 13.3 12.7 9.7 on 1 of 2 days 7.0 1.8 2.2 3.1 3.5 7.7 9.5 9.3 10.0 9.0 5.7 on both days 2.0 # 0.1 * 0.0 * 0.2 * 1.6 2.1 2.6 3.3 3.7 4.0
Quantity consumed in a day ))))))))))))))))))))))))))))))))))))))))))))g)))))))))))))))))))))))))))))))))))))))))))))(3 1/2 fluid ounces = 103 g)
Mean 153 4 * 6 * 27 * 38 * 148 154 194 179 164 139 SEM 8 # 1 * 10 * 17 * 18 16 16 16 13 18
5th percentile 2 # --- 2 * 2 * 2 * 2 * 2 * 2 * 2 * 1 * 10th percentile 3 # # 2 * 2 * 4 3 4 5 5 2 * 25th percentile 9 1 * 1 * 3 * 3 * 7 7 22 24 30 15 50th percentile 118 2 3 9 7 61 58 176 135 143 118 75th percentile 236 5 * 7 * 23 * 13 * 221 228 309 227 236 176 90th percentile 354 9 * 17 * 50 * 43 * 352 393 431 413 314 315 * 95th percentile 472 10 * 19 * 144 * 244 * 472 * 545 * 466 * 470 * 437 * 382 *
)))))))))))))))))))))))))))))))))))))))))))))))))))))))))))))))))))))))))))))))))))))))))))))))))))))))))))))))))))))))))))))))))))
* Indicates a statistic that is potentially unreliable because of small sample size or large coefficient of variation.# Indicates a percentage that is greater than 0 but less than 0.05 or a mean, SEM, or percentile that is greater than 0 but less than 0.5.--- Indicates a percentile that could not be estimated.Note: See "Table notes."Source: USDA's Continuing Survey of Food Intakes by Individuals, 1994-96, 2 days.

191
Table 2.072. Soups: Percentage of persons us ing food in 2 days and quantities consumed in a day.
)))))))))))))))))))))))))))))))))))))))))))))))))))))))))))))))))))))))))))))))))))))))))))))))))))))))))))))))))))))))))))))))))))
* * Age (years) and sex* *)))))))))))))))))))))))))))))))))))))))))))))))))))))))))))))))))))))))))))))))))
* * 2-5 6-11 12-19 20-39 40-59 60 and older* *)))))) )))))) ))))))))))))))) ))))))))))))))) ))))))))))))))) )))))))))))))))
Statistic * All individuals * Males Males* age 2 and over * and and Males Females Males Females Males Females Males Females* *females females
)))))))))))))))))))))))))))))))))))))))))))))))))))))))))))))))))))))))))))))))))))))))))))))))))))))))))))))))))))))))))))))))))))
Number in sample 14,262 2,109 1,432 696 702 1,543 1,449 1,663 1,694 1,545 1,429
Percent of persons using ))))))))))))))))))))))))))))))))))))))))))))%)))))))))))))))))))))))))))))))))))))))))))))
at least once in 2 days 22.1 23.7 17.6 17.2 17.2 18.5 21.4 22.7 22.9 30.2 31.3 on 1 of 2 days 18.3 19.5 15.3 15.3 15.0 15.6 17.4 17.9 19.8 23.6 25.1 on both days 3.8 4.2 2.3 1.9 2.1 2.9 4.0 4.8 3.1 6.5 6.2
Quantity consumed in a day ))))))))))))))))))))))))))))))))))))))))))))g)))))))))))))))))))))))))))))))))))))))))))))(1 cup chunky chicken noodle = 240 g)
Mean 398 259 337 507 413 502 406 420 357 416 354 SEM 7 10 21 32 26 20 18 15 11 11 9
5th percentile 117 63 60 * 137 * 120 * 172 118 123 117 159 69 10th percentile 170 116 119 194 * 153 237 192 229 143 210 177 25th percentile 241 121 229 308 241 246 243 243 241 243 240 50th percentile 361 240 247 479 368 467 361 365 360 365 345 75th percentile 483 348 468 600 492 598 486 492 480 488 476 90th percentile 697 480 583 737 * 722 962 635 721 569 721 496 95th percentile 898 505 722 * 1,099 * 966 * 1,179 742 956 619 938 715
)))))))))))))))))))))))))))))))))))))))))))))))))))))))))))))))))))))))))))))))))))))))))))))))))))))))))))))))))))))))))))))))))))
* Indicates a statistic that is potentially unreliable because of small sample size or large coefficient of variation.# Indicates a percentage that is greater than 0 but less than 0.05 or a mean, SEM, or percentile that is greater than 0 but less than 0.5.--- Indicates a percentile that could not be estimated.Note: See "Table notes."Source: USDA's Continuing Survey of Food Intakes by Individuals, 1994-96, 2 days.
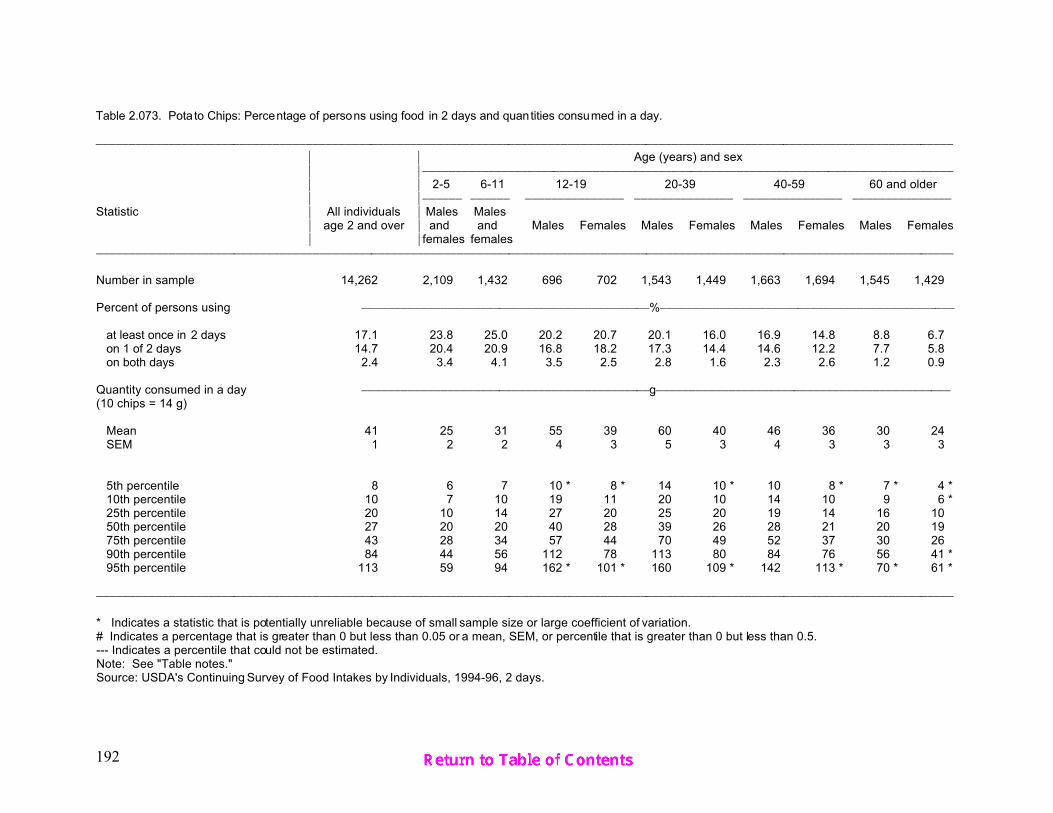
192
Table 2.073. Pota to Chips: Percentage of persons using food in 2 days and quantities consumed in a day.
)))))))))))))))))))))))))))))))))))))))))))))))))))))))))))))))))))))))))))))))))))))))))))))))))))))))))))))))))))))))))))))))))))
* * Age (years) and sex* *)))))))))))))))))))))))))))))))))))))))))))))))))))))))))))))))))))))))))))))))))
* * 2-5 6-11 12-19 20-39 40-59 60 and older* *)))))) )))))) ))))))))))))))) ))))))))))))))) ))))))))))))))) )))))))))))))))
Statistic * All individuals * Males Males* age 2 and over * and and Males Females Males Females Males Females Males Females* *females females
)))))))))))))))))))))))))))))))))))))))))))))))))))))))))))))))))))))))))))))))))))))))))))))))))))))))))))))))))))))))))))))))))))
Number in sample 14,262 2,109 1,432 696 702 1,543 1,449 1,663 1,694 1,545 1,429
Percent of persons using ))))))))))))))))))))))))))))))))))))))))))))%)))))))))))))))))))))))))))))))))))))))))))))
at least once in 2 days 17.1 23.8 25.0 20.2 20.7 20.1 16.0 16.9 14.8 8.8 6.7 on 1 of 2 days 14.7 20.4 20.9 16.8 18.2 17.3 14.4 14.6 12.2 7.7 5.8 on both days 2.4 3.4 4.1 3.5 2.5 2.8 1.6 2.3 2.6 1.2 0.9
Quantity consumed in a day ))))))))))))))))))))))))))))))))))))))))))))g)))))))))))))))))))))))))))))))))))))))))))))(10 chips = 14 g)
Mean 41 25 31 55 39 60 40 46 36 30 24 SEM 1 2 2 4 3 5 3 4 3 3 3
5th percentile 8 6 7 10 * 8 * 14 10 * 10 8 * 7 * 4 * 10th percentile 10 7 10 19 11 20 10 14 10 9 6 * 25th percentile 20 10 14 27 20 25 20 19 14 16 10 50th percentile 27 20 20 40 28 39 26 28 21 20 19 75th percentile 43 28 34 57 44 70 49 52 37 30 26 90th percentile 84 44 56 112 78 113 80 84 76 56 41 * 95th percentile 113 59 94 162 * 101 * 160 109 * 142 113 * 70 * 61 *
)))))))))))))))))))))))))))))))))))))))))))))))))))))))))))))))))))))))))))))))))))))))))))))))))))))))))))))))))))))))))))))))))))
* Indicates a statistic that is potentially unreliable because of small sample size or large coefficient of variation.# Indicates a percentage that is greater than 0 but less than 0.05 or a mean, SEM, or percentile that is greater than 0 but less than 0.5.--- Indicates a percentile that could not be estimated.Note: See "Table notes."Source: USDA's Continuing Survey of Food Intakes by Individuals, 1994-96, 2 days.

193
Table 2.074. Corn Chips: Percentage of persons using food in 2 days and quanti ties consumed in a day.
)))))))))))))))))))))))))))))))))))))))))))))))))))))))))))))))))))))))))))))))))))))))))))))))))))))))))))))))))))))))))))))))))))
* * Age (years) and sex* *)))))))))))))))))))))))))))))))))))))))))))))))))))))))))))))))))))))))))))))))))
* * 2-5 6-11 12-19 20-39 40-59 60 and older* *)))))) )))))) ))))))))))))))) ))))))))))))))) ))))))))))))))) )))))))))))))))
Statistic * All individuals * Males Males* age 2 and over * and and Males Females Males Females Males Females Males Females* *females females
)))))))))))))))))))))))))))))))))))))))))))))))))))))))))))))))))))))))))))))))))))))))))))))))))))))))))))))))))))))))))))))))))))
Number in sample 14,262 2,109 1,432 696 702 1,543 1,449 1,663 1,694 1,545 1,429
Percent of persons using ))))))))))))))))))))))))))))))))))))))))))))%)))))))))))))))))))))))))))))))))))))))))))))
at least once in 2 days 16.0 19.6 25.6 26.9 25.1 16.2 17.9 12.8 12.0 4.8 5.3 on 1 of 2 days 14.0 17.3 21.6 24.7 19.9 13.8 16.1 11.3 11.0 4.3 4.7 on both days 2.0 2.3 3.9 2.2 5.2 2.4 1.8 1.5 1.0 0.5 * 0.6 *
Quantity consumed in a day ))))))))))))))))))))))))))))))))))))))))))))g)))))))))))))))))))))))))))))))))))))))))))))(1 cup = 26 g)
Mean 46 30 36 61 53 70 38 49 35 32 22 SEM 2 2 2 5 5 8 2 4 2 3 2
5th percentile 7 5 5 13 * 7 * 14 * 7 * 11 * 6 * 7 * 5 * 10th percentile 11 8 9 17 13 19 9 13 9 11 * 6 * 25th percentile 18 13 18 27 26 26 18 21 17 14 11 50th percentile 28 22 27 42 31 50 26 32 26 25 18 75th percentile 52 33 38 70 52 78 48 54 44 35 27 90th percentile 91 61 57 106 111 160 76 84 68 56 * 40 * 95th percentile 140 76 98 180 * 143 * 200 * 104 * 112 * 90 * 77 * 48 *
)))))))))))))))))))))))))))))))))))))))))))))))))))))))))))))))))))))))))))))))))))))))))))))))))))))))))))))))))))))))))))))))))))
* Indicates a statistic that is potentially unreliable because of small sample size or large coefficient of variation.# Indicates a percentage that is greater than 0 but less than 0.05 or a mean, SEM, or percentile that is greater than 0 but less than 0.5.--- Indicates a percentile that could not be estimated.Note: See "Table notes."Source: USDA's Continuing Survey of Food Intakes by Individuals, 1994-96, 2 days.
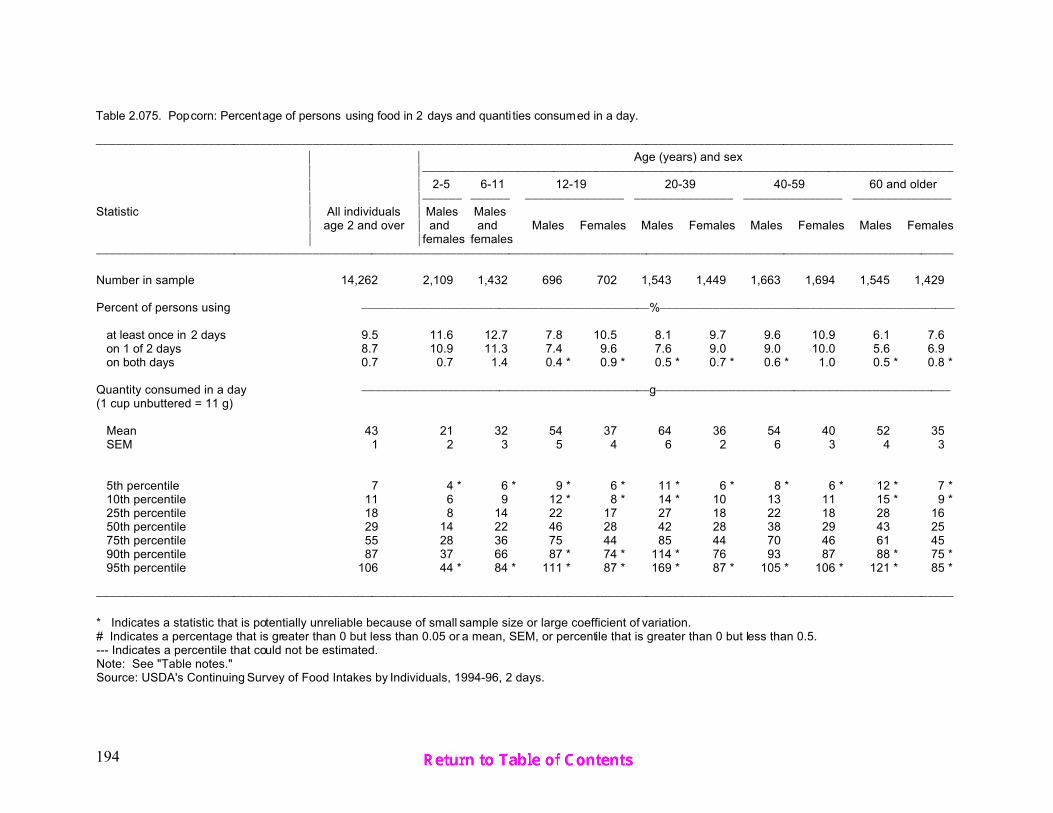
194
Table 2.075. Popcorn: Percentage of persons using food in 2 days and quanti ties consumed in a day.
)))))))))))))))))))))))))))))))))))))))))))))))))))))))))))))))))))))))))))))))))))))))))))))))))))))))))))))))))))))))))))))))))))
* * Age (years) and sex* *)))))))))))))))))))))))))))))))))))))))))))))))))))))))))))))))))))))))))))))))))
* * 2-5 6-11 12-19 20-39 40-59 60 and older* *)))))) )))))) ))))))))))))))) ))))))))))))))) ))))))))))))))) )))))))))))))))
Statistic * All individuals * Males Males* age 2 and over * and and Males Females Males Females Males Females Males Females* *females females
)))))))))))))))))))))))))))))))))))))))))))))))))))))))))))))))))))))))))))))))))))))))))))))))))))))))))))))))))))))))))))))))))))
Number in sample 14,262 2,109 1,432 696 702 1,543 1,449 1,663 1,694 1,545 1,429
Percent of persons using ))))))))))))))))))))))))))))))))))))))))))))%)))))))))))))))))))))))))))))))))))))))))))))
at least once in 2 days 9.5 11.6 12.7 7.8 10.5 8.1 9.7 9.6 10.9 6.1 7.6 on 1 of 2 days 8.7 10.9 11.3 7.4 9.6 7.6 9.0 9.0 10.0 5.6 6.9 on both days 0.7 0.7 1.4 0.4 * 0.9 * 0.5 * 0.7 * 0.6 * 1.0 0.5 * 0.8 *
Quantity consumed in a day ))))))))))))))))))))))))))))))))))))))))))))g)))))))))))))))))))))))))))))))))))))))))))))(1 cup unbuttered = 11 g)
Mean 43 21 32 54 37 64 36 54 40 52 35 SEM 1 2 3 5 4 6 2 6 3 4 3
5th percentile 7 4 * 6 * 9 * 6 * 11 * 6 * 8 * 6 * 12 * 7 * 10th percentile 11 6 9 12 * 8 * 14 * 10 13 11 15 * 9 * 25th percentile 18 8 14 22 17 27 18 22 18 28 16 50th percentile 29 14 22 46 28 42 28 38 29 43 25 75th percentile 55 28 36 75 44 85 44 70 46 61 45 90th percentile 87 37 66 87 * 74 * 114 * 76 93 87 88 * 75 * 95th percentile 106 44 * 84 * 111 * 87 * 169 * 87 * 105 * 106 * 121 * 85 *
)))))))))))))))))))))))))))))))))))))))))))))))))))))))))))))))))))))))))))))))))))))))))))))))))))))))))))))))))))))))))))))))))))
* Indicates a statistic that is potentially unreliable because of small sample size or large coefficient of variation.# Indicates a percentage that is greater than 0 but less than 0.05 or a mean, SEM, or percentile that is greater than 0 but less than 0.5.--- Indicates a percentile that could not be estimated.Note: See "Table notes."Source: USDA's Continuing Survey of Food Intakes by Individuals, 1994-96, 2 days.
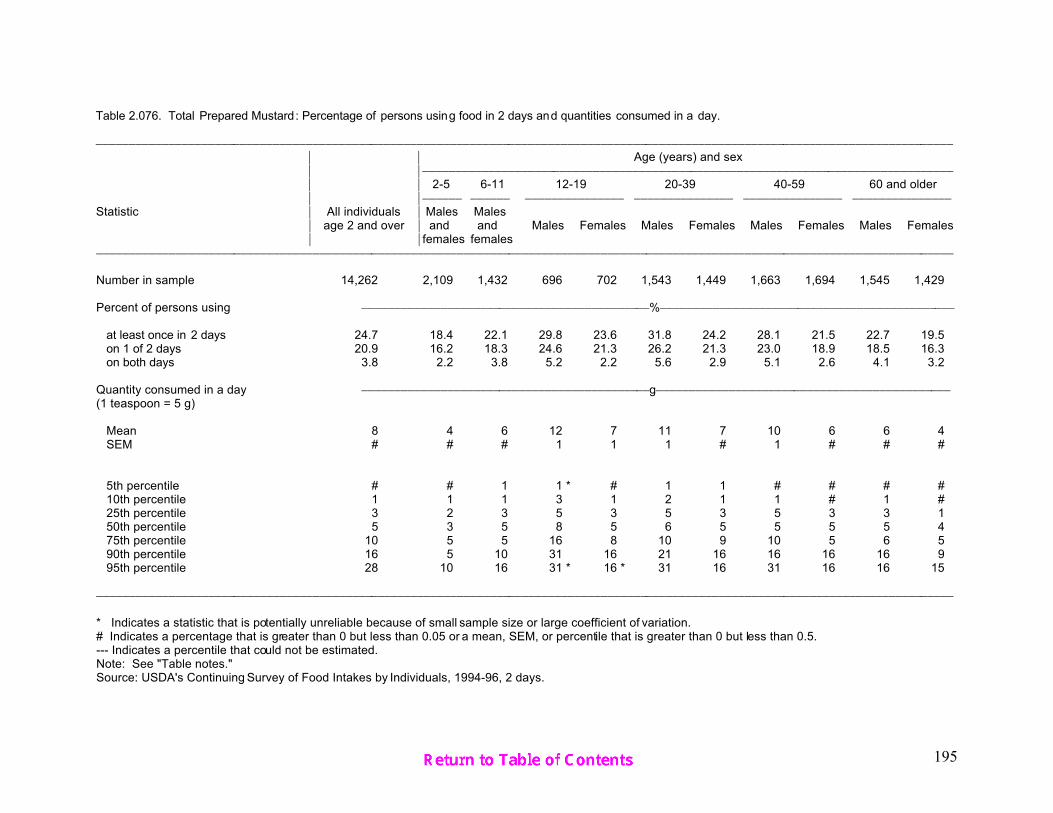
195
Table 2.076. Total Prepared Mustard: Percentage of persons using food in 2 days and quantities consumed in a day.
)))))))))))))))))))))))))))))))))))))))))))))))))))))))))))))))))))))))))))))))))))))))))))))))))))))))))))))))))))))))))))))))))))
* * Age (years) and sex* *)))))))))))))))))))))))))))))))))))))))))))))))))))))))))))))))))))))))))))))))))
* * 2-5 6-11 12-19 20-39 40-59 60 and older* *)))))) )))))) ))))))))))))))) ))))))))))))))) ))))))))))))))) )))))))))))))))
Statistic * All individuals * Males Males* age 2 and over * and and Males Females Males Females Males Females Males Females* *females females
)))))))))))))))))))))))))))))))))))))))))))))))))))))))))))))))))))))))))))))))))))))))))))))))))))))))))))))))))))))))))))))))))))
Number in sample 14,262 2,109 1,432 696 702 1,543 1,449 1,663 1,694 1,545 1,429
Percent of persons using ))))))))))))))))))))))))))))))))))))))))))))%)))))))))))))))))))))))))))))))))))))))))))))
at least once in 2 days 24.7 18.4 22.1 29.8 23.6 31.8 24.2 28.1 21.5 22.7 19.5 on 1 of 2 days 20.9 16.2 18.3 24.6 21.3 26.2 21.3 23.0 18.9 18.5 16.3 on both days 3.8 2.2 3.8 5.2 2.2 5.6 2.9 5.1 2.6 4.1 3.2
Quantity consumed in a day ))))))))))))))))))))))))))))))))))))))))))))g)))))))))))))))))))))))))))))))))))))))))))))(1 teaspoon = 5 g)
Mean 8 4 6 12 7 11 7 10 6 6 4 SEM # # # 1 1 1 # 1 # # #
5th percentile # # 1 1 * # 1 1 # # # # 10th percentile 1 1 1 3 1 2 1 1 # 1 # 25th percentile 3 2 3 5 3 5 3 5 3 3 1 50th percentile 5 3 5 8 5 6 5 5 5 5 4 75th percentile 10 5 5 16 8 10 9 10 5 6 5 90th percentile 16 5 10 31 16 21 16 16 16 16 9 95th percentile 28 10 16 31 * 16 * 31 16 31 16 16 15
)))))))))))))))))))))))))))))))))))))))))))))))))))))))))))))))))))))))))))))))))))))))))))))))))))))))))))))))))))))))))))))))))))
* Indicates a statistic that is potentially unreliable because of small sample size or large coefficient of variation.# Indicates a percentage that is greater than 0 but less than 0.05 or a mean, SEM, or percentile that is greater than 0 but less than 0.5.--- Indicates a percentile that could not be estimated.Note: See "Table notes."Source: USDA's Continuing Survey of Food Intakes by Individuals, 1994-96, 2 days.

196
Table 2.077. Total Tomato Catsup: Percentage of persons using food in 2 days and quantities consumed in a day.
)))))))))))))))))))))))))))))))))))))))))))))))))))))))))))))))))))))))))))))))))))))))))))))))))))))))))))))))))))))))))))))))))))
* * Age (years) and sex* *)))))))))))))))))))))))))))))))))))))))))))))))))))))))))))))))))))))))))))))))))
* * 2-5 6-11 12-19 20-39 40-59 60 and older* *)))))) )))))) ))))))))))))))) ))))))))))))))) ))))))))))))))) )))))))))))))))
Statistic * All individuals * Males Males* age 2 and over * and and Males Females Males Females Males Females Males Females* *females females
)))))))))))))))))))))))))))))))))))))))))))))))))))))))))))))))))))))))))))))))))))))))))))))))))))))))))))))))))))))))))))))))))))
Number in sample 14,262 2,109 1,432 696 702 1,543 1,449 1,663 1,694 1,545 1,429
Percent of persons using ))))))))))))))))))))))))))))))))))))))))))))%)))))))))))))))))))))))))))))))))))))))))))))
at least once in 2 days 27.8 40.9 40.3 42.8 39.2 37.1 24.1 23.0 16.8 15.2 10.6 on 1 of 2 days 23.4 33.0 32.6 31.7 32.8 30.6 21.9 19.6 15.4 13.1 9.5 on both days 4.5 7.9 7.7 11.0 6.4 6.5 2.2 3.4 1.4 2.2 1.1
Quantity consumed in a day ))))))))))))))))))))))))))))))))))))))))))))g)))))))))))))))))))))))))))))))))))))))))))))(1 tablespoon = 15 g)
Mean 21 14 17 31 21 25 18 22 16 16 14 SEM # 1 1 2 1 1 1 1 1 1 2
5th percentile 2 2 2 4 4 5 2 4 2 2 * 1 * 10th percentile 5 2 5 5 5 5 5 5 4 2 2 25th percentile 6 5 6 12 7 12 7 7 5 5 5 50th percentile 15 10 13 15 15 15 15 15 12 12 8 75th percentile 29 15 20 45 28 30 22 29 15 22 15 90th percentile 45 30 37 74 45 60 34 52 30 33 29 95th percentile 60 44 48 108 59 70 57 58 47 48 * 48 *
)))))))))))))))))))))))))))))))))))))))))))))))))))))))))))))))))))))))))))))))))))))))))))))))))))))))))))))))))))))))))))))))))))
* Indicates a statistic that is potentially unreliable because of small sample size or large coefficient of variation.# Indicates a percentage that is greater than 0 but less than 0.05 or a mean, SEM, or percentile that is greater than 0 but less than 0.5.--- Indicates a percentile that could not be estimated.Note: See "Table notes."Source: USDA's Continuing Survey of Food Intakes by Individuals, 1994-96, 2 days.
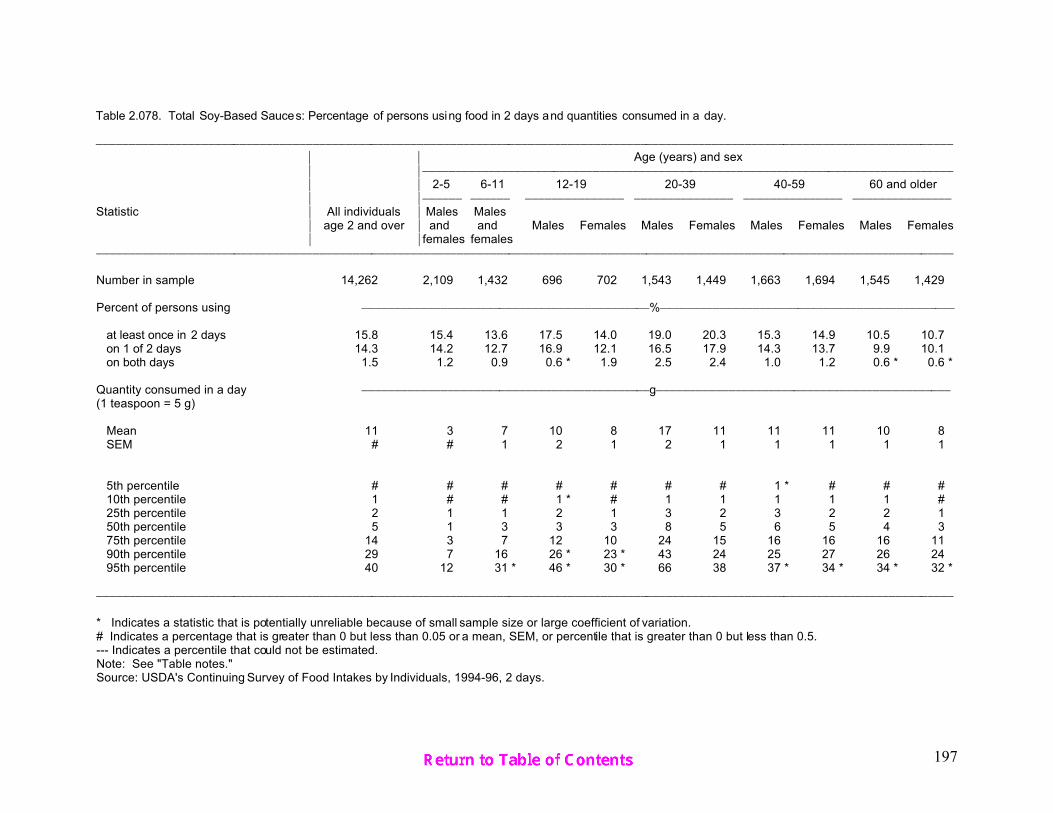
197
Table 2.078. Total Soy-Based Sauces: Percentage of persons using food in 2 days and quantities consumed in a day.
)))))))))))))))))))))))))))))))))))))))))))))))))))))))))))))))))))))))))))))))))))))))))))))))))))))))))))))))))))))))))))))))))))
* * Age (years) and sex* *)))))))))))))))))))))))))))))))))))))))))))))))))))))))))))))))))))))))))))))))))
* * 2-5 6-11 12-19 20-39 40-59 60 and older* *)))))) )))))) ))))))))))))))) ))))))))))))))) ))))))))))))))) )))))))))))))))
Statistic * All individuals * Males Males* age 2 and over * and and Males Females Males Females Males Females Males Females* *females females
)))))))))))))))))))))))))))))))))))))))))))))))))))))))))))))))))))))))))))))))))))))))))))))))))))))))))))))))))))))))))))))))))))
Number in sample 14,262 2,109 1,432 696 702 1,543 1,449 1,663 1,694 1,545 1,429
Percent of persons using ))))))))))))))))))))))))))))))))))))))))))))%)))))))))))))))))))))))))))))))))))))))))))))
at least once in 2 days 15.8 15.4 13.6 17.5 14.0 19.0 20.3 15.3 14.9 10.5 10.7 on 1 of 2 days 14.3 14.2 12.7 16.9 12.1 16.5 17.9 14.3 13.7 9.9 10.1 on both days 1.5 1.2 0.9 0.6 * 1.9 2.5 2.4 1.0 1.2 0.6 * 0.6 *
Quantity consumed in a day ))))))))))))))))))))))))))))))))))))))))))))g)))))))))))))))))))))))))))))))))))))))))))))(1 teaspoon = 5 g)
Mean 11 3 7 10 8 17 11 11 11 10 8 SEM # # 1 2 1 2 1 1 1 1 1
5th percentile # # # # # # # 1 * # # # 10th percentile 1 # # 1 * # 1 1 1 1 1 # 25th percentile 2 1 1 2 1 3 2 3 2 2 1 50th percentile 5 1 3 3 3 8 5 6 5 4 3 75th percentile 14 3 7 12 10 24 15 16 16 16 11 90th percentile 29 7 16 26 * 23 * 43 24 25 27 26 24 95th percentile 40 12 31 * 46 * 30 * 66 38 37 * 34 * 34 * 32 *
)))))))))))))))))))))))))))))))))))))))))))))))))))))))))))))))))))))))))))))))))))))))))))))))))))))))))))))))))))))))))))))))))))
* Indicates a statistic that is potentially unreliable because of small sample size or large coefficient of variation.# Indicates a percentage that is greater than 0 but less than 0.05 or a mean, SEM, or percentile that is greater than 0 but less than 0.5.--- Indicates a percentile that could not be estimated.Note: See "Table notes."Source: USDA's Continuing Survey of Food Intakes by Individuals, 1994-96, 2 days.

198
Table 2.079. Total Cucumber Pick les: Percentage of persons using food in 2 days and quantit ies consumed in a day.
)))))))))))))))))))))))))))))))))))))))))))))))))))))))))))))))))))))))))))))))))))))))))))))))))))))))))))))))))))))))))))))))))))
* * Age (years) and sex* *)))))))))))))))))))))))))))))))))))))))))))))))))))))))))))))))))))))))))))))))))
* * 2-5 6-11 12-19 20-39 40-59 60 and older* *)))))) )))))) ))))))))))))))) ))))))))))))))) ))))))))))))))) )))))))))))))))
Statistic * All individuals * Males Males* age 2 and over * and and Males Females Males Females Males Females Males Females* *females females
)))))))))))))))))))))))))))))))))))))))))))))))))))))))))))))))))))))))))))))))))))))))))))))))))))))))))))))))))))))))))))))))))))
Number in sample 14,262 2,109 1,432 696 702 1,543 1,449 1,663 1,694 1,545 1,429
Percent of persons using ))))))))))))))))))))))))))))))))))))))))))))%)))))))))))))))))))))))))))))))))))))))))))))
at least once in 2 days 32.7 22.9 27.7 33.8 36.2 40.8 32.8 37.6 31.7 27.8 26.7 on 1 of 2 days 27.8 21.1 23.5 27.9 32.2 33.7 28.4 30.8 27.3 22.6 23.7 on both days 4.9 1.7 4.2 5.9 4.0 7.1 4.4 6.7 4.4 5.2 3.0
Quantity consumed in a day ))))))))))))))))))))))))))))))))))))))))))))g)))))))))))))))))))))))))))))))))))))))))))))(1 medium = 65 g)
Mean 18 12 20 20 20 19 15 21 16 17 17 SEM 1 1 3 1 3 1 1 1 1 1 2
5th percentile 1 1 1 2 * 1 * 1 1 1 1 1 1 10th percentile 3 1 3 3 3 3 3 3 2 1 1 25th percentile 5 3 5 9 6 9 5 8 5 5 4 50th percentile 12 5 10 14 12 14 10 14 11 10 10 75th percentile 19 12 18 24 20 20 16 24 18 18 18 90th percentile 36 28 37 40 43 35 34 37 36 39 35 95th percentile 60 49 67 64 * 71 * 60 45 56 64 53 57
)))))))))))))))))))))))))))))))))))))))))))))))))))))))))))))))))))))))))))))))))))))))))))))))))))))))))))))))))))))))))))))))))))
* Indicates a statistic that is potentially unreliable because of small sample size or large coefficient of variation.# Indicates a percentage that is greater than 0 but less than 0.05 or a mean, SEM, or percentile that is greater than 0 but less than 0.5.--- Indicates a percentile that could not be estimated.Note: See "Table notes."Source: USDA's Continuing Survey of Food Intakes by Individuals, 1994-96, 2 days.

199
Table 2.080. Total Sour Cream: Percentage of persons using food in 2 days and quantities consumed in a day.
)))))))))))))))))))))))))))))))))))))))))))))))))))))))))))))))))))))))))))))))))))))))))))))))))))))))))))))))))))))))))))))))))))
* * Age (years) and sex* *)))))))))))))))))))))))))))))))))))))))))))))))))))))))))))))))))))))))))))))))))
* * 2-5 6-11 12-19 20-39 40-59 60 and older* *)))))) )))))) ))))))))))))))) ))))))))))))))) ))))))))))))))) )))))))))))))))
Statistic * All individuals * Males Males* age 2 and over * and and Males Females Males Females Males Females Males Females* *females females
)))))))))))))))))))))))))))))))))))))))))))))))))))))))))))))))))))))))))))))))))))))))))))))))))))))))))))))))))))))))))))))))))))
Number in sample 14,262 2,109 1,432 696 702 1,543 1,449 1,663 1,694 1,545 1,429
Percent of persons using ))))))))))))))))))))))))))))))))))))))))))))%)))))))))))))))))))))))))))))))))))))))))))))
at least once in 2 days 17.6 16.5 18.8 13.8 21.2 18.5 19.5 16.7 20.7 12.0 13.8 on 1 of 2 days 15.6 15.1 17.1 12.5 18.0 16.2 16.8 14.8 19.1 10.0 12.1 on both days 2.0 1.5 1.7 1.3 * 3.2 2.4 2.7 1.9 1.6 2.0 1.7
Quantity consumed in a day ))))))))))))))))))))))))))))))))))))))))))))g)))))))))))))))))))))))))))))))))))))))))))))(1 tablespoon = 14 g)
Mean 18 6 11 18 17 30 18 18 17 19 12 SEM 1 1 2 3 3 4 1 2 2 2 2
5th percentile # # # # # # # # # # # 10th percentile # # # # # # # # # # # 25th percentile 1 # # # # 1 2 2 1 1 1 50th percentile 6 # 1 6 3 6 8 8 6 11 4 75th percentile 26 3 7 28 14 32 29 20 26 28 14 90th percentile 54 27 29 55 * 47 75 57 51 47 48 29 95th percentile 69 29 50 71 * 75 * 114 65 64 58 61 * 43 *
)))))))))))))))))))))))))))))))))))))))))))))))))))))))))))))))))))))))))))))))))))))))))))))))))))))))))))))))))))))))))))))))))))
* Indicates a statistic that is potentially unreliable because of small sample size or large coefficient of variation.# Indicates a percentage that is greater than 0 but less than 0.05 or a mean, SEM, or percentile that is greater than 0 but less than 0.5.--- Indicates a percentile that could not be estimated.Note: See "Table notes."Source: USDA's Continuing Survey of Food Intakes by Individuals, 1994-96, 2 days.

200
Table 2.081. Total Fluid Cream: Percentage of persons using food in 2 days and quantities consumed in a day.
)))))))))))))))))))))))))))))))))))))))))))))))))))))))))))))))))))))))))))))))))))))))))))))))))))))))))))))))))))))))))))))))))))
* * Age (years) and sex* *)))))))))))))))))))))))))))))))))))))))))))))))))))))))))))))))))))))))))))))))))
* * 2-5 6-11 12-19 20-39 40-59 60 and older* *)))))) )))))) ))))))))))))))) ))))))))))))))) ))))))))))))))) )))))))))))))))
Statistic * All individuals * Males Males* age 2 and over * and and Males Females Males Females Males Females Males Females* *females females
)))))))))))))))))))))))))))))))))))))))))))))))))))))))))))))))))))))))))))))))))))))))))))))))))))))))))))))))))))))))))))))))))))
Number in sample 14,262 2,109 1,432 696 702 1,543 1,449 1,663 1,694 1,545 1,429
Percent of persons using ))))))))))))))))))))))))))))))))))))))))))))%)))))))))))))))))))))))))))))))))))))))))))))
at least once in 2 days 59.2 60.3 61.2 66.5 59.1 66.7 57.6 58.1 55.0 55.7 51.1 on 1 of 2 days 39.4 40.8 41.2 45.0 40.2 41.1 38.7 40.0 37.3 34.8 36.3 on both days 19.8 19.5 19.9 21.5 18.9 25.6 18.9 18.2 17.6 20.9 14.8
Quantity consumed in a day ))))))))))))))))))))))))))))))))))))))))))))g)))))))))))))))))))))))))))))))))))))))))))))(1 tablespoon = 15 g)
Mean 15 9 13 14 15 16 13 19 16 22 16 SEM # 1 1 1 2 1 1 1 1 1 1
5th percentile 1 # 1 1 1 1 # 1 # 1 # 10th percentile 1 1 1 1 1 1 1 1 1 1 1 25th percentile 1 1 1 1 1 2 1 2 1 2 1 50th percentile 3 2 3 3 2 4 3 5 4 10 8 75th percentile 19 12 16 10 15 20 18 29 17 29 22 90th percentile 44 26 32 44 45 46 36 59 41 47 36 95th percentile 60 32 47 73 63 62 49 68 59 76 58
)))))))))))))))))))))))))))))))))))))))))))))))))))))))))))))))))))))))))))))))))))))))))))))))))))))))))))))))))))))))))))))))))))
* Indicates a statistic that is potentially unreliable because of small sample size or large coefficient of variation.# Indicates a percentage that is greater than 0 but less than 0.05 or a mean, SEM, or percentile that is greater than 0 but less than 0.5.--- Indicates a percentile that could not be estimated.Note: See "Table notes."Source: USDA's Continuing Survey of Food Intakes by Individuals, 1994-96, 2 days.
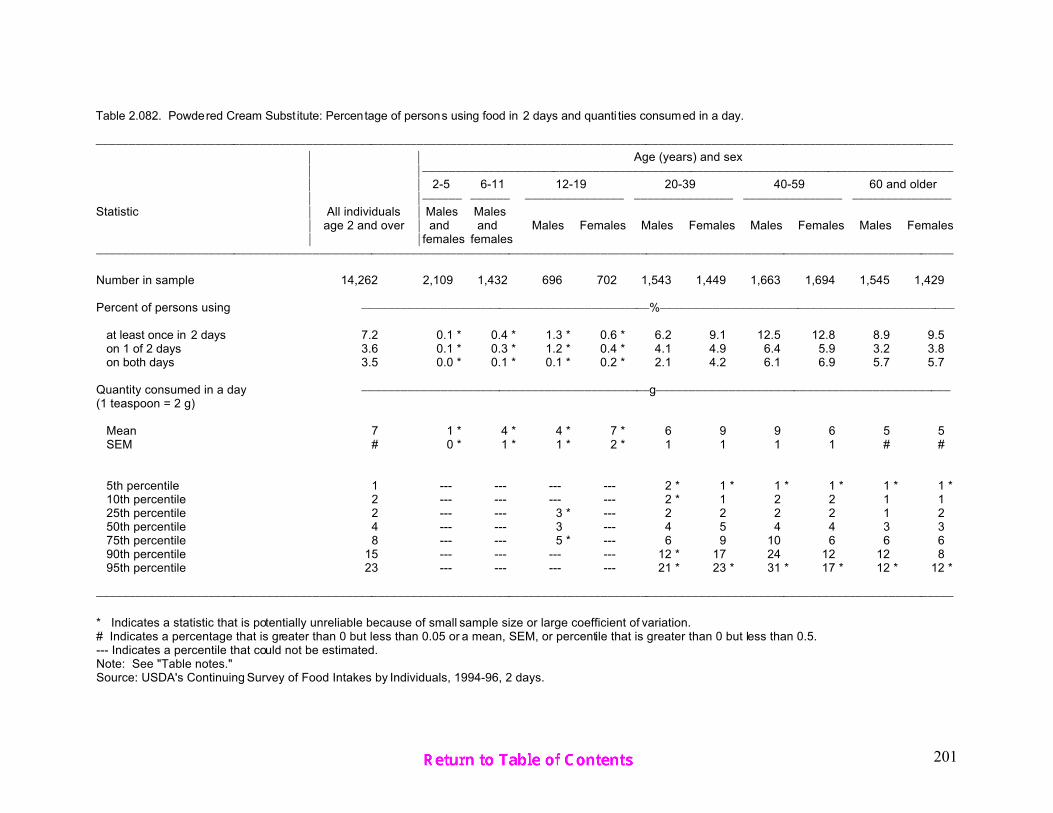
201
Table 2.082. Powdered Cream Subst itute: Percentage of persons using food in 2 days and quanti ties consumed in a day.
)))))))))))))))))))))))))))))))))))))))))))))))))))))))))))))))))))))))))))))))))))))))))))))))))))))))))))))))))))))))))))))))))))
* * Age (years) and sex* *)))))))))))))))))))))))))))))))))))))))))))))))))))))))))))))))))))))))))))))))))
* * 2-5 6-11 12-19 20-39 40-59 60 and older* *)))))) )))))) ))))))))))))))) ))))))))))))))) ))))))))))))))) )))))))))))))))
Statistic * All individuals * Males Males* age 2 and over * and and Males Females Males Females Males Females Males Females* *females females
)))))))))))))))))))))))))))))))))))))))))))))))))))))))))))))))))))))))))))))))))))))))))))))))))))))))))))))))))))))))))))))))))))
Number in sample 14,262 2,109 1,432 696 702 1,543 1,449 1,663 1,694 1,545 1,429
Percent of persons using ))))))))))))))))))))))))))))))))))))))))))))%)))))))))))))))))))))))))))))))))))))))))))))
at least once in 2 days 7.2 0.1 * 0.4 * 1.3 * 0.6 * 6.2 9.1 12.5 12.8 8.9 9.5 on 1 of 2 days 3.6 0.1 * 0.3 * 1.2 * 0.4 * 4.1 4.9 6.4 5.9 3.2 3.8 on both days 3.5 0.0 * 0.1 * 0.1 * 0.2 * 2.1 4.2 6.1 6.9 5.7 5.7
Quantity consumed in a day ))))))))))))))))))))))))))))))))))))))))))))g)))))))))))))))))))))))))))))))))))))))))))))(1 teaspoon = 2 g)
Mean 7 1 * 4 * 4 * 7 * 6 9 9 6 5 5 SEM # 0 * 1 * 1 * 2 * 1 1 1 1 # #
5th percentile 1 --- --- --- --- 2 * 1 * 1 * 1 * 1 * 1 * 10th percentile 2 --- --- --- --- 2 * 1 2 2 1 1 25th percentile 2 --- --- 3 * --- 2 2 2 2 1 2 50th percentile 4 --- --- 3 --- 4 5 4 4 3 3 75th percentile 8 --- --- 5 * --- 6 9 10 6 6 6 90th percentile 15 --- --- --- --- 12 * 17 24 12 12 8 95th percentile 23 --- --- --- --- 21 * 23 * 31 * 17 * 12 * 12 *
)))))))))))))))))))))))))))))))))))))))))))))))))))))))))))))))))))))))))))))))))))))))))))))))))))))))))))))))))))))))))))))))))))
* Indicates a statistic that is potentially unreliable because of small sample size or large coefficient of variation.# Indicates a percentage that is greater than 0 but less than 0.05 or a mean, SEM, or percentile that is greater than 0 but less than 0.5.--- Indicates a percentile that could not be estimated.Note: See "Table notes."Source: USDA's Continuing Survey of Food Intakes by Individuals, 1994-96, 2 days.

202
Table 2.083. Total Margarine: Percentage of persons using food in 2 days and quantities consumed in a day.
)))))))))))))))))))))))))))))))))))))))))))))))))))))))))))))))))))))))))))))))))))))))))))))))))))))))))))))))))))))))))))))))))))
* * Age (years) and sex* *)))))))))))))))))))))))))))))))))))))))))))))))))))))))))))))))))))))))))))))))))
* * 2-5 6-11 12-19 20-39 40-59 60 and older* *)))))) )))))) ))))))))))))))) ))))))))))))))) ))))))))))))))) )))))))))))))))
Statistic * All individuals * Males Males* age 2 and over * and and Males Females Males Females Males Females Males Females* *females females
)))))))))))))))))))))))))))))))))))))))))))))))))))))))))))))))))))))))))))))))))))))))))))))))))))))))))))))))))))))))))))))))))))
Number in sample 14,262 2,109 1,432 696 702 1,543 1,449 1,663 1,694 1,545 1,429
Percent of persons using ))))))))))))))))))))))))))))))))))))))))))))%)))))))))))))))))))))))))))))))))))))))))))))
at least once in 2 days 76.9 74.4 76.2 73.0 75.2 72.4 73.0 78.8 81.1 84.7 83.5 on 1 of 2 days 40.9 40.8 41.5 45.8 44.5 44.1 41.5 40.1 42.5 31.2 34.6 on both days 36.0 33.6 34.7 27.2 30.7 28.3 31.6 38.7 38.7 53.5 48.9
Quantity consumed in a day ))))))))))))))))))))))))))))))))))))))))))))g)))))))))))))))))))))))))))))))))))))))))))))(1 teaspoon = 5 g)
Mean 11 7 9 14 9 13 10 14 11 12 10 SEM # # # 1 1 1 # 1 # # #
5th percentile 1 # 1 1 1 1 1 1 1 1 1 10th percentile 1 1 1 2 1 1 1 2 1 2 1 25th percentile 3 2 2 4 3 5 3 5 3 5 4 50th percentile 7 5 6 9 6 9 6 9 7 9 7 75th percentile 14 9 11 18 13 16 13 18 14 16 13 90th percentile 25 16 20 33 19 29 22 29 24 26 22 95th percentile 33 21 28 49 27 42 27 41 31 34 29
)))))))))))))))))))))))))))))))))))))))))))))))))))))))))))))))))))))))))))))))))))))))))))))))))))))))))))))))))))))))))))))))))))
* Indicates a statistic that is potentially unreliable because of small sample size or large coefficient of variation.# Indicates a percentage that is greater than 0 but less than 0.05 or a mean, SEM, or percentile that is greater than 0 but less than 0.5.--- Indicates a percentile that could not be estimated.Note: See "Table notes."Source: USDA's Continuing Survey of Food Intakes by Individuals, 1994-96, 2 days.
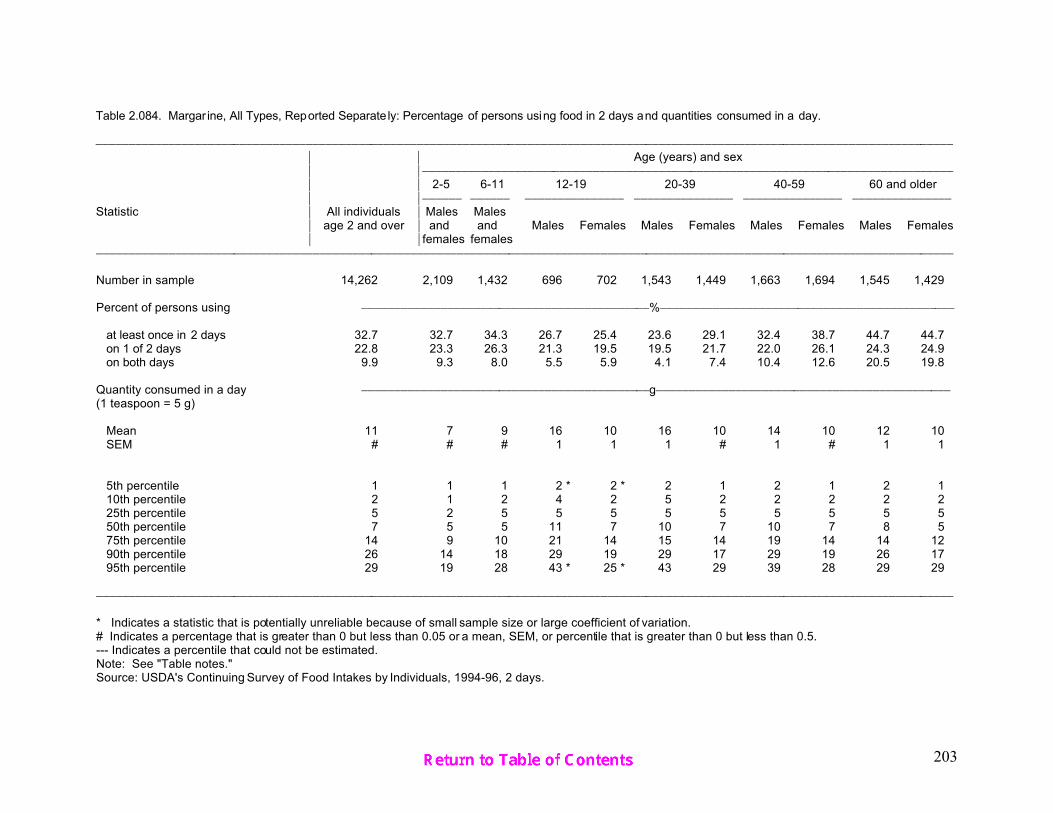
203
Table 2.084. Margar ine, All Types, Reported Separate ly: Percentage of persons using food in 2 days and quantities consumed in a day.
)))))))))))))))))))))))))))))))))))))))))))))))))))))))))))))))))))))))))))))))))))))))))))))))))))))))))))))))))))))))))))))))))))
* * Age (years) and sex* *)))))))))))))))))))))))))))))))))))))))))))))))))))))))))))))))))))))))))))))))))
* * 2-5 6-11 12-19 20-39 40-59 60 and older* *)))))) )))))) ))))))))))))))) ))))))))))))))) ))))))))))))))) )))))))))))))))
Statistic * All individuals * Males Males* age 2 and over * and and Males Females Males Females Males Females Males Females* *females females
)))))))))))))))))))))))))))))))))))))))))))))))))))))))))))))))))))))))))))))))))))))))))))))))))))))))))))))))))))))))))))))))))))
Number in sample 14,262 2,109 1,432 696 702 1,543 1,449 1,663 1,694 1,545 1,429
Percent of persons using ))))))))))))))))))))))))))))))))))))))))))))%)))))))))))))))))))))))))))))))))))))))))))))
at least once in 2 days 32.7 32.7 34.3 26.7 25.4 23.6 29.1 32.4 38.7 44.7 44.7 on 1 of 2 days 22.8 23.3 26.3 21.3 19.5 19.5 21.7 22.0 26.1 24.3 24.9 on both days 9.9 9.3 8.0 5.5 5.9 4.1 7.4 10.4 12.6 20.5 19.8
Quantity consumed in a day ))))))))))))))))))))))))))))))))))))))))))))g)))))))))))))))))))))))))))))))))))))))))))))(1 teaspoon = 5 g)
Mean 11 7 9 16 10 16 10 14 10 12 10 SEM # # # 1 1 1 # 1 # 1 1
5th percentile 1 1 1 2 * 2 * 2 1 2 1 2 1 10th percentile 2 1 2 4 2 5 2 2 2 2 2 25th percentile 5 2 5 5 5 5 5 5 5 5 5 50th percentile 7 5 5 11 7 10 7 10 7 8 5 75th percentile 14 9 10 21 14 15 14 19 14 14 12 90th percentile 26 14 18 29 19 29 17 29 19 26 17 95th percentile 29 19 28 43 * 25 * 43 29 39 28 29 29
)))))))))))))))))))))))))))))))))))))))))))))))))))))))))))))))))))))))))))))))))))))))))))))))))))))))))))))))))))))))))))))))))))
* Indicates a statistic that is potentially unreliable because of small sample size or large coefficient of variation.# Indicates a percentage that is greater than 0 but less than 0.05 or a mean, SEM, or percentile that is greater than 0 but less than 0.5.--- Indicates a percentile that could not be estimated.Note: See "Table notes."Source: USDA's Continuing Survey of Food Intakes by Individuals, 1994-96, 2 days.

204
Table 2.085. Total Butter: Percentage of persons using food in 2 days and quanti ties consumed in a day.
)))))))))))))))))))))))))))))))))))))))))))))))))))))))))))))))))))))))))))))))))))))))))))))))))))))))))))))))))))))))))))))))))))
* * Age (years) and sex* *)))))))))))))))))))))))))))))))))))))))))))))))))))))))))))))))))))))))))))))))))
* * 2-5 6-11 12-19 20-39 40-59 60 and older* *)))))) )))))) ))))))))))))))) ))))))))))))))) ))))))))))))))) )))))))))))))))
Statistic * All individuals * Males Males* age 2 and over * and and Males Females Males Females Males Females Males Females* *females females
)))))))))))))))))))))))))))))))))))))))))))))))))))))))))))))))))))))))))))))))))))))))))))))))))))))))))))))))))))))))))))))))))))
Number in sample 14,262 2,109 1,432 696 702 1,543 1,449 1,663 1,694 1,545 1,429
Percent of persons using ))))))))))))))))))))))))))))))))))))))))))))%)))))))))))))))))))))))))))))))))))))))))))))
at least once in 2 days 39.5 42.8 39.7 34.2 34.8 38.3 38.6 41.5 40.2 43.3 40.8 on 1 of 2 days 30.1 31.6 31.2 28.3 28.7 30.1 30.1 30.2 30.3 29.9 29.7 on both days 9.4 11.2 8.5 5.8 6.1 8.2 8.5 11.2 9.9 13.4 11.1
Quantity consumed in a day ))))))))))))))))))))))))))))))))))))))))))))g)))))))))))))))))))))))))))))))))))))))))))))(1 teaspoon = 5 g)
Mean 10 6 8 13 8 14 8 10 8 10 8 SEM # # # 1 1 3 # 1 # 1 1
5th percentile 1 # # 1 * 1 * 1 1 1 # 1 # 10th percentile 1 1 1 1 1 1 1 1 1 1 1 25th percentile 2 1 2 3 2 3 2 3 2 2 2 50th percentile 5 3 5 9 5 7 5 6 5 6 5 75th percentile 12 7 10 15 10 16 11 14 11 14 10 90th percentile 21 14 16 28 16 32 17 22 19 21 18 95th percentile 29 19 25 38 * 23 * 50 24 30 27 31 24
)))))))))))))))))))))))))))))))))))))))))))))))))))))))))))))))))))))))))))))))))))))))))))))))))))))))))))))))))))))))))))))))))))
* Indicates a statistic that is potentially unreliable because of small sample size or large coefficient of variation.# Indicates a percentage that is greater than 0 but less than 0.05 or a mean, SEM, or percentile that is greater than 0 but less than 0.5.--- Indicates a percentile that could not be estimated.Note: See "Table notes."Source: USDA's Continuing Survey of Food Intakes by Individuals, 1994-96, 2 days.
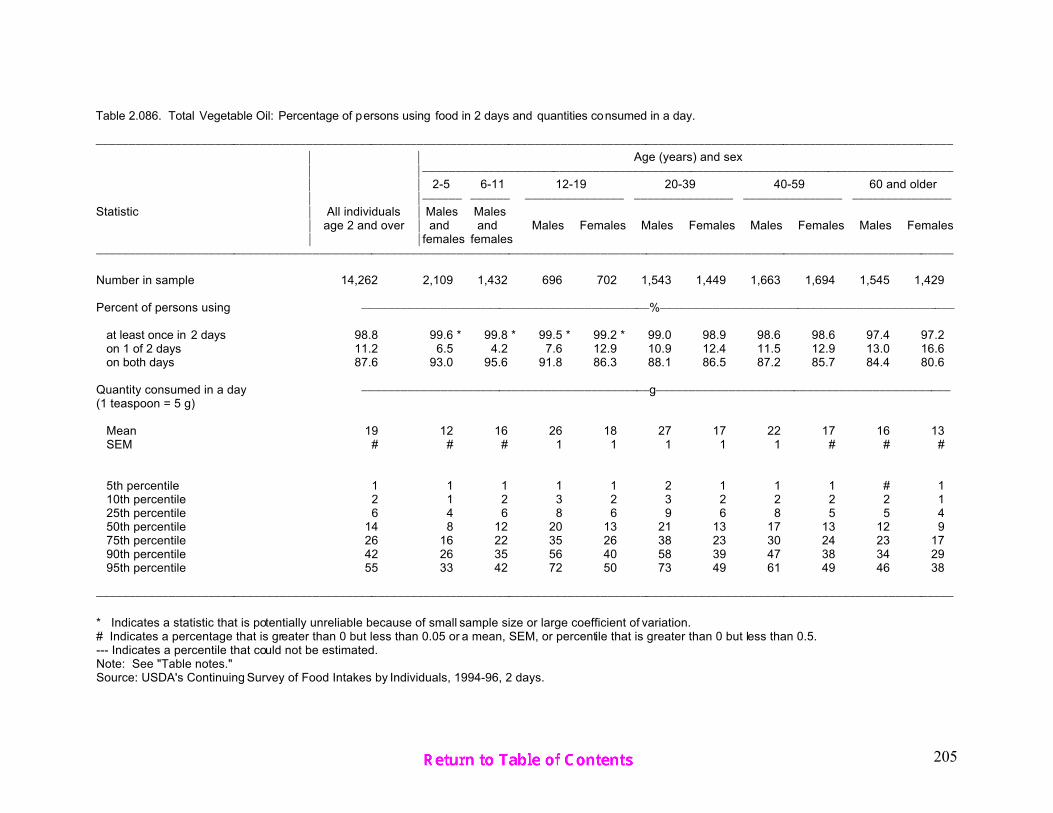
205
Table 2.086. Total Vegetable Oil: Percentage of persons using food in 2 days and quantities consumed in a day.
)))))))))))))))))))))))))))))))))))))))))))))))))))))))))))))))))))))))))))))))))))))))))))))))))))))))))))))))))))))))))))))))))))
* * Age (years) and sex* *)))))))))))))))))))))))))))))))))))))))))))))))))))))))))))))))))))))))))))))))))
* * 2-5 6-11 12-19 20-39 40-59 60 and older* *)))))) )))))) ))))))))))))))) ))))))))))))))) ))))))))))))))) )))))))))))))))
Statistic * All individuals * Males Males* age 2 and over * and and Males Females Males Females Males Females Males Females* *females females
)))))))))))))))))))))))))))))))))))))))))))))))))))))))))))))))))))))))))))))))))))))))))))))))))))))))))))))))))))))))))))))))))))
Number in sample 14,262 2,109 1,432 696 702 1,543 1,449 1,663 1,694 1,545 1,429
Percent of persons using ))))))))))))))))))))))))))))))))))))))))))))%)))))))))))))))))))))))))))))))))))))))))))))
at least once in 2 days 98.8 99.6 * 99.8 * 99.5 * 99.2 * 99.0 98.9 98.6 98.6 97.4 97.2 on 1 of 2 days 11.2 6.5 4.2 7.6 12.9 10.9 12.4 11.5 12.9 13.0 16.6 on both days 87.6 93.0 95.6 91.8 86.3 88.1 86.5 87.2 85.7 84.4 80.6
Quantity consumed in a day ))))))))))))))))))))))))))))))))))))))))))))g)))))))))))))))))))))))))))))))))))))))))))))(1 teaspoon = 5 g)
Mean 19 12 16 26 18 27 17 22 17 16 13 SEM # # # 1 1 1 1 1 # # #
5th percentile 1 1 1 1 1 2 1 1 1 # 1 10th percentile 2 1 2 3 2 3 2 2 2 2 1 25th percentile 6 4 6 8 6 9 6 8 5 5 4 50th percentile 14 8 12 20 13 21 13 17 13 12 9 75th percentile 26 16 22 35 26 38 23 30 24 23 17 90th percentile 42 26 35 56 40 58 39 47 38 34 29 95th percentile 55 33 42 72 50 73 49 61 49 46 38
)))))))))))))))))))))))))))))))))))))))))))))))))))))))))))))))))))))))))))))))))))))))))))))))))))))))))))))))))))))))))))))))))))
* Indicates a statistic that is potentially unreliable because of small sample size or large coefficient of variation.# Indicates a percentage that is greater than 0 but less than 0.05 or a mean, SEM, or percentile that is greater than 0 but less than 0.5.--- Indicates a percentile that could not be estimated.Note: See "Table notes."Source: USDA's Continuing Survey of Food Intakes by Individuals, 1994-96, 2 days.

206
Table 2.087. Pourable Salad Dressing: Percentage of persons using food in 2 days and quantities consumed in a day.
)))))))))))))))))))))))))))))))))))))))))))))))))))))))))))))))))))))))))))))))))))))))))))))))))))))))))))))))))))))))))))))))))))
* * Age (years) and sex* *)))))))))))))))))))))))))))))))))))))))))))))))))))))))))))))))))))))))))))))))))
* * 2-5 6-11 12-19 20-39 40-59 60 and older* *)))))) )))))) ))))))))))))))) ))))))))))))))) ))))))))))))))) )))))))))))))))
Statistic * All individuals * Males Males* age 2 and over * and and Males Females Males Females Males Females Males Females* *females females
)))))))))))))))))))))))))))))))))))))))))))))))))))))))))))))))))))))))))))))))))))))))))))))))))))))))))))))))))))))))))))))))))))
Number in sample 14,262 2,109 1,432 696 702 1,543 1,449 1,663 1,694 1,545 1,429
Percent of persons using ))))))))))))))))))))))))))))))))))))))))))))%)))))))))))))))))))))))))))))))))))))))))))))
at least once in 2 days 21.3 9.4 12.4 12.4 15.3 21.4 21.7 26.0 29.7 28.0 24.3 on 1 of 2 days 17.9 8.9 11.1 11.5 14.0 19.0 18.7 21.6 24.0 20.9 19.5 on both days 3.3 0.5 * 1.3 0.9 * 1.4 * 2.4 3.0 4.3 5.7 7.0 4.8
Quantity consumed in a day ))))))))))))))))))))))))))))))))))))))))))))g)))))))))))))))))))))))))))))))))))))))))))))(1 tablespoon Italian = 15 g)
Mean 39 17 29 45 38 47 40 44 37 34 31 SEM 1 2 3 4 4 2 2 2 1 1 1
5th percentile 5 2 * 5 * 5 * 5 * 8 5 13 6 5 6 10th percentile 10 3 5 11 * 5 * 15 8 15 11 11 11 25th percentile 16 5 15 29 15 29 16 29 16 15 15 50th percentile 31 14 29 39 31 31 31 31 31 29 29 75th percentile 56 23 31 61 59 60 58 59 49 47 41 90th percentile 66 32 59 79 * 74 * 88 78 83 65 62 59 95th percentile 90 46 * 62 * 106 * 82 * 113 93 112 87 72 64
)))))))))))))))))))))))))))))))))))))))))))))))))))))))))))))))))))))))))))))))))))))))))))))))))))))))))))))))))))))))))))))))))))
* Indicates a statistic that is potentially unreliable because of small sample size or large coefficient of variation.# Indicates a percentage that is greater than 0 but less than 0.05 or a mean, SEM, or percentile that is greater than 0 but less than 0.5.--- Indicates a percentile that could not be estimated.Note: See "Table notes."Source: USDA's Continuing Survey of Food Intakes by Individuals, 1994-96, 2 days.

207
Table 2.088. Total Mayonnaise and Mayonnaise-Type Dressing: Percentage of persons using food in 2 days and quanti ties consumed in a day.
)))))))))))))))))))))))))))))))))))))))))))))))))))))))))))))))))))))))))))))))))))))))))))))))))))))))))))))))))))))))))))))))))))
* * Age (years) and sex* *)))))))))))))))))))))))))))))))))))))))))))))))))))))))))))))))))))))))))))))))))
* * 2-5 6-11 12-19 20-39 40-59 60 and older* *)))))) )))))) ))))))))))))))) ))))))))))))))) ))))))))))))))) )))))))))))))))
Statistic * All individuals * Males Males* age 2 and over * and and Males Females Males Females Males Females Males Females* *females females
)))))))))))))))))))))))))))))))))))))))))))))))))))))))))))))))))))))))))))))))))))))))))))))))))))))))))))))))))))))))))))))))))))
Number in sample 14,262 2,109 1,432 696 702 1,543 1,449 1,663 1,694 1,545 1,429
Percent of persons using ))))))))))))))))))))))))))))))))))))))))))))%)))))))))))))))))))))))))))))))))))))))))))))
at least once in 2 days 44.7 29.6 33.4 44.0 42.7 51.2 45.2 51.7 47.8 43.5 43.4 on 1 of 2 days 32.8 24.3 27.0 33.7 30.4 35.5 36.4 35.7 34.8 30.1 30.3 on both days 11.9 5.4 6.4 10.3 12.4 15.7 8.8 16.0 13.0 13.4 13.1
Quantity consumed in a day ))))))))))))))))))))))))))))))))))))))))))))g)))))))))))))))))))))))))))))))))))))))))))))(1 tablespoon mayonnaise = 14 g)
Mean 16 9 12 21 13 19 14 19 16 17 15 SEM # # # 1 1 1 # 1 # 1 1
5th percentile 2 1 2 4 2 4 3 3 2 2 2 10th percentile 5 2 3 5 4 5 5 5 4 4 4 25th percentile 7 3 5 10 6 9 6 9 6 7 5 50th percentile 14 7 10 15 11 14 12 14 14 14 13 75th percentile 19 14 15 27 16 25 16 27 20 22 19 90th percentile 30 16 23 41 27 35 28 36 31 34 30 95th percentile 42 23 29 54 32 54 37 51 41 48 41
)))))))))))))))))))))))))))))))))))))))))))))))))))))))))))))))))))))))))))))))))))))))))))))))))))))))))))))))))))))))))))))))))))
* Indicates a statistic that is potentially unreliable because of small sample size or large coefficient of variation.# Indicates a percentage that is greater than 0 but less than 0.05 or a mean, SEM, or percentile that is greater than 0 but less than 0.5.--- Indicates a percentile that could not be estimated.Note: See "Table notes."Source: USDA's Continuing Survey of Food Intakes by Individuals, 1994-96, 2 days.

208
Table 2.089. Gravy: Percentage of persons using food in 2 days and quantities consumed in a day.
)))))))))))))))))))))))))))))))))))))))))))))))))))))))))))))))))))))))))))))))))))))))))))))))))))))))))))))))))))))))))))))))))))
* * Age (years) and sex* *)))))))))))))))))))))))))))))))))))))))))))))))))))))))))))))))))))))))))))))))))
* * 2-5 6-11 12-19 20-39 40-59 60 and older* *)))))) )))))) ))))))))))))))) ))))))))))))))) ))))))))))))))) )))))))))))))))
Statistic * All individuals * Males Males* age 2 and over * and and Males Females Males Females Males Females Males Females* *females females
)))))))))))))))))))))))))))))))))))))))))))))))))))))))))))))))))))))))))))))))))))))))))))))))))))))))))))))))))))))))))))))))))))
Number in sample 14,262 2,109 1,432 696 702 1,543 1,449 1,663 1,694 1,545 1,429
Percent of persons using ))))))))))))))))))))))))))))))))))))))))))))%)))))))))))))))))))))))))))))))))))))))))))))
at least once in 2 days 9.4 7.5 8.1 8.8 8.2 9.5 8.0 11.5 8.5 13.9 10.8 on 1 of 2 days 8.8 7.1 7.9 8.4 7.8 8.8 7.6 10.6 7.9 12.3 10.4 on both days 0.6 0.4 * 0.2 * 0.4 * 0.4 * 0.6 * 0.4 * 0.9 0.6 * 1.6 0.4 *
Quantity consumed in a day ))))))))))))))))))))))))))))))))))))))))))))g)))))))))))))))))))))))))))))))))))))))))))))(1/4 cup = 58 g)
Mean 80 34 67 105 90 108 68 97 69 81 60 SEM 4 2 10 10 22 12 8 9 7 4 4
5th percentile 13 4 * 5 * 28 * 15 * 15 * 5 * 15 * 7 * 14 * 13 * 10th percentile 14 9 11 * 29 * 15 * 29 11 * 27 11 15 14 25th percentile 29 14 29 36 29 54 26 30 29 29 29 50th percentile 58 29 52 72 52 75 40 59 58 58 46 75th percentile 116 46 78 134 116 117 87 117 89 109 74 90th percentile 169 59 118 * 227 * 168 * 185 156 * 226 144 166 117 95th percentile 231 79 * 177 * 237 * 224 * 262 * 204 * 237 * 197 * 223 * 160 *
)))))))))))))))))))))))))))))))))))))))))))))))))))))))))))))))))))))))))))))))))))))))))))))))))))))))))))))))))))))))))))))))))))
* Indicates a statistic that is potentially unreliable because of small sample size or large coefficient of variation.# Indicates a percentage that is greater than 0 but less than 0.05 or a mean, SEM, or percentile that is greater than 0 but less than 0.5.--- Indicates a percentile that could not be estimated.Note: See "Table notes."Source: USDA's Continuing Survey of Food Intakes by Individuals, 1994-96, 2 days.
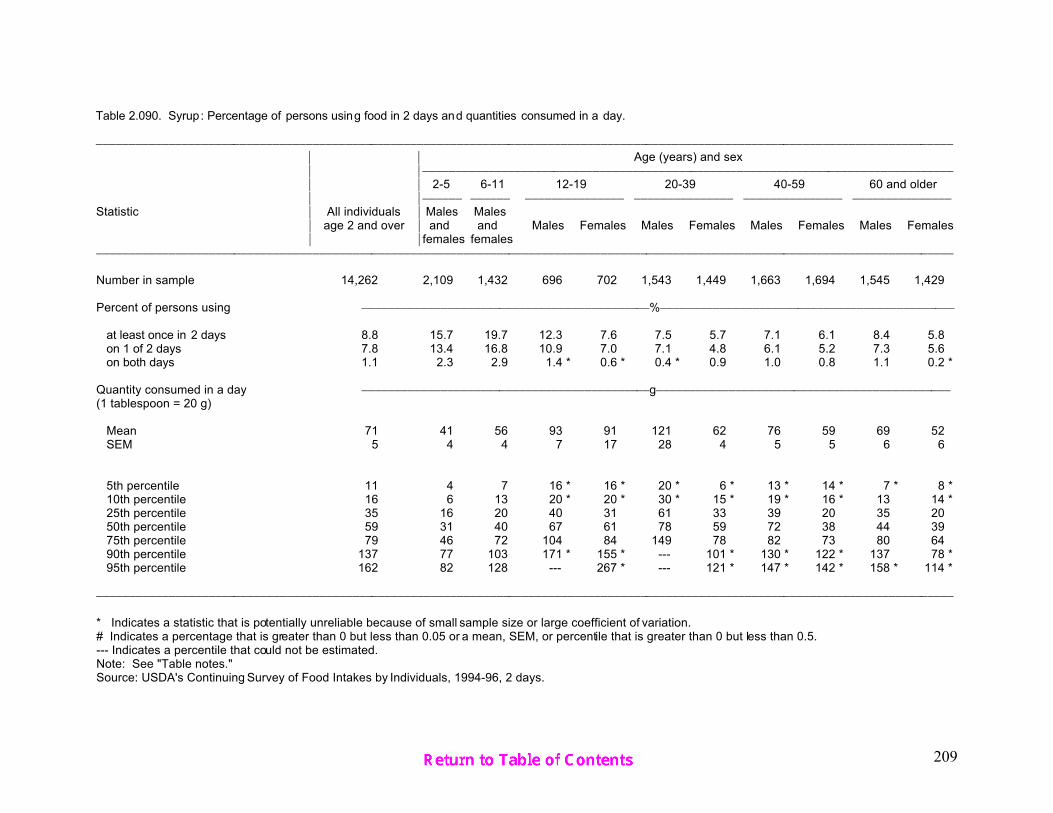
209
Table 2.090. Syrup: Percentage of persons using food in 2 days and quantities consumed in a day.
)))))))))))))))))))))))))))))))))))))))))))))))))))))))))))))))))))))))))))))))))))))))))))))))))))))))))))))))))))))))))))))))))))
* * Age (years) and sex* *)))))))))))))))))))))))))))))))))))))))))))))))))))))))))))))))))))))))))))))))))
* * 2-5 6-11 12-19 20-39 40-59 60 and older* *)))))) )))))) ))))))))))))))) ))))))))))))))) ))))))))))))))) )))))))))))))))
Statistic * All individuals * Males Males* age 2 and over * and and Males Females Males Females Males Females Males Females* *females females
)))))))))))))))))))))))))))))))))))))))))))))))))))))))))))))))))))))))))))))))))))))))))))))))))))))))))))))))))))))))))))))))))))
Number in sample 14,262 2,109 1,432 696 702 1,543 1,449 1,663 1,694 1,545 1,429
Percent of persons using ))))))))))))))))))))))))))))))))))))))))))))%)))))))))))))))))))))))))))))))))))))))))))))
at least once in 2 days 8.8 15.7 19.7 12.3 7.6 7.5 5.7 7.1 6.1 8.4 5.8 on 1 of 2 days 7.8 13.4 16.8 10.9 7.0 7.1 4.8 6.1 5.2 7.3 5.6 on both days 1.1 2.3 2.9 1.4 * 0.6 * 0.4 * 0.9 1.0 0.8 1.1 0.2 *
Quantity consumed in a day ))))))))))))))))))))))))))))))))))))))))))))g)))))))))))))))))))))))))))))))))))))))))))))(1 tablespoon = 20 g)
Mean 71 41 56 93 91 121 62 76 59 69 52 SEM 5 4 4 7 17 28 4 5 5 6 6
5th percentile 11 4 7 16 * 16 * 20 * 6 * 13 * 14 * 7 * 8 * 10th percentile 16 6 13 20 * 20 * 30 * 15 * 19 * 16 * 13 14 * 25th percentile 35 16 20 40 31 61 33 39 20 35 20 50th percentile 59 31 40 67 61 78 59 72 38 44 39 75th percentile 79 46 72 104 84 149 78 82 73 80 64 90th percentile 137 77 103 171 * 155 * --- 101 * 130 * 122 * 137 78 * 95th percentile 162 82 128 --- 267 * --- 121 * 147 * 142 * 158 * 114 *
)))))))))))))))))))))))))))))))))))))))))))))))))))))))))))))))))))))))))))))))))))))))))))))))))))))))))))))))))))))))))))))))))))
* Indicates a statistic that is potentially unreliable because of small sample size or large coefficient of variation.# Indicates a percentage that is greater than 0 but less than 0.05 or a mean, SEM, or percentile that is greater than 0 but less than 0.5.--- Indicates a percentile that could not be estimated.Note: See "Table notes."Source: USDA's Continuing Survey of Food Intakes by Individuals, 1994-96, 2 days.

210
Table 2.091. Total Sugar: Percentage of persons using food in 2 days and quanti ties consumed in a day.
)))))))))))))))))))))))))))))))))))))))))))))))))))))))))))))))))))))))))))))))))))))))))))))))))))))))))))))))))))))))))))))))))))
* * Age (years) and sex* *)))))))))))))))))))))))))))))))))))))))))))))))))))))))))))))))))))))))))))))))))
* * 2-5 6-11 12-19 20-39 40-59 60 and older* *)))))) )))))) ))))))))))))))) ))))))))))))))) ))))))))))))))) )))))))))))))))
Statistic * All individuals * Males Males* age 2 and over * and and Males Females Males Females Males Females Males Females* *females females
)))))))))))))))))))))))))))))))))))))))))))))))))))))))))))))))))))))))))))))))))))))))))))))))))))))))))))))))))))))))))))))))))))
Number in sample 14,262 2,109 1,432 696 702 1,543 1,449 1,663 1,694 1,545 1,429
Percent of persons using ))))))))))))))))))))))))))))))))))))))))))))%)))))))))))))))))))))))))))))))))))))))))))))
at least once in 2 days 99.5 99.8 * 100.0 * 99.9 * 99.9 * 99.3 * 99.5 * 99.7 * 99.5 * 99.3 * 99.1 on 1 of 2 days 5.0 1.9 1.8 2.9 5.1 5.7 6.7 5.3 5.2 4.8 7.0 on both days 94.5 97.9 98.2 97.0 94.8 93.6 92.8 94.3 94.3 94.4 92.1
Quantity consumed in a day ))))))))))))))))))))))))))))))))))))))))))))g)))))))))))))))))))))))))))))))))))))))))))))(1 teaspoon granulated = 4 g)
Mean 45 39 54 74 51 52 41 45 33 37 30 SEM 1 1 1 3 3 2 2 1 1 1 1
5th percentile 1 4 6 3 1 1 1 1 1 2 1 10th percentile 4 7 12 6 3 3 3 3 3 3 2 25th percentile 13 16 24 24 16 13 12 12 11 12 9 50th percentile 31 31 43 57 39 35 29 31 24 28 22 75th percentile 59 54 72 103 69 73 54 60 45 52 41 90th percentile 99 80 107 152 112 119 92 101 74 82 64 95th percentile 133 108 134 192 147 165 126 129 97 107 81
)))))))))))))))))))))))))))))))))))))))))))))))))))))))))))))))))))))))))))))))))))))))))))))))))))))))))))))))))))))))))))))))))))
* Indicates a statistic that is potentially unreliable because of small sample size or large coefficient of variation.# Indicates a percentage that is greater than 0 but less than 0.05 or a mean, SEM, or percentile that is greater than 0 but less than 0.5.--- Indicates a percentile that could not be estimated.Note: See "Table notes."Source: USDA's Continuing Survey of Food Intakes by Individuals, 1994-96, 2 days.

211
Table 2.092. Total Honey: Percentage of persons using food in 2 days and quantit ies consumed in a day.
)))))))))))))))))))))))))))))))))))))))))))))))))))))))))))))))))))))))))))))))))))))))))))))))))))))))))))))))))))))))))))))))))))
* * Age (years) and sex* *)))))))))))))))))))))))))))))))))))))))))))))))))))))))))))))))))))))))))))))))))
* * 2-5 6-11 12-19 20-39 40-59 60 and older* *)))))) )))))) ))))))))))))))) ))))))))))))))) ))))))))))))))) )))))))))))))))
Statistic * All individuals * Males Males* age 2 and over * and and Males Females Males Females Males Females Males Females* *females females
)))))))))))))))))))))))))))))))))))))))))))))))))))))))))))))))))))))))))))))))))))))))))))))))))))))))))))))))))))))))))))))))))))
Number in sample 14,262 2,109 1,432 696 702 1,543 1,449 1,663 1,694 1,545 1,429
Percent of persons using ))))))))))))))))))))))))))))))))))))))))))))%)))))))))))))))))))))))))))))))))))))))))))))
at least once in 2 days 22.2 28.3 28.8 22.8 21.6 16.3 21.8 21.3 21.3 22.6 23.9 on 1 of 2 days 17.4 22.8 23.8 17.6 18.2 13.6 17.7 15.7 17.2 15.1 16.6 on both days 4.8 5.5 5.1 5.1 3.3 2.8 4.1 5.6 4.0 7.5 7.3
Quantity consumed in a day ))))))))))))))))))))))))))))))))))))))))))))g)))))))))))))))))))))))))))))))))))))))))))))(1 tablespoon = 21 g)
Mean 5 3 3 5 2 6 5 9 * 5 5 5 SEM # # # 1 # 1 1 3 * 1 # 1
5th percentile # # # # # # # # # # # 10th percentile # # # # # # # # # # # 25th percentile # # # # # # # 1 # # # 50th percentile 1 1 1 1 1 1 1 1 1 1 1 75th percentile 3 2 2 3 2 4 4 5 4 4 3 90th percentile 14 5 5 7 6 14 15 21 15 14 14 95th percentile 21 11 10 34 * 7 * 22 * 24 28 21 21 28
)))))))))))))))))))))))))))))))))))))))))))))))))))))))))))))))))))))))))))))))))))))))))))))))))))))))))))))))))))))))))))))))))))
* Indicates a statistic that is potentially unreliable because of small sample size or large coefficient of variation.# Indicates a percentage that is greater than 0 but less than 0.05 or a mean, SEM, or percentile that is greater than 0 but less than 0.5.--- Indicates a percentile that could not be estimated.Note: See "Table notes."Source: USDA's Continuing Survey of Food Intakes by Individuals, 1994-96, 2 days.

212
Table 2.093. Candy Containing Chocolate: Percentage of persons using food in 2 days and quantities consumed in a day.
)))))))))))))))))))))))))))))))))))))))))))))))))))))))))))))))))))))))))))))))))))))))))))))))))))))))))))))))))))))))))))))))))))
* * Age (years) and sex* *)))))))))))))))))))))))))))))))))))))))))))))))))))))))))))))))))))))))))))))))))
* * 2-5 6-11 12-19 20-39 40-59 60 and older* *)))))) )))))) ))))))))))))))) ))))))))))))))) ))))))))))))))) )))))))))))))))
Statistic * All individuals * Males Males* age 2 and over * and and Males Females Males Females Males Females Males Females* *females females
)))))))))))))))))))))))))))))))))))))))))))))))))))))))))))))))))))))))))))))))))))))))))))))))))))))))))))))))))))))))))))))))))))
Number in sample 14,262 2,109 1,432 696 702 1,543 1,449 1,663 1,694 1,545 1,429
Percent of persons using ))))))))))))))))))))))))))))))))))))))))))))%)))))))))))))))))))))))))))))))))))))))))))))
at least once in 2 days 15.8 16.9 23.8 19.5 18.4 15.3 14.9 14.1 16.4 11.0 9.8 on 1 of 2 days 13.5 14.4 20.8 16.7 16.3 13.3 12.8 11.6 14.6 8.6 8.4 on both days 2.2 2.6 3.0 2.9 2.1 2.1 2.1 2.5 1.8 2.5 1.4
Quantity consumed in a day ))))))))))))))))))))))))))))))))))))))))))))g)))))))))))))))))))))))))))))))))))))))))))))(1 ounce = 28 g)
Mean 48 31 40 65 48 52 52 59 44 48 36 SEM 2 3 2 6 2 3 6 7 3 5 3
5th percentile 7 5 7 11 * 9 * 9 * 7 * 10 * 7 9 * 5 * 10th percentile 10 6 8 20 11 11 10 14 10 11 8 25th percentile 20 10 17 40 23 27 21 25 17 20 15 50th percentile 40 21 28 53 41 45 36 44 32 36 27 75th percentile 57 40 56 77 57 57 57 65 52 56 43 90th percentile 90 58 79 115 94 85 93 106 87 90 62 95th percentile 126 83 113 153 * 116 * 110 * 170 * 133 * 132 159 * 87 *
)))))))))))))))))))))))))))))))))))))))))))))))))))))))))))))))))))))))))))))))))))))))))))))))))))))))))))))))))))))))))))))))))))
* Indicates a statistic that is potentially unreliable because of small sample size or large coefficient of variation.# Indicates a percentage that is greater than 0 but less than 0.05 or a mean, SEM, or percentile that is greater than 0 but less than 0.5.--- Indicates a percentile that could not be estimated.Note: See "Table notes."Source: USDA's Continuing Survey of Food Intakes by Individuals, 1994-96, 2 days.

213
Table 2.094. Candy Not Containing Chocolate: Percentage of persons using food in 2 days and quantities consumed in a day.
)))))))))))))))))))))))))))))))))))))))))))))))))))))))))))))))))))))))))))))))))))))))))))))))))))))))))))))))))))))))))))))))))))
* * Age (years) and sex* *)))))))))))))))))))))))))))))))))))))))))))))))))))))))))))))))))))))))))))))))))
* * 2-5 6-11 12-19 20-39 40-59 60 and older* *)))))) )))))) ))))))))))))))) ))))))))))))))) ))))))))))))))) )))))))))))))))
Statistic * All individuals * Males Males* age 2 and over * and and Males Females Males Females Males Females Males Females* *females females
)))))))))))))))))))))))))))))))))))))))))))))))))))))))))))))))))))))))))))))))))))))))))))))))))))))))))))))))))))))))))))))))))))
Number in sample 14,262 2,109 1,432 696 702 1,543 1,449 1,663 1,694 1,545 1,429
Percent of persons using ))))))))))))))))))))))))))))))))))))))))))))%)))))))))))))))))))))))))))))))))))))))))))))
at least once in 2 days 11.0 22.9 28.2 14.1 18.3 5.4 8.1 6.4 8.8 6.2 5.9 on 1 of 2 days 9.2 18.2 23.1 11.1 16.4 5.1 7.1 5.5 7.3 4.9 5.1 on both days 1.7 4.7 5.1 3.0 1.9 0.4 * 1.0 0.9 1.5 1.2 0.8 *
Quantity consumed in a day ))))))))))))))))))))))))))))))))))))))))))))g)))))))))))))))))))))))))))))))))))))))))))))(1 ounce = 28 g)
Mean 36 27 32 52 37 52 35 42 38 39 24 SEM 2 1 2 7 4 7 5 5 6 7 3
5th percentile 4 4 3 3 * 4 * 5 * 5 * 4 * 6 * 3 * 3 * 10th percentile 6 6 5 8 * 6 6 * 5 * 5 * 6 4 * 3 * 25th percentile 12 13 14 15 14 12 9 12 10 6 6 50th percentile 21 20 21 29 22 28 18 26 23 21 12 75th percentile 46 30 43 62 51 55 50 53 44 37 29 90th percentile 83 52 65 116 * 85 103 * 82 * 112 * 79 92 * 60 * 95th percentile 114 74 85 179 * 111 * 138 * 112 * 124 * 116 * 136 * 82 *
)))))))))))))))))))))))))))))))))))))))))))))))))))))))))))))))))))))))))))))))))))))))))))))))))))))))))))))))))))))))))))))))))))
* Indicates a statistic that is potentially unreliable because of small sample size or large coefficient of variation.# Indicates a percentage that is greater than 0 but less than 0.05 or a mean, SEM, or percentile that is greater than 0 but less than 0.5.--- Indicates a percentile that could not be estimated.Note: See "Table notes."Source: USDA's Continuing Survey of Food Intakes by Individuals, 1994-96, 2 days.

214
Table 2.095. Jel ly, Jams, Preserves, and Marmalade: Percentage of persons us ing food in 2 days and quantities consumed in a day.
)))))))))))))))))))))))))))))))))))))))))))))))))))))))))))))))))))))))))))))))))))))))))))))))))))))))))))))))))))))))))))))))))))
* * Age (years) and sex* *)))))))))))))))))))))))))))))))))))))))))))))))))))))))))))))))))))))))))))))))))
* * 2-5 6-11 12-19 20-39 40-59 60 and older* *)))))) )))))) ))))))))))))))) ))))))))))))))) ))))))))))))))) )))))))))))))))
Statistic * All individuals * Males Males* age 2 and over * and and Males Females Males Females Males Females Males Females* *females females
)))))))))))))))))))))))))))))))))))))))))))))))))))))))))))))))))))))))))))))))))))))))))))))))))))))))))))))))))))))))))))))))))))
Number in sample 14,262 2,109 1,432 696 702 1,543 1,449 1,663 1,694 1,545 1,429
Percent of persons using ))))))))))))))))))))))))))))))))))))))))))))%)))))))))))))))))))))))))))))))))))))))))))))
at least once in 2 days 17.3 27.0 21.8 13.4 13.7 11.5 14.1 15.3 16.6 25.2 24.0 on 1 of 2 days 13.6 22.0 18.1 10.5 11.5 9.6 11.2 12.0 14.0 17.9 16.0 on both days 3.7 5.0 3.7 2.9 2.3 1.9 3.0 3.2 2.6 7.4 8.0
Quantity consumed in a day ))))))))))))))))))))))))))))))))))))))))))))g)))))))))))))))))))))))))))))))))))))))))))))(1 tablespoon jam = 21 g)
Mean 21 17 20 43 21 36 18 23 16 19 15 SEM 1 1 1 8 2 3 1 1 1 1 1
5th percentile 3 3 5 6 * 4 * 5 * 3 * 3 3 3 3 10th percentile 6 3 6 6 * 5 * 7 6 6 6 6 4 25th percentile 7 6 9 15 9 12 6 12 6 6 6 50th percentile 14 14 18 20 18 19 13 18 12 13 12 75th percentile 20 19 19 40 20 40 20 27 19 20 19 90th percentile 39 37 38 77 * 38 * 78 37 40 33 38 28 95th percentile 63 38 45 119 * 48 * 104 * 47 * 73 39 40 37
)))))))))))))))))))))))))))))))))))))))))))))))))))))))))))))))))))))))))))))))))))))))))))))))))))))))))))))))))))))))))))))))))))
* Indicates a statistic that is potentially unreliable because of small sample size or large coefficient of variation.# Indicates a percentage that is greater than 0 but less than 0.05 or a mean, SEM, or percentile that is greater than 0 but less than 0.5.--- Indicates a percentile that could not be estimated.Note: See "Table notes."Source: USDA's Continuing Survey of Food Intakes by Individuals, 1994-96, 2 days.

215
Table 2.096. Total Artificial Sweetener: Percentage of persons using food in 2 days and quantit ies consumed in a day.
)))))))))))))))))))))))))))))))))))))))))))))))))))))))))))))))))))))))))))))))))))))))))))))))))))))))))))))))))))))))))))))))))))
* * Age (years) and sex* *)))))))))))))))))))))))))))))))))))))))))))))))))))))))))))))))))))))))))))))))))
* * 2-5 6-11 12-19 20-39 40-59 60 and older* *)))))) )))))) ))))))))))))))) ))))))))))))))) ))))))))))))))) )))))))))))))))
Statistic * All individuals * Males Males* age 2 and over * and and Males Females Males Females Males Females Males Females* *females females
)))))))))))))))))))))))))))))))))))))))))))))))))))))))))))))))))))))))))))))))))))))))))))))))))))))))))))))))))))))))))))))))))))
Number in sample 14,262 2,109 1,432 696 702 1,543 1,449 1,663 1,694 1,545 1,429
Percent of persons using ))))))))))))))))))))))))))))))))))))))))))))%)))))))))))))))))))))))))))))))))))))))))))))
at least once in 2 days 26.3 9.0 12.1 12.0 15.6 18.1 31.4 31.1 42.7 36.1 38.2 on 1 of 2 days 12.2 7.4 8.8 10.0 10.4 8.8 14.7 13.2 16.1 13.9 15.6 on both days 14.1 1.6 3.2 2.1 5.2 9.3 16.7 17.9 26.6 22.2 22.6
Quantity consumed in a day ))))))))))))))))))))))))))))))))))))))))))))g)))))))))))))))))))))))))))))))))))))))))))))(1 teaspoon = 3 g)
Mean 2 # 1 1 1 2 2 2 2 2 1 SEM # # # # # # # # # # #
5th percentile # # # # # # # # # # # 10th percentile # # # # # # # # # # # 25th percentile 1 # # # # 1 1 1 1 # # 50th percentile 1 # 1 1 1 1 1 1 1 1 1 75th percentile 2 1 1 1 1 2 2 2 2 2 2 90th percentile 4 1 1 3 * 2 * 4 3 4 4 3 3 95th percentile 4 1 * 2 * 5 * 2 * 4 4 6 5 5 4
)))))))))))))))))))))))))))))))))))))))))))))))))))))))))))))))))))))))))))))))))))))))))))))))))))))))))))))))))))))))))))))))))))
* Indicates a statistic that is potentially unreliable because of small sample size or large coefficient of variation.# Indicates a percentage that is greater than 0 but less than 0.05 or a mean, SEM, or percentile that is greater than 0 but less than 0.5.--- Indicates a percentile that could not be estimated.Note: See "Table notes."Source: USDA's Continuing Survey of Food Intakes by Individuals, 1994-96, 2 days.

216
TABLE NOTES
Explanation of Symbols Used in Tables
Asterisks are used in the tables to identify estimates thatmay tend to be less statistically reliable than those thatare not flagged. However, all the data in the tablesshould be able to be used to assess the order ofmagnitude of a given foods’ intake. The rules used forflagging estimates are described in the Methods section.
Dashes denote either that the value could not becalculated because too few persons consumed the foodor the percentile could not be interpolated because toomany reports were exactly the same magnitude. Minimum and/or maximum values are reported inappendix C. Zeroes in tables represent true zeroes;values which are greater than zero but which round to 0or 0.0 are noted with a pound sign (#).
SEM refers to the standard error of the mean. See theMethods section and Appendix A for additional notes.
Description of Foods in Table Set 1: QuantitiesConsumed Per Eating Occasion
1.001 White BreadIncludes all plain and toasted white breads includingFrench, Italian, sourdough, raisin, cheese, andcinnamon, and bread that was not identified as to type.Excluded are rolls, bagels, English muffins, flat breads,hard bread sticks, breadcrumbs and croutons. Breadused in sandwiches was included, but bread eaten as
part of other types of mixtures such as stewed tomatoesand meatloaf were not. A slice of white bread weighs 26g, and a slice of white toast weighs 23 g.
1.002 Whole Grain and “Wheat” BreadIncludes breads made with any whole grain flours suchas plain and toasted whole and cracked wheat, rye,pumpernickel and bran yeast breads, except rolls,bagels, English muffins, and flat breads. Whole grain andso-called “wheat” breads eaten as part of sandwiches areincluded, but bread eaten as part of other types ofmixtures such as stewed tomatoes and meatloaf werenot. A slice of whole wheat bread weighs 28 g, and aslice of whole wheat toast weighs 25 g.
1.003 RollsIncludes all hard, soft, French, Italian, Vienna rollswhether made primarily from white, whole wheat, rye, orother flour. Hamburger and frankfurter rolls eaten as partof sandwiches are included here as well. One dinner rollweighs 28 g; one medium hamburger roll weighs 43 g.
1.004 BiscuitsIncludes all biscuits reported separately or as part of asandwich. One medium biscuit made from scratch orbiscuit mix weighs 30g; one regular biscuit made fromrefrigerator dough weighs 19 g.
1.005 TortillasIncludes all tortillas reported separately or as part of aburrito, enchilada, taco, or other food. Excludes tortillachips. One 7-inch round tortilla made from flour weighs33 g; one 7-inch round tortilla made from corn weighs 25g; and one 6-1/2 inch corn taco shell weighs 21 g.

217
1.006 Quickbreads and MuffinsIncludes cornbread, fruit breads, pumpkin breads,zucchini breads, non-yeast coffee cakes, and all kinds ofmuffins. Excludes other cornmeal products such ascornbread stuffing, cornbread coating on frankfurters(corn dogs), hush puppies, and spoon bread. One wedgeof cornbread from home recipe (1/12 of an 8-inch round)weighs 52 g; one medium bran muffin weighs 57 g.
1.007 Doughnuts and Sweet RollsIncludes all varieties of doughnuts, sweet rolls and yeast-raised coffee cakes, except Danish pastries. Onemedium cake doughnut (3-1/4 inches in diameter) weighs47 g; one medium glazed doughnut (3-1/4 inches indiameter) weighs 60 g; one medium sweet roll weighs 60g.
1.008 CrackersIncludes all kinds of crackers reported separately, exceptsandwich-type crackers and sweet crackers. Four saltinecrackers weigh 12 g.
1.009 CookiesIncludes all varieties of cookies, except brownies. Alsoincludes sweet crackers such as graham crackers andanimal crackers. One medium cookie weighs 10 g. 1.010 CakeIncludes all kinds of cakes and cupcakes, exceptcoffeecake and cheesecake. One-twelfth of a 2-layer 8-or 9-inch frosted cake weighs 109 g, and one frostedcupcake (2-1/2 inches) weighs 36 g.
1.011 Pie
Includes all kinds of pies, but not turnovers, fritters,dumplings, strudels, or crisps. Excludes pie reported aspart of frozen meals. One-eighth of a 2-crust, 9-inch fruitpie weighs 150 g; 1/8 of a 9-inch cream pie weighs 144g.
1.012 Pancakes and WafflesIncludes pancakes and waffles reported separately or aspart of a frozen meal, but not blintzes, crepes, or potatopancakes. One 5-inch pancake weighs 40 g; one 4-inchround waffle weighs 39 g.
1.013 Cooked CerealIncludes oatmeal, grits, cream of wheat, cream of rice,cornmeal mush, and other cooked breakfast cereals.Includes weight of milk or sugar if reported collectively.The weights of ½ cup of cooked cereal are as follows:oatmeal, 117 g; grits, 121 g; cream of wheat, 125 g.
1.014 OatmealIncludes oatmeal eaten as hot cereal; excludes oatmealconsumed as ingredient of other food such as cookies.
1.015 Ready-to-Eat CerealIncludes all kinds of ready-to-eat cereal reportedseparately, whether or not pre-sweetened. Also includesdry baby cereals, which are often re-hydrated beforeserving. Weight of additional sugar, if any, and milk is notincluded. One cup of toasted oat rings (Cheerios®)weighs 30 g; 1 cup of corn flakes weighs 25 g; and 1 cupof raisin bran weighs 55-61 g.
1.016 Corn FlakesIncludes plain, frosted and flavored corn flakes. One cup

218
of plain corn flakes weighs 25 g; and 1 cup of frosted orflavored corn f lakes weighs 40 g.
1.017 Toasted Oat RingsIncludes plain, frosted and flavored oat rings. One cup ofplain, frosted or flavored oat rings weighs 30 g.
1.018 RiceIncludes cooked white and brown rice reportedseparately or as an ingredient in fried rice, Spanish rice,pilaf, and other mixed foods which are mostly rice; weightof other ingredients not included. Excludes cream of rice,wild rice, and rice in puddings and soups. One-half cupof cooked, regular white rice, no fat added in cooking,weighs 79 g.
1.019 PastaIncludes all spaghetti, macaroni, noodles, and otherpasta, whether reported separately or as part of mixeddishes, such as spaghetti with tomato sauce. Includesonly the weight of the pasta and not the otheringredients. Excludes noodles in pasta salads, puddings,and soup. One cup of cooked pasta weighs 140 g.
1.020 Macaroni and CheeseIncludes macaroni and cheese and that with beef,tomatoes, and/or other ingredients added. One cup ofcooked macaroni and cheese weighs 243 g.
1.021 Spaghetti with Tomato SauceIncludes spaghetti with tomato sauce andmeat/meatballs and/or cheese. One cup of cookedspaghetti with sauce weighs 248 g.
1.022 PizzaIncludes all kinds of pizza, French bread pizza, pizzaturnovers and calzone. One slice (1/8) of a 12-inch thincrust pizza with meat weighs 71 g.
1.023 Raw CucumbersIncludes plain cucumbers and cucumbers with sourcream or vinegar and oil dressing. Represents the weightof the cucumbers only, and not the dressing. Does notinclude cucumbers reported as part of other mixed salad.One-half cup of sliced cucumbers weighs 60 g.
1.024 Total LettuceIncludes all plain lettuce, Boston lettuce, and Romainereported separately or as part of a mixed salad orsandwich. One cup of lettuce weighs 55 g, one mediumleaf weighs 8 g.
1.025 Mixed Lettuce-Based SaladIncludes only salad made of lettuce mixed with othervegetables. One cup of lettuce salad with tomatoes andcarrots weighs 73 g.
1.026 Cooked BroccoliIncludes cooked broccoli reported separately and not aspart of a casserole or other mixture. One-half cup ofcooked, chopped broccoli weighs 92 g.
1.027 Cooked CarrotsIncludes cooked carrots, reported separately and not aspart of a casserole or other mixture. One-half cup ofsliced cooked carrots weighs 73 g.
1.028 Raw Carrots

219
Includes only raw carrots reported separately. One-halfcup of raw chopped carrots weighs 64 g and one mediumcarrot weighs 61 g.
1.029 Raw Tomatoes Includes all raw tomatoes reported separately. One-halfcup of sliced or chopped raw tomatoes weighs 90 g; onemedium tomato weighs 123 g.
1.030 Total Tomato SauceIncludes all tomato sauce, whether reported separatelyor as part of mixed food. Does not include the weight ofmeat in sauce. One-half cup of sauce weighs 122 g.
1.031 Cooked String BeansIncludes cooked string beans reported separately andnot as part of a mixture. One-half cup of cooked stringbeans weighs 68 g.
1.032 ColeslawIncludes all reports of coleslaw. One-half cup of coleslawweighs 92 g.
1.033 Cooked PeasIncludes cooked green peas reported separately. One-half cup of cooked green peas from fresh or frozenweighs 80 g.
1.034 Cooked CornIncludes cooked corn reported separately or as part ofcorn and peppers or creamed corn. One-half cup of cornweighs 82 g; the edible portion of one medium ear offresh cooked corn weighs 100 g.
1.035 Raw OnionsIncludes raw mature onions reported separately. Onemedium slice of raw onion weighs 14 g, and one-halfcup, chopped weighs 80 g.
1.036 French-Fried PotatoesIncludes all French fried potatoes, whether made fromfrozen or fresh potatoes, except those reported as part ofa frozen meal. Ten medium French fries weigh 50 g.
1.037 Home-Fried and Hash-Browned PotatoesIncludes all home-fried and hash-browned potatoes andpotato-puffs reported separately. One-half cup of homefries weighs 97 g and ½ cup of hash-browned potatoesweighs 78 g.
1.038 Baked PotatoesIncludes all baked potatoes; weight of added ingredientsnot included. One medium baked potato, peel eatenweighs 122 g.
1.039 Boiled PotatoesIncludes all boiled potatoes reported separately. One-halfcup of boiled potatoes weighs 78 g.
1.040 Mashed PotatoesIncludes all mashed potatoes reported separately. One-half cup of mashed potatoes made with milk and fatweighs 105 g.
1.041 Cooked Dried Beans and PeasIncludes all cooked dried beans reported separately,such as kidney beans and lentils, with and without addedfat. One-half cup of cooked kidney beans without fat
220
weighs 86 g; ½ cup of cooked white beans with fatweighs 90 g.
1.042 Baked BeansIncludes all baked beans, with and without pork added,reported separately. One-half cup of baked beansweighs 126 g.
1.043 Raw OrangesIncludes raw oranges reported separately. Excludestangerines, mandarin oranges, canned oranges, andoranges which were reported as part of a salad. Onemedium raw orange weighs 131 g.
1.044 Orange JuiceIncludes all fresh, canned, and frozen orange juicereported separately, except juice that is not reconstituted.Six fluid ounces of orange juice weighs 187 g.
1.045 Raw ApplesIncludes raw apples reported separately. Excludesapples, which were part of a salad. One medium rawapple weighs 138 g.
1.046 Applesauce and Cooked ApplesIncludes applesauce and cooked apples reportedseparately. Excludes, for example, cooked apples eatenas part of a pie. One-half cup of applesauce weighs 128g.
1.047 Apple JuiceIncludes all apple juice and cider reported separately andnot as part of a juice blend. Six fluid ounces of applejuice weighs 186 g.
1.048 Raw BananasIncludes only raw bananas reported separately. Onemedium banana weighs 118 g.
1.049 Fluid MilkIncludes all fluid, reconstituted dry, and reconstitutedevaporated, cow’s milk reported separately. Excludeschocolate milk and other milk-flavored beverages. Onecup of fluid milk weighs 244-245 g.
1.050 Fluid Milk Consumed with CerealIncludes all fluid, reconstituted dry and reconstitutedevaporated cows’ milk eaten in combination with all typesof cereal.
1.051 Whole MilkIncludes all fluid, and reconstituted dry, whole (3-1/2 – 4percent fat) cow’s milk reported separately. One cup ofwhole milk weighs 244 g.
1.052 Whole Milk Consumed with CerealIncludes whole milk eaten in combination with all types ofcereal. One cup of fluid whole milk weighs 244 g.
1.053 Lowfat MilkIncludes all fluid and reconstituted dry, 1-2% fat cow’smilk reported separately. One cup of 1% or 2% fat milkweighs 244 g.
1.054 Lowfat Milk Consumed with CerealIncludes all fluid and reconstituted dry, 1-2% fat cow’smilk eaten in combination with all types of cereal. Onecup of 1-2% fat milk weighs 244 g.
221
1.055 Skim MilkIncludes all fluid, and reconstituted dry, skim or .5% fatand lower cow’s milk reported separately. One cup ofskim milk weighs 245 g.
1.056 Skim Milk Consumed with Cereal Includes all fluid, reconstituted dry, skim or .5% fat andlower cow’s milk eaten in combination with all types ofcereal. One cup of skim milk weighs 245 g.
1.057 Cheese, Other Than Cream or CottageIncludes all cheese, other than cream or cottageregardless of fat content, reported separately or as partof a sandwich. Excludes cheese consumed as part ofother mixtures. One and a half ounces of cheese weighs43 g.
1.058 Ice Cream and Ice MilkIncludes all flavors of hard and soft ice cream and icemilk reported separately. Excludes sherbet, frozenyogurt, and all novelties and cones. One-half cup of hardice cream weighs 66 g and ½ cup of soft ice creamweighs 86 g.
1.059 Beef SteaksIncludes all beef steak reported separately. Excludesbeef steaks reported as part of a sandwich. One ounceof cooked beef weighs 28 g.
1.060 Beef RoastsIncludes all roast beef reported separately. Excludesbeef roasts reported as part of a sandwich. One ounce ofcooked beef weighs 28 g.
1.061 Ground BeefIncludes all ground beef reported separately or as part ofa sandwich or other main dish type mixture (weight ofother ingredients not included). Once cooked, a 4-ouncepatty (1/4 pound raw) weighs 85 g.
1.062 HamIncludes all cured ham and Canadian bacon, exceptluncheon meats, reported separately or as part of asandwich or other main dish type mixture (weight of otheringredients not included). One ounce of cooked hamweighs 28 g.
1.063 Pork Chops, Steaks, RoastsIncludes all uncured pork chops, steaks, and roasts,whether reported separately or as part of a sandwich orother mixed food (weight of other ingredients notincluded). Excludes ground pork and pork contained insausages. One ounce of cooked pork roast weighs 28 g,and 1 medium cooked pork chop (lean edible portion)weighs 79 g.
1.064 BaconIncludes all bacon (except “Canadian bacon”) whethermade from pork or other meat reported separately or aspart of a sandwich (weight of other ingredients notincluded) or frozen meal (e.g., as a side item or in asandwich, not as part of a mixed dish). Excludes baconin other types of mixed food. One thin strip of cookedbacon weighs 5 g.
1.065 Pork Breakfast SausageIncludes all pork breakfast sausage, whether reported

222
separately or as part of a frozen meal or sandwich(weight of other ingredients not included). One mediumcooked sausage link weighs 13 g.
1.066 Frankfurters and Luncheon MeatsIncludes all frankfurters and luncheon meats, whetherreported separately or as part of sandwich (weight ofother ingredients not included). One cooked frankfurterweighs 57 g, and one ounce of luncheon meat weighs 28g.
1.067 Canned TunaIncludes all canned tuna, whether reported separately oras part of sandwich or other mixed food (weight of otheringredients not included). One-half of a 6.5-ounce can oftuna, water pack, drained, weighs 83 g.
1.068 Other FinfishIncludes all finf ish, except canned, dried and raw,whether reported separately or as part of a sandwich orother mixed food (weight of other ingredients notincluded). One ounce of cooked fish weighs 28 g.
1.069 Total Chicken and TurkeyIncludes all chicken and turkey, except frankfurters andluncheon meats, whether reported separately or as partof a sandwich or other mixed food (weight of otheringredients not included). One ounce of cooked chickenor turkey weighs 28 g.
1.070 ChickenIncludes all chicken, except frankfurters and luncheonmeats, whether reported separately or as part of asandwich (weight of other ingredients not included). One
ounce of cooked chicken weighs 28 g.
1.071 TurkeyIncludes all turkey, except frankfurters and luncheonmeats, whether reported separately or as part of asandwich (weight of other ingredients not included). Oneounce of cooked turkey weighs 28 g.
1.072 Boiled, Poached, and Baked EggsIncludes all boiled and poached eggs, whether reportedseparately or as part of a sandwich or other mixed foodin which the egg is visible (eggs in breads, saladdressing, eggnog, custard, and puddings are excluded).The weight of other ingredients is not included. Onelarge boiled egg weighs 50 g.
1.073 Fried EggsIncludes all fried eggs, whether reported separately or aspart of a sandwich (weight of other ingredients is notincluded). One large fried egg weighs 46 g.
1.074 Scrambled EggsIncludes all eggs from scrambled eggs, omelets, andsandwiches (weight of other ingredients not included).One large scrambled egg, no fat added in cooking,weighs 60 g.
1.075 Peanut ButterIncludes peanut butter reported separately or on asandwich. One tablespoon of peanut butter weighs 16 g.
1.076 CoffeeIncludes liquid coffees, whether regular or decaffeinated.

223
Excludes coffee made with liqueurs, chicory and othercereal-based hot beverages, and presweetened instantcoffees. Includes only the weight of the coffee (not anysweetener, cream or milk). One 8-fluid-ounce cup ofcoffee weighs 237 g.
1.077 Coffee, with CaffeineIncludes all regular coffee and coffee not specified as todecaffeinated or regular. Excludes coffee made withliqueurs, and presweetened instant coffees. Includesonly the weight of the coffee (not any sweetener, cream,or milk). One 8-fluid-ounce cup of coffee weighs 237 g.
1.078 Coffee, DecaffeinatedIncludes all decaffeinated coffee; excludes chicory andother cereal-based hot beverages. Excludes coffee madewith liqueurs, and presweetened instant coffees. Includesonly the weight of the coffee (not any sweetener, cream,or milk). One 8-fluid-ounce cup of coffee weighs 237 g.
1.079 TeaIncludes all teas, whether made from green or blackleaves or from herbs. Includes only the weight of the tea(not any sweetener, lemon juice, cream, or milk). One 8-fluid-ounce cup of tea weighs 237 g.
1.080 Soft DrinksIncludes all carbonated soft drinks, whether sweetenedor not and whether caffeine-free or not. One 12-fluid-ounce can of soft drink weighs 355-369 g.
1.081 Soft Drinks, Not Diet, With CaffeineIncludes all caffeine-containing, regularly sweetenedcarbonated soft drinks. In addition to colas, this includes
Dr. Pepper and Mountain Dew. One 12-fluid-ounce canweighs 369 g.
1.082 Soft Drinks, Not Diet, Caffeine-FreeIncludes all caffeine-free, regularly sweetenedcarbonated soft drinks. One 12-fluid-ounce can weighs369 g.
1.083 Soft Drinks, Diet, With CaffeineIncludes all caffeine-containing, carbonated diet softdrinks. One 12-f luid-ounce can weighs 355 g.
1.084 Soft Drinks, Diet, Caffeine-FreeIncludes all caffeine-free, carbonated diet soft drinks.One 12-fluid-ounce can weighs 355 g.
1.085 Fruit DrinksIncludes all non-carbonated fruit-flavored drinks.Excludes 100 percent fruit juice. Eight fluid ouncesweighs 248 g.
1.086 BeerIncludes all alcohol-containing beer reported separately.Excludes beer used in food preparation. One 12-fluid-ounce can of beer weighs 360 g.
1.087 WineIncludes all wine, whether reported separately or as partof a wine beverage. Excludes wine used in foodpreparation. One 3 ½-fluid-ounce glass of wine weighs103 g.
1.088 SoupsIncludes all soups reported separately; excludes fruit

224
soups, soups reported as undiluted, and thoseconsumed as an ingredient in another food, such as acasserole. One cup of beef broth or chunky chickennoodle soup weighs 240 g; one cup of cream of chickensoup weighs 245 g.
1.089 Potato ChipsExcludes potato sticks and chips used in casseroles. Ten potato chips, regular cut, weigh 14 g.
1.090 Corn ChipsIncludes all cornmeal-based salty snacks. Includes corntortilla chips, but excludes taco shells. One cup of cornchips weighs 26 g.
1.091 PopcornIncludes all popcorn, except caramel coated. Weight ofoil used in cooking and added butter included. One cupof popped in oil, unbuttered popcorn weighs 11 g.
1.092 Prepared MustardIncludes all prepared mustard, whether reportedseparately or as part of a sandwich, but not as part ofother mixtures. One teaspoon of mustard weighs 5 g.
1.093 Tomato CatsupIncluded all tomato catsup, whether reported separatelyor as part of a sandwich, but not as part of othermixtures. One tablespoon of catsup weighs 15 g.
1.094 Total Soy-Based SaucesIncludes all soy and Worcestershire sauces reportedseparately or as an ingredient of another food. Oneteaspoon of soy sauce weighs 5 g.
1.095 Cucumber PicklesIncludes all pickles, whether reported separately or aspart of a sandwich. One medium dill pickle weighs 65 g,and four thin slices weigh 24 g.
1.096 Fluid CreamIncludes all fluid cream reported separately. Does notinclude whipped cream. One tablespoon of creamweighs 15 g.
1.097 Powdered Cream SubstituteIncludes all powdered cream substitute reportedseparately. Does not include powdered dessert topping.One packet of powdered cream substitute weighs 3 g;one teaspoon weighs 2 g.
1.098 Margarine, All TypesIncludes all margarines (stick, tub or soft, imitation, andliquid) and margarine/butter blends reported separately.Excludes margarine consumed as an ingredient ofanother food. One teaspoon of margarine weighs 5 g.
1.099 Margarine, StickIncludes all stick margarines that are 60 percent fat orgreater by weight, and margarines not specified as totype, reported separately. Excludes margarineconsumed as an ingredient of another food. Oneteaspoon of margarine weighs 5 g.
1.100 Margarine, SoftIncludes all soft margarines that are 60 percent fat orgreater by weight reported separately. Excludes softmargarine consumed as an ingredient of another food.One teaspoon of soft margarine weighs 5 g.

225
1.101 Margarine, ImitationIncludes diet margarines and margarines that are only 40percent fat by weight. Excludes margarine spreadsconsumed as an ingredient of another food andmargarine/butter blends. One teaspoon of margarinespread weighs 5 g.
1.102 ButterIncludes only butter reported separately. Excludes butterconsumed as an ingredient of another food, whippedbutter and butter in margarine/butter blends. Oneteaspoon weighs 5 g.
1.103 Pourable Salad DressingIncludes all pourable salad dressings reported separatelyor as part of a mixture such as a salad. One tablespoonof Italian dressing weighs 15 g.
1.104 MayonnaiseIncludes only regular mayonnaise reported separately oras part of a sandwich. One tablespoon of mayonnaiseweighs 14 g.
1.105 Mayonnaise-Type DressingIncludes mayonnaise-type salad dressing reportedseparately or as part of a sandwich. Excludes reducedfat-varieties. One tablespoon of mayonnaise-typedressing weighs 15 g.
1.106 GravyIncludes gravy reported separately, on meat, or on aroast beef or turkey sandwich with gravy. Excludesgravies consumed as part of casseroles, milk gravy, andother sauces. One-fourth cup of beef gravy weighs 58 g.
1.107 SyrupIncludes maple, corn, cane, and fruit syrups, as well asbuttered and corn and maple syrup blends reportedseparately. Excludes ice cream toppings and reduced-calorie syrups. One tablespoon of maple syrup weighs20 g.
1.108 SugarIncludes white, brown sugar, confectioner’s, and rawsugar reported separately or in coffee or tea. Oneteaspoon of granulated white sugar weighs 4 g.
1.109 Candy Containing ChocolateIncludes plain milk chocolate, chocolate candy bars, andall chocolate-flavored or chocolate-covered candyreported separately. One ounce of candy weighs 28 g.
1.110 Candy Not Containing ChocolateIncludes all candy other than chocolate, such as hardcandy, gumdrops, caramel, and licorice. One ounce ofcandy weighs 28 g.
1.111 Jelly, Jams, Preserves, and MarmaladeIncludes all jelly, jams, preserves, and marmalade. Onetablespoon of jelly weighs 19 g, and one tablespoon ofjam weighs 21 g.
Description of Foods in Table Set 2: QuantitiesConsumed in A day
2.001 Total Yeast BreadIncludes all foods included below in Total White Breadand Total Whole Grain and “Wheat” Bread. Does not
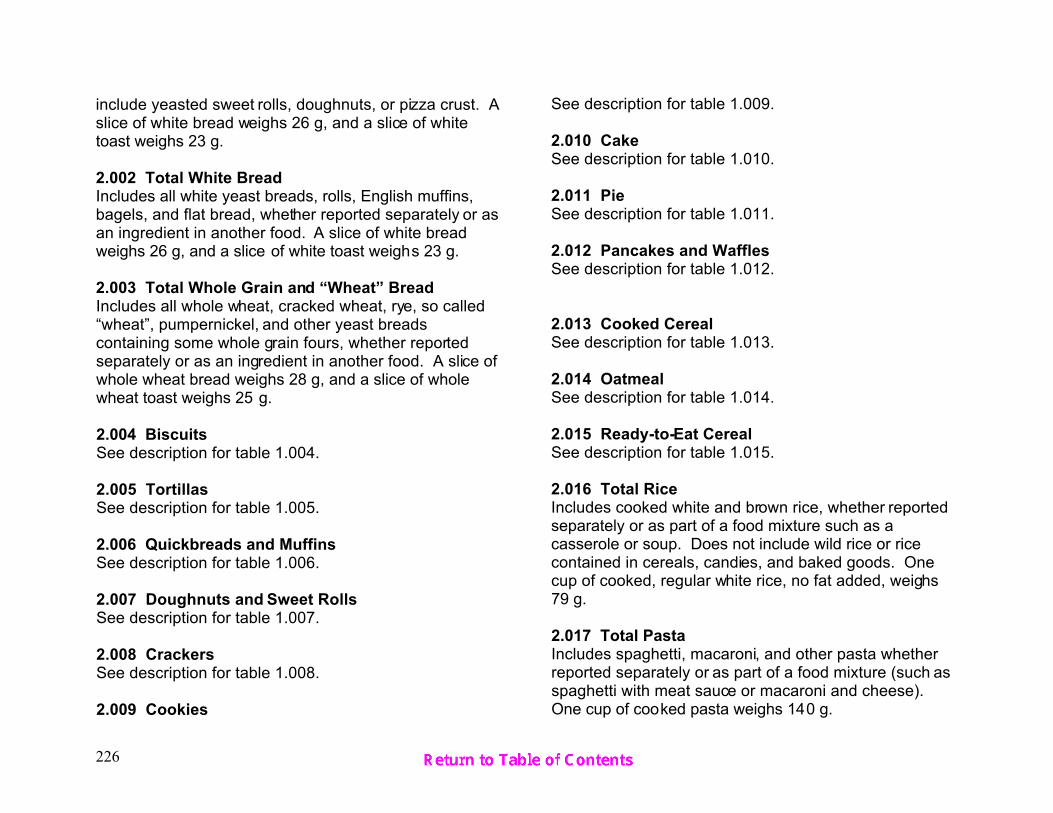
226
include yeasted sweet rolls, doughnuts, or pizza crust. Aslice of white bread weighs 26 g, and a slice of whitetoast weighs 23 g.
2.002 Total White BreadIncludes all white yeast breads, rolls, English muffins,bagels, and flat bread, whether reported separately or asan ingredient in another food. A slice of white breadweighs 26 g, and a slice of white toast weighs 23 g.
2.003 Total Whole Grain and “Wheat” BreadIncludes all whole wheat, cracked wheat, rye, so called“wheat”, pumpernickel, and other yeast breadscontaining some whole grain fours, whether reportedseparately or as an ingredient in another food. A slice ofwhole wheat bread weighs 28 g, and a slice of wholewheat toast weighs 25 g.
2.004 BiscuitsSee description for table 1.004.
2.005 TortillasSee description for table 1.005.
2.006 Quickbreads and MuffinsSee description for table 1.006.
2.007 Doughnuts and Sweet RollsSee description for table 1.007.
2.008 CrackersSee description for table 1.008.
2.009 Cookies
See description for table 1.009.
2.010 CakeSee description for table 1.010.
2.011 PieSee description for table 1.011.
2.012 Pancakes and WafflesSee description for table 1.012.
2.013 Cooked CerealSee description for table 1.013.
2.014 OatmealSee description for table 1.014.
2.015 Ready-to-Eat CerealSee description for table 1.015.
2.016 Total RiceIncludes cooked white and brown rice, whether reportedseparately or as part of a food mixture such as acasserole or soup. Does not include wild rice or ricecontained in cereals, candies, and baked goods. Onecup of cooked, regular white rice, no fat added, weighs79 g.
2.017 Total PastaIncludes spaghetti, macaroni, and other pasta whetherreported separately or as part of a food mixture (such asspaghetti with meat sauce or macaroni and cheese). One cup of cooked pasta weighs 140 g.
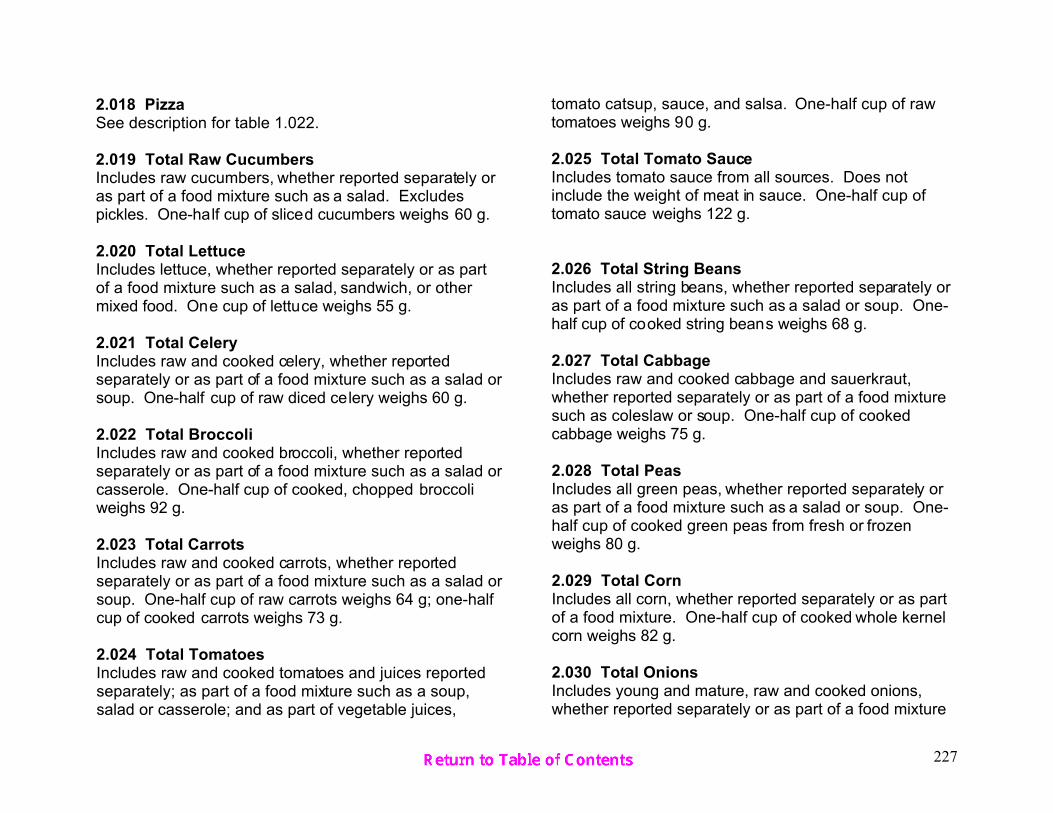
227
2.018 PizzaSee description for table 1.022.
2.019 Total Raw CucumbersIncludes raw cucumbers, whether reported separately oras part of a food mixture such as a salad. Excludespickles. One-half cup of sliced cucumbers weighs 60 g.
2.020 Total LettuceIncludes lettuce, whether reported separately or as partof a food mixture such as a salad, sandwich, or othermixed food. One cup of lettuce weighs 55 g.
2.021 Total CeleryIncludes raw and cooked celery, whether reportedseparately or as part of a food mixture such as a salad orsoup. One-half cup of raw diced celery weighs 60 g.
2.022 Total BroccoliIncludes raw and cooked broccoli, whether reportedseparately or as part of a food mixture such as a salad orcasserole. One-half cup of cooked, chopped broccoliweighs 92 g.
2.023 Total CarrotsIncludes raw and cooked carrots, whether reportedseparately or as part of a food mixture such as a salad orsoup. One-half cup of raw carrots weighs 64 g; one-halfcup of cooked carrots weighs 73 g. 2.024 Total TomatoesIncludes raw and cooked tomatoes and juices reportedseparately; as part of a food mixture such as a soup,salad or casserole; and as part of vegetable juices,
tomato catsup, sauce, and salsa. One-half cup of rawtomatoes weighs 90 g.
2.025 Total Tomato SauceIncludes tomato sauce from all sources. Does notinclude the weight of meat in sauce. One-half cup oftomato sauce weighs 122 g.
2.026 Total String BeansIncludes all string beans, whether reported separately oras part of a food mixture such as a salad or soup. One-half cup of cooked string beans weighs 68 g.
2.027 Total CabbageIncludes raw and cooked cabbage and sauerkraut,whether reported separately or as part of a food mixturesuch as coleslaw or soup. One-half cup of cookedcabbage weighs 75 g.
2.028 Total PeasIncludes all green peas, whether reported separately oras part of a food mixture such as a salad or soup. One-half cup of cooked green peas from fresh or frozenweighs 80 g.
2.029 Total CornIncludes all corn, whether reported separately or as partof a food mixture. One-half cup of cooked whole kernelcorn weighs 82 g.
2.030 Total OnionsIncludes young and mature, raw and cooked onions,whether reported separately or as part of a food mixture

228
such as a sandwich, salad, or soup. One-half cup of rawonions weighs 80 g, and one-half cup of cooked onionsweighs 105 g.
2.031 Total PeppersIncludes raw and cooked hot and sweet peppers,whether reported separately or as part of a food mixturesuch as a salad or soup. One-half cup of chopped rawpeppers weighs 74 g; one-half cup of cooked peppersweighs 68 g.
2.032 Total White PotatoesIncludes cooked white potatoes, whether reportedseparately or as part of a food mixture such as a salad orsoup. One-half cup of boiled potatoes weighs 78 g.
2.033 Total Dried Beans and PeasIncludes cooked dried beans and peas, whether reportedseparately or as part of a food mixture such as a salad orsoup. One-half cup of cooked kidney beans without fatweighs 86 g; one-half cup cooked white beans with fatweighs 90 g.
2.034 Total OrangesIncludes all oranges and orange juice, whether reportedseparately or as part of a food mixture such as a salad ormarmalade. One medium raw orange weighs 131 g.
2.035 Total Orange JuiceIncludes all raw, canned and frozen orange juice,reported separately or as part of a food mixture. Six fluidounces of orange juice weighs 187 g.
2.036 Total Grapefruit
Includes all grapefruit and grapefruit juice, whetherreported separately or as part of a food mixture such asa salad. One-half of a medium raw grapefruit weighs128 g, and 6 fluid ounces of unsweetened grapefruit juiceweighs 185 g.
2.037 Total LemonsIncludes all lemons and all fresh, bottled, and frozenlemon juice reported separately or as part of a foodmixture. One fluid ounce of lemon juice weighs 30 g.
2.038 Total Lemon JuiceIncludes all fresh, bottled and frozen lemon juice,reported separately or as part of a food mixture. Onefluid ounce of lemon juice weighs 30 g.
2.039 Total ApplesIncludes all apples, raw, cooked, and dried, and applejuices whether reported separately or as part of a foodmixture such as a salad or pie. One medium raw appleweighs 138 g, and one-half cup of applesauce weighs128 g.
2.040 Total Apple JuiceIncludes all apple juice and cider reported separately oras part of a juice blend or other food mixture. Six fluidounces of apple juice weighs 186 g.
2.041 Total PeachesIncludes all peaches, raw, cooked, dried, and in nectar,whether reported separately or as part of a food mixturesuch as a pie or preserves. One medium raw peachweighs 98 g.

229
2.042 Total BananasIncludes all bananas, raw and cooked, whether reportedseparately or as part of a food mixture such as a bread,pie, or fruit salad. One medium raw banana weighs 118g.
2.043 Total StrawberriesIncludes all strawberries, whether reported separately oras part of a food mixture such as a salad, pie, ice creamor preserves. One-half cup of sliced raw strawberriesweighs 83 g.
2.044 Total GrapesIncludes all grapes, raisins, and grape juice whetherreported separately or as part of a food mixture such asa salad or preserves. One-half cup of seedless grapesweighs 80 g.
2.045 Total MilkIncludes all cows’ milk reported separately or as aningredient in another food including all milk in ice creams,pudding, yogurt, creams, and processed foods exceptcheese and margarine. Also includes reconstitutedweight of dried and evaporated milk. One cup of fluidwhole milk weighs 244 g.
2.046 Fluid Milk Consumed with CerealSee description for table 1.050
2.047 Total Cheese Other than Cream or CottageIncludes all cheeses, other than cream or cottage, whichare reported separately or as part of a sandwich or othermixed food. Excludes cream cheese or cottage cheese.One and a half ounces of cheese weighs 43 g.
2.048 Total Cottage CheeseIncludes all cottage cheese, whether reported separatelyor as an ingredient in a mixed food. One-half cup ofcottage cheese weighs 105 g.
2.049 Ice Cream and Ice MilkSee description for table 1.058.
2.050 Total BeefIncludes all beef, whether reported separately or as partof a sandwich or other mixed food (weight of otheringredients not included). Excludes veal, organ meats,frankfurters and luncheon meat. One ounce of cookedbeef weighs 28 g.
2.051 Total PorkIncludes all pork, whether reported separately or as partof a sandwich or other mixed food (weight of otheringredients not included). Excludes organ meats,frankfurters and luncheon meats, and sausages madefrom a mixture of pork and some other meat. One ounceof cooked pork weighs 28 g.
2.052 Total BaconIncludes all bacon (except “Canadian bacon”), whetherreported separately or as part of a sandwich or othermixed food. One thin strip of cooked bacon weighs 5 g.
2.053 Pork Breakfast SausageSee description for table 1.065.
2.054 Total Frankfurters and Luncheon MeatsIncludes all frankfurters, luncheon meats whetherreported separately or as part of a sandwich or other

230
food mixture (weight of other ingredients not included).One frankfurter weighs 57 g, and one ounce of luncheonmeat weighs 28 g.
2.055 Total FinfishIncludes all finf ish (fresh, frozen, canned, dried, and raw)whether reported separately or as part of a sandwich orother mixed food (weight of other ingredients notincluded). One ounce of cooked fish weighs 28 g.
2.056 Canned TunaSee description for table 1.067.
2.057 Total Chicken and TurkeySee description for table 1.069.
2.058 Total EggsIncludes all eggs, whether reported separately or as partof bread, mayonnaise, or other multi-ingredient food ormixture. One large boiled egg weighs 50 g.
2.059 Total Peanut ButterIncludes all peanut butter, whether reported separately oras part of a sandwich, cookie, or other mixed food. Onetablespoon of peanut butter weighs 16 g.
2.060 CoffeeSee description for table 1.076.
2.061 Coffee, With CaffeineSee description for table 1.077.
2.062 Coffee, DecaffeinatedSee description for table 1.078.
2.063 TeaSee description for table 1.079.
2.064 Soft DrinksSee description for table 1.080.
2.065 Soft Drinks, Not Diet, With CaffeineSee description for table 1.081.
2.066 Soft Drinks, Not Diet, Caffeine-FreeSee description for table 1.082.
2.067 Soft Drinks, Diet, With CaffeineSee description for table 1.083.
2.068 Soft Drinks, Diet, Caffeine-FreeSee description for table 1.084.
2.069 Fruit DrinksSee description for table 1.085.
2.070 BeerSee description for table 1.086.
2.071 Total WineIncludes all wine, whether reported separately or as partof a wine beverage. Also includes wine used in foodpreparation (the alcohol content of wines is reducedwhen heated). One 3 ½-fluid-ounce glass of wine weighs103 g.
2.072 SoupsSee description for table 1.088.
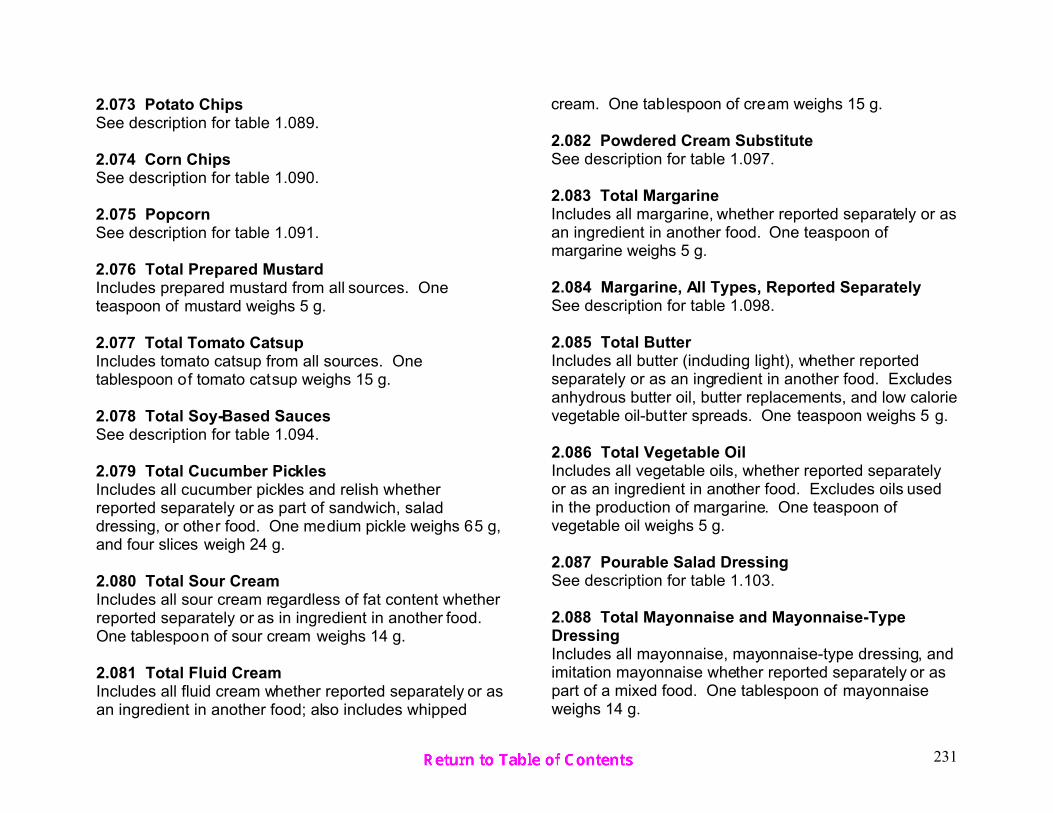
231
2.073 Potato ChipsSee description for table 1.089.
2.074 Corn ChipsSee description for table 1.090.
2.075 PopcornSee description for table 1.091.
2.076 Total Prepared MustardIncludes prepared mustard from all sources. Oneteaspoon of mustard weighs 5 g.
2.077 Total Tomato CatsupIncludes tomato catsup from all sources. Onetablespoon of tomato catsup weighs 15 g.
2.078 Total Soy-Based SaucesSee description for table 1.094.
2.079 Total Cucumber PicklesIncludes all cucumber pickles and relish whetherreported separately or as part of sandwich, saladdressing, or other food. One medium pickle weighs 65 g,and four slices weigh 24 g.
2.080 Total Sour CreamIncludes all sour cream regardless of fat content whetherreported separately or as in ingredient in another food.One tablespoon of sour cream weighs 14 g.
2.081 Total Fluid CreamIncludes all fluid cream whether reported separately or asan ingredient in another food; also includes whipped
cream. One tablespoon of cream weighs 15 g.
2.082 Powdered Cream SubstituteSee description for table 1.097.
2.083 Total MargarineIncludes all margarine, whether reported separately or asan ingredient in another food. One teaspoon ofmargarine weighs 5 g.
2.084 Margarine, All Types, Reported SeparatelySee description for table 1.098.
2.085 Total ButterIncludes all butter (including light), whether reportedseparately or as an ingredient in another food. Excludesanhydrous butter oil, butter replacements, and low calorievegetable oil-butter spreads. One teaspoon weighs 5 g.
2.086 Total Vegetable OilIncludes all vegetable oils, whether reported separatelyor as an ingredient in another food. Excludes oils usedin the production of margarine. One teaspoon ofvegetable oil weighs 5 g.
2.087 Pourable Salad DressingSee description for table 1.103.
2.088 Total Mayonnaise and Mayonnaise-TypeDressingIncludes all mayonnaise, mayonnaise-type dressing, andimitation mayonnaise whether reported separately or aspart of a mixed food. One tablespoon of mayonnaiseweighs 14 g.

232
2.089 GravySee description for table 1.106.
2.090 SyrupSee description for table 1.107.
2.091 Total SugarIncludes all white, brown, confectioner’s and raw sugar,whether reported separately or as an ingredient inanother food. One teaspoon of white sugar weighs 4 g.
2.092 Total HoneyIncludes all honey whether reported separately or as aningredient in another food. One tablespoon of honeyweighs 21 g.
2.093 Candy Containing ChocolateSee description for table 1.109.
2.094 Candy Not Containing ChocolateSee description for table 1.110.
2.095 Jelly, Jams, Preserves, and MarmaladeSee description for table 1.111.
2.096 Total Artificial SweetenerIncludes all artificial sweeteners, whether reportedseparately or contained in another food such as dietsoda. One teaspoon of powdered sweetener weighs 3 g.

233
APPENDIX A: STATISTICAL NOTES
1. Sample size is the number of individuals in the sample for the particular age-sex category; sampling weights were notapplied.
2. Percentage of persons using each food is a weighted estimate of the percentage of persons in the population whoused the food at least once in 2 days.
3. Eating occasions are delineated by the time the eating occasion began rather than the name of the eating occasion. If more than one mention of a food was made for an eating occasion (such as milk as a beverage and milk on cereal),the amounts were summed and the total was the amount consumed for that eating occasion.
4. Mean quantity consumed per eating occasion =
where U is the set of individuals using the food and wi is the sampling weight for the ith individual.
5. Percentiles of quantities consumed per eating occasion were based on a weighted array of mean quantitiesconsumed per occasion for each user of the food.

234
6. Mean quantities consumed in a day =
where U is the set of individuals using the food and wi is the sampling weight for the ith individual and
the value on a single day = total quantity consumed on that day if consumedon only one day, or total quantity consumed on arandomly selected consumption day if consumedon more than one day.
7. Percentiles of quantities consumed in a day were based on a weighted array of mean quantities consumed per day foreach user of the food.

235
APPENDIX B. MEAN QUANTITIES CONSUMED PER PERSON PER DAY
The tables in this appendix provide estimates of mean quantities of foods consumed per person per day for allindividuals, that is, consumers and non-consumers, over both days. These means reflect both the amount andfrequency of consumption and represent the population’s usual daily intake of the tabulated foods during the 3-yearperiod, 1994-96.
Zeros in table represent true zeroes; values that are greater than zero but which round to 0 or 0.0 are noted with a poundsign (#).
Mean quantities consumed per person per day =
where wj is the sampling weight for the jth individual over all individuals, not just users of the food.

236
Appendix Table B. Mean quantities consumed per person per day)))))))))))))))))))))))))))))))))))))))))))))))))))))))))))))))))))))))))))))))))))))))))))))))))))))))))))))))))))))))))))))))))))
* * Age (years) and sex* *)))))))))))))))))))))))))))))))))))))))))))))))))))))))))))))))))))))))))))))))))
* * 2-5 6-11 12-19 20-39 40-59 60 and older* *)))))) )))))) ))))))))))))))) ))))))))))))))) ))))))))))))))) )))))))))))))))
Food (corresponding table) * All individuals * Males Males* age 2 and over * and and Males Females Males Females Males Females Males Females* *females females
)))))))))))))))))))))))))))))))))))))))))))))))))))))))))))))))))))))))))))))))))))))))))))))))))))))))))))))))))))))))))))))))))))
Number in sample 14,262 2,109 1,432 696 702 1,543 1,449 1,663 1,694 1,545 1,429
Grain-based products ))))))))))))))))))))))))))))))))))))))))))))g))))))))))))))))))))))))))))))))))))))))))))))
White Bread (1.001) 26 20 25 31 22 36 20 31 21 29 20 Whole Grain and "Wheat" Bread (1.002) 11 7 7 7 6 12 8 15 12 18 16 Rolls (1.003) 20 10 18 32 17 37 17 22 14 14 9 Biscuits (1.004, 2.004) 4 2 3 5 3 5 3 6 4 5 3 Tortillas (1.005, 2.005) 7 3 5 12 7 13 8 6 4 1 1 Quickbreads and Muffins (1.006, 2.006) 6 3 4 8 5 4 5 9 6 9 8 Doughnuts and Sweet Rolls (1.007, 2.007) 6 4 5 10 6 7 4 7 5 5 3 Crackers (1.008, 2.008) 3 3 3 3 3 2 3 3 2 4 3 Cookies (1.009, 2.009) 8 11 12 11 9 8 7 9 7 9 7 Cake (1.010, 2.010) 9 6 9 9 8 9 8 11 8 10 9 Pie (1.011, 2.011) 7 1 4 7 4 5 6 11 8 16 11 Pancakes and Waffles (1.012, 2.012) 5 6 9 7 3 5 3 5 3 6 3 Cooked Cereal (1.013, 2.013) 16 21 14 10 9 10 9 19 15 37 29 Oatmeal (1.014, 2.014) 10 14 9 5 * 4 6 6 13 9 24 18 Ready-to-Eat Cereal (1.015, 2.015) 16 19 25 25 16 14 13 14 11 18 13 Corn Flakes (1.016) 2 2 3 4 2 3 1 2 1 3 2 Toasted Oat Rings (1.017) 2 4 3 3 2 1 1 1 1 1 1 Rice (1.018) 31 18 20 38 29 45 32 38 27 25 18 Pasta (1.019) 35 29 33 40 36 49 34 42 29 28 22 Macaroni and Cheese (1.020) 11 16 15 17 15 13 10 10 7 9 7 Spaghetti with Tomato Sauce (1.021) 19 23 20 30 22 29 16 16 11 12 9 Pizza (1.022, 2.018) 19 12 22 49 24 34 16 15 11 5 3 Total Yeast Bread (2.001) 63 40 54 75 52 88 52 76 57 69 52 Total White Bread (2.002) 50 32 45 66 44 72 42 58 42 49 35 Total Whole Grain and "Wheat" Bread (2.003) 13 7 8 10 8 15 11 18 15 20 17 Total Rice (2.016) 31 19 21 39 30 45 33 39 27 26 19 Total Pasta (2.017) 41 35 39 48 43 57 39 47 32 32 26 )))))))))))))))))))))))))))))))))))))))))))))))))))))))))))))))))))))))))))))))))))))))))))))))))))))))))))))))))))))))))))))))))))
* Indicates a statistic that is potentially unreliable because of small sample size or large coefficient of variation.Source: USDA's Continuing Survey of Food Intakes by Individuals, 1994-96, 2 days.
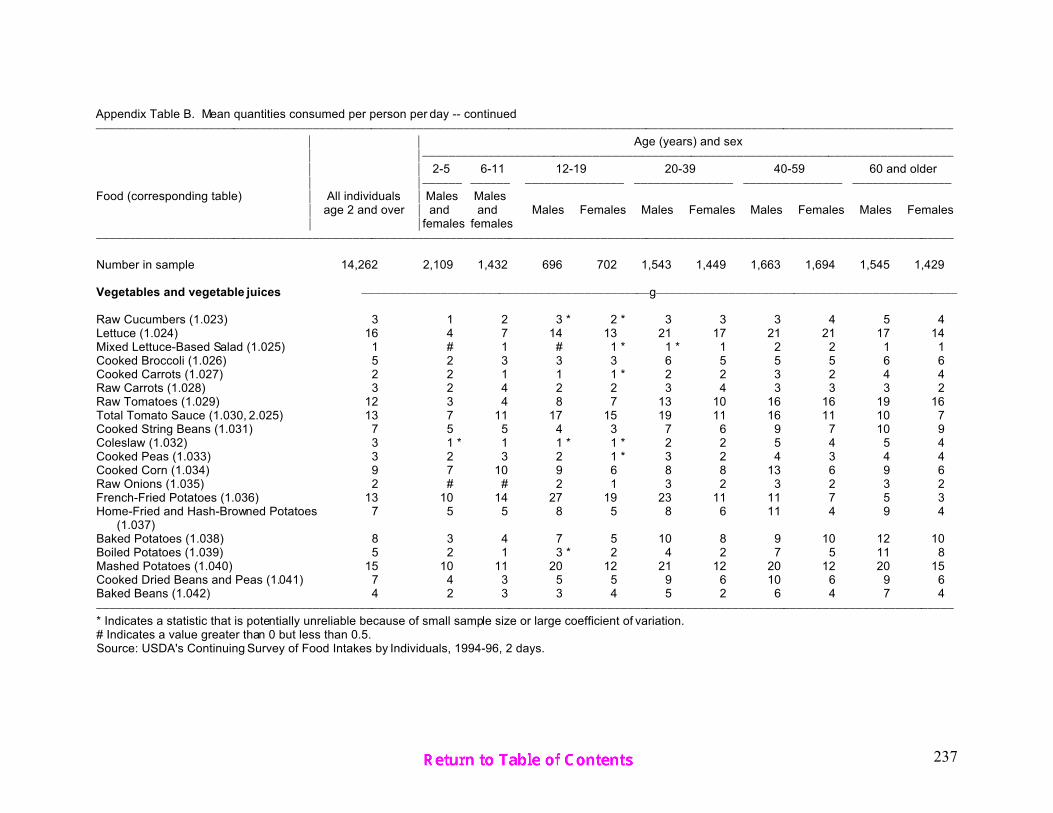
237
Appendix Table B. Mean quantities consumed per person per day -- continued)))))))))))))))))))))))))))))))))))))))))))))))))))))))))))))))))))))))))))))))))))))))))))))))))))))))))))))))))))))))))))))))))))
* * Age (years) and sex* *)))))))))))))))))))))))))))))))))))))))))))))))))))))))))))))))))))))))))))))))))
* * 2-5 6-11 12-19 20-39 40-59 60 and older* *)))))) )))))) ))))))))))))))) ))))))))))))))) ))))))))))))))) )))))))))))))))
Food (corresponding table) * All individuals * Males Males* age 2 and over * and and Males Females Males Females Males Females Males Females* *females females
)))))))))))))))))))))))))))))))))))))))))))))))))))))))))))))))))))))))))))))))))))))))))))))))))))))))))))))))))))))))))))))))))))
Number in sample 14,262 2,109 1,432 696 702 1,543 1,449 1,663 1,694 1,545 1,429
Vegetables and vegetable juices ))))))))))))))))))))))))))))))))))))))))))))g))))))))))))))))))))))))))))))))))))))))))))))
Raw Cucumbers (1.023) 3 1 2 3 * 2 * 3 3 3 4 5 4 Lettuce (1.024) 16 4 7 14 13 21 17 21 21 17 14 Mixed Lettuce-Based Salad (1.025) 1 # 1 # 1 * 1 * 1 2 2 1 1 Cooked Broccoli (1.026) 5 2 3 3 3 6 5 5 5 6 6 Cooked Carrots (1.027) 2 2 1 1 1 * 2 2 3 2 4 4 Raw Carrots (1.028) 3 2 4 2 2 3 4 3 3 3 2 Raw Tomatoes (1.029) 12 3 4 8 7 13 10 16 16 19 16 Total Tomato Sauce (1.030, 2.025) 13 7 11 17 15 19 11 16 11 10 7 Cooked String Beans (1.031) 7 5 5 4 3 7 6 9 7 10 9 Coleslaw (1.032) 3 1 * 1 1 * 1 * 2 2 5 4 5 4 Cooked Peas (1.033) 3 2 3 2 1 * 3 2 4 3 4 4 Cooked Corn (1.034) 9 7 10 9 6 8 8 13 6 9 6 Raw Onions (1.035) 2 # # 2 1 3 2 3 2 3 2 French-Fried Potatoes (1.036) 13 10 14 27 19 23 11 11 7 5 3 Home-Fried and Hash-Browned Potatoes 7 5 5 8 5 8 6 11 4 9 4 (1.037) Baked Potatoes (1.038) 8 3 4 7 5 10 8 9 10 12 10 Boiled Potatoes (1.039) 5 2 1 3 * 2 4 2 7 5 11 8 Mashed Potatoes (1.040) 15 10 11 20 12 21 12 20 12 20 15 Cooked Dried Beans and Peas (1.041) 7 4 3 5 5 9 6 10 6 9 6 Baked Beans (1.042) 4 2 3 3 4 5 2 6 4 7 4 )))))))))))))))))))))))))))))))))))))))))))))))))))))))))))))))))))))))))))))))))))))))))))))))))))))))))))))))))))))))))))))))))))
* Indicates a statistic that is potentially unreliable because of small sample size or large coefficient of variation.# Indicates a value greater than 0 but less than 0.5.Source: USDA's Continuing Survey of Food Intakes by Individuals, 1994-96, 2 days.

238
Appendix Table B. Mean quantities consumed per person per day -- continued)))))))))))))))))))))))))))))))))))))))))))))))))))))))))))))))))))))))))))))))))))))))))))))))))))))))))))))))))))))))))))))))))))
* * Age (years) and sex* *)))))))))))))))))))))))))))))))))))))))))))))))))))))))))))))))))))))))))))))))))
* * 2-5 6-11 12-19 20-39 40-59 60 and older* *)))))) )))))) ))))))))))))))) ))))))))))))))) ))))))))))))))) )))))))))))))))
Food (corresponding table) * All individuals * Males Males* age 2 and over * and and Males Females Males Females Males Females Males Females* *females females
)))))))))))))))))))))))))))))))))))))))))))))))))))))))))))))))))))))))))))))))))))))))))))))))))))))))))))))))))))))))))))))))))))
Number in sample 14,262 2,109 1,432 696 702 1,543 1,449 1,663 1,694 1,545 1,429
Vegetables and vegetable juices - continued ))))))))))))))))))))))))))))))))))))))))))))g))))))))))))))))))))))))))))))))))))))))))))))
Total Raw Cucumbers (2.019) 3 1 2 3 * 2 * 4 3 4 4 5 4 Total Lettuce (2.020) 16 4 7 14 13 21 17 21 21 17 15 Total Celery (2.021) 4 1 2 3 3 4 4 5 4 5 4 Total Broccoli (2.022) 6 3 4 3 4 8 7 7 7 7 8 Total Carrots (2.023) 10 5 7 7 6 10 11 12 10 14 12 Total Tomatoes (2.024) 45 25 31 52 39 61 42 56 43 49 39 Total String Beans (2.026) 8 5 5 4 3 8 7 10 8 12 10 Total Cabbage (2.027) 5 2 2 3 * 2 6 3 8 7 10 8 Total Peas (2.028) 5 3 4 4 2 5 4 7 5 7 6 Total Corn (2.029) 10 8 11 10 7 10 11 16 8 12 8 Total Onions (2.030) 12 4 6 13 9 18 12 16 12 13 10 Total Peppers (2.031) 4 1 2 3 2 8 5 6 5 4 3 Total White Potatoes (2.032) 51 30 36 68 45 71 42 63 43 61 44 Total Dried Beans and Peas (2.033) 17 8 10 19 15 23 15 24 15 21 13 )))))))))))))))))))))))))))))))))))))))))))))))))))))))))))))))))))))))))))))))))))))))))))))))))))))))))))))))))))))))))))))))))))
* Indicates a statistic that is potentially unreliable because of small sample size or large coefficient of variation.Source: USDA's Continuing Survey of Food Intakes by Individuals, 1994-96, 2 days.

239
Appendix Table B. Mean quantities consumed per person per day -- continued)))))))))))))))))))))))))))))))))))))))))))))))))))))))))))))))))))))))))))))))))))))))))))))))))))))))))))))))))))))))))))))))))))
* * Age (years) and sex* *)))))))))))))))))))))))))))))))))))))))))))))))))))))))))))))))))))))))))))))))))
* * 2-5 6-11 12-19 20-39 40-59 60 and older* *)))))) )))))) ))))))))))))))) ))))))))))))))) ))))))))))))))) )))))))))))))))
Food (corresponding table) * All individuals * Males Males* age 2 and over * and and Males Females Males Females Males Females Males Females* *females females
)))))))))))))))))))))))))))))))))))))))))))))))))))))))))))))))))))))))))))))))))))))))))))))))))))))))))))))))))))))))))))))))))))
Number in sample 14,262 2,109 1,432 696 702 1,543 1,449 1,663 1,694 1,545 1,429
Fruits and fruit juices ))))))))))))))))))))))))))))))))))))))))))))g))))))))))))))))))))))))))))))))))))))))))))))
Raw Oranges (1.043) 7 7 7 5 4 7 5 7 7 9 10 Orange Juice (1.044) 55 50 54 78 66 66 47 51 46 54 50 Raw Apples (1.045) 14 19 18 11 10 13 11 14 14 19 14 Applesauce and Cooked Apples (1.046) 4 7 7 2 * 3 * 1 2 3 3 6 7 Apple Juice (1.047) 14 53 19 16 21 10 10 11 5 8 7 Raw Bananas (1.048) 16 15 11 9 6 13 13 20 18 29 23 Total Oranges (2.034) 53 49 53 74 59 63 45 51 44 54 51 Total Orange Juice (2.035) 42 37 42 64 51 51 36 40 32 41 37 Total Grapefruit (2.036) 6 1 1 * 5 * 4 * 4 * 4 9 8 12 12 Total Lemons (2.037) 2 1 1 3 3 3 2 3 2 2 1 Total Lemon Juice (2.038) 2 1 1 3 2 2 2 2 2 2 1 Total Apples (2.039) 35 88 49 33 38 28 27 32 25 37 31 Total Apple Juice (2.040) 17 62 24 20 25 13 13 14 6 10 9 Total Peaches (2.041) 4 3 4 3 4 2 3 4 4 8 7 Total Bananas (2.042) 16 16 12 10 6 13 13 21 19 30 24 Total Strawberries (2.043) 3 2 3 2 3 2 4 3 4 4 4 Total Grapes (2.044) 12 27 17 9 13 10 9 11 9 12 10 )))))))))))))))))))))))))))))))))))))))))))))))))))))))))))))))))))))))))))))))))))))))))))))))))))))))))))))))))))))))))))))))))))
* Indicates a statistic that is potentially unreliable because of small sample size or large coefficient of variation.Source: USDA's Continuing Survey of Food Intakes by Individuals, 1994-96, 2 days.
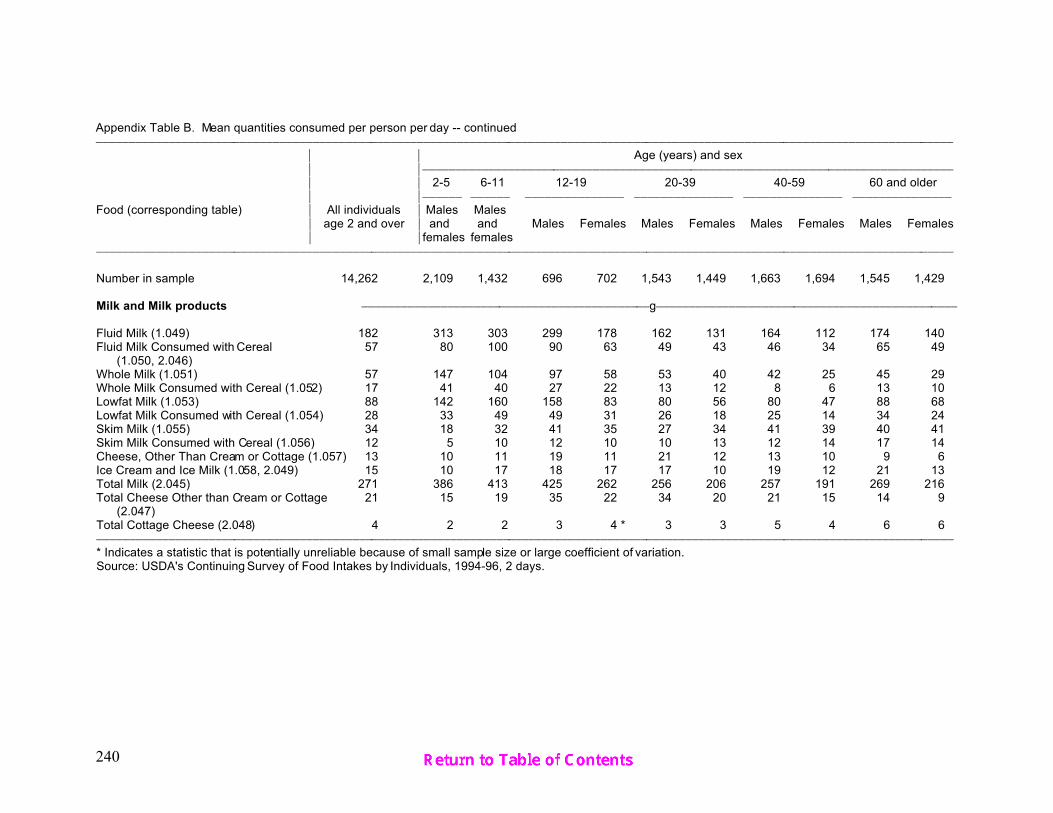
240
Appendix Table B. Mean quantities consumed per person per day -- continued)))))))))))))))))))))))))))))))))))))))))))))))))))))))))))))))))))))))))))))))))))))))))))))))))))))))))))))))))))))))))))))))))))
* * Age (years) and sex* *)))))))))))))))))))))))))))))))))))))))))))))))))))))))))))))))))))))))))))))))))
* * 2-5 6-11 12-19 20-39 40-59 60 and older* *)))))) )))))) ))))))))))))))) ))))))))))))))) ))))))))))))))) )))))))))))))))
Food (corresponding table) * All individuals * Males Males* age 2 and over * and and Males Females Males Females Males Females Males Females* *females females
)))))))))))))))))))))))))))))))))))))))))))))))))))))))))))))))))))))))))))))))))))))))))))))))))))))))))))))))))))))))))))))))))))
Number in sample 14,262 2,109 1,432 696 702 1,543 1,449 1,663 1,694 1,545 1,429
Milk and Milk products ))))))))))))))))))))))))))))))))))))))))))))g))))))))))))))))))))))))))))))))))))))))))))))
Fluid Milk (1.049) 182 313 303 299 178 162 131 164 112 174 140 Fluid Milk Consumed with Cereal 57 80 100 90 63 49 43 46 34 65 49 (1.050, 2.046)Whole Milk (1.051) 57 147 104 97 58 53 40 42 25 45 29 Whole Milk Consumed with Cereal (1.052) 17 41 40 27 22 13 12 8 6 13 10 Lowfat Milk (1.053) 88 142 160 158 83 80 56 80 47 88 68 Lowfat Milk Consumed with Cereal (1.054) 28 33 49 49 31 26 18 25 14 34 24 Skim Milk (1.055) 34 18 32 41 35 27 34 41 39 40 41 Skim Milk Consumed with Cereal (1.056) 12 5 10 12 10 10 13 12 14 17 14 Cheese, Other Than Cream or Cottage (1.057) 13 10 11 19 11 21 12 13 10 9 6 Ice Cream and Ice Milk (1.058, 2.049) 15 10 17 18 17 17 10 19 12 21 13 Total Milk (2.045) 271 386 413 425 262 256 206 257 191 269 216 Total Cheese Other than Cream or Cottage 21 15 19 35 22 34 20 21 15 14 9 (2.047) Total Cottage Cheese (2.048) 4 2 2 3 4 * 3 3 5 4 6 6 )))))))))))))))))))))))))))))))))))))))))))))))))))))))))))))))))))))))))))))))))))))))))))))))))))))))))))))))))))))))))))))))))))
* Indicates a statistic that is potentially unreliable because of small sample size or large coefficient of variation.Source: USDA's Continuing Survey of Food Intakes by Individuals, 1994-96, 2 days.
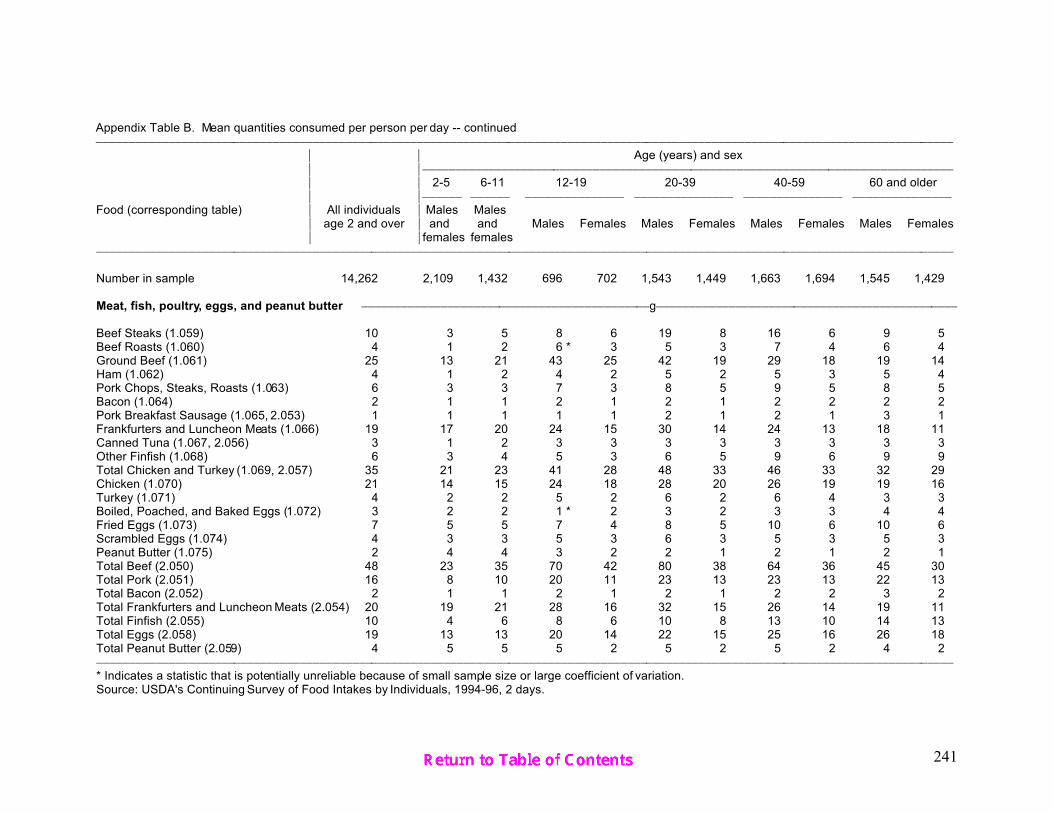
241
Appendix Table B. Mean quantities consumed per person per day -- continued)))))))))))))))))))))))))))))))))))))))))))))))))))))))))))))))))))))))))))))))))))))))))))))))))))))))))))))))))))))))))))))))))))
* * Age (years) and sex* *)))))))))))))))))))))))))))))))))))))))))))))))))))))))))))))))))))))))))))))))))
* * 2-5 6-11 12-19 20-39 40-59 60 and older* *)))))) )))))) ))))))))))))))) ))))))))))))))) ))))))))))))))) )))))))))))))))
Food (corresponding table) * All individuals * Males Males* age 2 and over * and and Males Females Males Females Males Females Males Females* *females females
)))))))))))))))))))))))))))))))))))))))))))))))))))))))))))))))))))))))))))))))))))))))))))))))))))))))))))))))))))))))))))))))))))
Number in sample 14,262 2,109 1,432 696 702 1,543 1,449 1,663 1,694 1,545 1,429
Meat, fish, poultry, eggs, and peanut butter ))))))))))))))))))))))))))))))))))))))))))))g))))))))))))))))))))))))))))))))))))))))))))))
Beef Steaks (1.059) 10 3 5 8 6 19 8 16 6 9 5 Beef Roasts (1.060) 4 1 2 6 * 3 5 3 7 4 6 4 Ground Beef (1.061) 25 13 21 43 25 42 19 29 18 19 14 Ham (1.062) 4 1 2 4 2 5 2 5 3 5 4 Pork Chops, Steaks, Roasts (1.063) 6 3 3 7 3 8 5 9 5 8 5 Bacon (1.064) 2 1 1 2 1 2 1 2 2 2 2 Pork Breakfast Sausage (1.065, 2.053) 1 1 1 1 1 2 1 2 1 3 1 Frankfurters and Luncheon Meats (1.066) 19 17 20 24 15 30 14 24 13 18 11 Canned Tuna (1.067, 2.056) 3 1 2 3 3 3 3 3 3 3 3 Other Finfish (1.068) 6 3 4 5 3 6 5 9 6 9 9 Total Chicken and Turkey (1.069, 2.057) 35 21 23 41 28 48 33 46 33 32 29 Chicken (1.070) 21 14 15 24 18 28 20 26 19 19 16 Turkey (1.071) 4 2 2 5 2 6 2 6 4 3 3 Boiled, Poached, and Baked Eggs (1.072) 3 2 2 1 * 2 3 2 3 3 4 4 Fried Eggs (1.073) 7 5 5 7 4 8 5 10 6 10 6 Scrambled Eggs (1.074) 4 3 3 5 3 6 3 5 3 5 3 Peanut Butter (1.075) 2 4 4 3 2 2 1 2 1 2 1 Total Beef (2.050) 48 23 35 70 42 80 38 64 36 45 30 Total Pork (2.051) 16 8 10 20 11 23 13 23 13 22 13 Total Bacon (2.052) 2 1 1 2 1 2 1 2 2 3 2 Total Frankfurters and Luncheon Meats (2.054) 20 19 21 28 16 32 15 26 14 19 11 Total Finfish (2.055) 10 4 6 8 6 10 8 13 10 14 13 Total Eggs (2.058) 19 13 13 20 14 22 15 25 16 26 18 Total Peanut Butter (2.059) 4 5 5 5 2 5 2 5 2 4 2 )))))))))))))))))))))))))))))))))))))))))))))))))))))))))))))))))))))))))))))))))))))))))))))))))))))))))))))))))))))))))))))))))))
* Indicates a statistic that is potentially unreliable because of small sample size or large coefficient of variation.Source: USDA's Continuing Survey of Food Intakes by Individuals, 1994-96, 2 days.

242
Appendix Table B. Mean quantities consumed per person per day -- continued)))))))))))))))))))))))))))))))))))))))))))))))))))))))))))))))))))))))))))))))))))))))))))))))))))))))))))))))))))))))))))))))))))
* * Age (years) and sex* *)))))))))))))))))))))))))))))))))))))))))))))))))))))))))))))))))))))))))))))))))
* * 2-5 6-11 12-19 20-39 40-59 60 and older* *)))))) )))))) ))))))))))))))) ))))))))))))))) ))))))))))))))) )))))))))))))))
Food (corresponding table) * All individuals * Males Males* age 2 and over * and and Males Females Males Females Males Females Males Females* *females females
)))))))))))))))))))))))))))))))))))))))))))))))))))))))))))))))))))))))))))))))))))))))))))))))))))))))))))))))))))))))))))))))))))
Number in sample 14,262 2,109 1,432 696 702 1,543 1,449 1,663 1,694 1,545 1,429
Other beverages ))))))))))))))))))))))))))))))))))))))))))))g))))))))))))))))))))))))))))))))))))))))))))))
Coffee (1.076, 2.060) 255 # 3 * 17 11 271 221 507 401 449 361 Coffee, with Caffeine (1.077, 2.061) 224 # 2 * 17 10 261 207 458 340 356 280 Coffee, Decaffeinated (1.078, 2.062) 31 # # # 1 * 10 13 49 62 92 81 Tea (1.079, 2.063) 123 20 31 83 73 161 136 163 166 124 146 Soft Drinks (1.080, 2.064) 333 100 203 592 387 555 391 357 283 150 112 Soft Drinks, Not Diet, With Caffeine 193 51 107 440 271 381 208 185 107 60 40 (1.081, 2.065) Soft Drinks, Not Diet, Caffeine-Free 60 39 73 126 77 79 65 57 40 26 23 (1.082, 2.066) Soft Drinks, Diet, With Caffeine 54 5 14 16 30 74 85 76 86 34 25 (1.083, 2.067) Soft Drinks, Diet, Caffeine-Free 26 4 10 10 9 21 34 38 50 31 24 (1.084, 2.068) Fruit Drinks (1.085, 2.069) 87 124 136 194 130 101 73 67 45 41 34 Beer (1.086, 2.070) 78 0 # 40 * 6 * 246 48 160 29 74 7 Wine (1.087) 9 0 0 # 1 * 8 10 15 16 15 11 Total Wine (2.071) 9 # # # 1 * 8 11 15 16 15 11 Soups (1.088, 2.072) 52 37 33 51 40 55 52 58 47 77 66
Chips and popcorn
Potato Chips (1.089, 2.073) 4 3 5 7 4 7 3 4 3 2 1 Corn Chips (1.090, 2.074) 4 3 5 9 8 6 4 3 2 1 1 Popcorn (1.091, 2.075) 2 1 2 2 2 3 2 3 2 2 1 )))))))))))))))))))))))))))))))))))))))))))))))))))))))))))))))))))))))))))))))))))))))))))))))))))))))))))))))))))))))))))))))))))
* Indicates a statistic that is potentially unreliable because of small sample size or large coefficient of variation.# Indicates a value greater than 0 but less than 0.5.Source: USDA's Continuing Survey of Food Intakes by Individuals, 1994-96, 2 days.

243
Appendix Table B. Mean quantities consumed per person per day -- continued)))))))))))))))))))))))))))))))))))))))))))))))))))))))))))))))))))))))))))))))))))))))))))))))))))))))))))))))))))))))))))))))))))
* * Age (years) and sex* *)))))))))))))))))))))))))))))))))))))))))))))))))))))))))))))))))))))))))))))))))
* * 2-5 6-11 12-19 20-39 40-59 60 and older* *)))))) )))))) ))))))))))))))) ))))))))))))))) ))))))))))))))) )))))))))))))))
Food (corresponding table) * All individuals * Males Males* age 2 and over * and and Males Females Males Females Males Females Males Females* *females females
)))))))))))))))))))))))))))))))))))))))))))))))))))))))))))))))))))))))))))))))))))))))))))))))))))))))))))))))))))))))))))))))))))
Number in sample 14,262 2,109 1,432 696 702 1,543 1,449 1,663 1,694 1,545 1,429
Condiments, gravies, and fats ))))))))))))))))))))))))))))))))))))))))))))g))))))))))))))))))))))))))))))))))))))))))))))Prepared Mustard (1.092) 1 # 1 2 1 2 1 2 1 1 # Tomato Catsup (1.093) 3 3 4 8 5 5 2 2 1 1 1 Total Soy-Based Sauces (1.094, 2.078) 1 # # 1 1 2 1 1 1 1 # Cucumber Pickles (1.095) 3 1 3 3 3 4 2 3 2 2 2 Fluid Cream (1.096) 2 # # # # 2 2 3 2 3 2 Powdered Cream Substitute (1.097, 2.082) # # # # # # 1 1 1 # # Margarine, All Types, Reported Separately 2 1 2 2 2 2 2 3 3 4 3 (1.098, 2.084) Margarine, Stick (1.099) 1 # 1 1 1 1 1 1 1 1 1 Margarine, Soft (1.100) 1 1 1 1 1 1 1 2 2 2 1 Margarine, Imitation (1.101) # # # # # # # 1 # 1 1 Butter (1.102) 1 1 1 1 1 2 1 1 1 2 1 Pourable Salad Dressing (1.103, 2.087) 5 1 2 3 3 6 5 7 7 6 4 Mayonnaise (1.104) 2 1 1 3 1 3 2 2 1 1 1 Mayonnaise-Type Dressing (1.105) 1 # 1 1 1 1 # 1 1 # # Gravy (1.106, 2.089) 4 1 3 5 4 * 5 3 6 3 6 3 Total Prepared Mustard (2.076) 1 # 1 2 1 2 1 2 1 1 1 Total Tomato Catsup (2.077) 3 4 4 9 5 6 2 3 1 1 1 Total Soy-Based Sauces (2.078) 1 # # 1 1 2 1 1 1 1 # Total Cucumber Pickles (2.079) 3 1 3 4 4 5 3 5 3 3 3 Total Sour Cream (2.080) 2 1 1 1 2 3 2 2 2 1 1 Total Fluid Cream (2.081) 6 3 5 6 5 8 5 8 6 9 6 Total Margarine (2.083) 6 4 5 7 5 7 5 8 6 9 7 Total Butter (2.085) 2 2 2 3 2 3 2 3 2 3 2 Total Vegetable Oil (2.086) 18 11 15 25 17 25 16 21 16 15 11 Total Mayonnaise and Mayonnaise-Type 5 2 2 6 4 7 4 7 5 5 4 Dressing (2.088) )))))))))))))))))))))))))))))))))))))))))))))))))))))))))))))))))))))))))))))))))))))))))))))))))))))))))))))))))))))))))))))))))))
* Indicates a statistic that is potentially unreliable because of small sample size or large coefficient of variation.# Indicates a value greater than 0 but less than 0.5.Source: USDA's Continuing Survey of Food Intakes by Individuals, 1994-96, 2 days.

244
Appendix Table B. Mean quantities consumed per person per day -- continued)))))))))))))))))))))))))))))))))))))))))))))))))))))))))))))))))))))))))))))))))))))))))))))))))))))))))))))))))))))))))))))))))))
* * Age (years) and sex* *)))))))))))))))))))))))))))))))))))))))))))))))))))))))))))))))))))))))))))))))))
* * 2-5 6-11 12-19 20-39 40-59 60 and older* *)))))) )))))) ))))))))))))))) ))))))))))))))) ))))))))))))))) )))))))))))))))
Food (corresponding table) * All individuals * Males Males* age 2 and over * and and Males Females Males Females Males Females Males Females* *females females
)))))))))))))))))))))))))))))))))))))))))))))))))))))))))))))))))))))))))))))))))))))))))))))))))))))))))))))))))))))))))))))))))))
Number in sample 14,262 2,109 1,432 696 702 1,543 1,449 1,663 1,694 1,545 1,429
Sugars, candies, and jellies ))))))))))))))))))))))))))))))))))))))))))))g))))))))))))))))))))))))))))))))))))))))))))))
Syrup (1.107, 2.090) 3 4 6 6 4 5 * 2 3 2 3 2 Sugar (1.108) 6 2 2 5 4 9 6 8 6 6 4 Candy Containing Chocolate (1.109, 2.093) 4 3 5 7 5 5 4 5 4 3 2 Candy Not Containing Chocolate (1.110, 2.094) 2 4 5 5 4 2 2 2 2 1 1 Jelly, Jams, Preserves, and Marmalade 2 3 3 3 2 2 2 2 2 3 2 (1.111, 2.095) Total Sugar (2.091) 44 39 54 74 50 53 41 44 33 36 29 Total Honey (2.092) 1 # # 1 # 1 1 1 1 1 1 Total Artificial Sweetener (2.096) # # # # # # # 1 1 1 # )))))))))))))))))))))))))))))))))))))))))))))))))))))))))))))))))))))))))))))))))))))))))))))))))))))))))))))))))))))))))))))))))))
* Indicates a statistic that is potentially unreliable because of small sample size or large coefficient of variation.# Indicates a value greater than 0 but less than 0.5.Source: USDA's Continuing Survey of Food Intakes by Individuals, 1994-96, 2 days.
245
APPENDIX C. MINIMUM AND MAXIMUM VALUES OF FOODS REPORTED BY SUBGROUPS FORWHICH PERCENTILES COULD NOT BE ESTIMATED BECAUSE OF TOO FEWREPORTS OVERALL OR TOO MANY REPORTS OF EXACTLY THE SAME MAGNITUDE

246
Appendix Table C. Minimum and maximum quantities of food reported by subgroups for which percentiles could not be estimated because of too few reports overall or too many reports of exactly the same magnitude)))))))))))))))))))))))))))))))))))))))))))))))))))))))))))))))))))))))))))))))))))))))))))))))))))))))))))))))))))))))))))))))))))
Age (years) and sex)))))))))))))))))))))))))))))))))))))))))))))))))))))))))))))))))))))))))))))))))
2-5 6-11 12-19 20-39 40-59 60 and older)))))) )))))) ))))))))))))))) ))))))))))))))) ))))))))))))))) )))))))))))))))
Food (corresponding table) Males Males and and Males Females Males Females Males Females Males Femalesfemales females
)))))))))))))))))))))))))))))))))))))))))))))))))))))))))))))))))))))))))))))))))))))))))))))))))))))))))))))))))))))))))))))))))))
Number in sample 2,109 1,432 696 702 1,543 1,449 1,663 1,694 1,545 1,429
))))))))))))))))))))))))))))))))))))))))g)))))))))))))))))))))))))))))))))))))))))
Oatmeal (1.014) minimum --- --- 117 147 --- --- --- --- --- ---maximum --- --- 585 478 --- --- --- --- --- ---
Macaroni and Cheese (1.020) minimum --- --- --- --- --- --- --- 5 --- ---maximum --- --- --- --- --- --- --- 486 --- ---
Spaghetti with Tomato Sauce (1.021) minimum --- --- 248 --- --- --- --- --- --- ---maximum --- --- 2,356 --- --- --- --- --- --- ---
Raw Cucumbers (1.023) minimum --- --- 7 --- --- --- --- --- --- ---maximum --- --- 280 --- --- --- --- --- --- ---
Mixed Lettuce-Based Salad (1.025) minimum --- --- 9 2 55 --- --- --- --- 14maximum --- --- 146 261 438 --- --- --- --- 330
Cooked Broccoli (1.026) minimum --- --- 34 --- --- --- --- --- --- ---maximum --- --- 312 --- --- --- --- --- --- ---
Cooked Carrots (1.027) minimum --- --- 8 3 --- --- --- --- --- ---maximum --- --- 185 175 --- --- --- --- --- ---
Coleslaw (1.032) minimum --- 4 12 4 --- --- --- --- --- ---maximum --- 184 276 184 --- --- --- --- --- ---
Cooked Peas (1.033) minimum --- --- 21 10 --- --- --- --- --- ---maximum --- --- 240 340 --- --- --- --- --- ---
)))))))))))))))))))))))))))))))))))))))))))))))))))))))))))))))))))))))))))))))))))))))))))))))))))))))))))))))))))))))))))))))))))
Source: USDA's Continuing Survey of Food Intakes by Individuals, 1994-96, 2 days.
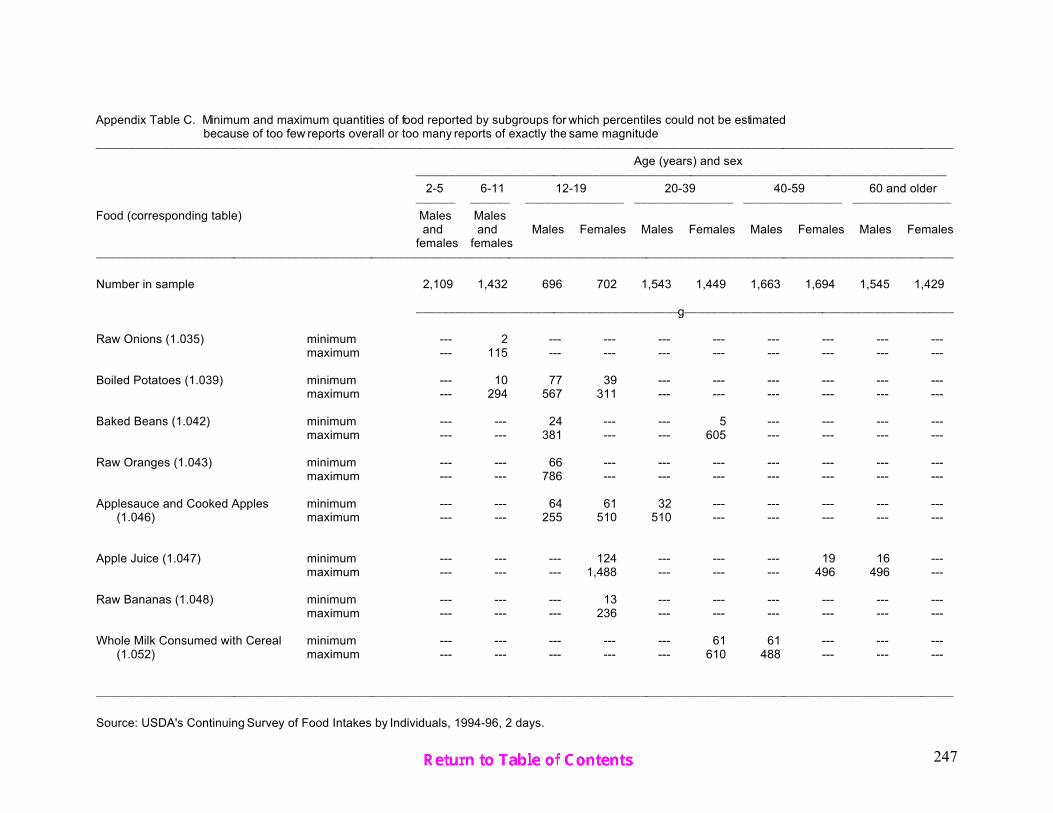
247
Appendix Table C. Minimum and maximum quantities of food reported by subgroups for which percentiles could not be estimated because of too few reports overall or too many reports of exactly the same magnitude)))))))))))))))))))))))))))))))))))))))))))))))))))))))))))))))))))))))))))))))))))))))))))))))))))))))))))))))))))))))))))))))))))
Age (years) and sex)))))))))))))))))))))))))))))))))))))))))))))))))))))))))))))))))))))))))))))))))
2-5 6-11 12-19 20-39 40-59 60 and older)))))) )))))) ))))))))))))))) ))))))))))))))) ))))))))))))))) )))))))))))))))
Food (corresponding table) Males Males and and Males Females Males Females Males Females Males Femalesfemales females
)))))))))))))))))))))))))))))))))))))))))))))))))))))))))))))))))))))))))))))))))))))))))))))))))))))))))))))))))))))))))))))))))))
Number in sample 2,109 1,432 696 702 1,543 1,449 1,663 1,694 1,545 1,429
))))))))))))))))))))))))))))))))))))))))g)))))))))))))))))))))))))))))))))))))))))
Raw Onions (1.035) minimum --- 2 --- --- --- --- --- --- --- ---maximum --- 115 --- --- --- --- --- --- --- ---
Boiled Potatoes (1.039) minimum --- 10 77 39 --- --- --- --- --- ---maximum --- 294 567 311 --- --- --- --- --- ---
Baked Beans (1.042) minimum --- --- 24 --- --- 5 --- --- --- ---maximum --- --- 381 --- --- 605 --- --- --- ---
Raw Oranges (1.043) minimum --- --- 66 --- --- --- --- --- --- ---maximum --- --- 786 --- --- --- --- --- --- ---
Applesauce and Cooked Apples minimum --- --- 64 61 32 --- --- --- --- --- (1.046) maximum --- --- 255 510 510 --- --- --- --- ---
Apple Juice (1.047) minimum --- --- --- 124 --- --- --- 19 16 ---maximum --- --- --- 1,488 --- --- --- 496 496 ---
Raw Bananas (1.048) minimum --- --- --- 13 --- --- --- --- --- ---maximum --- --- --- 236 --- --- --- --- --- ---
Whole Milk Consumed with Cereal minimum --- --- --- --- --- 61 61 --- --- --- (1.052) maximum --- --- --- --- --- 610 488 --- --- ---
)))))))))))))))))))))))))))))))))))))))))))))))))))))))))))))))))))))))))))))))))))))))))))))))))))))))))))))))))))))))))))))))))))
Source: USDA's Continuing Survey of Food Intakes by Individuals, 1994-96, 2 days.

248
Appendix Table C. Minimum and maximum quantities of food reported by subgroups for which percentiles could not be estimated because of too few reports overall or too many reports of exactly the same magnitude)))))))))))))))))))))))))))))))))))))))))))))))))))))))))))))))))))))))))))))))))))))))))))))))))))))))))))))))))))))))))))))))))))
Age (years) and sex)))))))))))))))))))))))))))))))))))))))))))))))))))))))))))))))))))))))))))))))))
2-5 6-11 12-19 20-39 40-59 60 and older)))))) )))))) ))))))))))))))) ))))))))))))))) ))))))))))))))) )))))))))))))))
Food (corresponding table) Males Males and and Males Females Males Females Males Females Males Femalesfemales females
)))))))))))))))))))))))))))))))))))))))))))))))))))))))))))))))))))))))))))))))))))))))))))))))))))))))))))))))))))))))))))))))))))
Number in sample 2,109 1,432 696 702 1,543 1,449 1,663 1,694 1,545 1,429
))))))))))))))))))))))))))))))))))))))))g)))))))))))))))))))))))))))))))))))))))))
Skim Milk Consumed with Cereal minimum --- --- 61 --- --- --- --- --- --- --- (1.056) maximum --- --- 613 --- --- --- --- --- --- ---
Beef Roasts (1.060) minimum --- --- --- 9 --- --- --- --- --- ---maximum --- --- --- 320 --- --- --- --- --- ---
Pork Breakfast Sausage (1.065) minimum --- --- 13 --- --- --- --- --- --- ---maximum --- --- 170 --- --- --- --- --- --- ---
Canned Tuna (1.067) minimum --- --- 14 --- --- --- --- --- --- ---maximum --- --- 170 --- --- --- --- --- --- ---
Coffee (1.076) minimum 30 59 --- 89 --- --- --- --- --- ---maximum 237 498 --- 947 --- --- --- --- --- ---
Coffee, with Caffeine (1.077) minimum 30 59 --- 89 --- --- --- --- --- ---maximum 237 498 --- 947 --- --- --- --- --- ---
Coffee, Decaffeinated (1.078) minimum 59 118 296 237 --- --- --- --- --- ---maximum 59 298 296 238 --- --- --- --- --- ---
Soft Drinks, Diet, Caffeine-Free minimum --- --- --- 118 --- --- --- --- --- --- (1.084) maximum --- --- --- 720 --- --- --- --- --- ---
)))))))))))))))))))))))))))))))))))))))))))))))))))))))))))))))))))))))))))))))))))))))))))))))))))))))))))))))))))))))))))))))))))
Source: USDA's Continuing Survey of Food Intakes by Individuals, 1994-96, 2 days.

249
Appendix Table C. Minimum and maximum quantities of food reported by subgroups for which percentiles could not be estimated because of too few reports overall or too many reports of exactly the same magnitude)))))))))))))))))))))))))))))))))))))))))))))))))))))))))))))))))))))))))))))))))))))))))))))))))))))))))))))))))))))))))))))))))))
Age (years) and sex)))))))))))))))))))))))))))))))))))))))))))))))))))))))))))))))))))))))))))))))))
2-5 6-11 12-19 20-39 40-59 60 and older)))))) )))))) ))))))))))))))) ))))))))))))))) ))))))))))))))) )))))))))))))))
Food (corresponding table) Males Males and and Males Females Males Females Males Females Males Femalesfemales females
)))))))))))))))))))))))))))))))))))))))))))))))))))))))))))))))))))))))))))))))))))))))))))))))))))))))))))))))))))))))))))))))))))
Number in sample 2,109 1,432 696 702 1,543 1,449 1,663 1,694 1,545 1,429
))))))))))))))))))))))))))))))))))))))))g)))))))))))))))))))))))))))))))))))))))))
Beer (1.086) minimum --- 15 360 180 --- --- --- --- --- ---maximum --- 15 4,560 2,160 --- --- --- --- --- ---
Wine (1.087) minimum --- --- 151 157 --- --- --- --- --- 15maximum --- --- 157 386 --- --- --- --- --- 944
Fluid Cream (1.096) minimum 5 5 5 1 --- --- --- --- --- ---maximum 182 71 76 121 --- --- --- --- --- ---
Powdered Cream Substitute (1.097) minimum 1 2 2 3 --- --- --- --- --- ---maximum 1 7 6 12 --- --- --- --- --- ---
Margarine, Imitation (1.101) minimum --- --- 2 1 --- 1 --- --- --- ---maximum --- --- 40 15 --- 44 --- --- --- ---
Butter (1.102) minimum --- 1 1 1 --- --- --- --- --- ---maximum --- 85 114 28 --- --- --- --- --- ---
Mayonnaise-Type Dressing (1.105) minimum --- --- --- 2 --- --- --- --- --- ---maximum --- --- --- 30 --- --- --- --- --- ---
Syrup (1.107) minimum --- --- 7 --- 7 --- --- --- --- ---maximum --- --- 315 --- 315 --- --- --- --- ---
)))))))))))))))))))))))))))))))))))))))))))))))))))))))))))))))))))))))))))))))))))))))))))))))))))))))))))))))))))))))))))))))))))
Source: USDA's Continuing Survey of Food Intakes by Individuals, 1994-96, 2 days.
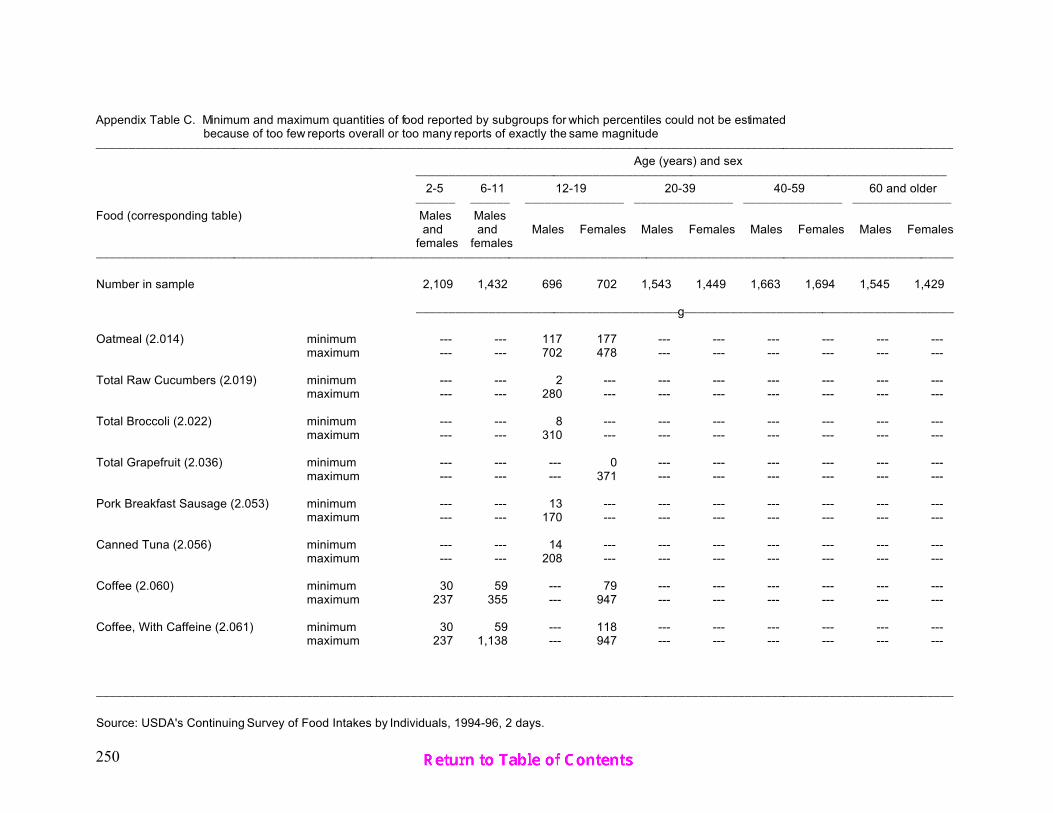
250
Appendix Table C. Minimum and maximum quantities of food reported by subgroups for which percentiles could not be estimated because of too few reports overall or too many reports of exactly the same magnitude)))))))))))))))))))))))))))))))))))))))))))))))))))))))))))))))))))))))))))))))))))))))))))))))))))))))))))))))))))))))))))))))))))
Age (years) and sex)))))))))))))))))))))))))))))))))))))))))))))))))))))))))))))))))))))))))))))))))
2-5 6-11 12-19 20-39 40-59 60 and older)))))) )))))) ))))))))))))))) ))))))))))))))) ))))))))))))))) )))))))))))))))
Food (corresponding table) Males Males and and Males Females Males Females Males Females Males Femalesfemales females
)))))))))))))))))))))))))))))))))))))))))))))))))))))))))))))))))))))))))))))))))))))))))))))))))))))))))))))))))))))))))))))))))))
Number in sample 2,109 1,432 696 702 1,543 1,449 1,663 1,694 1,545 1,429
))))))))))))))))))))))))))))))))))))))))g)))))))))))))))))))))))))))))))))))))))))
Oatmeal (2.014) minimum --- --- 117 177 --- --- --- --- --- ---maximum --- --- 702 478 --- --- --- --- --- ---
Total Raw Cucumbers (2.019) minimum --- --- 2 --- --- --- --- --- --- ---maximum --- --- 280 --- --- --- --- --- --- ---
Total Broccoli (2.022) minimum --- --- 8 --- --- --- --- --- --- ---maximum --- --- 310 --- --- --- --- --- --- ---
Total Grapefruit (2.036) minimum --- --- --- 0 --- --- --- --- --- ---maximum --- --- --- 371 --- --- --- --- --- ---
Pork Breakfast Sausage (2.053) minimum --- --- 13 --- --- --- --- --- --- ---maximum --- --- 170 --- --- --- --- --- --- ---
Canned Tuna (2.056) minimum --- --- 14 --- --- --- --- --- --- ---maximum --- --- 208 --- --- --- --- --- --- ---
Coffee (2.060) minimum 30 59 --- 79 --- --- --- --- --- ---maximum 237 355 --- 947 --- --- --- --- --- ---
Coffee, With Caffeine (2.061) minimum 30 59 --- 118 --- --- --- --- --- ---maximum 237 1,138 --- 947 --- --- --- --- --- ---
)))))))))))))))))))))))))))))))))))))))))))))))))))))))))))))))))))))))))))))))))))))))))))))))))))))))))))))))))))))))))))))))))))
Source: USDA's Continuing Survey of Food Intakes by Individuals, 1994-96, 2 days.

251
Appendix Table C. Minimum and maximum quantities of food reported by subgroups for which percentiles could not be estimated because of too few reports overall or too many reports of exactly the same magnitude)))))))))))))))))))))))))))))))))))))))))))))))))))))))))))))))))))))))))))))))))))))))))))))))))))))))))))))))))))))))))))))))))))
Age (years) and sex)))))))))))))))))))))))))))))))))))))))))))))))))))))))))))))))))))))))))))))))))
2-5 6-11 12-19 20-39 40-59 60 and older)))))) )))))) ))))))))))))))) ))))))))))))))) ))))))))))))))) )))))))))))))))
Food (corresponding table) Males Males and and Males Females Males Females Males Females Males Femalesfemales females
)))))))))))))))))))))))))))))))))))))))))))))))))))))))))))))))))))))))))))))))))))))))))))))))))))))))))))))))))))))))))))))))))))
Number in sample 2,109 1,432 696 702 1,543 1,449 1,663 1,694 1,545 1,429
))))))))))))))))))))))))))))))))))))))))g)))))))))))))))))))))))))))))))))))))))))
Coffee, Decaffeinated (2.062) minimum 59 118 296 237 --- --- --- --- --- ---maximum 59 298 296 238 --- --- --- --- --- ---
Soft Drinks, Diet, Caffeine-Free minimum --- --- --- 118 --- --- --- --- --- --- (2.068) maximum --- --- --- 1,080 --- --- --- --- --- ---
Beer (2.070) minimum --- 15 360 360 --- --- --- --- --- ---maximum --- 15 4,560 2,160 --- --- --- --- --- ---
Total Wine (2.071) minimum --- 0 --- --- --- --- --- --- --- ---maximum --- 36 --- --- --- --- --- --- --- ---
Powdered Cream Substitute (2.082) minimum 1 2 2 3 --- --- --- --- --- ---maximum 1 6 6 12 --- --- --- --- --- ---
Syrup (2.090) minimum --- --- 7 --- 7 --- --- --- --- ---maximum --- --- 315 --- 315 --- --- --- --- ---
)))))))))))))))))))))))))))))))))))))))))))))))))))))))))))))))))))))))))))))))))))))))))))))))))))))))))))))))))))))))))))))))))))
Source: USDA's Continuing Survey of Food Intakes by Individuals, 1994-96, 2 days.
252
REFERENCES
Federation of American Societies for ExperimentalBiology, Life Sciences Research Office. Prepared for theInteragency Board for Nutrition Monitoring and RelatedResearch. 1995. Third Report on Nutrition Monitoring inthe United States: Volume 1. U. S. Government PrintingOffice, Washington, DC, 365 pp.
Krebs-Smith, S.M., P.M. Guenther, A. Cook, F.E.Thompson, J. Cucinelli, and J. Udler. 1997. FoodsCommonly Eaten in the United States: QuantitiesConsumed Per Eating Occasion and in a Day, 1989-91. United States Department of Agriculture, AgricultureResearch Service, NFS Report No. 91-3. 249 pp.
Pao, E.M. and M.C. Burk. 1975. Portion Sizes and Day’sIntakes of Selected Foods. US Dept. Agr. ARS-NE-67,70 pp.
Pao, E.M., K.H. Fleming, P.M. Guenther, and S.J. Mickle. 1982. Foods Commonly Eaten by Individuals: AmountPer Day and Per Eating Occasion. Hyattsville:Consumer Nutrition Center, Human Nutrition InformationService. Home Economics Research Report Number 44. 431 pp.
SAS Institute Inc. 1996. SAS, version 6.12. Cary, NC27513. Computer program.
Shah, B.V., B. G. Barnwell, and G. S. Bieler. 1997. SUDAAN, version 7.5.1. Research Triangle Institute,Research Triangle Park, NC 27709. Computer program.
Tippett, K.S. and Y.S. Cypel (eds.). 1998. Design andOperation: The Continuing Survey of Food Intakes byIndividuals and the Diet And Health Knowledge Survey,1994-96. United States Department of Agriculture,Agricultural Research Services, NFS Report No. 96-1. 264 pp.
U. S. Department of Agriculture (USDA), AgriculturalResearch Service. 1998. 1994-96 Continuing Survey ofFood Intakes by Individuals and 1994-96 Diet and HealthKnowledge Survey. CD-ROM.
Related Documents