Kamini P. Iyer Food Security and Rural Indian Agriculture Spring 2013 1 Food Security in Rural India: A Case Study of Vadamanappakkam, Tamil Nadu Kamini P. Iyer ABSTRACT Growing food shortages coupled with rising global demand have created food security crises in many parts of the world. Food security is defined as the availability of food and one’s access to it. Access to food is determined by political and market forces acting on food systems, an individual’s wealth, and their share in food production. Making up 85% of India’s economy, the agricultural sector is crucia l to India’s economic and political stability, and a common method for assessing food security in this region consists of scaling up regional models. To address misguided perceptions resulting from inaccuracies inherent in these models, I assessed local food security – specifically those factors that affect access – using Vadamanappakkam, Tamil Nadu as a case study in order to create a model for small-scale assessment. I identified key factors including income levels, role in the food system, education levels of the head of the household, and use of ration cards, in order to quantitatively and qualitatively evaluate access to food in Vadamanappakkam. Individuals with higher incomes spent less of their total income on food as a percentage. Those who lived in a household where the head of the household had completed some form of higher education spent the least percentage of their income on food. Consumers and those with ration cards spent the highest percentage of their income on food. Despite the limitations of this study, Vadamanappakkam serves as a clear example of the importance of localized assessments in understanding the larger agricultural system in India and its implications for global food markets. KEYWORDS rural agriculture, food access, agro-industry, regional assessment, Public Distribution System (PDS)

Welcome message from author
This document is posted to help you gain knowledge. Please leave a comment to let me know what you think about it! Share it to your friends and learn new things together.
Transcript

Kamini P. Iyer Food Security and Rural Indian Agriculture Spring 2013
1
Food Security in Rural India:
A Case Study of Vadamanappakkam, Tamil Nadu
Kamini P. Iyer
ABSTRACT
Growing food shortages coupled with rising global demand have created food security crises in
many parts of the world. Food security is defined as the availability of food and one’s access to
it. Access to food is determined by political and market forces acting on food systems, an
individual’s wealth, and their share in food production. Making up 85% of India’s economy,
the agricultural sector is crucial to India’s economic and political stability, and a common
method for assessing food security in this region consists of scaling up regional models. To
address misguided perceptions resulting from inaccuracies inherent in these models, I assessed
local food security – specifically those factors that affect access – using Vadamanappakkam,
Tamil Nadu as a case study in order to create a model for small-scale assessment. I identified key
factors including income levels, role in the food system, education levels of the head of the
household, and use of ration cards, in order to quantitatively and qualitatively evaluate access to
food in Vadamanappakkam. Individuals with higher incomes spent less of their total income on
food as a percentage. Those who lived in a household where the head of the household had
completed some form of higher education spent the least percentage of their income on food.
Consumers and those with ration cards spent the highest percentage of their income on food.
Despite the limitations of this study, Vadamanappakkam serves as a clear example of the
importance of localized assessments in understanding the larger agricultural system in India and
its implications for global food markets.
KEYWORDS
rural agriculture, food access, agro-industry, regional assessment, Public Distribution System
(PDS)

Kamini P. Iyer Food Security and Rural Indian Agriculture Spring 2013
2
INTRODUCTION
Growing food shortages coupled with rising global demand have created food security
crises in many parts of the world (Baviera and Bello 2009). Food security is defined as the
availability of food and one’s access to it (Sinha et al. 1988) and climatic factors are often the
best indicators of the availability of agricultural foods in any given year (Powlson and Brookes
1987, Sinha et al. 1988, Insam 1990, Kumar and Parikh 2001, Aggarwal and Mall 2002,
Krishna et al. 2003, Shukla et al. 2003, Roy 2006, Rupa et al. 2007). Access to food is
determined by political and market forces acting on food systems, an individual’s wealth, and
their share in food production (Parry 1990, Rosenzweig et al. 1993, Gregory et al. 2005). With
the onset of this global food crisis, it is critical that domestic food security of key producers for
the world food market, like India, be thoroughly understood (Parry 1990, Baviera and Bello
2009).
Despite the economic significance of the agricultural sector, there are undoubtedly
misguided perceptions regarding the status of food security in India. The agricultural industry,
crucial to maintaining India’s large population, employs approximately 743 million Indians
(O’Brien et al. 2004, Kapila 2009). Although agriculture constitutes only 20% of India’s national
Gross Domestic Product, it makes up 85% of the economy in rural India (Kapila 2009).
Additionally, as a major exporter of agricultural products, large portions of India’s political and
economic stability depends on this industry (O’Brien et al. 2004, Kapila 2009). Though rural
food security show stable positive trends of food needs being met for the rural population
nationwide, it is based on scaling up regional assessments that are sporadic and not equally
distributed among the various regions (Parry 1990, Rosenzweig et al. 1993, O’Brien et al. 2004,
Kapila 2009). Thus, such trends can conceal potential problems in other regions of India.
Regional assessments of food security in certain Indian states – Punjab, Uttar Pradesh,
Madhya, Pradesh, Haryana, Bihar, Andhra Pradesh, Maharashtra, and West Bengal – are
abundant due to the large contribution of these regions to India’s overall agricultural productivity
(Fischer et al. 2005). However, there are not adequate studies conducted in the remainder states,
like Tamil Nadu, which brings to question whether stable national trends are comprised
disproportionately of assessments done in agriculturally productive regions (O’Brien et al. 2004).
Past studies have relied heavily on socio-economic agricultural models rather than realistic

Kamini P. Iyer Food Security and Rural Indian Agriculture Spring 2013
3
assessments done on-site and do not take into significant consideration key economic events, like
the liberalization of India’s markets in 1991, to evaluate present-day food security in India
(O’Brien et al. 2004, Fischer et al. 2005, Kapila 2009). A reassessment of regional trends is
critical to understanding the nature of current food security in India.
I will conduct a regional assessment of rural food security in Vadamanappakkam,
Tamil Nadu to identify the local trend for Thiruvannamalai District and its surrounding locales.
Vadamanappakkam is representative of its encompassing district as it conforms to the same
political, socio-economic, and environmental pressures as the rest of the region. This study will
add to the limited localized food security assessments done previously in Tamil Nadu. Food
security will be measured by the monetary amount spent on purchasing food by an individual
within Vadamanappakkam. Further assessments will be made through observational studies of
influential factors (e.g. income levels, role in the food system, education levels, and use of ration
cards). Specifically, I will:
1. Identify producers, distributors, and consumers in Vadamanappakkam’s food system
and how their role impacts their food security
2. Identify the impacts of income levels, education of head of household and use of
ration cards on food expenditure by Vadamanappakkam’s population
3. Assess the implications are for maintaining food security in the future on a local,
national, and global scale
Expected Findings
I expect discrepancies in food expenditures among producers, distributors, and
consumers. I expect producers to have a moderate level of expenditure on food as they will grow
a portion of their own sustenance but will not have the diversity to be completely self sustaining
(Parry 1990). Vendors, I expect, will have the least expenditures as they will be able to buy a
variety of food and sell it for a profit while retaining a lower purchase price for themselves
(Parry 1990). I expect pure consumers to have the highest cost in the food system as they have
no mechanism to offset their consumption of food (Parry 1990). Overall, I predict the intensity of
impact to be greater on consumers than producers and vendors as they are at the end of the food
system chain with no buffering capacity (Parry 1990).
Kamini P. Iyer Food Security and Rural Indian Agriculture Spring 2013
4
METHODS
Study site
I conducted this study in the village of Vadamanappakkam located in the southern Indian
state of Tamil Nadu. This village, located 100 km south of Chennai in Thiruvannamalai District,
is encompassed within the Cheyar Taluk. In Tamil Nadu, districts are divided up into taluks for
the purpose of revenue administration by the state government. There are approximately 900
households in the village, which roughly comprises a population of 3,000 individuals. The
majority of adults are agricultural and textile workers who suffer from a variety of occupational
maladies and socio-economic hardships, that invariably correlate with poor health and sanitation
standards.
Food security and Vadamanappakkam
Food security is defined as the availability of food and one’s access to it (Sinha et al.
1988). I assessed rural food security in Vadamanappakkam, Tamil Nadu in order to identify a
regional trend for Thiruvannamalai District and its surrounding locales. I used
Vadamanappakkam as a representative sample of the larger district as it adheres to the same
political, socio-economic, and environmental pressures as the rest of the region. Food security
is not thoroughly understood in this particular region despite its predominantly agricultural
economy. In this study, I identified and analyzed the interactions between producers, vendors
(i.e. distributors), and consumers, with respect to locally grown foods in Vadamanappakkam.
I measured local food security by quantifying the percentage of an individual’s net
expenditures that was used to purchase food locally. I defined net expenditure in this study as the
monetary amount spent on purchasing food within Vadamanappakkam. These values were then
calculated as a percentage of total income. The calculated value accounted for those who grew a
portion of their food or bought it at a subsidized rate due to certain socio-economic factors (e.g.
their income or role in the food system). The following is a summary of how I calculated net
expenditure for each group based on how I defined each role for this study:

Kamini P. Iyer Food Security and Rural Indian Agriculture Spring 2013
5
Producers: Any individual that participated in growing food regardless of scale.
Net expenditure for producers was calculated as follows
|𝐹𝑜𝑜𝑑 𝑆𝑜𝑙𝑑 − 𝐹𝑜𝑜𝑑 𝐵𝑜𝑢𝑔ℎ𝑡|
𝑇𝑜𝑡𝑎𝑙 𝐼𝑛𝑐𝑜𝑚𝑒
Distributors: Any individual that participated in the resale of food acting as the
link between producers and consumers (these were often self-identified vendors).
Net expenditure for distributors was calculated as
|𝐹𝑜𝑜𝑑 𝑆𝑜𝑙𝑑 − 𝐹𝑜𝑜𝑑 𝐵𝑜𝑢𝑔ℎ𝑡|
𝑇𝑜𝑡𝑎𝑙 𝐼𝑛𝑐𝑜𝑚𝑒
Consumers: Any individual that participated in purchasing and consuming food.
Net expenditure for consumers was calculated as the value spent on purchased
food.
|𝐹𝑜𝑜𝑑 𝐵𝑜𝑢𝑔ℎ𝑡|
𝑇𝑜𝑡𝑎𝑙 𝐼𝑛𝑐𝑜𝑚𝑒
Data collection
To identify expenditure patterns, I conducted household surveys. Household surveys
maximized the data that could be collected on a large number of individuals, but the unit of
interest remained at the individual level. I sampled 92 households from the 892 households
located within the village. Each survey took approximately 25 minutes to complete. I selected
households based on visual aesthetics, as they often are a good indicator of economic status. This
ensured that the sampling individuals were stratified somewhat evenly across different income
groups. This sampling method, however, did not indicate their specific role – producers,
distributors, and consumers – in the food system. In order to ensure that there was an equal
stratification across the different groups, intermediate evaluations were done. Intermediate
evaluations simply involved counting the number of the various income groups (high, middle,
and low) we had surveyed and re-evaluating the number of surveys needed from the lacking
groups. To cover all groups, surveys were conducted at different times in the day to ensure
farmers and other working individuals were sampled during non-working hours.
The survey assessed both primary and secondary factors. Primary factors included
income, family size, government ration programs, and consumption. Secondary factors included

Kamini P. Iyer Food Security and Rural Indian Agriculture Spring 2013
6
education level, occupation, agricultural practices, insurance policies, and monetary debt. I then
used a combination of quantitative and qualitative analysis evaluating select primary and
secondary factors to identify and explore net expenditure patterns with relation to key factors
(e.g. income, role in the food system, government program, and education levels) that affected
access to food to help evaluate the implications for maintaining food security in
Vadamanappakkam.
Methods of analysis
To investigate the different relationships among various factors (income, education
levels, role in the food system, and the use of ration cards) and net expenditure on food, I used a
series of statistical tests. For ease of analysis, I assumed the necessary statistical criteria that
allowed me to run these tests as if data was collected under “ideal” conditions (please see
“Limitations and future directions” section for more detail).
Income
To investigate the relationship between income and net expenditure on food, I conducted
a regression analysis to determine whether the mean net expenditure on food differed by income
levels. I used income as a proxy for economic status. I used data from all individuals and
answered the following question: Did the data provide sufficient evidence to indicate that the
mean net expenditure on food differed as income level changed? I plotted net expenditure on
food as the dependent variable on the y-axis against income levels as the independent variable on
the x-axis. The assumptions made were that these samples from my data were drawn
independently, and the net expenditures of individuals were normally distributed. Additionally, I
assumed my “populations” had equal variance which allowed me to run regression analysis on
individuals’ incomes against net expenditure on food.
Education level

Kamini P. Iyer Food Security and Rural Indian Agriculture Spring 2013
7
To investigate the relationship between the level of education and net expenditure on
food, I conducted an ANOVA test to determine whether the mean net expenditure on food
differed by completed education level by the head of the household (primary, secondary, higher).
Primary education level included those who had completed anywhere from the equivalent of
Kindergarten through 5th grade. Secondary education level included those who had completed
anywhere from 6th through 12th grade. Higher education included those who had completed a
diploma, bachelors, or graduate level studies. I selected individuals from each category and
answered the following question: Did the data provide sufficient evidence to indicate that the
mean net expenditure on food differed for at least two of the three groups?
Ha (Primary Hypothesis): The mean net expenditure on food differs for at least
two of the three groups.
H0 (Null Hypothesis): The mean net expenditure on food does not differ among
all three groups
I assumed that the samples from my data were drawn independently, and the net
expenditures of individuals were normally distributed for each of the three groups. Additionally,
I assumed my “populations” had equal variance which allowed me to run my ANOVA test and
plot the three categories – primary, secondary, and higher – as my independent variable on the x-
axis against net expenditure on food as my dependent variable on the y-axis.
Role in the food system
To investigate the relationship between the roles of individuals in the food system and net
expenditure on food, I conducted an ANOVA test. I aimed to determine whether the mean net
expenditure on food differed for the three groups (producers, distributors, and consumers). I
selected individuals from each category and answered the following question: Did the data
provide sufficient evidence to indicate that the mean net expenditure on food differed for at least
two of the three groups of individuals?
Ha (Primary Hypothesis): The mean net expenditure on food differs for at least
two of the three groups of individuals.
H0 (Null Hypothesis): The mean net expenditure on food does not differ among
all three groups of individuals

Kamini P. Iyer Food Security and Rural Indian Agriculture Spring 2013
8
I assumed that the samples from my data were drawn independently, and the net
expenditures of individuals were normally distributed for each of the three groups. Additionally,
I assumed my “populations” had equal variance which allowed me to run my ANOVA test and
plot the three categories– producers, distributors, and consumers – as my independent variable
on the x-axis against net expenditure on food as my dependent variable on the y-axis.
Ration card use
To investigate the relationship between the use of ration cards and net expenditure on
food, I conducted an ANOVA test to determine whether the mean net expenditure on food
differed between those who used ration cards and those who did not. I selected individuals from
each category and answered the following question: Did the data provide sufficient evidence to
indicate that the mean net expenditure on food differed between those who used ration cards and
those who did not?
Ha (Primary Hypothesis): The mean net expenditure on food differs for those who
do used ration cards.
H0 (Null Hypothesis): The mean net expenditure on food does not differ for those
who used ration card.
The assumptions made were that these samples from my data were drawn independently,
and the net expenditures of individuals were normally distributed for each of the three groups.
Additionally, I assumed my “populations” had equal variance which allowed me to run my
ANOVA test and plot the two categories– those who use ration cards and those who don’t – as
my independent variable on the x-axis against net expenditure on food as my dependent variable
on the y-axis.
RESULTS
Overall statistical trends
The survey identified major trends that characterize Vadamanappakkam’s food security.
Individuals with higher incomes spent less of their total income on food as a percentage. Those

Kamini P. Iyer Food Security and Rural Indian Agriculture Spring 2013
9
who lived in a household where the head of the household had completed some form of higher
education spent the least percentage of their income on food. Consumers and those with ration
cards spent the highest percentage of their income on food.
Detailed statistical analyses
Income
Using linear regression, I found an exponential relationship between net expenditure on
food and an individual’s income (Fig. 1).
Fig. 1. The Effect of Income (Rs.) on Net Food Expenditure (n=92). The data is expressed as a fraction of total
income where 1.0 corresponds with 100%.
y = (-0.134)*log(x)+1.4525

Kamini P. Iyer Food Security and Rural Indian Agriculture Spring 2013
10
I plotted the income in Rupees (Rs.) on the x-axis against the fraction of money spent on food
from their income on the y-axis. Though the best fit line of the linear regression visually
suggests that as income levels increased, expenditure on foods decreased, the linear regression
model itself indicated a non-significant correlation between net expenditure on food and income
levels (R2=.30905, F(1,90)=1.532, p=0.219).
Education level
Using an ANOVA test, lower education levels indicated higher mean expenditure on
food as a percentage of an individual’s income (Fig. 2).
Fig. 2. The Effect of Education Levels on Net Food Expenditure (n=92). The data is expressed as a fraction of
Total Income equating 1.0 to 100% and 2.0 to 200% respectively.
Kamini P. Iyer Food Security and Rural Indian Agriculture Spring 2013
11
Increased education levels resulted in generally lower expenditures on food (as a percentage of
income) (F(3,84)=1.00, p=0.3969). There was no significant trend indicating that only
households in which the head of the household had completed up through 5th grade – primary
education level (M=0.4000, SD=1.0450) – or up through 12th grade – secondary education level
(M=0.4200, SD=0.8248) – had higher expenditure on food. However, heads of households who
had no education showed some significant relative increases in the percentage of their income
they spent on food (M=0.8300, SD=1.500) and those heads of households who had completed a
diploma, bachelors, or graduate level studies – higher education levels – showed some
significant decreases in the percentage of their income they spent on food (M=0.1900,
SD=0.3215). Additionally, those with no education had the largest variation within the group,
followed by those who had had secondary and primary education. Those who had higher
education had the least variation within their group.
Role in the food system
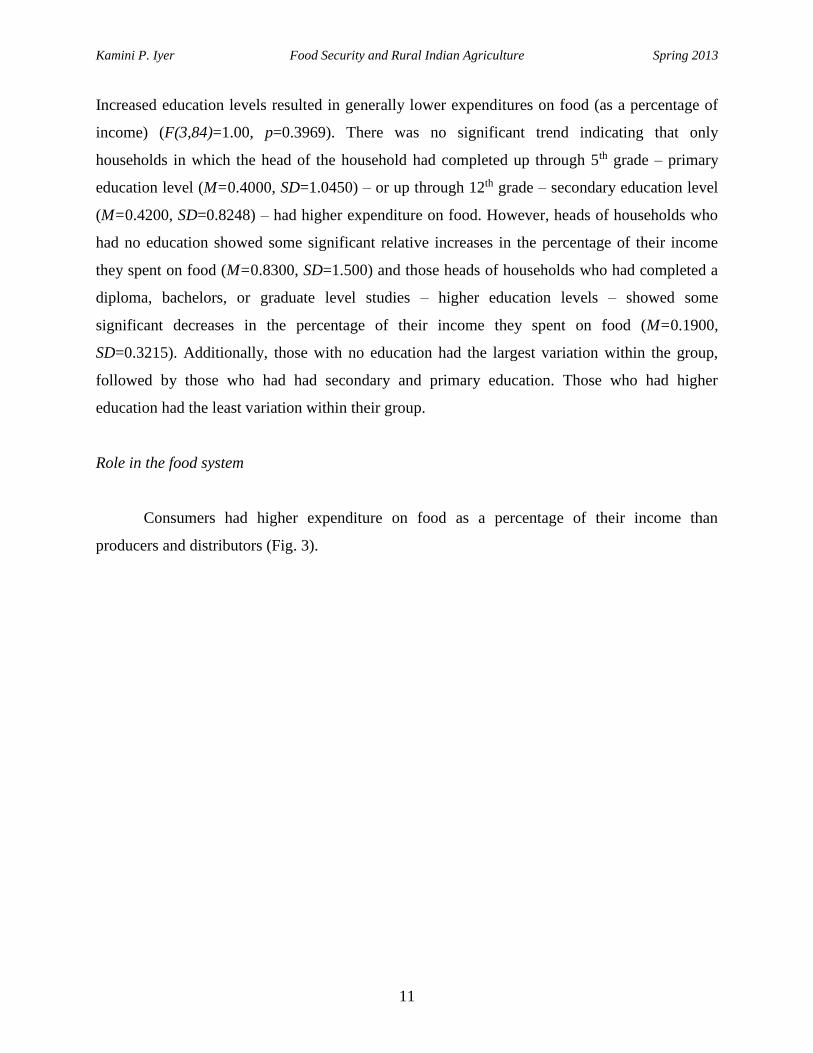
Consumers had higher expenditure on food as a percentage of their income than
producers and distributors (Fig. 3).
Kamini P. Iyer Food Security and Rural Indian Agriculture Spring 2013
12
Fig. 3. The Effect of an Individual’s Role in the Food System on Net Food Expenditure (n=92). The data is
expressed as a fraction of Total Income equating 1.0 to 100% and 2.0 to 200% respectively.
I found that no two groups (F(2,84)=.1306, p=0.8778) showed any significant trend in the
percentage of expenditure spent on food. However, being a consumer (M=0.4700, SD=0.9389)
versus a producer or distributor did significantly affect the percentage of expenditure on food by
an individual. Those who were distributors (M=0.2300, SD=0.3663) or consumers (M=0.4400,
SD=1.3066) spent a little more and little less on food respectively.
Ration card use
Those who did not used ration cards spent on average 20% more on food as a percentage
of their income (Fig. 4).

Kamini P. Iyer Food Security and Rural Indian Agriculture Spring 2013
13
Fig. 4. The Effect of Ration Card Use on Net Food Expenditure as a Percentage of Total Income (n=92)
expressed as a decimal
There was no significant difference (F (1, 90) = 0.1584, p=0.6916) in the percentage spent on
food by those who had ration cards (M=0.4500, SD=0.9964) and those who did not have ration
cards (M=0.2500, SD=0.2565). Those who had ration cards spent on average 45% on food versus
those who did not spent on average 25% on food as a percentage of their total income.
DISCUSSION
Vadamanappakkam’s food system is similar to food systems in surrounding villages.
There are three primary players in the food system – producers, distributors, and consumers –
who depending on their role show characteristic patterns of expenditure on food (see “Role in the
Food System” section for complete details). My survey shows that access to food in
Kamini P. Iyer Food Security and Rural Indian Agriculture Spring 2013
14
Vadamanappakkam was minimally impacted by different economic and social factors such as
income levels, education levels, role in the food system, and the use of ration cards. This is likely
because most communities value food as a basic necessity and therefore, it is a top priority for
most individuals as it ensures their survival. Compromising food spending seems to be a last
resort option for most families (Behrman and Deolalikar 1987, O’Brien et al 2004).
Income level
Increased incomes exponentially decreased expenditures on food as a percentage of a
villager’s total income. However, the notion that increased wealth increases food security cannot
be linearly correlated. The ability to purchase food is undoubtedly increased by individuals
having more money to spend on food (O’Brien et al 2004). However, often in agricultural
societies like Vadamanappakkam, access to food is limited by factors like the accessibility of the
village to other major cities that are points of trade and exchange (Adelman and Dalton 1971).
Perhaps of greater significance is the misconception that increased incomes leads to
purchasing food that is “healthier” and more nutritious (Behrman and Deolalikar 1987).
“Healthier” foods would include a more distributed pattern of food purchases across the food
pyramid. Villagers would buy larger quantities of fruits, vegetables, grains, meats, milk and
minimal quantities of oils and sugars. In Vadamanappakkam, it was quite evident that those
individuals who had significantly lower incomes did not generally buy as much dairy products or
fresh produce – two significant food groups that contribute to healthy diets (Behrman and
Deolalikar 1987, O’Brien et al 2004). Interestingly, those surveyed expressed a stronger
preference to spend on meats over dairy products and fresh produce despite the significant
expense it caused for many. This may be due to structural shifts in diets with traditionally
vegetarian societies moving towards non-vegetarian diets for a variety of reasons including
adoption of Western culture, renunciation of religious strictures, and perceptions of food choices
that most aided in physical labor (Huang and Bouis 1996). However, the most important feature
binding the various explanations for the effect of income on food expenditure is ultimately the
personal value placed on food as a basic need and the concurrent attitudes that each individual
has towards purchasing foods (Furst et al. 1996).
Kamini P. Iyer Food Security and Rural Indian Agriculture Spring 2013
15
Education level
Education levels to a large extent did not affect food expenditure except in the case when
heads of households did not have any education as it strongly indicated a lack of technical skills
that would provide increased wages. For producers, those who had completed up to secondary or
higher levels of education pointed to higher farm productivity which may be because of access to
different and more appropriate agricultural practices (Lockheed et al. 1980). Consumers and
distributors were also perhaps more informed actors in the food system because of basic skills
that were provided by their primary level education such as writing, reading, and fundamental
mathematical skills (Behrman and Wolfe 1982).
Factors that could have affected education patterns include gender and cultural norms. In
the households surveyed, women were seen as the key decision making entity within households
including decision made about food purchases. However, head of households for which
education levels were measured were generally for the eldest male of the household. This
disconnect between those who were generally responding to the survey and the women who
made the decisions about food purchases decreases the certainty of the impact education levels
have on food purchases. At best, the education level of head of households may be treated as a
proxy for education levels experienced by all individuals in that household which in turn would
validate any data received on food purchases. Therefore, despite the significance education levels
may have on producers and distributors food expenditures, education levels of head of
households were not as indicative of consumer choices by the women and consequently, food
expenditure patterns by consumers from this study (Lockheed et al 1980, Behrman and Wolfe
1982, Huang and Bouis 1996). Fundamentally, education levels by themselves cannot be seen as
a singular indicator of food expenditures. Rather, a combination of gender, values, and education
may provide a more accurate assessment.
Role in the food system
The most pronounced effect of differences in food expenditure resulted from the varied
roles in the food system. Consumers, compared to producers and distributors, spent a larger
percentage of their income on food purchases as they are at the end of the food system chain with
Kamini P. Iyer Food Security and Rural Indian Agriculture Spring 2013
16
no buffering capacity against external influences, such as food prices, on food expenditure
patterns (Parry 1990).
Specifically in Vadamanappakkam, the agricultural industry was characterized by large
export-oriented units such as grains, rice, wheat, etc. Few individuals grew vegetables and far
less claimed to be self-sufficient off their land. Essentially, limited crop varieties along with local
labor shortages and lack of small-farm production created opportunities for distributors to control
the prices of a majority of consumable goods (Tacoli 2003). Furthermore, it allowed them to
keep those food products they themselves needed without incurring a large loss to their income.
Producers, on the other hand, were highly dependent on market prices to determine the
success and value of their crops for any given year (Parry 1990). Especially in
Vadamanappakkam, producers grew crops that are encouraged by the national government to be
grown in surplus so as to provide subsidized food to rural populations through ration stores
throughout India (Sarma and Gandhi 1990, Kapila 2009). By doing this, not only did they
prevent themselves from becoming self-sufficient, but also were playing to highly volatile
market demands from around India (Kapila 2009). As a result, their income highly fluctuated and
in turn, expenditure on food as a percentage of their income varied immensely.
Consumers, unlike producers and distributors, had the misfortune of being subject to both
the market and natural constraints faced by producers as well as the whims of distributors who
could inflate prices of food products to consumers for no apparent reason. With limited options
of buying food in Vadamanappakkam, most individuals would have to go to these vendors.
For those with higher incomes, these incremental changes would not have a great impact
on the percentage of their income they would spend on food. However for those with lower
incomes, this would be quite significant and financial implications for these household would be
far greater and beyond the scope of this paper (O’Brien et al 2004).
Use of ration cards
The use of ration cards was not significant as most individuals in this food system were
provided with basic food supplies by the public distribution system (PDS) mandated by the
Government of India. The public distribution system is a food security program that subsidizes
major commodities, including food, for lower income families, especially in rural India (Sarma

Kamini P. Iyer Food Security and Rural Indian Agriculture Spring 2013
17
and Gandhi 1990, Shashidhar and Kumaraswamy 2009). In Vadamanappakkam, almost every
single household surveyed had a ration card that was used regularly. Only 4 individuals did not
have ration cards of which two were in the process of applying for one and the other two had lost
theirs. Therefore, there can be no isolated conclusions drawn from this variable. However, it is
important to consider the alternative where no food subsidies existed for any rural population in
India. In such a case, villagers from Vadamanappakkam would have spent a significantly larger
percentage of their income on food as they would need to purchase everything at full value
(Sarma and Gandhi 1990, O’Brien et al 2004).
Additionally, the allocations of food commodities through the public distribution system
are consistent throughout India disregarding regional indigenous food consumption patterns
(Shashidhar and Kumaraswamy 2009). In the surveys conducted, of those who used the ration
system, roughly 90% of individuals purchased additional rice – a dietary staple of South Indian
cuisine. Vadamanappakkam’s population profile is undoubtedly rural. However, with the wide
range of poverty levels, most of Vadamanappakkam’s population fall just above the poverty line
and therefore, many low income families are subject to the same allocations as those in higher
income brackets. As a result, food security which is supposed to be guaranteed to the vulnerable
populations is not accurately granted by this system to no fault of the local population (Rao
2008, Shashidhar and Kumaraswamy 2009). Moreover, this system only provides access in the
traditional sense where food is “made available”. The ability to purchase these foods is
completely independent of this program and can be better addressed through employment
policies targeted towards the purchasing power capabilities of rural populations (Rao 2008).
Limitations and future directions
An isolated case study of rural agriculture, the findings in Vadamanappakkam must be
assessed relative to its limitations. Specifically, conducting this survey as part of a larger study, I
and the team had very limited intentions of analyzing rural agricultural patterns. As a result, key
factors like gender were not analyzed. Moreover, the food system in Vadamanappakkam is not as
static as it is assumed to be for the simplicity of analysis. In fact, there are traveling vegetable,
fruit, and meat vendors that are constantly traveling through the village at different times of the
year adding another layer of complexity to this system. Perhaps a more randomized and stratified

Kamini P. Iyer Food Security and Rural Indian Agriculture Spring 2013
18
sampling by both income and role would have been more appropriate for this research than just
income levels.
However, Vadamanappakkam can be used as an example of rural agricultural system in
this region as the political, economic, and social forces interacting with one another are quite
similar. Again, to extrapolate such studies to larger populations comes with newer variables that
must be adequately assessed. Despite these limitations, Vadamanappakkam serves as a clear
example of what localized assessments can provide for understanding the larger agricultural
system in India and its implications for global food markets.
Broader implications and conclusions
Understanding regional trends in rural agricultural consumption patterns are important
when formulating specialized government policies and protections for such vulnerable
populations. Moreover, if more localized studies are conducted, population responses to the
possibility of reduced yields and increased food costs can be better assessed (Parry 1990,
Rosenzweig et al. 1993). Especially with recent global food shortages and increased food
prices, there is a high possibility for rural food insecurity to undermine the abil ity of India to
continue importing food for large populations (Parry 1990, O’Brien et al. 2004). With a
growing global agro-industry, it is imperative that the impacts of changing food systems in
India are understood (O’Brien et al. 2004). More fundamentally, domestic trends and long-
term food security must be effectively evaluated to understand its implications for both the
local and global population (O’Brien et al. 2004). By looking at Vadamanappakkam as a
simple case study for localized assessment of food security, other regions may follow suit and
allow for a more thorough understanding of domestic food security in India (Parry 1990,
Rosenzweig et al. 1993, O’Brien et al. 2004). Appropriate policy measures , specifically those
guiding the public distribution system, may then be taken to promote domestic food security
and in turn sustain the demands of the global agro-industry (O’Brien et al. 2004).

Kamini P. Iyer Food Security and Rural Indian Agriculture Spring 2013
19
ACKNOWLEDGMENTS
I would like to thank the entire ES 196 team – Tina, Kurt, Rachael, Anne and Carrie – for their
enthusiastic support and dedication in guiding me through this project. I would especially like to
thank Rachael Marzion for her patience and never-ending encouragement in completing this
project. This project would not have been possible without the entire Project RISHI (Rural India
Social and Health Improvement) team, specifically the Berkeley chapter for their efforts
throughout this entire process. Thanks to Angie Zhu for helping me with my statistical analysis.
Finally, thank you to “Access International,” my thesis peer group – Abraham Diaz, Grecia
Elenes, William Mumby, and Shehan Peiris – for all the revisions, edits, and encouragement.
REFERENCES
Adelman, I. and G. Dalton. 1971. A factor analysis of modernization in village India. The
Economic Journal 81:563-579.
Aggarwal, P.K. and R.K. Mall. 2002. Climate change and rice yields in diverse agro-
environments of India II effect of uncertainties in scenarios and crop models on impact
assessment. Climatic Change 52:342.
Baviero, M. and W. Bello. 2009. Food Wars. Monthly Review 61: 1-3.
Behrman, J.R. and A.B. Deolalikar. 1987. Will developing country nutrition improve with
income? A case study for rural South India. Journal of Political Economy 95:492-507.
Behrman, J.R. and B. L. Wolfe. 1982. More evidence on nutrition demand: Income seems
overrated and women’s schooling underemphasized. Journal of Development Economics
14: 105-128.
Fischer G., M. Shah, F.N. Tubiello, and H. Velhuizen. 2005. Socio-economic and climate change
impacts on agriculture: an integrated assessment, 1990–2080. Philosophical Transactions
of the Royal Society: Biological Sciences 360:2067.
Furst, T., M. Connors, C.A. Bisogni, J. Sobal, and L.W. Falk. 1996. Food choice: a conceptual
model of the process. Appetite 26: 247-266.
Gregory, P.J., J.S.I. Ingram, and M. Brklacich. 2005. Climate change and food security.
Philosophical Transactions of the Royal Society B: Biological Sciences 1463: 2139-148.

Kamini P. Iyer Food Security and Rural Indian Agriculture Spring 2013
20
Huang, J. and H. Bouis. 1996. Structural changes in the demand for food in Asia. International
Food Policy Research Institute 41: np.
Insam, H. 1990. Are the soil microbial biomass and basai respiration governed by the climatic
regime? Soil Biology and Biochemistry 22:525-532.
Kapila U. 2009. Output and productivity growth in Indian agriculture. Pages 45 In K. L. Krishna
and U. Kapila, editors. Readings in Indian Agriculture and Industry, Academic
Foundation, New Delhi.
Krishna K. K., K.K. Rupa, R.G. Ashrit, N.R. Deshpande, and J.W. Hansen. 2003. Future
scenarios of extreme rainfall and temperature over India. Proceedings of the Workshop
on Scenarios and Future Emissions, Indian Institute of Management (IIM), Ahmadabad,
NATCOM Project Management Cell, Ministry of Environment and Forests,
Government of India. New Delhi, India.
Kumar, K.S.K. and J. Parikh. 2001. Indian agriculture and climate sensitivity. Global IPCC
SRES (2000). Summary for Policymakers. Intergovernmental Panel on Climate
Change: Special Report on Emissions Scenarios. Environmental Change 11:152.
Lockheed, M.E., T. Jamison, and L.J. Lau. 1980. Farmer education and farm efficiency: a
survey. Economic Development and Cultural Change 29: 37-76.
O'Brien K., R. Leichenko, U. Kelkar, H. Venema, H. Tompkins, A. Javed, S. Bhadwal, S.
Barg, L. Nygaard, and J. West. 2004. Mapping vulnerability to multiple stressors:
climate change and globalization in India. Global Environmental Change-Human and
Policy Dimensions 14:303-313.
Parry, M.L. 1990. Climate change and world agriculture. Earthscan Publications Limited,
London, England.
Powlson, D. S. and P.C. Brookes. 1987. Measurement of soil microbial biomass provides an
early indicator of changes in total soil organic matter due to straw incorporation. Soil
Biology and Biochemistry 19:159-164.
Rao, E.V.P. 2008. Food Security and Public Distribution System in India: A Review. Asia-
Pacific Journal of Rural Development 18: 175-186.
Rosenzweig C., M.L. Parry, G. Fischer, and K. Frohberg. 1993. Climate change and world
food supply. Research Report. Environmental Change Unit, University of Oxford.
Oxford, England.
Roy, J. 2006. The economics of climate change. A Review of Studies in the Context of South
Asia with a Special Focus on India. Jadavpur University. Kolkata. India.

Kamini P. Iyer Food Security and Rural Indian Agriculture Spring 2013
21
Rupa, K.K., J.H. Christensen, B. Hewitson, A. Busuioc, A. Chen, X. Gao, I. Held, R. Jones, ,
W.-T. Kwon, R. Laprise, V. Magaña Rueda, L. Mearns, C.G. Menéndez, J. Räisänen, A.
Rinke, A. Sarr and P. Whetton. 2007. Regional climate projections. Climate Change
2007: The Physical Science Basis. Contribution of Working Group I to the Fourth
Assessment Report of the Intergovernmental Panel on Climate Change. Cambridge
University Press, New York, New York, USA.
Sarma, J.S. and V.P. Gandhi. 1990. Production and consumption of foodgrains in India:
Implications of accelerated growth and poverty alleviation. International Food Policy
Research Institute 81: 1-115.
Shashidhar, K.C. and A.S. Kumaraswamy. 2009. Impact of Public Distribution System on
Traditional Food System. Mysore Journal of Agricultural Sciences 43:115-118.
Shukla, P.R., S. Sharma, N.H. Ravindranath, A. Garg, and S. Bhattacharya. 2003. Climate
change and India: vulnerability assessment and adaptation. Universities Press,
Hyderabad, Andhra Pradesh, India.
Sinha, S. X., N. H. Rao, and M. S. Swaminathan. 1988. Food security in the changing global
climate. Center for International Earth Science Information Network, New Delhi, India.
Tacoli, C. 2003. The links between urban and rural development. Environment and Urbanization
15:1-12.
Related Documents