FOOD SECURITY ASSESSMENT IN SYLHET HAOR AREA EMPHASIZING HOMESTEAD PRODUCTIVITY AND AGRICULTURAL RESOURCE UTILIZATION A THESIS Submitted to Bangabandhu Sheikh Mujibur Rahman Agricultural University in partial fulfillment of the requirement for the degree of MASTER OF SCIENCE IN AGRONOMY by Md. Rukunuzzaman Talukder Registration No. 08-05-2110 Advisory Committee Major Professor and Chairman Prof. Dr. Md. Rafiqul Islam Research Supervisor Dr. Md. Altaf Hossain Member Dr. M. A. Mannan Dr. Md. Mizanur Rahman BANGABANDHU SHEIKH MUJIBUR RAHMAN AGRICULTURAL UNIVERSITY GAZIPUR-1706, BANGLADESH WINTER 2014

Welcome message from author
This document is posted to help you gain knowledge. Please leave a comment to let me know what you think about it! Share it to your friends and learn new things together.
Transcript
FOOD SECURITY ASSESSMENT IN SYLHET HAOR AREA EMPHASIZING
HOMESTEAD PRODUCTIVITY AND AGRICULTURAL RESOURCE
UTILIZATION
A THESIS
Submitted to
Bangabandhu Sheikh Mujibur Rahman Agricultural University
in partial fulfillment of the requirement
for the degree of
MASTER OF SCIENCE IN
AGRONOMY
by
Md. Rukunuzzaman Talukder
Registration No. 08-05-2110
Advisory Committee
Major Professor and Chairman
Prof. Dr. Md. Rafiqul Islam
Research Supervisor
Dr. Md. Altaf Hossain
Member
Dr. M. A. Mannan
Dr. Md. Mizanur Rahman
BANGABANDHU SHEIKH MUJIBUR RAHMAN AGRICULTURAL UNIVERSITY
GAZIPUR-1706, BANGLADESH
WINTER 2014
ii
ABSTRACT
Haor area of Sylhet Basin is considered critical for its special nature, although it provides
livelihood to the local communities. In spite of making considerable socioeconomic progress for
the last two decades in Sylhet haor area, it still has the largest number of poor of which a
significant portion is chronically malnourished and suffering from silent disaster. In view of
assessing the status of food security, a study was conducted in five unions of Ajmirigonj upazila
under Habigonj district in Sylhet haor area in respect of homestead soil productivity and
agricultural resource utilization during the period from October 2013 to June 2014. A household
survey was conducted using structured questionnaire covering 60 households. Relevant primary
and secondary data were also collected during the study period. Demographic characteristics in
the study area showed that the majority of the respondents were old aged having higher level of
education, large family size having small farms, low annual income, high farming experience and
farming-based occupation. It is observed that medium to rich people are increasing and with
subsequent decrease in poor people. The most notable change of land was the increase in
settlement area, and decrease in permanent freshwater lakes or rivers. Haor water is mostly
polluted during the dry season and the people have limited access to pure drinking water. Flash
flood has been reported to be the major natural disaster. Boro rice-fallow-local Aman is the major
cropping pattern in the area. The topsoil and subsoil fertility of the homestead area varied greatly
continuing remarkably low amount of nitrogen and organic carbon in general. A significant
differences were found in organic carbon, nitrogen, phosphorus , zinc, sulfur contents between
topsoil and subsoil. Significant positive relationships were found between various nutrient
contents and fruits yield. The area is dominated by crops, followed by livestock and poultry,
fishery and homestead agro-forestry. The technology adoption indices indicate that the uses of
chemical fertilizer, low lift pump and power tiller were important adopted technologies in crop-
based farming system. The rearing of modern poultry breed in livestock and poultry farming, poly
culture of fish and cultivation of fast growing forest tree in homestead were the leading
technologies practiced by the respondents. Among twelve food items, rice consumption of the
respondents was much higher and estimated to be 32 percent higher compared to recommended
dietary need, but majority of them remained below optimum level of calorie intake. During natural
calamities, about 17 percent of the respondents failed to get available food for consumption. The
respondents fulfilled their 84 percent dietary needs from the farming enterprises. However, the
dominant contributor of farming enterprises was crops followed by fisheries and livestocks. The
major problems of the study area were loss of resources due to natural calamities, high price and
inadequate supply of agricultural inputs. From the study, it is concluded that there are enormous
scopes of utilizing land and water resources and fallow land under homestead area for ensuring
household food security in haor area of Sylhet Basin.
iii
ACKNOWLEDGEMENTS
All praises and thanks are for ALMIGHTY ALLAH, the beneficent, the merciful, whose
blessings and exaltation flourished my thoughts and thrived my ambitions to have the cherish fruit
of my modest efforts in the form of this write-up from the blooming spring of blossoming
knowledge. I offer my humblest thanks from the deepest core of my heart to the HOLY
PROPHET, the city of knowledge, HAZRAT MUHAMMAD (Peace Be upon Him) for humanity.
The author expresses the deep sense of gratitude to his honorable Major Professor and
Chairman of the Advisory Committee Dr. Md. Rafiqul Islam, Professor, Department of
Agronomy, Bangabandhu Sheikh Mujibur Rahamna Agricultural University (BSMRAU) Gazipur-
1706 under whose dynamic supervision, propitious guidance, keen interest, philanthropic attitude
and encouragement, the research work was carried out.
The author also sincerely wishes to express deep sense of respect, gratitude and high
appreciation to his honorable Research Supervisor Dr. Md. Altaf Hossain, Principal Scientific
Officer, Soil Resource Development Institute (SRDI), Krishi Khamar Sarak, Dhaka-1215 for his
valuable suggestions and comments that had provided an incentive to finish this piece of work.
Thanks are extended to the Advisory Committee Members Dr. Abdul Mannan, Associate
Professor, Department of Agronomy and Dr. Md. Mizanur Rahman, Associate Professor,
Department of Soil Science, BSMRSU for their valuable advice, encouragement and fruitful
suggestions during the research work. The author expresses heartfelt thanks to all other honorable
teachers of the Department of Agronomy, BSMRAU for their valuable teaching, generous help
and suggestions during the course of study.
The author expresses especial and earnest thanks to BAS-USDA Collaborative Research
Project personnel Md. Tariq Hassan, Former Director General, Department of Agricultural
Extension (DAE) and Dr. Md. Abdul Mannan, Chief Instructor, DAE for their valuable
suggestions, co-operation and encouragement during the research work. The author must extend
his admiration and appreciation to the BAS-USDA Collaborative Research Endeavor Program for
providing fellowship and research funding under the project of “Modeling of Year Round Fruit
Production in the Haor Homestead of Bangladesh” to conduct this research.
The author extends his special gratefulness Dr. Md. Enamul Haque, Professor, and
Mohammad Ziaul Hoque, Department of Agricultural Extension and Rural Development,
BSMRAU. The author takes this privilege to express his thanks to the staff of the Department of
Agronomy, BSMRAU and Agricultural Extension, DAE, Soil Science, SRDI and BSMRAU for
their sincere help and co-operation.
His heartiest thanks and gratefulness are also extended to my elder brothers, beloved friends,
younger brother, well-wishers specially to Mahbub Islam, Kazi Khayrul Basher, Md. Meftahul
Karim, Hanif uddin, Ranju Ahmed, Asif uddin, Mahfuz Imran, Nazmul Hasan, Saiful Islam,
Abdullah Al Mamun, Torikul Islam who inspired and helped me during the research.
Finally, the author expresses special appreciation and indebtedness to his beloved father Md.
Mominul Islam and mother Rowshanara Begum and also all other family members especially my
uncle Md. Ferdous Talukder and my aunt Selina Begum whose sacrifice and inspiration,
encouragement and continuous blessing paved the way to his higher education.
May ALLAH let this for the good of the humanity to the fulfillment of the aspiration of all
referred to here.
Winter 2014 The author
iv
CONTENTS
Page
ABSTRACT
ACKNOWLEDGEMENTS
CONTENTS
LIST OF TABLES
LIST OF FIGURES
ii
iii
iv
vi
vii
CHAPTER-I: INTRODUCTION 1
CHAPTER-II: REVIEW OF LITERATURE 3
2.1 Livelihood activities in haor area 3
2.2 Land resource availability trends in haor area 4
2.3 Farming system in haor area 4
2.4 Homestead vegetation in haor area 5
2.5 Homestead soil productivity in haor area 5
2.6 Household food security in haor area 6
CHAPTER-III: MATERIALS AND METHODS 8
3.1 Locale of the study 8
3.2 Population and sample size 8
3.3 Instrument for collection of data 9
3.4 Procedure of data collection 9
3.5 Collection and analysis of soil samples 9
3.6 Measurement of variables 9
3.7 Measurement of population characteristics 9
3.8 Land use change over time 10
3.9 Hydrological status in the Haor area 10
3.10 Cropping pattern adoption index 10
3.11 Ownership of livestock and poultry 11
3.12 Fishing system adoption index 11
3.13 Ownership of fruit, timber, and fuel wood trees 11
3.14 Extent of adoption of farming technology 11
3.15 Food consumption and calorie intake 12
3.16 Access to food 12
3.17 Contribution of farming enterprises to household food security 12
3.18 Problem confrontation 13
CHAPTER-IV: RESULTS AND DISCUSSION 14
4.1 Socio-economic and demographic profile of the respondents 14
4.1.1 Age 14
4.1.2 Education 14
4.1.3 Family size 15
4.1.4 Farm size 15
4.1.5 Farming experience 16
4.1.6 Occupation 16
4.1.7 Monthly income 16
4.2 Land use changes of Sylhet haor 17
4.2.1 Pattern of land use change 17
4.2.2 Change of hydrological status 17
4.3 Pattern of farming system 18
4.3.1 Cropping system 18
4.3.2 Livestock system 19
v
4.3.3 Fisheries system 20
4.3.4 Homestead forestry system 20
4.4 Homestead soil productivity 21
4.4.1 Homestead soil nutrient status 21
4.4.2 Comparison between topsoil and subsoil nutrients 25
4.4.3 Soil nutrient and fruit yield relationship 26
4.5 Adoption of farming technology 29
4.6 Food security status of households 31
4.6.1 Food consumption 31
4.6.2 Food security status as calorie intake 32
4.6.3 Food security status as access to food 32
4.6.4 Contribution of farm enterprises to household food security 32
4.7 Problem confrontation of the haor land farmers 34
CHAPTER-V: SUMMARY AND CONCLUSIONS 36
REFERENCES 37
vi
LIST OF TABLES
Sl. Page no.
no.
1. Properties determined and methods used for analyzing soil samples 9
2. Conversion of some cash items into energy 13
3. Distribution of the respondents according to age 14
4. Distribution of the farmers according to farm size 15
5. Distribution of the respondents according to farming experience 16
6. Changing scenario of monthly income of the respondents over time 17
7. Change in major land use/land cover pattern in the study area over time 17
8. Changing scenario of hydrological status in the study area over time 18
9. Extent of practice of cropping pattern by the farmers in haor areas 19
10. Distribution of the farmers according to ownership of livestock and poultry
on the basis of price
19
11. Extent of practice of fishing systems by the farmers in the study areas 20
12. Comparison of topsoil and subsoil nutrient contents in the homestead areas 26
13. Correction coefficient between soil nutrients contents 26
14. Correlation co-efficient between soil chemical properties and yield of major
fruit trees
28
15. Distribution of the respondents according to adoption of farming technology 29
16. Technology adoption index (TAI) in crop sector 29
17. Technology adoption index (TAI) in livestock and poultry sector 30
18. Technology adoption index (TAI) in fishery sector 31
19. Technology adoption index (TAI) in homestead agroforestry sector 31
20. Consumption of food items by the respondents 32
21. Food security status of the respondents according to calorie intake 33
22. Distribution of the respondents based on number of meals taken per day 33
23. Contribution of farming enterprises to household food security 33
24. Contribution of the major farming enterprises to the respondents’ household
food security
34
25. Problem confrontation index (PCI) of study area farmer 35
vii
LIST OF FIGURES
Sl.
no.
Page no.
1. Map showing (a) Sylhet haor area in Bangladesh (b) Azmiriganj upazila (sub-
district) of Habiganj district and (c) Five unions of Azmiriganj upazila with
homestead sites
8
2. Distribution of the respondents according to educational level 14
3. Distribution of the respondents according to family size 15
4. Distribution of the respondents according to occupation. 16
5. Distribution of the respondents according toownership of fruit trees 20
6. Distribution of the respondents according to ownership of timber trees 21
7. Distribution of the respondents according to ownership of fuel wood trees 21
8. Distribution of farmer’s homestead according to soil test value interpretation
of soil reaction (pH) based on critical limits
22
9. Distribution of farmer’s homestead according to soil test value interpretation
of organic carbon based on critical limits
22
10. Distribution of farmer’s homestead according to soil test value interpretation
of nitrogen based on critical limits
23
11. Distribution of farmer’s homestead according to soil test value of phosphorus
based on critical limits
23
12. Distribution of farmer’s homestead according to soil test value of potassium
based on critical limits
24
13 Distribution of farmer’s homestead according to soil test value interpretation
of zinc based on critical limits
24
14. Distribution of farmer’s homestead according to soil test value interpretation
of sulfur based on critical limits
25
15. Comparative contribution of farming enterprises to the respondents’
household food security
34
1
CHAPTER I
INTRODUCTION
In Bangladesh, land availability for crop production is in decreasing trend. A significant
quantity of agricultural land is being transformed to rural and urban settlements including
homestead, ponds and roads (Hasan et al., 2013). Therefore, proper utilization of homestead area
for increasing agricultural productivity is a necessity. Among many critical agro-ecological area of
Bangladesh, haor area in greater Sylhet is considered important for its special nature. About 30
percent of the population in haor area lies below the lower poverty level. The majority of
households belonging to the poor and extreme poor categories are suffering from significant
shortages of food. Data on child malnutrition shows that 55 percent children under-five in the haor
area are underweight against 41 percent in general for Bangladesh. The haor area covers about 15
percent of the total area of Bangladesh, of which 12 percent is covered by settlement. Due to
special geographical settings, the housing and settlement patterns are different from other parts of
the country. Almost all land above the maximum flood level is under human settlement. In the
area, about 52 percent of households contain agricultural land where different types of crops and
trees are grown. However, some areas in the homestead remain fallow for a considerable period
and some are not properly utilized due to lack of information on production potentials of land,
soils as well as hydrology and agro-climatic conditions.
Wetland ecosystems are of great importance to Bangladesh because of their extent and critical
economic and ecological role that they play in sustaining life and livelihoods in the country (Khan
et al., 1994). Bangladesh possesses vast area of wetlands including rivers and streams, freshwater
lakes and marshes, haors, baors, beels, water storage reservoirs, fish ponds, flooded cultivated
fields and estuarine systems with extensive mangrove swamps. The haors, baors, beels and jheels
are of fluvial origin and are commonly identified as freshwater wetlands. These freshwater
wetlands occupy four landscape units-floodplains, freshwater marshes, lakes and swamp forests.
Bangladesh is estimated to possess seven to eight million hectares of wetlands in the form of
permanent rivers and streams, estuarine and mangrove swamps, shallow lakes and marshes, large
reservoirs, small ponds and tanks, shrimp ponds and seasonally flooded flood plains (Nishat,
1993).
Haors are bowl-shaped depressions between the natural levees of a river subject to recurrent
monsoon flooding and are mostly located in the north-eastern region of the country, covering an
area of approximately 24,500 km2. It consists of about 47 major haors and 6300 beels of varying
size of which about 3500 are permanent and 2800 are seasonal (Hussain and Salam, 2007). The
haor dwellers are some of the poorest and most vulnerable people, particularly those who live on
the marooned island/adjacent to river banks.
The overall scenario of food security in Bangladesh indicates inadequate calorie intake,
malnutrition and hidden hunger. Many households fail to meet the basic food requirements. The
rural areas where head of households’ income is less than one dollar per day experience acute food
shortages. In haor area farmers face food shortages especially during pre-harvesting/lean periods.
Rice is the staple food which provides 68 percent of the calorie and 54 percent of the protein
needs. Approximately 32 million of the total population in Bangladesh cannot afford an average
daily intake of more than 1800 kilocalories (USAID, 2007). USAID recommended that the
average daily calorie intake should be 2828 Kcal for the countries like Bangladesh. It indicates that
most of the households in Bangladesh particularly in haor rural areas suffer from malnutrition.
Mostly children and the women in the rural households face this acute malnutrition.
There are little employment opportunities in haor areas where most of the people make their
living from cropping, raising cattle and catching fish. Land is the most important resource in the
haors, but poor households lack the support they need to utilize it fully, including poor access to
technical advice and training, agricultural inputs and marketing facilities (Mahmud, 2008).
Promoting sustainable development in haor areas of Bangladesh poses important challenges.
Poverty caused by traditional agriculture and environmental degradation in the haor areas of
Bangladesh needs to be addressed by appropriate policies and programs to develop an
2
environmentally compatible and economically viable agricultural systems. During 1990s, the
international NGOs, such as CARE and Oxfam developed sustainable livelihood models
considering the need to broaden the scope of development project. However, policies and
programs aimed at promoting alternative land use systems in Bangladesh failed to achieve
expected goals because of inadequate understanding of the changing trends in existing land use
systems and forces driving the changes.
Farmers in the haor area are engaged in increasing agricultural production and income by
utilizing their available resources around the homestead. For maximizing and diversifying as well
as sustaining the production potentials in homestead areas, acquiring data and information on soil
and land resources is imperative. However, such information is scanty, which is considered as an
impediment for up scaling new technologies and practicing modern production packages in the
area. The suitability assessment of various plant species especially fruits trees to be grown in
homestead area based on land and soil characteristics, and their quality has not been done hitherto.
Moreover, there are lack of information on knowledge gaps between farmers practice and
recommended management practice for fruit trees and other plant species in the homestead area. In
this regards, appropriate management packages needs to be disseminated for increasing fruit
production in homesteads.
Furthermore, there is still very little quantitative information on health, nutrition, and food
security of haor dwellers. There are dearth of study reports addressing the management of farming
systems and the food security aspects in haor areas. In this context, it is indispensable to
understand the characteristics and potentiality of homestead land and soils, and agricultural
resources towards household food security in selected areas in haor region of Bangladesh. Taking
the above facts into consideration, a specific area of Azmiriganj Upazila was selected for the study
aiming at:
i. inventorizing agricultural resources at farm level;
ii. evaluating homestead productivity emphasizing soil fertility and fruit productivity;
iii. assessing technology adoption in enhancing productivity of farm enterprises; and
iv. assessing food security in terms of resource utilization, and food availability,
consumption and demand in the farming community.
3
CHAPTER II
REVIEW OF LITERATURE
2.1 Livelihood activities in haor area
The haor areas in Sylhet basin is located in the north-eastern region of Bangladesh. It is
considered as a wetland ecosystem having international importance. There are 423 small and large
haors in Bangladesh comprising an area of about 8000 km2 dispersed in the districts of
Sunamgonj, Sylhet, Moulvibazar, Hobigonj, Netrokona and Kishoreganj (Alam et al., 2010;
BHWDB, 2011). Haor is a highly productive natural source of livelihoods that supports millions
of poor people and plays a vital role in supplying protein to human diets. It is also one of the major
sources of livelihoods particularly for fishing, cultivating food crops, vegetables, and pasture lands
(BCAS, 2005). The wetlands are generally used for cultivation, while it also works as a back-water
reservoir during the monsoon (IUCN, 2010). Cultivation of rice during dry season is the major
livelihood activity in and around the wetlands of haor area (IUCN, 2011). In Bangladesh, about 76
percent of the population live in rural area and major parts of it is under various types of wetlands
including floodplains, haors, baors, and lakes (Kabir, 2006). The rural people are directly or
indirectly dependent on agriculture for their livelihoods. During winter, the haor basin is planted
with modern Boro paddy. In recent years, almost all seasonal wetlands came under modern rice
cultivation in winter. Poor people and the landless groups work in crop fields as daily labor or
cultivate rich people’s land as sharecropper for earning livelihood (Ahmed, 2008).
In haor area, fishing is the largest livelihood activity (Amin et al., 2007). Two million people
are fully engaged in fishing, handling, packaging, transporting, distribution and marketing of fish.
Moreover, about 10 million are part-time fishermen to supplement their income or live on fishing
for some part of the year. About 62 percent head of households are engaged in farming, 18 percent
as day labor, 8 percent in fishing and 2 percent in business (Nuruzzaman, 2004). Few families are
engaged in fuel wood and sand collection, bird trapping, duck rearing also. Kabir and Amin (2006)
reported that agriculture, collection of sand, stone and coal, small business, rowing passenger boats
and goods transportation are common activities in the haor area.
Floodplain fishing and fish related activities play a vital role to employ rural people (Amin et
al., 2007). When the people become unemployed due to less demand of labor in agriculture field,
the agriculture labors are engaged in floodplain fishing to earn livelihood expenditure. Some of the
fishermen are involved in making fishing gears and bamboo traps to protect their livelihoods
(Ahmed, 2008). The socio-economic census showed that 19 percent families are involved in
fishing as their primary occupation, while 54 percent as a secondary occupation. The average
annual per capita income from this sector is about BDT 5400 (Khan, 1993). Moreover, lack of
cultivable area due to prolonged flooding in the haor areas restricts livelihoods of local
communities (Sarma, 2010).
Sarma (2010) tried to explore the socioeconomic status and their dependency on its natural
resources of the people residing near deeply flooded haor areas. The local residents having an
annual average per capita income of BDT 3175 essentially depend on the wetlands for their
survival. Studies revealed that 32 percent households prefer fishing during the monsoon, while 37
percent prefer small business, 17 percent prefer beef fattening, 23 percent prefer handicraft. Many
people in haor areas are also involved in dairy and poultry farming also. There is a huge potential
for dairy and poultry farming especially the duck rearing in haor areas. Collection of fodder grass
for cattle from the haor is also an important livelihood activity of both poor and rich. The poor
people usually sell a portion of the collected grass to supplement their family income (Hossian and
Khan, 2006). About 5 percent households are engaged in rowing passenger boats. Boats are also
used in stone and coal collection and transportation (Ahmed, 2008; Hossian and Khan, 2006).
Women are also engaged in sewing and embroidery as alternative livelihood activities. All these
multifarious activities are important to the haor people for a reliable income throughout the year.
4
2.2. Land resource availability trends in haor area
Land use change has been a very important phenomenon on the ecosystems of many areas
(Metzger et al., 2006; Turner et al., 1997). Land use change directly influences the provisional
ecosystem services (food and timber), climate regulation, nutrient cycling and cultural identity
(Reid et al., 2005; Daily, 1997). Land use and land cover change has number of consequences such
as change in the atmospheric composition, biotic diversity, biological systems and its ability to
support human needs and environmental risk (Daniel, 2008). Foley et al. (2005) reported that
between 30-40 percent of the natural vegetation on the earth’s surface has been converted to
pastures and croplands, which are currently expanding by around 13 million hectares per year
(FAO, 2002). The effects of the land conversion on climate could be very important at regional
and global scales (Foley et al., 2003).
The haor ecosystem is changing and it makes the livelihood more vulnerable. Particularly the
agriculture sector is expected to be heavily influenced by land cover changes. Salauddin and Islam
(2011) estimated that water bodies of the haor area has been reduced by around 6.88 percent,
whereas, land area has been increased by 8.35 percent during the period of 2000 to 2008. It is
obvious that loss of biodiversity due to such conversion is a great threat for nature (Hoekstra et al.,
2005; Dirzo and Raven 2003; Sanderson et al., 2002; UNEP, 1995). Many of these changes are
driven by land use practices that feed a growing population, but affect other ecosystem services.
(Foley et al., 2005; MA, 2005; DeFries et al., 2004).
Besides anthropogenic activities, land cover of haor area can also be altered by other forces
such as weather, flooding, climate fluctuations, and ecosystem dynamics. Both human-induced and
natural land cover changes can influence the global change because of its interaction with
terrestrial ecosystem (Houghton, 1994), biodiversity (Sala et al., 2000) and landscape ecology
(Reid et al., 2000). Land cover changes may increase the risk of flash floods which is historically
very common in haor area where Boro rice is the major crop grown during winter season.
Occurrence of flash flood at the later stages of Boro rice affects the farmers who are mostly
dependent on Boro rice production (Mas et al., 2004; Zhao et al., 2004).
2.3 Farming system in haor area
Farming is an activity carried out by the members of households that represent managerial units
organized for the economic production of crops, livestock, and fishes (Ruthenberg, 1980).
According to CGIAR (1986), a farming system is a complicated interwoven mesh of soils, plants,
animals, implements, workers, other inputs, environmental influences with the strands held. Shaner
et al. (1982) defined farming systems in relation to Bangladesh situation as physical, biological
and socio-economic setting. Hossain (1988) found that the farmers in subsistent farming systems
generally maintain different enterprises in their farms for sustenance and they are very dynamic in
selecting enterprises and adopting technology.
In terms of farming system, crop production practices, and economic activities of haor areas
are quite different from those of the other parts of the country. The total cultivated area of haor
districts is about 1.26 million hectares of which about 66 percent is under haor. The farming
system of haor area is rice-based. Huda (2004) reported that almost 80 percent of this area is
covered by Boro rice, while only about 10 percent area is under transplanted Aman. Hybrid rice is
also grown in haor area and the area is increasing in different locations. (Das, 2004; Husain et al.,
2001). Agriculture is the main source of livelihood in haor area. Directly or indirectly, all other
sources of income in this ecologically disadvantaged area are subject to harvesting of crops. But
early flash floods often cause extensive damage to the crops. Cultivation of early maturing short-
duration rice variety would enable farmers to escape crop damage due to early flash flood. Lack of
water control dam also appeared to be an important problem in the haor areas.
Early flood and drought are the main constraints in growing modern Boro rice (Alam et al.,
2010). Though flood is the common phenomenon in the haor areas, the people have had an
experience about the seasonal and flash flood with its frequency and magnitude. Now-a-days they
are unable to predict the flood due to construction of different structures and embankments in the
upstream, and siltation of river beds as well as change in river flow. As Boro is damaged by early
5
flash flood, flood-controlling dams need to be constructed to prevent huge loss of Boro rice (Khan
et el., 2012)
3.4 Homestead vegetation in haor area
There are 25.53 million homesteads in Bangladesh (BBS, 2011). Homesteads provide some basic
household needs like fruit, food, shelter and cash. In Bangladesh, a large area of every homestead
remain fallow year after year, where plantation of diversified fruit trees is possible and farmers can
easily get year round fruits from their homestead gardens and consequently improve their
livelihood. Akinnifesi et al. (2004) emphasized the nutritive economic values of fruits, being rich
in minerals and vitamins, sold for cash income and supplement foods during famines and or in
emergencies.
The importance of homestead garden is also well recognized worldwide. In western Africa,
Irvingia gabonensi is a popular tree-fruit for home consumption and the other species are grown
for cash sale in local markets (Ayuk et al., 1999). The presence of fruit trees appeared to be most
closely related to subsistence in Soqotra Island. The number of large fruit trees declined as the
importance of crops destined for the market increased (Ceccolini, 2002). Farmers prefer to produce
fruit trees rather than multipurpose- or timber trees on their farms in Costa Rica (Marmillod, 1987)
and Honduras (Hellin et al., 1999). Low labor requirement was seen as an advantage and the
relatively free availability of forest-based timber- and fuel wood products as a limitation. In
Nicaragua, 37 percent space of homesteads have been found to be allocated for producing fruit
species and about 85 percent of the fruits so produced were used for home consumption and the
remainder for marketing (Mendez et al., 2001). In Jamaica, fruit was regarded as the second most
important product following timber based on importance of tree species that farmers usually
practiced in their homesteads (McDonald et al., 2003).
The above reviews clearly ascertain the importance of growing fruit trees on homestead areas
both for consumption and income generation. Many studies reveal that the biophysical interactions
between trees and crops in agroforestry systems have been relatively well studied (Rao et al.,
1998). However, such interactions between annual crops and fruit trees have seldom been studied.
On the other hand, economic performance and relative yields of mixed annual-fruit tree systems
have not been better studied and reported in Bangladesh. Akinnifesi et al. (2004) emphasized on
the conservation of genetic resources of homestead fruit trees and approached four basic steps: (i))
identification of priority species by communities and other users, (ii) participatory selection of
superior trees and naming them in situ, (iii) propagation and cultivation of trees as fruit orchards,
and (iv) dissemination and adoption.
The diversity of fruit species, species richness and relative prevalence of species were
investigated in the haor area of Bangladesh (Islam et al., 2011). They ranked the fruit species
according to their relative prevalence in five different unions viz Azmiriganj, Kakailcheo,
Bodolpur, Jolshukha and Sibpasha. Banana was found in abundance in all the unions except
Azmiriganj where betel nut was the most prevalent one followed by coconut, mango and date.
Mannan (2000) reported that mango was the most prevalent followed by guava, jackfruit and
coconut. Islam et al. (2011) emphasized that such study would provide the foundation for the
policy makers to understand the species richness, fruit species conservation, and socio-economic
importance of homestead as well as to formulate biodiversity conservation planning.
3.5 Homestead soil productivity in haor area
The homestead garden system is common in many countries of Asia including Bangladesh. These
gardens provide family nutrition, increase household income, act as buffer to food insecurity
during lean season and more importantly protect habitat and conserve soil (Landauer and Brazil
1990). It is reported that more than 60 varieties of fruits and vegetables are commonly cultivated in
homestead areas of Bangladesh. The choosing of types and mixing of species depend on household
food preferences, soil and climatic conditions, and availability of local planting materials and
seeds.
In India, Pandey and Singh (2009) studied soil fertility in three depths (0 -10, 10-20 and 20-30
cm) at two canopy positions under home garden trees: coconut palm (Cocos nucifera L.), clove
6
(Eugenia cariophyllata Thunb), and nutmeg (Myristica fragrans Houtt. Nees) spice and native
moist evergreen forest, where they described the variations in organic carbon (C), total nitrogen
(N) and phosphorus (P), mineral N and P, and exchangeable potassium (K), calcium (Ca), and
Magnesium (Mg) and microbial biomass C in soils in relation to leaf litter and root biomass of
three 20-year-old home garden. Zingore et al. (2007) measured the variability of soil fertility with
distance from homesteads on smallholder farms of different socio-economic groups on two soil
types in Zimbabwe. They observed that soil organic matter, available P and cation exchange
capacity (CEC) decreased with increasing distance from homestead on most farms. Soil available
P was particularly responsive to management, irrespective of soil type, as it was more concentrated
on the plots closest to homesteads on wealthy farms, compared with distant plots and all plots on
poor farms. There was a large gap in the amounts of mineral fertilizers used by the wealthiest
farmers and the poorest farmers. The wealthy farmers who owned cattle also used large amounts of
manure, which provide at least 90 kg N and 25 kg P (36 kg N ha−1
and 10 kg P ha−1
) per farm per
year. The poor farmers used little or no organic sources of nutrients.
Variability of soil fertility within, and across farms, poses a major challenge for increasing
crop productivity in smallholder systems in Africa. Impact of different soil fertility management
strategies on spatial soil fertility gradients was studied by Masvaya et al. (2010). They observed
that soil available P was higher in homestead (8-13 mg kg−1
) of resource-endowed farmers than on
crop field and all fields on resource constrained farms (2-6 mg kg−1
). Heterogeneity in soil fertility
in smallholder systems is caused by both inherent soil-landscape and human-induced variability
across farms differing in resources and practices. Soil fertility indicators in respect of C, N, P, K,
Ca, Mg content and pH decreased significantly with increasing distance from the homesteads
(Tittonell et al., 2012).
3.6 Household food security in haor area
Food security includes the ready availability of nutritionally adequate and safe foods as well as an
assurance of the ability to acquire suitable foods in socially acceptable ways. Webb et al. (2002)
stated that physical availability of food underscores the significance of production in order to
supply enough food for all people at all times. Maxwell (1995) stated that the concept of food
security is based on three distinct yet inter-related fundamental concepts: food availability, food
access and food utilization. These concepts together determine the food security status at any
level of analysis. A very few literature are available on food security, of which some are relevant
to the strategies adopted by the people suffering from food insecurity more frequently. The
literature on food security aspects of the people living in the haor areas is limited.
A number of studies focusing on the different aspects of food insecurity have been conducted
by Rahman and Khan, 2005; Halder and Mosley, 2004; Radhakrishna and Ravi, 2003; Talukder
and Quilkey, 1991. They have identified that lack of economic and social access to safe and
nutritious food items to meet daily dietary need are the major reason for food insecurity. Sarma
(2010) conducted detail studies on vulnerability issues and sustainable livelihood development in
haor area. He reported that 71 percent households were found effectively landless of which about
55 percent were absolutely landless and 17 percent households were migrated and 78.9 percent
haor households suffered from food insecurity mainly because of landlessness, mono-crop
culture, seasonal unemployment and natural calamities. The haor basin is poverty stricken where
more than 28 percent of the population lives below the poverty line (FSHB, 2012). The major
drivers of poverty in the haors are the prolonged deep flooding associated with settlement on
cramped islands, lack of easy communicating roads and predominantly growing a single rice crop
(Prance, 1997). Crop agriculture is the principal livelihood of the farmers who practice mono-
culture (FSHB, 2012). This single crop remains under constant threat of partial to complete
damage from early flash flood. The haor inhabitants face economic, social and technical
constraints in earning their livelihood. Optimum food security in haor areas can be ensured if
acclimatized species are introduced in the haor region with appropriate management alternatives
including seasonal floating vegetable garden. .
Fishing is observed to be the best optional source of income for the haor people. Besides
fishing, there is little work during non-crop season in the haor area (Gardener and Ahmed, 2006).
7
The haor area supports rich fisheries after flood water have receded. Apart from actually
professional fishermen, there are seasonal participants in fishing (Craig et al., 2004). Since they
are landless and marginal farmers, fishing has been conceived as a critical component of their
livelihood. Nobody is allowed to fish during monsoon in the disadvantaged area of haors to secure
a livelihood. As a result, the incidence of poverty is very high which is about 50 percent (Kam et
al., 2005). In some haor area, poverty varies from 61 to 81 percent (Rahman and Razzaque, 2000).
Although number of studies on food security is available in different ecologically critical areas
of Bangladesh, there is little information for haor areas of the country. The haor area of Sylhet
region is most vulnerable due to its geographical settings and food security aspects are most vital
that needs to be addressed based on available resources and their appropriate utilization.
Unfortunately, appraisal of various resources on spatial and temporal basis and holistic approach
of utilization of resources for improving livelihood of the rural community are still lacking.
Thus the present study was undertaken to evaluate the situation of food security of the people
living in selected areas of Azmiriganj Upazila through productivity assessment of homestead land
resources along with agricultural resource utilization.
8
CHAPTER III
MATERIALS AND METHODS
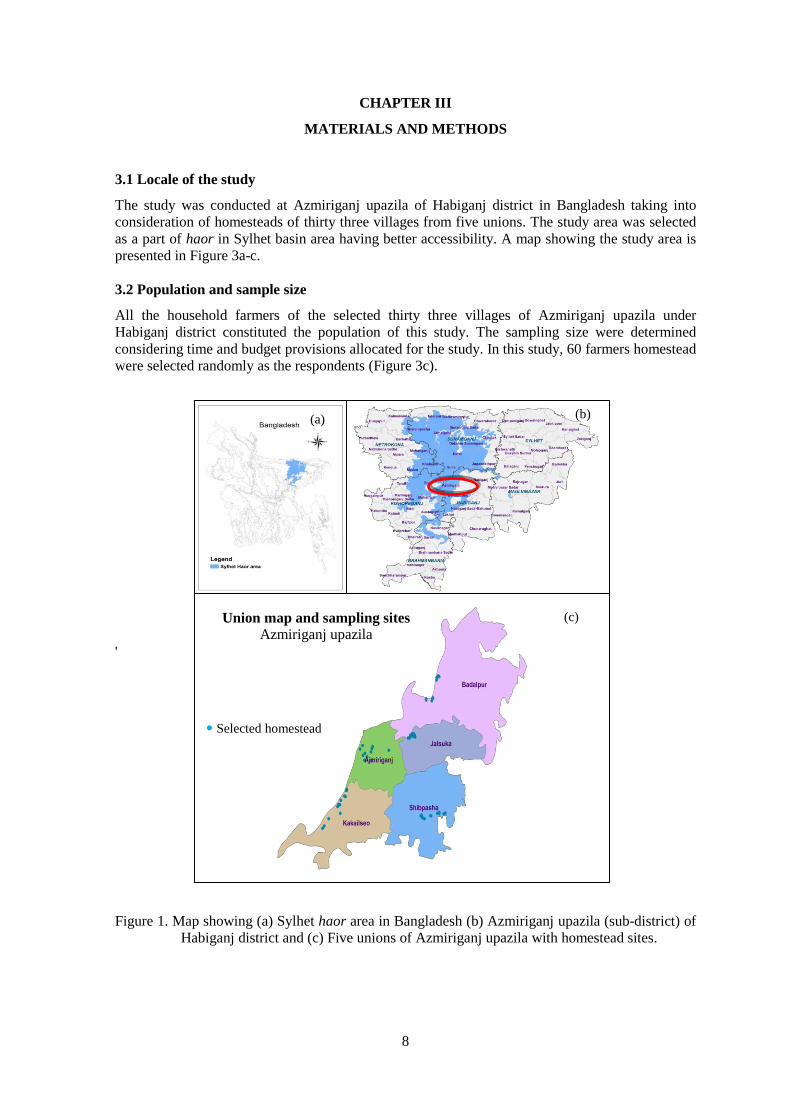
3.1 Locale of the study
The study was conducted at Azmiriganj upazila of Habiganj district in Bangladesh taking into
consideration of homesteads of thirty three villages from five unions. The study area was selected
as a part of haor in Sylhet basin area having better accessibility. A map showing the study area is
presented in Figure 3a-c.
3.2 Population and sample size
All the household farmers of the selected thirty three villages of Azmiriganj upazila under
Habiganj district constituted the population of this study. The sampling size were determined
considering time and budget provisions allocated for the study. In this study, 60 farmers homestead
were selected randomly as the respondents (Figure 3c).
'
Figure 1. Map showing (a) Sylhet haor area in Bangladesh (b) Azmiriganj upazila (sub-district) of
Habiganj district and (c) Five unions of Azmiriganj upazila with homestead sites.
(a)
(c)
(b)
Selected homestead
Union map and sampling sites Azmiriganj upazila
9
3.3 Instrument for collection of data
In order to collect information from the respondents, an interview schedule was prepared keeping
in mind the objectives of the study. The interview schedule contained both open and closed
questions. The questions were made easily understandable by the respondents. Besides, secondary
data including official records, reports, journals, proceedings and other related printed materials
were also used as base materials for the study. The interview schedule was pre-tested involving 20
respondents and modified through incorporating necessary amendments. Then the researcher
discussed with the Members of the Advisory Committee and the questionnaire was finalized. An
English version of the Interview Schedule has been presented in Appendix I.
3.4 Procedure of data collection
Data were collected through face to face interview of farmers during October 2013 to June 2014
by the researcher himself. To get valid and relevant information, the researcher made all possible
efforts to explain the purpose of the study to the respondents. Appointments with the interviewees
were made in advance. In case of failure to collect information from the respondents due to their
other business, re-visits were made with prior appointments. While interviewing any respondent,
the researcher took all possible care for establishing rapport with him so that the respondents feel
free to furnish with appropriate response to the questions and statements as included in the
schedule. Questions were asked in multiple ways so that the respondents could easily understand
the content of the questions. If any respondent was not clear about what was wanted from him,
supplementary questions were asked for further clarification. Data were also collected through
focus group discussion (FGD) and from available published and unpublished secondary sources.
3.5 Collection and analysis of soil samples
Soil samples were collected form 60 homesteads following standard methods. Collected samples
were air dried ground and sieved through a 2 mm (10 mesh) sieve. The composite samples were
stored in clean plastic bag for physical and chemical analyses following standard methods
provided by BARC (2012). Soil samples were analyzed for determining different properties
following standard protocols (Table 1).
Table 1: Properties determined and methods used for analyzing soil samples
Properties Methods of analysis References
Soil Texture Hydrometer Method Black, 1965
Soil reaction (pH) Glass electrode pH meter Jackson,1962
Organic carbon Wet oxidation method Page et al.,1982
Total Nitrogen micro-Kjeldahl method Jackson,1973
Available Phosphorus Colorimetrically Olsen et al ,. 1954
Exchangeable potassium Flame-photometer Jackson,1973
Available Sulfur Turbidimetrically Page et al.,1982
Available Zinc Atomic absorption
spectrophotometer.
Lindsay and Norvell,1978
3.6 Measurement of variables
In the present study, the researcher gathered and reviewed related literature to widen his
understanding about the nature and scope of the relevant variables.
3.7 Measurement of population characteristics
Age, education, family size, farming experience, farm size, annual income, and contact with the
sources of information were the population characteristics of the study. The meaning of these
characteristics along with their measurement procedures are stated below:
10
Age: Age of a respondent referred to the period from his birth to the time of data collection. Age
of a respondent was measured in terms of actual years on the basis of his statement. A score of one
(1) was assigned for each year of age.
Education: Education means a process of learning, especially in school or college. Education was
measured on the basis of completed years of schooling by a respondent in the formal educational
institutions. Score of one (1) was given to a respondent for each year of schooling.
Family size: The family size of a respondent was measured in terms of the number of family
member who used to eat and live together permanently. Respondents were classified into three
categories on the basis of their family size according to Alam (2007).
Farm size: The farm sizes of the respondents were measured in hectares using the following
formula (Alam, 2007):
Total farm size= a+b/2+c/2+d
Where,
a = Own cultivated land
b = Cultivated land under others on borga
c = Cultivated land taken from others on borga
d = Non cultivated land
Farming experience: The farming experience of the respondent means the experience he gained
directly by performing various farming activities and it was expressed in years i.e. score of one
was given for each year of experience.
Occupation: For determining the occupation of the respondents in the study area, every
respondent was asked about their daily activities in which they were involved for maintaining their
livelihood.
Estimation of income: Incomes of each respondent from haor activities (fishing, farming, farm
labor, livestock rearing, driving boat etc.), non-haor activities (service, business etc.) and other
cash income (social benefits scheme, relief and interest) were recorded in taka for estimating total
monthly income.
Annual income: Family income of a respondent was measured by taking sum of income earned by
a respondent and other member of the family in a year from crop sector, livestock, fisheries,
homestead forestry sector and non-agricultural sector. It was expressed in taka being considered as
the income of a respondent‟s family.
3.8 Land use change over time
For measurement of the change in land use pattern over time the respondents‟ opinions in 2014
were compared with that of 2002-2004.
3.9 Hydrological status in the haor area
For determining the hydrological status in the haor area, some criteria such as sources of irrigation
water, quality of haor water, quality of drinking water, depth of inundation, duration of inundation,
flooding and condition of haor were considered and respondents opinions in 2014 were compared
with that of 2002-2004.
3.10 Cropping pattern adoption index
Farmers follow different types of cropping patterns based on their resources and demand.
Therefore, the adoption of cropping pattern might appear as an important indicator for food
security. A measuring scale containing 7-item was used to determine the extent of technology
adoption of cropping pattern by an individual. Each respondent was asked about the extent of his
adoption against each of the cropping patterns practiced. The extent of adoption was rated as
„much‟, „little‟ and „not at all‟ and the weight for the corresponding rating scale was assigned as 2,
11
1, and 0, respectively. From the responses, the total score of each adoption was calculated by
adding up the weights. The score of adoption of each respondent could range from 0 to 20, 0
indicating no adoption, and 20 very high adoption.
3.11 Ownership of livestock and poultry
It was measured by quantity with current values and then transformed into 4 point ordinal scale for
making livestock and poultry index such as:
(a) No ownership
(owned none of the livestock or poultry)
0
(b) Small ownership
(owned livestock and poultry valued up to BDT: 15,000)
1
(c) Medium ownership
(owned livestock and poultry valued between BDT: 15,001-30,000)
2
(d) Large ownership
(owned livestock and poultry having value above BDT: 30,000)
3
3.12 Fishing system adoption index
Farmers adopt different types of fishing technology. Therefore, the adoption of fishing technology
appears to be an important factor for food security. A 4-item measuring scale was used to
determine the extent of adoption of fishing system by an individual. Each respondent was asked
about the extent of his adoption against each of the fishing system. The extent of adoption was
rated as „much‟, „little‟ and „not at all‟ and the weight for these rating scales was assigned as 2, 1,
and 0, respectively. From the responses, the total score of each adoption was calculated by adding
up the weights. The score of adoption of each respondent could range from 0 to 8, 0 indicating no
adoption and 8 indicating much adoption.
3.13 Ownership of fruit, timber, and fuel wood trees
It was measured by actual number of the components possessed by an individual respondent and
then transformed into ordinal scale as:
(a) No ownership (owned none of the trees) 0
(b) Small ownership (owned up to 10 trees) 1
(c) Medium ownership (owned 11-20 trees) 2
(d) Large ownership (owned more than 20 trees 3
3.14 Extent of adoption of farming technology
A four point type scale was used for computing the extent of adoption of farming technology
score. Weightage of the responses against each technology were assigned in the following way.
Scores of 0, 1, 2 and 3 were assigned for “no use”, „low use‟, „medium use‟ and „high use‟,
respectively. The weightage of responses of all the farming technologies adopted by an individual
respondent were added together to obtain the extent of adoption of farming technology.
For a better understanding of particular farming technologies adopted by the respondents, a
technology adoption index (TAI) was computed. The TAI was calculated by multiplying the
frequency counts of each of the technologies with its corresponding weights such as 3 for „high‟, 2
for „medium‟, 1 for „low‟ and 0 for „not at all‟. By adding all the values of each cell together, the
score of TAI was calculated. The TAI for each technology could range from 0 to 180 where zero
indicating „not at all‟, while 180 indicating „high adoption‟ of such farming technologies.
12
3.15 Food consumption and calorie intake
The food consumption of the respondents was estimated on the basis of their food needed for a
month. The respondents were directly asked to mention the amount of food consumed by the
members of the household per month. Food consumption was measured based on average monthly
calorie intake of the family members. The household food consumption was converted into calorie
intake per person per day. The selected food items were rice, wheat, tuber, pulse, vegetables, fruit,
fish, meat, milk, sugar, and edible oil. Calorie uptake was measured by using the formula
developed by Imai (2003) (Appendix IV).
3.16 Access to food
Access to food was measured on the basis of ability to have meals/day by each member of the
family. The respondents were directly asked to mention whether they were able to have three
meals/day, two meals/day and one meal/day over a period as per described by Hossain (2009).
Scores assigned were: For taking 1 meal daily=1, for taking 2 meals per day=2 and for taking 3
meals per day=3.
3.17 Contribution of farming enterprises to household food security
Farming enterprises functionally indicated the crops, livestock, fisheries and homestead
agroforestry enterprises. Household food security expressed the economic, physical and social
availability, accessibility and sustainability of the dietary needs of the individual in farm families
(FAO, 1996). In this study, contribution of farming enterprises to the household food security was
determined by using the following formula:
Contribution of farming enterprises to household food security (%) =
Total calorie obtained from farm produces per year was determined with the help of a list of
energy (Kcal) content in 100g of different food items (Meyer, 2004). All the farming enterprises
could not be converted into energy (Kcal) by using this list. Problem arose when it was found that
some part of the farm produces were sold by the respondents and some item like jute and tree
could not be directly converted into energy (Kcal). These are obviously cash item i.e. directly
related to monetary return rather than having calorie value. It was, therefore, inevitable to find out
a conversion factor to be used to convert cash items into energy (Kcal).
Hence, information were sought from focus group discussion (FGD) involving direct
participation of selected respondents regarding prices of the products and food items needed to be
bought by the farmers. The price of some products which were sold was determined giving a value
in BDT. This monetary value was converted into energy following the procedure as stated in Table
2. The cash energy conversion factor was computed according to the following formula.
Cash energy conversion factor
= 41250/1533 =26.91
This means that the calorie value of the items sold was calculated by multiplying the monetary
value (BDT) with cash energy conversion factor. It was then added to the calorie value of the
consumed food items to get the total calorie obtained from farm produces per year. On the other
hand, total calorie needed by the family members was known from the average Recommended
Desired Intake (RDI) (Kcal/capita/day) of food item which employed the rate of dietary needs as
2187 Kcal/person/day (Anon, 2008). Finally, contribution of farming enterprises to household food
security was determined by dividing the total calorie obtained from farm produces per year by the
Total calorie obtained from farm produces per year ----------------------------------------------------------------× 100 Total calorie needed by family members per year
Total calorific value of the produces = Total monetary value of the produces
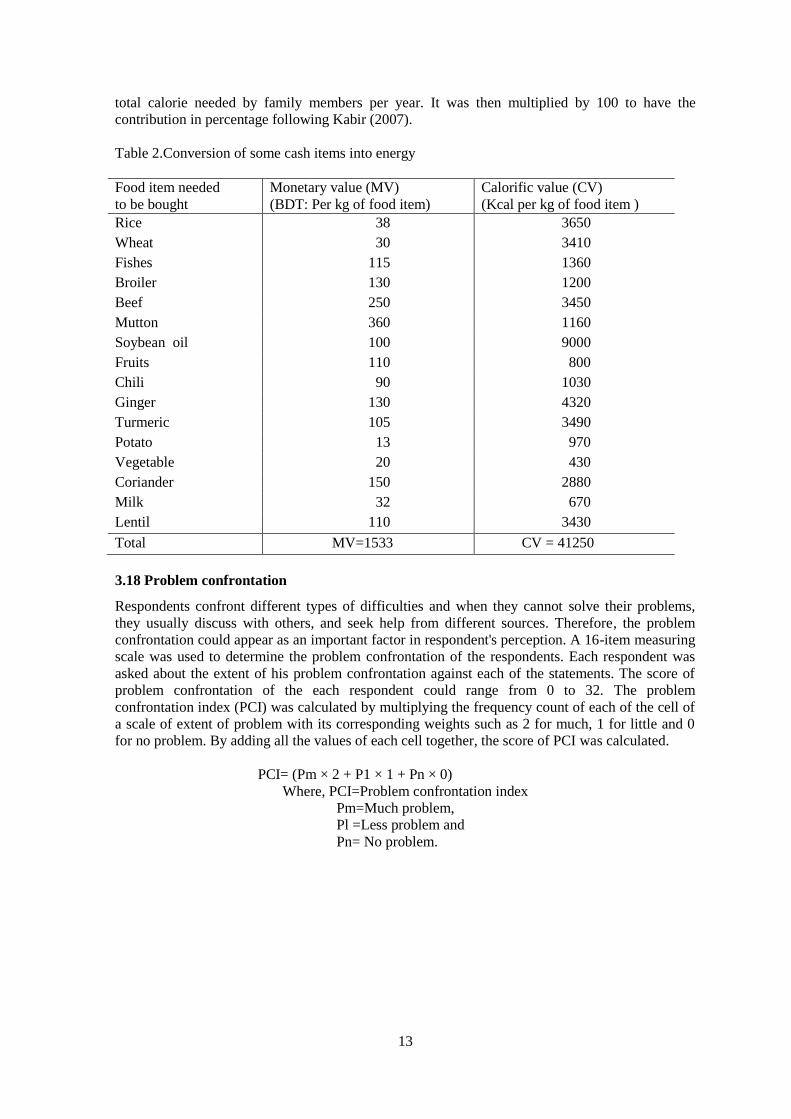
13
total calorie needed by family members per year. It was then multiplied by 100 to have the
contribution in percentage following Kabir (2007).
Table 2.Conversion of some cash items into energy
Food item needed
to be bought
Monetary value (MV)
(BDT: Per kg of food item)
Calorific value (CV)
(Kcal per kg of food item )
Rice 38 3650
Wheat 30 3410
Fishes 115 1360
Broiler 130 1200
Beef 250 3450
Mutton 360 1160
Soybean oil 100 9000
Fruits 110 800
Chili 90 1030
Ginger 130 4320
Turmeric 105 3490
Potato 13 970
Vegetable 20 430
Coriander 150 2880
Milk 32 670
Lentil 110 3430
Total MV=1533 CV = 41250
3.18 Problem confrontation
Respondents confront different types of difficulties and when they cannot solve their problems,
they usually discuss with others, and seek help from different sources. Therefore, the problem
confrontation could appear as an important factor in respondent's perception. A 16-item measuring
scale was used to determine the problem confrontation of the respondents. Each respondent was
asked about the extent of his problem confrontation against each of the statements. The score of
problem confrontation of the each respondent could range from 0 to 32. The problem
confrontation index (PCI) was calculated by multiplying the frequency count of each of the cell of
a scale of extent of problem with its corresponding weights such as 2 for much, 1 for little and 0
for no problem. By adding all the values of each cell together, the score of PCI was calculated.
PCI= (Pm × 2 + P1 × 1 + Pn × 0)
Where, PCI=Problem confrontation index
Pm=Much problem,
Pl =Less problem and
Pn= No problem.
14
CHAPTER IV
RESULTS AND DISCUSSION
4.1 Socio-economic and demographic profile of the respondents
The socio-economic and demographic profile of the respondents under the study is discussed in
this section to get an idea about population characteristics of selected area of Azmiriganj Upazila.
The socio-economic and demographic characteristics include age, education, family size, farm
size, farming experience, annual income of the respondents.
4.1.1 Age
The age of an individual is an important social factor pertaining to one’s personality make up. The
elders are important in having long experience in many spheres of life. The age of the respondents
of the study site ranged from 23 to 80 years with an average of 49.38 years. Based on their age,
the respondents were classified into three categories like young (< 35 years), middle aged (35-50
years) and old aged (>50 years) as suggested by Haider (2010). Data displayed in Table 3 also
indicates that the highest portion of respondents (42 percent) was in the old aged group followed
by middle (34 percent) and young aged groups (24 percent).
4.1.2 Education
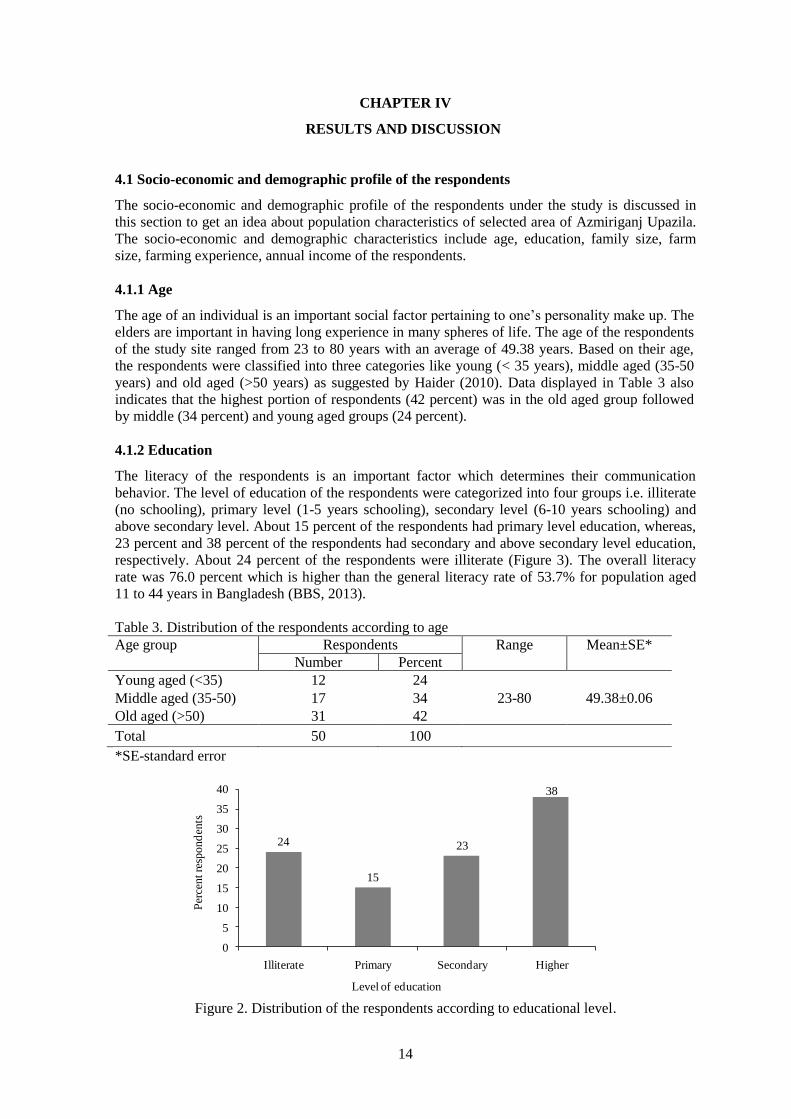
The literacy of the respondents is an important factor which determines their communication
behavior. The level of education of the respondents were categorized into four groups i.e. illiterate
(no schooling), primary level (1-5 years schooling), secondary level (6-10 years schooling) and
above secondary level. About 15 percent of the respondents had primary level education, whereas,
23 percent and 38 percent of the respondents had secondary and above secondary level education,
respectively. About 24 percent of the respondents were illiterate (Figure 3). The overall literacy
rate was 76.0 percent which is higher than the general literacy rate of 53.7% for population aged
11 to 44 years in Bangladesh (BBS, 2013).
Table 3. Distribution of the respondents according to age
Age group Respondents Range Mean±SE*
Number Percent
Young aged (<35) 12 24
Middle aged (35-50) 17 34 23-80 49.38±0.06
Old aged (>50) 31 42
Total 50 100
*SE-standard error
Figure 2. Distribution of the respondents according to educational level.
24
15
23
38
0
5
10
15
20
25
30
35
40
Illiterate Primary Secondary Higher
Per
cen
t re
spo
nd
ents
Level of education
15
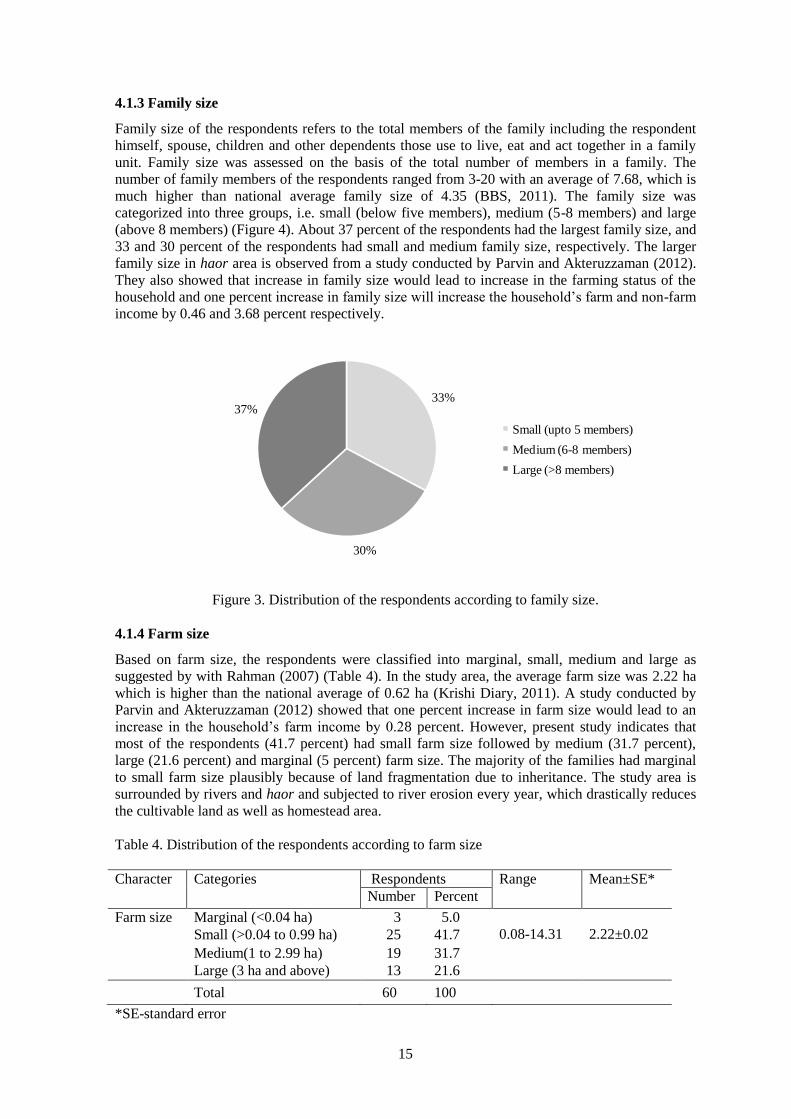
4.1.3 Family size
Family size of the respondents refers to the total members of the family including the respondent
himself, spouse, children and other dependents those use to live, eat and act together in a family
unit. Family size was assessed on the basis of the total number of members in a family. The
number of family members of the respondents ranged from 3-20 with an average of 7.68, which is
much higher than national average family size of 4.35 (BBS, 2011). The family size was
categorized into three groups, i.e. small (below five members), medium (5-8 members) and large
(above 8 members) (Figure 4). About 37 percent of the respondents had the largest family size, and
33 and 30 percent of the respondents had small and medium family size, respectively. The larger
family size in haor area is observed from a study conducted by Parvin and Akteruzzaman (2012).
They also showed that increase in family size would lead to increase in the farming status of the
household and one percent increase in family size will increase the household’s farm and non-farm
income by 0.46 and 3.68 percent respectively.
Figure 3. Distribution of the respondents according to family size.
4.1.4 Farm size
Based on farm size, the respondents were classified into marginal, small, medium and large as
suggested by with Rahman (2007) (Table 4). In the study area, the average farm size was 2.22 ha
which is higher than the national average of 0.62 ha (Krishi Diary, 2011). A study conducted by
Parvin and Akteruzzaman (2012) showed that one percent increase in farm size would lead to an
increase in the household’s farm income by 0.28 percent. However, present study indicates that
most of the respondents (41.7 percent) had small farm size followed by medium (31.7 percent),
large (21.6 percent) and marginal (5 percent) farm size. The majority of the families had marginal
to small farm size plausibly because of land fragmentation due to inheritance. The study area is
surrounded by rivers and haor and subjected to river erosion every year, which drastically reduces
the cultivable land as well as homestead area.
Table 4. Distribution of the respondents according to farm size
Character Categories Respondents Range Mean±SE*
Number Percent
Farm size Marginal (<0.04 ha) 3 5.0
0.08-14.31
2.22±0.02
Small (>0.04 to 0.99 ha) 25 41.7
Medium(1 to 2.99 ha) 19 31.7
Large (3 ha and above) 13 21.6
Total 60 100
*SE-standard error
33%
30%
37%
Small (upto 5 members)
Medium (6-8 members)
Large (>8 members)
16
4.1.5 Farming experience
Farming experience refers to number of years of involvement of respondents in farming activities.
It helps an individual to take correct decision. There was a wide range of farming experience
between 0 and 60 years with an average 26.1 years (Table 5). Among the sample population, 71.7
percent had high farming experience. Only 20 and 8.3 percent had poor and moderate farming
experience, respectively.
Table 5. Distribution of the respondents according to farming experience
Farming experience Respondents Mean±SE
Number Percent
Poor (<15 years) 12 20.0 26.1±0.06
Moderate (16-20 years) 5 8.3
High (>20 years) 43 71.7
Total 60 100
*SE-standard error
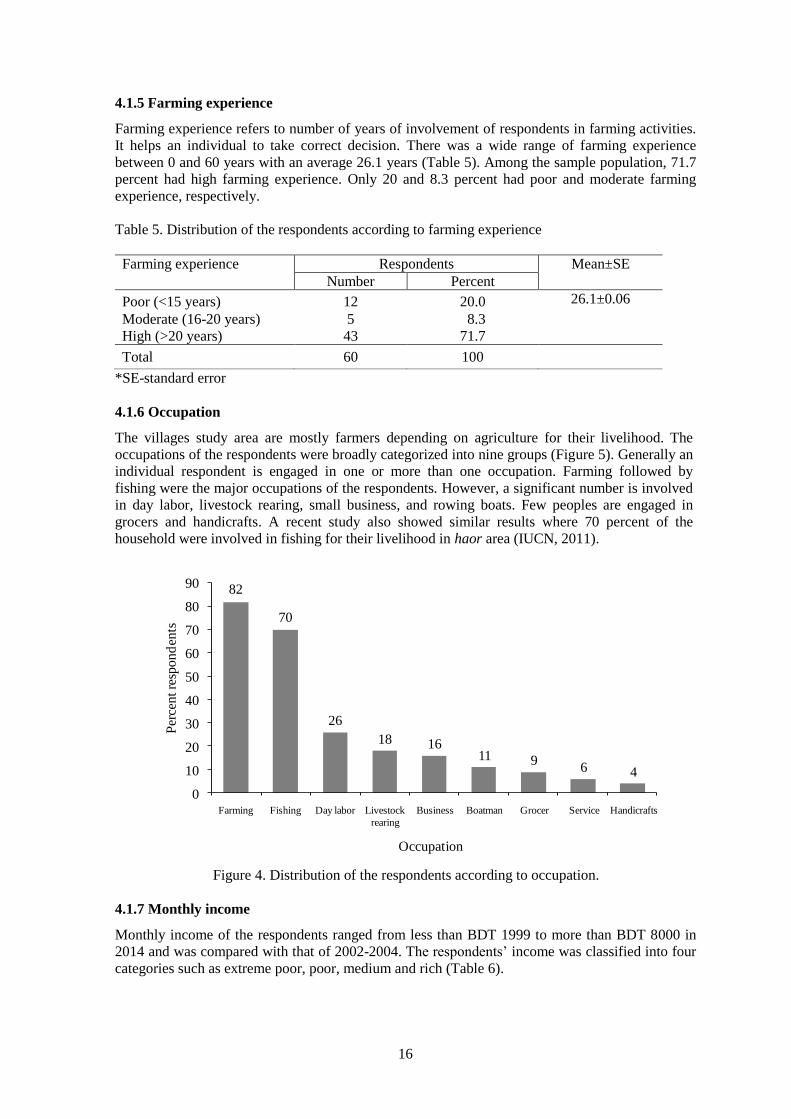
4.1.6 Occupation
The villages study area are mostly farmers depending on agriculture for their livelihood. The
occupations of the respondents were broadly categorized into nine groups (Figure 5). Generally an
individual respondent is engaged in one or more than one occupation. Farming followed by
fishing were the major occupations of the respondents. However, a significant number is involved
in day labor, livestock rearing, small business, and rowing boats. Few peoples are engaged in
grocers and handicrafts. A recent study also showed similar results where 70 percent of the
household were involved in fishing for their livelihood in haor area (IUCN, 2011).
Figure 4. Distribution of the respondents according to occupation.
4.1.7 Monthly income
Monthly income of the respondents ranged from less than BDT 1999 to more than BDT 8000 in
2014 and was compared with that of 2002-2004. The respondents’ income was classified into four
categories such as extreme poor, poor, medium and rich (Table 6).
82
70
26
18 1611 9
6 4
0
10
20
30
40
50
60
70
80
90
Farming Fishing Day labor Livestock
rearing
Business Boatman Grocer Service Handicrafts
Per
cent re
spon
den
ts
Occupation
17
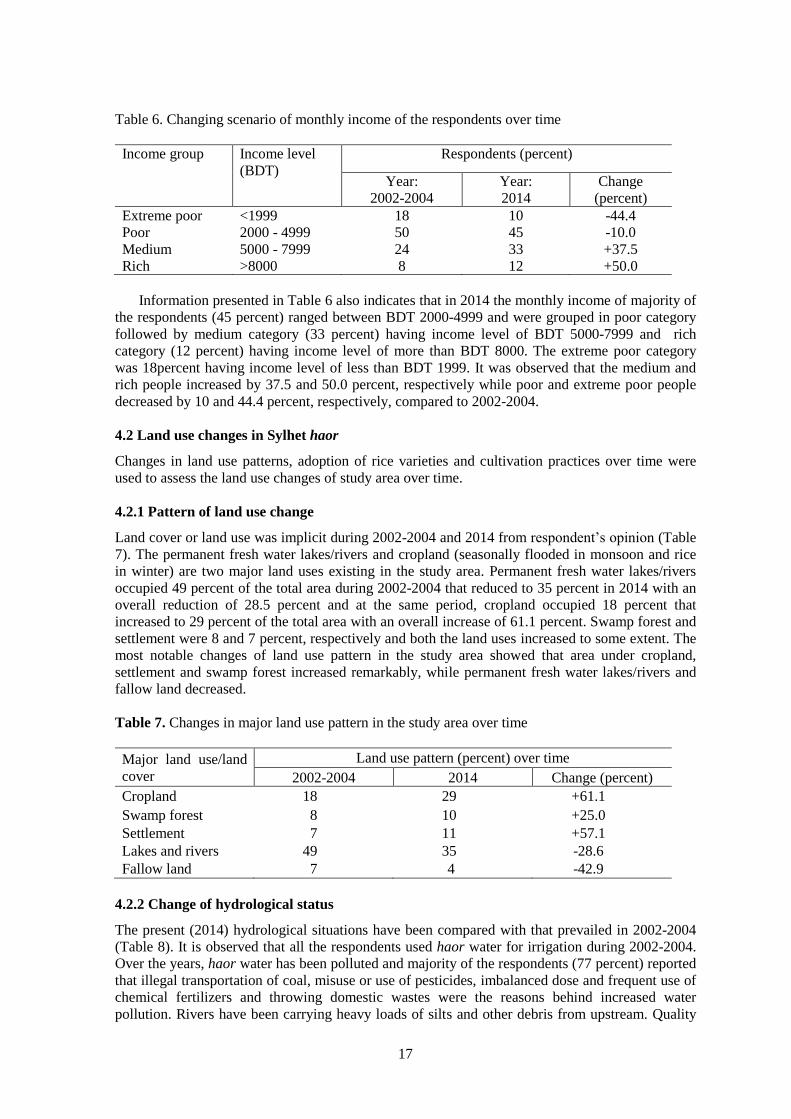
Table 6. Changing scenario of monthly income of the respondents over time
Income group
Income level
(BDT)
Respondents (percent)
Year:
2002-2004
Year:
2014
Change
(percent)
Extreme poor <1999 18 10 -44.4
Poor 2000 - 4999 50 45 -10.0
Medium 5000 - 7999 24 33 +37.5
Rich >8000 8 12 +50.0
Information presented in Table 6 also indicates that in 2014 the monthly income of majority of
the respondents (45 percent) ranged between BDT 2000-4999 and were grouped in poor category
followed by medium category (33 percent) having income level of BDT 5000-7999 and rich
category (12 percent) having income level of more than BDT 8000. The extreme poor category
was 18percent having income level of less than BDT 1999. It was observed that the medium and
rich people increased by 37.5 and 50.0 percent, respectively while poor and extreme poor people
decreased by 10 and 44.4 percent, respectively, compared to 2002-2004.
4.2 Land use changes in Sylhet haor
Changes in land use patterns, adoption of rice varieties and cultivation practices over time were
used to assess the land use changes of study area over time.
4.2.1 Pattern of land use change
Land cover or land use was implicit during 2002-2004 and 2014 from respondent’s opinion (Table
7). The permanent fresh water lakes/rivers and cropland (seasonally flooded in monsoon and rice
in winter) are two major land uses existing in the study area. Permanent fresh water lakes/rivers
occupied 49 percent of the total area during 2002-2004 that reduced to 35 percent in 2014 with an
overall reduction of 28.5 percent and at the same period, cropland occupied 18 percent that
increased to 29 percent of the total area with an overall increase of 61.1 percent. Swamp forest and
settlement were 8 and 7 percent, respectively and both the land uses increased to some extent. The
most notable changes of land use pattern in the study area showed that area under cropland,
settlement and swamp forest increased remarkably, while permanent fresh water lakes/rivers and
fallow land decreased.
Table 7. Changes in major land use pattern in the study area over time
Major land use/land
cover
Land use pattern (percent) over time
2002-2004 2014 Change (percent)
Cropland 18 29 +61.1
Swamp forest 8 10 +25.0
Settlement 7 11 +57.1
Lakes and rivers 49 35 -28.6
Fallow land 7 4 -42.9
4.2.2 Change of hydrological status
The present (2014) hydrological situations have been compared with that prevailed in 2002-2004
(Table 8). It is observed that all the respondents used haor water for irrigation during 2002-2004.
Over the years, haor water has been polluted and majority of the respondents (77 percent) reported
that illegal transportation of coal, misuse or use of pesticides, imbalanced dose and frequent use of
chemical fertilizers and throwing domestic wastes were the reasons behind increased water
pollution. Rivers have been carrying heavy loads of silts and other debris from upstream. Quality
18
of drinking water was reported to deteriorate over time. During 2002-2004, majority of the
respondents (71 percent) were satisfied with the quality of drinking water, but in 2014 the
satisfaction level decreased to 50.7 percent which was supported by more than half (65 percent) of
the respondent (Table 8).
Table 8. Changing scenario of hydrological status in the study area over time
Hydrological
status
Changes Respondent’s opinion (percent)
2002-2004 2014 Change (percent)
Sources of
irrigation water
Haor 100 100 0.00
Irrigation scheme 0 0 0.00
Quality of haor
Water
Polluted 13 77 +492
Non polluted 87 23 -73.56
Quality of
drinking water
Satisfied 71 35 -50.70
Not satisfied 29 65 +124.13
Duration of
inundation
April–November (8 months) 31 15 -51.61
May –Mid December (7.5 months) 35 23 -34.28
May– November (7 months) 25 49 +96
Mid May– November (6.5 months) 9 13 +44.4
Flooding
Early flood 5 2 -60
Late flood 2 2 0.00
Flash flood 93 96 +3.22
In the study area, duration of inundation was to decrease over time. About 31 percent
respondents reported that haor area had been inundated for 8 months (April- November) in 2002-
2004, while this statement was currently supported by only 15 percent respondents. In 2014, 49
and 13 percent respondents opined that haor areas are inundated for 7 months (May- November)
and 6.5 months (Mid May- November), respectively, while for 2002-2004 this statement was
supported by 25 and 9 percent respondents, respectively. The reason behind decreasing inundation
period may be due to decrease of water flow from upstream, particularly from different tributaries
originated from Meghalaya hills of India. In case of flooding situation, almost all of the
respondents reported that flash flood is the major natural disaster in the study area and increased
by 3.22 percent over the last 10-12 years. Flash flood is generally caused by heavy and excessive
rainfall and onrush of water from adjacent Assam and Meghalaya hills in India during early
monsoon. Such floods cause immense damage to the standing boro rice, lives and properties every
year and the situation has been aggravating in the haor region due to siltation in downstream over
time.
4.3 Pattern of farming system
Farming system of Bangladesh indicates the homestead as a common feature of all farming
systems from where other enterprises are managed by the farmers. The cropping systems were
divided into field and horticultural crops, while both were again sub-divided into irrigated and
rainfed. The livestock systems were divided into cattle, buffalo, poultry, goat, and sheep, while
poultry was subdivided into chicken, duck, and pigeon. The fisheries systems were mainly of two
types - fish culture and fish catching. Fish cultures were of three types - pond, backyard pond and
rice shrimp culture. Fish catching was divided into catching from river, canal, and haor and from
rice field. The agro-forestry systems were mainly observed in the homestead and field (Hossain et
al.,1991).
4.3.1 Cropping system
Haor farmers practice different types of cropping pattern. In order to find out the extent of
practicing different cropping pattern, adoption index was determined through seven cropping
19
patterns which are being practiced by the haor farmers and were ranked accordingly. Ranking
order of the cropping pattern was identified by adding the specific score given to each pattern. The
adoption score ranged from 2 to 120. Ranking order of the cropping pattern followed by the
respondents is presented in Table 9. Among all the cropping patterns, Boro rice-fallow-
transplanted Aman ranked first position scoring 120 followed by Boro rice-fallow-broadcasting
Aman. Huda (2004) reported that almost 80% of haor area (i.e. 0.68 million ha) is covered by Boro
rice, while only about 10% area is covered by transplanted Aman production. The study area is
mostly dominated by medium high land and transplanted Aman cultivation is very common. Rabi
crop-fallow-fallow score 65 and 16 and they were ranked second and third, respectively. Potato-
fallow- transplanted Aman got lowest score (2) and placed in the last position.
From Table 9, it is evident that the cropping pattern of the haor area is predominantly rice
based followed by rabi crops like tuber, potato and wheat. This might be due to the fact that the
study area was attached with mainland and annual flooding increase the soil fertility and creates
favorable condition for production of these major crops.
Table 9. Extent of practice of cropping pattern by the farmers in the study area
Type of cropping pattern
Extent of practice (N=60) CPAI
Rank
order Much (2) Little (1) Not at all (0)
Boro rice - fallow – T. aman 60 0 0 120 I
Boro rice - fallow – B. aman 5 55 0 65 II
Rabi crops - fallow – fallow 2 12 46 16 III
Rabi frops - jute – fallow 0 5 55 5 IV
Wheat - fallow – T. aman 1 3 56 4 V
Tuber – fallow - T. aman 0 3 57 3 VI
Potato - fallow- T. aman 0 2 58 2 VII
4.3.2 Livestock system
Livestock and poultry are the essential resources of the haor farmers. The peoples of the haor area
are much aware of their livestock and poultry resources as the sector contributes greatly to their
daily diets and draft energy required for land preparation. The respondents along with their
livestock and poultry ownership on the basis of price are categorized following Mahmud (2008)
and presented in Table 10. It is evident that only 25 percent of the respondents did not own any
livestock and poultry resource (Table 10). Data reveals that 35 percent of the respondents had low
ownership of livestocks and poultry resources and about one-seventh of the respondents owned
livestock and poultry resources indicating medium ownership. About one-fourth of the respondents
had high ownership of livestock and poultry resources. These patterns of ownership indicate that
the livestock and poultry resources play an important role to livelihood development and there is
scope of further development of the sector for ensuring food security in future.
Table 10. Distribution of the farmers according to ownership of livestock and poultry on the basis
of price
Category of ownership No. of respondents Percent Mean±SE
No livestock 15 25 22250±3.16
Low (up to BDT.15000) 21 35
Medium ( BDT. 15001-30000) 8 13
High (above BDT. 30000) 16 27
Total: 60 100
20
4.3.3 Fisheries system
Fisheries sector is a source of animal protein and contributes to rural employment and alleviation
of poverty to a great extent. Farmers adopted various system of fishing according to their dietary
needs and income generation. Fishing systems of haor farmers are illustrated in Table 11. It
reveals that fish catching in backyard pond ranked first position, and this is probably because of
the fact that haor area is flood-prone and low-lying, and water remains in their backyard pond for
8-10 months in most of the areas and even throughout the year in some places. Round the year fish
culture in pond ranked second position, fish catching in canal and fish catching in river were
ranked third and fourth, respectively. As haor lands are low-laying areas, every household had
backyard pond which was dug during building homesteads. There is greater scope to bring the
backyard pond under commercial fish culture for income generation for ensuring food security.
There are ample scopes to develop the fishery sector, but it requires timely availability of inputs
like fish fries, feed and credit.
Table 11. Extent of practice of fishing systems by the farmers in the study area
Type of fishing system Extent of practice (N=60) FSAI Rank
order Much (2) Little (1) Not at
all (0)
Fish catching in backyard pond 33 12 15 78 I
Round the year fish culture in pond 24 21 15 69 II
Fish catching in canal 6 39 15 51 III
Fish catching in river 10 28 22 48 IV
4.3.4 Homestead forestry system
Homestead is considered as a lifeboat for the survival of the landless, marginal and small farmers
who don’t have any resources other than the homestead products. On the other hand, forestry
system ensures sound environment through plantation of fruit, timber and fuel wood trees in and
around the homestead as well as in the marginal and fallow land. It also helps the respondents in
raising their income and for improving livelihood pattern. Figures 5-7 showed the distribution of
the respondents according to fruit, timber and fuel wood trees ownerships, respectively following
Mahmud (2008). Finding reveals that every respondent has fruit trees either in the homestead or in
the marginal/fallow or crop field. About three-fourth of respondents owned more than 20 trees.
Small and medium ownership of fruit trees were found 5 percent and 20 percent respondents,
respectively. This pattern of ownership reflects medium to high ownership of fruit trees by the
respondents.
Figure 5. Distribution of the respondents according to ownership of fruit trees.
0%
5%
20%
75%
Ownership having no fruit tree
Small ownership (up to 10 fruit trees)
Medium ownership (11-20 fruit trees)
Large ownership (>20 fruit trees)
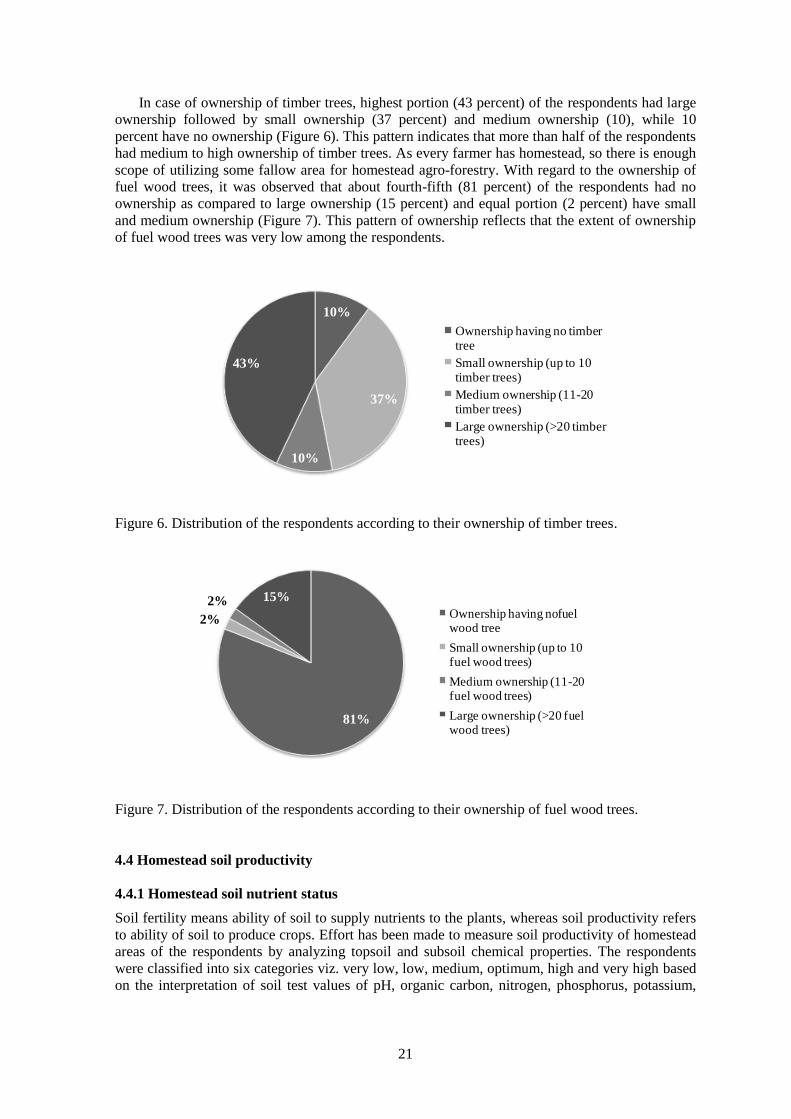
21
In case of ownership of timber trees, highest portion (43 percent) of the respondents had large
ownership followed by small ownership (37 percent) and medium ownership (10), while 10
percent have no ownership (Figure 6). This pattern indicates that more than half of the respondents
had medium to high ownership of timber trees. As every farmer has homestead, so there is enough
scope of utilizing some fallow area for homestead agro-forestry. With regard to the ownership of
fuel wood trees, it was observed that about fourth-fifth (81 percent) of the respondents had no
ownership as compared to large ownership (15 percent) and equal portion (2 percent) have small
and medium ownership (Figure 7). This pattern of ownership reflects that the extent of ownership
of fuel wood trees was very low among the respondents.
Figure 6. Distribution of the respondents according to their ownership of timber trees.
Figure 7. Distribution of the respondents according to their ownership of fuel wood trees.
4.4 Homestead soil productivity
4.4.1 Homestead soil nutrient status
Soil fertility means ability of soil to supply nutrients to the plants, whereas soil productivity refers
to ability of soil to produce crops. Effort has been made to measure soil productivity of homestead
areas of the respondents by analyzing topsoil and subsoil chemical properties. The respondents
were classified into six categories viz. very low, low, medium, optimum, high and very high based
on the interpretation of soil test values of pH, organic carbon, nitrogen, phosphorus, potassium,
10%
37%
10%
43%
Ownership having no timber tree
Small ownership (up to 10 timber trees)
Medium ownership (11-20 timber trees)
Large ownership (>20 timber trees)
81%
2%
2% 15%
Ownership having nofuel wood tree
Small ownership (up to 10
fuel wood trees)
Medium ownership (11-20 fuel wood trees)
Large ownership (>20 fuel wood trees)
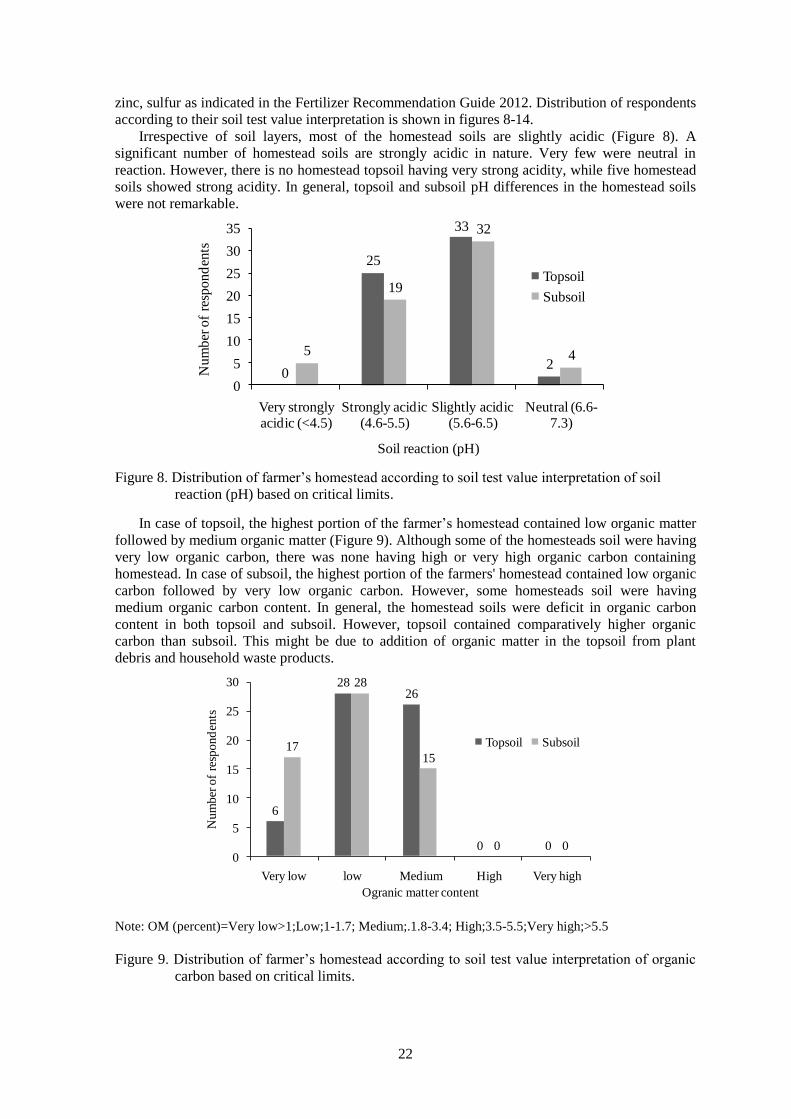
22
zinc, sulfur as indicated in the Fertilizer Recommendation Guide 2012. Distribution of respondents
according to their soil test value interpretation is shown in figures 8-14.
Irrespective of soil layers, most of the homestead soils are slightly acidic (Figure 8). A
significant number of homestead soils are strongly acidic in nature. Very few were neutral in
reaction. However, there is no homestead topsoil having very strong acidity, while five homestead
soils showed strong acidity. In general, topsoil and subsoil pH differences in the homestead soils
were not remarkable.
Figure 8. Distribution of farmer’s homestead according to soil test value interpretation of soil
reaction (pH) based on critical limits.
In case of topsoil, the highest portion of the farmer’s homestead contained low organic matter
followed by medium organic matter (Figure 9). Although some of the homesteads soil were having
very low organic carbon, there was none having high or very high organic carbon containing
homestead. In case of subsoil, the highest portion of the farmers' homestead contained low organic
carbon followed by very low organic carbon. However, some homesteads soil were having
medium organic carbon content. In general, the homestead soils were deficit in organic carbon
content in both topsoil and subsoil. However, topsoil contained comparatively higher organic
carbon than subsoil. This might be due to addition of organic matter in the topsoil from plant
debris and household waste products.
Note: OM (percent)=Very low>1;Low;1-1.7; Medium;.1.8-3.4; High;3.5-5.5;Very high;>5.5
Figure 9. Distribution of farmer’s homestead according to soil test value interpretation of organic
carbon based on critical limits.
6
2826
0 0
17
28
15
0 00
5
10
15
20
25
30
Very low low Medium High Very high
Nu
mb
er o
f re
spo
nd
ents
Ogranic matter content
Topsoil Subsoil
5
19
32
4
0
25
33
2
0
5
10
15
20
25
30
35
Very strongly acidic (<4.5)
Strongly acidic (4.6-5.5)
Slightly acidic (5.6-6.5)
Neutral (6.6-7.3)
Nu
mb
er o
f re
spo
nd
ents
Soil reaction (pH)
Topsoil
Subsoil
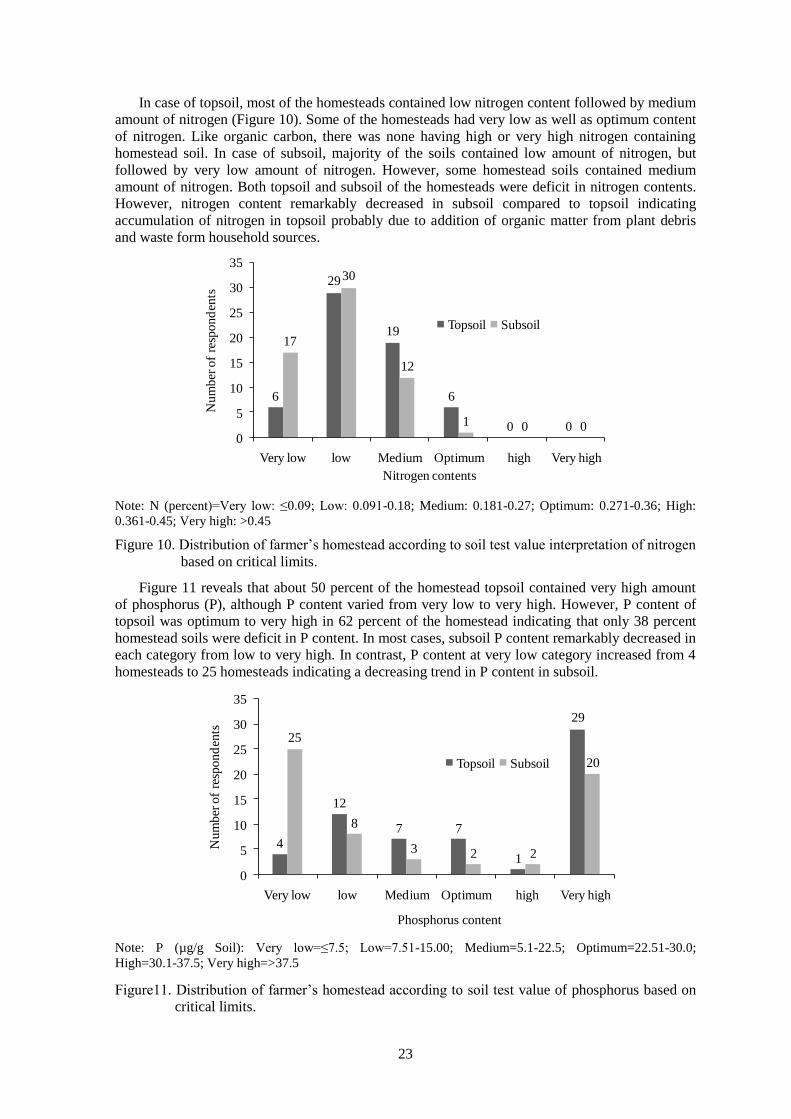
23
In case of topsoil, most of the homesteads contained low nitrogen content followed by medium
amount of nitrogen (Figure 10). Some of the homesteads had very low as well as optimum content
of nitrogen. Like organic carbon, there was none having high or very high nitrogen containing
homestead soil. In case of subsoil, majority of the soils contained low amount of nitrogen, but
followed by very low amount of nitrogen. However, some homestead soils contained medium
amount of nitrogen. Both topsoil and subsoil of the homesteads were deficit in nitrogen contents.
However, nitrogen content remarkably decreased in subsoil compared to topsoil indicating
accumulation of nitrogen in topsoil probably due to addition of organic matter from plant debris
and waste form household sources.
Note: N (percent)=Very low: ≤0.09; Low: 0.091-0.18; Medium: 0.181-0.27; Optimum: 0.271-0.36; High:
0.361-0.45; Very high: >0.45
Figure 10. Distribution of farmer’s homestead according to soil test value interpretation of nitrogen
based on critical limits.
Figure 11 reveals that about 50 percent of the homestead topsoil contained very high amount
of phosphorus (P), although P content varied from very low to very high. However, P content of
topsoil was optimum to very high in 62 percent of the homestead indicating that only 38 percent
homestead soils were deficit in P content. In most cases, subsoil P content remarkably decreased in
each category from low to very high. In contrast, P content at very low category increased from 4
homesteads to 25 homesteads indicating a decreasing trend in P content in subsoil.
Note: P (µg/g Soil): Very low=≤7.5; Low=7.51-15.00; Medium=5.1-22.5; Optimum=22.51-30.0;
High=30.1-37.5; Very high=>37.5
Figure11. Distribution of farmer’s homestead according to soil test value of phosphorus based on
critical limits.
6
29
19
6
0 0
17
30
12
1 0 00
5
10
15
20
25
30
35
Very low low Medium Optimum high Very high
Num
ber
of
resp
ond
ents
Nitrogen contents
Topsoil Subsoil
4
12
7 7
1
29
25
8
3 2 2
20
0
5
10
15
20
25
30
35
Very low low Medium Optimum high Very high
Num
ber
of
resp
ond
ents
Phosphorus content
Topsoil Subsoil
24
In general, potassium (K) content of topsoil in 67 percent homestead was optimum to very
high, while 33 percent of the homestead was deficit in K content (Figure 12). About 48 percent of
the homesteads contained a very high amount of K. In contrast, 23 percent homestead soil
contained very low to low amount of K. Potassium content of subsoil in optimum to high
categories decreased much in 52 percent homestead when compared with topsoil. On the other
hand, the number of homestead containing very low to medium amount of K in subsoil increased
indicating that subsoil is more deficit in K content than topsoil.
Note: K (meq/100g)= Very low=≤0.09; Low=0.091-0.18; Medium=0.181 0.27; Optimum= 0.271-0.36;
High=0.361-0.45; Very high=>0.45
Figure12. Distribution of farmer’s homestead according to soil test value of potassium based on
critical limits.
Irrespective of layers, the homestead soil contained a very high amount of Zinc (Zn) (Figure
13). About 87 percent homestead soils contained optimum to very high amount of Zn, while only
13 percent of the homesteads was deficit in Zn contents. Even no soils contained very low amount
Note: Zn(µg/g soil)=Very low=≤0.45; Low=0.451-0.9; Medium=0.91-1.35; Optimum=1.351-1.8;
High=1.81-2.25.5;Very high=>2.25
Figure 13. Distribution of farmer’s homestead according to soil test value interpretation of zinc
based on critical limits.
2
12
6 6 5
29
4
17
8
5 4
22
0
5
10
15
20
25
30
35
Very low low Medium Optimum high Very high
Nu
mb
er o
f re
spo
nd
ents
Potassium content
Topsoil Subsoil
02
6 5 5
42
0
5
96
3
37
0
5
10
15
20
25
30
35
40
45
Very low low Medium Optimum high Very high
Num
ber
of
resp
ond
ents
Zinc content
Topsoil Subsoil
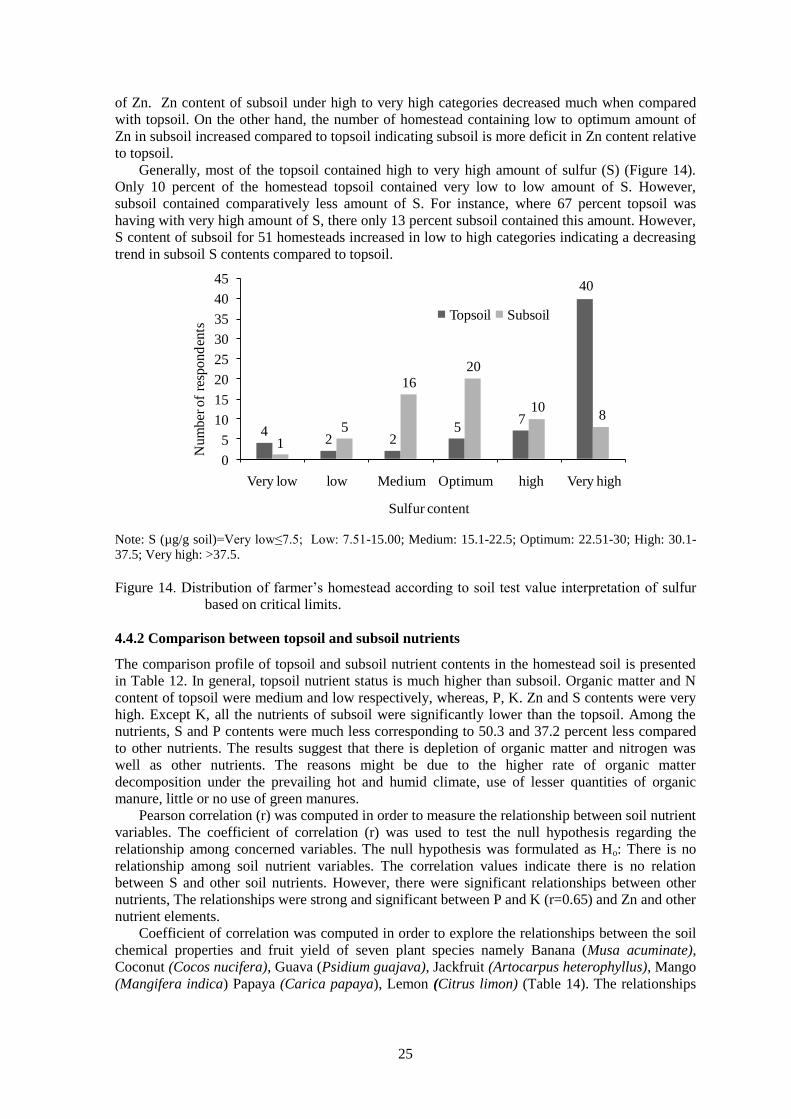
25
of Zn. Zn content of subsoil under high to very high categories decreased much when compared
with topsoil. On the other hand, the number of homestead containing low to optimum amount of
Zn in subsoil increased compared to topsoil indicating subsoil is more deficit in Zn content relative
to topsoil.
Generally, most of the topsoil contained high to very high amount of sulfur (S) (Figure 14).
Only 10 percent of the homestead topsoil contained very low to low amount of S. However,
subsoil contained comparatively less amount of S. For instance, where 67 percent topsoil was
having with very high amount of S, there only 13 percent subsoil contained this amount. However,
S content of subsoil for 51 homesteads increased in low to high categories indicating a decreasing
trend in subsoil S contents compared to topsoil.
Note: S (µg/g soil)=Very low≤7.5; Low: 7.51-15.00; Medium: 15.1-22.5; Optimum: 22.51-30; High: 30.1-
37.5; Very high: >37.5.
Figure 14. Distribution of farmer’s homestead according to soil test value interpretation of sulfur
based on critical limits.
4.4.2 Comparison between topsoil and subsoil nutrients
The comparison profile of topsoil and subsoil nutrient contents in the homestead soil is presented
in Table 12. In general, topsoil nutrient status is much higher than subsoil. Organic matter and N
content of topsoil were medium and low respectively, whereas, P, K. Zn and S contents were very
high. Except K, all the nutrients of subsoil were significantly lower than the topsoil. Among the
nutrients, S and P contents were much less corresponding to 50.3 and 37.2 percent less compared
to other nutrients. The results suggest that there is depletion of organic matter and nitrogen was
well as other nutrients. The reasons might be due to the higher rate of organic matter
decomposition under the prevailing hot and humid climate, use of lesser quantities of organic
manure, little or no use of green manures.
Pearson correlation (r) was computed in order to measure the relationship between soil nutrient
variables. The coefficient of correlation (r) was used to test the null hypothesis regarding the
relationship among concerned variables. The null hypothesis was formulated as Ho: There is no
relationship among soil nutrient variables. The correlation values indicate there is no relation
between S and other soil nutrients. However, there were significant relationships between other
nutrients, The relationships were strong and significant between P and K (r=0.65) and Zn and other
nutrient elements.
Coefficient of correlation was computed in order to explore the relationships between the soil
chemical properties and fruit yield of seven plant species namely Banana (Musa acuminate),
Coconut (Cocos nucifera), Guava (Psidium guajava), Jackfruit (Artocarpus heterophyllus), Mango
(Mangifera indica) Papaya (Carica papaya), Lemon (Citrus limon) (Table 14). The relationships
42 2
57
40
1
5
16
20
108
0
5
10
15
20
25
30
35
40
45
Very low low Medium Optimum high Very high
Nu
mb
er o
f re
spo
nd
ents
Sulfur content
Topsoil Subsoil
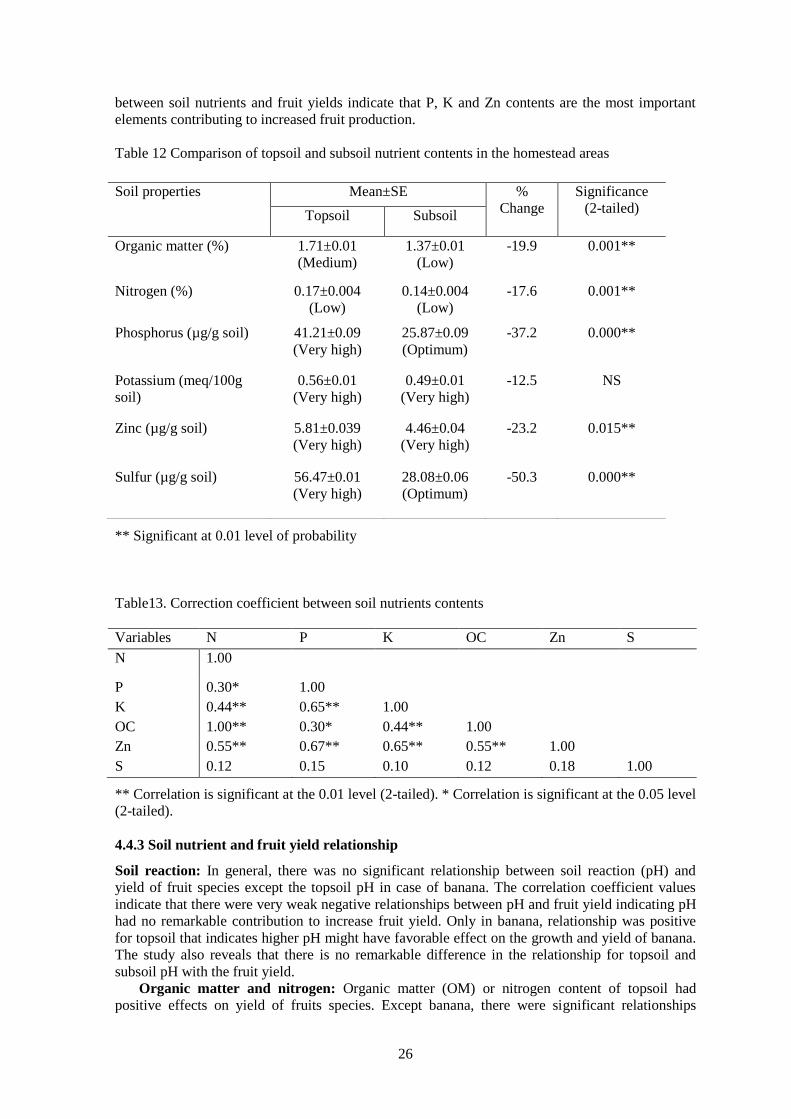
26
between soil nutrients and fruit yields indicate that P, K and Zn contents are the most important
elements contributing to increased fruit production.
Table 12 Comparison of topsoil and subsoil nutrient contents in the homestead areas
** Significant at 0.01 level of probability
Table13. Correction coefficient between soil nutrients contents
Variables N P K OC Zn S
N 1.00
P 0.30* 1.00
K 0.44** 0.65** 1.00
OC 1.00** 0.30* 0.44** 1.00
Zn 0.55** 0.67** 0.65** 0.55** 1.00
S 0.12 0.15 0.10 0.12 0.18 1.00
** Correlation is significant at the 0.01 level (2-tailed). * Correlation is significant at the 0.05 level
(2-tailed).
4.4.3 Soil nutrient and fruit yield relationship
Soil reaction: In general, there was no significant relationship between soil reaction (pH) and
yield of fruit species except the topsoil pH in case of banana. The correlation coefficient values
indicate that there were very weak negative relationships between pH and fruit yield indicating pH
had no remarkable contribution to increase fruit yield. Only in banana, relationship was positive
for topsoil that indicates higher pH might have favorable effect on the growth and yield of banana.
The study also reveals that there is no remarkable difference in the relationship for topsoil and
subsoil pH with the fruit yield.
Organic matter and nitrogen: Organic matter (OM) or nitrogen content of topsoil had
positive effects on yield of fruits species. Except banana, there were significant relationships
Soil properties Mean±SE %
Change
Significance
(2-tailed) Topsoil Subsoil
Organic matter (%) 1.71±0.01
(Medium)
1.37±0.01
(Low)
-19.9 0.001**
Nitrogen (%) 0.17±0.004
(Low)
0.14±0.004
(Low)
-17.6 0.001**
Phosphorus (µg/g soil) 41.21±0.09
(Very high)
25.87±0.09
(Optimum)
-37.2 0.000**
Potassium (meq/100g
soil)
0.56±0.01
(Very high)
0.49±0.01
(Very high)
-12.5 NS
Zinc (µg/g soil) 5.81±0.039
(Very high)
4.46±0.04
(Very high)
-23.2 0.015**
Sulfur (µg/g soil) 56.47±0.01
(Very high)
28.08±0.06
(Optimum)
-50.3 0.000**
27
between soils OM or N and fruit yield and the relationships were stronger for topsoil OM or N
status. The exception was for Jackfruit, where the relationship between subsoil OM or N content
and fruit yield was significant. The OM or N and S contents of topsoil contribute more to fruit
yield. This might be due to the fact that organic matter has direct and indirect effect on the
availability of other nutrients and improving soil physical and biological properties that may
subsequently enhance growth and yield of fruit trees. Generally, N helps rapid growth of fruit
trees, increases yield and improving the quality of fruits.
Phosphorus: Irrespective of topsoil and subsoil, phosphorus (P) content showed significant
correlation with fruit yield of all the species. Such relationships were much strong for banana,
coconut, jackfruit and guava. In case of lemon and papaya, P content for topsoil had strong
significant relationship with fruit yield, but for subsoil the relationships were weak. Only
exception was mango where there was no significant relationship between P content of topsoil and
fruit yield, although there existed a weak relationship for subsoil P content. Phosphorus helped
fruit trees with the transformation of solar energy into chemical energy, proper plant maturation
withstanding stress. It also encouraged blooming and root growth of fruit trees.
Potassium: Potassium (K) contents of both topsoil and subsoil showed strong significant
correlations with fruit yield of all the species. Only exception was for subsoil of mango, where the
relationship was weak. Interestingly, the other fruit species were having much stronger correlations
between K contents and fruit yield for subsoil compared to topsoil indicating subsoil K content
contributes much in maintaining higher fruit yield. Potassium helped in the building of protein,
photosynthesis, fruit trees quality and reduction of diseases. Potassium is supplied to fruit trees by
organic materials. It also improves root growth and seed production of fruit trees.
Zinc: In general, zinc (Zn) contents of both topsoil and subsoil showed significant correlations
with fruit yield in all the plant species. Only the subsoil Zn content had no significant relationship
with the yield of coconut and papaya. The fruit yield relationship with the soil Zn contents were
comparatively stronger in topsoil compared to subsoil, This indicates that the maintenance of
topsoil Zn content is much important for sustainable fruit yield in the homestead area. Zinc helped
with the transformation of carbohydrates and regulated consumption of sugars and fruit trees
growth.
Sulfur: The relationships between soil sulfur (S) and yield of fruit species were mostly
insignificant. However, there existed significant relationships between topsoil S and fruit yield of
lemon, papaya and jackfruit. In most cases, the correlation coefficient values between S and fruit
yield showed very weak relationships indicating S content had very little effects on fruit yield. The
study also reveals that there were some weak and negative relationships for subsoil S compared to
topsoil S content with the fruit yield. Sulfur helped fruit trees in chlorophyll formation, with
vigorous plant growth and resistance to cold. It also improves root growth and seed production of
fruit trees. Sulfur helped fruit trees in chlorophyll formation, with vigorous plant growth and
resistance to cold.
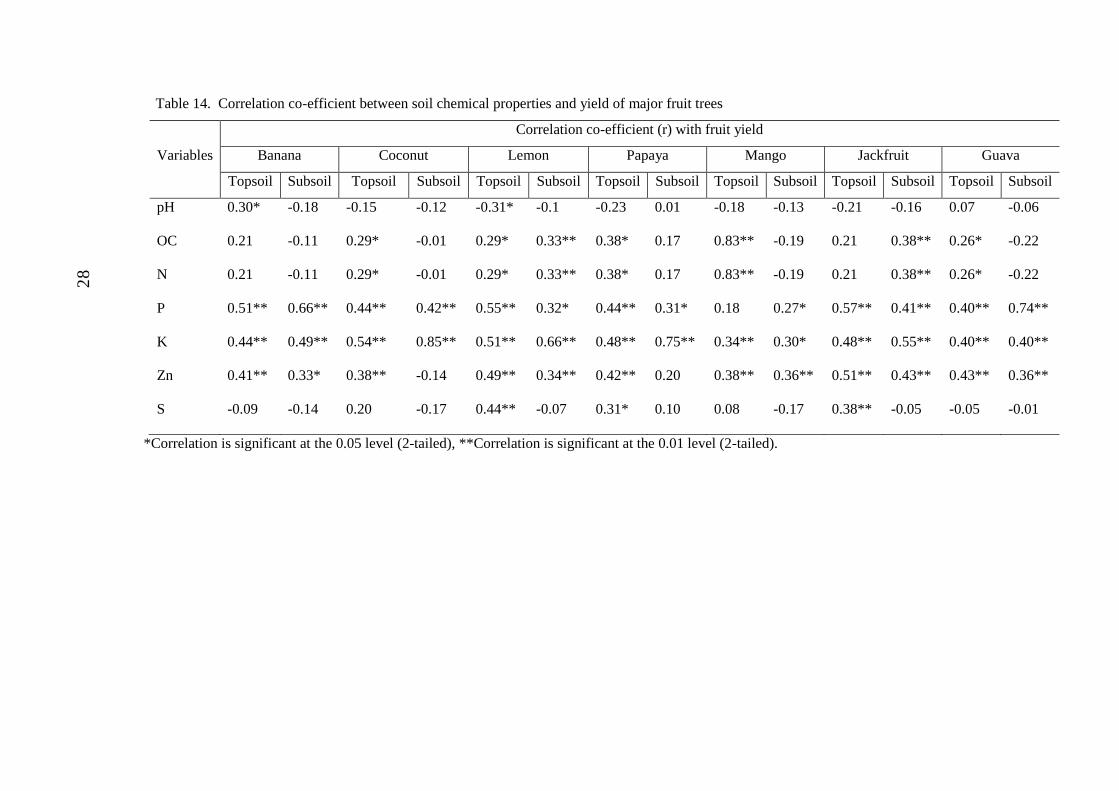
Table 14. Correlation co-efficient between soil chemical properties and yield of major fruit trees
Variables
Correlation co-efficient (r) with fruit yield
Banana Coconut Lemon Papaya Mango Jackfruit Guava
Topsoil Subsoil Topsoil Subsoil Topsoil Subsoil Topsoil Subsoil Topsoil Subsoil Topsoil Subsoil Topsoil Subsoil
pH 0.30* -0.18 -0.15 -0.12 -0.31* -0.1 -0.23 0.01 -0.18 -0.13 -0.21 -0.16 0.07 -0.06
OC 0.21 -0.11 0.29* -0.01 0.29* 0.33** 0.38* 0.17 0.83** -0.19 0.21 0.38** 0.26* -0.22
N 0.21 -0.11 0.29* -0.01 0.29* 0.33** 0.38* 0.17 0.83** -0.19 0.21 0.38** 0.26* -0.22
P 0.51** 0.66** 0.44** 0.42** 0.55** 0.32* 0.44** 0.31* 0.18 0.27* 0.57** 0.41** 0.40** 0.74**
K 0.44** 0.49** 0.54** 0.85** 0.51** 0.66** 0.48** 0.75** 0.34** 0.30* 0.48** 0.55** 0.40** 0.40**
Zn 0.41** 0.33* 0.38** -0.14 0.49** 0.34** 0.42** 0.20 0.38** 0.36** 0.51** 0.43** 0.43** 0.36**
S -0.09 -0.14 0.20 -0.17 0.44** -0.07 0.31* 0.10 0.08 -0.17 0.38** -0.05 -0.05 -0.01
*Correlation is significant at the 0.05 level (2-tailed), **Correlation is significant at the 0.01 level (2-tailed).
28
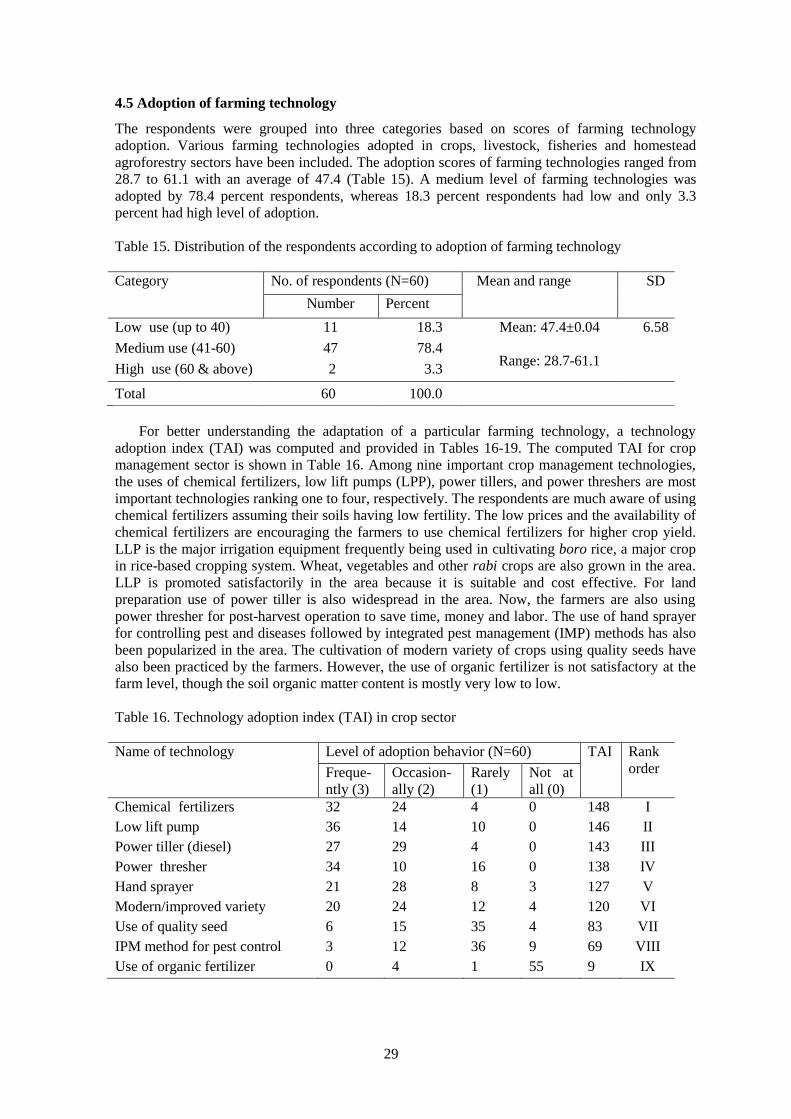
29
4.5 Adoption of farming technology
The respondents were grouped into three categories based on scores of farming technology
adoption. Various farming technologies adopted in crops, livestock, fisheries and homestead
agroforestry sectors have been included. The adoption scores of farming technologies ranged from
28.7 to 61.1 with an average of 47.4 (Table 15). A medium level of farming technologies was
adopted by 78.4 percent respondents, whereas 18.3 percent respondents had low and only 3.3
percent had high level of adoption.
Table 15. Distribution of the respondents according to adoption of farming technology
Category
No. of respondents (N=60) Mean and range
SD
Number Percent
Low use (up to 40) 11 18.3 Mean: 47.4±0.04
Range: 28.7-61.1
6.58
Medium use (41-60) 47 78.4
High use (60 & above) 2 3.3
Total 60 100.0
For better understanding the adaptation of a particular farming technology, a technology
adoption index (TAI) was computed and provided in Tables 16-19. The computed TAI for crop
management sector is shown in Table 16. Among nine important crop management technologies,
the uses of chemical fertilizers, low lift pumps (LPP), power tillers, and power threshers are most
important technologies ranking one to four, respectively. The respondents are much aware of using
chemical fertilizers assuming their soils having low fertility. The low prices and the availability of
chemical fertilizers are encouraging the farmers to use chemical fertilizers for higher crop yield.
LLP is the major irrigation equipment frequently being used in cultivating boro rice, a major crop
in rice-based cropping system. Wheat, vegetables and other rabi crops are also grown in the area.
LLP is promoted satisfactorily in the area because it is suitable and cost effective. For land
preparation use of power tiller is also widespread in the area. Now, the farmers are also using
power thresher for post-harvest operation to save time, money and labor. The use of hand sprayer
for controlling pest and diseases followed by integrated pest management (IMP) methods has also
been popularized in the area. The cultivation of modern variety of crops using quality seeds have
also been practiced by the farmers. However, the use of organic fertilizer is not satisfactory at the
farm level, though the soil organic matter content is mostly very low to low.
Table 16. Technology adoption index (TAI) in crop sector
Name of technology
Level of adoption behavior (N=60) TAI Rank
order
Freque-
ntly (3)
Occasion-
ally (2)
Rarely
(1)
Not at
all (0)
Chemical fertilizers 32 24 4 0 148 I
Low lift pump 36 14 10 0 146 II
Power tiller (diesel) 27 29 4 0 143 III
Power thresher 34 10 16 0 138 IV
Hand sprayer 21 28 8 3 127 V
Modern/improved variety 20 24 12 4 120 VI
Use of quality seed 6 15 35 4 83 VII
IPM method for pest control 3 12 36 9 69 VIII
Use of organic fertilizer 0 4 1 55 9 IX
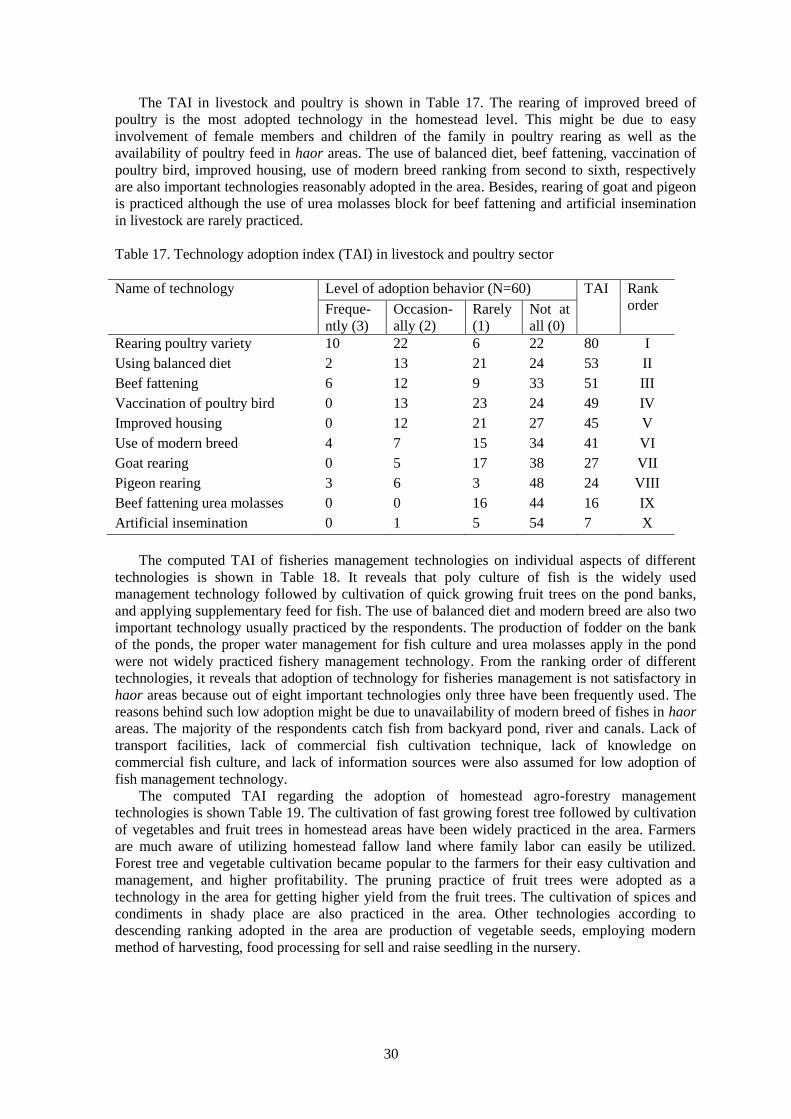
30
The TAI in livestock and poultry is shown in Table 17. The rearing of improved breed of
poultry is the most adopted technology in the homestead level. This might be due to easy
involvement of female members and children of the family in poultry rearing as well as the
availability of poultry feed in haor areas. The use of balanced diet, beef fattening, vaccination of
poultry bird, improved housing, use of modern breed ranking from second to sixth, respectively
are also important technologies reasonably adopted in the area. Besides, rearing of goat and pigeon
is practiced although the use of urea molasses block for beef fattening and artificial insemination
in livestock are rarely practiced.
Table 17. Technology adoption index (TAI) in livestock and poultry sector
Name of technology
Level of adoption behavior (N=60) TAI Rank
order Freque-
ntly (3)
Occasion-
ally (2)
Rarely
(1)
Not at
all (0)
Rearing poultry variety 10 22 6 22 80 I
Using balanced diet 2 13 21 24 53 II
Beef fattening 6 12 9 33 51 III
Vaccination of poultry bird 0 13 23 24 49 IV
Improved housing 0 12 21 27 45 V
Use of modern breed 4 7 15 34 41 VI
Goat rearing 0 5 17 38 27 VII
Pigeon rearing 3 6 3 48 24 VIII
Beef fattening urea molasses 0 0 16 44 16 IX
Artificial insemination 0 1 5 54 7 X
The computed TAI of fisheries management technologies on individual aspects of different
technologies is shown in Table 18. It reveals that poly culture of fish is the widely used
management technology followed by cultivation of quick growing fruit trees on the pond banks,
and applying supplementary feed for fish. The use of balanced diet and modern breed are also two
important technology usually practiced by the respondents. The production of fodder on the bank
of the ponds, the proper water management for fish culture and urea molasses apply in the pond
were not widely practiced fishery management technology. From the ranking order of different
technologies, it reveals that adoption of technology for fisheries management is not satisfactory in
haor areas because out of eight important technologies only three have been frequently used. The
reasons behind such low adoption might be due to unavailability of modern breed of fishes in haor
areas. The majority of the respondents catch fish from backyard pond, river and canals. Lack of
transport facilities, lack of commercial fish cultivation technique, lack of knowledge on
commercial fish culture, and lack of information sources were also assumed for low adoption of
fish management technology.
The computed TAI regarding the adoption of homestead agro-forestry management
technologies is shown Table 19. The cultivation of fast growing forest tree followed by cultivation
of vegetables and fruit trees in homestead areas have been widely practiced in the area. Farmers
are much aware of utilizing homestead fallow land where family labor can easily be utilized.
Forest tree and vegetable cultivation became popular to the farmers for their easy cultivation and
management, and higher profitability. The pruning practice of fruit trees were adopted as a
technology in the area for getting higher yield from the fruit trees. The cultivation of spices and
condiments in shady place are also practiced in the area. Other technologies according to
descending ranking adopted in the area are production of vegetable seeds, employing modern
method of harvesting, food processing for sell and raise seedling in the nursery.
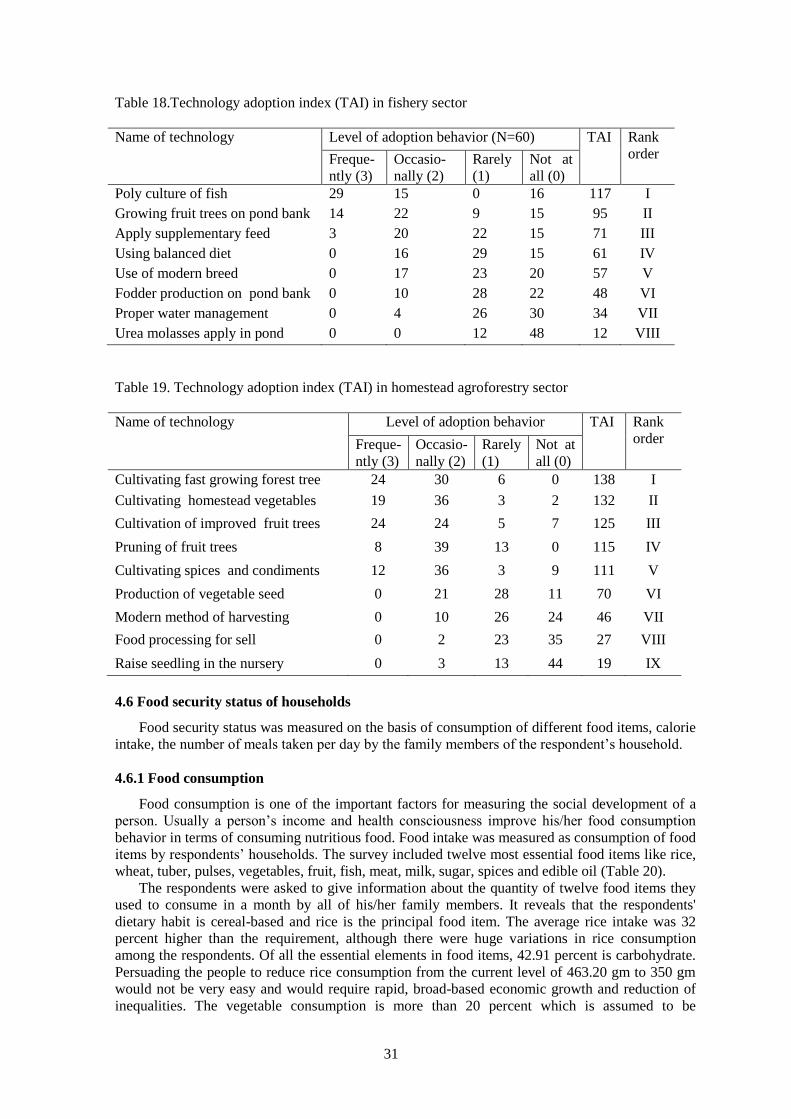
31
Table 18.Technology adoption index (TAI) in fishery sector
Name of technology
Level of adoption behavior (N=60) TAI
Rank
order Freque-
ntly (3)
Occasio-
nally (2)
Rarely
(1)
Not at
all (0)
Poly culture of fish 29 15 0 16 117 I
Growing fruit trees on pond bank 14 22 9 15 95 II
Apply supplementary feed 3 20 22 15 71 III
Using balanced diet 0 16 29 15 61 IV
Use of modern breed 0 17 23 20 57 V
Fodder production on pond bank 0 10 28 22 48 VI
Proper water management 0 4 26 30 34 VII
Urea molasses apply in pond 0 0 12 48 12 VIII
Table 19. Technology adoption index (TAI) in homestead agroforestry sector
Name of technology
Level of adoption behavior TAI Rank
order Freque-
ntly (3)
Occasio-
nally (2)
Rarely
(1)
Not at
all (0)
Cultivating fast growing forest tree 24 30 6 0 138 I
Cultivating homestead vegetables 19 36 3 2 132 II
Cultivation of improved fruit trees 24 24 5 7 125 III
Pruning of fruit trees 8 39 13 0 115 IV
Cultivating spices and condiments 12 36 3 9 111 V
Production of vegetable seed 0 21 28 11 70 VI
Modern method of harvesting 0 10 26 24 46 VII
Food processing for sell 0 2 23 35 27 VIII
Raise seedling in the nursery 0 3 13 44 19 IX
4.6 Food security status of households
Food security status was measured on the basis of consumption of different food items, calorie
intake, the number of meals taken per day by the family members of the respondent’s household.
4.6.1 Food consumption
Food consumption is one of the important factors for measuring the social development of a
person. Usually a person’s income and health consciousness improve his/her food consumption
behavior in terms of consuming nutritious food. Food intake was measured as consumption of food
items by respondents’ households. The survey included twelve most essential food items like rice,
wheat, tuber, pulses, vegetables, fruit, fish, meat, milk, sugar, spices and edible oil (Table 20).
The respondents were asked to give information about the quantity of twelve food items they
used to consume in a month by all of his/her family members. It reveals that the respondents'
dietary habit is cereal-based and rice is the principal food item. The average rice intake was 32
percent higher than the requirement, although there were huge variations in rice consumption
among the respondents. Of all the essential elements in food items, 42.91 percent is carbohydrate.
Persuading the people to reduce rice consumption from the current level of 463.20 gm to 350 gm
would not be very easy and would require rapid, broad-based economic growth and reduction of
inequalities. The vegetable consumption is more than 20 percent which is assumed to be
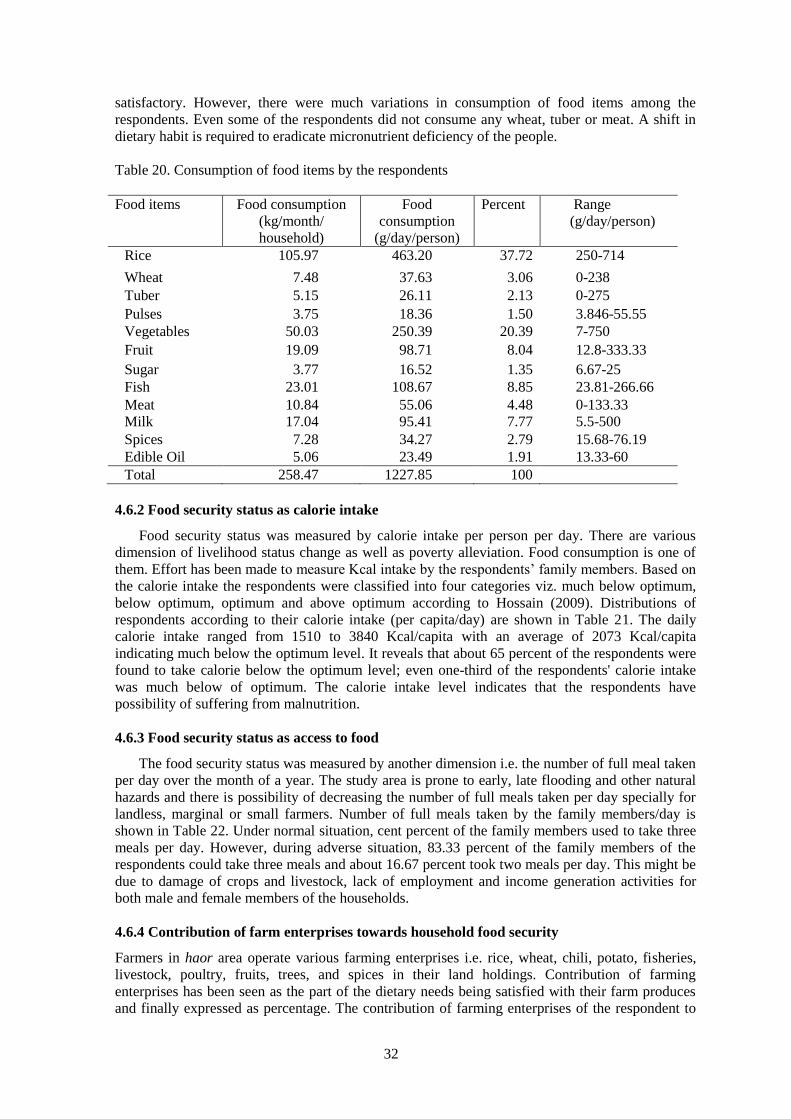
32
satisfactory. However, there were much variations in consumption of food items among the
respondents. Even some of the respondents did not consume any wheat, tuber or meat. A shift in
dietary habit is required to eradicate micronutrient deficiency of the people.
Table 20. Consumption of food items by the respondents
Food items Food consumption
(kg/month/
household)
Food
consumption
(g/day/person)
Percent Range
(g/day/person)
Rice 105.97 463.20 37.72 250-714
Wheat 7.48 37.63 3.06 0-238
Tuber 5.15 26.11 2.13 0-275
Pulses 3.75 18.36 1.50 3.846-55.55
Vegetables 50.03 250.39 20.39 7-750
Fruit 19.09 98.71 8.04 12.8-333.33
Sugar 3.77 16.52 1.35 6.67-25
Fish 23.01 108.67 8.85 23.81-266.66
Meat 10.84 55.06 4.48 0-133.33
Milk 17.04 95.41 7.77 5.5-500
Spices 7.28 34.27 2.79 15.68-76.19
Edible Oil 5.06 23.49 1.91 13.33-60
Total 258.47 1227.85 100
4.6.2 Food security status as calorie intake
Food security status was measured by calorie intake per person per day. There are various
dimension of livelihood status change as well as poverty alleviation. Food consumption is one of
them. Effort has been made to measure Kcal intake by the respondents’ family members. Based on
the calorie intake the respondents were classified into four categories viz. much below optimum,
below optimum, optimum and above optimum according to Hossain (2009). Distributions of
respondents according to their calorie intake (per capita/day) are shown in Table 21. The daily
calorie intake ranged from 1510 to 3840 Kcal/capita with an average of 2073 Kcal/capita
indicating much below the optimum level. It reveals that about 65 percent of the respondents were
found to take calorie below the optimum level; even one-third of the respondents' calorie intake
was much below of optimum. The calorie intake level indicates that the respondents have
possibility of suffering from malnutrition.
4.6.3 Food security status as access to food
The food security status was measured by another dimension i.e. the number of full meal taken
per day over the month of a year. The study area is prone to early, late flooding and other natural
hazards and there is possibility of decreasing the number of full meals taken per day specially for
landless, marginal or small farmers. Number of full meals taken by the family members/day is
shown in Table 22. Under normal situation, cent percent of the family members used to take three
meals per day. However, during adverse situation, 83.33 percent of the family members of the
respondents could take three meals and about 16.67 percent took two meals per day. This might be
due to damage of crops and livestock, lack of employment and income generation activities for
both male and female members of the households.
4.6.4 Contribution of farm enterprises towards household food security
Farmers in haor area operate various farming enterprises i.e. rice, wheat, chili, potato, fisheries,
livestock, poultry, fruits, trees, and spices in their land holdings. Contribution of farming
enterprises has been seen as the part of the dietary needs being satisfied with their farm produces
and finally expressed as percentage. The contribution of farming enterprises of the respondent to
33
their household food security is illustrated in Table 23. The observed range of contribution varied
from 0.45 to 1659 percent with an average of 84.2 percent. Among the respondents, 48.3 percent
received high level of contribution, while 10 percent and 41.67 percent of them received medium
and low level of contribution, respectively from their farming enterprises towards household food
security.
Table 21. Food security status of the respondents according to calorie intake
Categories
Number Percent Mean SD
Range (Kcal/
capita/day
Much below optimum
(upto1800 kcal/capita/day)
14 23.33 2073
340
1510-3840
Below optimum
(>1800-2122 kcal/capita/day)
25 41.67
Optimum
(>2122-2444 kcal/capita/day)
17 28.33
Above optimum
(>2444 kcal/capita/day)
4 6.67
Total 60 100
Table 22. Distribution of the respondents based on the number of meal taken per day
Status of access to food Normal situation Adverse situation
No. of
respondents
Percent No. of
respondents
Percent
Three meals/day 60 100 50 83.33
Two meals/day 00 00 10 16.67
One meal/day 00 00 00 00
Table 23. Contribution of farming enterprises to household food security
Categories Number Percent Mean SD
Low (below 33) 25 41.7 84.2±94.3
Observed Range
(percent)=0.45-1659
Medium ( 33 to 67) 6 10.0
High (above 67) 29 48.3
Total 60 100
The main reason behind high range and standard deviation of the respondents might be due to
land ownership and ownership structure of different farming enterprises. Most of the respondents
had land area of 0.2 to 1.00 ha. This land was not completely owned by the respective respondents
rather cultivated as sharecropping, lease and mortgaged. In case of sharecropper small farmers,
decision making capacity retained to the land owners. Consequently, crop diversification and
intensification could not be adopted by the respondents which lead to lower household food
security.
Overall contribution of the farming enterprises to the respondent farmers’ household food
security has been further partitioned into major farming enterprises which is presented in Table 24.
Among the five major sectors of farming enterprises, crop sector alone contributed 63.5 percent to
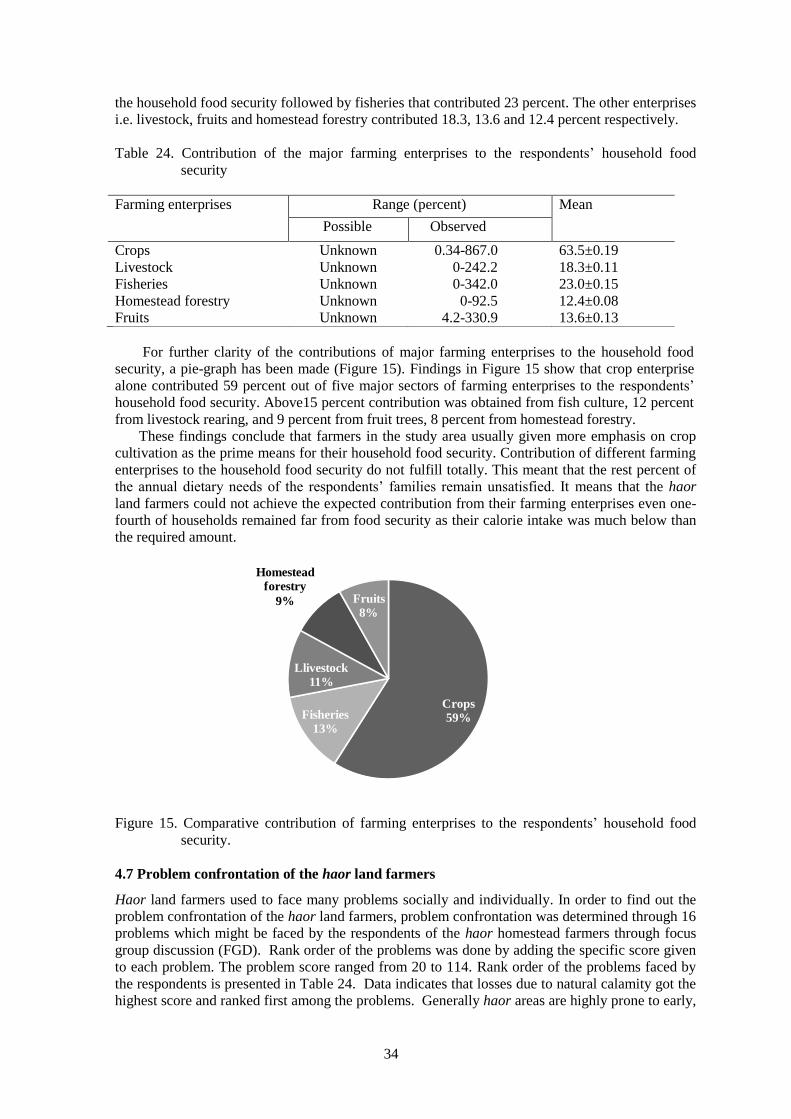
34
the household food security followed by fisheries that contributed 23 percent. The other enterprises
i.e. livestock, fruits and homestead forestry contributed 18.3, 13.6 and 12.4 percent respectively.
Table 24. Contribution of the major farming enterprises to the respondents’ household food
security
Farming enterprises Range (percent) Mean
Possible Observed
Crops Unknown 0.34-867.0 63.5±0.19
Livestock Unknown 0-242.2 18.3±0.11
Fisheries Unknown 0-342.0 23.0±0.15
Homestead forestry Unknown 0-92.5 12.4±0.08
Fruits Unknown 4.2-330.9 13.6±0.13
For further clarity of the contributions of major farming enterprises to the household food
security, a pie-graph has been made (Figure 15). Findings in Figure 15 show that crop enterprise
alone contributed 59 percent out of five major sectors of farming enterprises to the respondents’
household food security. Above15 percent contribution was obtained from fish culture, 12 percent
from livestock rearing, and 9 percent from fruit trees, 8 percent from homestead forestry.
These findings conclude that farmers in the study area usually given more emphasis on crop
cultivation as the prime means for their household food security. Contribution of different farming
enterprises to the household food security do not fulfill totally. This meant that the rest percent of
the annual dietary needs of the respondents’ families remain unsatisfied. It means that the haor
land farmers could not achieve the expected contribution from their farming enterprises even one-
fourth of households remained far from food security as their calorie intake was much below than
the required amount.
Figure 15. Comparative contribution of farming enterprises to the respondents’ household food
security.
4.7 Problem confrontation of the haor land farmers
Haor land farmers used to face many problems socially and individually. In order to find out the
problem confrontation of the haor land farmers, problem confrontation was determined through 16
problems which might be faced by the respondents of the haor homestead farmers through focus
group discussion (FGD). Rank order of the problems was done by adding the specific score given
to each problem. The problem score ranged from 20 to 114. Rank order of the problems faced by
the respondents is presented in Table 24. Data indicates that losses due to natural calamity got the
highest score and ranked first among the problems. Generally haor areas are highly prone to early,
Crops
59%Fisheries
13%
Llivestock
11%
Homestead
forestry
9% Fruits
8%
35
late and flash flood, As a result, the crops as well as human, livestock and other biological
organisms are subjected to be victim of natural calamity. It was also reported that lack of flood
control measures associated with lack of short-duration crop varieties is the major hindrance to the
adoption of potential cropping patterns in haor area (Alam et al., 2010).
Table 25. Problem confrontation index (PCI) of study area farmers
Problems
Extent of problem (N=60) PCI
Rank
order Much
((2)
Little
(1)
Not at
all (0)
Losses due to natural calamity 55 4 1 114 I
High price of inputs 41 18 1 100 II
Inadequate supply inputs 46 7 7 99 III
Lack of storage facilities 43 12 5 98 IV
Lack of marketing facilities 39 16 5 94 V
Problems in getting bank credit 32 25 3 89 VI
Lack of transport facilities 33 23 4 89 VII
Low price of product 36 15 9 87 VIII
River bank erosion 24 27 9 75 IX
Lack of change agent contact 24 25 11 73 X
Malnutrition 22 28 10 72 XI
Infertility of soil 21 26 13 68 XII
Absentee land lord system 19 28 13 66 XIII
Lack of land management technology 13 15 32 41 XIV
Lack of electricity 12 15 33 39 XV
Irregular relief supply 4 12 44 20 XVI
High input cost and inadequate supply of inputs were identified as other important problems.
Farmers need to purchase required inputs for their agricultural and other production sector.
Sometime input dealers and agencies cheat the farmers by demanding high price for inputs. Lack
of storage facility was also a problem. Sometimes respondents produce excess vegetable and other
perishables, which they could not sell and consume. So, large amount of produces were in wastage
loss. The respondents had no technical knowledge of preservation and value addition of their
products.
Lack of marketing facility was another vital problem. Respondents are bound to sell their
produces in the local market due to lack of transport facilities. So they do not get fair price.
Unavailability of bank loan is another important problem of the study area and respondents
initially need financial support to start farming activities for which they need to borrow from bank.
Lack of proper contact with the change agents involved in facilitating development activities was
another important problem. Because of inadequate number of extension workers in the study area,
important modern technologies cannot spread easily to the haor farmers. During flooding season,
about one-third of the households usually used to face food insecurity and they are dependent on
relief both from GO and NGOs sectors.
36
CHAPTER V
SUMMARY AND CONCLUSIONS
The study reveals that majority of the farmers in the study area of Sylhet haor were aged having
higher level of education, large family size but small farm size, and high farming experience. The
economic condition of the farmers greatly changed during the year from 2002-2004 to 2014. This
time many of the farmers have been found to switch over from low income group to high income
group. Land use and land cover also changed a lot for this period. A vast area of lakes and rivers,
and fallow land have been transformed to cropland, swamp forest and settlement. Land inundation
period decreased to one and half months, but incidence of flash flood increased. Water pollution
increased and drinking water quality decreased. There exists an acute shortage of fuel wood at
household level.
There were huge variations in nutrient content of homestead soil. In general, soil is very low
to low in N contents, very rich in P content, particularly in subsoil. Soil is also rich in K, very rich
in S content particularly in topsoil and much rich in Zn content. Except K, topsoil and subsoil
nutrient contents have significant relationships. Fruit yield had strong significant relationship with
organic carbon, N, P, K and Zn contents of both topsoil and subsoil. Technology adoption index
(TAI) was much higher for cultivation of vegetables, plantation of fruit and tree species in the
homestead area. Rice is the dominant crop in the area and found to be the principal food item
followed by vegetables, fish, fruit and milk. Rice intake rate was found higher than recommended
amount, although the total calorie intake was below optimum level. Three-fourth of the annual
dietary requirement of the farm family is fulfilled from farming enterprises. The major problems of
the study area were losses of farming enterprises due to natural calamities, high price and
inadequate supply of agricultural inputs. Based on the above findings, the following conclusions
may be drawn:
(i) For getting accurate picture of the household-based food security in the entire haor area,
more spatial and temporal data on the availability of resources and their utilization pattern
needs to be generated;
(ii) There are ample scopes of utilizing fringed land resulting from siltation and fallow land
under homestead area for increasing food production;
(iii) Detailed appraisal of homestead resources including land availability, plant species
diversity and other resource-based is also important. The homestead resources
management applying appropriate technologies and increasing farmers' managerial
capability may contribute to increase food production for attaining food security at
household level;
(iv) The participation of the community people to local, regional and national level planning
and sustainable utilization of resources are vitally important for the development of haor
area; and
(v) Various awareness building programs should be undertaken for the local community to
utilize homestead resources with a view to increase their contribution to household level
food security.
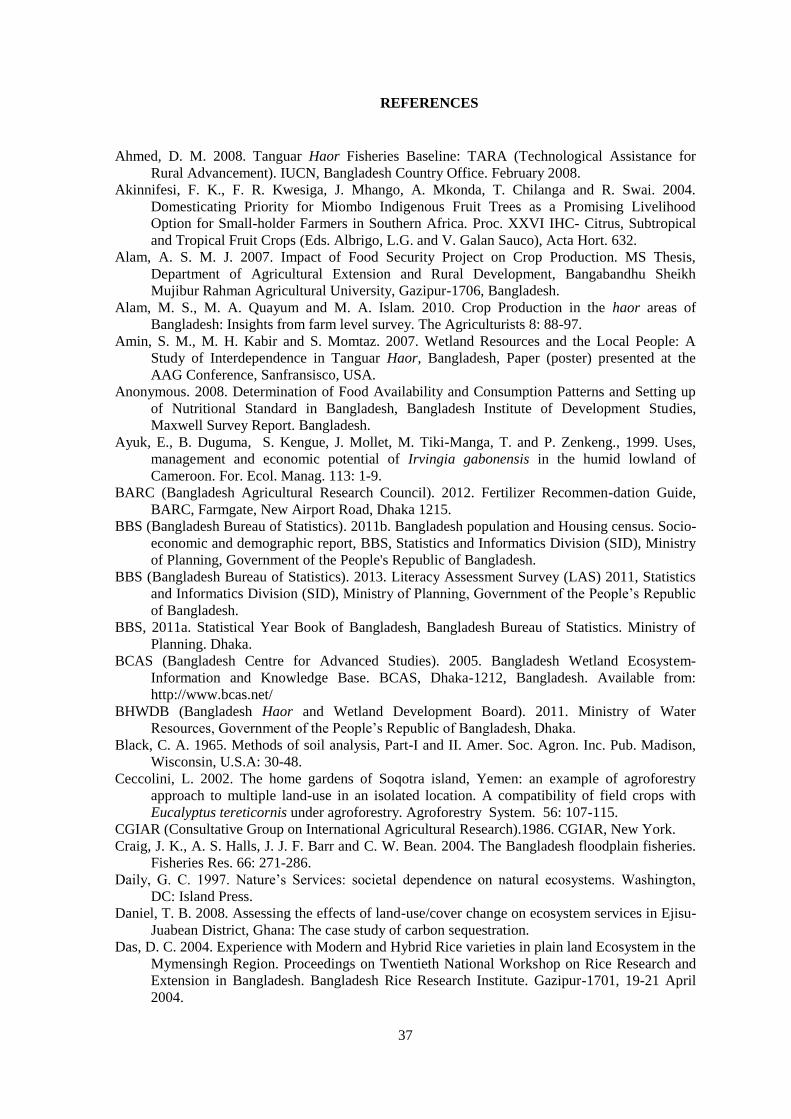
37
REFERENCES
Ahmed, D. M. 2008. Tanguar Haor Fisheries Baseline: TARA (Technological Assistance for
Rural Advancement). IUCN, Bangladesh Country Office. February 2008.
Akinnifesi, F. K., F. R. Kwesiga, J. Mhango, A. Mkonda, T. Chilanga and R. Swai. 2004.
Domesticating Priority for Miombo Indigenous Fruit Trees as a Promising Livelihood
Option for Small-holder Farmers in Southern Africa. Proc. XXVI IHC- Citrus, Subtropical
and Tropical Fruit Crops (Eds. Albrigo, L.G. and V. Galan Sauco), Acta Hort. 632.
Alam, A. S. M. J. 2007. Impact of Food Security Project on Crop Production. MS Thesis,
Department of Agricultural Extension and Rural Development, Bangabandhu Sheikh
Mujibur Rahman Agricultural University, Gazipur-1706, Bangladesh.
Alam, M. S., M. A. Quayum and M. A. Islam. 2010. Crop Production in the haor areas of
Bangladesh: Insights from farm level survey. The Agriculturists 8: 88-97.
Amin, S. M., M. H. Kabir and S. Momtaz. 2007. Wetland Resources and the Local People: A
Study of Interdependence in Tanguar Haor, Bangladesh, Paper (poster) presented at the
AAG Conference, Sanfransisco, USA.
Anonymous. 2008. Determination of Food Availability and Consumption Patterns and Setting up
of Nutritional Standard in Bangladesh, Bangladesh Institute of Development Studies,
Maxwell Survey Report. Bangladesh.
Ayuk, E., B. Duguma, S. Kengue, J. Mollet, M. Tiki-Manga, T. and P. Zenkeng., 1999. Uses,
management and economic potential of Irvingia gabonensis in the humid lowland of
Cameroon. For. Ecol. Manag. 113: 1-9.
BARC (Bangladesh Agricultural Research Council). 2012. Fertilizer Recommen-dation Guide,
BARC, Farmgate, New Airport Road, Dhaka 1215.
BBS (Bangladesh Bureau of Statistics). 2011b. Bangladesh population and Housing census. Socio-
economic and demographic report, BBS, Statistics and Informatics Division (SID), Ministry
of Planning, Government of the People's Republic of Bangladesh.
BBS (Bangladesh Bureau of Statistics). 2013. Literacy Assessment Survey (LAS) 2011, Statistics
and Informatics Division (SID), Ministry of Planning, Government of the People’s Republic
of Bangladesh.
BBS, 2011a. Statistical Year Book of Bangladesh, Bangladesh Bureau of Statistics. Ministry of
Planning. Dhaka.
BCAS (Bangladesh Centre for Advanced Studies). 2005. Bangladesh Wetland Ecosystem-
Information and Knowledge Base. BCAS, Dhaka-1212, Bangladesh. Available from:
http://www.bcas.net/
BHWDB (Bangladesh Haor and Wetland Development Board). 2011. Ministry of Water
Resources, Government of the People’s Republic of Bangladesh, Dhaka.
Black, C. A. 1965. Methods of soil analysis, Part-I and II. Amer. Soc. Agron. Inc. Pub. Madison,
Wisconsin, U.S.A: 30-48.
Ceccolini, L. 2002. The home gardens of Soqotra island, Yemen: an example of agroforestry
approach to multiple land-use in an isolated location. A compatibility of field crops with
Eucalyptus tereticornis under agroforestry. Agroforestry System. 56: 107-115.
CGIAR (Consultative Group on International Agricultural Research).1986. CGIAR, New York.
Craig, J. K., A. S. Halls, J. J. F. Barr and C. W. Bean. 2004. The Bangladesh floodplain fisheries.
Fisheries Res. 66: 271-286.
Daily, G. C. 1997. Nature’s Services: societal dependence on natural ecosystems. Washington,
DC: Island Press.
Daniel, T. B. 2008. Assessing the effects of land-use/cover change on ecosystem services in Ejisu-
Juabean District, Ghana: The case study of carbon sequestration.
Das, D. C. 2004. Experience with Modern and Hybrid Rice varieties in plain land Ecosystem in the
Mymensingh Region. Proceedings on Twentieth National Workshop on Rice Research and
Extension in Bangladesh. Bangladesh Rice Research Institute. Gazipur-1701, 19-21 April
2004.
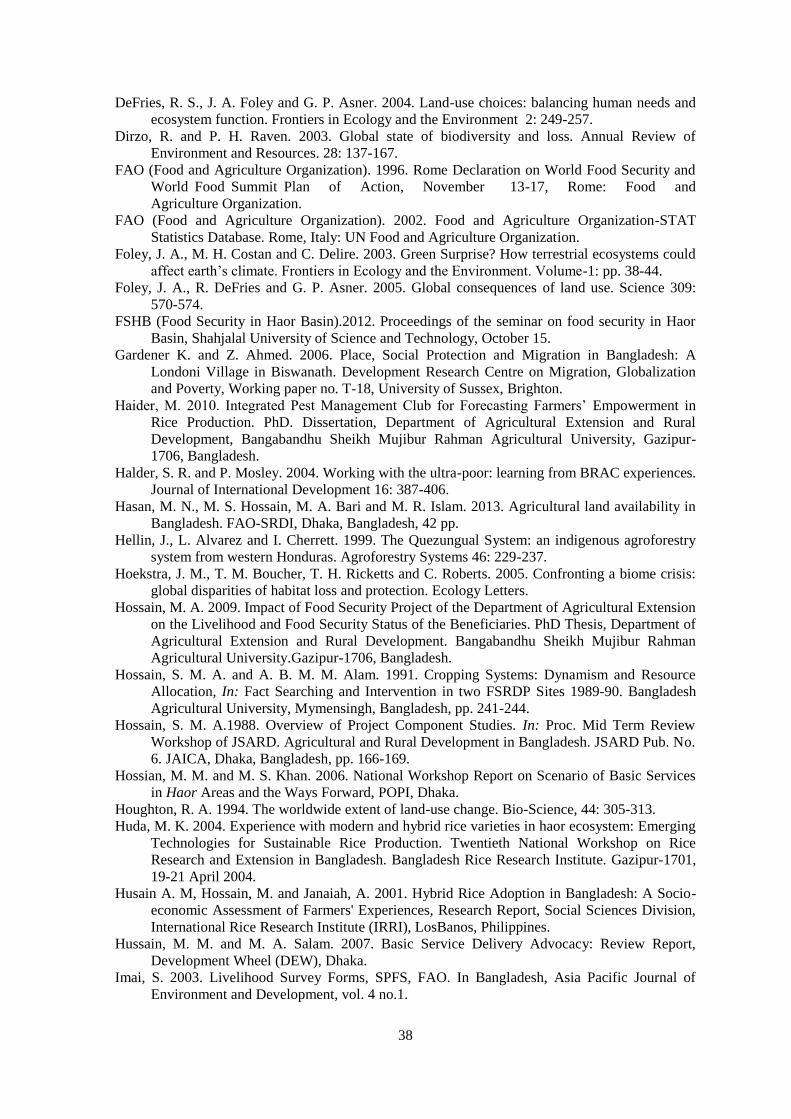
38
DeFries, R. S., J. A. Foley and G. P. Asner. 2004. Land-use choices: balancing human needs and
ecosystem function. Frontiers in Ecology and the Environment 2: 249-257.
Dirzo, R. and P. H. Raven. 2003. Global state of biodiversity and loss. Annual Review of
Environment and Resources. 28: 137-167.
FAO (Food and Agriculture Organization). 1996. Rome Declaration on World Food Security and
World Food Summit Plan of Action, November 13-17, Rome: Food and
Agriculture Organization.
FAO (Food and Agriculture Organization). 2002. Food and Agriculture Organization-STAT
Statistics Database. Rome, Italy: UN Food and Agriculture Organization.
Foley, J. A., M. H. Costan and C. Delire. 2003. Green Surprise? How terrestrial ecosystems could
affect earth’s climate. Frontiers in Ecology and the Environment. Volume-1: pp. 38-44.
Foley, J. A., R. DeFries and G. P. Asner. 2005. Global consequences of land use. Science 309:
570-574.
FSHB (Food Security in Haor Basin).2012. Proceedings of the seminar on food security in Haor
Basin, Shahjalal University of Science and Technology, October 15.
Gardener K. and Z. Ahmed. 2006. Place, Social Protection and Migration in Bangladesh: A
Londoni Village in Biswanath. Development Research Centre on Migration, Globalization
and Poverty, Working paper no. T-18, University of Sussex, Brighton.
Haider, M. 2010. Integrated Pest Management Club for Forecasting Farmers’ Empowerment in
Rice Production. PhD. Dissertation, Department of Agricultural Extension and Rural
Development, Bangabandhu Sheikh Mujibur Rahman Agricultural University, Gazipur-
1706, Bangladesh.
Halder, S. R. and P. Mosley. 2004. Working with the ultra-poor: learning from BRAC experiences.
Journal of International Development 16: 387-406.
Hasan, M. N., M. S. Hossain, M. A. Bari and M. R. Islam. 2013. Agricultural land availability in
Bangladesh. FAO-SRDI, Dhaka, Bangladesh, 42 pp.
Hellin, J., L. Alvarez and I. Cherrett. 1999. The Quezungual System: an indigenous agroforestry
system from western Honduras. Agroforestry Systems 46: 229-237.
Hoekstra, J. M., T. M. Boucher, T. H. Ricketts and C. Roberts. 2005. Confronting a biome crisis:
global disparities of habitat loss and protection. Ecology Letters.
Hossain, M. A. 2009. Impact of Food Security Project of the Department of Agricultural Extension
on the Livelihood and Food Security Status of the Beneficiaries. PhD Thesis, Department of
Agricultural Extension and Rural Development. Bangabandhu Sheikh Mujibur Rahman
Agricultural University.Gazipur-1706, Bangladesh.
Hossain, S. M. A. and A. B. M. M. Alam. 1991. Cropping Systems: Dynamism and Resource
Allocation, In: Fact Searching and Intervention in two FSRDP Sites 1989-90. Bangladesh
Agricultural University, Mymensingh, Bangladesh, pp. 241-244.
Hossain, S. M. A.1988. Overview of Project Component Studies. In: Proc. Mid Term Review
Workshop of JSARD. Agricultural and Rural Development in Bangladesh. JSARD Pub. No.
6. JAICA, Dhaka, Bangladesh, pp. 166-169.
Hossian, M. M. and M. S. Khan. 2006. National Workshop Report on Scenario of Basic Services
in Haor Areas and the Ways Forward, POPI, Dhaka.
Houghton, R. A. 1994. The worldwide extent of land-use change. Bio-Science, 44: 305-313.
Huda, M. K. 2004. Experience with modern and hybrid rice varieties in haor ecosystem: Emerging
Technologies for Sustainable Rice Production. Twentieth National Workshop on Rice
Research and Extension in Bangladesh. Bangladesh Rice Research Institute. Gazipur-1701,
19-21 April 2004.
Husain A. M, Hossain, M. and Janaiah, A. 2001. Hybrid Rice Adoption in Bangladesh: A Socio-
economic Assessment of Farmers' Experiences, Research Report, Social Sciences Division,
International Rice Research Institute (IRRI), LosBanos, Philippines.
Hussain, M. M. and M. A. Salam. 2007. Basic Service Delivery Advocacy: Review Report,
Development Wheel (DEW), Dhaka.
Imai, S. 2003. Livelihood Survey Forms, SPFS, FAO. In Bangladesh, Asia Pacific Journal of
Environment and Development, vol. 4 no.1.
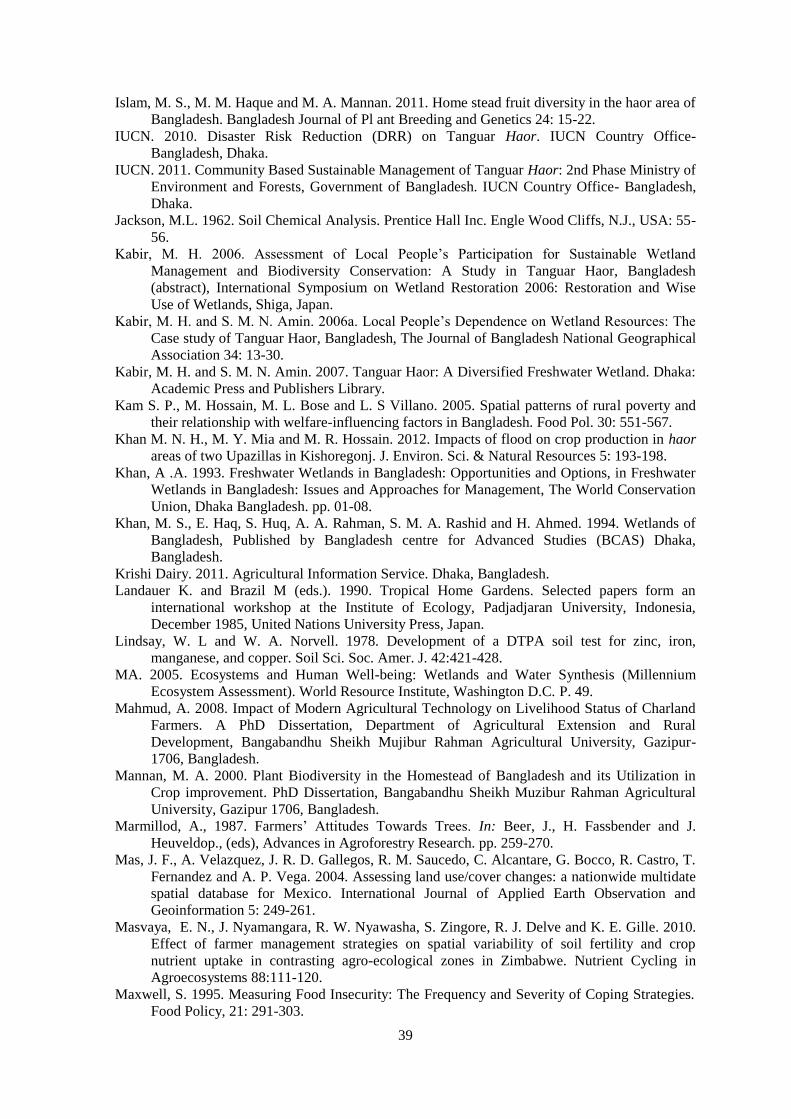
39
Islam, M. S., M. M. Haque and M. A. Mannan. 2011. Home stead fruit diversity in the haor area of
Bangladesh. Bangladesh Journal of Pl ant Breeding and Genetics 24: 15-22.
IUCN. 2010. Disaster Risk Reduction (DRR) on Tanguar Haor. IUCN Country Office-
Bangladesh, Dhaka.
IUCN. 2011. Community Based Sustainable Management of Tanguar Haor: 2nd Phase Ministry of
Environment and Forests, Government of Bangladesh. IUCN Country Office- Bangladesh,
Dhaka.
Jackson, M.L. 1962. Soil Chemical Analysis. Prentice Hall Inc. Engle Wood Cliffs, N.J., USA: 55-
56.
Kabir, M. H. 2006. Assessment of Local People’s Participation for Sustainable Wetland
Management and Biodiversity Conservation: A Study in Tanguar Haor, Bangladesh
(abstract), International Symposium on Wetland Restoration 2006: Restoration and Wise
Use of Wetlands, Shiga, Japan.
Kabir, M. H. and S. M. N. Amin. 2006a. Local People’s Dependence on Wetland Resources: The
Case study of Tanguar Haor, Bangladesh, The Journal of Bangladesh National Geographical
Association 34: 13-30.
Kabir, M. H. and S. M. N. Amin. 2007. Tanguar Haor: A Diversified Freshwater Wetland. Dhaka:
Academic Press and Publishers Library.
Kam S. P., M. Hossain, M. L. Bose and L. S Villano. 2005. Spatial patterns of rural poverty and
their relationship with welfare-influencing factors in Bangladesh. Food Pol. 30: 551-567.
Khan M. N. H., M. Y. Mia and M. R. Hossain. 2012. Impacts of flood on crop production in haor
areas of two Upazillas in Kishoregonj. J. Environ. Sci. & Natural Resources 5: 193-198.
Khan, A .A. 1993. Freshwater Wetlands in Bangladesh: Opportunities and Options, in Freshwater
Wetlands in Bangladesh: Issues and Approaches for Management, The World Conservation
Union, Dhaka Bangladesh. pp. 01-08.
Khan, M. S., E. Haq, S. Huq, A. A. Rahman, S. M. A. Rashid and H. Ahmed. 1994. Wetlands of
Bangladesh, Published by Bangladesh centre for Advanced Studies (BCAS) Dhaka,
Bangladesh.
Krishi Dairy. 2011. Agricultural Information Service. Dhaka, Bangladesh.
Landauer K. and Brazil M (eds.). 1990. Tropical Home Gardens. Selected papers form an
international workshop at the Institute of Ecology, Padjadjaran University, Indonesia,
December 1985, United Nations University Press, Japan.
Lindsay, W. L and W. A. Norvell. 1978. Development of a DTPA soil test for zinc, iron,
manganese, and copper. Soil Sci. Soc. Amer. J. 42:421-428.
MA. 2005. Ecosystems and Human Well-being: Wetlands and Water Synthesis (Millennium
Ecosystem Assessment). World Resource Institute, Washington D.C. P. 49.
Mahmud, A. 2008. Impact of Modern Agricultural Technology on Livelihood Status of Charland
Farmers. A PhD Dissertation, Department of Agricultural Extension and Rural
Development, Bangabandhu Sheikh Mujibur Rahman Agricultural University, Gazipur-
1706, Bangladesh.
Mannan, M. A. 2000. Plant Biodiversity in the Homestead of Bangladesh and its Utilization in
Crop improvement. PhD Dissertation, Bangabandhu Sheikh Muzibur Rahman Agricultural
University, Gazipur 1706, Bangladesh.
Marmillod, A., 1987. Farmers’ Attitudes Towards Trees. In: Beer, J., H. Fassbender and J.
Heuveldop., (eds), Advances in Agroforestry Research. pp. 259-270.
Mas, J. F., A. Velazquez, J. R. D. Gallegos, R. M. Saucedo, C. Alcantare, G. Bocco, R. Castro, T.
Fernandez and A. P. Vega. 2004. Assessing land use/cover changes: a nationwide multidate
spatial database for Mexico. International Journal of Applied Earth Observation and
Geoinformation 5: 249-261.
Masvaya, E. N., J. Nyamangara, R. W. Nyawasha, S. Zingore, R. J. Delve and K. E. Gille. 2010.
Effect of farmer management strategies on spatial variability of soil fertility and crop
nutrient uptake in contrasting agro-ecological zones in Zimbabwe. Nutrient Cycling in
Agroecosystems 88:111-120.
Maxwell, S. 1995. Measuring Food Insecurity: The Frequency and Severity of Coping Strategies.
Food Policy, 21: 291-303.
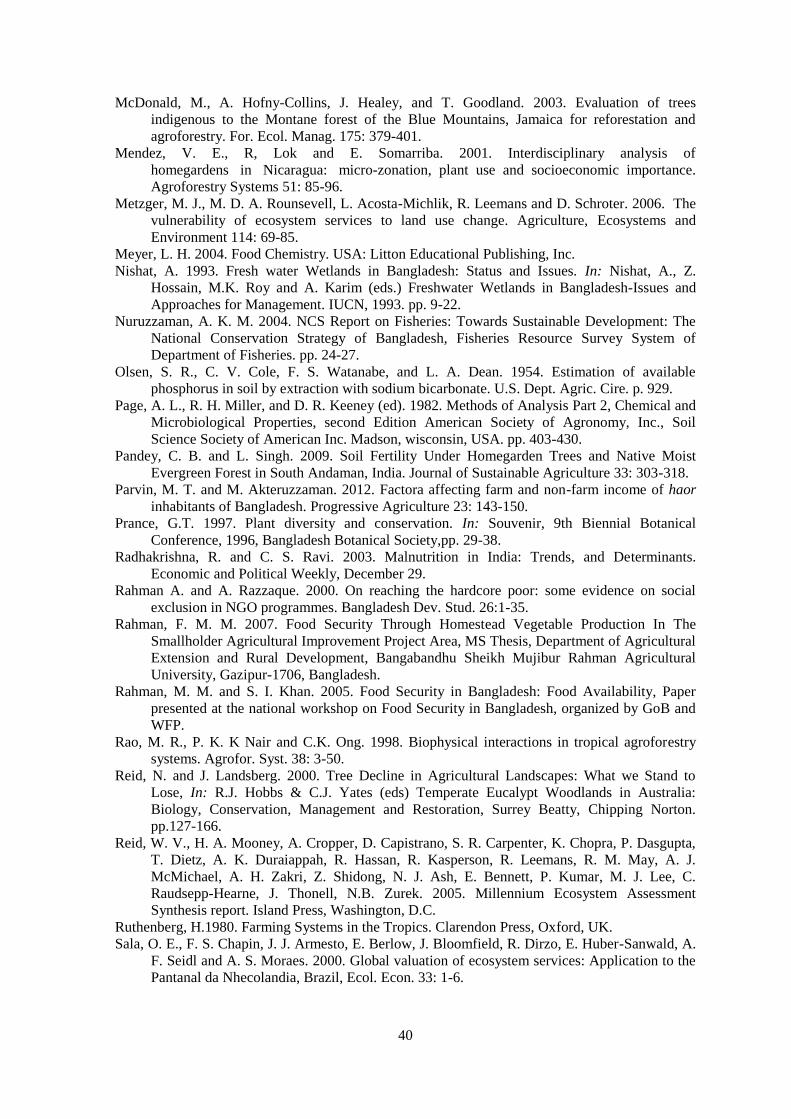
40
McDonald, M., A. Hofny-Collins, J. Healey, and T. Goodland. 2003. Evaluation of trees
indigenous to the Montane forest of the Blue Mountains, Jamaica for reforestation and
agroforestry. For. Ecol. Manag. 175: 379-401.
Mendez, V. E., R, Lok and E. Somarriba. 2001. Interdisciplinary analysis of
homegardens�in�Nicaragua:�micro-zonation, plant use and socioeconomic importance.
Agroforestry Systems 51: 85-96.
Metzger, M. J., M. D. A. Rounsevell, L. Acosta-Michlik, R. Leemans and D. Schroter. 2006. The
vulnerability of ecosystem services to land use change. Agriculture, Ecosystems and
Environment 114: 69-85.
Meyer, L. H. 2004. Food Chemistry. USA: Litton Educational Publishing, Inc.
Nishat, A. 1993. Fresh water Wetlands in Bangladesh: Status and Issues. In: Nishat, A., Z.
Hossain, M.K. Roy and A. Karim (eds.) Freshwater Wetlands in Bangladesh-Issues and
Approaches for Management. IUCN, 1993. pp. 9-22.
Nuruzzaman, A. K. M. 2004. NCS Report on Fisheries: Towards Sustainable Development: The
National Conservation Strategy of Bangladesh, Fisheries Resource Survey System of
Department of Fisheries. pp. 24-27.
Olsen, S. R., C. V. Cole, F. S. Watanabe, and L. A. Dean. 1954. Estimation of available
phosphorus in soil by extraction with sodium bicarbonate. U.S. Dept. Agric. Cire. p. 929.
Page, A. L., R. H. Miller, and D. R. Keeney (ed). 1982. Methods of Analysis Part 2, Chemical and
Microbiological Properties, second Edition American Society of Agronomy, Inc., Soil
Science Society of American Inc. Madson, wisconsin, USA. pp. 403-430.
Pandey, C. B. and L. Singh. 2009. Soil Fertility Under Homegarden Trees and Native Moist
Evergreen Forest in South Andaman, India. Journal of Sustainable Agriculture 33: 303-318.
Parvin, M. T. and M. Akteruzzaman. 2012. Factora affecting farm and non-farm income of haor
inhabitants of Bangladesh. Progressive Agriculture 23: 143-150.
Prance, G.T. 1997. Plant diversity and conservation. In: Souvenir, 9th Biennial Botanical
Conference, 1996, Bangladesh Botanical Society,pp. 29-38.
Radhakrishna, R. and C. S. Ravi. 2003. Malnutrition in India: Trends, and Determinants.
Economic and Political Weekly, December 29.
Rahman A. and A. Razzaque. 2000. On reaching the hardcore poor: some evidence on social
exclusion in NGO programmes. Bangladesh Dev. Stud. 26:1-35.
Rahman, F. M. M. 2007. Food Security Through Homestead Vegetable Production In The
Smallholder Agricultural Improvement Project Area, MS Thesis, Department of Agricultural
Extension and Rural Development, Bangabandhu Sheikh Mujibur Rahman Agricultural
University, Gazipur-1706, Bangladesh.
Rahman, M. M. and S. I. Khan. 2005. Food Security in Bangladesh: Food Availability, Paper
presented at the national workshop on Food Security in Bangladesh, organized by GoB and
WFP.
Rao, M. R., P. K. K Nair and C.K. Ong. 1998. Biophysical interactions in tropical agroforestry
systems. Agrofor. Syst. 38: 3-50.
Reid, N. and J. Landsberg. 2000. Tree Decline in Agricultural Landscapes: What we Stand to
Lose, In: R.J. Hobbs & C.J. Yates (eds) Temperate Eucalypt Woodlands in Australia:
Biology, Conservation, Management and Restoration, Surrey Beatty, Chipping Norton.
pp.127-166.
Reid, W. V., H. A. Mooney, A. Cropper, D. Capistrano, S. R. Carpenter, K. Chopra, P. Dasgupta,
T. Dietz, A. K. Duraiappah, R. Hassan, R. Kasperson, R. Leemans, R. M. May, A. J.
McMichael, A. H. Zakri, Z. Shidong, N. J. Ash, E. Bennett, P. Kumar, M. J. Lee, C.
Raudsepp-Hearne, J. Thonell, N.B. Zurek. 2005. Millennium Ecosystem Assessment
Synthesis report. Island Press, Washington, D.C.
Ruthenberg, H.1980. Farming Systems in the Tropics. Clarendon Press, Oxford, UK.
Sala, O. E., F. S. Chapin, J. J. Armesto, E. Berlow, J. Bloomfield, R. Dirzo, E. Huber-Sanwald, A.
F. Seidl and A. S. Moraes. 2000. Global valuation of ecosystem services: Application to the
Pantanal da Nhecolandia, Brazil, Ecol. Econ. 33: 1-6.
41
Salauddin, M. and A. K. M. S. Islam. 2011. Identification of Land Cover Changes of The Haor
Area of Bangladesh Using Modis Images. Bangladesh University of Engineering and
Technology (BUET), Dhaka-1000, Bangladesh.
Sanderson, E. W., M. Jaiteh, M. A. Levy, K. H. Redford, A. V. Wannebo, G. Woomer. 2002. The
human footprint is a global map of human influence on the land surface, which suggests that
human beings are stewards of nature, whether we like it or not. BioScience 52: 891-904.
Sarma, P. K. 2010. Scenario of haor vulnerabilities and other obstacles for sustainable livelihood
development in Nikli upazila. Journal of Bangladesh Agricultural University 8: 283-290.
Shaner, W. W., P. F. Philipp and W. R. Schemehl. 1982. Farming Systems Research and
Development: Guidelines for Developing Countries. Westview Press, Boulder, Colorado.
Talukder, R. K. and J. J. Quilkey. 1991. Food preference and calorie intake behaviour in
Bangladesh. The Bangladesh Journal of Agricultural Economics, 16: 1-26.
Tittonell, P., A. Muriuki, C. J. Klapwijk, K. D. Shepherd, R. Coe and B. Vanlauwe. 2013. Soil
heterogeneity and soil fertility gradients in smallholder farms of the East African highlands.
Soil Science Society of America Journal 77: 525-538.
Turner II, B. L., D. L. Skole, S. Sanderson, G. Fischer, L. O. Fresco and R. Leemans. 1997. Land
use and land-cover change. Earth Science Frontiers 4: 26-33.
UNEP (United Nations Environment Programme). 1995. Global Biodiversity Assessment. V.H.
Heywood, Ed. Cambridge, UK: Cambridge University Press.
USAID. 2007. Restoring Wetlands through Improved Governance: Community Based Co-
Management in Bangladesh, The MACH Experience. Technical Paper 1.
Webb, P., J. Coates and R. Houser.2002. Allocative Responses to Scarcity: Self-Reported
Assessments of Hunger Compared with Conventional Measures of Poverty and Malnutrition
in Bangladesh. Food Policy and Applied Nutrition Program, Discussion paper No.13,
TUFTS Nutrition.
Zhao, G. X., G. Lin and T. Warner. 2004. Using Thematic Mapper data for change detection and
sustainable use of cultivated land: a case study in the Yellow River delta, China.
International. Journal of Remote Sensing 25: 2509-2522.
Zingore, S. H. K. Murwira, R. J. Delve and K. E. Giller. 2007. Influence of nutrient management
strategies on variability of soil fertility, crop yields and nutrient balances on smallholder
farms in Zimbabwe. Agriculture, Ecosystems & Environment 119: 112-126.
Related Documents