MARINE ECOLOGY PROGRESS SERIES Mar Ecol Prog Ser Vol. 234: 289–299, 2002 Published June 3 INTRODUCTION Seabirds are important components of marine ecosystems and occupy a range of trophic levels in marine food webs (Croxall 1987, Hobson & Welch 1992). Seabirds may thus be good indicators of environmental changes (Ainley 1980, Jarman et al. 1996), including fluctuations in prey abundance and distribution (Hatch & Sanger 1992, Montevecchi 1993, Montevecchi & Myers 1995). In addition, seabirds are generally be- © Inter-Research 2002 · www.int-res.com *E-mail: [email protected]; [email protected] Food resource utilisation by the Magellanic penguin evaluated through stable-isotope analysis: segregation by sex and age and influence on offspring quality Manuela G. Forero 1, *, Keith A. Hobson 2, 3 , Gary R. Bortolotti 2 , Jose A. Donázar 4 , M. Bertellotti 4 , G. Blanco 5 1 Instituto Mediterráneo da Estudios Avanzadas (C.S.I.C.-U.I.B), C/Miguel Marqués, 21, 07190 Esporles, Mallorca, Spain 2 Department of Biology, University of Saskatchewan, Saskatoon, Saskatchewan S7N5E2, Canada 3 Canadian Wildlife Service, 115 Perimeter Road, Saskatoon, Saskatchewan S7N0X4, Canada 4 Department of Applied Biology, Estación Biológica de Doñana, Consejo Superior de Investigaciones Científicas, Apdo. 1056, 41013 Sevilla, Spain 5 Instituto de Investigación en Recursas Cinegéticos (C.S.I.C.-U.C.L.M.), Ronda de Toledo, s/n, 13005 Civdad Real, Spain ABSTRACT: We used stable-isotope analysis (SIA) to evaluate sources of variation in the diet of and prey selection by Magellanic penguins Spheniscus magellanicus breeding on the Argentinean Patagonia coast. Our aim was to determine potential sources of variation in diet, focusing mainly on sex and age, although geographic and temporal effects were also taken into account. In addition, we evaluated how prey selection affects offspring quality. We measured stable nitrogen (δ 15 N) and carbon (δ 13 C) isotope values in whole blood of chicks (n = 98), yearlings (n = 15) and adults (n = 143) in 9 different breeding colonies during 2 consecutive breeding seasons (1999 and 2000). We also measured stable isotope val- ues in representative prey consumed by this species. Stable nitrogen and carbon isotope values in blood for penguins varied from 17.8 to 20.0 ‰ and from –18.1 to –14.8 ‰, respectively. Both colony and season had a significant effect on the 2 isotope signatures. Adult males had higher blood δ 15 N and δ 13 C values than females. Age significantly affected both δ 15 N and δ 13 C values, with chicks showing the highest and yearlings the lowest δ 15 N values. Chicks showed lower δ 13 C values than yearlings and adults. Mean prey δ 15 N values ranged from 13.6 ‰ in squid to 18.0 ‰ in octopus. As anchovy, the main prey consumed by the species in the study area, did not differ from other fish species (hake) in its δ 15 N value, we used it to represent a fish dietary alternative. Using a 2-source (anchovy and squid) isotopic mixing model, we de- termined that the mean proportion of anchovy in the diet was 49% for yearlings, 76% for chicks, and 69% and 67% for adult males and females, respectively. Sex and age differences in diet, as revealed by stable isotopes, may be the consequence of individual morphology (sexual size dimorphism) and re- productive constraints imposed by chick development since growing young require more nutritive prey than adults and yearlings. This reasoning would also explain the significant and positive correlation found between proportion of anchovy in the diet and body condition of chicks. KEY WORDS: Diet segregation · Stable-isotope analysis · Magellanic penguin · Argentinean Patagonia · Chick quality Resale or republication not permitted without written consent of the publisher

Welcome message from author
This document is posted to help you gain knowledge. Please leave a comment to let me know what you think about it! Share it to your friends and learn new things together.
Transcript
MARINE ECOLOGY PROGRESS SERIESMar Ecol Prog Ser
Vol. 234: 289–299, 2002 Published June 3
INTRODUCTION
Seabirds are important components of marineecosystems and occupy a range of trophic levels inmarine food webs (Croxall 1987, Hobson & Welch 1992).
Seabirds may thus be good indicators of environmentalchanges (Ainley 1980, Jarman et al. 1996), includingfluctuations in prey abundance and distribution (Hatch& Sanger 1992, Montevecchi 1993, Montevecchi &Myers 1995). In addition, seabirds are generally be-
© Inter-Research 2002 · www.int-res.com *E-mail: [email protected]; [email protected]
Food resource utilisation by the Magellanicpenguin evaluated through stable-isotope analysis:
segregation by sex and age and influence onoffspring quality
Manuela G. Forero1,*, Keith A. Hobson2, 3, Gary R. Bortolotti2, Jose A. Donázar4, M. Bertellotti4, G. Blanco5
1Instituto Mediterráneo da Estudios Avanzadas (C.S.I.C.-U.I.B), C/Miguel Marqués, 21, 07190 Esporles, Mallorca, Spain2Department of Biology, University of Saskatchewan, Saskatoon, Saskatchewan S7N5E2, Canada
3Canadian Wildlife Service, 115 Perimeter Road, Saskatoon, Saskatchewan S7N0X4, Canada 4Department of Applied Biology, Estación Biológica de Doñana, Consejo Superior de Investigaciones Científicas,
Apdo. 1056, 41013 Sevilla, Spain5Instituto de Investigación en Recursas Cinegéticos (C.S.I.C.-U.C.L.M.), Ronda de Toledo, s/n, 13005 Civdad Real, Spain
ABSTRACT: We used stable-isotope analysis (SIA) to evaluate sources of variation in the diet of and preyselection by Magellanic penguins Spheniscus magellanicus breeding on the Argentinean Patagoniacoast. Our aim was to determine potential sources of variation in diet, focusing mainly on sex and age,although geographic and temporal effects were also taken into account. In addition, we evaluated howprey selection affects offspring quality. We measured stable nitrogen (δ15N) and carbon (δ13C) isotopevalues in whole blood of chicks (n = 98), yearlings (n = 15) and adults (n = 143) in 9 different breedingcolonies during 2 consecutive breeding seasons (1999 and 2000). We also measured stable isotope val-ues in representative prey consumed by this species. Stable nitrogen and carbon isotope values in bloodfor penguins varied from 17.8 to 20.0‰ and from –18.1 to –14.8‰, respectively. Both colony and seasonhad a significant effect on the 2 isotope signatures. Adult males had higher blood δ15N and δ13C valuesthan females. Age significantly affected both δ15N and δ13C values, with chicks showing the highest andyearlings the lowest δ15N values. Chicks showed lower δ13C values than yearlings and adults. Mean preyδ15N values ranged from 13.6 ‰ in squid to 18.0 ‰ in octopus. As anchovy, the main prey consumed bythe species in the study area, did not differ from other fish species (hake) in its δ15N value, we used it torepresent a fish dietary alternative. Using a 2-source (anchovy and squid) isotopic mixing model, we de-termined that the mean proportion of anchovy in the diet was 49% for yearlings, 76% for chicks, and69% and 67% for adult males and females, respectively. Sex and age differences in diet, as revealed bystable isotopes, may be the consequence of individual morphology (sexual size dimorphism) and re-productive constraints imposed by chick development since growing young require more nutritive preythan adults and yearlings. This reasoning would also explain the significant and positive correlationfound between proportion of anchovy in the diet and body condition of chicks.
KEY WORDS: Diet segregation ·Stable-isotope analysis ·Magellanic penguin ·Argentinean Patagonia ·Chick quality
Resale or republication not permitted without written consent of the publisher
Mar Ecol Prog Ser 234: 289–299, 2002
lieved to be regulated by their food supply, which isthought to be sparse and patchily distributed (Ander-son et al. 1982, Monaghan et al. 1989, Cairns 1992).There is an increasing interest in the study of diet com-position and feeding ecology of seabirds as an impor-tant key to understanding the dynamics of their pop-ulations and as indicators of environmental health(Montevecchi 1993).
Factors influencing feeding behavior and preychoice by individuals range from behavioral to mor-phological characteristics, and all of them may impactfitness of individuals (Pierotti & Annet 1995). Withinpopulations, age and experience of individuals are fac-tors contributing to variation in exploitation of foodresources, but few studies have investigated differ-ences in diet between different age-classes in seabirds(see however Hobson 1993, Pedrocchi et al. 1996,Bearhop et al. 2000, Hodum & Hobson 2000). Nonethe-less, differences in competitive ability caused by fac-tors such as age or experience may largely determinequality and quantity of food resources exploited byindividuals. A second potential source of variation infeeding behavior within populations is differences inmorphology. Many studies have reported differencesin the diets of males and females of seabirds (e.g.Koffijberg & van Eerden 1995, Kato et al. 1996, Clarkeet al. 1998, González-Solís et al. 2000). The ‘IntersexualCompetition Hypothesis’ predicts that in dimorphicspecies, reduction of competition for food between thesexes results from the capture of different prey typesby each sex and that this is one of the main selectiveforces maintaining sexual dimorphism (Selander1972). Important differences in exploitation of foodresources with stage of the life cycle of individuals maybe yet another factor contributing to variation in dietswithin species (Pierotti & Annet 1991, Bertellotti &Yorio 1999, Velando & Freire 1999). The optimal forag-ing theory (Emlen 1966, McArthur & Pianka 1966,Stephens and Krebs 1986) was built on the assumptionthat animals would enhance their fitness by foraging inways that maximize the net rate of energy gain. Underthis theoretical framework we could predict how par-ents, during the breeding season, should distributefood resources between themselves and their off-spring. In this context, we hypothesize that parentsmay optimize their success and their investment in off-spring by provisioning themselves with different preythan they feed their chicks, as energetic needs ofchicks during growing should be higher than in adults(Moreno & Sanz 1996). Finally, as most seabird speciesare colonial, variation in the distribution of marineresources could introduce important differences in thediet among geographical locations (Croxall & Lishman1987, Frere et al. 1996, Bertellotti & Yorio 1999,Velando & Freire 1999).
Despite the importance of identifying sources of vari-ation in diet and foraging behavior in order to under-stand the ecology of seabirds, these aspects have notbeen well studied. This gap is due, in part, to method-ological limitations. Most studies of seabird diet haverelied upon examination of stomach contents of adultbirds. These conventional methods are useful for iden-tifying specific prey taxa. However, several sources ofbias exist with this procedure, including the rapiddigestion of soft-bodied prey (see reviews in Duffy &Jackson 1986 and González-Solís et al. 1999). Recently,numerous studies have used alternative approaches todietary analyses by measuring the proportional abun-dance of stable isotopes of various elements in differ-ent tissues from both consumer and prey species (e.g.Hobson 1993, Hobson et al. 1994, Sydeman et al. 1997,Thomson et al. 1999). This approach is based on thefact that stable-isotope ratios of nitrogen (15N:14N, ex-pressed as δ15N) and carbon (13C:12C, expressed as δ13C)in the consumer tissues reflect those in their prey in apredictable manner (DeNiro & Epstein 1978, 1981). Inmarine ecosystems a step-wise enrichment of 15N typi-cally occurs with each trophic level (Hobson & Welch1992, Hobson et al. 1994, Sydeman et al. 1997) andranges between about 3 and 5‰ (Michener & Schell1994). δ13C values provide less information on trophiclevel but can reveal sources of feeding, includinginshore versus offshore foraging in marine habitats, asphytoplankton has lighter δ13C than many inshoreplants (Hobson et al. 1994, France 1995, Hobson et al.1995). Thus, δ13C values can be used as an approxi-mate indicator of the zone of feeding around thecolony. Recent investigations have also indicated that agreat deal of dietary information can be obtained fromthe isotopic analysis of blood, thereby reducing theneed to sacrifice birds just for analysis of diet (Hobson& Clark 1992, 1993, Ben-David et al. 1997, Hobson etal. 1997, Hodum & Hobson 2000). In addition, theperiod over which tissue isotopic concentrations reflectdiet depends, in part, on the isotopic turnover rate inthat tissue (Tieszen et al. 1983, Hobson 1993). Stable-isotope signatures of whole blood represent dietaryinformation integrated over a period of at least 4 wk(Hobson & Clark 1992). Isotopic analysis of blood sam-ples are appropriate, then, for studying feeding eco-logy during the chick-rearing period or other discreteperiods of time.
In this study, we used stable-isotope analysis (SIA) totest potential sources of variation in the diet of Magel-lanic penguins Spheniscus magellanicus, a dimorphicseabird breeding on the Argentinean Patagonia coast.We focused primarily on age and sex differences assources of variation in the diet of this species. We mea-sured variation in stable-nitrogen and carbon isotoperatios for penguins from different colonies and for their
290
Forero et al.: Evaluation of Magellanic penguin food utilisation using stable-isotope analysis
main prey. In addition, we examined if prey selectiondiffered between individuals of different age andreproductive status and if prey distribution betweenparents and chicks had consequences for breedingperformance of individuals as measured by offspringbody condition.
MATERIALS AND METHODS
Study area and species. This study was conducted inthe Chubut province of Argentinean Patagonia during2 consecutive breeding seasons (1999 and 2000). Inthis area we selected 9 breeding colonies distributedacross a long extension of coast (see Table 1). Magel-lanic penguins arrive at their breeding colonies in lateAugust and early September (Boersma et al. 1990).During the first 2 wk after arrival, they remain on thebeach without consuming food until eggs are laid (Sco-laro 1984). The breeding season extends then to lateJanuary, when chicks leave the colonies. Clutches typ-ically contain 2 eggs, but second-hatched chicks arelost from a high proportion of nests due mainly to star-vation (Boersma & Stokes 1995). Nest relief periodsbetween members of pairs become shorter from thelaying and incubation to the chick stage. Both malesand females provide food to chicks (Stokes & Boersma1998). During the chick-rearing period food is deliv-ered to chicks once every 24 h by 1 member of the pair(Scolaro 1984).
The Magellanic penguin is a diving species that for-ages primarily on pelagic schooling fishes and to alesser extent on squid. In our study area, the most com-mon prey during the breeding season is anchovy(Engraulis anchoita) while hake (Merluccius hubbsi),squid (Loligo and Illex sp.) and crustaceans (Artemisialonginaris) are secondary prey (Scolaro et al. 1999).Estimations of foraging ranges for the chick-rearingperiod, based on chick-feeding intervals and meanswimming speeds, are about 30 km (Scolaro 1984, Wil-son et al. 1995).
Sampling penguins and prey. We visited colonieswhen most of the chicks were about 70 d old, and insome cases a few days before they left the nest. Mostchicks were caught while they were attended by theirparents, so we also captured the adult that was presentat that time. Yearlings, identified by molt and plumage(Williams 1995), were sampled on the shore. We mea-sured (to the nearest mm) bill length and bill depthusing calipers, and flipper length using a wing rule.Weighing was carried out using a spring balance witha precision of 25 g. Some structural body measure-ments of chicks, such as bill length, had not reachedasymptotic values at the time of sampling (Boersma etal. 1990). Previous studies have shown that bill length
grows linearly with age throughout the chick period(Boersma et al. 1990). Because we sampled chicks dif-fering slightly in age, we controlled for bill length (asan indicator of age) to remove possible age effectswhen calculating an index of body condition. Becausechicks of this species are sexually dimorphic in size(authors’ unpubl. data), sex (determined by molecularprocedures, see below) was also included in the calcu-lation of body condition. As an index of body conditionof the chicks we used the residuals from an ANCOVAwith log body mass as the dependent variable, sex asthe main factor and log of flipper and bill length ascovariates (r2 = 0.342, F3, 304 = 51.890, p < 0.001). Anadditional number of chicks sampled in the samecolonies and period as part of other studies (see Foreroet al. 2001, Jovani et al. 2001, Tella et al. 2001) wasused to calculate this index.
Before releasing individuals, about 1 ml of blood wasextracted from the brachial or tarsal veins. The bloodwas transferred to 2 different vials containing 1.5 ml of70% ethanol (see Hobson et al. 1997). One of the sam-ples of blood was used for stable-isotope analyses andthe other one was processed for molecular sexing ofthe birds. Sexing of birds was carried out using theprimers 2945F, cFR and 3224R as described by Elle-gren (1996), which provide a universal method for sex-ing birds (e.g. M.B. et al. unpubl. data). Final samplesizes by colony, sex and age varied due to the differen-tial difficulty of capturing birds in different coloniesand some losses during sample processing.
Based on previous studies of the diet of Magellanicpenguins (Scolaro & Badano 1986, Frere et al. 1996,Gandini et al. 1999, Scolaro et al. 1999), we selectedthe following prey species for further analyses of stableisotopes: anchovy, hake, Argentine shrimp (Artemisialonginaris), Patagonian and Argentine squids (Loligoand Illex sp., respectively) and Patagonian octopus(Octopus tehuelche). Prey samples were collected fromthe waters where the penguins forage, inshore and off-shore, the latter supplied by the fishing industry. Addi-tionally, we obtained some prey from regurgitates thatoccurred as we handled the birds. Species determina-tion of prey was performed directly in the field, as mostof the prey samples were from whole animals. Afterthat, we preserved a small portion of soft tissue fromeach prey in 5 ml of 70% ethanol for use in stable-isotope analyses.
Stable-isotope analyses. Samples of prey and bloodof penguins were stored at room temperature (20 to25°C) until isotope analysis. Ethanol was removed fromprey samples by successive rinsing in distilled waterand freeze-drying. Prey tissues were treated for lipidextraction using a Soxhlet apparatus with chloroformsolvent and then dried at 60°C for 24 h to remove anyresidual solvent. Extraction of lipids was not necessary
291
Mar Ecol Prog Ser 234: 289–299, 2002
for blood samples because the lipid component inblood is generally very low (Deuel 1955). Whole bloodstored in solution was freeze-dried and then pow-dered. Stable-carbon and nitrogen isotope assays wereperformed on 1 mg subsamples of homogenizedmaterials by loading into tin cups and combusting at1800°C in a Robo-Prep elemental analyzer. ResultantCO2 and N2 gases were then analyzed using an inter-faced Europa 20:20 continuous-flow isotope ratio massspectrometer (CFIRMS) with every 5 unknowns sepa-rated by 2 laboratory standards (egg albumin). Stable-isotope abundances were expressed in δ notation asthe deviation from standards in parts per thousand (‰)according to the following equation:
δX = [(Rsample/Rstandard) – 1] × 1000
where X = 15N or 13C, and R = the corresponding ratio15N/14N or 13C/12C. The Rstandard for 15N is that foratmospheric N2 (air) and for 13C is that for Pee DeeBelemnite (PDB). Based on numerous measurementsof organic standards (albumen and collagen) the ana-lytical precision (±1 SD) of these measurements is esti-mated to be ±0.1 and ±0.3‰ for carbon and nitrogen,respectively (Hobson et al. 1994).
Isotopic models. We used a 2-source isotopic mixingmodel based on δ15N values (Hobson 1993, Hodum &Hobson 2000) to estimate what proportion of the pen-guin diet was comprised of each of the major dietsources (anchovy or squid). This linear mixing modelusing 2 endpoints and 1 isotope follows on as a simplecase of the linear procedure proposed by Phillips(2001). As both isotopic endpoints did not vary in theircarbon and nitrogen concentrations (unpubl. data), itwas not necessary to make adjustments based on dif-ferential compositions (Phillips & Koch 2001). Becauseof the dominance of anchovy in the diet of Magellanicpenguins (Scolaro et al. 1999) and its similar isotopiccomposition to that of other fishes included in the diet(see ‘Results’), we used anchovy as the sole represen-tation of fish in the diet. In addition, we also assumedthat the isotopic fractionation factor (∆dt) for δ15Nbetween diet and penguin whole blood was 3‰ , andthat it was not affected by age (DeNiro & Epstein 1981,Minagawa & Wada 1984, Hodum & Hobson 2000). Forthe simplest situation involving only 2 main dietaryoptions (anchovy and squid) that are segregated troph-ically (see ‘Results’), the relative contribution of eachprey type to the diet of a consumer was estimatedaccording to the following relationship:
Pa = (Dt – Db)/(Db – Da)
where Pa is the proportion of the diet derived fromsource ‘a’; D t the δ15N value of the consumer blood; andDa and Db are the consumer blood δ15N values cor-responding to exclusive diets of type ‘a’ and ‘b’ (i.e.
anchovy and squid) respectively, calculated as the iso-topic value of the prey plus the enrichment factor (∆dt)between the prey and consumer.
Statistical analyses. To account for possible variationin isotopic signatures between colonies and years, wefirst assessed whether there were colony or year effectson both blood δ15N and δ13C values. When these effectswere significant for any of the isotope signatures, thesefactors were taken into account in further analyses toavoid possible biases in the results. Differences be-tween sexes were tested for adults and chicks sepa-rately. Age effects were explored in those colonieswhere we sampled the 3 age classes. Differences inδ15N values among prey types were analyzed by 1-wayANOVA. When post-hoc comparisons were required,we used the Tukey Honest Significant Difference test(HSD). The effect of δ15N on body condition of chickswas analyzed using linear regression and 1-tailedtests. Because penguin chick traits vary with diet(Heath & Randall 1985), we predicted that body condi-tion of chicks would improve as the proportion of fishin the diet increased. In some colonies, sample size wastoo small for some age or sex classes (see Table 1), sosome of them were excluded for some analyses. Nor-mality of distributions was assessed through inspectionof normal plots and Kolmogorov-Smirnov test anddepartures from homogeneity of variances using Lev-ene's test.
RESULTS
A total of 256 penguins from 9 different colonies wassampled for blood stable-isotope signatures (Table 1).Differences in isotope signatures among colonies wereanalyzed separately by year using those colonies sam-pled in the same breeding season. We found a signifi-cant effect of colony identity on δ15N (1-way ANOVA,1999: F5,153 = 9.89, p < 0.001; 2000: F5,91 = 5.35,p < 0.001) and δ13C values (1999: F5,153 = 59.24,p < 0.001; 2000: F5,91 = 9.91, p < 0.001). Annual effectson isotope signatures were explored in the 3 coloniesthat were sampled during 2 consecutive breeding sea-sons (see Table 1). There were no differences betweenyears in δ15N values in any colony (2-way ANOVA,year: F1,143 = 2.09, p = 0.15; colony: F2,143 = 6.88,p < 0.01; colony × year: F2,143 = 2.29, p = 0.10); how-ever, for δ13C values, year, colony and the interactionwere significant (year: F1,143 = 52.14, p < 0.01; colony:F2,143 = 74.81, p < 0.001; colony × year: F2,143 = 8.77,p < 0.001), indicating that differences in δ13C betweenyears varied among colonies. Previous results also in-dicated that differences among colonies in both iso-topes remained significant by considering only these3 colonies. Post-hoc tests showed that δ15N values in
292
Forero et al.: Evaluation of Magellanic penguin food utilisation using stable-isotope analysis
Punta Tombo (see Table 1) were different from theother 2 colonies (Tukey HSD test, all p < 0.001), whichshowed similar values of this isotope (Tukey HSD test,p = 0.76). For δ13C values, there were significant dif-ferences among all colonies (Tukey HSD test, allp < 0.007). Therefore, the effects of colony on δ15N val-ues, and colony, year and its interaction on δ13C values,were taken into account in further analyses by includ-ing these terms in the models.
Nitrogen and carbon isotope values in blood for pen-guins varied from 17.8 to 20.0‰ and from –18.1 to–14.8‰, respectively. δ15N and δ13C values were notcorrelated in chicks (Pearson rank correlation, r = –0.14,p = 0.17) or adults (r = 0.03, p = 0.17), so we analyzedthe effects of age and sex separately for each isotope.
Differences between the sexes in δ15N and δ13C val-ues were analyzed excluding the colonies Caleta Ex-terna and Isla Vernaci Norte 1 (see Table 1), becausewe did not know the sex of most of the birds sampledthere. For chicks, sex had no influence on blood δ15N(2-way ANOVA, sex: F1,72 = 1.48, p = 0.23; colony:F6,72 = 4.61, p < 0.001; sex × colony: F6,72 = 0.07, p =0.99) or δ13C values (3-way ANOVA, sex: F1,75 = 0.01,p = 0.94; colony: F6,75 = 30.77, p < 0.001; year: F1,75 =6.79, p = 0.01; colony × year: F2,75 = 26.07, p < 0.05).In adults, sex significantly influenced δ15N (sex: F1,101 =4.67, p = 0.03; colony: F6,101 = 9.49, p < 0.001; sex ×colony: F6,101 = 0.85, p = 0.53) and δ13C values (sex:F1,104 = 10.1, p < 0.01; colony: F6,104 = 31.04, p < 0.001;year: F1,104 = 46.75, p < 0.001: colony × year: F2,104 =6.92, p < 0.01). These results indicated that adult maleshad higher blood δ15N and δ13C values than females(Table 1, Fig. 1). Differences between male and femaleyearlings could not be explored due to the small sam-ples sizes (see Table 1).
Influence of age on blood isotope values was testedin those colonies where we simultaneously sampledchicks, yearlings and adults (Table 1). Age signifi-cantly influenced both δ15N (2-way ANOVA, age:F2,18 = 51.93, p < 0.001; colony: F2,108 = 9.20, p < 0.001;colony × age: F4,108 = 1.8, p = 0.13) and δ13C values(3-way ANOVA, age: F2,110 = 9.5, p < 0.001; colony:F2,110 = 38.4, p < 0.001; year: F1,110 = 15.34, p < 0.001;colony × year: F1,109 = 5.23, p = 0.02). Values of bloodδ15N were different among the 3 age classes (post hocTukey HSD test, all p < 0.001). Chicks had the highest,adults intermediate, and yearlings the lowest δ15N val-ues (Table 2, Fig. 1). For δ13C, chicks had significantlylower values than both adults and yearlings (TukeyHSD test, all p < 0.04). Yearlings and adults showedsimilar values for δ13C (Tukey HSD test, p > 0.14)(Table 2, Fig. 1).
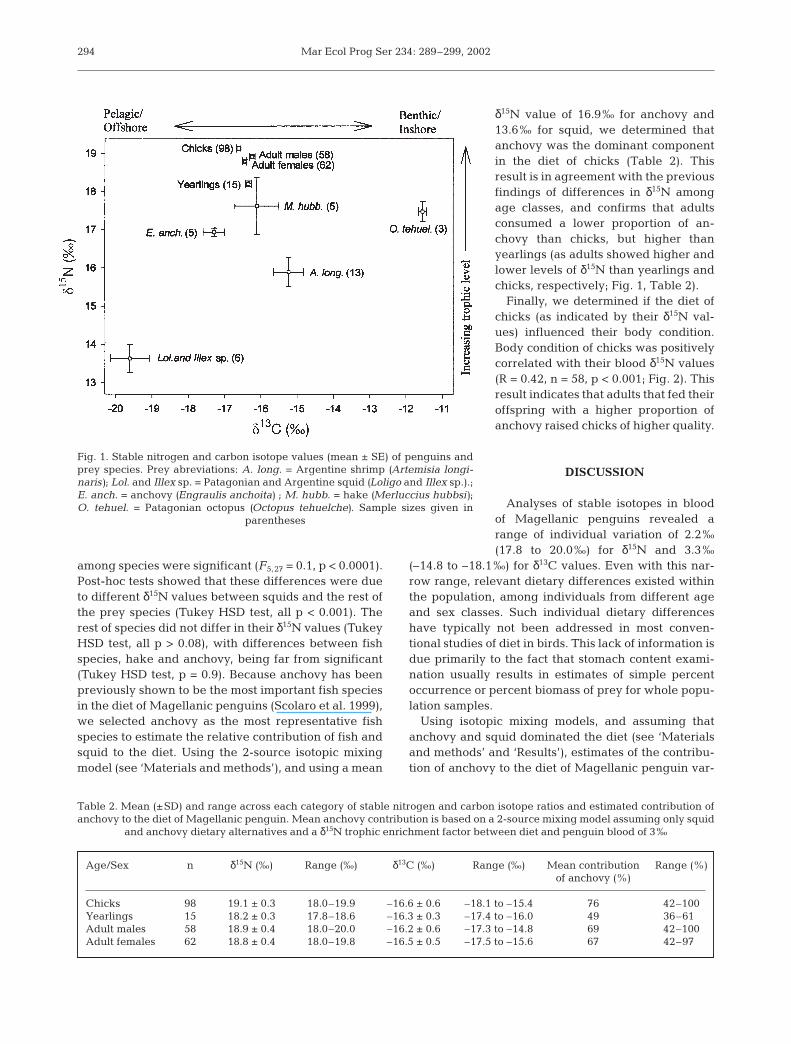
Mean δ15N values for the main prey species of Mag-ellanic penguin varied from 13.6‰ in both squid spe-cies to 18.0‰ in octopus (Fig. 1). Overall, differences
293
Tab
le 1
. Sta
ble
-nit
rog
en a
nd
car
bon
isot
ope
valu
es (
mea
ns
±S
D,‰
) fo
r ad
ult
fem
ales
(A
d F
em),
ad
ult
mal
es (
Ad
Mal
), y
earl
ing
s (Y
earl
) an
d c
hic
ks
(Ch
) fo
r ea
ch c
olon
y an
dse
ason
of
sam
pli
ng
. Sam
ple
siz
es a
re in
dic
ated
insi
de
par
enth
eses
; sta
ble
-car
bon
isot
ope
sig
nat
ure
s w
ere
mea
sure
d f
or t
he
sam
e in
div
idu
als
as t
he
stab
le-n
itro
gen
isot
ope
valu
es. D
ue
to t
he
fact
th
at s
ome
ind
ivid
ual
s w
ere
of u
nk
now
n s
ex, t
otal
sam
ple
siz
e, in
dic
ated
aft
er c
olon
y n
ame,
cou
ld in
som
e ca
ses
not
mat
ch t
he
sum
of
the
nu
mb
er o
f in
div
idu
als
in e
ach
cat
egor
y
Col
ony
Loc
atio
nS
easo
n_
δ15N
δ13
C
δ15N
δ13
Cδ15
Nδ13
Cδ15
Nδ13
CA
d F
emA
d F
emA
d M
alA
d M
alY
earl
Yea
rlC
hC
h
Eta
nci
a S
an L
oren
zo (
46)
42°0
5’S
, 63°
51’W
1999
(27
)18
.8 ±
0.2
(5)
–16.
9±
0.4
19.0
±0.
1 (6
)–1
6.8
±0.
318
.4±
0.2
(6)
–16.
3±
0.1
_19.
2±
0.1
(10)
–17.
2±
0.3
2000
(19
)18
.7±
0.2
(7)
–17.
1±
0.3
19.0
±0.
1 (2
)–1
6.8
±0.
118
.9±
0.1
(3)
–17.
3±
0.2
Ase
nta
mie
nto
Oes
te (
22)
42°0
6’S
, 63°
56’W
1999
(22
)19
.0±
0.4
(6)
–16.
9±
0.3
19.4
±0.
1 (6
)–1
7.0
±0.
2_1
9.3
±0.
1 (1
0)–1
7.6
±0.
4
Cal
eta
Ext
ern
a (9
)42
°16’
S, 6
3°38
’W20
00 (
9)_
18.6
±0.
4 (3
)–1
6.5
±0.
1
Isla
Pri
mer
a C
alet
a V
ald
és (
25)
42°2
1’S
, 63°
37’W
1999
(25
)19
.0±
0.2
(4)
–16.
4±
0.2
18.9
±0.
4 (6
)–1
6.4
±0.
218
.1±
0.3
(6)
–16.
5±
0.4
19.2
±0.
2 (9
)–1
6.5
±0.
4
Cal
eta
Inte
rna
(29)
42°2
7’S
, 63°
36’W
1999
(29
)_1
9.1
±0.
4 (1
0)–1
6.3
±0.
119
.2±
0.3
(9)
–16.
2±
0.2
_19.
4±
0.3
(10)
–16.
6±
0.2
Pu
nta
Tom
bo
(46)
44°0
2’S
, 65°
11’W
1999
(26
)18
.5±
0.2
(6)
–16.
1±
0.2
18.7
±0.
2 (7
)–1
5.7
±0.
317
.9±
0.1
(3)
–16.
1±
0.1
_19.
0±
0.3
(10)
–16.
2±
0.2
2000
(20
)18
.5±
0.4
(3)
–16.
7±
0.4
18.8
±0.
3 (6
)–1
6.5
±0.
518
.5±
0.5
(5)
–16.
5±
0.4
Cab
o D
os B
ahía
s (5
7)44
°54’
S, 6
5°32
’W19
99 (
30)
_18.
7±
0.2
(10)
–15.
9±
0.2
_18.
8±
0.4
(10)
–15.
4±
0.3
19.0
±0.
1(10
)–1
5.8
±0.
220
00 (
27)
18.5
±0.
5 (5
)–1
6.4
±0.
318
.4±
0.5
(2)
–16.
4±
0.2
_19.
1±
0.3
(17)
–16.
4±
0.3
Isla
Arc
e (1
2)45
°06’
S, 6
5°23
’W20
00 (
12)
18.5
±0.
1(2)
–16.
5±
0.1
18.6
±0.
2 (3
)–1
6.5
±0.
119
.0±
0.1
(6)
–16.
6±
0.2
Isla
Ver
nac
i Nor
te 1
(10
)45
°11’
S, 6
6°30
’W20
00 (
10)
19.2
±0.
2 (8
)–1
6.0
±0.
2
Mar Ecol Prog Ser 234: 289–299, 2002
among species were significant (F5,27 = 0.1, p < 0.0001).Post-hoc tests showed that these differences were dueto different δ15N values between squids and the rest ofthe prey species (Tukey HSD test, all p < 0.001). Therest of species did not differ in their δ15N values (TukeyHSD test, all p > 0.08), with differences between fishspecies, hake and anchovy, being far from significant(Tukey HSD test, p = 0.9). Because anchovy has beenpreviously shown to be the most important fish speciesin the diet of Magellanic penguins (Scolaro et al. 1999),we selected anchovy as the most representative fishspecies to estimate the relative contribution of fish andsquid to the diet. Using the 2-source isotopic mixingmodel (see ‘Materials and methods’), and using a mean
δ15N value of 16.9‰ for anchovy and13.6‰ for squid, we determined thatanchovy was the dominant componentin the diet of chicks (Table 2). Thisresult is in agreement with the previousfindings of differences in δ15N amongage classes, and confirms that adultsconsumed a lower proportion of an-chovy than chicks, but higher thanyearlings (as adults showed higher andlower levels of δ15N than yearlings andchicks, respectively; Fig. 1, Table 2).
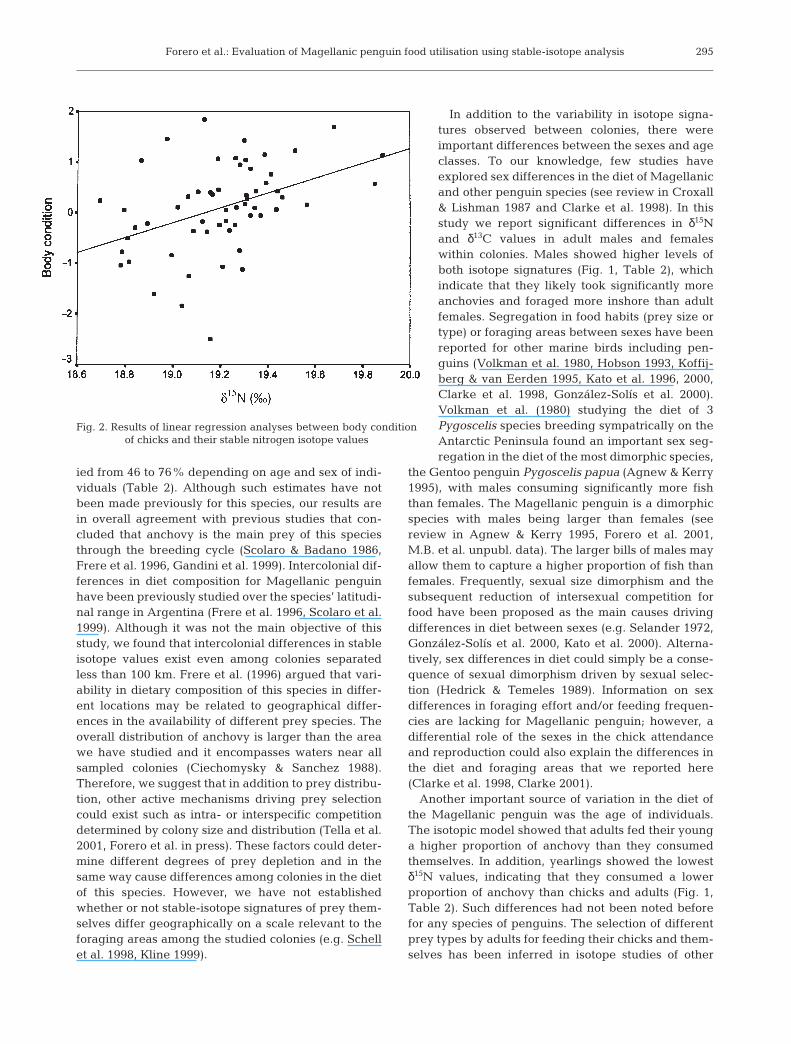
Finally, we determined if the diet ofchicks (as indicated by their δ15N val-ues) influenced their body condition.Body condition of chicks was positivelycorrelated with their blood δ15N values(R = 0.42, n = 58, p < 0.001; Fig. 2). Thisresult indicates that adults that fed theiroffspring with a higher proportion ofanchovy raised chicks of higher quality.
DISCUSSION
Analyses of stable isotopes in bloodof Magellanic penguins revealed arange of individual variation of 2.2‰(17.8 to 20.0‰) for δ15N and 3.3‰
(–14.8 to –18.1‰) for δ13C values. Even with this nar-row range, relevant dietary differences existed withinthe population, among individuals from different ageand sex classes. Such individual dietary differenceshave typically not been addressed in most conven-tional studies of diet in birds. This lack of information isdue primarily to the fact that stomach content exami-nation usually results in estimates of simple percentoccurrence or percent biomass of prey for whole popu-lation samples.
Using isotopic mixing models, and assuming thatanchovy and squid dominated the diet (see ‘Materialsand methods’ and ‘Results’), estimates of the contribu-tion of anchovy to the diet of Magellanic penguin var-
294
Fig. 1. Stable nitrogen and carbon isotope values (mean ± SE) of penguins andprey species. Prey abreviations: A. long. = Argentine shrimp (Artemisia longi-naris); Lol. and Illex sp. = Patagonian and Argentine squid (Loligo and Illex sp.).;E. anch. = anchovy (Engraulis anchoita) ; M. hubb. = hake (Merluccius hubbsi);O. tehuel. = Patagonian octopus (Octopus tehuelche). Sample sizes given in
parentheses
Table 2. Mean (±SD) and range across each category of stable nitrogen and carbon isotope ratios and estimated contribution ofanchovy to the diet of Magellanic penguin. Mean anchovy contribution is based on a 2-source mixing model assuming only squid
and anchovy dietary alternatives and a δ15N trophic enrichment factor between diet and penguin blood of 3‰
Age/Sex n δ15N (‰) Range (‰) δ13C (‰) Range (‰) Mean contribution Range (%)of anchovy (%)
Chicks 98 19.1 ± 0.3 18.0–19.9 –16.6 ± 0.6 –18.1 to –15.4 76 42–100Yearlings 15 18.2 ± 0.3 17.8–18.6 –16.3 ± 0.3 –17.4 to –16.0 49 36–61_Adult males 58 18.9 ± 0.4 18.0–20.0 –16.2 ± 0.6 –17.3 to –14.8 69 42–100Adult females 62 18.8 ± 0.4 18.0–19.8 –16.5 ± 0.5 –17.5 to –15.6 67 42–97_
Forero et al.: Evaluation of Magellanic penguin food utilisation using stable-isotope analysis
ied from 46 to 76% depending on age and sex of indi-viduals (Table 2). Although such estimates have notbeen made previously for this species, our results arein overall agreement with previous studies that con-cluded that anchovy is the main prey of this speciesthrough the breeding cycle (Scolaro & Badano 1986,Frere et al. 1996, Gandini et al. 1999). Intercolonial dif-ferences in diet composition for Magellanic penguinhave been previously studied over the species’ latitudi-nal range in Argentina (Frere et al. 1996, Scolaro et al.1999). Although it was not the main objective of thisstudy, we found that intercolonial differences in stableisotope values exist even among colonies separatedless than 100 km. Frere et al. (1996) argued that vari-ability in dietary composition of this species in differ-ent locations may be related to geographical differ-ences in the availability of different prey species. Theoverall distribution of anchovy is larger than the areawe have studied and it encompasses waters near allsampled colonies (Ciechomysky & Sanchez 1988).Therefore, we suggest that in addition to prey distribu-tion, other active mechanisms driving prey selectioncould exist such as intra- or interspecific competitiondetermined by colony size and distribution (Tella et al.2001, Forero et al. in press). These factors could deter-mine different degrees of prey depletion and in thesame way cause differences among colonies in the dietof this species. However, we have not establishedwhether or not stable-isotope signatures of prey them-selves differ geographically on a scale relevant to theforaging areas among the studied colonies (e.g. Schellet al. 1998, Kline 1999).
In addition to the variability in isotope signa-tures observed between colonies, there wereimportant differences between the sexes and ageclasses. To our knowledge, few studies haveexplored sex differences in the diet of Magellanicand other penguin species (see review in Croxall& Lishman 1987 and Clarke et al. 1998). In thisstudy we report significant differences in δ15Nand δ13C values in adult males and femaleswithin colonies. Males showed higher levels ofboth isotope signatures (Fig. 1, Table 2), whichindicate that they likely took significantly moreanchovies and foraged more inshore than adultfemales. Segregation in food habits (prey size ortype) or foraging areas between sexes have beenreported for other marine birds including pen-guins (Volkman et al. 1980, Hobson 1993, Koffij-berg & van Eerden 1995, Kato et al. 1996, 2000,Clarke et al. 1998, González-Solís et al. 2000).Volkman et al. (1980) studying the diet of 3Pygoscelis species breeding sympatrically on theAntarctic Peninsula found an important sex seg-regation in the diet of the most dimorphic species,
the Gentoo penguin Pygoscelis papua (Agnew & Kerry1995), with males consuming significantly more fishthan females. The Magellanic penguin is a dimorphicspecies with males being larger than females (seereview in Agnew & Kerry 1995, Forero et al. 2001,M.B. et al. unpubl. data). The larger bills of males mayallow them to capture a higher proportion of fish thanfemales. Frequently, sexual size dimorphism and thesubsequent reduction of intersexual competition forfood have been proposed as the main causes drivingdifferences in diet between sexes (e.g. Selander 1972,González-Solís et al. 2000, Kato et al. 2000). Alterna-tively, sex differences in diet could simply be a conse-quence of sexual dimorphism driven by sexual selec-tion (Hedrick & Temeles 1989). Information on sexdifferences in foraging effort and/or feeding frequen-cies are lacking for Magellanic penguin; however, adifferential role of the sexes in the chick attendanceand reproduction could also explain the differences inthe diet and foraging areas that we reported here(Clarke et al. 1998, Clarke 2001).
Another important source of variation in the diet ofthe Magellanic penguin was the age of individuals.The isotopic model showed that adults fed their younga higher proportion of anchovy than they consumedthemselves. In addition, yearlings showed the lowestδ15N values, indicating that they consumed a lowerproportion of anchovy than chicks and adults (Fig. 1,Table 2). Such differences had not been noted beforefor any species of penguins. The selection of differentprey types by adults for feeding their chicks and them-selves has been inferred in isotope studies of other
295
Fig. 2. Results of linear regression analyses between body conditionof chicks and their stable nitrogen isotope values
Mar Ecol Prog Ser 234: 289–299, 2002
seabirds (Hobson 1993, Schmutz & Hobson 1998,Hodum & Hobson 2000). As with our study, theseauthors assumed that isotopic fractionation betweendiet and bird tissue does not change with age (Mina-gawa & Wada 1984, Rau et al. 1991, Hobson & Welch1995). Other evidence supporting our conclusions thatisotopic differences among age classes represent realdietary differences was provided by a recent study byBearhop et al. (2000), who determined that isotopic dif-ferences in blood between adults and chicks of GreatSkua Catharacta skua were related to differential con-centrations of blood uric acid. Both uric acid and ureaare waste products of protein catabolism that are typi-cally depleted in 15N relative to body proteins (Peter-son & Fry 1987). Thus, in chicks, where catabolismactivity is higher than in adults, and uric acid or ureaconcentration in blood should also be higher than inadults, we would expect lower δ15N values in chickblood relative to blood of adults. In this sense, our find-ings that chick blood was enriched in 15N comparedwith adult blood are conservative, and suggest a realdietary difference between these age groups.
These age-related differences cannot be explainedin a context of high availability and regular distributionof the preferred prey (anchovy). Rather, we suggestthat breeding constraints should determine the ob-served differences among age classes. On the onehand, Magellanic penguins, as other seabirds (Brad-street & Brown 1985, Pedrocchi et al. 1996, Schmutz &Hobson 1998, Hodum & Hobson 2000), can activelyfeed their young with the most profitable prey, takingfor themselves those items with lower food value(Emlen 1966, Stephens & Krebs 1986). This should bedetermined proximally by the high energetic require-ments of growing chicks (Moreno & Sanz 1996). On theother hand, differential nutritional quality require-ments of chicks may influence prey segregation be-tween parents and offspring. Diet quality refers to sev-eral separately operating factors such as digestion timeand nutritive value (Massias & Becker 1990, Hilton etal. 1998). Firstly, it is known that retention times ofdigesta of fish are typically shorter than those of squid.Wilson et al. (1985) showed that African penguinsSpheniscus dermescus digested squids Loligo rey-naudi only half as fast as anchovy Engraulis capensis.Faster digestibility of anchovy could be a positive fac-tor promoting adults to feed their chicks this prey type.Secondly, nutritive value, which varies between andwithin prey species (Hislop et al. 1991, Golet et al.2000), may influence the observed patterns. Fishestend to have a higher caloric value and higher lipidand calcium content than squids (Clarke & Prince1980, Cherel & Ridoux 1992). Both the nature of theprey species and their fat and caloric contents havebeen identified as factors influencing growth rates of
the chicks of Jackass Spheniscus dermescus and yel-low-eyed penguins Megadyptes antipodes (Heath &Randall 1985, van Heezik & Davis 1990). Anchovy is ahigh-lipid prey compared to squid (Heath & Randall1985). Although data on growth rates in relation to diettype are not available for Magellanic penguin, ourresults indicate that chicks that have been fed with ahigher proportion of anchovy (i.e. higher δ15N value)have better body condition (Fig. 2). This, in turn, couldresult in a higher probability of survival of these indi-viduals, as has been observed in other species of birds(see review in Magrath 1991).
Finally, it is interesting to note that yearling pen-guins consumed a lesser proportion of anchovy thanadult breeding birds. This apparently contradicts theexpected pattern: individuals without breeding con-straints should exploit the most valued prey. Our resultcan be satisfactorily explained, however, if anchovyavailability is low compared to alternative prey.Thus, yearlings would exploit alternative prey (squid),whereas adults, forced to feed growing chicks, concen-trate their foraging effort on anchovies.
Higher δ13C values of adults compared with chicksduring the chick-rearing period is consistent with thehypothesis that during the chick-rearing phase, adultsfeed themselves in inshore waters and make longerforaging trips over more pelagic waters to obtain foodfor their chicks. The duration of foraging trips in Mag-ellanic penguins during the chick-rearing phase isabout 24 h, prey gathering taking place 30 km from thecolony (Wilson et al. 1995). After a foraging trip a nestrelief between the male and female occurs. As withother penguin species, adult Magellanic penguinstend to partially digest food and transport it as a massin the proventriculus (Croxall 1987). Therefore, itwould appear that the only way to segregate foodbetween parents and their offspring would be to sepa-rate food intake in time.
Using the isotopic approach, we have describedintraspecific patterns of partitioning of food resourcesin Magellanic penguins. Although our trophic model isbased on assumptions and the sex- and age-relateddifferences found can be considered relative ratherthan absolute, our results clearly show that breedingadults actively feed their young with high-quality prey,different from those consumed by themselves. Thissupports a fundamental tenet of optimal foraging the-ory (Stephens & Krebs 1986). Our results strongly indi-cate that this behavior could increase some of the indi-vidual potential fitness components (offspring survival)by influencing offspring quality. Such findings high-light the importance of identifying diet requirements ofdifferent sex and age classes in the population in orderto make predictions about how changes in food avail-ability may affect different demographic parameters.
296
Forero et al.: Evaluation of Magellanic penguin food utilisation using stable-isotope analysis
Finally, intraspecific variability in prey selection,which could influence interspecific diet overlap andsubsequently ecological relationships, should be con-sidered in broader ecological approaches to the studyof seabird communities.
Acknowledgements. We thank the Fundación Patagonia Nat-ural, Juan Manuel Grande and Olga Ceballos, and the staff ofNatural Reserves on the Patagonian coast for their help dur-ing field work and with logistic support. J. L. Tella helped inthe field work and made many constructive comments on themanuscript. We also thank the staff of the CNF of Argentinafor faciliting blood exportation permits. Blood samples fromIsla Vernaci Norte 1 were taken by J. Moreno and J. Potti.D. Harris performed the stable-isotope analyses in the Labo-ratory of Soil Science, University of California at Davis.P. Healy assisted with sample preparation at the Prairie andNorthern Wildlife Research Center in Saskatoon, Canada.Financial support was partially provided by the Junta deAndalucía. G.B. and M.G.F. were supported by post-doctoralgrants from the Ministerio de Educación y Ciencia (MEC) ofSpain, and M.B. by a post-doctoral grant from the ConsejoNacional de Investigación Científica y Técnica (CONICET)of Argentina. A Natural Sciences and Engineering ResearchCouncil of Canada grant to G.R.B., an operating grant fromthe Canadian Wildlife Service to K.A.H., and the Obra SocialCaja de Granada provided additional funding.
LITERATURE CITED
Agnew DJ, Kerry KR (1995) Sexual dimorphism in penguins.In: Dann P, Norman I, Reilly P (eds) The penguins. SurreyBeatty & Sons, Sydney, p 299–318
Ainley DG (1980) Seabirds as marine organisms: a review.Calif Coop Ocean Fish Invest Rep 21:48–53
Anderson DW, Gress F, Mais KF (1982) Brown pelicans: influ-ence of food supply on reproduction. Oikos 39:23–31
Bearhop S, Teece MA, Waldron S, Furness RW (2000) The in-fluence of lipid and uric acid upon 13C and 15N values inavian blood: implications for trophic studies. Auk 117:504–507
Ben-David M, Flynn RW, Schell DM (1997) Annual and sea-sonal changes in diets of martens: evidence from stableisotope analyses. Oecologia 111:280–291
Bertellotti M, Yorio P (1999) Spatial and temporal patterns inthe diet of the kelp gull in Patagonia. Condor 101:790–798
Boersma PD, Stokes DL (1995) Mortality patterns, hatchingasynchrony, and size asymmetry in Magellanic penguin(Spheniscus magellanicus) chicks. In: Dann P, Norman Y,Reilly P (eds) Penguin biology. Surrey Beatty & Sons,Sydney, p 3–35
Boersma PD, Stokes DL, Yorio PM (1990) Reproductive vari-ability and historical change of Magellanic penguins(Spheniscus magellanicus) at Punta Tompo. In: Davis LI,Darby JT (eds) Penguin biology. Academic Press, London,p 15–43
Bradstreet MSW, Brown RGB (1985) Feeding ecology of theAtlantic alcidae. In: Nettleship DN, Birkhead TR (eds) TheAtlantic Alcidae Academic Press, London, p 264–318
Cairns DK (1992) Bridging the gap between ornithology andfisheries science: use of seabird data in stock assessmentmodels. Condor 94:811–824
Cherel Y, Ridoux V (1992) Prey species and nutritive value offood fed during summer to King Penguin Aptenodytes
patagonica chicks at Possession Island, Crozet Archip-ielago. Ibis 134:118–127
Ciechomysky JD de, Sanchez RP (1988) Análisis comparativode las estimaciones de biomasa de la anchoíta (Engraulisanchoita) en el Atlántico Sudoccidental en diferentes añosy con distintas metodologías. Publ Com Tec Mix FrenteMar 4:117–131
Clarke A, Prince PA (1980) Chemical composition andcalorific value of food fed to Mollymauk chicks Diomedeamelanophris and D. Chrysostoma at Bird island, SouthGeorgia. Ibis 122:488–494
Clarke JR (2001) Partitioning of foraging effort in Adélie pen-guins provisioning chicks at Béchervaise Island, Antarc-tica. Polar Biol 24:16–20
Clarke JR, Manly B, Kerry K, Gardner H, Franchi E, CorsoliniS, Focardi S (1998) Sex differences in Adélie penguin for-aging strategies. Polar Biol 20:248–258
Croxall JP (ed) (1987) Seabirds: feeding ecology and the rolein marine ecosystems. Cambridge University Press, Cam-bridge
Croxall JP, Lishman GS (1987) The food and feeding ecologyof penguins. In: Croxall JP (ed) Seabirds: feeding ecologyand role in marine ecosystems. Cambridge UniversityPress, Cambridge, p 101–134
DeNiro MJ, Epstein S (1978) Influence of diet on the distribu-tion of carbon isotopes in animals. Geochim CosmochimActa 42:495–506–351
DeNiro MJ, Epstein S (1981) Influence of diet on the distribu-tion of nitrogen isotopes in animals. Geochim CosmochimActa 45:341–351
Deuel HJ (1955) The lipids II: biochemistry, digestion, absorp-tion, transport and storage. Interscience, New York
Duffy DC, Jackson S (1986) Diet studies of seabirds: a reviewof methods. Colon Waterbirds 9:1–17
Ellegren H (1996) First gene on the avian W chromosome(CHD) provides a tag for universal sexing of non-ratitebirds. Proc R Soc Lond B 263:1635–1641
Emlen JM 1966. The role of time and energy in food prefer-ence. Am Nat 100:611–617
Forero MG, Tella JL, Donázar JA, Blanco G, Bertellotti M,Ceballo O (2001) Phenotypic assortative mating andwithin-pair sexual dimorphism and its influence on breed-ing success and offspring quality in Magellanic penguins.Can J Zool 79:1414–1422
Forero MG, Tella JL, Hobson KA, Bertellotti M, Blanco G(2002) Conspecific food competition explains variabilityin colony size: a test using stable isotopes in Magellanicpenguins. Ecology (in press)
France RL (1995) Carbon-13 enrichment in benthic comparedto planktonic algae: foodweb implications. Mar Ecol ProgSer 124:307–312
Frere E, Gandini P, Lichtschein V (1996) Variacion latitudinalen la dieta del pinguino de magallanes (Spheniscus magel-lanicus) en la costa Patagonica, Argentina. Ornitol Neotrop7:35–41
Gandini P, Frere E, Boersma PD (1996) Status and conserva-tion of Magellanic penguin Spheniscus magellanicus inPatagonia, Argentina. Bird Conservation International 6:307–316
Golet GH, Kuletz KJ, Roby DD, Irons DB (2000) Adult preychoice affects chick growth and reproductive success inpigeon guillemots. Auk 117:82–91
González-Solís J, Oro D, Pedrocchi V, Jover L, Ruiz X (1999)Bias assoiated with diet samples in Audouin’s gulls. Con-dor 99:773–779
González-Solís J, Croxall P, Wood AG (2000) Sexual dimor-phism and sexual segregation in foraging strategies of
297
Mar Ecol Prog Ser 234: 289–299, 2002
northern giant petrels Macronectes halli during incuba-tion. Oikos 90:390–398
Hatch SA, Sanger GA (1992) Puffins as samplers of juvenilepollock and other forage fish in the Gulf of Alaska. MarEcol Prog Ser 80:1–14
Heath RGM, Randall RM (1985) Growth of Jackass penguinchicks (Spheniscus dermescus) hand reared on differentdiets. J Zool Lond.205:91–105
Hedrick AV, Temeles EJ (1989) The evolution of sexualdimorphism in animals: hypotheses and test. Trends EcolEvol 4:136–138
Hilton GM, Houston DC, Furness RW (1998) Which compo-nents of diet quality affect retention time of digesta in sea-birds? Funct Ecol 12:929–939
Hislop JR, Harris MP, Smith, JGM (1991) Variation in thecalorific value and total energy content of the lessersandeel (Ammodytes marinus) and other fish preyed on byseabirds. J Zool Lond 224:501–517
Hobson KA (1993) Trophic relationships among high Arcticseabirds: insights from tissue-dependent stable-isotopemodels. Mar Ecol Prog Ser 95:7–18
Hobson KA, Clark RG (1992) Assessing avian diets using sta-ble isotopes II: factors influencing diet-tissue fractionation.The Condor 94:189–197
Hobson KA, Clark RG (1993) Turnover of 13C in cellular andplasma fractions of blood: implications for nondestructivesampling in avian dietary studies. Auk 110:638–641
Hobson KA, Welch HE (1992) Determination of trophic rela-tionships within a high Arctic marine food web using δ13Cand δ15N analysis. Mar Ecol Prog Ser 84:9–18
Hobson KA, Welch HE (1995) Cannibalism and trophic struc-ture in a high Arctic lake: insights from stable-isotopeanalysis. Can J Fish Aquat Sci 52:1195–1201
Hobson KA, Piatt JF, Pitocchelli J (1994) Using stable isotopesto determine seabird trophic relationships. J Anim Ecol 63:786–798
Hobson KA, Ambrose WG, Renauld PE (1995) Sources of pri-mary production, benthic-pelagic coupling, and trophicrelationships within the Northeast Water Polynya: insightsfrom δ13C and δ15N analysis. Mar Ecol Prog Ser 128:1–10
Hobson KA, Gibbs HL, Gloutney ML (1997) Preservation ofblood and tissue samples for stable-carbon and stable-nitrogen isotope analysis. Can J Zool 75:1720–1723
Hodum PJ, Hobson KA (2000) Trophic relationships amongAntarctic fulmarine petrels: insights into dietary overlapand chick provisioning strategies inferred from stable-isotope (δ15N and δ13C) analyses. Mar Ecol Prog Ser 198:273–281
Jarman WM, Hobson KA, Sydeman WJ, Bacon CE, McLarenEB (1996) Influence of trophic position and feeding loca-tion on contaminant levels in the Gulf of the Farallonesfood web revealed by stable isotope analysis. Environ SciTechnol 30:654–660
Jovani R, Tella JL, Forero MG, Bertellotti M, Blanco G,Ceballos O, Donázar JA (2001) Absence of blood parasitesin the Patagonian seabird community: is it related to themarine environment? Waterbirds 24:430–433
Kato A, Nishiumi I, Naito Y (1996) Sexual difference in diet ofKing Cormorants at Maquarie Island. Polar Biol 16:75–77
Kato A, Watanuki Y, Nishiumi I, Kuroki M, Shaughnessy P,Naito Y (2000) Variation in foraging and parental behav-iour of king cormorants. Auk 117:718–730
Kline TC (1999) Temporal and spatial variability of 13C/12Cand 15N/14N in pelagic biota of Prince William Sound,Alaska. Can J Fish Aquat Sci 56:94–117
Koffijberg K, van Eerden MR (1995) Sexual dimorphism inthe cormorant Phalacrocorax carbo sinensis: possible
implications for differences in structural size. Ardea 83:37–46
MacArthur RH, Pianka ER (1966) On optimal use of a patchyenvironment. Am Nat 100:603–609
Magrath RD (1991) Nestling weight and juvenile survival inthe black bird, Turdus merula. J Anim Ecol 60:335–351
Massias A, Becker PH (1990) Nutritive value of food andgrowth in Common tern Sterna hirundo chicks. O Scand21:187–194
Michener RH, Schell DM (1994) Stable isotope ratios as trac-ers in marine and aquatic food webs. In: Lajtha K, Mich-ener RH (eds) Stable isotopes in ecology and environ-mental science. Blackwell Scientific Publications, Oxford,p 138–157
Minagawa M, Wada E (1984) Stepwise enrichment of 15Nalong food chains: further evidence and the relationbetween δ15N and animal age. Geochim Cosmochim Acta48:1135–1140
Monaghan P, Uttley JD, Burns MD, Thaine D, Blackwood J(1989) The relationship between food supply, reproduc-tive effort and breeding success in arctic terns Sternaparadisaea. J Animl Ecol 58:261–274
Montevecchi WA (1993) Birds as indicators of change inmarine prey stocks. In: Furness RW, Greenwood JJD (eds)Birds as monitors of environmental change. Chapman &Hall, London, p 217–266
Montevecchi WA, Myers RA (1995) Prey harvests of seabirdsreflect pelagic fish and squid abundance on multiplespatial and temporal scales. Mar Ecol Prog Ser 117:1–9
Moreno J, Sanz JJ (1996) Field metabolic rates of breedingChinstrap penguins (Pygoscelis antarctica) in the SouthShetlands. Physiol Zool 69:586–598
Pedrocchi V, Oro D, González-Solís J (1996) Differences be-tween diet of adult and chick Audouin's gulls Larusaudouinii at the Chafarinas Islands, SW Mediterranean.O Fenica 73:124–130
Peterson BJ, Fry B (1987) Stable isotopes in ecosystem stud-ies. Annu Rev Ecol Syst 18:293–320
Phillips DL (2001) Mixing models in analyses of diet using mul-tiple stable isotopes: a critique. Oecologia 127:166–170
Phillips DL, Koch PL (2002) Incorporating concentration de-pendence in stable isotope mixing models. Oecologia130:114–125
Pierotti R, Annett CA (1991) Diet choice in the Herring Gull:constrains imposed by reproductive and ecological factors.Ecology 72:319–328
Pierotti R, Annett CA (1995) Diet and reproductive perfor-mance in seabirds. BioScience 40:568–574
Rau GH, Hopkins TL, Torres JJ (1991) 15N/14N and 13C/12C inWeddell Sea invertebrates: implications for feeding diver-sity. Mar Ecol Prog Ser 77:1–6
Schell DM, Barnett BA, Vinette KA (1998) Carbon and nitro-gen isotope ratios in zooplankton of the Bering, Chukchiand Beaufort seas. Mar Ecol Prog Ser 162:11–23
Schmutz JA, Hobson KA (1998) Geographic, temporal, andage-specific variation in diets of Glaucous gulls in westernAlaska. Condor 100:119–130
Scolaro JA (1984) Timing of nest relief during incubation andguard stage period of chicks in Magellanic penguins(Spheniscus magellanicus). Hist Nat 4:281–284
Scolaro JA, Badano LA (1986) Diet of the Magellanic penguinSpheniscus magellanicus during the chick-rearing periodat Punta Clara, Argentina. Cormorant 13:91–97
Scolaro JA, Wilson RP, Laurenti S, Kierspel M, Gallelli H,Upto JA (1999) Feeding preferences of the Magellanicpenguin over its breeding range in Argentina. Waterbirds22:104–110
298
Forero et al.: Evaluation of Magellanic penguin food utilisation using stable-isotope analysis
Selander RK (1972) Sexual selection and dimorphism in birds.In: Champbell B (ed) Sexual selection and the descent ofMan. Heinemann, Chicago, p 180–230
Stephens DW, Krebs JR (1986) Foraging theory. PrincetonUniversity Press, Princeton, NJ
Stokes DL, Boersma PD (1998) Nest site characteristics andreproductive success in Magellanic penguins (Spheniscusmagellanicus). Auk 115:34–49
Sydeman WJ, Hobson KA, Pyle P, McLaren E (1997) Trophicrelationships among seabirds in central California: com-bined stable isotope and conventional dietary approach.Condor 99:327–336
Tella JL, Forero MG, Bertelloti M, Donázar JA, Blanco G,Ceballos O (2001) Offspring body condition and immuno-competence are negatively affected by high breedingdensities in a colonial seabird: a multi-scale approach.Proc R Soc Lond B 268:1455–1461
Thompson RD, Lilliendahl K, Solmundsson J, Furness RW,Waldron S, Phillips RA (1999) Trophic relationships amongsix species of Icelandic seabirds as determined throughstable isotope analysis. Condor 101:898–903
Tieszen LL, Boutton TW, Tesdahl KG, Slade NH (1983) Frac-tionation and turnover of stable carbon isotopes in animal
tissues: implications for 13C analysis of diet. Oecologia 57:32–37
van Heezik Y, Davis L (1990) Effects of food variability ongrowth rates, fledging sizes and reproductive success inthe yellow-eyed penguin Megadyptes antipodes . Ibis 132:354–365
Velando, A, Freire J (1999) Intercolony and seasonal differ-ences in the breeding diet of European shags on the Gali-cian coast (NW Spain). Mar Ecol Prog Ser 188:225–236
Volkman NJ, Presler P, Trivelpiece WZ (1980) Diets ofpygoscelid penguins at King George Island, Antarctica.Condor 82:373–378
Wilson RP, La Cock GD, Wilson MP, Mollagee F (1985)Differential digestion of fish and squid in the Jackasspenguin Spheniscus demersus . Ornis Scandinavica 16:77–79
Wilson RP, Scolaro JA, Peters G, Laurenti S, Kierspel M, Gal-lelli H, Upton J (1995) Foraging areas of Magellanic pen-guins Spheniscus magellanicus breeding at San Lorenzo,Argentina, during the incubation period. Mar Ecol ProgSer 129:1–6
Williams TD (1995) The penguins. Oxford University PressOxford
299
Editorial responsibility: Charles Peterson (ContributingEditor), Morehead City, North Carolina, USA
Submitted: November 17, 2000; Accepted: December 19, 2001Proofs received from author(s): April 27, 2002
Related Documents