1 Running head: FOOD-RELATED ATTENTIONAL BIAS Food-related attentional bias: Word versus pictorial stimuli and the importance of stimuli calorific value in the dot probe task Tanya Freijy, Barbara Mullan 1 , and Louise Sharpe School of Psychology University of Sydney, NSW, 2006 Australia Correspondence: Assoc. Prof. Barbara Mullan Health Psychology & Behavioural Medicine Research Group School of Psychology & Speech Pathology, Curtin University GPO Box U1987, Perth WA 6845, Australia Ph: +61 8 9266 2468 Email: [email protected] Word Count (excluding tables/figures): Abstract 231 Body 5028 1 Present address: School of Psychology & Speech Pathology, Curtin University, WA 6845, Australia

Welcome message from author
This document is posted to help you gain knowledge. Please leave a comment to let me know what you think about it! Share it to your friends and learn new things together.
Transcript
1
Running head: FOOD-RELATED ATTENTIONAL BIAS
Food-related attentional bias: Word versus pictorial stimuli and the importance of
stimuli calorific value in the dot probe task
Tanya Freijy, Barbara Mullan1, and Louise Sharpe
School of Psychology
University of Sydney, NSW, 2006 Australia
Correspondence:
Assoc. Prof. Barbara Mullan
Health Psychology & Behavioural Medicine Research Group
School of Psychology & Speech Pathology, Curtin University
GPO Box U1987, Perth WA 6845, Australia
Ph: +61 8 9266 2468
Email: [email protected]
Word Count (excluding tables/figures):
Abstract 231
Body 5028
1 Present address: School of Psychology & Speech Pathology, Curtin University, WA 6845,
Australia
2
Highlights
● Biases were measured toward word and picture, and high- and low-calorie stimuli.
● A stimuli type by calorific value interaction effect was found.
● For pictures, biases were toward high-calorie food and away from low-calorie food.
● For words, biases were toward low-calorie food and away from high-calorie food.
● No associations between biases and BMI, restraint, or external eating were found.
3
Abstract
Objective. The primary aim of this study was to extend previous research on food-related
attentional biases by examining biases toward pictorial vs. word stimuli, and foods of high vs.
low calorific value. It was expected that participants would demonstrate greater biases to
pictures over words, and to high-calorie over low-calorie foods. A secondary aim was to
examine associations between BMI, dietary restraint, external eating and attentional biases. It
was expected that high scores on these individual difference variables would be associated
with a bias toward high-calorie stimuli. Methods. Undergraduates (N = 99) completed a dot
probe task including matched word and pictorial food stimuli in a controlled setting.
Questionnaires assessing eating behaviour were administered, and height and weight were
measured. Results. Contrary to predictions, there were no main effects for stimuli type
(pictures vs. words) or calorific value (high vs. low). There was, however, a significant
interaction effect suggesting a bias toward high-calorie pictures, but away from high-calorie
words; and a bias toward low-calorie words, but away from low-calorie pictures. No
associations between attentional bias and any of the individual difference variables were
found. Discussion. The presence of a stimulus type by calorific value interaction
demonstrates the importance of stimuli type in the dot probe task, and may help to explain
inconsistencies in prior research. Further research is needed to clarify associations between
attentional bias and BMI, restraint, and external eating.
Keywords: Attentional bias; Dot probe; Stimuli; Food; Eating behaviour; Cognition
4
Introduction 1
The phenomenon of selective attention towards personally relevant stimuli has been 2
documented across a range of health concerns, such as anxiety (for a review, see Bar-Haim, 3
Lamy, Pergamin, Bakermans-Kranenburg, & van IJzendoorn, 2007), chronic pain (for 4
reviews, see Crombez, Van Ryckeghem, Eccleston, & Van Damme, 2013; Schoth, Nunes, & 5
Liossi, 2012), substance use (for reviews, see Cox, Fadardi, & Pothos, 2006; Field & Cox, 6
2008; Franken, 2003), and eating disorders (for reviews, see Brooks, Prince, Stahl, Campbell, 7
& Treasure, 2011; Faunce, 2002; Giel et al., 2011), such that individuals suffering from these 8
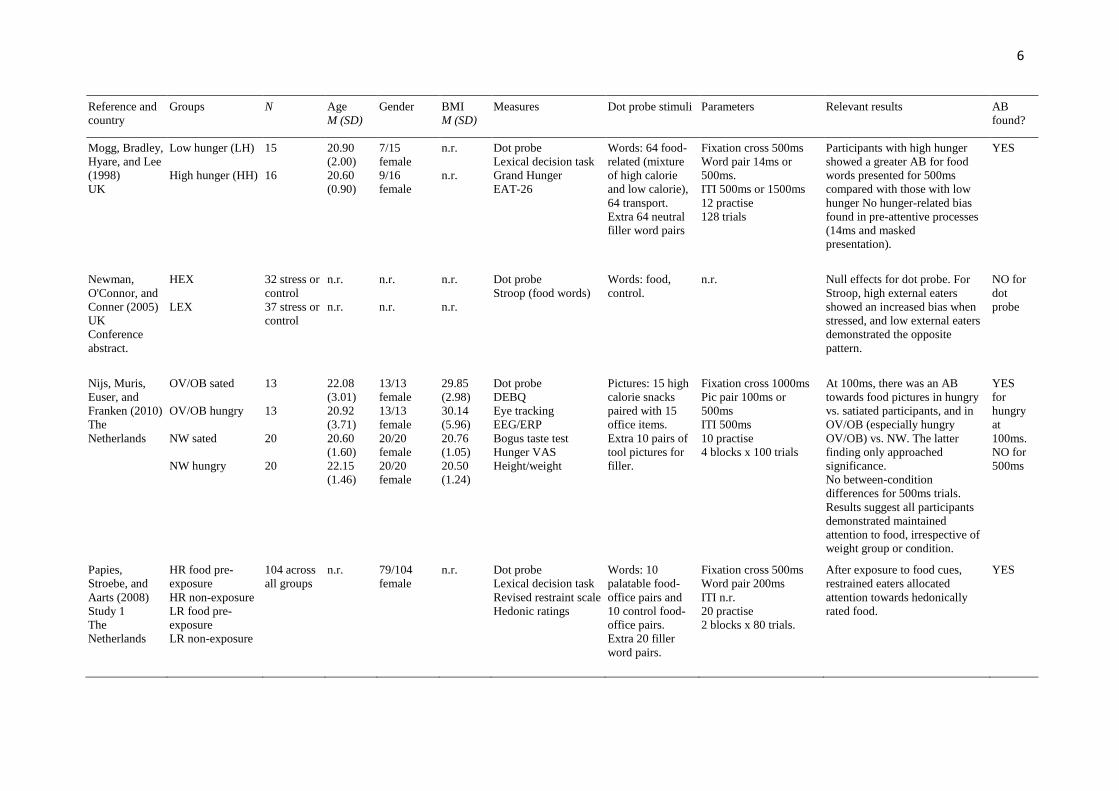
conditions are more likely to attend to behaviour-related cues. Attentional biases have also 9
been found toward food cues in non-clinical populations under conditions of hunger (Mogg, 10
Bradley, Hyare, & Lee, 1998; Nijs, Muris, Euser, & Franken, 2010). In this case the salience 11
of food stimuli is increased by the physiological drive for hunger, signalling the body’s need 12
for food. Such findings have given rise to interest in how other variables, such as weight 13
status, restraint and external motivation for food might influence attentional biases. For 14
example, if overweight patients are more likely to attend to food cues, then this attention 15
could act as a trigger for eating and lead to over-eating which could contribute further to 16
weight gain. However, differences in the stimuli and paradigm parameters that are used 17
between studies has made it difficult to determine under what conditions these biases are 18
found. If such biases exist this has implications for not only our understanding of attentional 19
bias and its role in the development and maintenance of food-related behaviours but also for 20
designing interventions to help people manage their food intake. One aim of the current study 21
was to clarify these inconsistencies in the literature on non-clinical populations. As the 22
majority of studies on food-related attentional bias have used reaction time data, when 23
referring to previous studies we are reporting reaction time data, unless otherwise stated. 24
Early investigations into food-related attentional biases generally employed a 25
modified Stroop (1935) colour naming task. In this paradigm, participants are presented with 26
5
a series of words printed in different colours. They are asked to inhibit their tendency to read 27
the word and instead name the colour in which each word is printed. Reaction times for 28
colour-naming target words (e.g., unhealthy food) are compared with reaction times for 29
colour-naming control words (e.g., non-food). Longer reaction times for target words are 30
interpreted as indicating that the emotional relevance of the word category has caused 31
interference. The presence of such an effect has typically been attributed to an attentional bias 32
toward the target stimuli. Investigations of attentional biases towards food-related stimuli 33
using the Stroop task have largely focussed on individuals with eating disorders. Reviews and 34
meta-analyses indicate that such individuals generally take longer to colour-name food-, and 35
weight/shape-related words than other words (Brooks et al., 2011; Dobson & Dozois, 2004; 36
Johansson, Ghaderi, & Andersson, 2005; Lee & Shafran, 2004). However, one of the 37
difficulties with the Stroop task is determining the source of the interference effect. It has 38
been suggested that the delay in colour naming may occur as a result of either heightened 39
attention to stimuli, or contrastingly, avoidance of stimuli (De Ruiter & Brosschot, 1994). To 40
overcome the limitations of the Stroop task, a growing number of investigators have 41
employed the dot probe task (MacLeod, Mathews, & Tata, 1986). This task involves brief 42
presentations of picture or word pairs on-screen (one experimental and one neutral). Then, a 43
probe (commonly a dot, asterisk, or letter) appears in the location of one of the previously 44
shown stimuli, and participants are required to indicate the location of the probe as quickly as 45
possible. This allows differentiation between attention directed toward stimuli and attention 46
directed away from stimuli, providing a more precise measure of attentional allocation. 47
Further, stimuli presentation durations can be modified as a means to test for initial orienting 48
toward a target stimulus (short duration, ≤ 200 ms) or sustained attention (longer duration, ≥ 49
500 ms) (Field & Cox, 2008). Therefore, an attentional bias towards target stimuli exists 50
when there is faster detection of probes replacing such stimuli. In contrast, attentional 51
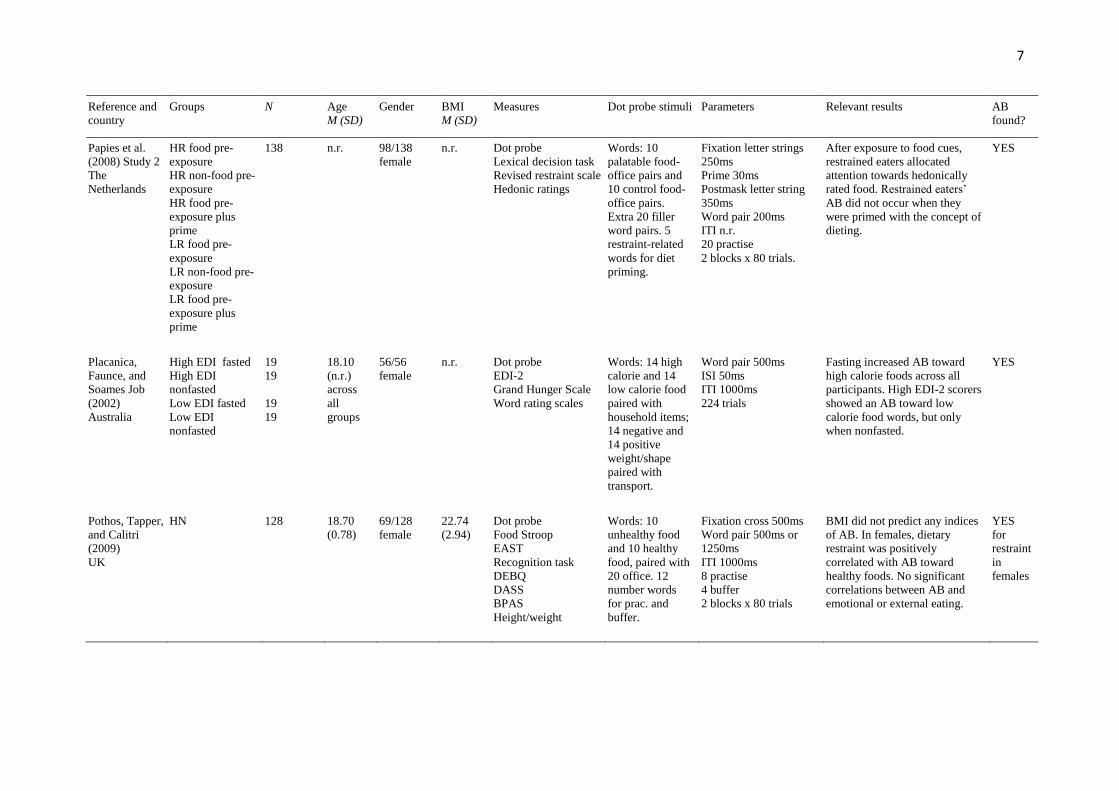
6
avoidance of target stimuli exists when there is slower detection of probes replacing such 52
stimuli. 53
Increasingly, investigators have employed the dot probe task to assess food-related 54
attentional bias, particularly to assess whether certain groups are more prone to attentional 55
bias than others. Yet, evidence for the existence of an effect remains equivocal. For example, 56
in some cases all individuals appear to selectively attend toward dot probe food cues 57
irrespective of how they are grouped, for instance, by level of dietary restraint (Ahern, Field, 58
Yokum, Bohon, & Stice, 2010; Werthmann et al., 2013), or body weight (Nijs et al., 2010). A 59
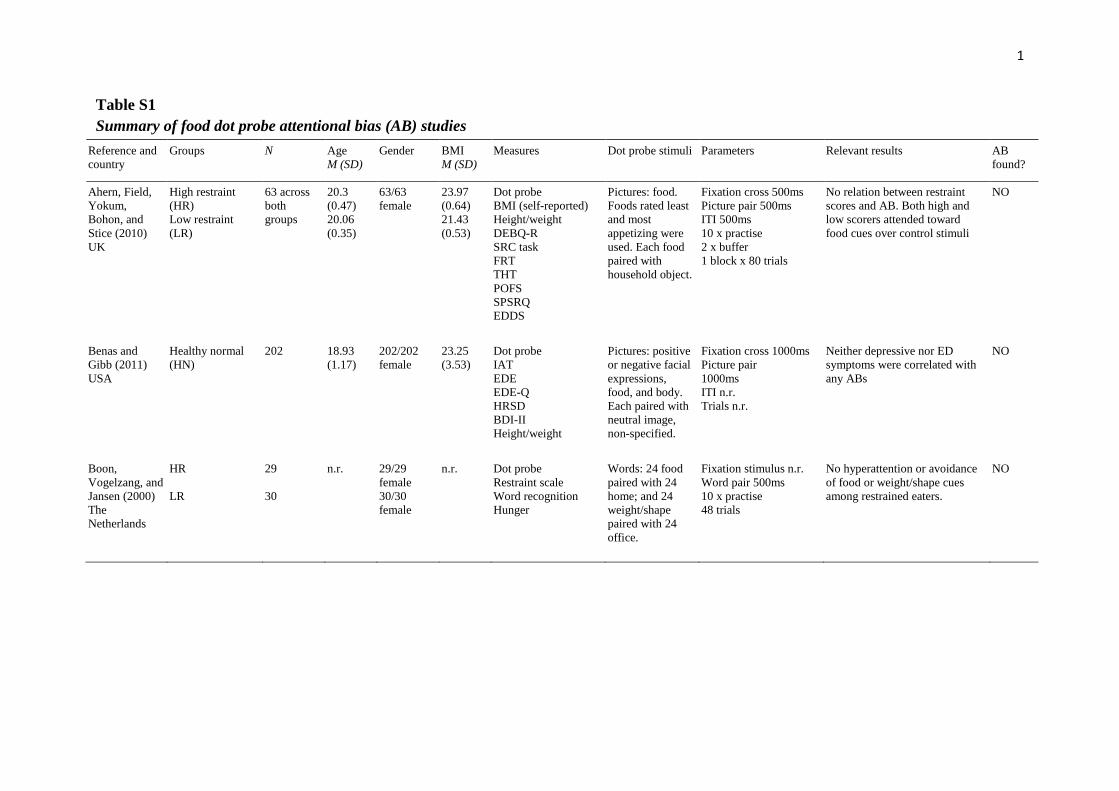
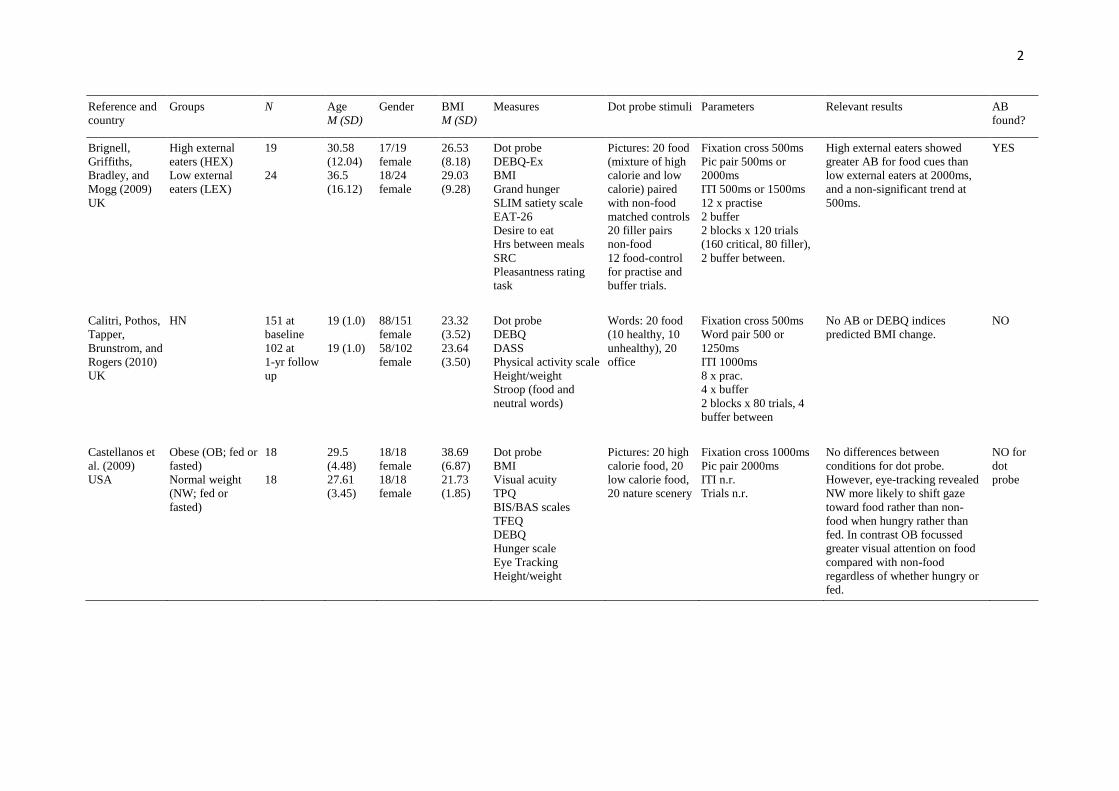
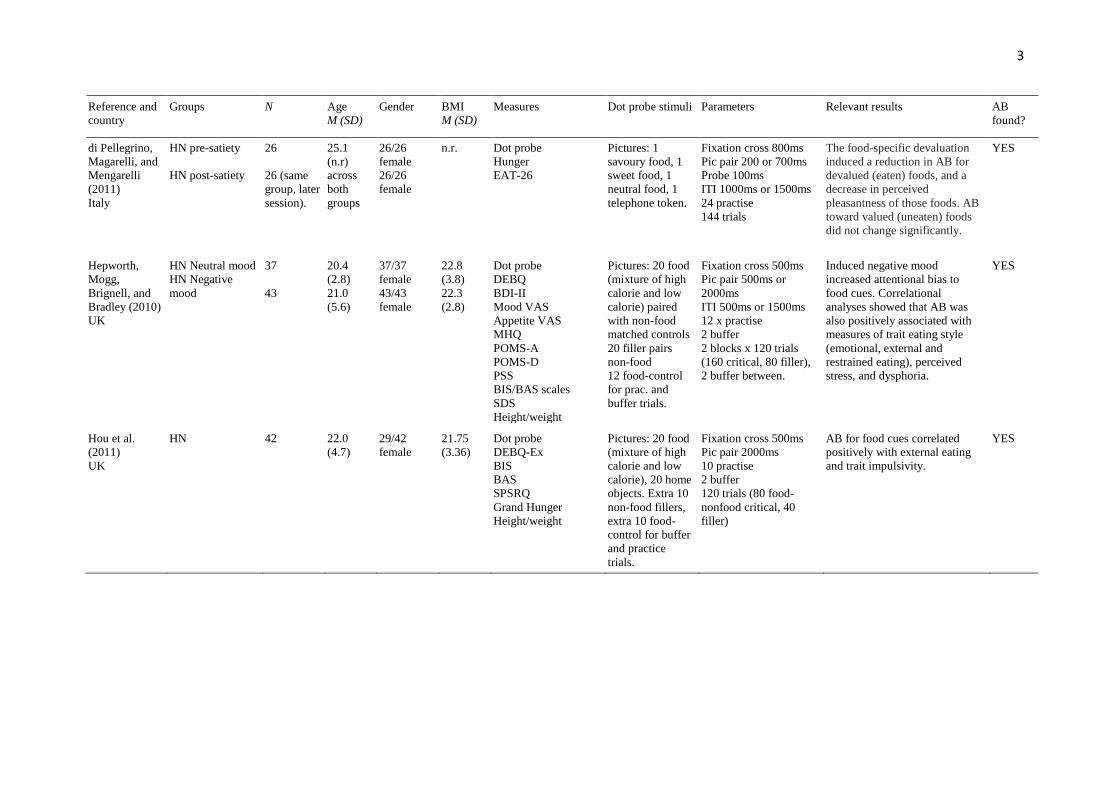
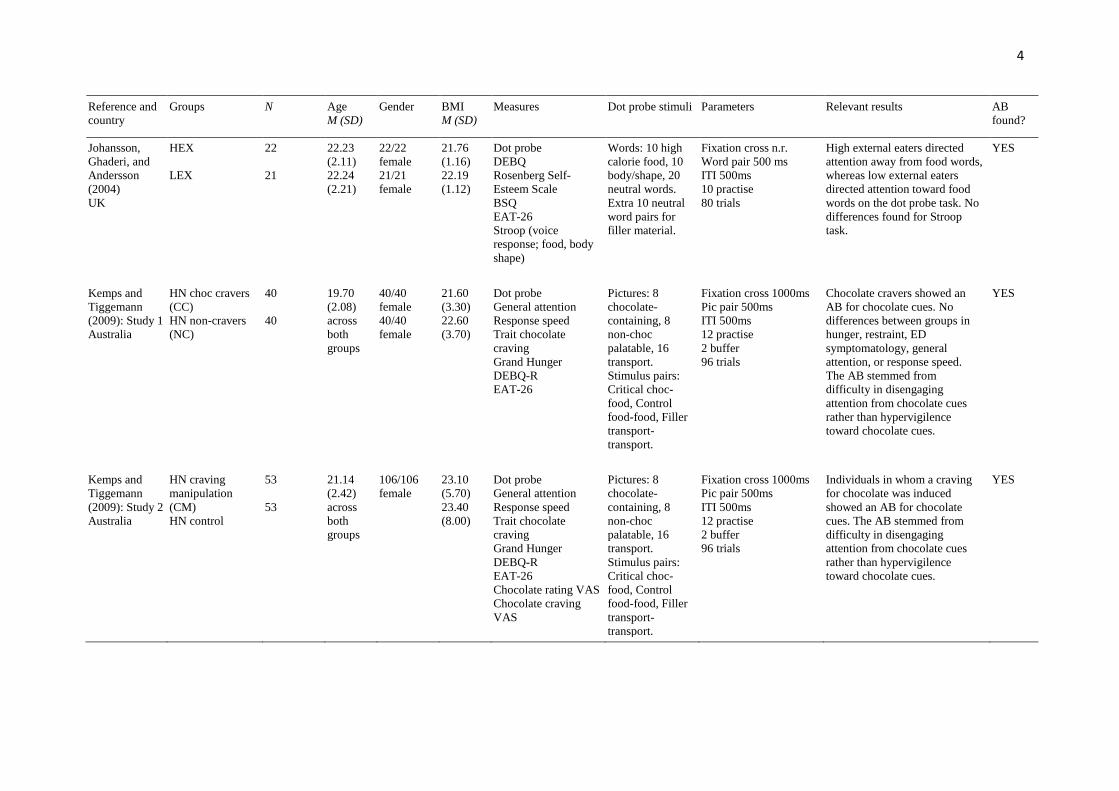
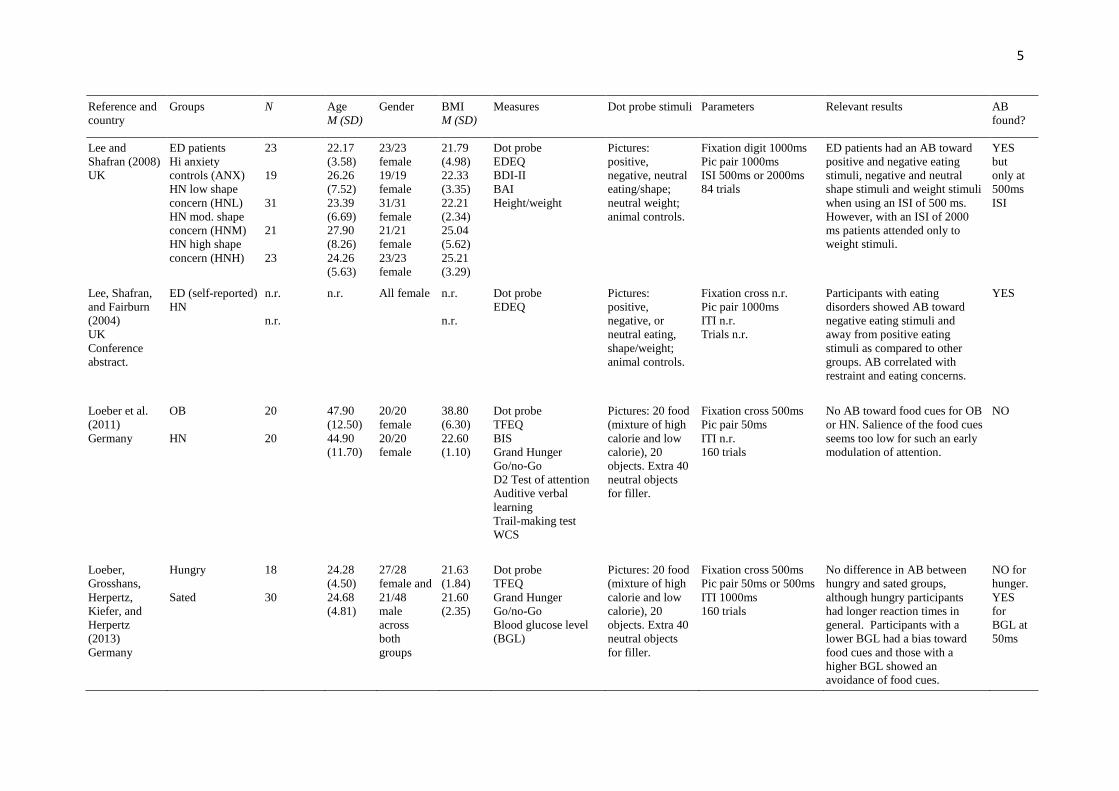
summary tabulation of existing dot probe research, excluding attentional training studies, 60
indicates that inconsistent findings may in part be due to wide variation in sample sizes, 61
stimuli, and task parameters across studies (Supplementary Material, Table S1). However, 62
while these factors may explain why some studies yield positive effects and others do not, it 63
is also possible that methodological factors (e.g., the use of word or picture stimuli), 64
physiological variables (e.g., body weight), and/or behavioural variables (e.g., dietary 65
restraint) may also contribute to inconsistencies between studies. 66
The question of whether words and pictures are equally useful as stimuli for the food 67
dot probe task has not yet been examined in the literature. Pictures may be considered more 68
ecologically valid than words because they more closely approximate real-world cues. 69
Indeed, it has been shown that pictures are more strongly related to affective information than 70
words (De Houwer & Hermans, 1994). Moreover, high-calorie food pictures can induce 71
gustatory responses in brain regions for taste and reward (Simmons, Martin, & Barsalou, 72
2005). The issue of word versus pictorial stimuli in the dot probe has been tested in other 73
contexts, such as in assessments of attentional biases among patients with chronic pain (Dear, 74
Sharpe, Nicholas, & Refshauge, 2011). Specifically, patients with chronic pain and matched 75
pain-free controls were asked to complete one picture-based and one word-based dot probe 76
task. An attentional bias toward pictorial stimuli was found, although only when pictures 77
7
were rated as self-relevant. There was no reported attentional bias toward word stimuli. No 78
such study has been conducted using food stimuli. 79
A second methodological issue that may contribute to inconsistencies between studies 80
is the calorific value of food stimuli. While some studies have compared biases toward high- 81
and low-calorie food stimuli and reported null effects when using dot probe response 82
latencies (Castellanos et al., 2009; Tapper, Pothos, & Lawrence, 2010), others have reported 83
an attentional bias toward high-calorie foods (Johansson, Ghaderi, & Andersson, 2004; 84
Kemps & Tiggemann, 2009; Nijs et al., 2010) or toward foods in general (Brignell et al., 85
2009; Hou et al., 2011; Mogg et al., 1998) over neutral non-food cues. It is important to test 86
whether participants respond differently to high- versus low-calorie food stimuli as such 87
information may be hidden when using mixed calorie stimuli. 88
The relationship between food-related attentional bias and various physiological and 89
behavioural variables also appears to be inconsistent across studies, and may account for 90
some of the discrepancies in findings. It is commonly hypothesised that overweight/obese 91
individuals selectively attend toward foods, especially high-calorie foods, and that this 92
tendency may contribute to outcomes such as cravings, overeating and weight gain. In line 93
with this argument, Nijs and colleagues (2010) found higher initial orientation at 100ms 94
stimulus presentation towards dot probe food cues in overweight/obese versus normal-weight 95
individuals. Other studies have, however, failed to replicate weight-based differences when 96
using dot probe response latencies (Castellanos et al., 2009; Loeber et al., 2011; Werthmann 97
et al., 2011). Hence, BMI was a variable of interest in the present study. 98
The eating behaviour variables of dietary restraint and external eating have been 99
tested in the context of the food dot probe, again with mixed results. Dietary restraint refers to 100
the intention to restrict food intake in order to control body weight (Herman & Mack, 1975). 101
As this intention may lead to preoccupation with food, it is reasonable to speculate that an 102
attentional bias, especially toward high-calorie ‘forbidden’ foods, may follow. However, 103
8
support for this relationship is limited. Five dot probe studies (Ahern et al., 2010; Boon, 104
Vogelzang, & Jansen, 2000; Lee, Shafran, & Fairburn, 2004; Papies et al., 2008; Werthmann 105
et al., 2013) have investigated the relationship between restrained eating and attentional 106
biases. Only two of these studies (Lee et al., 2004; Papies et al., 2008) found a relationship, 107
and of those, the latter included pre-exposure to food words before the dot probe task, which 108
may have primed participants to the stimuli. 109
Inconsistent findings have also emerged regarding external eating tendencies and 110
attentional bias. According to the externality theory of overeating, certain individuals are 111
more sensitive to external food cues (e.g., sight, smell, and taste of food) than others, and 112
more likely to eat in response to these cues, irrespective of internal physiological signals of 113
hunger and satiety (Schachter & Rodin, 1974). As such, it may be expected that an 114
association exists between external eating and attentional bias toward food stimuli. This 115
prediction has been supported by several studies (Brignell et al., 2009; Hepworth, Mogg, 116
Brignell, & Bradley, 2010; Hou et al., 2011), however others report no associations 117
(Newman, O'Connor, & Conner, 2005; Pothos, Tapper, & Calitri, 2009), or counterintuitive 118
results. For example, Johansson, Ghaderi, and Andersson (2004) found that high externally 119
motivated eaters had a tendency to direct their attention away from food words whilst low 120
externally motivated eaters directed attention towards food words in the dot probe task. To 121
assist in clarifying these issues, dietary restraint and external eating were included in the 122
present study. 123
Objective. In light of the literature outlined above, the primary aim of the present 124
study was to examine the relationships between food-related attentional bias and two 125
methodological variables, namely stimuli type (words vs. pictures) and stimuli calorific value 126
(high vs. low) in the dot probe task. In addition, a secondary aim was to examine 127
relationships between food-related attentional bias and specific behavioural (dietary restraint, 128
external eating) and physiological (BMI) variables. 129
9
It was hypothesised that: 130
1. There would be a greater attentional bias toward pictorial stimuli than word stimuli. 131
2. There would be a greater attentional bias toward high-calorie food than low-calorie food. 132
3. Higher levels of dietary restraint would be associated with increased attentional biases 133
toward high-calorie food stimuli. 134
4. Higher levels of external eating would be associated with increased attentional biases 135
toward high-calorie food stimuli. 136
5. A higher BMI would be associated with increased attentional bias toward high-calorie food 137
stimuli. 138
Method 139
Participants 140
The sample consisted of 99 undergraduate students (79 female) from a wide range of 141
courses an Australian university, recruited via the University’s online participant recruitment 142
system. Inclusion criteria were 18 years of age or older, and fluency in English. The mean 143
age was 19.34 years (SD = 2.95) and mean BMI was 21.96 (SD = 2.88). The majority were 144
Caucasian (54%) and lived with their parents (65%). The study was approved by the 145
University Human Research Ethics Committee. Participants were reimbursed with course 146
credit in exchange for participation. 147
Stimulus material 148
One set of word stimuli and a matching set of pictorial stimuli were developed for this 149
study. The word stimuli set consisted of: 150
• 5 high-calorie food–neutral (household items) pairs, e.g., bacon-towel 151
• 5 low-calorie food–neutral (household items) pairs, e.g., apple-boxes 152
• 5 high-calorie food–low-calorie food filler pairs, e.g., sausage-carrots. The filler pairs were 153
designed as such to juxtapose high- vs low-calorie foods and thereby lead to increased 154
salience of the calorific value of food stimuli. 155
10
• 5 neutral (music-related)–neutral (travel-related) filler pairs, e.g., guitar-camera 156
Words that referred to meals or foodstuffs with ambiguous calorific value, e.g. ‘yoghurt’, or 157
‘spaghetti’, were avoided. Word pairs were matched in length and frequency of usage. 158
Frequency data was sourced from the British National Corpus, a representative sample of 159
spoken and written late 20th Century British English words. 160
The pictorial stimuli consisted of four sets of colour image pairs that directly reflected 161
the word stimuli pairs. Pictures were acquired from copyright-free stock image websites. All 162
images were re-sized to 300 x 300 pixels. Image pairs were matched as closely as possible in 163
brightness, colour, and shape. An additional 5 neutral (animals)–neutral (clothing) word and 164
corresponding picture pairs were developed for use in task practice trials. 165
A pilot test of the word and picture stimuli was conducted (n = 18) to ascertain (i) 166
whether the images clearly reflected the food and non-food words they were assigned to; (ii) 167
whether participants could discriminate reliably between high-calorie and low-calorie foods; 168
and (iii) whether image pairs appeared matched in appearance. Participants correctly 169
identified 19.2 of 20 food images (SD = 0.99), and 28.5 of 30 non-food images (SD = 1.20). 170
Participants also correctly classified the calorific value of 18.7 of the 20 stimuli foods as 171
high-calorie or low-calorie (SD = 1.23). In response to qualitative feedback from the pilot 172
test, several images were replaced or altered in brightness or shape, in order to strengthen the 173
degree of pair matching. The final stimuli used can be found in the online Supplementary 174
Material (Table S2). 175
Procedure 176
Upon arrival at the laboratory, participants provided informed consent and completed 177
a demographics questionnaire and hunger scale. The dot probe task was then administered, 178
followed by completion of the self-report eating behaviour measures. Height and weight were 179
then measured by the experimenter. At the conclusion of testing, participants were debriefed. 180
The duration of each testing session was approximately 25 minutes. 181
11
Measures 182
Demographics. Age, gender, living conditions, and ethnicity data were collected. A 183
question regarding whether participants were vegetarian was also included. 184
Hunger. State hunger was measured by asking participants ‘How hungry are you 185
right now?’ in a pre-task questionnaire. Responses were rated on a scale of 1 (not hungry at 186
all) to 7 (extremely hungry). 187
Dutch Eating Behavior Questionnaire (DEBQ; van Strien, Frijters, Bergers, & 188
Defares, 1986). The DEBQ is a well-established measure of dietary restraint (10 questions), 189
external eating (10 questions), and emotional eating (13 questions). Items are scored on a 5-190
point Likert scale ranging from 1 (never) to 5 (very often). The DEBQ has been shown to 191
have good internal consistency and factorial validity (van Strien et al., 1986). Only the 192
restraint and external eating subscales were of interest in the present study. 193
Body Mass Index (BMI). Weight was measured to the nearest .1 kg and height to the 194
nearest .5cm. BMI was calculated using the formula [weight] kg/[height] m2. 195
Dot probe task (MacLeod et al., 1986). The task was programmed using Inquisit 196
software, version 3.0.6.0, and presented on a wide screen 26-inch LCD monitor. Participants 197
were seated approximately 60 cm from the computer screen. The task consisted of ten 198
practice trials, followed by one block of 160 trials. Each trial began with presentation of a 199
central fixation cross (‘+’; 1cm in height) for 500ms, followed by a pair of words or pictures 200
for 500ms. A 500ms stimulus duration was chosen as it reflects the duration most commonly 201
used in the existing food dot probe literature (see Supplementary Material Table S1). The 202
stimuli pair was presented with one word (in capital letters; 1 cm in height) or picture (8 cm x 203
8cm) in the upper half of the screen and another in the lower half, with 4.5 cm of space 204
between the two stimuli. A visual probe (‘p’ or ‘q’; 1cm in height) then appeared in place of 205
either the upper or lower picture or word and remained until participants pressed the ‘p’ or ‘q’ 206
12
response keys as quickly as possible to indicate the letter they had seen. The inter-trial 207
interval was 500 ms. Reaction time (ms) for each trial was recorded by the task software. 208
Each stimulus pair appeared on screen once as pictures and once as words in each of 209
the following four combinations: (i) target upper, probe upper, (ii) target upper, probe lower, 210
(iii) target lower, probe upper, (iv) target lower, probe lower. The order of trials was uniquely 211
randomised for each participant. The probe appeared in the upper or lower halves of the 212
screen randomly and with equal probability. There were 80 critical trials (target-neutral) and 213
80 filler trials in total. 214
Pleasantness. The food stimuli used in critical trials of the dot probe task were rated 215
on a scale of 1 (extremely pleasant) to 7 (extremely unpleasant) in a post-task questionnaire. 216
Data preparation 217
Data from practice and filler trials were removed. Trials with errors were discarded 218
(5.6% of data). In accordance with previous food dot probe studies (di Pellegrino, Magarelli, 219
& Mengarelli, 2011; Hou et al., 2011; Mogg et al., 1998) trials with response latencies < 200 220
ms or >1500 ms, and trials with latencies more than 2 SD above the participant’s mean 221
latency were then excluded as outliers (4.0% of data). One participant with an exceptionally 222
high error rate (91.4%) was excluded. Trials targeting meat-based foods were removed from 223
vegetarian participants’ (n = 5) data sets. Four attentional bias scores were calculated for each 224
participant, one for each stimuli category: high-calorie words, high-calorie pictures, low-225
calorie words, and low-calorie pictures. Bias scores were calculated using the formula 226
0.5*[(TuPl – TlPl) + (TlPu – TuPu)], where T = target stimulus, P = probe, u = upper, and l = 227
lower (MacLeod & Mathews, 1988). In congruent trials (TlPl and TuPu), the probe replaces 228
the target image/word, and in incongruent trials (TuPl and TlPu), the probe replaces the 229
neutral image/word. A positive attentional bias score indicates a bias towards the target 230
(food) stimulus whereas a negative attentional bias score indicates a bias away from the target 231
(food) stimulus. 232
13
Data analysis 233
Analyses were performed using SPSS version 21. Two variables were transformed to 234
improve normality using established methods (Osborne, 2010): BMI (inverse computed, 235
distribution reversed, then a constant added to each score), and external eating (natural 236
logarithm). Whilst the transformed variables were used in the data analysis, the 237
untransformed means and SDs are provided to facilitate comparisons with previous research. 238
A paired samples t-test was conducted to compare average pleasantness ratings of 239
high- and low calorie foods. 240
To explore the presence of attentional bias differences, mean attentional bias scores 241
were entered into a 2 (Stimuli: word vs pictures) x 2 (calorific value: high vs low) repeated 242
measures ANOVA. We also conducted a paired samples t-test to compare the biases towards 243
higher calorie foods for words vs pictures. Pearson’s correlations were conducted between 244
bias scores and BMI, dietary restraint and external eating. Due to non-normality of the hunger 245
variable distribution, Spearman’s Rho correlations were conducted between bias scores and 246
hunger. 247
Results 248
Pleasantness 249
On average, low calorie foods (M = 2.05; SD = .70) were rated as more pleasant than 250
high calorie foods (M = 2.94; SD = .98), t(98) = 8.035, p < .001. 251
Hypotheses 1 and 2: Stimuli type and calorific value 252
There were no main effects for stimuli type, F(1,98) = .006, p = .938, partial η2 = .00; 253
or calorific value, F(1,98) = .008, p = .927, partial η2 = .00; however, there was a significant 254
interaction between these variables, F(1,98) = 4.30, p = .041, partial η2 = .042. The 255
conventions for partial η2 are small = 0.01; medium = 0.06; and large = 0.14. The interaction 256
effect (Figure 1) suggests an overall bias toward high-calorie stimuli compared to low-calorie 257
stimuli for pictures, but towards low-calorie stimuli and away from high-calorie stimuli for 258
14
words. Follow-up t-tests were conducted to determine the nature of the interaction. None of 259
the t-tests reached significance (t < 1.586, p > 0.116). As such, we can conclude that these are 260
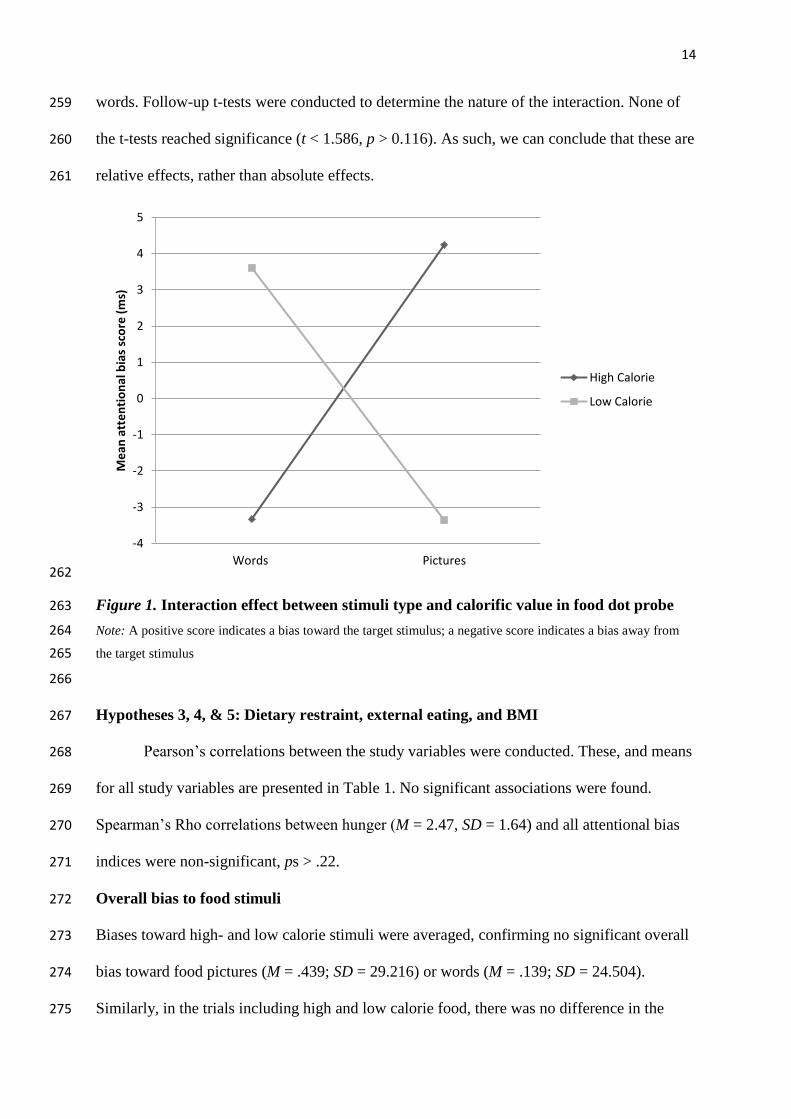
relative effects, rather than absolute effects. 261
262
Figure 1. Interaction effect between stimuli type and calorific value in food dot probe 263
Note: A positive score indicates a bias toward the target stimulus; a negative score indicates a bias away from 264
the target stimulus 265
266
Hypotheses 3, 4, & 5: Dietary restraint, external eating, and BMI 267
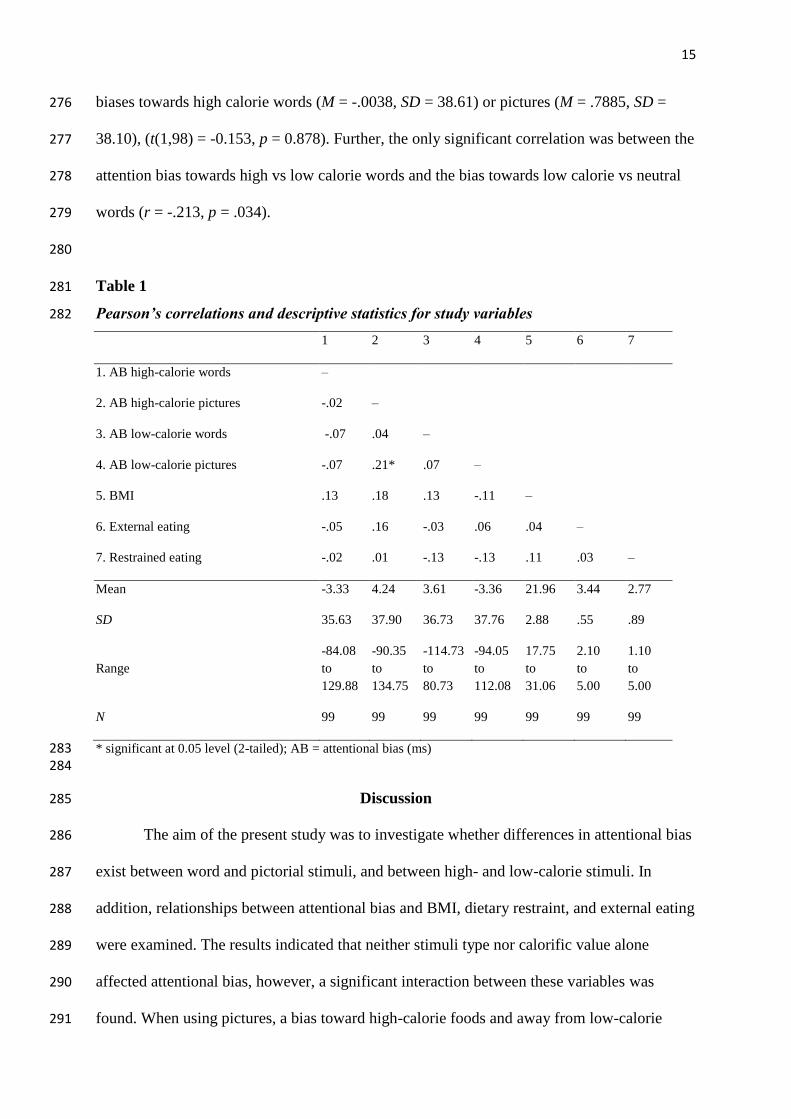
Pearson’s correlations between the study variables were conducted. These, and means 268
for all study variables are presented in Table 1. No significant associations were found. 269
Spearman’s Rho correlations between hunger (M = 2.47, SD = 1.64) and all attentional bias 270
indices were non-significant, ps > .22. 271
Overall bias to food stimuli 272
Biases toward high- and low calorie stimuli were averaged, confirming no significant overall 273
bias toward food pictures (M = .439; SD = 29.216) or words (M = .139; SD = 24.504). 274
Similarly, in the trials including high and low calorie food, there was no difference in the 275
-4
-3
-2
-1
0
1
2
3
4
5
Words Pictures
Me
an a
tte
nti
on
al b
ias
sco
re (
ms)
High Calorie
Low Calorie
15
biases towards high calorie words (M = -.0038, SD = 38.61) or pictures (M = .7885, SD = 276
38.10), (t(1,98) = -0.153, p = 0.878). Further, the only significant correlation was between the 277
attention bias towards high vs low calorie words and the bias towards low calorie vs neutral 278
words (r = -.213, p = .034). 279
280
Table 1 281
Pearson’s correlations and descriptive statistics for study variables 282
1 2 3 4 5 6 7
1. AB high-calorie words –
2. AB high-calorie pictures -.02 –
3. AB low-calorie words -.07 .04 –
4. AB low-calorie pictures -.07 .21* .07 –
5. BMI .13 .18 .13 -.11 –
6. External eating -.05 .16 -.03 .06 .04 –
7. Restrained eating -.02 .01 -.13 -.13 .11 .03 –
Mean -3.33 4.24 3.61 -3.36 21.96 3.44 2.77
SD 35.63 37.90 36.73 37.76 2.88 .55 .89
Range
-84.08
to
129.88
-90.35
to
134.75
-114.73
to
80.73
-94.05
to
112.08
17.75
to
31.06
2.10
to
5.00
1.10
to
5.00
N 99 99 99 99 99 99 99
* significant at 0.05 level (2-tailed); AB = attentional bias (ms) 283 284
Discussion 285
The aim of the present study was to investigate whether differences in attentional bias 286
exist between word and pictorial stimuli, and between high- and low-calorie stimuli. In 287
addition, relationships between attentional bias and BMI, dietary restraint, and external eating 288
were examined. The results indicated that neither stimuli type nor calorific value alone 289
affected attentional bias, however, a significant interaction between these variables was 290
found. When using pictures, a bias toward high-calorie foods and away from low-calorie 291
16
foods was seen, whereas when using words the opposite pattern was observed. As low calorie 292
foods were rated as more pleasant than high calorie foods on average, palatability of high 293
calorie food cannot account for the findings. There were no associations between attentional 294
bias and restraint, external eating, or BMI. 295
The significant interaction observed between stimuli type and calorific value provides 296
new evidence for the importance of stimuli type in the food dot probe task, indicating that 297
attentional bias outcomes vary depending on whether words or pictures are used, and whether 298
they are high or low-calorie. The decision to incorporate task filler pairs that juxtaposed high- 299
vs low-calorie foods may have led to increased salience of the calorific value of food stimuli 300
and thereby contributed to the reported effect. We do not know whether participants would 301
have responded differently to each set of words had they been presented separately. 302
Nonetheless, the influence of calorific value on attentional bias outcomes may help to clarify 303
inconsistencies in previous dot probe research. It may be that in studies that used a mixture of 304
high and low-calorie picture stimuli (e.g., Loeber et al., 2011), participants selectively 305
attended toward high-calorie pictures, and away from low-calorie pictures and this 306
discrepancy would not have been detected as the stimuli used were of mixed calorific value. 307
Calculation of an overall attentional bias score toward a mixed set of pictures would collapse 308
together the biases toward high-calorie stimuli and away from low-calorie stimuli, leaving a 309
negligible attentional bias index and potentially, a null effect. Indeed, the current data 310
indicate negligible overall biases toward food pictures (0.44 ms), and words (0.14 ms). 311
Similarly in previous food dot probe studies using word stimuli of mixed calorific value 312
results may have been masked (e.g., Boon et al., 2000). For this reason it is recommended 313
that in future studies, high- and low-calorie stimuli be grouped and analysed separately. 314
The pattern of the interaction effect, particularly the biases toward high calorie 315
pictures and low calorie words, may be explained by existing research that indicates 316
differential cognitive processing of pictures and words. Stimuli presented in picture form are 317
17
more easily recalled (e.g., Noldy, Stelmack, & Campbell, 1990; Paivio & Csapo, 1973) and 318
recognised (e.g., Shepard, 1967; Snodgrass, Volvovitz, & Walfish, 1972) than stimuli 319
presented in word form; this phenomenon is known as the picture superiority effect. Pictures 320
are more strongly related to affective information than words (Glaser & Glaser, 1989). In line 321
with this prediction, De Houwer and Hermans (1994), Experiment 1 reported that the 322
affective categorisation of a word was slowed down when the word was accompanied by a 323
distracting picture. Words, however, did not interfere with affective categorisation of 324
pictures. Moreover, pictures were categorised much faster than words. According to Glaser 325
and Glaser (1989) such results indicate that pictures have privileged access to the network in 326
which affective information is stored, known as the semantic executive system. Given that 327
high calorie picture stimuli are biologically relevant and may reinforce previously 328
experienced affective states such as pleasure, images of such foods in the dot probe task may 329
be particularly visually attractive for participants. This may help to explain why there was an 330
overall bias toward high calorie picture stimuli in the present study. Glaser and Glaser (1989) 331
propose that the while the semantic executive system controls perception of pictures and 332
action on objects, the lexical executive system controls perception and production of spoken 333
and written language. Words can only access semantic (and thus affective) information after 334
they have passed the lexicon. Electrophysiological responses to word and picture stimuli have 335
shown that affective information indeed modulates the processing of pictures yet has little 336
influence on the processing of words (Hinojosa, Carretie, Valcarcel, Mendez-Bertolo, & 337
Pozo, 2009). Early stage processing of words is therefore more likely to draw on analytical 338
rather than affective information. Assuming that participants had prior knowledge of low 339
calorie foods (in this case fruits and vegetables) being a healthier choice than high calorie 340
foods, this may explain why there was an overall bias toward low calorie word stimuli in the 341
present study. It should be noted that the current results reflect the biases of a majority-female 342
sample of undergraduates who, on average, rated low calorie, healthy foods as more pleasant 343
18
than high calorie foods, and that other groups of individuals (such as overweight or those 344
scoring high on restraint) may show a different pattern of biases when exposed to the same 345
stimuli. 346
In this study no associations between food-related attentional bias and any of the 347
individual difference variables were found. The lack of association between hunger and 348
attentional bias is inconsistent with previous dot probe research (Mogg et al., 1998; Nijs et 349
al., 2010), however this result was likely due to the majority of participants rating themselves 350
as not hungry, therefore it is likely that the result was due to a restriction in range. 351
With regard to restraint, the current result supports prior research in which no 352
relationship between restraint and attentional bias was found (Ahern et al., 2010; Boon et al., 353
2000). It has been suggested that the dot probe task may not be sensitive enough for non-354
clinical restrained eaters and is instead a better measure of attentional bias among patients 355
with eating disorders (Boon et al., 2000). Certainly, the existence of attentional biases toward 356
food and body-related cues is well documented in the latter population (Brooks et al., 2011; 357
Faunce, 2002; Giel et al., 2011). Further, in a non-clinical sample, Diamantis (1992) found 358
that rather than being linked with attentional bias, restraint was linked with a memory bias for 359
food words, especially ‘forbidden’ food words. This relationship has been tested by Israeli 360
and Stewart (2001), who found a relative memory bias for ‘forbidden’ food words in highly 361
restrained eaters when compared to those with low levels of restraint. Therefore, whilst the 362
present results indicate that relationship between restraint and attentional bias appears weak 363
and difficult to detect, it may be worthwhile exploring other cognitive biases, such as 364
memory bias, in restrained eaters. 365
There was no association between BMI and attentional bias, which may be in part due 366
to the sample being predominantly of healthy weight. However, the lack of effect of BMI on 367
attentional bias generally confirms existing research based on dot probe response latencies 368
(Castellanos et al., 2009; Loeber et al., 2011; Pothos, Tapper, et al., 2009; Werthmann et al., 369
19
2011). Further, food-related attentional bias, as measured by the dot probe, has failed to 370
predict changes in individuals’ BMI at one-year follow up (Calitri, Pothos, Tapper, 371
Brunstrom, & Rogers, 2010). As indicated by studies that combined the dot probe with eye-372
tracking (Castellanos et al., 2009; Werthmann et al., 2011), an association between BMI and 373
attentional bias may only be detectable when using eye-tracking as it is a more sensitive 374
measure of attentional allocation. Thus it may be worthwhile to add eye tracking to future dot 375
probe studies to increase precision of measurement. 376
The finding of no association between external eating and attentional bias is 377
consistent with some evidence (Pothos, Tapper, et al., 2009) yet conflicts with other reports 378
(Brignell et al., 2009; Hepworth et al., 2010; Hou et al., 2011). In previous studies assessing 379
attentional bias toward food pictures, external eating correlation coefficients were .42 380
(Brignell et al., 2009), .39 (Hepworth et al., 2010), and .36 (Hou et al., 2011). In contrast, the 381
correlation coefficients found in the present study (.16 for high-calorie pictures and .06 for 382
low-calorie pictures) are comparatively low. The mean scores for external eating, however, 383
remain similar between this study and others (Hou et al., 2011; Hepworth et al., 2010). The 384
relationship between external eating and attentional bias thus remains unclear and warrants 385
further attention. Separating out high and low-calorie stimuli before conducting correlations 386
with external eating may help to facilitate comparisons with the current findings. 387
The limitations of the current study should be considered when interpreting the 388
results. Although there was a significant interaction effect indicating that relative to low 389
calorie food stimuli, participants focussed more on high calorie stimuli when pictures were 390
presented, whereas the reverse was true when words were presented. However, the absolute 391
differences between response times to these stimuli did not differ from one another, as 392
indicated by the follow-up t-tests. Further, the effect size of the significant interaction was 393
small. We acknowledge that using ‘plates’ as a neutral word and picture stimulus may have 394
20
elicited food-related thoughts, however options were limited as each food word was paired 395
with a household object of matched word length and frequency. 396
Conclusions 397
In summary, the present study yielded a novel finding regarding the importance of 398
stimuli in the dot probe task and is the first to examine stimuli type and calorific value of 399
stimuli together. It was found that attentional bias outcomes vary depending on whether 400
words or pictures are used, and whether they are high- or low-calorie. This finding may help 401
to explain null effects in prior studies that mixed high- and low-calorie food stimuli together. 402
Based on the finding it is recommended that in future high- and low-calorie stimuli be 403
analysed separately. In the current study, no relationships were found between attentional 404
bias and BMI, restraint, or external eating. Further research is therefore needed to clarify 405
these associations, or lack thereof. In particular, it is advised that in future dot probe studies 406
concurrent eye-tracking be employed in order to increase measurement precision. The present 407
study has highlighted the complex nature of food-related attentional bias, and is a step toward 408
a greater understanding of this phenomenon. 409
410
411
Acknowledgements 412
The authors would like to thank the University of Sydney Health Psychology Lab group for 413
their helpful comments on an earlier draft of this manuscript 414
415
416
417
418
419
420
21
References 421
Ahern, A. L., Field, M., Yokum, S., Bohon, C., & Stice, E. (2010). Relation of dietary 422
restraint scores to cognitive biases and reward sensitivity. Appetite, 55(1), 61-68. doi: 423
10.1016/j.appet.2010.04.001 424
Bar-Haim, Y., Lamy, D., Pergamin, L., Bakermans-Kranenburg, M. J., & van IJzendoorn, M. 425
H. (2007). Threat-related attentional bias in anxious and nonanxious individuals: a 426
meta-analytic study. Psychological Bulletin, 133(1), 1-24. doi: 10.1037/0033-427
2909.133.1.1 428
Benas, J. S., & Gibb, B. E. (2011). Cognitive biases in depression and eating disorders. 429
Cognitive Therapy and Research, 35(1), 68-78. doi: 10.1007/s10608-009-9279-1 430
Boon, B., Vogelzang, L., & Jansen, A. (2000). Do restrained eaters show attention toward or 431
away from food, shape and weight stimuli? European Eating Disorders Review, 8(1), 432
51-58. doi: 10.1002/(sici)1099-0968(200002)8:1<51::aid-erv306>3.0.co;2-e 433
Brignell, C., Griffiths, T., Bradley, B. P., & Mogg, K. (2009). Attentional and approach 434
biases for pictorial food cues. Influence of external eating. Appetite, 52(2), 299-306. 435
doi: 10.1016/j.appet.2008.10.007 436
Brooks, S., Prince, A., Stahl, D., Campbell, I. C., & Treasure, J. (2011). A systematic review 437
and meta-analysis of cognitive bias to food stimuli in people with disordered eating 438
behaviour. Clinical Psychology Review, 31(1), 37-51. doi: 10.1016/j.cpr.2010.09.006 439
Calitri, R., Pothos, E. M., Tapper, K., Brunstrom, J. M., & Rogers, P. J. (2010). Cognitive 440
biases to healthy and unhealthy food words predict change in BMI. Obesity, 18(12), 441
2282-2287. doi: 10.1038/oby.2010.78 442
Castellanos, E. H., Charboneau, E., Dietrich, M. S., Park, S., Bradley, B. P., Mogg, K., & 443
Cowan, R. L. (2009). Obese adults have visual attention bias for food cue images: 444
evidence for altered reward system function. International Journal of Obesity, 33(9), 445
1063-1073. doi: 10.1038/ijo.2009.138 446
22
Cooper, M. J., & Fairburn, C. G. (1992). Selective processing of eating, weight and shape 447
related words in patients with eating disorders and dieters. British Journal of Clinical 448
Psychology, 31(3), 363-365. doi: 10.1111/j.2044-8260.1992.tb01007.x 449
Cox, W. M., Fadardi, J. S., & Pothos, E. M. (2006). The addiction-Stroop test: Theoretical 450
considerations and procedural recommendations. Psychological Bulletin, 132(3), 443. 451
doi: 10.1037/0033-2909.132.3.443 452
Crombez, G., Van Ryckeghem, D. M. L., Eccleston, C., & Van Damme, S. (2013). 453
Attentional bias to pain-related information: A meta-analysis. Pain, 154(4), 497-510. 454
doi: 10.1016/j.pain.2012.11.013 455
De Houwer, J., & Hermans, D. (1994). Differences in the affective processing of words and 456
pictures. Cognition & Emotion, 8(1), 1-20. doi: 10.1080/02699939408408925 457
De Ruiter, C., & Brosschot, J. F. (1994). The emotional Stroop interference effect in anxiety: 458
Attentional bias or cognitive avoidance? Behaviour Research and Therapy, 32(3), 459
315-319. doi: 10.1016/0005-7967(94)90128-7 460
Dear, B. F., Sharpe, L., Nicholas, M. K., & Refshauge, K. (2011). Pain-related attentional 461
biases: The importance of the personal relevance and ecological validity of stimuli. 462
The Journal of Pain, 12(6), 625-632. doi: 10.1016/j.jpain.2010.11.010 463
di Pellegrino, G., Magarelli, S., & Mengarelli, F. (2011). Food pleasantness affects visual 464
selective attention. Quarterly Journal of Experimental Psychology, 64(3), 560-571. 465
doi: 10.1080/17470218.2010.504031 466
Diamantis, J. A. (1992). An investigation of cognitive biases in dietary restraint. ((Doctoral 467
dissertation) C322906). Retrieved from ProQuest Dissertations & Theses database. 468
(C322906) 469
Dobson, K. S., & Dozois, D. J. (2004). Attentional biases in eating disorders: A meta-analytic 470
review of Stroop performance. Clinical Psychology Review, 23(8), 1001-1022. doi: 471
10.1016/j.cpr.2003.09.004 472
23
Faunce, G. J. (2002). Eating Disorders and Attentional Bias: A Review. Eating Disorders, 473
10(2), 125-139. doi: 10.1080/10640260290081696 474
Field, M., & Cox, W. M. (2008). Attentional bias in addictive behaviors: A review of its 475
development, causes, and consequences. Drug and Alcohol Dependence, 97(1–2), 1-476
20. doi: 10.1016/j.drugalcdep.2008.03.030 477
Franken, I. H. (2003). Drug craving and addiction: integrating psychological and 478
neuropsychopharmacological approaches. Progress in Neuro-Psychopharmacology 479
and Biological Psychiatry, 27(4), 563-579. doi: 10.1016/S0278-5846(03)00081-2 480
Giel, K. E., Teufel, M., Friederich, H. C., Hautzinger, M., Enck, P., & Zipfel, S. (2011). 481
Processing of pictorial food stimuli in patients with eating disorders—A systematic 482
review. International Journal of Eating Disorders, 44(2), 105-117. doi: 483
10.1002/eat.20785 484
Glaser, W. R., & Glaser, M. O. (1989). Context effects in Stroop-like word and picture 485
processing. Journal of Experimental Psychology: General, 118(1), 13-42. doi: 486
10.1037/0096-3445.118.1.13 487
Hepworth, R., Mogg, K., Brignell, C., & Bradley, B. P. (2010). Negative mood increases 488
selective attention to food cues and subjective appetite. Appetite, 54(1), 134-142. doi: 489
10.1016/j.appet.2009.09.019 490
Herman, C. P., & Mack, D. (1975). Restrained and unrestrained eating. Journal of 491
Personality, 43(4), 647-660. doi: 10.1111/j.1467-6494.1975.tb00727.x 492
Hinojosa, J. A., Carretie, L., Valcarcel, M. A., Mendez-Bertolo, C., & Pozo, M. A. (2009). 493
Electrophysiological differences in the processing of affective information in words 494
and pictures. Cognitive, Affective & Behavioral Neuroscience, 9(2), 173-189. doi: 495
10.3758/CABN.9.2.173 496
24
Hou, R. H., Mogg, K., Bradley, B. P., Moss-Morris, R., Peveler, R., & Roefs, A. (2011). 497
External eating, impulsivity and attentional bias to food cues. Appetite, 56(2), 424-498
427. doi: 10.1016/j.appet.2011.01.019 499
Israeli, A. L., & Stewart, S. H. (2001). Memory bias for forbidden food cues in restrained 500
eaters. Cognitive Therapy and Research, 25(1), 37-48. doi: 501
10.1023/A:1026422731313 502
Johansson, L., Ghaderi, A., & Andersson, G. (2004). The role of sensitivity to external food 503
cues in attentional allocation to food words on dot probe and Stroop tasks. Eating 504
Behaviors, 5(3), 261-271. doi: 10.1016/j.eatbeh.2004.01.005 505
Johansson, L., Ghaderi, A., & Andersson, G. (2005). Stroop interference for food- and body-506
related words: a meta-analysis. Eating Behaviors, 6(3), 271-281. 507
Kemps, E., & Tiggemann, M. (2009). Attentional Bias for Craving-Related (Chocolate) Food 508
Cues. Experimental & Clinical Psychopharmacology, 17(6), 425-433. doi: 509
10.1037/a0017796 510
Lee, M., & Shafran, R. (2004). Information processing biases in eating disorders. Clinical 511
Psychology Review, 24(2), 215-238. doi: 10.1016/j.cpr.2003.10.004 512
Lee, M., & Shafran, R. (2008). Processing biases in eating disorders: The impact of temporal 513
factors. International Journal of Eating Disorders, 41(4), 372-375. doi: 514
10.1002/eat.20495 515
Lee, M., Shafran, R., & Fairburn, C. G. (2004). Attentional biases in eating disorders: 516
Assessment using an enhanced methodology. International Journal of Eating 517
Disorders, 35(4), 402-403. doi: 10.1002/eat.20051 518
Loeber, S., Grosshans, M., Korucuoglu, O., Vollmert, C., Vollstädt-Klein, S., Schneider, S., . 519
. . Kiefer, F. (2011). Impairment of inhibitory control in response to food-associated 520
cues and attentional bias of obese participants and normal-weight controls. 521
International Journal of Obesity, 36, 1334-1339. doi: 10.1038/ijo.2011.184 522
25
Loeber, S., Grosshans, M., Herpertz, S., Kiefer, F., & Herpertz, S. C. (2013). Hunger 523
modulates behavioral disinhibition and attentional allocation to food-associated cues 524
in normal weight controls. Appetite, 71(1), 32-39. doi: 10.1016/j.appet.2013.07.008 525
MacLeod, C., & Mathews, A. (1988). Anxiety and the allocation of attention to threat. The 526
Quarterly Journal of Experimental Psychology Section A, 40(4), 653-670. doi: 527
10.1080/14640748808402292 528
MacLeod, C., Mathews, A., & Tata, P. (1986). Attentional bias in emotional disorders. 529
Journal of Abnormal Psychology, 95(1), 15. doi: 10.1037/0021-843X.95.1.15 530
Mogg, K., Bradley, B. P., Hyare, H., & Lee, S. (1998). Selective attention to food-related 531
stimuli in hunger: are attentional biases specific to emotional and psychopathological 532
states, or are they also found in normal drive states? Behaviour Research and 533
Therapy, 36(2), 227-237. doi: 10.1016/s0005-7967(97)00062-4 534
Newman, E., O'Connor, D., & Conner, M. (2005). Stress-induced eating: An investigation of 535
attentional biases for food words in external eaters. Psychology & Health, 20(S1), 536
192-192. doi: 10.1080/14768320500221275 537
Nijs, I. M., Muris, P., Euser, A. S., & Franken, I. H. (2010). Differences in attention to food 538
and food intake between overweight/obese and normal-weight females under 539
conditions of hunger and satiety. Appetite, 54(2), 243-254. doi: 540
10.1016/j.appet.2009.11.004 541
Noldy, N. E., Stelmack, R. M., & Campbell, K. B. (1990). Event-related potentials and 542
recognition memory fpr pictures and words: The effects of intentional and incidental 543
learning. Psychophysiology, 27(4), 417-428. doi: 10.1111/j.1469-544
8986.1990.tb02337.x 545
Osborne, J. W. (2010). Improving your data transformations: Applying the Box-Cox 546
transformation. Practical Assessment, Research & Evaluation, 15(12), 1-9. doi: 547
Retrieved from http://pareonline.net/ 548
26
Paivio, A., & Csapo, K. (1973). Picture superiority in free recall: Imagery or dual coding? 549
Cognitive Psychology, 5(2), 176-206. doi: 10.1016/0010-0285(73)90032-7 550
Papies, E. K., Stroebe, W., & Aarts, H. (2008). The allure of forbidden food: On the role of 551
attention in self-regulation. Journal of Experimental Social Psychology, 44(5), 1283-552
1292. doi: 10.1016/j.jesp.2008.04.008 553
Piech, R. M., Pastorino, M. T., & Zald, D. H. (2010). All I saw was the cake. Hunger effects 554
on attentional capture by visual food cues. Appetite, 54(3), 579. doi: 555
10.1016/j.appet.2009.11.003 556
Placanica, J. L., Faunce, G. J., & Soames Job, R. F. (2002). The effect of fasting on 557
attentional biases for food and body shape/weight words in high and low Eating 558
Disorder Inventory scorers. International Journal of Eating Disorders, 32(1), 79-90. 559
doi: 10.1002/eat.10066 560
Pothos, E. M., Calitri, R., Tapper, K., Brunstrom, J. M., & Rogers, P. J. (2009). Comparing 561
Measures of Cognitive Bias Relating to Eating Behaviour. Applied Cognitive 562
Psychology, 23(7), 936-952. doi: 10.1002/acp.1506 563
Pothos, E. M., Tapper, K., & Calitri, R. (2009). Cognitive and behavioral correlates of BMI 564
among male and female undergraduate students. Appetite, 52(3), 797-800. doi: 565
10.1016/j.appet.2009.03.002 566
Schachter, S., & Rodin, J. (1974). Obese humans and rats. Washington, DC: 567
Erlbaum/Halsted. 568
Schoth, D. E., Nunes, V. D., & Liossi, C. (2012). Attentional bias towards pain-related 569
information in chronic pain; a meta-analysis of visual-probe investigations. Clinical 570
Psychology Review, 32(1), 13-25. doi: 10.1016/j.cpr.2011.09.004 571
Shafran, R., Lee, M., Cooper, Z., Palmer, R. L., & Fairburn, C. G. (2007). Attentional bias in 572
eating disorders. International Journal of Eating Disorders, 40(4), 369-380. doi: 573
10.1002/eat.20375 574
27
Shafran, R., Lee, M., Cooper, Z., Palmer, R. L., & Fairburn, C. G. (2008). Effect of 575
psychological treatment on attentional bias in eating disorders. International Journal 576
of Eating Disorders, 41(4), 348-354. doi: 10.1002/eat.20500 577
Shepard, R. N. (1967). Recognition memory for words, sentences, and pictures. Journal of 578
Verbal Learning and Verbal Behaviour, 6(1), 156-163. doi: 10.1016/S0022-579
5371(67)80067-7 580
Simmons, W. K., Martin, A., & Barsalou, L. W. (2005). Pictures of Appetizing Foods 581
Activate Gustatory Cortices for Taste and Reward. Cerebral Cortex, 15(10), 1602-582
1608. doi: 10.1093/cercor/bhi038 583
Snodgrass, J. G., Volvovitz, R., & Walfish, E. R. (1972). Recognition memory for words, 584
pictures, and words + pictures. Psychonomic Science, 27(6), 345-347. doi: 585
10.3758/BF03328986 586
Stroop, J. R. (1935). Studies of interference in serial verbal reactions. Journal of 587
Experimental Psychology, 18, 643-662. doi: 10.1037/h0054651 588
Tapper, K., Pothos, E. M., & Lawrence, A. D. (2010). Feast your eyes: Hunger and trait 589
reward drive predict attentional bias for food cues. Emotion, 10(6), 949-954. doi: 590
10.1037/a0020305 591
van Strien, T., Frijters, J. E. R., Bergers, G. P. A., & Defares, P. B. (1986). The Dutch Eating 592
Behavior Questionnaire (DEBQ) for assessment of restrained, emotional, and external 593
eating behavior. International Journal of Eating Disorders, 5(2), 295-315. doi: 594
10.1002/1098-108x(198602)5:2<295::aid-eat2260050209>3.0.co;2-t 595
Werthmann, J., Roefs, A., Nederkoorn, C., Mogg, K., Bradley, B. P., & Jansen, A. (2011). 596
Can(not) take my eyes off it: Attention bias for food in overweight participants. 597
Health Psychology, 30(5), 561-569. doi: 10.1037/a0024291 598
28
Werthmann, J., Roefs, A., Nederkoorn, C., Mogg, K., Bradley, B. P., & Jansen, A. (2013). 599
Attention bias for food is independent of restraint in healthy weight individuals: An 600
eye tracking study. Eating Behaviors. doi: 10.1016/j.eatbeh.2013.06.005 601
1
Table S1
Summary of food dot probe attentional bias (AB) studies
Reference and
country
Groups
N
Age
M (SD)
Gender
BMI
M (SD)
Measures
Dot probe stimuli Parameters Relevant results
AB
found?
Ahern, Field,
Yokum,
Bohon, and
Stice (2010)
UK
High restraint
(HR)
Low restraint
(LR)
63 across
both
groups
20.3
(0.47)
20.06
(0.35)
63/63
female
23.97
(0.64)
21.43
(0.53)
Dot probe
BMI (self-reported)
Height/weight
DEBQ-R
SRC task
FRT
THT
POFS
SPSRQ
EDDS
Pictures: food.
Foods rated least
and most
appetizing were
used. Each food
paired with
household object.
Fixation cross 500ms
Picture pair 500ms
ITI 500ms
10 x practise
2 x buffer
1 block x 80 trials
No relation between restraint
scores and AB. Both high and
low scorers attended toward
food cues over control stimuli
NO
Benas and
Gibb (2011)
USA
Healthy normal
(HN)
202 18.93
(1.17)
202/202
female
23.25
(3.53)
Dot probe
IAT
EDE
EDE-Q
HRSD
BDI-II
Height/weight
Pictures: positive
or negative facial
expressions,
food, and body.
Each paired with
neutral image,
non-specified.
Fixation cross 1000ms
Picture pair
1000ms
ITI n.r.
Trials n.r.
Neither depressive nor ED
symptoms were correlated with
any ABs
NO
Boon,
Vogelzang, and
Jansen (2000)
The
Netherlands
HR
LR
29
30
n.r. 29/29
female
30/30
female
n.r. Dot probe
Restraint scale
Word recognition
Hunger
Words: 24 food
paired with 24
home; and 24
weight/shape
paired with 24
office.
Fixation stimulus n.r.
Word pair 500ms
10 x practise
48 trials
No hyperattention or avoidance
of food or weight/shape cues
among restrained eaters.
NO
2
Reference and
country
Groups
N
Age
M (SD)
Gender
BMI
M (SD)
Measures
Dot probe stimuli Parameters Relevant results
AB
found?
Brignell,
Griffiths,
Bradley, and
Mogg (2009)
UK
High external
eaters (HEX)
Low external
eaters (LEX)
19
24
30.58
(12.04)
36.5
(16.12)
17/19
female
18/24
female
26.53
(8.18)
29.03
(9.28)
Dot probe
DEBQ-Ex
BMI
Grand hunger
SLIM satiety scale
EAT-26
Desire to eat
Hrs between meals
SRC
Pleasantness rating
task
Pictures: 20 food
(mixture of high
calorie and low
calorie) paired
with non-food
matched controls
20 filler pairs
non-food
12 food-control
for practise and
buffer trials.
Fixation cross 500ms
Pic pair 500ms or
2000ms
ITI 500ms or 1500ms
12 x practise
2 buffer
2 blocks x 120 trials
(160 critical, 80 filler),
2 buffer between.
High external eaters showed
greater AB for food cues than
low external eaters at 2000ms,
and a non-significant trend at
500ms.
YES
Calitri, Pothos,
Tapper,
Brunstrom, and
Rogers (2010)
UK
HN 151 at
baseline
102 at
1-yr follow
up
19 (1.0)
19 (1.0)
88/151
female
58/102
female
23.32
(3.52)
23.64
(3.50)
Dot probe
DEBQ
DASS
Physical activity scale
Height/weight
Stroop (food and
neutral words)
Words: 20 food
(10 healthy, 10
unhealthy), 20
office
Fixation cross 500ms
Word pair 500 or
1250ms
ITI 1000ms
8 x prac.
4 x buffer
2 blocks x 80 trials, 4
buffer between
No AB or DEBQ indices
predicted BMI change.
NO
Castellanos et
al. (2009)
USA
Obese (OB; fed or
fasted)
Normal weight
(NW; fed or
fasted)
18
18
29.5
(4.48)
27.61
(3.45)
18/18
female
18/18
female
38.69
(6.87)
21.73
(1.85)
Dot probe
BMI
Visual acuity
TPQ
BIS/BAS scales
TFEQ
DEBQ
Hunger scale
Eye Tracking
Height/weight
Pictures: 20 high
calorie food, 20
low calorie food,
20 nature scenery
Fixation cross 1000ms
Pic pair 2000ms
ITI n.r.
Trials n.r.
No differences between
conditions for dot probe.
However, eye-tracking revealed
NW more likely to shift gaze
toward food rather than non-
food when hungry rather than
fed. In contrast OB focussed
greater visual attention on food
compared with non-food
regardless of whether hungry or
fed.
NO for
dot
probe
3
Reference and
country
Groups
N
Age
M (SD)
Gender
BMI
M (SD)
Measures
Dot probe stimuli Parameters Relevant results
AB
found?
di Pellegrino,
Magarelli, and
Mengarelli
(2011)
Italy
HN pre-satiety
HN post-satiety
26
26 (same
group, later
session).
25.1
(n.r)
across
both
groups
26/26
female
26/26
female
n.r. Dot probe
Hunger
EAT-26
Pictures: 1
savoury food, 1
sweet food, 1
neutral food, 1
telephone token.
Fixation cross 800ms
Pic pair 200 or 700ms
Probe 100ms
ITI 1000ms or 1500ms
24 practise
144 trials
The food-specific devaluation
induced a reduction in AB for
devalued (eaten) foods, and a
decrease in perceived
pleasantness of those foods. AB
toward valued (uneaten) foods
did not change significantly.
YES
Hepworth,
Mogg,
Brignell, and
Bradley (2010)
UK
HN Neutral mood
HN Negative
mood
37
43
20.4
(2.8)
21.0
(5.6)
37/37
female
43/43
female
22.8
(3.8)
22.3
(2.8)
Dot probe
DEBQ
BDI-II
Mood VAS
Appetite VAS
MHQ
POMS-A
POMS-D
PSS
BIS/BAS scales
SDS
Height/weight
Pictures: 20 food
(mixture of high
calorie and low
calorie) paired
with non-food
matched controls
20 filler pairs
non-food
12 food-control
for prac. and
buffer trials.
Fixation cross 500ms
Pic pair 500ms or
2000ms
ITI 500ms or 1500ms
12 x practise
2 buffer
2 blocks x 120 trials
(160 critical, 80 filler),
2 buffer between.
Induced negative mood
increased attentional bias to
food cues. Correlational
analyses showed that AB was
also positively associated with
measures of trait eating style
(emotional, external and
restrained eating), perceived
stress, and dysphoria.
YES
Hou et al.
(2011)
UK
HN 42 22.0
(4.7)
29/42
female
21.75
(3.36)
Dot probe
DEBQ-Ex
BIS
BAS
SPSRQ
Grand Hunger
Height/weight
Pictures: 20 food
(mixture of high
calorie and low
calorie), 20 home
objects. Extra 10
non-food fillers,
extra 10 food-
control for buffer
and practice
trials.
Fixation cross 500ms
Pic pair 2000ms
10 practise
2 buffer
120 trials (80 food-
nonfood critical, 40
filler)
AB for food cues correlated
positively with external eating
and trait impulsivity.
YES
4
Reference and
country
Groups
N
Age
M (SD)
Gender
BMI
M (SD)
Measures
Dot probe stimuli Parameters Relevant results
AB
found?
Johansson,
Ghaderi, and
Andersson
(2004)
UK
HEX
LEX
22
21
22.23
(2.11)
22.24
(2.21)
22/22
female
21/21
female
21.76
(1.16)
22.19
(1.12)
Dot probe
DEBQ
Rosenberg Self-
Esteem Scale
BSQ
EAT-26
Stroop (voice
response; food, body
shape)
Words: 10 high
calorie food, 10
body/shape, 20
neutral words.
Extra 10 neutral
word pairs for
filler material.
Fixation cross n.r.
Word pair 500 ms
ITI 500ms
10 practise
80 trials
High external eaters directed
attention away from food words,
whereas low external eaters
directed attention toward food
words on the dot probe task. No
differences found for Stroop
task.
YES
Kemps and
Tiggemann
(2009): Study 1
Australia
HN choc cravers
(CC)
HN non-cravers
(NC)
40
40
19.70
(2.08)
across
both
groups
40/40
female
40/40
female
21.60
(3.30)
22.60
(3.70)
Dot probe
General attention
Response speed
Trait chocolate
craving
Grand Hunger
DEBQ-R
EAT-26
Pictures: 8
chocolate-
containing, 8
non-choc
palatable, 16
transport.
Stimulus pairs:
Critical choc-
food, Control
food-food, Filler
transport-
transport.
Fixation cross 1000ms
Pic pair 500ms
ITI 500ms
12 practise
2 buffer
96 trials
Chocolate cravers showed an
AB for chocolate cues. No
differences between groups in
hunger, restraint, ED
symptomatology, general
attention, or response speed.
The AB stemmed from
difficulty in disengaging
attention from chocolate cues
rather than hypervigilence
toward chocolate cues.
YES
Kemps and
Tiggemann
(2009): Study 2
Australia
HN craving
manipulation
(CM)
HN control
53
53
21.14
(2.42)
across
both
groups
106/106
female
23.10
(5.70)
23.40
(8.00)
Dot probe
General attention
Response speed
Trait chocolate
craving
Grand Hunger
DEBQ-R
EAT-26
Chocolate rating VAS
Chocolate craving
VAS
Pictures: 8
chocolate-
containing, 8
non-choc
palatable, 16
transport.
Stimulus pairs:
Critical choc-
food, Control
food-food, Filler
transport-
transport.
Fixation cross 1000ms
Pic pair 500ms
ITI 500ms
12 practise
2 buffer
96 trials
Individuals in whom a craving
for chocolate was induced
showed an AB for chocolate
cues. The AB stemmed from
difficulty in disengaging
attention from chocolate cues
rather than hypervigilence
toward chocolate cues.
YES
5
Reference and
country
Groups
N
Age
M (SD)
Gender
BMI
M (SD)
Measures
Dot probe stimuli Parameters Relevant results
AB
found?
Lee and
Shafran (2008)
UK
ED patients
Hi anxiety
controls (ANX)
HN low shape
concern (HNL)
HN mod. shape
concern (HNM)
HN high shape
concern (HNH)
23
19
31
21
23
22.17
(3.58)
26.26
(7.52)
23.39
(6.69)
27.90
(8.26)
24.26
(5.63)
23/23
female
19/19
female
31/31
female
21/21
female
23/23
female
21.79
(4.98)
22.33
(3.35)
22.21
(2.34)
25.04
(5.62)
25.21
(3.29)
Dot probe
EDEQ
BDI-II
BAI
Height/weight
Pictures:
positive,
negative, neutral
eating/shape;
neutral weight;
animal controls.
Fixation digit 1000ms
Pic pair 1000ms
ISI 500ms or 2000ms
84 trials
ED patients had an AB toward
positive and negative eating
stimuli, negative and neutral
shape stimuli and weight stimuli
when using an ISI of 500 ms.
However, with an ISI of 2000
ms patients attended only to
weight stimuli.
YES
but
only at
500ms
ISI
Lee, Shafran,
and Fairburn
(2004)
UK
Conference
abstract.
ED (self-reported)
HN
n.r.
n.r.
n.r. All female n.r.
n.r.
Dot probe
EDEQ
Pictures:
positive,
negative, or
neutral eating,
shape/weight;
animal controls.
Fixation cross n.r.
Pic pair 1000ms
ITI n.r.
Trials n.r.
Participants with eating
disorders showed AB toward
negative eating stimuli and
away from positive eating
stimuli as compared to other
groups. AB correlated with
restraint and eating concerns.
YES
Loeber et al.
(2011)
Germany
OB
HN
20
20
47.90
(12.50)
44.90
(11.70)
20/20
female
20/20
female
38.80
(6.30)
22.60
(1.10)
Dot probe
TFEQ
BIS
Grand Hunger
Go/no-Go
D2 Test of attention
Auditive verbal
learning
Trail-making test
WCS
Pictures: 20 food
(mixture of high
calorie and low
calorie), 20
objects. Extra 40
neutral objects
for filler.
Fixation cross 500ms
Pic pair 50ms
ITI n.r.
160 trials
No AB toward food cues for OB
or HN. Salience of the food cues
seems too low for such an early
modulation of attention.
NO
Loeber,
Grosshans,
Herpertz,
Kiefer, and
Herpertz
(2013)
Germany
Hungry
Sated
18
30
24.28
(4.50)
24.68
(4.81)
27/28
female and
21/48
male
across
both
groups
21.63
(1.84)
21.60
(2.35)
Dot probe
TFEQ
Grand Hunger
Go/no-Go
Blood glucose level
(BGL)
Pictures: 20 food
(mixture of high
calorie and low
calorie), 20
objects. Extra 40
neutral objects
for filler.
Fixation cross 500ms
Pic pair 50ms or 500ms
ITI 1000ms
160 trials
No difference in AB between
hungry and sated groups,
although hungry participants
had longer reaction times in
general. Participants with a
lower BGL had a bias toward
food cues and those with a
higher BGL showed an
avoidance of food cues.
NO for
hunger.
YES
for
BGL at
50ms
6
Reference and
country
Groups
N
Age
M (SD)
Gender
BMI
M (SD)
Measures
Dot probe stimuli Parameters Relevant results
AB
found?
Mogg, Bradley,
Hyare, and Lee
(1998)
UK
Low hunger (LH)
High hunger (HH)
15
16
20.90
(2.00)
20.60
(0.90)
7/15
female
9/16
female
n.r.
n.r.
Dot probe
Lexical decision task
Grand Hunger
EAT-26
Words: 64 food-
related (mixture
of high calorie
and low calorie),
64 transport.
Extra 64 neutral
filler word pairs
Fixation cross 500ms
Word pair 14ms or
500ms.
ITI 500ms or 1500ms
12 practise
128 trials
Participants with high hunger
showed a greater AB for food
words presented for 500ms
compared with those with low
hunger No hunger-related bias
found in pre-attentive processes
(14ms and masked
presentation).
YES
Newman,
O'Connor, and
Conner (2005)
UK
Conference
abstract.
HEX
LEX
32 stress or
control
37 stress or
control
n.r.
n.r.
n.r.
n.r.
n.r.
n.r.
Dot probe
Stroop (food words)
Words: food,
control.
n.r. Null effects for dot probe. For
Stroop, high external eaters
showed an increased bias when
stressed, and low external eaters
demonstrated the opposite
pattern.
NO for
dot
probe
Nijs, Muris,
Euser, and
Franken (2010)
The
Netherlands
OV/OB sated
OV/OB hungry
NW sated
NW hungry
13
13
20
20
22.08
(3.01)
20.92
(3.71)
20.60
(1.60)
22.15
(1.46)
13/13
female
13/13
female
20/20
female
20/20
female
29.85
(2.98)
30.14
(5.96)
20.76
(1.05)
20.50
(1.24)
Dot probe
DEBQ
Eye tracking
EEG/ERP
Bogus taste test
Hunger VAS
Height/weight
Pictures: 15 high
calorie snacks
paired with 15
office items.
Extra 10 pairs of
tool pictures for
filler.
Fixation cross 1000ms
Pic pair 100ms or
500ms
ITI 500ms
10 practise
4 blocks x 100 trials
At 100ms, there was an AB
towards food pictures in hungry
vs. satiated participants, and in
OV/OB (especially hungry
OV/OB) vs. NW. The latter
finding only approached
significance.
No between-condition
differences for 500ms trials.
Results suggest all participants
demonstrated maintained
attention to food, irrespective of
weight group or condition.
YES
for
hungry
at
100ms.
NO for
500ms
Papies,
Stroebe, and
Aarts (2008)
Study 1
The
Netherlands
HR food pre-
exposure
HR non-exposure
LR food pre-
exposure
LR non-exposure
104 across
all groups
n.r. 79/104
female
n.r. Dot probe
Lexical decision task
Revised restraint scale
Hedonic ratings
Words: 10
palatable food-
office pairs and
10 control food-
office pairs.
Extra 20 filler
word pairs.
Fixation cross 500ms
Word pair 200ms
ITI n.r.
20 practise
2 blocks x 80 trials.
After exposure to food cues,
restrained eaters allocated
attention towards hedonically
rated food.
YES
7
Reference and
country
Groups
N
Age
M (SD)
Gender
BMI
M (SD)
Measures
Dot probe stimuli Parameters Relevant results
AB
found?
Papies et al.
(2008) Study 2
The
Netherlands
HR food pre-
exposure
HR non-food pre-
exposure
HR food pre-
exposure plus
prime
LR food pre-
exposure
LR non-food pre-
exposure
LR food pre-
exposure plus
prime
138 n.r. 98/138
female
n.r. Dot probe
Lexical decision task
Revised restraint scale
Hedonic ratings
Words: 10
palatable food-
office pairs and
10 control food-
office pairs.
Extra 20 filler
word pairs. 5
restraint-related
words for diet
priming.
Fixation letter strings
250ms
Prime 30ms
Postmask letter string
350ms
Word pair 200ms
ITI n.r.
20 practise
2 blocks x 80 trials.
After exposure to food cues,
restrained eaters allocated
attention towards hedonically
rated food. Restrained eaters’
AB did not occur when they
were primed with the concept of
dieting.
YES
Placanica,
Faunce, and
Soames Job
(2002)
Australia
High EDI fasted
High EDI
nonfasted
Low EDI fasted
Low EDI
nonfasted
19
19
19
19
18.10
(n.r.)
across
all
groups
56/56
female
n.r. Dot probe
EDI-2
Grand Hunger Scale
Word rating scales
Words: 14 high
calorie and 14
low calorie food
paired with
household items;
14 negative and
14 positive
weight/shape
paired with
transport.
Word pair 500ms
ISI 50ms
ITI 1000ms
224 trials
Fasting increased AB toward
high calorie foods across all
participants. High EDI-2 scorers
showed an AB toward low
calorie food words, but only
when nonfasted.
YES
Pothos, Tapper,
and Calitri
(2009)
UK
HN 128 18.70
(0.78)
69/128
female
22.74
(2.94)
Dot probe
Food Stroop
EAST
Recognition task
DEBQ
DASS
BPAS
Height/weight
Words: 10
unhealthy food
and 10 healthy
food, paired with
20 office. 12
number words
for prac. and
buffer.
Fixation cross 500ms
Word pair 500ms or
1250ms
ITI 1000ms
8 practise
4 buffer
2 blocks x 80 trials
BMI did not predict any indices
of AB. In females, dietary
restraint was positively
correlated with AB toward
healthy foods. No significant
correlations between AB and
emotional or external eating.
YES
for
restraint
in
females
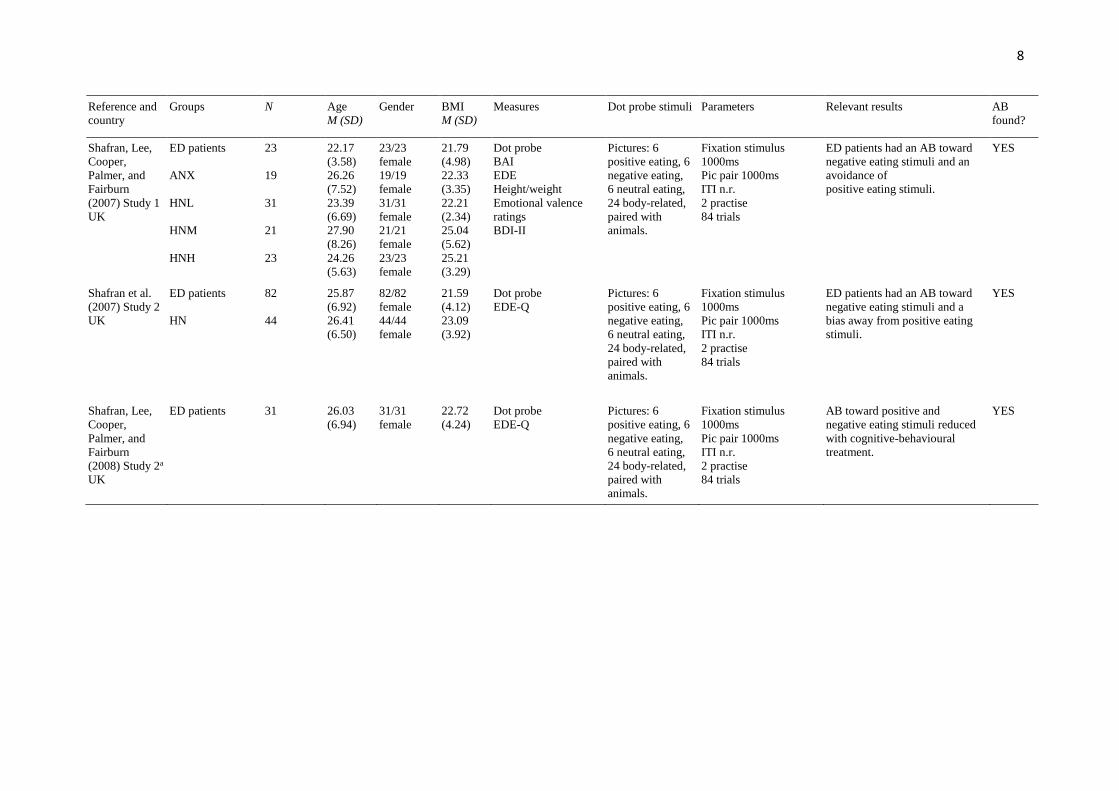
8
Reference and
country
Groups
N
Age
M (SD)
Gender
BMI
M (SD)
Measures
Dot probe stimuli Parameters Relevant results
AB
found?
Shafran, Lee,
Cooper,
Palmer, and
Fairburn
(2007) Study 1
UK
ED patients
ANX
HNL
HNM
HNH
23
19
31
21
23
22.17
(3.58)
26.26
(7.52)
23.39
(6.69)
27.90
(8.26)
24.26
(5.63)
23/23
female
19/19
female
31/31
female
21/21
female
23/23
female
21.79
(4.98)
22.33
(3.35)
22.21
(2.34)
25.04
(5.62)
25.21
(3.29)
Dot probe
BAI
EDE
Height/weight
Emotional valence
ratings
BDI-II
Pictures: 6
positive eating, 6
negative eating,
6 neutral eating,
24 body-related,
paired with
animals.
Fixation stimulus
1000ms
Pic pair 1000ms
ITI n.r.
2 practise
84 trials
ED patients had an AB toward
negative eating stimuli and an
avoidance of
positive eating stimuli.
YES
Shafran et al.
(2007) Study 2
UK
ED patients
HN
82
44
25.87
(6.92)
26.41
(6.50)
82/82
female
44/44
female
21.59
(4.12)
23.09
(3.92)
Dot probe
EDE-Q
Pictures: 6
positive eating, 6
negative eating,
6 neutral eating,
24 body-related,
paired with
animals.
Fixation stimulus
1000ms
Pic pair 1000ms
ITI n.r.
2 practise
84 trials
ED patients had an AB toward
negative eating stimuli and a
bias away from positive eating
stimuli.
YES
Shafran, Lee,
Cooper,
Palmer, and
Fairburn
(2008) Study 2a
UK
ED patients
31 26.03
(6.94)
31/31
female
22.72
(4.24)
Dot probe
EDE-Q
Pictures: 6
positive eating, 6
negative eating,
6 neutral eating,
24 body-related,
paired with
animals.
Fixation stimulus
1000ms
Pic pair 1000ms
ITI n.r.
2 practise
84 trials
AB toward positive and
negative eating stimuli reduced
with cognitive-behavioural
treatment.
YES
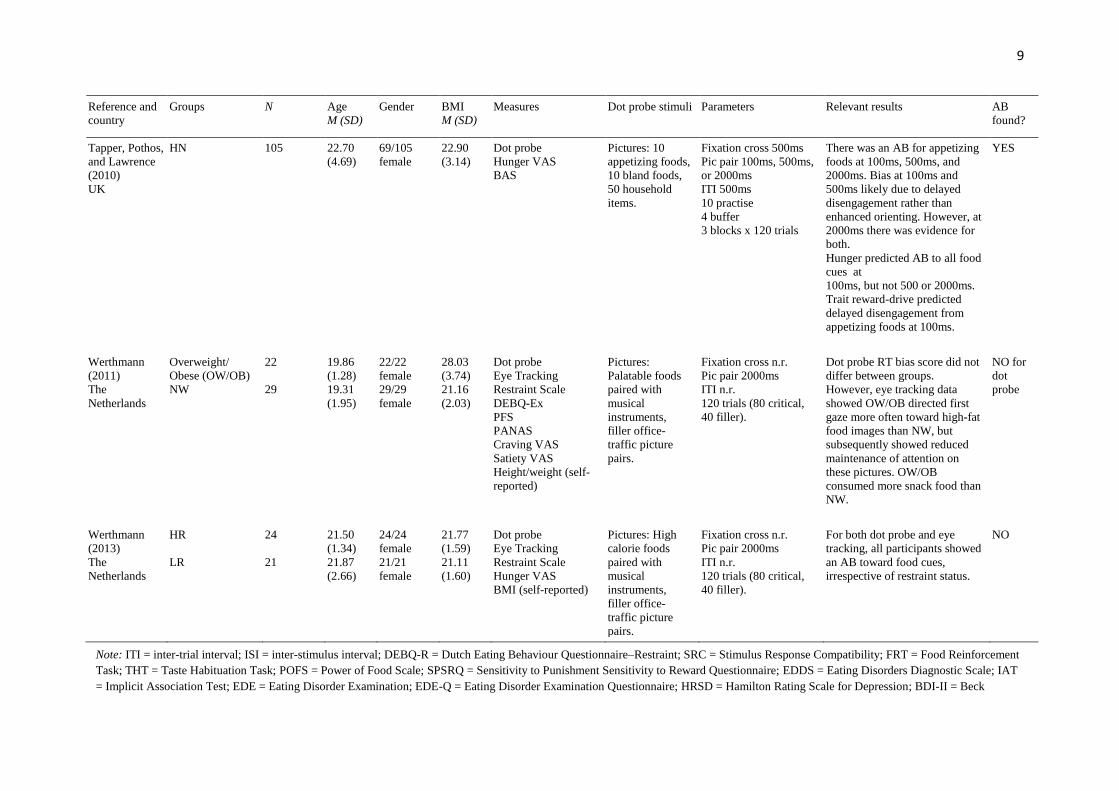
9
Reference and
country
Groups
N
Age
M (SD)
Gender
BMI
M (SD)
Measures
Dot probe stimuli Parameters Relevant results
AB
found?
Tapper, Pothos,
and Lawrence
(2010)
UK
HN 105 22.70
(4.69)
69/105
female
22.90
(3.14)
Dot probe
Hunger VAS
BAS
Pictures: 10
appetizing foods,
10 bland foods,
50 household
items.
Fixation cross 500ms
Pic pair 100ms, 500ms,
or 2000ms
ITI 500ms
10 practise
4 buffer
3 blocks x 120 trials
There was an AB for appetizing
foods at 100ms, 500ms, and
2000ms. Bias at 100ms and
500ms likely due to delayed
disengagement rather than
enhanced orienting. However, at
2000ms there was evidence for
both.
Hunger predicted AB to all food
cues at
100ms, but not 500 or 2000ms.
Trait reward-drive predicted
delayed disengagement from
appetizing foods at 100ms.
YES
Werthmann
(2011)
The
Netherlands
Overweight/
Obese (OW/OB)
NW
22
29
19.86
(1.28)
19.31
(1.95)
22/22
female
29/29
female
28.03
(3.74)
21.16
(2.03)
Dot probe
Eye Tracking
Restraint Scale
DEBQ-Ex
PFS
PANAS
Craving VAS
Satiety VAS
Height/weight (self-
reported)
Pictures:
Palatable foods
paired with
musical
instruments,
filler office-
traffic picture
pairs.
Fixation cross n.r.
Pic pair 2000ms
ITI n.r.
120 trials (80 critical,
40 filler).
Dot probe RT bias score did not
differ between groups.
However, eye tracking data
showed OW/OB directed first
gaze more often toward high-fat
food images than NW, but
subsequently showed reduced
maintenance of attention on
these pictures. OW/OB
consumed more snack food than
NW.
NO for
dot
probe
Werthmann
(2013)
The
Netherlands
HR
LR
24
21
21.50
(1.34)
21.87
(2.66)
24/24
female
21/21
female
21.77
(1.59)
21.11
(1.60)
Dot probe
Eye Tracking
Restraint Scale
Hunger VAS
BMI (self-reported)
Pictures: High
calorie foods
paired with
musical
instruments,
filler office-
traffic picture
pairs.
Fixation cross n.r.
Pic pair 2000ms
ITI n.r.
120 trials (80 critical,
40 filler).
For both dot probe and eye
tracking, all participants showed
an AB toward food cues,
irrespective of restraint status.
NO
Note: ITI = inter-trial interval; ISI = inter-stimulus interval; DEBQ-R = Dutch Eating Behaviour Questionnaire–Restraint; SRC = Stimulus Response Compatibility; FRT = Food Reinforcement
Task; THT = Taste Habituation Task; POFS = Power of Food Scale; SPSRQ = Sensitivity to Punishment Sensitivity to Reward Questionnaire; EDDS = Eating Disorders Diagnostic Scale; IAT
= Implicit Association Test; EDE = Eating Disorder Examination; EDE-Q = Eating Disorder Examination Questionnaire; HRSD = Hamilton Rating Scale for Depression; BDI-II = Beck
10
Depression Inventory; DEBQ-Ex = Dutch Eating Behaviour Questionnaire–External Eating; EAT-26 = Eating Attitudes Test; DASS = Depression, Anxiety, and Stress Scale; TPQ =
Tridimensional Personality Questionnaire; BIS/BAS = Behavioural Inhibition System/Behavioural Activation System; TFEQ = Three-Factor Eating Questionnaire; VAS = visual analogue
scale; MHQ = Modified Hunger Questionnaire; POMS-A = Shortened Profile of Mood States: Tension/Anxiety; POMS-D = Shortened Profile of Mood States: Depression; SDS = Social
Desirability Scale; BSQ = Body Shape Questionnaire; BAI = Beck Anxiety Inventory; WCS = Wisconsin Card Sorting Test; EEG/ERP = Electroencephalography/Event-related Potentials; EDI-
2 = Eating Disorder Inventory–2; EAST = Extrinsic Affective Simon Task ; BPAS = Brief Physical Assessment Tool; PANAS = Positive and Negative Affect Scale. a Shafran et al. (2008) Study 1 omitted from table as it is a duplicate of Shafran et al. (2007) Study 2
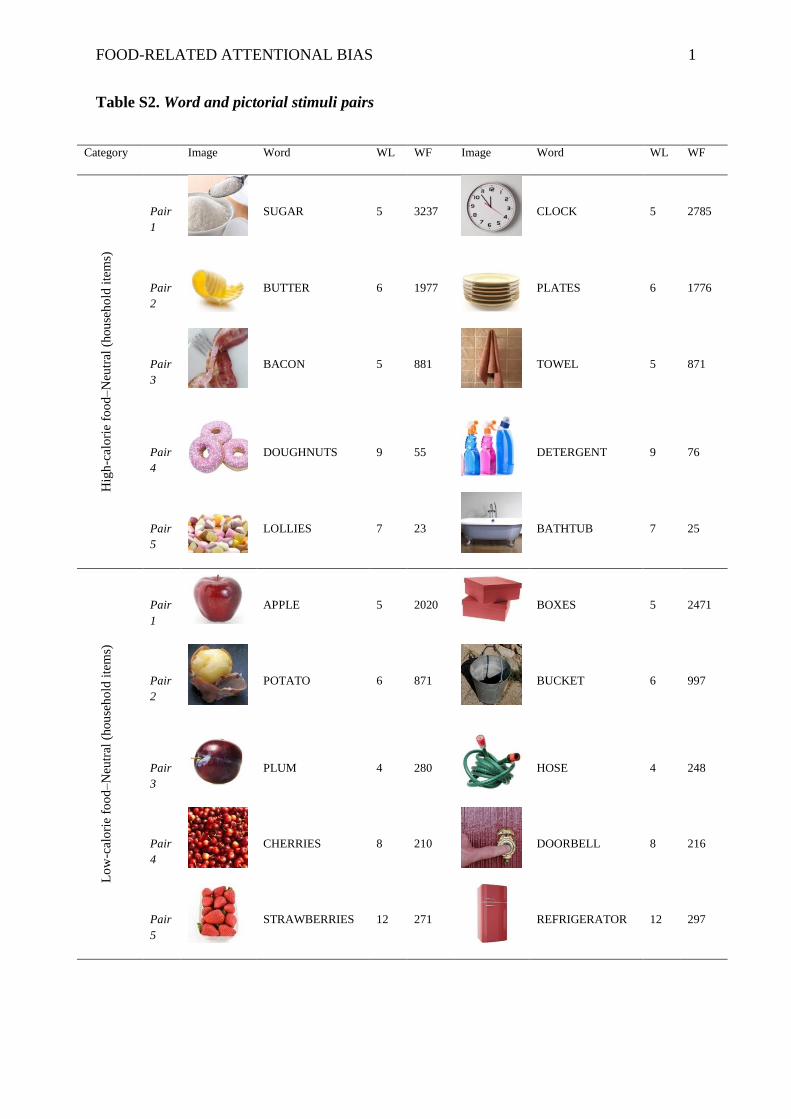
FOOD-RELATED ATTENTIONAL BIAS 1
Table S2. Word and pictorial stimuli pairs
Category Image Word WL WF Image Word WL WF
Hig
h-c
alo
rie
foo
d–
Neu
tral
(hou
seh
old
ite
ms)
Pair
1
SUGAR
5
3237
CLOCK
5
2785
Pair
2
BUTTER
6
1977
PLATES
6
1776
Pair
3
BACON
5
881
TOWEL
5
871
Pair
4
DOUGHNUTS
9
55
DETERGENT
9
76
Pair
5
LOLLIES
7
23
BATHTUB
7
25
Lo
w-c
alo
rie
foo
d–
Neu
tral
(hou
seh
old
ite
ms)
Pair
1
APPLE
5
2020
BOXES
5
2471
Pair
2
POTATO
6
871
BUCKET
6
997
Pair
3
PLUM
4
280
HOSE
4
248
Pair
4
CHERRIES
8
210
DOORBELL
8
216
Pair
5
STRAWBERRIES
12
271
REFRIGERATOR
12
297
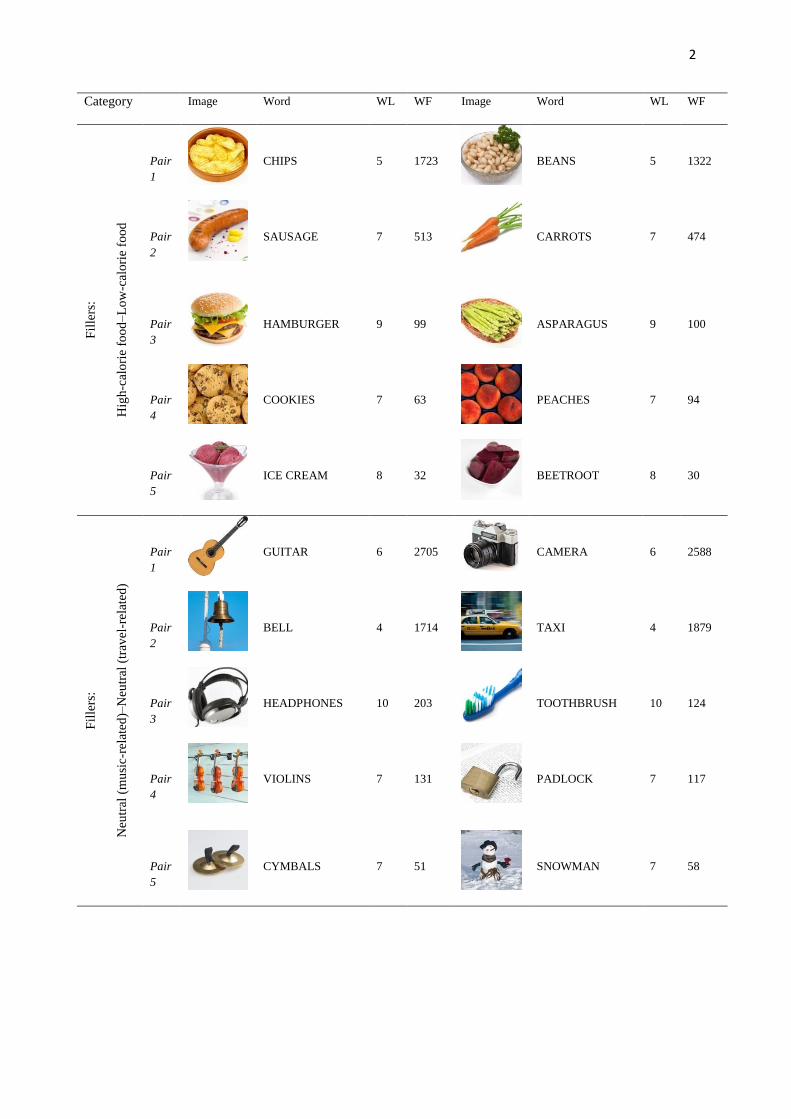
2
Category Image Word WL WF Image Word WL WF F
ille
rs:
Hig
h-c
alo
rie
foo
d–
Lo
w-c
alori
e fo
od
Pair
1
CHIPS
5
1723
BEANS
5
1322
Pair
2
SAUSAGE
7
513
CARROTS
7
474
Pair
3
HAMBURGER
9
99
ASPARAGUS
9
100
Pair
4
COOKIES
7
63
PEACHES
7
94
Pair
5
ICE CREAM
8
32
BEETROOT
8
30
Fil
lers
:
Neu
tral
(m
usi
c-re
late
d)–
Neu
tral
(tr
avel
-rel
ated
)
Pair
1
GUITAR
6
2705
CAMERA
6
2588
Pair
2
BELL
4
1714
TAXI
4
1879
Pair
3
HEADPHONES
10
203
TOOTHBRUSH
10
124
Pair
4
VIOLINS
7
131
PADLOCK
7
117
Pair
5
CYMBALS
7
51
SNOWMAN
7
58
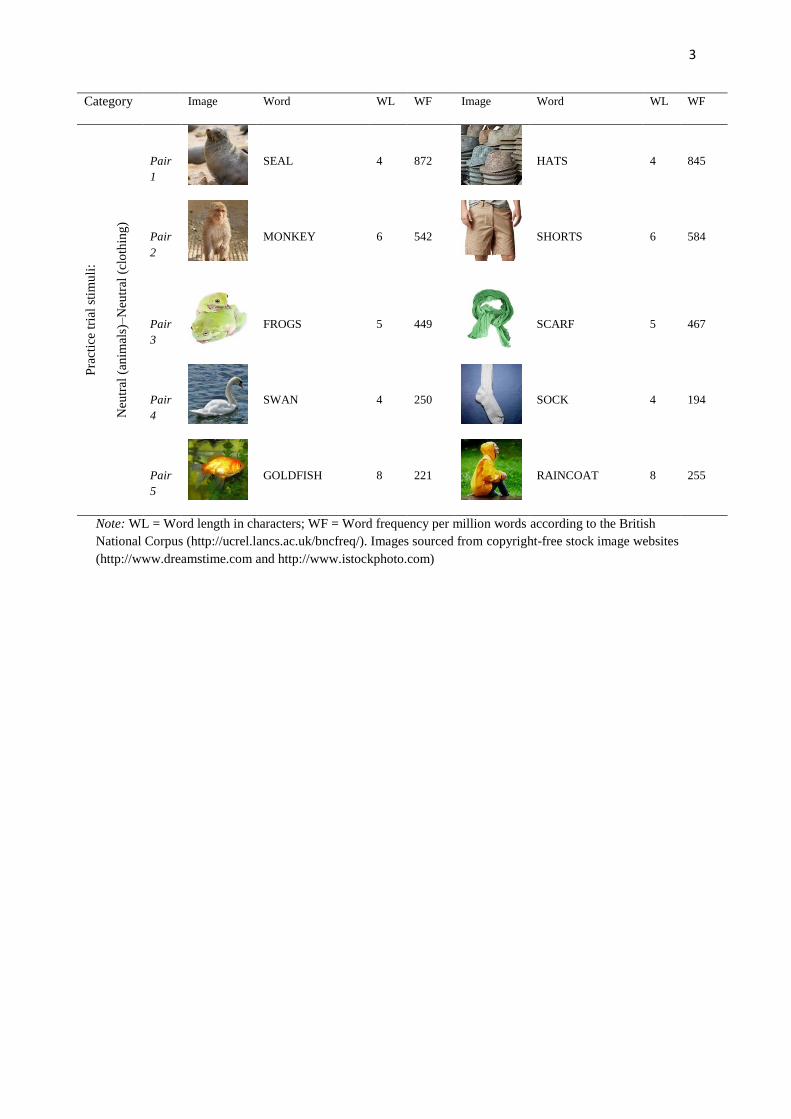
3
Category Image Word WL WF Image Word WL WF P
ract
ice
tria
l st
imu
li:
Neu
tral
(an
imal
s)–
Neu
tral
(cl
oth
ing
)
Pair
1
SEAL
4
872
HATS
4
845
Pair
2
MONKEY
6
542
SHORTS
6
584
Pair
3
FROGS
5
449
SCARF
5
467
Pair
4
SWAN
4
250
SOCK
4
194
Pair
5
GOLDFISH
8
221
RAINCOAT
8
255
Note: WL = Word length in characters; WF = Word frequency per million words according to the British
National Corpus (http://ucrel.lancs.ac.uk/bncfreq/). Images sourced from copyright-free stock image websites
(http://www.dreamstime.com and http://www.istockphoto.com)
Related Documents