NOAA Technical Memorandum NMFS-NE-155 This report series represents a secondary level of scientifiic publishing. All issues employ thorough internal scientific review; some issues employ external scientific review. By design, reviews are transparent collegial reviews, not anonymous peer reviews. All issues may be cited in formal scientific communications. U. S. DEPARTMENT OF COMMERCE William M. Daley, Secretary National Oceanic and Atmospheric Administration D. James Baker, Administrator National Marine Fisheries Service Penelope D. Dalton, Assistant Administrator for Fisheries Northeast Region Northeast Fisheries Science Center Woods Hole, Massachusetts January 2000 Food of Northwest Atlantic Fishes and Two Common Species of Squid 1 Woods Hole Lab., National Marine Fisheries Serv., 166 Water St., Woods Hole, MA 02543 2 Current Address: 38 Hilltop Rd., Mashpee, MA 02649 3 [Deceased] Narragansett Lab., National Marine Fisheries Serv., 28 Tarzwell Dr., Narragansett, RI 02882 4 Current Address: 23 Fairway Ln., West Falmouth, MA 02540 Ray E. Bowman 1,2 , Charles E. Stillwell 3 , William L. Michaels 1 , and Marvin D. Grosslein 1,4

Welcome message from author
This document is posted to help you gain knowledge. Please leave a comment to let me know what you think about it! Share it to your friends and learn new things together.
Transcript

NOAA Technical Memorandum NMFS-NE-155
This report series represents a secondary level of scientifiic publishing. All issuesemploy thorough internal scientific review; some issues employ external scientificreview. By design, reviews are transparent collegial reviews, not anonymous peerreviews. All issues may be cited in formal scientific communications.
U. S. DEPARTMENT OF COMMERCEWilliam M. Daley, Secretary
National Oceanic and Atmospheric AdministrationD. James Baker, Administrator
National Marine Fisheries ServicePenelope D. Dalton, Assistant Administrator for Fisheries
Northeast RegionNortheast Fisheries Science Center
Woods Hole, Massachusetts
January 2000
Food of Northwest Atlantic Fishes
and Two Common Species of Squid
1Woods Hole Lab., National Marine Fisheries Serv., 166 Water St., Woods Hole, MA 025432Current Address: 38 Hilltop Rd., Mashpee, MA 026493[Deceased] Narragansett Lab., National Marine Fisheries Serv., 28 Tarzwell Dr., Narragansett, RI 028824Current Address: 23 Fairway Ln., West Falmouth, MA 02540
Ray E. Bowman1,2, Charles E. Stillwell3, William L. Michaels1,
and Marvin D. Grosslein1,4

iiiPage
Contents
Abstract ............................................................................................................................................................................... vTaxonomic Index of Fish and Squid Species Sampled, Including for Each Species the Number of Stomachs Examined,
Percentage of Stomachs Found Empty, and Associated Appendix Table Number ..................................................... viiAlphabetic Index of Fish and Squid Species Sampled, Including for Each Species the Geographic Areas Where
Collected, Types of Data Listed, and Associated Appendix Table Number ................................................................. xiIntroduction ..........................................................................................................................................................................1Methods and Materials .........................................................................................................................................................1Results and Observations .....................................................................................................................................................2Acknowledgments ................................................................................................................................................................5References Cited ...................................................................................................................................................................6
Tables
Table 1. Percentage of total stomach contents by weight of six functional prey groups for 170 species of fishand squid collected in the Northwest Atlantic .....................................................................................................7
Table 2. Percentage by weight of fish component of diet of piscivores according to geographic area of collection ...... 11Table 3. Percentage by weight of squid component of diet of predators which eat squid according to geographic
area of collection ................................................................................................................................................ 12Table 4. Percentage by weight of polychaete component of diet of predators which eat polychaetes according to
geographic area of collection ............................................................................................................................. 13Table 5. Percentage by weight of decapod crustacean component of diet of predators which eat decapods according
to geographic area of collection ......................................................................................................................... 14Table 6. Percentage by weight of crustaceans (other than decapods) in diet of predators which eat such crustaceans
according to geographic area of collection ........................................................................................................ 15Table 7. Percentage by weight of all other prey (than those noted in Tables 2-6) in diet of predators according to
geographic area of collection ............................................................................................................................. 16
Figure
Figure 1. Delineation of the six principal offshore geographic areas, and the two inshore areas referred to as inshorenorth of Cape Hatteras and inshore south of Cape Hatteras, surveyed by the NEFSC during 1977-80 ............ iv
Appendices
Appendix A. Overall prey of 110 predators which were lightly sampled and/or not well represented in collectionsduring the NEFSC’s 1977-80 bottom trawl surveys ..................................................................................... 17
Appendix B. Overall prey of 60 predators which were fully sampled and well represented in collections during theNEFSC’s 1977-80 bottom trawl surveys ...................................................................................................... 33

Page iv
Figure 1. Delineation of the six principal offshore geographic areas, and the two inshore areas referred to as inshore north of Cape Hatteras andinshore south of Cape Hatteras, surveyed by the NEFSC during 1977-80. (Bottom depth of the offshore areas ranges from 27 to 366m, and of the inshore areas ranges from 8 to <27 m. The inshore area north of Cape Hatteras extends from Cape Hatteras to thewestern portion of the Scotian Shelf. The inshore area south of Cape Hatteras extends from Cape Hatteras to Cape Fear.)

vPage
ABSTRACT
This paper provides a reference document for researchers interested in the types of prey eaten by fishes and twocommon species of squids in continental shelf waters off the northeastern United States. The stomach contents of 31,567individuals representing 180 species were analyzed. Collection of specimens was primarily by bottom trawl or longline during1963-84. Most of the smaller-sized fish species (i.e., < 100 cm long) and the two squid species were collected by bottom trawlduring 1977-80. Most of the apex predators, including the large sharks and tunas, and other large-sized species werecollected by longline.
Dietary data are initially presented as a summary table which lists for each of 170 predators the relative contributionof six major functional prey groups (i.e., fish, squid, polychaete, decapod crustacean, other crustacean, and all other) to itsdiet. Such data are subsequently presented as summary tables which list for each of those six functional prey groups thepredators involved and the relative contribution of seven geographic areas (i.e., Middle Atlantic, Southern New England,Georges Bank, Gulf of Maine, Scotian Shelf, inshore north of Cape Hatteras, and south of Cape Hatteras) to each predator’sconsumption of that functional prey group. Also, appendix tables provide a detailed listing of the overall stomach contentsfor each predator species and, for selected species, the stomach contents according to predator size, or to both predator sizeand geographic area of collection.
Fifty-nine species fed primarily (i.e., >50% of the stomach contents by weight or volume) on fish and/or squid.Some of the major piscivores (not listed in any particular order) were Atlantic cod, silver hake, almost all of the sharks, winterskate, thorny skate, goosefish, white hake, bluefish, striped bass, weakfish, Atlantic bonito, little tunny, sea raven, Atlantichalibut, and summer flounder. Common fish and squid taken as prey included northern sand lance, hakes, herrings, macker-els, butterfish, anchovies, scup, flatfishes, sculpins, longfin inshore squid, and northern shortfin squid.
A variety of prey groups other than fish and squid were important food for different predators. For example,polychaetes (mostly spionids, nereids, and nephtyids) were important constituents of the diet of seven species. Decapodshrimp (e.g., Pandalus spp., Dichelopandalus leptocerus, and Crangon septemspinosa) and crabs (principally Cancer spp.,Pagurus spp., and Ovalipes spp.) were the main food of 17 species. Crustaceans other than decapod shrimp and crabs madeup a substantial portion of the stomach contents of 32 species, and included prey such as copepods, amphipods, euphausi-ids, mysids, and stomatopods. Other prey groups such as echinoderms, bivalve mollusks, cnidarians, and tunicates made upmost of the food of 37 predators. Eighteen predator species were diverse feeders and didn’t feed intensively on any one ofthe above-noted prey categories.

Page vi

viiPage
Taxonomic Index (common and scientific names) of Fish and Squid Species Sampled, Including for Each Species the Numberof Stomachs Examined, Percentage of Stomachs Found Empty, and Associated Appendix Table Number
____________________________________________________________________________________________________________
Stomachs AppendixCommon Name Scientific Name No. % Empty Table No.____________________________________________________________________________________________________________
CLASS CEPHALOPODA -- SQUIDSORDER TEUTHIDIDA
Northern shortfin squid Illex illecebrosus 2447 25.7 B-1a,bLongfin inshore squid Loligo pealeii 2498 26.8 B-2a,b
CLASS AGNATHA -- JAWLESS FISHESORDER MYXINIFORMES
Atlantic hagfish Myxine glutinosa 4 75.0 A-1CLASS CHONDRICHTHYES -- CARTILAGINOUS FISHES
ORDER LAMNIFORMESSand tiger Odontaspis taurus 8 0.0 A-1Bigeye thresher Alopias superciliosus 24 25.0 A-1Thresher shark A. vulpinus 19 36.8 A-1White shark Carcharodon carcharias 23 39.1 A-1Shortfin mako Isurus oxyrinchus 400 31.5 A-1Longfin mako I. paucus 10 40.0 A-1Porbeagle Lamna nasus 6 33.3 A-1Chain dogfish Scyliorhinus retifer 35 5.7 B-3Bignose shark Carcharhinus altimus 22 59.1 A-2Silky shark C. falciformis 54 66.7 A-2Dusky shark C. obscurus 53 18.9 B-4a,bSandbar shark C. plumbeus 7 57.1 A-2Night shark C. signatus 66 53.0 A-2Tiger shark Galeocerdo cuvier 52 23.1 A-2Smooth dogfish Mustelus canis 688 3.1 B-5a,bBlue shark Prionace glauca 1199 51.5 A-2Atlantic sharpnose shark Rhizoprionodon terraenovae 85 25.9 B-6a,bScalloped hammerhead Sphyrna lewini 2 0.0 A-2Smooth hammerhead S. zygaena 16 56.3 A-2
ORDER SQUALIFORMESSpiny dogfish Squalus acanthias 2662 47.8 B-7a,bAtlantic angel shark Squatina dumeril 58 10.3 B-8
ORDER RAJIFORMESAtlantic torpedo Torpedo nobiliana 7 42.9 A-3Clearnose skate Raja eglanteria 50 12.0 B-9Little skate R. erinacea 504 9.3 B-10a,bRosette skate R. garmani 16 6.3 A-3Barndoor skate R. laevis 3 0.0 A-3Winter skate R. ocellata 745 20.1 B-11a,bThorny skate R. radiata 269 9.7 B-12a,bSmooth skate R. senta 29 27.6 B-13Southern stingray Dasyatis americana 2 0.0 A-3Roughtail stingray D. centroura 4 0.0 A-3Bluntnose stingray D. say 26 15.4 B-14Spiny butterfly ray Gymnura altavela 8 50.0 A-3Bullnose ray Myliobatis freminvillei 15 13.3 A-3Cownose ray Rhinoptera bonasus 3 0.0 A-3
CLASS OSTEICHTHYES -- BONY FISHESORDER ANGUILLIFORMES
Margined snake eel Ophichthus cruentifer 3 0.0 A-3Slender snipe eel Nemichthys scolopaceus 1 0.0 A-4Conger eel Conger oceanicus 9 22.2 A-4
ORDER CLUPEIFORMESBlueback herring Alosa aestivalis 11 18.2 A-4Hickory shad A. mediocris 4 50.0 A-4Alewife A. pseudoharengus 240 11.7 B-15a,bAmerican shad A. sapidissima 21 0.0 A-4

Page viii
Taxonomic Index (cont.)____________________________________________________________________________________________________________
Stomachs AppendixCommon Name Scientific Name No. % Empty Table No.____________________________________________________________________________________________________________
Atlantic menhaden Brevoortia tyrannus 32 9.4 B-16Atlantic herring Clupea harengus 139 23.0 B-17a,bRound herring Etrumeus teres 98 15.3 B-18Atlantic thread herring Opisthonema oglinum 6 33.3 A-4Spanish sardine Sardinella aurita 8 0.0 A-4Striped anchovy Anchoa hepsetus 15 6.7 A-4
ORDER SALMONIFORMESAtlantic argentine Argentina silus 184 58.7 B-19Atlantic salmon Salmo salar 1 0.0 A-4
ORDER AULOPIFORMESShortnose greeneye Chlorophthalmus agassizi 6 0.0 A-5Inshore lizardfish Synodus foetens 2 50.0 A-5Offshore lizardfish Synodus poeyi 6 0.0 A-5Snakefish Trachinocephalus myops 3 66.7 A-5Longnose lancetfish Alepisaurus ferox 2 0.0 A-5
ORDER MYCTOPHIFORMESLanternfish uncl. Myctophidae 10 0.0 A-5NA Hygophum taaningi 9 0.0 A-5NA Maurolicus weitzmani 16 37.5 A-5
ORDER GADIFORMESCusk Brosme brosme 49 55.1 B-20Fourbeard rockling Enchelyopus cimbrius 7 14.3 A-5Atlantic cod Gadus morhua 718 4.6 B-21a,bHaddock Melanogrammus aeglefinus 950 2.3 B-22a,bOffshore hake Merluccius albidus 17 82.4 A-6Silver hake M. bilinearis 2263 28.4 B-23a,bPollock Pollachius virens 82 12.2 B-24a,bLongfin hake Urophycis chesteri 17 23.5 A-6Red hake U. chuss 1482 22.5 B-25a,bSpotted hake U. regia 47 12.8 B-26White hake U. tenuis 283 19.4 B-27a,bMarlin-spike Nezumia bairdi 10 11.1 A-6Longnose grenadier Coelorhynchus carminatus 18 0.0 A-6Grenadier uncl. Macrouridae 3 0.0 A-6Fawn cusk-eel Lepophidium profundorum 165 33.9 B-28a,bStriped cusk-eel Ophidion marginatum 2 0.0 A-6
ORDER BATRACHOIDIFORMESAtlantic midshipman Porichthys plectrodon 10 0.0 A-6
ORDER LOPHIIFORMESGoosefish Lophius americanus 872 53.6 B-29a,b
ORDER ATHERINIFORMESAtlantic needlefish Strongylura marina 5 80.0 A-6Atlantic saury Scomberesox saurus 30 6.7 A-7Silverside uncl. Menidia sp. 36 83.3 A-7
ORDER ZEIFORMESBuckler dory Zenopsis conchifera 5 40.0 A-7Deepbody boarfish Antigonia capros 5 0.0 A-7
ORDER GASTEROSTEIFORMESThreespine stickleback Gasterosteus aculeatus 1 0.0 A-7Red cornetfish Fistularia petimba 5 0.0 A-7Cornetfish uncl. Fistulariidae 1 0.0 A-7Longspine snipefish Macrorhamphosus scolopax 6 33.3 A-7Northern pipefish Syngnathus fuscus 38 65.0 B-30
ORDER SCORPAENIFORMESBlackbelly rosefish Helicolenus dactylopterus 80 31.3 B-31a,bAcadian redfish Sebastes fasciatus 266 57.1 B-32a,bScorpionfish uncl. Scorpaenidae 1 0.0 A-8

ixPage
Taxonomic Index (cont.)____________________________________________________________________________________________________________
Stomachs AppendixCommon Name Scientific Name No. % Empty Table No.____________________________________________________________________________________________________________
Armored searobin Peristedion miniatum 24 33.3 A-8Spiny searobin Prionotus alatus 1 0.0 A-8Northern searobin P. carolinus 41 19.5 B-33Striped searobin P. evolans 7 28.6 A-8Bluespotted searobin Prionotus roseus 1 0.0 A-8Searobin uncl. Triglidae 8 50.0 A-8Hookear sculpin uncl. Artediellus spp. 22 9.1 A-8Sea raven Hemitripterus americanus 146 45.2 B-34a,bLonghorn sculpin Myxocephalus octodecemspinosus 149 16.8 B-35a,bShorthorn sculpin M. scorpius 10 20.0 A-8Moustache sculpin Triglops murrayi 28 7.1 B-36Bigeye sculpin T. nybelini 21 28.6 A-8Alligatorfish Aspidophoroides monopterygius 24 20.8 A-9Lumpfish Cyclopterus lumpus 2 0.0 A-9Atlantic seasnail Liparis atlanticus 2 0.0 A-9
ORDER PERCIFORMESStriped bass Morone saxatilis 2 0.0 A-9Black sea bass Centropristis striata 680 28.7 B-37a,bSand perch Diplectrum formosum 3 33.3 A-9Red grouper Epinphelus mystacinus 1 0.0 A-9Scamp Mycteroperca phenax 3 33.3 A-9Bigeye Priacanthus arenatus 2 0.0 A-9Tilefish Lopholatilus chamaeleonticeps 9 33.3 A-10Bluefish Pomatomus saltatrix 568 27.3 B-38a,bCobia Rachycentron canadum 3 0.0 A-10Atlantic bumper Chloroscombrus chrysurus 5 20.0 A-10Round scad Decapterus punctatus 5 40.0 A-10Bigeye scad Selar crumenophthalmus 10 0.0 A-10Greater amberjack Seriola dumerili 3 0.0 A-10Banded rudderfish S. zonata 2 0.0 A-10Rough scad Trachurus lathami 11 0.0 A-10Vermilion snapper Rhomboplites aurorubens 10 10.0 A-10Tomtate Haemulon aurolineatum 23 39.1 A-11White grunt H. plumieri 14 21.4 A-11Pigfish Orthopristis chrysoptera 11 9.1 A-11Whitebone porgy Calamus leucosteus 11 81.8 A-11Spottail pinfish Diplodus holbrooki 6 16.7 A-11Pinfish Lagodon rhomboides 11 54.5 A-11Longspine porgy Stenotomus caprinus 72 45.8 B-39Scup S. chrysops 438 34.7 B-40a,bSilver perch Bairdiella chrysoura 5 80.0 A-11Weakfish Cynoscion regalis 393 19.8 B-41a,bBanded drum Larimus fasciatus 11 27.3 B-11Spot Leiostomus xanthurus 442 15.6 B-42a,bSouthern kingfish Menticirrhus americanus 88 20.5 B-43a,bNorthern kingfish M. saxatilis 78 6.4 B-44a,bAtlantic croaker Micropogonias undulatus 263 21.3 B-45Atlantic spadefish Chaetodipterus faber 1 0.0 A-11Hogfish Lachnolaimus maximus 1 0.0 A-12Tautog Tautoga onitis 2 33.3 A-12Cunner Tautogolabrus adspersus 54 46.3 B-46Ocean pout Macrozoarces americanus 94 22.3 B-47a,bAtlantic soft pout Melanostigma atlanticum 3 66.7 A-12Radiated shanny Ulvaria subbifurcata 6 16.7 A-12Wrymouth Cryptacanthodes maculatus 1 0.0 A-12Atlantic wolffish Anarhichas lupus 75 25.3 B-48a,bSouthern stargazer Astroscopus y-graecum 1 0.0 A-12

Page x
Taxonomic Index (cont.)____________________________________________________________________________________________________________
Stomachs AppendixCommon Name Scientific Name No. % Empty Table No.____________________________________________________________________________________________________________
Northern sand lance Ammodytes dubius 1353 29.0 B-49a,bAtlantic cutlassfish Trichiurus lepturus 11 0.0 A-12Little tunny Euthynnus alletteratus 1 0.0 A-12Atlantic bonito Sarda sarda 3 0.0 A-12Chub mackerel Scomber japonicus 25 4.0 A-13Atlantic mackerel S. scombrus 114 18.4 B-50a,bKing mackerel Scomberomorus cavalla 5 20.0 A-13Spanish mackerel S. maculatus 12 0.0 A-13Swordfish Xiphias gladius 171 9.9 A-13Harvestfish Peprilus alepidotus 2 0.0 A-13Butterfish P. triacanthus 852 20.2 B-51a,b
ORDER PLEURONECTIFORMESGulf Stream flounder Citharichthys arctifrons 224 28.1 B-52a,bSummer flounder Paralichthys dentatus 655 61.4 B-53a,bFourspot flounder P. oblongus 178 38.2 B-54a,bWindowpane Scophthalmus aquosus 1092 34.7 B-55a,bDusky flounder Syacium papillosum 1 0.0 A-13Witch flounder Glyptocephalus cynoglossus 130 16.2 B-56a,bAmerican plaice Hippoglossoides platessoides 300 49.0 B-57a,bAtlantic halibut Hippoglossus hippoglossus 125 27.2 B-58a,bWinter flounder Pseudopleuronectes americanus 1746 30.8 B-59a,bYellowtail flounder Limanda ferruginea 225 34.7 B-60a,b
ORDER TETRAODONTIFORMESPlanehead filefish Monacanthus hispidus 8 50.0 A-13
Fish Which Had Empty Stomachs for All Samples
Striated argentine Argentina striata 1 100.0 NAPolka-dot batfish Ogcocephalus radiatus 1 100.0 NASheepshead minnow Cyprinodon variegatus 1 100.0 NASeahorse uncl. Hippocampus sp. 1 100.0 NAHorned searobin Bellator militaris 1 100.0 NABighead searobin Prionotus tribulus 1 100.0 NAGag Mycteroperca microlepis 1 100.0 NAWolf eelpout Lycenchelys verrilli 1 100.0 NAGray triggerfish Balistes capriscus 2 100.0 NAStriped burrfish Chilomycterus schoepfi 1 100.0 NA
____________________________________________________________________________________________________________

xiPage
Alphabetic Index (common names) of Fish and Squid Species Sampled, Including for Each Speciesthe Geographic Areas Where Collected, Types of Data Listed, and Associated Appendix Table Number
[Area-collected codes are: 1 - Middle Atlantic, 2 - Southern New England, 3 - Georges Bank, 4 - Gulf of Maine, 5 - Scotian Shelf, 6 - offshoresouth of Cape Hatteras, 7 - inshore south of Cape Hatteras, 8- inshore north of Cape Hatteras, and 9 - Northwest Atlantic (for large pelagic fish).Data-type codes are: T - overall listing of prey, L - listing of prey according to predator length, and A - listing of prey according to geographicarea.]____________________________________________________________________________________________________________
AppendixCommon Name Area(s) Collected Data Types Table No.____________________________________________________________________________________________________________
Acadian redfish 3 4 5 T L A B-32a,bAlewife 1 2 3 4 5 8 T L A B-15a,bAlligatorfish 4 T A-9American plaice 3 4 5 8 T L A B-57a,bAmerican shad 1 2 4 8 T A-4Armored searobin 1 2 T A-8Atlantic angel shark 1 6 8 T L B-8Atlantic argentine 4 5 T L B-19Atlantic bonito 2 T A-12Atlantic bumper 7 T A-10Atlantic cod 1 2 3 4 5 8 T L A B-21a,bAtlantic croaker 1 2 6 7 8 T L B-45Atlantic cutlassfish 7 T A-12Atlantic hagfish 4 T A-1Atlantic halibut 3 4 5 8 T L A B-58a,bAtlantic herring 3 4 5 6 8 T L A B-17a,bAtlantic mackerel 2 3 4 5 8 T L A B-50a,bAtlantic menhaden 7 8 T L B-16Atlantic midshipman 7 T A-6Atlantic needlefish 4 5 T A-6Atlantic salmon 4 T A-4Atlantic saury 3 T A-7Atlantic seasnail 3 T A-9Atlantic sharpnose shark 6 7 8 T L A B-6a,bAtlantic soft pout 4 T A-12Atlantic spadefish 7 T A-11Atlantic thread herring 7 T A-4Atlantic torpedo 1 2 3 6 T A-3Atlantic wolffish 2 3 4 5 8 T L A B-48a,bBanded drum 7 T A-11Banded rudderfish 8 T A-10Barndoor skate 3 5 T A-3Bigeye 7 T A-9Bigeye scad 1 T A-10Bigeye sculpin 3 T A-8Bigeye thresher 9 T A-1Bignose shark 9 T A-2Black sea bass 1 2 3 6 7 8 T L A B-37a,bBlackbelly rosefish 1 2 3 4 T L A B-31a,bBlue shark 9 T A-2Blueback herring 1 5 T A-4Bluefish 1 2 3 6 7 8 T L A B-38a,bBluespotted searobin 6 T A-8Bluntnose stingray 1 6 7 8 T L B-14Buckler dory 1 T A-7Bullnose ray 6 7 8 T A-3Butterfish 1 2 3 6 7 8 T L A B-51a,bChain dogfish 1 2 T L B-3Chub mackerel 7 8 T A-13Clearnose skate 1 6 7 8 T L B-9Cobia 6 T A-10

Page xii
Alphabetic Index (cont.)____________________________________________________________________________________________________________
AppendixCommon Name Area(s) Collected Data Types Table No.____________________________________________________________________________________________________________
Conger eel 1 2 3 T A-4Cornetfish uncl. 7 T A-7Cownose ray 8 T A-3Cunner 2 3 8 T L B-46Cusk 3 4 5 T L B-20Deepbody boarfish 1 T A-7Dusky flounder 6 T A-13Dusky shark 1 6 7 8 T L A B-4a,bFawn cusk-eel 1 2 3 8 T L A B-28a,bFourbeard rockling 4 T A-5Fourspot flounder 1 2 3 T L A B-54a,bGoosefish 1 2 3 4 5 7 8 T L A B-29a,bGreater amberjack 6 T A-10Grenadier uncl. 2 T A-6Gulf Stream flounder 1 2 3 T L A B-52a,bHaddock 1 2 3 4 5 8 T L A B-22a,bHarvestfish 7 T A-13Hickory shad 2 T A-4Hogfish 6 T A-12Hookear sculpin uncl. 4 5 T A-8Hygophum taaningi 1 T A-5Inshore lizardfish 6 8 T A-5King mackerel 6 8 T A-13Lanternfish uncl. 1 T A-5Little skate 1 2 3 8 T L A B-10a,bLittle tunny 6 T A-12Longfin inshore squid 1 2 3 4 5 6 7 8 T L A B-2a,bLongfin hake 1 2 4 5 T A-6Longfin mako 9 T A-1Longhorn sculpin 2 3 4 5 T L A B-35a,bLongnose grenadier 1 2 T A-6Longnose lancetfish 9 T A-5Longspine porgy 1 7 8 T L B-39Longspine snipefish 1 T A-7Lumpfish 8 T A-9Margined snake eel 2 T A-3Marlin-spike 4 T A-6Maurolicus weitzmani 4 T A-5Moustache sculpin 3 5 T L B-36Night shark 1 9 T A-2Northern kingfish 6 7 8 T L A B-44a,bNorthern pipefish 8 T L B-30Northern sand lance 1 2 3 4 8 T L A B-49a,bNorthern searobin 1 2 3 8 T L B-33Northern shortfin squid 1 2 3 4 5 8 T L A B-1a,bOcean pout 2 3 4 5 8 T L A B-47a,bOffshore hake 1 3 T A-6Offshore lizardfish 6 T A-5Pigfish 7 T A-11Pinfish 7 T A-11Planehead filefish 7 8 T A-13Pollock 3 4 5 8 T L A B-24a,bPorbeagle 9 T A-1Radiated shanny 4 5 T A-12Red cornetfish 6 T A-7Red grouper 1 T A-9Red hake 1 2 3 4 5 8 T L A B-25a,b

xiiiPage
Alphabetic Index (cont.)____________________________________________________________________________________________________________
AppendixCommon Name Area(s) Collected Data Types Table No.____________________________________________________________________________________________________________
Rosette skate 1 T A-3Rough scad 7 8 T A-10Roughtail stingray 1 8 T A-3Round herring 1 2 7 8 T L B-18Round scad 7 T A-10Sand perch 6 7 T A-9Sand tiger 7 8 9 T A-1Sandbar shark 1 6 7 8 T A-2Scalloped hammerhead 7 9 T A-2Scamp 6 7 T A-9Scorpionfish uncl. 7 T A-8Scup 1 2 6 7 8 T L A B-40a,bSea raven 2 3 4 5 8 T L A B-34a,bSearobin uncl. 6 T A-8Shortfin mako 2 9 T A-1Shorthorn sculpin 5 T A-8Shortnose greeneye 3 T A-5Silky shark 9 T A-2Silver hake 1 2 3 4 5 8 T L A B-23a,bSilver perch 7 T A-11Silverside uncl. 2 T A-7Slender snipe eel 2 T A-4Smooth dogfish 1 2 7 8 T L A B-5a,bSmooth hammerhead 7 9 T A-2Smooth skate 3 4 T L B-13Snakefish 6 T A-5Southern kingfish 7 8 T L A B-43a,bSouthern stargazer 7 T A-12Southern stingray 6 T A-3Spanish mackerel 7 8 T A-13Spanish sardine 7 T A-4Spiny butterfly ray 6 8 T A-3Spiny dogfish 1 2 3 4 5 7 8 T L A B-7a,bSpiny searobin 6 T A-8Spot 1 7 8 T L A B-42a,bSpottail pinfish 7 T A-11Spotted hake 1 2 8 T L B-26Striped anchovy 8 T A-4Striped bass 8 T A-9Striped cusk-eel 8 T A-6Striped searobin 1 8 T A-8Summer flounder 1 2 3 4 6 7 8 T L A B-53a,bSwordfish 9 T A-13Tautog 7 T A-12Thorny skate 3 4 5 8 T L A B-12a,bThreespine stickleback 8 T A-7Thresher shark 9 T A-1Tiger shark 9 T A-2Tilefish 2 T A-10Tomtate 6 7 T A-11Vermilion snapper 7 T A-10Weakfish 1 2 7 8 T L A B-41a,bWhite grunt 6 7 T A-11White hake 2 3 4 5 8 T L A B-27a,bWhite shark 9 T A-1Whitebone porgy 7 T A-11

Page xiv
Alphabetic Index (cont.)____________________________________________________________________________________________________________
AppendixCommon Name Area(s) Collected Data Types Table No.____________________________________________________________________________________________________________
Windowpane 1 2 3 7 8 T L A B-55a,bWinter flounder 1 2 3 4 5 8 T L A B-59a,bWinter skate 2 3 4 8 T L A B-11a,bWitch flounder 3 4 5 8 T L A B-56a,bWrymouth 4 T A-12Yellowtail flounder 2 3 8 T L A B-60a,b____________________________________________________________________________________________________________

1Page
INTRODUCTION
Trophic structure of fish assemblages on the continen-tal shelf from New England to Cape Hatteras, North Caro-lina, has been examined by the Northeast Fisheries ScienceCenter (NEFSC) in several large-scale dietary studies. Paststudies have described food-web structure and trophic in-teractions among Northwest Atlantic fishes. For the 1969-72 study period, see Maurer and Bowman (1975) andLangton and Bowman (1980, 1981); for the 1973-76 period,see Edwards and Bowman (1979) and Bowman and Michaels(1984). Also see Cohen et al. (1982), Sissenwine (1984), andSherman (1986).
Understanding trophic interrelationships among themajority of fish species within an ecosystem is necessaryto define more precisely the role that predation plays indetermining ecosystem structure and the possible long-termeffects of various fisheries exploitation regimes. The pri-mary purpose of this report is to provide basic diet compo-sition data on fishes and two species of squids commonlycaught in the Northeast Continental Shelf Ecosystem.
Diet data for some of the species covered in this reportare scant or nonexistent in the published literature. Thisreport’s data expand on existing diet data for major fish andsquid species sampled during the 1969-72 and 1973-76 studyperiods, and cover the broader geographic area from NovaScotia to Cape Fear, North Carolina, including inshore areaswhere bottom depth ranges from 8 to 27 m. Previous stud-ies only covered the area from Nova Scotia to Cape Hatterasin water depths of 27-366 m. The majority of data presentedhere represent the last of a series of quantitative stomachcontent collections initiated in 1973.
Detailed stomach content data, based on percentagecomposition by weight or volume, are presented for indi-vidual predator species. Also, we identify six major func-tional prey groups based on the predators’ stomach con-tents.
METHODS AND MATERIALS
Specimens sampled for stomach content analysis wereprimarily collected during NEFSC bottom trawl surveycruises conducted during the spring, summer, autumn, andwinter from 1977 to 1980. Stratified random sampling wasconducted in continental shelf waters from Nova Scotia toCape Fear, North Carolina and sampling occurred 24 hr/day.Tows were 30 min in duration at a vessel speed of 6.5 km/hr,usually in the direction of the next sampling station. Bot-tom depths sampled ranged from 8 to 366 m. The 27-mdepth contour (along the coast) delineates inshore versusoffshore sampling areas of the NEFSC. Eight general areassurveyed by the NEFSC are depicted in Figure 1. Theyinclude the six traditional offshore areas -- offshore southof Cape Hatteras, Middle Atlantic, Southern New England,Georges Bank, Gulf of Maine, and Scotian Shelf -- along
with two inshore areas -- inshore south of Cape Hatterasand inshore north of Cape Hatteras.
Stomach content samples taken during bottom trawlsurvey cruises were based on three criteria as follows: 1)offshore species of particular interest to investigators atthe NEFSC for a variety of reasons (e.g., species making upthe majority of commercial catches or species known toconsume primarily fish), 2) species making up the majorityof catches (by weight) in inshore areas (hitherto notsampled), and 3) species for which dietary information wasscant or nonexistent. Survey technicians sampled speciesfirst for criterion no. 1 if the station was offshore, or forcriterion no. 2 if the station was inshore. Other sampleswere taken when time permitted. Samples generally repre-sented the length frequency of each species caught.
Stomachs of large fish or squid were excised aboardship, individually wrapped in gauze with a label denotingvessel, cruise, station, species, specimen size (i.e., fork lengthwhen applicable, otherwise total length, disk width for rays,or mantle length for squid), sex, and maturity, and preservedin a 3.7% formaldehyde solution (Formalin and sea water)by volume. Small fish and squid were preserved whole.
The preserved stomachs were individually opened inthe laboratory and their contents emptied onto a 0.25-mm-mesh-opening screen sieve to permit washing away the form-aldehyde without the loss of any food items. The stomachcontents were sorted, identified, counted, and damp driedon absorbent paper. Major prey items and commonly oc-curring but relatively minor prey, in terms of weight, wereidentified to species whenever practical. The wet weight ofall stomach content groups was determined to the nearest0.001 g, and all data recorded. A stomach was consideredempty when no material was found in the stomach, or whenthe material found in the stomach both could not be identi-fied and weighed less than 0.001 g.
We also provide information on the food of large pe-lagic species. These samples were gathered from varioussources during 1963-84. Stomach content samples of apexpredators, including large sharks and tunas, and other largespecies (i.e., >100 cm) were mostly collected from fish caughtby rod and reel, or by longline during research vessel cruises.Some samples were collected from fish caught during fish-ing tournaments over the years. The sampling area cov-ered continental shelf waters from Florida to the GrandBanks (southeast of Newfoundland).
As noted earlier, stomach content data associated withthe 1977-80 period of bottom trawl survey cruises were mea-sured as percentage composition by wet weight. Data as-sociated with the 1963-66 period were measured as percent-age composition by occurrence. Data associated with the1969-72 period are based on samples first being groupedaccording to fish length, then being measured as percent-age composition by wet weight. Stomach content data pre-sented for apex predators are based on percentage compo-sition by volume.
No statistical weighting (e.g., length frequency, samplesize, population size, or species distribution) was applied to
Page 2
any stomach content data. Sources of potential bias orvariation in the data include age/size, sex, maturity stage,and various sampling factors (i.e., time of day, season, year,area, and bottom depth and temperature). Accordingly, di-etary listings should be considered only as broad summa-ries. Some items listed as stomach contents are parasites(e.g., trematodes, cestodes, and nematodes), some of whichmay have been ingested by the predator when it ate otherparasitized organisms. Similarly, some items identified inthe stomachs may have originated from the stomachs offish prey and were not directly consumed by a particularpredator.
Life history and distribution data for many economi-cally important species (e.g., Atlantic cod, haddock, silverhake, and Atlantic herring) may be found in Grosslein andAzarovitz (1982). Details of stomach content sampling pro-cedures and data processing methods utilized by the NEFSCare given in Langton et al. (1980). All common and scien-tific names of fishes and invertebrates (both predator andprey), whenever possible, are according to Robins et al.(1991) for fishes except pleuronectids, Cooper and Chapleau(1998) for pleuronectid fishes, Turgeon et al. (1988) formollusks except loliginids, Turgeon et al. (1998) for loliginidmollusks, Williams et al. (1989) for decapod crustaceans,Cairns et al. (1991) for cnidarians and ctenophores, andeither Gosner (1971) or Barnes (1987) for other invertebrates.
RESULTS AND OBSERVATIONS
Detailed diet data for each predator species are given intabular form in Appendices A and B. In the appendix tables,diet composition is expressed as the percentage by weightthat each stomach content group makes up of the total stom-ach contents for each predator species (except in a fewcases, which are noted in the tables, where percentage byvolume or occurrence is given because a different measure-ment method was utilized during the particular study fromwhich those data were taken). Percentage subtotals forphyla and other major taxonomic groups are shown in brack-ets; subtotals for minor groups within major groups are inparentheses. The number sampled, number empty, meanstomach content by weight or volume, and mean predatorlength are provided at the bottom of each table.
The stomach contents of 31,567 individual predators,representing 178 species of fish and 2 common species ofsquid were examined. The total number of each speciesexamined and the percentage empty are listed in the earlier-presented taxonomic index. The area(s) in which sampleswere collected and the type(s) of data which are presentedfor each species are given in the earlier-presented alpha-betic index. All stomachs of 10 species collected were empty;they are listed at the end of the taxonomic index.
OVERALL PREY
A summary of the stomach content data for the 170species with food in their stomachs is provided in Table 1.(Also refer to Appendices A and B for a detailed listing ofprey.) The functional prey groups (i.e., fish, squid, poly-chaete, decapod crustacean, other crustacean, and all other)noted immediately below and listed in Table 1 collectivelymade up at least 50% by weight (or volume) of the stomachcontents of the predators indicated.
Fish and/or squid made up the majority of the stomachcontents of 59 species. Identified fish prey, for the mostpart, were northern sand lance, silver hake, other hakes,herrings, mackerels, butterfish, anchovies, scup, flatfishes,and sculpins. Squid prey were primarily longfin inshoreand northern shortfin squids. Polychaetes (mostly spionids,nereids, and nephtyids) were important constituents of thediet of seven species. Decapod shrimp (mainly Pandalusspp., Dichelopandalus leptocerus, and Crangonseptemspinosa) and crabs (principally Cancer spp., Pagurusspp., and Ovalipes spp.) were the principal food of 17 preda-tors. Crustaceans other than decapods made up a substan-tial portion of the stomach contents of 32 species, and in-cluded prey such as copepods, amphipods, mysids, andeuphausiids. Note, however, that some of the unidentifiedcrustacean matter included here may have been decapodremains). The “all other” group (i.e., stomach contents otherthan the groups noted above) is primarily made up of somecombination of bivalve mollusks, gastropods, echinoderms,cnidarians, urochordates, sand, or unidentified material. Thisgroup made up most of the stomach contents of 37 species.Eighteen predator species were diverse feeders and didn’tfeed predominantly on any one of the above functionalprey groups.
PREY ACCORDING TO PREDATOR LENGTH
Different diet compositions for fish in different lengthranges are observed for 60 species (Appendix B). Gener-ally, fish 20 cm long tended to eat some combination oforganisms such as chaetognaths, copepods, amphipods,mysids, polychaetes, and small decapod shrimp. Fish >20cm long (e.g., little skate, Atlantic cod, silver hake, pollock,and white hake) consumed mostly fish, squid, decapodshrimp, and/or crabs.
Exceptions to this pattern are seen in three groups ofpredators. The first group are those species which fedintensively on fish and/or squid for most of their life. Preda-tors in this group included, in part, northern shortfin andlongfin inshore squids, most of the sharks (e.g., dusky shark,sharpnose shark, and spiny dogfish), goosefish, and blue-fish.

3Page
The second group are those predators which ate prima-rily planktonic organisms (e.g., chaetognaths, copepods,pelagic amphipods, mysids, euphausiids, and/or salps).Most of the herrings, Atlantic argentine, northern sand lance,Atlantic mackerel, Acadian redfish, and butterfish are amongthe fishes included in this group.
The third group of fishes preyed almost totally on somecombination of small benthic crustaceans (mostly amphi-pods), echinoderms, cnidarians, and polychaetes. Speciessuch as haddock, Gulf Stream flounder, witch flounder,American plaice, yellowtail flounder, and winter flounderare among the predators in this group.
PREY ACCORDING TO GEOGRAPHIC AREA
A qualitative and quantitative understanding of preda-tion on fish by fish (i.e., natural mortality, in part) is criti-cally important for development of multispecies fisherymodels. The percentage of fish in the diet of all piscivoressampled from at least two geographic areas, in sufficientnumbers for analysis (about 20 fish per area), during bot-tom trawl surveys from 1977 to 1980 are presented in Table2. Excluding apex predators, the listed species representthe majority of the demersal fish and squid biomass withinthe entire study area.
Spotted hake, which is not listed in Table 2, is a domi-nant piscivore in the Middle Atlantic, but too few weresampled during the 1977-80 period to warrant inclusion.However, during the 1973-76 period in the Middle Atlantic,15.9% and 36.9% of their food was fish and squid, respec-tively (Bowman and Michaels 1984).
Many large apex predators which fed primarily on fishand/or squid (e.g., blue shark, thresher shark, and sword-fish) are migratory. They occur in the survey area onlyduring certain periods of the year. Their predatory impacton fish and squid populations during these periods shouldnot be overlooked.
Information on how functional prey groups such asfish, squid, polychaetes, decapods, other crustaceans, andother organisms are partitioned by predators within thestudy area is given in Tables 2-7. (See also Appendix B.)For each functional prey group, the principal predatorswhich utilize that group as food are discussed, by area, inthe following sections.
Fish
Overall, northern sand lance was the primary fish preyin almost all geographic areas during the study period. (SeeTable 2 and the detailed prey listings in Appendix B.) In theMiddle Atlantic, northern sand lance was an important food(>10% of all food by weight) of little skate, silver hake, red
hake, summer flounder, and windowpane. Other notablefish prey in the Middle Atlantic were silver hake (consumedby silver hake, fourspot flounder, and windowpane), her-rings (eaten by spiny dogfish, summer flounder, and blue-fish), and scup (prey of smooth dogfish and black sea bass).
Southern New England piscivores which ate northernsand lance include, in part, smooth dogfish, winter skate,silver hake, Atlantic cod, summer flounder, windowpane,and yellowtail flounder. In this area, silver hake were preyof fourspot flounder, silver hake, and goosefish. Atlanticcod were identified as prey of Atlantic cod and fourspotflounder. Unidentified gadids were found in the stomachsof spiny dogfish, white hake, red hake, and Gulf Streamflounder. Herrings were the prey of spiny dogfish and sum-mer flounder. One of the few instances of predation onspiny dogfish (i.e., by Atlantic cod) was observed in thisarea.
Georges Bank predators fed on a wide assortment offish prey. Major fish prey were northern sand lance (eatenby winter skate, thorny skate, Atlantic cod, pollock, redhake, summer flounder, winter flounder, windowpane, blue-fish, and longhorn sculpin), herrings (consumed by spinydogfish, thorny skate, silver hake, and bluefish), variousgadids (found in the stomachs of spiny dogfish, white hake,red hake, Atlantic halibut, bluefish, sea raven, andgoosefish, with Atlantic cod and haddock specifically be-ing identified as food of Atlantic halibut and goosefish,respectively), and longhorn sculpin (prey of little skate,Atlantic halibut, bluefish, and goosefish).
Gulf of Maine predators ate primarily northern sand lance(food of spiny dogfish, winter skate, silver hake, haddock,red hake, and Atlantic halibut), silver hake (prey of silverhake, Atlantic cod, white hake, red hake, Atlantic halibut,Acadian redfish, sea raven, and goosefish), and herrings(found in the stomachs of thorny skate, silver hake, Atlan-tic cod, Atlantic halibut, and goosefish). Haddock waspreyed on by goosefish.
Scotian Shelf fishes ate northern sand lance (prey ofred hake), mackerel (eaten by spiny dogfish and silver hake),herrings (food of silver hake), silver hake (preyed upon bysilver hake, white hake, and red hake), haddock (identifiedin the stomachs of red hake and goosefish), unidentifiedgadids (a portion of the diet of Atlantic halibut andgoosefish), and longhorn sculpin (found in the stomachsof goosefish).
Inshore north of Cape Hatteras (i.e., Cape Hatteras toNova Scotia), fish prey were northern sand lance (>10% ofthe food of winter skate, silver hake, Atlantic cod, pollock,summer flounder, black sea bass, and scup), herrings (con-sumed by Atlantic sharpnose shark, spiny dogfish, thornyskate, Atlantic cod, Atlantic halibut, summer flounder, blue-fish, weakfish, and goosefish), mackerel (eaten by duskyshark), silver hake (a food of silver hake, red hake, Atlantichalibut, and windowpane), butterfish (prey of smooth dog-

Page 4
fish and bluefish), and anchovies (preyed upon by Atlanticsharpnose shark, black sea bass, weakfish, northern king-fish, and windowpane).
South of Cape Hatteras (including inshore and offshoreareas from Cape Hatteras to Cape Fear), fish prey were al-most exclusively anchovies (food of Atlantic sharpnoseshark, dusky shark, summer flounder, bluefish, black seabass, weakfish, southern kingfish, northern kingfish, andspot) and herrings (consumed by Atlantic sharpnose shark,bluefish, black sea bass, and weakfish).
Squid
Longfin inshore and northern shortfin squids were theprincipal squid species identified as prey within all areassampled except the Middle Atlantic (Appendix B). In theMiddle Atlantic, only longfin inshore squid was found tobe a major squid prey, although it didn’t make up >50% ofthe stomach contents of a single species.
Table 3 shows that several species fed intensively onsquid (i.e., the stomachs of all predators noted immediatelybelow contained on average >50% squid by weight). Forexample, the diet of summer flounder and bluefish sampledin Southern New England was mostly squid. On GeorgesBank, squid was an important prey of bluefish and fourspotflounder. In Scotian Shelf waters, predation on squid wasnoted by pollock and northern shortfin squid. Goosefishwas identified as having >50% squid in the diet for theinshore area north of Cape Hatteras. No predators wereobserved with >50% squid in their diet for the area south ofCape Hatteras.
Polychaetes
Polychaetes were an important food source (i.e., >50%of stomach contents by weight) for relatively few species,but they were taken as prey in all areas sampled (Table 4and Appendix B). Taxonomic groups making up the major-ity of the polychaete prey were nephtyids, nereids,lumbrinerids, flabelligerids, spionids, and ampharetids.
Species in the Middle Atlantic whose main prey waspolychaetes are winter flounder, Gulf Stream flounder, andscup. In Southern New England, polychaetes didn’t makeup >50% of the stomach contents of any predator exam-ined. However, the stomachs of haddock, winter flounder,and Gulf Stream flounder all contained >40%. On GeorgesBank, yellowtail and witch flounders were identified as twospecies which fed intensively (i.e., >50%) on polychaetes.Of all species examined from the Gulf of Maine and ScotianShelf, only witch flounder stomachs contained >50% poly-chaetes (in both areas). The inshore area north of CapeHatteras yielded the most predator species (i.e., 10) with>10% by weight of polychaetes in their stomachs, but thestomachs of only two species, witch flounder and spot,
contained >50%. Not a single species examined from wa-ters south of Cape Hatteras had stomachs containing >50%polychaetes, and only scup stomachs contained >10%.
Decapod Crustaceans
Relatively few species made up the majority of decapodcrustacean prey throughout the entire survey area, but thosespecies were an important food source for many predators(Table 5 and Appendix B). For example, decapods accountedfor >50% of the stomach contents of dusky shark, smoothdogfish, and blackbelly rosefish in the Middle Atlantic, andfor >50% of the stomach contents of smooth dogfish, win-dowpane, northern kingfish, and southern kingfish in wa-ters south of Cape Hatteras.
In the Middle Atlantic and in waters south of CapeHatteras, Crangon septemspinosa, portunids (e.g., Ovalipesocellatus), Cancer irroratus, and Munida spp. were impor-tant decapod prey.
Four predators examined from the Southern New En-gland area (i.e., smooth dogfish, black sea bass, longhornsculpin, and sea raven) fed intensively on decapods. Inthis area, for all predators which ate decapods, the mostimportant prey were C. irroratus, C. borealis, Crangonseptemspinosa, and Dichelopandalus leptocerus.
On Georges Bank, the same species of prey as noted forSouthern New England were also principal food, along withHyas spp. and Pagurus spp. Only the stomachs of long-horn sculpin and sea raven sampled on Georges Bank con-tained >50% decapods.
The largest portion of the decapods consumed in theGulf of Maine was made up of a combination of Cancerborealis, Hyas spp., Pandalus borealis, and D. leptocerus.Predators in this area with >50% decapod prey wereblackbelly rosefish and longhorn sculpin.
In Scotian Shelf waters, decapods such as C. irroratus,Pasiphaea spp., Crangon septemspinosa, and D. leptoceruswere the most important prey. The stomach contents ofboth sea raven and longhorn sculpin contained >50% de-capods. Also worthy of mention is Atlantic halibut with49.6% decapods.
Fish from the inshore area north of Cape Hatteras fedprincipally on Cancer irroratus, O. ocellatus, Crangonseptemspinosa, and D. leptocerus. Predators in the inshorearea with >50% decapod prey were smooth dogfish andblack sea bass.
Crustaceans Other than Decapods
Five taxonomic groups accounted for the majority ofcrustacean prey other than decapods. Three of these (i.e.,copepods, amphipods, and euphausiids) were an importantfood in all geographic areas sampled (i.e., either individu-ally or in some combination they made up >50% of the diet

5Page
by weight of several predators). The other two groups,mysids and stomatopods, were important prey in only fourof the seven areas sampled (Table 6 and Appendix B).Mysids were important as a food source in the Middle At-lantic, Southern New England, inshore north of CapeHatteras, and on Georges Bank. Stomatopods were majorprey of several predators in the Middle Atlantic, SouthernNew England, inshore north of Cape Hatteras, and south ofCape Hatteras.
In the Middle Atlantic, crustaceans other than deca-pods made up >50% of the diet of alewife, haddock (onlyone fish was examined), and northern sand lance. SouthernNew England fishes which fed intensively on one or moreof the nondecapod crustacean groups noted earlier in thissection are alewife, yellowtail flounder, Atlantic mackerel,northern sand lance, and ocean pout. Predators identifiedfor Georges Bank were alewife, Atlantic mackerel, black seabass, Acadian redfish, and northern sand lance. In the Gulfof Maine, seven predators fed for the most part only onnondecapod crustaceans: Atlantic herring, alewife, Atlan-tic mackerel, summer flounder, Acadian redfish, northernsand lance, and longfin inshore squid). Within the ScotianShelf area, the stomachs of Atlantic herring, alewife, Atlan-tic mackerel, Acadian redfish, and ocean pout all contained>90% by weight of crustaceans other than decapods. Pre-dation on these crustaceans inshore north of Cape Hatteraswas most important to species such as alewife, Atlanticmackerel, northern sand lance, fawn cusk-eel, and window-pane. None of the species examined from waters south ofCape Hatteras had stomachs containing >50% nondecapodcrustaceans.
Other Prey
Major stomach content categories such as echinoderms,gastropods, bivalve mollusks, chaetognaths, cnidarians,nemerteans (i.e., rhynchocoels), tunicates, animal remains,and sand made up the majority (either individually or insome combination) of what is found in the stomachs of 32predators (Table 7). Of these categories, only those whichindividually made up >50% of the stomach contents byweight of a predator within a particular area are noted in theremainder of this section (excluding animal remains andsand).
None of these prey categories totaled >50% of the stom-ach contents of any predator in the Middle Atlantic orSouthern New England. On Georges Bank, Atlantic herringfed intensively on chaetognaths, American plaice ate (forthe most part) only echinoderms (92.3%), and Atlantic wolf-fish consumed bivalve mollusks. In the Gulf of Maine, echi-noderms were an important food of haddock and oceanpout. Only one predator each within the Scotian Shelf,inshore area north of Cape Hatteras, and area south of Cape
Hatteras fed primarily on any prey category considered here(i.e., winter flounder eating cnidarians, ocean pout consum-ing echinoderms, and butterfish preying on tunicates, re-spectively).
OBSERVATIONS
Scientists at the NEFSC’s Woods Hole Laboratory haveconducted broadscale dietary studies of fishes sampledduring bottom trawl surveys since 1963. Dietary data pre-sented here, which are largely based on samples from the1977-80 portion of the survey series, corroborate earlier re-ports that relatively few species account for a substantialportion of the food of Northwest Atlantic continental shelffishes and squids [Edwards and Bowman (1979), Bowmanand Michaels (1984), Bowman et al. (1984), Maurer andBowman (1985)]. The abundances of some species identi-fied as critical prey are known to fluctuate among seasonsand years based on indices generated by these surveys.During 1977-80 (i.e., this study’s period, in part), when thesurvey indices rose for northern sand lance, we simulta-neously found sand lance to be a major prey item.
This report summarizes much dietary information intovarious predator/prey groups, but that information doesnot take into account predator/prey population sizes, orspatial/temporal aspects, of predation (i.e., overlap of preda-tor and prey populations). Before the impact of predationon a population can be determined, these factors must beconsidered.
A complete list of all stomach contents for all predatorspecies in this report can be obtained from the Food ChainDynamics Investigation at the NEFSC.
ACKNOWLEDGMENTS
Personnel of the NEFSC’s Food Chain Dynamics In-vestigation contributing to the compilation of this report,listed alphabetically, were: John Hauser, Brian Hayden,Richard Langton, Lisa Lierheimer, Donald Mack, RonaldMack, Scott McNamara, Thomas Morris, Jacqueline Murray,James Myette, Stephen Spina, Andrea Swiecicki, and LynnWhiteley. Eleanore Beale, Elke Bergholz-Nelson, EdwardBrown-Ledger, Caroline Karp, Lisa Urry, and numerous sum-mer students and survey technicians helped to collect andanalyze stomach contents. Members of the NEFSC’s ApexPredators Ecology Investigation deserving special thanksfor processing stomach contents and providing data sum-maries are John Casey, Nancy Kohler, and Robert Medved.Jon Gibson, Michael Fogarty, and Russell Brown provideduseful suggestions on the organization and content of themanuscript.

Page 6
REFERENCES CITED
Barnes, R.D. 1987. Invertebrate zoology. 5th ed. Orlando, FL:Harcourt Brace Jovanovich College Publ.; 893 p.
Bowman, R.[E.]; Eppi, R.; Grosslein, M.[D.] 1984. Diet andconsumption of spiny dogfish in the Northwest Atlantic.ICES (Int. Counc. Explor. Sea) C.M. 1984/G:27; 8 p. Avail-able from: International Council for the Exploration of theSea, Palægade 2-4, DK-1261 Copenhagen K, Denmark.
Bowman, R.E.; Michaels, W.L. 1984. Food of seventeen spe-cies of Northwest Atlantic fish. NOAA (Natl. Ocean. Atmos.Admin.) Tech. Memo. NMFS-F/NEC-28; 183 p. Availablefrom: National Technical Information Service, 5285 PortRoyal Rd., Springfield, VA 22161 (NTIS Access. No. PB89-219195).
Cairns, S.D. (Chairman); Calder, D.R.; Brinckmann-Voss, A.;Castro, C.B.; Pugh, P.R.; Cutress, C.E.; Japp, W.J.; Fautin,D.G.; Larson, R.J.; Harbison, G.R.; Arai, M.N.; Opresko,D.M. 1991. Common and scientific names of aquaticinvertebrates from the United States and Canada: Cnidariaand Ctenophora. Am. Fish. Soc. Spec. Publ. 22; 75 p.
Cohen, E.; Grosslein, M.[D.]; Sissenwine, M.[P.]; Steimle, F.;Wright, W. 1982. Energy budget of Georges Bank. In:Mercer, M.C., ed. Multispecies approaches to fisheriesmanagement advice. Can. Spec. Publ. Fish. Aquat. Sci.59:95-107.
Cooper, J.A.; Chapleau, F. 1998. Monophyly and interrela-tionships of the family Pleuronectidae(Pleuronectiformes), with a revised classification. Fish.Bull. (U.S.) 96:686-726.
Edwards, R.L.; Bowman R.E. 1979. Food consumed by conti-nental shelf fishes. In: Predator-prey systems in fish com-munities and their role in fisheries management. Wash-ington, DC: Sports Fishing Institute; p. 387-406.
Gosner, K.L. 1971. Guide to identification of marine and estua-rine invertebrates. New York, NY: John Wiley and Sons;693 p.
Grosslein, M.D.; Azarovitz, T.R. 1982. Fish distribution. MESA(Mar. Ecosyst. Anal.) N.Y. Bight Atlas Monogr. 15. Al-bany, NY: New York Sea Grant Institute; 182 p.
Langton, R.W.; Bowman, R.E. 1980. Food of fifteen NorthwestAtlantic gadiform fishes. NOAA (Natl. Ocean. Atmos.Admin.) Tech. Rep. NMFS SSRF-740; 23 p.
Langton, R.W.; Bowman, R.E. 1981. Food of eight NorthwestAtlantic pleuronectiform fishes. NOAA (Natl. Ocean.Atmos. Admin.) Tech. Rep. NMFS SSRF-749; 16 p.
Langton, R.W.; North, B.M.; Hayden, B.P.; Bowman, R.E. 1980.Fish food-habit studies -- sampling procedures and dataprocessing methods utilized by the Northeast FisheriesCenter, Woods Hole Laboratory, U.S.A. ICES (Int. Counc.Explor. Sea) C.M. 1980/L:61; 8 p. Available from: Interna-tional Council for the Exploration of the Sea, Palægade 2-4, DK-1261 Copenhagen K, Denmark.
Maurer, R.O.; Bowman, R.E. 1975. Food habits of marine fishesof the Northwest Atlantic — data report. Woods HoleLab. Ref. Doc. 75-3; 90 p. Available from: National MarineFisheries Service, 166 Water St., Woods Hole, MA 02543.
Maurer, R.O.; Bowman, R.E. 1985. Food consumption of squids(Illex illecebrosus and Loligo pealei) off the northeast-ern United States. NAFO (Northwest Atl. Fish. Org.) Sci.Counc. Stud. 9:117-124.
Robins, C.R. (chairman); Bailey, R.M.; Bond, C.E.; Brooker,J.R.; Lachner, E.A.; Lea, R.N.; Scott, W.B. 1991. Commonand scientific names of fishes from the United States andCanada. 5th ed. Am. Fish. Soc. Spec. Publ. 20; 183 p.
Sherman, K. 1986. Measurement strategies for monitoring andforecasting variability in large marine ecosystems. In:Sherman, K.; Alexander, L., eds. Variability and manage-ment of large marine ecosystems: AAAS selected sym-posium 99. Boulder, CO: Westview Press; p. 203-236.
Sissenwine, M.P. 1984. Why do fish populations vary? In:May, R., ed. Exploitation of marine communities. Berlin,Germany: Springer-Verlag; p. 59-94.
Turgeon D.D. (chairman), Bogan, A.E.; Coan, E.V.; Emerson,W.K.; Lyons, W.G.; Pratt, W.L.; Roper, C.F.E.; Scheltema,A.; Thompson, F.G.; Williams, J.D. 1988. Common andscientific names of aquatic invertebrates from the UnitedStates and Canada: mollusks. Am. Fish. Soc. Spec. Publ.16; 277 p.
Turgeon, D.D. (chair); Quinn, J.F., Jr.; Bogan, A.E.; Coan, E.V.;Hochberg, F.G.; Lyons, W.G.; Mikkelsen, P.M.; Neves,R.J.; Roper, C.F.E.; Rosenberg, G.; Roth, B.; Scheltema,A.; Thompson, F.G.; Vecchione, M.; Williams, J.D. 1998.Common and scientific names of aquatic invertebratesfrom the United States and Canada: mollusks. 2nd ed. Am.Fish. Soc. Spec. Publ. 26; 526 p.
Williams, A.B. (chairman); Abele, L.G.; Felder, D.L.; Hobbs,H.H., Jr.; Manning, R.B.; McLaughlin, P.A.; Farfante, I.P.1989. Common and scientific names of names of aquaticinvertebrates from the United States and Canada: deca-pod crustaceans. Am. Fish. Soc. Spec. Publ. 17; 77 p.

7Page
Table 1. Percentage of total stomach contents by weight of six functional prey groups for 170 species of fish and squidcollected in the Northwest Atlantic. (The order of species follows the taxonomic index presented earlier.)
_____________________________________________________________________________________
Functional Prey Group ___________________________________________________________Decapod Other All
Predator Fish Squid Polychaete Crustacean Crustacean Other_____________________________________________________________________________________
Northern shortfin squid 19.0 34.6 <0.1 0.4 16.2 29.8Longfin inshore squid 13.7 5.6 <0.1 0.2 4.5 76.0Atlantic hagfish 47.6 - - - - 52.4Sand tiger 100.0 - - - - -Bigeye thresher 83.5 15.1 - - - 1.4Thresher shark 97.1 2.9 - - - -White shark 27.0 - - - - 73.0Shortfin mako 98.2 1.4 - - - 0.4Longfin mako 91.9 4.9 - - - 3.2Porbeagle 0.7 99.3 - - - -Chain dogfish 49.5 20.7 6.3 10.0 12.4 1.1Bignose shark 38.4 - - - - 61.6Silky shark 57.5 32.3 - - - 10.2Dusky shark 58.1 14.4 - 11.5 6.1 9.9Sandbar shark 98.2 - - - - 1.8Night shark 1.2 97.9 - - - 0.9Tiger shark 57.6 0.3 - - - 42.1Smooth dogfish 7.4 8.2 0.8 72.1 2.6 8.9Blue shark 53.9 33.8 - - - 12.3Atlantic sharpnose shark 80.0 5.2 - 8.3 1.4 5.1Scalloped hammerhead 100.0 - - - - -Smooth hammerhead 98.0 - - - - 2.0Spiny dogfish 53.7 17.8 - 3.3 1.0 24.2Atlantic angel shark 83.3 7.7 <0.1 0.2 <0.1 8.8Atlantic torpedo 100.0 - <0.1 - - -Clearnose skate 57.8 0.6 0.4 38.6 0.8 1.8Little skate 9.5 - 12.9 40.5 25.0 12.1Rosette skate 1.7 2.6 0.7 81.8 9.9 3.3Barndoor skate - - - 100.0 - -Winter skate 66.2 7.0 8.5 4.8 2.6 10.9Thorny skate 45.3 22.9 6.4 9.1 3.9 12.4Smooth skate <0.1 - - 69.2 27.4 3.4Southern stingray 0.7 - 0.3 98.7 0.3 -Roughtail stingray 31.1 - <0.1 68.7 0.1 0.1Bluntnose stingray 40.9 - 10.2 23.2 1.0 24.7Spiny butterfly ray 6.9 - - - - 93.1Bullnose ray <0.1 - 2.2 6.2 0.2 91.4Cownose ray 90.7 - - 0.3 8.6 0.4Margined snake eel - - 31.7 61.7 6.4 0.2Slender snipe eel - - - - 100.0 -Conger eel 96.5 - - - 0.1 3.4Blueback herring - - - 0.9 49.6 49.5Hickory shad - - - 100.0 - -Alewife 1.7 0.1 - 2.5 86.2 9.5

Page 8
Table 1. (cont.)
_____________________________________________________________________________________
Functional Prey Group __________________________________________________________Decapod Other All
Predator Fish Squid Polychaete Crustacean Crustacean Other_____________________________________________________________________________________
American shad 16.3 1.1 - - 78.1 4.5Atlantic menhaden - - - 0.5 49.3 50.2Atlantic herring <0.1 - - <0.1 85.2 14.8Round herring 32.8 - - 21.3 41.3 4.6Atlantic thread herring - - - - - 100.0Spanish sardine - - - - 100.0 <0.1Striped anchovy 0.3 - 5.9 2.8 79.5 11.5Atlantic argentine 10.3 0.5 1.0 1.6 70.8 15.8Atlantic salmon - - 4.6 0.3 - 95.1Shortnose greeneye - - 10.7 - 68.8 20.5Inshore lizardfish 100.0 - - - - -Offshore lizardfish 2.5 96.2 - 1.3 - -Snakefish - - - - - 100.0Longnose lancetfish 2.8 1.0 - 13.5 82.6 0.1Lanternfish uncl. 6.2 - - 20.5 52.4 20.9Hygophum taaningi - - 0.5 3.3 95.7 0.5Mullers pearlsides - - - - 100.0 -Cusk 15.5 0.1 <0.1 47.7 3.7 33.0Fourbeard rockling - - 65.7 - 1.2 33.1Atlantic cod 56.8 12.5 2.5 17.8 3.3 7.1Haddock 3.0 1.1 14.1 2.9 15.4 63.5Offshore hake - - - - 82.5 17.5Silver hake 63.0 7.7 - 5.2 23.4 0.7Pollock 54.1 23.5 - 2.6 18.3 1.5Longfin hake 0.5 - - - 99.1 0.4Red hake 21.7 5.7 2.6 25.9 37.4 6.7Spotted hake 39.1 25.0 0.9 11.9 16.4 6.7White hake 57.1 21.4 0.1 7.1 13.5 0.8Marlin-spike - - 0.4 - 99.6 -Longnose grenadier - - 80.1 2.9 10.9 6.1Grenadier uncl. - - 16.7 - 27.3 56.0Fawn cusk-eel 9.8 - 25.7 23.9 27.3 13.3Striped cusk-eel - - - 70.3 29.7 -Atlantic midshipman 68.9 23.2 - 2.8 5.1 -Goosefish 73.9 24.9 - - - 1.2Atlantic needlefish - - - - 100.0 -Atlantic saury - - - - 45.6 54.4Tidewater silverside - - - - 100.0 -Buckler dory 100.0 - - - - -Deepbody boarfish 3.3 - - - 43.1 53.6Threespine stickleback 75.0 - - - 25.0 -Red cornetfish 100.0 - - - - -Cornetfish uncl. 26.7 - - - 73.3 -Longspine snipefish - - - - 100.0 -Northern pipefish - - - - 100.0 -

9Page
Table 1. (cont.)
_____________________________________________________________________________________
Functional Prey Group ___________________________________________________________Decapod Other All
Predator Fish Squid Polychaete Crustacean Crustacean Other_____________________________________________________________________________________
Blackbelly rosefish 2.1 3.0 3.3 46.7 5.4 39.5Acadian redfish 7.5 - 0.1 3.1 88.2 1.1Scorpionfish uncl. - - - 100.0 - -Armored searobin 1.1 - - 39.1 48.0 11.8Spiny searobin - - - - 100.0 -Northern searobin 14.7 - 15.2 37.3 14.2 18.6Striped searobin 77.3 - - 21.3 1.3 0.1Bluespotted searobin - - - - 100.0 -Searobin uncl. - - - - 44.4 55.6Hookear sculpin uncl. - - 54.2 - 25.3 20.5Sea raven 73.8 1.4 - 24.0 - 0.8Longhorn sculpin 10.5 - 2.1 77.2 5.2 5.0Shorthorn sculpin - - - 58.4 2.9 38.7Moustache sculpin - - 16.1 67.9 15.6 0.4Bigeye sculpin - - 47.9 34.7 15.6 1.8Alligatorfish - - - 3.4 96.6 -Lumpfish - - 10.9 0.4 0.4 88.3Atlantic seasnail - - - - 100.0 -Striped bass 100.0 - - - - -Black sea bass 28.5 3.8 1.9 45.6 8.9 11.3Sand perch 100.0 - - - - -Red grouper - 100.0 - - - -Scamp 97.0 - - 3.0 <0.1 -Bigeye - - 21.2 - 15.4 63.4Tilefish <0.1 - 0.2 4.4 17.5 77.9Bluefish 58.8 40.0 0.4 0.4 0.2 0.2Cobia 29.5 12.9 - 54.3 - 3.3Atlantic bumper - - - - - 100.0Round scad - - - - - 100.0Bigeye scad 13.6 - - 10.6 4.1 71.7Greater amberjack 100.0 - - - - -Banded rudderfish 97.0 - - 3.0 - -Rough scad - - - - 38.0 62.0Vermilion snapper 0.5 81.7 - <0.1 0.1 17.7Tomtate 0.4 - 5.6 1.0 5.6 87.4White grunt 13.1 - 18.9 13.2 4.3 50.5Pigfish - - 61.2 5.8 0.7 32.3Whitebone porgy 100.0 - - - - -Spottail pinfish 0.2 - - 4.6 5.2 90.0Pinfish 1.7 - - - - 98.3Longspine porgy 2.9 0.8 11.3 21.6 7.2 56.2Scup 23.5 11.8 21.0 7.3 13.1 23.3Silver perch - - - - 100.0 -Weakfish 76.0 7.8 1.0 10.4 4.5 0.3Banded drum - - - 19.9 80.1 -

Page 10
Table 1. (cont.)
_____________________________________________________________________________________
Functional Prey Group ___________________________________________________________Decapod Other All
Predator Fish Squid Polychaete Crustacean Crustacean Other_____________________________________________________________________________________
Spot 2.9 - 53.9 2.6 11.3 29.3Southern kingfish 15.9 - 10.3 48.2 15.3 10.3Northern kingfish 9.4 - 3.8 82.7 2.1 2.0Atlantic croaker 12.5 2.0 37.4 10.3 13.4 24.4Atlantic spadefish - - - - - 100.0Hogfish - - - 0.9 29.7 69.4Tautog - - - 100.0 - -Cunner 1.8 - 0.8 72.0 2.9 22.5Ocean pout <0.1 - 2.1 5.4 19.3 73.2Atlantic soft pout - - - - 100.0 -Radiated shanny - - 2.3 - 5.4 92.3Wrymouth - - - 100.0 - -Atlantic wolffish - - 0.1 13.0 1.6 85.3Southern stargazer 100.0 - - - - -Northern sand lance 0.8 - <0.1 - 74.8 24.4Atlantic cutlassfish 69.2 - - 21.9 8.1 0.8Little tunny 99.3 - - - 0.6 0.1Atlantic bonito 80.7 19.3 - - - -Chub mackerel 0.8 - - - 12.6 86.6Atlantic mackerel 0.1 0.2 <0.1 0.7 89.5 9.5King mackerel 99.9 0.1 - - - -Spanish mackerel 82.5 16.5 - 0.4 - 0.6Swordfish 32.5 67.4 - - - 0.1Harvestfish - - - - - 100.0Butterfish 0.1 - 2.3 0.1 1.7 95.8Gulf Stream flounder 4.6 - 47.2 7.2 34.1 6.9Summer flounder 61.1 34.2 - 1.8 2.6 0.3Fourspot flounder 11.8 54.3 2.0 27.3 2.5 2.1Windowpane 31.4 - 0.9 14.3 51.6 1.8Dusky flounder 8.7 - - 25.5 65.8 -Witch flounder - - 85.7 - 3.4 10.9American plaice - - 2.2 4.0 1.2 92.6Atlantic halibut 65.7 18.5 - 15.4 <0.1 0.4Winter flounder 3.5 - 35.6 0.8 7.1 53.0Yellowtail flounder 0.7 - 38.5 6.4 42.5 11.9Planehead filefish - 5.8 66.7 - - 27.5_____________________________________________________________________________________

11Page
Table 2. Percentage by weight of fish component of diet of piscivores according to geographic area of collection
_________________________________________________________________________________________
Area ____________________________________________________________________Inshore
Southern North SouthMiddle New Georges Gulf of Scotian of Cape of Cape
Predator Atlantic England Bank Maine Shelf Hatteras Hatteras_________________________________________________________________________________________
Northern shortfin squid 23.0 12.3 5.2 13.1 7.1 73.3 -Longfin inshore squid 17.0 15.3 7.6 0.0 0.0 21.4 17.8Dusky shark 17.9 - - - - 86.2 21.5Smooth dogfish 10.1 7.8 - - - 5.8 24.6Atlantic sharpnose shark - - - - - 77.1 81.0Spiny dogfish 72.7 55.8 49.9 40.9 30.6 60.4 92.4Little skate 24.2 1.7 2.9 - - 17.5 -Winter skate - 66.6 65.2 88.1 - 88.2 -Thorny skate - - 68.1 38.3 15.4 64.8 -Alewife 1.9 2.0 0.4 0.1 - 7.3 -Atlantic herring - - 0.0 <0.1 - 0.0 0.0Atlantic cod 74.2 71.9 40.3 43.8 4.0 61.4 -Haddock - <0.1 <0.1 3.9 <0.1 0.0 -Silver hake 74.1 88.9 62.2 50.2 85.7 51.6 -Pollock - - 56.1 4.9 15.4 100.0 -Red hake 51.9 31.5 8.9 22.6 30.9 51.3 -White hake - 97.8 55.2 42.9 51.0 93.5 -Fawn cusk-eel 0.0 19.9 0.0 - - 0.0 -Goosefish 96.0 63.2 28.5 81.1 91.2 46.6 -Blackbelly rosefish 10.1 2.9 0.6 0.0 - - -Acadian redfish - - 0.0 15.6 <0.1 - -Sea raven - 0.0 44.2 97.6 36.5 90.6 -Longhorn sculpin - 1.0 12.9 0.0 0.0 - -Black sea bass 23.6 3.0 0.0 - - 18.4 44.8Bluefish 98.1 4.6 33.9 - - 75.5 94.1Scup 0.0 0.8 - - - 30.0 55.7Weakfish 0.0 100.0 - - - 76.3 74.1Spot 0.0 - - - - 0.1 9.9Southern kingfish - - - - - 6.4 21.0Northern kingfish - - - - - 27.9 5.2Ocean pout - <0.1 0.0 0.0 0.0 <0.1 -Northern sand lance 6.5 2.5 0.5 0.0 - <0.1 -Atlantic mackerel - 0.0 <0.1 0.2 2.4 0.0 -Butterfish <0.1 0.0 0.0 - - <0.1 0.2Gulf Stream flounder 0.0 6.8 0.0 - - - -Summer flounder 95.7 43.2 100.0 0.0 - 60.3 90.2Fourspot flounder 41.6 19.5 0.3 - - - -Windowpane 55.7 23.6 71.6 - - 22.1 0.0Atlantic halibut - - 84.0 51.8 25.7 97.3 -Winter flounder 0.0 <0.1 5.2 0.0 0.0 2.1 -Yellowtail flounder - 0.9 0.0 - - 0.9 -_________________________________________________________________________________________

Page 12
Table 3. Percentage by weight of squid component of diet of predators which eat squid according to geographic area of collection
_________________________________________________________________________________________
Area ____________________________________________________________________Inshore
Southern North SouthMiddle New Georges Gulf of Scotian of Cape of Cape
Predator Atlantic England Bank Maine Shelf Hatteras Hatteras_________________________________________________________________________________________
Northern shortfin squid 36.1 30.3 40.8 22.7 70.0 3.2 -Longfin inshore squid 10.1 8.0 0.3 0.0 0.0 8.0 4.6Dusky shark 0.0 - - - - 12.2 24.6Smooth dogfish 3.7 0.7 - - - 10.1 <0.1Atlantic sharpnose shark - - - - - 0.0 7.1Spiny dogfish 5.0 22.4 17.2 24.7 26.3 9.1 3.4Winter skate - 10.2 6.9 11.7 - 0.0 -Thorny skate - - 6.4 32.6 16.3 <0.1 -Alewife 2.5 0.0 0.0 0.0 0.0 0.0 -Atlantic cod 0.0 <0.1 1.6 43.6 0.0 <0.1 -Haddock 0.0 0.0 0.0 1.3 1.9 0.0 -Silver hake 17.0 3.2 0.0 0.0 3.5 32.7 -Pollock - - 5.9 46.8 80.9 0.0 -Red hake 0.0 30.1 6.2 1.4 23.6 0.5 -White hake - 0.0 0.0 29.5 40.1 0.0 -Goosefish 0.0 22.7 49.6 14.6 3.5 53.3 -Blackbelly rosefish 0.0 0.0 4.5 0.0 - - -Sea raven - 0.0 3.6 0.0 0.0 <0.1 -Black sea bass 1.6 0.0 0.0 - - 5.3 5.5Bluefish 1.3 95.3 65.8 - - 22.2 3.5Scup 0.0 0.0 - - - 15.8 0.0Weakfish 0.0 0.0 - - - 5.9 19.0Atlantic mackerel - <0.1 0.5 0.0 0.0 0.0 -Summer flounder 1.3 55.6 0.0 0.0 - 31.1 -Fourspot flounder 0.0 45.3 73.1 - - - -Atlantic halibut - - 15.4 25.4 22.9 1.1 -_________________________________________________________________________________________

13Page
Table 4. Percentage by weight of polychaete component of diet of predators which eat polychaetes according to geographic area ofcollection
_________________________________________________________________________________________
Area ____________________________________________________________________Inshore
Southern North SouthMiddle New Georges Gulf of Scotian of Cape of Cape
Predator Atlantic England Bank Maine Shelf Hatteras Hatteras_________________________________________________________________________________________
Northern shortfin squid 0.0 0.0 0.0 0.0 <0.1 0.1 -Longfin inshore squid <0.1 <0.1 <0.1 0.0 0.0 0.4 0.0Smooth dogfish 0.3 0.8 - - - 0.6 0.6Little skate 3.2 21.7 15.0 - - 3.3 -Winter skate - 9.0 8.4 <0.1 - 2.7 -Thorny skate - - 5.6 8.5 45.5 29.6 -Alewife 0.0 0.0 0.0 0.0 0.0 0.6 -Atlantic cod 1.1 5.4 2.4 0.1 <0.1 1.9 -Haddock 0.0 47.1 18.6 7.8 29.4 42.2 -Red hake 0.6 1.8 0.6 2.4 1.2 9.4 -White hake - 0.0 0.2 <0.1 0.0 0.3 -Fawn cusk-eel 46.4 13.6 26.3 - - 22.1 -Blackbelly rosefish 0.0 11.2 1.8 15.8 - - -Acadian redfish - - 0.0 0.0 <0.1 - -Longhorn sculpin - 5.0 1.1 17.9 2.5 - -Black sea bass 3.7 0.3 0.0 - - 0.9 0.2Bluefish 0.0 0.0 0.0 - - 0.8 0.4Scup 52.5 34.0 - - - 14.8 18.1Weakfish 0.0 0.0 - - - 1.0 0.1Spot 1.7 - - - - 73.2 3.5Southern kingfish - - - - - 24.6 2.0Northern kingfish - - - - - 14.4 1.3Ocean pout - 3.9 0.6 5.7 0.0 <0.1 -Atlantic wolfish - 0.0 0.0 0.2 0.0 0.0 -Northern sand lance 0.0 <0.1 <0.1 0.0 - <0.1 -Atlantic mackerel - 0.0 0.1 0.0 0.0 0.0 -Butterfish 0.0 3.7 0.0 - - 3.3 <0.1Gulf Stream flounder 61.0 43.2 46.4 - - - -Fourspot flounder 6.0 4.1 0.0 - - - -Windowpane 0.5 0.5 2.3 - - 0.9 0.0Witch flounder - - 76.7 82.6 74.7 90.7 -American plaice - - 0.5 1.0 0.0 7.9 -Winter flounder 74.2 43.8 24.2 37.1 <0.1 48.5 -Yellowtail flounder - 28.9 71.9 - - 25.6 -_________________________________________________________________________________________

Page 14
Table 5. Percentage by weight of decapod crustacean component of diet of predators which eat decapods according to geographic areaof collection
_________________________________________________________________________________________
Area ____________________________________________________________________Inshore
Southern North SouthMiddle New Georges Gulf of Scotian of Cape of Cape
Predator Atlantic England Bank Maine Shelf Hatteras Hatteras_________________________________________________________________________________________
Northern shortfin squid 1.2 1.2 <0.1 <0.1 <0.1 <0.1 -Longfin inshore squid 0.2 <0.1 <0.1 0.0 0.0 1.3 0.0Dusky shark 79.0 - - - - 0.2 4.8Smooth dogfish 74.2 89.2 - - - 70.0 59.9Atlantic sharpnose shark - - - - - 22.1 3.6Spiny dogfish 1.3 1.1 5.7 0.1 0.1 11.9 1.6Little skate 42.8 25.7 47.1 - - 49.4 -Winter skate - 1.5 4.5 0.0 - 6.5 -Thorny skate - - 17.1 5.8 10.9 3.5 -Alewife 0.0 0.7 0.3 <0.1 0.0 15.4 -Atlantic herring - - 0.0 <0.1 0.0 0.0 -Atlantic cod 24.3 17.9 34.1 5.5 10.0 21.6 -Haddock 0.0 8.1 2.2 1.7 7.0 8.9 -Silver hake 2.8 4.5 5.6 6.8 1.9 5.5 -Pollock - - 3.4 5.2 2.1 0.0 -Red hake 41.0 25.5 33.3 19.3 30.3 29.0 -White hake - 1.6 39.3 5.4 7.7 5.1 -Fawn cusk-eel 19.0 30.1 17.4 - - 11.4 -Blackbelly rosefish 72.3 39.1 39.2 84.2 - - -Acadian redfish - - 0.0 0.5 5.6 - -Sea raven - 64.8 51.5 1.5 63.5 8.4 -Longhorn sculpin - 85.5 74.9 72.4 94.2 - -Black sea bass 48.1 52.4 21.1 - - 55.9 32.4Bluefish 0.0 0.0 <0.1 - - 0.4 1.2Scup 17.0 2.7 - - - 7.7 2.0Weakfish 0.0 0.0 - - - 11.1 6.2Spot 2.6 - - - - 2.3 2.5Southern kingfish - - - - - 43.1 51.1Northern kingfish - - - - - 46.2 90.7Ocean pout - 10.2 5.8 0.8 0.0 0.0 -Atlantic wolfish - 0.0 7.9 14.6 22.0 12.2 -Atlantic mackerel - 0.0 2.1 <0.1 0.0 0.0 -Butterfish 0.0 0.2 0.3 - - 0.2 0.0Gulf Stream flounder 2.5 9.0 5.6 - - - -Summer flounder 2.4 0.6 0.0 0.0 - 2.8 5.2Fourspot flounder 48.8 20.9 22.9 - - - -Windowpane 14.6 32.7 15.3 - - 7.5 100.0American plaice - - 0.1 1.0 0.0 17.4 -Atlantic halibut - - 0.1 22.0 49.6 1.5 -Winter flounder 2.5 1.2 0.4 2.8 0.0 0.4 -Yellowtail flounder - 1.6 0.6 - - 39.5 -_________________________________________________________________________________________

15Page
Table 6. Percentage by weight of crustaceans (other than decapods) in diet of predators which eat such crustaceans according togeographic area of collection
_________________________________________________________________________________________
Area ____________________________________________________________________Inshore
Southern North SouthMiddle New Georges Gulf of Scotian of Cape of Cape
Predator Atlantic England Bank Maine Shelf Hatteras Hatteras_________________________________________________________________________________________
Northern shortfin squid 8.5 18.6 22.0 26.4 4.8 3.9 -Longfin inshore squid 3.4 7.5 3.1 70.1 0.0 3.6 1.4Dusky shark 0.0 - - - - 1.1 18.1Smooth dogfish 2.3 0.4 - - - 2.5 9.9Atlantic sharpnose shark - - - - - <0.1 2.0Spiny dogfish <0.1 0.2 <0.1 3.4 0.3 2.6 0.0Little skate 10.7 36.0 20.3 - - 23.6 -Winter skate - 6.7 1.7 0.1 - 1.6 -Thorny skate - - 0.4 4.9 9.8 0.5 -Alewife 56.5 92.4 82.1 93.1 99.9 68.3 -Atlantic herring - - 4.3 97.6 97.2 2.3 0.0Atlantic cod <0.1 1.3 5.4 3.8 21.1 3.1 -Haddock 100.0 6.1 20.1 14.9 5.7 11.7 -Silver hake 5.4 2.3 31.7 41.9 8.4 9.7 -Pollock - - 32.4 39.3 0.5 0.0 -Red hake 1.6 6.9 38.6 46.7 11.7 4.3 -White hake - 0.3 3.5 21.1 0.0 0.1 -Fawn cusk-eel 29.5 14.5 47.6 - - 66.5 -Blackbelly rosefish 10.5 13.9 2.5 0.0 - - -Acadian redfish - - 100.0 82.1 93.8 - -Sea raven - 0.0 <0.1 0.0 0.0 <0.1 -Longhorn sculpin - 5.9 4.3 7.0 <0.1 - -Black sea bass 15.0 44.3 76.3 - - 8.2 0.5Bluefish 0.0 0.0 0.0 - - 0.3 0.2Scup 0.1 9.5 - - - 14.6 0.3Weakfish 0.0 0.0 - - - 4.9 <0.1Spot 3.4 - - - - 6.8 20.2Southern kingfish - - - - - 4.8 20.9Northern kingfish - - - - - 5.5 1.3Ocean pout - 61.0 5.3 <0.1 100.0 <0.1 -Atlantic wolfish - 33.3 0.1 4.2 0.5 0.0 -Northern sand lance 61.6 57.5 79.8 70.7 - 87.8 -Atlantic mackerel - 96.2 74.9 85.2 95.9 98.4 -Butterfish 2.6 3.3 4.3 - - 1.3 0.1Gulf Stream flounder 31.7 33.1 42.3 - - - -Summer flounder 0.6 0.2 0.0 100.0 - 5.0 4.4Fourspot flounder 1.4 3.8 2.3 - - - -Windowpane 27.9 41.0 3.2 - - 67.8 0.0Witch flounder - - 11.2 1.9 0.0 2.4 -American plaice - - 2.2 1.3 0.0 0.2 -Atlantic halibut - - <0.1 <0.1 <0.1 <0.1 -Winter flounder 1.3 10.3 2.8 0.8 0.0 11.8 -Yellowtail flounder - 54.8 14.6 - - 23.0 -_________________________________________________________________________________________

Page 16
Table 7. Percentage by weight of all other prey (other than those noted in Tables 2-6) in diet of predators according to geographic areaof collection
_________________________________________________________________________________________
Area ____________________________________________________________________Inshore
Southern North SouthMiddle New Georges Gulf of Scotian of Cape of Cape
Predator Atlantic England Bank Maine Shelf Hatteras Hatteras_________________________________________________________________________________________
Northern shortfin squid 31.2 37.6 31.6 37.8 18.1 19.5 -Longfin inshore squid 69.3 69.2 89.0 29.9 100.0 65.3 76.2Dusky shark 3.1 - - - - 0.3 3.1Smooth dogfish 9.4 1.1 - - - 11.0 5.0Atlantic sharpnose shark - - - - - 0.8 6.4Spiny dogfish 21.0 20.5 27.2 30.9 42.7 16.0 2.6Little skate 19.1 14.9 14.7 - - 6.2 -Winter skate - 6.0 13.3 0.1 - 1.0 -Thorny skate - - 2.4 9.4 2.1 1.6 -Alewife 39.1 5.6 17.5 6.8 0.1 23.8 -Atlantic herring - - 95.7 2.4 2.8 97.7 100.0Atlantic cod 0.4 3.5 15.1 3.2 64.9 12.0 -Haddock 0.0 38.7 59.1 70.4 56.0 37.2 -Silver hake 0.7 1.1 0.5 1.1 0.5 0.5 -Pollock - - 2.2 3.8 1.1 0.0 -Red hake 4.9 4.2 11.6 7.6 2.3 5.5 -White hake - 0.3 1.8 1.1 1.2 1.0 -Fawn cusk-eel 5.1 21.9 8.7 - - 0.0 -Goosefish 1.0 1.2 0.7 2.4 <0.1 0.1 -Blackbelly rosefish 7.1 32.9 51.4 0.0 - - -Acadian redfish - - 0.0 1.8 0.6 - -Sea raven - 35.2 0.7 0.9 0.0 1.0 -Longhorn sculpin - 2.6 6.8 2.7 3.3 - -Black sea bass 8.0 0.0 2.6 - - 11.3 21.6Bluefish 0.6 0.1 0.3 - - 0.8 0.7Scup 30.4 53.0 - - - 17.1 21.3Weakfish 100.0 0.0 - - - 0.8 0.6Spot 92.3 - - - - 17.6 63.9Southern kingfish - - - - - 21.1 5.0Northern kingfish - - - - - 6.0 1.6Ocean pout - 24.9 88.3 93.5 0.0 100.0 -Atlantic wolfish - 66.7 92.0 81.0 77.5 87.8 -Northern sand lance 31.9 40.0 19.7 29.3 - 12.2 -Atlantic mackerel - 3.8 22.4 14.6 1.7 1.6 -Butterfish 97.4 92.8 95.4 - - 95.2 99.8Gulf Stream flounder 4.8 7.9 5.7 - - - -Summer flounder <0.1 0.4 0.0 0.0 - 0.8 0.2Fourspot flounder 2.2 6.4 1.4 - - - -Windowpane 1.3 2.2 7.6 - - 1.7 0.0Witch flounder - - 12.1 15.5 25.3 6.9 -American plaice - - 97.2 96.7 100.0 74.5 -Atlantic halibut - - 0.5 0.8 1.8 0.1 -Winter flounder 22.0 44.7 67.4 59.3 100.0 37.2 -Yellowtail flounder - 13.8 12.9 - - 11.0 -_________________________________________________________________________________________

Page 17
APPENDIX A
Overall Prey of 110 Predators Which Were Lightly Sampled and/or Not Well Represented in Collections
during the NEFSC’s 1977-80 Bottom Trawl Surveys
Stomach content data for 110 subjectively chosen predatorspecies are given in Tables A-1 through A-13. These tablespresent data for: 1) 86 predator species for which 25 or fewerindividuals were sampled during the 1977-80 NEFSC bottomtrawl surveys, and 2) 28 predator species not well representedin the 1977-80 survey samples (i.e., there is some duplicationwith the aforementioned 86 species). Data were gathered overa number of years (i.e., 1963-84) from various areas, and were
collected and analyzed using different methods. Sources of thedata and other information for each species are included in the13 tables.
Data on the latter 28 species are important because some ofthe species are large pelagic predators which make up aconsiderable biomass (e.g., blue shark), and which are knownto feed primarily on fish and squid.

Page 18
Table A-1. Diet composition and sampling data for Atlantic hagfish, sand tiger, bigeye thresher, thresher shark, white shark, shortfin mako, longfinmako, and porbeagle. (Subscripts indicate data source: 1 = 1977-80 trawl surveys, and 2 = Apex Predators Investigation studies.Superscripts indicate data type: * = percentage by volume, and none = percentage by weight. Squared brackets indicate major taxonsubtotal; parentheses indicate minor taxon subtotal.)
Predator Atlantic Sand Sand Bigeye Thresher White Shortfin Shortfin Longfin
Stomach Contents hagfish1 tiger1 tiger2* thresher2
* shark2* shark2
* mako1 mako2* mako2
* Porbeagle2*
CEPHALOPODA - - - [15.1] [2.9] - [22.9] [1.4] [4.9] [99.3]Illex illecebrosus - - - 11.9 2.2 - - 1.2 - 69.5Loligo pealeii - - - - - - 22.9 <0.1 - -Cephalopoda unid. - - - 3.2 0.7 - - 0.2 4.9 29.8
ARTHROPODA [52.4] - - - - - - - - -CHONDRICHTHYES - [33.2] [76.3] - - [1.1] - [0.3] [12.1] -
Odontaspididae - 33.2 - - - - - - - -Carcharhinus sp. - - - - - - - - 12.1 -Mustelus canis - - - - - 0.3 - - - -Prionace glauca - - - - - 0.1 - 0.2 - -Squaliformes - - - - - 0.7 - - - -Raja eglanteria - - 76.3 - - - - - - -Chondrichthyes unid. - - - - - - - 0.1 - -
OSTEICHTHYES [47.6] [66.8] [23.7] [83.5] [97.1] [25.9] [77.1] [97.9] [79.8] [0.7]Anguilla rostrata - - - - - - - 0.2 - -Etrumeus teres - - - 1.7 - - - - - -Brevoortia tyrannus - - - - - - - 0.1 - -Gadidae - - 0.1 - - - - 0.2 - -Macrozoarces americanus - - - - - - - 0.1 - -Exocoetidae - - - - 1.8 - - - - -Scomberesox saurus - - - - 3.3 - - 0.4 - -Pomatomus saltatrix - - - - 22.3 11.0 - 77.5 6.2 -Stenotomus chrysops - 0.9 - - - - - - - -Leiostomus xanthurus - 12.0 - - - - - - - -Sciaenidae - - - 3.3 - - - - - -Labridae - - 2.9 - - - - - - -Ammodytes dubius - - - - 66.3 - - - - -Euthynnus pelamis - - - - - - - 0.4 - -Scomber scombrus - - - 1.5 - - - 0.6 - -Thunnus thynnus - - - - - 13.7 - - 73.2 -Thunnus sp. - - - - - - - 0.5 - -Scombridae - - - 6.8 2.7 - - 2.4 - -Xiphias gladius - - - - - - - 12.4 0.4 -Peprilus triacanthus - 17.7 - - - - 30.8 <0.1 - -Scorpaenidae - - - 53.8 - - - 0.4 - -Sebastes fasciatus - - - - - - - 0.3 - -Triglidae - - 20.6 - - - - 0.1 - -Osteichthyes unid. 47.6 36.2 0.1 16.4 0.7 1.2 46.3 2.2 - 0.7
MAMMALIA - - - - - [73.0] - [0.3] - -ANIMAL REMAINS AND MISC. - - - [1.4] - - - [0.1] [3.2] -
Number sampled 4 5 3 24 19 23 1 399 10 6Number empty 3 0 0 6 7 9 0 126 4 2Mean stomach content (g or cm3) <0.1 275.1 687.0 245.7 388.4 2857.8 141.1 1226.5 1851.7 586.7Mean fish length (cm) 42 235 169 238 199 187 146 NA 155 126Fish length range (cm) 33-55 213-246 80-207 123-335 155-240 111-459 - 67-328 97-242 78-209

Page 19
Table A-2. Diet composition and sampling data for bignose shark, silky shark, sandbar shark, night shark, tiger shark, blue shark, scallopedhammerhead, and smooth hammerhead. (Subscripts indicate data source: 1 = 1977-80 trawl surveys, and 2 = Apex PredatorsInvestigation studies. Superscripts indicate data type: * = percentage by volume, and none = percentage by weight. Squared bracketsindicate major taxon subtotal; parentheses indicate minor taxon subtotal.)
Predator Bignose Silky Sandbar Night Tiger Blue Scalloped Smooth Smooth
Stomach Contents shark2* shark2
* shark1 shark2* shark2
* shark2* hammerhead1 hammerhead1 hammerhead2
*
BIVALVIA - - [1.0] - - - - - -Spisula solidissima - - 1.0 - - - - - -
CEPHALOPODA - [32.3] - [97.9] [0.3] [33.8] - - -Illex illecebrosus - 29.2 - 38.8 - 3.7 - - -Octopodida - - - - - 21.4 - - -Cephalopoda unid. - 3.1 - 59.1 0.3 8.7 - - -
CHONDRICHTHYES [0.9] [0.2] - - [20.0] [2.1] - - [0.1]Cetorhinus maximus - - - - 8.3 - - - -Prionace glauca - - - - - 0.5 - - -Carcharhinus obscurus - - - - 6.2 - - - -Galeocerdo cuvieri - - - - 3.2 - - - -Squaliformes 0.9 - - - 0.1 1.1 - - -Raja sp. - - - - 2.0 0.4 - - -Rajidae - 0.2 - - 0.2 0.1 - - 0.1
OSTEICHTHYES [37.5] [57.3] [98.2] [1.2] [37.6] [51.8] [100.0] [100.0] [97.9]Ophichthus cruentifer - - 29.4 - - - - - -Clupea harengus - - - - - 0.4 - - 17.1Etrumeus teres - 0.8 - - - - - - -Brevoortia tyrannus - 16.9 - - - - - - -Clupeidae - - - - - 2.2 - - -Anchoa hepsetus - - - - - - 12.0 - -Lophius americanus - - - - 31.6 0.1 - - -Alepisaurus sp. - - - - - 8.9 - - -Urophycis tenuis - - 5.5 - - - - - -Gadidae - - - - 0.2 13.2 - - -Pomatomus saltatrix - - - - 4.4 13.4 - - -Coryphaena hippurus - - - - - - - - 63.8Stenotomus chrysops - - - - <0.1 0.1 - - -Leiostomus xanthurus - - 23.4 - - - - - -Scomber scombrus - - - - 0.3 2.5 - - -Sciaenidae - 0.2 - - - - - - -Peprilus triacanthus 0.8 - - 1.1 - 1.1 - - 6.5Scorpaenidae 0.4 - - - - - - - -Triglidae - - - - <0.1 - - - 5.9Pleuronectes ferruginus - - - - - 2.1 - - -Osteichthyes unid. 36.3 39.4 39.9 0.1 1.1 7.8 88.0 100.0 4.6
SEA TURTLE - - - - [7.6] - - - -SEA AND LAND BIRDS - - - - [0.2] [0.4] - - -MAMMALIA [61.6] - - - [30.1] [8.0] - - -ANIMAL REMAINS AND MISC. - [10.2] [0.8] [0.9] [4.2] [3.9] - - [2.0]
Number sampled 22 54 7 66 52 1199 2 1 15Number empty 13 36 4 35 12 617 0 0 9Mean stomach content (g or cm3) 180.8 60.3 12.7 40.5 1788.1 170.6 36.8 2.1 175.1Mean fish length (cm) 155 111 160 112 181 187 67 92 146Fish length range (cm) 66-210 73-212 104-240 60-196 102-305 53-356 54-81 - 128-204

Page 20
Table A-3. Diet composition and sampling data for Atlantic torpedo, rosette skate, barndoor skate, southern stingray, roughtail stingray, spinybutterfly ray, bullnose ray, cownose ray, and margined snake eel. (Data source: 1977-80 trawl survey. Data type: percentage byweight. Squared brackets indicate major taxon subtotal; parentheses indicate minor taxon subtotal.)
Predator Atlantic Rosette Barndoor Southern Roughtail Spiny Bullnose Cownose Margined
Stomach Contents torpedo skate skate stingray stingray butterfly ray ray ray snake eel
RHYNCHOCOELA - - - - - - [3.8] - -MOLLUSCA - [2.6] - - - - [84.9] - -
Gastropoda - - - - - - (1.1) - -Bivalvia - - - - - - (73.1) - -
Yoldia sp. - - - - - - 0.6 - -Ensis directus - - - - - - 26.3 - -
Bivalvia unid. - - - - - - 46.2 - -Cephalopoda - (2.6) - - - - - - -Nudibranchia - - - - - - (8.1) - -Mollusca unid. - - - - - - (2.6) - -
POLYCHAETA [<0.1] [0.7] - [0.3] [<0.1] - [2.2] - [31.7]Lumbrineris tenuis - - - - - - - - 31.1Polychaeta unid. - - - - - - - - 0.6
CRUSTACEA - [91.7] [100.0] [99.0] [68.8] - [6.4] [8.9] [68.1]Amphipoda - (1.0) - - - - (<0.1) - (6.4)
Melita sp. - - - - - - - - 1.2Leptocheirus pinguis - - - - - - - - 4.9Unciola irrorata - 0.8 - - - - - - -Amphipoda unid. - 0.2 - - - - <0.1 - 0.3
Mysidacea - (3.4) - - - - - (8.6) -Mysidopsis bigelowi - - - - - - - 8.5 -Mysidacea unid. - 3.4 - - - - - 0.1 -
Decapoda - (81.8) (100.0) (98.7) (68.7) - (6.2) (0.3) (61.7)Ranilia muricata - - - - - - 4.8 - -Dichelopandalus leptocerus - - 38.4 - - - - - -Crangon septemspinosa - 27.3 - <0.1 <0.1 - 0.2 0.1 34.3Pagurus sp. - - 5.8 - - - 0.2 0.2 -Cancer irroratus - 49.1 37.2 - <0.1 - 1.0 - -Cancer borealis - - 18.6 - - - - - -Ovalipes ocellatus - - - 68.1 68.7 - - - -Portunus sp. - - - 17.7 - - - - -Munidairis sp. - - - - - - - - 27.4Munida sp. - 5.0 - 0.2 - - - - -Decapoda unid. - 0.4 - 12.7 <0.1 - - <0.1 -
Crustacea unid. - (5.5) - (0.3) (0.1) - (0.2) - -OSTEICHTHYES [100.0] [1.7] - [0.7] [31.1] [6.9] [<0.1] [90.7] -
Ophichthus cruentifer - 1.6 - - - - - - -Anchoa hepsetus - - - - - - - 90.7 -Gadidae - - - - - - - - -Merluccius bilinearis 58.7 - - - - - - - -Stenotomus chrysops - - - - 7.2 - - - -Ammodytes dubius - - - - 23.9 - - - -Osteichthyes unid. 41.3 0.1 - 0.7 <0.1 6.9 <0.1 - -
ANIMAL REMAINS AND MISC. - [3.3] - - [0.1] [93.1] [2.7] [0.4] [0.2]
Number sampled 7 16 3 2 4 8 15 3 3Number empty 3 1 0 0 0 4 2 0 0Mean stomach content (g) 5.8 0.6 17.1 47.6 132.8 0.2 10.0 4.9 0.1Mean fish length (cm) 70 32 85 85 99 63 70 47 39Fish length range (cm) 25-125 19-42 78-92 84-87 76-129 52-112 37-123 40-52 36-42

Page 21
Table A-4. Diet composition and sampling data for slender snipe eel, conger eel, blueback herring, hickory shad, American shad, Atlantic threadherring, Spanish sardine, striped anchovy, and Atlantic salmon. (Subscripts indicate data source: 1 = 1977-80 trawl survey, and 4 =1963-66 trawl survey. Superscripts indicate data type: # = percentage by occurrence, and none = percentage by weight. Squaredbrackets indicate major taxon subtotal; parentheses indicate minor taxon subtotal.)
Predator Slender Conger Blueback Hickory American Atlantic Spanish Striped Atlantic
Stomach Contents snipe eel1 eel1 herring1 shad4# shad1 thread herring1 sardine1 anchovy1 salmon1
CTENOPHORA - - [42.5] - - - - - -CHAETOGNATHA - - - - [0.2] - - - -MOLLUSCA - - [<0.1] - [1.1] - - - -
Gastropoda - - <0.1 - - - - - -Bivalvia - - <0.1 - - - - - -Cephalopoda - - - - 1.1 - - - -
POLYCHAETA - - - - - - - [5.9] [4.6]Phyllodocidae - - - - - - - 0.2 -Lumbrineris tenuis - - - - - - - - -Polychaeta unid. - - - - - - - 5.7 4.6
CRUSTACEA [100.0] [0.1] [50.5] 25.0 [78.1] - [100.0] [82.3] [0.3]Copepoda - - (41.6) - (2.8) - (100.0) (0.3) -
Centropages sp. - - - - - - - 0.1 -Calanoida - - - - - - 100.0 0.2 -Copepoda unid. - - 41.6 - 2.8 - - - -
Amphipoda - (<0.1) (8.0) - (0.2) - - - -Parathemisto - - 8.0 - 0.2 - - - -Melita sp. - - - - - - - - -Leptocheirus pinguis - - - - - - - - -Amphipoda unid. - <0.1 - - - - - - -
Mysidacea - - - - - - - (78.8) -Neomysis americana - - - - - - - 30.9 -Mysidacea unid. - - - - - - - 47.9 -
Euphausiacea - - - - (74.6) - - - -Meganyctiphanes norvegica - - - - 59.7 - - - -Euphausiacea unid. - - - - 14.9 - - - -
Decapoda - - (0.9) 25.0 - - - (2.8) (0.3)Penaeidae - - - - - - - 1.7 -Callianassa setimanus - - - - - - - 1.1 -Crangon septemspinosa - - - 25.0 - - - - -Munidairis sp. - - - - - - - - -Decapoda larvae - - 0.9 - - - - - -Decapoda unid. - - - - - - - - 0.3
Crustacea unid. (100.0) (0.1) - - (0.5) - - (0.4) -OSTEICHTHYES - [96.5] - - [16.3] - - [0.3] -
Gadidae - 96.4 - - - - - - -Merluccius bilinearis - - - - 14.4 - - - -Osteichthyes scales - - - - - - - 0.3 -Osteichthyes unid. - 0.1 - - 1.9 - - - -
ANIMAL REMAINS AND MISC. - [3.4] [7.0] - [4.3] [41.6] [<0.1] [11.1] [95.1]SAND - - - - - [58.4] - [0.4] -
Number sampled 1 9 11 4 21 6 8 15 1Number empty 0 2 2 2 0 2 0 1 0Mean stomach content (g) <0.1 5.0 <0.1 NA 1.7 <0.1 <0.1 0.1 2.6Mean fish length (cm) 45 61 22 43 25 14 5 11 34Fish length range (cm) - 39-90 14-28 37-50 15-48 14-16 5-6 10-13 -

Page 22
Table A-5. Diet composition and sampling data for shortnose greeneye, inshore lizardfish, offshore lizardfish, snakefish, longnose lancetfish,lanternfish unclassified, Hygophum taaningi, Maurolicus weitzmani, and fourbeard rockling. (Subscripts indicate data source: 1 =1977-80 trawl survey, 3 = 1969-72 trawl survey, and 5 = Food Chain Dynamics Investigation special studies. Data type: percentage byweight. Squared brackets indicate major taxon subtotal; parentheses indicate minor taxon subtotal.)
Predator Shortnose Inshore Offshore Longnose Lanternfish Hygophum Maurolicus Fourbeard
Stomach Contents greeneye1 lizardfish1 lizardfish1 Snakefish1 lancetfish5 uncl.1 taaningi1 weitzmani3 rockling1
PLATYHELMINTHES - - - [7.7] - - - - -MOLLUSCA - - [96.2] - [1.0] - - - -
Bivalvia - - - - - - - - (0.7)Cephalopoda - - (96.2) - (1.0) - - - -
Octopodida - - - - 0.8 - - - -Cephalopoda unid. - - 96.2 - 0.2 - - - -
POLYCHAETA [10.7] - - - - - [0.5] - [65.7]Spionidae - - - - - - - - 20.7Polychaeta unid. 10.7 - - - - - 0.5 - 45.0
CRUSTACEA [68.8] - [1.3] - [96.1] [72.9] [99.0] [100.0] [1.2]Copepoda - - - - - (38.9) (48.4) (38.9) -
Pontellidae - - - - - - - 5.6 -Centropages sp. - - - - - 4.2 - - -Calanoida - - - - - - - 33.3 -Copepoda unid. - - - - - 34.7 48.4 - -
Stomatopoda - - - - - (3.3) - - -Amphipoda - - - - (74.5) (7.9) (0.9) - (0.2)
Parathemisto gaudichaudi - - - - - 2.8 - - -Parathemisto sp. - - - - 71.5 - - - -Prosina sp. - - - - 1.8 - - - -Platyscelidae - - - - 0.5 - - - -Pronima sp. - - - - 0.4 - - - -Hyperiidae - - - - 0.3 0.7 0.9 - -Ampelisca sp. - - - - - 4.4 - - -Amphipoda unid. - - - - - - - - 0.2
Mysidacea - - - - - (0.4) - - -Euphausiacea - - - - - (1.9) (36.1) - -
Euphausia krohni - - - - - - 35.2 - -Euphausiacea unid. - - - - - 1.9 0.9 - -
Decapoda - - (1.3) - (13.5) (20.5) (3.3) - -Lucifer faxoni - - - - - - 0.5 - -Crangon septemspinosa - - - - - 16.5 - - -Crabs unid. - - 1.3 - - - 2.8 - -Brachyuran (megalops) - - - - 13.5 - - - -Decapoda unid. - - - - - 4.0 - 2.8 -
Crustacea unid. (68.8) - - - (8.1) - (10.3) (61.1) (1.0)OSTEICHTHYES - [100.0] [2.5] - [2.8] [6.2] - - -
Ogcocephalidae - - - - 1.0 - - - -Osteichthyes unid. - 100.0 2.5 - 1.8 6.2 - - -
ANIMAL REMAINS AND MISC. [20.5] - - [92.3] [0.1] [20.9] [0.5] - [32.4]
Number sampled 6 2 6 3 2 10 9 16 7Number empty 0 1 0 2 0 0 0 6 1Mean stomach content (g) <0.1 0.2 0.7 <0.1 25.1 0.1 <0.1 <0.1 0.1Mean fish length (cm) 12 26 10 18 73 8 6 NA 22Fish length range (cm) 11-14 22-31 7-15 14-20 NA 8-10 6-7 NA 15-32

Page 23
Table A-6. Diet composition and sampling data for offshore hake, longfin hake, marlin-spike, longnose grenadier, grenadier unclassified,striped cusk-eel, Atlantic midshipman, and Atlantic needlefish. (Subscripts indicate data source: 1 = 1977-80 trawl survey, and3 = 1969-72 trawl survey. Data type: percentage by weight. Squared brackets indicate major taxon subtotal; parenthesesindicate minor taxon subtotal.)
Predator Offshore Longfin Marlin- Longnose Grenadier Striped Atlantic Atlantic
Stomach Contents hake1 hake1 spike1 grenadier1 uncl.1 cusk-eel1 midshipman1 needlefish3
MOLLUSCA - - - - - - [23.2] -Cephalopoda - - - - - - 23.2 -
POLYCHAETA - - [0.4] [80.1] [16.7] - - -Glycera sp. - - - 2.2 - - - -Nephtys incisa - - - 15.6 - - - -Nephtys sp. - - - 1.6 - - - -Ophelina sp. - - - 26.0 - - - -Spionidae - - - 0.2 - - - -Lumbrineris fragilis - - - 5.6 - - - -Lumbrineris sp. - - - 1.0 - - - -Ninoe nigripes - - - 5.4 - - - -Ampharetidae - - - - 4.4 - - -Polychaeta unid. - - 0.4 22.5 12.3 - - -
CRUSTACEA [82.5] [99.1] [99.6] [13.8] [27.3] [100.0] [7.9] [100.0]Copepoda - (3.7) - (0.3) - - - (100.0)
Calanus sp. - 1.7 - - - - - -Centropages sp. - - - 0.3 - - - -Calanoida - - - - - - - 100.0Copepoda unid. - 2.0 - - - - - -
Stomatopoda - - - - - - (0.4) -Cumacea - - (<0.1) (0.1) (0.2) - - -Isopoda - (0.2) (0.5) - (17.7) - - -
Cirolana sp. - 0.2 0.5 - 17.7 - - -Amphipoda - (0.3) - (5.5) (1.2) (29.7) (<0.1) -
Hyperiidae - 0.3 - - - - - -Ampelisca sp. - - - 2.0 - - <0.1 -Unciola sp. - - - 3.0 - - - -Amphipoda unid. - - - 0.5 1.2 29.7 - -
Mysidacea - - (0.1) - (4.6) - (1.6) -Pseudomma affine - - - - 4.6 - - -Mysidacea unid. - - 0.1 - - - 1.6 -
Euphausiacea (82.5) (57.6) (99.0) - - - - -Meganyctiphanes norvegica - 47.3 99.0 - - - - -Thysanoessa raschi 20.6 - - - - - - -Euphausiacea unid. 61.9 10.3 - - - - - -
Decapoda - - - (2.9) - (70.3) (2.8) -Crangon septemspinosa - - - 2.8 - 70.3 - -Decapoda unid. - - - 0.1 - - 2.8 -
Crustacea unid. - (37.3) - (5.0) (3.6) - (3.1) -OSTEICHTHYES - [0.5] - - - - [68.9] -
Engraulidae - - - - - - 64.5 -Osteichthyes unid. - 0.5 - - - - 4.4 -
ANIMAL REMAINS AND MISC. [17.5] [0.4] - [6.1] [56.0] - - -
Number sampled 17 17 10 18 3 2 10 5Number empty 14 4 1 0 0 0 1 4Mean stomach content (g) <0.1 0.2 0.3 0.2 0.1 0.1 0.1 <0.1Mean fish length (cm) 27 20 20 15 26 25 14 NAFish length range (cm) 13-35 16-35 15-26 10-23 26 22-29 14 NA

Page 24
Table A-7. Diet composition and sampling data for Atlantic saury, silverside unclassified, buckler dory, deepbody boarfish, threespinestickleback, red cornetfish, cornetfish unclassified, and longspine snipefish. (Subscripts indicate data source: 1 = 1977-80trawl survey, 3 = 1969-72 trawl survey, and 5 = Food Chain Dynamics Investigation special studies. Superscripts indicate datatype: # = percentage by occurrence, and none = percentage by weight. Squared brackets indicate major taxon subtotal;parentheses indicate minor taxon subtotal.)
Predator Atlantic Silverside Buckler Deepbody Threespine Red Cornetfish Longspine
Stomach Contents saury5 uncl.3 dory3 boarfish1 stickleback1 cornetfish1 uncl.1 snipefish3#
HYDROZOA [54.4] - - - - - - -Siphonophora 54.4+ - - - - - - -
CRUSTACEA [45.6] [100.0] - [43.1] [25.0] - [73.3] 66.7Copepoda - - - (4.2) (25.0) - - -
Metridia sp. - - - 3.6 - - - -Calanoida - - - - - - - 16.7Copepoda unid. - - - 0.6 25.0 - - -
Cumacea - - - (0.9) - - - -Bodotriidae - - - 0.9 - - - -
Amphipoda - (100.0) - (0.3) - - - -Hyperiidae - - - 0.2 - - - -Caprellidae - 100.0 - - - - - -Gammaridea - - - - - - - 66.7Amphipoda unid. - - - 0.1 - - - -
Mysidacea - - - - - - (73.3) -Praunus flexuosus - - - - - - 73.3 -
Euphausiacea (45.6)+ - - - - - - -Crustacea unid. - - - (37.7) - - - -
OSTEICHTHYES - - [100.0] [3.3] [75.0] [100.0] [26.7] -Stenotomus chrysops - - 32.1 - - - - -Labridae - - - - - 91.0 - -Percophidae - - - - - 1.5 - -Osteichthyes larvae - - - - 75.0 - - -Osteichthyes unid. - - 67.9 3.3 - 7.5 26.7 -
ANIMAL REMAINS AND MISC. - - - [53.6] - - - 16.7
Number sampled 30 36 5 5 1 5 1 6Number empty 2 30 2 0 0 0 0 2Mean stomach content (g) 0.7 <0.1 5.4 0.6 <0.1 11.0 <0.1 NAMean fish length (cm) 32 NA NA 12 5 69 32 NAFish length range (cm) NA NA NA 12-14 - 43-115 - NA
+ Not a positive identification due to being well digested.

Page 25
Table A-8. Diet composition and sampling data for scorpionfish unclassified, armored searobin, spiny searobin, striped searobin, bluespottedsearobin, searobin unclassified, hookear sculpin unclassified, shorthorn sculpin, and bigeye sculpin. (Subscripts indicate data source: 1= 1977-80 trawl survey, and 3 = 1969-72 trawl survey. Data type: percentage by weight. Squared brackets indicate major taxonsubtotal; parentheses indicate minor taxon subtotal.)
Predators Scorpionfish Armored Spiny Striped Bluespotted Searobin Hookear Shorthorn Bigeye
Stomach Contents uncl.1 searobin1 searobin1 searobin1 searobin1 uncl.1 sculpin1 sculpin3 sculpin3
MOLLUSCA - - - [0.1] - - [12.1] - -Bivalvia - - - 0.1 - - 12.1 - -
ANNELIDA - - - - - - [56.1] - [47.9]Polychaeta - - - - - - (54.2) - (47.9)
Nephtyidae - - - - - - 34.4 - -Polychaeta unid. - - - - - - 19.8 - 47.9
Annelida - - - - - - (1.9) - -CRUSTACEA [100.0] [87.1] [100.0] [22.6] [100.0] [44.4] [25.3] [61.3] [50.3]
Stomatopoda - (10.1) - - - - - - -Heterosquilla armata - 10.1 - - - - - - -
Cumacea - - - - - - 0.3 - -Amphipoda - (14.9) - - - - (17.6) (<0.1) (9.6)
Harpinia propinqua - - - - - - 0.3 - -Unciola irrorata - 12.2 - - - - - - -Amphipoda unid. - 2.7 - - - - 17.3 <0.1 9.6
Mysidacea - - - - - - - - (3.6)Decapoda (100.0) (38.8) - (21.3) - - - (58.4) (34.7)
Pasiphaeidae - - - - - - - 47.6 -Crangonidae - 6.8 - - - - - - -Crangon septemspinosa - - - 6.0 - - - - -Decapod shrimp - - - - - - - - 12.0Cancer irroratus - 9.1 - 2.6 - - - - -Pelia mutica - - - - - - - 6.0 -Munida sp. - 22.9 - - - - - - -Pilumnus sayi 100.0 - - - - - - - -Crab unid. - - - 12.7 - - - - -Decapoda unid. - - - - - - - 4.8 22.7
Crustacea unid. - (23.3) (100.0) (1.3) (100.0) (44.4) (7.4) (2.9) (2.4)OSTEICHTHYES - [1.1] - [77.3] - - - - -ANIMAL REMAINS AND MISC. - [11.8] - - - [55.6] [6.5] [38.7] [1.8]
Number sampled 1 24 1 7 1 8 22 10 21Number empty 0 8 0 2 0 4 2 2 6Mean stomach content (g) 0.5 <0.1 <0.1 0.6 <0.1 <0.1 <0.1 <0.1 0.1Mean fish length (cm) 20 25 13 30 16 8 6 153 NAFish length range (cm) - 7-34 - 21-39 - 5-11 4-8 NA NA

Page 26
Table A-9. Diet composition and sampling data for alligatorfish, lumpfish, Atlantic seasnail, striped bass, sand perch, red grouper, scamp, andbigeye. (Subscripts indicate data source: 1 = 1977-80 trawl survey, and 3 = 1969-72 trawl survey. Data type: percentage by weight.Squared brackets indicate major taxon subtotal; parentheses indicate minor taxon subtotal.)
Predator Alligator- Alligator- Atlantic Striped Sand Red
Stomach Contents fish1 fish3 Lumpfish1 seasnail3 bass1 perch1 grouper3 Scamp1 Bigeye1
MOLLUSCA - - - - - - [100.0] [<0.1] -Gastropoda - - - - - - - (<0.1) -Cephalopoda - - - - - - (100.0) - -
Octopodida - - - - - - 100.0 - -POLYCHAETA - - [10.9] - - - - - [21.2]
Nereidae - - 10.9 - - - - - -Polychaeta unid. - - - - - - - - 21.2
CRUSTACEA [100.0] [100.0] [0.8] [100.0] - - - [3.0] [15.4]Copepoda - - (0.4) - - - - (<0.1) -Amphipoda (100.0) (86.3) - (100.0) - - - - -
Stenopleustes gracilis 18.2 - - - - - - - -Dyopedos porrectus 81.8 - - - - - - - -Aoridae - 36.0 - - - - - - -Caprellidae - 49.3 - - - - - - -Gammaridea - - - 100.0 - - - - -Amphipoda unid. <0.1 1.0 - - - - - - -
Decapoda - (3.4) (0.4) - - - - (3.0) -Portunus spinicarpus - - - - - - - 2.5 -Decapoda larvae - - 0.4 - - - - - -Decapoda unid. - 3.4 - - - - - 0.5 -Crustacea unid. - (10.3) - - - - - - 15.4
ASCIDIACEA - - [29.4] - - - - - -OSTEICHTHYES - - - - [100.0] [100.0] - [97.0] -
Brevoortia tryannus - - - - 68.8 - - - -Urophycis chuss - - - - 30.1 - - - -Macrozoarces americanus - - - - 1.1 - - - -Cyprinodon variegatus - - - - - - - 95.7 -Osteichthyes larvae - - - - - 2.5 - - -Osteichthyes unid. - - - - - 97.5 - 1.3 -
ANIMAL REMAINS AND MISC. - - [58.9] - - - - - [63.4]
Number sampled 1 23 2 2 2 3 1 3 2Number empty 0 5 0 0 0 1 0 1 0Mean stomach content (g) <0.1 <0.1 27.9 <0.1 542.3 0.4 <0.1 14.2 <0.1Mean fish length (cm) 9 NA 35 NA 107 20 NA 71 18Fish length range (cm) - NA 31-40 NA 102-112 18-24 NA 54-99 18

Page 27
Table A-10. Diet composition and sampling data for tilefish, cobia, Atlantic bumper, round scad, bigeye scad, greater amberjack, bandedrudderfish, rough scad, and vermilion snapper. (Data source: 1977-80 trawl survey. Data type: percentage by weight. Squaredbrackets indicate major taxon subtotal; parentheses indicate minor taxon subtotal.)
Predator Atlantic Round Bigeye Greater Banded Rough Vermilion
Stomach Contents Tilefish Cobia bumper scad scad amberjack rudderfish scad snapper
MOLLUSCA [0.2] [12.9] [<0.1] [17.1] - - - - [81.7]Gastropoda (0.1) - (<0.1) (17.1) - - - - -Bivalvia (0.1) - (<0.1) - - - - - -
Pectinidae 0.1 - - - - - - - -Bivalvia unid. - - <0.1 - - - - - -
Cephalopoda - (12.9) - - - - - - -Illex sp. - 12.9 - - - - - - -Cephalopoda unid. - - - - - - - - 81.7
POLYCHAETA [0.2] - - - - - - - -CRUSTACEA [21.9] [54.3] - - [14.7] - [3.0] [38.0] [0.1]
Copepoda - - - - - - - (25.7) (<0.1)Isopoda (1.2) - - - - - - - -
Cirolana polita 1.0 - - - - - - - -Isopoda unid. 0.2 - - - - - - - -
Amphipoda (0.2) - - - - - - - (0.1)Euphausiacea (0.5) - - - - - - - -Decapoda (4.4) (54.3) - - (10.6) - (3.0) - (<0.1)
Euprognatha rastellifera 1.6 - - - - - - - -Ovalipes ocellatus - 28.4 - - - - - - -Bathynectes sp. - 13.8 - - - - - - -Munida irrasa 1.3 - - - - - - - -Shrimp unid. - - - - - - 3.0 - -Crabs unid. - - - - 10.6 - - - -Decapoda unid. 1.5 12.1 - - - - - <0.1 <0.1
Crustacea unid. (15.6) - - - (4.1) - - (12.3) -ECHINODERMATA [74.8] - - - - - - - -
Ophiuroidea (74.8) - - - - - - - -Amphioplus sp. 10.4 - - - - - - - -Amphiuridae 64.4 - - - - - - - -
ASCIDIACEA - - - - - - - - [16.4]OSTEICHTHYES [<0.1] [29.5] - - [13.6] [100.0] [97.0] - [0.5]
Myoxo. octodecemspinosus - - - - - 32.4 - - -Scophthalmus aquosus - 28.4 - - - - - - -Pleuronectiformes - 1.1 - - - - - - -Osteichthyes scales - - - - 1.8 - - - -Osteichthyes unid. <0.1 - - - 11.8 67.6 97.0 - 0.5
ANIMAL REMAINS AND MISC. [2.9] [3.3] [100.0] [82.9] [71.7] - - [62.0] [1.3]
Number sampled 9 3 5 5 10 3 2 11 10Number empty 3 0 1 2 0 0 0 0 1Mean stomach content (g) 0.8 24.0 <0.1 <0.1 <0.1 133.7 3.8 <0.1 0.8Mean fish length (cm) 39 94 10 14 13 96 18 13 17Fish length range (cm) 25-45 84-100 9-16 14-16 13-15 92-100 18 12-15 12-24

Page 28
Table A-11. Diet composition and sampling data for tomtate, white grunt, pigfish, whitebone porgy, spottail pinfish, pinfish, silver perch,banded drum, and Atlantic spadefish. Data source: 1977-80 trawl survey. Data type: percentage by weight. Squared bracketsindicate major taxon subtotal; parentheses indicate minor taxon subtotal.)
Predator White Whitebone Spottail Silver Banded Atlantic
Stomach Contents Tomtate grunt Pigfish porgy pinfish Pinfish perch drum spadefish
CNIDARIA - - - - [50.6] [16.3] - - -Hydrozoa - - - - 19.7 - - - -Anthozoa - - - - 30.9 16.3 - - -
MOLLUSCA - [40.8] - - [14.9] [81.3] - - -Bivalvia - 17.9 - - 14.9 - - - -Mollusca unid. - 22.9 - - - 81.3 - - -
POLYCHAETA [5.6] [18.9] [61.2] - - - - - -Glyceridae - - 3.1 - - - - - -Diopatra cuprea - - 17.6 - - - - - -Lumbrineris sp. 1.2 - - - - - - - -Arabellidae - 2.2 - - - - - - -Terebellidae - 7.1 - - - - - - -Polychaeta unid. 4.4 9.6 40.5 - - - - - -
SIPUNCULA - - [9.8] - - - - - -CRUSTACEA [6.6] [17.5] [6.5] - [9.8] - [100.0] [100.0] -
Stomatopoda - (4.0) - - - - - - -Amphipoda (3.7) (0.3) (0.2) - (5.2) - - (1.4) -
Aeginina longicornis - - - - 5.1 - - - -Gammaridea - - - - - - - 1.4 -Amphipoda unid. 3.7 0.3 0.2 - 0.1 - - - -
Mysidacea - - - - - - (100.0) (64.4) -Mysidopsis bigelowi - - - - - - 100.0 64.4 -
Decapoda (1.0) (13.2) (5.8) - (4.6) - - (19.9) -Acetes americanus - - 0.3 - 2.1 - - - -Crangon septemspinosa 1.0 - - - - - - - -Shrimps unid. - 0.3 5.1 - - - - - -Crabs unid. - 6.6 0.1 - - - - 19.9 -Decapoda unid. - 6.3 0.3 - 2.5 - - - -
Crustacea unid. (1.9) (<0.1) (0.5) - - - - (14.3) -ECHINODERMATA - [1.7] - - [1.0] [0.7] - - -
Echinoidea - 0.8 - - - - - - -Ophiuroidea - 0.5 - - 1.0 0.7 - - -Echinodermata unid. - 0.4 - - - - - - -
OSTEICHTHYES [0.4] [13.1] - [100.0] [0.2] [1.7] - - -Anchoa sp. - - - 90.6 - - - - -Engraulidae - - - - - 1.7 - - -Osteichthyes unid. 0.4 13.1 - 9.4 0.2 - - - -
ANIMAL REMAINS AND MISC. [87.4] [8.0] [22.5] - [23.5] - - - [100.0]
Number sampled 23 14 11 11 6 11 5 11 1Number empty 9 3 1 9 1 6 4 3 0Mean stomach content (g) 0.1 1.5 0.4 0.1 0.2 0.2 <0.1 <0.1 <0.1Mean fish length (cm) 15 29 18 27 17 16 19 15 12Fish length range (cm) 11-19 24-39 16-24 20-32 12-20 15-18 18-20 14-20 -

Page 29
Table A-12. Diet composition and sampling data for hogfish, tautog, Atlantic soft pout, radiated shanny, wrymouth, southern stargazer,Atlantic cutlassfish, little tunny, and Atlantic bonito. (Subscripts indicate data source: 1 = 1977-80 trawl survey, and 4 = 1963-66trawl survey. Superscripts indicate data type: # = percentage by occurrence, and none = percentage by weight. Squared bracketsindicate major taxon subtotal; parentheses indicate minor taxon subtotal.)
Predator Atlantic Radiated Southern Atlantic Little Atlantic
Stomach Contents Hogfish1 Tautog4# soft pout1 shanny1 Wrymouth1 stargazer1 cutlassfish1 tunny1 bonito1
MOLLUSCA [29.7] - - - - - - - [19.3]Cephalopoda - - - - - - - - (19.3)
Loligo sp. - - - - - - - - 19.3Mollusca unid. (shell) (29.7) - - - - - - - -
POLYCHAETA - - - [2.3] - - - - -CRUSTACEA [30.6] 66.7 [100.0] [5.4] [100.0] - [30.0] [0.6] -
Copepoda - - (100.0) - - - - - -Amphipoda - - - (5.4) - - - (0.6) -
Leptocheirus plumulosus - - - 0.8 - - - - -Metopella angusta - - - 2.3 - - - - -Bathymedon saussurei - - - 1.5 - - - - -Gammarus lawrencianus - - - - - - - 0.6 -Gammaridea - - - 0.8 - - - - -
Mysidacea - - - - - - (0.1) - -Decapoda (0.9) 66.7 - - (100.0) - (21.9) - -
Acetes americanus - - - - - - 20.4 - -Pandalidae - - - - 100.0 - - - -Stenocionops furcata 0.9 - - - - - - - -Callianassa setimanus - - - - - - 1.5 - -Decapoda unid. - 66.7 - - - - - - -
Crustacea unid. (29.7) - - - - - (8.0) - -OSTEICHTHYES - - - - - [100.0] [69.2] [99.3] [80.7]
Etrumeus teres - - - - - - - 66.3 -Osteichthyes unid. - - - - - 100.0 69.2 33.0 80.7
ANIMAL REMAINS AND MISC. [39.7] - - [92.3] - - [0.8] [0.1] -
Number sampled 1 3 3 6 1 1 11 1 3Number empty 0 1 2 1 0 0 0 0 0Mean stomach content (g) 5.7 NA <0.1 <0.1 0.6 2.1 0.1 31.7 8.5Mean fish length (cm) 55 31 11 12 23 22 48 65 52Fish length range (cm) - 24-40 11 11-15 - - 44-53 - 50-54

Page 30
Table A-13. Diet composition and sampling data for chub mackerel, king mackerel, Spanish mackerel, swordfish, harvestfish, duskyflounder, and planehead filefish. (Subscripts indicate data source: 1 = 1977-80 trawl survey, and 2 = Apex PredatorsInvestigation studies. Superscripts indicate data type: * = percentage by volume, and none = percentage by weight. Squaredbrackets indicate major taxon subtotal; parentheses indicate minor taxon subtotal.)
Predator Chub King Spanish Harvest- Dusky Planehead
Stomach Contents mackerel1 mackerel1 mackerel1 Swordfish2* fish1 flounder1 filefish1
MOLLUSCA - [0.1] [16.5] [67.4] - - [5.8]Bivalvia - - - - - - (<0.1)Cephalopoda - (0.1) (16.5) (67.4) - - (5.8)
Illex illecebrosus - - - 25.5 - - -Loligo sp. - - - 0.1 - - -Cephalopoda unid. - 0.1 16.5 41.8 - - 5.8
POLYCHAETA - - - - - - [66.7]CRUSTACEA [12.6] - [0.4] - - [91.3] -
Copepoda (12.6) - - - - - -Decapoda - - (0.4) - - (25.5) -
Pandalidae - - 0.4 - - - -Crab unid. - - - - - 25.5 -
Crustacea unid. - - (<0.1) - - (65.8) -ECHINODERMATA - - - - - - [1.7]
Ophiuroidea - - - - - - 1.7LARVACEA [3.7] - - - - - -OSTEICHTHYES [0.8] [99.9] [82.5] [32.5] - [8.7] -
Brevoortia tryannus - - - 0.5 - - -Clupea harengus - - - 0.2 - - -Etrumeus teres - 33.8 60.3 - - - -Anchoa hepsetus - - 6.3 - - - -Paralepis atlantica - - - 0.3 - - -Alepisauridae - - - 0.5 - - -Merluccius bilinearis - - - 9.4 - - -Gadidae - - - 2.6 - - -Pomatomus saltatrix - - - 4.0 - - -Ammodytes dubius - - - 0.2 - - -Gempylidae - - - 0.2 - - -Scomber scombrus - - - 5.4+ - - -Scombridae - 50.3 - - - - -Cubiceps athenae - - - 0.6 - - -Peprilus triacanthus - - - 1.5 - - -Sebastes fasciatus - - - 2.4 - - -Osteichthyes unid. 0.8 15.8 15.9 4.7 - 8.7 -
ANIMAL REMAINS AND MISC. [82.9] - [0.6] [0.1] [100.0] - [25.8]
Number sampled 25 5 12 168 2 1 8Number empty 1 1 0 17 0 0 4Mean stomach content (g or m3) 0.1 12.2 3.0 702.3 0.2 0.2 <0.1Mean fish length (cm) 18 65 37 153 12 23 8Fish length range (cm) 14-21 56-75 30-62 78-283 10-14 - 5-19
+ Atlantic mackerel was used as bait.

Page 32
APPENDIX B
Overall Prey of 60 Predators Which Were Fully Sampled and Well Represented in Collections
during the NEFSC’s 1977-80 Bottom Trawl Surveys
Stomach content data for 60 predator species sampledduring the 1977-80 NEFSC bottom trawl surveys arepresented in Tables B-1 though B-60. These tablesrepresent predator species for which 25 or more individualseach were sampled.
For 44 of these 60 species, stomach content data aregiven according both to predator length categories and togeographic areas of collection. Those 44 species wereselected based on the greatest number of individuals (atleast 25) and areas (at least two) represented by thesamples. For the remaining 16 of these 60 species,stomach content data are given according only to predatorlength categories.
The tables for the 44 predators listed by both predatorlength and geographic area have two subtable numbers
(e.g., Tables B-1a and B-1b, respectively). The tables forthe 16 predators listed by only predator length have onemain table number (e.g., Table B-3).
Stomach content data have been summarized, whennecessary, to fit on one page to aid in making comparisonsamong predator species. Whenever the list of prey specieshad to be so summarized, fish prey, in almost everyinstance, were left intact at the expense of those other preywhich had contributed the least percentage by weight to thepredator’s diet, and which were then condensed into highertaxonomic groups. In instances when the list of fish preyhad to be summarized, only species which made up <1% ofthe total stomach contents by weight and which were notcommercially important were then lumped into highertaxonomic groups.

Page 33

Page 34
Table B-1a. Diet composition and sampling data for northern shortfin squid by squid length category. (Samples gathered during 1977-80.Data expressed as percentage of stomach content by weight. Squared brackets indicate major taxon subtotal; parenthesesindicate minor taxon subtotal.)
Length Category (cm) Stomach Contents 1-5 6-10 11-15 16-20 21-25 26-30 31-35 >35 Total
PLATYHELMINTHES [0.2] [<0.1] [0.1] [0.7] [0.5] [0.4] [<0.1] [8.9] [0.5]Cestoda 0.2 <0.1 0.1 0.4 0.3 0.2 <0.1 - 0.3Trematoda - - - 0.3 0.2 0.2 - 8.9 0.2
RHYNCHOCOELA - - - [<0.1] - [<0.1] - [0.5] [<0.1]NEMATODA - [<0.1] [<0.1] [<0.1] [<0.1] [<0.1] - [0.2] [<0.1]CHAETOGNATHA - [0.1] [1.8] [<0.1] [<0.1] [<0.1] - - [0.1]
Sagitta elegans - - - <0.1 - - - - <0.1Chaetognatha unid. - 0.1 1.8 - <0.1 <0.1 - - 0.1
CEPHALOPODA - [2.0] [16.2] [8.4] [20.8] [61.6] [96.0] [83.9] [34.6]Loligo sp. - - - - <0.1 - - - <0.1Cephalopoda unid. - 2.0 16.2 8.4 20.8 61.6 96.0 83.9 34.6
POLYCHAETA - - [0.7] - [<0.1] [<0.1] - - [<0.1]CRUSTACEA [0.5] [14.6] [7.3] [36.4] [19.4] [7.8] - - [16.6]
Copepoda - - - (<0.1) (<0.1) - - - (<0.1)Cumacea - - - - (<0.1) - - - (<0.1)Amphipoda - - - (<0.1) (<0.1) - - - (<0.1)
Hyperiidae - - - <0.1 <0.1 - - - <0.1Ampeliscidae - - - - <0.1 - - - <0.1Unciola irrorata - - - - <0.1 - - - <0.1Unciola sp. - - - - <0.1 - - - <0.1Caprellidae - - - <0.1 <0.1 - - - <0.1Amphipoda unid. - - - - <0.1 - - - <0.1
Mysidacea - - - - (<0.1) - - - (<0.1)Euphausiacea - - - (12.5) (3.1) (1.4) - - (3.3)
Meganyctiphanes norvegica - - - <0.1 0.3 0.1 - - 0.2Euphausiacea unid. - - - 12.5 2.8 1.3 - - 3.1
Decapoda - - (0.5) (1.5) (0.3) (<0.1) - - (0.4)Dichelopandalus leptocerus - - - - 0.2 - - - 0.1Pandalidae - - - - <0.1 - - - <0.1Crangon septemspinosa - - - - <0.1 - - - <0.1Crab unid. - - <0.1 0.2 0.1 - - - 0.1Shrimp unid. - - - <0.1 <0.1 <0.1 - - <0.1Decapoda larvae - - - <0.1 <0.1 - - - <0.1Decapoda unid. - - 0.5 1.3 <0.1 - - - 0.2
Crustacea unid. (0.5) (14.6) (6.8) (22.4) (16.0) (6.4) - - (12.9)SALPIDAE - - - - [<0.1] [0.1] - - [<0.1]CHONDRICHTHYES - - - - [0.2] - - - [0.1]
Rajidae - - - - 0.2 - - - 0.1OSTEICHTHYES [96.1] [6.0] [20.7] [9.9] [27.5] [8.5] - [6.5] [18.9]
Gadidae - - - - <0.1 0.5 - - 0.2Osteichthyes eggs - - - - <0.1 - - - <0.1Osteichthyes unid. 96.1 6.0 20.7 9.9 27.5 8.0 - 6.5 18.7
ANIMAL REMAINS AND MISC. [3.2] [77.3] [53.2] [44.6] [31.6] [21.6] [4.0] - [29.2]
Number sampled 11 145 357 599 1064 257 10 4 2447Number empty 0 48 116 164 226 69 4 1 628Mean stomach content (g) 0.173 0.068 0.246 0.525 1.638 3.912 11.523 0.516 1.340Mean squid length (cm) 4 8 13 18 22 27 31 39 19

Page 35
Table B-1b. Diet composition and sampling data for northern shortfin squid by geographic area. (Samples gathered during 1977-80.Data expressed as percentage of stomach content by weight. Squared brackets indicate major taxon subtotal; parenthesesindicate minor taxon subtotal.)
Geographic Area Inshore
Southern NorthMiddle New Georges Gulf of Scotian of Cape
Stomach Contents Atlantic England Bank Maine Shelf Hatteras
PLATYHELMINTHES [1.0] [0.4] [0.6] [0.3] [0.3] [<0.1]Cestoda 1.0 0.4 0.3 0.1 <0.1 <0.1Trematoda <0.1 <0.1 0.3 0.2 0.3 -
RHYNCHOCOELA - [<0.1] - - [<0.1] -NEMATODA [<0.1] [<0.1] [<0.1] [<0.1] [<0.1] [<0.1]CHAETOGNATHA [<0.1] [<0.1] [0.3] - - -
Sagitta elegans - - <0.1 - - -Chaetognatha unid. <0.1 <0.1 0.3 - - -
CEPHALOPODA [36.1] [30.3] [40.8] [22.7] [70.0] [3.2]Loligo sp. - - - - <0.1 -Cephalopoda unid. 36.1 30.3 40.8 22.7 70.0 3.2
POLYCHAETA - - - - [<0.1] [0.1]CRUSTACEA [9.7] [19.8] [22.0] [26.4] [4.8] [3.9]
Copepoda - (<0.1) (<0.1) - - (<0.1)Cumacea (<0.1) - - - - -Amphipoda (<0.1) (<0.1) (<0.1) - (<0.1) -
Hyperiidae <0.1 - - - <0.1 -Ampeliscidae - <0.1 - - - -Unciola irrorata <0.1 - - - - -Unciola sp. - - <0.1 - - -Caprellidae - <0.1 <0.1 - - -Amphipoda unid. <0.1 <0.1 <0.1 - - -
Mysidacea - - (<0.1) - (<0.1) -Euphausiacea - (12.9) (1.8) (4.6) (0.2) (0.3)
Meganyctiphanes norvegica - <0.1 <0.1 0.8 - -Euphausiacea unid. - 12.9 1.8 3.8 0.2 0.3
Decapoda (1.2) (1.2) (<0.1) (<0.1) (<0.1) (<0.1)Dichelopandalus leptocerus - 0.6 <0.1 - - -Pandalidae - <0.1 - - - -Crangon septemspinosa - <0.1 <0.1 - - -Crab unid. - 0.6 <0.1 - - <0.1Shrimp unid. - <0.1 <0.1 <0.1 <0.1 -Decapoda larvae <0.1 - <0.1 - - -Decapoda unid. 1.2 <0.1 <0.1 <0.1 - -
Crustacea unid. (8.5) (5.7) (20.2) (21.8) (4.6) (3.6)SALPIDAE - - [0.2] - - -CHONDRICHTHYES - - [0.4] - - -
Rajidae - - 0.4 - - -OSTEICHTHYES [23.0] [12.3] [5.2] [13.1] [7.1] [73.3]
Gadidae 1.5 - - - - -Osteichthyes eggs - - <0.1 - - -Osteichthyes unid. 21.5 12.3 5.2 13.1 7.1 73.3
ANIMAL REMAINS AND MISC. [30.2] [37.2] [30.5] [37.5] [17.8] [19.5]
Number sampled 423 518 792 318 202 195Number empty 116 134 201 73 67 37Mean stomach content (g) 0.783 0.820 1.056 2.341 2.564 2.180Mean squid length (cm) 19 18 19 22 23 19

Page 36
Table B-2a. Diet composition and sampling data for longfin inshore squid by squid length category. (Samples gathered during 1977-80.Data expressed as percentage of stomach content by weight. Squared brackets indicate major taxon subtotal; parenthesesindicate minor taxon subtotal.)
Length Category (cm) Stomach Contents 1-5 6-10 11-15 16-20 21-25 26-30 31-35 Total
CESTODA - [<0.1] [<0.1] [<0.1] [<0.1] [0.1] - [<0.1]CHAETOGNATHA [0.6] [0.1] [0.1] [<0.1] - - - [0.1]
Sagitta elegans - <0.1 <0.1 - - - - <0.1Chaetognatha unid. 0.6 0.1 0.1 <0.1 - - - 0.1
MOLLUSCA - [2.8] [5.1] [8.4] [2.3] [10.9] [9.5] [5.6]Gastropoda - - - <0.1 - - - <0.1Bivalvia - - - - <0.1 - - <0.1Cephalopoda - 2.8 5.1 8.4 2.3 10.9 9.5 5.6
POLYCHAETA - [0.3] [<0.1] - [<0.1] - - [<0.1]Opheliidae - - - - <0.1 - - <0.1
Nereis zonata - - - - <0.1 - - <0.1Polychaeta unid. - 0.3 <0.1 - - - - <0.1
CRUSTACEA [1.8] [4.2] [7.0] [3.8] [5.8] [0.7] - [4.7]Copepoda - (0.6) (<0.1) - (<0.1) - - (0.1)
Candacia sp. - 0.6 - - - - - 0.1Calanoida - - <0.1 - <0.1 - - <0.1Copepoda unid. - <0.1 <0.1 - - - - <0.1
Amphipoda (0.2) (0.4) (0.3) (<0.1) (<0.1) (<0.1) - (0.2)Hyperiidae - 0.2 <0.1 <0.1 <0.1 - - 0.1Ampeliscidae - - - - - <0.1 - <0.1Gammaridea 0.2 0.2 0.3 - - - - 0.1Amphipoda unid. - <0.1 - - - - - <0.1
Mysidacea - (<0.1) (<0.1) (<0.1) (<0.1) - - (<0.1)Euphausiacea - (0.8) (3.5) (2.1) (3.7) - - (2.1)
Meganyctiphanes norvegica - - 0.5 <0.1 - - - 0.2Euphausiacea unid. - 0.8 3.0 2.1 3.7 - - 1.9
Decapoda - (<0.1) (0.4) (<0.1) (<0.1) (0.7) - (0.2)Crangon septemspinosa - - <0.1 <0.1 - - - <0.1Munida iris - - <0.1 - - 0.7 - 0.1Lithodidae - - - <0.1 - - - <0.1Crab unid. - - - <0.1 - <0.1 - <0.1Shrimp unid. - <0.1 - - - - - <0.1Decapoda unid. - <0.1 0.4 <0.1 <0.1 - - 0.1
Crustacea unid. (1.6) (2.4) (2.8) (1.7) (2.1) (<0.1) - (2.1)OSTEICHTHYES [3.1] [5.6] [11.4] [12.3] [23.7] [17.0] [3.4] [13.7]
Gadidae - - <0.1 0.2 - <0.1 - 0.1Ammodytes dubius - - - - 1.0 - - 0.2Osteichthyes larvae - 0.1 - - - - - <0.1Osteichthyes unid. 3.1 5.5 11.4 12.1 22.7 17.0 3.4 13.4
ANIMAL REMAINS AND MISC. [94.5] [87.0] [76.4] [75.5] [68.2] [71.3] [87.1] [75.9]
Number sampled 165 810 822 444 189 59 9 2498Number empty 78 178 214 132 49 15 3 669Mean stomach content (g) 0.028 0.231 0.449 0.976 1.503 1.055 1.568 0.542Mean squid length (cm) 4 8 12 17 22 27 32 12

Page 37
Table B-2b. Diet composition and sampling data for longfin squid by geographic area. (Samples gathered during 1977-80. Dataexpressed as percentage of stomach content by weight. Squared brackets indicate major taxon subtotal; parentheses indicateminor taxon subtotal.)
Geographic Area Offshore Inshore Inshore
Southern South South North Middle New Georges Gulf of Scotian of Cape of Cape of Cape
Stomach Contents Atlantic England Bank Maine Shelf Hatteras Hatteras Hatteras
CESTODA [<0.1] [<0.1] [<0.1] [2.3] - - - [<0.1]CHAETOGNATHA [0.2] [0.1] [<0.1] - - - - [<0.1]
Sagitta elegans - <0.1 - - - - - -Chaetognatha unid. 0.2 0.1 <0.1 - - - - <0.1
MOLLUSCA [10.1] [8.0] [0.3] - - [8.0] [0.5] [8.0]Gastropoda - <0.1 - - - - - -Bivalvia - <0.1 - - - - - -Cephalopoda 10.1 8.0 0.3 - - 8.0 0.5 8.0
POLYCHAETA [<0.1] [<0.1] [<0.1] - - - - [0.4]Opheliidae <0.1 - - - - - - -Nereis zonata <0.1 - - - - - - -Polychaeta unid. - <0.1 <0.1 - - - - 0.4
CRUSTACEA [3.6] [7.5] [3.1] [70.1] - [1.8] [0.9] [4.9]Copepoda (0.4) (<0.1) - - - - - (<0.1)
Candacia sp. 0.4 - - - - - - -Calanoida - - - - - - - <0.1Copepoda unid. <0.1 <0.1 - - - - - -
Amphipoda (0.2) (<0.1) (<0.1) - - (<0.1) - (0.8)Hyperiidae 0.2 <0.1 <0.1 - - - - -Ampeliscidae <0.1 - - - - - - -Gammaridea - - <0.1 - - <0.1 - 0.8Amphipoda unid. - <0.1 - - - - - -
Mysidacea (<0.1) (<0.1) - - - - - (<0.1)Euphausiacea (0.5) (6.6) (1.0) - - - - -
Meganyctiphanes norvegica <0.1 - 0.4 - - - - -Euphausiacea unid. 0.5 6.6 0.6 - - - - -
Decapoda (0.2) (<0.1) (<0.1) - - - - (1.3)Crangon septemspinosa <0.1 - - - - - - 0.3Munida iris 0.2 - - - - - - -Lithodidae <0.1 - - - - - - -Crab unid. <0.1 - - - - - - <0.1Shrimp unid. - - <0.1 - - - - -Decapoda unid. <0.1 <0.1 - - - - - 1.0
Crustacea unid. (2.3) (0.9) (2.1) (70.1) - (1.8) (0.9) (2.8)OSTEICHTHYES [17.0] [15.3] [7.6] - - [26.6] [7.0] [21.4]
Gadidae 0.4 - - - - - - -Ammodytes dubius 0.9 - - - - - - -Osteichthyes larvae <0.1 - - - - - - -Osteichthyes unid. 15.7 15.3 7.6 - - 26.6 7.0 21.4
ANIMAL REMAINS AND MISC. [69.1] [69.1] [89.0] [27.6] [100.0] [63.6] [91.6] [65.3]
Number sampled 773 503 468 6 1 99 95 555Number empty 213 122 126 0 0 28 28 154Mean stomach content (g) 0.428 0.630 1.046 0.658 3.576 0.340 0.291 0.269Mean squid length (cm) 13 12 13 24 20 12 14 11

Page 38
Table B-3. Diet composition and sampling data for chain dogfish by fish length category. (Samples gathered during 1977-80. Dataexpressed as percentage of stomach content by weight. Squared brackets indicate major taxon subtotal; parentheses indicateminor taxon subtotal.)
Length Category (cm) Stomach Contents 11-15 16-20 21-25 26-30 31-35 36-40 41-45 Total
NEMATODA - - - - - [1.0] - [0.1]CEPHALOPODA - [4.9] [15.9] [57.3] [0.2] [13.8] [30.3] [20.7]POLYCHAETA [100.0] [38.0] [14.5] [1.7] [0.2] - [2.4] [6.3]
Eunice sp. - 15.5 9.7 1.3 - - - 2.3Eunicidae - 0.3 3.0 - - - - 0.2Glyceridae - - 0.3 - - - - <0.1Nereis sp. - - 0.2 0.4 - - - <0.1Polychaeta unid. 100.0 22.2 1.3 - 0.2 - 2.4 3.8
CRUSTACEA - [54.1] [60.7] [41.0] [20.3] [3.4] [13.3] [22.4]Stomatapoda - - - - (12.7) - - (2.6)
Heterosquilla armata - - - - 12.7 - - 2.6Amphipoda - (<0.1) (0.8) - - - - (<0.1)
Ampelisca sp. - <0.1 - - - - - <0.1Byblis serrata - <0.1 - - - - - <0.1Unciola sp. - - 0.8 - - - - <0.1
Mysidacea - - - - - (<0.1) - (<0.1)Mysidopsis bigelowi - - - - - <0.1 - <0.1
Euphausiacea - (14.2) (22.1) (11.5) - (2.0) - (3.7)Meganyctiphanes norvegica - 5.2 12.1 11.5 - 2.0 - 2.2Euphausiacea unid. - 9.0 10.0 - - - - 1.5
Decapoda - (28.9) (17.8) (3.9) - - (12.5) (10.0)Cancer irroratus - 19.8 - - - - 9.6 6.6Munida irrasa - 0.4 17.8 0.5 - - - 0.8Sergestidae - - - - - - 2.9 1.3Shrimp unid. - 0.6 - - - - - 0.1Decapoda unid. - 8.1 - 3.4 - - - 1.2
Crustacea unid. - (11.0) (20.0) (25.6) (7.6) (1.4) (0.8) (6.1)OSTEICHTHYES - - [3.0] - [79.2] [78.2] [54.0] [49.5]
Osteichthyes unid. - - 3.0 - 79.2 78.2 54.0 49.5ANIMAL REMAINS AND MISC. - [3.0] [5.9] - [0.1] [3.6] - [1.0]
Number sampled 1 11 6 2 7 3 5 35Number empty 0 0 0 0 1 0 1 2Mean stomach content (g) 0.005 0.290 0.192 0.995 0.793 1.058 2.468 0.783Mean fish length (cm) 15 18 22 28 32 37 42 27

Page 39
Table B-4a. Diet composition and sampling data for dusky shark by fish length category. (Samples gathered during 1977-80. Dataexpressed as percentage of stomach content by weight. Squared brackets indicate major taxon subtotal; parentheses indicateminor taxon subtotal.)
Length Category (cm) Stomach Contents <61 61-70 71-80 81-90 91-100 101-110 >110 Total
NEMATODA - - - - [<0.1] - - [<0.1]MOLLUSCA - [49.3] - [25.0] [25.1] [7.2] [1.1] [14.4]
Cephalopoda - (49.3) - (25.0) (25.1) (7.2) (1.1) (14.4)Loligo pealeii - - - - 24.7 - - 6.8Loligo sp. - 11.0 - 8.3 - 7.2 - 4.0Cephalopoda unid. - 38.3 - 16.7 0.4 <0.1 1.1 3.6
Mollusca unid. - - - - - (<0.1) - (<0.1)CRUSTACEA - [0.1] [0.2] [2.3] [22.2] [29.7] - [17.6]
Copepoda - (0.1) - - - - - (<0.1)Stomatopoda - - - - - (0.3) - (5.5)
Squilla empusa - - - - 8.3 8.0 - 5.4Stomatopoda unid. - - - - - 0.3 - 0.1
Amphipoda - - - (<0.1) - - - (<0.1)Hyperiidae - - - <0.1 - - - <0.1
Euphausiacea - (<0.1) (0.2) - (<0.1) - - (<0.1)Meganyctiphanes norvegica - - 0.2 - <0.1 - - <0.1Euphausiacea unid. - <0.1 - - - - - <0.1
Decapoda - - - (2.3) (12.1) (21.2) - (11.5)Cancer irroratus - - - - 4.0 <0.1 - 1.1Pinnixa cylindrica - - - - 0.2 - - <0.1Ovalipes ocellatus - - - - 6.5 21.2 - 9.9Crabs unid. - - - 2.3 1.0 - - 0.4Decapoda unid. - - - - 0.4 - - 0.1
Crustacea unid. - - - - (1.8) (0.2) - (0.6)ECHINODERMATA - - - - - [0.8] - [0.3]
Echinarachnius parma - - - - - 0.8 - 0.3OSTEICHTHYES [100.0] [50.5] [99.7] [72.7] [50.8] [61.9] [40.8] [58.1]
Clupeidae - - - - 1.5 - - 0.4Anchoa hepsetus - - - 2.3 - - - 0.2Batrachoididae - - - 22.7 - - - 1.6Urophycis regia - 7.0 - - - - - 0.4Centropristis striata - - - 7.2 - - - 0.5Stenotomus chrysops - 14.9 - - 12.8 - - 4.4Sciaenidae - - - - - 29.1 - 11.2Cynoscion regalis - - - - - 9.8 - 3.8Leiostomus xanthurus - - - 11.2 7.0 19.5 - 10.2Ammodytes dubius - - - - - 0.6 - 0.2Scombridae - - - - 22.3 - - 6.2Pleuronectiformes - - - - - - 18.1 2.9Osteichthyes unid. 100.0 28.6 99.7 29.3 7.2 2.9 22.7 16.1
ANIMAL REMAINS AND MISC. - [0.1] [0.1] [<0.1] [1.6] [0.4] [58.1] [9.5]SAND - - - - [0.3] [<0.1] - [0.1]
Number sampled 2 6 2 13 18 7 5 53Number empty 1 1 0 4 2 1 1 10Mean stomach content (g) 0.060 15.210 46.768 8.477 24.705 88.173 50.676 30.385Mean fish length (cm) 51 67 75 84 94 103 160 94

Page 40
Table B-4b. Diet composition and sampling data for dusky shark by geographic area. (Samples gathered during 1977-80. Dataexpressed as percentage of stomach content by weight. Squared brackets indicate major taxon subtotal;parentheses indicate minor taxon subtotal.)
Geographic Area Offshore Inshore Inshore South South North
Middle of Cape of Cape of CapeStomach Contents Atlantic Hatteras Hatteras Hatteras
NEMATODA - - - [<0.1]MOLLUSCA [0.1] [60.5] [7.2] [12.2]
Cephalopoda - (60.5) (7.2) (12.2)Loligo pealeii - - - 12.0Loligo sp. - 39.9 - -Cephalopoda unid. - 20.6 7.2 0.2
Mollusca unid. (0.1) - - -CRUSTACEA [79.0] [1.2] [33.5] [1.3]
Copepoda - - (<0.1) -Stomatopoda - - (24.8) (0.8)
Squilla empusa - - 24.2 0.8Stomatopoda unid. - - 0.6 -
Amphipoda - - - (<0.1)Hyperiidae - - - <0.1
Euphausiacea - (0.1) (<0.1) -Meganyctiphanes norvegica - 0.1 - -Euphausiacea unid. - - <0.1 -
Decapoda (79.0) (0.9) (6.7) (0.2)Cancer irroratus <0.1 - 5.5 -Pinnixa cylindrica - - 0.2 -Ovalipes ocellatus 78.0 - - -Crabs unid. - 0.9 1.0 0.2Decapoda unid. 1.0 - - -
Crustacea unid. - (0.2) (2.0) (0.3)ECHINODERMATA [2.4] - - -
Echinarachnius parma 2.4 - - -OSTEICHTHYES [17.9] [33.5] [15.7] [86.2]
Clupeidae 3.3 - - -Anchoa hepsetus - - 0.8 -Batrachoididae - 15.7 - -Urophycis regia - 4.0 - -Centropristis striata - - - 0.9Stenotomus chrysops - 8.5 - 6.2Sciaenidae - - - 19.6Cynoscion regalis - - - 6.6Leiostomus xanthurus 6.3 - - 16.4Ammodytes dubius 1.8 - - -Scombridae - - - 10.8Pleuronectiformes - - - 5.0Osteichthyes unid. 6.5 5.3 14.9 20.7
ANIMAL REMAINS AND MISC. [<0.1] [4.8] [43.6] [0.3]SAND [0.6] - - [<0.1]
Number sampled 8 19 13 13Number empty 2 6 1 1Mean stomach content (g) 25.608 8.393 25.243 70.608Mean fish length (cm) 99 92 89 97

Page 41
Table B-5a. Diet composition and sampling data for smooth dogfish by fish length category. (Samples gathered during 1977-80. Dataexpressed as percentage of stomach content by weight. Squared brackets indicate major taxon subtotal; parentheses indicate minortaxon subtotal.)
Length Category (cm) Stomach Contents <41 41-50 51-60 61-70 71-80 81-90 91-100 101-110 >110 Total
MOLLUSCA [62.1] [5.8] [5.8] [14.6] [3.3] [9.7] [17.2] [9.3] [16.1] [13.2]Bivalvia (0.2) (4.1) (5.0) (0.4) (0.8) (0.8) (1.5) (5.3) (15.6) (4.4)Cephalopoda - (1.7) (0.3) (13.2) (2.5) (8.7) (15.3) (2.8) (0.5) (8.2)
Loligo pealeii - - - - 0.1 5.6 6.7 0.7 - 3.5Loligo sp. - - - - 0.3 2.1 6.5 0.7 <0.1 3.0Cephalopoda unid. - 1.7 0.3 13.2 2.1 1.0 2.1 1.4 0.5 1.7
Mollusca unid. (61.9) - (0.5) (1.0) (<0.1) (0.2) (0.4) (1.2) (<0.1) (0.6)POLYCHAETA [8.7] [3.8] [7.9] [3.0] [1.6] [1.4] [0.7] [0.1] [0.3] [0.8]SIPUNCULA - - - [3.0] - - [0.2] [0.1] - [0.2]MEROSTOMATA - - - [<0.1] - - [0.2] [4.6] [2.9] [1.6]
Limulus sp. - - - <0.1 - - 0.2 4.6 2.9 1.6CRUSTACEA [24.2] [81.9] [53.3] [64.6] [83.1] [78.8] [73.1] [74.2] [74.6] [74.7]
Stomatopoda - (0.5) (1.0) - - (1.1) (<0.1) (<0.1) (<0.1) (0.2)Decapoda (15.8) (67.4) (34.2) (58.6) (75.8) (75.4) (71.4) (72.8) (69.8) (72.1)
Pagurus pollicaris - 9.1 5.6 0.6 1.0 - 0.4 <0.1 0.3 0.4Pagurus sp. 15.6 10.4 2.9 1.0 0.5 0.4 0.9 0.5 0.1 0.7Paguridae - 11.8 1.4 - 0.5 - 0.2 <0.1 - 0.3Libinia sp. - - - <0.1 - 0.3 0.9 0.3 2.1 0.8Majidae - 2.9 0.1 - 1.5 0.2 <0.1 0.2 <0.1 <0.1Cancer irroratus - 17.5 12.6 13.9 37.9 43.8 39.7 45.7 31.2 40.0Cancer borealis - 4.1 - - - - 4.2 0.3 1.1 1.9Cancridae - - 0.5 0.7 1.4 <0.1 2.4 1.7 0.9 1.7Ovalipes ocellatus - 3.4 4.4 17.9 20.4 11.0 8.9 13.9 24.5 13.1Ovalipes stephensoni - - - 1.5 5.2 8.1 3.7 1.7 0.2 3.1Albunea sp. - - 3.3 10.0 0.4 3.5 1.3 0.2 <0.1 1.2Decapoda unid. 0.2 8.2 3.4 13.0 7.0 8.1 8.8 8.3 9.4 8.9
Crustacea unid. (8.4) (14.0) (18.1) (6.0) (7.3) (2.3) (1.4) (1.4) (4.8) (2.4)HOLOTHUROIDEA - - [4.6] - - - [0.7] [<0.1] - [0.3]OSTEICHTHYES - [3.5] [27.0] [12.2] [5.4] [7.2] [5.7] [10.1] [4.0] [7.4]
Ophichthus cruentifer - - - 0.2 - - - - - <0.1Etrumeus teres - - - - - - <0.1 3.1 <0.1 1.0Clupeidae - - - - - - - 0.3 - 0.1Anchoa sp. - - - 0.7 <0.1 - 0.1 0.8 0.1 0.4Urophycis regia - - - 0.4 - - - - - <0.1Gadidae - - - - 0.1 - 0.2 - - 0.1Trachurus lathami - - - - - 0.2 - - - <0.1Stenotomus chrysops - 1.2 15.5 8.2 - - 0.5 - - 0.4Leiostomus xanthurus - - - - - 1.1 - - - 0.1Ammodytes dubius - - - - - 0.2 0.3 0.1 0.2 0.2Peprilus triacanthus - - - - - <0.1 0.5 1.4 <0.1 0.6Prionotus sp. - - - 0.9 <0.1 2.0 - - - 0.3Osteichthyes unid. - 2.3 11.5 1.8 5.3 3.7 4.1 4.4 3.7 4.2
ANIMAL REMAINS AND MISC. [5.0] [5.0] [1.4] [2.6] [6.6] [2.9] [2.2] [1.6] [2.1] [1.8]
Number sampled 7 52 41 35 56 111 237 102 47 688Number empty 2 0 2 0 1 6 5 4 1 21Mean stomach content (g) 1.827 4.252 3.845 10.120 15.664 24.148 37.699 66.009 62.196 32.228Mean fish length (cm) 32 46 55 65 76 86 95 104 115 86

Page 42
Table B-5b. Diet composition and sampling data for smooth dogfish by geographic area. (Samples gathered during 1977-80. Data expressed as percentage of stomach content by weight. Squared brackets indicate major taxonsubtotal; parentheses indicate minor taxon subtotal.)
Geographic Area Inshore Inshore
Southern South North Middle New of Cape of Cape
Stomach Contents Atlantic England Hatteras Hatteras
MOLLUSCA [7.4] [0.7] [<0.1] [16.0]Bivalvia (2.9) (<0.1) (<0.1) (5.2)Cephalopoda (3.7) (0.7) (<0.1) (10.1)
Loligo sp. 2.1 0.2 - 8.3Cephalopoda unid. 1.6 0.5 <0.1 1.8
Mollusca unid. (0.8) (<0.1) (<0.1) (0.7)POLYCHAETA [0.3] [0.8] [0.6] [0.6]SIPUNCULA - - [3.3] [<0.1]MEROSTOMATA [3.4] - [0.2] [1.4]
Limulus sp. 3.4 - 0.2 1.4CRUSTACEA [76.5] [89.6] [69.8] [72.5]
Stomatopoda (<0.1) (<0.1) (4.6) (<0.1)Decapoda (74.2) (89.2) (59.9) (70.0)
Pagurus pollicaris 0.2 - 0.1 0.5Pagurus sp. - 1.4 0.4 0.8Paguridae - - - 0.3Libinia sp. 1.5 - - 0.7Majidae - - 0.3 0.2Cancer irroratus 54.3 68.8 3.2 35.8Cancer borealis 0.9 4.7 1.3 1.9Cancridae 0.5 - 0.6 2.1Ovalipes ocellatus 5.3 - 10.5 16.1Ovalipes stephensoni - 9.5 - 3.3Albunea sp. 0.5 - 8.7 1.1Decapoda unid. 11.0 4.8 34.8 7.2
Crustacea unid. (2.3) (0.4) (5.3) (2.5)HOLOTHUROIDEA - - - [0.4]OSTEICHTHYES [10.1] [7.8] [24.6] [5.8]
Ophichthus cruentifer - - - <0.1Etrumeus teres - - - 1.3Clupeidae - - - 0.1Anchoa sp. - - - 0.5Urophycis regia - - - <0.1Gadidae <0.1 - - <0.1Trachurus lathami - - - <0.1Stenotomus chrysops 2.8 - - -Leiostomus xanthurus - - - 0.2Ammodytes dubius 0.2 1.0 - 0.1Peprilus triacanthus - - 4.6 0.7Prionotus sp. 1.5 - 0.5 -Osteichthyes unid. 5.6 6.8 19.5 2.9
ANIMAL REMAINS AND MISC. [2.3] [1.1] [1.5] [3.3]
Number sampled 121 41 55 471Number empty 3 3 3 12Mean stomach content (g) 29.839 38.394 12.151 36.180Mean fish length (cm) 86 86 83 87

Page 43
Table B-6a. Diet composition and sampling data for Atlantic sharpnose shark by fish length category. (Samples gathered during 1977-80. Data expressed as percentage of stomach content by weight. Squared brackets indicate major taxon subtotal;parentheses indicate minor taxon subtotal.)
Length Category (cm) Stomach Contents <40 41-50 51-60 61-70 71-80 81-90 91-100 101-110 Total
CESTODA - - - - - [<0.1] - - [<0.1]RHYNCHOCOELA - [<0.1] - - - - - - [<0.1]NEMATODA - [<0.1] - - - - - - [<0.1]MOLLUSCA [34.7] [41.7] [39.1] - [4.1] [1.9] [0.7] [51.1] [6.1]
Gastropoda - - - - - - - (51.1) (0.7)Cephalopoda (34.7) (41.7) (39.1) - - (1.9) (0.6) - (5.2)
Illex sp. 0.4 - - - - - - - <0.1Loligo sp. 34.3 - 8.2 - - 1.9 0.6 - 1.8Cephalopoda unid. - 41.7 30.9 - - <0.1 <0.1 - 3.4
Mollusca unid. - - - - (4.1) - (0.1) - (0.2)CRUSTACEA [18.0] [10.2] [12.6] - [24.6] [57.8] [7.5] - [9.7]
Cirripedia - (<0.1) - - - - - - (<0.1)Stomatopoda - - - - - - (1.6) - (1.2)
Squilla empusa - - - - - - 1.6 - 1.2Decapoda (15.7) (8.2) (12.6) - (24.6) (57.8) (5.9) - (8.3)
Libinia emarginata - - - - - - 0.8 - 0.6Penaeidae - - - - - 17.9 - - 0.6Pandalidae - 0.5 - - - - - - <0.1Pagurus sp. - - - - - - 1.8 - 1.5Paguridae - - - - - - <0.1 - <0.1Sicyonia sp. - - - - - 4.2 - - 0.1Ovalipes ocellatus 15.7 7.5 - - - 35.7 3.1 - 4.6Portunus gibbesii - - - - 24.6 - 0.2 - 0.5Crab unid. - - - - - - <0.1 - 0.1Shrimp unid. - 0.2 - - - - <0.1 - <0.1Decapoda unid. - - 12.6 - - - - - 0.3
Crustacea unid. (2.3) (2.0) - - - - (<0.1) - (0.2)OSTEICHTHYES [46.6] [48.1] [48.3] [100.0] [71.3] [35.9] [87.3] - [80.0]
Etrumeus teres - - - - - - 1.9 - 1.5Clupeidae 9.6 - - - - - - - 0.3Anchoa hepsetus - 16.0 - - - 27.8 0.4 - 2.3Engraulidae - - - - - - 0.4 - 0.3Syngnathidae - - - - - - 0.6 - 0.4Sciaenidae - - - - - - 9.8 - 7.8Astroscopus guttatus - - - - - - 13.5 - 10.7Citharichthys arctifrons - - - - 63.5 - - - 1.0Pleuronectiformes 15.3 - - - - - - - 0.5Monacanthus hispidus - - - - - - 6.1 - 4.8Sphoeroides maculatus - - - - - - 8.0 - 6.3Osteichthyes unid. 21.7 32.1 48.3 100.0 7.8 8.1 46.6 - 44.1
ANIMAL REMAINS [0.7] - - - - [4.4] [4.4] [48.9] [4.1]SAND - - - - - - [0.1] - [0.1]
Number sampled 20 12 4 2 3 11 31 2 85Number empty 7 2 0 1 1 3 8 0 22Mean stomach content (g) 1.166 3.967 3.452 10.571 3.638 2.066 17.951 4.491 9.918Mean fish length (cm) 36 46 52 68 76 86 94 104 70

Page 44
Table B-6b. Diet composition and sampling data for Atlantic sharpnose shark by geographic area. (Samplesgathered during 1977-80. Data expressed as percentage of stomach content by weight. Squaredbrackets indicate major taxon subtotal; parentheses indicate minor taxon subtotal.)
Geographic Area Offshore Inshore Inshore South South Northof Cape of Cape of Cape
Stomach Contents Hatteras Hatteras Hatteras
CESTODA [<0.1] - -RHYNCHOCOELA - [<0.1] -NEMATODA - [<0.1] -MOLLUSCA [0.2] [16.0] [0.3]
Gastropoda - (1.7) -Cephalopoda (0.2) (14.0) -
Illex sp. - <0.1 -Loligo sp. 0.2 4.8 -Cephalopoda unid. <0.1 9.2 -
Mollusca unid. - (0.3) (0.3)CRUSTACEA [4.8] [6.3] [22.1]
Cirripedia - (<0.1) -Stomatopoda (3.3) - -
Squilla empusa 3.3 - -Decapoda (1.5) (5.7) (22.1)
Libinia emarginata - 1.7 -Penaeidae 1.5 - -Pandalidae - <0.1 -Pagurus sp. - - 5.8Paguridae - <0.1 -Sicyonia sp. - 0.4 -Ovalipes ocellatus - 2.7 14.3Portunus gibbesii - - 2.0Crab unid. - 0.2 -Shrimp unid. - <0.1 <0.1Decapoda unid. - 0.7 -
Crustacea unid. - (0.6) (<0.1)OSTEICHTHYES [86.0] [76.0] [77.1]
Etrumeus teres - - 6.0Clupeidae - 0.9 -Anchoa hepsetus - 6.2 -Engraulidae - - 1.2Syngnathidae 1.2 - -Sciaenidae - - 30.8Astroscopus guttatus 28.5 - -Citharichthys arctifrons - - 3.9Pleuronectiformes - 1.4 -Monacanthus hispidus 12.9 - -Sphoeroides maculatus 16.8 - -Osteichthyes unid. 26.6 67.5 35.2
ANIMAL REMAINS [9.0] [1.7] [0.1]SAND - - [0.4]
Number sampled 9 60 16Number empty 0 18 4Mean stomach content (g) 29.374 4.387 11.087Mean fish length (cm) 89 63 83

Page 45
Table B-7a. Diet composition and sampling data for spiny dogfish by fish length category. (Samples gathered during 1977-80. Data expressedas percentage of stomach content by weight. Squared brackets indicate major taxon subtotal; parentheses indicate minor taxonsubtotal.)
Length Category (cm) Stomach Contents <31 31-40 41-50 51-60 61-70 71-80 81-90 91-100 101-110 Total
CTENOPHORA [2.6] [2.3] [1.7] [0.8] [0.7] [0.6] [0.9] [<0.1] - [0.5]MOLLUSCA [20.2] [51.5] [36.5] [58.3] [16.6] [28.4] [27.3] [23.1] [25.1] [26.6]Bivalvia (<0.1) (27.0) (8.4) (1.7) (0.9) (1.9) (7.4) (11.3) (12.4) (7.7)
Pectinidae - 27.0 8.4 1.7 - - 3.7 6.1 12.4 4.2Bivalvia unid. <0.1 - - - 0.9 1.9 3.7 5.2 - 3.5
Cephalopoda (20.2) (24.5) (24.0) (56.6) (15.7) (23.1) (19.9) (10.9) (12.7) (17.8)Illex sp. - - - 4.9 3.0 7.3 6.5 4.2 - 5.2Loligo sp. - - - 5.3 5.2 3.4 2.6 3.3 8.9 3.4Cephalopoda unid. 20.2 24.5 24.0 46.4 7.5 12.4 10.8 3.4 3.8 9.2
Mollusca unid. - - (4.1) (<0.1) - (3.4) - (0.9) - (1.1)CRUSTACEA [4.1] [1.8] [9.5] [8.5] [7.6] [2.9] [2.8] [5.0] [0.8] [4.3]
Euphausiacea (0.7) (1.2) (1.4) (4.4) (6.6) (2.1) (<0.1) (<0.1) - (0.8)Decapoda (1.6) - (7.6) (3.4) (0.7) (0.8) (2.6) (5.0) (0.6) (3.3)
Cancer spp. 0.6 - 6.8 0.2 0.3 0.2 1.9 4.5 0.6 2.5Decapoda unid. 1.0 - 0.8 3.2 0.4 0.6 0.7 0.5 <0.1 0.8
Crustacea unid. (1.8) (0.6) (0.5) (0.7) (0.3) (<0.1) (0.2) (<0.1) (0.2) (0.2)OSTEICHTHYES [13.6] [22.6] [44.2] [22.3] [49.9] [36.1] [62.0] [58.4] [66.0] [53.7]
Ophichthidae - - - - - - - 1.2 - 0.5Alosa aestivalis - - - - - - 3.3 - - 0.9Alosa pseudoharengus - - - - - 1.7 - 4.3 - 2.1Brevoortia tyrannus - - - - - 0.4 - - - 0.1Clupea harengus - - - - - 2.9 - 1.3 - 1.1Etrumeus teres - - - - - - - 0.6 - 0.2Clupeidae - - - 2.5 1.6 5.4 0.3 - - 1.3Melanogrammus aeglefinus - - - - - - 1.9 - - 0.5Merluccius bilinearis - - - - - - 0.3 1.5 - 0.7Urophycis chesteri - - - - - - - 1.0 - 0.4Urophycis chuss - - - - - - 4.3 1.5 - 1.8Urophycis sp. - - - - - - 5.3 - - 1.5Gadidae - <0.1 - <0.1 <0.1 3.8 2.0 - <0.1 1.4Belonidae - - - - 8.1 - - - - 0.3Carangidae - - - - - - - 1.4 - 0.5Stenotomus chrysops - - - - - - 0.7 - - 0.2Astroscopus sp. - - - - - - - 0.9 - 0.4Anarhichas sp. - - - - - - - 2.2 - 0.9Ammodytes dubius - - - 0.1 2.6 2.4 0.6 6.5 2.0 3.4Scomber scombrus - - - - - - 6.3 - - 1.8Paralichthys dentatus - - - - - 0.1 - 1.0 - 0.4Scophthalmus aquosus - - - - - - 0.3 0.6 - 0.3Symphurus sp. - - - - - 1.4 11.4 4.6 8.4 5.6Hippoglossus hippoglossus - - 3.6 - - - - - - <0.1Pleuronectes ferruginus - - - <0.1 - - - 0.4 - 0.2Osteichthyes unid. 13.6 22.6 40.6 19.7 37.6 18.0 25.3 29.4 55.6 27.2
ANIMAL REMAINS AND MISC. [59.5] [21.8] [8.1] [10.1] [25.2] [32.0] [7.0] [13.5] [8.1] [14.9]
Number sampled 226 307 164 235 207 697 368 423 35 2662Number empty 124 187 104 125 101 357 152 114 8 1272Mean stomach content (g) 0.261 0.393 1.252 2.705 3.901 6.421 16.711 20.553 24.003 9.720Mean fish length (cm) 27 34 45 55 66 75 85 94 103 78

Page 46
Table B-7b. Diet composition and sampling data for spiny dogfish by geographic area. (Samples gathered during 1977-80. Data expressedas percentage of stomach content by weight. Squared brackets indicate major taxon subtotal; parentheses indicate minor taxonsubtotal.)
Geographic Area Inshore Inshore
Southern South North Middle New Georges Gulf of Scotian of Cape of Cape
Stomach Contents Atlantic England Bank Maine Shelf Hatteras Hatteras
CTENOPHORA [0.1] [0.4] [0.1] [0.3] [<0.1] - [2.6]MOLLUSCA [22.6] [36.7] [25.8] [27.9] [26.3] [5.3] [12.1]
Bivalvia (17.3) (13.6) (7.3) - - (1.9) (2.8)Pectinidae 3.6 9.4 4.6 - - - 2.1Bivalvia unid. 13.7 4.2 2.7 - - 1.9 0.7
Cephalopoda (5.0) (22.4) (17.2) (24.7) (26.3) (3.4) (9.1)Illex sp. - 7.3 1.7 13.9 - - 4.2Loligo sp. - 6.6 5.3 - - 1.3 4.1Cephalopoda unid. 5.0 8.5 10.2 10.8 26.3 2.1 0.8
Mollusca unid. (0.3) (0.7) (1.3) (3.2) (<0.1) - (0.2)CRUSTACEA [1.3] [1.3] [5.7] [3.5] [0.4] [1.6] [14.5]
Euphausiacea (<0.1) (<0.1) (<0.1) (3.4) (0.2) - (1.8)Decapoda (1.3) (1.1) (5.7) (0.1) (0.1) (1.6) (11.9)
Cancer spp. 1.0 1.1 4.5 - <0.1 - 9.5Decapoda unid. 0.3 <0.1 1.2 0.1 0.1 1.6 2.4
Crustacea unid. (<0.1) (0.2) (<0.1) (<0.1) (0.1) - (0.8)OSTEICHTHYES [72.7] [55.8] [49.9] [40.9] [30.6] [92.4] [60.4]
Ophichthidae - - - - - 14.3 -Alosa aestivalis - - 3.9 - - - -Alosa pseudoharengus - 6.6 0.9 0.7 - - -Brevoortia tyrannus - - - - 1.1 - -Clupea harengus - 1.9 - - - - 6.0Etrumeus teres 2.0 - - - - - -Clupeidae - 1.0 <0.1 1.0 - - 8.7Melanogrammus aeglefinus - 2.1 - - - - -Merluccius bilinearis - 1.2 1.4 - - - -Urophycis chesteri - 1.6 - - - - -Urophycis chuss - 2.3 5.0 - - - -Urophycis sp. 0.1 5.6 - - - - -Gadidae - 5.2 <0.1 - - - -Belonidae - - - 1.7 - - -Carangidae - - - - - - 5.5Stenotomus chrysops - 0.7 - - - - -Astroscopus sp. - - - - - 10.7 -Anarhichas sp. - - - 4.9 - - -Ammodytes dubius 3.6 2.1 0.5 12.2 - 0.1 1.0Scomber scombrus - - - - 25.8 - -Paralichthys dentatus - 1.5 0.1 - - - -Scophthalmus aquosus - 0.9 - - - 2.2 -Symphurus sp. 47.4 - - - - - -Hippoglossus hippoglossus - - 0.1 - - - -Pleuronectes ferruginus - - - 0.9 - - <0.1Osteichthyes unid. 19.6 23.1 38.0 19.5 3.7 65.1 39.2
ANIMAL REMAINS AND MISC. [3.3] [5.8] [18.5] [27.4] [42.7] [0.7] [10.4]
Number sampled 276 735 783 417 238 17 196Number empty 150 407 353 190 112 0 60Mean stomach content (g) 9.464 7.787 6.783 9.395 6.351 43.469 11.083Mean fish length (cm) 62 58 65 76 74 93 84

Page 47
Table B-8. Diet composition and sampling data for Atlantic angel shark by fish length category. (Samples gathered during 1977-80.Data expressed as percentage of stomach content by weight. Squared brackets indicate major taxon subtotal; parenthesesindicate minor taxon subtotal.)
Length Category (cm) Stomach Contents 31-50 51-70 71-90 91-110 111-130 Total
NEMATODA [0.1] - - - - [<0.1]CEPHALOPODA [8.1] [27.7] [<0.1] [<0.1] [<0.1] [7.7]
Ommastrephidae 0.4 - - - - <0.1Loligo pealeii 6.6 - - - - 0.7Loligo sp. - 27.5 - - - 6.8Cephalopoda 1.1 0.2 <0.1 <0.1 <0.1 0.2
POLYCHAETA [<0.1] - - - - [<0.1]Ninoe nigripes <0.1 - - - - <0.1
CRUSTACEA [0.6] [<0.1] [<0.1] [0.2] [0.8] [0.2]Isopoda (<0.1) - - - - (<0.1)
Cirolana sp. <0.1 - - - - <0.1Amphipoda (<0.1) - - - - (<0.1)
Unciola irrorata <0.1 - - - - <0.1Decapoda (0.6) (<0.1) (<0.1) - (0.8) (0.2)
Crangonidae 0.1 - - - - <0.1Paguridae 0.3 <0.1 - - - <0.1Cancer irroratus - <0.1 - - - <0.1Ovalipes ocellatus - - - - 0.8 0.2Decapoda unid. 0.2 - <0.1 - - <0.1
Crustacea unid. (<0.1) (<0.1) - (0.2) - (<0.1)OSTEICHTHYES [71.1] [62.8] [96.3] [89.2] [90.9] [83.3]
Anchoa hepsetus - 0.3 - - - 0.1Merluccius bilinearis - 3.3 - - - 0.8Pomatomus saltatrix - - - - 57.8 17.6Leiostomus xanthurus - 6.6 18.0 - - 6.4Sciaenidae - - 51.5 - - 13.7Peprilus triacanthus - 15.5 - - 0.9 4.1Prionotus carolinus - - - - 20.5 6.3Osteichthyes unid. 71.1 37.1 26.8 89.2 11.7 34.3
ANIMAL REMAINS [20.0] [8.6] [2.1] [5.8] [8.3] [7.7]PLANT [0.1] - [0.6] - - [0.2]ROCK AND SAND - [0.9] [1.0] [4.8] - [0.9]
Number sampled 18 24 6 4 6 58Number empty 1 3 0 2 0 6Mean stomach content (g) 6.169 11.561 49.841 18.741 57.076 19.051Mean fish length (cm) 42 58 79 103 119 65

Page 48
Table B-9. Diet composition and sampling data for clearnose skate by fish length category. (Samples gathered during 1977-80. Dataexpressed as percentage of stomach content by weight. Squared brackets indicate major taxon subtotal; parentheses indicateminor taxon subtotal.)
Length Category (cm) Stomach Contents 31-35 36-40 41-45 46-50 51-55 56-60 61-65 Total
MOLLUSCA - - [6.9] - [1.4] [2.4] [0.2] [0.9]Bivalvia - - (6.9) - (0.6) (<0.1) (0.2) (0.3)
Ensis directus - - - - 0.6 <0.1 - 0.1Solenidae - - 6.9 - - - - 0.1
Cephalopoda - - - - (0.8) (2.4) - (0.6)Mollusca unid. - - - - - (<0.1) 0.2 (0.1)
POLYCHAETA - - - [6.5] [<0.1] - [<0.1] [0.4]Diopatra cuprea - - - 3.9 - - - 0.2Ophelia sp. - - - 2.6 - - - 0.2Polychaeta unid. - - - <0.1 <0.1 - <0.1 <0.1
CRUSTACEA - [100.0] [90.4] [72.8] [16.8] [83.8] [24.0] [39.4]Stomatopoda - - - - (1.6) - - (0.3)Amphipoda - - (3.2) (0.4) (<0.1) - - (0.1)
Ampelisca verrilli - - 3.2 - - - - 0.1Byblis serrata - - - - <0.1 - - <0.1Acanthohaustorius millsi - - - 0.1 - - - <0.1Rhepoxynius epistomus - - - 0.3 - - - <0.1
Mysidacea - (1.1) - - - - - (<0.1)Decapoda - (98.9) (82.2) (72.4) (15.2) (83.6) (23.5) (38.6)
Penaeus aztecus - - - - - - 5.9 3.3Penaeidae - - 0.6 - - - - <0.1Crangon septemspinosa - - 1.6 0.6 <0.1 0.2 - 0.1Shrimp unid. - - 5.4 - - - - 0.1Pagurus pollicaris - - - - - 0.4 - 0.1Sicyonia sp. - - - - 1.9 1.5 - 0.6Cancer irroratus - - 54.5 71.5 10.8 39.8 17.6 24.9Cancer sp. - - - - - 0.7 - 0.1Cancridae - - - 0.3 0.8 - - 0.2Ovalipes ocellatus - 98.9 10.5 - 0.5 0.8 - 0.6Portunidae - - - - - 27.6 - 5.6Scyllaridae - - - - - 2.3 - 0.5Crab unid. - - - - 0.1 10.3 - 2.1Decapoda unid. - - 9.6 - 1.1 - - 0.4
Crustacea unid. - - (5.0) - - (0.2) (0.5) (0.4)OSTEICHTHYES - - - [19.7] [78.6] [13.4] [74.3] [57.8]
Branchiostoma sp. - - - 8.2 - - - 0.5Myoxocephalus scorpius - - - - - 0.6 - 0.1Cynoscion regalis - - - - - - 41.9 23.1Peprilus triacanthus - - - - 7.1 - - 1.2Soleidae - - - - 65.7 - - 10.8Osteichthyes unid. - - - 11.5 5.8 12.8 32.4 22.1
ANIMAL REMAINS AND MISC. [100.0] - [2.7] [1.0] [3.2] [0.4] [1.5] [1.5]
Number sampled 1 1 6 7 12 12 11 50Number empty 0 0 0 1 0 1 4 6Mean stomach content (g) 0.033 0.377 0.800 2.303 3.608 4.465 13.273 5.284Mean fish length (cm) 33 38 42 48 53 58 62 53

Page 49
Table B-10a. Diet composition and sampling data for little skate by fish length category. (Samples gathered during 1977-80. Data expressedas percentage of stomach content by weight. Squared brackets indicate major taxon subtotal; parentheses indicate minor taxonsubtotal.)
Length Category (cm) Stomach Contents <15 16-20 21-25 26-30 31-35 36-40 41-45 46-50 >51 Total
MOLLUSCA - - - [0.2] [0.8] [4.7] [4.9] [2.7] [5.8] [3.8]Bivalvia - - - (0.2) - (1.7) (3.1) (1.4) (5.8) (2.4)Mollusca unid. - - - - (0.8) (3.0) (1.8) (1.3) - (1.4)
POLYCHAETA [0.3] [7.1] [2.2] [11.8] [17.9] [6.6] [11.1] [15.2] [6.2] [12.9]Maldanidae - - - 4.3 0.4 1.3 0.4 1.2 0.6 0.9Aphroditidae - - - - - 0.6 - 3.4 1.9 1.7Nephtys spp. - - - 1.4 14.7 <0.1 1.8 1.0 - 1.9Polychaeta unid. 0.3 7.1 2.2 6.2 2.8 4.7 8.9 9.6 3.7 8.4
CRUSTACEA [86.1] [85.9] [96.6] [83.5] [38.7] [62.3] [64.4] [66.3] [69.5] [65.5]Stomatopoda - - - - - - (1.4) (<0.1) (8.8) (1.3)Cumacea (12.3) (5.4) (2.0) (7.8) (0.7) (0.1) (<0.1) (<0.1) (<0.1) (0.3)
Pseudoleptocuma minor 3.8 3.8 - - - - <0.1 - - 0.1Cumacea unid. 8.5 1.6 2.0 7.8 0.7 0.1 <0.1 <0.1 <0.1 0.2
Isopoda - - - (6.9) (0.6) (5.3) (3.3) (2.2) (<0.1) (2.4)Cirolana sp. - - - 6.9 0.6 5.3 3.3 2.2 <0.1 2.4
Amphipoda (35.1) (44.8) (62.1) (48.3) (15.9) (22.3) (13.2) (13.9) (15.4) (15.7)Byblis serrata 4.8 3.6 5.1 3.2 0.3 1.6 0.2 0.2 - 0.4Ampeliscidae 1.3 5.1 3.5 0.7 0.2 0.3 <0.1 <0.1 <0.1 0.2Unciola spp. 3.7 6.3 16.2 6.1 1.7 7.5 3.7 2.3 <0.1 2.9Gammarus annulatus - - 0.7 11.0 - 0.7 0.5 <0.1 0.2 0.4Oedicerotidae 10.9 13.2 8.4 0.5 2.8 1.1 0.8 1.3 <0.1 1.2Leptocheirus pinguis 4.5 9.6 8.8 5.0 10.7 3.2 5.4 6.9 15.1 7.2Amphipoda unid. 9.9 7.0 19.4 21.8 0.2 7.9 2.6 3.2 0.1 3.4
Decapoda (21.9) (22.7) (21.6) (13.1) (19.7) (32.2) (40.0) (46.2) (37.2) (40.5)Crangon septemspinosa 15.5 18.9 18.7 8.8 4.1 7.3 5.7 4.4 5.8 5.4Axius serratus - - - - - - 2.1 1.1 - 1.2Cancer borealis - - - - - 8.3 3.4 2.6 5.4 3.2Cancer irroratus - 0.2 2.2 3.1 7.4 13.1 22.0 27.1 9.9 21.2Pagurus acadianus - - - - - 0.4 0.2 3.0 7.7 2.2Decapoda unid. 6.4 3.6 0.7 1.2 8.2 3.1 6.6 8.0 8.4 7.3
Crustacea unid. (16.8) (13.0) (10.9) (7.4) (1.8) (2.4) (6.5) (4.0) (8.1) (5.3)OSTEICHTHYES - - - [2.4] [37.2] [5.3] [10.8] [5.4] [10.7] [9.5]
Anchoa mitchilli - - - - - - 1.7 - - 0.6Gadidae - - - - - - 1.1 <0.1 - 0.4Ammodytes dubius - - - - 35.7 0.8 5.7 1.7 0.3 4.7Myoxocephalus octodecemspinosus - - - - - - - - 8.4 0.8Lepophidium profundorum - - - - - - 0.2 - - 0.1Bothidae - - - - 0.5 - - <0.1 - 0.1Pleuronectes americanus - - - - 0.2 - - - - <0.1Pleuronectiformes - - - 1.3 - - 0.1 <0.1 0.7 0.1Osteichthyes eggs or larvae - - - - - 0.3 <0.1 <0.1 - <0.1Osteichthyes unid. - - - 1.1 0.8 4.2 2.0 3.7 1.3 2.7
ANIMAL REMAINS AND MISC. [13.6] [7.0] [1.2] [2.1] [5.4] [21.1] [8.8] [10.4] [7.8] [8.3]
Number sampled 58 14 11 25 25 45 130 175 21 504Number empty 2 0 1 3 3 6 14 17 1 47Mean stomach content (g) 0.075 0.222 0.222 0.319 1.416 0.758 1.625 1.580 2.936 1.263Mean fish length (cm) 10 18 22 28 33 38 43 47 52 38

Page 50
Table B-10b. Diet composition and sampling data for little skate by geographic area. (Samples gathered during 1977-80.Data expressed as percentage of stomach content by weight. Squared brackets indicate major taxon subtotal;parentheses indicate minor taxon subtotal.)
Geographic Area Inshore
Southern North Middle New Georges of Cape
Stomach Contents Atlantic England Bank Hatteras
MOLLUSCA [12.8] [3.4] [1.5] [0.9]Bivalvia 6.3 2.3 1.5 0.9Mollusca unid. 6.5 1.1 <0.1 <0.1
POLYCHAETA [3.2] [21.7] [15.0] [3.3]Maldanidae 0.7 3.8 1.1 0.4Aphroditidae - 2.9 2.7 -Nephtys spp. - 2.1 4.2 -Polychaeta unid. 2.5 12.9 7.0 2.9
CRUSTACEA [53.5] [61.7] [67.4] [73.0]Stomatopoda (<0.1) (<0.1) - (5.4)Cumacea (<0.1) (0.4) (<0.1) (0.3)
Pseudoleptocuma minor - - <0.1 0.2Cumacea unid. <0.1 0.4 <0.1 0.1
Isopoda (0.8) (3.1) (3.3) (1.5)Cirolana sp. 0.8 3.1 3.3 1.5
Amphipoda (1.3) (26.6) (11.5) (14.6)Byblis serrata <0.1 0.4 0.2 0.7Unciola spp. 0.5 4.6 0.5 5.1Gammarus annulatus - 0.5 - 1.0Oedicerotidae <0.1 1.0 2.6 0.8Leptocheirus pinguis 0.4 16.7 3.4 3.5Amphipoda unid. 0.4 3.4 4.8 3.5
Decapoda (42.8) (25.7) (47.1) (49.4)Crangon septemspinosa 3.0 6.2 4.8 6.5Axius serratus 0.5 0.3 3.5 -Cancer borealis 3.0 3.5 0.9 5.7Cancer irroratus 26.1 9.7 24.1 29.7Pagurus acadianus - 0.9 6.0 0.7Decapoda unid. 10.2 5.1 7.8 6.8
Crustacea unid. (8.6) (5.9) (5.5) (1.8)OSTEICHTHYES [24.2] [1.7] [2.9] [17.5]
Anchoa mitchilli - - - 2.3Gadidae 2.3 - - 0.2Ammodytes dubius 19.5 0.3 - 6.4Myoxocephalus octodecemspinosus - - 1.7 1.3Lepophidium profundorum - - - 0.3Bothidae 0.3 - - <0.1Pleuronectes americanus - <0.1 - -Pleuronectiformes 0.2 <0.1 0.4 <0.1Osteichthyes eggs or larvae - <0.1 <0.1 0.2Osteichthyes unid. 1.9 1.4 0.8 6.8
ANIMAL REMAINS AND MISC. [6.3] [11.5] [13.2] [5.3]
Number sampled 63 202 105 134Number empty 1 31 8 7Mean stomach content (g) 1.581 1.000 1.727 1.148Mean fish length (cm) 35 41 42 33

Page 51
Table B-11a. Diet composition and sampling data for winter skate by fish length category. (Samples gathered during 1977-80. Data expressedas percentage of stomach content by weight. Squared brackets indicate major taxon subtotal; parentheses indicate minor taxonsubtotal.)
Length Category (cm) Stomach Contents <31 31-40 41-50 51-60 61-70 71-80 81-90 91-100 101-110 Total
MOLLUSCA [0.4] [4.6] [4.8] [10.7] [12.3] [24.8] [23.8] [1.9] - [15.8]Bivalvia (0.4) (4.6) (4.6) (10.7) (10.4) (16.6) (9.4) (0.8) - (8.8)
Solenidae - - - - 6.5 3.2 4.0 - - 2.7Bivalvia unid. 0.4 4.6 4.6 10.7 3.9 13.4 5.4 0.8 - 6.1
Cephalopoda - (<0.1) (0.2) - (1.9) (8.2) (13.4) (1.1) - (7.0)Illex sp. - - - - 1.9 7.2 12.2 1.1 - 6.3Cephalopoda unid. - <0.1 0.2 - - 1.0 1.2 - - 0.7
POLYCHAETA [12.9] [8.2] [15.9] [21.9] [13.1] [14.0] [6.1] [1.3] [2.4] [8.5]Lumbrineris fragilis - 0.9 3.3 1.6 0.4 1.4 <0.1 <0.1 - 0.5Ophelia sp. - 1.0 0.1 5.5 3.1 2.1 1.4 0.3 2.4 1.6Nephtys bucera - <0.1 0.5 1.7 4.7 3.1 0.7 0.5 - 1.7Nephtyidae 4.2 0.2 4.8 4.7 2.6 4.9 2.8 0.2 - 2.8Polychaeta unid. 8.7 6.1 7.2 8.4 2.3 2.5 1.2 0.3 - 1.9
CRUSTACEA [85.7] [78.3] [65.2] [30.5] [6.7] [6.1] [2.3] [0.8] [<0.1] [7.4]Isopoda (4.9) (3.2) (4.3) (4.3) (1.5) (1.2) (0.1) (<0.1) - (0.8)
Cirolana sp. 4.9 3.2 4.3 4.3 1.5 1.2 0.1 <0.1 - 0.8Amphipoda (51.9) (31.6) (11.6) (8.6) (0.7) (0.4) (<0.1) (<0.1) (<0.1) (1.4)
Byblis serrata 7.4 1.9 0.6 0.1 <0.1 <0.1 <0.1 <0.1 - 0.1Unciola irrorata 7.8 4.9 0.5 0.1 <0.1 <0.1 <0.1 - - 0.1Haustoriidae 7.1 5.9 0.2 2.4 0.4 0.4 <0.1 - - 0.4Leptocheirus pinguis 23.7 2.1 4.8 <0.1 <0.1 <0.1 <0.1 - <0.1 0.2Amphipoda unid. 5.9 16.8 5.5 6.0 0.3 <0.1 <0.1 <0.1 - 0.6
Decapoda (27.6) (39.8) (45.1) (16.5) (4.4) (4.4) (1.9) (0.8) - (4.8)Dichelopandalus leptocerus - 0.3 2.2 0.3 <0.1 0.3 <0.1 0.4 - 0.3Crangon septemspinosa 7.0 6.7 29.5 6.9 0.8 0.5 0.2 <0.1 - 1.3Pagurus spp. - 5.6 0.1 4.4 0.1 0.7 <0.1 - - 0.4Cancer irroratus 20.1 24.0 7.1 1.2 2.0 1.0 1.7 0.3 - 1.7Ovalipes ocellatus - 0.9 4.0 3.6 0.5 1.2 <0.1 - - 0.5Decapoda unid. 0.5 2.3 2.2 0.1 1.0 0.7 <0.1 0.1 - 0.6
Crustacea unid. (1.3) (3.7) (4.2) (1.1) (0.1) (0.1) (0.3) (<0.1) - (0.4)CHONDRICHTHYES - - - - [0.5] [0.2] [1.1] - - [0.5]
Rajidae - - - - 0.5 0.2 1.1 - - 0.5OSTEICHTHYES [0.4] [4.9] [9.6] [32.6] [64.7] [49.2] [65.5] [95.2] [96.4] [66.2]
Ophichthus cruentifer - - - 0.2 - - - - - <0.1Gadus morhua - - 0.4 - - - - - - <0.1Merluccius bilinearis - - - - <0.1 0.2 - 11.7 - 2.7Gadidae - - - - - <0.1 3.2 8.0 - 2.9Ammodytes dubius - 3.8 5.2 30.9 60.4 35.4 55.4 68.0 64.0 51.9Cottidae - - - - - 4.3 - - - 1.0Pleuronectes ferruginus - - 0.2 - - - - - - <0.1Osteichthyes larvae - - - <0.1 - - - - - <0.1Osteichthyes unid. 0.4 1.1 3.8 1.5 4.3 9.3 6.9 7.5 32.4 7.7
ANIMAL REMAINS AND MISC. [0.6] [4.0] [4.5] [4.3] [2.7] [5.7] [1.2] [0.8] [1.2] [1.6]
Number sampled 12 52 72 37 85 173 199 102 13 745Number empty 0 4 4 7 16 36 39 38 6 150Mean stomach content (g) 0.687 1.264 1.822 2.869 7.030 7.174 8.910 11.630 11.103 6.588Mean fish length (cm) 24 36 45 55 66 76 84 94 103 72

Page 52
Table B-11b. Diet composition and sampling data for winter skate by geographic area. (Samples gathered during 1977-80.Data expressed as percentage of stomach content by weight. Squared brackets indicate major taxon subtotal;parentheses indicate minor taxon subtotal.)
Geographic Area Inshore
Southern North New Georges Gulf of of Cape
Stomach Contents England Bank Maine Hatteras
MOLLUSCA [10.9] [16.4] [11.7] [0.3]Bivalvia (0.7) (9.5) - (0.3)
Solenidae - 3.0 - -Bivalvia unid. 0.7 6.5 - 0.3
Cephalopoda (10.2) (6.9) (11.7) -Illex sp. - 6.9 - -Cephalopoda unid. 10.2 <0.1 11.7 -
POLYCHAETA [9.0] [8.4] [<0.1] [2.7]Lumbrineris fragilis - 0.6 - -Ophelia sp. - 1.6 - 1.6Nephtys bucera 4.7 1.7 - -Nephtyidae 0.9 2.9 <0.1 0.8Polychaeta unid. 3.4 1.6 - 0.3
CRUSTACEA [8.2] [6.2] [0.1] [8.1]Isopoda (2.1) (0.8) - (0.3)
Cirolana sp. 2.1 0.8 - 0.3Amphipoda (4.1) (0.5) - (1.3)
Byblis serrata 0.2 <0.1 - 0.2Unciola irrorata 1.0 <0.1 - 0.6Leptocheirus pinguis 1.6 0.2 - -Amphipoda unid. 1.3 0.3 - 0.5
Decapoda (1.5) (4.5) - (6.5)Dichelopandalus leptocerus <0.1 0.3 - -Crangon septemspinosa 0.5 1.3 - 0.3Pagurus spp. <0.1 0.3 - -Cancer irroratus 1.0 1.8 - 0.3Ovalipes ocellatus - 0.4 - 5.9Decapoda unid. <0.1 0.4 - -
Crustacea unid. (0.5) (0.4) (0.1) (<0.1)CHONDRICHTHYES - [0.5] - -
Rajidae - 0.5 - -OSTEICHTHYES [66.6] [64.7] [88.1] [88.2]
Ophichthus cruentifer - <0.1 - -Gadus morhua - <0.1 - -Merluccius bilinearis - 2.9 - -Gadidae - 3.1 - -Ammodytes dubius 64.1 50.3 88.1 48.2Cottidae - 1.1 - -Pleuronectes ferruginus - <0.1 - -Osteichthyes larvae - <0.1 - -Osteichthyes unid. 2.5 7.3 - 40.0
ANIMAL REMAINS AND MISC. [5.3] [3.8] [0.1] [0.7]
Number sampled 34 661 12 36Number empty 8 122 2 16Mean stomach content (g) 3.658 7.291 15.204 3.542Mean fish length (cm) 62 72 87 83

Page 53
Table B-12a. Diet composition and sampling data for thorny skate by fish length category. (Samples gathered during 1977-80. Data expressed aspercentage of stomach content by weight. Squared brackets indicate major taxon subtotal; parentheses indicate minor taxon subtotal.)
Length Category (cm) Stomach Contents <21 21-30 31-40 41-50 51-60 61-70 71-80 81-90 >90 Total
CEPHALOPODA - [4.2] [0.4] [7.5] [12.3] [12.1] [6.4] [5.2] [45.9] [22.9]Illex sp. - - - - - 2.8 - - 17.5 7.3Loligo sp. - - - - - - - - 26.3 10.5Octopoda - - 0.4 - - - - 3.6 - 0.6Cephalopoda unid. - 4.2 <0.1 7.5 12.3 9.3 6.4 1.6 2.1 4.5
ANNELIDA [34.7] [37.5] [25.1] [30.7] [39.2] [11.7] [15.3] [16.0] [0.9] [10.7]Aphroditidae 21.0 0.1 1.4 0.4 17.4 2.7 3.0 - - 2.0Nephtys spp. 7.8 6.2 5.2 1.3 5.1 5.0 3.0 1.9 <0.1 2.0Nephtyidae 2.3 - 0.7 0.5 3.4 1.4 1.4 0.8 <0.1 0.8Nereis sp. - - - - 2.4 - 3.6 2.8 - 1.4Annelida unid. 3.6 31.2 17.8 28.5 10.9 2.6 4.3 10.5 0.9 4.5
CRUSTACEA [48.7] [30.4] [70.3] [32.1] [18.7] [19.0] [10.6] [25.7] [3.3] [13.0]Isopoda (0.2) (3.6) (0.4) (0.3) (0.4) (<0.1) (<0.1) (0.1) - (0.1)Amphipoda (33.8) (9.6) (9.7) (5.2) (0.3) (<0.1) (<0.1) - - (0.3)Euphausiacea (1.1) (0.5) (33.9) (3.9) (0.8) (0.4) (6.0) (0.9) (<0.1) (2.3)
Meganyctiphanes norvegica 1.1 0.5 33.9 3.9 0.8 0.4 6.0 0.9 <0.1 2.3Decapoda (8.5) (11.3) (19.9) (12.7) (15.2) (17.2) (4.6) (23.5) (2.0) (9.1)
Dichelopandalus leptocerus - - - - 1.4 1.4 0.1 3.0 0.5 1.0Pandalidae - - - - <0.1 2.0 <0.1 3.4 <0.1 0.9Crangon septemspinosa 7.0 6.0 0.3 1.4 <0.1 0.5 - - - 0.1Axiidae - - - 9.1 1.8 0.3 - 0.3 1.5 0.8Paguridae 0.7 4.9 13.5 - - 2.6 0.6 0.3 - 0.5Hyas sp. - - 3.8 0.5 - 9.9 3.6 8.2 - 3.5Cancer spp. 0.3 0.2 - - 8.0 - - 4.6 - 1.1Decapoda unid. 0.5 0.2 2.3 1.7 4.0 0.5 0.3 3.7 <0.1 1.2
Crustacea unid. (5.1) (5.4) (6.4) (10.0) (2.0) (1.4) (<0.1) (1.2) (1.3) (1.2)AGNATHA - - - - - - [1.3] - - [0.3]CHONDRICHTHYES - - - - - - - [15.1] - [2.3]OSTEICHTHYES [3.1] [3.7] [0.1] - [22.8] [51.1] [60.9] [29.5] [45.1] [45.3]
Clupea harengus - - - - - 36.5 - - 20.8 12.9Clupea sp. - - - - - - 25.5 - - 6.5Ammodytes dubius - - - - - 8.2 13.2 2.0 - 4.7Scombridae - - - - - - - - 1.9 0.7Anarhichadidae - - - - 4.2 - - - - 0.2Cottidae - - - - - 4.6 0.3 - - 0.7Cryptacanthodes maculatus - - - - - - 1.3 15.5 - 2.7Lumpenus maculatus - - - - - - 7.7 - - 1.9Scophthalmus sp. - - - - - - - - 7.3 2.9Pleuronectidae 3.1 3.1 - - - - - - - <0.1Osteichthyes eggs - - - - - - 6.1 - - 1.5Osteichthyes unid. - 0.6 0.1 - 18.6 1.8 6.8 12.0 15.1 10.6
ANIMAL REMAINS AND MISC. [13.5] [24.2] [4.1] [29.7] [7.0] [6.1] [5.5] [8.5] [4.8] [5.5]
Number sampled 31 16 30 29 36 36 42 31 18 269Number empty 2 0 6 3 3 4 6 0 2 26Mean stomach content (g) 0.241 0.434 1.170 0.670 3.098 9.065 15.467 12.595 56.514 9.532Mean fish length (cm) 16 26 34 45 55 65 75 85 95 56

Page 54
Table B-12b. Diet composition and sampling data for thorny skate by geographic area. (Samples gathered during 1977-80.Data expressed as percentage of stomach content by weight. Squared brackets indicate major taxon subtotal;parentheses indicate minor taxon subtotal.)
Geographic Area Inshore North
Georges Gulf of Scotian of CapeStomach Contents Bank Maine Shelf Hatteras
CEPHALOPODA [6.4] [32.6] [16.3] [<0.1]Illex sp. 1.4 10.9 - -Loligo sp. - 16.4 - -Octopoda - 0.9 - -Cephalopoda unid. 5.0 4.4 16.3 <0.1
ANNELIDA [5.6] [8.5] [45.5] [29.6]Aphroditidae 1.7 1.1 12.9 5.9Nephtys spp. 1.6 1.3 20.6 3.1Nephtyidae <0.1 1.3 - <0.1Nereis sp. - - - 18.0Annelida unid. 2.3 4.8 12.0 2.6
CRUSTACEA [17.5] [10.7] [20.7] [4.0]Isopoda (<0.1) (<0.1) - (<0.1)Amphipoda (0.2) (<0.1) (4.5) (0.3)Euphausiacea (<0.1) (3.5) (0.2) (<0.1)
Meganyctiphanes norvegica <0.1 3.5 0.2 <0.1Decapoda (17.1) (5.8) (10.9) (3.5)
Dichelopandalus leptocerus 0.2 1.2 4.9 0.1Pandalidae - 1.3 - 0.2Crangon septemspinosa 0.2 <0.1 - 0.9Axiidae - 0.9 3.3 0.9Paguridae 2.1 <0.1 - <0.1Hyas sp. 13.3 - 1.0 0.7Cancer spp. <0.1 1.6 - -Decapoda unid. 1.3 0.8 1.7 0.7
Crustacea unid. (0.2) (1.4) (5.1) (0.2)AGNATHA - [0.5] - -CHONDRICHTHYES [8.9] - - -OSTEICHTHYES [59.2] [38.3] [15.4] [64.8]
Clupea harengus - 13.0 - 57.8Clupea sp. 25.0 - - -Ammodytes dubius 18.2 - - -Scombridae - 1.2 - -Anarhichadidae - - 7.8 -Cottidae 0.2 0.9 - -Cryptacanthodes maculatus <0.1 4.2 - -Lumpenus maculatus - 3.0 - -Scophthalmus sp. - 4.5 - -Pleuronectidae <0.1 - - -Osteichthyes eggs 6.0 - - -Osteichthyes unid. 9.8 11.5 7.6 7.0
ANIMAL REMAINS AND MISC. [2.4] [9.4] [2.1] [1.6]
Number sampled 67 156 16 30Number empty 5 18 1 2Mean stomach content (g) 9.861 10.491 3.794 6.871Mean fish length (cm) 50 59 56 52

Page 55
Table B-13. Diet composition and sampling data for smooth skate by fish length category. (Samples gathered during 1977-80. Dataexpressed as percentage of stomach content by weight. Squared brackets indicate major taxon subtotal; parentheses indicateminor taxon subtotal.)
Length Category (cm) Stomach Contents <26 26-30 31-35 36-40 41-45 46-50 51-55 56-60 >60 Total
NEMATODA - - - - [0.7] - - [0.1] - [0.1]CRUSTACEA [56.7] [72.2] [100.0] [93.2] [99.3] [100.0] [99.5] [98.2] [100.0] [96.6]
Isopoda - - - - - - (23.2) - - (1.5)Amphipoda - (0.8) - - - - - - - [<0.1]Mysidacea - (5.3) - - - (0.1) - - - (<0.1)
Erythrops erythrophthalma - 1.1 - - - 0.1 - - - <0.1Pseudomma affine - 4.2 - - - - - - - <0.1
Euphausiacea (56.7) (51.2) - - - - - (66.0) - (23.1)Meganyctiphanes norvegica 56.7 51.2 - - - - - 66.0 - 23.1
Decapoda - - (55.8) (93.2) (97.9) (97.5) (51.3) (29.5) (100.0) (69.2)Dichelopandalus leptocerus - - - 41.6 97.9 5.5 - - - 15.7Pandalus borealis - - - 51.1 - - - 22.8 - 14.4Pandalus montagui - - - 0.5 - 7.4 - - - 2.0Pandalidae - - - - - 43.5 - <0.1 - 11.5Crangon septemspinosa - - - - - 10.9 - - - 2.9Paguridae - - - - - - 51.3 - - 3.3Cancer borealis - - - - - - - 4.0 - 1.4Cancer irroratus - - - - - 4.5 - - - 1.2Shrimp unid. - - - - - - - 2.7 100.0 8.9Decapoda unid. - - 55.8 - - 25.7 - - - 7.9
Crustacea unid. - (14.9) (44.2) - (1.4) (2.4) (25.0) (2.7) - (4.3)OSTEICHTHYES - - - - - - [0.3] - - [<0.1]ANIMAL REMAINS [43.3] [27.8] - [6.8] - - [0.2] [1.7] - [3.3]
Number sampled 1 6 2 3 3 5 4 4 1 29Number empty 0 3 1 1 1 1 1 0 0 8Mean stomach content (g) 0.171 0.088 0.641 2.900 2.028 3.545 1.089 5.734 5.383 2.316Mean fish length (cm) 17 27 33 37 42 49 53 58 66 43

Page 56
Table B-14. Diet composition and sampling data for bluntnose stingray by fish length category. (Samples gathered during 1977-80.Data expressed as percentage of stomach content by weight. Squared brackets indicate major taxon subtotal; parenthesesindicate minor taxon subtotal.)
Length Category (cm) Stomach Contents 21-40 41-60 61-80 >80 Total
CESTODA - [<0.1] - - [<0.1]MOLLUSCA - [91.4] [19.3] [0.1] [19.7]
Spisula solidissima - - 0.4 0.1 <0.1Bivalvia - 91.4 18.9 - 19.7
POLYCHAETA [1.1] [0.1] [11.6] [0.2] [10.2]Nereis sp. - - - 0.2 <0.1Polychaeta unid. 1.1 0.1 11.6 - 10.2
SIPUNCULA - - [2.2] - [2.0]Golfingia sp. - - 2.2 - 2.0
CRUSTACEA [85.2] [0.7] [19.0] [97.1] [24.2]Amphipoda (77.4) (0.4) - - (0.4)
Ampelisca macrocephala 49.5 - - - 0.1Ampelisca verrilli 15.2 - - - 0.2Unciola sp. - <0.1 - - <0.1Gammaridea 9.6 - - - 0.1Amphipoda unid. 3.1 0.4 - - <0.1
Euphausiacea - - - (1.8) (0.1)Meganyctiphanes norvegica - - - 1.7 0.1Euphausiacea unid. - - - 0.1 <0.1
Decapoda (2.3) (0.3) (18.5) (95.3) (23.2)Hippolytidae - - - <0.1 <0.1Crangon septemspinosa 2.3 0.3 - 20.0 1.5Callianassa setimanus - - 14.2 - 12.5Callianassa sp. - - 0.2 - 0.1Callianassidae - - 3.6 - 3.2Cancer irroratus - - - 9.3 0.7Munida iris - - - 0.2 <0.1Munida valida - - - 2.0 0.1Ranilia muricata - - - 49.0 3.6Decapoda unid. - - 0.5 14.8 1.5
Crustacea unid. (5.5) - (0.5) - (0.5)OSTEICHTHYES [<0.1] - [46.2] [0.2] [40.9]
Anchoa mitchilli - - 0.5 - 0.4Osmerus mordax - - - 0.2 <0.1Leiostomus xanthurus - - 39.4 - 34.9Stenotomus chrysops - - 6.2 - 5.5Osteichthyes eggs <0.1 - - - <0.1Osteichthyes unid. - - 0.1 - 0.1
ANIMAL REMAINS [12.3] [7.8] [1.7] [2.4] [3.0]SAND [1.4] - - - [<0.1]
Number sampled 8 7 8 3 26Number empty 3 1 0 0 4Mean stomach content (g) 0.572 2.068 48.777 10.689 16.974Mean fish length (cm) 26 51 72 119 58

Page 57
Table B-15a. Diet composition and sampling data for alewife by fish length category. (Samples gathered during 1977-80. Data expressedas percentage of stomach content by weight. Squared brackets indicate major taxon subtotal; parentheses indicate minor taxonsubtotal.)
Length Category (cm) Stomach Contents 6-10 11-15 16-20 21-25 26-30 31-35 Total
CNIDARIA - - - [0.9] [2.1] - [1.5]CHAETOGNATHA - - [0.3] [1.3] [0.8] - [0.9]MOLLUSCA - - - [<0.1] [0.4] [0.3] [0.3]
Opisthobranchia - - - - 0.2 <0.1 0.1Gastropoda - - - <0.1 0.1 0.3 0.1Cephalopoda - - - - 0.1 - 0.1
CRUSTACEA [98.5] [99.8] [79.2] [89.1] [90.2] [37.7] [88.7]Copepoda (67.5) (29.6) (17.2) (27.2) (17.7) (10.5) (21.3)
Candacia armata - - - - <0.1 0.6 <0.1Calanoida 5.6 14.4 4.4 3.1 8.6 1.6 6.3Copepoda unid. 61.9 15.2 12.8 24.1 9.1 8.3 15.0
Amphipoda (0.8) (0.5) (0.4) (3.4) (6.5) (8.3) (5.2)Hyperia glaba - - - - - 0.4 <0.1Parathemisto sp. - - <0.1 1.9 5.2 7.9 3.7Hyperiidae 0.8 0.5 0.4 <0.1 <0.1 <0.1 0.1Unciola sp. - - - - <0.1 - <0.1Rhachotropis oculata - - - <0.1 <0.1 - <0.1Gammarus sp. - - - 0.2 0.2 - 0.2Protohaustorius wigleyi - <0.1 - - - - <0.1Monoculodes sp. - - - 0.4 <0.1 - 0.2Leptocheirus pinguis - - - - <0.1 - <0.1Pontogeneia inermis - - - <0.1 <0.1 - <0.1Amphipoda unid. - - - 0.9 1.1 - 1.0
Mysidacea - - - (6.1) (2.9) - (3.8)Neomysis americana - - - 5.8 2.9 - 3.7Mysidacea unid. - - - 0.3 - - 0.1
Euphausacea - (27.1) (19.7) (45.1) (53.9) (2.3) (47.1)Meganyctiphanes norvegica - 10.1 19.7 39.6 51.8 2.1 43.7Euphausiacea unid. - 17.0 - 5.5 2.1 0.2 3.4
Decapoda - (0.4) (1.8) (3.9) (1.7) (<0.1) (2.5)Dichelopandalus leptocerus - - - - 0.2 - 0.1Crangon septemspinosa - - - <0.1 - - <0.1Paguroidea - - 0.1 <0.1 <0.1 - <0.1Decapoda larvae - 0.4 1.7 3.9 1.5 <0.1 2.4
Crustacea unid. (30.2) (42.2) (40.1) (3.4) (7.5) (16.6) (8.8)THALIACEA - - - [0.4] [1.4] [6.1] [1.0]
Salpidae - - - 0.2 <0.1 6.1 0.2Thaliacea unid. - - - 0.2 1.4 - 0.8
LARVACEA - - - - [0.2] [4.4] [0.2]OSTEICHTHYES - - [17.6] [0.8] [0.4] - [1.7]
Ammodytes dubius - - 15.0 - - - 1.0Osteichthyes unid. - - 2.6 0.8 0.4 - 0.7
ANIMAL REMAINS AND MISC. [1.5] [0.2] [2.9] [7.5] [4.5] [51.5] [5.7]
Number sampled 11 25 40 70 87 7 240Number empty 0 5 8 5 9 1 28Mean stomach content (g) 0.011 0.100 0.276 0.905 1.056 0.484 0.718Mean fish length (cm) 8 13 18 23 27 32 22

Page 58
Table B-15b. Diet composition and sampling data for alewife by geographic area. (Samples gathered during 1977-80. Dataexpressed as percentage of stomach content by weight. Squared brackets indicate major taxon subtotal; parenthesesindicate minor taxon subtotal.)
Geographic Area Inshore
Southern NorthMiddle New Georges Gulf of Scotian of Cape
Stomach Contents Atlantic England Bank Maine Shelf Hatteras
CNIDARIA - - - - - [9.6]CHAETOGNATHA [36.4] - - [<0.1] - [0.1]MOLLUSCA [2.5] [0.3] - [0.2] - -
Opisthobranchia - - - 0.2 - -Gastropoda - 0.3 - <0.1 - -Cephalopoda 2.5 - - - - -
CRUSTACEA [56.5] [92.4] [82.1] [93.1] [99.9] [68.3]Copepoda (28.6) (46.6) - (8.6) - (42.2)
Candacia armata - - - <0.1 - -Calanoida 28.6 2.6 - 1.7 - 26.3Copepoda unid. - 44.0 - 6.9 - 15.9
Amphipoda (8.4) (15.2) (79.3) (1.3) - (<0.1)Hyperia glaba - - - <0.1 - -Parathemisto sp. 7.6 13.8 - 1.3 - <0.1Hyperiidae 0.8 - - <0.1 - <0.1Unciola sp. - - <0.1 - - -Rhachotropis oculata - - 1.3 - - -Gammarus sp. - 1.1 - - - -Monoculodes sp. - - 12.1 - - -Leptocheirus pinguis - - <0.1 - - -Pontogeneia inermis - - 0.6 - - -Amphipoda unid. - 0.3 65.3 - - -
Mysidacea - (19.0) - - - -Neomysis americana - 18.4 - - - -Mysidacea unid. - 0.6 - - - -
Euphausacea - (5.9) - (70.9) (99.9) (7.1)Meganyctiphanes norvegica - 5.7 - 64.8 99.9 7.1Euphausiacea unid. - 0.2 - 6.1 - <0.1
Decapoda - (0.7) (0.3) (<0.1) - (15.4)Dichelopandalus leptocerus - 0.7 - - - -Crangon septemspinosa - <0.1 0.3 - - -Paguroidea - - - - - 0.2Decapoda larvae - - - <0.1 - 15.2
Crustacea unid. (19.5) (5.0) (2.5) (12.3) - (3.6)THALIACEA - - - [0.4] - [5.2]
Salpidae - - - 0.4 - -Thaliacea unid. - - - - - 5.2
LARVACEA - - - [0.3] - -OSTEICHTHYES [1.9] [2.0] [0.4] [0.1] - [7.3]
Ammodytes dubius - - - - - 6.2Osteichthyes unid. 1.9 2.0 0.4 0.1 - 1.1
ANIMAL REMAINS AND MISC. [2.7] [5.3] [17.5] [5.9] [0.1] [9.5]
Number sampled 10 26 10 126 5 64Number empty 0 7 1 15 1 5Mean stomach content (g) 0.431 1.317 0.238 0.749 2.059 0.417Mean fish length (cm) 25 25 26 20 29 23

Page 59
Table B-16. Diet composition and sampling data for Atlantic menhaden by fish length category. (Samples gathered during1977-80. Data expressed as percentage of stomach content by weight. Squared brackets indicate major taxonsubtotal; parentheses indicate minor taxon subtotal.)
Length Category (cm) Stomach Contents 16-20 21-25 26-30 Total
FORAMINIFERA [2.3] - - [0.2]CRUSTACEA [14.4] [57.5] [19.5] [49.8]
Copepoda (12.5) (45.2) (19.5) (39.6)Calanoida 12.5 44.7 19.5 39.2Copepoda unid. - 0.5 - 0.4
Mysidacea - (12.0) - (9.7)Neomysis americana - 12.0 - 9.7
Decapoda (1.9) (0.3) - (0.5)Pagurus sp. - <0.1 - 0.1Pagurus larvae 1.5 - - 0.1Decapoda larvae 0.4 0.3 - 0.3
Crustacea larvae - (<0.1) - (<0.1)ANIMAL REMAINS [29.1] [9.4] [80.5] [18.1]SAND [54.2] [33.1] - [31.9]
Number sampled 11 15 6 32Number empty 3 0 0 3Mean stomach content (g) 0.024 0.151 0.045 0.087Mean fish length (cm) 17 22 26 21

Page 60
Table B-17a. Diet composition and sampling data for Atlantic herring by fish length category. (Samples gathered during 1977-80. Dataexpressed as percentage of stomach content by weight. Squared brackets indicate major taxon subtotal; parentheses indicateminor taxon subtotal.)
Length Category (cm) Stomach Contents 11-15 16-20 21-25 26-30 31-35 Total
TREMATODA - - [<0.1] - - [<0.1]CHAETOGNATHA - - [15.1] [4.0] - [7.5]GASTROPODA - - [<0.1] - - [<0.1]CRUSTACEA [98.9] [95.9] [68.6] [93.4] [98.4] [85.2]
Copepoda (0.6) - (2.6) (4.2) (98.4) (3.8)Calanus sp. - - - <0.1 - <0.1Calanoida 0.6 - 1.1 0.1 16.1 0.5Copepoda unid. - - 1.5 4.1 82.3 3.3
Cirripedia - - (<0.1) - - (<0.1)Cumacea - - (0.3) - - (0.1)
Diastylidae - - 0.3 - - 0.1Amphipoda (1.2) (8.5) (1.2) (5.1) - (3.7)
Parathemisto gaudichaudii - - 0.4 4.8 - 3.0Parathemisto sp. - 0.1 0.8 0.3 - 0.4Hyperiidae 1.2 8.4 <0.1 - - 0.3Calliopius laeviusculus - - <0.1 <0.1 - <0.1Gammaridea - - <0.1 - - <0.1
Mysidacea - - (<0.1) - - (<0.1)Erythrops erythrophthalma - - <0.1 - - <0.1Mysidopsis bigelowi - - <0.1 - - <0.1
Euphausiacea (83.6) (43.2) (62.9) (83.8) - (75.1)Euphausia sp. - - 1.1 - - 0.4Meganyctiphanes norvegica 1.5 10.3 37.0 82.0 - 61.8Thysanoessa raschii 81.9 - 10.4 1.8 - 7.0Euphausiacea unid. 0.2 32.9 14.4 - - 5.9
Decapoda (0.3) - (<0.1) (<0.1) - (<0.1)Decapoda larvae 0.3 - <0.1 <0.1 - <0.1Decapoda unid. - - - <0.1 - <0.1
Crustacea larvae - - (<0.1) - - (<0.1)Crustacea unid. (13.2) (44.2) (1.6) (0.3) - (2.5)
OSTEICHTHYES - - - [<0.1] - [<0.1]Pholis gunnellus - - - <0.1 - <0.1
ANIMAL REMAINS [0.7] [4.1] [16.3] [2.6] [1.6] [7.3]ROCK [0.4] - - - - [<0.1]
Number sampled 21 18 51 45 4 139Number empty 4 2 12 11 2 31Mean stomach content (g) 0.101 0.126 0.472 0.946 0.076 0.513Mean fish length (cm) 13 17 23 27 31 22

Page 61
Table B-17b. Diet composition and sampling data for Atlantic herring by geographic area. (Samples gathered during 1977-80. Dataexpressed as percentage of stomach content by weight. Squared brackets indicate major taxon subtotal; parentheses indicateminor taxon subtotal.)
Geographic Area Offshore Inshore South North
Georges Gulf of Scotian of Cape of CapeStomach Contents Bank Maine Shelf Hatteras Hatteras
TREMATODA [<0.1] - - - -CHAETOGNATHA [58.0] - - - -GASTROPODA - [<0.1] - - -CRUSTACEA [4.3] [97.6] [97.2] - [2.3]
Copepoda (2.8) (4.5) (0.3) - (2.3)Calanus sp. - <0.1 - - -Calanoida 2.8 0.2 0.3 - 2.3Copepoda unid. - 4.3 - - -
Cirripedia - (<0.1) - - -Cumacea - (0.1) - - -
Diastylidae - 0.1 - - -Amphipoda (1.3) (4.7) (0.1) - -
Parathemisto gaudichaudii 1.1 3.7 0.1 - -Parathemisto sp. - 0.6 - - -Hyperiidae <0.1 0.4 - - -Calliopius laeviusculus 0.2 - - - -Gammaridea - <0.1 - - -
Mysidacea (<0.1) (<0.1) - - -Erythrops erythrophthalma - <0.1 - - -Mysidopsis bigelowi <0.1 - - - -
Euphausiacea (0.2) (85.7) (92.1) - -Euphausia sp. - - 3.6 - -Meganyctiphanes norvegica - 80.4 - - -Thysanoessa raschii 0.2 4.6 34.8 - -Euphausiacea unid. - 0.7 53.7 - -
Decapoda - (<0.1) - - -Decapoda larvae - <0.1 - - -Decapoda unid. - <0.1 - - -
Crustacea larvae (<0.1) - - - -Crustacea unid. (<0.1) (2.6) (4.7) - -
OSTEICHTHYES - [<0.1] - - -Pholis gunnellus - <0.1 - - -
ANIMAL REMAINS [37.7] [2.4] [2.8] [100.0] [97.7]ROCK - [<0.1] - - -
Number sampled 10 91 22 6 10Number empty 0 19 2 3 8Mean stomach content (g) 0.923 0.603 0.326 0.001 0.009Mean fish length (cm) 24 23 19 15 27

Page 62
Table B-18. Diet composition and sampling data for round herring by fish length category. (Samples gathered during1977-80. Data expressed as percentage of stomach content by weight. Squared brackets indicate major taxonsubtotal; parentheses indicate minor taxon subtotal.)
Length Category (cm) Stomach Contents 6-10 11-15 16-20 Total
GASTROPODA - [<0.1] - [<0.1]CRUSTACEA [80.6] [65.0] [57.7] [62.6]
Copepoda (26.4) (41.7) (1.6) (27.7)Candacia armata - 0.3 - 0.2Calanoida 26.4 10.4 - 6.9Copepoda unid. - 31.0 1.6 20.6
Cirripedia larvae (cypris) - (<0.1) - (<0.1)Stomatopoda - (0.5) - (0.4)Amphipoda - (0.6) (2.7) (1.3)
Hyperiidae - <0.1 - <0.1Ampelisca sp. - - 0.1 <0.1Byblis serrata - <0.1 0.2 0.1Gammarus lawrencianus - 0.6 2.4 1.2
Mysidacea - (3.7) (15.6) (7.8)Neomysis americana - 3.7 15.6 7.8Mysidacea - <0.1 - <0.1
Decapoda - (16.2) (31.0) (21.3)Lucifer faxoni - 0.2 0.1 0.2Decapoda larvae - 16.0 29.4 20.6Shrimp - <0.1 - <0.1Decapoda unid. - - 1.5 0.5
Crustacea larvae - (0.2) (4.4) (1.6)Crustacea unid. (54.2) (2.1) (2.4) (2.5)
OSTEICHTHYES - [27.9] [42.3] [32.8]Pleuronectiformes - 0.8 - 0.5Osteichthyes larvae - 11.8 - 7.7Osteichthyes unid. - 15.3 42.3 24.6
ANIMAL REMAINS [19.4] [7.1] - [4.6]
Number sampled 12 81 5 98Number empty 1 14 0 15Mean stomach content (g) 0.006 0.113 0.978 0.144Mean fish length (cm) 9 11 17 11

Page 63
Table B-19. Diet composition and sampling data for Atlantic argentine by fish length category. (Samples gathered during 1977-80. Dataexpressed as percentage of stomach content by weight. Squared brackets indicate major taxon subtotal; parentheses indicateminor taxon subtotal.)
Length Category (cm) Stomach Contents 16-20 21-25 26-30 31-35 36-40 41-45 Total
HYDROZOA - - - [3.5] [2.7] - [1.2]Siphonophora - - - 3.5 2.7 - 1.2
CTENOPHORA - [9.2] [0.9] - - - [1.8]TREMATODA - - [<0.1] - - - [<0.1]NEMATODA - [<0.1] [<0.1] [<0.1] - - [<0.1]CHAETOGNATHA - [7.3] [0.6] - - - [1.4]CEPHALOPODA - - - [1.4] - - [0.5]POLYCHAETA [52.8] - [0.1] - - - [1.0]
Trochochaeta sp. - - 0.1 - - - 0.1Polychaeta unid. 52.8 - - - - - 0.9
CRUSTACEA [40.5] [9.0] [86.3] [79.9] [85.0] [100.0] [72.4]Copepoda - - - (1.1) (37.2) - (0.9)Isopoda - - (0.2) - - - (0.1)Amphipoda - (2.3) (2.3) (0.5) - - (1.8)
Hyperia glaba - 0.2 0.8 - - - 0.4Hyperia sp. - - - 0.4 - - 0.1Parathemisto gaudichaudii - - 0.4 - - - 0.2Parathemisto sp. - 1.3 0.4 0.1 - - 0.5Hyperiidae - 0.1 0.7 <0.1 - - 0.4Gammaridea - 0.4 - - - - 0.1Amphipoda unid. - 0.3 - - - - 0.1
Euphausacea (40.5) (4.8) (77.9) (76.5) (47.8) (100.0) (65.8)Meganyctiphanes norvegica 40.5 4.8 77.9 75.6 47.8 100.0 65.5Euphausacea unid. - - - 0.9 - - 0.3
Decapoda - (0.4) (2.6) (0.7) - - (1.6)Shrimp unid. - - 2.6 - - - 1.3Decapoda larvae - 0.4 <0.1 - - - 0.1Decapoda unid. - - - 0.7 - - 0.2
Crustacea unid. - (1.5) (3.3) (1.1) - - (2.2)THALIACEA - - - [2.6] - - [0.8]
Salpidae - - - 2.6 - - 0.8OSTEICHTHYES - [41.2] [4.8] [5.6] - - [10.3]
Maurolicus muelleri - - - 4.2 - - 1.4Osteichthyes unid. - 41.2 4.8 1.4 - - 8.9
ANIMAL REMAINS - [33.3] [7.3] [7.0] [12.3] - [10.5]ROCK [6.7] - - - - - [0.1]
Number sampled 4 24 54 69 27 6 184Number empty 2 6 24 49 22 5 108Mean stomach content (g) 0.126 0.178 0.266 0.137 0.015 0.027 0.158Mean fish length (cm) 18 23 28 33 38 41 31

Page 64
Table B-20. Diet composition and sampling data for cusk by fish length category. (Samples gathered during 1977-80. Data expressed aspercentage of stomach content by weight. Squared brackets indicate major taxon subtotal; parentheses indicate minor taxonsubtotal.)
Length Category (cm) Stomach Contents <51 51-60 61-70 71-80 81-90 91-100 Total
TREMATODA - - [<0.1] [<0.1] - - [<0.1]MOLLUSCA - - [0.1] [1.0] - - [0.1]
Cephalopoda - - - 1.0 - - 0.1Mollusca unid. - - 0.1 - - - <0.1
ANNELIDA [14.9] - [<0.1] - - - [2.2]Onuphidae 0.3 - - - - - <0.1Polychaeta - - <0.1 - - - <0.1Annelida unid. 14.6 - - - - - 2.2
CRUSTACEA [85.1] [100.0] [3.9] [46.1] [40.7] [89.4] [51.4]Isopoda - - - - (6.1) - (0.4)
Cirolana sp. - - - - 6.1 - 0.4Amphipoda (2.1) - - - - - (0.3)
Caprellidae 2.0 - - - - - 0.3Gammaridea 0.1 - - - - - <0.1
Euphausiacea (1.9) (100.0) (0.9) (9.4) - - (1.8)Meganyctiphanes norvegica 1.9 - - 9.4 - - 1.0Euphausiacea unid. - 100.0 0.9 - - - 0.8
Decapoda (77.1) - (3.0) (36.7) (27.0) (89.4) (47.7)Spirontocaris liljeborgii - - 3.0 - - - 1.1Hippolytidae - - - 36.7 - - 2.7Dichelopandalus leptocerus - - - - - 25.2 8.6Pandalidae - - - - 27.0 - 1.9Crangon septemspinosa 31.9 - - - - - 4.8Paguridae 45.2 - - - - - 6.8Majidae - - - - - 64.2 21.8
Crustacea unid. (4.0) - - - (7.6) - (1.2)ECHINODERMATA - - [37.5] - [20.1] - [15.0]
Ophiura sarsi - - 37.5 - - - 13.6Ophiura sp. - - - - 20.1 - 1.4
OSTEICHTHYES [<0.1] - [42.6] [<0.1] - - [15.5]Artediellus uncinatus - - 26.7 - - - 9.7Osteichthyes scales <0.1 - - <0.1 - - <0.1Osteichthyes unid. - - 15.9 - - - 5.8
ANIMAL REMAINS - - [8.2] [25.8] [39.2] [10.6] [11.0]ROCK - - [7.7] [27.1] - - [4.8]
Number sampled 9 6 9 8 11 6 49Number empty 5 5 4 5 5 3 27Mean stomach content (g) 0.385 0.016 0.925 0.210 0.148 1.307 0.470Mean fish length (cm) 43 58 63 72 85 96 69

Page 65
Table B-21a. Diet composition and sampling data for Atlantic cod by fish length category. (Samples gathered during 1977-80. Data expressed aspercentage of stomach content by weight. Squared brackets indicate major taxon subtotal; parentheses indicate minor taxon subtotal.)
Length Category (cm) Stomach Contents 1-10 11-20 21-30 31-40 41-50 51-60 61-70 71-80 >80 Total
CNIDARIA - - - [2.4] [<0.1] [1.7] [0.2] [0.3] - [0.2]MOLLUSCA - [18.4] [<0.1] [2.8] [5.6] [9.5] [23.3] [40.2] [10.7] [14.9]
Pectinidae - (17.9) - - (1.1) (<0.1) (0.5) (3.2) - (0.6)Cephalopoda - - - - - (4.6) (19.7) (32.7) (9.8) (12.5)
Illex illecebrosus - - - - - - 7.1 14.5 8.8 2.4Loligo sp. - - - - - - - 11.1 0.9 1.9Cephalopoda unid. - - - - - 4.6 12.6 7.1 0.1 8.2
Mollusca unid. - (0.5) (<0.1) (2.8) (4.5) (4.9) (3.1) (4.3) (0.9) (1.8)POLYCHAETA [0.5] [0.7] [10.4] [2.4] [2.7] [0.8] [1.3] [0.3] [2.3] [2.5]CRUSTACEA [92.9] [80.6] [43.2] [45.1] [49.3] [41.8] [30.3] [35.2] [12.8] [21.1]
Amphipoda (6.4) (26.2) (20.6) (4.8) (3.3) (2.7) (1.5) (1.0) (0.4) (1.2)Aeginina longicornis - - 5.3 0.1 - <0.1 <0.1 - - 0.1Unciola irrorata - 8.0 3.9 1.1 0.9 <0.1 <0.1 0.7 <0.1 0.2Leptocheirus pinguis 0.3 15.4 5.4 1.2 1.1 0.2 <0.1 <0.1 - 0.1Amphipoda unid. 6.1 2.8 6.0 2.4 1.3 2.5 1.5 0.3 0.4 0.8
Mysidacea (79.6) - (0.6) - (<0.1) (<0.1) - - - (0.1)Euphausiacea (0.4) (4.3) (<0.1) (2.4) (6.3) (6.4) (2.1) (<0.1) (<0.1) (0.9)
Meganyctiphanes norvegica 0.4 4.3 <0.1 2.4 6.3 6.4 2.1 <0.1 <0.1 0.9Decapoda (2.7) (34.5) (19.4) (34.3) (32.9) (30.2) (23.8) (32.2) (12.2) (17.8)
Dichelopandalus leptocerus 0.6 - 1.2 1.8 4.8 0.7 0.4 0.7 0.2 0.5Pandalus borealis - - - 0.3 1.3 2.1 2.9 0.6 <0.1 0.5Crangon septemspinosa 0.1 7.3 10.6 6.0 1.0 0.6 0.1 <0.1 <0.1 0.3Pagurus spp. - - 0.6 2.9 2.8 2.8 2.3 1.2 0.2 0.8Hyas spp. - 25.1 2.8 2.8 6.1 2.8 3.1 6.1 0.2 1.6Cancer borealis - - - 1.3 3.6 8.4 5.1 6.9 3.5 4.3Cancer irroratus - - 2.0 7.2 9.2 9.2 7.0 6.7 5.6 6.2Decapoda unid. 2.0 2.1 2.2 12.0 4.1 3.6 2.9 10.0 2.5 3.6
Crustacea unid. (3.8) (15.6) (2.6) (3.6) (6.8) (2.5) (2.9) (2.0) (0.2) (1.1)ECHINODERMATA - - [1.9] [0.6] [5.5] [4.4] [1.7] [2.2] [0.3] [1.1]CHORDATA - - [40.2] [39.3] [24.8] [36.4] [38.8] [20.1] [70.3] [56.8]
Squalus acanthias - - - - - - - - 6.9 4.6Clupeidae - - - - - - 4.4 9.7 6.5 5.9Gadus morhua - - - - - - - - 6.2 4.1Merluccius bilinearis - - - 17.2 - 4.1 - - 6.2 4.7Gadidae - - - - 0.8 15.0 0.3 - - 1.2Ammodytes dubius - - - 10.8 11.1 7.2 16.9 4.4 13.0 11.5Macrozoarces americanus - - - - - - - - 3.9 2.6Scophthalmus aquosus - - - - - - 3.7 1.0 2.4 2.0Pleuronectes ferruginus - - 0.4 - - - - - - <0.1Pleuronectes americanus - - - 0.2 - - - - 1.7 1.1Fish eggs and larvae - - <0.1 <0.1 0.8 <0.1 - - 0.2 0.2Chordata unid. - - 39.8 11.1 12.1 10.1 13.5 5.0 23.3 18.9
ANIMAL REMAINS AND MISC. [6.6] [0.3] [4.3] [7.4] [12.1] [5.4] [4.4] [1.7] [3.6] [3.4]
Number sampled 134 14 81 73 78 109 86 52 91 718Number empty 8 1 4 1 2 5 4 4 4 33Mean stomach content (g) 0.096 0.781 2.406 3.302 5.888 12.096 15.733 39.021 120.157 23.056Mean fish length (cm) 5 18 25 35 45 55 65 75 95 46

Page 66
Table B-21b. Diet composition and sampling data for Atlantic cod by geographic area. (Samples gathered during 1977-80. Dataexpressed as percentage of stomach content by weight. Squared brackets indicate major taxon subtotal; parenthesesindicate minor taxon subtotal.)
Geographic Area Inshore
Southern NorthMiddle New Georges Gulf of Scotian of Cape
Stomach Contents Atlantic England Bank Maine Shelf Hatteras
CNIDARIA - [<0.1] [1.1] - - [0.2]MOLLUSCA - [0.2] [11.0] [43.6] - [3.7]
Pectinidae - (<0.1) (3.7) - - (0.5)Cephalopoda - (<0.1) (1.6) (43.6) - (<0.1)
Illex sp. - - - 29.2 - -Loligo sp. - - - 6.9 - -Cephalopoda unid. - <0.1 1.6 7.5 - <0.1
Mollusca unid. - (0.2) (5.7) (<0.1) - (3.2)POLYCHAETA [1.1] [5.4] [2.4] [0.1] [<0.1] [1.9]CRUSTACEA [24.3] [19.2] [39.5] [9.3] [31.1] [24.7]
Amphipoda (<0.1) (0.5) (2.3) (0.5) (<0.1) (1.6)Unciola irrorata - 0.4 0.1 0.2 - <0.1Leptocheirus pinguis - <0.1 <0.1 0.3 - 0.1Amphipoda unid. <0.1 0.1 2.2 <0.1 <0.1 1.5
Mysidacea - (0.2) (<0.1) - - (<0.1)Euphausiacea - (<0.1) (<0.1) (3.1) (2.2) (0.2)
Meganyctiphanes norvegica - <0.1 <0.1 3.1 2.2 0.2Decapoda (24.3) (17.9) (34.1) (5.5) (10.0) (21.6)
Dichelopandalus leptocerus - 0.3 2.3 <0.1 1.6 0.3Pandalus borealis - - - 1.2 3.1 0.7Crangon septemspinosa - 0.2 0.1 <0.1 - 0.9Pagurus spp. - 0.5 3.1 <0.1 - 0.2Hyas spp. - <0.1 8.2 <0.1 - 1.7Cancer borealis - 9.6 2.8 - - 4.0Cancer irroratus 17.4 5.5 14.7 <0.1 - 9.0Decapoda unid. 6.9 1.8 2.9 4.3 5.3 4.8
Crustacea unid. (<0.1) (0.6) (3.1) (0.2) (18.9) (1.3)ECHINODERMATA - [0.5] [1.5] [0.4] [49.7] [2.0]CHORDATA [74.2] [71.9] [40.3] [43.8] [4.0] [61.4]
Squalus acanthias - 15.8 - - - -Clupeidae - - - 15.3 - 5.4Gadus morhua - 14.1 - - - -Merluccius bilinearis - - - 16.8 - -Gadidae - - 0.2 - - 4.2Ammodytes dubius - 17.8 7.4 - - 18.4Macrozoarces americanus - 7.1 - - - 1.7Scophthalmus aquosus - 1.5 - - - 5.4Pleuronectes ferruginus - - - - - <0.1Pleuronectes americanus - - - - - 3.9Fish eggs and larvae - - <0.1 0.5 - <0.1Chordata unid. 74.2 15.6 32.7 11.2 4.0 22.4
ANIMAL REMAINS AND MISC. [0.4] [2.8] [4.2] [2.8] [15.2] [6.1]
Number sampled 6 142 179 130 12 250Number empty 1 5 7 10 0 11Mean stomach content (g) 15.969 33.870 11.999 35.706 1.767 19.350Mean fish length (cm) 21 45 40 59 26 46

Page 67
Table B-22a. Diet composition and sampling data for haddock by fish length category. (Samples gathered during 1977-80. Data expressedas percentage of stomach content by weight. Squared brackets indicate major taxon subtotal; parentheses indicate minor taxonsubtotal.)
Length Category (cm) Stomach Contents 1-10 11-20 21-30 31-40 41-50 51-60 61-70 71-80 81-90 Total
CNIDARIA [2.9] - [<0.1] [<0.1] - [0.2] [<0.1] - - [0.7]MOLLUSCA - [3.4] [0.7] [8.1] [4.4] [5.9] [1.5] [5.0] [<0.1] [4.3]
Gastropoda - - - (2.7) (0.4) (<0.1) - - - (0.4)Bivalvia - (3.1) (0.7) (5.3) (2.4) (4.6) (1.0) (0.3) (<0.1) (2.4)Cephalopoda - - - (<0.1) (1.5) (0.3) - (4.7) - (1.1)Mollusca unid. - (0.3) - (0.1) (0.1) (1.0) (0.5) (<0.1) - (0.4)
POLYCHAETA [0.9] [20.2] [7.1] [14.1] [17.0] [24.5] [4.7] [8.0] [<0.1] [14.1]Nephtyidae - 2.7 <0.1 <0.1 2.1 0.3 0.4 0.6 <0.1 0.6Spionidae - 0.5 0.3 1.4 1.2 2.0 <0.1 0.3 - 0.8Polychaeta unid. 0.9 17.0 6.8 12.7 13.7 22.2 4.3 7.1 <0.1 12.7
CRUSTACEA [56.3] [47.1] [11.3] [31.4] [27.4] [14.3] [13.7] [3.0] [61.3] [18.3]Cumacea (4.0) (3.2) (0.4) (0.2) (<0.1) (<0.1) - (<0.1) - (0.1)Amphipoda (31.6) (16.9) (6.0) (17.6) (8.8) (9.6) (6.0) (0.4) (<0.1) (6.7)
Parathemisto sp. 2.3 0.4 <0.1 <0.1 0.3 2.2 2.8 <0.1 <0.1 1.4Hyperiidae 6.0 - <0.1 <0.1 <0.1 <0.1 <0.1 <0.1 - <0.1Ericthonius rubricornis 14.3 0.2 0.3 0.2 <0.1 <0.1 <0.1 - - <0.1Unciola irrorata 0.3 5.5 2.0 8.9 3.1 3.3 1.4 0.4 - 2.2Leptocheirus pinguis - 5.2 1.2 0.6 0.4 2.3 0.5 <0.1 - 1.0Amphipoda unid. 8.7 5.6 2.5 7.9 5.0 1.8 1.3 <0.1 <0.1 2.1
Mysidacea - (14.7) - - - - - - - (0.1)Euphausacea - - (0.6) (6.3) (13.4) (0.8) (6.1) (0.1) (61.3) (8.0)
Meganyctiphanes norvegica - - 0.6 6.3 13.4 0.8 6.1 0.1 61.3 8.0Decapoda (0.9) (4.2) (3.4) (6.4) (3.7) (3.6) (1.4) (2.1) - (2.9)
Dichelopandalus leptocerus - 0.5 2.5 0.5 0.7 0.3 <0.1 - - 0.3Crangon septemspinosa - 2.3 0.9 0.9 0.6 <0.1 - <0.1 - 0.2Decapoda unid. 0.9 1.4 <0.1 5.0 2.4 3.3 1.4 2.1 - 2.4
Crustacea unid. (19.8) (8.1) (0.9) (0.9) (1.5) (0.3) (0.2) (0.4) - (0.5)ECHINODERMATA - [0.7] [4.4] [18.4] [28.5] [32.5] [57.4] [71.5] [34.2] [43.7]
Crinoidea - - - - (2.3) - (3.1) - - (1.0)Holothuroidea - - - - (0.7) (1.0) (2.4) (0.6) - (1.1)Echinoidea - (0.4) (<0.1) (2.7) (1.0) (2.0) (1.2) (2.6) - (1.5)Ophiuroidea - (0.1) (2.6) (12.5) (22.0) (26.8) (47.1) (65.4) (33.7) (37.3)
Amphiura sp. - - - - - 1.8 - 10.0 - 2.4Ophiopholis aculeata - - <0.1 5.9 6.9 6.5 19.5 2.5 - 8.3Ophiura sarsi - - 1.0 3.5 8.8 8.5 14.5 27.0 33.4 14.7Ophiura sp. - - 0.5 0.4 0.1 1.3 4.2 16.1 - 4.4Ophiuroidea unid. - 0.1 1.1 2.7 6.2 8.7 8.9 9.8 0.3 7.5
Echinodermata unid. - (0.2) (1.8) (3.2) (2.5) (2.7) (3.6) (2.9) (0.5) (2.8)OSTEICHTHYES - [0.6] [68.3] [<0.1] [<0.1] [<0.1] [<0.1] [<0.1] - [3.0]
Ammodytes dubius - - 61.6 - - - - - - 2.6Osteichthyes unid. - 0.6 6.7 <0.1 <0.1 <0.1 <0.1 <0.1 - 0.4
ANIMAL REMAINS AND MISC. [27.3] [26.5] [7.3] [21.9] [17.9] [16.9] [20.8] [11.7] [4.4] [12.8]SAND AND ROCK [12.6] [1.5] [0.9] [6.1] [4.8] [5.7] [1.9] [0.8] [0.1] [3.1]
Number sampled 11 124 77 117 157 251 144 60 9 950Number empty 0 5 0 5 4 5 3 0 0 22Mean stomach content (g) 0.032 0.128 2.023 1.473 2.254 4.382 6.582 11.203 30.498 3.887Mean fish length (cm) 9 16 25 36 45 55 64 75 83 46

Page 68
Table B-22b. Diet composition and sampling data for haddock by geographic area. (Samples gathered during 1977-80. Dataexpressed as percentage of stomach content by weight. Squared brackets indicate major taxon subtotal; parenthesesindicate minor taxon subtotal.)
Geographic Area Inshore
Southern NorthMiddle New Georges Gulf of Scotian of Cape
Stomach Contents Atlantic England Bank Maine Shelf Hatteras
CNIDARIA - - [<0.1] [0.8] [0.7] [0.3]MOLLUSCA - [0.2] [1.5] [3.3] [15.3] [3.8]
Gastropoda - - (<0.1) (0.2) (2.7) (0.3)Bivalvia - (0.2) (1.3) (1.5) (10.0) (3.2)Cephalopoda - - - (1.3) (1.9) -Mollusca unid. - - (0.2) (0.3) (0.7) (0.3)
POLYCHAETA - [47.1] [18.6] [7.8] [29.4] [42.2]Nephtyidae - 0.4 0.1 0.2 0.2 7.5Spionidae - - 4.7 <0.1 0.9 0.7Polychaeta unid. - 46.7 13.8 7.6 28.3 34.0
CRUSTACEA [100.0] [14.2] [22.3] [16.6] [12.7] [20.6]Cumacea - (0.1) (<0.1) (<0.1) (0.3) (0.8)Amphipoda (100.0) (5.6) (19.0) (3.9) (3.5) (8.5)
Parathemisto sp. 27.8 - - 1.9 0.7 <0.1Ericthonius rubricornis - <0.1 <0.1 <0.1 <0.1 0.4Unciola irrorata - 1.4 11.9 0.1 1.7 3.8Leptocheirus pinguis - <0.1 1.6 0.9 <0.1 0.9Amphipoda unid. 72.2 4.2 5.5 1.0 1.1 3.4
Mysidacea - (<0.1) (0.4) (<0.1) (<0.1) (<0.1)Euphausacea - - - (10.8) (0.5) -
Meganyctiphanes norvegica - - - 10.8 0.5 -Decapoda - (8.1) (2.2) (1.7) (7.0) (8.9)
Dichelopandalus leptocerus - - 0.4 0.3 0.3 -Crangon septemspinosa - 0.8 0.7 <0.1 0.3 0.9Decapoda unid. - 7.3 1.1 1.4 6.4 8.0
Crustacea unid. - (0.4) (0.7) (0.2) (1.4) (2.4)ECHINODERMATA - [13.3] [31.0] [50.1] [17.7] [17.1]
Crinoidea - - - (1.4) - -Holothuroidea - - (<0.1) (1.3) (1.3) -Echinoidea - - (0.6) (1.3) (5.7) (0.5)Ophiuroidea - - (30.2) (42.6) (7.9) (10.4)
Amphiura sp. - - - 3.2 - -Ophiopholis aculeata - - 4.3 10.0 3.8 2.4Ophiura sarsi - - <0.1 19.6 1.2 8.0Ophiura sp. - - 25.9 0.3 <0.1 -Ophiuroidea unid. - - <0.1 9.5 2.9 <0.1
Echinodermata unid. - (13.3) (0.2) (3.5) (2.8) (6.2)OSTEICHTHYES - [<0.1] [<0.1] [3.9] [<0.1] -
Ammodytes dubius - - - 3.5 - -Osteichthyes unid. - <0.1 <0.1 0.4 <0.1 -
ANIMAL REMAINS AND MISC. - [17.9] [14.6] [16.5] [18.2] [14.3]SAND AND ROCK - [7.3] [12.0] [1.0] [6.0] [1.7]
Number sampled 1 12 139 578 157 63Number empty 0 2 2 15 3 0Mean stomach content (g) 0.018 1.681 4.222 4.699 1.728 1.559Mean fish length (cm) 10 54 44 51 34 30

Page 69
Table B-23a. Diet composition and sampling data for silver hake by fish length category. (Samples gathered during 1977-80. Data expressed aspercentage of stomach content by weight. Squared brackets indicate major taxon subtotal; parentheses indicate minor taxon subtotal.)
Length Category (cm) Stomach Contents <10 11-15 16-20 21-25 26-30 31-35 36-40 41-45 >45 Total
CEPHALOPODA - - - - [3.4] - [0.1] [2.1] [14.4] [7.7]Loligo sp. - - - - - - - 1.6 13.1 6.8Cephalopoda unid. - - - - 3.4 - 0.1 0.5 1.3 0.9
CRUSTACEA [95.2] [92.2] [96.5] [63.2] [66.3] [66.6] [57.8] [26.0] [4.8] [28.6]Cumacea (1.6) (0.8) (0.1) (<0.1) (<0.1) (<0.1) (<0.1) (<0.1) - (<0.1)Amphipoda (5.9) (9.0) (8.2) (0.6) (1.9) (2.2) (0.4) (0.4) (<0.1) (0.7)
Parathemisto gaudichaudii 2.4 5.3 5.1 <0.1 0.5 <0.1 <0.1 - - 0.1Parathemisto spp. 2.7 1.5 1.6 0.4 0.7 0.2 <0.1 <0.1 <0.1 0.1Gammarus annulatus - <0.1 - - - 1.0 0.4 0.4 <0.1 0.2Amphipoda unid. 0.8 2.2 1.5 0.2 0.7 1.0 <0.1 <0.1 <0.1 0.3
Mysidacea (9.9) (4.0) (2.0) (0.3) (0.9) (1.4) (<0.1) (<0.1) (<0.1) (0.2)Mysis mixta 5.3 0.8 1.2 <0.1 - <0.1 - - - <0.1Neomysis americana 3.7 2.7 0.7 <0.1 0.9 1.4 <0.1 <0.1 <0.1 0.2Mysidacea unid. 0.9 0.5 0.1 0.3 <0.1 <0.1 <0.1 - - <0.1
Euphausiacea (66.9) (60.2) (67.9) (39.0) (48.2) (51.8) (46.0) (20.8) (3.7) (21.9)Meganyctiphanes norvegica 45.2 45.0 61.9 37.5 44.5 51.7 44.3 20.8 3.7 21.2Nyctiphanes couchii 1.6 - - - - - 1.5 - - 0.2Thysanoessa inermis 2.4 - 0.7 - - - - - - <0.1Thysanoessa raschii 9.4 0.9 0.4 - - - - - - <0.1Euphausiacea unid. 8.3 14.3 4.9 1.5 3.7 0.1 0.2 - - 0.5
Decapoda (4.9) (9.0) (15.3) (20.3) (13.4) (10.0) (11.0) (4.5) (0.9) (5.2)Pasiphaea multidentata - - - - 1.2 1.3 3.8 - - 0.7Penaeidae - - - 1.7 - - - - - <0.1Dichelopandalus leptocerus - 2.2 13.5 11.0 4.1 2.5 3.8 1.4 <0.1 1.7Pandalus borealis - - 0.1 1.2 1.1 2.9 <0.1 0.3 0.2 0.5Pandalus montagui - - - 2.8 0.7 <0.1 0.6 0.8 - 0.3Pandalidae <0.1 1.2 1.3 0.9 0.8 0.3 <0.1 1.2 - 0.3Crangon septemspinosa 4.6 4.1 0.3 1.9 2.8 2.0 2.6 0.8 0.8 1.4Decapoda unid. 0.3 1.5 0.1 0.8 2.7 1.0 0.2 <0.1 - 0.3
Crustacea unid. (6.0) (9.2) (3.0) (3.0) (1.9) (1.2) (0.4) (0.3) (0.2) (0.6)OSTEICHTHYES [2.5] [6.1] [2.6] [35.8] [29.6] [32.4] [41.6] [70.9] [80.6] [63.0]
Clupea harengus - - - - - 11.1 - 12.6 3.2 4.7Etrumeus teres - - - 6.4 - - - - - 0.2Clupeidae - - - - 4.0 - - 7.9 20.1 11.5Anchoa hepsetus - - - - - - - - 0.3 0.1Merluccius bilinearis - - 0.3 0.9 5.8 2.1 3.1 9.4 10.2 7.5Urophycis sp. - - - - - - 0.5 - <0.1 0.1Ammodytes dubius - 0.7 - 24.5 18.6 4.3 11.8 22.7 7.0 10.5Scomber scombrus - - - - - - 5.0 - - 0.7Bothidae - - - - - - 3.4 - - 0.5Osteichthyes eggs - - - - <0.1 - - - - <0.1Osteichthyes unid. 2.5 5.4 2.3 4.0 1.2 14.9 17.8 18.3 39.8 27.2
ANIMAL REMAINS AND MISC. [2.3] [1.7] [0.9] [1.0] [0.7] [1.0] [0.5] [1.0] [0.2] [0.7]
Number sampled 196 425 280 266 323 373 253 72 75 2263Number empty 29 87 68 95 107 133 83 20 20 642Mean stomach content (g) 0.045 0.109 0.251 0.495 0.819 1.574 3.048 11.004 36.325 2.385Mean fish length (cm) 6 13 17 23 28 33 37 42 52 24

Page 70
Table B-23b. Diet composition and sampling data for silver hake by geographic area. (Samples gathered during 1977-80. Dataexpressed as percentage of stomach content by weight. Squared brackets indicate major taxon subtotal; parenthesesindicate minor taxon subtotal.)
Geographic Area Inshore
Southern NorthMiddle New Georges Gulf of Scotian of Cape
Stomach Contents Atlantic England Bank Maine Shelf Hatteras
CEPHALOPODA [17.0] [3.2] - - [3.5] [32.7]Loligo sp. - 2.4 - - 3.3 29.7Cephalopoda unid. 17.0 0.8 - - 0.2 3.0
CRUSTACEA [8.2] [6.8] [37.3] [48.7] [10.3] [15.2]Cumacea (<0.1) (<0.1) (<0.1) (<0.1) (<0.1) (<0.1)Amphipoda (0.9) (1.3) (0.8) (0.5) (0.1) (1.1)
Parathemisto gaudichaudii <0.1 <0.1 - 0.3 <0.1 -Parathemisto spp. <0.1 - - <0.1 <0.1 -Gammarus annulatus - 0.7 - - - 0.8Amphipoda unid. 0.9 0.6 0.8 0.2 0.1 0.3
Mysidacea (<0.1) (0.5) (<0.1) (<0.1) (<0.1) (0.9)Mysis mixta - - - <0.1 - <0.1Neomysis americana <0.1 0.5 - <0.1 <0.1 0.9Mysidacea unid. - <0.1 <0.1 <0.1 <0.1 <0.1
Euphausiacea (4.4) (0.1) (30.3) (40.7) (8.1) (6.7)Meganyctiphanes norvegica 0.8 0.1 30.1 39.5 7.7 6.7Nyctiphanes couchii - - - 0.5 - -Thysanoessa inermis - - <0.1 <0.1 - -Euphausiacea unid. 3.6 <0.1 0.2 0.7 0.4 <0.1
Decapoda (2.8) (4.5) (5.6) (6.8) (1.9) (5.5)Pasiphaea multidentata 0.3 - - 1.8 - -Penaeidae - - - - 0.2 -Dichelopandalus leptocerus - 2.0 3.8 2.2 1.1 0.5Pandalus borealis - - <0.1 1.2 <0.1 -Pandalus montagui - <0.1 - 0.6 0.2 -Pandalidae - <0.1 <0.1 0.6 0.2 <0.1Crangon septemspinosa 2.5 2.2 0.9 <0.1 <0.1 5.0Decapoda unid. <0.1 0.3 0.9 0.4 0.2 <0.1
Crustacea unid. (0.1) (0.4) (0.6) (0.7) (0.2) (1.0)OSTEICHTHYES [74.1] [88.9] [62.2] [50.2] [85.7] [51.6]
Clupea harengus - - - - 21.9 -Etrumeus teres - - - - - 0.8Clupeidae - - 62.2 17.9 - -Anchoa hepsetus - - - - - 0.7Merluccius bilinearis 6.6 15.5 - 8.2 7.3 5.0Urophycis sp. - 0.1 - - - 0.3Ammodytes dubius 56.3 3.3 - 9.4 - 28.7Scomber scombrus - - - - 3.4 -Bothidae - - - - - 2.4Osteichthyes eggs - <0.1 - - - -Osteichthyes unid. 11.2 70.0 <0.1 14.7 53.1 13.7
ANIMAL REMAINS AND MISC. [0.7] [1.1] [0.5] [1.1] [0.5] [0.5]
Number sampled 76 176 196 1209 413 193Number empty 32 74 57 293 129 57Mean stomach content (g) 0.784 3.036 1.841 1.833 2.782 5.575Mean fish length (cm) 24 28 29 23 23 27

Page 71
Table B-24a. Diet composition and sampling data for pollock by fish length category. (Samples gathered during 1977-80. Data expressedas percentage of stomach content by weight. Squared brackets indicate major taxon subtotal; parentheses indicate minor taxonsubtotal.)
Length Category (cm) Stomach Contents <31 31-40 41-50 51-60 61-70 71-80 81-90 >90 Total
NEMATODA [0.3] - [2.8] [12.4] [0.1] [0.1] [0.1] [0.3] [0.3]CHAETOGNATHA [42.8] - - - [<0.1] - - - [<0.1]
Sagitta elegans 21.2 - - - - - - - <0.1Chaetognatha unid. 21.6 - - - <0.1 - - - <0.1
CEPHALOPODA - [5.1] - - [44.5] [21.8] [1.2] [22.9] [23.5]Illex sp. - - - - - 20.7 - - 0.9Loligo sp. - - - - 43.8 - - 14.3 16.7Octopoda - - - - - 1.1 - - 0.1Cephalopoda unid. - 5.1 - - 0.7 - 1.2 8.6 5.8
CRUSTACEA [53.4] [84.8] [63.3] [20.9] [32.3] [17.9] [58.1] [8.3] [20.9]Isopoda - - - - (<0.1) (0.6) - (<0.1) (<0.1)
Cirolana sp. - - - - <0.1 0.6 - <0.1 <0.1Amphipoda (11.6) (0.1) (6.0) (1.5) (<0.1) (0.2) (0.5) (0.4) (0.3)
Hyperia sp. - - - - - - 0.3 - <0.1Parathemisto sp. - - - - <0.1 <0.1 0.1 0.4 0.3Hyperiidae - - 3.6 - <0.1 - 0.1 - <0.1Calliopius laeviusculus - - - - <0.1 0.2 - - <0.1Ericthonius rubricornis 9.9 - - - - - - - <0.1Lysianassidae - - - 1.5 - - - - <0.1Monoculodes intermedius - - 1.4 - - - - - <0.1Leptocheirus pinguis - 0.1 0.9 - - - - - <0.1Photis sp. 0.2 - - - - - - - <0.1Caprellidae 0.5 - - - - - - - <0.1Amphipoda unid. 1.0 - 0.1 - <0.1 <0.1 - <0.1 <0.1
Euphausacea (21.2) (83.4) (51.3) (10.4) (32.3) (3.8) (44.8) (7.6) (17.8)Meganyctiphanes norvegica 17.5 83.4 51.3 10.4 32.3 3.8 44.8 7.6 17.8Euphausiacea unid. 3.7 - - - - - <0.1 - <0.1
Decapoda - - (6.0) (9.0) (<0.1) (12.1) (12.5) (0.3) (2.6)Pasiphaeidae - - - - - 4.7 - - 0.2Dichelopandalus leptocerus - - - - - 6.7 0.7 0.3 0.6Pandalus borealis - - - - - - 11.4 - 1.6Crangon septemspinosa - - - 9.0 <0.1 0.7 - - 0.1Decapoda unid. - - 6.0 - <0.1 - 0.4 - 0.1
Crustacea unid. (20.6) (1.3) - - - (1.2) (0.3) (<0.1) (0.2)UROCHORDATA - - - - [0.6] [8.5] - - [0.5]OSTEICHTHYES - - - - [22.0] [46.9] [38.3] [68.2] [54.1]
Myctophidae - - - - - 11.0 - - 0.5Merluccius bilinearis - - - - 0.2 2.0 - - 0.1Ammodytes dubius - - - - 18.4 27.5 - 66.0 46.1Anarhichadidae - - - - - - 9.0 - 1.2Pholis gunnellus - - - - 0.7 - <0.1 - 0.1Osteichthyes unid. - - - - 2.7 6.4 29.3 2.2 6.1
ANIMAL REMAINS AND MISC. [3.5] [10.1] [33.9] [66.7] [0.5] [4.8] [2.3] [0.3] [0.7]
Number sampled 5 11 7 10 11 14 13 11 82Number empty 0 2 0 3 3 1 0 1 10Mean stomach content (g) 0.551 1.497 0.497 0.115 23.071 4.281 15.212 83.988 17.795Mean fish length (cm) 23 34 48 56 65 74 85 98 65

Page 72
Table B-24b. Diet composition and sampling data for pollock by geographic area. (Samples gathered during 1977-80. Dataexpressed as percentage of stomach content by weight. Squared brackets indicate major taxon subtotal;parentheses indicate minor taxon subtotal.)
Geographic Area Inshore North
Georges Gulf of Scotian of CapeStomach Contents Bank Maine Shelf Hatteras
NEMATODA [0.5] [0.5] [<0.1] -CHAETOGNATHA - [<0.1] [0.8] -
Sagitta elegans - - 0.4 -Chaetognatha unid. - <0.1 0.4 -
CEPHALOPODA [5.9] [46.8] [80.9] -Illex sp. 4.6 - - -Loligo sp. - 28.9 80.9 -Octopoda 0.3 - - -Cephalopoda unid. 1.0 17.9 - -
CRUSTACEA [35.8] [44.5] [2.6] -Isopoda (0.2) - - -
Cirolana sp. 0.2 - - -Amphipoda (1.7) (0.1) (0.2) -
Hyperia sp. 0.2 - - -Parathemisto sp. 1.5 <0.1 - -Hyperiidae - 0.1 - -Ericthonius rubricornis - - 0.2 -Lysianassidae <0.1 - - -Monoculodes intermedius <0.1 - - -Leptocheirus pinguis <0.1 - - -Photis sp. - - <0.1 -Calliopius laeviusculus <0.1 - - -Amphipoda unid. <0.1 - <0.1 -
Euphausacea (30.2) (38.9) (0.3) -Meganyctiphanes norvegica 30.2 38.9 0.3 -Euphausiacea unid. - <0.1 <0.1 -
Decapoda (3.4) (5.2) (2.1) -Pasiphaeidae - - 2.1 -Dichelopandalus leptocerus 3.1 - - -Pandalus borealis - 5.0 - -Crangon septemspinosa 0.3 - - -Decapoda unid. <0.1 0.2 - -
Crustacea unid. (0.3) (0.3) (<0.1) -UROCHORDATA - [1.5] - -OSTEICHTHYES [56.1] [4.9] [15.4] [100.0]
Myctophidae - - 4.8 -Merluccius bilinearis - 0.4 - -Ammodytes dubius 28.5 - - 100.0Anarhichadidae <0.1 3.9 - -Pholis gunnellus - 0.4 - -Osteichthyes unid. 27.6 0.2 10.6 -
ANIMAL REMAINS AND MISC. [1.7] [1.8] [0.3] -
Number sampled 46 28 7 1Number empty 6 4 0 0Mean stomach content (g) 5.838 16.310 19.654 596.400Mean fish length (cm) 62 72 48 106

Page 73
Table B-25a. Diet composition and sampling data for red hake by fish length category. (Samples gathered during 1977-80. Data expressed aspercentage of stomach content by weight. Squared brackets indicate major taxon subtotal; parentheses indicate minor taxon subtotal.)
Length Category (cm) Stomach Contents 1-10 11-15 16-20 21-25 26-30 31-35 36-40 41-45 >45 Total
MOLLUSCA - - [1.6] [<0.1] [0.9] [5.9] [16.5] [4.6] [8.4] [8.7]Bivalvia - - 1.6 <0.1 0.8 0.3 5.3 0.3 2.6 2.1Cephalopoda - - - - <0.1 5.6 10.8 1.3 5.8 5.7Mollusca unid. - - - - 0.1 <0.1 0.4 3.0 <0.1 0.9
POLYCHAETA [0.3] [5.3] [0.7] [1.5] [3.6] [2.3] [2.3] [1.4] [3.0] [2.6]CRUSTACEA [88.1] [81.6] [58.6] [74.6] [84.8] [69.7] [64.4] [66.1] [44.4] [63.3]
Amphipoda (55.6) (44.6) (35.4) (10.1) (15.3) (3.8) (2.4) (0.8) (0.4) (3.9)Parathemisto sp. 4.0 - 3.1 1.6 0.9 <0.1 <0.1 0.1 - 0.3Aeginina longicornis - 2.4 - 0.5 0.9 0.2 <0.1 <0.1 <0.1 0.2Unciola inermis 1.6 0.5 - 0.6 0.8 0.1 0.3 <0.1 <0.1 0.2Unciola irrorata 0.8 1.2 2.5 1.9 1.2 0.4 0.3 <0.1 <0.1 0.3Leptocheirus pinguis 3.8 11.5 0.3 2.1 10.4 2.0 1.3 0.4 0.1 1.6Pontogeneia inermis 35.0 21.9 25.4 0.7 <0.1 <0.1 <0.1 - - 0.4Amphipoda unid. 10.4 7.1 4.1 2.7 1.1 1.1 0.5 0.3 0.3 0.9
Mysidacea (2.5) (3.4) (0.1) (0.6) (0.7) (<0.1) (0.1) (0.1) (<0.1) (0.2)Neomysis americana 1.0 3.1 - <0.1 <0.1 <0.1 <0.1 <0.1 <0.1 <0.1Mysidacea unid. 1.5 0.3 0.1 0.6 0.7 <0.1 0.1 0.1 <0.1 0.2
Euphausiacea (4.3) (1.1) (9.3) (15.4) (34.6) (32.2) (34.2) (40.0) (18.8) (30.4)Meganyctiphanes norvegia 2.8 0.4 9.3 13.7 32.9 31.2 33.4 36.5 18.4 29.0Euphausiacea unid. 1.5 0.7 - 1.7 1.7 1.0 0.8 3.5 0.4 1.4
Decapoda (15.8) (29.1) (8.8) (45.5) (29.7) (29.8) (24.9) (23.6) (22.8) (25.9)Dichelopandalus leptocerus - - 2.2 15.5 13.9 12.6 6.5 9.7 3.1 8.2Pandalus borealis - - 0.2 1.6 - - 0.6 0.4 7.1 2.0Pandalidae - - 1.1 0.7 2.0 2.5 1.3 2.9 0.8 1.8Crangon septemspinosa 2.1 8.8 3.3 23.4 3.4 2.5 1.6 2.6 1.4 2.7Crangonidae 1.7 <0.1 - 0.5 1.9 0.6 0.2 <0.1 0.1 0.3Axiidae - - - - 3.9 <0.1 0.9 1.0 0.4 0.9Paguridae <0.1 19.4 0.2 <0.1 0.5 4.2 1.8 1.5 2.2 2.1Cancer irroratus - - - 1.7 1.5 4.9 6.0 5.0 4.9 4.8Cancridae 0.3 - - 1.3 <0.1 0.1 2.6 0.1 1.6 1.1Decapoda unid. 11.7 0.9 1.8 0.8 2.6 2.4 3.4 0.4 1.2 2.0
Crustacea unid. (9.9) (3.4) (5.0) (3.0) (4.5) (3.9) (2.8) (1.6) (2.4) (2.9)CHONDRICHTHYES - - - - - - - - [1.1] [0.3]OSTEICHTHYES [<0.1] [9.7] [37.6] [21.5] [7.2] [17.2] [11.1] [24.3] [34.9] [21.4]
Melanogrammus aeglefinus - - - - - - - 0.3 4.3 1.1Merluccius bilinearis - - 30.7 19.7 1.0 4.7 - - 16.7 5.9Gadidae - - - - - 1.4 4.7 2.9 - 2.0Ammodytes dubius - - 1.8 - 6.0 6.2 2.0 1.2 2.4 2.9Scomber scombrus - - - - - - 0.6 - 0.6 0.3Triglidae - 8.3 - - - - - - - <0.1Osteichthyes larvae - - 2.6 - - <0.1 - - - <0.1Osteichthyes unid. <0.1 1.4 2.5 1.8 0.2 4.9 3.8 19.9 10.9 9.2
ANIMAL REMAINS AND MISC. [11.6] [3.4] [1.5] [2.4] [3.5] [4.9] [5.7] [3.6] [8.2] [3.7]
Number sampled 103 48 55 88 216 346 344 173 109 1482Number empty 11 13 16 15 39 92 79 50 18 333Mean stomach content (g) 0.035 0.214 0.555 0.954 0.865 1.596 2.060 3.881 5.505 1.921Mean fish length (cm) 6 12 18 23 28 33 37 42 49 32

Page 74
Table B-25b. Diet composition and sampling data for red hake by geographic area. (Samples gathered during 1977-80. Dataexpressed as percentage of stomach content by weight. Squared brackets indicate major taxon subtotal; parenthesesindicate minor taxon subtotal.)
Geographic Area Inshore
Southern NorthMiddle New Georges Gulf of Scotian of Cape
Stomach Contents Atlantic England Bank Maine Shelf Hatteras
MOLLUSCA [3.4] [30.1] [11.2] [3.8] [23.6] [0.5]Bivalvia 3.4 <0.1 2.6 2.4 <0.1 <0.1Cephalopoda - 30.1 6.2 1.4 23.6 0.5Mollusca unid. - <0.1 2.4 <0.1 - <0.1
POLYCHAETA [0.6] [1.8] [0.6] [2.4] [1.2] [9.4]CRUSTACEA [42.6] [32.4] [71.9] [66.0] [42.0] [33.3]
Amphipoda (0.4) (3.8) (6.8) (1.5) (2.3) (1.1)Parathemisto sp. - - <0.1 0.6 - -Aeginina longicornis - 1.5 <0.1 <0.1 0.3 0.2Unciola inermis - - 0.5 <0.1 <0.1 -Unciola irrorata <0.1 0.2 0.9 <0.1 0.2 <0.1Leptocheirus pinguis - 0.4 4.4 0.1 1.4 0.2Pontogeneia inermis - - 0.3 0.6 - -Amphipoda unid. 0.4 1.7 0.7 0.2 0.4 0.7
Mysidacea (<0.1) (<0.1) (<0.1) (0.3) (<0.1) (0.5)Neomysis americana <0.1 <0.1 <0.1 <0.1 - 0.2Mysidacea unid. - <0.1 <0.1 0.3 <0.1 0.3
Euphausiacea - - (27.7) (42.8) (7.6) (<0.1)Meganyctiphanes norvegia - - 27.6 40.0 7.6 -Euphausiacea unid. - - 0.1 2.8 <0.1 <0.1
Decapoda (41.0) (25.5) (33.3) (19.3) (30.3) (29.0)Dichelopandalus leptocerus 1.6 3.8 9.4 7.8 8.0 11.8Pandalus borealis - - - 4.0 1.4 -Pandalidae - <0.1 0.6 2.6 4.4 0.2Crangon septemspinosa 4.3 0.9 3.9 0.8 4.4 11.7Crangonidae - <0.1 0.3 0.4 - 0.2Axiidae - 3.1 1.1 0.5 1.9 0.1Paguridae - <0.1 5.7 0.5 2.4 <0.1Cancer irroratus 33.5 2.3 10.1 0.7 5.6 3.7Cancridae - 15.3 0.8 0.2 - -Decapoda unid. 1.6 0.1 1.4 1.8 2.2 1.3
Crustacea unid. (1.2) (3.1) (4.1) (2.1) (1.8) (2.7)CHONDRICHTHYES - - [0.8] - - -OSTEICHTHYES [51.9] [31.5] [8.9] [22.6] [30.9] [51.3]
Melanogrammus aeglefinus - - - 2.1 0.9 -Merluccius bilinearis - - - 10.1 1.0 16.0Gadidae - 21.9 2.9 - - -Ammodytes dubius 33.5 - 3.6 1.4 7.0 -Scomber scombrus - - - - - 5.1Triglidae - - - <0.1 - -Osteichthyes larvae - - - <0.1 0.2 -Osteichthyes unid. 18.4 9.6 2.4 9.0 21.8 30.2
ANIMAL REMAINS AND MISC. [1.5] [4.2] [6.6] [5.2] [2.3] [5.5]
Number sampled 5 97 521 681 87 94Number empty 2 23 69 192 25 23Mean stomach content (g) 10.429 1.553 1.818 2.164 2.226 1.735Mean fish length (cm) 34 31 29 34 32 32

Page 75
Table B-26. Diet composition and sampling data for spotted hake by fish length category. (Samples gathered during 1977-80. Dataexpressed as percentage of stomach content by weight. Squared brackets indicate major taxon subtotal; parentheses indicateminor taxon subtotal.)
Length Category (cm) Stomach Contents 6-10 11-15 16-20 21-25 >25 Total
MOLLUSCA - [14.7] [15.6] [2.6] [43.2] [30.9]Bivalvia - (14.7) (15.5) - - (5.7)
Ensis directus - - 0.2 - - 0.1Solenidae - - 1.1 - - 0.4Bivalvia unid. - 14.7 14.2 - - 5.2
Cephalopoda - - - - (43.2) (25.0)Mollusca unid. - - (0.1) (2.6) - (0.2)
POLYCHAETA - [3.2] [2.1] - - [0.9]Maldanidae - - 0.6 - - 0.2Pherusa affinis - - 1.5 - - 0.5Polychaeta unid. - 3.2 <0.1 - - 0.2
CRUSTACEA [100.0] [65.2] [63.7] [83.4] [0.2] [28.3]Cumacea - (<0.1) (<0.1) - - (<0.1)
Pseudoleptocuma minor - <0.1 <0.1 - - <0.1Isopoda - (<0.1) - - - (<0.1)
Edotea sp. - <0.1 - - - <0.1Amphipoda - (1.2) (45.5) (24.4) - (16.0)
Parathemisto sp. - - - <0.1 - <0.1Ampelisca verrilli - - 40.5 23.0 - 14.2Ampelisca declivitatis - - <0.1 - - <0.1Byblis serrata - - - <0.1 - <0.1Unciola irrorata - 0.1 5.0 - - 1.6Synchelidium americanum - - <0.1 - - <0.1Rhepoxynius epistomus - 1.1 - - - 0.1Aeginina longicornis - - <0.1 - - <0.1Gammaridea - - - 1.4 - 0.1
Mysidacea - - (<0.1) - - (<0.1)Mysidopsis bigelowi - - <0.1 - - <0.1
Decapoda (100.0) (64.0) (17.6) (57.5) - (11.9)Crangon septemspinosa 16.1 1.3 0.8 0.9 - 0.4Cancer irroratus - 0.3 14.2 56.0 - 7.9Cancer sp. 83.9 11.2 - - - 0.5Cancridae - 0.5 - - - <0.1Crab unid. - - - 0.6 - <0.1Decapoda larvae - - - <0.1 - <0.1Decapoda unid. - 50.7 2.6 - - 3.1
Crustacea unid. - - (0.6) (1.5) (0.2) (0.4)OSTEICHTHYES - - [18.1] [14.0] [56.6] [39.1]
Ophidiidae - - - - 56.6 32.6Ammodytes dubius - - 13.9 - - 4.4Pleuronectiformes - - 0.4 - - 0.1Osteichthyes unid. - - 3.8 14.0 - 2.0
ANIMAL REMAINS AND MISC. - [16.9] [0.5] - - [0.8]
Number sampled 1 22 16 5 3 47Number empty 0 4 1 1 0 6Mean stomach content (g) 0.031 0.190 1.805 1.111 17.573 1.944Mean fish length (cm) 9 13 18 22 32 17

Page 76
Table B-27a. Diet composition and sampling data for white hake by fish length category. (Samples gathered during 1977-80. Data expressedas percentage of stomach content by weight. Squared brackets indicate major taxon subtotal; parentheses indicate minor taxonsubtotal.)
Length Category (cm) Stomach Contents <11 11-20 21-30 31-40 41-50 51-60 61-70 71-80 >80 Total
CEPHALOPODA - - - [0.8] [15.4] [2.0] [25.0] [63.7] [1.3] [21.4]Illex sp. - - - - - - 20.5 63.1 - 16.5Loligo pealeii - - - - 6.3 - - - - 1.0Cephalopoda unid. - - - 0.8 9.1 2.0 4.5 0.6 1.3 3.9
POLYCHAETA - [5.2] [1.1] [1.1] [<0.1] - - - - [0.1]CRUSTACEA [100.0] [81.9] [93.7] [64.8] [27.8] [45.8] [2.8] [25.8] [5.5] [20.6]
Calanoida (16.4) (0.8) - - - - - - - (<0.1)Isopoda - (1.7) (0.2) (<0.1) - - - - - (<0.1)Amphipoda (0.3) (28.1) (4.5) (0.2) (<0.1) (<0.1) (<0.1) - - (0.1)
Unciola irrorata - 0.6 1.3 0.1 - - - - - <0.1Anonyx sarsi - 5.5 - - - - - - - <0.1Hippomedon serratus - 2.0 - <0.1 - - - - - <0.1Leptocheirus pinguis - - 2.4 0.1 - <0.1 - - - 0.1Amphipoda unid. 0.3 20.0 0.8 <0.1 <0.1 - <0.1 - - <0.1
Mysidacea (1.0) (<0.1) - (1.9) (<0.1) - - (2.5) - (0.4)Mysidopsis bigelowi 1.0 <0.1 - - - - - - - <0.1Mysidacea unid. - - - 1.9 <0.1 - - 2.5 - 0.4
Euphausiacea - - (13.8) (36.9) (19.9) (26.4) (1.4) (17.8) (5.5) (12.2)Meganyctiphanes norvegica - - 7.6 35.7 18.0 23.8 1.4 17.8 3.8 11.3Euphausiacea unid. - - 6.2 1.2 1.9 2.6 <0.1 - 1.7 0.9
Decapoda (82.3) (40.9) (73.4) (22.4) (7.5) (16.2) (1.3) (4.9) - (7.1)Pasiphaeidae - - - - 0.4 - - 4.4 - 0.5Dichelopandalus leptocerus - - 53.0 10.8 4.9 9.9 0.6 - - 3.9Pandalus borealis - - 8.0 - - 4.1 0.3 - - 0.7Pandalus montagui - - - 1.2 - - - - - 0.1Pandalus sp. - - - 0.8 0.1 0.9 <0.1 - - 0.2Pandalidae - - 0.7 - 0.6 1.1 - - - 0.2Crangon septemspinosa 82.3 36.2 8.9 4.1 0.9 0.2 - - - 0.7Axius serratus - - - 1.7 - - - - - 0.1Paguridae - - 2.7 <0.1 0.3 - - <0.1 - <0.1Cancer irroratus - - - 3.8 - - 0.4 - - 0.5Cancridae - 1.9 - - - - - - - <0.1Decapoda unid. - 2.8 0.1 <0.1 0.3 <0.1 - 0.5 - 0.2
Crustacea unid. - (10.4) (1.8) (3.4) (0.4) (3.2) (0.1) (0.6) (<0.1) (0.8)OSTEICHTHYES - [4.8] [1.9] [30.8] [55.8] [50.9] [72.1] [9.1] [92.6] [57.1]
Merluccius bilinearis - - - 1.3 14.7 - - - 76.8 7.4Urophycis chuss - - - - - - 19.5 - - 9.0Urophycis tenuis - - - - 17.0 - - - - 2.6Gadidae - - - 11.9 - 8.9 9.2 - - 6.2Ammodytes dubius - - - - 0.5 3.0 - - - 0.4Pleuronectiformes - - - 1.9 - - 2.4 - - 1.3Osteichthyes unid. - 4.8 1.9 15.7 23.6 39.0 41.0 9.1 15.8 30.2
ANIMAL REMAINS AND MISC. - [8.1] [3.3] [2.5] [1.0] [1.3] [0.1] [1.4] [0.6] [0.8]
Number sampled 9 14 42 79 69 28 21 12 9 283Number empty 0 0 12 21 17 2 1 1 1 55Mean stomach content (g) 0.035 0.208 1.416 3.670 7.844 13.439 77.570 32.290 25.716 12.431Mean fish length (cm) 7 15 27 36 44 54 64 75 87 39

Page 77
Table B-27b. Diet composition and sampling data for white hake by geographic area. (Samples gathered during 1977-80. Dataexpressed as percentage of stomach content by weight. Squared brackets indicate major taxon subtotal; parenthesesindicate minor taxon subtotal.)
Geographic Area Inshore
Southern North New Georges Gulf of Scotian of Cape
Stomach Contents England Bank Maine Shelf Hatteras
CEPHALOPODA - - [29.5] [40.1] -Illex sp. - - 21.8 40.1 -Loligo pealeii - - 1.5 - -Cephalopoda unid. - - 6.2 - -
POLYCHAETA - [0.2] [<0.1] - [0.3]CRUSTACEA [1.9] [42.8] [26.5] [7.7] [5.2]
Calanoida - (<0.1) - - -Isopoda - (<0.1) - - (<0.1)Amphipoda (0.3) (1.1) (<0.1) - (0.1)
Unciola irrorata - 0.2 - - 0.1Leptocheirus pinguis <0.1 0.8 - - <0.1Amphipoda unid. 0.3 0.1 <0.1 - <0.1
Mysidacea - (<0.1) (0.7) - (<0.1)Mysidopsis bigelowi - <0.1 - - -Mysidacea unid. - - 0.7 - <0.1
Euphausiacea - (0.5) (19.2) - (<0.1)Meganyctiphanes norvegica - 0.5 17.8 - <0.1Euphausiacea unid. - <0.1 1.4 - -
Decapoda (1.6) (39.3) (5.4) (7.7) (5.1)Pasiphaeidae - - <0.1 7.1 -Dichelopandalus leptocerus 1.1 26.7 3.0 - 3.2Pandalus borealis - - 1.1 - -Pandalus montagui - - <0.1 - 0.4Pandalus sp. - - 0.3 - -Pandalidae - - 0.3 - <0.1Crangon septemspinosa 0.5 9.6 <0.1 - 0.6Axius serratus - - 0.2 - -Paguridae - 0.1 0.2 - -Cancer irroratus - 2.9 0.3 - 0.9Cancridae - <0.1 - - -Decapoda unid. <0.1 <0.1 <0.1 0.6 <0.1
Crustacea unid. (<0.1) (1.9) (1.2) - (<0.1)OSTEICHTHYES [97.8] [55.2] [42.9] [51.0] [93.5]
Merluccius bilinearis - - 6.3 51.0 -Urophycis chuss - - 14.4 - -Urophycis tenuis - 51.9 - - -Gadidae 13.9 - 1.6 - 23.1Ammodytes dubius - - 0.6 - -Pleuronectidae - - - - 0.9Pleuronectiformes - - 1.8 - -Osteichthyes unid. 83.9 3.3 18.2 - 69.5
ANIMAL REMAINS AND MISC. [0.3] [1.8] [1.1] [1.2] [1.0]
Number sampled 18 43 191 4 27Number empty 6 2 45 1 1Mean stomach content (g) 13.406 4.125 11.591 59.595 23.970Mean fish length (cm) 44 24 46 63 39

Page 78
Table B-28a. Diet composition and sampling data for fawn cusk-eel by fish length category. (Samples gathered during 1977-80. Dataexpressed as percentage of stomach content by weight. Squared brackets indicate major taxon subtotal; parentheses indicateminor taxon subtotal.)
Length Category (cm) Stomach Contents 11-15 16-20 21-25 26-30 Total
POLYCHAETA [18.8] [30.8] [24.1] [24.0] [25.7]Ninoe nigripes - 8.8 - - 2.1Nothria conchylega - 11.6 - 1.7 3.3Aglaophamus sp. - 1.2 <0.1 14.0 4.3Nephtys incisa - - - 6.4 1.8Nephtyidae - 0.5 6.6 <0.1 3.3Syllides sp. 18.8 - 0.2 - 0.1Polychaeta unid. - 8.7 17.3 1.9 10.8
CRUSTACEA [6.3] [48.5] [54.4] [47.3] [51.2]Stomatopoda - (4.8) - - (1.1)Isopoda - - (3.1) (2.2) (2.1)
Cirolana sp. - - 3.1 2.2 2.1Amphipoda (6.3) (26.2) (19.7) (24.6) (22.9)
Ampelisca agassizi - 0.3 3.3 4.4 2.9Ampeliscidae - 1.6 <0.1 3.3 1.4Unciola irrorata - 19.8 11.5 7.6 12.4Unciola sp. 6.3 - 0.3 - 0.2Casco bigelowi - - 0.2 3.3 1.0Leptocheirus pinguis - 0.7 3.9 3.8 3.1Amphipoda unid. - 3.8 0.5 2.2 1.9
Decapoda - (17.0) (30.5) (19.1) (23.9)Dichelopandalus leptocerus - - 2.2 - 1.0Crangon septemspinosa - 6.6 10.9 14.5 10.9Pontophilus brevirostris - - 2.6 - 1.2Pontophilus norvegicus - - 5.7 - 2.7Crangonidae - - 1.5 - 0.7Munida iris - 4.3 - 0.7 1.2Munida sp. - 2.9 1.7 - 1.5Caridion gordoni - - 3.1 - 1.5Pagurus sp. - - - 2.5 0.7Cancridae - 1.4 2.1 0.5 1.5Decapoda unid. - 1.8 0.7 0.9 1.0
Crustacea unid. - (0.5) (1.1) (1.4) (1.2)ECHINODERMATA [74.9] [18.3] [7.3] [3.8] [9.2]
Echinoidea - - (0.3) (3.8) (1.2)Ophiuroidea (74.9) (18.3) (7.0) - (8.0)
Axiognathus squamatus - 8.1 - - 2.0Ophiuroidea unid. 74.9 10.2 7.0 - 6.0
OSTEICHTHYES - [0.6] [7.1] [22.3] [9.8]Brosme brosme - - 4.3 - 2.0Pleuronectiformes - - 2.8 14.7 5.5Osteichthyes unid. - 0.6 - 7.6 2.3
ANIMAL REMAINS AND MISC. - [1.8] [7.1] [2.6] [4.1]
Number sampled 4 65 69 27 165Number empty 2 22 22 10 56Mean stomach content (g) 0.004 0.018 0.034 0.052 0.030Mean fish length (cm) 14 18 23 27 21

Page 79
Table B-28b. Diet composition and sampling data for fawn cusk-eel by geographic area. (Samples gathered during 1977-80.Data expressed as percentage of stomach content by weight. Squared brackets indicate major taxon subtotal;parentheses indicate minor taxon subtotal.)
Geographic Area Inshore
Southern North Middle New Georges of Cape
Stomach Contents Atlantic England Bank Hatteras
POLYCHAETA [46.4] [13.6] [26.3] [22.1]Ninoe nigripes 7.6 - - -Nothria conchylega 10.0 - 2.4 -Aglaophamus sp. 1.0 8.1 - -Nephtys incisa - - 9.1 -Nephtyidae 10.6 0.5 - -Polychaeta unid. 17.2 5.0 14.8 22.1
CRUSTACEA [48.5] [44.6] [65.0] [77.9]Stomatopoda - - - (38.3)Isopoda - - (10.4) -
Cirolana sp. - - 10.4 -Amphipoda (29.0) (13.3) (35.4) (28.2)
Ampelisca agassizi 0.2 <0.1 14.1 -Ampeliscidae - 0.3 4.0 12.8Unciola irrorata 27.0 2.9 15.2 13.4Unciola sp. 0.1 0.2 - -Casco bigelowi - 2.1 - -Leptocheirus pinguis 0.6 5.6 0.9 -Amphipoda unid. 1.1 2.2 1.2 2.0
Decapoda (19.0) (30.1) (17.4) (11.4)Dichelopandalus leptocerus - - 5.3 -Crangon septemspinosa 17.9 8.9 7.5 -Pontophilus brevirostris - 2.5 - -Pontophilus norvegicus - 5.5 - -Crangonidae - 1.4 - -Munida iris - 2.1 1.0 -Munida sp. 0.9 2.5 - -Caridion gordoni - 3.0 - -Pagurus sp. - - 3.6 -Cancridae - 2.3 - 11.4Decapoda unid. 0.2 1.9 - -
Crustacea unid. (0.5) (1.2) (1.8) -ECHINODERMATA [2.7] [17.0] - -
Echinoidea - (2.4) - -Ophiuroidea (2.7) (14.6) - -
Axiognathus squamatus - 4.0 - -Ophiuroidea unid. 2.7 10.6 - -
OSTEICHTHYES - [19.9] - -Brosme brosme - 4.1 - -Pleuronectiformes - 11.2 - -Osteichthyes unid. - 4.6 - -
ANIMAL REMAINS AND MISC. [2.4] [4.9] [8.7] -
Number sampled 41 96 23 5Number empty 11 33 11 1Mean stomach content (g) 0.034 0.026 0.043 0.030Mean fish length (cm) 19 21 25 18

Page 80
Table B-29a. Diet composition and sampling data for goosefish by fish length category. (Samples gathered during 1977-80. Data expressed as percentageof stomach content by weight. Squared brackets indicate major taxon subtotal; parentheses indicate minor taxon subtotal.)
Length Category (cm) Stomach Contents 1-20 21-30 31-40 41-50 51-60 61-70 71-80 81-90 >90 Total
CEPHALOPODA [0.3] [3.3] [8.8] [27.3] [27.6] [40.5] [28.5] [28.2] [17.9] [24.9]Illex sp. - - - 8.7 22.3 16.1 14.6 15.5 16.6 15.3Loligo sp. - - - 3.6 1.0 5.5 - - 0.9 1.3Cephalopoda unid. 0.3 3.3 8.8 15.0 4.3 18.9 13.9 12.7 0.4 8.3
CHONDRICHTHYES - - - [0.7] [3.7] [15.8] [8.7] [5.4] [10.3] [8.8]Rajiformes - - - - 3.7 15.3 6.0 5.4 10.3 8.2Squalus acanthias - - - 0.7 - 0.5 2.7 - - 0.6
OSTEICHTHYES [98.2] [96.2] [89.6] [71.9] [67.0] [42.6] [62.5] [62.5] [70.3] [65.1]Alosa pseudoharengus - - - - 5.6 - - - 1.0 0.7Clupea harengus - - - - - - - - 0.8 0.3Clupeidae - - - - 1.9 - - 1.2 14.2 5.6Enchelyopus cimbrius - 5.1 4.5 - 2.7 - - - - 0.4Melanogrammus aeglefinus - - - - - - - 5.1 0.5 0.9Merluccius bilinearis 15.0 34.6 - 14.7 14.3 7.8 3.4 4.0 2.5 5.4Pollachius virens - - - - 3.5 - - - - 0.2Urophycis chesteri - - - - 2.3 - 0.4 0.6 - 0.3Urophycis chuss - - - - 0.2 <0.1 - - 4.8 1.9Urophycis tenuis - - 0.3 - - - - - - <0.1Urophycis sp. - 2.5 - - - - - - - 0.1Gadidae - 3.7 1.6 2.5 <0.1 - 15.1 - 7.8 6.2Macrouridae - - - - 1.2 - - - - 0.1Lophiidae - - - - - - - - 4.0 1.6Ammodytes dubius 24.2 - - 0.8 - 0.6 0.2 <0.1 - 0.2Peprilus triacanthus - - - - 1.8 1.7 0.9 2.0 - 0.8Sebastes fasciatus - - - - - 3.0 - - - 0.4Helicolenus dactylopterus - - - - - - - - 0.4 0.1Lopholatilus chamaeleonticeps - - - - - - - - 0.7 0.3Hemitripterus americanus - - - - - - - - 0.3 0.1Myoxocephalus octodecemspinosus - - - - 7.7 1.7 2.4 - 0.9 1.5Lumpenus lumpretaeformis - - - 1.2 - - - - - 0.1Triglidae - - - - - - 0.9 3.6 - 0.7Etropus microstomus - - - - - - - - 0.9 0.4Paralichthys oblongus - - - - - - - 2.1 - 0.3Scophthalmus aquosus - - - - - - - - 0.7 0.3Bothidae - 1.2 - - 0.3 - 0.1 - - 0.1Glyptocephalus cynoglossus - 4.9 - - - - 0.7 - 0.8 0.6Hippoglossoides platessoides - - - - - - - 0.2 4.6 1.8Pleuronectes ferruginus 0.4 - - - - - 1.1 - - 0.2Pleuronectes americanus - 1.7 - 0.4 - - - - 1.3 0.5Pleuronectiformes - 0.5 - 5.1 8.0 - - 10.8 - 2.2Osteichthyes eggs - - - - - - - - <0.1 <0.1Osteichthyes unid. 58.6 42.0 83.2 47.2 17.5 27.8 37.3 32.9 24.1 30.8
ANIMAL REMAINS AND MISC. [1.5] [0.5] [1.6] [0.1] [1.7] [1.1] [0.3] [3.9] [1.5] [1.2]
Number sampled 51 78 102 107 104 122 119 86 103 872Number empty 23 37 50 73 59 78 53 42 52 467Mean stomach content (g) 3.530 14.086 13.209 19.862 32.999 60.421 92.943 90.873 209.566 66.524Mean fish length (cm) 15 25 35 45 55 65 75 85 98 59

Page 81
Table B-29b. Diet composition and sampling data for goosefish by geographic area. (Samples gathered during 1977-80. Dataexpressed as percentage of stomach content by weight. Squared brackets indicate major taxon subtotal; parenthesesindicate minor taxon subtotal.)
Geographic Area Inshore
Southern NorthMiddle New Georges Gulf of Scotian of Cape
Stomach Contents Atlantic England Bank Maine Shelf Hatteras
CEPHALOPODA - [22.7] [49.6] [14.6] [3.5] [53.3]Illex sp. - 3.9 40.8 8.0 - 46.0Loligo sp. - 0.9 3.3 - - 7.3Cephalopoda unid. - 17.9 5.5 6.6 3.5 <0.1
CHONDRICHTHYES [3.0] [12.9] [21.2] [1.9] [5.3] -Rajiformes - 10.2 21.2 1.9 5.3 -Squalus acanthias 3.0 2.7 - - - -
OSTEICHTHYES [96.0] [63.2] [28.5] [81.1] [91.2] [46.6]Alosa pseudoharengus - - - 1.8 - -Clupea harengus - 1.3 - - - -Clupeidae - 0.5 - 13.0 - 3.6Enchelyopus cimbrius - - - 0.9 - -Melanogrammus aeglefinus - - 1.0 0.4 5.9 -Merluccius bilinearis - 14.4 0.5 4.9 - -Pollachius virens - - 1.0 - - -Urophycis chesteri - 1.4 - - - -Urophycis chuss - - - 4.5 - 0.2Urophycis tenuis - <0.1 - - - -Gadidae - 0.4 5.0 2.8 42.7 7.3Macrouridae - 0.3 - - - -Lophiidae - - - - 18.7 -Ammodytes dubius - 0.9 0.2 - - -Peprilus triacanthus - 2.2 - 0.7 - -Sebastes fasciatus - <0.1 - 0.9 - -Helicolenus dactylopterus - 0.6 - - - -Lopholatilus chamaeleonticeps - 1.3 - - - -Hemitripterus americanus - 0.5 - - - -Myoxocephalus octodecemspinosus - 1.0 3.8 - 5.7 -Lumpenus lumpretaeformis - - - 0.1 - -Triglidae - 3.1 - - - -Etropus microstomus - 1.6 - - - -Paralichthys oblongus - - 0.8 0.3 - -Scophthalmus aquosus - 1.1 - - - -Bothidae 2.4 <0.1 - - - 0.6Glyptocephalus cynoglossus - 1.9 - 0.3 - -Hippoglossoides platessoides - - - 4.3 - -Pleuronectes ferruginus - - <0.1 0.5 - -Pleuronectes americanus - - - 1.2 0.6 -Pleuronectiformes - 8.4 - 0.3 2.3 -Osteichthyes eggs - <0.1 - - - -Osteichthyes unid. 93.6 22.3 16.2 44.2 15.3 34.9
ANIMAL REMAINS AND MISC. [1.0] [1.2] [0.7] [2.4] [<0.1] [0.1]
Number sampled 26 362 91 316 51 25Number empty 13 208 52 164 22 7Mean stomach content (g) 18.339 34.587 133.825 74.414 91.418 106.507Mean fish length (cm) 43 52 69 63 63 68
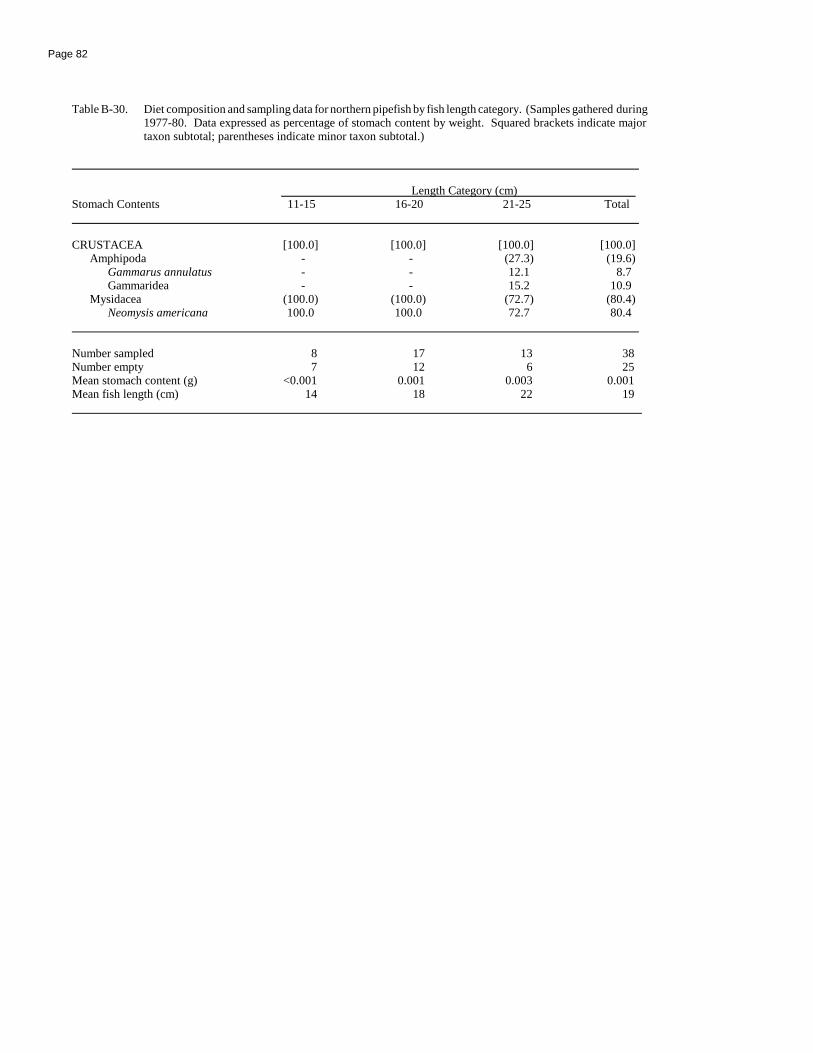
Page 82
Table B-30. Diet composition and sampling data for northern pipefish by fish length category. (Samples gathered during1977-80. Data expressed as percentage of stomach content by weight. Squared brackets indicate majortaxon subtotal; parentheses indicate minor taxon subtotal.)
Length Category (cm) Stomach Contents 11-15 16-20 21-25 Total
CRUSTACEA [100.0] [100.0] [100.0] [100.0]Amphipoda - - (27.3) (19.6)
Gammarus annulatus - - 12.1 8.7Gammaridea - - 15.2 10.9
Mysidacea (100.0) (100.0) (72.7) (80.4)Neomysis americana 100.0 100.0 72.7 80.4
Number sampled 8 17 13 38Number empty 7 12 6 25Mean stomach content (g) <0.001 0.001 0.003 0.001Mean fish length (cm) 14 18 22 19

Page 83
Table B-31a. Diet composition and sampling data for blackbelly rosefish by fish length category. (Samples gathered during 1977-80. Dataexpressed as percentage of stomach content by weight. Squared brackets indicate major taxon subtotal; parentheses indicateminor taxon subtotal.)
Length Category (cm) Stomach Contents 6-10 11-15 16-20 21-25 26-30 Total
NEMATODA - - [<0.1] [0.8] - [0.1]MOLLUSCA - [1.4] [5.4] - - [3.3]
Bivalvia - 1.4 - - - 0.3Cephalopoda - - 5.4 - - 3.0
POLYCHAETA - [1.8] [3.1] [8.7] - [3.3]Maldanidae - - 1.1 - - 0.6Eunice sp. - - - 4.3 - 0.6Onuphis sp. - 1.0 - - - 0.2Ampharete arctica - 0.2 - - - 0.1Terebellidae - - 1.8 - - 1.0Polychaeta unid. - 0.6 0.2 4.4 - 0.8
CRUSTACEA [28.9] [87.2] [48.8] [23.7] - [52.1]Cumacea - (<0.1) (0.1) - - (<0.1)Amphipoda (6.5) (5.2) (0.3) (<0.1) - (1.6)
Unciola inermis - 0.8 - - - 0.2Unciola irrorata 5.0 0.6 0.3 - - 0.4Unciola dissimilis - 1.6 <0.1 - - 0.4Unciola sp. - 2.2 <0.1 - - 0.6Amphipoda unid. 1.5 <0.1 - <0.1 - <0.1
Mysidacea - - (<0.1) (<0.1) - (0.1)Euphausiacea - (2.3) (3.0) (0.9) - (2.3)
Meganyctiphanes norvegica - 2.3 0.3 0.9 - 0.8Euphausiacea unid. - - 2.7 - - 1.5
Decapoda (7.5) (76.2) (44.7) (22.8) - (46.7)Spirontocaris sp. - - 0.3 - - 0.2Eualus pusiolus 7.5 - - - - 0.1Dichelopandalus leptocerus - 38.5 28.8 - - 25.5Pagurus sp. - 0.9 - - - 0.2Munida sp. - - 1.4 - - 0.8Caridion gordoni - 0.4 0.7 - - 0.5Cancer irroratus - - 4.4 - - 2.5Cancer sp. - 1.1 8.8 - - 5.2Crab unid. - 12.0 0.3 - - 3.1Shrimp unid. - 23.3 - 22.8 - 8.6
Crustacea unid. (14.9) (3.5) (0.7) - - (1.4)ECHINODERMATA - - [1.3] - [13.7] [1.5]
Holothuroidea - - - - 13.7 0.8Ophiuroidea - - 1.3 - - 0.7
SALPIDAE - [0.8] [30.1] [66.6] [86.3] [30.7]Salpa fusiformis - - 2.8 57.0 86.3 13.9Salpidae unid. - 0.8 27.3 9.6 - 16.8
OSTEICHTHYES [71.1] [5.6] [<0.1] [0.2] - [2.1]ANIMAL REMAINS AND MISC. - [3.2] [11.3] - - [6.9]
Number sampled 8 26 33 10 3 80Number empty 4 10 6 4 1 25Mean stomach content (g) 0.025 0.181 0.333 0.251 0.375 0.244Mean fish length (cm) 8 13 17 22 28 16

Page 84
Table B-31b. Diet composition and sampling data for blackbelly rosefish by geographic area. (Samples gathered during1977-80. Data expressed as percentage of stomach content by weight. Squared brackets indicate major taxonsubtotal; parentheses indicate minor taxon subtotal.)
Geographic Area Southern
Middle New Georges Gulf of Stomach Contents Atlantic England Bank Maine
NEMATODA - - [0.2] -MOLLUSCA - [2.7] [4.5] -
Bivalvia - 2.7 - -Cephalopoda - - 4.5 -
POLYCHAETA - [11.2] [1.8] [15.8]Maldanidae - - 0.9 -Eunice sp. - - - 15.8Onuphis sp. - 1.9 - -Terebellidae - 8.1 - -Polychaeta unid. - 1.2 0.9 -
CRUSTACEA [82.8] [53.0] [41.7] [84.2]Cumacea (0.1) - (<0.1) -Amphipoda (6.7) (0.3) (0.4) -
Unciola inermis 1.1 - - -Unciola irrorata 0.4 - 0.4 -Unciola dissimilis 2.2 0.2 - -Unciola sp. 3.0 - <0.1 -Amphipoda unid. <0.1 0.1 <0.1 -
Mysidacea - (0.1) (<0.1) -Euphausiacea (2.8) (9.4) (1.0) -
Meganyctiphanes norvegica 2.8 - 0.5 -Euphausiacea unid. - 9.4 0.5 -
Decapoda (72.3) (39.1) (39.2) (84.2)Spirontocaris sp. - - 0.3 -Eualus pusiolus - - 0.1 -Dichelopandalus leptocerus - - 38.1 -Pagurus sp. - 1.8 - -Munida sp. 4.5 - - -Caridion gordoni - - 0.7 -Cancer irroratus 5.9 11.7 - -Cancer sp. 28.5 2.1 - -Crab unid. 0.9 23.5 - -Shrimp unid. 32.5 - - 84.2
Crustacea unid. (0.9) (4.1) (1.1) -ECHINODERMATA [4.6] - [1.1] -
Holothuroidea 4.6 - - -Ophiuroidea - - 1.1 -
SALPIDAE - - [45.7] -Salpa fusiformis - - 20.7 -Salpidae unid. - - 25.0 -
OSTEICHTHYES [10.1] [2.9] [0.6] -ANIMAL REMAINS AND MISC. [2.5] [30.2] [4.4] -
Number sampled 28 16 36 1Number empty 12 4 10 0Mean stomach content (g) 0.121 0.150 0.363 0.679Mean fish length (cm) 15 15 17 21

Page 85
Table B-32a. Diet composition and sampling data for Acadian redfish by fish length category. (Samples gathered during 1977-80. Dataexpressed as percentage of stomach content by weight. Squared brackets indicate major taxon subtotal; parentheses indicateminor taxon subtotal.)
Length Category (cm) Stomach Contents 11-15 16-20 21-25 26-30 31-35 36-40 41-45 Total
SIPHONOPHORA - - - - - [0.3] - [0.1]NEMATODA - - [<0.1] - - [<0.1] - [<0.1]CHAETOGNATHA - - [<0.1] - - [<0.1] - [<0.1]MOLLUSCA - - - [6.2] [<0.1] - - [0.7]POLYCHAETA - - [0.5] - - - - [0.1]CRUSTACEA [100.0] [100.0] [98.7] [92.4] [80.0] [99.5] [100.0] [91.3]
Copepoda - (62.7) (29.3) (10.0) (0.3) (1.0) - (5.9)Calanus sp. - 62.7 29.3 10.0 0.3 1.0 - 5.9
Cumacea - - - - - (<0.1) - (<0.1)Diastylis sp. - - - - - <0.1 - <0.1
Amphipoda - (0.4) (0.8) (0.1) (1.4) (0.5) (42.9) (1.0)Parathemisto gaudichaudii - 0.4 0.7 - 1.3 0.2 - 0.6Parathemisto sp. - - 0.1 <0.1 <0.1 0.2 38.9 0.2Vibilia sp. - - - - - 0.1 - 0.1Hyperiidae - <0.1 <0.1 <0.1 0.1 <0.1 - 0.1Oedicerotidae - - - - - <0.1 4.0 <0.1Amphipoda unid. - - - 0.1 - - - <0.1
Euphausiacea - (32.3) (65.4) (81.0) (77.5) (90.8) (57.1) (80.7)Meganyctiphanes norvegica - 32.3 64.0 78.3 76.9 90.3 57.1 79.9Euphausiacea unid. - - 1.4 2.7 0.6 0.5 - 0.8
Decapoda - (4.1) (3.0) - (0.3) (6.6) - (3.1)Spirontocaris liljeborgii - 4.1 - - - - - 0.1Dichelopandalus leptocerus - - 3.0 - - 0.5 - 0.5Pandalidae - - - - - 0.8 - 0.3Crangon septemspinosa - - - - - 4.8 - 1.9Shrimp unid. - - - - - 0.2 - 0.1Decapoda larvae - - <0.1 <0.1 - - - <0.1Decapoda unid. - - - - 0.3 0.3 - 0.2
Crustacea unid. (100.0) (0.5) (0.2) (1.3) (0.5) (0.6) - (0.6)OSTEICHTHYES - - - [1.3] [19.5] [0.2] - [7.5]
Merluccius bilinearis - - - - 19.5 - - 7.3Cryptacanthodes maculatus - - - - - 0.2 - 0.1Sebastes fasciatus - - - 1.3 - - - 0.1Osteichthyes larvae - - - - - <0.1 - <0.1
ANIMAL REMAINS - - [0.8] [0.1] [0.5] [<0.1] - [0.3]
Number sampled 4 14 45 55 77 63 8 266Number empty 1 8 29 35 45 29 5 152Mean stomach content (g) 0.038 0.306 0.439 0.374 0.939 1.216 0.062 0.730Mean fish length (cm) 14 19 23 28 32 37 41 30

Page 86
Table B-32b. Diet composition and sampling data for Acadian redfish by geographic area. (Samples gatheredduring 1977-80. Data expressed as percentage of stomach content by weight. Squared bracketsindicate major taxon subtotal; parentheses indicate minor taxon subtotal.)
Geographic Area Georges Gulf of Scotian
Stomach Contents Bank Maine Shelf
SIPHONOPHORA - [0.2] -NEMATODA - - [<0.1]CHAETOGNATHA - [<0.1] [<0.1]MOLLUSCA - [1.4] [<0.1]POLYCHAETA - - [<0.1]CRUSTACEA [100.0] [82.6] [99.4]
Copepoda (63.5) (0.8) (10.6)Calanus sp. 63.5 0.8 10.6
Cumacea - - (<0.1)Diastylis sp. - - <0.1
Amphipoda (18.6) (0.1) (1.6)Parathemisto gaudichaudii 18.6 0.1 1.1Parathemisto sp. - - 0.4Vibilia sp. - - <0.1Hyperiidae - <0.1 0.1Oedicerotidae - - <0.1Amphipoda unid. - <0.1 -
Euphausiacea (12.8) (81.0) (80.6)Meganyctiphanes norvegica 12.8 80.7 79.2Euphausiacea unid. - 0.3 1.4
Decapoda - (0.5) (5.6)Spirontocaris liljeborgii - - 0.2Dichelopandalus leptocerus - - 1.0Pandalidae - - 0.6Crangon septemspinosa - - 3.6Shrimp unid. - - 0.2Decapoda larvae - - <0.1Decapoda unid. - 0.5 -
Crustacea unid. (5.1) (0.2) (1.0)OSTEICHTHYES - [15.6] [<0.1]
Merluccius bilinearis - 15.1 -Cryptacanthodes maculatus - 0.2 -Sebastes fasciatus - 0.3 -Osteichthyes larvae - <0.1 <0.1
ANIMAL REMAINS - [0.2] [0.6]
Number sampled 3 86 177Number empty 1 42 109Mean stomach content (g) 0.052 1.088 0.567Mean fish length (cm) 22 31 30

Page 87
Table B-33. Diet composition and sampling data for northern searobin by fish length category. (Samples gathered during 1977-80.Data expressed as percentage of stomach content by weight. Squared brackets indicate major taxon subtotal;parentheses indicate minor taxon subtotal.)
Length Category (cm) Stomach Contents 11-15 16-20 21-25 26-30 Total
MOLLUSCA - [1.9] [2.5] [10.4] [3.9]Bivalvia - (1.9) (2.5) (8.4) (3.4)
Solenidae - - - 6.0 1.2Tellina agilis - 1.8 2.0 2.4 1.9Bivalvia unid. - 0.1 0.5 - 0.3
Mollusca unid. - - (<0.1) (2.0) (0.5)POLYCHAETA - [1.5] [26.7] [1.2] [15.2]
Nephtyidae - 0.6 0.3 0.4 0.4Spionidae - - 22.1 - 12.1Polychaeta unid. - 0.9 4.3 0.8 2.7
CRUSTACEA [87.8] [90.2] [45.8] [20.1] [51.5]Cumacea - (10.8) (1.1) (0.2) (3.0)
Pseudoleptocuma minor - 0.5 - - 0.1Oxyurostylis smithi - 10.3 0.9 - 2.6Cumacea unid. - - 0.2 0.2 0.3
Isopoda - (1.0) (<0.1) - (0.3)Edotea sp. - 1.0 <0.1 - 0.3
Amphipoda (3.7) (2.9) (8.3) (2.5) (5.9)Ampelisca agassizi - - 0.2 - 0.1Ampeliscidae 3.7 - 0.3 - 0.3Ericthonius rubricornis - - 0.9 - 0.5Unciola irrorata - 1.1 4.9 0.4 3.0Protohaustorius wigleyi - - 0.2 0.6 0.2Leptocheirus pinguis - - 0.7 - 0.4Rhepoxynius epistomus - - - 1.3 0.3Caprellidae - 0.5 0.9 - 0.6Gammaridea - 1.3 0.2 0.2 0.5
Decapoda (16.9) (71.0) (33.8) (17.4) (37.3)Dichelopandalus leptocerus - - 4.6 - 2.5Crangon septemspinosa 5.8 38.6 8.7 - 12.9Cancer borealis - - 0.4 - 0.2Cancer irroratus 7.8 27.9 16.1 17.4 18.5Cancridae - 1.0 - - 0.2Crab unid. 3.3 - 1.7 - 1.0Decapoda larvae - 1.0 2.0 - 1.3Decapoda unid. - 2.5 0.3 - 0.7
Crustacea unid. (67.2) (4.5) (2.6) - (5.0)OSTEICHTHYES - [0.9] [2.1] [64.3] [14.7]
Paralichthys dentatus - - 0.8 - 0.4Pleuronectiformes - 0.9 - - 0.2Osteichthyes unid. - - 1.3 64.3 14.1
ANIMAL REMAINS - [5.0] [9.5] [2.3] [6.4]SAND AND ROCK [12.2] [0.5] [13.4] [1.7] [8.3]
Number sampled 7 11 19 4 41Number empty 1 2 4 1 8Mean stomach content (g) 0.057 0.192 0.299 0.537 0.252Mean fish length (cm) 14 18 22 28 20

Page 88
Table B-34a. Diet composition and sampling data for sea raven by fish length category. (Samples gathered during 1977-80. Data expressed aspercentage of stomach content by weight. Squared brackets indicate major taxon subtotal; parentheses indicate minor taxon subtotal.)
Length Category (cm) Stomach Contents 6-10 11-15 16-20 21-25 26-30 31-35 36-40 41-45 >45 Total
RHYNCHOCOELA - - - - - - - [0.1] - [<0.1]MOLLUSCA [0.3] - - - [2.6] [9.2] - [<0.1] [<0.1] [1.6]
Bivalvia - - - - (2.6) (0.3) - - (<0.1) (0.2)Anadara transversa - - - - - <0.1 - - - <0.1Clinocardium ciliatum - - - - - 0.3 - - - 0.1Bivalvia unid. - - - - 2.6 - - - <0.1 0.1
Cephalopoda - - - - - (8.9) - (<0.1) - (1.4)Illex sp. - - - - - - - <0.1 - <0.1Cephalopoda unid. - - - - - 8.9 - - - 1.4
Mollusca unid. (0.3) - - - - - - - - (<0.1)CRUSTACEA [99.7] [100.0] [11.7] [24.5] [28.5] [22.7] [23.6] [30.5] [22.9] [24.0]
Amphipoda (3.1) - (<0.1) - - - - - - (<0.1)Euphausiacea - (43.2) - - - - - - - (<0.1)
Euphausia krohnii - 22.9 - - - - - - - <0.1Meganyctiphanes norvegica - 20.3 - - - - - - - <0.1
Decapoda (96.6) (45.0) (10.3) (24.5) (28.5) (22.7) (23.6) (30.5) (22.9) (24.0)Hippolytidae - - 0.7 - - - - - - <0.1Dichelopandalus leptocerus - - 4.7 1.2 7.2 <0.1 0.6 - - 0.4Pandalus borealis - - - - - - - - <0.1 0.1Pandalus montagui - - - 2.1 - - - - - 0.1Pandalidae - - - - 1.0 - - - - <0.1Crangon septemspinosa 63.0 45.0 - 0.2 - - - - - <0.1Pagurus sp. - - - - - - - - 0.1 <0.1Hyas coarctatus - - - - - - - - 0.4 0.2Cancer borealis - - - 17.2 - - 8.8 30.5 22.4 17.4Cancer irroratus - - - 3.8 20.3 22.7 14.2 - - 5.8Shrimp unid. 33.6 - - - - <0.1 - - - <0.1Decapoda unid. - - 4.9 - - <0.1 - - - <0.1
Crustacea unid. - (11.8) (1.4) - - (<0.1) (<0.1) - - (<0.1)OSTEICHTHYES - - [87.4] [75.5] [56.9] [67.4] [76.4] [69.4] [77.0] [73.8]
Merluccius bilinearis - - - - - 4.4 - - - 0.7Gadidae - - - 11.4 - - - - - 0.4Anarhichadidae - - - - - - - - 71.7 38.6Liparis atlanticus - - 4.8 - - 0.6 - - - 0.1Liparis liparis - - - - 0.6 - - - - <0.1Ophidiidae - - - - - 7.5 13.6 - - 2.6Pholis gunnellus - - 18.8 - - - - - - 0.2Lumpenus lumpretaeformis - - - 33.0 - - - - - 1.1Macrozoarces americanus - - - 3.3 - 17.1 - - - 2.8Osteichthyes unid. - - 63.8 27.8 56.3 37.8 62.8 69.4 5.3 27.3
ANIMAL REMAINS - - [0.7] - [0.1] [<0.1] - [<0.1] [<0.1] [0.1]ROCK AND SAND - - [0.2] [<0.1] [11.9] [0.7] [<0.1] - [0.1] [0.5]
Number sampled 4 7 18 22 17 34 20 8 16 146Number empty 0 3 7 10 9 16 11 3 7 66Mean stomach content (g) 0.080 0.077 0.867 2.899 3.433 9.030 10.564 31.104 65.994 13.436Mean fish length (cm) 9 13 18 22 28 33 37 42 51 30

Page 89
Table B-34b. Diet composition and sampling data for sea raven by geographic area. (Samples gathered during 1977-80. Dataexpressed as percentage of stomach content by weight. Squared brackets indicate major taxon subtotal; parenthesesindicate minor taxon subtotal.)
Geographic Area Inshore
Southern North New Georges Gulf of Scotian of Cape
Stomach Contents England Bank Maine Shelf Hatteras
RHYNCHOCOELA - [<0.1] - - -MOLLUSCA - [3.6] [0.8] - [<0.1]
Bivalvia - - (0.8) - (<0.1)Anadara transversa - - <0.1 - -Clinocardium ciliatum - - 0.3 - -Bivalvia unid. - - 0.5 - <0.1
Cephalopoda - (3.6) - - (<0.1)Illex sp. - - - - <0.1Cephalopoda unid. - 3.6 - - -
Mollusca unid. - (<0.1) - - -CRUSTACEA [64.8] [51.5] [1.5] [63.5] [8.4]
Amphipoda - (<0.1) - - (<0.1)Euphausiacea - (<0.1) - - -
Euphausia krohnii - <0.1 - - -Meganyctiphanes norvegica - <0.1 - - -
Decapoda (64.8) (51.5) (1.5) (63.5) (8.4)Hippolytidae - - - - <0.1Dichelopandalus leptocerus - 0.4 1.1 63.5 -Pandalus borealis - - - - 0.1Pandalus montagui - - - - 0.1Pandalidae - - 0.2 - -Crangon septemspinosa - <0.1 - - -Pagurus sp. - - - - <0.1Hyas coarctatus - - - - 0.5Cancer borealis - 45.2 - - -Cancer irroratus - 5.9 - - 7.7Shrimp unid. 64.8 - <0.1 - -Decapoda unid. - - 0.2 - <0.1
Crustacea unid. - (<0.1) - - -OSTEICHTHYES - [44.2] [97.6] [36.5] [90.6]
Merluccius bilinearis - - 4.4 - -Gadidae - 1.0 - - -Anarhichadidae - - - - 84.5Liparis atlanticus - 0.3 - - -Liparis liparis - - - 36.5 -Ophidiidae - 6.9 - - -Pholis gunnellus - - - - 0.3Lumpenus lumpretaeformis - - 6.8 - -Macrozoarces americanus - 0.3 17.0 - -Osteichthyes unid. - 35.7 69.4 - 5.8
ANIMAL REMAINS [19.4] [0.3] [0.1] - [0.2]ROCK AND SAND [15.8] [0.4] [<0.1] - [0.8]
Number sampled 14 73 31 6 22Number empty 12 27 13 4 10Mean stomach content (g) 0.012 10.337 10.007 0.161 40.712Mean fish length (cm) 26 29 33 25 34

Page 90
Table B-35a. Diet composition and sampling data for longhorn sculpin by fish length category. (Samples gathered during 1977-80. Dataexpressed as percentage of stomach content by weight. Squared brackets indicate major taxon subtotal; parentheses indicateminor taxon subtotal.)
Length Category (cm) Stomach Contents 6-10 11-15 16-20 21-25 26-30 31-35 36-40 Total
MOLLUSCA - - - [1.6] [0.4] [<0.1] - [0.5]Gastropoda - - - 0.7 0.1 - - 0.2Mollusca unid. - - - 0.9 0.3 <0.1 - 0.3
POLYCHAETA [11.7] [23.4] [1.5] [1.0] [1.8] [3.3] - [2.1]Aphroditidae - - - - 0.5 3.3 - 1.0Polychaeta unid. 11.7 23.4 1.5 1.0 1.3 - - 1.1
CRUSTACEA [81.6] [68.8] [96.2] [93.2] [85.2] [63.9] [89.5] [82.4]Isopoda - - - (0.3) (0.3) - - (0.2)
Cirolana polita - - - 0.3 0.3 - - 0.2Amphipoda (53.3) (18.8) - (1.1) (2.0) (0.6) - (1.9)
Calliopius laeviusculus - - - - 1.1 - - 0.7Ericthonius rubricornis 3.3 - - <0.1 <0.1 - - <0.1Unciola irrorata 8.3 - - 0.4 0.5 0.4 - 0.5Lysianassidae - - - - - 0.2 - 0.1Oedicerotidae - - - 0.1 <0.1 - - <0.1Leptocheirus pinguis - 17.2 - 0.2 <0.1 <0.1 - 0.1Podoceridae 16.7 - - - - - - <0.1Aeginina longicornis - - - - 0.3 - - 0.2Caprellidae - - - <0.1 0.1 - - 0.1Amphipoda unid. 25.0 1.6 - 0.4 <0.1 <0.1 - 0.2
Decapoda - (14.1) (96.2) (84.5) (80.2) (62.3) (89.5) (77.2)Dichelopandalus leptocerus - - 54.9 29.6 3.5 26.8 89.5 12.2Crangon septemspinosa - - 11.0 5.3 3.6 6.5 - 4.5Axius serratus - - - 5.5 - 1.2 - 0.9Pagurus acadianus - - 6.1 1.6 10.9 1.3 - 7.7Pagurus annulipes - - - - <0.1 3.0 - 0.7Paguridae - - - - 4.0 - - 2.6Hyas coarctatus - - - 0.4 1.9 5.5 - 2.4Hyas sp. - - - - 1.1 0.3 - 0.8Cancer irroratus - - 16.5 36.6 53.2 2.6 - 40.2Cancridae - - - - 0.2 - - 0.2Ovalipes ocellatus - - - 0.2 - - - <0.1Crab unid. - - 7.7 1.4 0.2 4.0 - 1.2Shrimp unid. - 14.1 - 3.9 1.6 10.2 - 3.6Decapoda unid. - - - <0.1 <0.1 0.9 - 0.2
Crustacea unid. (28.3) (35.9) - (7.3) (2.7) (1.0) - (3.1)OSTEICHTHYES - - - - [7.3] [27.6] - [10.5]
Gadidae - - - - 0.2 - - 0.1Ammodytes dubius - - - - - 19.5 - 4.0Myoxocephalus octodecemspinosus - - - - 0.2 - - 0.2Osteichthyes unid. - - - - 6.9 8.1 - 6.2
ANIMAL REMAINS AND MISC. [5.0] [7.8] [2.3] [4.2] [3.9] [1.1] - [2.7]SAND AND ROCK [1.7] - - [<0.1] [1.4] [4.1] [10.5] [1.8] Number sampled 11 2 6 32 75 22 1 149Number empty 3 0 2 3 13 4 0 25Mean stomach content (g) 0.005 0.032 0.560 1.008 2.234 2.362 0.086 1.714Mean fish length (cm) 8 11 20 24 28 32 37 26

Page 91
Table B-35b. Diet composition and sampling data for longhorn sculpin by geographic area. (Samples gathered during 1977-80.Data expressed as percentage of stomach content by weight. Squared brackets indicate major taxon subtotal;parentheses indicate minor taxon subtotal.)
Geographic Area Southern New Georges Gulf of Scotian
Stomach Contents England Bank Maine Shelf
MOLLUSCA [<0.1] [0.4] - [2.2]Gastropoda - 0.1 - 2.2Mollusca unid. <0.1 0.3 - -
POLYCHAETA [5.0] [1.1] [17.9] [2.5]Aphroditidae 4.2 - 17.9 1.9Polychaeta unid. 0.8 1.1 - 0.6
CRUSTACEA [91.4] [79.2] [79.4] [94.2]Isopoda (0.1) (0.2) - -
Cirolana polita 0.1 0.2 - -Amphipoda (1.9) (1.4) - -
Calliopius laeviusculus - 0.9 - -Ericthonius rubricornis <0.1 <0.1 - -Unciola irrorata 0.7 0.4 - -Lysianassidae 0.1 <0.1 - -Leptocheirus pinguis <0.1 <0.1 - -Podoceridae - <0.1 - -Aeginina longicornis 1.1 - - -Caprellidae <0.1 <0.1 - -Amphipoda unid. <0.1 0.1 - -
Decapoda (85.5) (74.9) (72.4) (94.2)Dichelopandalus leptocerus 41.3 5.9 - 28.0Crangon septemspinosa 10.2 3.3 - 6.3Axius serratus - 0.3 - 18.4Pagurus acadianus 1.8 9.4 - 0.2Pagurus annulipes - 0.8 - -Paguridae 2.5 2.8 - -Hyas coarctatus 4.0 2.3 - -Hyas sp. 0.4 - 47.3 -Cancer irroratus 5.9 47.9 - 39.8Cancridae 1.0 - - -Ovalipes ocellatus - <0.1 - -Crab unid. 1.2 1.3 - 1.5Shrimp unid. 17.2 0.7 25.1 -Decapoda unid. <0.1 0.2 - -
Crustacea unid. (3.9) (2.7) (7.0) (<0.1)OSTEICHTHYES [1.0] [12.9] - -
Gadidae - 0.1 - -Ammodytes dubius - 5.0 - -Myoxocephalus octodecemspinosus 1.0 - - -Osteichthyes unid. - 7.8 - -
ANIMAL REMAINS AND MISC. [2.1] [4.4] [2.7] [0.3]SAND AND ROCK [0.5] [2.0] - [0.8]
Number sampled 33 99 10 7Number empty 7 11 5 2Mean stomach content (g) 1.224 2.035 0.383 1.373Mean fish length (cm) 28 25 28 22

Page 92
Table B-36. Diet composition and sampling data for moustache sculpin by fish length category. (Samplesgathered during 1977-80. Data expressed as percentage of stomach content by weight.Squared brackets indicate major taxon subtotal; parentheses indicate minor taxon subtotal.)
Length Category (cm) Stomach Contents 6-10 11-15 Total
POLYCHAETA [31.9] [5.2] [16.1]Rhodine sp. 1.5 - 0.6Nothria conchylega - 1.2 0.7Polychaeta unid. 30.4 4.0 14.8
CRUSTACEA [68.1] [93.8] [83.5]Copepoda (0.1) - (0.1)
Calanus sp. 0.1 - 0.1Cumacea (5.5) - (2.3)
Diastylis quadrispinosa 5.5 - 2.3Amphipoda (14.7) (5.1) (9.1)
Haploops sp. 5.1 - 2.1Ampeliscidae 2.4 - 1.0Caprellidae - 0.3 0.2Ericthonius sp. 0.9 0.7 0.8Unciola irrorata 1.2 - 0.5Corophiidae 0.5 - 0.2Leptocheirus pinguis 1.8 3.4 2.7Podoceropsis nitida - 0.4 0.2Dulichia sp. 0.1 - 0.1Tironidae 1.9 - 0.8Gammaridea 0.8 0.3 0.5
Decapoda (41.5) (86.1) (67.9)Eualus pusiolus 4.9 - 2.0Dichelopandalus leptocerus 24.0 - 9.9Pandalus borealis 12.6 - 5.2Pandalidae - 57.5 33.9Crangon septemspinosa - 1.2 0.7Crangonidae - 2.8 1.7Shrimp unid. - 24.6 14.5
Crustacea unid. (6.3) (2.6) (4.1)ROCK - [1.0] [0.4]
Number sampled 12 16 28Number empty 1 1 2Mean stomach content (g) 0.071 0.076 0.074Mean fish length (cm) 8 12 10

Page 93
Table B-37a. Diet composition and sampling data for black sea bass by fish length category. (Samples gathered during 1977-80. Data expressed aspercentage of stomach content by weight. Squared brackets indicate major taxon subtotal; parentheses indicate minor taxon subtotal.)
Length Category (cm) Stomach Contents 1-5 6-10 11-15 16-20 21-25 26-30 31-35 36-40 >40 Total
MOLLUSCA - [0.5] [2.4] [6.7] [20.4] [9.2] [2.5] [10.5] [6.7] [10.2]Bivalvia - (0.5) (1.8) (4.2) (7.4) (8.0) (1.1) (6.9) (1.3) (5.2)
Laevicardium sp. - - - 1.7 2.2 6.6 - - - 2.6Ensis directus - - - - 0.3 - - 6.9 1.3 0.5Bivalvia unid. - 0.5 1.8 2.5 4.9 1.4 1.1 - - 2.1
Cephalopoda - - - (1.0) (12.1) (0.6) (0.5) (3.3) (2.3) (3.8)Loligo sp. - - - - 4.1 - - - 2.2 1.3Cephalopoda unid. - - - 1.0 8.0 0.6 0.5 3.3 0.1 2.5
Mollusca unid. - - (0.6) (1.5) (0.9) (0.6) (0.9) (0.3) (3.1) (1.2)POLYCHAETA - [5.8] [8.3] [0.2] [0.7] [0.2] [0.4] [<0.1] [9.6] [1.9]CRUSTACEA [85.5] [91.5] [82.4] [76.3] [45.7] [57.8] [78.8] [45.7] [17.3] [54.5]
Amphipoda (43.6) (19.9) (0.3) (<0.1) (<0.1) (<0.1) (7.5) - - (1.2)Mysidacea (3.2) (4.2) - (1.1) (<0.1) (2.5) (<0.1) - - (0.9)Euphausiacea - - (33.8) (34.2) (7.3) - - - - (6.3)
Meganyctiphanes norvegica - - 33.8 34.2 7.3 - - - - 6.3Decapoda (35.5) (44.2) (46.9) (40.3) (38.2) (54.9) (70.2) (45.7) (17.3) (45.6)
Dichelopandalus leptocerus - 7.2 - <0.1 - - - - - <0.1Crangon septemspinosa 14.5 19.4 0.1 <0.1 0.3 0.3 <0.1 - 0.1 0.2Paguridae - 1.9 6.4 2.4 5.8 3.8 0.9 - 2.0 3.4Munida sp. - 1.7 - 2.3 0.4 4.5 1.7 - - 1.9Cancer borealis - - 1.8 - - <0.1 7.6 - - 1.2Cancer irroratus - 10.2 23.8 19.6 17.5 40.4 37.2 45.7 7.6 27.0Ovalipes sp. - - - - - - 15.2 - 4.8 3.0Decapoda unid. 21.0 3.8 14.8 16.0 14.2 5.9 7.6 - 2.8 8.9
Crustacea unid. (3.2) (23.2) (1.4) (0.7) (0.2) (0.4) (1.1) - - (0.5)OSTEICHTHYES - [1.8] [2.6] [8.4] [27.8] [25.0] [14.7] [43.5] [62.9] [28.5]
Ophichthus cruentifer - - - - - - - - 0.3 0.1Alepocephalidae - - - - - 2.0 - - - 0.6Clupea harengus - - - - 2.3 - - - - 0.6Anchoa hepsetus - - - 6.8 17.2 - - - 9.5 6.4Anchoa mitchilli - - - - - - 9.6 - - 1.5Engraulidae - - - - 3.7 - - - - 0.9Cyprinodon variegatus - - - - - - - 30.4 - 1.3Hippocampus sp. - - - - - - 1.9 - - 0.3Syngnathus fuscus - - - - - - 3.0 - - 0.5Myctophidae - - - - - 12.8 - - - 3.6Ophidiidae - - - - - 2.1 - - - 0.6Ammodytes dubius - - - - - - - - 20.6 3.0Stenotomus chrysops - - - - - 3.7 - - 25.3 4.8Scophthalmus aquosus - - - - - - - - 4.4 0.7Osteichthyes larvae - - - - <0.1 <0.1 - - - <0.1Osteichthyes unid. - 1.8 2.6 1.6 4.6 4.4 0.2 13.1 2.8 3.6
ANIMAL REMAINS AND MISC. [14.5] [0.4] [4.3] [8.4] [5.4] [7.8] [3.6] [0.3] [3.5] [4.9]
Number sampled 9 82 69 142 188 103 49 16 22 680Number empty 1 11 19 36 64 30 18 11 5 195Mean stomach content (g) 0.007 0.023 0.223 0.581 0.975 2.033 2.314 1.912 4.983 1.097Mean fish length (cm) 5 7 13 18 22 27 32 38 45 21

Page 94
Table B-37b. Diet composition and sampling data for black sea bass by geographic area. (Samples gathered during 1977-80. Dataexpressed as percentage of stomach content by weight. Squared brackets indicate major taxon subtotal; parentheses indicateminor taxon subtotal.)
Geographic Area Offshore Inshore Inshore
Southern South South North Middle New Georges of Cape of Cape of Cape
Stomach Contents Atlantic England Bank Hatteras Hatteras Hatteras
MOLLUSCA [5.4] - - [12.0] [19.6] [7.5]Bivalvia (1.8) - - (10.8) (12.6) (2.2)
Laevicardium sp. - - - - 9.0 -Bivalvia unid. 1.8 - - 10.8 3.6 2.2
Cephalopoda (1.6) - - - (5.9) (5.3)Loligo sp. 0.4 - - - - 4.2Cephalopoda unid. 1.2 - - - 5.9 1.1
Mollusca unid. (2.0) - - (1.2) (1.1) (<0.1)POLYCHAETA [3.7] [0.3] - [3.4] [<0.1] [0.9]CRUSTACEA [63.1] [96.7] [97.4] [22.8] [33.5] [64.1]
Amphipoda (<0.1) (17.2) - - (<0.1) (4.2)Mysidacea (<0.1) (3.4) (18.4) - - (3.2)Euphausiacea (14.8) - - - - -
Meganyctiphanes norvegica 14.8 - - - - -Decapoda (48.1) (52.4) (21.1) (22.7) (33.0) (55.9)
Dichelopandalus leptocerus <0.1 11.9 - - - -Crangon septemspinosa <0.1 31.8 - - - 0.6Paguridae 1.3 3.2 - 0.1 3.9 6.1Munida sp. 4.5 - - - - -Cancer borealis 2.9 - - - - -Cancer irroratus 34.6 1.9 - - 2.2 43.0Ovalipes sp. 1.7 - - - 5.5 2.7Decapoda unid. 3.1 3.6 21.1 22.6 21.4 3.5
Crustacea unid. (0.2) (23.7) (57.9) (0.1) (0.5) (0.8)OSTEICHTHYES [23.6] [3.0] - [61.1] [43.7] [18.4]
Ophichthus cruentifer 0.1 - - - - -Alepocephalidae - - - - 1.9 -Clupea harengus - - - - 2.0 -Anchoa hepsetus - - - - 22.3 -Anchoa mitchilli - - - - - 5.4Engraulidae - - - - 3.2 -Cyprinodon variegatus - - - - 4.4 -Hippocampus sp. - - - 15.7 - -Syngnathus fuscus - - - - - 1.7Myctophidae 8.5 - - - - -Ophidiidae 1.4 - - - - -Ammodytes dubius 0.2 - - - - 10.8Stenotomus chrysops 8.8 - - - 3.7 -Scophthalmus aquosus 1.5 - - - - -Osteichthyes larvae - - - - <0.1 <0.1Osteichthyes unid. 3.1 3.0 - 45.4 6.2 0.5
ANIMAL REMAINS AND MISC. [4.2] - [2.6] [0.7] [3.2] [9.1]
Number sampled 288 39 9 28 185 131Number empty 105 4 4 6 52 24Mean stomach content (g) 1.096 0.029 0.004 0.493 1.150 1.546Mean fish length (cm) 23 7 7 20 22 20

Page 95
Table B-38a. Diet composition and sampling data for bluefish by fish length category. (Samples gathered during 1977-80. Data expressed aspercentage of stomach content by weight. Squared brackets indicate major taxon subtotal; parentheses indicate minor taxon subtotal.)
Length Category (cm) Stomach Contents 1-10 11-20 21-30 31-40 41-50 51-60 61-70 71-80 >80 Total
MOLLUSCA - [6.3] [7.4] [8.5] [19.3] [15.0] [57.7] [61.7] [21.2] [40.1]Cephalopoda - (6.3) (7.4) (8.5) (19.3) (15.0) (57.7) (61.4) (21.2) (40.0)
Illex sp. - - 1.7 - - - 17.5 46.8 0.7 22.8Loligo pealeii - - - - - 2.8 1.4 7.1 - 3.9Loligo sp. - <0.1 1.6 1.5 18.4 10.5 28.4 6.9 20.5 10.6Cephalopoda unid. - 6.3 4.1 7.0 0.9 1.7 10.4 0.6 - 2.7
Mollusca unid. - - (<0.1) - - - - (0.3) - (0.1)POLYCHAETA - [2.2] [3.7] [<0.1] - [0.7] - - - [0.4]
Glyceridae - - <0.1 - - 0.7 - - - 0.1Ophioglycera gigantea - - 3.7 - - - - - - 0.3Polychaeta unid. - 2.2 <0.1 <0.1 - - - - - <0.1
CRUSTACEA - [0.4] [1.8] [1.6] - [0.8] [0.7] [<0.1] - [0.6]Amphipoda - (0.1) (1.3) (1.3) - - - - - (0.2)Decapoda - - (0.4) (0.3) - (0.8) (0.7) (<0.1) - (0.4)
Palaemonetes pugio - - - 0.3 - - - - - <0.1Ovalipes ocellatus - - - - - 0.8 - - - 0.2Decapoda unid. - - 0.4 <0.1 - <0.1 0.7 <0.1 - 0.2
Crustacea unid. - (0.3) (0.1) (<0.1) - - - - - (<0.1)OSTEICHTHYES [100.0] [90.6] [86.7] [89.9] [80.7] [83.3] [39.9] [38.2] [78.8] [58.8]
Batrachoidiformes - - 0.6 13.7 2.9 - - - - 1.0Brevoortia tyrannus - - - - - 11.1 - - - 2.3Clupea harengus - - - 2.3 - - - - - 0.1Etrumeus teres - - 15.9 11.7 14.8 34.4 0.9 2.0 - 11.3Clupeidae - <0.1 2.7 - - - - - - 0.2Anchoa hepsetus - 23.1 10.3 1.1 4.3 2.5 - - - 2.0Anchoa mitchilli - - 2.0 1.8 - 0.2 - - - 0.3Engraulidae - 11.3 11.0 4.3 0.2 1.7 - 0.3 - 1.7Myctophidae - - 3.5 - - - - - - 0.3Merluccius bilinearis - - - 4.0 5.7 - - - - 0.7Gadidae - - - 0.6 - - - 0.7 - 0.3Stenotomus chrysops - - 1.3 - 3.4 - 2.3 - - 0.7Ammodytes dubius - - <0.1 - - 0.4 5.8 <0.1 - 0.8Scomber scombrus - - - - - 0.4 - - - 0.1Thunnus thynnus - - - 1.8 - - - - - 0.1Peprilus triacanthus - - 15.6 14.2 6.8 6.2 9.3 3.1 22.5 6.5Sebastes fasciatus - - - 4.7 - - - - - 0.2Myoxocephalus octodecemsp. - - - - - - - 3.7 - 1.6Cynoscion regalis - - - - - - - 0.2 - 0.1Leiostomus xanthurus - - - 0.7 - - - - - <0.1Prionotus sp. - - - - - 1.7 - - - 0.4Pleuronectiformes - - - - 6.6 - 17.2 - - 2.7Osteichthyes unid. 100.0 56.2 23.8 29.0 36.0 24.7 4.4 28.2 56.3 25.4
ANIMAL REMAINS AND MISC. - [0.5] [0.4] - [<0.1] [0.2] [1.7] [0.1] - [0.1]
Number sampled 9 81 239 71 26 49 39 50 4 568Number empty 7 28 76 22 1 5 9 6 1 155Mean stomach content (g) 0.144 0.824 3.572 7.025 35.455 42.650 31.381 89.488 13.811 17.933Mean fish length (cm) 10 16 25 34 45 54 65 74 84 35

Page 96
Table B-38b. Diet composition and sampling data for bluefish by geographic area. (Samples gathered during 1977-80. Data expressed aspercentage of stomach content by weight. Squared brackets indicate major taxon subtotal; parentheses indicate minor taxonsubtotal.)
Geographic Area Offshore Inshore Inshore
Southern South South North Middle New Georges of Cape of Cape of Cape
Stomach Contents Atlantic England Bank Hatteras Hatteras Hatteras
MOLLUSCA [1.3] [95.3] [66.1] - [4.5] [22.2]Cephalopoda (1.3) (95.3) (65.8) - (4.5) (22.2)
Illex sp. - 72.9 54.8 - - 0.3Loligo pealeii - - - - - 7.0Loligo sp. - 11.2 8.1 - 3.3 12.9Cephalopoda unid. 1.3 11.2 2.9 - 1.2 2.0
Mollusca unid. - - (0.3) - (<0.1) (<0.1)POLYCHAETA - - - - [0.5] [0.8]
Ophioglycera gigantea - - - - - 0.6Polychaeta unid. - - - - 0.5 0.2
CRUSTACEA - - [<0.1] - [1.8] [0.7]Amphipoda - - - - - (0.3)Decapoda - - (<0.1) - (1.6) (0.4)
Palaemonetes pugio - - - - 0.4 -Ovalipes ocellatus - - - - - 0.3Decapoda unid. - - <0.1 - 1.2 0.1
Crustacea unid. - - - - (0.2) (<0.1)OSTEICHTHYES [98.1] [4.6] [33.9] [100.0] [92.3] [75.5]
Batrachoidiformes - - - - 1.2 1.7Brevoortia tyrannus - - - - - 4.1Clupea harengus - - - - - 0.2Etrumeus teres 89.9 - 0.9 - - 19.3Clupeidae 3.8 - - - 3.0 0.1Anchoa hepsetus - - - - 19.5 2.2Anchoa mitchilli - - - - 4.0 0.3Engraulidae - - - - 11.6 2.2Myctophidae - - - - - 0.5Merluccius bilinearis - - - - - 1.3Gadidae - - 0.9 - - <0.1Stenotomus chrysops - - - - - 1.3Ammodytes dubius - - 2.1 - 0.2 0.1Scomber scombrus - - - - - 0.2Thunnus thynnus - - - - - 0.2Peprilus triacanthus - - - - 5.8 11.4Sebastes fasciatus - - - - - 0.4Myoxocephalus octodecemspinosus - - 4.7 - - -Cynoscion regalis - - - - - 0.2Leiostomus xanthurus - - - - - <0.1Prionotus sp. - - - - - 0.7Pleuronectiformes - - 0.4 - - 4.6Osteichthyes unid. 4.4 4.6 24.9 100.0 47.0 24.5
ANIMAL REMAINS AND MISC. [0.6] [0.1] [<0.1] - [0.9] [0.8]
Number sampled 3 5 58 1 136 365Number empty 0 0 9 0 49 97Mean stomach content (g) 12.782 103.849 60.804 117.095 2.853 15.333Mean fish length (cm) 40 60 70 77 26 33

Page 97
Table B-39. Diet composition and sampling data for longspine porgy by fish length category. (Samples gathered during1977-80. Data expressed as percentage of stomach content by weight. Squared brackets indicate major taxonsubtotal; parentheses indicate minor taxon subtotal.)
Length Category (cm) Stomach Contents 6-10 11-15 16-20 Total
HYDROZOA - [0.7] - [0.4]PLATYHELMINTHES - - [0.4] [0.1]NEMATODA [0.1] [0.2] - [0.1]CHAETOGNATHA - [0.4] - [0.3]MOLLUSCA - - [5.7] [1.0]
Bivalvia - - 1.3 0.2Cephalopoda - - 4.4 0.8
POLYCHAETA [3.0] [10.5] [25.9] [11.3]Maldanidae - 1.6 6.3 2.0Lumbrineris tenuis - - 0.9 0.2Glycera capitata - - 0.7 0.1Glyceridae - 2.4 0.1 1.4Nephtyidae 2.6 0.4 - 0.9Nereidae 0.2 0.3 - 0.2Sthenelais sp. - 0.5 - 0.3Polychaeta unid. 0.2 5.3 17.9 6.2
CRUSTACEA [42.1] [30.8] [1.9] [28.8]Copepoda - (5.8) (0.1) (3.4)Amphipoda - (1.4) (0.5) (1.0)
Ampelisca sp. - 0.6 - 0.3Unciola sp. - <0.1 - 0.1Melita dentata - - 0.1 <0.1Gammaridea - - 0.4 0.1Amphipoda unid. - 0.8 - 0.5
Mysidacea (0.2) (0.1) (1.2) (0.5)Heteromysis formosa - 0.1 1.2 0.3Mysis mixta 0.2 - - 0.1Mysidacea unid. - <0.1 - 0.1
Euphausiacea - (3.7) - (2.2)Decapoda (41.9) (19.7) (0.1) (21.6)
Lucifer faxoni 8.1 3.0 - 3.7Sergestidae - 1.3 - 0.7Pagurus sp. - 1.5 - 0.9Shrimp unid. 2.6 1.3 - 1.4Decapoda larvae 10.8 2.9 0.1 4.3Decapoda unid. 20.4 9.7 - 10.6
Crustacea unid. - (0.1) - (0.1)OSTEICHTHYES [8.2] [0.8] [2.2] [2.9]ANIMAL REMAINS [45.4] [55.7] [47.9] [51.5]SAND [1.2] [0.9] [16.0] [3.6]
Number sampled 5 46 21 72Number empty 0 25 8 33Mean stomach content (g) 0.194 0.050 0.033 0.055Mean fish length (cm) 10 13 16 14

Page 98
Table B-40a. Diet composition and sampling data for scup by fish length category. (Samples gathered during 1977-80. Data expressed aspercentage of stomach content by weight. Squared brackets indicate major taxon subtotal; parentheses indicate minor taxonsubtotal.)
Length Category (cm) Stomach Contents 6-10 11-15 16-20 21-25 26-30 31-35 Total
CNIDARIA [<0.1] - [24.9] [11.0] [3.5] - [8.2]Anthozoa <0.1 - - 0.9 3.5 - 1.2Ceriantharia - - 24.9 10.1 - - 7.0
RHYNCHOCOELA - - - [4.8] [2.8] - [2.0]CEPHALOPODA - - [0.2] [6.6] [25.6] [16.9] [11.8]
Illex sp. - - - - 25.3 13.2 9.3Loligo pealeii - - - - - 3.7 0.7Cephalopoda unid. - - 0.2 6.6 0.3 - 1.8
POLYCHAETA [40.9] [61.3] [26.5] [26.9] [9.3] [4.4] [21.0]Lumbrineris fragilis - 3.9 0.6 - 1.4 - 0.7Lumbrineridae 16.6 8.7 0.9 1.4 0.3 <0.1 2.0Pherusa affinis - 5.9 0.3 0.2 - - 0.5Pherusa sp. - - 1.4 2.7 0.2 - 1.0Flabelligeridae 1.0 - 1.8 1.8 0.3 - 0.9Ophioglycera gigantea - - 2.8 4.6 - - 1.7Nephtyidae 2.5 0.1 7.3 8.3 1.0 - 3.8Sabellidae 1.6 0.2 1.3 0.8 <0.1 - 0.6Ampharetidae 3.8 0.3 0.6 1.8 1.1 - 1.1Terebellidae 3.2 10.6 <0.1 0.2 <0.1 - 0.5Polychaeta unid. 12.2 31.6 9.5 5.1 5.0 4.4 8.2
CRUSTACEA [41.7] [13.4] [20.3] [30.4] [19.0] [2.7] [20.4]Amphipoda (8.5) (1.9) (5.5) (21.3) (2.6) (1.2) (8.2)
Gammarus annulatus - 0.2 - 16.3 - - 4.3Leptocheirus pinguis 3.4 0.1 1.9 0.8 0.3 - 0.8Aeginina longicornis 1.7 - 1.3 0.4 - - 0.4Amphipoda unid. 3.4 1.6 2.3 3.8 2.3 1.2 2.7
Mysidacea (29.4) (5.7) (<0.1) - - - (1.8)Neomysis americana 29.4 5.7 <0.1 - - - 1.8
Decapoda (1.9) (4.4) (13.1) (6.9) (9.2) (1.5) (7.3)Crangon septemspinosa 1.9 - 1.0 0.1 - - 0.3Munida sp. - - - - 2.1 1.5 0.9Paguridae - 2.1 0.2 0.4 - - 0.2Cancer irroratus - - 10.2 6.2 5.6 - 4.9Cancridae - - 1.6 0.1 - - 0.3Decapoda unid. <0.1 2.3 0.1 0.1 1.5 <0.1 0.7
Crustacea unid. (1.9) (1.4) (1.7) (2.2) (7.2) (<0.1) (3.1)UROCHORDATA - - [6.7] [0.6] - - [1.3]
Oikopleura sp. - - 6.7 0.6 - - 1.3OSTEICHTHYES [0.3] [0.3] [8.6] [<0.1] [30.4] [74.3] [23.5]
Ammodytes dubius - - 3.1 - 29.9 68.4 21.2Peprilus triacanthus - - - - - 5.8 1.1Osteichthyes larvae - - 4.9 <0.1 - <0.1 0.9Osteichthyes unid. 0.3 0.3 0.6 - 0.5 0.1 0.3
ANIMAL REMAINS AND MISC. [17.1] [25.0] [12.8] [19.7] [9.4] [1.7] [11.8]
Number sampled 114 91 122 63 40 8 438Number empty 36 19 53 26 16 2 152Mean stomach content (g) 0.056 0.083 0.185 0.531 0.881 2.930 0.294Mean fish length (cm) 8 12 17 22 27 32 16

Page 99
Table B-40b. Diet composition and sampling data for scup by geographic area. (Samples gathered during 1977-80. Data expressed aspercentage of stomach content by weight. Squared brackets indicate major taxon subtotal; parentheses indicate minor taxonsubtotal.)
Geographic Area Offshore Inshore Inshore
Southern South South North Middle New of Cape of Cape of Cape
Stomach Contents Atlantic England Hatteras Hatteras Hatteras
CNIDARIA - [6.5] - - [9.4]Anthozoa - 6.5 - - -Ceriantharia - - - - 9.4
RHYNCHOCOELA - [10.8] - - -CEPHALOPODA - - - - [15.8]
Illex sp. - - - - 12.5Loligo pealeii - - - - 0.9Cephalopoda unid. - - - - 2.4
POLYCHAETA [52.5] [34.0] - [18.5] [14.8]Lumbrineris fragilis 7.5 - - - 0.4Lumbrineridae 1.5 6.9 - 2.6 0.7Pherusa affinis - - - - 0.6Pherusa sp. - 3.9 - - 0.3Flabelligeridae - 2.1 - - 0.7Ophioglycera gigantea - - - - 2.3Nephtyidae 0.7 4.0 - - 4.0Sabellidae 0.3 2.7 - 1.9 -Ampharetidae 0.3 5.6 - - <0.1Terebellidae 4.9 0.3 - - <0.1Polychaeta unid. 37.3 8.5 - 14.0 5.8
CRUSTACEA [17.1] [12.2] - [4.9] [22.3]Amphipoda (0.1) (7.0) - (2.0) (8.8)
Gammarus annulatus - - - - 5.7Leptocheirus pinguis - 1.9 - - 0.6Amphipoda unid. 0.1 5.1 - 2.0 2.5
Mysidacea - (0.5) - - (2.3)Neomysis americana - 0.5 - - 2.3
Decapoda (17.0) (2.7) - (2.0) (7.7)Crangon septemspinosa - <0.1 - - 0.4Munida sp. 17.0 - - - -Paguridae - 0.3 - 2.0 0.2Cancer irroratus - - - - 6.6Decapoda unid. - 2.4 - - 0.5
Crustacea unid. (<0.1) (2.0) - (0.9) (3.5)UROCHORDATA [26.1] - - - -
Oikopleura sp. 26.1 - - - -OSTEICHTHYES - [0.8] - [56.9] [30.0]
Ammodytes dubius - - - - 28.4Peprilus triacanthus - - - - 1.4Osteichthyes larvae - - - 56.9 <0.1Osteichthyes unid. - 0.8 - - 0.2
ANIMAL REMAINS AND MISC. [4.3] [35.7] [100.0] [19.7] [7.7]
Number sampled 55 111 5 29 238Number empty 10 46 0 3 93Mean stomach content (g) 0.119 0.217 0.008 0.066 0.403Mean fish length (cm) 17 16 14 13 16

Page 100
Table B-41a. Diet composition and sampling data for weakfish by fish length category. (Samples gathered during 1977-80. Data expressedas percentage of stomach content by weight. Squared brackets indicate major taxon subtotal; parentheses indicate minor taxonsubtotal.)
Length Category (cm) Stomach Contents 1-10 11-20 21-30 31-40 41-50 51-60 61-70 >70 Total
CEPHALOPODA - - [16.2] [<0.1] [0.7] [0.7] [0.4] [25.3] [7.8]Illex illecebrosus - - 15.3 - - - - - 2.7Loligo sp. - - - - - - - 25.3 4.7Cephalopoda unid. - - 0.9 <0.1 0.7 0.7 0.4 - 0.4
POLYCHAETA - [1.5] [0.5] - [<0.1] [3.2] - - [1.0]CRUSTACEA [95.8] [74.3] [12.3] [5.9] [18.0] [17.4] [13.4] [13.9] [14.9]
Copepoda (1.7) - - - - - - - (<0.1)Amphipoda (<0.1) (0.3) (<0.1) (0.6) (1.6) (2.6) (<0.1) - (0.9)Mysidacea (61.7) (63.2) (6.5) (3.2) (15.6) - (0.5) - (3.3)
Mysidopsis bigelowi 9.0 6.8 3.7 <0.1 <0.1 - - - 0.8Neomysis americana 40.2 46.8 2.8 3.2 15.6 - 0.5 - 2.4Mysidacea unid. 12.5 9.6 <0.1 - - - - - 0.1
Decapoda (24.5) (10.5) (5.5) (2.1) (0.8) (14.8) (12.9) (13.2) (10.4)Acetes sp. 3.3 5.5 1.5 0.2 - - - - 0.3Dichelopandalus leptocerus - - 1.4 - - 11.6 <0.1 0.6 3.4Crangon septemspinosa 16.2 3.4 0.4 1.1 0.2 2.7 2.5 - 1.5Ovalipes ocellatus - - <0.1 - - 0.5 9.8 12.0 4.4Decapoda unid. 5.0 1.6 2.2 0.8 0.6 - 0.6 0.6 0.8
Crustacea unid. (7.9) (0.3) (0.3) (<0.1) (<0.1) (<0.1) (<0.1) (0.7) (0.3)OSTEICHTHYES [3.4] [23.5] [70.4] [94.1] [81.3] [78.2] [85.0] [60.8] [76.0]
Etrumeus teres - - 2.6 - - - 4.9 - 1.5Clupeidae - - 11.2 - - - - - 2.0Anchoa hepsetus - - 13.6 1.5 - - 5.1 - 3.6Anchoa mitchilli - - 4.9 12.6 79.9 9.1 6.8 39.6 17.8Anchoa sp. - 8.4 2.8 - - - - - 0.6Engraulidae - - 1.8 2.3 - - 1.2 - 0.8Myctophidae - - - - - - - 3.1 0.6Gadus morhua - - 0.1 - - - - - <0.1Merluccius bilinearis - - <0.1 - - - - - <0.1Gadidae - - - - - - 5.6 - 1.1Ammodytes dubius - - - - - 13.4 0.1 - 3.6Caranx hippos - - - 20.8 - - - - 2.1Carangidae - - 5.9 - - - - - 1.0Cynoscion regalis - - - 9.8 - - - - 1.0Peprilus triacanthus - - 0.2 - - - 4.9 2.6 1.5Macrozoarces americanus - - - 1.1 - - - - 0.1Citharichthys arctifrons - - - - - 2.0 46.5 - 10.0Scophthalmus aquosus - 1.0 - - - - - - <0.1Bothidae - - - - - - - 7.5 1.4Pleuronectiformes - - <0.1 - - - - - <0.1Osteichthyes larvae 3.4 4.2 0.3 - - - - - 0.1Osteichthyes unid. - 9.9 27.0 46.0 1.4 53.7 9.9 8.0 27.2
ANIMAL REMAINS AND MISC. [0.8] [0.7] [0.6] [<0.1] [<0.1] [0.5] [1.2] - [0.3]
Number sampled 32 75 196 44 15 15 13 3 393Number empty 4 9 54 9 0 0 2 0 78Mean stomach content (g) 0.050 0.218 1.302 3.393 5.509 25.746 22.916 91.206 3.722Mean fish length (cm) 9 15 25 33 45 54 66 73 26

Page 101
Table B-41b. Diet composition and sampling data for weakfish by geographic area. (Samples gathered during 1977-80.Data expressed as percentage of stomach content by weight. Squared brackets indicate major taxon subtotal;parentheses indicate minor taxon subtotal.)
Geographic Area Inshore Inshore
Southern South North Middle New of Cape of Cape
Stomach Contents Atlantic England Hatteras Hatteras
CEPHALOPODA - - [19.0] [5.9]Illex illecebrosus - - 19.0 -Loligo sp. - - - 5.5Cephalopoda unid. - - <0.1 0.4
POLYCHAETA - - [0.1] [1.0]CRUSTACEA - - [6.2] [16.0]
Amphipoda - - (<0.1) (1.0)Mysidacea - - (<0.1) (3.7)
Mysidopsis bigelowi - - <0.1 0.9Neomysis americana - - - 2.7Mysidacea unid. - - <0.1 0.1
Decapoda - - (6.2) (11.1)Acetes sp. - - 2.3 <0.1Dichelopandalus leptocerus - - 1.7 3.7Crangon septemspinosa - - - 1.7Ovalipes ocellatus - - 0.1 5.1Decapoda unid. - - 2.1 0.6
Crustacea unid. - - (<0.1) (0.2)OSTEICHTHYES - [100.0] [74.1] [76.3]
Etrumeus teres - - - 1.7Clupeidae - - 4.6 1.5Anchoa hepsetus - - 15.6 1.6Anchoa mitchilli - - 4.6 20.0Anchoa sp. - - 4.1 -Engraulidae - - 0.2 0.9Myctophidae - - - 0.7Gadus morhua - - 0.2 -Merluccius bilinearis - - 0.1 -Gadidae - - - 1.3Ammodytes dubius - - - 4.1Caranx hippos - - - 2.5Carangidae - - 7.3 -Cynoscion regalis - - - 1.2Peprilus triacanthus - - <0.1 1.8Macrozoarces americanus - - 0.8 -Citharichthys arctifrons - - - 11.6Scophthalmus aquosus - - - <0.1Bothidae - - - 1.6Pleuronectiformes - - - <0.1Osteichthyes larvae - - 0.4 <0.1Osteichthyes unid. - 100.0 36.2 25.8
ANIMAL REMAINS AND MISC. [100.0] - [0.6] [0.8]
Number sampled 1 1 111 280Number empty 0 0 21 56Mean stomach content (g) 0.072 0.017 1.855 4.489Mean fish length (cm) 55 70 26 26

Page 102
Table B-42a. Diet composition and sampling data for spot by fish length category. (Samples gathered during 1977-80. Data expressed aspercentage of stomach content by weight. Squared brackets indicate major taxon subtotal; parentheses indicate minor taxonsubtotal.)
Length Category (cm) Stomach Contents 6-10 11-15 16-20 21-25 26-30 Total
MOLLUSCA [59.9] [13.9] [10.3] [15.4] [12.4] [11.6]Bivalvia (59.9) (13.0) (5.5) (0.6) - (5.7)
Tellina sp. - - 4.5 - - 3.4Bivalvia unid. 59.9 13.0 1.0 0.6 - 2.3
Mollusca unid. - (0.9) (4.8) (14.8) (12.4) (5.9)POLYCHAETA [36.7] [51.6] [60.3] [23.9] - [53.9]
Archiannelida - 0.4 13.3 - - 10.1Maldanidae - - <0.1 1.7 - 0.2Onuphis sp. - - 0.6 - - 0.4Aglaophamus circinata - - 0.3 1.1 - 0.4Nephtyidae - - 2.0 - - 1.5Cirratulidae - <0.1 1.2 0.1 - 0.9Spio sp. - - - 16.5 - 2.2Spionidae - 7.7 1.7 <0.1 - 2.2Asabellides oculata - 14.8 17.6 - - 14.5Ampharetidae - 3.5 <0.1 - - 0.3Polychaeta unid. 36.7 25.2 23.6 4.5 - 21.2
CRUSTACEA [1.6] [17.6] [11.1] [7.8] [87.6] [13.9]Copepoda - (7.7) (0.3) (2.2) - (1.2)Stomatopoda - - - - (62.3) (1.6)Cumacea - (2.0) (3.1) (0.1) (24.7) (3.2)
Oxyurostylis smithi - 1.9 0.7 - 24.7 1.3Cumacea unid. - 0.1 2.4 0.1 - 1.9
Isopoda (1.6) (0.4) (<0.1) - - (<0.1)Amphipoda - (1.6) (3.6) (3.4) - (3.7)
Ampelisca spp. - 1.4 1.6 0.1 - 1.5Unciola irrorata - - 0.5 3.1 - 0.8Amphipoda unid. - 0.2 1.5 0.2 - 1.4
Mysidacea - (0.8) (0.4) (0.9) - (0.5)Neomysis americana - 0.8 0.4 0.9 - 0.5
Decapoda - (4.7) (2.4) (1.1) (0.6) (2.6)Acetes americanus - 0.7 0.6 - - 0.5Crangon septemspinosa - 4.0 1.4 <0.1 - 1.4Decapoda unid. - <0.1 0.4 1.1 0.6 0.7
Crustacea unid. - (0.4) (1.3) (0.1) - (1.1)ECHINODERMATA - - [<0.1] [0.5] - [0.1]OSTEICHTHYES - [1.3] [3.1] [2.7] - [2.9]
Anchoa hepsetus - - 1.5 - - 1.1Engraulidae - 0.8 0.8 - - 0.7Paralichthys dentatus - - <0.1 - - <0.1Osteichthyes larvae - 0.4 0.2 1.3 - 0.4Osteichthyes unid. - 0.1 0.6 1.4 - 0.7
ANIMAL REMAINS AND MISC. [1.8] [15.6] [15.2] [49.7] - [17.6]
Number sampled 9 101 290 39 3 442Number empty 3 10 47 8 1 69Mean stomach content (g) 0.049 0.044 0.149 0.190 0.496 0.129Mean fish length (cm) 10 13 17 21 26 16

Page 103
Table B-42b. Diet composition and sampling data for spot by geographic area. (Samples gathered during1977-80. Data expressed as percentage of stomach content by weight. Squared bracketsindicate major taxon subtotal; parentheses indicate minor taxon subtotal.)
Geographic Area Inshore Inshore South North
Middle of Cape of CapeStomach Contents Atlantic Hatteras Hatteras
MOLLUSCA - [21.1] [7.9]Bivalvia - (0.3) (7.9)
Tellina sp. - - 4.8Bivalvia unid. - 0.3 3.1
Mollusca unid. - (20.8) -POLYCHAETA [1.7] [3.5] [73.2]
Archiannelida - <0.1 14.2Maldanidae - <0.1 0.3Onuphis sp. - 0.4 0.4Aglaophamus circinata - - 0.5Nephtyidae - 0.3 2.0Cirratulidae - - 1.3Spio sp. - - 3.0Spionidae - <0.1 2.6Asabellides oculata - - 20.3Ampharetidae - - 0.4Polychaeta unid. 1.7 2.8 28.2
CRUSTACEA [6.0] [22.7] [9.1]Copepoda - (3.1) (0.3)Stomatopoda - (5.7) -Cumacea - (10.1) (0.5)
Oxyurostylis smithi - 4.7 -Cumacea unid. - 5.4 0.5
Amphipoda - (1.1) (4.1)Ampelisca spp. - <0.1 2.0Unciola irrorata - - 1.1Amphipoda unid. - 1.1 1.0
Mysidacea - - (0.6)Neomysis americana - - 0.6
Decapoda (2.6) (2.5) (2.3)Acetes americanus - 1.7 <0.1Crangon septemspinosa - - 2.0Decapoda unid. 2.6 0.8 0.3
Crustacea unid. (3.4) (0.2) (1.3)ECHINODERMATA - [0.4] -OSTEICHTHYES - [9.9] [0.1]
Anchoa hepsetus - 4.0 -Engraulidae - 2.4 -Paralichthys dentatus - - <0.1Osteichthyes larvae - 1.3 -Osteichthyes unid. - 2.2 0.1
ANIMAL REMAINS AND MISC. [92.3] [42.4] [9.7]
Number sampled 4 221 218Number empty 0 48 21Mean stomach content (g) 0.029 0.073 0.186Mean fish length (cm) 16 18 16

Page 104
Table B-43a. Diet composition and sampling data for southern kingfish by fish length category. (Samples gathered during 1977-80. Dataexpressed as percentage of stomach content by weight. Squared brackets indicate major taxon subtotal; parentheses indicateminor taxon subtotal.)
Length Category (cm) Stomach Contents 11-15 16-20 21-25 26-30 31-35 Total
ANTHOZOA - - [0.8] - - [0.3]RHYNCHOCOELA - [1.6] [0.3] - - [0.1]BIVALVIA - - [4.9] [2.7] - [3.2]
Solenidae - - - 0.7 - 0.4Bivalvia unid. - - 4.9 2.0 - 2.8
POLYCHAETA [26.1] [33.6] [13.0] [9.4] - [10.3]Arabellidae - - 1.3 - - 0.5Diopatra cuprea - - 0.6 - - 0.2Glycera americana - - 8.9 9.0 - 7.8Glyceridae - - 1.3 - - 0.6Phyllodocidae - 0.7 - <0.1 - <0.1Polychaeta unid. 26.1 32.9 0.9 0.4 - 1.2
CRUSTACEA [73.9] [26.6] [39.0] [73.2] [100.0] [63.5]Stomatopoda - - (0.6) (5.0) - (2.9)
Squilla neglecta - - - 2.6 - 1.4Stomatopoda unid. - - 0.6 2.4 - 1.5
Cumacea - (0.5) - - - (<0.1)Amphipoda - (1.8) (0.1) (<0.1) - (0.1)Decapoda (69.6) (18.9) (10.9) (63.0) (100.0) (48.2)
Acetes americanus - - 0.2 1.0 - 0.6Crangon septemspinosa - - 2.7 0.2 - 1.0Pagurus sp. - - 0.8 - - 0.3Paguridae - 0.8 - - - <0.1Ogyrides sp. - 5.0 - - - 0.1Parapenaeus sp. - - 2.3 - - 0.8Pinnotheridae - 1.5 0.2 - - 0.1Ovalipes ocellatus - 1.5 - - - <0.1Portunus gibbesii - - - 17.1 - 9.0Portunus sp. - - 1.3 3.0 - 2.0Portunidae - - - 1.0 - 0.5Albunea paretii - - - 6.1 - 3.2Albunea sp. - - - 2.8 100.0 12.5Crab unid. 69.6 1.4 1.2 - - 0.5Shrimp unid. - 4.6 <0.1 - - 0.1Decapoda unid. - 4.1 2.2 31.8 - 17.5
Crustacea unid. (4.3) (5.4) (27.4) (5.2) - (12.3)OSTEICHTHYES - [25.4] [27.7] [10.8] - [15.9]
Anchoa hepsetus - - 17.1 - - 5.9Pleuronectiformes - - - 1.8 - 1.0Osteichthyes larvae - - 0.1 <0.1 - 0.1Osteichthyes unid. - 25.4 10.5 9.0 - 8.9
ANIMAL REMAINS AND MISC. - [12.8] [14.3] [1.8] - [5.6]SAND - - - [2.1] - [1.1]
Number sampled 2 19 36 30 1 88Number empty 0 4 9 5 0 18Mean stomach content (g) 0.012 0.052 0.444 0.813 5.123 0.529Mean fish length (cm) 15 18 23 27 32 23

Page 105
Table B-43b. Diet composition and sampling data for southern kingfish by geographicarea. (Samples gathered during 1977-80. Data expressed as percentageof stomach content by weight. Squared brackets indicate major taxonsubtotal; parentheses indicate minor taxon subtotal.)
Geographic Area Inshore Inshore South Northof Cape of Cape
Stomach Contents Hatteras Hatteras
ANTHOZOA - [0.8]RHYNCHOCOELA [0.2] -BIVALVIA [1.0] [6.8]
Solenidae - 1.0Bivalvia unid. 1.0 5.8
POLYCHAETA [2.0] [24.6]Arabellidae - 1.2Diopatra cuprea 0.3 -Glycera americana - 21.5Glyceridae - 1.7Phyllodocidae - <0.1Polychaeta unid. 1.7 0.2
CRUSTACEA [72.0] [47.9]Stomatopoda (2.1) (4.1)
Squilla neglecta 2.1 -Stomatopoda unid. - 4.1
Cumacea (<0.1) -Amphipoda (<0.1) (<0.1)Decapoda (51.1) (43.1)
Acetes americanus 0.6 0.6Crangon septemspinosa - 2.9Pagurus sp. - 0.8Paguridae <0.1 -Ogyrides sp. 0.2 -Parapenaeus sp. 1.2 -Pinnotheridae 0.1 -Ovalipes ocellatus <0.1 -Portunus gibbesii 14.1 -Portunus sp. 0.7 4.3Albunea paretii 0.4 0.7Albunea sp. 18.9 10.0Crab unid. 0.2 1.0Shrimp unid. 0.2 <0.1Decapoda unid. 14.5 22.8
Crustacea unid. (18.8) (0.7)OSTEICHTHYES [21.0] [6.4]
Anchoa hepsetus 9.2 -Pleuronectiformes 1.5 -Osteichthyes larvae 0.1 -Osteichthyes unid. 10.2 6.4
ANIMAL REMAINS AND MISC. [2.1] [13.5]SAND [1.7] [<0.1]
Number sampled 49 39Number empty 8 10Mean stomach content (g) 0.605 0.431Mean fish length (cm) 22 24

Page 106
Table B-44a. Diet composition and sampling data for northern kingfish by fish length category. (Samples gathered during 1977-80. Dataexpressed as percentage of stomach content by weight. Squared brackets indicate major taxon subtotal; parentheses indicateminor taxon subtotal.)
Length Category (cm) Stomach Contents 6-10 11-15 16-20 21-25 26-30 31-35 Total
MOLLUSCA - - - [1.2] [0.1] - [0.3]POLYCHAETA - [3.6] [17.8] [10.5] [1.9] - [3.8]
Lumbrineris fragilis - - - - 0.7 - 0.5Onuphidae - - - 4.4 1.0 - 1.5Glyceridae - 2.4 6.6 - - - 0.2Nephtys bucera - - - 1.1 - - 0.2Nephtys sp. - - 0.3 2.0 0.2 - 0.5Nephtyidae - 1.2 - 0.7 - - 0.1Polychaeta unid. - - 10.9 2.3 <0.1 - 0.8
CRUSTACEA [100.0] [74.9] [76.3] [70.8] [87.4] [92.3] [84.8]Stomatopoda - - - (5.6) - - (1.0)
Squilla empusa - - - 5.6 - - 1.0Amphipoda - (0.6) (10.2) (3.1) (<0.1) - (0.9)
Ampelisca verrilli - - 4.2 0.4 <0.1 - 0.2Gammarus annulatus - - 5.4 2.3 - - 0.6Amphipoda unid. - 0.6 0.6 0.4 - - 0.1
Mysidacea - (1.8) (0.3) (<0.1) - - (<0.1)Decapoda (100.0) (72.5) (62.0) (61.7) (87.4) (92.3) (82.7)
Acetes americanus - - 0.2 2.2 0.1 - 0.5Acetes sp. - - <0.1 0.7 - - 0.1Penaeidae - - - 1.4 - - 0.3Callianassa setimanus 26.0 - - - - - 0.1Hippolytidae - - - 0.9 1.3 - 1.0Crangon septemspinosa 24.1 - 27.0 1.8 <0.1 - 1.3Cancer irroratus - - - 1.9 - - 0.3Ovalipes ocellatus - - - - 16.8 - 10.9Portunus gibbesii - - - 6.2 - - 1.1Portunus spinicarpus - - - 1.4 - - 0.3Portunus sp. - - - 0.6 1.2 7.8 1.9Portunidae - - - 0.5 41.5 53.2 34.0Ogyrides sp. - - 5.9 0.6 - - 0.3Pinnixa chaetopterana 49.9 65.9 10.8 - - - 0.7Albunea paretii - - - 18.4 13.4 18.3 14.5Decapoda unid. - 6.6 18.1 25.1 13.1 13.0 15.4
Crustacea unid. - - (3.8) (0.4) - - (0.2)OSTEICHTHYES - - [1.5] [16.0] [8.1] [7.7] [9.4]
Ophichthus cruentifer - - - - 2.1 7.7 2.4Engraulidae - - - 10.9 5.6 - 5.7Bothidae - - 0.8 <0.1 - - <0.1Osteichthyes larvae - - - 1.0 - - 0.2Osteichthyes unid. - - 0.7 4.1 0.4 - 1.1
ANIMAL REMAINS AND MISC. - [21.5] [4.4] [1.5] [1.5] - [1.1]SAND - - - - [1.0] - [0.6]
Number sampled 1 2 14 32 27 2 78Number empty 0 0 1 1 2 1 5Mean stomach content (g) 0.361 0.083 0.189 0.498 2.104 5.699 1.119Mean fish length (cm) 10 14 17 23 27 32 23

Page 107
Table B-44b. Diet composition and sampling data for northern kingfish by geographic area. (Samples gatheredduring 1977-80. Data expressed as percentage of stomach content by weight. Squared bracketsindicate major taxon subtotal; parentheses indicate minor taxon subtotal.)
Geographic Area Offshore Inshore Inshore South South Northof Cape of Cape of Cape
Stomach Contents Hatteras Hatteras Hatteras
MOLLUSCA - [0.4] [<0.1]POLYCHAETA - [1.3] [14.4]
Lumbrineris fragilis - - 2.6Onuphidae - 1.0 3.7Glyceridae - - 1.1Nephtys bucera - - 1.1Nephtys sp. - <0.1 2.8Nephtyidae - - 0.7Polychaeta unid. - 0.3 2.4
CRUSTACEA - [92.1] [51.7]Stomatopoda - (1.3) -
Squilla empusa - 1.3 -Amphipoda - (<0.1) (4.6)
Ampelisca verrilli - <0.1 1.1Gammarus annulatus - - 3.2Amphipoda unid. - <0.1 0.3
Mysidacea - (<0.1) (<0.1)Decapoda - (90.8) (46.2)
Acetes sp. - 0.7 0.1Penaeidae - 0.3 -Callianassa setimanus - - 0.6Hippolytidae - 1.3 -Crangon septemspinosa - - 7.1Cancer irroratus - - 1.9Ovalipes ocellatus - 13.3 -Portunus gibbesii - 1.4 -Portunus spinicarpus - 0.3 -Portunus sp. - 2.2 0.6Portunidae - 41.5 -Ogyrides sp. - 0.3 -Pinnixa chaetopterana - - 3.7Albunea paretii - 17.7 -Decapoda unid. - 11.8 32.2
Crustacea unid. - (<0.1) (0.9)OSTEICHTHYES [100.0] [5.0] [27.9]
Ophichthus cruentifer - 2.9 -Engraulidae - 1.0 27.0Bothidae - <0.1 <0.1Osteichthyes larvae - 0.2 -Osteichthyes unid. 100.0 0.9 0.9
ANIMAL REMAINS AND MISC. - [0.4] [6.0]SAND - [0.8] -
Number sampled 1 43 34Number empty 0 3 2Mean stomach content (g) 0.118 1.664 0.461Mean fish length (cm) 29 24 22

Page 108
Table B-45. Diet composition and sampling data for Atlantic croaker by fish length category. (Samples gathered during 1977-80. Dataexpressed as percentage of stomach content by weight. Squared brackets indicate major taxon subtotal; parentheses indicate minortaxon subtotal.)
Length Category (cm) Stomach Contents 11-15 16-20 21-25 26-30 31-35 36-40 41-45 Total
CERIANTHARIA - - - [1.9] [1.4] - - [0.9]MOLLUSCA - [58.6] [11.2] [12.6] [16.3] [10.9] - [15.1]
Bivalvia - (58.6) (4.5) (11.1) (7.8) (10.9) - (9.9)Solenidae - - - 4.1 4.9 - - 2.6Bivalvia unid. - 58.6 4.5 7.0 2.9 10.9 - 7.3
Cephalopoda - - (6.7) (0.9) - - - (2.0)Mollusca unid. - - (<0.1) (0.6) (8.5) (<0.1) - (3.2)
POLYCHAETA - [8.6] [34.5] [55.1] [27.0] [50.6] [68.7] [37.4]Eunicidae - - - 2.0 1.7 - - 1.0Lumbrineris fragilis - - 5.4 2.4 4.8 9.5 - 4.7Lumbrineridae - - 0.1 4.2 1.1 - - 1.3Diopatra cuprea - - 1.8 2.5 0.5 - 16.5 1.4Pherusa affinis - - <0.1 0.2 2.7 0.8 - 1.1Glycera americana - - 14.0 19.6 1.7 0.2 - 8.5Glycera dibranchiata - - - 0.3 1.7 - - 0.7Glycera robusta - - - - - 8.5 - 0.9Spio sp. - 3.7 2.4 3.0 1.0 - - 1.8Spionidae - <0.1 4.2 3.5 2.7 22.5 - 5.3Polychaeta unid. - 4.9 6.6 17.4 9.1 9.1 52.2 10.7
CRUSTACEA [32.4] [9.3] [23.9] [10.5] [35.0] [16.6] [9.8] [23.7]Stomatopoda - - - (0.6) (29.0) - - (10.3)
Squilla empusa - - - - 28.8 - - 10.1Stomatopoda unid. - - - 0.6 0.2 - - 0.2
Mysidacea - - (<0.1) (2.0) (0.7) (0.3) - (0.7)Neomysis americana - - <0.1 2.0 0.7 0.3 - 0.7
Decapoda - (8.4) (23.4) (7.3) (4.3) (2.5) (3.7) (10.3)Hippolytidae - 0.6 3.6 - - - - 1.0Crangon septemspinosa - <0.1 0.1 2.1 0.5 1.9 - 0.9Cancridae - - 3.4 <0.1 0.2 0.3 - 1.1Pinnixa chaetopterana - 1.6 0.5 - - - - 0.2Ovalipes ocellatus - - 5.6 4.2 - - - 2.4Albunea paretii - - 2.1 - - - - 0.6Decapoda unid. - 6.2 8.1 1.0 3.6 0.3 3.7 4.1
Crustacea unid. (32.4) (0.9) (0.5) (0.6) (1.0) (13.8) (6.1) (2.4)HEMICHORDATA - [22.1] [13.7] - - - - [4.7]OSTEICHTHYES - [<0.1] [6.9] [15.0] [16.5] [14.7] [0.2] [12.5]
Anchoa mitchilli - - - 1.3 6.6 12.2 - 3.9Engraulidae - - - 6.0 4.3 2.5 - 3.0Peprilus triacanthus - - - - 0.2 - - 0.1Osteichthyes larvae - - 0.7 - <0.1 - - 0.2Osteichthyes unid. - <0.1 6.2 7.7 5.4 <0.1 0.2 5.3
ANIMAL REMAINS AND MISC. [43.3] [1.4] [9.6] [4.7] [3.0] [5.5] [21.3] [5.1]SAND AND ROCK [24.3] - [0.2] [0.2] [0.8] [1.7] - [0.6]
Number sampled 2 33 118 64 36 9 1 263Number empty 0 5 33 12 5 1 0 56Mean stomach content (g) 0.019 0.275 0.511 0.707 2.129 2.676 2.876 0.830Mean fish length (cm) 13 18 23 27 32 37 45 25

Page 109
Table B-46. Diet composition and sampling data for cunner by fish length category. (Samples gathered during 1977-80. Data expressed aspercentage of stomach content by weight. Squared brackets indicate major taxon subtotal; parentheses indicate minor taxonsubtotal.)
Length Category (cm) Stomach Contents <10 11-15 16-20 21-25 26-30 31-35 36-40 41-45 Total
MOLLUSCA - [1.0] [49.2] [28.5] - [41.4] - - [6.1]Polyplacophora - - - (0.2) - - - - (<0.1)Gastropoda - (1.0) - - - - - - (0.1)Bivalvia - - - (<0.1) - - - - (<0.1)
Cerastoderma pinnulatum - - - <0.1 - - - - <0.1Mollusca unid. - - (49.2) (28.3) - (41.4) - - (6.0)
ANNELIDA - [8.1] - [7.6] - - - - [1.1]Lepidonotus squamatus - - - 0.3 - - - - <0.1Polychaeta - 2.6 - 7.3 - - - - 0.8Annelida unid. - 5.5 - - - - - - 0.3
SIPUNCULA - - - [0.1] - - - - [<0.1]Phascolion strombi - - - 0.1 - - - - <0.1
CRUSTACEA [100.0] [33.5] [1.8] [4.8] [64.0] [58.3] [79.4] [99.3] [74.9]Cumacea - - (0.1) (0.1) - - - - (<0.1)
Diastylis quadrispinosa - - - 0.1 - - - - <0.1Diastylis sp. - - 0.1 - - - - - <0.1
Isopoda - - (0.8) (<0.1) - - - - (<0.1)Arcturidae - - 0.8 <0.1 - - - - <0.1
Amphipoda (100.0) (2.4) (0.9) (1.8) (<0.1) - - - (0.3)Ericthonius rubricornis - - <0.1 0.1 - - - - <0.1Unciola irrorata - - 0.3 - - - - - <0.1Unciola sp. - 2.4 - - - - - - 0.1Pleusymtes glaber 10.0 - - - - - - - <0.1Stenula sp. 90.0 - - - - - - - <0.1Aeginina longicornis - - - 0.5 - - - - 0.1Caprellidae - - - 0.2 - - - - <0.1Gammaridea - - 0.3 0.2 <0.1 - - - <0.1Amphipoda unid. - - 0.3 0.8 <0.1 - - - 0.1
Decapoda - (30.3) - (1.3) (52.5) (58.3) (75.7) (99.0) (72.0)Pandalus montagui - 30.3 - - - - - - 1.6Pagurus sp. - - - - - 21.3 - 16.7 9.3Cancer borealis - - - - 5.5 - - - 0.8Cancer irroratus - - - - 4.2 25.9 72.7 49.7 37.3Crab unid. - - - - - - 3.0 - 0.5Decapoda unid. - - - 1.3 42.8 11.1 - 32.6 22.5
Crustacea unid. - (0.8) - (1.6) (11.5) - (3.7) (0.3) (2.6)ECHINODERMATA - - - - [33.9] - - - [5.0]
Echinoidea - - - - 33.9 - - - 5.0UROCHORDATA - - - [12.4] - - - - [1.1]OSTEICHTHYES - - - - - - [11.5] - [1.8]
Pleuronectiformes - - - - - - 11.5 - 1.8ANIMAL REMAINS AND MISC. [<0.1] [52.1] [39.2] [39.4] - [0.3] - [0.1] [6.9]SAND AND ROCK - [5.3] [9.8] [7.2] [2.1] - [9.1] [0.6] [3.1]
Number sampled 8 9 2 5 10 6 10 4 54Number empty 6 5 1 0 3 3 6 1 25Mean stomach content (g) 0.001 0.489 0.723 1.469 1.217 0.875 1.324 9.810 1.539Mean fish length (cm) 6 13 17 23 27 33 38 43 25

Page 110
Table B-47a. Diet composition and sampling data for ocean pout by fish length category. (Samples gathered during 1977-80. Data expressedas percentage of stomach content by weight. Squared brackets indicate major taxon subtotal; parentheses indicate minor taxonsubtotal.)
Length Category (cm) Stomach Contents 1-10 11-20 21-30 31-40 41-50 51-60 >60 Total
MOLLUSCA - [8.6] [3.1] [14.5] [20.7] [1.7] [37.2] [19.3]Bivalvia - (8.6) (3.1) (11.6) (13.4) (1.5) (37.2) (17.3)
Pecten sp. - - - - - 1.1 - 0.4Placopecten magellanicus - - - - - <0.1 37.2 12.4Pectinidae - 8.6 - - - - - 0.1Cerastoderma pinnulatum - - 3.1 0.2 6.4 - - 1.5Bivalvia unid. - - - 11.4 7.0 0.4 - 2.9
Mollusca unid. - - - (2.9) (7.3) (0.2) - (2.0)POLYCHAETA - [65.6] [10.9] [3.9] [3.0] [0.7] [<0.1] [2.1]
Aphroditidae - - - 2.4 2.4 - - 0.8Cirratulidae - 56.9 - - - - - 0.5Polychaeta unid. - 8.7 10.9 1.5 0.6 0.7 <0.1 0.8
CRUSTACEA [100.0] [17.7] [25.0] [33.5] [29.8] [39.5] [4.1] [24.7]Isopoda - - (0.2) (2.3) (<0.1) (0.2) - (0.4)
Edotea triloba - - - 2.3 <0.1 - - 0.3Isopoda unid. - - 0.2 - - 0.2 - 0.1
Amphipoda (100.0) (15.8) (19.9) (7.0) (27.3) (32.0) (1.8) (18.1)Parathemisto sp. 100.0 - - - - - - <0.1Ampeliscidae - - - 0.1 0.6 0.4 0.2 0.4Ericthonius rubricornis - 0.6 1.8 - - <0.1 - <0.1Unciola irrorata - 6.7 16.9 0.6 20.0 11.2 1.6 8.9Leptocheirus pinguis - 5.9 - 1.8 1.6 19.9 <0.1 6.9Aeginina longicornis - - - 0.7 - - - 0.1Amphipoda unid. - 2.6 1.2 3.8 5.1 0.5 <0.1 1.8
Decapoda - (1.4) (3.7) (22.8) (2.5) (5.6) (2.3) (5.4)Dichelopandalus leptocerus - - - 0.9 - - - 0.1Paguridae - 1.4 3.7 - - - - <0.1Hyas coarctatus - - - - 0.2 5.2 - 1.7Cancer borealis - - - 21.9 2.3 - - 2.8Crab unid. - - - - - 0.4 2.3 0.8
Crustacea unid. - (0.5) (1.2) (1.4) (<0.1) (1.7) - (0.8)ECHINODERMATA - - [29.8] [44.7] [40.6] [49.7] [54.9] [48.3]
Echinoidea - - - - (<0.1) (8.2) (52.0) (20.0)Echinarachnius parma - - - - <0.1 7.3 36.7 14.6Echinoidea unid. - - - - - 0.9 15.3 5.4
Ophiuroidea - - (29.8) (44.7) (40.6) (39.7) (2.9) (27.7)Ophiopholis aculeata - - 23.5 4.1 0.9 0.6 1.9 1.7Ophiura sarsi - - 0.5 - 0.4 35.8 0.3 11.5Ophiuroidea unid. - - 5.8 40.6 39.3 3.3 0.7 14.5
Echinodermata unid. - - - - - (1.8) - (0.6)OSTEICHTHYES - - - [<0.1] [<0.1] - - [<0.1]ANIMAL REMAINS AND MISC. - [8.1] [16.4] [3.3] [3.4] [8.4] [3.1] [4.6]SAND AND ROCK - - [14.8] [0.1] [2.5] [<0.1] [0.7] [1.0]
Number sampled 1 13 10 20 18 19 13 94Number empty 0 1 2 5 4 6 3 21Mean stomach content (g) 0.004 0.105 0.184 0.802 1.979 2.598 4.018 1.665Mean fish length (cm) 5 16 26 35 45 54 68 41

Page 111
Table B-47b. Diet composition and sampling data for ocean pout by geographic area. (Samples gathered during 1977-80. Dataexpressed as percentage of stomach content by weight. Squared brackets indicate major taxon subtotal; parenthesesindicate minor taxon subtotal.)
Geographic Area Inshore
Southern North New Georges Gulf of Scotian of Cape
Stomach Contents England Bank Maine Shelf Hatteras
MOLLUSCA [8.8] [31.7] [0.6] - [16.7]Bivalvia (3.2) (30.5) (0.6) - (16.6)
Pecten sp. - 0.8 - - -Placopecten magellanicus - 27.6 - - -Pectinidae - - 0.6 - -Cerastoderma pinnulatum 2.2 2.1 - - -Bivalvia unid. 1.0 <0.1 - - 16.6
Mollusca unid. (5.6) (1.2) - - (0.1)POLYCHAETA [3.9] [0.6] [5.7] - [<0.1]
Aphroditidae 2.9 - - - -Cirratulidae - - 4.2 - -Polychaeta unid. 1.0 0.6 1.5 - <0.1
CRUSTACEA [71.2] [11.1] [0.8] [100.0] [<0.1]Isopoda (0.9) (0.2) - - (<0.1)
Edotea triloba 0.9 - - - <0.1Isopoda unid. - 0.2 - - -
Amphipoda (59.6) (3.9) (<0.1) (100.0) -Parathemisto sp. - - - 100.0 -Ampeliscidae 0.3 0.6 - - -Unciola irrorata 28.2 2.7 - - -Leptocheirus pinguis 25.1 0.2 - - -Aeginina longicornis 0.3 - - - -Amphipoda unid. 5.7 0.4 <0.1 - -
Decapoda (10.2) (5.8) (0.8) - -Dichelopandalus leptocerus - - 0.8 - -Paguridae <0.1 <0.1 - - -Hyas coarctatus - 3.8 - - -Cancer borealis 10.2 - - - -Crab unid. <0.1 2.0 - - -
Crustacea unid. (0.5) (1.2) - - -ECHINODERMATA [12.8] [46.2] [92.9] - [81.1]
Echinoidea (12.8) (36.6) - - -Echinarachnius parma 8.5 27.2 - - -Echinoidea unid. 4.3 9.4 - - -
Ophiuroidea - (8.3) (92.9) - (81.1)Ophiopholis aculeata - 3.8 - - -Ophiura sarsi - 0.9 92.9 - -Ophiuroidea unid. - 3.6 - - 81.1
Echinodermata unid. - (1.3) - - -OSTEICHTHYES [<0.1] - - - [<0.1]ANIMAL REMAINS AND MISC. [1.4] [9.3] [<0.1] - [2.2]SAND AND ROCK [1.9] [1.1] - - -
Number sampled 42 34 12 1 5Number empty 12 4 5 0 0Mean stomach content (g) 1.013 2.074 1.553 0.004 4.949Mean fish length (cm) 39 50 28 5 40

Page 112
Table B-48a. Diet composition and sampling data for Atlantic wolffish by fish length category. (Samples gathered during 1977-80. Data expressedas percentage of stomach content by weight. Squared brackets indicate major taxon subtotal; parentheses indicate minor taxon subtotal.)
Length Category (cm) Stomach Contents 1-10 11-20 21-30 31-40 41-50 51-60 61-70 71-80 >80 Total
MOLLUSCA [25.4] [33.7] [3.3] [5.0] [12.1] [36.3] [69.6] [50.4] [62.3] [57.6]Gastropoda (24.9) - (1.1) - (3.7) (0.5) (17.6) (1.1) (12.6) (10.8)Bivalvia - (33.7) (2.2) (5.0) (1.2) (28.9) (32.5) (29.1) (48.9) (40.1)
Pecten sp. - - - - - - - - 18.2 10.6Placopecten sp. - - - - - - 27.1 29.1 9.6 12.9Pectinidae - - - - - - - - 21.1 12.2Bivalvia unid. - 33.7 2.2 5.0 1.2 28.9 5.4 - - 4.4
Mollusca unid. (0.5) - - - (7.2) (6.9) (19.5) (20.2) (0.8) (6.7)POLYCHAETA - - [10.9] - [0.2] [0.5] - - - [0.1]
Aphrodita hastata - - 10.9 - - - - - - <0.1Polychaeta unid. - - - - 0.2 0.5 - - - 0.1
CRUSTACEA [73.7] [3.5] [0.5] [59.1] [15.0] [19.9] [26.4] [49.1] [4.7] [14.6]Copepoda (1.0) - - - - - - - - (<0.1)Tanaidacea - (0.4) - - - - - - - (<0.1)Amphipoda (28.7) (3.1) - - - - - - - (<0.1)
Parathemisto sp. 28.7 - - - - - - - - <0.1Amphipoda unid. - 3.1 - - - - - - - <0.1
Mysidacea (0.5) - - - - - - - - (<0.1)Euphausiacea (37.3) - - - - (4.8) - (11.9) - (1.5)
Meganyctiphanes norvegica - - - - - 4.8 - 11.9 - 1.5Euphausiacea unid. 37.3 - - - - - - - - <0.1
Decapoda (0.5) - (0.5) (59.1) (15.0) (15.1) (26.4) (37.2) (4.5) (13.0)Dichelopandalus leptocerus - - - - - - 0.6 - - 0.1Pandalus borealis - - - - - - - 37.1 - 3.1Sclerocrangon boreas - - - - 10.6 - - - - 0.4Pagurus longicarpus - - - - - - - - 3.1 1.8Pagurus arcuatus - - - - 2.7 - - - - 0.1Paguridae - - - - 1.6 1.2 4.7 0.1 1.4 1.9Majidae - - - 59.1 - - 0.9 - - 0.3Cancer irroratus - - - - - 12.6 19.8 - - 5.0Decapoda unid. 0.5 - 0.5 - 0.1 1.3 0.4 - <0.1 0.3
Crustacea unid. (5.7) - - - - - - - (0.2) (0.1)ECHINODERMATA - [62.8] [83.8] [35.9] [68.2] [36.0] [1.9] - [31.6] [25.8]
Echinoidea - - - (35.9) (52.7) (0.8) (1.9) - (11.7) (9.3)Strongylocentrotus sp. - - - 35.9 52.7 - 1.9 - 7.5 6.7Echinarachnius parma - - - - - - - - 0.1 0.1Echinoidea unid. - - - - - 0.8 - - 4.1 2.5
Ophiuroidea - - (76.0) - (7.3) (35.2) - - (18.7) (15.3)Ophiura sarsi - - - - - 2.6 - - 18.7 11.1Ophiuroidea unid. - - 76.0 - 7.3 32.6 - - - 4.2
Echinodermata unid. - (62.8) (7.8) - (8.2) - - - (1.2) (1.2)ANIMAL REMAINS AND MISC. [0.9] - [1.5] - [2.2] [6.4] [1.9] [0.5] [0.2] [1.0]ROCK - - - - [2.3] [0.9] [0.2] - [1.2] [0.9]
Number sampled 23 4 7 5 5 8 9 4 10 75Number empty 3 3 4 2 0 3 2 2 0 19Mean stomach content (g) 0.009 0.419 0.274 0.339 4.864 9.595 13.583 14.107 39.532 9.074Mean fish length (cm) 4 16 26 34 46 55 66 76 92 40

Page 113
Table B-48b. Diet composition and sampling data for Atlantic wolffish by geographic area. (Samples gathered during 1977-80. Dataexpressed as percentage of stomach content by weight. Squared brackets indicate major taxon subtotal; parenthesesindicate minor taxon subtotal.)
Geographic Area Inshore
Southern North New Georges Gulf of Scotian of Cape
Stomach Contents England Bank Maine Shelf Hatteras
MOLLUSCA - [88.8] [47.0] [32.4] [38.9]Gastropoda - (30.4) (0.7) (2.4) (0.7)Bivalvia - (56.6) (38.7) (8.5) (35.7)
Pecten sp. - 31.5 - 1.2 -Placopecten sp. - 14.8 6.6 - 33.1Pectinidae - 10.3 24.1 - -Bivalvia unid. - - 8.0 7.3 2.6
Mollusca unid. - (1.8) (7.6) (21.5) (2.5)POLYCHAETA - - [0.2] - -
Aphrodita hastata - - <0.1 - -Polychaeta unid. - - 0.2 - -
CRUSTACEA [33.3] [8.0] [18.8] [22.5] [12.2]Copepoda - - - (<0.1) -Amphipoda - - (<0.1) (<0.1) -
Parathemisto sp. - - - <0.1 -Amphipoda unid. - - <0.1 - -
Mysidacea (33.3) - - - -Euphausiacea - - (4.2) (<0.1) -
Meganyctiphanes norvegica - - 4.2 - -Euphausiacea unid. - - - <0.1 -
Decapoda - (7.9) (14.6) (22.0) (12.2)Dichelopandalus leptocerus - - - 0.8 -Pandalus borealis - - 8.4 - -Sclerocrangon boreas - - 1.0 - -Pagurus longicarpus - 5.5 - - -Pagurus arcuatus - - 0.3 - -Paguridae - 2.4 0.6 1.4 4.1Majidae - - - 2.4 -Cancer irroratus - - 3.9 16.4 8.1Decapoda unid. - - 0.4 1.0 <0.1
Crustacea unid. - (0.1) (<0.1) (0.5) -ECHINODERMATA - [2.1] [31.9] [38.3] [48.1]
Echinoidea - - (0.2) (37.2) (24.6)Strongylocentrotus sp. - - - 36.6 10.5Echinarachnius parma - - - 0.6 -Echinoidea unid. - - 0.2 - 14.1
Ophiuroidea - - (30.4) (1.1) (23.5)Ophiura sarsi - - 29.1 1.1 1.7Ophiuroidea unid. - - 1.3 - 21.8
Echinodermata unid. - (2.1) (1.3) - -ANIMAL REMAINS AND MISC. [66.7] [1.0] [1.8] [1.4] [0.4]ROCK - [0.1] [0.3] [5.4] [0.4]
Number sampled 1 8 28 33 5Number empty 0 0 11 7 1Mean stomach content (g) 0.003 28.046 8.943 2.760 22.939Mean fish length (cm) 3 79 41 27 68

Page 114
Table B-49a. Diet composition and sampling data for northern sand lance by fish length category. (Samples gathered during 1977-80. Dataexpressed as percentage of stomach content by weight. Squared brackets indicate major taxon subtotal; parentheses indicateminor taxon subtotal.)
Length Category (cm) Stomach Contents 1-5 6-10 11-15 16-20 21-25 26-30 Total
CNIDARIA - - [0.3] [<0.1] - - [0.1]CHAETOGNATHA - [16.6] [10.8] [17.8] [14.4] [95.4] [15.2]
Sagitta elegans - - 0.4 0.1 3.9 - 1.0Sagitta sp. - 14.9 1.6 9.0 <0.1 - 4.7Chaetognatha unid. - 1.7 8.8 8.7 10.5 95.4 9.5
OPISTHOBRANCHIA - - [<0.1] [0.1] [2.9] - [0.6]Limacina sp. - - - 0.1 2.3 - 0.5Opisthobranchia unid. - - <0.1 <0.1 0.6 - 0.1
POLYCHAETA - - [<0.1] [<0.1] [<0.1] [0.2] [<0.1]CRUSTACEA [42.9] [79.9] [83.6] [72.8] [63.1] [4.4] [74.8]
Ostracoda - (0.9) (1.2) (<0.1) - - (0.4)Copepoda (33.8) (40.5) (79.7) (64.4) (56.0) (1.2) (67.3)
Calanus sp. - 8.8 13.3 34.0 27.1 - 24.7Centropages sp. - - 11.0 <0.1 - - 3.9Calanoida 31.2 13.8 37.0 18.7 26.9 1.2 26.5Copepoda unid. 2.6 17.9 18.4 11.7 2.0 - 12.2
Cirripedia - (0.6) (0.2) (0.1) - - (0.2)Cumacea - - (<0.1) (<0.1) (<0.1) - (<0.1)Amphipoda - (0.1) (0.7) (3.9) (5.9) (2.7) (3.2)
Parathemisto gaudichaudii - - 0.5 0.7 <0.1 - 0.5Parathemisto sp. - - <0.1 0.7 1.2 - 0.6Hyperiidae - - <0.1 0.2 0.2 - 0.1Monoculodes edwardsi - - - - 0.7 - 0.1Calliopius laeviusculus - - 0.2 0.2 0.1 2.7 <0.1Gammarus annulatus - - - 2.1 3.7 - 1.7Amphipoda unid. - 0.1 <0.1 <0.1 <0.1 - 0.2
Mysidacea - (36.4) (0.3) (2.4) (0.4) (0.5) (2.0)Mysidopsis bigelowi - - <0.1 <0.1 0.3 - 0.1Mysidopsis sp. - - <0.1 <0.1 - 0.5 <0.1Neomysis americana - 36.4 0.3 2.4 0.1 - 1.9
Euphausiacea - - (0.7) (0.7) (0.2) - (0.6)Meganyctiphanes norvegica - - <0.1 0.1 0.2 - 0.1Euphausiacea unid. - - 0.7 0.6 <0.1 - 0.5
Crustacea unid. (9.1) (1.4) (0.8) (1.3) (0.6) - (1.1)UROCHORDATA [57.1] [1.3] [0.2] [2.8] [13.7] - [4.1]
Larvacea 57.1 1.3 0.1 <0.1 - - 0.1Urochordata unid. - - 0.1 2.8 13.7 - 4.0
OSTEICHTHYES - [0.1] [0.2] [1.7] [<0.1] - [0.8]Ammodytes dubius - - - <0.1 - - <0.1Pholis gunnellus - - - <0.1 - - <0.1Osteichthyes eggs - - <0.1 0.1 - - 0.1Osteichthyes larvae - 0.1 <0.1 0.3 - - 0.1Osteichthyes unid. - - 0.2 1.3 <0.1 - 0.6
ANIMAL REMAINS AND MISC. - [2.1] [4.9] [4.8] [5.9] - [4.4]
Number sampled 11 93 811 383 54 1 1353Number empty 1 27 227 130 8 0 393Mean stomach content (g) 0.007 0.019 0.040 0.103 0.343 0.593 0.069Mean fish length (cm) 4 9 13 17 21 27 14

Page 115
Table B-49b. Diet composition and sampling data for northern sand lance by geographic area. (Samples gathered during 1977-80. Dataexpressed as percentage of stomach content by weight. Squared brackets indicate major taxon subtotal; parentheses indicateminor taxon subtotal.)
Geographic Area Inshore
Southern North Middle New Georges Gulf of of Cape
Stomach Contents Atlantic England Bank Maine Hatteras
CNIDARIA [2.8] [0.3] [<0.1] - [0.1]CHAETOGNATHA [0.4] [32.2] [15.1] [0.1] [8.8]
Sagitta elegans - 3.7 0.2 - 0.2Sagitta sp. - 21.1 <0.1 - <0.1Chaetognatha unid. 0.4 7.4 14.9 0.1 8.6
OPISTHOBRANCHIA - [<0.1] [<0.1] [3.7] -Limacina sp. - - <0.1 3.0 -Opisthobranchia unid. - <0.1 <0.1 0.7 -
POLYCHAETA - [<0.1] [<0.1] - [<0.1]CRUSTACEA [61.6] [57.5] [79.8] [70.7] [87.8]
Ostracoda - (<0.1) (0.2) (2.1) (<0.1)Copepoda (59.6) (45.2) (73.7) (67.9) (78.9)
Calanus sp. - 7.3 52.3 - 2.3Centropages sp. - 5.0 - - 16.8Calanoida 35.7 28.0 9.4 56.8 37.4Copepoda unid. 23.9 4.9 12.0 11.1 22.4
Cirripedia - (0.1) (<0.1) (0.3) (0.4)Cumacea - (<0.1) - - (0.1)Amphipoda (0.8) (9.9) (1.9) (0.4) (<0.1)
Parathemisto sp. 0.8 2.0 1.3 - -Hyperiidae <0.1 <0.1 0.1 0.4 -Monoculodes edwardsi - 0.6 - - -Calliopius laeviusculus - - 0.4 - -Gammarus annulatus - 7.3 0.1 - -Amphipoda unid. - <0.1 <0.1 - <0.1
Mysidacea - (0.2) (2.2) - (5.9)Mysidopsis bigelowi - - 0.3 - -Mysidopsis sp. - - <0.1 - -Neomysis americana - 0.2 1.9 - 5.9
Euphausiacea - (0.2) (0.6) - (1.9)Meganyctiphanes norvegica - - 0.3 - -Euphausiacea unid. - 0.2 0.3 - 1.9
Crustacea unid. (1.2) (1.9) (1.2) (<0.1) (0.6)UROCHORDATA [6.5] [0.3] [0.7] [21.5] [0.1]
Larvacea 0.9 0.3 - - 0.1Urochordata unid. 5.6 <0.1 0.7 21.5 -
OSTEICHTHYES [6.5] [2.5] [0.5] - [<0.1]Ammodytes dubius - <0.1 - - -Pholis gunnellus - <0.1 - - -Osteichthyes eggs - - 0.2 - -Osteichthyes larvae - 0.6 <0.1 - -Osteichthyes unid. 6.5 1.9 0.3 - <0.1
ANIMAL REMAINS AND MISC. [22.2] [7.2] [3.9] [4.0] [3.2]
Number sampled 148 319 429 61 396Number empty 40 76 162 4 111Mean stomach content (g) 0.008 0.064 0.094 0.260 0.039Mean fish length (cm) 12 15 15 17 12

Page 116
Table B-50a. Diet composition and sampling data for Atlantic mackerel by fish length category. (Samples gathered during 1977-80. Dataexpressed as percentage of stomach content by weight. Squared brackets indicate major taxon subtotal; parentheses indicateminor taxon subtotal.)
Length Category (cm) Stomach Contents 16-20 21-25 26-30 31-35 36-40 41-45 Total
NEMATODA [0.7] [<0.1] [0.1] - [<0.1] [<0.1] [0.1]CHAETOGNATHA [13.8] - [5.0] [25.4] [9.3] [7.2] [8.6]
Sagitta elegans 3.0 - 4.8 16.2 4.0 5.2 4.8Chaetognatha unid. 10.8 - 0.2 9.2 5.3 2.0 3.8
MOLLUSCA [<0.1] - - [<0.1] [0.5] - [0.3]Bivalvia - - - - 0.1 - 0.1Cephalopoda <0.1 - - <0.1 0.4 - 0.2
POLYCHAETA [<0.1] - - [1.2] - - [<0.1]CRUSTACEA [81.9] [93.9] [94.7] [69.0] [89.0] [92.3] [90.2]
Copepoda (13.3) (92.7) (18.4) - (3.8) (1.0) (7.3)Calanoida 8.0 - 7.3 - 0.9 <0.1 2.0Centropages sp. 5.0 92.7 - - - - 2.2Copepoda unid. 0.3 - 11.1 - 2.9 1.0 3.1
Cumacea - - - - (<0.1) - (<0.1)Amphipoda (0.9) (1.2) (13.8) (21.9) (83.4) (90.4) (66.2)
Hyperia glaba - - 0.4 - - - 0.1Parathemisto gaudichaudii <0.1 1.2 13.4 - 3.5 <0.1 3.3Parathemisto sp. 0.2 - - 12.1 2.5 <0.1 1.4Hyperiidae 0.7 <0.1 - - - - 0.1Aeginina longicornis - - <0.1 - <0.1 - <0.1Gammarus annulatus - - - 9.8 77.4 90.4 61.3Amphipoda unid. <0.1 - - - <0.1 - <0.1
Mysidacea (67.6) - (38.3) (<0.1) (<0.1) (0.8) (10.8)Mysidopsis bigelowi 6.1 - - - - - 0.4Neomysis americana 61.5 - 38.3 <0.1 - 0.8 10.4Mysidacea unid. <0.1 - - <0.1 <0.1 - <0.1
Euphausiacea - - (20.1) (45.3) (0.6) (<0.1) (4.8)Euphausia krohnii - - - 38.0 - - 1.3Meganyctiphanes norvegica - - 20.1 3.3 0.6 <0.1 3.3Euphausiacea unid. - - <0.1 4.0 <0.1 <0.1 0.2
Decapoda (0.1) - (1.7) (0.4) (1.0) (0.1) (0.7)Crangon septemspinosa 0.1 - <0.1 - - <0.1 <0.1Pagurus sp. - - <0.1 - <0.1 <0.1 <0.1Decapoda larvae <0.1 - 1.7 0.4 1.0 0.1 0.7
Crustacea unid. (<0.1) - (2.4) (1.4) (0.2) - (0.4)UROCHORDATA [1.5] - [0.2] - - - [0.1]
Ascidiacea 0.6 - - - - - <0.1Urochordata unid. 0.9 - 0.2 - - - 0.1
OSTEICHTHYES [0.1] - [<0.1] - [0.2] [<0.1] [0.1]Osteichthyes larvae 0.1 - <0.1 - <0.1 <0.1 <0.1Osteichthyes unid. <0.1 - <0.1 - 0.2 - 0.1
ANIMAL REMAINS [2.0] [6.1] [<0.1] [0.6] [0.9] [0.5] [0.4]SAND - - - [3.8] [0.1] - [0.2]
Number sampled 32 7 17 26 24 8 114Number empty 1 1 5 8 5 1 21Mean stomach content (g) 0.571 0.715 2.226 0.341 3.895 11.594 2.248Mean fish length (cm) 17 22 28 33 38 41 29

Page 117
Table B-50b. Diet composition and sampling data for Atlantic mackerel by geographic area. (Samples gathered during 1977-80. Dataexpressed as percentage of stomach content by weight. Squared brackets indicate major taxon subtotal; parentheses indicateminor taxon subtotal.)
Geographic Area Inshore
Southern North New Georges Gulf of Scotian of Cape
Stomach Contents England Bank Maine Shelf Hatteras
NEMATODA - [0.2] [0.3] [<0.1] [<0.1]CHAETOGNATHA [3.3] [21.0] [1.8] - [0.2]
Sagitta elegans 2.2 11.2 - - 0.2Chaetognatha unid. 1.1 9.8 1.8 - -
MOLLUSCA [<0.1] [0.5] [2.0] - -Bivalvia - - (2.0) - -Cephalopoda (<0.1) (0.5) - - -
POLYCHAETA - [0.1] - - -CRUSTACEA [96.2] [77.0] [85.2] [95.9] [98.4]
Copepoda (<0.1) (13.1) (83.9) (54.2) -Calanoida - 6.2 2.1 - -Centropages sp. - - 81.8 11.5 -Copepoda unid. <0.1 6.9 - 42.7 -
Cumacea - (<0.1) - - -Amphipoda (95.5) (12.2) (1.3) (41.7) (96.2)
Hyperia glaba - 0.2 - - -Parathemisto gaudichaudii - 10.4 1.0 <0.1 -Parathemisto sp. - 1.4 0.2 41.7 -Hyperiidae <0.1 0.2 0.1 - -Gammarus annulatus 95.5 - - - 96.2Amphipoda unid. - <0.1 - - -
Mysidacea (0.5) (33.5) (<0.1) - -Mysidopsis bigelowi - 1.4 - - -Neomysis americana 0.5 32.1 - - -Mysidacea unid. - <0.1 <0.1 - -
Euphausiacea (0.2) (14.7) (<0.1) - (2.2)Euphausia krohnii - 4.2 - - -Meganyctiphanes norvegica 0.2 10.0 - - 2.2Euphausiacea unid. - 0.5 <0.1 - -
Decapoda - (2.1) (<0.1) - -Crangon septemspinosa - <0.1 <0.1 - -Pagurus sp. - <0.1 - - -Decapoda larvae - 2.1 <0.1 - -
Crustacea unid. - (1.4) - - -UROCHORDATA [0.1] [0.1] - - -
Ascidiacea - (0.1) - - -Urochordata unid. (0.1) (<0.1) - - -
OSTEICHTHYES - [<0.1] [0.2] [2.4] -Osteichthyes larvae - <0.1 - - -Osteichthyes unid. - <0.1 0.2 2.4 -
ANIMAL REMAINS [0.2] [1.1] [10.5] [1.7] [0.2]SAND [0.2] - - - [1.2]
Number sampled 24 74 11 4 1Number empty 11 8 1 1 0Mean stomach content (g) 6.450 1.083 0.544 1.410 9.628Mean fish length (cm) 32 27 29 29 39

Page 118
Table B-51a. Diet composition and sampling data for butterfish by fish length category. (Samples gathered during 1977-80. Data expressedas percentage of stomach content by weight. Squared brackets indicate major taxon subtotal; parentheses indicate minor taxonsubtotal.)
Length Category (cm) Stomach Contents 1-5 6-10 11-15 16-20 21-25 Total
CNIDARIA - [8.7] [<0.1] - - [1.4]CTENOPHORA - [0.3] - - - [0.1]RHYNCHOCOELA - - [0.3] - - [0.2]CHAETOGNATHA [0.5] [0.8] [<0.1] [1.0] - [0.6]
Sagitta elegans - 0.5 - 0.3 - 0.2Sagitta sp. - - <0.1 0.7 - 0.3Chaetognatha unid. 0.5 0.3 - - - 0.1
MOLLUSCA - [8.1] [29.5] [9.0] [0.3] [18.7]Thecosomata - (8.1) (29.5) (8.8) - (18.6)
Clione sp. - 7.8 26.6 8.8 - 17.1Thecosomata unid. - 0.3 2.9 <0.1 - 1.5
Mollusca unid. - - - (0.2) (0.3) (0.1)POLYCHAETA - [1.9] [2.4] [1.0] [14.7] [2.3]
Glyceridae - - 1.8 - - 0.9Tomopteris helgolandica - - - 0.2 - 0.1Tomopteris sp. - - <0.1 0.7 14.7 0.6Polychaeta unid. - 1.9 0.6 0.1 - 0.7
CRUSTACEA - [2.3] [1.1] [1.9] [5.1] [1.8]Copepoda - (1.7) (<0.1) (0.2) (4.8) (0.4)
Centropages sp. - 0.1 <0.1 <0.1 - <0.1Copepoda unid. - 1.6 <0.1 0.2 4.8 0.4
Stomatopoda - (0.2) - - - (<0.1)Amphipoda - (<0.1) (0.9) (0.5) (0.3) (0.7)
Hyperia glaba - - <0.1 0.2 <0.1 0.1Parathemisto sp. - <0.1 0.4 0.3 0.3 0.3Ampelisca verrilli - - 0.5 - - 0.3
Mysidacea - (0.1) (<0.1) (<0.1) - (<0.1)Neomysis americana - 0.1 <0.1 <0.1 - <0.1
Euphausiacea - (<0.1) (<0.1) (1.2) - (0.4)Meganyctiphanes norvegica - <0.1 <0.1 1.2 - 0.4
Decapoda larvae - (<0.1) (0.2) (<0.1) - (0.1)Crustacea unid. - (0.3) (<0.1) (<0.1) - (0.2)
UROCHORDATA - [17.7] [38.7] [20.7] [20.6] [29.0]Ascidiacea - - (11.0) (11.6) - (9.2)Thaliacea - (8.3) (4.4) (3.8) (6.8) (4.8)
Salpidae - 8.3 3.1 3.5 6.8 4.1Thaliacea unid. - - 1.3 0.3 - 0.7
Larvacea - (2.8) (<0.1) (0.7) (13.8) (1.0)Urochordata unid. - (6.6) (23.3) (4.6) - (14.0)
OSTEICHTHYES - [0.2] [<0.1] - - [0.1]ANIMAL REMAINS AND MISC. [99.5] [60.0] [28.0] [66.4] [59.3] [45.8]
Number sampled 39 327 282 194 10 852Number empty 11 32 63 63 3 172Mean stomach content (g) 0.010 0.067 0.241 0.234 0.301 0.163Mean fish length (cm) 4 8 12 17 21 11
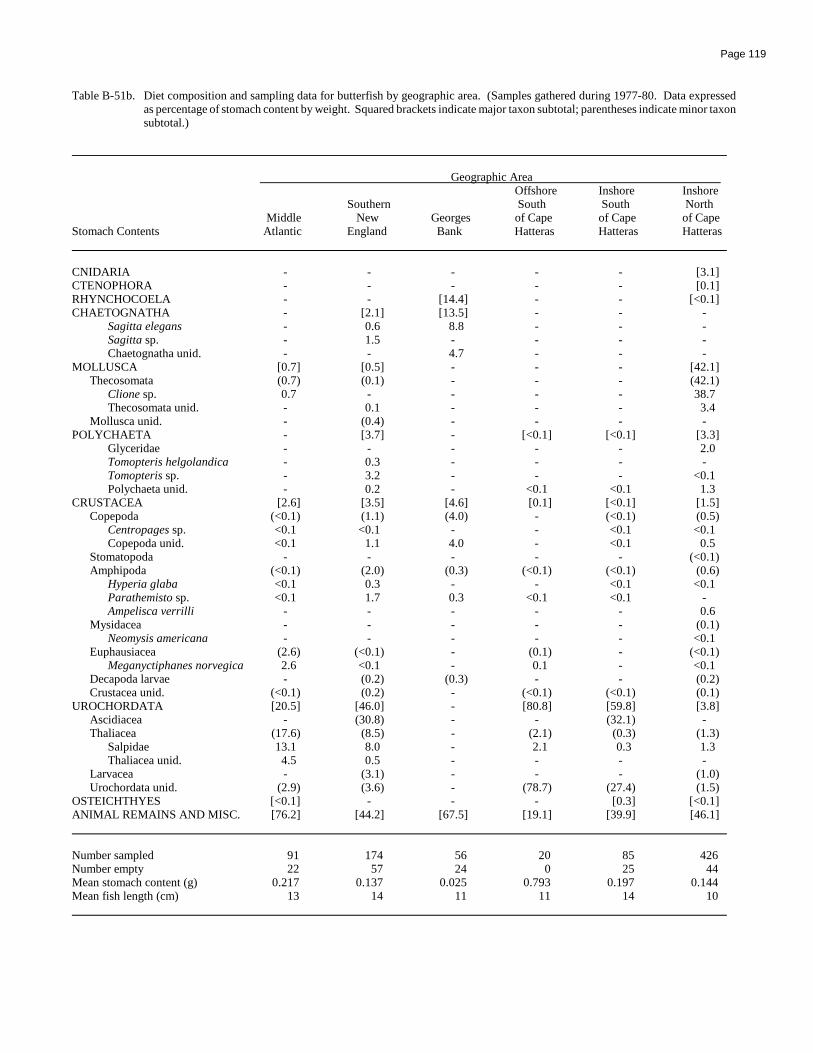
Page 119
Table B-51b. Diet composition and sampling data for butterfish by geographic area. (Samples gathered during 1977-80. Data expressedas percentage of stomach content by weight. Squared brackets indicate major taxon subtotal; parentheses indicate minor taxonsubtotal.)
Geographic Area Offshore Inshore Inshore
Southern South South North Middle New Georges of Cape of Cape of Cape
Stomach Contents Atlantic England Bank Hatteras Hatteras Hatteras
CNIDARIA - - - - - [3.1]CTENOPHORA - - - - - [0.1]RHYNCHOCOELA - - [14.4] - - [<0.1]CHAETOGNATHA - [2.1] [13.5] - - -
Sagitta elegans - 0.6 8.8 - - -Sagitta sp. - 1.5 - - - -Chaetognatha unid. - - 4.7 - - -
MOLLUSCA [0.7] [0.5] - - - [42.1]Thecosomata (0.7) (0.1) - - - (42.1)
Clione sp. 0.7 - - - - 38.7Thecosomata unid. - 0.1 - - - 3.4
Mollusca unid. - (0.4) - - - -POLYCHAETA - [3.7] - [<0.1] [<0.1] [3.3]
Glyceridae - - - - - 2.0Tomopteris helgolandica - 0.3 - - - -Tomopteris sp. - 3.2 - - - <0.1Polychaeta unid. - 0.2 - <0.1 <0.1 1.3
CRUSTACEA [2.6] [3.5] [4.6] [0.1] [<0.1] [1.5]Copepoda (<0.1) (1.1) (4.0) - (<0.1) (0.5)
Centropages sp. <0.1 <0.1 - - <0.1 <0.1Copepoda unid. <0.1 1.1 4.0 - <0.1 0.5
Stomatopoda - - - - - (<0.1)Amphipoda (<0.1) (2.0) (0.3) (<0.1) (<0.1) (0.6)
Hyperia glaba <0.1 0.3 - - <0.1 <0.1Parathemisto sp. <0.1 1.7 0.3 <0.1 <0.1 -Ampelisca verrilli - - - - - 0.6
Mysidacea - - - - - (0.1)Neomysis americana - - - - - <0.1
Euphausiacea (2.6) (<0.1) - (0.1) - (<0.1)Meganyctiphanes norvegica 2.6 <0.1 - 0.1 - <0.1
Decapoda larvae - (0.2) (0.3) - - (0.2)Crustacea unid. (<0.1) (0.2) - (<0.1) (<0.1) (0.1)
UROCHORDATA [20.5] [46.0] - [80.8] [59.8] [3.8]Ascidiacea - (30.8) - - (32.1) -Thaliacea (17.6) (8.5) - (2.1) (0.3) (1.3)
Salpidae 13.1 8.0 - 2.1 0.3 1.3Thaliacea unid. 4.5 0.5 - - - -
Larvacea - (3.1) - - - (1.0)Urochordata unid. (2.9) (3.6) - (78.7) (27.4) (1.5)
OSTEICHTHYES [<0.1] - - - [0.3] [<0.1]ANIMAL REMAINS AND MISC. [76.2] [44.2] [67.5] [19.1] [39.9] [46.1]
Number sampled 91 174 56 20 85 426Number empty 22 57 24 0 25 44Mean stomach content (g) 0.217 0.137 0.025 0.793 0.197 0.144Mean fish length (cm) 13 14 11 11 14 10

Page 120
Table B-52a. Diet composition and sampling data for Gulf Stream flounder by fish length category. (Samples gathered during 1977-80. Data expressed as percentage of stomach content by weight. Squared brackets indicate major taxon subtotal;parentheses indicate minor taxon subtotal.)
Length Category (cm) Stomach Contents 1-5 6-10 11-15 16-20 Total
POLYCHAETA [35.3] [36.7] [54.9] [31.6] [47.2]Nicomache lumbricalis - - 5.8 - 3.4Maldanidae - 5.7 - - 2.3Eunicidae 35.3 <0.1 - - 0.2Lumbrineris sp. - 5.4 - - 2.1Lumbrineridae - 8.0 1.1 - 3.8Ophelina sp. - - 2.2 - 1.3Nephtyidae - 4.1 22.1 - 14.4Sthenelais limicola - - 3.8 - 2.2Sabellidae - - 1.7 - 1.0Polychaeta unid. - 13.5 18.2 31.6 16.5
CRUSTACEA [64.7] [55.4] [31.5] [35.5] [41.3]Stomatopoda - (5.5) - - (2.2)
Platysquilla enodis - 4.6 - - 1.8Stomatopoda unid. - 0.9 - - 0.4
Cumacea - (0.8) (0.8) (2.6) (0.8)Amphipoda (64.7) (36.7) (13.7) (14.5) (23.1)
Ampelisca agassizi - 3.5 0.3 - 1.6Ampelisca sp. - 1.1 1.0 - 1.0Byblis serrata - 2.8 0.2 - 1.2Ampeliscidae - 2.4 0.3 - 1.1Ericthonius sp. - 3.6 <0.1 - 1.5Unciola sp. 17.6 9.2 6.0 1.3 7.2Casco bigelowi - 1.4 - - 0.5Oedicerotidae - 1.2 0.1 - 1.3Leptocheirus pinguis - 2.8 3.7 13.2 3.5Amphipoda unid. 47.1 8.7 2.1 - 4.2
Decapoda - (9.8) (5.1) (18.4) (7.2)Crangon septemspinosa - 0.3 0.9 - 0.6Munida sp. - 2.1 0.5 - 1.1Majidae - - 1.7 - 1.0Cancer irroratus - 3.5 0.7 11.8 2.0Cancridae - 2.5 0.4 - 1.2Decapoda larvae - <0.1 0.6 6.6 0.5Decapoda unid. - 1.4 0.3 - 0.8
Crustacea unid. - (2.6) (11.9) - (8.0)ECHINODERMATA - [1.9] [2.5] [23.7] [2.7]
Ophiura sp. - 1.5 0.2 - 0.7Ophiuroidea - 0.4 2.3 23.7 2.0
OSTEICHTHYES - - [7.8] - [4.6]Gadidae - - 6.0 - 3.5Osteichthyes larvae and eggs - - 1.8 - 1.1
ANIMAL REMAINS AND MISC. - [6.0] [3.3] [9.2] [4.2]
Number sampled 4 124 77 19 224Number empty 0 26 27 10 63Mean stomach content (g) 0.004 0.013 0.030 0.004 0.018Mean fish length (cm) 4 8 12 16 10

Page 121
Table B-52b. Diet composition and sampling data for Gulf Stream flounder by geographic area. (Samplesgathered during 1977-80. Data expressed as percentage of stomach content by weight.Squared brackets indicate major taxon subtotal; parentheses indicate minor taxon subtotal.)
Geographic Area Southern
Middle New GeorgesStomach Contents Atlantic England Bank
POLYCHAETA [61.0] [43.2] [46.4]Nicomache lumbricalis 16.7 - -Maldanidae - 3.4 -Eunicidae 0.9 - -Lumbrineris sp. 2.4 2.4 0.8Lumbrineridae 0.5 5.6 -Ophelina sp. 6.2 - -Nephtyidae 5.5 17.6 12.2Sthenelais limicola - - 16.7Polychaeta unid. 28.8 14.2 16.7
CRUSTACEA [34.2] [42.1] [47.9]Stomatopoda (3.0) (2.4) -
Platysquilla enodis 3.0 1.8 -Stomatopoda unid. - 0.6 -
Cumacea (1.5) (0.2) (2.6)Amphipoda (26.1) (19.2) (38.1)
Ampelisca agassizi 3.0 0.5 4.5Ampelisca sp. 3.7 - 2.1Byblis serrata 0.7 1.6 -Ampeliscidae - 0.7 5.1Ericthonius sp. 0.5 0.8 6.2Unciola sp. 7.5 7.6 4.6Casco bigelowi 1.5 0.4 -Oedicerotidae 6.3 - -Leptocheirus pinguis - 5.3 -Amphipoda unid. 2.9 2.3 15.6
Decapoda (2.5) (9.0) (5.6)Crangon septemspinosa - 0.9 -Munida sp. - 1.7 -Majidae - 1.5 -Cancer irroratus - 3.1 -Cancridae 1.3 1.0 1.7Decapoda larvae 0.1 0.4 1.9Decapoda unid. 1.1 0.4 2.0
Crustacea unid. (1.1) (11.3) (1.6)ECHINODERMATA - [4.1] -
Ophiura sp. - 1.1 -Ophiuroidea - 3.0 -
OSTEICHTHYES - [6.8] -Gadidae - 5.2 -Osteichthyes larvae and eggs - 1.6 -
ANIMAL REMAINS AND MISC. [4.8] [3.8] [5.7]
Number sampled 66 129 29Number empty 20 37 6Mean stomach content (g) 0.012 0.021 0.018Mean fish length (cm) 8 11 10

Page 122
Table B-53a. Diet composition and sampling data for summer flounder by fish length category. (Samples gathered during 1977-80. Data expressed aspercentage of stomach content by weight. Squared brackets indicate major taxon subtotal; parentheses indicate minor taxon subtotal.)
Length Category (cm) Stomach Contents <21 21-25 26-30 31-35 36-40 41-45 51-55 56-60 >60 Total
CEPHALOPODA - - [4.9] [27.1] [1.5] [19.1] [26.2] [64.5] [38.3] [34.2]Illex sp. - - - 10.2 - - - - 31.5 9.4Loligo pealeii - - - 3.8 - 12.2 12.7 51.1 - 16.3Loligo sp. - - - - - 2.3 - 3.4 - 1.2Lolliguncula brevis - - - 2.4 - - - - - 0.1Cephalopoda unid. - - 4.9 10.7 1.5 4.6 13.5 10.0 6.8 7.2
CRUSTACEA [43.3] [41.8] [18.6] [22.4] [6.5] [8.8] [1.1] - [0.9] [4.4]Stomatopoda - (5.5) - (0.3) - - - - - (<0.1)Amphipoda - - (1.6) (0.7) (1.0) - - - - (0.2)Mysidacea (0.6) (24.1) (12.3) (12.1) (2.2) (0.7) (0.3) - (0.9) (2.0)
Neomysis americana 0.6 24.1 12.3 12.1 2.2 0.7 0.3 - 0.9 2.0Euphausiacea - - - (6.0) - - - - - (0.3)
Meganyctiphanes norvegica - - - 6.0 - - - - - 0.3Decapoda (42.7) (12.0) (4.7) (2.8) (3.3) (7.3) (0.8) - - (1.8)
Dichelopandalus leptocerus - - - - - 1.9 - - - 0.2Crangon septemspinosa 9.0 4.3 0.3 0.3 0.2 <0.1 - - - 0.1Cancer irroratus 33.2 2.1 1.8 2.5 1.3 3.0 - - - 0.8Cancridae - - 1.7 <0.1 - - 0.8 - - 0.1Ovalipes ocellatus - - - - 1.8 2.4 - - - 0.5Decapoda unid. 0.5 5.6 0.9 - - - - - - 0.1
Crustacea unid. (<0.1) (0.2) - (0.5) - (0.8) - - - (0.1)OSTEICHTHYES [56.6] [58.2] [75.7] [49.8] [91.9] [70.9] [72.7] [35.5] [60.6] [61.1]
Batrachoididae - - - - - - - - 5.5 1.6Etrumeus teres - 35.1 - - 12.5 4.0 - - - 2.9Clupeidae - - - - - 5.5 - 13.4 - 4.2Anchoa hepsetus - - 7.6 - - 1.9 - - - 0.4Anchoa mitchilli - - - - - - - - 1.3 0.4Anchoa sp. - 6.4 - - - - - - - 0.1Engraulidae - - - - - - 0.3 2.1 - 0.6Cyprinodon variegatus - - - - - - 2.2 - - 0.2Merluccius bilinearis 54.0 - - 4.6 - - - - - 0.3Gadidae - - - - - 0.7 - - - 0.1Ophidiidae - - - - - 7.6 - - - 0.8Ammodytes dubius - - 34.0 12.1 58.2 27.3 43.2 12.8 4.5 22.3Triglops murrayi - - - - 1.9 - - - - 0.3Cynoscion regalis - - - 6.0 - 2.4 - - - 0.6Ulvaria subbifurcata - - - 1.3 - - - - - 0.1Macrozoarces americanus - 2.9 - - - - - - - <0.1Paralichthys sp. - - - 3.5 - - - - - 0.2Scophthalmus aquosus - - - 4.9 - - - - - 0.2Bothidae - - 5.4 0.8 - <0.1 - - - 0.2Osteichthyes unid. 2.6 13.8 28.7 16.6 19.3 21.5 27.0 7.2 49.3 25.6
ANIMAL REMAINS AND MISC. [0.1] [<0.1] [0.8] [0.7] [0.1] [1.2] - - [0.2] [0.3]
Number sampled 22 76 135 113 111 80 52 44 22 655Number empty 16 53 84 74 66 44 30 25 10 402Mean stomach content (g) 0.167 0.363 0.427 0.881 2.828 2.659 3.503 12.155 25.717 3.050Mean fish length (cm) 18 23 27 32 38 42 47 53 64 35

Page 123
Table B-53b. Diet composition and sampling data for summer flounder by geographic area. (Samples gathered during 1977-80. Data expressedas percentage of stomach content by weight. Squared brackets indicate major taxon subtotal; parentheses indicate minor taxonsubtotal.)
Geographic Area Inshore Inshore
Southern South North Middle New Georges Gulf of of Cape of Cape
Stomach Contents Atlantic England Bank Maine Hatteras Hatteras
CEPHALOPODA [1.3] [55.6] - - - [31.1]Illex sp. - 23.7 - - - 1.2Loligo pealeii - 24.4 - - - 16.9Loligo sp. - 2.4 - - - 0.6Lolliguncula brevis 0.8 - - - - -Cephalopoda unid. 0.5 5.1 - - - 12.4
CRUSTACEA [3.0] [0.8] - [100.0] [9.6] [7.8]Stomatopoda - - - - (4.4) (<0.1)Amphipoda - - - - - (0.5)Mysidacea (0.6) - - - (<0.1) (4.5)
Neomysis americana 0.6 - - - <0.1 4.5Euphausiacea - - - (100.0) - -
Meganyctiphanes norvegica - - - 100.0 - -Decapoda (2.4) (0.6) - - (5.2) (2.8)
Dichelopandalus leptocerus 0.3 0.4 - - - -Crangon septemspinosa 0.2 <0.1 - - 3.2 0.2Cancer irroratus 1.7 - - - 0.9 1.2Ovalipes ocellatus - - - - - 1.3Decapoda unid. 0.2 0.2 - - 1.1 0.1
Crustacea unid. - (0.2) - - (<0.1) (<0.1)OSTEICHTHYES [95.7] [43.2] [100.0] - [90.2] [60.3]
Batrachoididae - - 44.8 - - -Etrumeus teres - - - - - 6.8Clupeidae 22.6 1.6 - - - -Anchoa hepsetus - - - - 24.5 0.7Anchoa mitchilli - - - - - 0.9Anchoa sp. - - - - - 0.2Engraulidae - - - - - 1.4Cyprinodon variegatus - 0.5 - - - -Merluccius bilinearis - - - - - 0.8Gadidae 0.5 - - - - -Ophidiidae - 2.1 - - - -Ammodytes dubius 60.2 7.6 54.6 - - 18.9Triglops murrayi - - - - 50.6 -Cynoscion regalis - - - - - 1.3Ulvaria subbifurcata 0.4 - - - - -Macrozoarces americanus - - - - - <0.1Paralichthys sp. - - - - - 0.4Scophthalmus aquosus - - - - - 0.6Bothidae - - - - - 0.5Osteichthyes unid. 12.0 31.4 0.6 - 15.1 27.8
ANIMAL REMAINS AND MISC. [<0.1] [0.4] - - [0.2] [0.8]
Number sampled 139 88 9 1 74 350Number empty 98 65 5 0 62 177Mean stomach content (g) 2.274 8.534 7.776 5.995 0.161 2.409Mean fish length (cm) 36 48 56 34 27 34

Page 124
Table B-54a. Diet composition and sampling data for fourspot flounder by fish length category. (Samples gathered during 1977-80. Dataexpressed as percentage of stomach content by weight. Squared brackets indicate major taxon subtotal; parentheses indicateminor taxon subtotal.)
Length Category (cm) Stomach Contents 11-15 16-20 21-25 26-30 31-35 36-40 41-45 Total
MOLLUSCA - - - [<0.1] [20.1] [89.3] [100.0] [54.6]Bivalvia - - - - - (0.6) - (0.3)Cephalopoda - - - (<0.1) (20.1) (88.7) (100.0) (54.3)
Loligo sp. - - - - - 17.6 - 7.2Sepiolidae - - - - 20.1 - - 3.0Octopoda - - - - - - 100.0 15.2Cephalopoda unid. - - - <0.1 - 71.1 - 28.9
POLYCHAETA - [38.5] - [2.7] [5.9] - - [2.0]Aphroditidae - - - 1.0 - - - 0.2Sabellidae - - - 0.6 1.3 - - 0.4Asabellides oculata - 38.5 - - - - - 0.4Polychaeta unid. - - - 1.1 4.6 - - 1.0
SIPUNCULA - - - [1.1] - - - [0.3]Golfingia sp. - - - 1.1 - - - 0.3
CRUSTACEA [62.1] [35.3] [41.5] [68.4] [44.7] [10.7] - [29.8]Amphipoda - - (4.9) (2.0) (0.3) - - (0.8)Mysidacea (30.9) (0.9) - - (1.4) - - (0.3)
Neomysis americana 17.9 - - - 1.4 - - 0.3Mysidacea unid. 13.0 0.9 - - - - - <0.1
Decapoda (28.8) (34.4) (33.0) (61.2) (43.0) (10.7) - (27.3)Hippolytidae - - 1.3 - - - - 0.1Dichelopandalus leptocerus - - 19.1 10.4 5.3 1.2 - 4.6Pandalidae 7.4 - - 2.3 - - - 0.6Crangon septemspinosa 9.1 12.6 2.2 5.8 9.0 <0.1 - 3.0Munida iris - - - 8.1 - - - 1.9Munida sp. - 0.5 1.1 - - 3.3 - 1.4Cancer irroratus - 21.3 8.5 32.0 27.1 2.2 - 13.1Cancridae - - - 0.7 0.6 - - 0.3Albunea sp. - - - 1.0 0.6 2.2 - 1.2Decapoda unid. 12.3 - 0.8 0.9 0.4 1.8 - 1.1
Crustacea unid. (2.4) - (3.6) (5.2) (<0.1) - - (1.4)OSTEICHTHYES [37.9] [26.2] [55.1] [21.4] [26.6] [<0.1] - [11.8]
Gadus morhua - 26.2 - 10.8 - - - 2.8Merluccius bilinearis - - - - 23.4 - - 3.5Ophidiidae - - - 7.6 - - - 1.8Peprilus triacanthus - - - - 1.0 - - 0.1Bothidae - - 43.7 - - - - 1.9Pleuronectes ferruginus - - - <0.1 - - - <0.1Pleuronectidae - - - 0.2 - - - 0.1Osteichthyes larvae - - - <0.1 - - - <0.1Osteichthyes unid. 37.9 - 11.4 2.8 2.2 <0.1 - 1.6
ANIMAL REMAINS AND MISC. - - [3.4] [6.4] [2.7] - - [1.5]
Number sampled 5 14 24 71 50 13 1 178Number empty 0 6 8 26 23 5 0 68Mean stomach content (g) 0.057 0.084 0.210 0.399 0.352 3.721 18.040 0.668Mean fish length (cm) 14 17 23 28 32 37 42 28

Page 125
Table B-54b. Diet composition and sampling data for fourspot flounder by geographic area. (Samplesgathered during 1977-80. Data expressed as percentage of stomach content by weight.Squared brackets indicate major taxon subtotal; parentheses indicate minor taxon subtotal.)
Geographic Area Southern
Middle New GeorgesStomach Contents Atlantic England Bank
MOLLUSCA [1.4] [45.3] [73.1]Bivalvia (1.4) - -Cephalopoda - (45.3) (73.1)
Loligo sp. - 32.0 -Sepiolidae - 13.3 -Octopoda - - 25.2Cephalopoda unid. - - 47.9
POLYCHAETA [6.0] [4.1] -Aphroditidae - 1.1 -Sabellidae - 1.6 -Asabellides oculata 2.2 - -Polychaeta unid. 3.8 1.4 -
SIPUNCULA - [1.2] -Golfingia sp. - 1.2 -
CRUSTACEA [50.2] [24.7] [25.2]Amphipoda (<0.1) (2.4) (0.4)Mysidacea (1.4) (0.2) -
Neomysis americana 1.4 - -Mysidacea unid. - 0.2 -
Decapoda (48.8) (20.9) (22.9)Hippolytidae - - <0.1Dichelopandalus leptocerus - 4.9 5.7Pandalidae 0.1 <0.1 0.9Crangon septemspinosa 7.1 3.8 1.5Munida iris 11.2 - -Munida sp. 7.9 - <0.1Cancer irroratus 20.2 11.8 11.5Cancridae 0.9 0.4 -Albunea sp. - - 2.0Decapoda unid. 1.4 <0.1 1.3
Crustacea unid. (<0.1) (1.2) (1.9)OSTEICHTHYES [41.6] [19.5] [0.3]
Gadus morhua - 12.6 -Merluccius bilinearis 16.7 2.6 -Ophidiidae 10.5 - -Peprilus triacanthus - 0.6 -Bothidae 10.7 - -Pleuronectes ferruginus - <0.1 -Pleuronectidae 0.3 - -Osteichthyes larvae - <0.1 -Osteichthyes unid. 3.4 3.7 0.3
ANIMAL REMAINS AND MISC. [0.8] [5.2] [1.4]
Number sampled 28 90 60Number empty 4 44 20Mean stomach content (g) 0.733 0.296 1.195Mean fish length (cm) 26 28 28

Page 126
Table B-55a. Diet composition and sampling data for windowpane by fish length category. (Samples gathered during 1977-80. Data expressed aspercentage of stomach content by weight. Squared brackets indicate major taxon subtotal; parentheses indicate minor taxon subtotal.)
Length Category (cm) Stomach Contents 1-5 6-10 11-15 16-20 21-25 26-30 31-35 36-40 41-45 Total
CHAETOGNATHA - - - - [<0.1] [0.1] [0.3] [3.5] - [0.2]POLYCHAETA - - [0.1] [6.5] [0.6] [0.3] [3.2] [1.4] - [0.9]
Diopatra cuprea - - - - - - 2.0 - - 0.2Ampharetidae - - - 1.2 - 0.2 - - - 0.1Polychaeta unid. - - 0.1 5.3 0.6 0.1 1.2 1.4 - 0.6
CRUSTACEA [100.0] [100.0] [99.1] [82.2] [69.0] [63.5] [63.1] [35.6] [9.0] [65.9]Cumacea - (<0.1) - (<0.1) (0.2) (<0.1) (<0.1) (<0.1) (4.0) (0.1)Isopoda - - (<0.1) (<0.1) - - (<0.1) (0.2) - (<0.1)Amphipoda (8.8) - (2.5) (1.4) (8.4) (7.4) (10.7) (6.3) - (7.8)
Gammarus annulatus - - 0.7 0.3 4.8 5.4 8.2 0.3 - 5.2Gammarus lawrencianus - - 1.4 - - <0.1 - - - <0.1Gammarus sp. - - - <0.1 <0.1 0.6 1.2 - - 0.5Oedicerotidae - - 0.4 - 0.3 0.2 <0.1 0.2 - 0.2Leptocheirus pinguis - - - 1.1 3.0 0.7 - - - 1.2Amphipoda unid. 8.8 - - <0.1 0.3 0.5 1.3 5.8 - 0.7
Mysidacea (84.8) (95.0) (81.3) (76.1) (41.8) (40.4) (34.6) (9.2) - (41.7)Mysidopsis bigelowi - - - 11.9 0.6 <0.1 <0.1 0.4 - 0.6Neomysis americana 84.8 94.6 45.6 60.6 41.2 40.0 34.6 8.8 - 40.3Mysidacea unid. - 0.4 35.7 3.6 <0.1 0.4 <0.1 - - 0.8
Euphausiacea (4.0) (0.3) (5.2) - (0.6) (1.5) (0.8) - - (1.1)Meganyctiphanes norvegica 4.0 0.3 5.2 - 0.6 1.5 0.8 - - 1.1
Decapoda - (0.8) (9.3) (4.7) (15.5) (13.6) (15.9) (19.6) - (14.3)Acetes americanus - - 0.6 - - - - - - <0.1Dichelopandalus leptocerus - - - - 0.4 0.2 1.8 4.3 - 0.5Pandalidae - - - - 1.2 0.1 0.2 - - 0.4Crangon septemspinosa - 0.8 1.6 4.7 10.4 11.8 13.6 13.8 - 11.3Crangonidae - - - - 0.9 <0.1 <0.1 1.5 - 0.3Decapoda larvae - - 7.1 <0.1 2.1 1.4 - - - 1.4Decapoda unid. - - <0.1 <0.1 0.5 0.1 0.3 - - 0.4
Crustacea unid. (2.4) (3.9) (0.8) (<0.1) (2.5) (0.6) (1.1) (0.3) (5.0) (0.9)SALPIDAE - - - [1.1] - - - - - [<0.1]OSTEICHTHYES - - [<0.1] [9.3] [28.0] [34.6] [31.0] [59.2] [31.0] [31.4]
Ophichthus cruentifer - - - - - <0.1 - - - 0.1Engraulidae - - - - 3.9 5.6 1.1 - - 4.3Brosme brosme - - - - - 0.4 - 11.4 - 0.4Merluccius bilinearis - - - - 6.6 1.2 0.7 - - 2.4Gadidae - - - - <0.1 0.6 - - - 0.3Syngnathidae - - - - 0.2 <0.1 - - - <0.1Ammodytes dubius - - - 3.4 9.0 20.3 28.0 47.8 - 17.8Pleuronectiformes - - - - <0.1 - - - - <0.1Osteichthyes larvae - - - 1.7 0.4 1.9 <0.1 - - 1.2Osteichthyes unid. - - <0.1 4.2 7.9 4.6 1.2 - 31.0 4.9
ANIMAL REMAINS AND MISC. - - [0.8] [0.9] [2.4] [1.5] [2.4] [0.3] [60.0] [1.6]
Number sampled 22 32 43 102 376 401 103 12 1 1092Number empty 9 5 8 28 153 133 40 3 0 379Mean stomach content (g) 0.006 0.074 0.187 0.264 0.478 1.007 0.785 0.946 0.100 0.653Mean fish length (cm) 4 7 13 18 23 27 32 37 41 24

Page 127
Table B-55b. Diet composition and sampling data for windowpane by geographic area. (Samples gathered during 1977-80. Dataexpressed as percentage of stomach content by weight. Squared brackets indicate major taxon subtotal; parentheses indicateminor taxon subtotal.)
Geographic Area Inshore Inshore
Southern South North Middle New Georges of Cape of Cape
Stomach Contents Atlantic England Bank Hatteras Hatteras
CHAETOGNATHA [0.1] [<0.1] [2.5] - -POLYCHAETA [0.5] [0.5] [2.3] - [0.9]
Diopatra cuprea - - - - 0.4Ampharetidae - 0.5 - - <0.1Polychaeta unid. 0.5 <0.1 2.3 - 0.5
CRUSTACEA [42.5] [73.7] [18.5] [100.0] [75.3]Cumacea (<0.1) (<0.1) (<0.1) - (0.2)Isopoda - (<0.1) (<0.1) - (<0.1)Amphipoda (0.3) (19.0) (1.7) - (7.1)
Gammarus annulatus - 16.9 - - 3.6Gammarus sp. <0.1 <0.1 - - 0.9Oedicerotidae <0.1 - 0.1 - 0.3Leptocheirus pinguis - 1.5 - - 1.6Amphipoda unid. 0.3 0.6 1.6 - 0.7
Mysidacea (27.6) (21.3) (0.6) - (57.3)Mysidopsis bigelowi <0.1 <0.1 0.3 - 1.1Neomysis americana 27.6 21.3 0.2 - 54.8Mysidacea unid. <0.1 <0.1 0.1 - 1.4
Euphausiacea - - - - (2.0)Meganyctiphanes norvegica - - - - 2.0
Decapoda (14.6) (32.7) (15.3) (100.0) (7.5)Acetes americanus - - - 8.2 -Dichelopandalus leptocerus <0.1 2.6 - - -Pandalidae - 0.2 0.8 - 0.5Crangon septemspinosa 6.8 29.3 14.3 - 6.5Crangonidae <0.1 0.1 0.2 - 0.4Decapoda larvae 7.1 - - 91.8 <0.1Decapoda unid. 0.7 0.5 <0.1 - 0.1
Crustacea unid. (<0.1) (0.7) (0.9) - (1.2)SALPIDAE - - - - [<0.1]OSTEICHTHYES [55.7] [23.6] [71.6] - [22.1]
Ophichthus cruentifer 0.3 - - - -Engraulidae - - - - 7.6Brosme brosme - - - - 0.7Merluccius bilinearis 0.7 - - - 4.0Gadidae - <0.1 - - 0.6Syngnathidae - - - - <0.1Ammodytes dubius 45.0 20.2 70.1 - 2.8Pleuronectiformes 0.1 - - - -Osteichthyes larvae 0.3 0.2 - - 2.0Osteichthyes unid. 9.3 3.2 1.5 - 4.4
ANIMAL REMAINS AND MISC. [1.2] [2.2] [5.1] - [1.7]
Number sampled 224 132 88 12 637Number empty 120 45 38 4 174Mean stomach content (g) 0.590 1.013 0.473 0.052 0.636Mean fish length (cm) 25 26 28 12 22

Page 128
Table B-56a. Diet composition and sampling data for witch flounder by fish length category. (Samples gathered during 1977-80. Data expressed aspercentage of stomach content by weight. Squared brackets indicate major taxon subtotal; parentheses indicate minor taxon subtotal.)
Length Category (cm) Stomach Contents <26 26-30 31-35 36-40 41-45 46-50 51-55 56-60 61-65 Total
MOLLUSCA [0.1] - [0.3] [12.6] [2.9] [0.6] [2.7] [0.1] - [2.3]Gastropoda - - - (1.5) (<0.1) - (<0.1) (<0.1) - (0.1)Bivalvia (0.1) - (0.3) (11.1) (2.9) (0.6) (2.7) (0.1) - (2.2)
Yoldia limatula - - - - - - 1.9 - - 0.7Yoldia sp. - - - 11.1 - 0.6 <0.1 - - 0.9Bivalvia unid. 0.1 - 0.3 - 2.9 <0.1 0.8 0.1 - 0.6
POLYCHAETA [81.3] [96.0] [92.2] [81.1] [87.5] [84.7] [82.3] [86.3] [99.9] [85.7]Capitellidae - 2.6 - - 0.8 10.3 4.2 0.8 - 3.9Arabellidae - - - - - 4.7 - - - 1.2Eunice pennata - - - - - 4.1 - - - 0.8Lumbrineris fragilis - 8.3 7.5 - - 1.6 3.8 <0.1 - 2.3Lumbrineris sp. - - <0.1 - 3.7 - - - - 0.3Ninoe brevipes - - - - - - - 11.7 - 1.9Lumbrineridae 37.4 0.9 8.3 4.9 <0.1 0.7 1.1 <0.1 2.4 1.9Onuphis nebulosa - - - - - 1.3 - - - 0.3Ophelina sp. - <0.1 - - - - - 1.4 - 0.2Glycera dibranchiata - - - 32.0 - - - - - 2.3Goniada maculata - 1.0 - 1.0 - - 0.4 - - 0.2Goniada norvegica - - - - - - - 9.5 - 1.6Goniada sp. - - - - 5.8 0.3 <0.1 10.5 <0.1 2.3Ophioglycera gigantea - - - - - 18.9 - - - 3.8Goniadidae - 0.5 - 8.7 - - - - - 0.6Nephtys sp. - - 42.9 0.9 2.8 - 0.7 0.1 - 2.8Nephtyidae - - 1.4 3.8 1.1 0.8 0.1 0.2 - 0.7Sabellidae - - 1.6 <0.1 - <0.1 0.8 <0.1 - 0.4Spio sp. - - - - - - 0.5 - 3.2 0.6Spionidae - - - 2.8 - 0.7 0.2 4.7 - 1.2Sternaspis scutata - - - - - 0.7 1.5 1.8 5.1 1.2Sternaspidae - 5.8 - 3.3 - - - 4.4 - 1.1Terebellidae - - - - 5.3 - - - - 0.4Polychaeta unid. 43.9 76.9 30.5 23.7 68.0 40.6 69.0 41.2 89.2 53.7
CRUSTACEA [6.3] [0.6] [2.1] [4.1] [1.2] [2.7] [4.6] [1.4] - [3.4]Isopoda - - - - - - (1.5) (0.5) - (0.6)Amphipoda (5.5) (0.5) (2.1) (4.1) (0.2) (2.2) (2.7) (0.9) - (2.4)
Byblis serrata 3.4 - 0.5 - - - 1.8 - - 0.7Casco bigelowi 1.1 - 0.9 - - 1.2 <0.1 0.2 - 0.4Amphipoda unid. 1.0 0.5 0.7 4.1 0.2 1.0 0.9 0.7 - 1.3
Crustacea unid. (0.8) (0.1) - (<0.1) (1.0) (0.5) (0.4) - - (0.4)ECHINODERMATA - - - - [0.2] [1.3] [2.6] [7.2] - [2.4]
Dendrochirotida - - - - - - 2.6 - - 0.9Holothuroidea - - - - 0.2 1.3 - 7.2 - 1.5
ASCIDIACEA [12.3] - [0.3] - [<0.1] [1.2] [0.1] - - [0.5]ANIMAL REMAINS AND MISC. - [3.4] [5.1] [2.2] [8.2] [9.5] [7.7] [5.0] [0.1] [5.7]
Number sampled 6 10 10 9 13 28 39 13 2 130Number empty 2 1 0 0 1 6 9 1 1 21Mean stomach content (g) 0.143 0.194 0.463 0.717 0.534 0.641 0.841 1.131 1.817 0.692Mean fish length (cm) 21 28 32 37 44 47 53 57 62 45

Page 129
Table B-56b. Diet composition and sampling data for witch flounder by geographic area. (Samples gathered during 1977-80.Data expressed as percentage of stomach content by weight. Squared brackets indicate major taxon subtotal;parentheses indicate minor taxon subtotal.)
Geographic Area Inshore North
Georges Gulf of Scotian of CapeStomach Contents Bank Maine Shelf Hatteras
MOLLUSCA [2.1] [2.2] [25.2] [2.1]Gastropoda - (0.2) - -Bivalvia (2.1) (2.0) (25.2) (2.1)
Yoldia limatula - - - 1.9Yoldia sp. 0.2 1.8 - -Bivalvia unid. 1.9 0.2 25.2 0.2
POLYCHAETA [76.7] [82.6] [74.7] [90.7]Capitellidae 0.7 7.2 - -Arabellidae - 1.8 - -Eunice pennata - 1.6 - -Lumbrineris fragilis 11.4 1.3 - 1.4Lumbrineris sp. 3.1 - - -Ninoe brevipes - - - 5.1Lumbrineridae 0.1 2.7 1.5 1.2Onuphis nebulosa - 0.5 - -Ophelina sp. - <0.1 - 0.6Glycera dibranchiata 24.1 - - -Goniada maculata - 0.2 - 0.4Goniada sp. 22.8 0.1 - 4.2Ophioglycera gigantea - 7.2 - -Goniadidae - 1.3 - -Nephtys sp. - 4.5 - 1.0Nephtyidae 0.5 <0.1 34.5 0.8Sabellidae - 0.8 - -Spio sp. - - - 0.9Spionidae - 0.4 - 2.6Sternaspis scutata - <0.1 - 3.0Sternaspidae 7.5 0.2 29.8 <0.1Terebellidae - 0.8 - -Polychaeta unid. 6.5 52.0 8.9 69.5
CRUSTACEA [11.2] [1.9] - [2.4]Isopoda (0.9) - - (1.4)Amphipoda (10.3) (1.4) - (0.9)
Byblis serrata 6.6 0.1 - <0.1Casco bigelowi 0.4 0.1 - 0.7Amphipoda unid. 3.3 1.2 - 0.2
Crustacea unid. - (0.5) - (0.1)ECHINODERMATA [6.3] [3.4] - -
Dendrochirotida - 1.8 - -Holothuroidea 6.3 1.6 - -
ASCIDIACEA - [0.8] - -ANIMAL REMAINS AND MISC. [3.7] [9.1] [0.1] [4.8]
Number sampled 6 87 2 36Number empty 0 17 0 4Mean stomach content (g) 1.427 0.541 0.359 0.933Mean fish length (cm) 39 44 40 48

Page 130
Table B-57a. Diet composition and sampling data for American plaice by fish length category. (Samples gathered during 1977-80. Data expressed aspercentage of stomach content by weight. Squared brackets indicate major taxon subtotal; parentheses indicate minor taxon subtotal.)
Length Category (cm) Stomach Contents <16 16-20 21-25 26-30 31-35 36-40 41-45 46-50 >50 Total
ANTHOZOA - - - [1.8] [4.3] - - - - [0.7]NEMATODA [1.8] [2.5] [11.1] [<0.1] [<0.1] [<0.1] - - - [0.5]MOLLUSCA - - [0.2] [<0.1] [34.6] [24.3] [12.2] [29.8] [16.8] [20.3]
Bivalvia - - (0.2) (<0.1) (34.6) (24.3) (12.2) (24.4) (11.9) (17.7)Chlamys islandica - - - - - - - - 7.6 2.5Arctica islandica - - - - 0.4 - - - 4.3 1.4Cyclocardia borealis - - - - - - 11.2 - - 1.3Bivalvia unid. - - 0.2 <0.1 34.2 24.3 1.0 24.4 <0.1 12.5
Mollusca unid. - - - - - - - (5.4) (4.9) (2.6)POLYCHAETA [5.2] [8.1] [2.5] [5.0] [1.4] [4.3] [3.3] - [5.8] [2.2]
Lumbrineridae <0.1 0.9 - <0.1 - - - - - <0.1Nephtys sp. - - - 0.7 0.4 - - - - 0.1Nephtyidae 3.4 - 2.4 - - - - - - 0.2Spionidae 0.4 0.8 <0.1 1.7 <0.1 0.9 0.4 - 0.3 0.4Terebellidae - - - - - 0.4 - - - <0.1Polychaeta unid. 1.4 6.4 0.1 2.6 1.0 3.0 2.9 - 5.5 1.5
CRUSTACEA [0.4] [2.1] [14.7] [8.3] [17.1] [13.0] [3.0] [0.7] [0.2] [5.2]Isopoda - - - (0.1) - - - - - (<0.1)
Chiridotea sp. - - - 0.1 - - - - - <0.1Amphipoda (0.2) (0.2) - (1.8) (0.9) (0.5) - (0.7) - (0.5)
Unciola irrorata 0.2 - - - - - - - - <0.1Monoculodes intermedius - 0.2 - - - - - - - <0.1Leptocheirus pinguis - - - 1.8 0.9 - - 0.7 - 0.4Gammaridea <0.1 - - - <0.1 0.5 - <0.1 - 0.1
Euphausiacea - - - - - (7.9) - - - (0.7)Decapoda (0.2) - (14.7) (6.4) (16.2) (4.6) (3.0) - (0.2) (4.0)
Dichelopandalus leptocerus - - - 2.8 - - 3.0 - - 0.6Pandalidae - - - - 16.2 4.6 - - - 2.5Crangon septemspinosa - - 13.6 3.6 - - - - - 0.8Crangonidae 0.2 - - - - - - - - <0.1Decapoda unid. - - 1.1 - - - - - 0.2 0.1
Crustacea unid. - (1.9) - - (<0.1) - (<0.1) - - (<0.1)ECHINODERMATA [4.1] [3.2] [0.7] [26.4] [26.3] [41.8] [64.9] [68.3] [62.0] [49.8]
Echinoidea - - - (1.8) (3.2) (1.1) (0.5) (17.2) (1.6) (4.5)Echinarachnius parma - - - - - - - 16.5 - 3.1Echinoidea unid. - - - 1.8 3.2 1.1 0.5 0.7 1.6 1.4
Ophiuroidea (4.1) (2.4) (0.7) (24.6) (23.1) (40.7) (64.4) (20.3) (60.4) (39.5)Ophiura robusta - - - - 3.8 - - - - 0.5Ophiura sarsi - 1.9 - 18.3 3.4 8.7 56.7 17.4 6.4 14.5Ophiuroidea unid. 4.1 0.5 0.7 6.3 15.9 32.0 7.7 2.9 54.0 24.5
Echinodermata unid. - (0.8) - - - - - (30.8) - (5.8)ANIMAL REMAINS AND MISC. [88.5] [25.6] [64.1] [34.7] [16.3] [16.3] [16.6] [1.2] [7.3] [15.9]SAND AND ROCK - [58.5] [6.7] [23.8] - [0.3] - - [7.9] [5.4]
Number sampled 30 22 35 51 53 34 33 19 23 300Number empty 12 9 19 27 24 18 21 10 7 147Mean stomach content (g) 0.153 0.077 0.157 0.250 0.366 0.418 0.530 1.546 2.187 0.518Mean fish length (cm) 12 18 23 28 32 37 42 47 55 32

Page 131
Table B-57b. Diet composition and sampling data for American plaice by geographic area. (Samples gathered during 1977-80. Data expressed as percentage of stomach content by weight. Squared brackets indicate major taxonsubtotal; parentheses indicate minor taxon subtotal.)
Geographic Area Inshore North
Georges Gulf of Scotian of CapeStomach Contents Bank Maine Shelf Hatteras
ANTHOZOA [0.8] - - [2.9]NEMATODA - [0.1] - [2.3]MOLLUSCA [0.4] [26.4] [61.2] [<0.1]
Bivalvia (0.4) (24.6) (37.3) (<0.1)Chlamys islandica - - 37.3 -Arctica islandica 0.3 2.5 - -Cyclocardia borealis - 2.2 - -Bivalvia unid. 0.1 19.9 - <0.1
Mollusca unid. - (1.8) (23.9) -POLYCHAETA [0.5] [1.0] - [7.9]
Lumbrineridae - <0.1 - <0.1Nephtys sp. - <0.1 - 0.3Nephtyidae - - - 1.0Spionidae - <0.1 - 1.9Terebellidae - - - 0.2Polychaeta unid. 0.5 1.0 - 4.5
CRUSTACEA [2.3] [2.3] - [17.6]Isopoda <(0.1) - - -
Chiridotea sp. <0.1 - - -Amphipoda (2.2) (<0.1) - (0.2)
Unciola irrorata <0.1 - - -Monoculodes intermedius - - - <0.1Leptocheirus pinguis 2.2 - - -Gammaridea <0.1 <0.1 - 0.2
Euphausiacea - (1.3) - -Decapoda (0.1) (1.0) - (17.4)
Dichelopandalus leptocerus - 1.0 - -Pandalidae - - - 13.2Crangon septemspinosa 0.1 - - 4.0Decapoda unid. - <0.1 - 0.2
Crustacea unid. - (<0.1) - -ECHINODERMATA [92.3] [42.4] - [47.5]
Echinoidea (16.9) (2.4) - -Echinarachnius parma 16.9 - - -Echinoidea unid. - 2.4 - -
Ophiuroidea (75.4) (40.0) - (16.0)Ophiura robusta - - - 2.5Ophiura sarsi - 24.2 - 4.6Ophiuroidea unid. 75.4 15.8 - 8.9
Echinodermata unid. - (<0.1) - (31.5)ANIMAL REMAINS AND MISC. [3.6] [25.3] - [14.3]SAND AND ROCK [0.1] [2.5] [38.8] [7.5]
Number sampled 17 186 6 91Number empty 4 92 5 46Mean stomach content (g) 1.689 0.471 1.717 0.315Mean fish length (cm) 27 33 40 30

Page 132
Table B-58a. Diet composition and sampling data for Atlantic halibut by fish length category. (Samples gathered during 1977-80. Dataexpressed as percentage of stomach content by weight. Squared brackets indicate major taxon subtotal; parentheses indicate minortaxon subtotal.)
Length Category (cm) Stomach Contents <31 31-40 41-50 51-60 61-70 >70 Total
CEPHALOPODA - - - [0.6] [42.7] [14.8] [18.5]Illex illecebrosus - - - - - 6.5 4.4Illex sp. - - - - 19.5 7.7 9.0Octopoda - - - - 4.2 - 0.9Cephalopoda unid. - - - 0.6 19.0 0.6 4.2
CRUSTACEA [23.4] [83.0] [79.0] [79.1] [7.4] [5.9] [15.4]Amphipoda (0.1) (<0.1) - - (<0.1) (<0.1) (<0.1)Mysidacea - - (<0.1) - (<0.1) - (<0.1)Euphausiacea - - - (<0.1) - - (<0.1)Decapoda (21.6) (83.0) (79.0) (79.1) (7.4) (5.9) (15.4)
Spirontocaris liljeborgii - - 0.2 <0.1 - - <0.1Dichelopandalus leptocerus - 52.5 42.4 46.7 7.4 - 7.2Pandalus borealis - - 3.4 - - 0.1 0.2Pandalus montagui - - 4.8 16.9 - - 1.4Pandalidae - 1.1 11.2 4.1 - - 0.7Crangon septemspinosa 20.1 4.5 - - - - 0.1Pagurus acadianus 0.6 15.8 3.8 7.4 - - 0.9Pagurus pollicaris - 0.6 - - - - <0.1Pagurus pubescens - - 0.9 - - - <0.1Pagurus arcuatus - - 2.1 0.7 - - 0.1Pagurus sp. 0.4 - 0.9 - <0.1 - 0.1Paguridae - 5.5 0.8 - - - 0.1Cancer borealis - - - - - 5.3 3.6Cancer irroratus - 1.2 3.3 3.3 - - 0.4Crab unid. - 1.5 0.4 - - 0.5 0.4Shrimp unid. 0.5 0.3 4.8 - - <0.1 0.2
Crustacea unid. (1.7) - - - - - (<0.1)OSTEICHTHYES [76.6] [13.8] [20.9] [19.3] [49.6] [78.7] [65.7]
Alosa aestivalis - - - - - 1.0 0.7Clupeidae - - 11.1 - <0.1 0.2 0.6Gadus morhua - - - - - 2.5 1.7Merluccius bilinearis - - 1.6 - 16.4 12.2 11.6Gadidae - - - - 7.4 - 1.5Aspidophoroides monopterygius - 2.0 - - - - <0.1Ammodytes dubius - - 0.4 - 8.5 0.4 2.0Myoxocephalus octodecemspinosus - - - - 0.1 48.1 32.5Pholis gunnellus - 9.5 - - - - 0.1Macrozoarces americanus - - - - 8.2 9.5 8.0Hippoglossoides platessoides - - - - 4.5 - 0.9Pleuronectes ferruginus - - - 6.2 - - 0.5Osteichthyes larvae - 0.3 - - - - <0.1Osteichthyes unid. 76.6 2.0 7.8 13.1 4.5 4.8 5.6
ANIMAL REMAINS AND MISC. - [3.2] [0.1] [1.0] [0.3] [0.6] [0.4]
Number sampled 7 19 26 25 21 27 125Number empty 3 4 4 9 5 9 34Mean stomach content (g) 1.128 2.553 6.943 13.716 43.532 115.604 36.922Mean fish length (cm) 22 35 45 55 66 99 59

Page 133
Table B-58b. Diet composition and sampling data for Atlantic halibut by geographic area. (Samples gathered during 1977-80.Data expressed as percentage of stomach content by weight. Squared brackets indicate major taxon subtotal;parentheses indicate minor taxon subtotal.)
Geographic Area Inshore North
Georges Gulf of Scotian of CapeStomach Contents Bank Maine Shelf Hatteras
CEPHALOPODA [15.4] [25.4] [22.9] [1.1]Illex illecebrosus 8.2 - - -Illex sp. 7.2 24.1 - -Octopoda - - 4.2 -Cephalopoda unid. - 1.3 18.7 1.1
CRUSTACEA [0.1] [22.0] [49.6] [1.5]Amphipoda (<0.1) (<0.1) - (<0.1)Mysidacea (<0.1) (<0.1) - -Euphausiacea - - (<0.1) -Decapoda (0.1) (22.0) (49.6) (1.5)
Spirontocaris liljeborgii - <0.1 <0.1 -Dichelopandalus leptocerus <0.1 1.8 32.5 -Pandalus borealis - 0.3 0.6 -Pandalus montagui - - 7.0 -Pandalidae <0.1 1.9 1.6 -Crangon septemspinosa 0.1 <0.1 <0.1 -Pagurus acadianus <0.1 - 3.9 1.2Pagurus pollicaris <0.1 - - -Pagurus pubescens - - 0.2 -Pagurus arcuatus <0.1 - 0.4 -Paguridae <0.1 0.3 <0.1 0.3Cancer borealis - 16.8 - -Cancer irroratus <0.1 <0.1 1.6 -Crab unid. <0.1 <0.1 1.8 -Shrimp unid. <0.1 0.9 <0.1 -
Crustacea unid. - (<0.1) (<0.1) -OSTEICHTHYES [84.0] [51.8] [25.7] [97.3]
Alosa aestivalis - 3.3 - -Clupeidae - 0.8 - 10.8Gadus morhua 3.1 - - -Merluccius bilinearis 6.9 23.7 0.3 67.3Gadidae - - 7.0 -Aspidophoroides monopterygius - - 0.1 -Ammodytes dubius - 9.0 - -Myoxocephalus octodecemspinosus 60.6 - - -Pholis gunnellus - - 0.3 1.0Macrozoarces americanus 11.9 7.4 - -Hippoglossoides platessoides - - 4.2 -Pleuronectes ferruginus - - 2.2 -Osteichthyes larvae - - - <0.1Osteichthyes unid. 1.5 7.6 11.6 18.2
ANIMAL REMAINS AND MISC. [0.5] [0.8] [1.8] [0.1]
Number sampled 19 36 64 6Number empty 6 11 17 0Mean stomach content (g) 130.410 27.629 14.941 31.102Mean fish length (cm) 64 64 55 45

Page 134
Table B-59a. Diet composition and sampling data for winter flounder by fish length category. (Samples gathered during 1977-80. Data expressed aspercentage of stomach content by weight. Squared brackets indicate major taxon subtotal; parentheses indicate minor taxon subtotal.)
Length Category (cm) Stomach Contents <16 16-20 21-25 26-30 31-35 36-40 41-45 46-50 >50 Total
CNIDARIA [1.9] [17.6] [19.5] [29.4] [27.0] [18.2] [45.6] [49.5] [70.7] [39.0]Hydrozoa (<0.1) (2.4) (2.4) (3.7) (2.0) (3.3) (8.6) (9.7) (6.7) (5.6)Anthozoa (1.9) (15.2) (17.1) (25.7) (25.0) (14.9) (37.0) (39.8) (64.0) (33.4)
Actiniaria - - 0.7 0.9 - 2.4 3.5 - 1.4 1.4Ceriantharia - 9.5 9.1 16.7 18.2 8.1 23.5 16.5 39.2 19.6Anthozoa unid. 1.9 5.7 7.3 8.1 6.8 4.4 10.0 23.3 23.4 12.4
RHYNCHOCOELA [0.1] [0.2] [0.6] [0.7] [0.9] [1.2] [2.9] [1.9] [2.2] [1.8]MOLLUSCA [<0.1] [0.6] [1.2] [0.7] [1.5] [0.6] [5.1] [5.4] [0.6] [2.5]POLYCHAETA [81.0] [51.9] [40.9] [45.8] [48.6] [43.4] [25.2] [28.3] [12.8] [35.6]
Maldanidae 1.2 4.8 1.2 1.0 0.8 0.4 0.3 0.1 0.3 0.7Lumbrineris fragilis 0.4 0.3 3.7 2.8 2.0 1.0 1.7 2.3 2.4 2.0Lumbrineridae 0.5 1.5 2.4 1.8 4.4 0.4 0.7 0.5 0.6 1.5Diopatra sp. - - - 3.7 0.8 4.0 - - - 1.2Pherusa affinis <0.1 - 1.8 3.1 3.1 1.5 3.1 0.1 0.2 1.8Flabelligeridae 0.4 15.4 7.0 1.9 1.9 0.4 <0.1 0.1 0.4 1.1Nephtys spp. - 2.1 0.4 2.6 0.5 0.7 0.6 <0.1 0.8 0.8Nereis spp. <0.1 3.6 <0.1 0.1 0.5 <0.1 0.4 0.3 <0.1 0.5Chone infundibuliformis - - 4.7 3.1 2.9 0.9 2.0 <0.1 - 1.6Sabellidae 2.8 <0.1 1.6 2.2 7.6 0.2 <0.1 <0.1 <0.1 1.6Spiophanes bombyx <0.1 0.3 <0.1 0.8 0.3 5.0 6.8 5.7 5.5 4.0Spionidae 4.7 <0.1 <0.1 1.2 0.7 0.9 0.6 1.5 - 0.8Ampharete spp. 9.2 2.8 2.9 4.6 2.0 1.1 0.2 0.4 <0.1 1.5Asabellides oculata 46.2 0.1 <0.1 2.6 13.1 12.5 0.4 <0.1 - 5.0Polychaeta unid. 15.6 21.0 15.2 14.3 8.0 14.4 8.4 17.3 2.6 11.5
CRUSTACEA [11.3] [19.2] [23.0] [10.7] [11.4] [7.5] [6.5] [2.3] [0.7] [7.9]Amphipoda (9.3) (14.9) (19.0) (10.0) (9.5) (7.4) (5.8) (1.5) (0.6) (6.7)
Unciola irrorata 5.1 4.9 3.0 2.6 0.6 0.5 0.4 0.3 0.2 0.9Gammarus annulatus 1.3 3.2 0.4 1.0 3.0 1.2 0.5 - - 0.9Leptocheirus pinguis 0.7 1.7 3.0 0.9 1.1 0.5 0.1 <0.1 <0.1 0.6Pontogeneia inermis 0.2 0.2 1.0 1.3 1.0 3.4 1.8 0.3 0.1 1.3Amphipoda unid. 2.0 4.9 11.6 4.2 3.8 1.8 3.0 0.9 0.3 3.0
Decapoda (1.6) (3.4) (3.0) (0.7) (0.9) (0.1) (0.6) (0.8) (<0.1) (0.8)Crustacea unid. (0.4) (0.9) (1.0) (<0.1) (1.0) (<0.1) (0.1) (<0.1) (0.1) (0.4)
OSTEICHTHYES [<0.1] - [2.3] [0.1] [0.3] [19.6] [<0.1] [<0.1] [<0.1] [3.5]Engraulidae - - - - - 2.5 - - - 0.4Ammodytes dubius - - - - - 1.3 - - - 0.2Paralichthys dentatus - - - - - - - <0.1 - <0.1Bothidae - - - - - 15.8 - - - 2.7Osteichthyes eggs and larvae - - - - <0.1 - - - - <0.1Osteichthyes unid. <0.1 - 2.3 0.1 0.3 <0.1 <0.1 <0.1 <0.1 0.2
ANIMAL REMAINS AND MISC. [5.3] [8.1] [12.2] [10.7] [8.0] [7.6] [10.8] [7.1] [10.7] [6.8]SAND AND ROCK [0.4] [2.4] [0.3] [1.9] [2.3] [1.9] [3.9] [5.5] [2.3] [2.9]
Number sampled 61 117 285 388 326 214 169 116 70 1746Number empty 5 35 78 125 111 77 44 38 25 538Mean stomach content (g) 0.369 0.291 0.426 0.907 1.495 2.410 3.161 4.380 6.446 1.733Mean fish length (cm) 13 18 23 28 32 37 42 47 56 32

Page 135
Table B-59b. Diet composition and sampling data for winter flounder by geographic area. (Samples gathered during 1977-80. Dataexpressed as percentage of stomach content by weight. Squared brackets indicate major taxon subtotal; parenthesesindicate minor taxon subtotal.)
Geographic Area Inshore
Southern North Middle New Georges Gulf of Scotian of Cape
Stomach Contents Atlantic England Bank Maine Shelf Hatteras CNIDARIA [8.2] [32.7] [48.5] [35.6] [90.4] [22.3]
Hydrozoa - (4.4) (7.1) (0.2) - (3.4)Anthozoa (8.2) (28.3) (41.4) (35.4) (90.4) (18.9)
Actiniaria - <0.1 2.3 0.2 - 0.6Ceriantharia 8.2 22.2 21.4 33.0 90.4 13.7Anthozoa unid. - 6.1 17.7 2.2 - 4.6
RHYNCHOCOELA [1.1] [0.6] [1.7] [<0.1] - [1.9]MOLLUSCA - [0.1] [3.4] [2.5] [8.3] [1.1]POLYCHAETA [74.2] [43.8] [24.2] [37.1] [<0.1] [48.5]
Maldanidae - 1.4 <0.1 0.1 - 0.6Lumbrineris fragilis 15.6 <0.1 2.1 - - 2.8Lumbrineridae 1.0 1.0 0.7 0.7 - 2.9Diopatra sp. 23.5 - - - - 4.0Pherusa affinis - 3.4 1.4 - - 1.8Flabelligeridae 0.7 2.9 0.2 - - 2.2Nephtys spp. - 0.6 <0.1 - <0.1 2.3Chone infundibuliformis - 8.1 0.7 2.0 - <0.1Sabellidae - 10.8 <0.1 8.9 <0.1 0.2
Spiophanes bombyx - 0.1 7.1 - - <0.1Spionidae 8.7 <0.1 0.8 - - 1.1Ampharete spp. - 5.4 0.4 0.7 - 1.5Asabellides oculata - <0.1 <0.1 - - 17.4Polychaeta unid. 24.7 10.1 10.8 24.7 - 11.7
CRUSTACEA [3.8] [11.5] [3.2] [3.6] - [12.2]Amphipoda (1.3) (10.3) (2.8) (0.7) - (11.1)
Unciola irrorata 0.9 2.8 0.3 - - 1.0Gammarus annulatus - 2.6 - - - 2.0Leptocheirus pinguis - 1.8 0.2 <0.1 - 0.6Pontogeneia inermis - <0.1 1.6 - - 1.5Aeginina longicornis - 1.2 <0.1 - - 0.4Amphipoda unid. 0.4 1.9 0.7 0.7 - 5.6
Decapoda (2.5) (1.2) (0.4) (2.8) - (0.4)Crustacea unid. (<0.1) (<0.1) (<0.1) (0.1) - (0.7)
OSTEICHTHYES - [<0.1] [5.2] - - [2.1]Engraulidae - - - - - 1.5Ammodytes dubius - - 0.4 - - -Paralichthys dentatus - - <0.1 - - -Bothidae - - 4.8 - - -Osteichthyes eggs and larvae - - - - - <0.1Osteichthyes unid. - <0.1 <0.1 - - 0.6
ANIMAL REMAINS AND MISC. [6.5] [10.5] [9.6] [18.7] [1.3] [10.5]SAND AND ROCK [6.2] [0.8] [4.2] [2.5] - [1.4]
Number sampled 17 463 569 57 2 638Number empty 7 172 170 31 0 158Mean stomach content (g) 0.657 0.911 2.980 0.371 5.880 1.355Mean fish length (cm) 29 28 39 31 34 27

Page 136
Table B-60a. Diet composition and sampling data for yellowtail flounder by fish length category. (Samples gathered during 1977-80. Data expressedas percentage of stomach content by weight. Squared brackets indicate major taxon subtotal; parentheses indicate minor taxon subtotal.)
Length Category (cm) Stomach Contents 6-10 11-15 16-20 21-25 26-30 31-35 36-40 41-45 46-50 Total
CNIDARIA - - - - [4.9] [1.0] [8.3] - [0.5] [4.8]Ceriantharia - - - - 2.7 1.0 8.0 - 0.5 4.4Anthozoa - - - - 2.2 <0.1 0.3 - - 0.4
RHYNCHOCOELA - - - - [5.4] [0.8] [0.2] [0.3] - [0.9]MOLLUSCA [3.1] - - [<0.1] [2.4] [4.0] [0.6] [3.1] [<0.1] [1.5]POLYCHAETA [14.8] [18.1] [49.1] [40.7] [31.9] [53.3] [22.4] [71.6] [76.1] [38.5]
Maldanidae 6.2 - - <0.1 1.6 0.8 0.5 <0.1 <0.1 0.6Drilonereis sp. - - - - 0.1 - 0.2 9.0 - 1.3Lumbrineridae - - - 2.5 2.7 <0.1 0.3 0.7 2.5 1.2Pherusa sp. - - - 2.1 0.3 - 1.0 - - 0.7Ophelia sp. - - - 13.4 - - - - - 1.0Ophelina sp. - - - 1.2 2.0 2.1 2.3 - - 1.9Nephtyidae - - - 1.2 6.8 <0.1 1.1 0.2 - 1.5Sigalionidae - 15.6 - - - <0.1 0.2 - - 0.2Chone infundibuliformis - - - 0.9 0.4 6.7 1.8 - - 1.8Sabellidae - - - - 2.0 <0.1 1.5 0.3 - 1.0Cirratulidae - - - 1.6 4.9 <0.1 1.3 - <0.1 1.4Spiophanes bombyx - - - <0.1 6.4 11.7 5.9 40.3 31.2 12.0Ampharete arctica - - 29.8 0.2 0.1 - - - - 0.2Polychaeta unid. 8.6 2.5 19.3 17.6 4.6 32.0 6.3 21.1 42.4 13.7
CRUSTACEA [77.4] [79.0] [49.2] [56.4] [43.2] [34.3] [63.2] [13.4] [23.0] [48.9]Cumacea (0.6) - (0.5) (2.0) (0.7) (0.1) (<0.1) (<0.1) (0.1) (0.4)Isopoda (1.9) - - (0.3) (0.3) (0.2) (<0.1) (<0.1) - (0.2)Amphipoda (19.3) (19.4) (10.6) (22.3) (35.0) (29.4) (58.6) (13.4) (22.9) (41.5)
Ampelisca sp. - - 2.1 3.9 1.8 3.3 3.0 <0.1 3.8 2.6Byblis serrata - - - 2.0 2.7 <0.1 1.1 0.1 <0.1 1.0Ericthonius rubricornis - - - 0.5 0.9 0.3 40.6 <0.1 <0.1 19.9Unciola irrorata 9.3 - 0.2 9.1 11.2 3.0 1.7 0.2 2.3 3.4Gammarus annulatus - - - - 3.6 3.8 5.2 - - 3.4Gammarus sp. - - - - 0.1 0.1 <0.1 12.5 0.4 1.7Lysianassidae 1.9 5.9 - <0.1 <0.1 <0.1 - - - 0.4Oedicerotidae 6.2 13.5 2.8 <0.1 0.2 0.1 <0.1 <0.1 - 0.2Leptocheirus pinguis - - 3.1 3.8 3.1 8.2 4.4 0.4 13.2 4.5Dulichia sp. - - - - 8.7 2.5 1.0 <0.1 - 1.9Amphipoda unid. 1.9 - 2.4 3.0 2.7 8.1 1.6 0.2 3.2 2.5
Mysidacea - (1.7) - - (0.5) - (<0.1) - - (0.1)Decapoda (46.3) (57.9) (35.8) (31.0) (6.5) (3.6) (4.5) (<0.1) - (6.4)
Crangon septemspinosa 46.3 50.5 35.8 29.9 5.0 <0.1 4.4 - - 5.5Decapoda unid. - 7.4 - 1.1 1.5 3.6 0.1 <0.1 - 0.9
Crustacea unid. (9.3) - (2.3) (0.8) (0.2) (1.0) (0.1) - - (0.3)OSTEICHTHYES - - - - [4.6] - [0.2] - - [0.7]
Ammodytes dubius - - - - 4.6 - 0.2 - - 0.7ANIMAL REMAINS AND MISC. [4.7] [2.9] [1.7] [2.9] [7.6] [6.6] [5.1] [11.6] [0.4] [4.7]
Number sampled 8 10 2 38 54 47 52 10 4 225Number empty 0 3 0 19 19 20 15 1 1 78Mean stomach content (g) 0.020 0.114 0.548 0.400 0.474 0.522 1.902 2.718 2.406 0.904Mean fish length (cm) 7 12 18 23 28 33 37 43 49 30

Page 137
Table B-60b. Diet composition and sampling data for yellowtail flounder by geographic area. (Samplesgathered during 1977-80. Data expressed as percentage of stomach content by weight.Squared brackets indicate major taxon subtotal; parentheses indicate minor taxon subtotal.)
Geographic Area Inshore
Southern North New Georges of Cape
Stomach Contents England Bank Hatteras
CNIDARIA [6.2] [1.6] [3.2]Ceriantharia 6.1 0.4 2.7Anthozoa 0.1 1.2 0.5
RHYNCHOCOELA [0.1] [1.2] [4.7]MOLLUSCA [0.8] [4.0] [0.2]POLYCHAETA [28.9] [71.9] [25.6]
Maldanidae <0.1 2.0 0.5Drilonereis sp. 2.1 - -Lumbrineridae 1.0 1.0 1.3Pherusa sp. 0.7 - 2.0Ophelia sp. 1.5 - -Ophelina sp. 2.8 - -Nephtyidae 0.1 2.2 7.3Sigalionidae 0.1 1.3 <0.1Chone infundibuliformis 2.8 - -Sabellidae 1.5 0.1 -Cirratulidae 1.0 <0.1 5.9Spiophanes bombyx <0.1 53.7 -Polychaeta unid. 15.3 11.6 8.6
CRUSTACEA [56.4] [15.2] [62.5]Cumacea (0.3) (<0.1) (<0.1)Isopoda (<0.1) (0.2) (0.3)Amphipoda (54.1) (14.4) (22.1)
Ampelisca sp. 3.8 - 0.6Byblis serrata 0.2 3.7 0.2Ericthonius rubricornis 30.6 <0.1 <0.1Unciola irrorata 2.2 7.6 2.0Gammarus annulatus 1.8 - 17.8Gammarus sp. 2.6 - -Lysianassidae <0.1 1.5 <0.1Oedicerotidae <0.1 0.2 0.8Leptocheirus pinguis 6.8 0.1 0.5Dulichia sp. 2.9 - -Amphipoda unid. 3.2 1.3 0.2
Mysidacea - - (0.6)Decapoda (1.6) (0.6) (39.5)
Crangon septemspinosa 0.8 <0.1 39.2Decapoda unid. 0.8 0.6 0.3
Crustacea unid. (0.4) (<0.1) (<0.1)OSTEICHTHYES [0.9] - [0.9]
Ammodytes dubius 0.9 - 0.9ANIMAL REMAINS AND MISC. [6.7] [6.1] [2.9]
Number sampled 129 51 46Number empty 59 5 15Mean stomach content (g) 1.026 0.890 0.558Mean fish length (cm) 31 30 27
Related Documents