Food-limited reproduction and growth of three copepod species in the low-salinity zone of the San Francisco Estuary WIM J. KIMMERER 1 *, TONI R. IGNOFFO 1 , ANNE M. SLAUGHTER 1 AND ALISON L. GOULD 2 1 ROMBERG TIBURON CENTER, SAN FRANCISCO STATE UNIVERSITY , 3152 PARADISE DRIVE, TIBURON, CA 94920, USA AND 2 DEPARTMENT OF ECOLOGY AND EVOLUTIONARY BIOLOGY , UNIVERSITY OF MICHIGAN, ANN ARBOR, MI 48109, USA *CORRESPONDING AUTHOR: [email protected] Received August 10, 2013; accepted November 26, 2013 Corresponding editor: Marja Koski We determined reproductive and growth rates of three common copepods in the low-salinity zone of the San Francisco Estuary during spring–summer of 2006 and 2007. Rates were low, particularly during summer. The egg production rate of Eurytemora affinis in spring averaged 3 eggs female 21 day 21 or 0.04 day 21 , while that of Pseudodiaptomus forbesi in summer averaged 1 egg female 21 day 21 or 0.02 day 21 . Specific growth rates of copepodites were moderate for E. affinis in spring (0.23 and 0.15 day 21 for early and late stages, respectively) and low for P . forbesi in summer (0.15 and 0.03 day 21 , respectively). Growth and egg production rates of both species were generally lower than rates predicted from temperature for well-fed copepods, suggesting chronic food limitation. Previously published esti- mates for the small cyclopoid Limnoithona tetraspina were also low. None of the mea- sures of growth of any species was related to phytoplankton biomass, primary production or abundance of the species, nor did they differ between the 2 years despite large differences in hydrology. To understand patterns of abundance will require investigation of differential mortality rates. KEYWORDS: Eurytemora affinis; Pseudodiaptomus forbesi; Limnoithona tetraspina; food limitation; sac spawners available online at www.plankt.oxfordjournals.org # The Author 2014. Published by Oxford University Press. All rights reserved. For permissions, please email: [email protected] Journal of Plankton Research plankt.oxfordjournals.org J. Plankton Res. (2014) 36(3): 722–735. First published online January 7, 2014 doi:10.1093/plankt/fbt128 by guest on May 28, 2016 http://plankt.oxfordjournals.org/ Downloaded from

Welcome message from author
This document is posted to help you gain knowledge. Please leave a comment to let me know what you think about it! Share it to your friends and learn new things together.
Transcript
Food-limited reproduction and growth ofthree copepod species in the low-salinityzone of the San Francisco Estuary
WIM J. KIMMERER1*, TONI R. IGNOFFO1, ANNE M. SLAUGHTER1 AND ALISON L. GOULD2
1ROMBERG TIBURON CENTER, SAN FRANCISCO STATE UNIVERSITY, 3152 PARADISE DRIVE, TIBURON, CA 94920, USA AND
2DEPARTMENT OF ECOLOGY AND
EVOLUTIONARY BIOLOGY, UNIVERSITY OF MICHIGAN, ANN ARBOR, MI 48109, USA
*CORRESPONDING AUTHOR: [email protected]
Received August 10, 2013; accepted November 26, 2013
Corresponding editor: Marja Koski
We determined reproductive and growth rates of three common copepods in thelow-salinity zone of the San Francisco Estuary during spring–summer of 2006 and2007. Rates were low, particularly during summer. The egg production rate ofEurytemora affinis in spring averaged �3 eggs female21 day21 or 0.04 day21, whilethat of Pseudodiaptomus forbesi in summer averaged �1 egg female21 day21 or0.02 day21. Specific growth rates of copepodites were moderate for E. affinis inspring (0.23 and 0.15 day21 for early and late stages, respectively) and low for P.
forbesi in summer (0.15 and 0.03 day21, respectively). Growth and egg productionrates of both species were generally lower than rates predicted from temperature forwell-fed copepods, suggesting chronic food limitation. Previously published esti-mates for the small cyclopoid Limnoithona tetraspina were also low. None of the mea-sures of growth of any species was related to phytoplankton biomass, primaryproduction or abundance of the species, nor did they differ between the 2 yearsdespite large differences in hydrology. To understand patterns of abundance willrequire investigation of differential mortality rates.
KEYWORDS: Eurytemora affinis; Pseudodiaptomus forbesi; Limnoithona tetraspina; foodlimitation; sac spawners
available online at www.plankt.oxfordjournals.org
# The Author 2014. Published by Oxford University Press. All rights reserved. For permissions, please email: [email protected]
Journal of
Plankton Research plankt.oxfordjournals.org
J. Plankton Res. (2014) 36(3): 722–735. First published online January 7, 2014 doi:10.1093/plankt/fbt128
by guest on May 28, 2016
http://plankt.oxfordjournals.org/D
ownloaded from
I N T RO D U C T I O N
Endemic populations of plankton can be maintained inestuaries through some combination of high reproductiverate and short generation time (Ketchum, 1954). Highlyproductive estuaries offer opportunities for speciescapable of rapid population growth to offset losses totransport from the estuary, predation and other causes ofmortality. Estuaries have generally been consideredhighly productive systems, with high primary productioncoupled to high fishery yield (Nixon, 1988). However, notall estuaries are productive: for example, median totalchlorophyll concentrations were under 3 mg Chl m23 in50% of estuaries with long monitoring records (Cloernand Jassby, 2008).
What happens when productivity is low? Generally,primary productivity is positively related to growth andreproductive rates of zooplankton, but that link dependson foodweb efficiency, the food sources of the zooplank-ton and the dominant species of zooplankton (Nixon,1988; Runge, 1988; Saiz and Calbet, 2011). If populationgrowth rates of zooplankton in unproductive estuaries aregenerally low, these populations must have alternativeways of offsetting losses. Thus, a key question for under-standing maintenance of plankton species in estuaries isthe degree to which reproduction, growth and develop-ment are limited under ambient feeding conditions.
Primary production in the northern San FranciscoEstuary falls at the lower end of the scale for estuaries(Alpine and Cloern, 1992; Jassby, 2008) and this estuaryis therefore suitable for examining the response of zoo-plankton to variation in food supply. In this paper we de-termine the reproductive and growth rates of copepodscommon in the low-salinity zone (LSZ) of theSan Francisco Estuary during spring–summer of 2006and 2007.
Concerns over environmental degradation and con-flicts over the diversion of freshwater from the basin haveled to substantial monitoring efforts and recent invest-ments in research on this estuarine ecosystem. In particu-lar, declines in the abundance of several fish species,including the endangered, endemic delta smelt,Hypomesus transpacificus, in �2002 (Sommer et al., 2007),have led to increased efforts to understand the variousfactors affecting these species, including changes in thefoodweb.
This study was part of a larger examination of thefoodweb supporting the endangered delta smelt, whichoccurs in brackish water from late spring until winter andis probably food limited in spring–summer (Bennett,2005). The study therefore focused on the LSZ, definedhere to include a salinity range of 0.5 to �5, from Marchto August. The LSZ is an unproductive region: estimates
of primary production were only 25 and 31 gC m22 year21
during 2006 and 2007, respectively and only half of theproduction was in cells .5 mm (Kimmerer et al., 2012),roughly the size above which particles are available asfood for zooplankton (Bartram, 1981). Calanoid cope-pods that provide much of the food for planktivorous fish(Nobriga, 2002; Bryant and Arnold, 2007) are less abun-dant than small cyclopoids, but their growth and devel-opment rates have not been measured.
We examined abundance, egg production rate andsomatic growth rate of the calanoid copepods Eurytemora
affinis and Pseudodiaptomus forbesi, and combined these withpreviously published data on the small (0.45 mm totallength) oithonid Limnoithona tetraspina (Gould andKimmerer, 2010) for an overall examination of growthand reproduction of the three most common copepods ofthis region. Limnoithona tetraspina feeds, grows and repro-duces slowly at levels indicating food limitation nearly allthe time (Bouley and Kimmerer, 2006; Gould andKimmerer, 2010). Our objective was to determinewhether growth and reproductive rates of all commoncopepods in this region were low, linking low primaryproduction to poor feeding conditions for delta smelt andother fishes.
M E T H O D
Study area and species
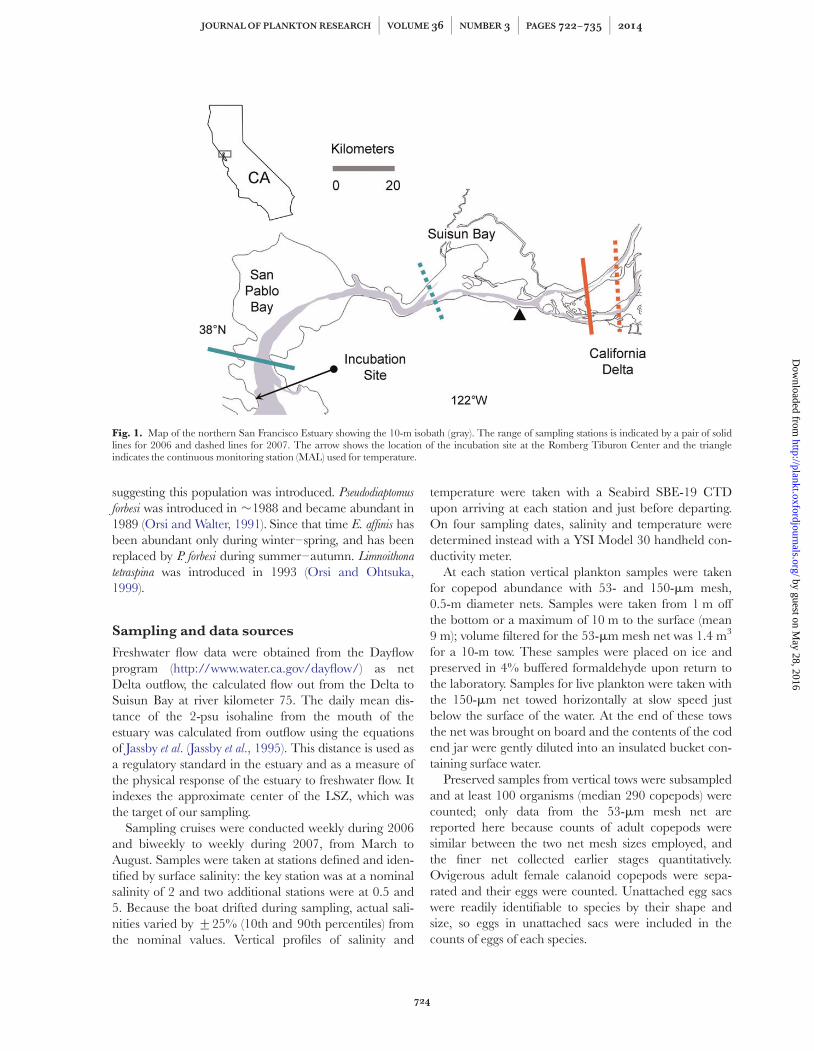
The San Francisco Estuary (SFE) is a large, turbidestuary with a lagoonal South Bay and a river-dominatednorthern reach (Fig. 1). The California Delta is anetwork of tidal channels, usually freshwater, formed bythe confluence of the Sacramento and San JoaquinRivers and some smaller rivers. Suisun and San PabloBays are both broad, shallow (5 m mean depth), turbidbays with deep, narrow channels. The climate isMediterranean, and nearly all of the precipitation occursduring the wet season from � November to April.Interannual variability in freshwater discharge is veryhigh: annual mean discharge from 1970 to 2010 varied�25-fold. High freshwater flow has a strong positiveeffect on populations of some species of fish and macroin-vertebrates (Jassby et al., 1995), but effects on lowertrophic levels are mixed (Jassby et al., 2002; Kimmerer,2002).
Many of the functional groups of organisms in theestuary are dominated by introduced species, includingthe zooplankton of the upper estuary (Orsi and Ohtsuka,1999). Eurytemora affinis has been present since beforesampling began, but the SFE population is closely relatedto populations from eastern North America (Lee, 2000)
W. J. KIMMERER ET AL. j GROWTH AND REPRODUCTION OF ESTUARINE COPEPODS
723
by guest on May 28, 2016
http://plankt.oxfordjournals.org/D
ownloaded from
suggesting this population was introduced. Pseudodiaptomus
forbesi was introduced in �1988 and became abundant in1989 (Orsi and Walter, 1991). Since that time E. affinis hasbeen abundant only during winter–spring, and has beenreplaced by P. forbesi during summer–autumn. Limnoithona
tetraspina was introduced in 1993 (Orsi and Ohtsuka,1999).
Sampling and data sources
Freshwater flow data were obtained from the Dayflowprogram (http://www.water.ca.gov/dayflow/) as netDelta outflow, the calculated flow out from the Delta toSuisun Bay at river kilometer 75. The daily mean dis-tance of the 2-psu isohaline from the mouth of theestuary was calculated from outflow using the equationsof Jassby et al. (Jassby et al., 1995). This distance is used asa regulatory standard in the estuary and as a measure ofthe physical response of the estuary to freshwater flow. Itindexes the approximate center of the LSZ, which wasthe target of our sampling.
Sampling cruises were conducted weekly during 2006and biweekly to weekly during 2007, from March toAugust. Samples were taken at stations defined and iden-tified by surface salinity: the key station was at a nominalsalinity of 2 and two additional stations were at 0.5 and5. Because the boat drifted during sampling, actual sali-nities varied by +25% (10th and 90th percentiles) fromthe nominal values. Vertical profiles of salinity and
temperature were taken with a Seabird SBE-19 CTDupon arriving at each station and just before departing.On four sampling dates, salinity and temperature weredetermined instead with a YSI Model 30 handheld con-ductivity meter.
At each station vertical plankton samples were takenfor copepod abundance with 53- and 150-mm mesh,0.5-m diameter nets. Samples were taken from 1 m offthe bottom or a maximum of 10 m to the surface (mean9 m); volume filtered for the 53-mm mesh net was 1.4 m3
for a 10-m tow. These samples were placed on ice andpreserved in 4% buffered formaldehyde upon return tothe laboratory. Samples for live plankton were taken withthe 150-mm net towed horizontally at slow speed justbelow the surface of the water. At the end of these towsthe net was brought on board and the contents of the codend jar were gently diluted into an insulated bucket con-taining surface water.
Preserved samples from vertical tows were subsampledand at least 100 organisms (median 290 copepods) werecounted; only data from the 53-mm mesh net arereported here because counts of adult copepods weresimilar between the two net mesh sizes employed, andthe finer net collected earlier stages quantitatively.Ovigerous adult female calanoid copepods were sepa-rated and their eggs were counted. Unattached egg sacswere readily identifiable to species by their shape andsize, so eggs in unattached sacs were included in thecounts of eggs of each species.
Fig. 1. Map of the northern San Francisco Estuary showing the 10-m isobath (gray). The range of sampling stations is indicated by a pair of solidlines for 2006 and dashed lines for 2007. The arrow shows the location of the incubation site at the Romberg Tiburon Center and the triangleindicates the continuous monitoring station (MAL) used for temperature.
JOURNAL OF PLANKTON RESEARCH j VOLUME 36 j NUMBER 3 j PAGES 722–735 j 2014
724
by guest on May 28, 2016
http://plankt.oxfordjournals.org/D
ownloaded from
Additional samples were taken for chlorophyll, phyto-plankton counts for biomass estimates and primary pro-duction (Lidstrom, 2009, Kimmerer et al., 2012).Chlorophyll and primary production were determinedusing both 5 and 0.7-mm (“whole water”) filters, andbiomass based on counts was determined for cells largerand smaller than 5 mm (Lidstrom, 2009), because parti-cles smaller than �5 mm are less available to copepodsthan are larger particles (Bartram, 1981). Primary pro-duction was measured in simulated in situ incubations(Kimmerer et al., 2012).
Rate estimates
Growth rates of E. affinis (spring) and P. forbesi (summer)were determined by the artificial-cohort method (Kimmererand McKinnon, 1987). Live zooplankton samples were sizefractionated into two classes, 200–250 and 250–300 mm,by reverse filtration through a clean PVC cylinder withmesh glued to one end. Samples were incubated in 4-LCubitainersw suspended in a bath of flowing water at theRomberg Tiburon Center at a temperature close to ambientand shaded to �50% ambient light. Incubation times were48 or 72 h. Three or four (sometimes six) initial and finalsamples were taken, and in some experiments additionalsamples were taken at intermediate times to check for con-stancy of growth rate (Table I).
Initial samples and each incubated sample were con-centrated onto a 35-mm mesh strainer, transferred to a20-mL glass scintillation vial with filtered water of thesame salinity, stained with neutral red for 30 min andpreserved in 2% glutaraldehyde, which minimizes loss ofcarbon and dry weight in copepods (Kimmerer andMcKinnon, 1986). After at least 1 month of preservation,copepods of the more abundant of the two species wereseparated and, in some cases, identified to stage. We usedactual mass of copepods in each replicate sample rather
than mass calculated from separate analyses (Kimmereret al., 2007). All copepods from each sample were countedand placed in a weighed tin capsule and dried for 48 h at508C. The capsules were then weighed again on aSartorius SE2 Ultra Microbalance and analyzed for carbonon a Costech Model 4010 Elemental Combustion Systemcalibrated with Cystine OAS (Elementar Americas B2105).
Dry weight and carbon were used separately to esti-mate the growth rate as the slope of log mass per individ-ual over time. The residuals from these regressionscontained some apparent outliers. To reduce the influ-ence of these outliers we used robust regressions (functionrlm in S-Plus, Venables and Ripley, 2003) to estimateslopes and confidence intervals.
The maximum growth rates of E. affinis and P. forbesi
copepodites were estimated from laboratory-determineddevelopment times at 15 and 228C, respectively, andstage-specific carbon content and dry weight for copepo-dites and adults (Gould and Kimmerer, 2010; Kimmererand Gould, 2010; T. Ignoffo, unpublished data). Themaximum growth rates were constant with stage in E.
affinis but lower in late than early copepodites in P. forbesi,so the maximum growth of P. forbesi was determined sep-arately for early and late copepodites. Temperature wasobtained from a continuous monitoring station (Fig. 1;Station MAL, http://cdec.water.ca.gov), and maximumgrowth rates in the field were determined by adjusting la-boratory rates to field temperature using the regressionsof egg development time on temperature for these species(Sullivan and Kimmerer, 2013).
Carbon and dry weight of copepodite and adult stagesfor estimating maximum growth rates were determinedfrom samples taken during March 2012 (E. affinis) andJuly 2009 (P. forbesi), i.e. during the seasons of maximumabundance of each species. An assumption of thismethod was that no bias would be introduced by the sea-sonal change in the sizes of copepods. Growth rates aredetermined essentially from the log ratios of masses ofsuccessive copepod life stages (Gould and Kimmerer,2010). We tested whether these ratios varied with tem-perature using data from Durbin and Durbin (Durbinand Durbin, 1978, Table 2) for Acartia hudsonica. Analysisof covariance of the log ratio of successive dry weightswith temperature and life stage showed that the effect oftemperature was small and not significant. Thus, whiletemperature affects growth rate through its influence ondevelopment time, the effect of temperature on body sizedoes not affect growth rate, and we are justified in esti-mating the maximum growth rate using stage-specificmass from a single date for each species.
Egg production was determined by the egg ratiomethod (Edmondson et al., 1962) using egg developmenttimes as a function of temperature from Sullivan and
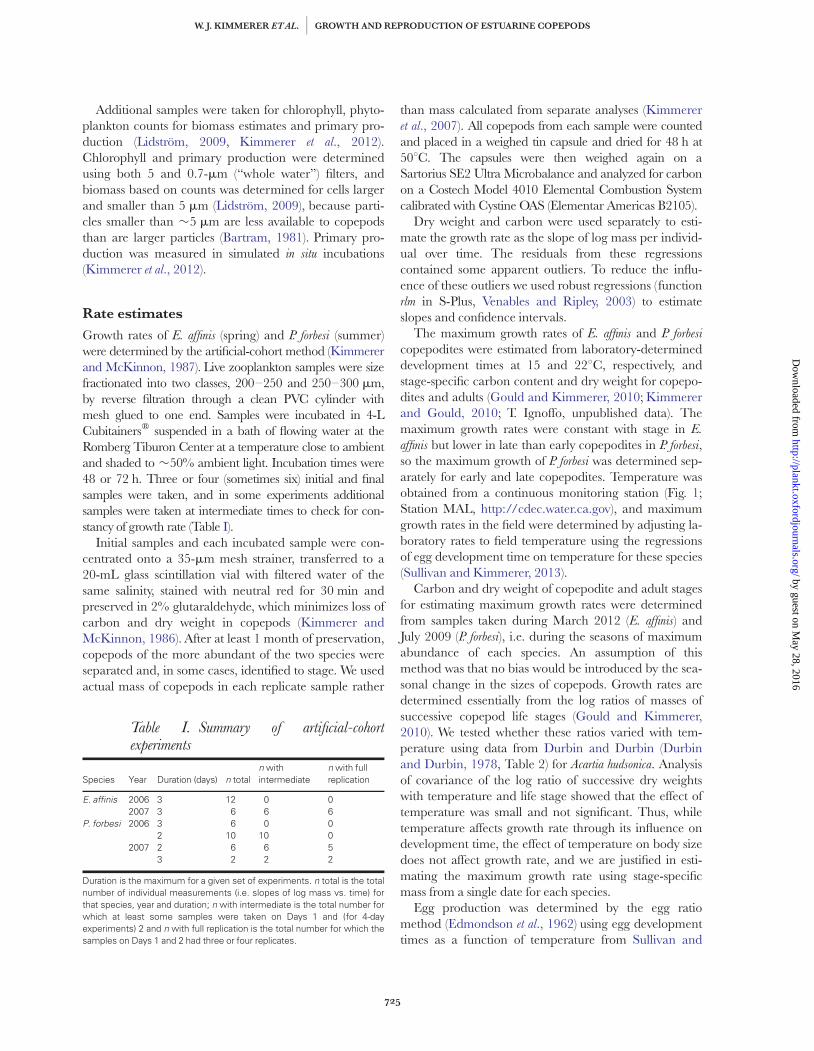
Table I. Summary of artificial-cohortexperiments
Species Year Duration (days) n totaln withintermediate
n with fullreplication
E. affinis 2006 3 12 0 02007 3 6 6 6
P. forbesi 2006 3 6 0 02 10 10 0
2007 2 6 6 53 2 2 2
Duration is the maximum for a given set of experiments. n total is the totalnumber of individual measurements (i.e. slopes of log mass vs. time) forthat species, year and duration; n with intermediate is the total number forwhich at least some samples were taken on Days 1 and (for 4-dayexperiments) 2 and n with full replication is the total number for which thesamples on Days 1 and 2 had three or four replicates.
W. J. KIMMERER ET AL. j GROWTH AND REPRODUCTION OF ESTUARINE COPEPODS
725
by guest on May 28, 2016
http://plankt.oxfordjournals.org/D
ownloaded from
Kimmerer (Sullivan and Kimmerer, 2013). We lacked thedata to correct for mortality as recommended by Ohmanet al. (Ohman et al., 1996). Specific production of adultfemales was determined by multiplying egg productionrate by the ratio of carbon content of eggs to that offemales. Egg carbon was determined from the meandiameter of eggs collected during our sampling program,using a value of 0.13 pgC mm23 based on data summar-ized by Kiørboe and Sabatini (Kiørboe and Sabatini,1995) and Uye and Sano (Uye and Sano, 1995).
Maximum egg production rates were estimated fromthe maximum growth rate of late female copepodites forP. forbesi and all copepodites for E. affinis, whose growthrate appeared constant with stage. For comparison weused the maximum egg production rates for E. affinis
(Table 3 in Ban, 1994) at three temperatures and a rela-tionship of specific egg production to temperature forPseudodiaptomus marinus (Fig. 6 in Liang and Uye, 1997).
Data on egg production and growth rate of the cyclo-poid copepod L. tetraspina were obtained from Gould andKimmerer (Gould and Kimmerer, 2010). Methods weresimilar to those above, except that in 2007 copepodswere also collected with Niskin bottles for egg ratios,because it became apparent that net sampling was dis-lodging a portion of the egg sacs from these small cope-pods. This did not appear to be a problem for the largercalanoids.
Monitoring data
We used data from a long-term monitoring program ofthe Interagency Ecological Program (Orsi and Mecum,1986) as a basis for comparison with our abundancedata. The samples analyzed here were collected with a150-mm mesh, 10-cm diameter Clarke-Bumpus nettowed for 10 min obliquely from near the bottom to thesurface. Original reports (Orsi and Mecum, 1986) andelectronic databases provide the calculated abundancem23 based on the flowmeter in the net and the aliquotsampled. We selected data from samples taken at salinity0.5–5 over the same time period as our study.
Samples from the monitoring program have beenarchived since the early 1990s. We re-analyzed a selec-tion of archived net samples from July and August 1991,1992 and 1996–2007 for egg ratios and abundance bylife stage of P. forbesi. For the purposes of this paper wepresent egg production rate calculated as above from eggratios for salinity 0.5–5 for 1996–2007, during which nonew introductions had occurred (Winder and Jassby, 2011).Subsamples were taken and adult female copepods andeggs were counted as described above. Eggs were countedfor a subsample of 20–50 females and the median eggs persac were used to determine the egg ratios of the remaining
ovigerous females. Unattached egg sacs of similar appear-ance to those of P. forbesi were also counted; �10%(median) of the eggs were in unattached sacs. About 400adult females and 300 eggs (medians) were counted persample. A comparison of eggs per female in pairs ofsamples taken with 53- and 150-mm mesh nets in 2006–2007 gave a median difference of zero, suggesting thatlosses of eggs from the larger mesh net, and therefore thenet used to collect the archived samples, were likely small.
All analyses were conducted in S-Plus v. 6.2 (Venablesand Ripley, 2003). Error terms are reported as 95% con-fidence intervals throughout.
R E S U LT S
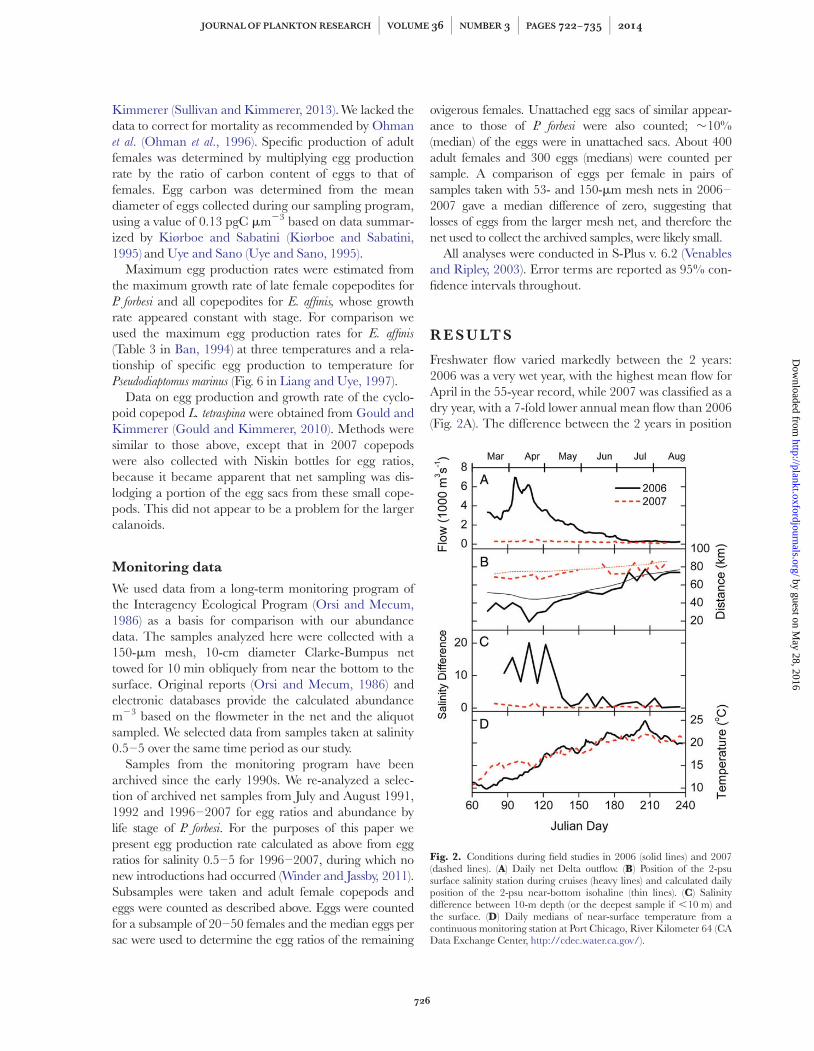
Freshwater flow varied markedly between the 2 years:2006 was a very wet year, with the highest mean flow forApril in the 55-year record, while 2007 was classified as adry year, with a 7-fold lower annual mean flow than 2006(Fig. 2A). The difference between the 2 years in position
Fig. 2. Conditions during field studies in 2006 (solid lines) and 2007(dashed lines). (A) Daily net Delta outflow. (B) Position of the 2-psusurface salinity station during cruises (heavy lines) and calculated dailyposition of the 2-psu near-bottom isohaline (thin lines). (C) Salinitydifference between 10-m depth (or the deepest sample if ,10 m) andthe surface. (D) Daily medians of near-surface temperature from acontinuous monitoring station at Port Chicago, River Kilometer 64 (CAData Exchange Center, http://cdec.water.ca.gov/).
JOURNAL OF PLANKTON RESEARCH j VOLUME 36 j NUMBER 3 j PAGES 722–735 j 2014
726
by guest on May 28, 2016
http://plankt.oxfordjournals.org/D
ownloaded from
of the salinity field and therefore the sampling stationswas equally striking, especially during spring (Fig. 2B).The strong compression of the salinity field during spring2006 was accompanied by strong stratification in thedeeper, wider channels of the lower estuary so that thesalinity difference between near-surface and near-bottomwas up to 20 (Fig. 2C). For the remainder of 2006 and allof 2007 stratification was negligible. Temperature(Fig. 2D) varied between 10 and 258C in 2006; the rangewas somewhat narrower in 2007, but summer means inboth years were 218C. The gradient in temperatureacross the three stations was also stronger in summer of2006 (20.88C from station 0.5 to station 5) than insummer of 2007 (20.38C).
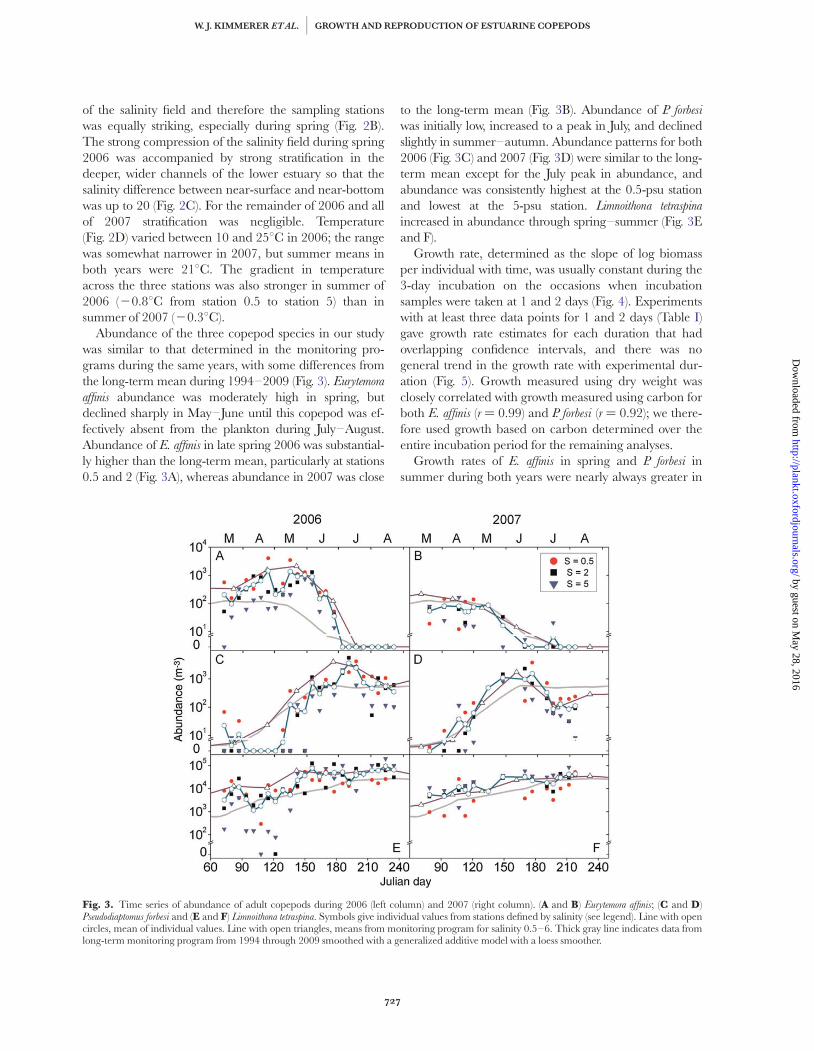
Abundance of the three copepod species in our studywas similar to that determined in the monitoring pro-grams during the same years, with some differences fromthe long-term mean during 1994–2009 (Fig. 3). Eurytemora
affinis abundance was moderately high in spring, butdeclined sharply in May–June until this copepod was ef-fectively absent from the plankton during July–August.Abundance of E. affinis in late spring 2006 was substantial-ly higher than the long-term mean, particularly at stations0.5 and 2 (Fig. 3A), whereas abundance in 2007 was close
to the long-term mean (Fig. 3B). Abundance of P. forbesi
was initially low, increased to a peak in July, and declinedslightly in summer–autumn. Abundance patterns for both2006 (Fig. 3C) and 2007 (Fig. 3D) were similar to the long-term mean except for the July peak in abundance, andabundance was consistently highest at the 0.5-psu stationand lowest at the 5-psu station. Limnoithona tetraspina
increased in abundance through spring–summer (Fig. 3Eand F).
Growth rate, determined as the slope of log biomassper individual with time, was usually constant during the3-day incubation on the occasions when incubationsamples were taken at 1 and 2 days (Fig. 4). Experimentswith at least three data points for 1 and 2 days (Table I)gave growth rate estimates for each duration that hadoverlapping confidence intervals, and there was nogeneral trend in the growth rate with experimental dur-ation (Fig. 5). Growth measured using dry weight wasclosely correlated with growth measured using carbon forboth E. affinis (r ¼ 0.99) and P. forbesi (r ¼ 0.92); we there-fore used growth based on carbon determined over theentire incubation period for the remaining analyses.
Growth rates of E. affinis in spring and P. forbesi insummer during both years were nearly always greater in
Fig. 3. Time series of abundance of adult copepods during 2006 (left column) and 2007 (right column). (A and B) Eurytemora affinis; (C and D)Pseudodiaptomus forbesi and (E and F) Limnoithona tetraspina. Symbols give individual values from stations defined by salinity (see legend). Line with opencircles, mean of individual values. Line with open triangles, means from monitoring program for salinity 0.5–6. Thick gray line indicates data fromlong-term monitoring program from 1994 through 2009 smoothed with a generalized additive model with a loess smoother.
W. J. KIMMERER ET AL. j GROWTH AND REPRODUCTION OF ESTUARINE COPEPODS
727
by guest on May 28, 2016
http://plankt.oxfordjournals.org/D
ownloaded from
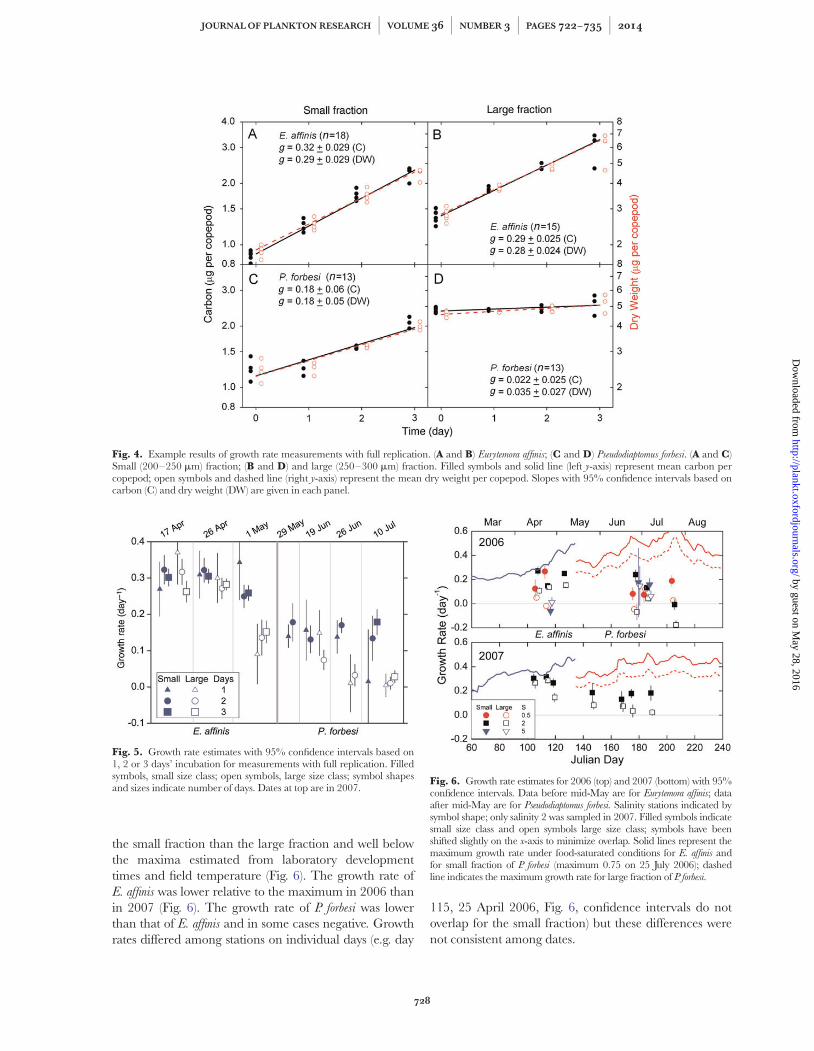
the small fraction than the large fraction and well belowthe maxima estimated from laboratory developmenttimes and field temperature (Fig. 6). The growth rate ofE. affinis was lower relative to the maximum in 2006 thanin 2007 (Fig. 6). The growth rate of P. forbesi was lowerthan that of E. affinis and in some cases negative. Growthrates differed among stations on individual days (e.g. day
115, 25 April 2006, Fig. 6, confidence intervals do notoverlap for the small fraction) but these differences werenot consistent among dates.
Fig. 4. Example results of growth rate measurements with full replication. (A and B) Eurytemora affinis; (C and D) Pseudodiaptomus forbesi. (A and C)Small (200–250 mm) fraction; (B and D) and large (250–300 mm) fraction. Filled symbols and solid line (left y-axis) represent mean carbon percopepod; open symbols and dashed line (right y-axis) represent the mean dry weight per copepod. Slopes with 95% confidence intervals based oncarbon (C) and dry weight (DW) are given in each panel.
Fig. 5. Growth rate estimates with 95% confidence intervals based on1, 2 or 3 days’ incubation for measurements with full replication. Filledsymbols, small size class; open symbols, large size class; symbol shapesand sizes indicate number of days. Dates at top are in 2007.
Fig. 6. Growth rate estimates for 2006 (top) and 2007 (bottom) with 95%confidence intervals. Data before mid-May are for Eurytemora affinis; dataafter mid-May are for Pseudodiaptomus forbesi. Salinity stations indicated bysymbol shape; only salinity 2 was sampled in 2007. Filled symbols indicatesmall size class and open symbols large size class; symbols have beenshifted slightly on the x-axis to minimize overlap. Solid lines represent themaximum growth rate under food-saturated conditions for E. affinis andfor small fraction of P. forbesi (maximum 0.75 on 25 July 2006); dashedline indicates the maximum growth rate for large fraction of P. forbesi.
JOURNAL OF PLANKTON RESEARCH j VOLUME 36 j NUMBER 3 j PAGES 722–735 j 2014
728
by guest on May 28, 2016
http://plankt.oxfordjournals.org/D
ownloaded from
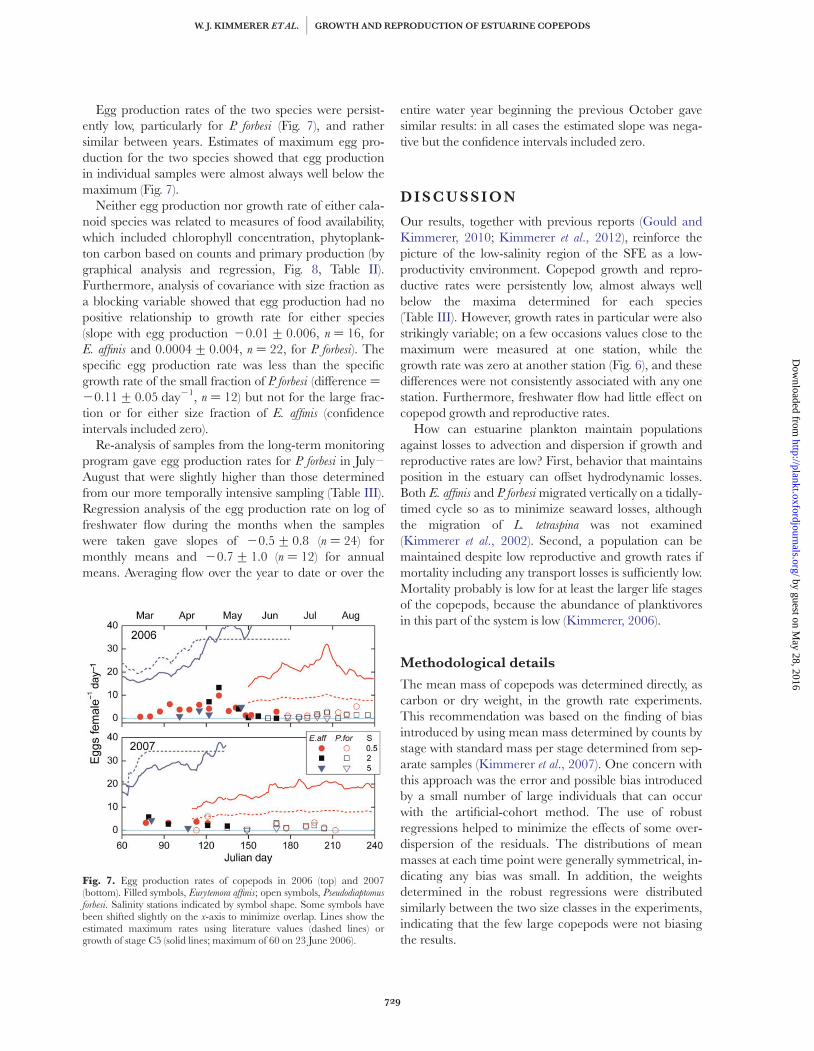
Egg production rates of the two species were persist-ently low, particularly for P. forbesi (Fig. 7), and rathersimilar between years. Estimates of maximum egg pro-duction for the two species showed that egg productionin individual samples were almost always well below themaximum (Fig. 7).
Neither egg production nor growth rate of either cala-noid species was related to measures of food availability,which included chlorophyll concentration, phytoplank-ton carbon based on counts and primary production (bygraphical analysis and regression, Fig. 8, Table II).Furthermore, analysis of covariance with size fraction asa blocking variable showed that egg production had nopositive relationship to growth rate for either species(slope with egg production 20.01+ 0.006, n ¼ 16, forE. affinis and 0.0004+ 0.004, n ¼ 22, for P. forbesi). Thespecific egg production rate was less than the specificgrowth rate of the small fraction of P. forbesi (difference ¼20.11+ 0.05 day21, n ¼ 12) but not for the large frac-tion or for either size fraction of E. affinis (confidenceintervals included zero).
Re-analysis of samples from the long-term monitoringprogram gave egg production rates for P. forbesi in July–August that were slightly higher than those determinedfrom our more temporally intensive sampling (Table III).Regression analysis of the egg production rate on log offreshwater flow during the months when the sampleswere taken gave slopes of 20.5+ 0.8 (n ¼ 24) formonthly means and 20.7+ 1.0 (n ¼ 12) for annualmeans. Averaging flow over the year to date or over the
entire water year beginning the previous October gavesimilar results: in all cases the estimated slope was nega-tive but the confidence intervals included zero.
D I S C U S S I O N
Our results, together with previous reports (Gould andKimmerer, 2010; Kimmerer et al., 2012), reinforce thepicture of the low-salinity region of the SFE as a low-productivity environment. Copepod growth and repro-ductive rates were persistently low, almost always wellbelow the maxima determined for each species(Table III). However, growth rates in particular were alsostrikingly variable; on a few occasions values close to themaximum were measured at one station, while thegrowth rate was zero at another station (Fig. 6), and thesedifferences were not consistently associated with any onestation. Furthermore, freshwater flow had little effect oncopepod growth and reproductive rates.
How can estuarine plankton maintain populationsagainst losses to advection and dispersion if growth andreproductive rates are low? First, behavior that maintainsposition in the estuary can offset hydrodynamic losses.Both E. affinis and P. forbesi migrated vertically on a tidally-timed cycle so as to minimize seaward losses, althoughthe migration of L. tetraspina was not examined(Kimmerer et al., 2002). Second, a population can bemaintained despite low reproductive and growth rates ifmortality including any transport losses is sufficiently low.Mortality probably is low for at least the larger life stagesof the copepods, because the abundance of planktivoresin this part of the system is low (Kimmerer, 2006).
Methodological details
The mean mass of copepods was determined directly, ascarbon or dry weight, in the growth rate experiments.This recommendation was based on the finding of biasintroduced by using mean mass determined by counts bystage with standard mass per stage determined from sep-arate samples (Kimmerer et al., 2007). One concern withthis approach was the error and possible bias introducedby a small number of large individuals that can occurwith the artificial-cohort method. The use of robustregressions helped to minimize the effects of some over-dispersion of the residuals. The distributions of meanmasses at each time point were generally symmetrical, in-dicating any bias was small. In addition, the weightsdetermined in the robust regressions were distributedsimilarly between the two size classes in the experiments,indicating that the few large copepods were not biasingthe results.
Fig. 7. Egg production rates of copepods in 2006 (top) and 2007(bottom). Filled symbols, Eurytemora affinis; open symbols, Pseudodiaptomusforbesi. Salinity stations indicated by symbol shape. Some symbols havebeen shifted slightly on the x-axis to minimize overlap. Lines show theestimated maximum rates using literature values (dashed lines) orgrowth of stage C5 (solid lines; maximum of 60 on 23 June 2006).
W. J. KIMMERER ET AL. j GROWTH AND REPRODUCTION OF ESTUARINE COPEPODS
729
by guest on May 28, 2016
http://plankt.oxfordjournals.org/D
ownloaded from
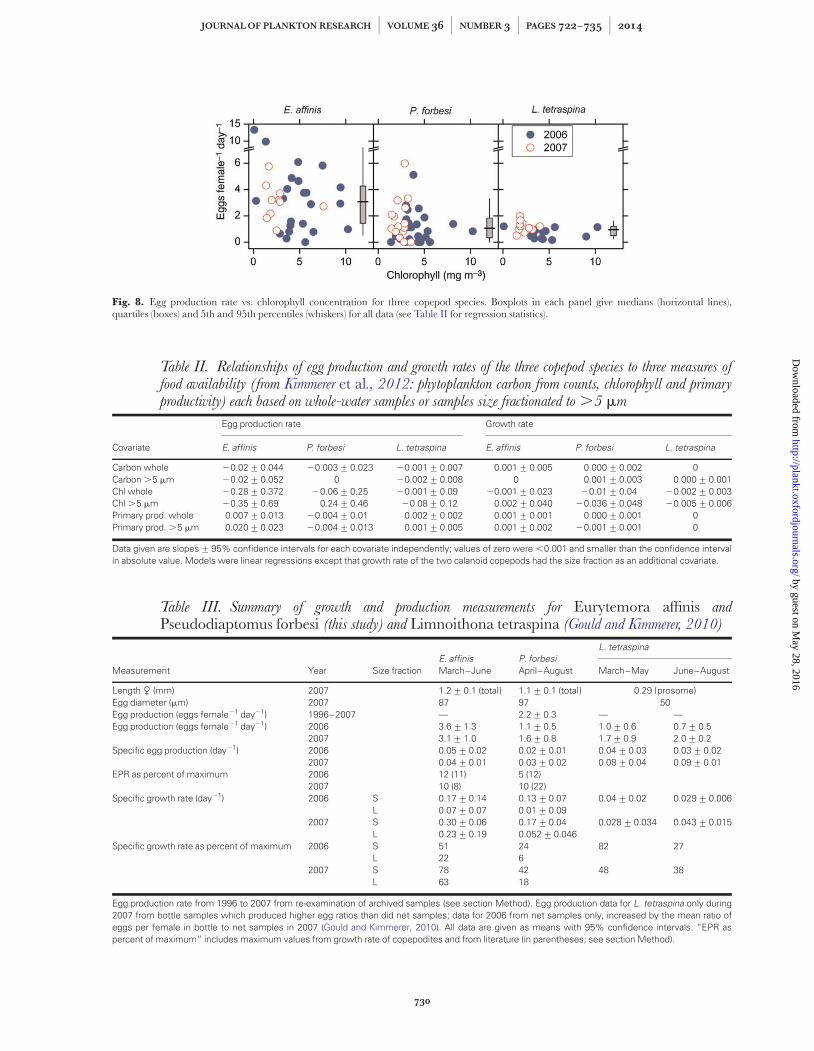
Fig. 8. Egg production rate vs. chlorophyll concentration for three copepod species. Boxplots in each panel give medians (horizontal lines),quartiles (boxes) and 5th and 95th percentiles (whiskers) for all data (see Table II for regression statistics).
Table II. Relationships of egg production and growth rates of the three copepod species to three measures offood availability (from Kimmerer et al., 2012: phytoplankton carbon from counts, chlorophyll and primaryproductivity) each based on whole-water samples or samples size fractionated to .5 mm
Covariate
Egg production rate Growth rate
E. affinis P. forbesi L. tetraspina E. affinis P. forbesi L. tetraspina
Carbon whole 20.02+0.044 20.003+0.023 20.001+0.007 0.001+0.005 0.000+0.002 0Carbon .5 mm 20.02+0.052 0 20.002+0.008 0 0.001+0.003 0.000+0.001Chl whole 20.28+0.372 20.06+0.25 20.001+0.09 20.001+0.023 20.01+0.04 20.002+0.003Chl .5 mm 20.35+0.69 0.24+0.46 20.08+0.12 0.002+0.040 20.036+0.048 20.005+0.006Primary prod. whole 0.007+0.013 20.004+0.01 0.002+0.002 0.001+0.001 0.000+0.001 0Primary prod. .5 mm 0.020+0.023 20.004+0.013 0.001+0.005 0.001+0.002 20.001+0.001 0
Data given are slopes+95% confidence intervals for each covariate independently; values of zero were ,0.001 and smaller than the confidence intervalin absolute value. Models were linear regressions except that growth rate of the two calanoid copepods had the size fraction as an additional covariate.
Table III. Summary of growth and production measurements for Eurytemora affinis andPseudodiaptomus forbesi (this study) and Limnoithona tetraspina (Gould and Kimmerer, 2010)
Measurement Year Size fractionE. affinis P. forbesi
L. tetraspina
March–June April–August March–May June–August
Length C (mm) 2007 1.2+0.1 (total) 1.1+0.1 (total) 0.29 (prosome)Egg diameter (mm) 2007 87 97 50Egg production (eggs female21 day21) 1996–2007 — 2.2+0.3 — —Egg production (eggs female21 day21) 2006 3.6+1.3 1.1+0.5 1.0+0.6 0.7+0.5
2007 3.1+1.0 1.6+0.8 1.7+0.9 2.0+0.2Specific egg production (day21) 2006 0.05+0.02 0.02+0.01 0.04+0.03 0.03+0.02
2007 0.04+0.01 0.03+0.02 0.08+0.04 0.09+0.01EPR as percent of maximum 2006 12 (11) 5 (12)
2007 10 (8) 10 (22)Specific growth rate (day21) 2006 S 0.17+0.14 0.13+0.07 0.04+0.02 0.029+0.006
L 0.07+0.07 0.01+0.092007 S 0.30+0.06 0.17+0.04 0.028+0.034 0.043+0.015
L 0.23+0.19 0.052+0.046Specific growth rate as percent of maximum 2006 S 51 24 82 27
L 22 62007 S 78 42 48 38
L 63 18
Egg production rate from 1996 to 2007 from re-examination of archived samples (see section Method). Egg production data for L. tetraspina only during2007 from bottle samples which produced higher egg ratios than did net samples; data for 2006 from net samples only, increased by the mean ratio ofeggs per female in bottle to net samples in 2007 (Gould and Kimmerer, 2010). All data are given as means with 95% confidence intervals. “EPR aspercent of maximum” includes maximum values from growth rate of copepodites and from literature (in parentheses; see section Method).
JOURNAL OF PLANKTON RESEARCH j VOLUME 36 j NUMBER 3 j PAGES 722–735 j 2014
730
by guest on May 28, 2016
http://plankt.oxfordjournals.org/D
ownloaded from
Bias could arise if copepods grow at a variable rate,such as by an early growth spurt followed by a period ofconsolidation (Miller, 2008). This would be difficult toresolve with small copepods because, using availabletechnology, tens to hundreds of copepods must be aggre-gated to determine dry weight and carbon content. Thiscould be resolved through measurements on individualorganisms (Salonen, 1979) if the apparatus were widelyavailable.
Egg ratios of naturally spawning copepod populationsdepend on a variety of factors besides the underlying in-dividual reproductive rates, most notably the age struc-ture of the population of females and therefore theirmortality rate (Ohman et al., 1996). However, determin-ing the mortality rate is far more difficult and laboriousthan determining egg ratios and egg development times.Mortality estimates can be variable (e.g. Hirst and Ward,2008) especially if the life-stage structure is unstable, e.g.because of pulses of reproduction, and the key assump-tion of a closed population is unlikely to be met in anestuary. Thus, we are faced with having to correct aneasily measured variable (egg production rate) using amuch less well-constrained parameter (mortality). Itwould be better to present the egg production estimatesin the context of general estimates of mortality: mortalityrate of female copepods in the study area is likely to below because of low rates of planktivory (Kimmerer, 2006;Gould and Kimmerer, 2010) such that reproductive rateestimates were only weakly biased by ignoring mortality.
Influence of environment
One of the key forcing functions in estuaries is variabilityin freshwater flow. In the SFE, freshwater flow is positive-ly related to abundance of several species of fish andshrimp, but responses of abundance or biomass at lowertrophic levels are mixed (Jassby et al., 1995; Kimmerer,2002; Kimmerer et al., 2009). Here we have shown thatgrowth and reproductive rates of copepods in the LSZare also unresponsive to flow. Therefore, the earlier con-clusion (Kimmerer, 2002) remains valid: the response ofsome fish species to flow is not driven by a flow signalpropagating up the foodweb through copepods.
Although abundance was higher in 2006 than in 2007,vital rates were either similar or higher in 2007 than in2006 (egg production of E. affinis and L. tetraspina,
Table III) despite the much higher freshwater flow in2006. The small interannual differences in copepod vitalrates are consistent with rather small differences inseveral measures of food supply in the LSZ (Kimmereret al., 2012). Only total chlorophyll concentration wasgreater in 2006 than in 2007, particularly in spring.Chlorophyll concentration in the .5-mm size fraction
was about the same in both years, as were both size frac-tions of phytoplankton carbon based on cell counts andprimary production (Kimmerer et al., 2012).
Our data on egg production rates of P. forbesi fromrecounts of samples from the monitoring program like-wise did not show a relationship between egg productionrate and freshwater flow over several alternative aver-aging periods. This is consistent with a lack of response ofprimary production to freshwater flow in the long-termdata (Kimmerer et al., 2012).
Salinity is a key determinant of spatial distributions ofplanktonic species (Fig. 3), but osmotic stress may not bea key influence on physiology of zooplankton becausethey move with water (Laprise and Dodson, 1993). Thedistribution of E. affinis in salinity is much narrower thanindicated by its broad salinity tolerance, suggesting a be-havioral mechanism for its distribution (Kimmerer et al.,1998). For all three species we observed consistent differ-ences in abundance (Fig. 3) but not growth (Fig. 6, a fewoccasions in 2006) or reproductive rate (Fig. 7) amongsalinity stations.
Food limitation
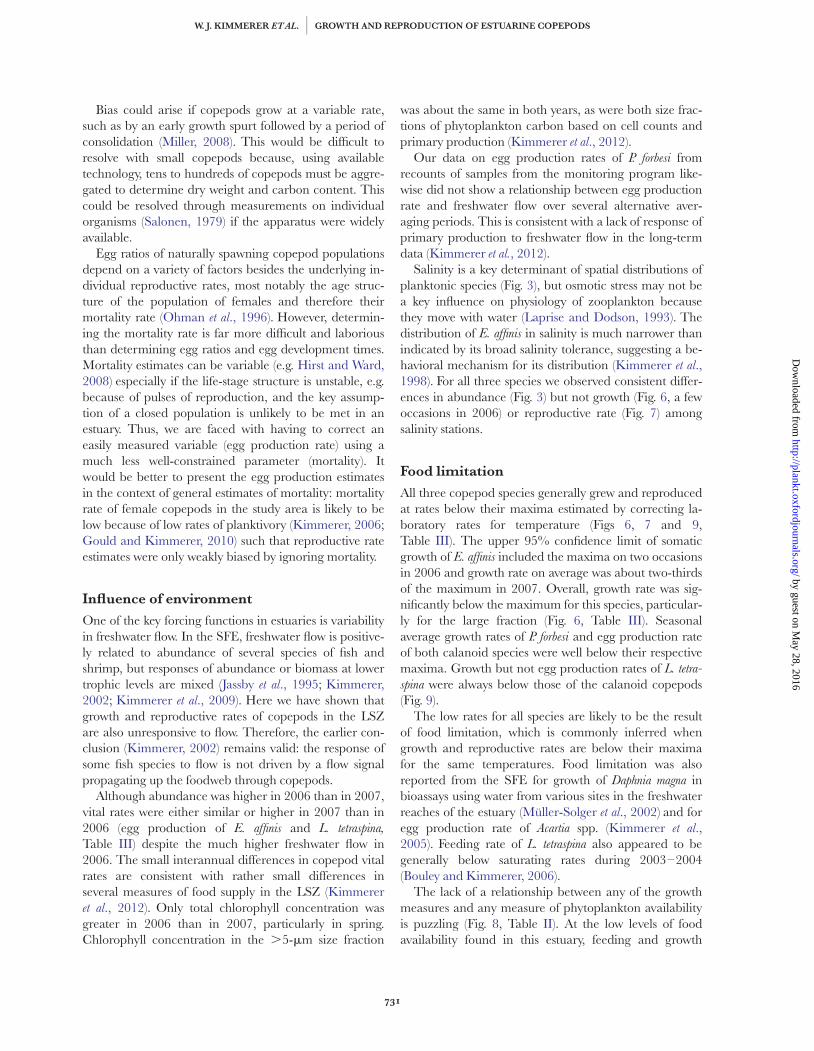
All three copepod species generally grew and reproducedat rates below their maxima estimated by correcting la-boratory rates for temperature (Figs 6, 7 and 9,Table III). The upper 95% confidence limit of somaticgrowth of E. affinis included the maxima on two occasionsin 2006 and growth rate on average was about two-thirdsof the maximum in 2007. Overall, growth rate was sig-nificantly below the maximum for this species, particular-ly for the large fraction (Fig. 6, Table III). Seasonalaverage growth rates of P. forbesi and egg production rateof both calanoid species were well below their respectivemaxima. Growth but not egg production rates of L. tetra-
spina were always below those of the calanoid copepods(Fig. 9).
The low rates for all species are likely to be the resultof food limitation, which is commonly inferred whengrowth and reproductive rates are below their maximafor the same temperatures. Food limitation was alsoreported from the SFE for growth of Daphnia magna inbioassays using water from various sites in the freshwaterreaches of the estuary (Muller-Solger et al., 2002) and foregg production rate of Acartia spp. (Kimmerer et al.,2005). Feeding rate of L. tetraspina also appeared to begenerally below saturating rates during 2003–2004(Bouley and Kimmerer, 2006).
The lack of a relationship between any of the growthmeasures and any measure of phytoplankton availabilityis puzzling (Fig. 8, Table II). At the low levels of foodavailability found in this estuary, feeding and growth
W. J. KIMMERER ET AL. j GROWTH AND REPRODUCTION OF ESTUARINE COPEPODS
731
by guest on May 28, 2016
http://plankt.oxfordjournals.org/D
ownloaded from
should have been approximately proportional to foodsupply. This lack of a relationship is not an artifact ofthese kinds of measurements. For example, egg produc-tion of copepods is often positively related to measures offood such as chlorophyll (Checkley, 1980; Kimmereret al., 2005), and somatic growth rates of especially thelater life stages also generally respond to food quantity inartificial-cohort experiments (Kimmerer and McKinnon,1987). However, sac-spawning copepods generally areless responsive to changes in phytoplankton biomass thanbroadcast-spawning copepods, both in reproductive ratesand development rates (Hirst and Bunker, 2003). It seemslikely that measures of food concentration in our studywere not variable enough to provide an adequate signal,and also that chlorophyll concentration did not representthe food of the copepods, either because of variable foodquality or because of consumption of microzooplankton.
If microzooplankton made up a large part of the cope-pods’ diet and the biomass of microzooplankton wereuncoupled from that of phytoplankton, then copepodgrowth and reproduction would not be solely determinedby phytoplankton biomass and production. The copepodspecies in our study are all omnivorous and capable offeeding on microzooplankton such as ciliates, and L. tetra-
spina feeds only on motile prey (Merrell and Stoecker,1998; Bouley and Kimmerer, 2006; Gifford et al., 2007;York et al., 2013). The abundance and biomass of micro-zooplankton was measured during several periods of ourstudy (York et al., 2011) but not frequently enough toprovide correlative evidence for variability in copepod vitalrates with microzooplankton biomass. Microzooplankton
grew at rates that were saturated with respect to food in 6of 8 dilution experiments in which grazing was differentfrom zero (York et al., 2011). Furthermore, grazing byclams may be a substantial control on the biomass of bothphytoplankton and microzooplankton (Greene et al., 2011).Thus, microzooplankton biomass may be uncoupled fromthat of phytoplankton.
This situation contrasts with that for egg production ofAcartia spp. in the more saline parts of the estuary, whichvaried strongly with chlorophyll concentration (Kimmereret al., 2005). Chlorophyll in that study was as high as16 mg m23 during spring blooms, providing a widerrange of values and therefore greater statistical power todetect responses of copepods. In addition, egg productionin Acartia spp. responds rapidly and strongly to changes infood concentration (Dagg, 1977). However, Acartia speciesin the San Francisco Estuary often consume mainly ciliates(Rollwagen Bollens and Penry, 2003), and the response ofegg production to chlorophyll concentration may have oc-curred through the response of ciliates to the spring blooms.
Indirect evidence for food limitation includes the con-sistently lower growth rates of the late copepodite stagesthan the early stages of the two calanoids in relation totheir laboratory-determined growth rates (Fig. 6). In add-ition, the generally higher growth rates of early copepo-dites of E. affinis in spring compared with those of P. forbesi
in summer may reflect the higher biomass in spring ofphytoplankton determined from cell counts and measure-ments (Lidstrom, 2009) and from chlorophyll (Kimmereret al., 2012), despite the lack of correlations between thesemeasures of food and growth. Furthermore, egg produc-tion rates of E. affinis from other estuaries are typicallyhigher; notably rates from the Chesapeake Bay were muchhigher than rates presented here, and unrelated to foodavailability, which was attributed to food saturation (Lloydet al., 2013).
Copepod vital rates in context
The literature on the degree of food limitation of sac-spawning copepods is equivocal. Reviews of global repro-ductive and growth rates indicate that sac spawners haveoverall lower growth and reproductive rates than broad-cast spawners of equivalent size at similar temperatures(Hirst and Bunker, 2003; Bunker and Hirst, 2004). Oneimplication of this work was that food limitation should bemuch more frequent for broadcast spawners than for sacspawners (Fig. 10 in Bunker and Hirst, 2004). The overallfood-saturated value of specific egg production rate of sac-spawning copepods corrected to 158C was 0.17 day21,but the value for seven species of Oithona was 0.071 day21
and 13 species not including Oithona had food-saturatedspecific egg production rates of 0.21 day21 (Table 5 in
Fig. 9. Monthly means of specific egg production and growth rates forcalanoid copepods (Eurytemora affinis and Pseudodiaptomus forbesi arecombined) and for Limnoithona tetraspina. Values were averaged firstacross size classes (calanoid growth only), then across stations and thendates within months.
JOURNAL OF PLANKTON RESEARCH j VOLUME 36 j NUMBER 3 j PAGES 722–735 j 2014
732
by guest on May 28, 2016
http://plankt.oxfordjournals.org/D
ownloaded from
Hirst and Bunker, 2003). These rates are well belowtypical rates for broadcast spawners at this temperature.
There is some evidence that food-saturated specificegg production rates may be higher than indicated byHirst and Bunker (Hirst and Bunker, 2003). For example,the specific egg production rate of O. davisae in FukuyamaHarbor was 0.14 day21 at 158C and 0.37 day21 at 218C(Uye and Sano, 1998). Much of the literature on dynam-ics of Oithona spp. is from high latitudes, and extrapola-tion to higher temperature may introduce inaccuracies.Specific egg production rates of sac-spawning calanoidsappear to be similar to those of Oithona spp. For example,the specific egg production of P. marinus in FukuyamaHarbor was 0.10 day21 at 158C and 0.17 day21 at 218C,which the authors assumed were saturated rates (Liangand Uye, 1997). The egg production rate of E. affinis inthe laboratory at high food concentration was 34 eggsfemale21 day21 at 15 or 208C (Ban, 1994), correspond-ing to a specific growth rate of 0.43 day21 (thin lines forspring, Fig. 7). Note, however, that E. affinis is a speciescomplex and that some life-history traits differ amongpopulations (Lee, 2000; Beyrend-Dur, et al., 2009), so thatthe actual maximum fecundity of E. affinis from the SFEis likely to differ from the above value.
Our estimates of maximum egg production rates werebased alternatively on literature values and on growth oflate copepodites, under the assumption that this growth con-tinues in the females but is manifested as egg production.These values agreed well for E. affinis but the literature esti-mate for a congener of P. forbesi was about half of the rate esti-mated from copepodite growth (Fig. 7). The global estimatefor sac spawners at this body mass and temperature range(Bunker and Hirst, 2004) was between these two estimates(not shown). Despite this uncertainty in the maximum eggproduction rate, the observed rates were always lower thanthe lowest estimate of maximum reproductive rate.
Somatic growth rates of sac-spawning copepods gener-ally are considered to be much lower than those of broad-cast spawners (Hirst and Bunker, 2003). Based on theglobal estimates of Hirst and Bunker (Hirst and Bunker,2003), the food-saturated growth rate of copepodites ofsac-spawning species averages 0.17 day21 for a 10 mgCcopepod at 158C. The variation with body mass is small,such that the global mean somatic growth rate is 0.18 day21
for a copepod of 0.1 mgC body mass (Tables 3–5 in Hirstand Bunker, 2003). However, somatic growth rates of bothE. affinis and P. forbesi, determined in the laboratory and cor-rected to 158C (T. Ignoffo, unpublished data), were consider-ably higher than this value and closer to the valuespresented by Hirst and Bunker (Hirst and Bunker, 2003) forbroadcast spawners. In contrast, the maximum growth rateof L. tetraspina at 158C in the laboratory was only one-thirdof the global value for a copepod of this size (Table III).
None of this is meant to question the value of globalsyntheses such as that of Hirst and Bunker (Hirst andBunker, 2003). Rather it is to point out that the maximumreproductive and growth rates of individual species maydiffer considerably from global means, partly because ofthe sampling bias inherent in those means, but also merelybecause each species is different. To understand food limi-tation in field populations, it is necessary to determine themaximum growth rates of each population of each speciesand to assess field growth rates against those maxima. Inour own study we suggest that the maxima for specific eggproduction rates are only rough estimates that need to beupdated with laboratory-based maxima.
Seasonal patterns
The seasonal patterns of abundance of the three specieshave persisted since L. tetraspina became abundant in1993 (Fig. 3). These patterns are apparent both in ourdata from 2006 to 2007 and in the record from the long-term monitoring program, although with some inter-annual variability. Each spring, E. affinis, formerly thenumerically dominant copepod through summer (Orsiand Mecum, 1986), declines to a level at which it isseldom detected in plankton samples. At around thesame time, P. forbesi increases in abundance to about thelevel maintained by E. affinis before 1987. The initialspring decline of E. affinis was related to inadvertent pre-dation and competition for food by the clam Potamocorbula
amurensis (Kimmerer et al., 1994). The mechanism behindthe rise of P. forbesi each spring is likely simply tempera-ture, since the native range of this species is subtropical totropical, roughly from Shanghai to the southern end ofVietnam (Razouls et al., 2007). However, the consistencyin the timing of these seasonal shifts remains a puzzle.
Neither differences in the growth rate nor reproductiverate are useful in explaining the inverse seasonal patternsof these two species. Eurytemora affinis had a higher growthrate that was closer to saturation in spring than was thecase for P. forbesi in summer, despite the temperature dif-ference. Egg production of E. affinis declined somewhatthrough spring (Fig. 7) but when the two species over-lapped, the egg production rates were similar. Thus, theannual decline in E. affinis is not explained by poorgrowth alone, and patterns of mortality including lossesto advection and dispersion must be determined to fill inthis gap in our understanding.
AC K N OW L E D G E M E N T S
We thank V. Greene, U. Lidstrom, A. Parker, J. Tirindelliand J.York for help in the field, A. Hennessy for long-term data, D. Bell and D. Morgan for vessel and logistic
W. J. KIMMERER ET AL. j GROWTH AND REPRODUCTION OF ESTUARINE COPEPODS
733
by guest on May 28, 2016
http://plankt.oxfordjournals.org/D
ownloaded from
support, and M. Weaver for helpful comments on themanuscript.
F U N D I N G
Funding was provided by the CALFED Bay-DeltaScience Program under grant SCI-05-C107, and theInteragency Ecological Program under Department ofWater Resources Contract 4600007494 and AgreementR10AC20074 between the US Bureau of Reclamationand San Francisco State University.
R E F E R E N C E S
Alpine, A. E. and Cloern, J. E. (1992) Trophic interactions and directphysical effects control phytoplankton biomass and production in anestuary. Limnol. Oceanogr., 37, 946–955.
Ban, S. (1994) Effect of temperature and food concentration on post-embryonic development, egg production and adult body size of cala-noid copepod Eurytemora affinis. J. Plankton Res., 16, 721–735.
Bartram, W. C. (1981) Experimental development of a model for thefeeding of neritic copepods on phytoplankton. J. Plankton Res., 3, 25–52.
Bennett, W. A. (2005) Critical assessment of the delta smelt populationin the San Francisco Estuary, California. San Francisco Estuary Watershed
Sci., 3, Issue 2 Article 1.
Beyrend-Dur, D., Souissi, S. and Devreker, D. et al. (2009) Life cycletraits of two transatlantic populations of Eurytemora affinis (Copepoda:Calanoida): salinity effects. J. Plankton Res., 31, 713–728.
Bouley, P. and Kimmerer, W. J. (2006) Ecology of a highly abundant,introduced cyclopoid copepod in a temperate estuary. Mar. Ecol. Prog.
Ser., 324, 219–228.
Bryant, M. E. and Arnold, J. D. (2007) Diets of age-0 striped bass in theSan Francisco Estuary, 1973–2002. Calif. Fish Game, 93, 1–22.
Bunker, A. J. and Hirst, A. G. (2004) Fecundity of marine planktoniccopepods: Global rates and patterns in relation to chlorophyll a, tem-perature and body weight. Mar. Ecol. Prog. Ser., 279, 161–181.
Checkley, D. M. (1980) Food limitation of egg production by a marine,planktonic copepod in the sea off southern California. Limnol.
Oceanogr., 25, 991–998.
Cloern, J. E. and Jassby, A. D. (2008) Complex seasonal patterns ofprimary producers at the land-sea interface. Ecol. Lett., 11, 1294–1303.
Dagg, M. (1977) Some effects of patchy food environments in copepods.Limnol. Oceanogr., 22, 99–107.
Durbin, E. G. and Durbin, A. G. (1978) Length and weight relation-ships of Acartia clausi from Narragansett Bay, Rhode Island. Limnol.
Oceanogr., 23, 958–969.
Edmondson, W. T., Anderson, G. C. and Comita, G. W. (1962)Reproductive rate of copepods in nature and its relation to phyto-plankton population. Ecology, 43, 625–634.
Gifford, S. M., Rollwagen Bollens, G. C. and Bollens, S. M. (2007)Mesozooplankton omnivory in the upper San Francisco Estuary. Mar.
Ecol. Prog. Ser., 348, 33–46.
Gould, A. L. and Kimmerer, W. J. (2010) Development, growth, and re-production of the cyclopoid copepod Limnoithona tetraspina in theupper San Francisco Estuary. Mar. Ecol. Prog. Ser., 412, 163–177.
Greene, V. E., Sullivan, L. J., Thompson, J. K. et al. (2011) Grazingimpact of the invasive clam Corbula amurensis on the microplankton as-semblage of the northern San Francisco Estuary. Mar. Ecol. Prog. Ser.,431, 183–193.
Hirst, A. G. and Bunker, A. J. (2003) Growth of marine planktonic cope-pods: global rates and patterns in relation to chlorophyll a, tempera-ture, and body weight. Limnol. Oceanogr., 48, 1988–2010.
Hirst, A. G. and Ward, P. (2008) Spring mortality of the cyclopoidcopepod Oithona similis in polar waters. Mar. Ecol. Prog. Ser., 372,169–180.
Jassby, A. D. (2008) Phytoplankton in the upper San Francisco Estuary:recent biomass trends, their causes and their trophic significance.San Francisco Estuary Watershed Sci., 6, Issue 1 Article 2.
Jassby, A. D., Cloern, J. E. and Cole, B. E. (2002) Annual primary pro-duction: patterns and mechanisms of change in a nutrient-rich tidalestuary. Limnol. Oceanogr., 47, 698–712.
Jassby, A. D., Kimmerer, W. J. and Monismith, S. G. et al. (1995)Isohaline position as a habitat indicator for estuarine populations.Ecol. Appl., 5, 272–289.
Ketchum, B. H. (1954) Relation between circulation and planktonicpopulations in estuaries. Ecology, 35, 191–200.
Kimmerer, W. J. (2002) Physical, biological, and management responsesto variable freshwater flow into the San Francisco Estuary. Estuaries,25, 1275–1290.
Kimmerer, W. J. (2006) Response of anchovies dampens effects of the in-vasive bivalve Corbula amurensis on the San Francisco Estuaryfoodweb. Mar. Ecol. Prog. Ser., 324, 207–218.
Kimmerer, W. J., Bennett, W. A. and Burau, J. R. (2002) Persistence oftidally-oriented vertical migration by zooplankton in a temperateestuary. Estuaries, 25, 359–371.
Kimmerer, W. J., Burau, J. R. and Bennett, W. A. (1998)Tidally-oriented vertical migration and position maintenance of zoo-plankton in a temperate estuary. Limnol. Oceanogr., 43, 1697–1709.
Kimmerer, W. J., Gartside, E. and Orsi, J. J. (1994) Predation by anintroduced clam as the probable cause of substantial declines in zoo-plankton in San Francisco Bay. Mar. Ecol. Prog. Ser., 113, 81–93.
Kimmerer, W. and Gould, A. (2010) A Bayesian approach to estimatingcopepod development times from stage frequency data. Limnol.
Oceanogr. Methods, 8, 118–126.
Kimmerer, W. J., Gross, E. S. and MacWilliams, M. (2009) Is the re-sponse of estuarine nekton to freshwater flow in the San FranciscoEstuary explained by variation in habitat volume? Estuaries Coast, 32,375–389.
Kimmerer, W. J., Hirst, A. G., Hopcroft, R. R. et al. (2007) Estimatingjuvenile copepod growth rates: corrections, inter-comparisons andrecommendations. Mar. Ecol. Prog. Ser., 336, 187–202.
Kimmerer, W. J. and McKinnon, A. D. (1986) Glutaraldehyde fixationto maintain biomass of preserved plankton. J. Plankton Res., 5,1003–1008.
Kimmerer, W. J. and McKinnon, A. D. (1987) Growth, mortality, andsecondary production of the copepod Acartia tranteri in WesternportBay, Australia. Limnol. Oceanogr., 32, 14–28.
Kimmerer, W. J., Nicolini, M. H., Ferm, N. et al. (2005) Chronic foodlimitation of egg production in populations of copepods of the genusAcartia in the San Francisco Estuary. Estuaries, 28, 541–550.
Kimmerer, W. J., Parker, A. E., Lidstrom, U. et al. (2012) Short-term andinterannual variability in primary production in the low-salinity zoneof the San Francisco Estuary. Estuaries Coast, 35, 913–929.
JOURNAL OF PLANKTON RESEARCH j VOLUME 36 j NUMBER 3 j PAGES 722–735 j 2014
734
by guest on May 28, 2016
http://plankt.oxfordjournals.org/D
ownloaded from
Kiørboe, T. and Sabatini, M. (1995) Scaling of fecundity, growth anddevelopment in marine planktonic copepods. Mar. Ecol. Prog. Ser.,120, 285–298.
Laprise, R. and Dodson, J. J. (1993) Nature of environmental variabilityexperienced by benthic and pelagic animals in the St. LawrenceEstuary, Canada. Mar. Ecol. Prog. Ser., 94, 129–139.
Lee, C. E. (2000) Global phylogeography of a cryptic copepod speciescomplex and reproductive isolation between genetically proximate“populations”. Evolution, 54, 2014–2027.
Liang, D. and Uye, S. (1997) Seasonal reproductive biology of the egg-carrying calanoid copepod Pseudodiaptomus marinus in a eutrophic inletof the Inland Sea of Japan. Mar. Biol., 128, 409–414.
Lidstrom, U. E. (2009) Primary production, biomass and species com-position of phytoplankton in the low salinity zone of the northernSan Francisco Estuary. MS Thesis. San Francisco State University.
Lloyd, S. S., Elliott, D. T. and Roman, M. R. (2013) Egg production bythe copepod, Eurytemora affinis, in Chesapeake Bay turbiditymaximum regions. J. Plankton Res., 35, 299–308.
Merrell, J. R. and Stoecker, D. K. (1998) Differential grazing on proto-zoan microplankton by developmental stages of the calanoidcopepod Eurytemora affinis Poppe. J. Plankton Res., 20, 289–304.
Miller, C. B. (2008) Copepod growth in detail: pattern similarity todecapod larvae. ICES J. Mar. Sci., 65, 332–338.
Muller-Solger, A. B., Jassby, A. D. and Muller-Navarra, D. (2002)Nutritional quality of food resources for zooplankton (Daphnia) in atidal freshwater system (Sacramento-San Joaquin River Delta).Limnol. Oceanogr., 47, 1468–1476.
Nixon, S. W. (1988) Physical energy inputs and the comparative ecologyof lake and marine ecosystems. Limnol. Oceanogr., 33, 1005–1025.
Nobriga, M. L. (2002) Larval delta smelt diet composition and feedingincidence: environmental and ontogenetic influences. Calif. Fish Game,88, 149–164.
Ohman, M. D., Aksnes, D. L. and Runge, J. A. (1996) The interrelationshipof copepod fecundity and mortality. Limnol. Oceanogr., 41, 1470–1477.
Orsi, J. and Mecum, W. (1986) Zooplankton distribution and abun-dance in the Sacramento-San Joaquin Delta in relation to certain en-vironmental factors. Estuaries, 9, 326–339.
Orsi, J. J. and Ohtsuka, S. (1999) Introduction of the Asian copepodsAcartiella sinensis, Tortanus dextrilobatus (Copepoda: Calanoida), andLimnoithona tetraspina (Copepoda: Cyclopoida) to the San FranciscoEstuary, California, USA. Plankton Biol. Ecol., 46, 128–131.
Orsi, J. J. and Walter, T. E. (1991) Pseudodiaptomus forbesi and P. marinus
(Copepoda: Calanoida), the latest copepod immigrants toCalifornia’s Sacramento-San Joaquin Estuary. In Uye, S.-I., Nishida,
S. and Ho, J.-S. (eds), Proceedings of the Fourth International Conference on
Copepoda. Bull. Plankton Soc. Japan, Spec. Vol., Hiroshima, pp.553–562.
Razouls, C., De Bovee, F. and Kouwenberg, J. (2007) Diversity and
Geographic Distribution of Marine Planktonic Copepods. ObservatoireOceanologique de Banyuls, Universite Pierre et Marie Curie (ParisVI), Banyuls/Mer Cedex, France.
Rollwagen Bollens, G. C. and Penry, D. L. (2003) Feeding dynamics ofAcartia spp. copepods in a large, temperate estuary (San FranciscoBay, CA). Mar. Ecol. Prog. Ser., 257, 139–158.
Runge, J. A. (1988) Should we expect a relationship between primaryproduction and fisheries? The role of copepod dynamics as a filter oftrophic variability. Hydrobiologia, 167/168, 61–71.
Saiz, E. and Calbet, A. (2011) Copepod feeding in the ocean: scalingpatterns, composition of their diet and the bias of estimates due tomicrozooplankton grazing during incubations. Hydrobiologia, 666,181–196.
Salonen, K. (1979) Versatile method for the rapid and accurate deter-mination of carbon by high-temperature combustion. Limnol.
Oceanogr., 24, 177–183.
Sommer, T., Armor, C., Baxter, R. et al. (2007) The collapse of pelagicfishes in the upper San Francisco Estuary. Fisheries, 32, 270–277.
Sullivan, L. J. and Kimmerer, W. J. (2013) Egg development time ofEurytemora affinis and Pseudodiaptomus forbesi (Copepoda, Calanoida)from the upper San Francisco Estuary with notes on methods.J. Plankton Res., 35, 1331–1338.
Uye, S. and Sano, K. (1995) Seasonal reproductive biology of the smallcyclopoid copepod Oithona davisae in a temperate eutrophic inlet. Mar.
Ecol. Prog. Ser., 118, 121–128.
Uye, S. and Sano, K. (1998) Seasonal variations in biomass, growth rateand production rate of the small cyclopoid copepod Oithona davisae ina temperate eutrophic inlet. Mar. Ecol. Prog. Ser., 163, 37–44.
Venables, W. N. and Ripley, B. N. (2003) Modern Applied Statistics with S.,Vol. Springer-Verlag, New York.
Winder, M. and Jassby, A. D. (2011) Shifts in zooplankton communitystructure: implications for food web processes in the upperSan Francisco Estuary. Estuaries Coast, 34, 675–690.
York, J. L., Costas, B. A. and McManus, G. B. (2011)Microzooplankton grazing in green water—results from two contrast-ing estuaries. Estuaries Coast, 34, 373–385.
York, J. K., McManus, G. B. and Kimmerer, W. J. et al. (2013) Trophiclinks in the plankton in the low salinity zone of a large temperateestuary: top-down effects of introduced copepods. Estuaries Coast, inpress. doi 10.1007/s12237-013-9698-9
W. J. KIMMERER ET AL. j GROWTH AND REPRODUCTION OF ESTUARINE COPEPODS
735
by guest on May 28, 2016
http://plankt.oxfordjournals.org/D
ownloaded from
Related Documents