I FOOD CONSUMPTION PATTERNS AND DIETARY PRACTICES IN RELATION TO IRON AND SALT INTAKES OF THE TIMAU COMMUNITY, MERU DISTRICT IN KENYA / / 15V M’LIRIA JOSEPH KOBIA (BSc. EST) A/56/P/7872/02 A DISSERTATION SUBMITTED TO THE DEPA R I’M ENT OF FOOD TECHNOLOGY AND NUTRITION IN PARTIAL FULFILMENT OF THE REQUIREMENTS FOR THE DEGREE OF MASTER OF SCIENCE IN APPLIED HUMAN NUTRITION IN THE COLLEGE OF AGRICULTURE AND VETERINARY SCIENCES, UNIVERSITY OF NAIROBI AUGUST 2004 University of NAIROBI Library 0524458 7

Welcome message from author
This document is posted to help you gain knowledge. Please leave a comment to let me know what you think about it! Share it to your friends and learn new things together.
Transcript

I
FOOD CONSUMPTION PATTERNS AND DIETARY PRACTICES IN RELATION TO IRON AND SALT INTAKES OF THE TIMAU COMMUNITY, MERU
DISTRICT IN KENYA / /
15V
M ’L IR IA J O S E P H K O B IA (B Sc. E ST )A/56/P/7872/02
A DISSERTATION SUBMITTED TO THE DEPA R I’M ENT OF FOOD TECHNOLOGY AND NUTRITION IN PARTIAL FULFILMENT OF THE REQUIREMENTS FOR THE
DEGREE OF MASTER OF SCIENCE IN APPLIED HUMAN NUTRITION IN THE COLLEGE OF AGRICULTURE AND VETERINARY SCIENCES, UNIVERSITY OF
NAIROBI
A U G U S T 2004
University of NAIROBI Library
0524458 7

DECLARATION
I M'LIRIA JOSEPH KOB1A hereby declare that this Dissertation is my original work and has not been presented for a degree in any other university.
I M’LIRIA JOSEPH KORIA (BSc. FST)
Signature and Date
This Dissertation has been submitted for examination with our approval as university Supervisors:
l)r. .1 ASWAN T K. SEIIMI. PhDDepartment of Food Technology and Nutrition, Applied Human Nutrition.
Signature and Date/ V / f I 0 <£
Dr. A. M. OMWECA, PhD
i

DEDICATIONDedicated to my beloved mom Mama Lucy Mwothiru M’Liria for her brave struggle, her love, understanding, encouragement and support throughout my studies. And to the memory of my late dad Mzee Jacob M'liria (God rest his soul in peace) who did not live to see the achievements of his last son.
I would also like to dedicate this work to the memory of the late Prof. Nelson Muroki (Peace be upon his soul) who supervised the preparation of the proposal for this project.
n

ACKNOWLEDG EM ENTI thank God for the gift of knowledge that He lias blessed me with. I would also like to thank the University of Nairobi for having offered me an opportunity to pursue the Applied Human Nutrition course for my Masters Degree. Special appreciation goes to the entire Department of Food Technology and Nutrition of the University of Nairobi, its staff and students who encouraged, guided and always gave me the morale to go on despite the dificulties encountered.
I also thank Micronutrient Initiative. Ottawa, Canada, for the aid of a grant through the financial assistance of the Government of Canada through the Canadian International Development Agency (CIDA) that enabled me to undertake this work.
A special note of appreciation is extended to Dr. J.K Sehrni and Dr. A.M Omwega of the Food Technology and Nutrition Department for their guidance and supervision throughout the study. Their criticisms, suggestions and contributions were appreciated. Any achievements this Study may have attained, I heavily owe it to them.
I would also like to thank Mrs. Mbaya (District Nutritionist) and my field assistants .1. Mwiti, R. Kaimenyi and Gitonga who braved the chilly mornings, and nights with me wholeheartedly and tirelessly throughout the data collection period. I also thank the area administrators in particular the Assistant Chiel Mr. Batista of Mali tat i sub-location, respondent mothers and their families who sacrificed their precious time.
And to my classmates, my deepest gratitude for co-operation, brotherhood and constant counsel which not only give me strength to continue but also deep insights into the future. May God always bless you in service to those entrusted to your care.
Finally. I am extremely grateful to the greater Late Jacob M'liria's Family and the people of Mwcrongundu for their continued support, prayers and co-operation in all my endeavours to attain this level of education. God bless you all.
iii
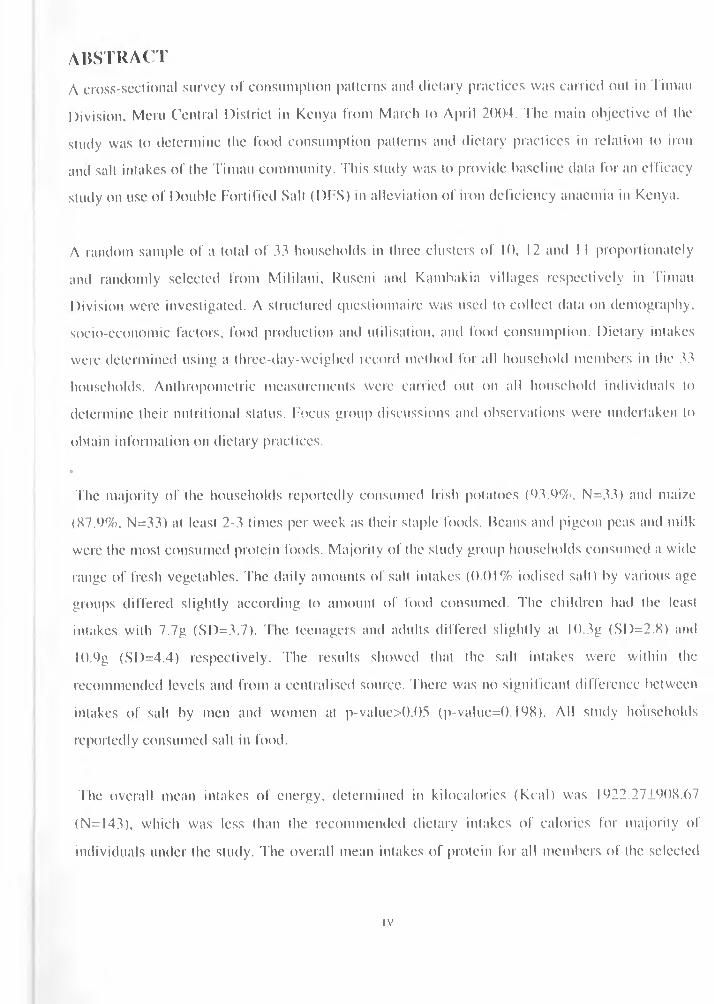
ABSTRACTA cross-sectional survey of consumption patterns and dietary practices was carried out in Timau Division. Meru Central District in Kenya from March to April 2004. The main objective of the study was to determine the food consumption patterns and dietary practices in relation to iron and salt intakes of the Timau community. This study was to provide baseline data for an efficacy study on use of Double Fortified Salt (DFS) in alleviation of iron deficiency anaemia in Kenya.
A random sample of a total of 33 households in three clusters of 10. 12 and I I proportionately and randomly selected from Mililani, Ruseni and Kambakia villages respectively in Timau Division were investigated. A structured questionnaire was used to collect data on demography, socio-economic factors, food production and utilisation, and food consumption. Dietary intakes were determined using a three-day-weighed record method for all household members in the 33 households. Anthropometric measurements were carried out on all household individuals to determine their nutritional status. Focus group discussions and observations were undertaken to obtain information on dietary practices.©
The majority of the households reportedly consumed Irish potatoes (93.9%, N=33) and maize (87.9%. N=33) at least 2-3 times per week as their staple foods. Beans and pigeon peas and milk were the most consumed protein foods. Majority of the study group households consumed a wide range of fresh vegetables. The daily amounts of salt intakes (0.01% iodised salt) by various age groups differed slightly according to amount of food consumed. The children had the least intakes with 7.7g (SD=3.7). 'the teenagers and adults differed slightly at l().3g (SD=2.8) and I0.9g (SD=4.4) respectively. The results showed that the salt intakes were within the recommended levels and from a centralised source. There was no significant difference between intakes of salt by men and women at p-value>().()5 (p-value=0.198). All study households reportedly consumed salt in food.
The overall mean intakes of energy, determined in kilocalories (Kcal) was 1922.271908.67 (N=I43), which was less than the recommended dietary intakes of calories for majority of individuals under the study. The overall mean intakes of protein for all members of the selected
IV
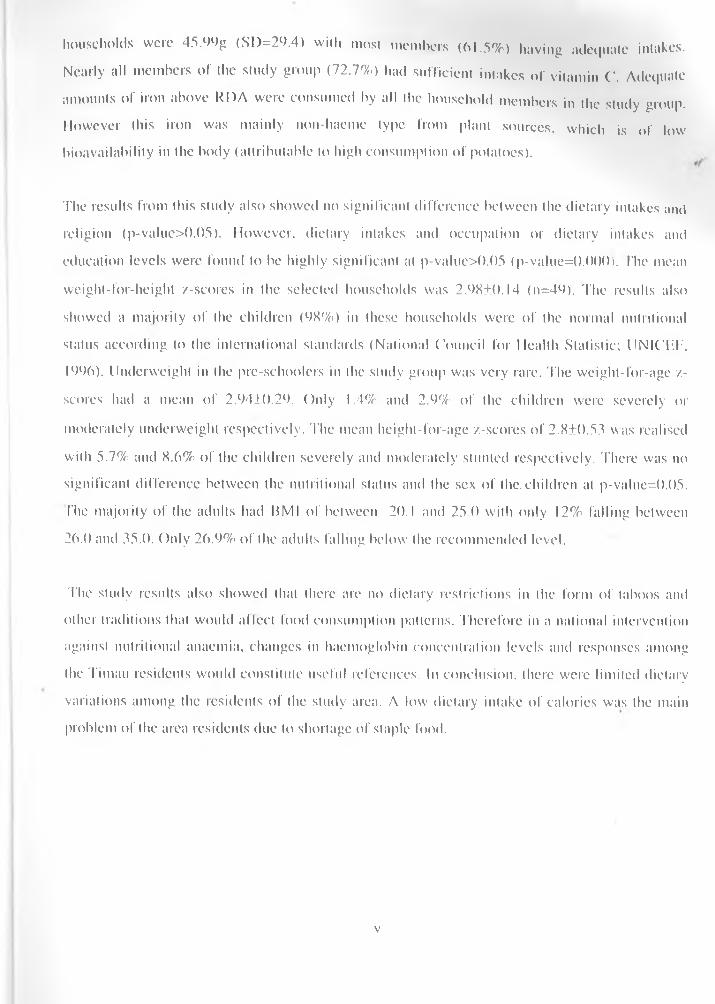
households were 45.99g (SD=29.4) with most members (61.5%) having adequate intakes. Nearly all members of the study group (72.7%) had sufficient intakes of vitamin C. Adequate amounts of iron above RDA were consumed by all the household members in the study group. However (his iron was mainly non-haeme type from plant sources, which is of low bioavailability in the body (attributable to high consumption of potatoes).
The results from this study also showed no significant difference between the dietary intakes and religion (p-value>0.()5). However, dietary intakes and occupation or dietary intakes and education levels were found to be highly significant at p-value>0.05 (p-value=().000). The mean weight-lor-height /-scores in the selected households was 2.9810.14 (n=49). The results also showed a majority of the children (98%) in these households were of the normal nutritional status according to the international standards (National Council for Health Statistic; UNICEF, 1996). Underweight in the pre-schoolers in the study group was very rare. The weight-for-age z- scores had a mean of 2.94±0.29. Only 1.4% and 2.9% of the children were severely or moderately underweight respectively. The mean height-lbr-age /.-scores of 2.810.53 was realised with 5.7% and 8.6% of the children severely and moderately stunted respectively. There was no significant difference between the nutritional status and the sex of the. children at p-value=0.05. The majority of the adults had liMI of between 20.1 and 25.0 with only 12% falling between26.0 and 35.0. Only 26.9% of the adults falling below the recommended level.
The study results also showed that there arc no dietary restrictions in the form of taboos and other traditions that would ailed food consumption patterns. Therefore in a national intervention against nutritional anaemia, changes in haemoglobin concentration levels and responses among the Timau residents would constitute useful references. In conclusion, there were limited dietary variations among the residents of the study area. A low dietary intake of calories was the main problem of the area residents due to shortage of staple food.
v
TABLE OF CONTENTSDECLARATION............................................................................................................................iDEDICATION...............................................................................................................................iiACKNOWLEDGEMENT........................................................................................................... iiiABSTRACT........................................................................................................................................ iv *TABLE OF CONTENTS............................................................................................................. vi
TABLE FIGURES............................................................................................................................ixLIST OF APPENDICES .................................................................................................................... xLIST OF ABBREVIATIONS........................................................................................................... x
OPERATIONAL DEFINITIONS...............................................................................................xiiGLOSSARY OF NON-ENGLISH WORDS.............................................................................xiv
CHAPTER O N E .......................................................................................................................... 15INTRODUCTION..................................................................................................................15
I I STATEMENT OF PROBLEM.............................................................................. 161.2 JUSTIFICATION...................................................................................................................171.3 MAIN OBJECTIVE...............................................................................................................IK
1.3.1 Specific Objectives..........................................................................................................IK1.3.2 Expected Benefits............................................................................................................IK
CHAPTER T W O .........................................................................................................................20LITERATURE REVIEW ..................................................................................................2<>
2.1 INTRODUCTION................................................................................................................202.1.1 Factors affecting food patterns and dietary practices.................................................... 202.1.2 Dynamism of food consumption habits........................................................................ 212.1.3 I lousehold access to food................................................................................ 22
2.2.0 FOOD PRODUCTION...................................................................................................... 222.2.1 Land availability............................................................................................................. 232.2.2 Agricultural practices..................................................................................................... 23
2.3.0 FOOD SECURITY AND FOOD POLICY...................................................................... 242.3.1 Food distribution and accessibility.................................................................................242.3.2 Food shortages................................................................................................................ 25
VI
2.4.0 NUTRITITIONAL STATUS OF THE RURAL COMMUNITIES............... ..............252.4.1 PEM...............................................................................................................................25
2.4.2 Sail Consumption............................................................................................................. 202.4.3. Micronutrient status.......................................................................................................... 28
CHAPTER THREE...................................................................................................37STUDY METHODOLOGIES........................................................................... 37
3.1 STUDY SITE......... ............................................................................................................... 373.2 COMMUNI TY EN TRY, RECRUITMENT AND TRAINING OF RESEARCH ASSISTANTS . 373.4 SAMPLE SIZE.....................................................................................................................383.5 STUDY DESIGN AND SAMPLING PROCEDURE........................................................ 383.6 DATA COLLECTION TOOLS............................................................................. 383.7 DATA COLLECTION PROCEDURE.................................................................................393.7 DA TA QUALITY CONTROL.............................................................................................. 413.8 DATA HANDLING AND ANALYSIS.............................................................................. 41
CHAPTER FOUR..................................................................................................... 42RESULTS 43
4 I DEMOGRAPHIC AND SOCIO-ECONOMIC CHARACTER1STICS OT IIOUSEOLDS..........43
4.2 OCCUPATIONS OF HOUSEHOLD MEMBERS....................................................... 444.3 SOCIAL ECONOMIC FACTORS RELATED TO DIETARY INTAKES ANDPATTERNS..................................................................................................................................45
4.3.0 Household incomes:........................................................................................ '............. 454.3.1 Land.................................................................................................................................454.3.2 I lousing...........................................................................................................................464.3.3 Food expenditure............................................................................................................ 474.3.4 Fuel sources.................................................................................................................... 474.3.5 Food production and utilisation......................................................................................484.3.5 Food consumption patterns............................................................................................50
4.4 DIETARY INTAKES........................................................................................................... 514.4.1 Salt intakes......................................................................................................................574.4.2 Nutritional status............................................................................................................ 58
VI I
CHAPTER FIVE.......................................................................................................6()DISCUSSION.................................................................................................... 6|5.1 DEMOGRAPHIC AND SOCIO-ECONOMIC STATUS OF HOUSEHOLDS................615.2 FOOD SECURITY AND CONSUMPTION PATTERNS..................................................625.3 NUTRITIONAL STATUS....................................................................................................635.4 DIETARY PRACTICES.......................................................................................................645.5 DIETARY INTAKES........................................................................................................... 65
CHAPTER SIX..........!...............................................................................................69CONCLUSION AND RECOMMENDATIONS..................................................... 69
CONCLUSION.............................................................................................................. 69RECOMMENDATIONS............................................................................................................ 69
CHAPTER EIGHT....................................................................................................71REFERENCES AND BIBLIOGRAPHY................................................................ 71APPENDICES........................................................................................................... 7 8
viii
UST OF TABLESible I: Composition of Tabic salt..................................................................................................................... 27able 2: levels of anaemia in (he two groups of world nations...........................................................................30
Table 3: iron requirements in various groups......................................................................................................32fable 4: Iron absorption rates for non-anaemic individuals from different foods........................................ 34fable 5: Age distribution in the study group......................................................................................................43fable 6: Land ownership sizes among households in the study group..............................................................46fable 7: Production and utilisation characteristics of selected foods by study households.............................. 49fable X: Frequency ofconsmption of some common foods by study households.............................................51fable 9: Dietary intakes of energy, proteins, vitamin C and iron (mg) for various age groups........................52fable 10: Comparison between 100% and 80% energy intake levels for various groups.................................53fable I I: Proportions off household members meeting RDAs for different nutrients......................................54fable 12: Correlations between dietary intakes and age. religion, educational level, occupation and
income of the households............................................................................................................................56fable 13: Phylate/iron densities in dietary intakes of different age groups.........................................................57fable 14: Distribution of under-fives children by nutritional status.................................................................... 59fable 15: Nutritional status of the adults.............................................................................................................59Table 16: Relationships between the various individual and household characteristics on the
nutritional status of the adults.....................................................................................................................60
TABLE FIGURESFigure I: Educational status of the household members....................................................................................44Figure 2: Income levels among various households..........................................................................................45Figure 3: comparison between total household income and expenditure on food.Error! Bookmark not definedFigure 4: summary of the selected nutrition adequacy based on RDA..................................... .•.......................52figure 5: Sources of vitamin C in the diet...........................................................................................................55figure 6: Sources of iron in the diet....................................................................................................................56Figure 7: Salt consumption levels by different age groups................................................................................ 58
ix

1ST OF APPENDICES
....... 20 Llix 1: Questionnaire................................................................................ 22 >nclix 2: 3-Day Weighed Food record......................................................24 endix 3: 3-Day Weighed Food Record continued.....................................43 endix 4: Weight Table...............................................................................46 jendix 5: KEY INFORMANTS/FGDs QUESTIONNAIRE......................49 pondix 6: KEY INFORM A NTS/F(iDs QUESTIONNAIRE.....................2/ Jpendix 7: Quantitative analysis of food intake (3-day weighed record)....52 /...53...54
56.575959
0
......27
....78''.8 5.... 86....77....78....80....81
I.
x

LIST OF ABBREVIATIONSAsl: Above sea levelDC’: District Commissioner.DO: Division Officer.DFS: Double Fortified Salt. .Epi-lnfo. : Epidemiological Information Program (Software).
• FAO: Food and Agriculture Organization.GOK: Government of Kenya.Gins: Grams.HH: 1 louseholds.III): Haemoglobin.HbC: Haemoglobin Concentration.1IIV/AIDS: Human Immune Virus/Acquired Immune Deficiency Syndrome.ID Iron Deficiency.IDA: Iron Deficiency Anaemia.KEMRI: Kenya Medical Research Institute.NCHS: National Council for Health Statistics.NRC: National Council for ResearchMOE: Ministry of Education.Ml: Micronutrient Initiative.MOM Ministry of 1 lealth (Kenya).PEM: Protein Energy Malnutrition.RDA: Recommended Daily Allowances.SPSS: Statistical Program for Social Surveys. (Software).SI): Standard Deviations.UNDP United Nations Development Program.UNICEF: United Nations International Children’s Education Fund.IJNU: United Nations University.USA: United States of America.USD A: United States Development Agency.USAID: United States Agency for International Development.
XI

V AI):
WHO:
NGO:
Ksh:
I IA /:
WAZ:VVIIZ:N:
N:
n:
Vitamin A Deficiency.World Health Organization.Non-Governmental Organisations.Kenya Shillings.Height-lor-Age /.-scores.Weight-for-Age /.-scores.Weight-for-Height /.-scores.In reference to household, defines total number of households under study (N=33).In reference to household members, defines the total number of individuals under study (N=143).In reference to household members, defines number of household members accounted for in certain categories e.g. adults.
XII
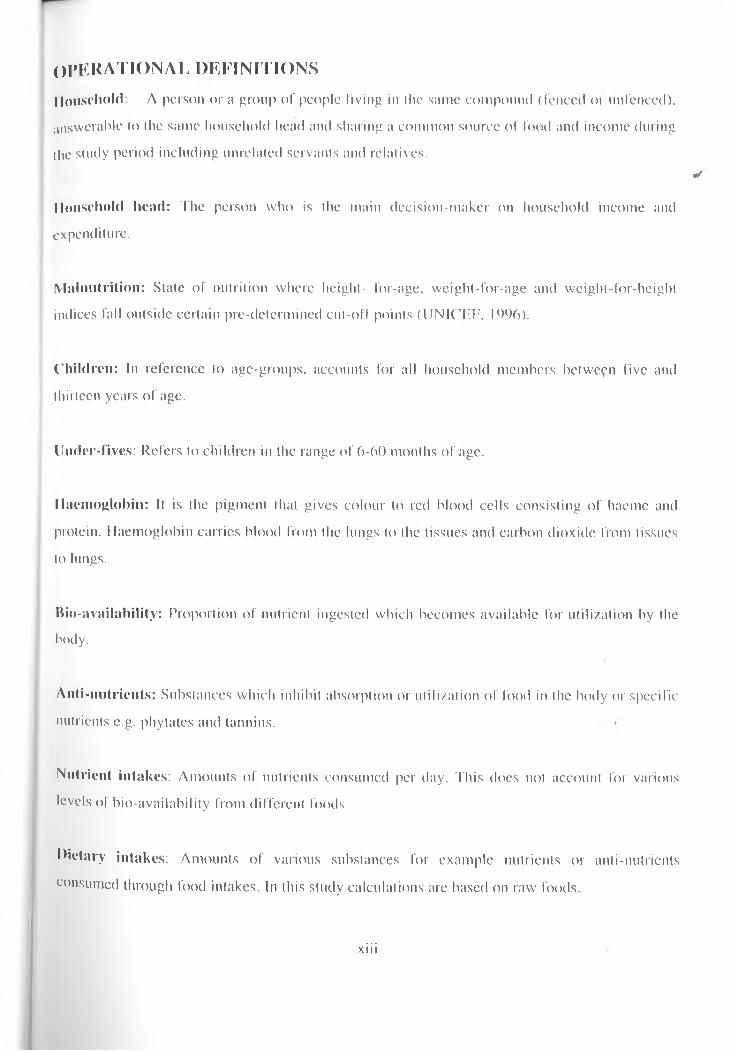
OPERATIONAL DEFINITIONSHousehold: A person or ;i group of people living in the same compound (fenced or unfenced),answerable to the same household head and sharing a common source of food and income during the study period including unrelated servants and relatives.
*/Household head: The person who is the main decision-maker on household income and expenditure.
Malnutrition: State of nutrition where height- for-age, weight-for-age and weight-for-height indices fall outside certain pre-determined cut-off points (UNICEF, 19%).
Children: In reference to age-groups, accounts for all household members between five and thirteen years of age.
Under-fives: Refers to children in the range of 6-60 months of age.
Haemoglobin: It is the pigment that gives colour to red blood cells consisting of haeme and protein. Haemoglobin carries blood from the lungs to the tissues and carbon dioxide from tissues to lungs.
Bio-availability: Proportion of nutrient ingested which becomes available for utilization by thebody.
Anti-nutrients: Substances which inhibit absorption or utilization of food in the body or specific nutrients e.g. phytates and tannins.
Nutrient intakes: Amounts of nutrients consumed per day. This does not account for various levels of bio-availability from different foods.
Dietary intakes: Amounts of various substances for example nutrients or anti-nutrients consumed through food intakes. In this study calculations are based on raw foods.
xiii

I
mporary houses: Houses whose roofs are thatched with grass or banana leaves and the walls > made of wood and plastered with mud or cow-dung.
enii-permanent houses: Houses whose roofs arc built with iron sheets or tiles and the walls are Jade of wooden poles or timber or iron sheets.
Permanent houses: Houses whose roofs arc built with iron sheets or tiles and the walls arc made of stone or bricks.
Children: Individuals whose ages are below IS years.
Teenagers: Individuals whose ages are above 13 years and below IS years.
X IV

GLOSSARY OF NON-ENGLISH WORDS.
llgiili: A thick porridge staple food prepared from maize flour and water.
Sukimiawiki: A green vegetable variety also referred to as kales.
GithiTi: A mixture of boiled beans and maize fried with potatoes and a variety of vegetables.
xv
CHAPTER ONE INTRODUCTIONMalnutrition is generally an endemic problem in developing countries and in particular. Africa.
Attempts to improve nutrition in Africa have been complicated by several factors including individual, household, community, national and international factors. These have further been aggravated by emergence of HIV - All) disease, cultural beliefs and customs, high fertility rates, poor economic status, limited access to health and social services. Recent nutritional surveys in Kenya, have shown declining trends in overall nutritional levels in the country between 1977 and 19X2 |GOK. 19831. Most common malnutrition forms are protein - energy malnutrition [PEM| and micronutrient deficiencies |“hidden luinger” | with most commonly reported being vitamin A. iron and iodine in children and adults especially women |SARA and USAID, 20()()|. In children, nutritional indicators often serve as proxy for overall well being in developing countries because they reflect the burden of infectious diseases on the community, as well as access to food and care practices (UNICEF. 1998).
To counter malnutrition nutritionists N(H)s and policy makers in government will require an elaborate understanding of socio-economic, cultural, religious, gastronomic factors, climatically underlying food production, processing, distribution, consumption patterns and dietary practices of various communities. The information obtained could be used in identification of various malnutrition forms in the community through anthropometric indicators, dietary, clinical and biochemical assessment of nutritional status of a community.
An in- depth study of food consumption patterns and dietary practices is an important aspect of understanding the social context of food and nutrition status of a community. A detailed descriptive analysis of the food system, pattern and habits of a population (food ethnography) is needed as in most communities knowledge and insight on the social context of food and nutrition is limited, incomplete or hardly available. This problem has led to poor and ineffective planning of nutiilion interventions or research in nutrition. There is evidence that in even long-established °°d ar,d nutrition programmes much basic information is lacking. Like in many other
communities in Kenya, this information is lacking for the Merit community in Timau (Merit Distiict). I his makes identification of nutritional problem difficult, consequently effective
r
planning, implementation and evaluation of food and nutrition programmes is impaired |Hartog Lid Stevern. 1995].
1.1 STATEMENT OF PROBLEMMicronutrient deficiencies are commonest of all nutrition deficiencies affecting an *f
overwhelming number of people world-wide. Iron deficiency affects about two billion people in the world (approximately 40% of (lie world’s population). Over 90% affected live in the developing countries. The prevalence is highest amongst children and women of reproductive ai>e of which 30-40 percent of the affected live in the developing countries. Over three-quarters kif the children and half of the women ol reproductive age are affected.
(According to micronutrient survey of 1900 (Mwaniki et al. 1090), which covered 45 districts in Kenya, it was estimated that 43.2%. 42.0% and 15.0% of pre-school, mothers and adult males in
/ that order were iron -deficient. Including those al high risk of slipping to deficiency status raised Ihp.proportion of affected children and mothers to over 70% and for adult males the estimate was [26%. Among the burden of anaemia per unit of surveyed population, the lake basin, coastal and northern semi-arid lowlands are on the lead. The central and the mid-west highland sub-regions has the lowest anaemia burden per unit population but weighting for population density, they had a large burden of predominantly mild anaemia.
A nation wide primary intervention targeting the general population is required to supplement the entire nation’s dietary intakes with iron to enable various groups to attain the recommended daily allowances (RDA). I bis intervention will involve all regions of the country (those with the highest levels ol anaemia and those with the lowest). In an efficacy study on use of Double bortified Salt (DFS) to address nutritional iron deficiency in the country, two study .sites were identified for baseline studies. Lungalunga in Kwalc District (Coastal Lowlands), which has the highest levels ol anaemia in the country (66.2% estimates of the moderate to severe forms of anaemia among the under-fives).
I imau in Meru District (Central Highlands of Kenya) with the lowest levels of anaemia prevalence (12.5% estimate of the moderate to severe forms of anaemia cases) was identified as
ihe reference site (Mwaniki et al. 1999). During the field experimental phase of the overall study, median llbC shift and response among the Timau residents of Mem district would constitute a
useful reference to the national intervention. Several factors may he potential risk factors in iron deficiency anaemia hut the most predominant is dietary inadequacy of available iron. The staple diets of most Kenyans are primarily of low iron bioavailahility, presence of high levels of iron inhibitors in cereals and legumes, which form major proportion of the diets, are largely to blame. * l ow levels of iron enhancers such as vitamin C and A aggravate the problem.
The results from this study, together with the other site, will establish the consumption patterns and dietary practices, which affects the iron nutriturc in the different regions and would therefore affect the bioavailahility of iron supplemented through the Double Fortified Salt intervention program. This shall enable standardization of the formulation of the DFS to suit the requirements of the entire nation.
1.2 JUSTIFICATIONIron deficiency is likely to account for about half, two-thirds and about less than one third of the burden of anaemia among children, mothers and adult males in that order. Decreasing oxygen concentration with increasing altitude sufficiently explains the high HbC in the highlands, its relationship with availability of haemanitics could not be clarified.
In Kenya, iron deficiency anaemia is a national public health problem. Across the country, the largest burden ol anaemia is borne by pre-school age children and the lowest by men, older children and the elderly. Among the pre-school age children, seven out of every ten arc likely to be anaemic. About 35.2% and 76.5% of this burden is home by the infants and children aged below 30 months respectively. Among the mothers, one out of every two is affected irrespective ol pregnancy status, over half of the mothers entered pregnancy in anaemic slate. According to micronutrient survey of 1999. which covered 45 districts in Kenya, it was estimated that 43.2%. 42.9% and 15.9% of pre-school, mothers and adult males in that order were iron -deficient. Including those al high risk of slipping to deficiency status raised the proportion of affected childien and mothers to over 70% and for adult males the estimate was 26%. Among the burden ol anaemia per unit ol surveyed population, the lake basin, coastal and northern semi-arid
3
lowlands arc on the lead. The central and the mid-wesl highland sub-regions has the lowesi •nviemia burden per unit population but weighting for population density, they had u large of predominantly mild anaemia.
Among the pre-school age children, seven out of every ten arc likely to be anaemic.35.2 76 5% of this burden is borne by the infants and children aged below 30 months respeqj Among the mothers, one out of every two is affected irrespective of pregnancy status, ov^of the mothers entered pregnancy in anaemic stale (Mwaniki et al, 1990). Further slti(|:
, ' ^establish the relationship of food consumption patterns and dietary habits that ^■f *C|bioavailability of iron in different communities are essential in alleviation ol iron -ueii^
\anaemia through a nation wide intervention program.
1.3 MAIN OBJECTIVETo determine the food consumption patterns and dietary practices in relation to iron ^ intakes of a high altitude (1500m asl) low malaria and low hookworm infestation coinnn the Central Highlands of Kenya - The case of Timau Division (Mem - District).
1.3.1 Specific Objectives1. To determine the demographic and socio-economic status of the community.2. To assess the food consumption patterns and dietary practices in the community.3. To determine food sources and availability at household level.4. To determine the nutritional adequacy of diets taken by the community.5. To assess the dietary factors affecting iron nutriture.6. To determine the levels of salt consumption at household level.7. fo determine the nutritional status of under lives and adults.
1.3.2 Kxpectcd BenefitsI his study shall provide valuable information that can be used in future by governing non-governmental agencies involved in intervention programmes targeting iron dc , anaemia alleviation not only in Timau - Mem District, but also countrywide. The gover^
4

|\j(!Os can also use the information in formulation of food and nutrition policies in regard to iron intakes as well as making development plans.
Information from this study could he used in designing materials for nutrition education interventions, population and disease control including iron deficiency anaemia. HIV — AIDS and promotion of development activities in the area. Research scientists would find results of this study valuable in formulation, implementation and evaluation of intervention programmes.
5
F
CHAPTER TWOl i t e r a t u r e r e v i e w2.1 INTRODUCTION *Many parts of the world in the recent years experienced acute food crisis in recent years and some have suffered serious famines. The worst affected is Africa and particularly sub-Saharan Africa where all nations have suffered major problems of malnutrition in certain sectors of their populations. Under-nutrition and malnutrition are important parts of the complex, widespread problem of poverty and deprivation that affects millions (majority) of people in Africa. Coupled with infections, poor nutrition poses an enormous health hazard to the poor. This is in part caused by bad weather conditions, high population growths and low agricultural production. Developing countries should strive for overall economic development and especially in the agricultural sector. Support should however be given to those projects and development sites that benefit large segment of the population. This will help reduce inequalities in income distribution and are likely to improve the nutrition, health and quality of life in those currently deprived (Latham, Dm).
Food consumption patterns and dietary practices are important aspects in studies related with efforts to alleviate malnutrition in the affected communities. They explore the various ways in which human body need for food has helped to shape the society through all the activities concerned with food production, distribution and utilisation (Calco. 1992). Different cultures determine the various substances to be taken as food in different societies. Classification of what man eats or drinks who prepares it. for whom and at what time is dictated by cultural norms in different communities.
-•I.l f actors affecting food patterns and dietary practicesCood knowledge of the social aspects of food and food consumption patterns is useful in understanding the nutritional situation of a group of people. Food habits are the ways in which individuals or groups of persons, in response to social and cultural, economic pressures choose to
6
fcnsume and make use of the available foods. Social functions interrelated with food in the pciety include:
• Gastronomic function• Means of cultural identity• Religious and magic function• Means of communication• Expression of economic wealth and status• Means to exercise influence and power in the community.• Food habits are influenced by many environmental variables. Food consumption studies
have shown close relation between the diet and ecological /one where it was situated.
2.1.2 Dynamism of food consumption habitsThe food habits and dietary patterns of a society are never static. They change with socioeconomic system of which they form part. A major aspect of the dynamics is the diffusion and acceptance of food crops and animals throughout the world. Trade, wars and migration have contributed in part to new foods. Food habits are changing constantly for better or for worse, by external influence or by modification from within the society itself.
The major question facing man is not change in food habits but how they change .It is only with knowledge of existing trends and interrelations of food patterns and other development trends, that one can be able to introduce those changes that are nutritionally desirable and necessary. It is important to understand the forces behind changing food habits in the developing countries where malnutrition is widespread if meaningful interventions are to be implemented. Two types of changes take place in food consumption habits:
Autonomous changes in food habits.I hese are closely related to the society in which one belongs and what it eats, hence when the society is changing it will have an effect in its food habits. These changes may result from population growth verses food production or change from subsistence farming to cash crops, further this may result from urbanization and consequent changes in food production and consumption patterns.
7
Inducing changes on food habits.These are changes due to nutrition or health education and food marketing activities. Government institution such as department of health, education, agriculture, or nutrition programmes may initiate these. NGOs may also take part in promotion of good health habits within a communityCommercial firms and agricultural hoard may also influence consumption of their products hence leading to dietary changes. When using the concept of changing food habits it is important lo specify that it means the increase or decrease of already known foods and acceptance of new varieties. The diffusion and acceptance of new foods is a long and complicated process, which is determined by the degree to which it can fit to the local food system and how it corresponds with the needs of the consumer.
«/
2.1.3 Household access to foodHousehold access to food (HAD is defined as the access to food adequate in quantity and quality to fulfil all nutritional requirements for all members of household throughout the year. HAF is a necessary but not sufficient condition for adequate dietary intake (FAO, 1997). The other underlying causes arc as important. For instance if a young child lacks appetite as a result of fever or is not fed adequately or long enough, its dietary intake will he inadequate and malnutrition will result. Therefore HAF does not include dietary intake or food consumption.
HAF can be classified according to its duration and its severity In terms of duration HAF can manifest as transitory (acute) or chronic. For transitory the simplest situation is a household which has all the requirement for adequate access to food hut for various reasons, may become temporarily insecure perhaps because of drought or floods. If access to food is restored, when the short fall comes, inadequacy is resolved.
2.2.0 FOOD PRODUCTIONI he performance of Kenya's agricultural production in the few decades has been declining hut it
• does not compare unfavourably with that of majority of the other African states (Mwandime. 1902). Nevertheless the annual growth rates of production have decreased over the last three
X
decades. As a result of the country’s high population growth, the country's food production per capita has declined considerably.
2.2.1 I .and availabilityThe relationship between the amount of land owned and the nutritional status of a population is not consistent. A number of studies have indicated that there is no correlation between land area and the nutritional status; while others have found a relationship between the two. Families with large farms are able to harvest enough to protect them during times of pre-harvest seasons from nutritional stress, hence the positive correlation of nutritional status and the size of land owned by a family. For example, a study in north Haiti (Mason et al, 19X4) revealed a positive relationship between land size and nutritional status. Similar studies in Kenya (Haaga and Mason, 19X6; Kennedy and Cogill. 19X7) and elsewhere (Kiclmann and McCord, I97X) revealed relationship between land size owned and nutritional status. Children of the landless agricultural workers and the smallholders were more malnourished (stunting and wasting) than those in households with large farms. However further studies in other places have shown the high amounts of energy and protein required in the large farms can lead to poor nutrition in the large farm holdings, as was the case in Guatemala (Velverde et al. 1977).
In Kenya, the unprecedented and on-going population increase has lend to serious pressure on land resources and at present, virtually the entire medium and the high-potential zones of the country are used for cropping. Although land holdings affect the nutritional status of the families especially the children, there are other factors, which exert stronger influence on nutrition. These include the wife’s economic activities, which if sufficient are able to insulate her and her children from her husband’s poverty. Therefore to reduce malnutrition in the developing countries efforts should be made to equitably distribute the land resources with target to the smallholders or those without any in order to improve their nutrition status.
2.2.2 Agricultural practicesA vast majority of the rural communities derive their food from subsistence farming on consumers’ own farm. In Africa particularly south of Sahara, much of the food cpnsumed in
9
households comes from subsistence farming. Food production in most developing countries is characterised by growing of food crops for household use and for sale. However cash crop f irming can nowadays be even in the remote areas and money has become a necessity of the rural life- This money is required for consumer goods, social obligations, education, health care and paying taxes.
Cash crop farming may have harmful effects on nutrition. This replacement of labour-intensive food crops with those requiring less labour, but nutritionally inferior and also replacement of food crop by cash crops. The food supply of the rural households become dependant on low or irregular wages or returns. The cash income of the family may not be used to compensate for the lost nutritive value by purchase of additional foods for the family. Studies in Kenya within the irrigated settlements have found that improving the living standards of families did not coincide with improving the nutritional status. Other non food needs had to be satisfied first. However, its important to keep in mind that improving the household incomes can improve the quality of food consumed and hence nutrition situation. Other factors such as involvement of the women in food production and processing as well as availability of cooking fuel are vital in influencing the nutrition status.
2.3.0 FOOD SECURITY AND FOOD POLICY2.3.1 Food distribution and accessibilityIn any given country, the food that is available, whether locally produced or imported is not evenly distributed to between its people. Discrepancies will be found between the rural and the urban areas, between the different socio-economic groups and also between members of households. According to Lewin's channel theory, certain members of the household control the various channels, the husband, wife or the household staff. In most societies, (lie wife is responsible for buying and the husband for supplying food from the farm. The women may control supply from the farm for vegetables and the men for staple foods in most African families (den Hartog and Stevern, 1995).
Members of the household will not always eat together around the same table as in most African societies like the western societies. In Indonesia men will eat first, and women and the children
10
later. In Africa, (here are sometimes three eating groups, the men, women and very young children, and the other children under guidance of an older sister. Different food parts are reserved for different groups. Usually in African families the men take the most nutritious portions.
2.3.2 Food shortagesFood production patterns in Kenya are characterised by considerable seasonal fluctuations, which are closely related to environmental factors. Such fluctuations in output contribute to unstable levels of food availability, especially in those parts of the country where farmers are confronted with relatively short and risky cropping seasons. This instability in food production results in local and more widespread food shortages. Such shortages occur not surprisingly in the country’s arid and semi-arid zones where sufficient food production is limited. These areas appear to be included in government's food relief programmes on almost permanent basis. However, even in those agricultural areas where production is high, frequent food shortages occur during the dry seasons. Such areas also receive considerable food relief per capita (Mwandime, 1992).
2.4.0 NUTRITITIONAL STATUS OF THE RURAL COMMUNITIES2.4.1 PEMThroughout southern and Eastern Africa about one third of all children are chronically malnourished. This malnutrition is associated with high morbidity rates in infants and young children. PEM is ranked as the major form of malnutrition in school age children in Kenya (CiOK, 1997). PEM results when the body's needs for energy and protein or both cannot be satisfied by the diet. It has a wide spectrum and manifestations, and its severity ranges from weight loss to growth retardation and to distinct clinical syndromes, frequently associated with deficiencies of Vitamins and minerals (e.g. Iron Vitamin A and Zinc) (EAO. 1997). It predisposes children to many incidences of preventable morbidity with possible subsequent mortality. Malnutrition is directly linked to inadequate dietary intake and disease, which in turn result from interaction of many underlying factors. Inadequate maternal and childcare and insufficient sanitation are also important determinants.

Although many developing governments may pursue to , • .& J tuice protein energy malnutritiontPBM) in their countries, this might not he possible within . . . . .' Mls century, Poverty, which is anunderlying cause of under nutrition, continues to prevail jn .UM J h "lany ol these countries (Muscat.Ic)84). F.ven .hough popuhuion in Africa has been rapidly h,crcasing per capi|a productionhas been declining. Many slralegies have been proposed a,lt.via|c ,he ,j()n ^countries and one of these methods that have been reconnne,,,^ jnvo|yes |arge||„g i,„ervenlions
populations a. risk (Lunven. 1982: I’inslrnp. 1981). A grea, propor|io„ of pi)p„|.,ti„n ,.jsk isfound in the rural areas and is composed of mainly of small Sc., . ...... . .U|c farmers, the majority probablylandless agricultural labourers or low paid or un-employed non,farm workcrs
2.4.2 .Salt Consimiption Salt in HumansFor humans, salt is as essential as water. We can perish from »(ln ....1 ")(i little salt as we can ol thirstSalt regulates the exchange o f water between on, cells an(| |hejr sl||.|oum|ing |luids ()||e component of salt, sodium (Nal is involved in muscle jnc|„(|i,,g heart|,ea, ,Krveimpulses, and the digestion of body-huilding protein 1 luma„s Co„|aiii abou( eigh, ,)unccs ()f sa|| The amount of salt is regulated in our bodies by our kidneys „„(| by perspjra|jon w ||a | js sa|(, „is a compound and has a cubic crystalline form when seen under a scanni„g electron microscope. Ms chemical name is sodium chloride. The chlorine pari (ion) accoi|n|s fo|. „ % <)f |hc disso|ve<| solids in seawater, while the sodium accounts for 30%.
Before the days of refrigeration, people used to cure meats. thUs preveil(jniI Sp(,j|.1(,eStorage life for salt is indefinite. So long as you keep it dry and a „ . . , .b 11(1 not let it get contaminatedwith dirt or whatever, it will never go bad. Over time, iodized sal. , .. , ,11 niay turn yellow, but tins isharmless and may still be used. Salt it rather hygroscopic and wj|| , , . , f . . ..J 11 adsorb moisture from the air itnot sealed in an air-tight container. If it does adsorb moisture ana ,.„l . , , , ,u takes up. it can be dried in theoven and then broken up with no barm done.
All salt, however, is not the same. Salt comes in a number of difrP , .'tient varieties, each with itsown purpose. Very little of the salt produced is intended for use i„ f, . ....f J ' 1111 nod. I he rest of it. aboutl)K%. has other uses. Therefore, it is important to bo certain thCs,"<l|> yon have is intended for
12
human consumption. Once satisfied it is, you should then determine its appropriateness for the tasks to which you might want to set it to (Ml et al, 1995).
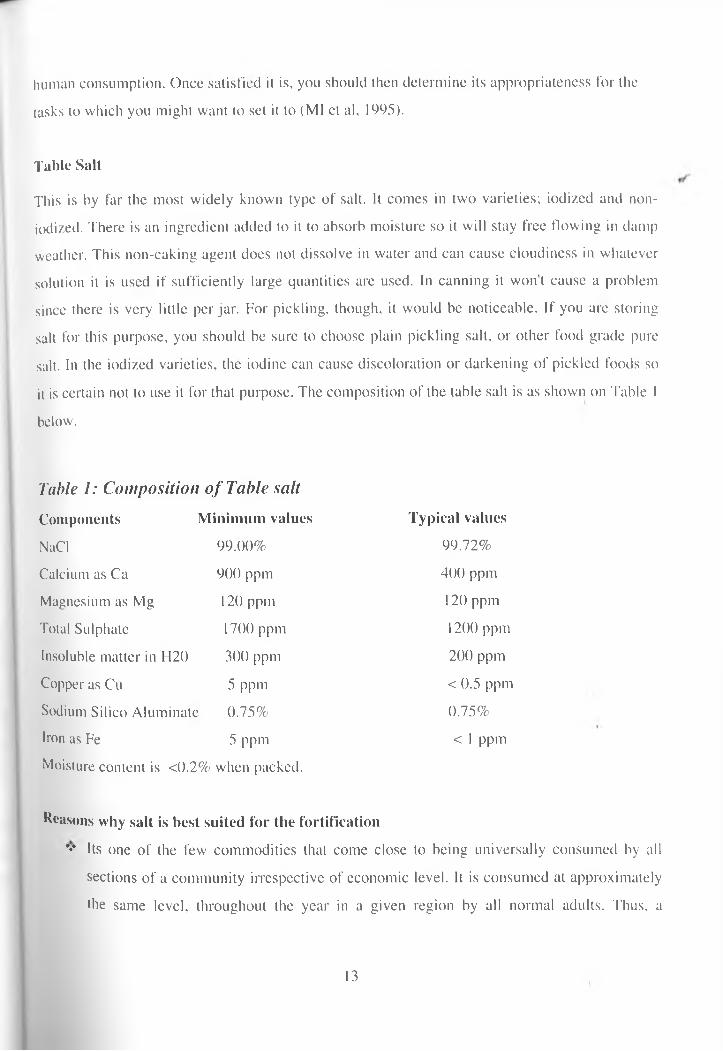
Table SaltThis is by far the most widely known type of salt. It comes in two varieties; iodized and noil- iodized. There is an ingredient added to it to absorb moisture so it will stay free flowing in damp weather. This non-caking agent does not dissolve in water and can cause cloudiness in whatever solution it is used if sufficiently large quantities are used. In canning it won’t cause a problem since there is very little per jar. For pickling, though, it would be noticeable. If you are storing salt for this purpose, you should be sure to choose plain pickling salt, or other food grade pure salt. In the iodized varieties, the iodine can cause discoloration or darkening of pickled foods so it is certain not to use it for that purpose. The composition of the table salt is as shown on Table 1 below.
Table 1: Composition o f Table salt Components Minimum values Typical valuesNaCl 99.00% 99.72%Calcium as Ca 900 ppm 400 ppmMagnesium as Mg 120 ppm 120 ppmTotal Sulphate 1700 ppm 1200 ppmInsoluble matter in H20 300 ppm 200 ppmCopper as Cu 5 ppm < 0.5 ppmSodium Silico Aluminate 0.75% 0.75%Iron as Fe 5 ppm < 1 ppmMoisture content is <0.2% when packed.
Reasons why salt is best suited for the fortification*♦* Its one of the few commodities that come close to being universally consumed by all
sections of a community irrespective of economic level. It is consumed at approximately the same level, throughout the year in a given region by all normal adults. Thus, a
13

micronutrient like iron or iodine when introduced through salt will be administered to each individual at a uni form dosage throughout the year.
Compared to other food commodities, whose production is widely dispersed, production of Salt is generally limited to a lew' centres. By adding a fixed dosage of micronutrienl like iron or iodine to salt at centralised locations, a majority of the population all over a region or country will ingest the nutrient in physiological amounts continuously with no additional effort.
... The mixing of an iodine or iron compound with salt is a simple operation and produces no adverse chemical reactions. The equipment required is uncomplicated, easy to operate and maintain.
•> The addition to salt of iodine (usually in the form of potassium iodide or iodate) or iron (usually in micro-encapsulated form) does not impart any colour, odour or taste to the salt. The double fortified salt is in fact not distinguishable from the ordinary salt.
❖ The cost of fortification of salt is low compared to the economic implications of iron or iodine deficiency to the community (Ml et al, 1995).
14.3. Micronutrient status Iron*r o n an important trace mineral that is found in every cell of the body, usually combined with l1l0!|,|n-1* is essential to the formation of haemoglobin and myoglobin, which carry oxygen in the blood and muscles. It is also needed for catalysing the conversion of beta-carotenes to V| am,n A. for detoxification of drugs in the liver and for production of anti-bodies (Hallman and
•P. 1996). Most of the iron in the body is found in the blood, but some is present in every cell, un<l to iron-containing enzymes (Guthrie el al, 1989).
'unctions
14
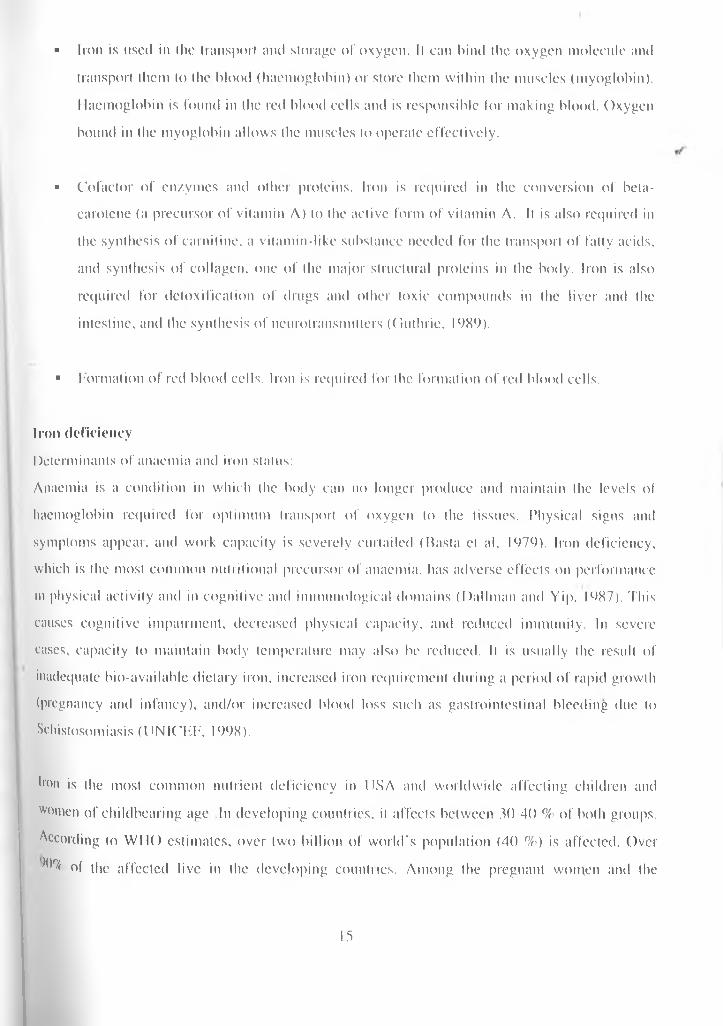
■ Iron is used in the transport and storage of oxygen. It can hind the oxygen molecule and transport them to the blood (haemoglobin) or store them within the muscles (myoglobin). Haemoglobin is found in the red blood cells and is responsible for making blood. Oxygen bound in the myoglobin allows the muscles to operate effectively.
■ Cofactor of enzymes and other proteins. Iron is required in the conversion of beta- carotene (a precursor of vitamin A) to the active form of vitamin A. It is also required in the synthesis of carnitine, a vitamin-like substance needed for the transport of fatty acids, and synthesis of collagen, one of the major structural proteins in the body. Iron is also required for detoxification of drugs and other toxic compounds in the liver and the intestine, and the synthesis of neurotransmitlers (Guthrie. 1989).
■ Formation of red blood cells. Iron is required for the formation of red blood cells.
Iron deficiencyDeterminants of anaemia and iron status:Anaemia is a condition in which the body can no longer produce and maintain the levels of haemoglobin required for optimum transport of oxygen to the tissues. Physical signs and symptoms appear, and work capacity is severely curtailed (Basta el al. 1979). Iron deficiency, which is the most common nutritional precursor of anaemia, has adverse effects on performance in physical activity and in cognitive and immunological domains (Hallman and Yip, 19S7). This causes cognitive impairment, decreased physical capacity, and reduced immunity. In severe cases, capacity to maintain body temperature may also be reduced. It is usually the result of inadequate bio-available dietary iron, increased iron requirement during a period of rapid growth (pregnancy and infancy), and/or increased blood loss such as gastrointestinal bleeding due to Schistosomiasis (UNICEF, 1998). *
*r°n is the most common nutrient deficiency in USA and worldwide affecting children and women of childbearing age In developing countries, it affects between 30-40 % of both groups. According to WHO estimates, over two billion of world's population (40 %) is affected. Over ^ of the affected live in the developing countries. Among the pregnant women and the
1 5
elderly. 50% is affected. Another group which is children, whom over 75% is anaemic or iron deficient.35% of the non-pregnant women and 32-55% both male and female adolescents are also affected (Ramakrishna, 1995). However these estimates are non-representative in terms of regions and populations. A few countries have reported anaemia prevalence to WHO.
Information is generally limited to hospital records with little data on other groups except women who are pregnant.
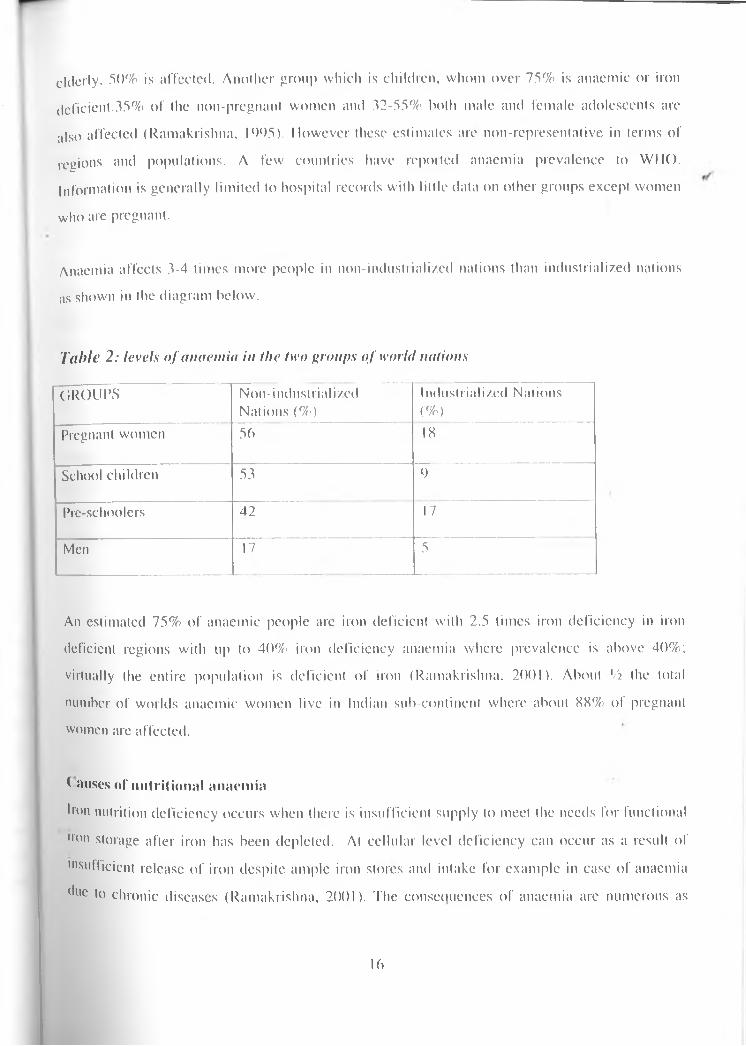
Anaemia affects 3-4 times more people in non-industiiali/ed nations than industrialized nations as shown in the diagram below.
Tabic 2 : levels o f anaemia in the two groups o f world nationsGROUPS Non-industrialized
Nations (%)Industrialized Nations(%)
Pregnant women 56 IX
School children 53 9Pre-schoolers 42 17Men 17 5
An estimated 75% of anaemic people are iron deficient with 2.5 times iron deficiency in iron deficient regions with up to 40% iron deficiency anaemia where prevalence is above 40%; virtually the entire population is deficient of iron (Ramakrishna. 2001). About Vi the total number of worlds anaemic women live in Indian sub-continent where about XX% of pregnant women are affected.
( a uses of nutritional anaemiaIron nutrition deficiency occurs when there is insufficient supply to meet the needs for functional ,rori storage after iron has been depleted. At cellular level deficiency can occur as a result of "’sufficient release of iron despite ample iron stores and intake for example in case of anaemia due to chronic diseases (Ramakrishna, 2001). The consequences of anaemia are numerous as
lb
iron plays a central role of mechanism for transport for oxygen and is essential in many enzyme systems. In children it is associated with impaired cognitive development, in adults iron deficiency is associated with weakness and fatigue, which reduces capacity for physical productivity. In pregnant women it contributes to maternal morbidity and mortality and increased risk of foetal morbidity, mortality and low birth weight. Severe anaemia may be a contributory factor to about 50% of maternal deaths, and it is main cause of up to 20% of maternal deaths in developing countries (ACCN/SCN; UNDP. 1997).
a) Changes in body iron levelsIron deficiency in women is caused by failure to consume high amounts for growth and failure to replace losses during menstruation and pregnancy. Low intakes of either total iron or absorbable (hio-available) type or excessive iron losses due to parasitic infections may also lead to deficiency.
Increased iron requirementsIron requirements vary greatly with age. gender and physiological status. Approximate amounts of iron vary with individuals and can be expressed as mg/ day/ lOOOkcl.The various amounts required by different groups are shown in the table 2 below.
17
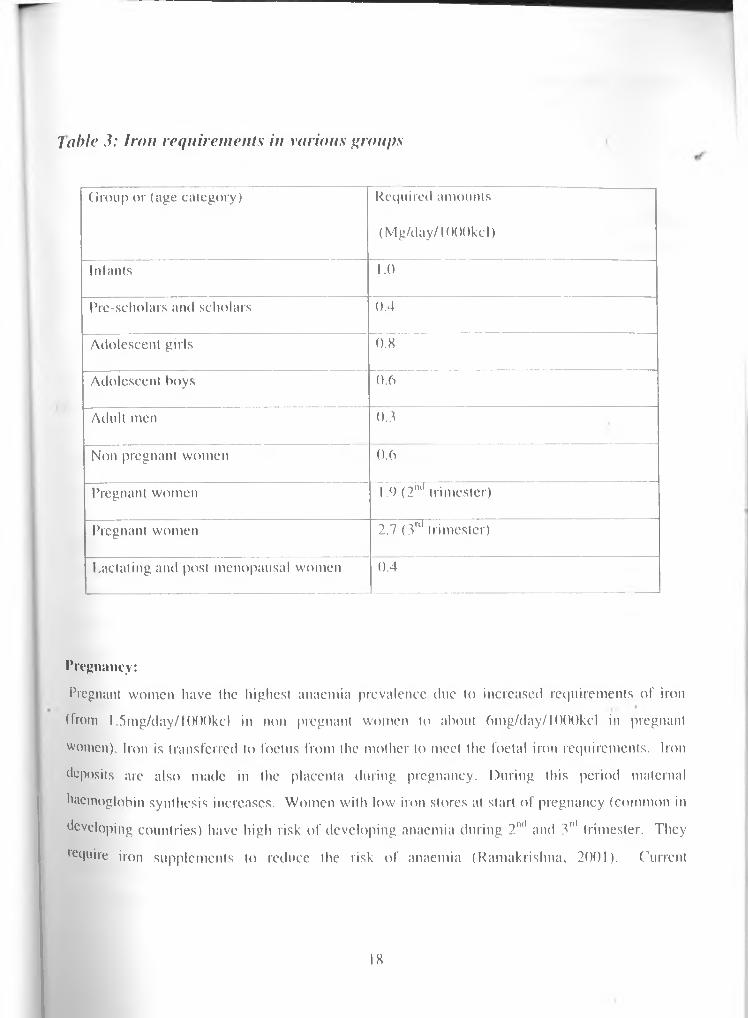
7 able 3: Iron requirements in various groups
Group or (age category) Required amounts (Mg/day/IOOOkcl)
Infants 1.0Pre-scholars and scholars 0.4Adolescent girls 0.8Adolescent boys 0.6Adult men 0.3Non pregnant women 0.6Pregnant women 1.9 (2ml trimester)Pregnant women 2.7 (3ul trimester)Lactating and post menopausal women 0.4
Pregnancy:Pregnant women have the highest anaemia prevalence due to increased requirements of iron (from 1.5mg/day/l()00kcl in non pregnant women to about 6mg/day/l(X)0kcl in pregnant women). Iron is transferred to foetus from the mother to meet the foetal iron requirements. Iron deposits are also made in the placenta during pregnancy. During this period maternal haemoglobin synthesis increases. Women with low iron stores at start of pregnancy (common in developing countries) have high risk of developing anaemia during 2ml and 3"' trimester. They require iron supplements to reduce the risk of anaemia (Ramakrishna. 2001). Current
IX
international recommendations are (SOmg/day lor six months during pregnancy and continuing three months post-partum in regions where prevalence of anaemia is above 40%.
Menstruation:Approximately half the iron of menstruating women is used to cover for iron loss during menstruation periods. 'This explains why women requirements of iron are twice the requirements for men and why deficiency is more common in women. Losses depend on level of menstruation, heavy losses occur in heavy menstruation as in women using intra uterine devices.
Infancy:Due to high requirements of iron for rapid growth infants arc vulnerable to iron deficiency. During the first four months, total body iron stores are fairly constant and about half the storage is mobilized for haemoglobin and enzyme synthesis. Breast milk is low in iron and the low amounts are also of low bio-availability. In developing countries half the infants are anaemic by one-year age.
Inclusion of iron rich foods for example liver, meat, dry fish, could help in alleviating iron deficiency but this is rarely consumed in third world (WHO, 1992). After two years prevalence of anaemia is low as more variety of foods arc taken but in developing countries prevalence is high due to low consumption of iron rich foods. Low birth weight is common in developing countries and this is risk factor for anaemia due to low iron stores.
AdolescencePrevalence in iron deficiency and anaemia increases at start of adolescence in girls and this is due to increased requirements for growth, which is aggravated a few years later by onket of menstruation.
•>) Low intake and/or of dietary ironThe best sources of iron are usually meat, fish and poultry. These have high hacme iron, which is of high bio-availability (about 20% is absorbed). In industrialized countries, daily iron intakes
19

range from 8 to 18 mg willi adults with low variations across soeio - economic groups. In non- industriali/.ed countries rates are higher among legumes consumers and ranges arc between 15 and 30mg, however, the iron is of low bio-availability and only 2 to 5 % is absorbed. This is because legumes and cereals consist mainly of non- haeme iron.
tphytates are generally high in un-germed maize, wheat, rice and legumes, which are the common staple foods in developing countries. I’hytales are strong inhibitors of iron absorption.Polyphenols, which are high in legumes, tea, nuts, and coffee, are also strong inhibitors of iron absorption. These food substances are also consumed in high amounts in both third world and developing countries. Oxalates, which are found in spinach and leafy green vegetables common in African recipes, also affect iron absorption. Fermentation, germination and soaking of cereals and legumes increases iron bio-availability in them. Leavening bread with yeast increases iron availability whereas unleavened bread is a risk factor in iron deficiency.
Increase in vitamin C through increased consumption of fruits and vegetable increases iron absorption. Low vitamin C is a risk factor in anaemia (Gillespie. 1998). However, the influence of ascorbic acid is less than influence of iron content in diets taken. Amounts absorbed depend on body stores and different diets.
Table 4: Iron absorption rates for non-anaeniic individuals from different foods.Food groups Absorption rates by non-anemic
individuals (%)Cereals, roots and legumes with no 5.0ascorbic acid or meat .»
Intermediate diets, low animal products 10with ascorbic acidHigh bio-available diets with high meat 15and ascorbic contents
— -— _
For similar diets iron deficient individuals will absorb 50% more of the iron intakes in diet.Many types of iron in foods and vegetables is usually non-haemc which is of low bio^availability of between land 8%. Ferric iron state is usually bound to protein phytates, oxalates, phosphates, polyphenols and carbonates (Passmore et al, 1986).High intakes of calcium and phosphates inhibit the absorption of iron, which makes the iron unavailable and increases the risk of iron deficiency (Dalman and Yip, 1996). Amounts of iron absorbed are also affected by high intakes of fibre, which depresses the utilization of iron and accounts for about 2% losses from green vegetables.
C) Diseases and parasitic infestationMalaria, diarrhoea! diseases, acute respiratory infections, 111V/A IDS, TB, Hepatitis B & C, severe protein-energy malnutrition, hookworm infestation. Schistosomiasis are known to cause and aggravate anaemia. Malaria is a leading causal factor. Non inflammatory conditions such as rheumatic arthritis, malignant tumours and chronic renal failure arc also associated with anaemia directly or indirectly. Genetic conditions e.g., sickle cell disease and trait affects haemoglobin levels (Mwaniki et al. 2001).
Symptoms of iron deficienciesPrevalence is particularly high among infants, young children and pregnant women. Gradual sequence of changes results in anaemia characterized by low haemoglobin levels. In brief, evidence of deficiency includes:
Pallor of membranes FatigueReduced work productivity ApathyLow secretion of hydrochloric acid in the stomachIncreased susceptibility to infectionshi children low psychomotor and mental development.
Anaemia is a serious outcome of iron deficiency. It is possible to be iron deficient but not anaemic and to be anaemic but not iron deficient. Non-iron related anaemia includes that which ls caused either by genetic problem, malaria, or intestinal parasitic infestations (Guthrie. 1989).
21
Classes of anaem ia(a) Nutrition anaemia caused by low dietary intakes of iron.(b) Pernicious anaemia caused by low Red Blood Cells (RBC) due to low vitamin BI2.(c) Hemorrhagic anaemia caused by high loss of blood through accidents, surgery or
intestinal parasites.Steps towards addressing iron deficiencySeveral methods have been advanced to combat anaemia at national level in different countries including; iron supplementation, fortification of foods and water. Success depends on methods most suitable and acceptable to target populations. Another problem is bio-availability of iron salts that are added, tastes and colour of the product. Industrial technology and infrastructure required in production of affordable fortified foods as well as distribution networks, which arc lacking in most developing countries (UNU. 2002) need to be improved for efficient fortification programmes.
In Kenya, iron supplementation is carried out at antenatal clinics but at national level there has been no co-ordinated efforts at alleviating iron deficiency anaemia. Iron fortification in developing countries at national level, requires new innovative efficacious and cost-effective methods adapted to their socio-economic and cultural environments. These methods must be simple and cheap to sustain by the local communities through cost sharing with governments of affected nations
Vitamin AOver 2.8 million children who are (approximately 0.1% of total) of below 5 years children have clinical xerophthalmia with approximately I million of these children in Africa. Vitamin A deficiency is usually due to low intakes in diets and parasitic infestations. Vitamin A deficiency causes anaemia. This can be alleviated by iron and vitamin A supplementation but not iron ;donc. Low vitamin A causes impaired mobilization of iron stores due to possibly lack of Vlla,nin on transferring receptors. Other vitamins important in iron mobilization include nboflavin, folic acid, which causes megaloblastic, macrocytic anaemia, as they are required in RBC synthesis. Vitamin BI2 is also important in anaemia alleviation as it causes megaloblastic anaemia.
22
CHAPTER THREES T U D Y M E T H O D O L O G I E S3.1 STUDY SITEMeru Central District was curved from tlie former larger Mem District, which comprised of ^ other districts including Meru North and Meru South districts. The District is in Eastern Province in Kenya. Being on the equator, it has diverse agro-ecological zones with good drainage systems.Its climate is influenced by high altitude (between 2500-5l99m asl). Timau lies on the leewardIside of Ml. Kenya. High altitude reduces the temperatures and the rate of evaporation and forces the rain bearing clouds to deposit most of the moisture on the windward side of mount Kenya leaving the leeward side with little rain. The rains are bimodal; long rains between March and may, short rains between October and December. Being on the equator the temperature ranges are not affected by rain but it influences seasonality in the area.
Administratively, it’s divided into 27 divisions and 75 locations. Timau division is the largest with an area of 1060 sq. km. It has 3 locations and 6 sub-locations. The district had a total population of 430,280 according to a recent census (GOK, 1999) with a growth rate of 2.843%. Timau division had a population of 18,052 (lowest in relation to other divisions). This is due to presence of large farms where wheat growing and cattle ranching is carried out (GOK*. 1997),
The area has highly fertile soils of loam type, which allows growing of different types of crops and rearing of different animals. Food crops grown include maize, millet, potatoes and wheal. Cash crops include tea, coffee, barley tobacco, and wheat. Timau area where the study was carried out has both large-scale and small-scale horticultural and wheat farming activities. Livestock are kept in varying numbers and types throughout Meru District. They include cattle, sheep, horses, goats and poultry in small and large scale.
3 2 COMMUNITY ENTRY, RECRUITMENT AND TRAINING <)l RESEARCH ASSIS I ANTS tielore the study implementation, the villagers were mobilised through briefing and discussing
study protocols with the administrators (D.O, chiefs and assistant chiefs) and the village elders who in turn spread word around the study area. In recruitment of field assistants, only I °se with adequate literacy and numeric skills were considered. Those with Form Four
23
certificates were interviewed, recruited, trained and assigned various selected villages to carry out the survey. To ease the process of community entry, only people from the area were recruited as field assistants.
3.4 SAMPLE SIZEFood intake was weighed for three consecutive days for 33 households for all individuals within the household. Those individuals who missed meals equivalent to two days food intake were not considered In the analysis. The food varieties in all the villages were similar and therefore the study subjects were pooled. This took into accounts that the study was in-depth consumption study (Hatloy, 1998)
3.5 STUDY DESIGN AND SAMPLING PROCEDUREThe study was cross-sectional and descriptive. It was carried out in three villages in Timau division of Meru District. Multi-stage sampling was used during the study. The-sampling frame consisted of the clusters (villages) in the purposively selected sub-location in the study site. The criteria for village selection were the length of time since settlement in the area. Those villages with stable settlement period (at least six months occupation) were purposively selected to give the true consumption patterns of the division. The households were randomly selected from all the households meeting the selection criteria. A household in reference to this survey were a
t group of people who might be related by blood or not but share food from the same pot.
In this study, thirty-three households were selected through proportionate sampling procedure: 10. 12 and 1 I families were picked from Milimani, Ruseni and Kambakia respectively according to total number of households. Coding was appropriately done for ease of identification during analysis and to prevent logistical complications during the study. The study was carried out over a pciiod ol 30 days running from Is' to 3()lh March 2004, including community entry, recruitment and training of field assistants.
3.6 ,)aTA COLLECTION TOOLShe data collection tools consisted of the following:
a) A structured questionnaire which consisted of the following modules:• Social demographic and social economic characteristics of the households.
24

• Food production and utilisation in the households.• Food consumption patterns.• Foods consumption frequency.• Nutrient and salt intakes.• Anthropometrical measurements of all household members,
h) Key informant’s guidelines.
3.7 DATA COLLECTION PROCEDUREa) SOCIO-DEMOGRAPHIC AND SOCIO-ECONOMIC CIIARACTRISTICS OF HOUSEHOLDSSex, Age, Household size. Household headship. Education level and other demographic information needed was collected by use of a structured questionnaire. The ages of all members were inquired from the mother or household head. To verify the ages given, the enumeratorsjexamined documentary evidence of the birth date (such as birth, baptismal certificate or clinic card) where possible, as errors in recalls are common. Age was approximated to nearest month for children. If dates could not be recalled, local calendar of events was used to approximate the age of the children. If there are two mothers in the household, both mothers were interviewed.
b) FOOD PRODUCTION AND UTILISATIONA module was designed to collect detailed information on land ownership and major crops grown, stored and consumed. This module was also used to get information on other sources ol food consumed in the household such as gifts or donations from friends, organizations or government relief food. This module was administered on the head of household or his wife.
ic) FOOD CONSUMPTION PATTERNSThis was determined by taking into account all the meals prepared in each household, times ol preparation and the members of the household who ate the food. These meals included breakfast, 'l|nch, snacks and dinner.
25
(I) NUTRIENT INTAKEFood intakes were obtained by a 3-day weighed record, which gave the types, and amounts of foods including condiments such as salt, spices or any other food commodities consumed over a period of three days in the household by each member of the household. Amounts of food commodities were weighed raw after the removal of peels. After cooking, the mixture was weighed before serving. To estimate the amounts consumed by each member during each meal over the three days, any leftovers and food not eaten were subtracted after separate estimation. The amounts were then added for all meals of the day and then the amounts for the period, was got by adding the total intakes for three days. The amounts were then divided by three days to give the average daily intakes. Weights were taken using a kitchen scale (with an accuracy of-±2g).
e) FOOD CONSUMPTION FREQUENCYThis module was used to obtain qualitative, descriptive information about usual food consumption patterns. A focused questionnaire was used. A detailed list of foods was given and a set of frequency-of-use response categories. Frequency of consumption of iron rich food groups was determined. Consumption frequencies were obtained from the mothers.
0 NUTRITIONAL STATUS.Nutritional status was assessed by use of anlhropomelrical measurements: height and weights were taken of all children who were under-five years of age, teenagers and adults. Standardised specific techniques were used as described by bulletin of the World Health Organisation (WHO, 1986). Children less than two years were weighed using the Salter Scale (with maximum of 23 kilograms and an accuracy of lOOgrams). They were weighed without shoes but with light clothing, which was adjusted by subtracting 130 grams from their weights. The older'children above 2 years of age but below five years, teenagers and adults were weighed using a bathroom scale (calibrated to 50 grams) interval. To adjust for their light clothing 250 grams were subtracted from their weights. *
*1e 'cn&l'1s of the children below 3 years of age were taken using a portable stadiometcr with a tlng headrest, (0.1 cm accuracy) while lying by their backs. For the children above 3 years of
26
age, teenagers and adults were measured standing straight against the stadiometer (height was read to the nearest 0.1 cm). The data was recorded in tabular form (refer to appendix questionnaire).
3.7 DATA QUALITY CONTROLTo guarantee quality data was collected, proper monitoring and evaluation was done from period before actual survey to the time of data entry. The following points were emphasized:1. Proper coding of the questionnaire.2. Proper selection and calibration of the equipment.3. Recruitment and adequate training of the field assistants.4. Constant supervision by direct observation of measurements in the field.3. At the end of the day. the data forms for survey were screened to check for recording errors and completeness. Any incomplete form or those containing suspicious entries were checked with repeat visit and corrected.6.The equipment were re-calibrated midway through the study and before the last week of data collection to ensure sustained efficiency. »
3.8 DATA HANDLING AND ANALYSISDuring (he study, the foods recorded were coded and data entered into computer using SPSS Version 1.0. Descriptive analysis, analysis of correlation and variance were run on SPSS software programme.During (he analysis, all food varieties consumed by all household members over a period of threedays were determined. The foods were weights before cooking, after cooking and the amountsserved to each household member determined. The actual food types consumed were determinedby subtracting the leftovers after the meal for each member of the household and thePpfoxiinate ratio of the ingredients. Food varieties per household member were computed•fferent|y and tabulated. The daily intakes per study subject were entered into the computer' l!1? SPSS program (Ming’ala, 2002). Data cleaning was done. Daily intakes of various
nutrjCm • .,ls "l terms ol calories, proteins, vitamin C and iron were determined. Daily intakes of Uutrients (phytales) were also determined. A comparison of the dietary intakes with the Us Recommended Daily Allowances (RDA) to establish adequacy of the intakes was done.
27
Dietary intake analysis was based on age groups and the Kenyan Food composition Tables (Sehmi et al, 1993). The calculations of the dietary intakes of the various nutrients from the foods consumed were done for each of the subjects in the selected households. Those individuals whose dietary patterns did not give adequate information on the intakes were not included. These *' were mainly the absentee household heads who worked far from home hence not present for most meals. The nutritional status of the study children and teenagers was determined using Epi- Info and Epi-Nut software programmes. The nutritional status of the adults was determined by
• analysing the Body Mass Index using SPSS programme.
2K
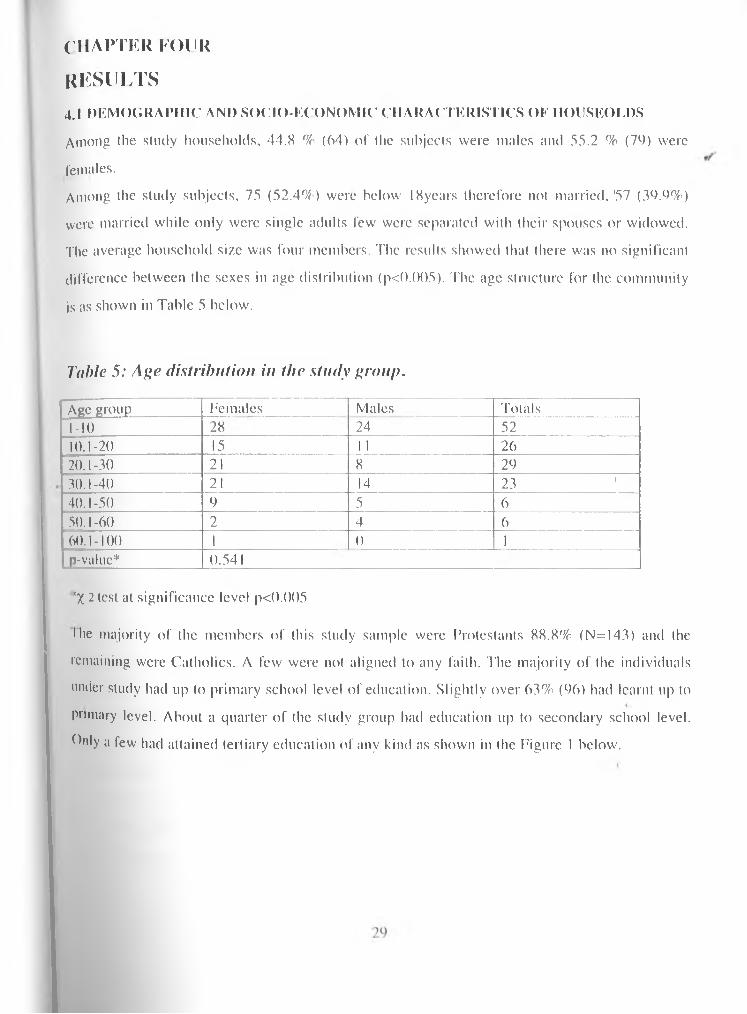
CHAPTER FOURR E S U L T S4.1 DEMOGRAPHIC AND SOCIO-ECONOMIC CHARACTERISTICS OF HOUSEOEDS Among the study households, 44.X % (64) of the subjects were males and 55.2 % (76) were females.Among the study subjects, 75 (52.4%) were below IXyears therefore not married.'57 (39.9%) were married while only were single adults few were separated witli their spouses or widowed. The average household size was four members. The results showed that there was no significant difference between the sexes in age distribution (p<().()()5). The age structure for the community is as shown in Table 5 below.
Table 5: Age distribution in the study group.Age group Females Males Totals1-10 28 24 5210.1-20 15 1 1 2620.1-30 21 8 2930.1-40 21 14 23 140.1-50 9 5 650.1-60 2 4 660.1-100 1 0 1p-value* 0.541!;X 2 test at significance level p<().()()5•he majority of the members of this study sample were Protestants 88.8% (N=I43) and the remaining were Catholics. A few were not aligned to any faith. The majority of the individuals under study had up to primary school level of education. Slightly over 63% (96) had learnt up to primary level. About a quarter of the study group had education up to secondary school level, hilly a few had attained tertiary education of any kind as shown in the Figure 1 below.
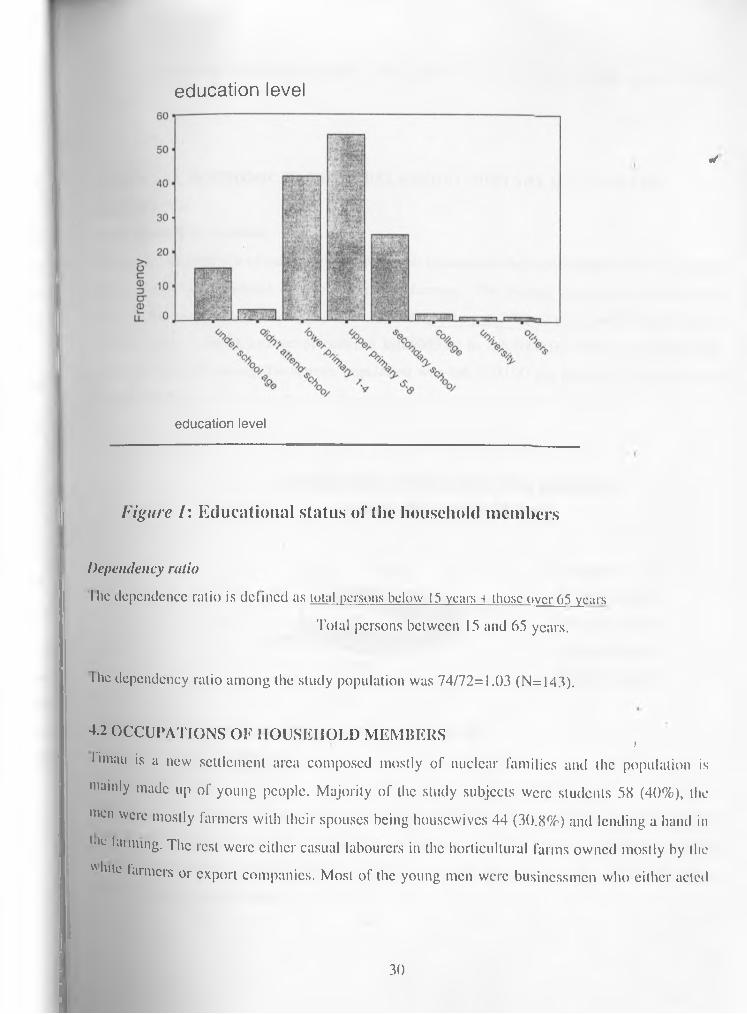
e d u c a t i o n le v e l
education level
✓
Figure I: E d u cation a l sta tu s o f the household m em b ers
Dependency ratioI he dependence ratio is defined as total persons below 15 years + those over 65 years
Total persons between 15 and 65 years.
I lie dependency ratio among the study population was 74/72=1.03 (N=143).
4.2 OCCUPATIONS OF HOUSEHOLD MEMBERS )Umau is a new settlement area composed mostly of nuclear families and the population is mainly made up of young people. Majority of the study subjects were students 58 (40%), the men were mostly farmers witli their spouses being housewives 44 (30.8%) and lending a hand in lilL ,aim‘ng- The rest were either casual labourers in the horticultural farms owned mostly by the "lute farmers or export companies. Most of the young men were businessmen who either acted
30
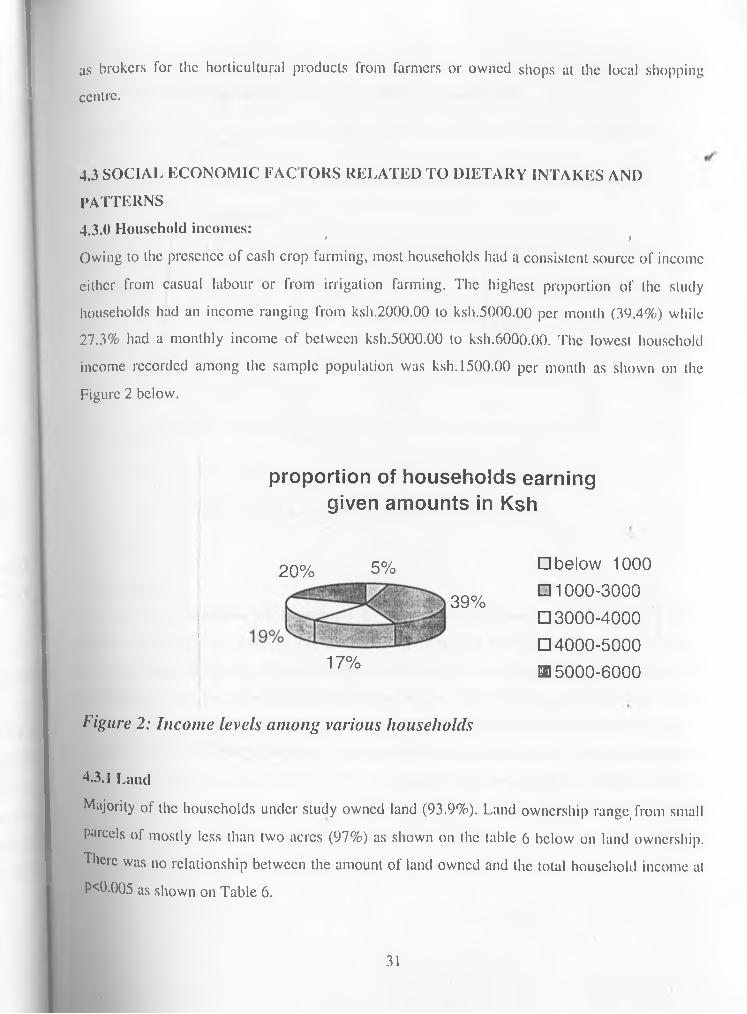
as brokers for the horticultural products from farmers or owned shops at the local shopping centre.
4.3 SOCIAL ECONOMIC FACTORS RELATED TO DIETARY INTAKES AND PATTERNS4.3.0 Household incomes: t jOwing to the presence of cash crop farming, most households had a consistent source of income either from casual labour or from irrigation farming. The highest proportion of the study households had an income ranging from ksh.2000.00 to ksh.5000.00 per month (39.4%) while 27.3% had a monthly income of between ksh.5000.00 to ksh.6000.00. The lowest household income recorded among the sample population was ksh. 1500.00 per month as shown on the Figure 2 below.
proportion of households earning given amounts in Ksh
ii
20% 5%
39%
17%
□ be low 1000
□ 1 0 0 0 -3 0 0 0□ 3 0 0 0 -4 0 0 0□ 4 0 0 0 -5 0 0 0 0 5 0 0 0 - 6 0 0 0
Figure 2: Income levels among various households
4.3.1 LandMajority of the households under study owned land (93.9%). Land ownership range, from small parcels of mostly less than two acres (97%) as shown on the table 6 below on land ownership. There was no relationship between the amount of land owned and the total household income at P<0.005 as shown on Table 6.
31
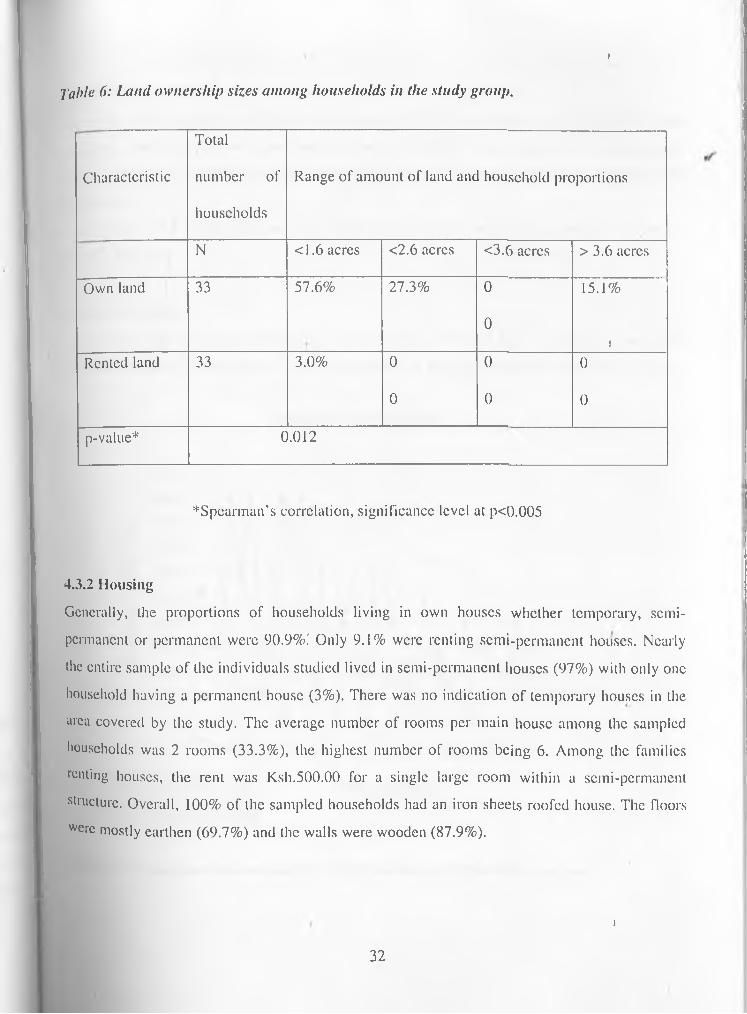
1
Table 6: Land ownership sizes among households in the study group.
CharacteristicTotalnumber of households
Range of amount of land and household proportions
N <1.6 acres <2.6 acres <3.6 acres >3.6 acresOwn land 33 57.6% 27.3% 0 15.1%
0J
Rented land 33 3.0% 0 0 00 0 0
p-value* 0.012
^Spearman’s correlation, significance level at p<0.005
4.3.2 HousingGenerally, the proportions of households living in own houses whether temporary, semipermanent or permanent were 90.9%i Only 9.1% were renting semi-permanent houses. Nearly the entire sample of the individuals studied lived in semi-permanent houses (97%) with only one household having a permanent house (3%). There was no indication of temporary houses in the area covered by the study. The average number of rooms per main house among the sampled households was 2 rooms (33.3%), the highest number of rooms being 6. Among the families renting houses, the rent was Ksh.500.00 for a single large room within a semi-permanent structure. Overall, 100% of the sampled households had an iron sheets roofed house. The floors Wcrc mostly earthen (69.7%) and the walls were wooden (87.9%).
t32
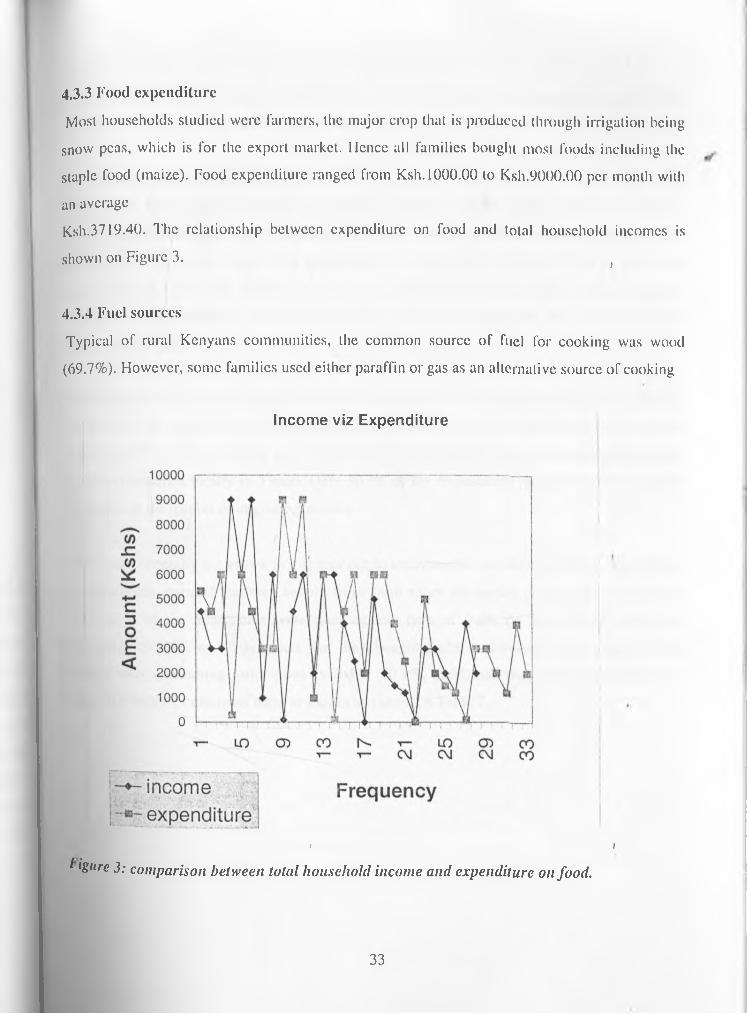
4.3.3 Food expenditureMost households studied were farmers, the major crop that is produced through irrigation being
snow peas, which is for the export market. Hence all families bought most foods including the staple food (maize). Food expenditure ranged from Ksh. 1000.00 to Ksh.9000.00 per month with an averageKsh.3719.40. The relationship between expenditure on food and total household incomes is shown on Figure 3. f
4.3.4 Fuel sourcesTypical of rural Kenyans communities, the common source of fuel for cooking was wood (69.7%). However, some families used either paraffin or gas as an alternative source of cooking
Income viz Expenditure
> iI igiire 3: comparison between total household income and expenditure on food.
33

* Ienergy. The basic light source for most families in the study sample was hurricane lamp (72.7%), while the alternative .source in most households was tin lamp (48.5%).
4.3.5 Food production and utilisationUnlike most Kenyan rural households where staple food is mostly maize, Timau had another equally important staple food: Irish potatoes, which were consumed in large quantities in all households under study. Maize was considered by majority households (63.3%) as the staple food, while 33.3 % of the families said it was potatoes. Most households under study grew potatoes in large quantities. Maize was generally not grown in the area due to long maturity period and low yields.
' J
✓
Vegetables were grown by irrigation throughout the year for both local market and for export. However not all vegetables grown were consumed by the households under study and generally in the area. The most commonly grown horticultural product was snow peas (fresh pods), which were not consumed locally in Timau. Only 30.3% of the respondents reported that they bought vegetables in the market or in green groceries.
Fruits were generally not grown in this area due to unfavourable weather conditions. Majority of the households reported that they bought fruits from either the market or green groceries. Only 6.1% (n=2) of the households were growing any type of fruits on their farms. Nearly all households (90.9%, n=30) revealed that they bought fruits occasionally from traders. Most lamilies were consuming fruits when available (80.9%, n=30) and they could afford the price while 10.1 %(n=3) consumed them as snacks as shown on Table 7.
' J34
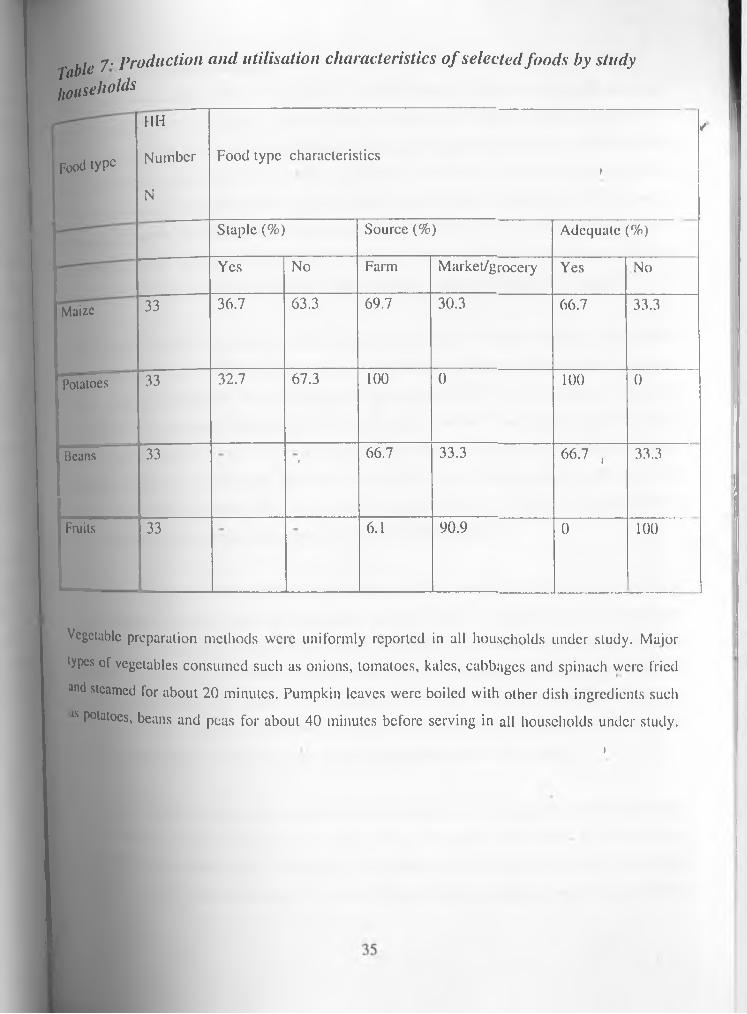
Tablehouse7 - Production and utilisation characteristics of selected foods by study holds
Food tyPc
HHNumberN
/Food type characteristics
1
Staple (%) Source (%) Adequate (%)Yes No Farm Market/grocery Yes No
Maize 33 36.7 63.3 69.7 30.3 66.7 33.3
Potatoes 33 32.7 67.3 100 0 100 0
Beans 33 r 66.7 33.3 66.7 , 33.3
Fruits 33 6.1 90.9 0 100
Vegetable preparation methods were uniformly reported in all households under study. Major types of vegetables consumed such as onions, tomatoes, kales, cabbages and spinach were fried and steamed for about 20 minutes. Pumpkin leaves were boiled with other dish ingredients such 8 P°latoes, beans and peas for about 40 minutes before serving in all households under study.
1
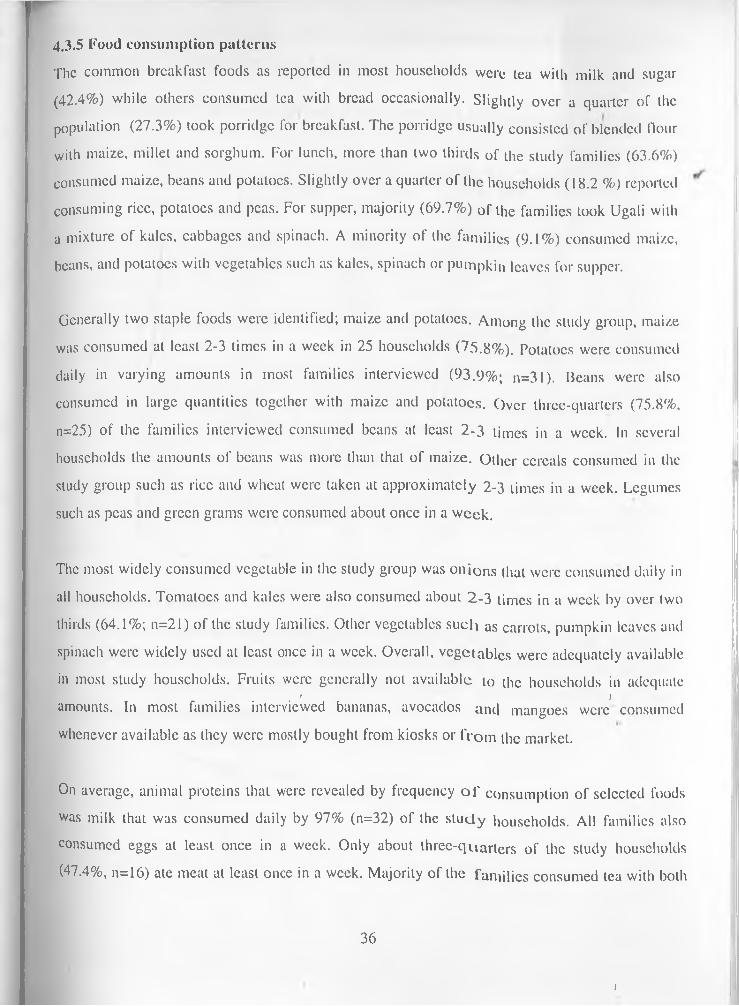
4.3.5 Food consumption patternsThe common breakfast foods as reported in most households were tea with milk and sugar (42.4%) while others consumed tea with bread occasionally. Slightly over a quarter of the population (27.3%) took porridge for breakfast. The porridge usually consisted of blended flour with maize, millet and sorghum. For lunch, more than two thirds of the study families (63.6%) consumed maize, beans and potatoes. Slightly over a quarter of the households (18.2 %) reported consuming rice, potatoes and peas. For supper, majority (69.7%) 0f the families took Ugali with a mixture of kales, cabbages and spinach. A minority of the families (9.1%) consumed maize, beans, and potatoes with vegetables such as kales, spinach or pumpkin leaves for supper.
Generally two staple foods were identified; maize and potatoes. Among the study group, maize was consumed at least 2-3 times in a week in 25 households (75.8%). Potatoes were consumed daily in varying amounts in most families interviewed (93.9%; n=31). Beans were also consumed in large quantities together with maize and potatoes. Over three-quarters (75.8%, n=25) of the families interviewed consumed beans at least 2-3 times in a week. In several households the amounts of beans was more than that of maize. Other cereals consumed in the study group such as rice and wheat were taken at approximately 2-3 times in a week. Legumes such as peas and green grams were consumed about once in a week.
The most widely consumed vegetable in the study group was onions that were consumed daily in all households. Tomatoes and kales were also consumed about 2-3 times in a week by over two thirds (64.1%; n=21) of the study families. Other vegetables such as carrots, pumpkin leaves and spinach were widely used at least once in a week. Overall, vegetables were adequately available in most study households. Fruits were generally not available to the households in adequate. ' iamounts. In most families interviewed bananas, avocados and mangoes were consumed whenever available as they were mostly bought from kiosks or from the market.
On average, animal proteins that were revealed by frequency o f consumption of selected foods was milk that was consumed daily by 97% (n=32) of the study households. All families also consumed eggs at least once in a week. Only about three-quarters of the study households (47.4%, n=16) ate meat at least once in a week. Majority of the families consumed tea with both
36
i
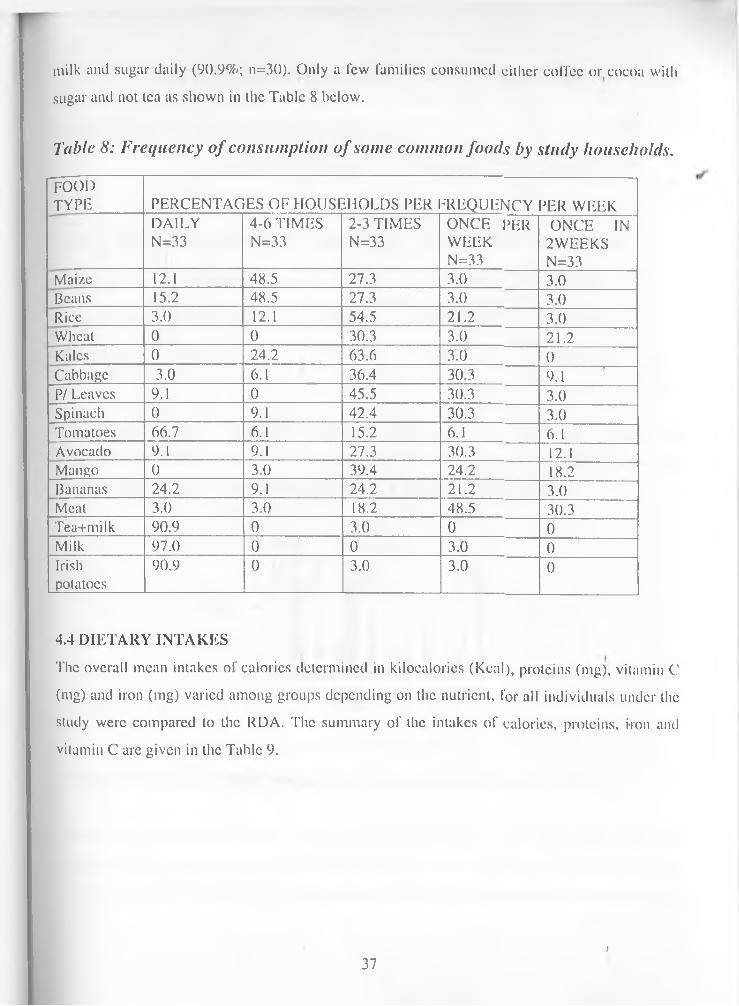
milk and sugar daily (90.9%; n=30). Only a few families consumed either coffee or cocoa with sugar and not tea as shown in the Table 8 below.
Table 8: Frequency o f consumption of some common foods by study households.FOODTYPE PERCENTAGES OF HOUSEHOLDS PER FREQUENCY PER WEEK
DAILYN=33
4-6 TIMES N=33
2-3 TIMES N=33
ONCE PERWEEKN=33
ONCE IN2WEEKSN=33
Maize 12.1 48.5 27.3 3.0 3.0Beans 15.2 48.5 27.3 3.0 3.0Rice 3.0 12.1 54.5 21.2 3.0Wheat 0 0 30.3 3.0 21.2Kales 0 24.2 63.6 3.0 0Cabbage 3.0 6.1 36.4 30.3 r 9 j rP/ Leaves 9.1 0 45.5 30.3 3.0Spinach 0 9.1 42.4 30.3 3.0Tomatoes 66.7 6.1 15.2 6.1 6.1Avocado 9.1 9.1 27.3 30.3 12.1Mango 0 3.0 39.4 24.2 18.2Bananas 24.2 9.1 24.2 21.2 3.0Meat 3.0 3.0 18.2 48.5 30.3Tea+milk 90.9 0 3.0 0 0Milk 97.0 0 0 3.0 0Irishpotatoes
90.9 0 3.0 3.0 0
4.4 DIETARY INTAKESThe overall mean intakes of calories determined in kilocalories (Kcal), proteins (mg), vitamin C (mg) and iron (mg) varied among groups depending on the nutrient, for all individuals under the study were compared to the RDA. The summary of the intakes of calorics, proteins, iron and vitamin C are given in the Table 9.
)37
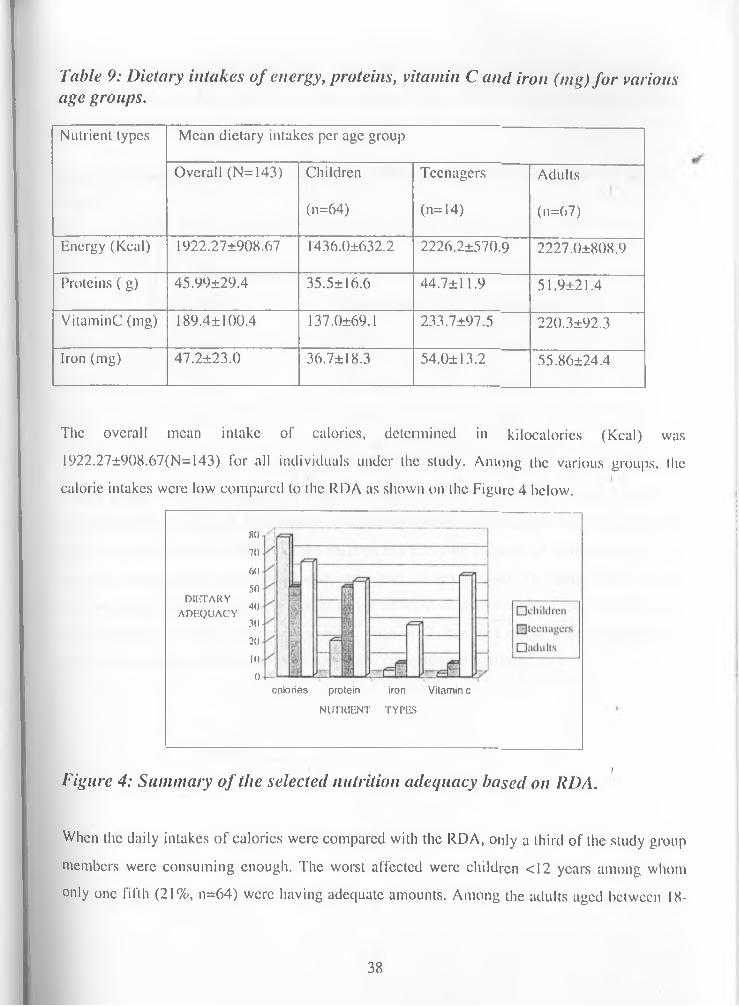
Table 9: Dietary intakes of energy, proteins, vitamin C and iron (mg) for various age groups.Nutrient types Mean dietary intakes per age group
Overall (N=143) Children Teenagers Adults(n=64) (n=14) (n=67)
Energy (Keal) 1922.27±908.67 1436.0±632.2 2226.2±570.9 2227.0±808.9Proteins ( g) 45.99±29.4 35.5± 16.6 44.7±11.9 51.9±21.4VitaminC (mg) 189.4± 100.4 137.0±69.1 233.7±97.5 220.3±92.3Iron (mg) 47.2±23.0 36.7±18.3 54.0±13.2 55.86±24.4
The overall mean intake of calories, determined in kilocalories (Kcal) was 1922.27±908.67(N= 143) for all individuals under the study. Among the various groups, the calorie intakes were low compared to the RDA as shown on the Figure 4 below.
80
70
60
50DIETARY
40ADEQUACY
30
20 10 0
calories protein iron Vitamin c
NUTRIENT TYPES
lFigure 4: Summary o f the selected nutrition adequacy based on RDA.
When the daily intakes of calorics were compared with the RDA, only a third of the study group members were consuming enough. The worst affected were children <12 years among whom only one fifth (21%, n=64) were having adequate amounts. Among the adults aged between IK-
38
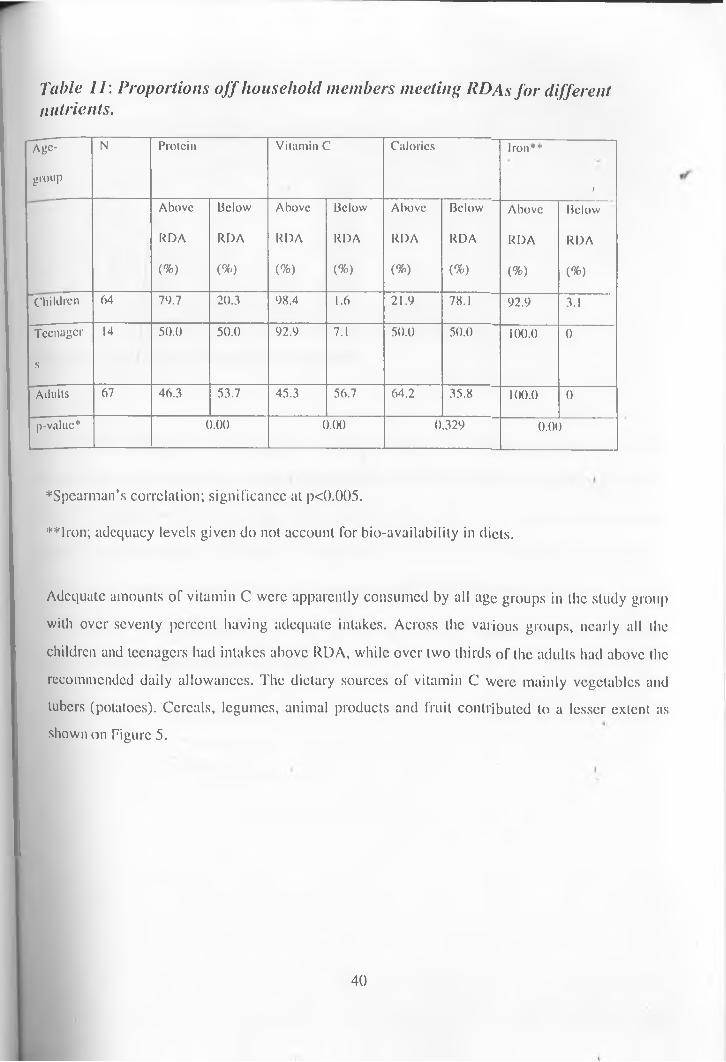
Table 11: Proportions off household members meeting RDAs for different nutrients.
Age-
group
N Protein Vitamin C Calories Iron**
iAbove Below Above Below Above Below Above Below
RDA RDA RDA RDA RDA RDA RDA RDA
(%) (%) (%) (%) (%) (%) (%) (%)
"Children 64 79.7 20.3 98.4 1.6 21.9 78.1 92.9 3.1
Teenager
s
14 50.0 50.0 92.9 7.1 50.0 50.0 100.0 0
Adults 67 46.3 53.7 45.3 56.7 64.2 35.8 100.0 0
p-value* 0.00 0.00 0.329 0.00
♦ Spearman’s correlation; significance at p<().()()5.**lron; adequacy levels given do not account for bio-availability in diets.
Adequate amounts of vitamin C were apparently consumed by all age groups in the study group with over seventy percent having adequate intakes. Across the various groups, nearly all the children and teenagers had intakes above RDA, while over two thirds of the adults had above the recommended daily allowances. The dietary sources of vitamin C were mainly vegetables and tubers (potatoes). Cereals, legumes, animal products and fruit contributed to a lesser extent as shown on Figure 5.
40
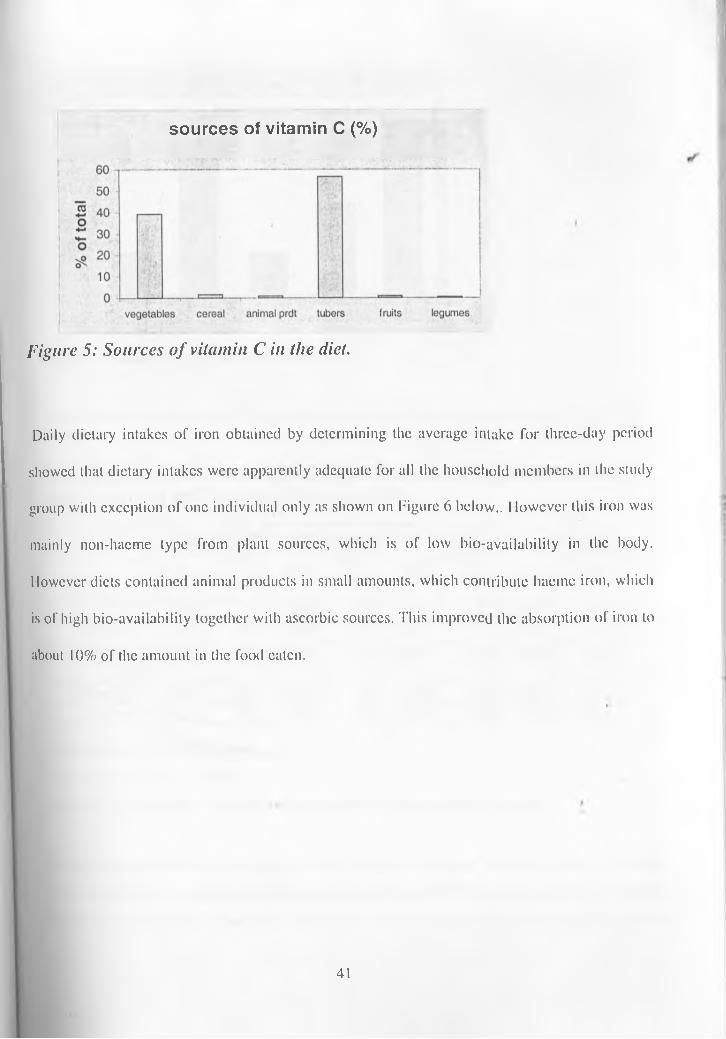
sources of vitamin C (%)
Figure 5: Sources o f vitamin C in the diet.
Daily dietary intakes of iron obtained by determining the average intake for three-day period showed that dietary intakes were apparently adequate for all the household members in the study group with exception of one individual only as shown on Figure 6 below.. 1 lowcver this iron was mainly non-hacme type from plant sources, which is of low bio-availability in the body. However diets contained animal products in small amounts, which contribute hacmc iron, which is of high bio-availability together with ascorbic sources. This improved the absorption of iron to about 10% of the amount in the food eaten.
41
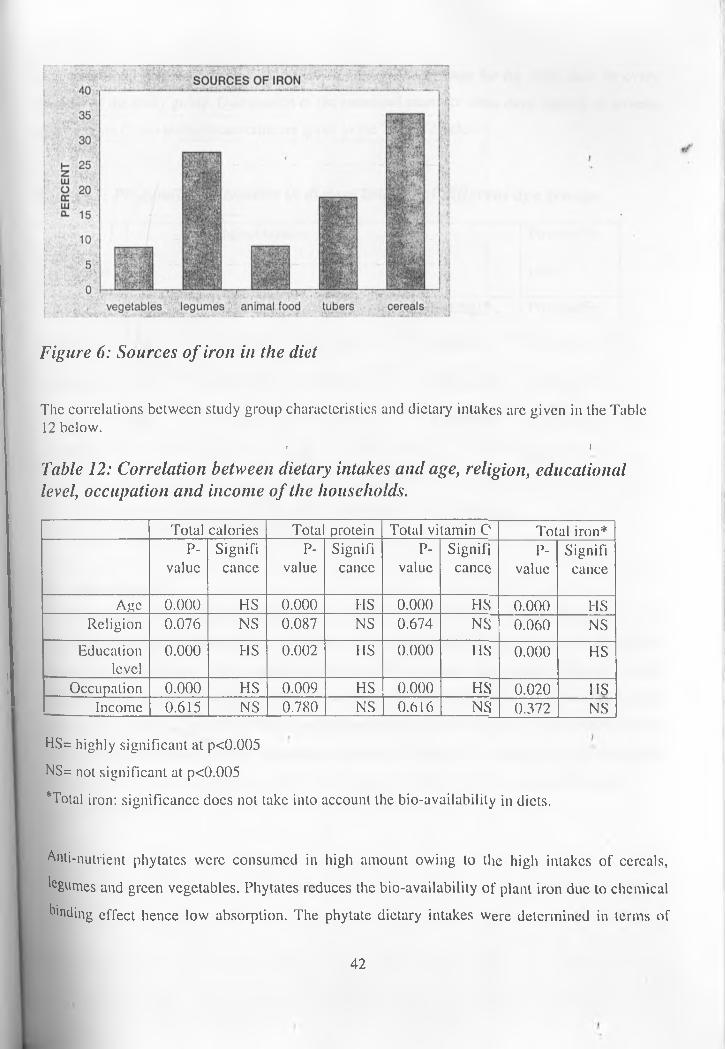
Figure 6: Sources of iron in the diet
The correlations between study group characteristics and dietary intakes are given in the Table 12 below.
i iTable 12: Correlation between dietary intakes and age, religion, educational level, occupation and income of the households.
Total calories Tota protein Total vitamin C Total iron*P-
valueSignificance
P-value
Significance
P-value
Significance
P-valuc
Significance
Age 0.000 HS 0.000 HS 0.000 HS 0.000 HSReligion 0.076 NS 0.087 NS 0.674 NS 0.060 NS
Educationlevel
0.000 HS 0.002 HS 0.000 HS 0.000 HSOccupation 0.000 HS 0.009 HS 0.000 HS 0.020 HS
Income 0.615 NS 0.780 NS 0.616 NS 0.372 NSHS= highly significant at p<0.005 NS= not significant at p<0.005Total iron: significance does not take into account the bio-availability in diets.
Anti-nutrient phytates were consumed in high amount owing to the high intakes of cereals, 'egumes and green vegetables. Phytates reduces the bio-availability of plant iron due to chemical Ending effect hence low absorption. The phytate dietary intakes were determined in terms of
42
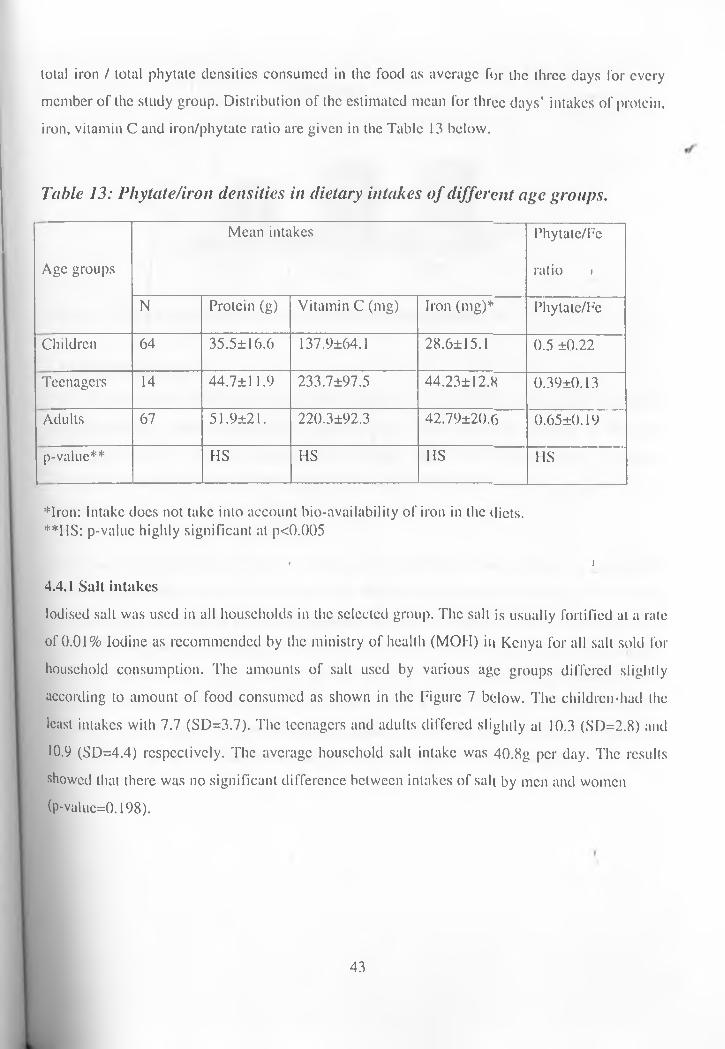
lotal iron / total phytate densities consumed in the food as average for the three days for every member of the study group. Distribution of the estimated mean for three days’ intakes of protein, iron, vitamin C and iron/phytate ratio are given in the Table 13 below.
Table 13: Pliytate/iron densities in dietary intakes of different age groups.
Age groupsMean intakes Phytate/Fe
ratio iN Protein (g) Vitamin C (mg) Iron (mg)* Phytate/Fe
Children 64 35.5± 16.6 137.9±64.1 28.6±15.1 0.5 ±0.22Teenagers 14 44.7±11.9 233.7±97.5 44.23±12.X 0.39±0.13Adults 67 51.9±21. 220.3±92.3 42.79±20.6 0.65±0.19p-value** HS HS HS HS
*lron: Intake does not take into account bio-availability of iron in the diets.**HS: p-valuc highly significant at p<0.005
« i4.4.1 Salt intakesIodised salt was used in all households in the selected group. The salt is usually fortified at a rate of 0.01% Iodine as recommended by the ministry of health (MOM) in Kenya for all salt sold for household consumption. The amounts of salt used by various age groups differed slightly according to amount of food consumed as shown in the Figure 7 below. The children-had the least intakes with 7.7 (SD=3.7). The teenagers and adults differed slightly at 10.3 (SD=2.8) and 10.9 (SD=4.4) respectively. The average household salt intake was 40.8g per day. The results showed that there was no significant difference between intakes of salt by men and women (p-value=0.198).
43
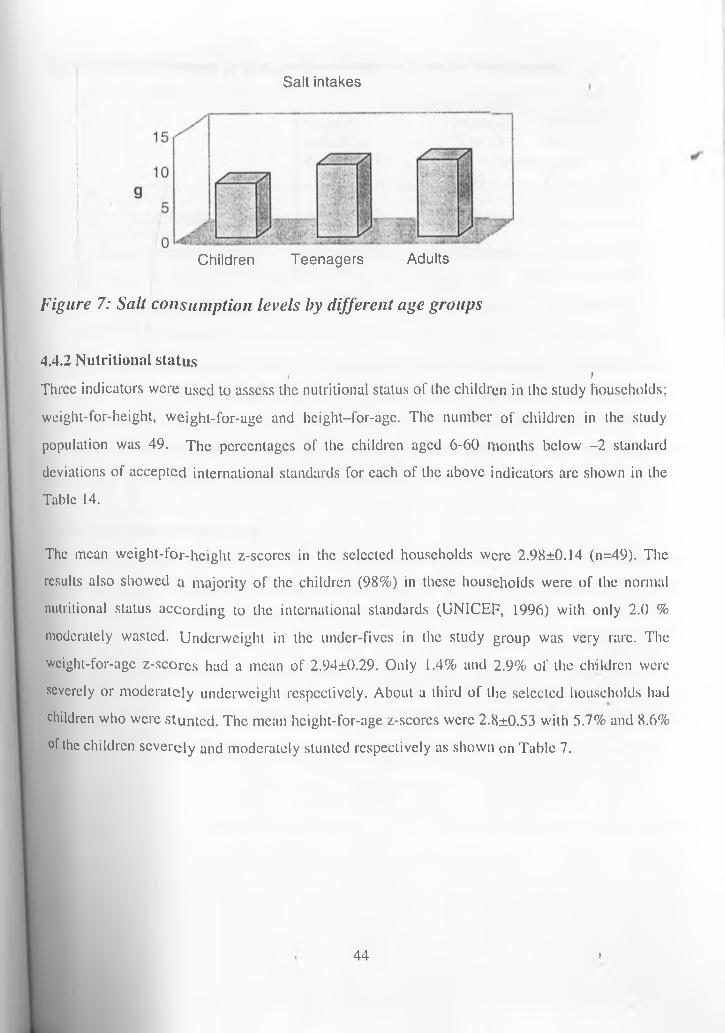
Salt intakes
Children Teenagers Adults
Figure 7: Salt consumption levels by different age groups
4.4.2 Nutritional status . )Three indicators were used to assess the nutritional status of the children in the study households; weight-for-height, weight-for-age and hcight-for-agc. The number of children in the study population was 49. The percentages of the children aged 6-60 months below -2 standard deviations of accepted international standards for each of the above indicators are shown in the Table 14.
The mean weight-for-height z-scorcs in the selected households were 2.98±0.14 (n=49). The results also showed a majority of the children (98%) in these households were of the normal nutritional status according to the international standards (UNICEF, 1996) with only 2.0 % moderately wasted. Underweight in the under-fives in the study group was very rare. The weight-for-age z-scores had a mean of 2.94±0.29. Only 1.4% and 2.9% of the children were severely or moderately underweight respectively. About a third of the selected households had children who were stunted. The mean height-for-age z-scorcs were 2.8±0.53 with 5.7% and 8.6% of the children severely and moderately stunted respectively as shown on Table 7.
44 i
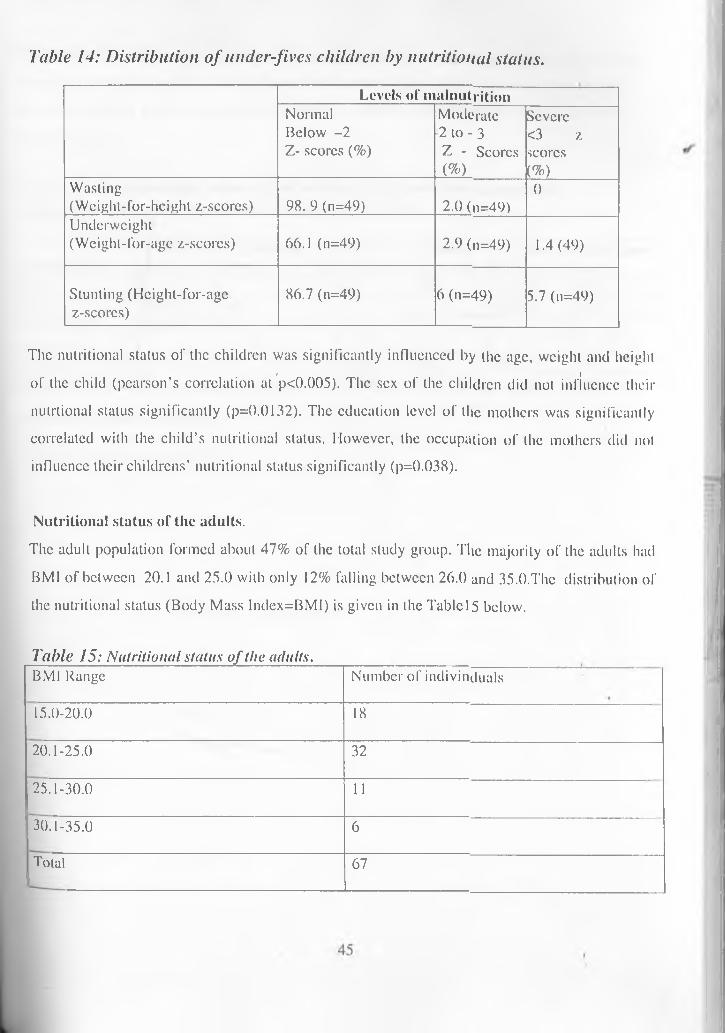
Table 14: Distribution of under-fives children by nutritional status.Levels of malnutrition
Normal Below -2 Z- scores (%)
Moderate 2 to - 3 Z - Scores (%)
Severe <3 z scores (%)Wasting
(Weight-for-hcighl z-scores) 98. 9 (n=49) 2.0 (n=49)0
Underweight(Weighl-for-age z-scores) 66.1 (n=49) 2.9 (n=49) 1.4 (49)
Stunting (Hcight-for-agc z-scorcs)
86.7 (n=49) 6 (n=49) 5.7 (n=49)
The nutritional status of the children was significantly influenced by the age, weight and height» fof the child (pearson’s correlation at p<0.005). The sex of the children did not influence their
nulrtional status significantly (p=0.0132). The education level of the mothers was significantly correlated with the child’s nutritional status. However, the occupation of the mothers did not influence their childrens’ nutritional status significantly (p=0.038).
Nutritional status of the adults.The adult population formed about 47% of the total study group. The majority of the adults had BMI of between 20.1 and 25.0 with only 12% falling between 26.0 and 35.0.The distribution ofthe nutritional status (Body Mass lndex=BMI) is given in the Tablcl5 below.
Table 15: Nutritional status o f the adults.BMI Range Number of indivinduals15.0-20.0 1820.1-25.0 3225.1-30.0 1130.1-35.0 6Total 67
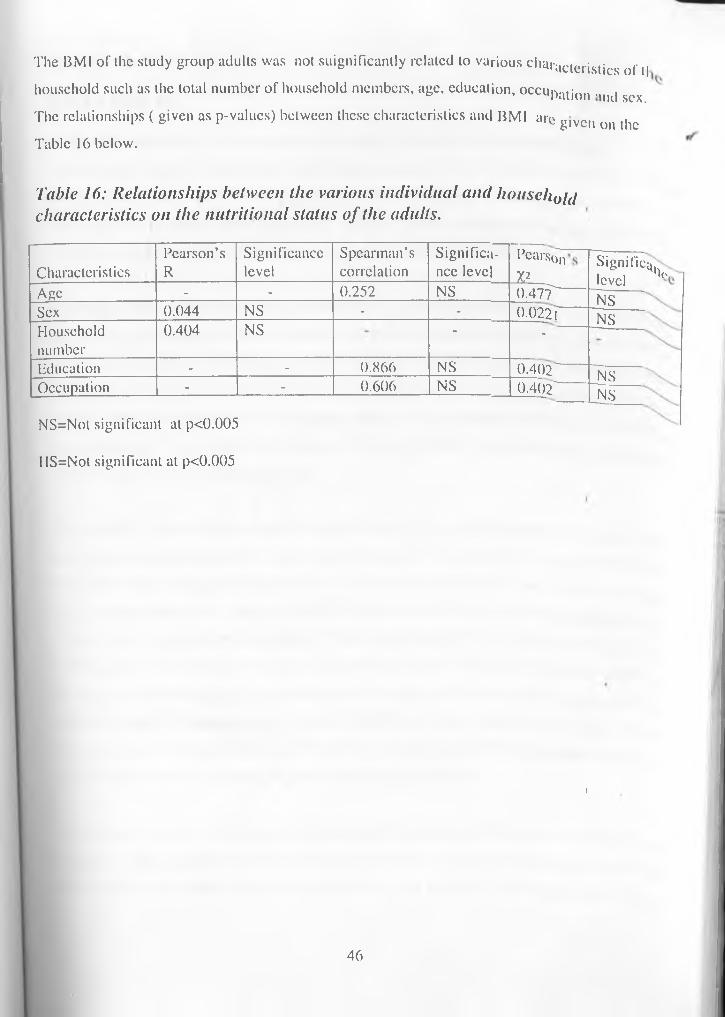
The BMI of the study group adults was not suignificantly related to various characteristics of (| household such as the total number of household members, age, education, occupatjon ,l|K| f The relationships ( given as p-valucs) between these characteristics and BMI arc
sex.given on the
Table 16 below.
Table 16: Relationships between the various individual and household characteristics on the nutritional status of the adults.
CharacteristicsPearson’sR
Significancelevel
Spearman’scorrelation
Significance level pearson
V-Age - - 0.252 NS 0.47"TSex 0.044 NS - - 0.022THouseholdnumber
0.404 NS “ -Education - - 0.866 NS 0.402—Occupation - - 0.606 NS 0 .402-NS=Not significant at p<0.005 IIS=Not significant at p<0.005
Signifies, levelNSNS
NSNS
ho
}
46

C H A P T E R F IV E
DISCUSSION5.1 DEMOGRAPHIC AND SOCIO-ECONOMIC STATUS OE HOUSEHOLDSTimau division has the lowest total population compared to the 27 divisions in Meru Central District. This is due to presence of large farms owned by either white; settlers or large national or multinational companies. The majority oflhc people live in the settlement scheme established by the government. These usually have high-density population (GOK, 1997).
Among the study group the average household size is small with an average of four persons per household. The families are mostly nuclear type indicating that the families are new in the area having recently (relatively to the area of their origin) migrated from other parts of former greater Meru District. This part of Meru is densely populated hence most people arc seeking more space outside. Most of the families still have strong ties with their extended families or work at their places of origin. This explains the presence of several absentee household heads, leaving their wives being in-charge of land and homes.
The majority of the selected households were Christian (95%; n=14) with no restrictions on their food consumption patterns. In most cases the parents had attained at least primary school education hence understand importance of good nutrition. Education may have been a major factor in determining the levels of hygiene and appreciable levels of child nutritional needs. Timau is a rich agricultural area, despite low levels of rainfall due to the fact that it is on the leeward side of Ml. Kenya. Nearly all households in the study area use irrigation method of farming, which and practice mostly horticulture for export purposes. Both men ynd women are actively engaged in income generating activities. Most of the residents in the area arc either farmers or farm workers in the large plantations in the neighbourhood. Dependency ratio is high due to the high number of young people who are mostly students.
. ' . . . 1 A few of the school leavers engage in horticultural business as middlemen or as labourers hencethey gel a steady source of income. Most of the inhabitants arc permanent in the area. NinetyPercent of the households in the study group own small pieces of land ranging from 1-10 acres
47
. . . nil ,,r land under irrigation iswhere they have built semi-permanent residential houses. The poilion o, , , r- ;„i .inability of the farmer tonot determined by the total amount of land owned but the tinancui eui
afford irrigation inputs.
5.2 FOOD SECURITY AND CONSUMPTION PATTERNS„ . e ,n0 ha to 10,000 ha areTimau is a former white highland area. Most large farms ranging Horn iu• , u.M-ti.'idU'rc crops are grown onowned by white settlers or by local and international companies, l loiticu
. , , , • . . fnm.ina. Ngusishi location islarge-scale irrigation. Other activities include ranching and wheat larmin^. i t • „ ion,i from while farmers and entirely a settlement area set up by the government through buying land, „ „ i in the area is notdividing it into small parcels for local small-scale farmers. Food secuiny,, i «, -...ch crop (sugarcane)affected by export production. As in the case of western Kenya where c. •
. ^ tno-tx „nn|icd in Timau but withdocs not affect food security (Kennedy and Cogmll, 1987), same case ui 1„ i ^r.ci.nrd at home. Fresh farma different reason -horticultural crops grown for export arc also consume
a r,v,ch legumes arc availableproduce including one of the staple foods (potatoes), vegetables and iicsn■ . i, . ,-ivers dry up.most of the year round except in cases of extremely dry conditions wnci
,.i due to extremely lowMaize, the common Kenyan staple food, is not grown in the aica, , rely on purchase fromtemperatures. Supplies of this commodity are low since the resident.
, . , lV.pd in large quantities hutshops and markets. The substitute is usually potatoes, which are consum. _ . . , • i o P..nc are not also grown indue to their low calorific content, energy deficiency is high, tsc.ins
r d niches for the majority of the adequate amounts even though they form an important pait ol mo., ,, • the markets or groceriesfamilies. Fruits are rarely grown in the area and arc usually expensive in. . . ^ ..md'inii of animal'products istherefore most families consume them whenever available. Consumpti
low among the area residents.
. c •. i • This supports the theoryConsumption of animal products depends on the family real income.r fnr lr,nlC expensive food items that households with higher income (in-kind) have preference lor tno
Tories for every shillingsuch as meat products, sugar and fat or oils. These provide, . „ „nj n0tatoes as the staple inspent. This is evident from the fact that rice supplements maize and lhouseholds with better incomes.
48
In conclusion, dietary deficiencies in the households under study wcmc mainly restricted to low calorie intakes and to lesser extent to protein inadequacy. These were the products which were bought from the markets most of the year resulting in a less cost-effective use of the available monetary resources.
< i5.3 NUTRITIONAL STATUSChild malnutrition contributes to stunted mental and physical growth world- wide, and to death of many children under 5 years old. In fact, over 50% of the 13 million child deaths each year are due to a combination of illness and malnutrition. Children with malnutrition are 8 times more likely to die than well-nourished children, while moderately malnourished children arc 5 times more likely to die according to Malawi Social Indicators Survey Report (Government of Malawi, 1995). But even if a child survives and nutrition improves, losses in physical and mental development may be irreversible. A child has only one chance to grow.
Although malnutrition is common in children living in low-income families, it is not always the direct result of low income in case of Mcru. Lack of food is one factor, but good caret and proper health are also necessary. Some families may not have enough for everyone, but children are always given a priority in this community. Poor access to nutrition and health care services (maternal and child growth monitoring) are important causes of malnutrition. This is particularly important in reference to respiratory diseases due to extremely low temperatures.
The rale of stunting of under-fives in Kenya stands at 30% while the rate of wasting is now at about 6% and underweight rate is about 20% according to Poverty and Malnutrition Report by Ministry of Planning (KDHS, 2003). These figures are high but lower than for Malawi with malnutrition rate of 48% (stunting) according to the Malawi Social Indicators Survey (MSIS) Report (Malawi Government, 1995). . i
Nutritional status of the children aged 5-59 months is an important indicator of the overall prevalence of malnutrition in the community. The results of this study showed existence of malnutrition as manifested by the three main indicators. Cases of wasting were rare with only two percent (2.0%, n=49) among the study group while few cases of underweight were recorded.
49
Presence of stunted children under-five years (14.3%, n=49) either moderately or severely stunted. Stunting is a reflection of the cumulative effects of chronic under-nutrition and long term deprivation and therefore these seems to be the victims of poor households where irrigation capital could have been a problem at first as revealed in the focus ^roup discussions with the mothers.
These study results were lower than earlier findings on Meru Central District by ministry of planning (GOK, 1997) where the level of malnutrition was reported as 27.5% (stunting). These variations could be explained by the fact that irrigation is commonly practised hence food seasonality is not apparently present. There was no significant difference between the nutritional status of the children under-five years of age and the sex of the children at P-value=0.05.
* I
5.4 DIETARY PRACTICESAs revealed in the focus group discussions, in most households in the study area, the mother sometimes with the help of the house-help who was usually a relative usually prepares meals. The food was mostly prepared in aluminium cooking pots according to key informant. Iodised salt was used in all households in the selected group. The salt is usually fortified at a rate of 0.01% Iodine as recommended by the ministry of health (MOM) in Kenya for all salt sold for household consumption. Family members are served separately irrespective of age levels during meals. No special foods or supplements arc bought for the children. Local weaning foods consisting of mashed potatoes, plantains and vegetables with a pinch of salt are given to small children.
There arc no cultural constrains on food consumption for any group of people in the area under study. All household members consume the same type of food. However, pregnant and Delating mothers are given special attention with their diets having more protein and calorie foods such as meat, milk, rich soups and fruits. Boys arc also given special attention at riles of puberty (circumcision). At this time their meals arc improved in terms of quality and quantity. More high nutrient density foods such as meats, cereal mixes and soups are given in large amounts to aid in Dc healing process. According to senior members of the community in the FGDS, famines arc
50 I
rare in the area, as irrigation is the main method of farming. However some parts of the division do not have adequate piped water for irrigation (Karukunku and Ethi villages) and during extreme dry periods some steams dry up leading to lack of water for drinking and irrigation in some parts of the division. Unlike the big farms, the small-scale farmers cannot afford to drill boreholes. t |
According to a local green grocer, food prices in the area fluctuate with seasons. Levels of production in the source areas also determine the prices as most cereals, legumes and fruits are supplied from other parts of the country. Some men who arc businessmen take their lunches at the local trading centre (Ngusishi), which is also the division administrative centre. Information from the local hotel operator showed that the foods served in the hotels arc similar to those prepared at home. The ingredients for hotel food preparation were mostly from the surrounding area.
5.5 DIETARY INTAKESThe results of this study showed that'a large proportion of the members in the study'.houscholds
consumed less than the recommended dietary intakes of calories. However, data on the reported consumption of food should always be interpreted with caution (Mwandimc, 1992). The deficiencies in calorics is quite apparent considering the FAO and WHO (1986) ad hoc committee recommendations for ‘1.5*BMR’ as the measure of the energy required for maintenance. This is because non-fasting subjects require energy that is 1.5 times greater than BMR in order to ensure a constant supply of energy (Polcman ct al, 1973). Consideration is also to be made that the study group and the area in general consists of small-scale horticultural farming by irrigation which is labour intensive.
The relatively higher protein intakes in the diet as shown by the results of this study, were contrary to Kortc’s Report (1967) that protein and not energy is the limiting factor in the diet of many settlement scheme people. However, this protein will be broken down to provide energy deficit due to low carbohydrate intake. The low intake of protein among the children and teenagers adversely affects their growth and mental development. In adults, it generally leads to poor health status. Women in the reproductive age are most adversely affected in terms of
51
nutritional status leading to poor pre-natal infant health. Because RDAs are set sufficiently above the mean physiological requirements, it cannot be automatically assumed that a nutritional deficiency exists whenever the recommended are not completely met. Individual nutritional requirements arc different and may be below RDA.
Sometimes fixed cut-off points for different nutrients can be made to determine adequacy in nutrient intakes such as two thirds RDA or certain percentages. This gives fewer false positives for under nutrition (Ramakrishna, 2001). Results from the study showed that iron dietary intakes are mostly above RDA for majority of study individuals (65.5%). This could be attributed to high tubers, vegetable and moderate animal product consumption. The groups that seem vulnerable to iron deficiency due to low intake are the adults. Children arc vulnerable mainly due to inadequate consumption of the bulky vegetables such as kales to provide enough iron intakes from the diet.
These findings are in support of the Micronutricnl Report 1999 (Mwaniki cl al, 1999) which reported that women and children were the most vulnerable group to iron deficiency. However the high levels of phylate compounds contained in these foods limit the bio-availability of this iron. The phytatc levels determined as iron/phytatc ratios were high for all households. The hight lphylate inhibitor density in this area (Mcru) attributable to high consumption of tubers w'as earlier reported in the Micronulricnt Survey Report 1999 (Mwaniki et al, 1999). Tannins (in lea) intake is high due to daily consumption of tea al breakfast and sometimes after meals or with meals. These anti - nutrients have been reported to inhibit the absorption of iron from dietary intakes. Another compounding factor in iron bio-availability was the fact that little of the iron intakes arc in form of hacmc iron, most were in the form of non-haeme iron which is of law bioavailability.
SALT INTAKESThe salt intakes were high in the area according to the recommended per capita intakes of an average of 5 -15g per day per child and adults (UNICEF ct al, 1995). The salt consumed in the study area was entirely iodised and packed. This showed that salt could be effectively used as a Chicle for supplementing the dietary intakes of vital micronutrients such as iron or iodine. To
52
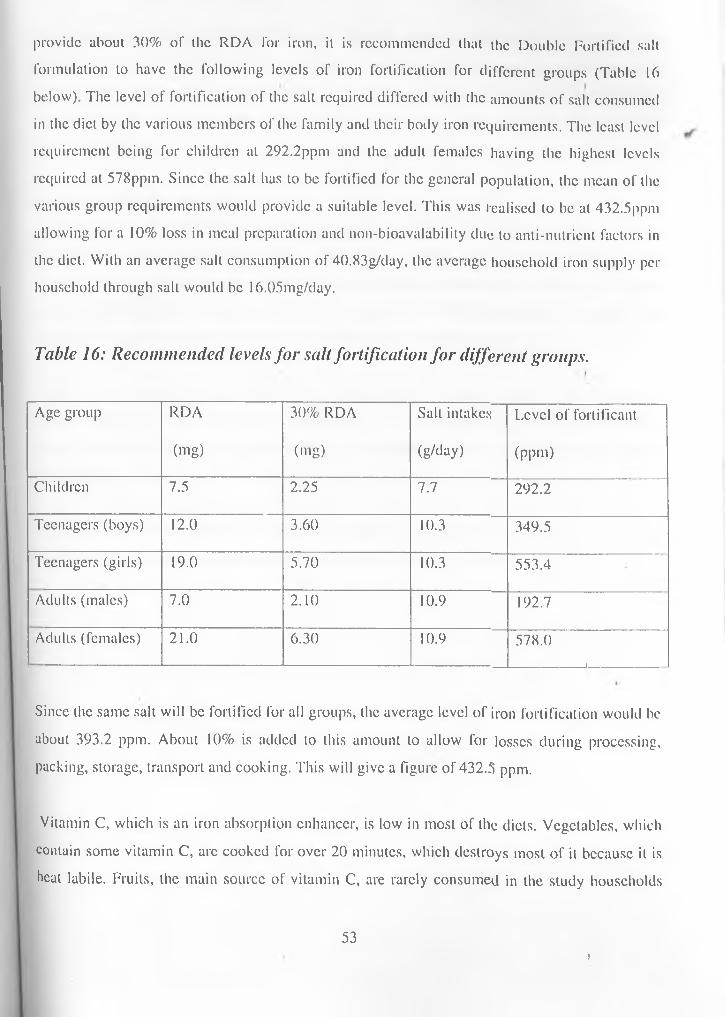
provide about 30% of the RDA for iron, it is recommended that the Double Fortified salt formulation to have the following levels of iron fortification for different groups (Table 16 below). The level of fortification of the salt required differed with the amounts of salt consumed in the diet by the various members of the family and their body iron requirements. The least level requirement being for children at 292.2ppm and the adult females having the highest levels required at 578ppm. Since the salt has to be fortified for the general population, the mean of the various group requirements would provide a suitable level. This was realised to be at 432.5ppm allowing for a 10% loss in meal preparation and non-bioavalability due to anti-nutrient factors in the diet. With an average salt consumption of 40.83g/day, the average household iron supply per household through salt would be 16.05mg/day.
Table 16: Recommended levels for salt fortification for different groups.
Age group RDA 30% RDA Salt intakes Level of fortificant(mg) (mg) (g/day) (ppm)
Children 7.5 2.25 7.7 292.2Teenagers (boys) 12.0 3.60 10.3 349.5Teenagers (girls) 19.0 5.70 10.3 553.4Adults (males) 7.0 2.10 10.9 192.7Adults (females) 21.0 6.30 10.9 578.0
_________ 1
Since the same salt will be fortified for all groups, the average level of iron fortification would be about 393.2 ppm. About 10% is added to this amount to allow for losses during processing, packing, storage, transport and cooking. This will give a figure of 432.3 ppm.
Vitamin C, which is an iron absorption enhancer, is low in most of the diets. Vegetables, which contain some vitamin C, arc cooked for over 20 minutes, which destroys most of it because it is heat labile. Fruits, the main source of vitamin C, are rarely consumed in the study households
531
since their availability is limited. However, potatoes, which are consumed in large amounts, provide the highest levels of vitamin C to the residents. The results from this study showed that there is no significant difference between the dietary intakes and religion (p-value>0.05). However the occupation and education levels were found to be highly significant at p-valuc>0.05 ^ (p-valuc=0.0()0)
Lesson learnt from the studyUnlike other areas in Mcru, Timau division mostly comprises of settlement scheme, which was established after independence. Hence the various infrastructure facilities havd not been developed sufficiently. Despite the fact that a large variety of horticulture products arc grown, some arc not consumed locally c.g. fresh snow peas (pods), which arc produced for export. Due to lack of nutrition education, the excess is entirely wasted in most households.
Most mothers have an upper hand in provision of food for the families. This has led to improvement of family nutrition in most cases. The mothers arc also actively involved in production and selling of the export products to the middlemen who usually get orders from the exporters.
When the diet of a community is simple and monotonous, it can lead lo lower energy intakes and may carry a risk of nutritional inadequacies especially for young children.
I
54
CHAPTER SIXC O N C L U S I O N A N D R E C O M M E N D A T I O N S' ICONCLUSIONIron deficiency anaemia is a nalional public health problem in Kenya. Anemia prevention and
control must therefore be accorded the highest priority status. The distribution of anaemia burden in Kenya according to the micronutrient survey report of 1999 (Mwaniki et al, 1999) is heavily skewed with the low altitude and the semi-arid north and the lake basin sub-regions bearing the larger share of moderate and severe forms of the estimated national burden. The highest burden of anaemia is borne by the children and women of childbearing age. The central and mid-west highlands where Timau lies have the lowest anaemia burden per unit population. Based on the earlier findings by the micronutrient survey of 1999, anaemia is a product of multiple factors amongst which low diet intakes arc most dominant. The high dietary intakes of iron among the residents of Timau, together with low malaria and hookworm may therefore be interpreted to mean low levels of anaemia.
The results of this study at Timau supports the earlier findings that high altitudes have low micronutrient deficiency levels primarily due to high intakes of dietary iron as well as low prevalence of malaria and schisloma. However high percentages of iron intakes from low bioavailability sources, high phytin and low vitamin C levels may lead to deficiency of iron among the residents. The results also show that the levels of malnutrition among the children and the adults arc low compared to the rest of the country. Salt consumption levels arc within the recommended levels and from a centralised source. Hence fortification of salt with iron would be effective in alleviation of dietary anaemia in the country. The study results also showed that there are no dietary restrictions in the form of taboos and other traditions that would affect foodconsumption patterns. Therefore in a national intervention against nutritional anaemia, changes in HbC levels and responses among the Timau residents would constitute useful references.
55i
R E C O M M E N D A T IO N SBased on the interpretation of findings of the survey, iron deficiency anaemia may be low compared to national levels. However lack of adequate nutrition and health care services might lead to increase in levels with increase in population in the area. The low levels of protein and calorie intakes are a cause of concern, which needs to be addressed. Overall lack of adequate consumption of fruits in most households’ diets may lead to low levels of dietary vitamin C as most vegetable vitamin C is destroyed during cooking time. The intakes of these inadequate nutrients in the diets need to be improved.
Consequently the following recommendations arc advanced to meet these goals:Nutrition and health education be emphasised at all possible entry points such as schools, women groups, civic meetings, through lectures and Participatory Rural Appraisal. Improvement of health and nutrition in the area by establishment of a health centre at Ngusishi shopping centre and posting of qualified personnel for service provision.
The government (GOK) and development partners in nutrition and health related sectors should recognise the consequence of anaemia and priority of nutritional deficiencies to the socioeconomic development in Kenya. A nation-wide advocacy intended to expose cost-effective risk reduction approaches to contain the prbblcm and maximum accruabk: benefits should'he started. Nation-wide effort towards increasing micronutrients available through increasing the bioavailability especially of iron and vitamin C and food fortification of commonly consumed foodstuffs and condiments is required. Residents should also be encouraged to increase their variation in food intakes.
Introduction of high nutrient density hybrids of crops especially the staple food crops such as maize beans, pigeon peas and potatoes, which arc rich in micronutrients. Revival of farmers’ credits financing to enable them to increase food production through purchase of inputs and farming methods. Together with drilling of boreholes, would increase production of both food and cash crops.
56
CHAPTER EIGHTR E F E R E N C E S A N D B I B L I O G R A P H Y
ACC/SCN (1991). Nutriion Relevant Actions, Geneva, pp. 64.
ACC/SCN (1992). Second Report on World Nutrition Situation,vol. 1, UN Agencies and 1FPRI, Washington, D.C. 3 : Micronutrients pp.39.
ACC/SCN (1997). Nutrition and Poverty Paper, Session Symposium Kathmadu March 1997. Paper no. 16.4 : Micronutrient Malnutrition, pp.65.
ACC/SCN (2000). Nutrition Throughout the Life Cycle. 4 th Report on World Nutrition» 1Situation. 2 .3: Vitamin A Deficiencyt update pp. 29-31.
Calco, E. (1992). Sciences socialcs, alimentanlion ct dcvcloppement images, metaphors at apories; revue tiers mondc (suppl.) 23 (1): 727-742.
Basta, S.S., Soekiman M. S., Karyadi D. and Scimshaw N .S. (1979). Iron Deficiency Anaemia And Productivity of Adult Males in Indonesia. Pp 32.
Dallman and Yip, R. (1996). Docs iron supplementation compromise zinc nutriture in healthy infants? American Journal of Nutrition, 42: 683, Washington DC.
f t
KAO (1987). Nutrition and food Aid, Food and Nutrition vol. 13.no.2, Rome.
FAO (1996). Nutriion Education for the Public, Food, Nutrition and Agriculture vol. 16: 33-45, Rome.
FAO (1997). Agriculture Food and Nutrition for Africa, A Resource book for Teachers of Agriculture, Food and Nutrition Division, Rome.
57
FAO (1997). Resource book for teachers of agriculture, Agriculture, Food and Nutrition for Africa, Rome.
Fischer, A.A., Laing, J.A. and Townsend, J.YV. (1991). Handbook for Family Planning Operations Research, 2nd Edition, Population Council. N. York,US A, PP40-47.
Foy, H., Kondi, A., Hangreaves, A. and Lowry, A. (1950). Anaemia of Africans in Kenya. Royal Society on Tropical Medicine, London: 43: 623-625, f
Gillcpsie, S., John, M., and Martorello, R., (1993). How Nutrition Improves Health : Nutrition Policy Discussion Paper no. 15 : 12-14
GOK (1983). Central Bureau of Statistics Report, Ministry of Planning, Nairobi, Kenya.
GOK, (1999). Meru Central Development Plan, Ministry of Planning, Nairobi, Kenya.
C.OK, (1997). Poverty and Malnutrition Report, Ministry of Planning, Nairobi, Kenya.
GOK/UNICEF, (1999). Anaemia and the status of iron. Vitamin-A and Zinc in kenya. The 1999 National Micronutrient Survey Report, Ministry of Health, Nairobi, Kenya.
Guthrie, H. A. (1995). Human Nutrition; p 240,334.
Guthrie, II.A. and Picciano, M.F. (1995). Micronutrients. Human Nutrition: Mosby-Yearbook, Second Edition. New York. USA.
Haaga, J. and Mason, J. (1986). Child Malnutrition in Rural Kenya: A Geographic and Agricultural Classification. Ecology of food and nutrition.vol. 18: p 297-307.
58
Harloy, L.E., Torhcim and Oshaug, A. (1998). Food Variety- u good indicator of the nutritional adequacy of the diet? A case study of an urban area in Mali, West A Africa. European Journal of Clinical Nutrition. Stockton Press. Stockholm, Sweden.
✓Hartog, A.P. den and Stevern VV.A. (1995). Manual for Social Surveys on Food Habits and< 1Consumption in Developing Countries, Wagcningcn, Netherlands. P 3-33
Jansen, A.A. and llorelli, H.T. (1987). Food and Nutrition in Kenya; Historical Review; Nairobi.
KDHS (2004). Kenya Demographic and Health Survey: Key Findings. Calverton, Maryand,USA: CBS, MOH and ORC Marco. Pg 20.
Kennedy, E. and Alderman, H. (1985). Comparative Analysis of Nutritional Effectiveness of Selected Interventions. IFRI, Washington, D.C.
• jKennedy, E. and Cogill (1987). Income and Nutrtional Effects of the Commercialisation of Agriculture in South-Western Kenya. International Food Policy Research InstituteRcport no.63. Washington, D.C.
Kielman, A. and Maccord, C. (1978). Weight for Age an Index for Risk of Death of Children.The Lancet.
Korte, R. (1967). Report on Nutrition Survey Conducted on Mwca Teberc Irrigation Sc|ieme in Kenya. Institute for Human Nutrition. Germany.
i iLatham, M.C. (1984). Strategies for the Control of Malnutrition and The Influence of Nutritional Sciences. Food and Nutrition: 10:1, FAO, Rome.
59
' 1Leslie, J. (1984). Design and Implementation of Nutrition Projects: Lessons Learned from The World Bank Experience in Brazil, Indonesia, Colombia and India. Economic Development, World Bank Institute, Washington, USA.
Luven, P. (1982). The Nutriliona Consequences of Agricultural and Rural Development Projects. Food and Nutrition Bulletin.Vol. 4
Malawi Government, (1995). Malawi Social Indicators Survey Report, Ministry of Economic Planning, Blantyre, Malawi.
' • *Malonowsky (1994). A scientific theory of culture and other essays, University of Carolina, Chappcl Hill, USA.
Mason, J.B. and Susan, J. (1987). Introduction and Policy Implications of Delivery of Oral Doses of Vitamin A to Prevent Vitamin A Deficiency (VAD) and Blindness. A Slate -of-thc - Art Review. Administrative committee on coordination /sub-committee on nutrition (ACC/SCN) of the United Nations, Geneva.
Ming’ala (2002). Data analysis using SPSS VERSION 10.0. M and O Data training experts, Naairobi, Kenya. P 3-86.
' IMonscn, E.R. and Balintfy, J.L. (1982). Calculating Iron Dietary Bioavailabilily. Refinement and Computerization. Journal of American Dietetics Association, 80:3(19-311.
Muscat, R. (1984). Malnutrition in the 1980s; Roles for the International Agencies. Food and nutrition Bulletin vol. 6(3): 16-18
Mwandinie, R. (1992). Expenditure, Food Consumption Patterns and Nutritional Status of the Tenants of Mwea Tcbere Scheme. (Thesis). Nairobi, Kenya. 14-30.
< i
60
Mwaniki 1). L., Omwega A.M., Munui E.M., Mulunga J.N., Akclola R., Shako B.R., Gotink M.H. and Pcret A.M. (2001). Anemia and status of iron. Vitamin A and Zinc in Kenya. The Kenya National micronutrients Survey Report (1999)
, iPassmore, R., Eastwood, R. and Davidson, L.P. (1986). Human Nutrition and Dietetics, 8111 Edition. Longman Group of Companies, Edinburgh-London.
Pinstrup-Anderson (1976). The Impact of Nutritional Goals in Agriculture and How Farm Policies Influence Nutritional Status. Food and Nutrition Vol.2 no.l, FAO, Rome.
Polcman, T.T. Peresa, L.M. Fernado, W.S.M. and del Mel, U.V. (1981). The effects of income on food habits in Sri-Lanka. Nutrition Newsletter 11 (3) Sri-Lanka. p 9-29.
Ramakrishna, U. (2001). Nutritional Anaemias. CRC Press, USA.< i
Republic of Kenya (1999). Population and Housing Census]; Nairobi, Kenya.
Rosalind, G. (1990). Principles of Nutritional Assessment; Oxford, New York, USA.
Ross, D.A., Gyapong, J.O. and Abbot, A.R. (1993). Determinants of Vitamin A deficiency in Northern Ghana. XV International Vitamin A Consultative Group meeting (abstract), Ghana.
Rosse, P.H. and Freeman, H.E. (1993). Evaluation, a Systematic Approach; London, Sage Publications.
. iSARA/USAID, (1992). H1V/AIDS and Nutrition. A Review of Literature and Recommendation for Nutritional Care in sub-Saharan Africa, Washington DC, USA.
Savage, K. and Burgess, A. (1993). Nutrition for Developing Countries: 2'Kl Edition, Oxford University Press, New York.
61
I
Schrimshaw, N.S., Taylor, J.S. and Gordon, J.E. (1968). Interactions of Nutrition and Infections, WHO, Geneva.
Schnii, J.K. (1993). National Food Composition Tables and the Planning of Satisfactory Diets in Kenya, MOH, Kenya. p22-140
Smith, V.E., Kolasa, K., Stauss, J.,Whelan, W. and Bingen, L. (1981). Development and Food Consumplionb Patterns in Rural Sierra Leone. Food and Nutrition. Vol. 7 p.24-32.
UNICEF (1991). Growth and Monitoring of Pre-School children : Practical Considerations for PHC Projects. Information for Action issue Paper. UNICEF, New York. 76.
UNICEF (1998). The State of World’s Children. Carol Bellamy, Executive Director. Press. 1 : The Silent Emergency pp. 11.
UNICEF (2000). Household Access to Food and Nutrition in Eastern and Southern Africa. UNICEF; Nairobi, Kenya.
UNICEF (2000). The State of World’s Children. Carol Bellamy, Executive Director. Table 2 : Nutrtion pp. 90, 94 and 96. * 1
UNICEF/GOK (1991). Strategics for Improving Nutrition of Children and Women in Developing Countries: New York. Report of The Height Monitoring In Primary Schools; Ministry of Planning and National Development, Nairobi, Kenya.
UNICE1, ICCIDD, PAMM, WIIO AND MI (1995). Monitoring Salt Iodizalion programmes. PAMM/MI/ICCIDD. Atlanta, USA.
UNU (2002). Food and nutrition bulletin; supplement on use of nuclear isotopic techniques in addressing nutrition problems, Vienna.
62
Valvcrde, V., Montorcll, R. and Mejia-Pivaral, V. (1977). Relationship between Family landAvailability and Nutritional Status. Ecology of Food and Nutrition.Vol.6
■ •WHO (1981). Health Program Evaluation. Guiding principles for its application in managerial process for national health development. World Health Organization (Health for all); Series 6, Geneva.
WHO (1983). Measuring changes in nutritional status. Guidelines for Assessing the Nutritional Impact ol Supplementary Feeding Programs for Vulnerable Groups; Geneva.
WHO (1986). Use and interpretation of Anthropometric Indicators of Nutritional Status. WHO Working Group-Bulletin of the World Health organisation 66 (929-94) WHO-Gcncva, Rome.
> iWHO (1986). Use and Interpretation of Anthropomelrical Indicators of Nutritional Status. WI10 Working Group. Bulletin of the WHO; 66 : (929-949), WHO, Geneva.
WHO (1992). The Prevalence of Anaemia in Women: A Tabulation of Available Information (2IKl Edition. WHO, Geneva.
WHO (1995). Micronutrient Deficiency Information System. (MDIS working paper no.2.) Global prevalence of Vitamin A Deficiency; Geneva.
WHO (1998/99). Measuring changes in nutritional status. WHO in conjunction with CDC and National health; Geneva.
WHO (2000). Management of Nutrition in major Emergencies. Geneva.^oung, S.A. and Foy, II. (1972). Anaemia. WHO Technical Report Series No.503; Nutritional Anemia; WHO, Geneva.
ip? R. and Dallman P.R. (1996). Iron, In Present Knowledge In Nutrition, 7lh Edition, Washington D.C: p277-292
63i
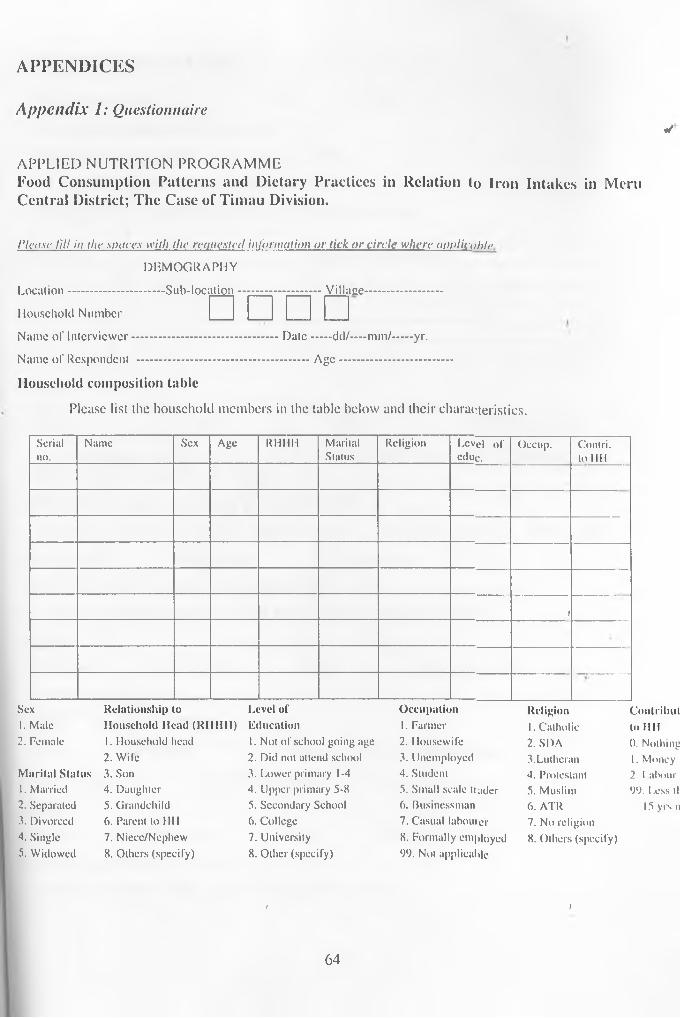
A P P E N D IC E S
A ppendix 1: Questionnairet/
APPLIED NUTRITION PROGRAMMEFood Consumption Patterns and Dietary Practices in Relation to Iron Intakes in Mem Central District; The Case of Timau Division.
Please 1111 in the .spaces with the requested information or lick o r circle where applicnhlf>.
DEMOGRAPHY
Location............................Sub-location........................Villace........................
Household Number
Name of Interviewer..........................................Date...... dd/— mm/......yr.
Name of Respondent ..................................................Age..................................
Household composition tablePlease list the household members in the table below and their characteristics.
□ □ □ □
S e r ia ln o .
N a m e S e x A g e R H H H M a r ita lS ta tu s
R e l ig io n L e v e l o f e d u c .
O c c u p . C o n l r i . to I I I !
i
S e x R e l a t i o n s h i p to L e v e l o f O c c u p a t i o n R e l i g i o n C o n t r i h u t1. M a le H o u s e h o l d H e a d ( K I I I I I I ) E d u c a t i o n 1. F a r m e r 1. C a th o l ic to 11112 . F e m a le 1. H o u s e h o ld h e a d 1. N o t o f s c h o o l g o in g a g e 2 . H o u s e w i f e 2 . S D A 0 . N o th in g
2 . W i le 2 . D id n o t a t t e n d s c h o o l 3 . U n e m p lo y e d 3 .L u th e r a n 1. M o n e yM a r i t a l S t a t u s 3 . S o n 3 . L o w e r p r im a r y 1-4 4 . S tu d e n t 4 . P r o te s ta n t 2 . 1 a b o u t '1. M a r r ie d 4 . D a u g h te r 4 . U p p e r p r im a r y 5 -8 5 . S m a l l s c a le t r a d e r 5 . M u s l im 9 9 . L e s s tli2 . S e p a r a te d 5 . G r a n d c h i ld 5 . S e c o n d a r y S c h o o l 6 . B u s in e s s m a n 6 . A T R 15 y r s n3 . D iv o r c e d 6 . P a r e n t to H H 6 . C o l l e g e 7 . C a s u a l l a b o u r e r 7 . N o r e l i g io n4 . S in g le 7 . N ie c c /N c p h e w 7 . U n iv e r s i t y 8 . F o r m a l ly e m p lo y e d 8. O t h e r s ( s p e c i f y )5 . W id o w e d 8 . O t h e r s ( s p e c i f y ) 8 . O t h e r ( s p e c i f y ) 9 9 . N o t a p p l ic a b le
< )
64

SOCIO-ECONOMIC STATUS2. Do you own land? I. Yes 2. No3. [If yes], how many acres do you own? >4. [If no], do you rent land? 1. Yes 2. No5. [If yes], how much do you pay per acre of land?6. Please fill the table below according to the livestock owned.
7. Is the house you live in?....................... 1. Your Own 2. Rented8. How big is the house?(no. of rooms)..........................................[If rented] how much do you pay per month? Ksh...................9. What is your total household income per month? I. Less than 2,0()0 2. 2,000-5,0005,000-10,000 4.10,000-20,000 5. 20,000 and above10. How much do you spend on food per month? Ksh.................... ............11. [Observe] What material has been used to construct the main house?a) Roof
1) Makati 2) iron sheets 3) tiles 4) grass/thatclt5) Others (specify).....................b) Wall1) mud 2) plaster 3) Wood 4 ) brick/block/stones5) Iron sheets 6) others (specify)..............................................c) Floor1) Mad 2) cemented 3) wood 4) brick/tiles/siones5) Others (specify)..............................................................12. What are the two main sources of energy for lighting?
65
t

3) hurricane lamps 4) pressure lampsI) wood 2) tin lamps5) gas 6) Electricity13. What are the two main sources of energy you use for cooking?I) wood 2) charcoal 3) paraffin 4) gas 5) electricity6) others (specify)
FOOD PRODUCTION AND UTILIZATION.
14. What is the staple food?..............................................................................15. What is your main source of staple food?/. Farm/garden 2. sliop/kiosk 3. market 4.others((specify).....................................................................16. How long does the food last after harvest?/. Staple................................................................ 2. Vegetables................................17. Which is the main source of vegetables for your household?I. Farm/garden .... 2.shop /kiosk ............ 3. market ................ 4. others(specify)......................18. Which is the main source of fruits?I .Farm/garden............. 2.Market................. 3.Sliop/kiosk............... 4. gathered
from roadside/bush .....................5. otliers(specify)................................19. When are fruits usually taken? i fI. Breakfast time 2. With or after a snack 3. With or immediately after main meal 4. Others (specify).......................20 Have you ever had to purchase your staple food in the last 1 year?
1. Yes 2. No
21. For the vegetables that arc mainly consumed in your household. Kindly explain how they arc prepared.
6 6

- j^ T o r VegetableMethod of preparation
J -------------------- ----1--- ---------
22. W hich ty p e o f p o t s d o y o u u se for c o o k in g ?1. A l u m i n i u m 2. Iron 3. Copper 4 , Earthenware 5. ()tj l c r s
fo o d c o n s u m p t i o n p a t t e r n
23. What food do you most commonly cat for1. Breakfast ?................................................................................................2. Lunch.........................................................................................................3.Supper..............................................................................................
24. When is tea /coffec/cocoa usually taken? / . Breakfast time 2. with snacks3. with or immediately after meals 4. others (specify).................
67

25 Please tell me how often you as a lioii- . ................'“hold consume the following foods?
^EQUENCY OF CONSUIMPTION
l=Once a year
POOL) EATENEnglish Name Kiswahili NameMaize Mahindi
"pjnger millet Wimbi"Rice Mchele mweupe’Sorghum Mtama"Sorghum Mutio wa mukira+Cassava na manga"Wheat NganoArrow roots NdumaCassava MhogoPotatoes(Eng) Viyazi ulayaSweet potatoes Viyazi vitamuBeans MaharagweChicken pea NdenguCow peas KundcGreen grams Choroko/pojoPigeon peas MbaaziSoya bean SoyaCashew nuts KoroshoCoconuts DafuGround nuts Njugu karanga
MchichaAmaranlhasCabbage Mboga
2=Four times a year3=Once a month4=Twice a month
5=On'ce ir 6=Once^
2 3 4 5 6 7 8 9 N *
T
-
Week7-2-3 ti^ ;lcs a weekf t es a week
N=Never
Please tell me how often you as a houstftj';--------------—— — — —----l(J consume the following foods
6 8
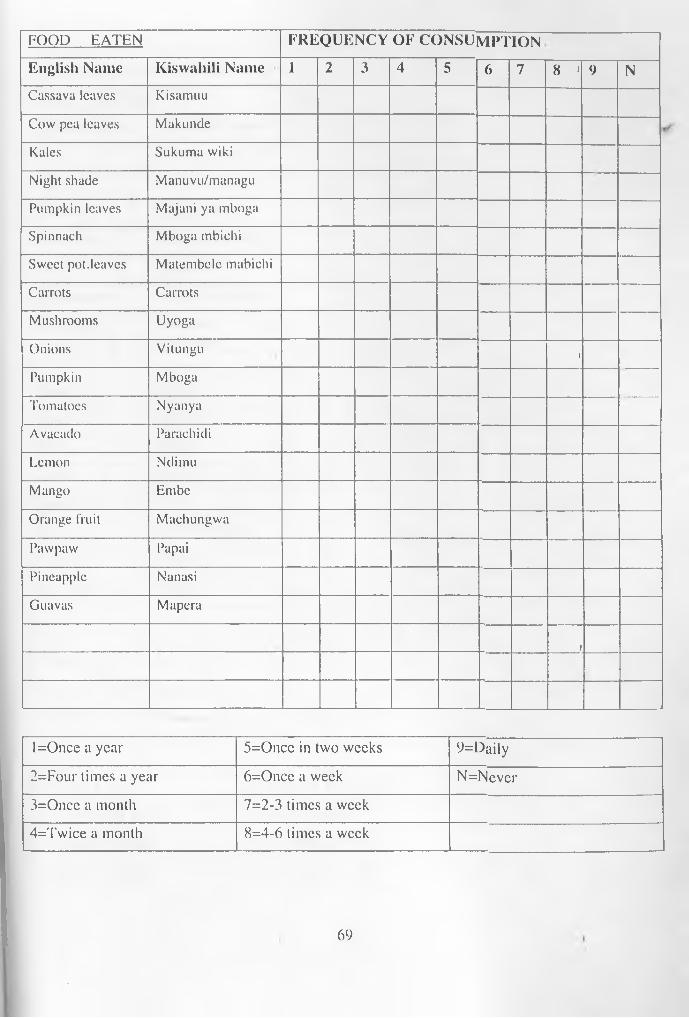
FOOD EATEN FREQUENCY OF CONSUMPTIONEnglish Name Kiswahili Name 1 2 3 4 5 6 7 8 1 9 NCassava leaves KisamuuCow pea leaves MakundeKales Sukuma wikiNight shade Manuvu/managuPumpkin leaves Majani ya mbogaSpinnach Mboga mbichiSweet pot.leaves Matembelc mabichiCarrots CarrotsMushrooms UyogaOnions Vitungu 1Pumpkin MbogaTomatoes NyanyaAvacado ParachidiLemon NdimuMango EmbeOrange fruit MachungwaPawpaw PapaiPineapple NanasiGuavas Mapera
1
l=Once a year 5=Oncc in two weeks 9=Daily2=Four times a year 6=Once a week N=Never3=Once a month 7=2-3 times a week4=Twiee a month 8=4-6 times a week
69
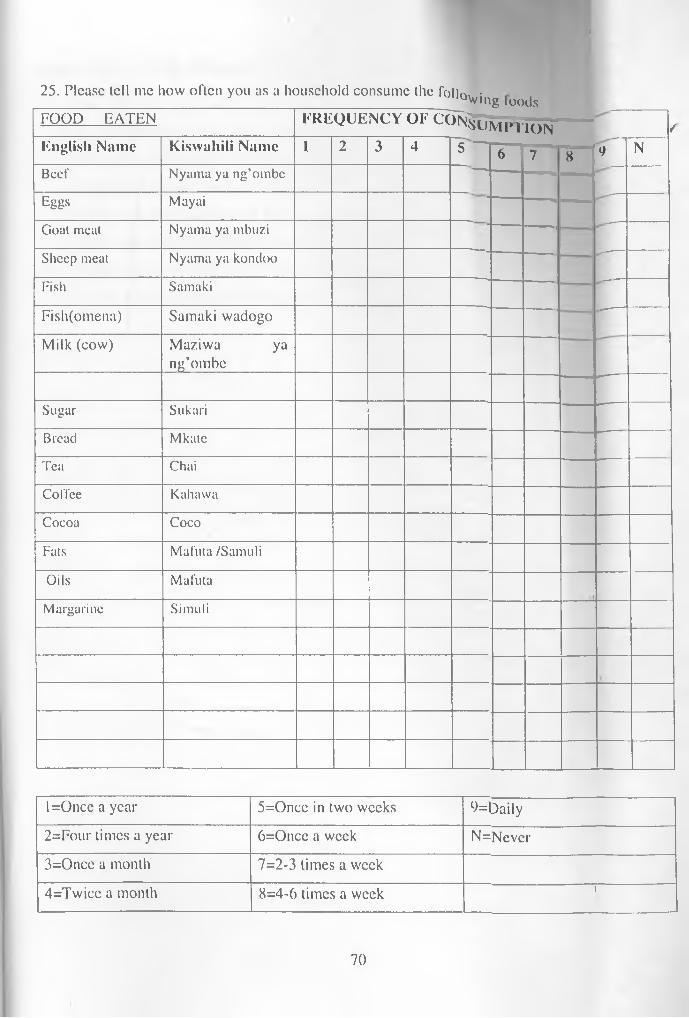
J
25. Please tell me how often you as a household consume the folln. • __________________________ _________ _____________________ ”“Q\ving loodsFOOD EATEN FREQUENCY OF CON^Lijvie Wo n /English Name Kiswuhili Name 1 2 3 4 N5 6 7 8 9Beef Nyama ya ng’ombcEggs MayaiGoat meat Nyama ya mbuziSheep meat Nyama ya kondooFish SamakiFish(omena) Samaki wadogoMilk (cow) Maziwa ya
ng’ombe
Sugar SukariBread MkateTea ChaiCoffee KahawaCocoa CocoFats Mafuta /SamuliOils MafutaMargarine Simuli ___
l=Oncc a year 5=Oncc in two weeks 9=Daily2=Four times a year 6=Once a week N=Never3=Once a month 7=2-3 times a week4=Twice a month 8=4-6 times a week 1
70

43. Please fill in the table below with the necessary informationf 1a) Which member of the family consumed the meal?b) What was the method of food preparation/cooking for the particular dish?c) What was the total weight of the dish prepared?d) What was the weight of the food served to the individual household members?e) What was the weight of the food leftover by each household member?0 What was the weight of the food consumed by each household member? g) What was the amount of water consumed by each household member?
Appendix 2: 3-Day Weighed Food record
71
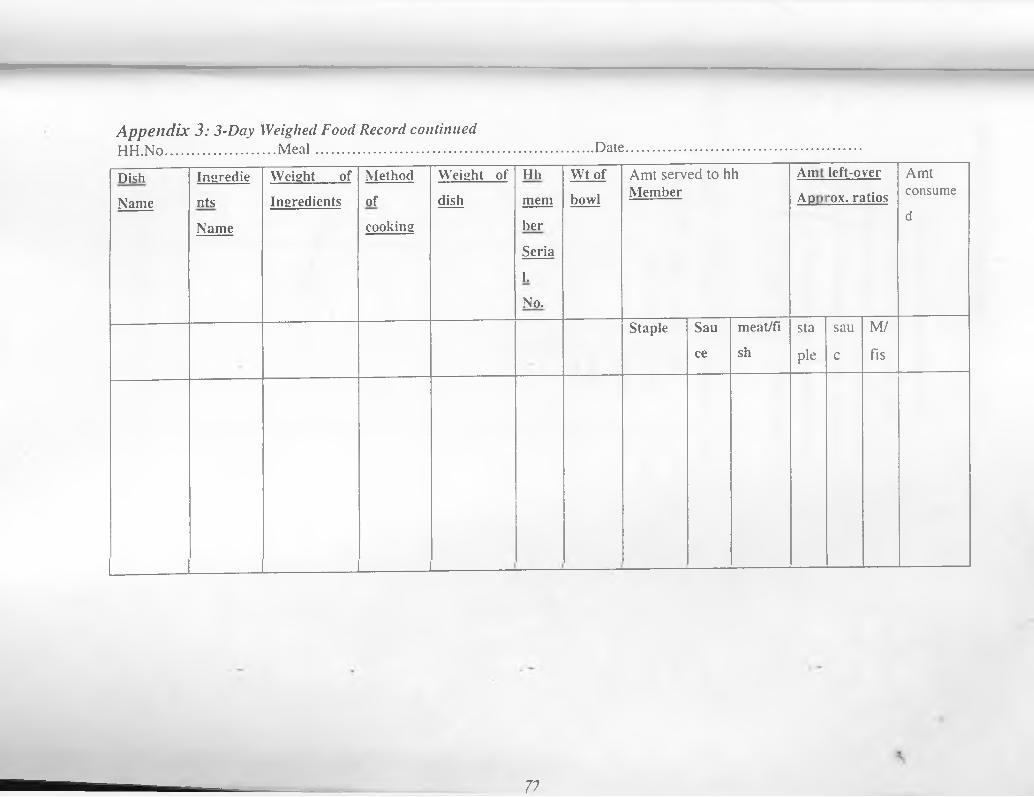
A ppend ix 3: 3-Day Weighed Food Record continuedHH.No............................M eal.......................................................................DateDishName
IngredientsName
Weight of Ingredients
Methodofcooking
Weight of dish
HhmemherSerialNo.
Wt of bowl
Amt served to h Member
h S| a]■<1 <1
left-o rox. ri
veritios
Amtconsumed
Staple Sauce
meat/fish
stapie
sauc
M/fis
__ ___
77

Appendix 4: Weight Table
a)b)c)d) c) f)
Hh. Serial no.
What was the weight of each household member before the meal?What was the weight of the cup of water served to the household member? What was the weight of the cup after the meal?What was the total amount of water drank during the meal?What was the weight of each household member after the meal?What is the difference between weight added and the water intake?
■I'jcI b<\
Height of hh member
Weight of hhd member before meal
Weighed cup of water before meal
Weighed cup of water after mcal(lcftover)
Total amount of water drunk
Wci8> 'Sia?/' hhd l,.me ml> t]l(1.
'Jtttafter mi
all
73

Fathcr/Grandfathcr’s GuideAppendix 5: KEY INFORMANTS/EGDs QUESTIONNAIRE
P lease record the b ack grou n d in form ation and the a n s w e r s t<q u estion s or record th e ir v iew s d u rin g d iscu ssio n in a n o t e b o o k *°d<» \ vjn^
Background Inforination1. Date of interview 7. Marital Status2. Sub-location 8. Age ^__3. Village 9. Level of education ...4. Interview No. 10. Occupation ~~~5. Name of Interviewer 11. Number of children6.Name of fathcr/g/fathcr 12. No. Of children <5 yrs __
1. What type of food crops arc grown or gathered in this area and., which seasons?2. How arc foods preserved in your community?3 Who usually does the cooking and with whose assistance?4. What kind of cooking utensils arc used and what are they made of?5. How arc the different foods and drinks prepared?6. What kinds of salt arc used in food preparation?7. What kinds of beverages and stimulants arc consumed?8. Do household members cat from own plates or in groups? Who distributes lboc|
Vv'lhin iuhousehold and in groups?9. At what age arc other foods other than breast milk introduced to infants and wh*»t .
foods? u'c the*.
10. What kind of special foods arc prepared or bought for infants?11. What foods are culturally considered special or forbidden during pregilancv')
(Li*HGivereason.
74

12. Which foods are culturally encouraged or prohibited during lactation? Give reason.13. What foods arc culturally considered special or forbidden for girls? Give reason.14. Which foods arc culturally encouraged or prohibited .to boys? Give reason.15. What foods arc consumed during periods of famine or food shortage?16. What is the nature of food shortage?
75

^ ^ H m i sewivp.R/nrnnH mothefs_G lll^ ^
•’lease record thc background information and the answers to following questions orrecord their views during discussion in a notebook
A p p e n d i x 6: K E Y INFORMANTS/FGDs QUESTIONNAIRE
background Information• ■ Date ot interview 7. Marital Status2. S u b - l o c a t i o n 8. Age3. V i l l a g e 9. Level of education4. Interview No. 10. Occupation5. Name of Interviewer 11. Number of children6-Name of falher/g/father 12. No. Of children <5 yrs
1. What type of food crops arc grown or gathered in this area and., which seasons?2. How are foods preserved in your community?3. Who usually docs the cooking and with whose assistance?4. What kind of cooking utensils arc used and what arc they made of?5. How arc the different foods and drinks prepared?6. What kinds of salt are used in food preparation?7. What kinds of beverages and stimulants are consumed?8. Do household members eat from own plates or in groups? Who distributes food within the
household and in groups?9. At what age arc other foods other than breast milk introduced to infants and what are these
foods?8. What kind of special foods arc prepared or bought for infants?9. What foods are culturally considered special or forbidden during pregnancy? (List) Give
reason.10. Which foods are culturally encouraged or prohibited during lactation? Give reason.11. What foods are culturally considered special or forbidden for girls? Give reason.12. Which foods are culturally encouraged or prohibited .to boys? Give reason.13. What foods arc consumed during periods of famine or food shortage?
76

14. What is the nature o f food shortage?
Appendix 7: Quantitative analysis of food intake (3-day weighed record)• lie ratio of the family’s food consumed was used to derive the amount of ingredients taken by each member.For example; if 30grams of sugar was used to make 300grams of tea, of which the child took 150 grams, the actual intake of sugar was 15 grams. Using Kenyan Tables conversion figures, the kilocalories and protein content was calculated as follows: lOOg sugar=375 kilocalories 15 g sugar=?15g x 375 Kcal = 56.25 Kcal
lOOg
For the composite foods like Githeri (maize and beans), the total nutrients intakes were calculated by computing each ingredient separately and adding them.For example Githeri made fromlOOOg maize, 500g beans, 200g fat and 120 g onion (0.54: 0.27: 0.11: and 0.06) and salt. From this food, kilocalories and protein were calculated as follows:KilocalorieslOOg maize=335 kcal; lg maize=3.35 kcal lOOg bcans=320 kcal; 1 g beans=3.2 kcal lOOg fat=900 kcal; lg fat=0.9 kcal lOOg onion = 38 kcal; 1 g onion = 0.38 kcal
77
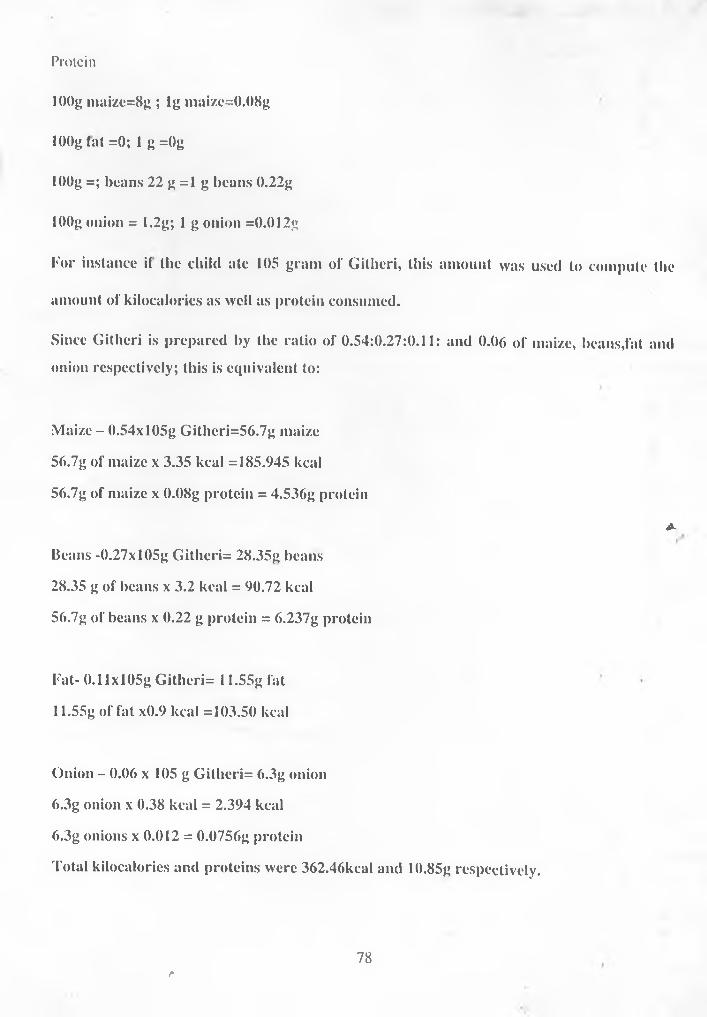
Protein10()g maize=8g ; lg maize=0.08g lOOg tat =0; 1 g =()g lOOg =; beans 22 g =1 g beans 0.22g lOOg onion = 1.2g; 1 g onion =0.012gFor instance if the child ate 105 gram of Githeri, this amount was used to compute the amount of kilocalories as well as protein consumed.Since Githeri is prepared by the ratio of 0.54:0.27:0.11: and 0.06 of maize, beans,fat and onion respectively; this is equivalent to:
Maize - 0.54xl05g Githeri=56.7g maize 56.7g of maize x 3.35 kcal =185.945 kcal 56.7g of maize x 0.08g protein = 4.536g protein
A-Beans -0.27x10⁵g Githeri= 28.35g beans 28.35 g of beans x 3.2 kcal = 90.72 kcal 56.7g of beans x 0.22 g protein = 6.237g protein
Fat- 0.11xl05g Githeri= 11.55g fat 11.55g of fat x0.9 kcal =103.50 kcal
Onion - 0.06 x 10⁵ g Githeri= 6.3g onion 6.3g onion x 0.38 kcal = 2.394 kcal 6.3g onions x 0.012 = 0.0756g proteinTotal kilocalories and proteins were 362.46kcal and 10.85g respectively.
r 78
Related Documents