foods Article Food Consumption Determinants and Barriers for Healthy Eating at the Workplace—A University Setting † João P. M. Lima 1,2,3,4, *, Sofia A. Costa 5 , Teresa R. S. Brandão 6 and Ada Rocha 2,3,7 Citation: Lima, J.P.M.; Costa, S.A.; Brandão, T.R.S.; Rocha, A. Food Consumption Determinants and Barriers for Healthy Eating at the Workplace—A University Setting. Foods 2021, 10, 695. https:// doi.org/10.3390/foods10040695 Academic Editor: Pascal Schlich Received: 1 March 2021 Accepted: 22 March 2021 Published: 25 March 2021 Publisher’s Note: MDPI stays neutral with regard to jurisdictional claims in published maps and institutional affil- iations. Copyright: © 2021 by the authors. Licensee MDPI, Basel, Switzerland. This article is an open access article distributed under the terms and conditions of the Creative Commons Attribution (CC BY) license (https:// creativecommons.org/licenses/by/ 4.0/). 1 Politécnico de Coimbra, ESTeSC, Unidade Científico-Pedagógica de Dietética e Nutrição, Rua 5 de Outubro, S. Martinho do Bispo, 3046-854 Coimbra, Portugal 2 GreenUPorto—Sustainable Agrifood Production Research Centre, Campus de Vairão Edifício de Ciências Agrárias (FCV2) Rua da Agrária, 747, 4485-646 Vairão, Portugal; [email protected] 3 LAQV-Requimte—R. D. Manuel II, Apartado 55142, 4051-401 Porto, Portugal 4 ciTechCare—Center for Innovative Care and Health Technology, R. de Santo André 2410, 2410-541 Leiria, Portugal 5 Instituto de Saúde de Pública da Universidade do Porto, Rua das Taipas 135, 4050-091 Porto, Portugal; [email protected] 6 CBQF—Center for Biotechnology and Fine Chemicals—Associate Laboratory, School of Biotechnology, Catholic University of Portugal, R. de Diogo Botelho 1327, 4169-005 Porto, Portugal; [email protected] 7 Faculty of Nutrition and Food Sciences, University of Porto, Rua do Campo Alegre, 823, 4150-180 Porto, Portugal * Correspondence: [email protected] † The work was a part of João Lima’s doctoral thesis. Abstract: Background: A wide variety of social, cultural and economic factors may influence dietary patterns. This work aims to identify the main determinants of food consumption and barriers for healthy eating at the workplace, in a university setting. Methods: A cross-sectional observational study was conducted with 533 participants. Data were obtained through the application of a self-administered questionnaire that included socio-demographic information, food consumption determinants and the main perceived barriers for healthy eating at the workplace. Results: The respondents identified “price” (22.5%), “meal quality” (20.7%), and “location/distance” (16.5%). For women, the determinant “availability of healthy food options” was more important than for men (p < 0.001). The food consumption determinants at the workplace most referred to by respondents were related to the nutritional value. Smell, taste, appearance and texture, and good value for money, were also considered important for choosing food at the workplace. Respondents referred to work commitments and lack of time as the main barriers for healthy eating at the workplace. Conclusions: Identification of determinants involved in food consumption, and the barriers for healthy eating, may contribute to a better definition of health promotion initiatives at the workplace aiming to improve nutritional intake. Keywords: food choice; food consumption; university; workplace; determinants; barriers 1. Introduction Globalization has caused drastic changes in food patterns within the last decade. These changes resulted in a reduction in the prevalence of malnutrition along with a widespread increase in prevalence of overweight and obesity [1]. An unhealthy lifestyle is one of the major risk factors for chronic diseases in developed countries [2]. Consumer behaviors play a prominent role in the etiology of several chronic non-communicable diseases, including obesity, diabetes mellitus, and cardiovascular diseases, among others, whose prevalence tends to stand still, or even increase [1,3,4]. Sedentary habits and unhealthy eating behaviors are responsible for a significant eco- nomic burden through absenteeism and presenteeism [5–8]. Additionally, for employees, unhealthy lifestyle behaviors and obesity might lead to negative effects related to work [9]. Foods 2021, 10, 695. https://doi.org/10.3390/foods10040695 https://www.mdpi.com/journal/foods

Welcome message from author
This document is posted to help you gain knowledge. Please leave a comment to let me know what you think about it! Share it to your friends and learn new things together.
Transcript
foods
Article
Food Consumption Determinants and Barriers for HealthyEating at the Workplace—A University Setting †
João P. M. Lima 1,2,3,4,*, Sofia A. Costa 5 , Teresa R. S. Brandão 6 and Ada Rocha 2,3,7
�����������������
Citation: Lima, J.P.M.; Costa, S.A.;
Brandão, T.R.S.; Rocha, A. Food
Consumption Determinants and
Barriers for Healthy Eating at the
Workplace—A University Setting.
Foods 2021, 10, 695. https://
doi.org/10.3390/foods10040695
Academic Editor: Pascal Schlich
Received: 1 March 2021
Accepted: 22 March 2021
Published: 25 March 2021
Publisher’s Note: MDPI stays neutral
with regard to jurisdictional claims in
published maps and institutional affil-
iations.
Copyright: © 2021 by the authors.
Licensee MDPI, Basel, Switzerland.
This article is an open access article
distributed under the terms and
conditions of the Creative Commons
Attribution (CC BY) license (https://
creativecommons.org/licenses/by/
4.0/).
1 Politécnico de Coimbra, ESTeSC, Unidade Científico-Pedagógica de Dietética e Nutrição, Rua 5 de Outubro,S. Martinho do Bispo, 3046-854 Coimbra, Portugal
2 GreenUPorto—Sustainable Agrifood Production Research Centre, Campus de Vairão Edifício de CiênciasAgrárias (FCV2) Rua da Agrária, 747, 4485-646 Vairão, Portugal; [email protected]
3 LAQV-Requimte—R. D. Manuel II, Apartado 55142, 4051-401 Porto, Portugal4 ciTechCare—Center for Innovative Care and Health Technology, R. de Santo André 2410,
2410-541 Leiria, Portugal5 Instituto de Saúde de Pública da Universidade do Porto, Rua das Taipas 135, 4050-091 Porto, Portugal;
[email protected] CBQF—Center for Biotechnology and Fine Chemicals—Associate Laboratory, School of Biotechnology,
Catholic University of Portugal, R. de Diogo Botelho 1327, 4169-005 Porto, Portugal; [email protected] Faculty of Nutrition and Food Sciences, University of Porto, Rua do Campo Alegre, 823,
4150-180 Porto, Portugal* Correspondence: [email protected]† The work was a part of João Lima’s doctoral thesis.
Abstract: Background: A wide variety of social, cultural and economic factors may influence dietarypatterns. This work aims to identify the main determinants of food consumption and barriers forhealthy eating at the workplace, in a university setting. Methods: A cross-sectional observationalstudy was conducted with 533 participants. Data were obtained through the application of aself-administered questionnaire that included socio-demographic information, food consumptiondeterminants and the main perceived barriers for healthy eating at the workplace. Results: Therespondents identified “price” (22.5%), “meal quality” (20.7%), and “location/distance” (16.5%). Forwomen, the determinant “availability of healthy food options” was more important than for men(p < 0.001). The food consumption determinants at the workplace most referred to by respondentswere related to the nutritional value. Smell, taste, appearance and texture, and good value for money,were also considered important for choosing food at the workplace. Respondents referred to workcommitments and lack of time as the main barriers for healthy eating at the workplace. Conclusions:Identification of determinants involved in food consumption, and the barriers for healthy eating, maycontribute to a better definition of health promotion initiatives at the workplace aiming to improvenutritional intake.
Keywords: food choice; food consumption; university; workplace; determinants; barriers
1. Introduction
Globalization has caused drastic changes in food patterns within the last decade. Thesechanges resulted in a reduction in the prevalence of malnutrition along with a widespreadincrease in prevalence of overweight and obesity [1]. An unhealthy lifestyle is one of themajor risk factors for chronic diseases in developed countries [2]. Consumer behaviors playa prominent role in the etiology of several chronic non-communicable diseases, includingobesity, diabetes mellitus, and cardiovascular diseases, among others, whose prevalencetends to stand still, or even increase [1,3,4].
Sedentary habits and unhealthy eating behaviors are responsible for a significant eco-nomic burden through absenteeism and presenteeism [5–8]. Additionally, for employees,unhealthy lifestyle behaviors and obesity might lead to negative effects related to work [9].
Foods 2021, 10, 695. https://doi.org/10.3390/foods10040695 https://www.mdpi.com/journal/foods
Foods 2021, 10, 695 2 of 13
Research has shown that unhealthy employees and those with an unhealthy lifestyle areless productive at work and have decreased work ability [10–14].
The workplace is recognized as an opportune and fruitful setting for health promotionbecause of the presence of natural social networks, the possibility of reaching a largenumber of people, and the amount of time people spend at work [15,16]. Promotion ofhealthy lifestyles, namely healthy nutritional behavior at the workplace, improves workers’health and productivity [17].
The workplace also offers an interesting context for studying eating behaviors. There isoften a high level of consistency in people’s working lives, with many workers (particularlythose who are office-based, as in this sample) spending most of their time in the samelocation surrounded by the same group of colleagues [18]. Partly for this reason, a numberof eating-related research studies have been conducted at the workplace [19–21].
A wide variety of social, cultural, and economic factors may influence dietary patterns.Intra-individual determinants, such as physiological and psychological factors, acquiredfood preferences, and knowledge about nutrition can be distinguished from interpersonalor social factors, such as family and partners influence [21].
Food choice determinants are frequently presented in four groups:
(a) Biologically determined behavioral predispositions, related to an individual’s innateabilities related to food, namely the preference for sweet and salty foods; the mecha-nisms that control hunger and satiety; and the sensory experience provided by food.These are the most basic determinants of food choice, meaning when choosing foodor drinks, people firstly follow their preferences [21];
(b) Sensory-affective factors—those related to feelings and emotions in relation to food—acquired familiarity and ability to learn how to like something are at the secondlevel [21];
(c) Intrapersonal factors, defined by an individual’s beliefs, attitudes, knowledge, skillsand social norms, follow the previous factors in determining the choice of food,just like the interpersonal ones, which involve family, friends and other social net-works [21]. The culture in which each individual was born and raised influencesgeneral behavior and food habits [21]. Interpersonal factors theoretical frameworkwas also described by Rothschild, 1999 [22], and applied, for example, in Bos, 2016 [23].Several authors have ascertained that choices depend on the surrounding environ-ment, and are based on one’s knowledge and experience [21];
(d) Environmental factors are the last level determining food consumption. Even thoughthey are the most distant from the individual, environmental factors are the easiestto influence. They include availability and accessibility to food; social, environmen-tal and cultural practices; resources; economic environment; and food marketingpractices [21]. For example, resources and economic environment determine foodconsumption through food cost or individual income [21]. According to the literature,low-income population groups are more likely to adopt unbalanced diets [21].
In addition to the determinants described above, the individual’s psychological stateis also assumed as one of the major determinants of the act of eating. Situations of emo-tional difficulty, states of anxiety and stress, situations of rejection, or loneliness, in morevulnerable individuals, can lead to changes in eating behavior [21].
Several studies concluded that individuals who identified a higher number of barriersfor healthier eating habits correspond to those with worse habits [23,24]. The main factorsidentified by consumers as barriers for healthy eating were lack of time, poor cooking skills,food price, or the lack of healthy choices at food service units [23–26].
Meals eaten at the workplace represent a large contribution to the daily energy intakeand influence the balance of the diet [27]. The study “Food and Portuguese PopulationLifestyle” [28], identified the factors that influence the food choices of Portuguese adults,and their relationship with socio-demographic and health features [29]. The attribute of“Taste” was the most important factor determining food choice, followed by the “Price”and the “Intention of healthy eating”, according to Poínhos et al. [29].
Foods 2021, 10, 695 3 of 13
Previous research conducted at different workplaces related to food consumptiondeterminants and perceived barriers, identified that structures and systems within theworkplace have a significant role in dietary behaviors. These include the facilities avail-able [30–32], training of staff [33], long hours worked as a result of high workloads andwork pressures, and a culture that encourages working through breaks [34,35]. Lack oftime for lunch can affect both health and productivity [36,37]. The conflict between pro-moting a greater range of healthier foods and business constraints has also been previouslyidentified [38].
In order to develop effective workplace interventions for healthy eating, researchersmust first consider all the known determinants of eating behavior as potential targets forintervention, such as distinct features of working conditions. In a recent systematic reviewof factors affecting healthy eating among nurses, the majority of studies found that work-places often create barriers for healthy eating [20]. Therefore, to define appropriate healthpromotion initiatives, it is necessary to characterize the determinants involved in foodchoice, in order to influence food consumption at the workplace. Additionally, to identifyperceived barriers for healthier eating habits it is also important for the implementationand assessment of interventions in different scenarios [39,40].
To the best of our knowledge, there are no studies that identify and characterizethe determinants involved in food choice in Portugal, especially at the workplace, and itbecomes relevant to develop research to better understand this subject. Therefore, this studyintends to identify the perceived barriers for healthy eating, and the main determinants offood consumption at the workplace, among university employees.
2. Materials and Methods2.1. Study Design and Sample
A cross-sectional observational study was conducted at a Portuguese universitythrough face-to-face interviews by a trained researcher at the participants’ workplace.This university had 3307 employees: 1750 teachers and researchers (academic), 1551 non-teaching staff (non-academic) [41]. A convenience sample was used, stratified by organicunits, aiming to represent the study population, allowing researchers to infer conclusionsfor the study population. Given that the sample corresponds to approximately 15% ofthe population, it was stratified into teaching and researcher staff, and non-teaching andnon-researcher staff; 533 employees were selected. Data collection was performed duringlabor hours.
2.2. Ethical Issues
The project was approved by Ethical Commission of the University of Porto, withthe number CEFADE 25.2014. The principles of the Helsinki Declaration were respectedand the workers under analysis accepted participation in the study through informedconsent, after having the purpose and methods involved in the study explained to themindividually.
2.3. Questionnaires for Data Collection
Data were obtained through the application of a self-administered questionnaire.It included socio-demographic information and food consumption determinants at theworkplace, and a list of barriers for healthy eating at the workplace. The questionnaireincluded questions such as the employee’s age, gender and marital status. Academicqualifications were also questioned, through a closed answer format composed of ninelevels of response (between primary school and PhD or Post-Doc). Employees withacademic qualifications higher than bachelor’s degree were asked about the training area.Concerning work practices, respondents were asked about the amount of time they spendworking at this institution, and the work regime (full-time or part-time). They were askedabout the professional category, function performed, with discrimination between teachingand non-teaching activity, and the establishment where they work.
Foods 2021, 10, 695 4 of 13
To assess food consumption determinants, a section of the questionnaire was devel-oped through the adaptation of the Food Choice Questionnaire, developed by Steptoe et al. [42]after translation and validation for the Portuguese population by Cardoso and Vale [43].Steptoe et al. also contributed to the questions of the Food Choice Questionnaire. A LikertScale of 5 points, from strongly disagree (1) to strongly agree (5) was used in the questionsrelated to determinants. Questions used in the studies “Food and Portuguese PopulationLifestyle” and “Food and Portuguese Population Lifestyle” [28,29] were included in thequestionnaire. The determinants of the choice of location for lunch in the workplace werealso evaluated. Respondents were invited to select the three main factors affecting theirchoice from a predefined list presented in our results [29,44–47].
The barriers presented to respondents were selected from the literature, and otherswere added considering individual perceptions of the researchers. Respondents couldselect as many options from the list as they wanted.
Food offer, quality of meals, prices and food and nutritional intake of employees wereanalyzed and published in previous research papers [48,49].
2.4. Statistical Analysis
Data were analyzed using the Statistical Package for Social Sciences version 21.0 ®
for Windows. Descriptive analysis was performed, and normality of cardinal variableswas tested with Shapiro-Wilk Test. Association between nominal variables was analyzedby chi-square test. Association between ordinals and nominal variables was performedwith Kruskal-Wallis tests. Between ordinal variables, or between ordinal and cardinal non-normal, Spearman correlation was performed. Taking into consideration the differentiationof the sample in terms of age, results were analyzed by age groups, through splittingthe sample by the median age (43 years old) to identify younger and older respondents.Cut-off of 0.05 was used as the level of statistical significance. Data were also analyzedaccording to Multiple Correspondence Analysis (MCA) procedures, which allows forexploring the pattern of relationships of several categorical variables and representingthem in few dimensions of homogeneous variables. For this model, sociodemographicvariables were included, namely gender, educational level, and professional occupation;lunch setting (lunch brought from home, university food services, restaurants and gohome), determinants for the lunch place choice and determinants of food consumptionidentified from Food Choice Questionnaire [42,43].
3. Results3.1. Sample Characterization
From 533 assessed individuals, 513 were considered valid answers. Participantswere aged between 21 and 80 years old (mean 43.3 ± 10.6), mostly females (65.5%) andmarried (63.4%). About 94% of respondents were full-time workers. Most workers (80.3%)had a university degree and about 35% had a PhD or a Post-Doc diploma. Only 3.3% ofrespondents did not complete high school education. Of respondents, 34.2% were Teachers,63.0% were Non-Academic Staff/Researchers and 2.8% had both activities.
The majority of workers had a sedentary activity since 81.5% of them reported spend-ing most of their time seated, and 74.5% characterized their work as not being “veryphysically demanding”.
Only 23.1% of respondents reported following an unhealthy diet at the workplace.Hence, only these workers were asked to point out the barriers for adopting a healthier diet.
3.2. Determinants of Choosing the Place for Having Lunch
The majority (96.7%) of respondents had lunch every day, however, only 36.1% ofthem attended the university food service. Of the respondents, 28% had lunch in localrestaurants. About 52% of workers brought lunch from home and only 16.2% had lunchat home.
Foods 2021, 10, 695 5 of 13
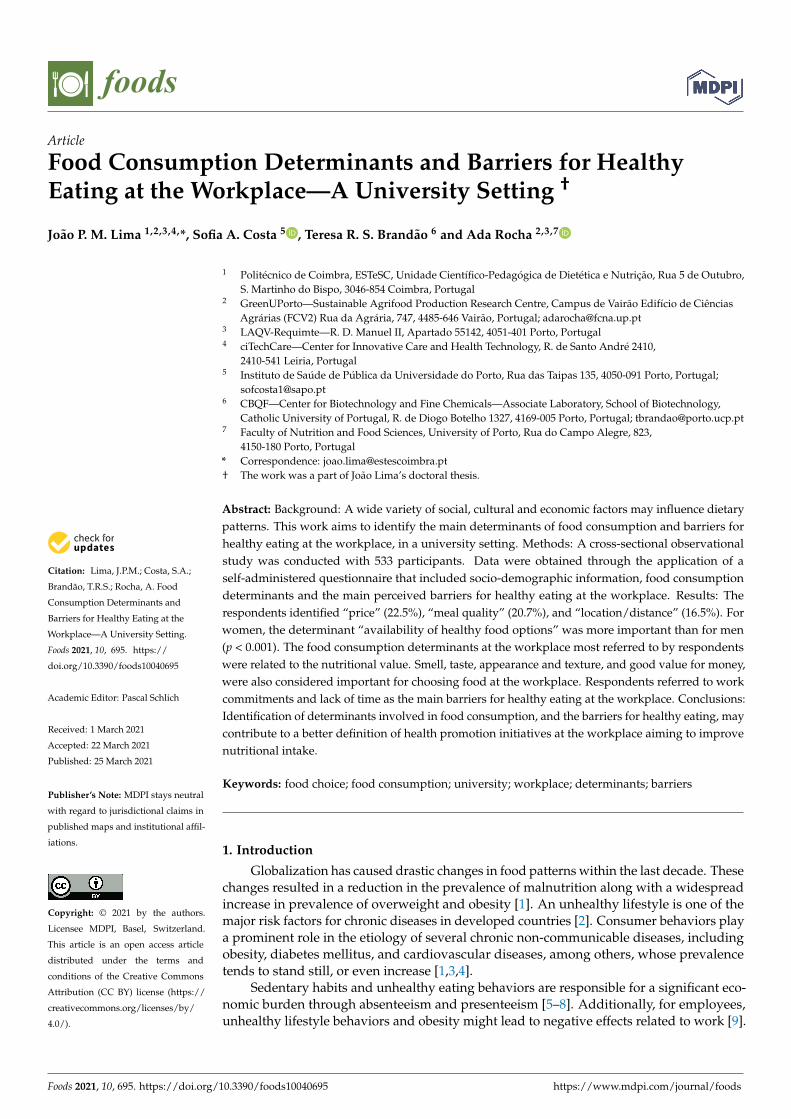
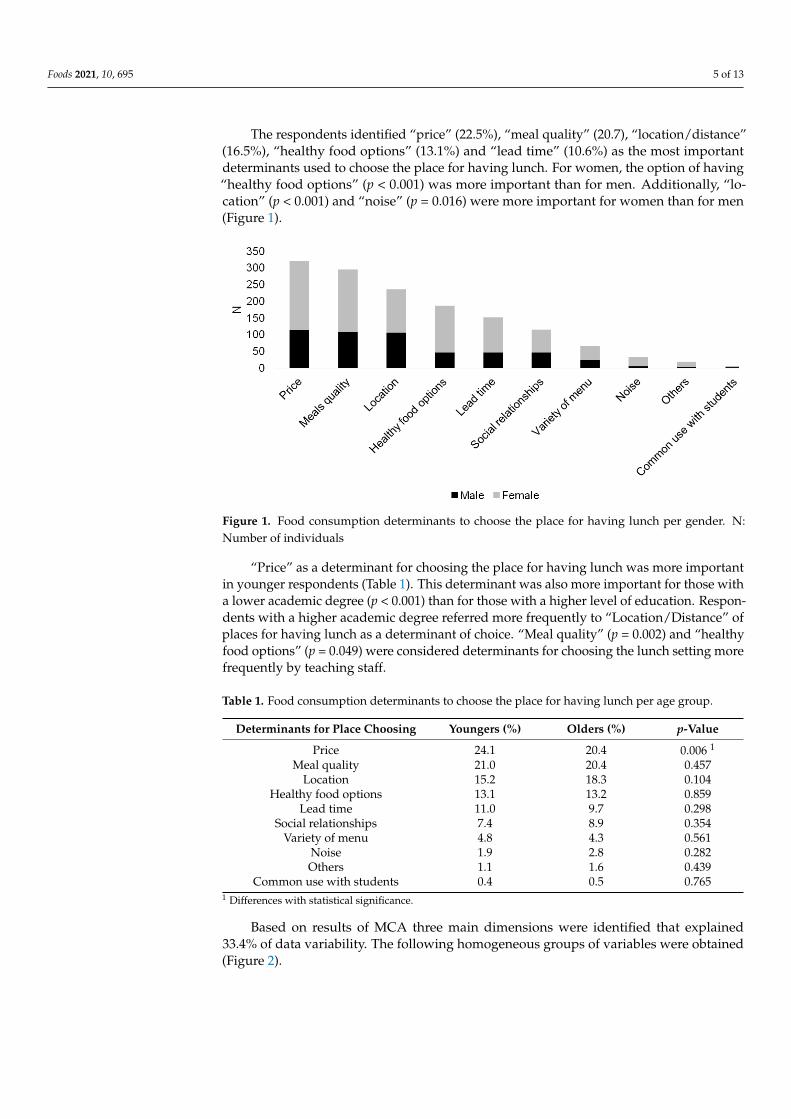
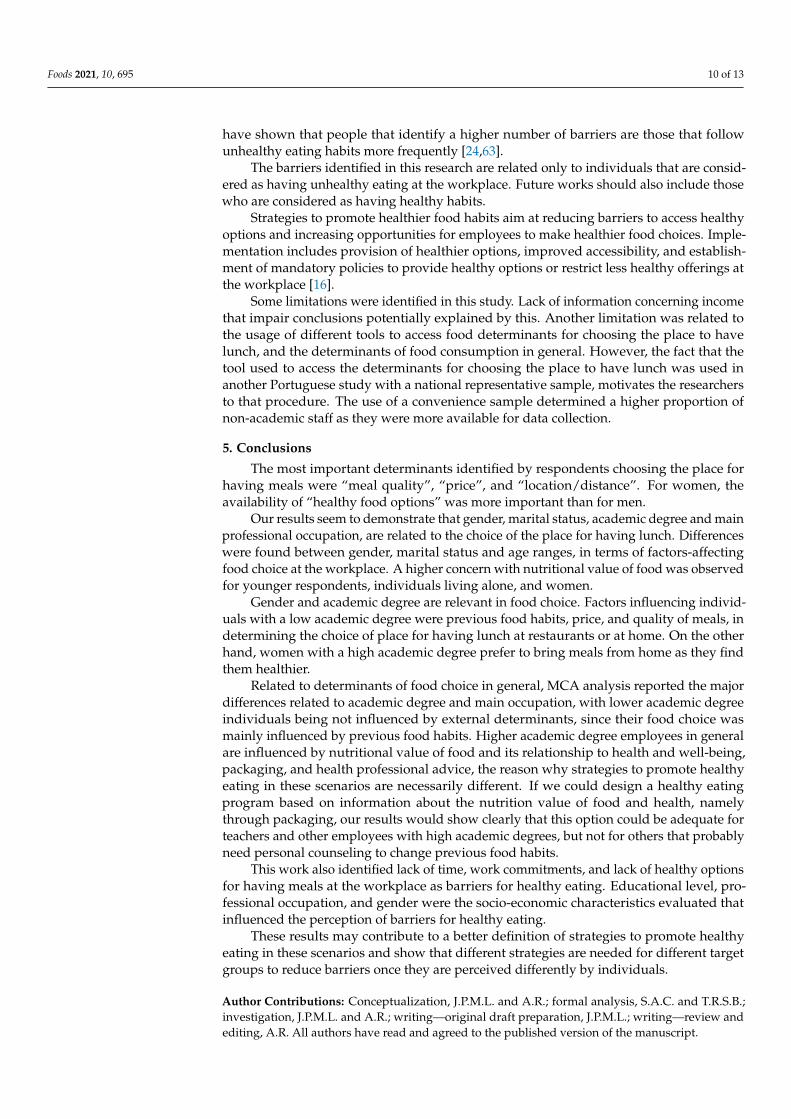
The respondents identified “price” (22.5%), “meal quality” (20.7), “location/distance”(16.5%), “healthy food options” (13.1%) and “lead time” (10.6%) as the most importantdeterminants used to choose the place for having lunch. For women, the option of having“healthy food options” (p < 0.001) was more important than for men. Additionally, “lo-cation” (p < 0.001) and “noise” (p = 0.016) were more important for women than for men(Figure 1).
Foods 2021, 10, x FOR PEER REVIEW 5 of 13
3.2. Determinants of Choosing the Place for Having Lunch
The majority (96.7%) of respondents had lunch every day, however, only 36.1% of
them attended the university food service. Of the respondents, 28% had lunch in local
restaurants. About 52% of workers brought lunch from home and only 16.2% had lunch
at home.
The respondents identified “price” (22.5%), “meal quality” (20.7), “location/distance”
(16.5%), “healthy food options” (13.1%) and “lead time” (10.6%) as the most important
determinants used to choose the place for having lunch. For women, the option of having
“healthy food options” (p < 0.001) was more important than for men. Additionally, “loca-
tion” (p < 0.001) and “noise” (p = 0.016) were more important for women than for men
(Figure 1).
Figure 1. Food consumption determinants to choose the place for having lunch per gender. N: Number of individuals
“Price” as a determinant for choosing the place for having lunch was more important
in younger respondents (Table 1). This determinant was also more important for those
with a lower academic degree (p < 0.001) than for those with a higher level of education.
Respondents with a higher academic degree referred more frequently to “Location/Dis-
tance” of places for having lunch as a determinant of choice. “Meal quality” (p = 0.002)
and “healthy food options” (p = 0.049) were considered determinants for choosing the
lunch setting more frequently by teaching staff.
Table 1. Food consumption determinants to choose the place for having lunch per age group.
Determinants for Place Choosing Youngers (%) Olders (%) p-Value
Price 24.1 20.4 0.006 1
Meal quality 21.0 20.4 0.457
Location 15.2 18.3 0.104
Healthy food options 13.1 13.2 0.859
Lead time 11.0 9.7 0.298
Social relationships 7.4 8.9 0.354
Variety of menu 4.8 4.3 0.561
Noise 1.9 2.8 0.282
Others 1.1 1.6 0.439
Common use with students 0.4 0.5 0.765 1 Differences with statistical significance.
Figure 1. Food consumption determinants to choose the place for having lunch per gender. N:Number of individuals
“Price” as a determinant for choosing the place for having lunch was more importantin younger respondents (Table 1). This determinant was also more important for those witha lower academic degree (p < 0.001) than for those with a higher level of education. Respon-dents with a higher academic degree referred more frequently to “Location/Distance” ofplaces for having lunch as a determinant of choice. “Meal quality” (p = 0.002) and “healthyfood options” (p = 0.049) were considered determinants for choosing the lunch setting morefrequently by teaching staff.
Table 1. Food consumption determinants to choose the place for having lunch per age group.
Determinants for Place Choosing Youngers (%) Olders (%) p-Value
Price 24.1 20.4 0.006 1
Meal quality 21.0 20.4 0.457Location 15.2 18.3 0.104
Healthy food options 13.1 13.2 0.859Lead time 11.0 9.7 0.298
Social relationships 7.4 8.9 0.354Variety of menu 4.8 4.3 0.561
Noise 1.9 2.8 0.282Others 1.1 1.6 0.439
Common use with students 0.4 0.5 0.7651 Differences with statistical significance.
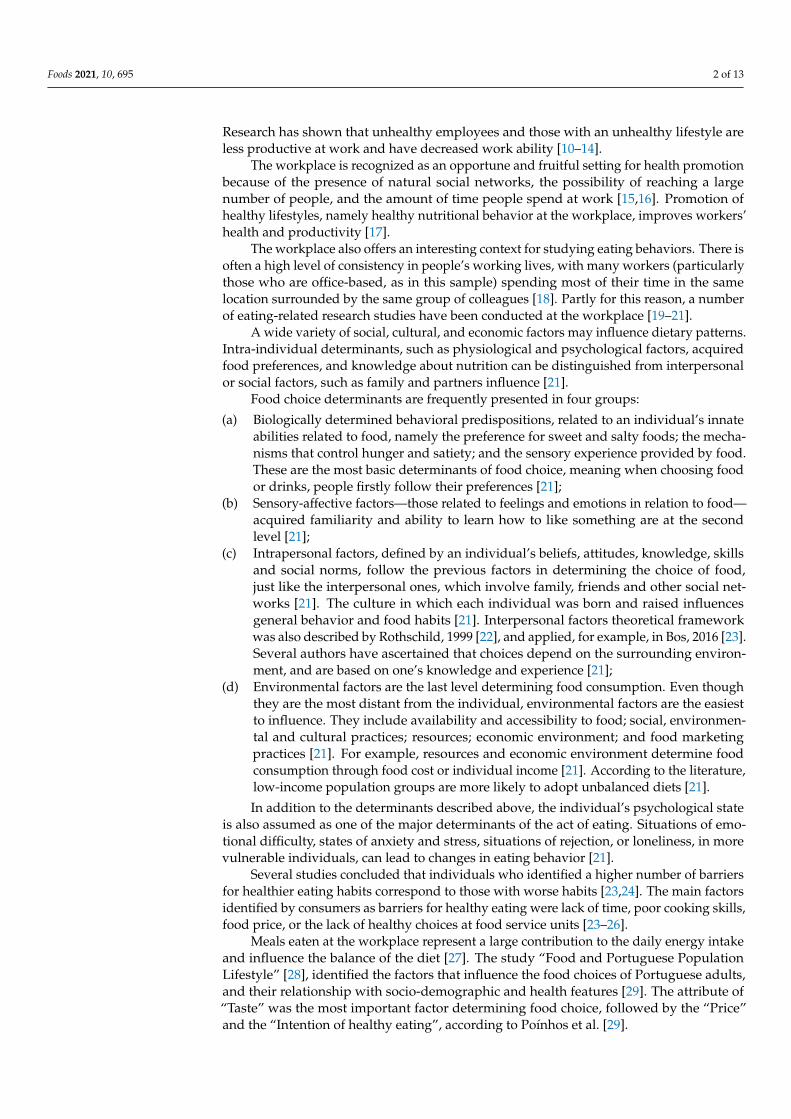
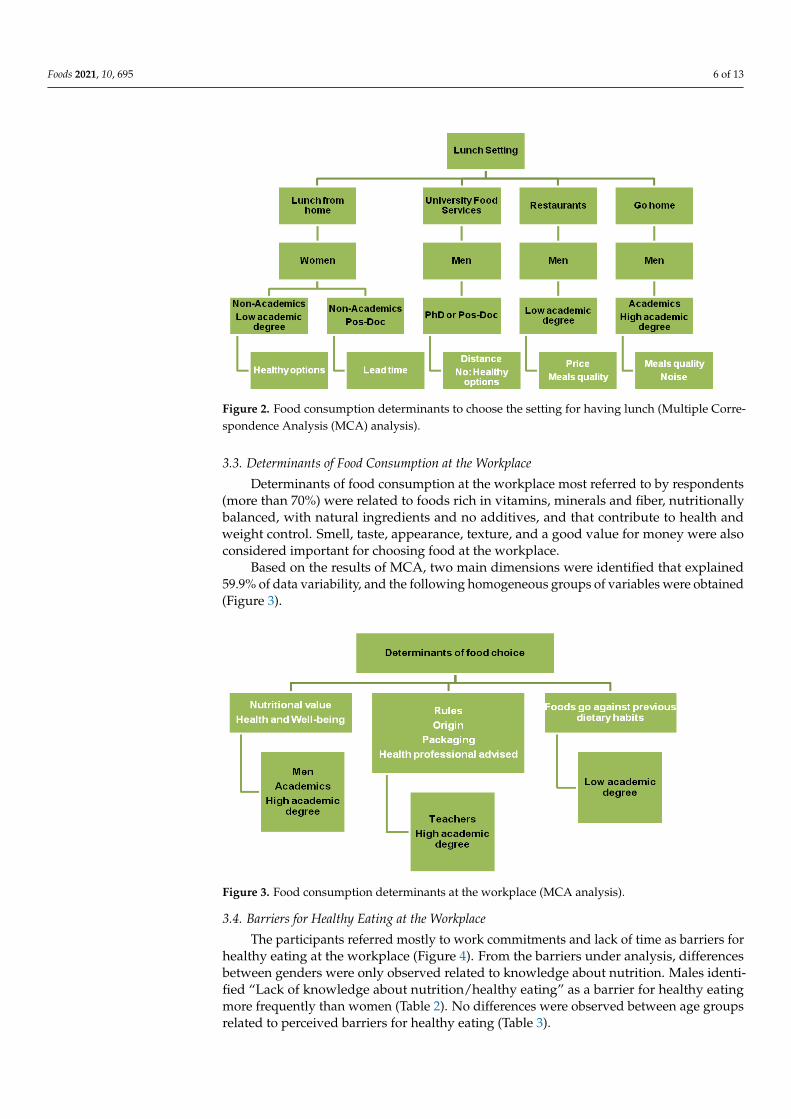
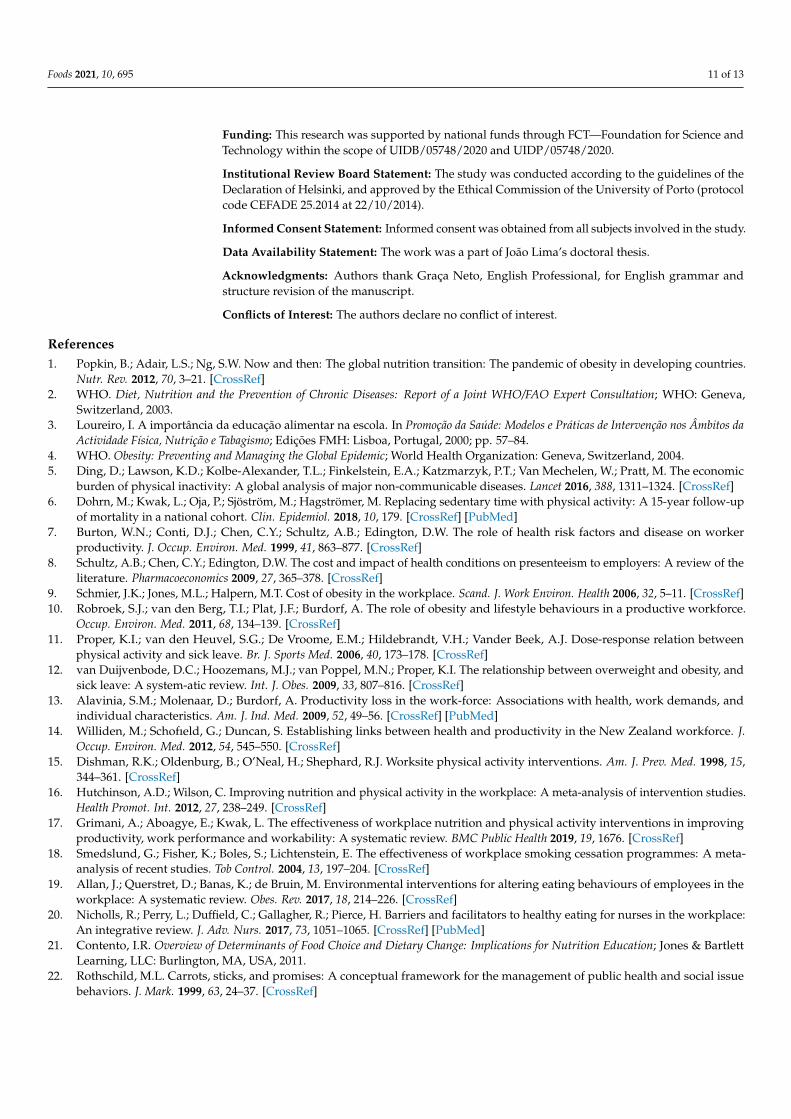
Based on results of MCA three main dimensions were identified that explained33.4% of data variability. The following homogeneous groups of variables were obtained(Figure 2).
Foods 2021, 10, 695 6 of 13
Foods 2021, 10, x FOR PEER REVIEW 6 of 13
Based on results of MCA three main dimensions were identified that explained 33.4%
of data variability. The following homogeneous groups of variables were obtained (Figure
2).
Figure 2. Food consumption determinants to choose the setting for having lunch (Multiple Corre-
spondence Analysis (MCA) analysis).
3.3. Determinants of Food Consumption at the Workplace
Determinants of food consumption at the workplace most referred to by respondents
(more than 70%) were related to foods rich in vitamins, minerals and fiber, nutritionally
balanced, with natural ingredients and no additives, and that contribute to health and
weight control. Smell, taste, appearance, texture, and a good value for money were also
considered important for choosing food at the workplace.
Based on the results of MCA, two main dimensions were identified that explained
59.9% of data variability, and the following homogeneous groups of variables were ob-
tained (Figure 3).
Figure 3. Food consumption determinants at the workplace (MCA analysis).
3.4. Barriers for Healthy Eating at the Workplace
The participants referred mostly to work commitments and lack of time as barriers
for healthy eating at the workplace (Figure 4). From the barriers under analysis, differ-
ences between genders were only observed related to knowledge about nutrition. Males
Figure 2. Food consumption determinants to choose the setting for having lunch (Multiple Corre-spondence Analysis (MCA) analysis).
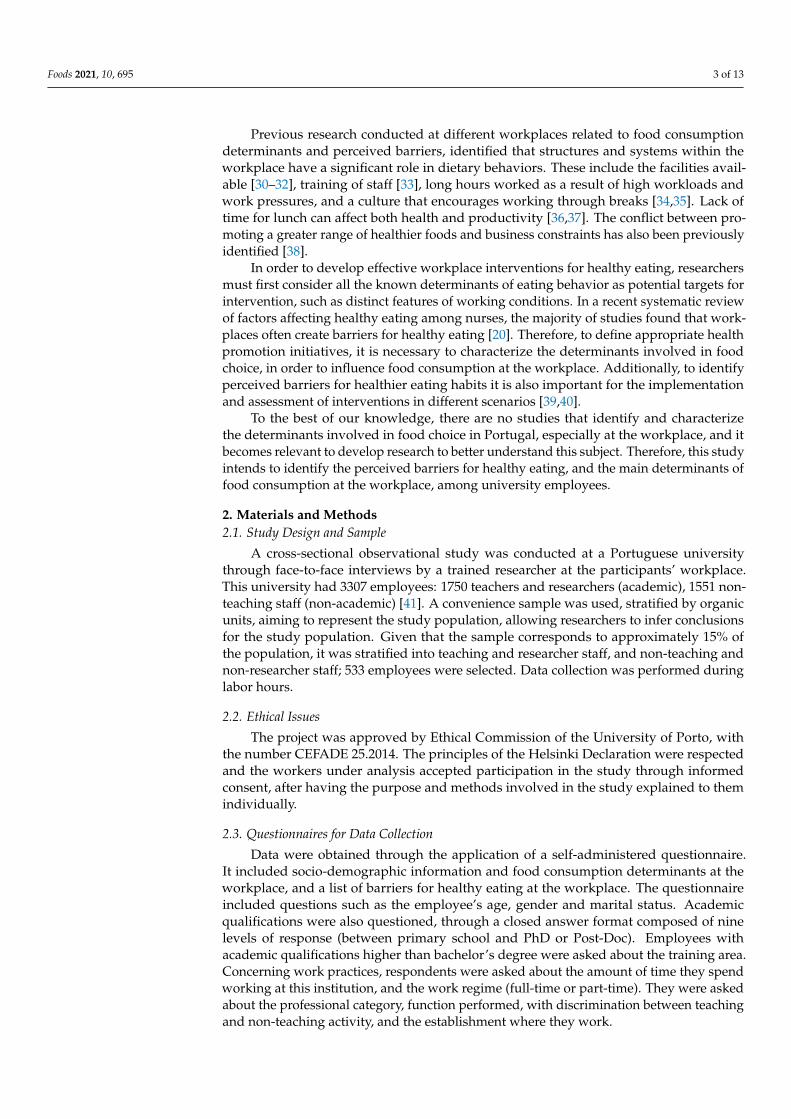
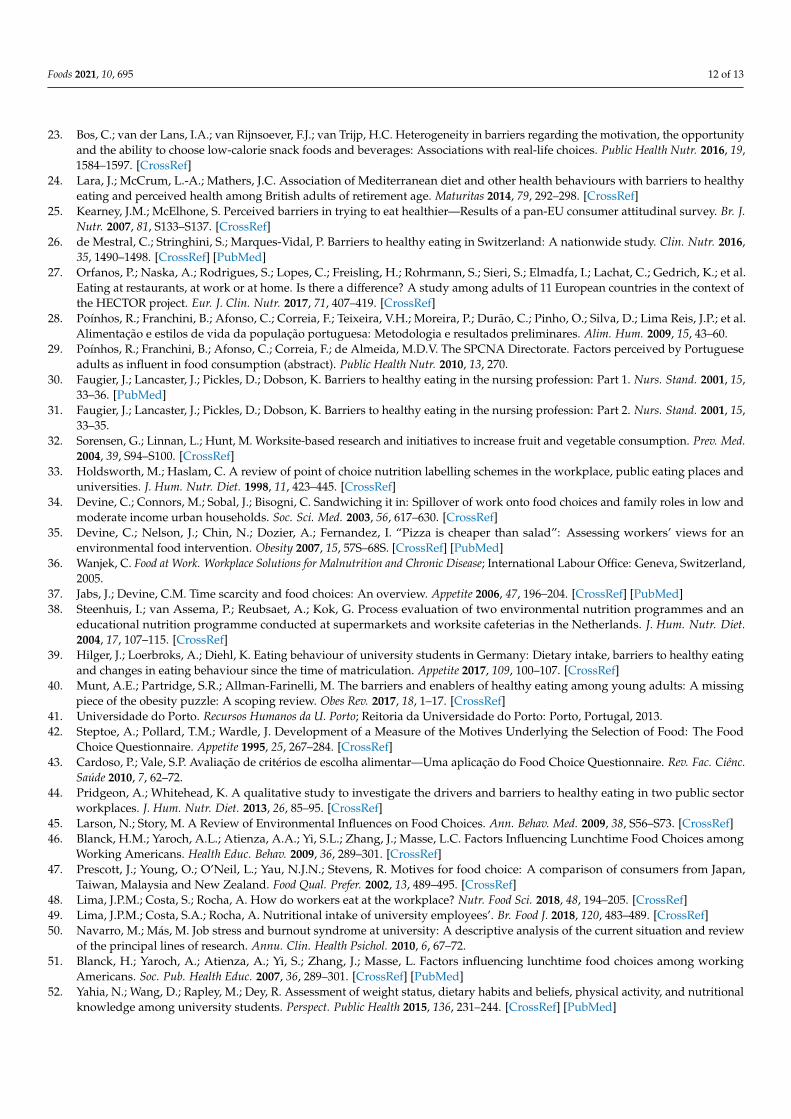
3.3. Determinants of Food Consumption at the Workplace
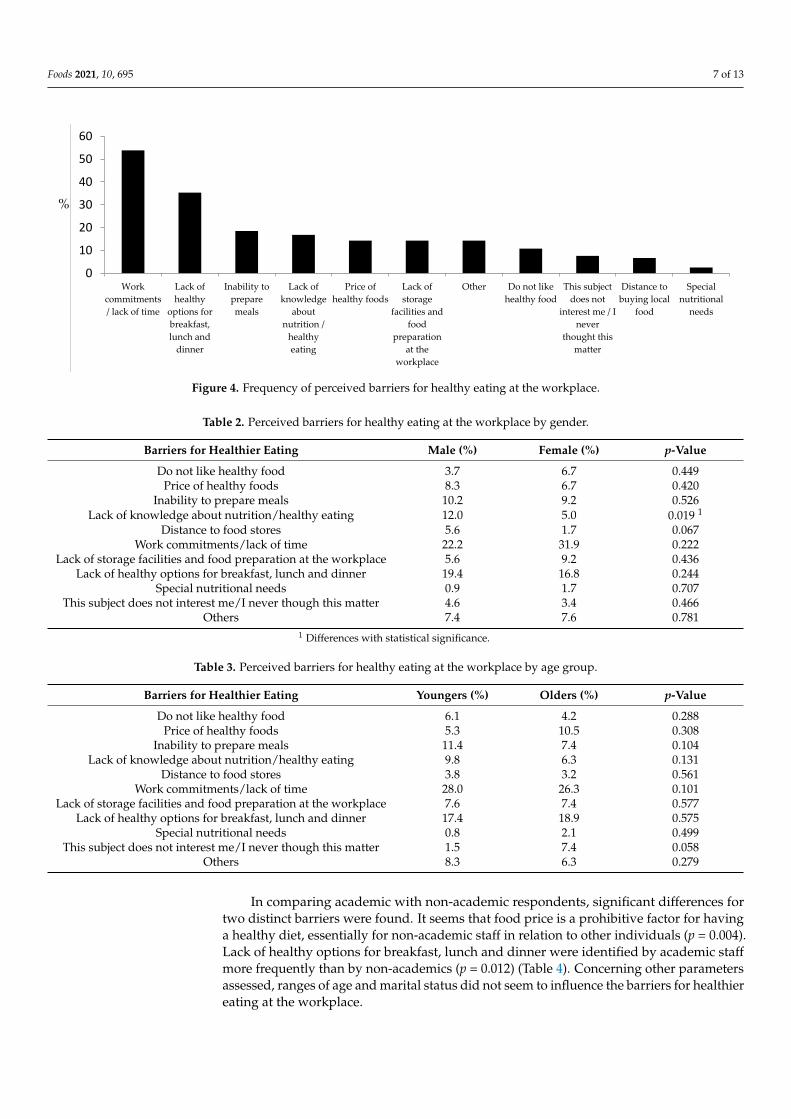
Determinants of food consumption at the workplace most referred to by respondents(more than 70%) were related to foods rich in vitamins, minerals and fiber, nutritionallybalanced, with natural ingredients and no additives, and that contribute to health andweight control. Smell, taste, appearance, texture, and a good value for money were alsoconsidered important for choosing food at the workplace.
Based on the results of MCA, two main dimensions were identified that explained59.9% of data variability, and the following homogeneous groups of variables were obtained(Figure 3).
Foods 2021, 10, x FOR PEER REVIEW 6 of 13
Based on results of MCA three main dimensions were identified that explained 33.4%
of data variability. The following homogeneous groups of variables were obtained (Figure
2).
Figure 2. Food consumption determinants to choose the setting for having lunch (Multiple Corre-
spondence Analysis (MCA) analysis).
3.3. Determinants of Food Consumption at the Workplace
Determinants of food consumption at the workplace most referred to by respondents
(more than 70%) were related to foods rich in vitamins, minerals and fiber, nutritionally
balanced, with natural ingredients and no additives, and that contribute to health and
weight control. Smell, taste, appearance, texture, and a good value for money were also
considered important for choosing food at the workplace.
Based on the results of MCA, two main dimensions were identified that explained
59.9% of data variability, and the following homogeneous groups of variables were ob-
tained (Figure 3).
Figure 3. Food consumption determinants at the workplace (MCA analysis).
3.4. Barriers for Healthy Eating at the Workplace
The participants referred mostly to work commitments and lack of time as barriers
for healthy eating at the workplace (Figure 4). From the barriers under analysis, differ-
ences between genders were only observed related to knowledge about nutrition. Males
Figure 3. Food consumption determinants at the workplace (MCA analysis).
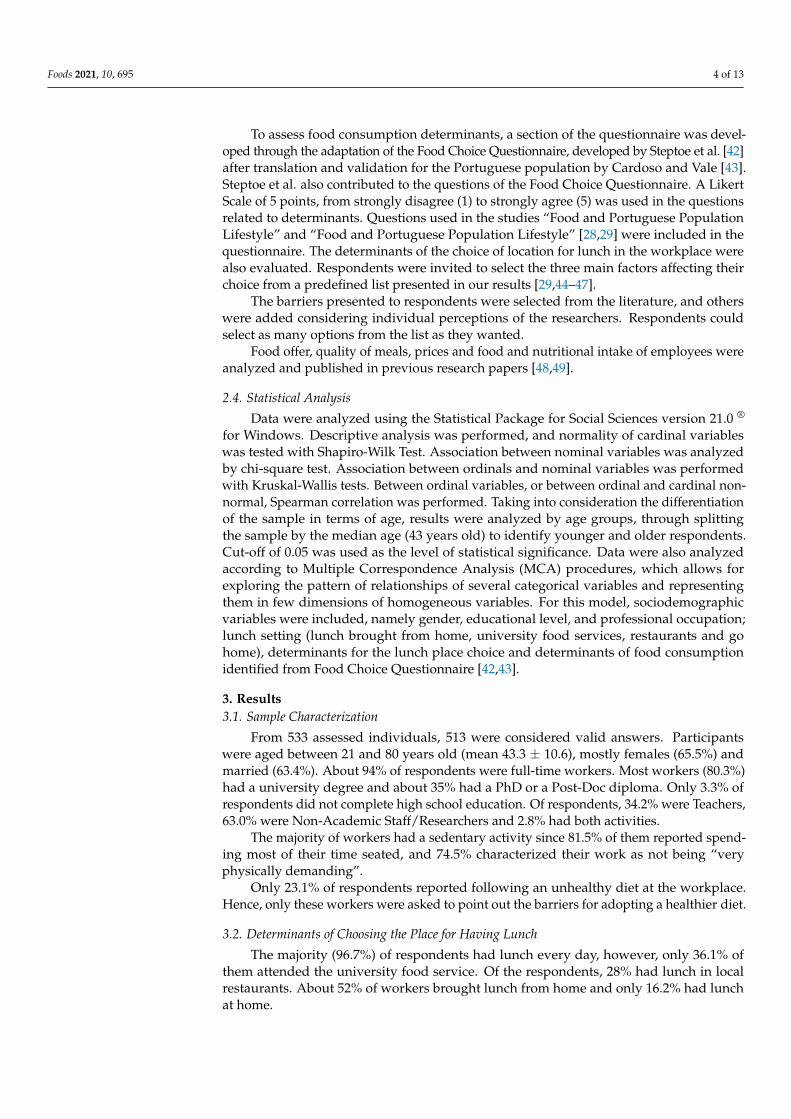
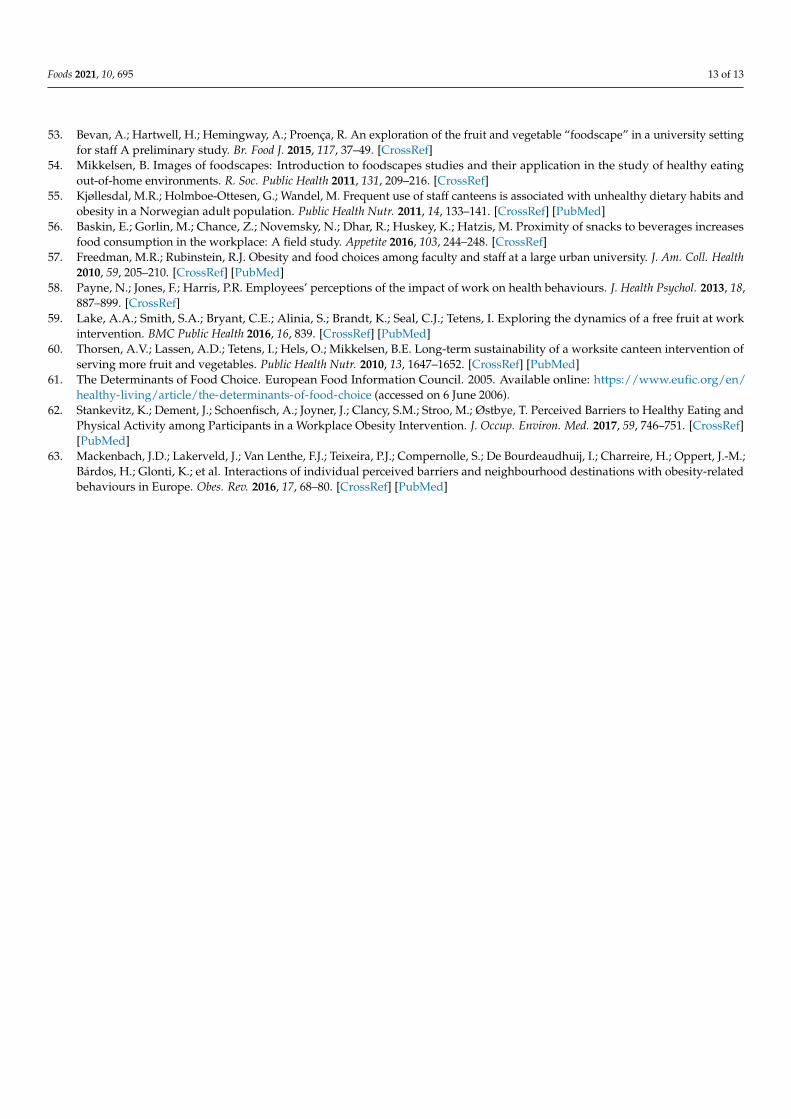
3.4. Barriers for Healthy Eating at the Workplace
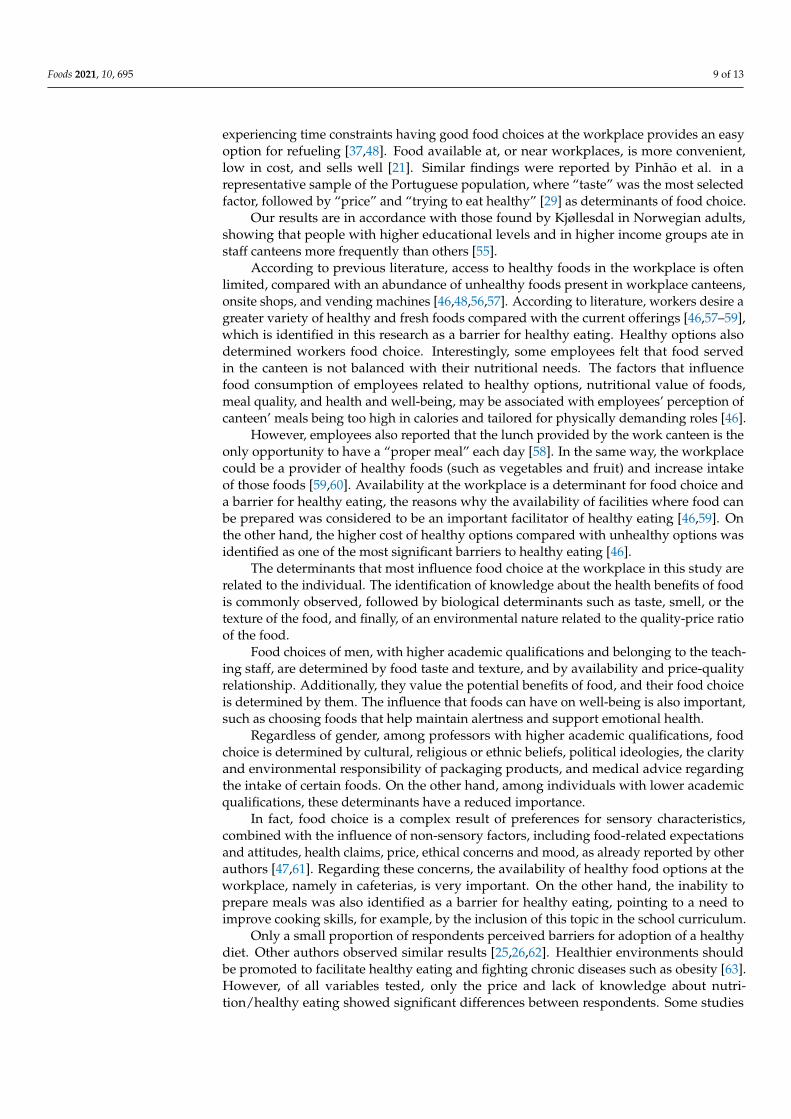
The participants referred mostly to work commitments and lack of time as barriers forhealthy eating at the workplace (Figure 4). From the barriers under analysis, differencesbetween genders were only observed related to knowledge about nutrition. Males identi-fied “Lack of knowledge about nutrition/healthy eating” as a barrier for healthy eatingmore frequently than women (Table 2). No differences were observed between age groupsrelated to perceived barriers for healthy eating (Table 3).
Foods 2021, 10, 695 7 of 13
Foods 2021, 10, x FOR PEER REVIEW 7 of 13
identified “Lack of knowledge about nutrition/healthy eating” as a barrier for healthy eat-
ing more frequently than women (Table 2). No differences were observed between age
groups related to perceived barriers for healthy eating (Table 3).
Figure 4. Frequency of perceived barriers for healthy eating at the workplace.
Table 2. Perceived barriers for healthy eating at the workplace by gender.
Barriers for Healthier Eating Male (%) Female (%) p-Value
Do not like healthy food 3.7 6.7 0.449
Price of healthy foods 8.3 6.7 0.420
Inability to prepare meals 10.2 9.2 0.526
Lack of knowledge about nutrition/healthy eating 12.0 5.0 0.019 1
Distance to food stores 5.6 1.7 0.067
Work commitments/lack of time 22.2 31.9 0.222
Lack of storage facilities and food preparation at the workplace 5.6 9.2 0.436
Lack of healthy options for breakfast, lunch and dinner 19.4 16.8 0.244
Special nutritional needs 0.9 1.7 0.707
This subject does not interest me/I never though this matter 4.6 3.4 0.466
Others 7.4 7.6 0.781 1 Differences with statistical significance.
Table 3. Perceived barriers for healthy eating at the workplace by age group.
Barriers for Healthier Eating Youngers (%) Olders (%) p-Value
Do not like healthy food 6.1 4.2 0.288
Price of healthy foods 5.3 10.5 0.308
Inability to prepare meals 11.4 7.4 0.104
Lack of knowledge about nutrition/healthy eating 9.8 6.3 0.131
Distance to food stores 3.8 3.2 0.561
Work commitments/lack of time 28.0 26.3 0.101
Lack of storage facilities and food preparation at the workplace 7.6 7.4 0.577
Lack of healthy options for breakfast, lunch and dinner 17.4 18.9 0.575
Special nutritional needs 0.8 2.1 0.499
This subject does not interest me/I never though this matter 1.5 7.4 0.058
Others 8.3 6.3 0.279
In comparing academic with non-academic respondents, significant differences for
two distinct barriers were found. It seems that food price is a prohibitive factor for having
0
10
20
30
40
50
60
Work
commitments
/ lack of time
Lack of
healthy
options for
breakfast,
lunch and
dinner
Inability to
prepare
meals
Lack of
knowledge
about
nutrition /
healthy
eating
Price of
healthy foods
Lack of
storage
facilities and
food
preparation
at the
workplace
Other Do not like
healthy food
This subject
does not
interest me / I
never
thought this
matter
Distance to
buying local
food
Special
nutritional
needs
%
Figure 4. Frequency of perceived barriers for healthy eating at the workplace.
Table 2. Perceived barriers for healthy eating at the workplace by gender.
Barriers for Healthier Eating Male (%) Female (%) p-Value
Do not like healthy food 3.7 6.7 0.449Price of healthy foods 8.3 6.7 0.420
Inability to prepare meals 10.2 9.2 0.526Lack of knowledge about nutrition/healthy eating 12.0 5.0 0.019 1
Distance to food stores 5.6 1.7 0.067Work commitments/lack of time 22.2 31.9 0.222
Lack of storage facilities and food preparation at the workplace 5.6 9.2 0.436Lack of healthy options for breakfast, lunch and dinner 19.4 16.8 0.244
Special nutritional needs 0.9 1.7 0.707This subject does not interest me/I never though this matter 4.6 3.4 0.466
Others 7.4 7.6 0.7811 Differences with statistical significance.
Table 3. Perceived barriers for healthy eating at the workplace by age group.
Barriers for Healthier Eating Youngers (%) Olders (%) p-Value
Do not like healthy food 6.1 4.2 0.288Price of healthy foods 5.3 10.5 0.308
Inability to prepare meals 11.4 7.4 0.104Lack of knowledge about nutrition/healthy eating 9.8 6.3 0.131
Distance to food stores 3.8 3.2 0.561Work commitments/lack of time 28.0 26.3 0.101
Lack of storage facilities and food preparation at the workplace 7.6 7.4 0.577Lack of healthy options for breakfast, lunch and dinner 17.4 18.9 0.575
Special nutritional needs 0.8 2.1 0.499This subject does not interest me/I never though this matter 1.5 7.4 0.058
Others 8.3 6.3 0.279
In comparing academic with non-academic respondents, significant differences fortwo distinct barriers were found. It seems that food price is a prohibitive factor for havinga healthy diet, essentially for non-academic staff in relation to other individuals (p = 0.004).Lack of healthy options for breakfast, lunch and dinner were identified by academic staffmore frequently than by non-academics (p = 0.012) (Table 4). Concerning other parametersassessed, ranges of age and marital status did not seem to influence the barriers for healthiereating at the workplace.

Foods 2021, 10, 695 8 of 13
Table 4. Perceived barriers for healthy eating at the workplace by professional occupation.
Barriers for Healthier Eating Academics (%) Non-Academics (%) p-Value
Do not like healthy food 3.5 6.6 0.406Price of healthy foods 1.2 10.9 0.004 1
Inability to prepare meals 7.1 10.9 0.307Lack of knowledge about nutrition/healthy eating 5.9 10.2 0.314
Distance to food stores 5.9 2.2 0.147Work commitments/lack of time 32.9 24.8 0.054
Lack of storage facilities and food preparation at the workplace 5.9 6.6 0.826Lack of healthy options for breakfast, lunch and dinner 25.9 14.6 0.012 1
Special nutritional needs 1.2 1.5 0.856This subject does not interest me/I never though this matter 5.9 2.9 0.272
Others 4.7 8.8 0.2361 Differences with statistical significance.
4. Discussion
Major determinants for choosing a place to have lunch were related to “meal quality”,“price”, and “location”. Working at higher education institutes determines an increasedburden of work and responsibilities, most of them extra classes [50], which contributesto work commitments and lack of time to take breaks, prepare, and have healthy meals.Additionally, sensory aspects of food consumption can influence the choice of lunch place.Sensory aspects are usually observed as determinant of food consumption. The cost ofmeals is more relevant for younger respondents as observed in a previous study [51].
Younger, non-teaching female employees with lower academic qualifications are thegroup who most frequently bring lunch from home. Bringing food from home is likelyassociated with higher level cooking skills—more common in the female gender [25].Additionally, this group also has lower disposable income and hence, bringing food fromhome allows for more savings.
Lunch location is also determined by other factors. According to other authors, mealsoutside the home often have a higher energy value and a poorer nutritional profile [27].Indeed, of the women who bring lunch from home, some do so to ensure a healthier lunch.
On the other hand, teachers with PhD or Post-Doc Diplomas mentioned waiting timeas a key decision driver. This is likely associated with a higher level of responsibility, strongfocus on work, and consequently, shorter lunch breaks.
In this study, food availability was identified more frequently by academic staff thanother respondents. On the other hand, non-academics reported a higher concern, andidentified the lack of storage facilities and food preparation areas at the workplace as a bar-rier. This parallelism on identified barriers could indicate that academics more frequentlyuse university cafeterias, and non-academics bring food from home and use storage andpreparation facilities, when available at the workplace, more frequently. These resultsare in line with the identification of a third barrier, significantly the difference betweenindividuals with different professional occupations. Effectively, non-academics identifiedthe price of healthy food options as a barrier for healthy eating more frequently thanacademics. Differences in salary between them could explain this result. The perception ofthese factors could influence the choice of place for having meals—cafeterias, or storageand preparation facilities.
Attending to the wide availability of information about healthy eating, the numberof respondents that identify the lack of knowledge about nutrition or healthy eating as abarrier is unexpected. Men identified this barrier more frequently than women. In addition,Yahia observed that men identified the barrier, lack of knowledge about nutrition or healthyeating, more frequently than women, among university students [52].
Universities are a captive environment where staff is restricted to a campus whereoffices, classes and study facilities are located, and where there is limited choice for foodprovision [53,54]. The workplace can be a strong determinant of food consumption behavioras it provides convenient access to healthy and/or unhealthy food choices. In a population
Foods 2021, 10, 695 9 of 13
experiencing time constraints having good food choices at the workplace provides an easyoption for refueling [37,48]. Food available at, or near workplaces, is more convenient,low in cost, and sells well [21]. Similar findings were reported by Pinhão et al. in arepresentative sample of the Portuguese population, where “taste” was the most selectedfactor, followed by “price” and “trying to eat healthy” [29] as determinants of food choice.
Our results are in accordance with those found by Kjøllesdal in Norwegian adults,showing that people with higher educational levels and in higher income groups ate instaff canteens more frequently than others [55].
According to previous literature, access to healthy foods in the workplace is oftenlimited, compared with an abundance of unhealthy foods present in workplace canteens,onsite shops, and vending machines [46,48,56,57]. According to literature, workers desire agreater variety of healthy and fresh foods compared with the current offerings [46,57–59],which is identified in this research as a barrier for healthy eating. Healthy options alsodetermined workers food choice. Interestingly, some employees felt that food servedin the canteen is not balanced with their nutritional needs. The factors that influencefood consumption of employees related to healthy options, nutritional value of foods,meal quality, and health and well-being, may be associated with employees’ perception ofcanteen’ meals being too high in calories and tailored for physically demanding roles [46].
However, employees also reported that the lunch provided by the work canteen is theonly opportunity to have a “proper meal” each day [58]. In the same way, the workplacecould be a provider of healthy foods (such as vegetables and fruit) and increase intakeof those foods [59,60]. Availability at the workplace is a determinant for food choice anda barrier for healthy eating, the reasons why the availability of facilities where food canbe prepared was considered to be an important facilitator of healthy eating [46,59]. Onthe other hand, the higher cost of healthy options compared with unhealthy options wasidentified as one of the most significant barriers to healthy eating [46].
The determinants that most influence food choice at the workplace in this study arerelated to the individual. The identification of knowledge about the health benefits of foodis commonly observed, followed by biological determinants such as taste, smell, or thetexture of the food, and finally, of an environmental nature related to the quality-price ratioof the food.
Food choices of men, with higher academic qualifications and belonging to the teach-ing staff, are determined by food taste and texture, and by availability and price-qualityrelationship. Additionally, they value the potential benefits of food, and their food choiceis determined by them. The influence that foods can have on well-being is also important,such as choosing foods that help maintain alertness and support emotional health.
Regardless of gender, among professors with higher academic qualifications, foodchoice is determined by cultural, religious or ethnic beliefs, political ideologies, the clarityand environmental responsibility of packaging products, and medical advice regardingthe intake of certain foods. On the other hand, among individuals with lower academicqualifications, these determinants have a reduced importance.
In fact, food choice is a complex result of preferences for sensory characteristics,combined with the influence of non-sensory factors, including food-related expectationsand attitudes, health claims, price, ethical concerns and mood, as already reported by otherauthors [47,61]. Regarding these concerns, the availability of healthy food options at theworkplace, namely in cafeterias, is very important. On the other hand, the inability toprepare meals was also identified as a barrier for healthy eating, pointing to a need toimprove cooking skills, for example, by the inclusion of this topic in the school curriculum.
Only a small proportion of respondents perceived barriers for adoption of a healthydiet. Other authors observed similar results [25,26,62]. Healthier environments shouldbe promoted to facilitate healthy eating and fighting chronic diseases such as obesity [63].However, of all variables tested, only the price and lack of knowledge about nutri-tion/healthy eating showed significant differences between respondents. Some studies
Foods 2021, 10, 695 10 of 13
have shown that people that identify a higher number of barriers are those that followunhealthy eating habits more frequently [24,63].
The barriers identified in this research are related only to individuals that are consid-ered as having unhealthy eating at the workplace. Future works should also include thosewho are considered as having healthy habits.
Strategies to promote healthier food habits aim at reducing barriers to access healthyoptions and increasing opportunities for employees to make healthier food choices. Imple-mentation includes provision of healthier options, improved accessibility, and establish-ment of mandatory policies to provide healthy options or restrict less healthy offerings atthe workplace [16].
Some limitations were identified in this study. Lack of information concerning incomethat impair conclusions potentially explained by this. Another limitation was related tothe usage of different tools to access food determinants for choosing the place to havelunch, and the determinants of food consumption in general. However, the fact that thetool used to access the determinants for choosing the place to have lunch was used inanother Portuguese study with a national representative sample, motivates the researchersto that procedure. The use of a convenience sample determined a higher proportion ofnon-academic staff as they were more available for data collection.
5. Conclusions
The most important determinants identified by respondents choosing the place forhaving meals were “meal quality”, “price”, and “location/distance”. For women, theavailability of “healthy food options” was more important than for men.
Our results seem to demonstrate that gender, marital status, academic degree and mainprofessional occupation, are related to the choice of the place for having lunch. Differenceswere found between gender, marital status and age ranges, in terms of factors-affectingfood choice at the workplace. A higher concern with nutritional value of food was observedfor younger respondents, individuals living alone, and women.
Gender and academic degree are relevant in food choice. Factors influencing individ-uals with a low academic degree were previous food habits, price, and quality of meals, indetermining the choice of place for having lunch at restaurants or at home. On the otherhand, women with a high academic degree prefer to bring meals from home as they findthem healthier.
Related to determinants of food choice in general, MCA analysis reported the majordifferences related to academic degree and main occupation, with lower academic degreeindividuals being not influenced by external determinants, since their food choice wasmainly influenced by previous food habits. Higher academic degree employees in generalare influenced by nutritional value of food and its relationship to health and well-being,packaging, and health professional advice, the reason why strategies to promote healthyeating in these scenarios are necessarily different. If we could design a healthy eatingprogram based on information about the nutrition value of food and health, namelythrough packaging, our results would show clearly that this option could be adequate forteachers and other employees with high academic degrees, but not for others that probablyneed personal counseling to change previous food habits.
This work also identified lack of time, work commitments, and lack of healthy optionsfor having meals at the workplace as barriers for healthy eating. Educational level, pro-fessional occupation, and gender were the socio-economic characteristics evaluated thatinfluenced the perception of barriers for healthy eating.
These results may contribute to a better definition of strategies to promote healthyeating in these scenarios and show that different strategies are needed for different targetgroups to reduce barriers once they are perceived differently by individuals.
Author Contributions: Conceptualization, J.P.M.L. and A.R.; formal analysis, S.A.C. and T.R.S.B.;investigation, J.P.M.L. and A.R.; writing—original draft preparation, J.P.M.L.; writing—review andediting, A.R. All authors have read and agreed to the published version of the manuscript.
Foods 2021, 10, 695 11 of 13
Funding: This research was supported by national funds through FCT—Foundation for Science andTechnology within the scope of UIDB/05748/2020 and UIDP/05748/2020.
Institutional Review Board Statement: The study was conducted according to the guidelines of theDeclaration of Helsinki, and approved by the Ethical Commission of the University of Porto (protocolcode CEFADE 25.2014 at 22/10/2014).
Informed Consent Statement: Informed consent was obtained from all subjects involved in the study.
Data Availability Statement: The work was a part of João Lima’s doctoral thesis.
Acknowledgments: Authors thank Graça Neto, English Professional, for English grammar andstructure revision of the manuscript.
Conflicts of Interest: The authors declare no conflict of interest.
References1. Popkin, B.; Adair, L.S.; Ng, S.W. Now and then: The global nutrition transition: The pandemic of obesity in developing countries.
Nutr. Rev. 2012, 70, 3–21. [CrossRef]2. WHO. Diet, Nutrition and the Prevention of Chronic Diseases: Report of a Joint WHO/FAO Expert Consultation; WHO: Geneva,
Switzerland, 2003.3. Loureiro, I. A importância da educação alimentar na escola. In Promoção da Saúde: Modelos e Práticas de Intervenção nos Âmbitos da
Actividade Física, Nutrição e Tabagismo; Edições FMH: Lisboa, Portugal, 2000; pp. 57–84.4. WHO. Obesity: Preventing and Managing the Global Epidemic; World Health Organization: Geneva, Switzerland, 2004.5. Ding, D.; Lawson, K.D.; Kolbe-Alexander, T.L.; Finkelstein, E.A.; Katzmarzyk, P.T.; Van Mechelen, W.; Pratt, M. The economic
burden of physical inactivity: A global analysis of major non-communicable diseases. Lancet 2016, 388, 1311–1324. [CrossRef]6. Dohrn, M.; Kwak, L.; Oja, P.; Sjöström, M.; Hagströmer, M. Replacing sedentary time with physical activity: A 15-year follow-up
of mortality in a national cohort. Clin. Epidemiol. 2018, 10, 179. [CrossRef] [PubMed]7. Burton, W.N.; Conti, D.J.; Chen, C.Y.; Schultz, A.B.; Edington, D.W. The role of health risk factors and disease on worker
productivity. J. Occup. Environ. Med. 1999, 41, 863–877. [CrossRef]8. Schultz, A.B.; Chen, C.Y.; Edington, D.W. The cost and impact of health conditions on presenteeism to employers: A review of the
literature. Pharmacoeconomics 2009, 27, 365–378. [CrossRef]9. Schmier, J.K.; Jones, M.L.; Halpern, M.T. Cost of obesity in the workplace. Scand. J. Work Environ. Health 2006, 32, 5–11. [CrossRef]10. Robroek, S.J.; van den Berg, T.I.; Plat, J.F.; Burdorf, A. The role of obesity and lifestyle behaviours in a productive workforce.
Occup. Environ. Med. 2011, 68, 134–139. [CrossRef]11. Proper, K.I.; van den Heuvel, S.G.; De Vroome, E.M.; Hildebrandt, V.H.; Vander Beek, A.J. Dose-response relation between
physical activity and sick leave. Br. J. Sports Med. 2006, 40, 173–178. [CrossRef]12. van Duijvenbode, D.C.; Hoozemans, M.J.; van Poppel, M.N.; Proper, K.I. The relationship between overweight and obesity, and
sick leave: A system-atic review. Int. J. Obes. 2009, 33, 807–816. [CrossRef]13. Alavinia, S.M.; Molenaar, D.; Burdorf, A. Productivity loss in the work-force: Associations with health, work demands, and
individual characteristics. Am. J. Ind. Med. 2009, 52, 49–56. [CrossRef] [PubMed]14. Williden, M.; Schofıeld, G.; Duncan, S. Establishing links between health and productivity in the New Zealand workforce. J.
Occup. Environ. Med. 2012, 54, 545–550. [CrossRef]15. Dishman, R.K.; Oldenburg, B.; O’Neal, H.; Shephard, R.J. Worksite physical activity interventions. Am. J. Prev. Med. 1998, 15,
344–361. [CrossRef]16. Hutchinson, A.D.; Wilson, C. Improving nutrition and physical activity in the workplace: A meta-analysis of intervention studies.
Health Promot. Int. 2012, 27, 238–249. [CrossRef]17. Grimani, A.; Aboagye, E.; Kwak, L. The effectiveness of workplace nutrition and physical activity interventions in improving
productivity, work performance and workability: A systematic review. BMC Public Health 2019, 19, 1676. [CrossRef]18. Smedslund, G.; Fisher, K.; Boles, S.; Lichtenstein, E. The effectiveness of workplace smoking cessation programmes: A meta-
analysis of recent studies. Tob Control. 2004, 13, 197–204. [CrossRef]19. Allan, J.; Querstret, D.; Banas, K.; de Bruin, M. Environmental interventions for altering eating behaviours of employees in the
workplace: A systematic review. Obes. Rev. 2017, 18, 214–226. [CrossRef]20. Nicholls, R.; Perry, L.; Duffield, C.; Gallagher, R.; Pierce, H. Barriers and facilitators to healthy eating for nurses in the workplace:
An integrative review. J. Adv. Nurs. 2017, 73, 1051–1065. [CrossRef] [PubMed]21. Contento, I.R. Overview of Determinants of Food Choice and Dietary Change: Implications for Nutrition Education; Jones & Bartlett
Learning, LLC: Burlington, MA, USA, 2011.22. Rothschild, M.L. Carrots, sticks, and promises: A conceptual framework for the management of public health and social issue
behaviors. J. Mark. 1999, 63, 24–37. [CrossRef]
Foods 2021, 10, 695 12 of 13
23. Bos, C.; van der Lans, I.A.; van Rijnsoever, F.J.; van Trijp, H.C. Heterogeneity in barriers regarding the motivation, the opportunityand the ability to choose low-calorie snack foods and beverages: Associations with real-life choices. Public Health Nutr. 2016, 19,1584–1597. [CrossRef]
24. Lara, J.; McCrum, L.-A.; Mathers, J.C. Association of Mediterranean diet and other health behaviours with barriers to healthyeating and perceived health among British adults of retirement age. Maturitas 2014, 79, 292–298. [CrossRef]
25. Kearney, J.M.; McElhone, S. Perceived barriers in trying to eat healthier—Results of a pan-EU consumer attitudinal survey. Br. J.Nutr. 2007, 81, S133–S137. [CrossRef]
26. de Mestral, C.; Stringhini, S.; Marques-Vidal, P. Barriers to healthy eating in Switzerland: A nationwide study. Clin. Nutr. 2016,35, 1490–1498. [CrossRef] [PubMed]
27. Orfanos, P.; Naska, A.; Rodrigues, S.; Lopes, C.; Freisling, H.; Rohrmann, S.; Sieri, S.; Elmadfa, I.; Lachat, C.; Gedrich, K.; et al.Eating at restaurants, at work or at home. Is there a difference? A study among adults of 11 European countries in the context ofthe HECTOR project. Eur. J. Clin. Nutr. 2017, 71, 407–419. [CrossRef]
28. Poínhos, R.; Franchini, B.; Afonso, C.; Correia, F.; Teixeira, V.H.; Moreira, P.; Durão, C.; Pinho, O.; Silva, D.; Lima Reis, J.P.; et al.Alimentação e estilos de vida da população portuguesa: Metodologia e resultados preliminares. Alim. Hum. 2009, 15, 43–60.
29. Poínhos, R.; Franchini, B.; Afonso, C.; Correia, F.; de Almeida, M.D.V. The SPCNA Directorate. Factors perceived by Portugueseadults as influent in food consumption (abstract). Public Health Nutr. 2010, 13, 270.
30. Faugier, J.; Lancaster, J.; Pickles, D.; Dobson, K. Barriers to healthy eating in the nursing profession: Part 1. Nurs. Stand. 2001, 15,33–36. [PubMed]
31. Faugier, J.; Lancaster, J.; Pickles, D.; Dobson, K. Barriers to healthy eating in the nursing profession: Part 2. Nurs. Stand. 2001, 15,33–35.
32. Sorensen, G.; Linnan, L.; Hunt, M. Worksite-based research and initiatives to increase fruit and vegetable consumption. Prev. Med.2004, 39, S94–S100. [CrossRef]
33. Holdsworth, M.; Haslam, C. A review of point of choice nutrition labelling schemes in the workplace, public eating places anduniversities. J. Hum. Nutr. Diet. 1998, 11, 423–445. [CrossRef]
34. Devine, C.; Connors, M.; Sobal, J.; Bisogni, C. Sandwiching it in: Spillover of work onto food choices and family roles in low andmoderate income urban households. Soc. Sci. Med. 2003, 56, 617–630. [CrossRef]
35. Devine, C.; Nelson, J.; Chin, N.; Dozier, A.; Fernandez, I. “Pizza is cheaper than salad”: Assessing workers’ views for anenvironmental food intervention. Obesity 2007, 15, 57S–68S. [CrossRef] [PubMed]
36. Wanjek, C. Food at Work. Workplace Solutions for Malnutrition and Chronic Disease; International Labour Office: Geneva, Switzerland,2005.
37. Jabs, J.; Devine, C.M. Time scarcity and food choices: An overview. Appetite 2006, 47, 196–204. [CrossRef] [PubMed]38. Steenhuis, I.; van Assema, P.; Reubsaet, A.; Kok, G. Process evaluation of two environmental nutrition programmes and an
educational nutrition programme conducted at supermarkets and worksite cafeterias in the Netherlands. J. Hum. Nutr. Diet.2004, 17, 107–115. [CrossRef]
39. Hilger, J.; Loerbroks, A.; Diehl, K. Eating behaviour of university students in Germany: Dietary intake, barriers to healthy eatingand changes in eating behaviour since the time of matriculation. Appetite 2017, 109, 100–107. [CrossRef]
40. Munt, A.E.; Partridge, S.R.; Allman-Farinelli, M. The barriers and enablers of healthy eating among young adults: A missingpiece of the obesity puzzle: A scoping review. Obes Rev. 2017, 18, 1–17. [CrossRef]
41. Universidade do Porto. Recursos Humanos da U. Porto; Reitoria da Universidade do Porto: Porto, Portugal, 2013.42. Steptoe, A.; Pollard, T.M.; Wardle, J. Development of a Measure of the Motives Underlying the Selection of Food: The Food
Choice Questionnaire. Appetite 1995, 25, 267–284. [CrossRef]43. Cardoso, P.; Vale, S.P. Avaliação de critérios de escolha alimentar—Uma aplicação do Food Choice Questionnaire. Rev. Fac. Ciênc.
Saúde 2010, 7, 62–72.44. Pridgeon, A.; Whitehead, K. A qualitative study to investigate the drivers and barriers to healthy eating in two public sector
workplaces. J. Hum. Nutr. Diet. 2013, 26, 85–95. [CrossRef]45. Larson, N.; Story, M. A Review of Environmental Influences on Food Choices. Ann. Behav. Med. 2009, 38, S56–S73. [CrossRef]46. Blanck, H.M.; Yaroch, A.L.; Atienza, A.A.; Yi, S.L.; Zhang, J.; Masse, L.C. Factors Influencing Lunchtime Food Choices among
Working Americans. Health Educ. Behav. 2009, 36, 289–301. [CrossRef]47. Prescott, J.; Young, O.; O’Neil, L.; Yau, N.J.N.; Stevens, R. Motives for food choice: A comparison of consumers from Japan,
Taiwan, Malaysia and New Zealand. Food Qual. Prefer. 2002, 13, 489–495. [CrossRef]48. Lima, J.P.M.; Costa, S.; Rocha, A. How do workers eat at the workplace? Nutr. Food Sci. 2018, 48, 194–205. [CrossRef]49. Lima, J.P.M.; Costa, S.A.; Rocha, A. Nutritional intake of university employees’. Br. Food J. 2018, 120, 483–489. [CrossRef]50. Navarro, M.; Más, M. Job stress and burnout syndrome at university: A descriptive analysis of the current situation and review
of the principal lines of research. Annu. Clin. Health Psichol. 2010, 6, 67–72.51. Blanck, H.; Yaroch, A.; Atienza, A.; Yi, S.; Zhang, J.; Masse, L. Factors influencing lunchtime food choices among working
Americans. Soc. Pub. Health Educ. 2007, 36, 289–301. [CrossRef] [PubMed]52. Yahia, N.; Wang, D.; Rapley, M.; Dey, R. Assessment of weight status, dietary habits and beliefs, physical activity, and nutritional
knowledge among university students. Perspect. Public Health 2015, 136, 231–244. [CrossRef] [PubMed]
Foods 2021, 10, 695 13 of 13
53. Bevan, A.; Hartwell, H.; Hemingway, A.; Proença, R. An exploration of the fruit and vegetable “foodscape” in a university settingfor staff A preliminary study. Br. Food J. 2015, 117, 37–49. [CrossRef]
54. Mikkelsen, B. Images of foodscapes: Introduction to foodscapes studies and their application in the study of healthy eatingout-of-home environments. R. Soc. Public Health 2011, 131, 209–216. [CrossRef]
55. Kjøllesdal, M.R.; Holmboe-Ottesen, G.; Wandel, M. Frequent use of staff canteens is associated with unhealthy dietary habits andobesity in a Norwegian adult population. Public Health Nutr. 2011, 14, 133–141. [CrossRef] [PubMed]
56. Baskin, E.; Gorlin, M.; Chance, Z.; Novemsky, N.; Dhar, R.; Huskey, K.; Hatzis, M. Proximity of snacks to beverages increasesfood consumption in the workplace: A field study. Appetite 2016, 103, 244–248. [CrossRef]
57. Freedman, M.R.; Rubinstein, R.J. Obesity and food choices among faculty and staff at a large urban university. J. Am. Coll. Health2010, 59, 205–210. [CrossRef] [PubMed]
58. Payne, N.; Jones, F.; Harris, P.R. Employees’ perceptions of the impact of work on health behaviours. J. Health Psychol. 2013, 18,887–899. [CrossRef]
59. Lake, A.A.; Smith, S.A.; Bryant, C.E.; Alinia, S.; Brandt, K.; Seal, C.J.; Tetens, I. Exploring the dynamics of a free fruit at workintervention. BMC Public Health 2016, 16, 839. [CrossRef] [PubMed]
60. Thorsen, A.V.; Lassen, A.D.; Tetens, I.; Hels, O.; Mikkelsen, B.E. Long-term sustainability of a worksite canteen intervention ofserving more fruit and vegetables. Public Health Nutr. 2010, 13, 1647–1652. [CrossRef] [PubMed]
61. The Determinants of Food Choice. European Food Information Council. 2005. Available online: https://www.eufic.org/en/healthy-living/article/the-determinants-of-food-choice (accessed on 6 June 2006).
62. Stankevitz, K.; Dement, J.; Schoenfisch, A.; Joyner, J.; Clancy, S.M.; Stroo, M.; Østbye, T. Perceived Barriers to Healthy Eating andPhysical Activity among Participants in a Workplace Obesity Intervention. J. Occup. Environ. Med. 2017, 59, 746–751. [CrossRef][PubMed]
63. Mackenbach, J.D.; Lakerveld, J.; Van Lenthe, F.J.; Teixeira, P.J.; Compernolle, S.; De Bourdeaudhuij, I.; Charreire, H.; Oppert, J.-M.;Bárdos, H.; Glonti, K.; et al. Interactions of individual perceived barriers and neighbourhood destinations with obesity-relatedbehaviours in Europe. Obes. Rev. 2016, 17, 68–80. [CrossRef] [PubMed]
Related Documents