1 Food and Beverage Manufacturing Subsectors in Lane County, Oregon: Candidates for Economic Growth and Development? Janai Kessi [email protected] Michael Thacker [email protected] Faculty Advisor: Professor Joe Stone Department of Economics University of Oregon Eugene, OR Community Partners: Ben Sappington Director: Regional Prosperity Initiative Eugene Area Chamber of Commerce Sarah Mizejewski Community and Economic Development Coordinator Lane County Department of Community and Economic Development

Welcome message from author
This document is posted to help you gain knowledge. Please leave a comment to let me know what you think about it! Share it to your friends and learn new things together.
Transcript
1
Food and Beverage Manufacturing
Subsectors in Lane County, Oregon:
Candidates for Economic Growth and
Development?
Janai Kessi [email protected]
Michael Thacker [email protected]
Faculty Advisor: Professor Joe Stone
Department of Economics University of Oregon
Eugene, OR
Community Partners: Ben Sappington
Director: Regional Prosperity Initiative Eugene Area Chamber of Commerce
Sarah Mizejewski Community and Economic Development Coordinator
Lane County Department of Community and Economic Development
2
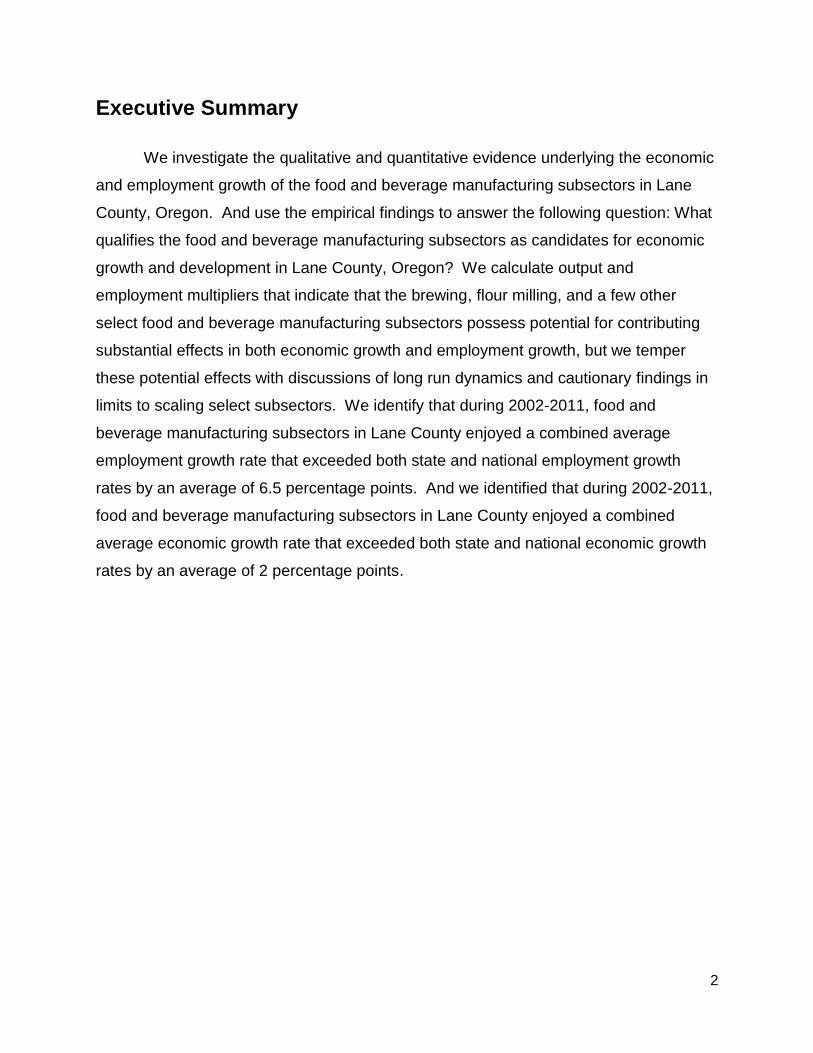
Executive Summary
We investigate the qualitative and quantitative evidence underlying the economic
and employment growth of the food and beverage manufacturing subsectors in Lane
County, Oregon. And use the empirical findings to answer the following question: What
qualifies the food and beverage manufacturing subsectors as candidates for economic
growth and development in Lane County, Oregon? We calculate output and
employment multipliers that indicate that the brewing, flour milling, and a few other
select food and beverage manufacturing subsectors possess potential for contributing
substantial effects in both economic growth and employment growth, but we temper
these potential effects with discussions of long run dynamics and cautionary findings in
limits to scaling select subsectors. We identify that during 2002-2011, food and
beverage manufacturing subsectors in Lane County enjoyed a combined average
employment growth rate that exceeded both state and national employment growth
rates by an average of 6.5 percentage points. And we identified that during 2002-2011,
food and beverage manufacturing subsectors in Lane County enjoyed a combined
average economic growth rate that exceeded both state and national economic growth
rates by an average of 2 percentage points.
3
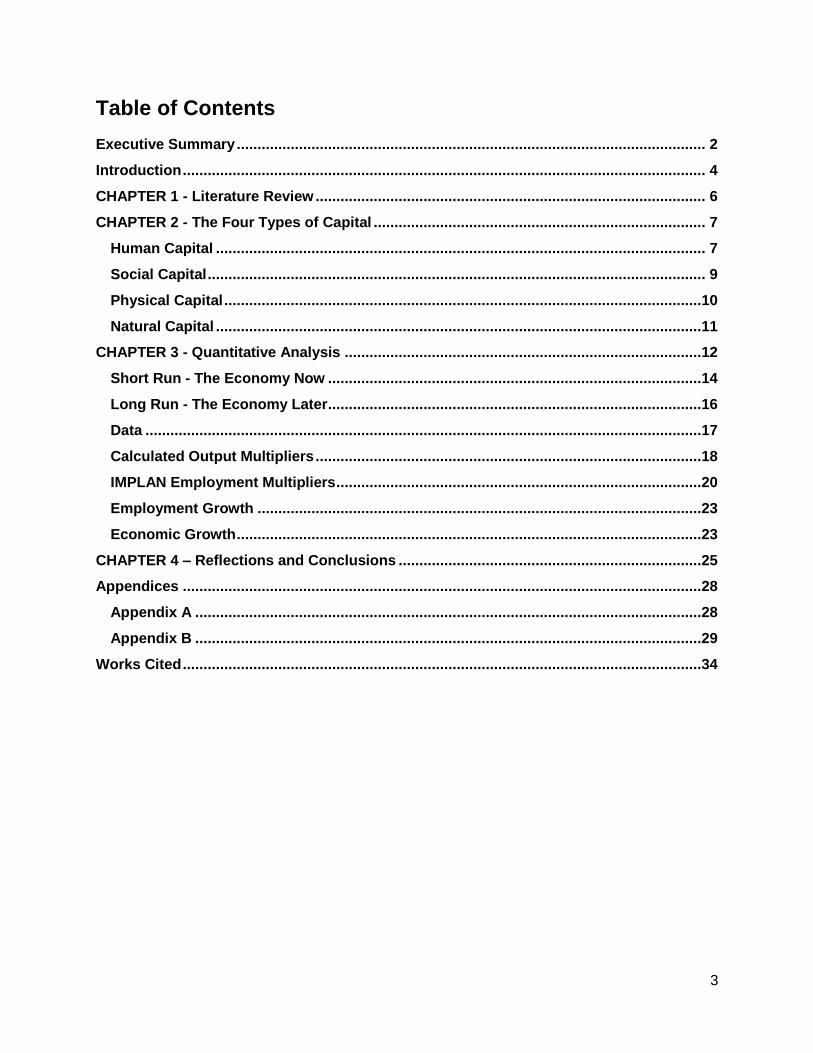
Table of Contents
Executive Summary ................................................................................................................. 2
Introduction .............................................................................................................................. 4
CHAPTER 1 - Literature Review .............................................................................................. 6
CHAPTER 2 - The Four Types of Capital ................................................................................ 7
Human Capital ...................................................................................................................... 7
Social Capital ........................................................................................................................ 9
Physical Capital ...................................................................................................................10
Natural Capital .....................................................................................................................11
CHAPTER 3 - Quantitative Analysis ......................................................................................12
Short Run - The Economy Now ..........................................................................................14
Long Run - The Economy Later ..........................................................................................16
Data ......................................................................................................................................17
Calculated Output Multipliers .............................................................................................18
IMPLAN Employment Multipliers ........................................................................................20
Employment Growth ...........................................................................................................23
Economic Growth ................................................................................................................23
CHAPTER 4 – Reflections and Conclusions .........................................................................25
Appendices .............................................................................................................................28
Appendix A ..........................................................................................................................28
Appendix B ..........................................................................................................................29
Works Cited .............................................................................................................................34

4
Introduction
During 2007 to 2009, Lane County’s manufacturing sector lost 7,345 jobs or
36.9%, while the food and beverage manufacturing subsectors added a combined 189
jobs, or 11%.1 This growth in the food and beverage subsectors caught the attention of
our clients, the Eugene Area Chamber of Commerce and the Lane County Department
of Community and Economic Development, and inspired the question this paper
investigates. What qualifies the food and beverage subsectors as candidates for
economic growth and development in Lane County, Oregon? This question interests
our clients given they operate with unique, yet parallel missions, both focused on
promoting a healthy economy and ultimately a healthy community.
For clarity these definitions help:
Food manufacturing is the transformation of livestock and agricultural
products into products for intermediate or final consumption. Distinguished by
raw materials processed into food products.2
Beverage manufacturing is the production of nonalcoholic beverages,
alcoholic beverages through the fermentation process, and distilled alcoholic
beverages.3
Economic growth is the increase in a region’s average wage or per-capita
income.4
Employment growth is the increase in a region’s total workforce.5
Economic development is the qualitative change and restructuring in a
region's economy in connection with technological and social progress.6
Local is the administrative region of Lane County.
Knowing the context in which our research question is asked helps us focus our
analysis and interpret our results. The context is Lane County. The March 2012
estimated 8.8 percent unemployment rate translates to roughly 15.8 thousand workers
1 (Rooney, 2010)
2 (Oregon Employment Department, 2011)
3 (Oregon Employment Department, 2011)
4 (O'Sullivan, 2009)
5 (O'Sullivan, 2009)
6 (Soubbotina, Beyond Economic Growth, 2004)
5
seeking employment.1 In 2011 the average annual wage, considering all private
industry sectors, was $35,335.2 For the same year the food manufacturing subsector
enjoyed an average annual wage of $37,358.3 In 2011 manufacturing accounted for
11% (12,000 jobs) of total private industry employment and the food and beverage
manufacturing subsectors account for 15.6% (1,867 jobs).4
These contextual, economic facts are useless to our investigation without linking
them to systematic, structured reasoning. Our approach is to go back to the basics. In
a recent op-ed commenting on Lane County’s economy now and the potential for
healthy growth, Bryce Ward, Philip Taylor, and Ed Whitelaw state that economies are
built on four forms of capital: human capital (workers and their education and skills),
physical capital (private and public machines, buildings, roads, water and sewer
systems), natural capital (mountains, valleys, rivers, coasts, grasslands, and forests),
and social capital (social networks and norms, laws and political systems).5 If these are
the building blocks for an economy, then a descriptive analysis of a subsector of that
economy should seek to gauge the quantity, quality, and reproducibility of the forms of
capital as indicators of potential growth. We intend to identify and describe each of
these four forms of capital as they exist in Lane County and as they relate to the food
and beverage manufacturing subsectors. And because rigorous economic analysis
demands both qualitative and quantitative components we will describe and analyze
quantitative economic data characteristic of food and beverage manufacturing in Lane
County, Oregon, and the United States.
1 (Bureau of Labor Statistics, 2012)
2 (Oregon Employment Department, 2011)
3 (Oregon Employment Department, 2011)
4 (Oregon Employment Department, 2011)
5 (Ward, Taylor, & Whitelaw, 2012)
6
CHAPTER 1 - Literature Review
Our research question involves estimating the economic impact of industry
subsectors on the economy of Lane County. One of the most common methods for
doing this is to use input-output models and regional multipliers. We used “A
Consumer’s Guide to Regional Economic Multipliers”1, by Coughlin and Mandelbaum to
guide our use and discussion of regional economic multipliers.
Multipliers are most commonly derived using an input-output model. An input-
output model is a mathematical representation of the economic connections between
defined sectors in the region at the time the data is gathered; for example, a model
representing the beverage manufacturing subsector would show that sales of printed
packaging materials in the region is dependent on beverage manufacturing sales, but
this relationship is fixed in the model. These relationships help to provide
understanding of the multiplier. The multiplier is primarily used to estimate total effect, or
impact, on the local economy associated with a given change. Coughlin and
Mandelbaum state, “an output multiplier of 1.66 indicates that if a firm’s sales in one
region to buyers in another region increase by $100 million, total sales throughout the
region are expected ultimately to increase by $166 million.”2 It is important to note that
a multiplier describes the relationships between industry sectors, but these are not
necessarily causal relationships. Therefore any estimated impact should be interpreted
with skepticism. This being said multipliers are valuable tools for estimating the
economic effects of some change in a region. They allow rather complex web of
economic linkages to be synthesized into a reasonably accurate description.
1 (Coughlin & Mandelbaum, 1991)
2 (Coughlin & Mandelbaum, 1991)
7
CHAPTER 2 - The Four Types of Capital
We analyze and describe select examples of the four types of capital as they
exist in Lane County and relate to the food and beverage manufacturing subsectors.
For clarity these definitions help:
Human capital is people’s innate abilities and talents plus their knowledge,
skills, and experience that make them economically productive.1
Social capital is the institutions, relationships, and norms that shape the quality
and quantity of a society's social interactions. And increasing evidence shows
that social cohesion is critical for societies to prosper economically and for
development to be sustainable. Social capital is not just the sum of the
institutions which underpin a society; it is the glue that holds them together.2
Physical capital the buildings (public and private), roads, bridges, water
systems, energy grids, machines, and technical equipment used in production,
plus it is the inventories of raw materials, half-finished goods, and finished
goods.3
Natural capital is the stock of natural resources, such as land, water, and
minerals, used for production. These can be either renewable or nonrenewable.4
Human Capital
There are 1,867 food and beverage manufacturing workers and 15,800
unemployed workers in Lane County. These employed and unemployed workers
represent human capital. Therefore a logical question is as follows: How talented,
skilled, and knowledgeable are these employed and unemployed workers? This is
difficult to answer. A rigorous assessment of the talents, skills, and knowledge of these
workers would require a comprehensive and expensive survey be conducted. Because
we have neither the time nor money for this comprehensive analysis, we have chosen
to use a proxy statistic.
1 (Soubbotina, 2004)
2 ( World Bank , 1998)
3 (Soubbotina, 2004)
4 (Soubbotina, 2004)
8
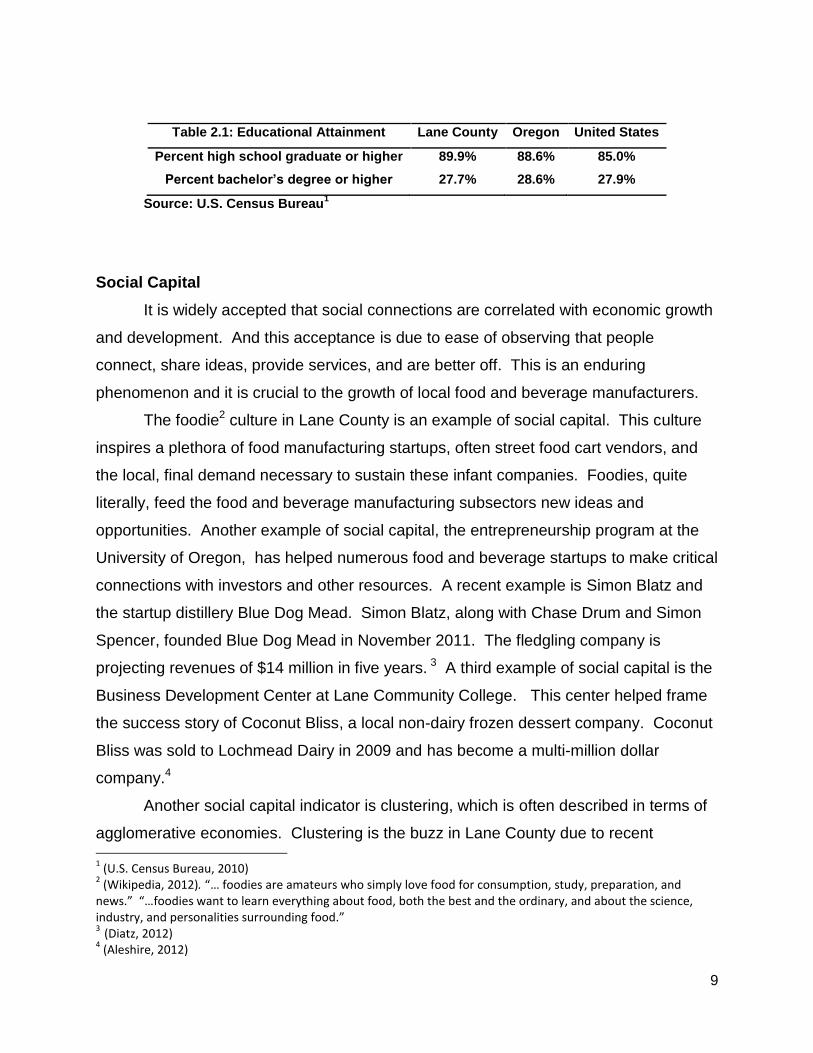
The most common proxy used for assessing a region’s human capital is to
determine the educational attainment of the workforce. Table 1.1 indicates that Lane
County trends above state and national percentages for high school graduation or
higher, but trends lower than state and national percentages for bachelor’s degree or
higher. A quick survey of educational requirements for food and beverage
manufacturing occupations reveals that on average, the educational requirements are
medium to long term on the job training and some post-secondary technical training.1
Because of these average educational requirements, it is safe to assume that high
school graduation rates and Lane Community College are two key contributors to the
quality and quantity of the region’s stock of human capital as it relates to food and
beverage manufacturing jobs. Because high school graduation rates trend higher than
state and national rates we assume this aspect of human capital is satisfactory in Lane
County. Lane Community College provides specialized technical training in mechanics,
welding, and manufacturing, training in culinary arts and hospitality, and foundational
courses in math, science, and writing. These educational opportunities are more
affordable than comparable opportunities at the University of Oregon and provide
technical skills and knowledge that are applicable to many job descriptions in the food
and beverage manufacturing subsectors.
But it is important to recognize that because of the smaller average size of the
local food and beverage manufacturing establishments, the range of educational
attainment and skills required is probably broader and more equally distributed. And the
number of positions within each establishment and the required skills for these positions
are not as heavily weighted in the lower skill categories as would be expected in larger
manufacturing firms. This need for more skilled labor is easily met by the University of
Oregon, which provides workers that have skills and knowledge in finance,
management, and science.
The take away from this brief description of human capital in Lane County is that
the quality and quantity of the stock of human capital is healthy. And the reproducibility
of this stock is strengthened by the region’s universities, community colleges, and high
schools.
1 (Oregon Employment Department, 2012)
9
Table 2.1: Educational Attainment Lane County Oregon United States
Percent high school graduate or higher 89.9% 88.6% 85.0%
Percent bachelor’s degree or higher 27.7% 28.6% 27.9%
Source: U.S. Census Bureau1
Social Capital
It is widely accepted that social connections are correlated with economic growth
and development. And this acceptance is due to ease of observing that people
connect, share ideas, provide services, and are better off. This is an enduring
phenomenon and it is crucial to the growth of local food and beverage manufacturers.
The foodie2 culture in Lane County is an example of social capital. This culture
inspires a plethora of food manufacturing startups, often street food cart vendors, and
the local, final demand necessary to sustain these infant companies. Foodies, quite
literally, feed the food and beverage manufacturing subsectors new ideas and
opportunities. Another example of social capital, the entrepreneurship program at the
University of Oregon, has helped numerous food and beverage startups to make critical
connections with investors and other resources. A recent example is Simon Blatz and
the startup distillery Blue Dog Mead. Simon Blatz, along with Chase Drum and Simon
Spencer, founded Blue Dog Mead in November 2011. The fledgling company is
projecting revenues of $14 million in five years. 3 A third example of social capital is the
Business Development Center at Lane Community College. This center helped frame
the success story of Coconut Bliss, a local non-dairy frozen dessert company. Coconut
Bliss was sold to Lochmead Dairy in 2009 and has become a multi-million dollar
company.4
Another social capital indicator is clustering, which is often described in terms of
agglomerative economies. Clustering is the buzz in Lane County due to recent 1 (U.S. Census Bureau, 2010)
2 (Wikipedia, 2012). “… foodies are amateurs who simply love food for consumption, study, preparation, and
news.” “…foodies want to learn everything about food, both the best and the ordinary, and about the science, industry, and personalities surrounding food.” 3 (Diatz, 2012) 4 (Aleshire, 2012)
10
expansion and location decisions of three large local breweries: Ninkasi, Oakshire, and
Hop Valley.1 It is often true that creativity thrives on proximity and proximity enables
knowledge spill overs and efficiency gains through shared inputs. But ascribing
agglomeration as the cause of clustering should be done reluctantly. The local brewing
industry purchases a large portion of their intermediate inputs outside of the region so
efficiency gains through sharing providers of intermediate inputs would most likely be
realized in the transportation of those inputs. And this efficiency gain would most likely
be small enough to not directly cause clustering. If the culture of local breweries is
collaborative, and there does seem to be willingness among local breweries to
collaborate and share knowledge, then there could be knowledge spillovers. But there
is no obvious or conclusive evidence to suggest this is occurring to any degree of
significance. Although there is limited evidence to suspect efficiency gains through
shared intermediate inputs and no obvious evidence of knowledge spillovers, there
could be gains to local brewery clustering through the facilitation of beer tourism.
Breweries that locate near each other could facilitate tourists visiting multiple breweries
within a convenient distance of each other. The important thing to consider is that
clustering does not always occur purposefully and it does not always provide significant
benefits to the clustering businesses. But in the case of local breweries in Lane County
there could be some advantages in developing proximity and encouraging tourism of
craft breweries.
Physical Capital
Lane County has advantages in physical capital in its bi-section by Interstate 5
(I5), water systems, and electrical grids, but some potential disadvantages in climate
controlled storage and food grade dry storage. Most, if not all, of the food and beverage
manufacturing businesses in Lane County rely on highway transport to move their
inputs and outputs. Thus, ready access to I5 (The main transportation route along the
west coast of the United States) is a locational advantage. EWEB, the electric and
water provider for Eugene supplies millions of gallons of water to the region’s brewing
industry and millions of kilo-watts of reliable electric power to beverage and food
1 (McDonald, 2012)
11
manufacturers. The reliable and consistent flow of clean water and energy is an
advantage for local food and beverage manufacturers. There is a single large cold
storage provider in Lane County. And this provider has supplied reliable cold storage
for intermediate inputs and finished goods over the last half century, but it is important
to note the differences between cold storage and climate control storage and that there
currently exists no climate control storage in Lane County. Cold storage controls only
temperature while climate control storage controls both temperature and humidity.
Climate control allows for lengthy storage of perishable raw inputs such as apples,
berries, and tomatoes. This lack of climate control storage is significant because some
food and beverage manufacturers require consistent flows of high quality raw inputs,
such as raw tomatoes, apples, blackberries, carrots, etc., and startups and small
manufacturers (the average demographic of Lane County food and beverage
manufacturers) could find the costs associated with purchasing their own climate control
storage, prohibitive. If the supply of cost competitive and affordable climate control
storage remains limited, the region’s capacity to attract, sustain, and retain scalable
food and beverage manufacturers could be restricted. The flour milling subsector is
experiencing resurgence in Lane County, but is facing a similar barrier to the climate
controlled storage issue, a limited supply of cost competitive and affordable, food grade-
dry storage for grains. It is important to note that based on business responses to the
Lane County Food Cluster Survey, these storage issues are perceived to be some of
the more critical choke points for scaling existing and prospective food manufacturing
businesses.
Natural Capital
Lane County has abundant natural capital. The Willamette and McKenzie Rivers
and 71,951 acres of farmed land1 are several of the most applicable and notable
examples. The McKenzie Watershed is the lifeblood of the craft brewing industry. It is
that simple, good water equals good beer which equals more final demand. Craft brews
flowing out of the region are recognized for their uniqueness and quality.2 Also given
the volume of farmable acres and the climate there is great potential for growing local
1 (Rooney, Agriculture in Lane County, 2012)
2 (DeBenedetti & Fletcher, 2010)
12
raw inputs for food and beverage manufacturing. These inputs could be fresh, cost
competitive (fewer transport miles), and provide a consistent supply. The obvious
caveat to this advantage is that in order for these crops to be produced there has to be
the benefits accrued by local farmers must outweigh the costs. And farmers will be
reluctant to produce crops for which there is limited demand. Local food and beverage
manufacturers could be a solution to minimizing these constraints.
The takeaway is that Lane County has large stock of high quality natural capital.
And because quality of life is inextricably linked to the quality of a region’s natural
capital, these amazing stocks of natural capital may be the strongest draw for attracting
and retaining skilled labor and entrepreneurs alike.
CHAPTER 3 - Quantitative Analysis
We analyze and describe the quantitative characteristics of the food and
beverage manufacturing subsectors in Lane County by gathering survey data from a
sample of local food and beverage manufacturers and analyzing regional economic and
13
employment growth data for the food and beverage manufacturing subsectors in Lane
County, Oregon and the United States. We use this data to inform our investigative
question: What qualifies the food and beverage manufacturing subsectors in Lane
County as candidates for economic growth and development?
See these definitions for clarity:
The short run is the amount of time during which at least one production input
is fixed.
The long run is the amount of time during which all production inputs are
variable.
The traded sector is business activity resulting in non-local sales; where non-
local are sales outside of Lane County.
A multiplier is a number that estimates the re-spending of revenue in the local
economy; it is a ratio of total change to initial change where total change
includes direct, indirect and induced effects of a given change and initial change
is that given change.
A direct effect is an initial change in the study area such as an increase of one
thousand dollars in traded sector sales or one hundred new jobs in traded sector
employment.
An indirect effect is a result of business purchases within the study area.
An induced effect is a result of household purchases within the study area.
An output multiplier estimates the total change in local sales resulting from a
measurable change in traded sector sales.
An employment multiplier estimates the total change in local employment
resulting from a measurable change in traded sector employment.
Our study focuses on food and beverage manufacturing businesses that sell a
percentage of goods and services outside of the local region. We refer to these as
traded sector businesses. This focus is logical for several reasons. First, traded sector
businesses have usually demonstrated scalable operations which often correlate with
increased rates of economic and employment growth. Second, traded sector
businesses often experience higher accounting profits which could translate into more

14
retained earnings. And if retained earnings are re-invested locally this adds to the
economic impact of the subsector this business is categorized under.
We analyze economic growth and employment data at local, state and national
levels to help indicate the long run viability of these local subsectors. First we analyze
the food and beverage manufacturing subsectors from a short run perspective and
describe the economic impacts as they exist now by estimating output and employment
multipliers. Second, we analyze the food and beverage manufacturing subsectors from
a long run perspective and describe the inter-temporal economic and employment
growth trends and some potential constraints to future growth.
Short Run - The Economy Now
The effects of a change in traded sector output can be synthesized into a
multiplier that describes the estimated re-spending of net export sales revenue. Figure
3.1 shows the re-spending and leakage used in calculating multipliers. The sum of the
re-spending divided by
the initial change provides the multiplier; the leakage at each level is the amount that
leaves the region. There are four types of multipliers: Output, Employment, Income,
and Added Value Multipliers. We focus on the output and employment multipliers. The
output multiplier estimates the total change in local sales resulting from a measurable
change in traded sector sales; the employment multiplier estimates the total change in
local employment resulting in a measurable change in traded sector employment.
$0.00
$10.00
$20.00
$30.00
$40.00
$50.00
$60.00
$70.00
$80.00
$90.00
$100.00
1 2 3 4 5 6 7 8 9 10 11
Figure 3.1: Effects of a $100 Change with 3.0 Multiplier
Leakage Re-spending

15
Multipliers are frequently used, but there are limitations to their usefulness. First,
the effects multipliers measure describe the economy now, yet multipliers are popular
methods for forecasting the cumulative economic effects over time of some project or
change in policy. This is ironic because the effects of a policy or project occur over time
in a dynamic, not static, economy. For example, if output were to decrease in a traded
sector, an employment multiplier would predict a decrease in employment across all
other sectors, but some of this reduction will be temporary as workers whose jobs were
eliminated find new jobs in the region.1 For this reason alone, multipliers should only be
used to describe the economy for a snap-shot in time. Second, multipliers do not
consider supply constraints, but assume that as output increases or decreases, the
supply of all inputs will adjust proportionately. But this is rarely the case. For example, if
the food and beverage manufacturing subsectors were to grow at a rapid pace, it is
likely that manufacturers would be forced to source more inputs from outside of the
region due to limited local supply. The same is true for other inputs including skilled
labor. Third, multipliers can be distorted by interregional feedback.2 This is a problem
when multipliers are applied to smaller regions, such as Lane County. Suppose a Lane
County beverage manufacturer purchases raw input from a farmer in neighboring Linn
County, but the farmer purchases his raw inputs from Lane County suppliers. If there
were an increase in beverage manufacturing output, there would be an associated
increase in demand for the farmer’s inputs as well, but the multiplier would not account
for this effect and would underestimate the total effects. This is more noticeable in
smaller regions because they are more interdependent on the regions around them.
Fourth, multipliers fail to account for certain cost structures. Business services such as
accounting are calculated as locally purchased inputs, but an increase in a firm’s output
by 2 percent will not likely impact the level of accounting services purchased by the firm.
But the multiplier will not consider this and predict a proportionate increase in
accounting. Considering these four problems multipliers should not be relied upon to
forecast economic impacts and can merely provide a descriptive analysis of short run
economic effects as they occur now.
1 (Coughlin & Mandelbaum, 1991)
2 (Coughlin & Mandelbaum, 1991)
16
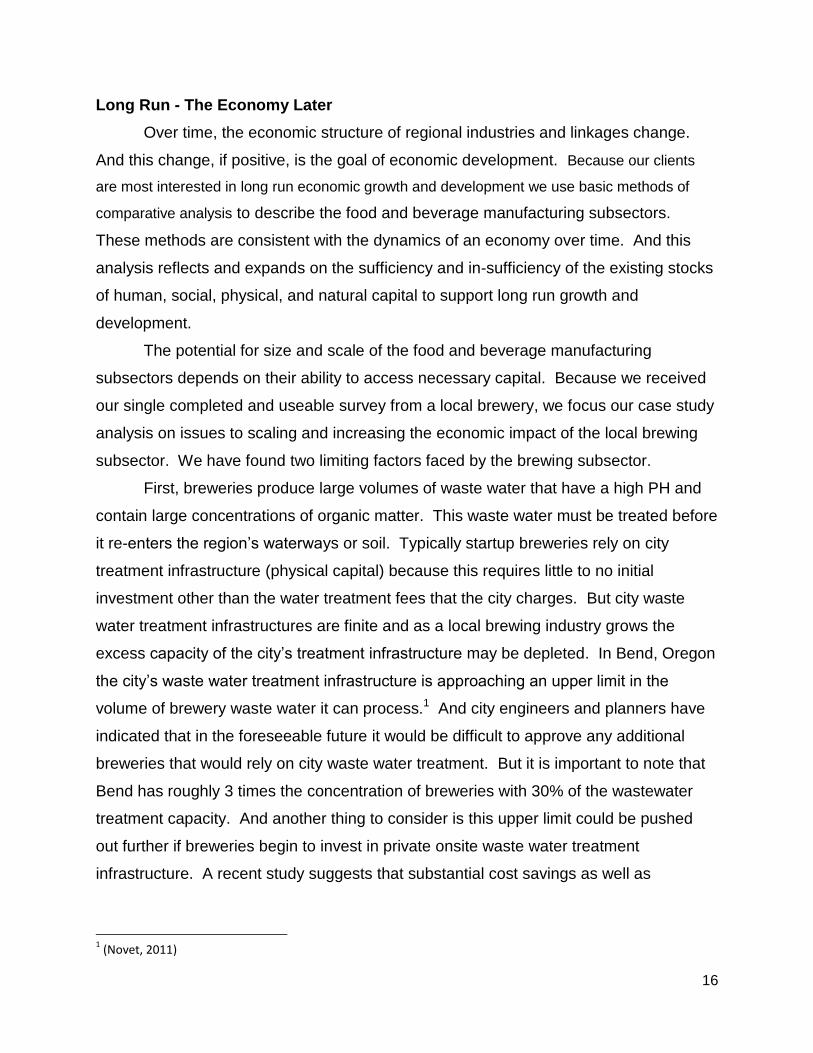
Long Run - The Economy Later
Over time, the economic structure of regional industries and linkages change.
And this change, if positive, is the goal of economic development. Because our clients
are most interested in long run economic growth and development we use basic methods of
comparative analysis to describe the food and beverage manufacturing subsectors.
These methods are consistent with the dynamics of an economy over time. And this
analysis reflects and expands on the sufficiency and in-sufficiency of the existing stocks
of human, social, physical, and natural capital to support long run growth and
development.
The potential for size and scale of the food and beverage manufacturing
subsectors depends on their ability to access necessary capital. Because we received
our single completed and useable survey from a local brewery, we focus our case study
analysis on issues to scaling and increasing the economic impact of the local brewing
subsector. We have found two limiting factors faced by the brewing subsector.
First, breweries produce large volumes of waste water that have a high PH and
contain large concentrations of organic matter. This waste water must be treated before
it re-enters the region’s waterways or soil. Typically startup breweries rely on city
treatment infrastructure (physical capital) because this requires little to no initial
investment other than the water treatment fees that the city charges. But city waste
water treatment infrastructures are finite and as a local brewing industry grows the
excess capacity of the city’s treatment infrastructure may be depleted. In Bend, Oregon
the city’s waste water treatment infrastructure is approaching an upper limit in the
volume of brewery waste water it can process.1 And city engineers and planners have
indicated that in the foreseeable future it would be difficult to approve any additional
breweries that would rely on city waste water treatment. But it is important to note that
Bend has roughly 3 times the concentration of breweries with 30% of the wastewater
treatment capacity. And another thing to consider is this upper limit could be pushed
out further if breweries begin to invest in private onsite waste water treatment
infrastructure. A recent study suggests that substantial cost savings as well as
1 (Novet, 2011)
17
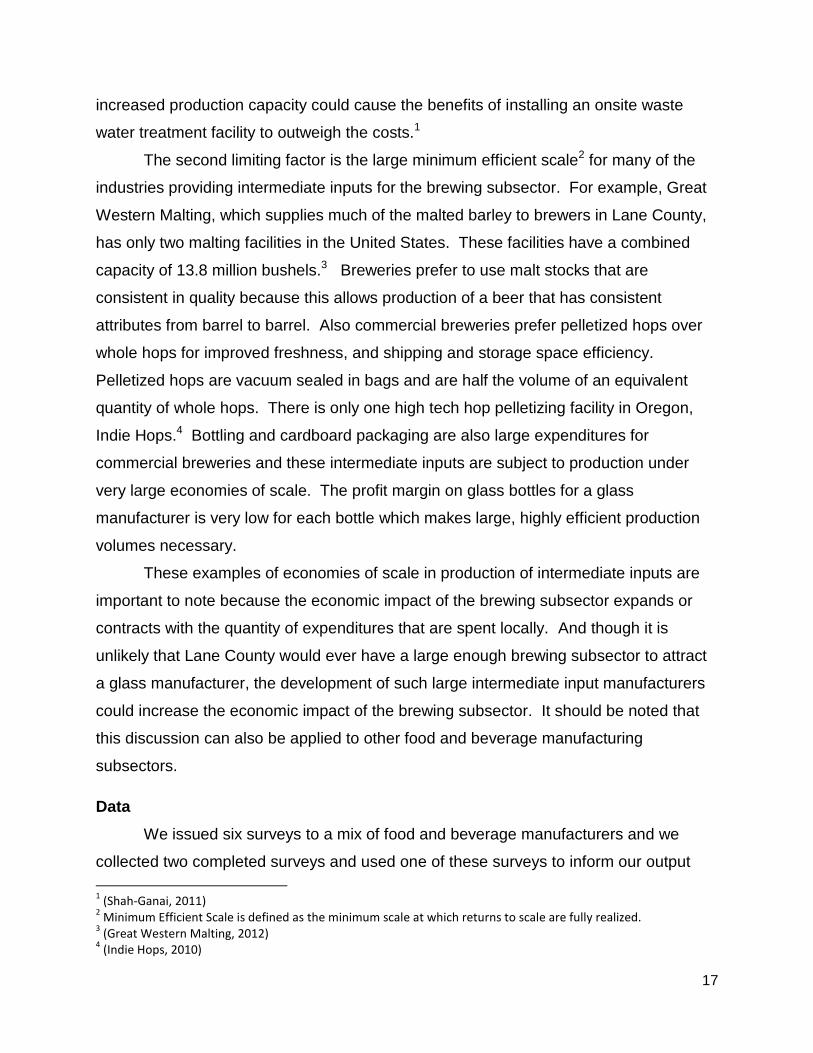
increased production capacity could cause the benefits of installing an onsite waste
water treatment facility to outweigh the costs.1
The second limiting factor is the large minimum efficient scale2 for many of the
industries providing intermediate inputs for the brewing subsector. For example, Great
Western Malting, which supplies much of the malted barley to brewers in Lane County,
has only two malting facilities in the United States. These facilities have a combined
capacity of 13.8 million bushels.3 Breweries prefer to use malt stocks that are
consistent in quality because this allows production of a beer that has consistent
attributes from barrel to barrel. Also commercial breweries prefer pelletized hops over
whole hops for improved freshness, and shipping and storage space efficiency.
Pelletized hops are vacuum sealed in bags and are half the volume of an equivalent
quantity of whole hops. There is only one high tech hop pelletizing facility in Oregon,
Indie Hops.4 Bottling and cardboard packaging are also large expenditures for
commercial breweries and these intermediate inputs are subject to production under
very large economies of scale. The profit margin on glass bottles for a glass
manufacturer is very low for each bottle which makes large, highly efficient production
volumes necessary.
These examples of economies of scale in production of intermediate inputs are
important to note because the economic impact of the brewing subsector expands or
contracts with the quantity of expenditures that are spent locally. And though it is
unlikely that Lane County would ever have a large enough brewing subsector to attract
a glass manufacturer, the development of such large intermediate input manufacturers
could increase the economic impact of the brewing subsector. It should be noted that
this discussion can also be applied to other food and beverage manufacturing
subsectors.
Data
We issued six surveys to a mix of food and beverage manufacturers and we
collected two completed surveys and used one of these surveys to inform our output
1 (Shah-Ganai, 2011)
2 Minimum Efficient Scale is defined as the minimum scale at which returns to scale are fully realized.
3 (Great Western Malting, 2012)
4 (Indie Hops, 2010)

18
multiplier calculation. An example of the survey can be viewed in Appendix A. We
collected wage and employment data for local, state, and national food and beverage
manufacturing industries from two sources: The Oregon Labor Market Information
System (OLMIS) through the Oregon Employment Department and the Bureau of Labor
Statistics (BLS) through the United States Department of Labor. Supporting data can
be found in Appendix B.
Calculated Output Multipliers
We conducted a survey to collect data from local food and beverage
manufacturing businesses and use this data to compute an output multiplier for these
manufacturing subsectors. But many businesses were unable to gather and provide
data because of time constraints. We received survey results from two beverage
manufacturing businesses. One is a startup and did not begin production until the
fourth quarter of 2011. Because of this their cost structure is unrepresentative of the
beverage manufacturing subsector as a whole because the majority of their expenses
were startup costs that most companies only incur once. For this reason, we decided to
not use the data. The other survey provided excellent data and we estimated a
multiplier using the following equation:
To calculate and apply this multiplier we make some assumptions:
All traded sector items (payroll, expenses, etc.) are proportionate to their totals as
traded sector sales are to total sales.
Households spend 60% of payroll locally.1
The leakage for all subsequent levels (See Figure 3.1) is proportionally
equivalent.
The cost structure, and therefore the multiplier, is a fair representation of the local
beverage manufacturing industry as a whole.
1 (Felsenstein, 1995)
19
As the industry grows, the cost structures and input sources will grow
proportionally.
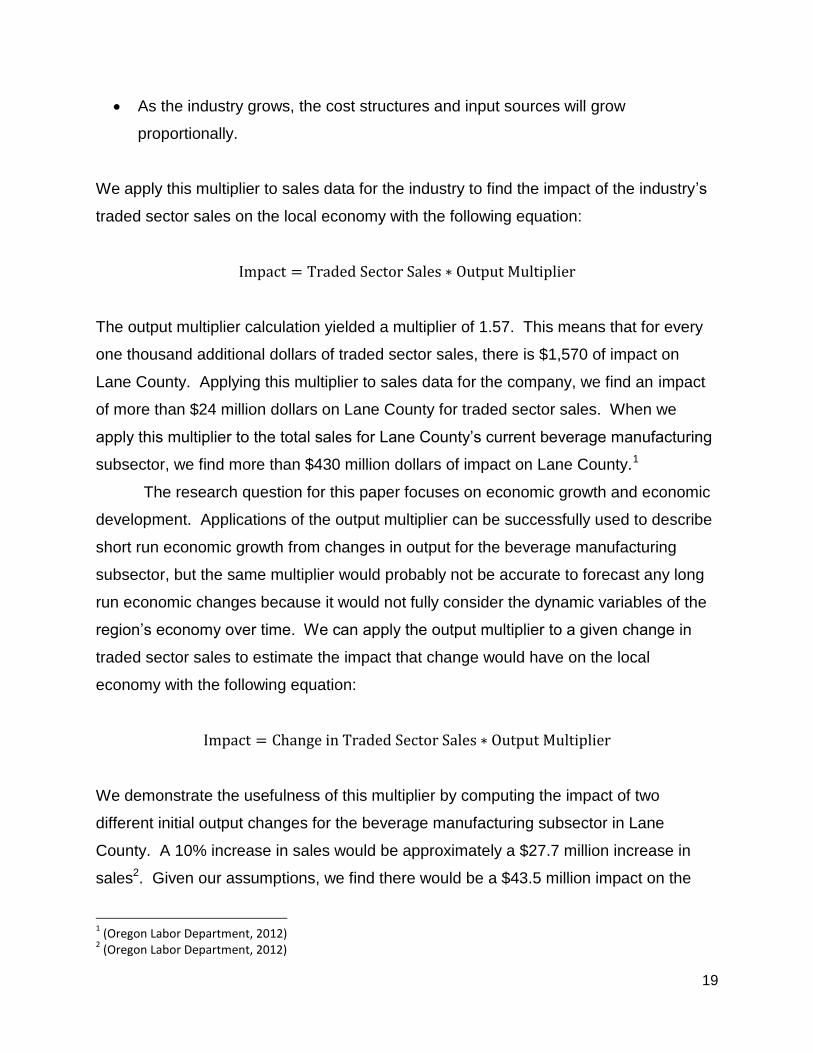
We apply this multiplier to sales data for the industry to find the impact of the industry’s
traded sector sales on the local economy with the following equation:
The output multiplier calculation yielded a multiplier of 1.57. This means that for every
one thousand additional dollars of traded sector sales, there is $1,570 of impact on
Lane County. Applying this multiplier to sales data for the company, we find an impact
of more than $24 million dollars on Lane County for traded sector sales. When we
apply this multiplier to the total sales for Lane County’s current beverage manufacturing
subsector, we find more than $430 million dollars of impact on Lane County.1
The research question for this paper focuses on economic growth and economic
development. Applications of the output multiplier can be successfully used to describe
short run economic growth from changes in output for the beverage manufacturing
subsector, but the same multiplier would probably not be accurate to forecast any long
run economic changes because it would not fully consider the dynamic variables of the
region’s economy over time. We can apply the output multiplier to a given change in
traded sector sales to estimate the impact that change would have on the local
economy with the following equation:
We demonstrate the usefulness of this multiplier by computing the impact of two
different initial output changes for the beverage manufacturing subsector in Lane
County. A 10% increase in sales would be approximately a $27.7 million increase in
sales2. Given our assumptions, we find there would be a $43.5 million impact on the
1 (Oregon Labor Department, 2012)
2 (Oregon Labor Department, 2012)
20
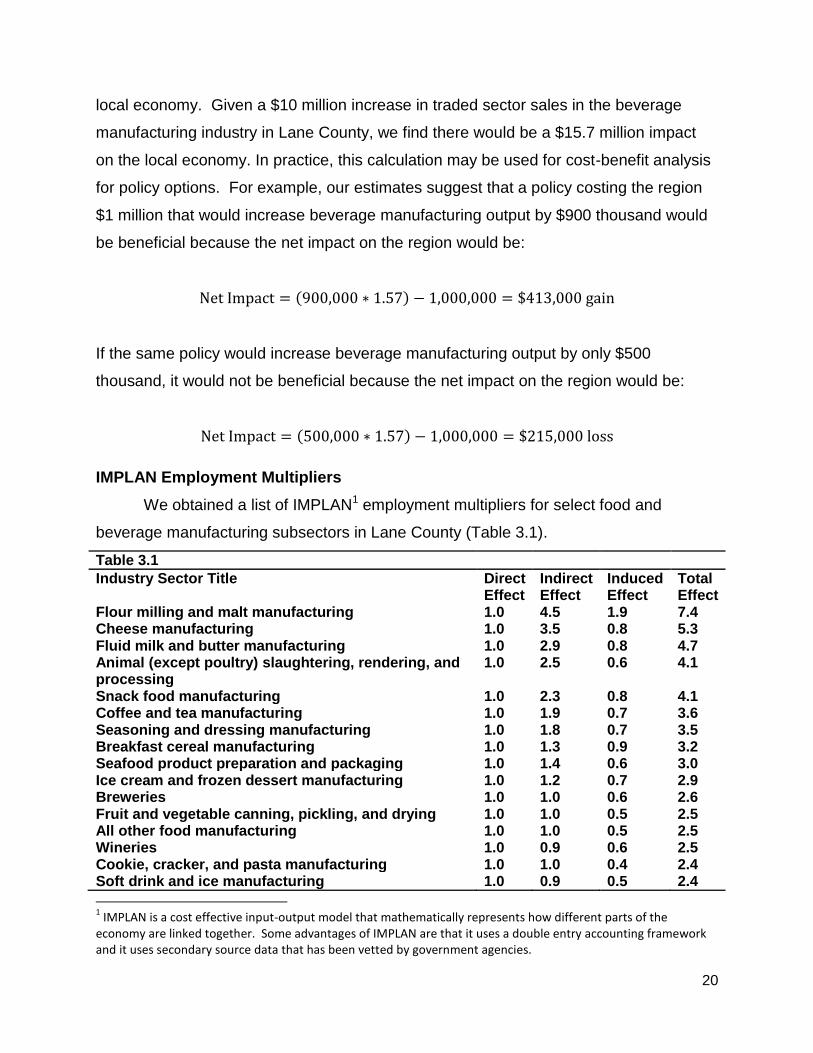
local economy. Given a $10 million increase in traded sector sales in the beverage
manufacturing industry in Lane County, we find there would be a $15.7 million impact
on the local economy. In practice, this calculation may be used for cost-benefit analysis
for policy options. For example, our estimates suggest that a policy costing the region
$1 million that would increase beverage manufacturing output by $900 thousand would
be beneficial because the net impact on the region would be:
( )
If the same policy would increase beverage manufacturing output by only $500
thousand, it would not be beneficial because the net impact on the region would be:
( )
IMPLAN Employment Multipliers
We obtained a list of IMPLAN1 employment multipliers for select food and
beverage manufacturing subsectors in Lane County (Table 3.1).
Table 3.1
Industry Sector Title Direct Effect
Indirect Effect
Induced Effect
Total Effect
Flour milling and malt manufacturing 1.0 4.5 1.9 7.4 Cheese manufacturing 1.0 3.5 0.8 5.3 Fluid milk and butter manufacturing 1.0 2.9 0.8 4.7 Animal (except poultry) slaughtering, rendering, and processing
1.0 2.5 0.6 4.1
Snack food manufacturing 1.0 2.3 0.8 4.1 Coffee and tea manufacturing 1.0 1.9 0.7 3.6 Seasoning and dressing manufacturing 1.0 1.8 0.7 3.5 Breakfast cereal manufacturing 1.0 1.3 0.9 3.2 Seafood product preparation and packaging 1.0 1.4 0.6 3.0 Ice cream and frozen dessert manufacturing 1.0 1.2 0.7 2.9 Breweries 1.0 1.0 0.6 2.6 Fruit and vegetable canning, pickling, and drying 1.0 1.0 0.5 2.5 All other food manufacturing 1.0 1.0 0.5 2.5 Wineries 1.0 0.9 0.6 2.5 Cookie, cracker, and pasta manufacturing 1.0 1.0 0.4 2.4 Soft drink and ice manufacturing 1.0 0.9 0.5 2.4
1 IMPLAN is a cost effective input-output model that mathematically represents how different parts of the
economy are linked together. Some advantages of IMPLAN are that it uses a double entry accounting framework and it uses secondary source data that has been vetted by government agencies.
21
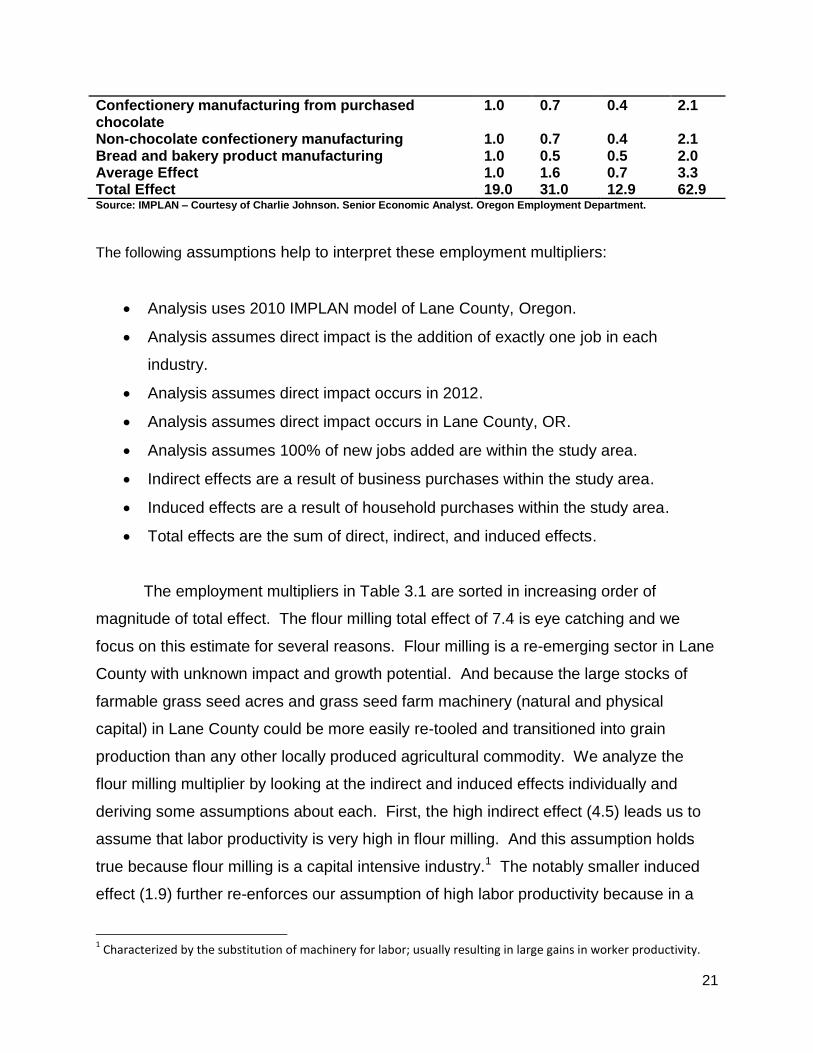
Confectionery manufacturing from purchased chocolate
1.0 0.7 0.4 2.1
Non-chocolate confectionery manufacturing 1.0 0.7 0.4 2.1 Bread and bakery product manufacturing 1.0 0.5 0.5 2.0 Average Effect 1.0 1.6 0.7 3.3 Total Effect 19.0 31.0 12.9 62.9 Source: IMPLAN – Courtesy of Charlie Johnson. Senior Economic Analyst. Oregon Employment Department.
The following assumptions help to interpret these employment multipliers:
Analysis uses 2010 IMPLAN model of Lane County, Oregon.
Analysis assumes direct impact is the addition of exactly one job in each
industry.
Analysis assumes direct impact occurs in 2012.
Analysis assumes direct impact occurs in Lane County, OR.
Analysis assumes 100% of new jobs added are within the study area.
Indirect effects are a result of business purchases within the study area.
Induced effects are a result of household purchases within the study area.
Total effects are the sum of direct, indirect, and induced effects.
The employment multipliers in Table 3.1 are sorted in increasing order of
magnitude of total effect. The flour milling total effect of 7.4 is eye catching and we
focus on this estimate for several reasons. Flour milling is a re-emerging sector in Lane
County with unknown impact and growth potential. And because the large stocks of
farmable grass seed acres and grass seed farm machinery (natural and physical
capital) in Lane County could be more easily re-tooled and transitioned into grain
production than any other locally produced agricultural commodity. We analyze the
flour milling multiplier by looking at the indirect and induced effects individually and
deriving some assumptions about each. First, the high indirect effect (4.5) leads us to
assume that labor productivity is very high in flour milling. And this assumption holds
true because flour milling is a capital intensive industry.1 The notably smaller induced
effect (1.9) further re-enforces our assumption of high labor productivity because in a
1 Characterized by the substitution of machinery for labor; usually resulting in large gains in worker productivity.

22
capital intensive industry it would be consistent that household expenditures (induced
effects) would be smaller than intermediate and raw input (indirect effects)
expenditures. These assumptions can be demonstrated by the following scenario.
Suppose a flour mill worker produces $10 million of flour per year. Assume that at the
current production volume the flour mill incurs $5 million in intermediate and raw input
expenditures. These expenditures are local. Further assume the one worker is already
producing at maximum capacity, but the mill’s physical capital is sufficient to increase
production. Also assume the mill’s physical capital is fixed (They cannot purchase
another milling machine). Then assume the mill experiences an increase in final
demand requiring them to double production and this causes them to add a new worker.
Now assume that all factors of production adjust perfectly to the increase in production.
All else being held constant this additional worker will result in a huge increase in local
expenditures ($5 million) which could result in significant indirect effects (New jobs in
other sectors). Conversely this additional worker and the new workers resulting from
the indirect effects will purchase goods and services in the local region. But when these
expenditures are compared to the much larger initial expenditures by the flour mill ($5
million), they will more than likely be smaller and therefore result in fewer new jobs. If
we expand our analytical window to look at cheese manufacturing and fluid milk and
butter manufacturing the same assumptions of capital intensity and worker productivity
hold true. The production processes in these food manufacturing subsectors utilize
large machinery to process large volumes of raw inputs into final goods.
There are several key assumptions to keep in mind to more accurately draw
useful conclusions from this list of employment multipliers.
All aspects of production must be the same in 2012 as they were in 2010.
All production factor inputs must adjust perfectly and match 2010 proportions.
There are no supply constraints.
If each of these assumptions holds true then the employment effect of one new
job in each of the sectors listed in Table 3.1 will be accurate. But this is more than likely
not the case. In fact there are known barriers to increasing production in flour milling in
23
Lane County. The first is access to sufficient volumes of food grade, dry storage for
grains. The second is necessary and sufficient volumes of locally grown grains to
support perfect matching of 2010 factor input proportions. If the barriers to increasing
flour milling production were overcome and the industry subsector did scale up
production there could be some significant employment growth. But it is very important
to recognize that the effects of adding one new job for flour milling or any of the other 18
subsectors in Table 3.1 could be very different from the estimated effect for myriads of
reasons. The economy is dynamic and does not always change in predictable ways.
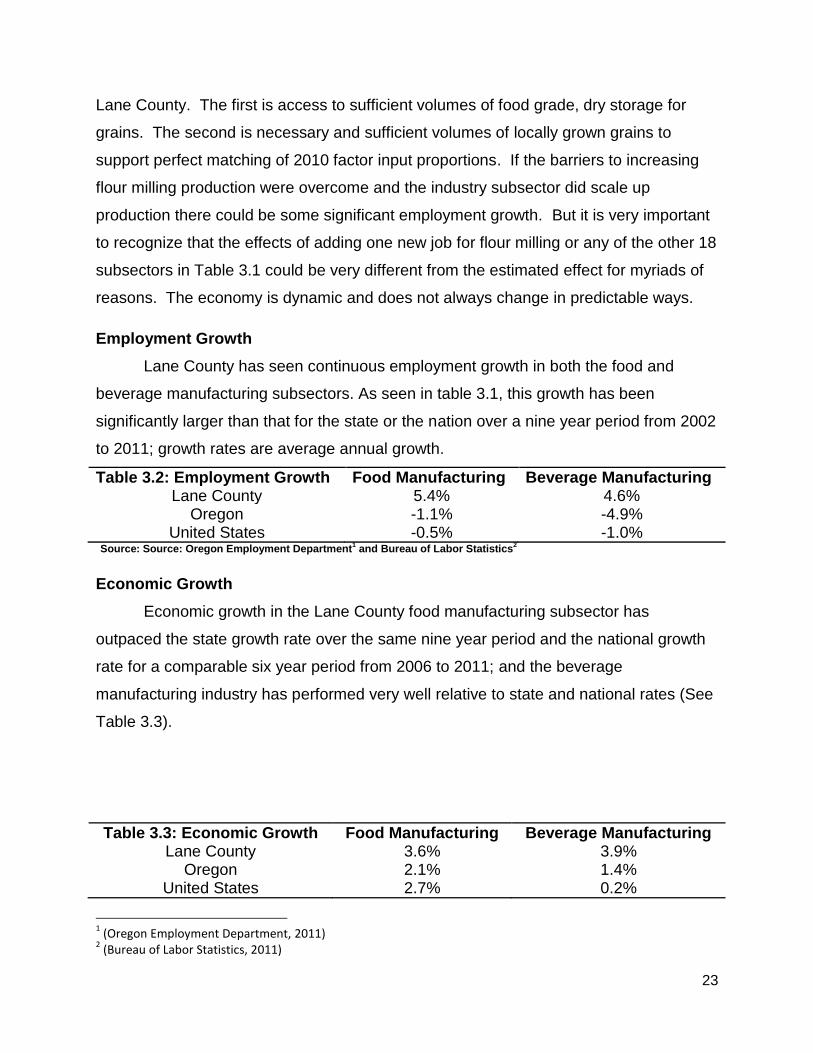
Employment Growth
Lane County has seen continuous employment growth in both the food and
beverage manufacturing subsectors. As seen in table 3.1, this growth has been
significantly larger than that for the state or the nation over a nine year period from 2002
to 2011; growth rates are average annual growth.
Table 3.2: Employment Growth Food Manufacturing Beverage Manufacturing Lane County 5.4% 4.6%
Oregon -1.1% -4.9% United States -0.5% -1.0%
Source: Source: Oregon Employment Department1 and Bureau of Labor Statistics
2
Economic Growth
Economic growth in the Lane County food manufacturing subsector has
outpaced the state growth rate over the same nine year period and the national growth
rate for a comparable six year period from 2006 to 2011; and the beverage
manufacturing industry has performed very well relative to state and national rates (See
Table 3.3).
Table 3.3: Economic Growth Food Manufacturing Beverage Manufacturing Lane County 3.6% 3.9%
Oregon 2.1% 1.4% United States 2.7% 0.2%
1 (Oregon Employment Department, 2011)
2 (Bureau of Labor Statistics, 2011)
24
Source: Oregon Employment Department1 and Bureau of Labor Statistics
2
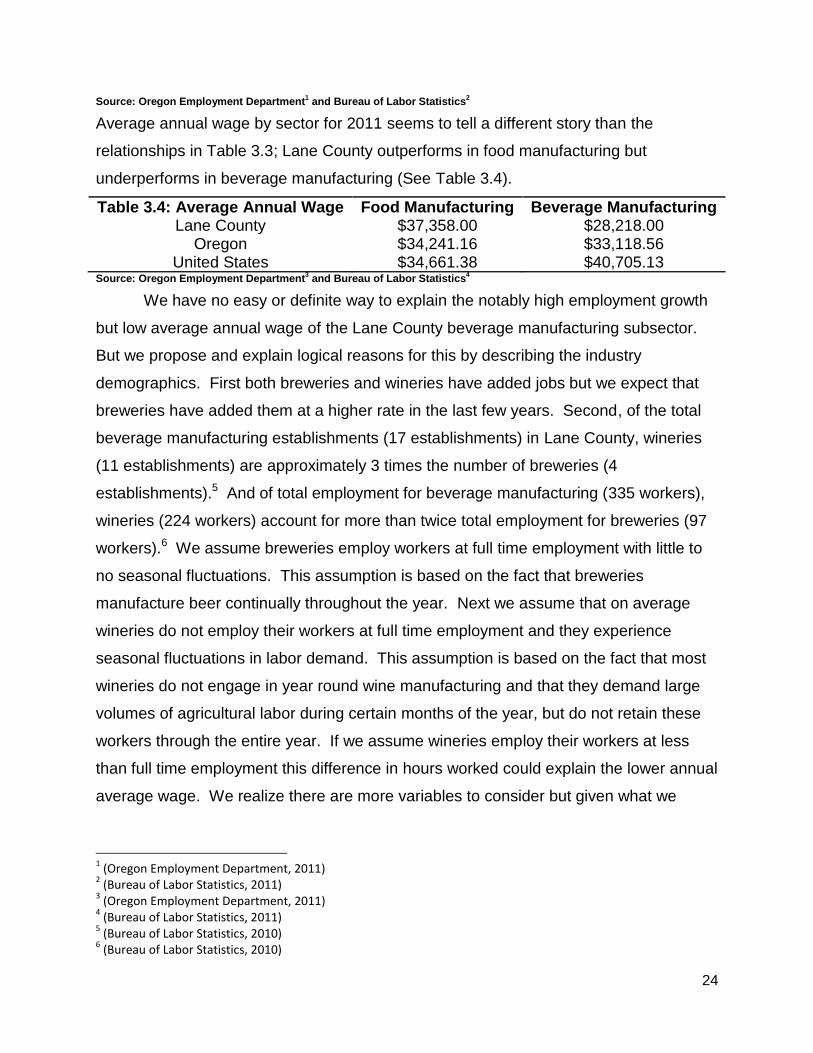
Average annual wage by sector for 2011 seems to tell a different story than the
relationships in Table 3.3; Lane County outperforms in food manufacturing but
underperforms in beverage manufacturing (See Table 3.4).
Table 3.4: Average Annual Wage Food Manufacturing Beverage Manufacturing Lane County $37,358.00 $28,218.00
Oregon $34,241.16 $33,118.56 United States $34,661.38 $40,705.13
Source: Oregon Employment Department3 and Bureau of Labor Statistics
4
We have no easy or definite way to explain the notably high employment growth
but low average annual wage of the Lane County beverage manufacturing subsector.
But we propose and explain logical reasons for this by describing the industry
demographics. First both breweries and wineries have added jobs but we expect that
breweries have added them at a higher rate in the last few years. Second, of the total
beverage manufacturing establishments (17 establishments) in Lane County, wineries
(11 establishments) are approximately 3 times the number of breweries (4
establishments).5 And of total employment for beverage manufacturing (335 workers),
wineries (224 workers) account for more than twice total employment for breweries (97
workers).6 We assume breweries employ workers at full time employment with little to
no seasonal fluctuations. This assumption is based on the fact that breweries
manufacture beer continually throughout the year. Next we assume that on average
wineries do not employ their workers at full time employment and they experience
seasonal fluctuations in labor demand. This assumption is based on the fact that most
wineries do not engage in year round wine manufacturing and that they demand large
volumes of agricultural labor during certain months of the year, but do not retain these
workers through the entire year. If we assume wineries employ their workers at less
than full time employment this difference in hours worked could explain the lower annual
average wage. We realize there are more variables to consider but given what we
1 (Oregon Employment Department, 2011)
2 (Bureau of Labor Statistics, 2011)
3 (Oregon Employment Department, 2011)
4 (Bureau of Labor Statistics, 2011)
5 (Bureau of Labor Statistics, 2010)
6 (Bureau of Labor Statistics, 2010)

25
know now we feel this is a logical explanation of the lower beverage manufacturing
average annual wage.
CHAPTER 4 – Reflections and Conclusions
26
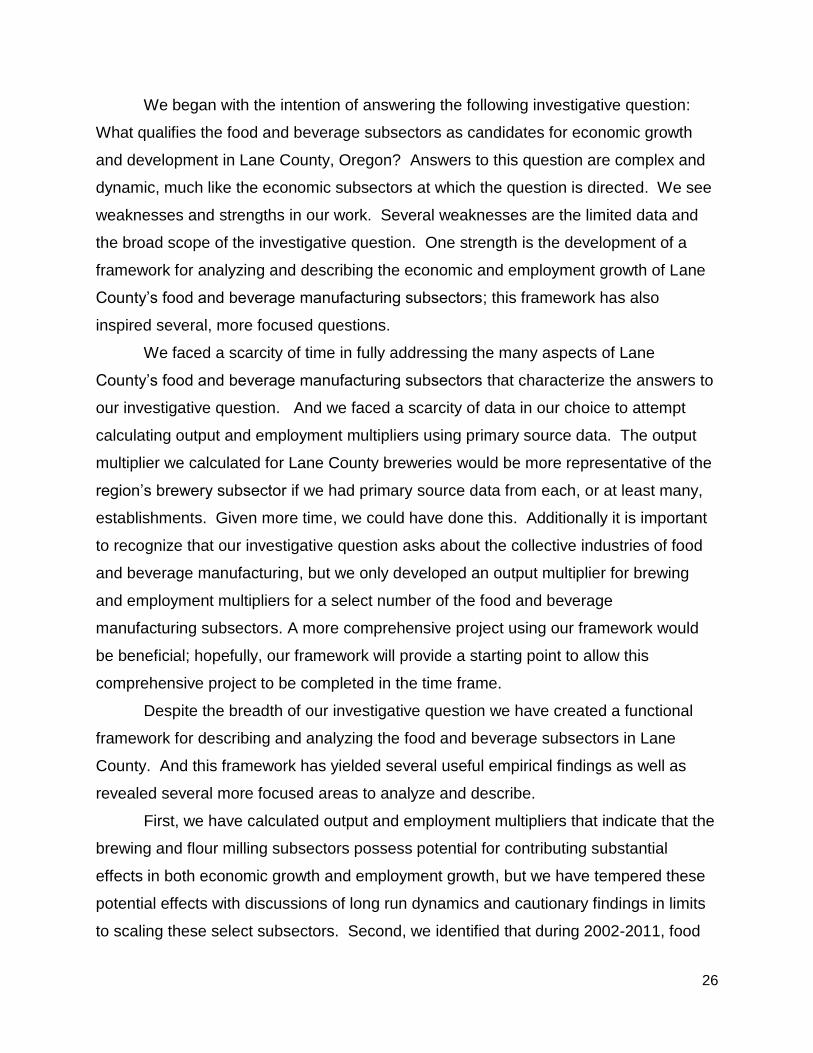
We began with the intention of answering the following investigative question:
What qualifies the food and beverage subsectors as candidates for economic growth
and development in Lane County, Oregon? Answers to this question are complex and
dynamic, much like the economic subsectors at which the question is directed. We see
weaknesses and strengths in our work. Several weaknesses are the limited data and
the broad scope of the investigative question. One strength is the development of a
framework for analyzing and describing the economic and employment growth of Lane
County’s food and beverage manufacturing subsectors; this framework has also
inspired several, more focused questions.
We faced a scarcity of time in fully addressing the many aspects of Lane
County’s food and beverage manufacturing subsectors that characterize the answers to
our investigative question. And we faced a scarcity of data in our choice to attempt
calculating output and employment multipliers using primary source data. The output
multiplier we calculated for Lane County breweries would be more representative of the
region’s brewery subsector if we had primary source data from each, or at least many,
establishments. Given more time, we could have done this. Additionally it is important
to recognize that our investigative question asks about the collective industries of food
and beverage manufacturing, but we only developed an output multiplier for brewing
and employment multipliers for a select number of the food and beverage
manufacturing subsectors. A more comprehensive project using our framework would
be beneficial; hopefully, our framework will provide a starting point to allow this
comprehensive project to be completed in the time frame.
Despite the breadth of our investigative question we have created a functional
framework for describing and analyzing the food and beverage subsectors in Lane
County. And this framework has yielded several useful empirical findings as well as
revealed several more focused areas to analyze and describe.
First, we have calculated output and employment multipliers that indicate that the
brewing and flour milling subsectors possess potential for contributing substantial
effects in both economic growth and employment growth, but we have tempered these
potential effects with discussions of long run dynamics and cautionary findings in limits
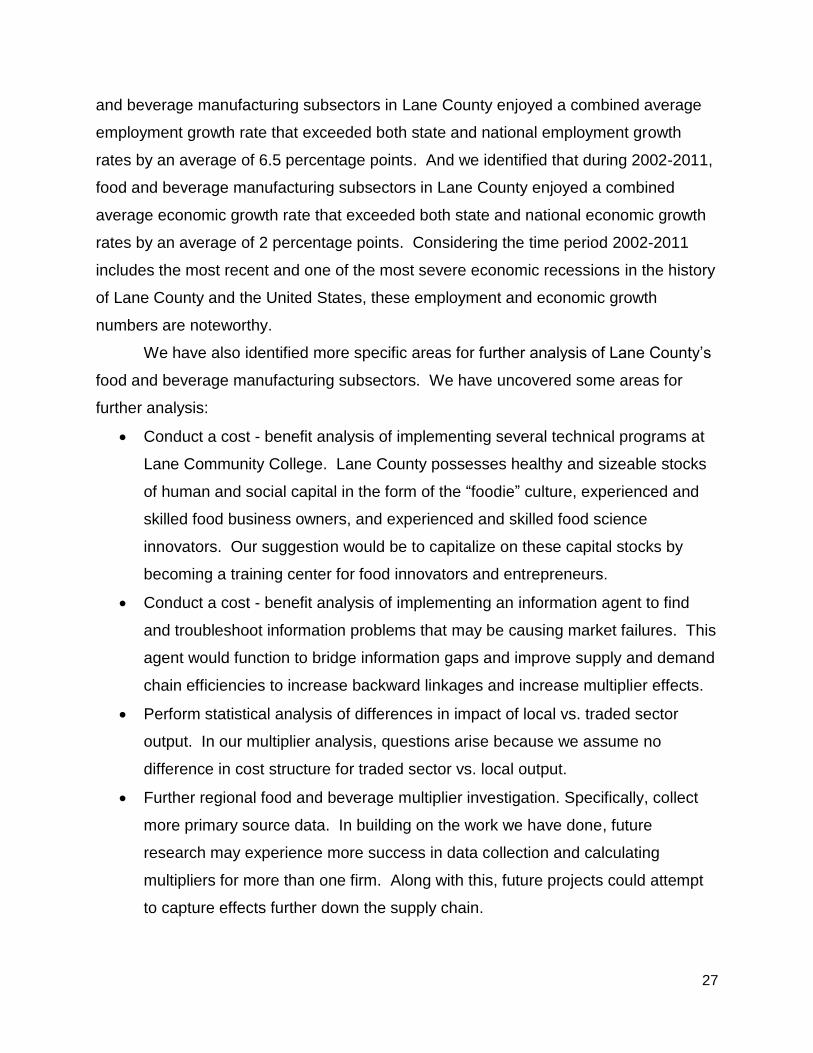
to scaling these select subsectors. Second, we identified that during 2002-2011, food
27
and beverage manufacturing subsectors in Lane County enjoyed a combined average
employment growth rate that exceeded both state and national employment growth
rates by an average of 6.5 percentage points. And we identified that during 2002-2011,
food and beverage manufacturing subsectors in Lane County enjoyed a combined
average economic growth rate that exceeded both state and national economic growth
rates by an average of 2 percentage points. Considering the time period 2002-2011
includes the most recent and one of the most severe economic recessions in the history
of Lane County and the United States, these employment and economic growth
numbers are noteworthy.
We have also identified more specific areas for further analysis of Lane County’s
food and beverage manufacturing subsectors. We have uncovered some areas for
further analysis:
Conduct a cost - benefit analysis of implementing several technical programs at
Lane Community College. Lane County possesses healthy and sizeable stocks
of human and social capital in the form of the “foodie” culture, experienced and
skilled food business owners, and experienced and skilled food science
innovators. Our suggestion would be to capitalize on these capital stocks by
becoming a training center for food innovators and entrepreneurs.
Conduct a cost - benefit analysis of implementing an information agent to find
and troubleshoot information problems that may be causing market failures. This
agent would function to bridge information gaps and improve supply and demand
chain efficiencies to increase backward linkages and increase multiplier effects.
Perform statistical analysis of differences in impact of local vs. traded sector
output. In our multiplier analysis, questions arise because we assume no
difference in cost structure for traded sector vs. local output.
Further regional food and beverage multiplier investigation. Specifically, collect
more primary source data. In building on the work we have done, future
research may experience more success in data collection and calculating
multipliers for more than one firm. Along with this, future projects could attempt
to capture effects further down the supply chain.

28
Appendices
Appendix A
29
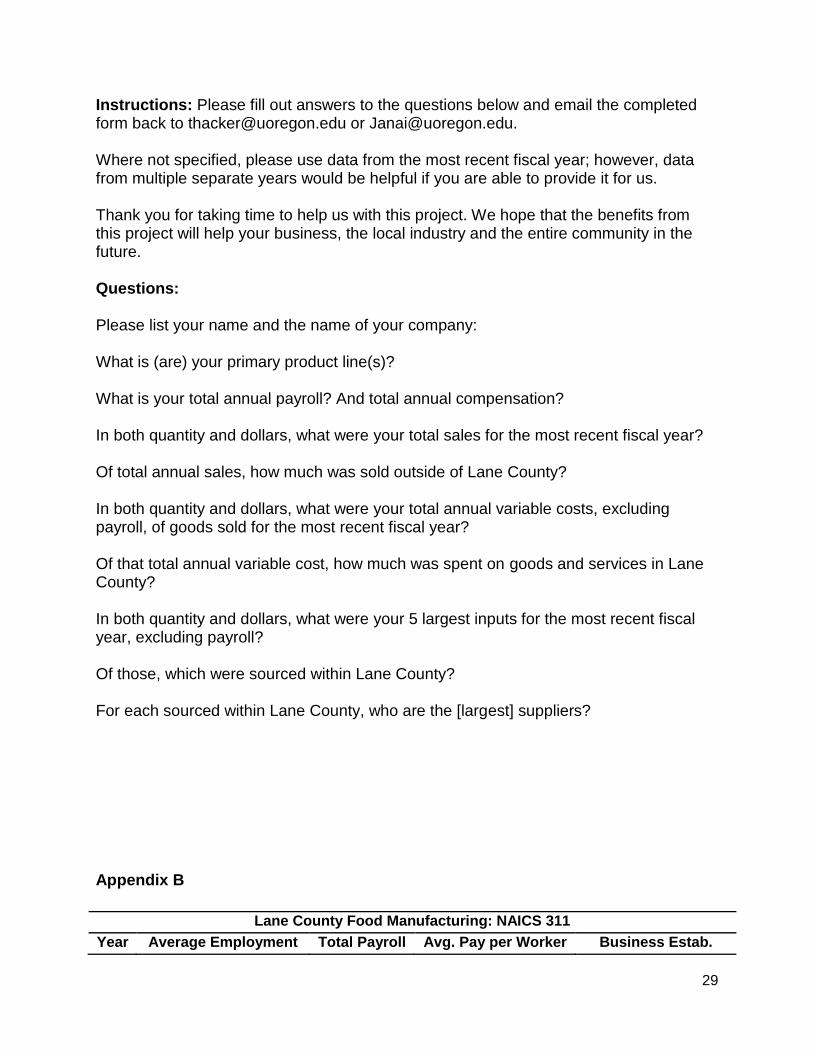
Instructions: Please fill out answers to the questions below and email the completed form back to [email protected] or [email protected]. Where not specified, please use data from the most recent fiscal year; however, data from multiple separate years would be helpful if you are able to provide it for us. Thank you for taking time to help us with this project. We hope that the benefits from this project will help your business, the local industry and the entire community in the future. Questions: Please list your name and the name of your company: What is (are) your primary product line(s)? What is your total annual payroll? And total annual compensation? In both quantity and dollars, what were your total sales for the most recent fiscal year? Of total annual sales, how much was sold outside of Lane County? In both quantity and dollars, what were your total annual variable costs, excluding payroll, of goods sold for the most recent fiscal year? Of that total annual variable cost, how much was spent on goods and services in Lane County? In both quantity and dollars, what were your 5 largest inputs for the most recent fiscal year, excluding payroll? Of those, which were sourced within Lane County? For each sourced within Lane County, who are the [largest] suppliers?
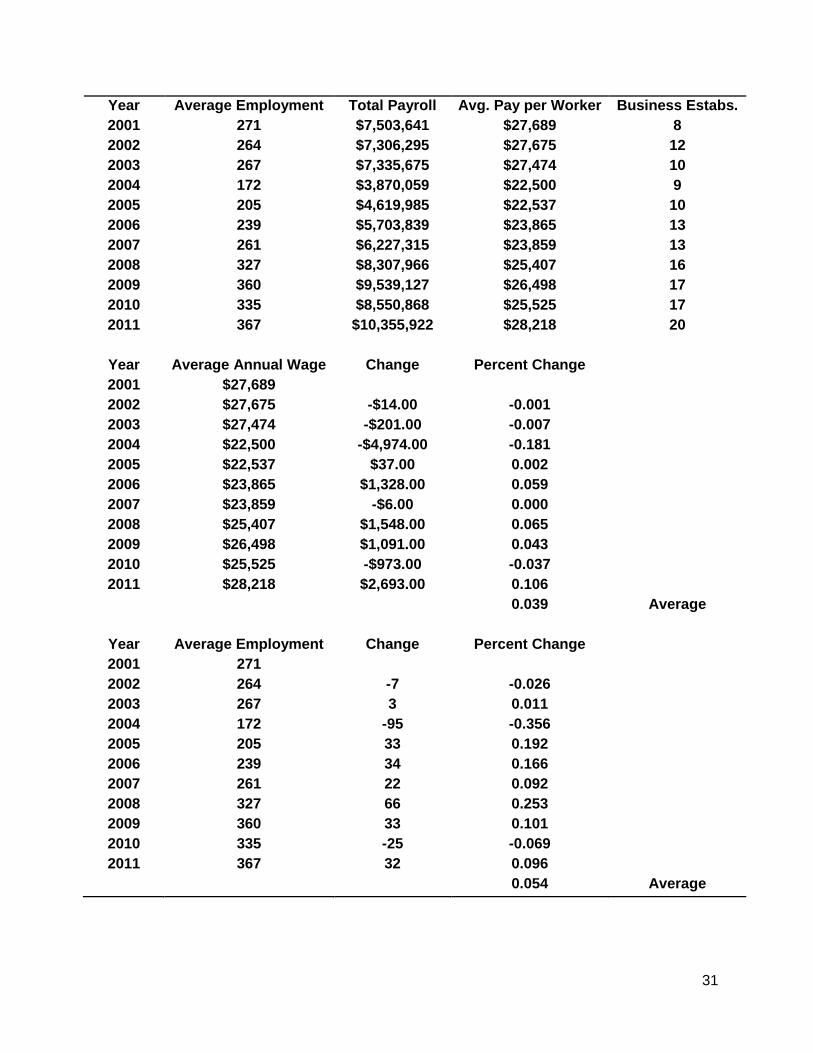
Appendix B
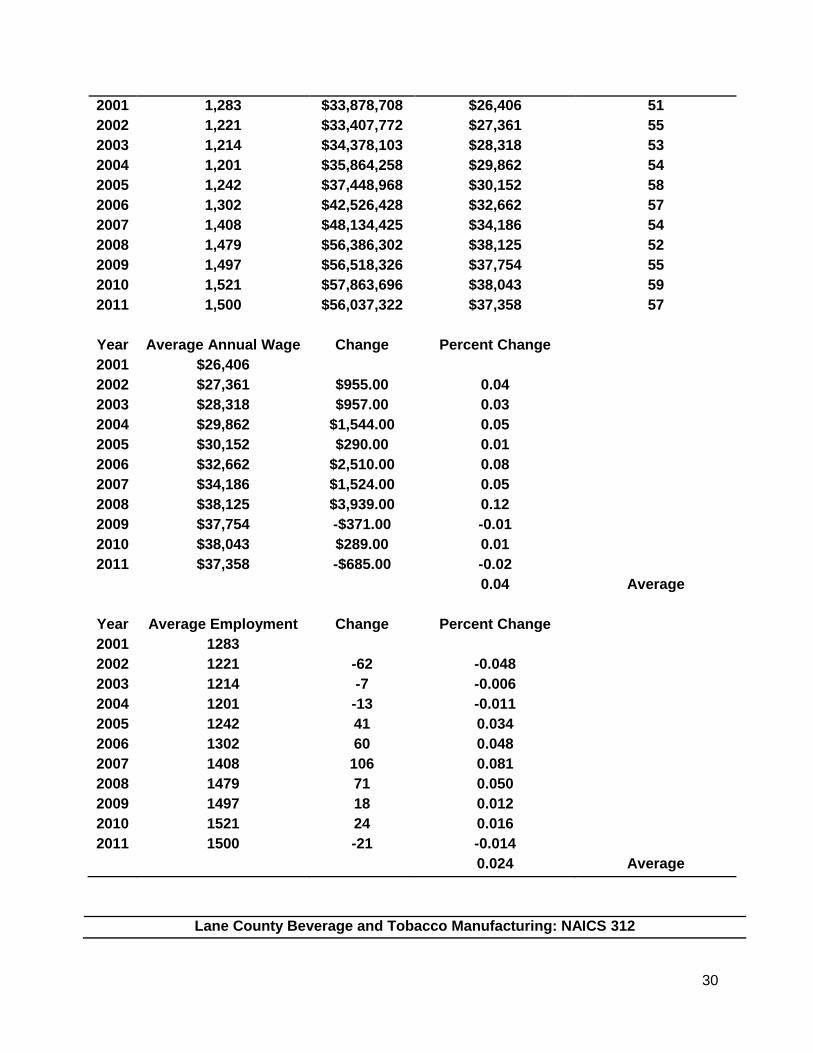
Lane County Food Manufacturing: NAICS 311
Year Average Employment Total Payroll Avg. Pay per Worker Business Estab.
30
2001 1,283 $33,878,708 $26,406 51
2002 1,221 $33,407,772 $27,361 55
2003 1,214 $34,378,103 $28,318 53
2004 1,201 $35,864,258 $29,862 54
2005 1,242 $37,448,968 $30,152 58
2006 1,302 $42,526,428 $32,662 57
2007 1,408 $48,134,425 $34,186 54
2008 1,479 $56,386,302 $38,125 52
2009 1,497 $56,518,326 $37,754 55
2010 1,521 $57,863,696 $38,043 59
2011 1,500 $56,037,322 $37,358 57
Year Average Annual Wage Change Percent Change
2001 $26,406
2002 $27,361 $955.00 0.04
2003 $28,318 $957.00 0.03
2004 $29,862 $1,544.00 0.05
2005 $30,152 $290.00 0.01
2006 $32,662 $2,510.00 0.08
2007 $34,186 $1,524.00 0.05
2008 $38,125 $3,939.00 0.12
2009 $37,754 -$371.00 -0.01
2010 $38,043 $289.00 0.01
2011 $37,358 -$685.00 -0.02
0.04 Average
Year Average Employment Change Percent Change
2001 1283
2002 1221 -62 -0.048
2003 1214 -7 -0.006
2004 1201 -13 -0.011
2005 1242 41 0.034
2006 1302 60 0.048
2007 1408 106 0.081
2008 1479 71 0.050
2009 1497 18 0.012
2010 1521 24 0.016
2011 1500 -21 -0.014
0.024 Average
Lane County Beverage and Tobacco Manufacturing: NAICS 312
31
Year Average Employment Total Payroll Avg. Pay per Worker Business Estabs.
2001 271 $7,503,641 $27,689 8
2002 264 $7,306,295 $27,675 12
2003 267 $7,335,675 $27,474 10
2004 172 $3,870,059 $22,500 9
2005 205 $4,619,985 $22,537 10
2006 239 $5,703,839 $23,865 13
2007 261 $6,227,315 $23,859 13
2008 327 $8,307,966 $25,407 16
2009 360 $9,539,127 $26,498 17
2010 335 $8,550,868 $25,525 17
2011 367 $10,355,922 $28,218 20
Year Average Annual Wage Change Percent Change
2001 $27,689
2002 $27,675 -$14.00 -0.001
2003 $27,474 -$201.00 -0.007
2004 $22,500 -$4,974.00 -0.181
2005 $22,537 $37.00 0.002
2006 $23,865 $1,328.00 0.059
2007 $23,859 -$6.00 0.000
2008 $25,407 $1,548.00 0.065
2009 $26,498 $1,091.00 0.043
2010 $25,525 -$973.00 -0.037
2011 $28,218 $2,693.00 0.106
0.039 Average
Year Average Employment Change Percent Change
2001 271
2002 264 -7 -0.026
2003 267 3 0.011
2004 172 -95 -0.356
2005 205 33 0.192
2006 239 34 0.166
2007 261 22 0.092
2008 327 66 0.253
2009 360 33 0.101
2010 335 -25 -0.069
2011 367 32 0.096
0.054 Average
32
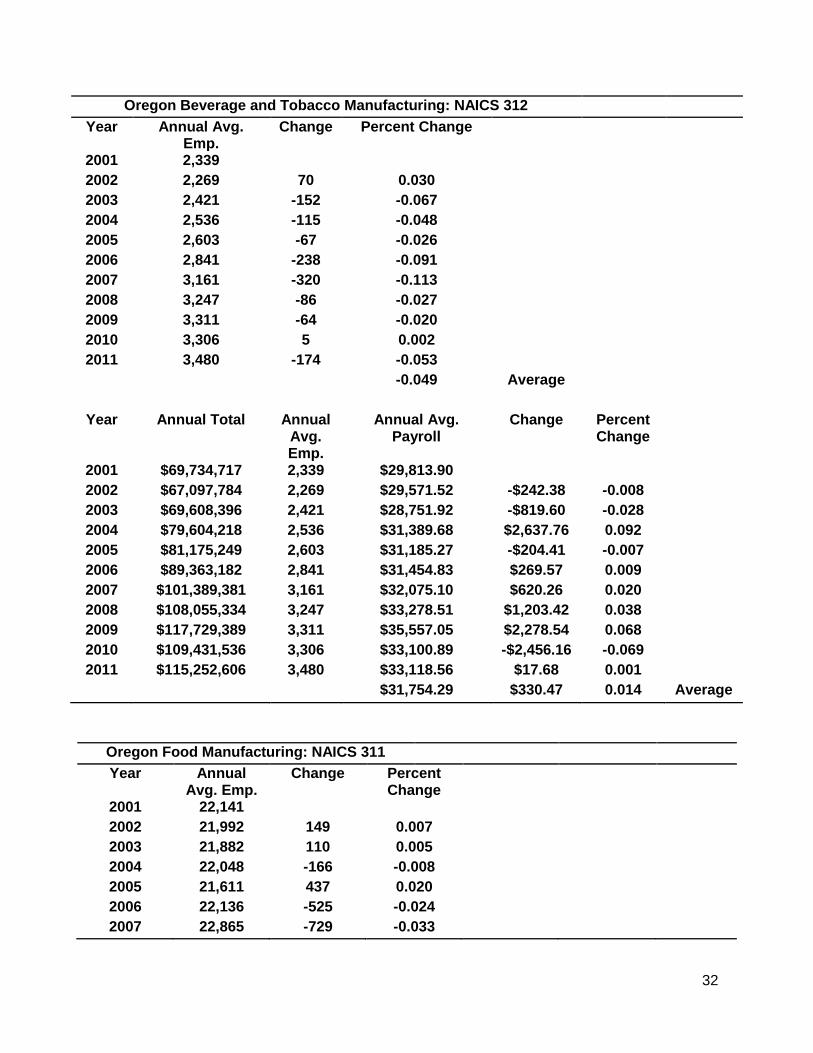
Oregon Beverage and Tobacco Manufacturing: NAICS 312
Year Annual Avg. Emp.
Change Percent Change
2001 2,339
2002 2,269 70 0.030
2003 2,421 -152 -0.067
2004 2,536 -115 -0.048
2005 2,603 -67 -0.026
2006 2,841 -238 -0.091
2007 3,161 -320 -0.113
2008 3,247 -86 -0.027
2009 3,311 -64 -0.020
2010 3,306 5 0.002
2011 3,480 -174 -0.053
-0.049 Average
Year Annual Total Annual Avg. Emp.
Annual Avg. Payroll
Change Percent Change
2001 $69,734,717 2,339 $29,813.90
2002 $67,097,784 2,269 $29,571.52 -$242.38 -0.008
2003 $69,608,396 2,421 $28,751.92 -$819.60 -0.028
2004 $79,604,218 2,536 $31,389.68 $2,637.76 0.092
2005 $81,175,249 2,603 $31,185.27 -$204.41 -0.007
2006 $89,363,182 2,841 $31,454.83 $269.57 0.009
2007 $101,389,381 3,161 $32,075.10 $620.26 0.020
2008 $108,055,334 3,247 $33,278.51 $1,203.42 0.038
2009 $117,729,389 3,311 $35,557.05 $2,278.54 0.068
2010 $109,431,536 3,306 $33,100.89 -$2,456.16 -0.069
2011 $115,252,606 3,480 $33,118.56 $17.68 0.001
$31,754.29 $330.47 0.014 Average
Oregon Food Manufacturing: NAICS 311
Year Annual Avg. Emp.
Change Percent Change
2001 22,141
2002 21,992 149 0.007
2003 21,882 110 0.005
2004 22,048 -166 -0.008
2005 21,611 437 0.020
2006 22,136 -525 -0.024
2007 22,865 -729 -0.033
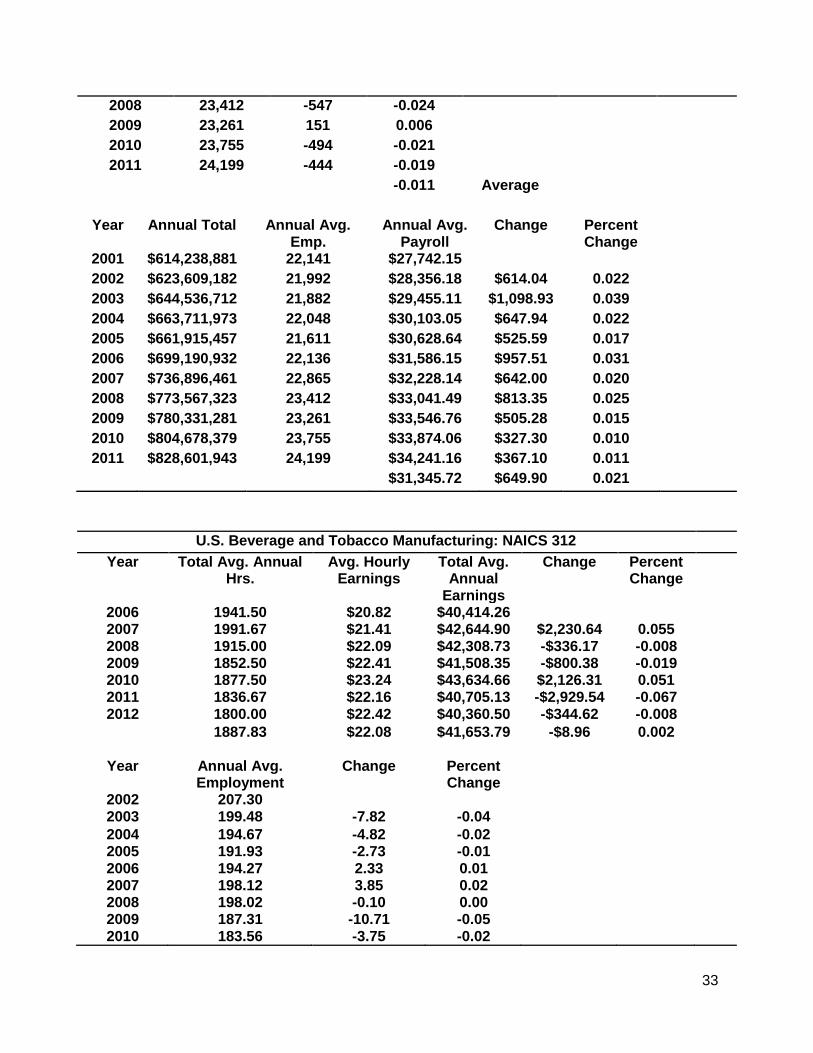
33
2008 23,412 -547 -0.024
2009 23,261 151 0.006
2010 23,755 -494 -0.021
2011 24,199 -444 -0.019
-0.011 Average
Year Annual Total Annual Avg. Emp.
Annual Avg. Payroll
Change Percent Change
2001 $614,238,881 22,141 $27,742.15
2002 $623,609,182 21,992 $28,356.18 $614.04 0.022
2003 $644,536,712 21,882 $29,455.11 $1,098.93 0.039
2004 $663,711,973 22,048 $30,103.05 $647.94 0.022
2005 $661,915,457 21,611 $30,628.64 $525.59 0.017
2006 $699,190,932 22,136 $31,586.15 $957.51 0.031
2007 $736,896,461 22,865 $32,228.14 $642.00 0.020
2008 $773,567,323 23,412 $33,041.49 $813.35 0.025
2009 $780,331,281 23,261 $33,546.76 $505.28 0.015
2010 $804,678,379 23,755 $33,874.06 $327.30 0.010
2011 $828,601,943 24,199 $34,241.16 $367.10 0.011
$31,345.72 $649.90 0.021
U.S. Beverage and Tobacco Manufacturing: NAICS 312
Year Total Avg. Annual Hrs.
Avg. Hourly Earnings
Total Avg. Annual
Earnings
Change Percent Change
2006 1941.50 $20.82 $40,414.26 2007 1991.67 $21.41 $42,644.90 $2,230.64 0.055 2008 1915.00 $22.09 $42,308.73 -$336.17 -0.008 2009 1852.50 $22.41 $41,508.35 -$800.38 -0.019 2010 1877.50 $23.24 $43,634.66 $2,126.31 0.051 2011 1836.67 $22.16 $40,705.13 -$2,929.54 -0.067 2012 1800.00 $22.42 $40,360.50 -$344.62 -0.008
1887.83 $22.08 $41,653.79 -$8.96 0.002
Year Annual Avg. Employment
Change Percent Change
2002 207.30 2003 199.48 -7.82 -0.04
2004 194.67 -4.82 -0.02 2005 191.93 -2.73 -0.01 2006 194.27 2.33 0.01 2007 198.12 3.85 0.02 2008 198.02 -0.10 0.00 2009 187.31 -10.71 -0.05 2010 183.56 -3.75 -0.02

34
2011 188.31 4.75 0.03 2012 195.58 7.27 0.04
-0.01 Average
U.S. Food Manufacturing: NAICS 311
Year Annual
Average
Total Annual
Average
Avg. Earnings per Hr.
Total Annual
Earnings Change
Percent Change
2006 38.99 1949.50 $15.54 $30,287.43
2007 39.44 1972.08 $15.92 $31,387.35 $1,099.92 0.036
2008 39.59 1979.58 $16.39 $32,453.62 $1,066.27 0.034
2009 38.86 1942.92 $17.08 $33,180.16 $726.54 0.022
2010 39.61 1980.42 $17.29 $34,239.75 $1,059.59 0.032
2011 39.39 1969.58 $17.60 $34,661.38 $421.63 0.012
2012 39.75 1987.50 $17.87 $35,511.66 $850.27 0.025
39.38 1968.80 $16.81 $33,103.05 $870.70 0.027
Year Annual Avg. Employment
Change Percent Change
2002 1524.93
2003 1517.41 -7.53 -0.005
2004 1494.05 -23.36 -0.015
2005 1477.61 -16.44 -0.011
2006 1479.43 1.83 0.001
2007 1483.73 4.30 0.003
2008 1480.40 -3.33 -0.002
2009 1456.61 -23.79 -0.016
2010 1450.95 -5.66 -0.004
2011 1456.63 5.68 0.004
2012 1451.30 -5.33 -0.004
-0.005 Average
Works Cited
World Bank . (1998, April). Social Capital Working Paper. Retrieved May 14, 2012, from
http://web.worldbank.org/WBSITE/EXTERNAL/TOPICS/EXTSOCIALDEVELOPMENT/EXTTSOC
IALCAPITAL/0,,contentMDK:20185164~menuPK:418217~pagePK:148956~piPK:216618~theSite
PK:401015
Aleshire, I. (2012, May 7). LCC Center Spawns Many Succeses. The Register Guard.
Bureau of Labor Statistics. (2010). Quarterly Census of Employment and Wages. Retrieved June 06,
2012, from http://www.bls.gov/cew/
35
Bureau of Labor Statistics. (2011). Industries at a Glance. Retrieved June 6, 2012, from Bureau of Labor
Statistics: http://www.bls.gov/iag/
Bureau of Labor Statistics. (2012). Economy at a Glance (Eugene-Springfield, OR).
Coughlin, C. C., & Mandelbaum, T. B. (1991). A Consumer's Guide to Regional Economic Multipliers.
Review, 19-32.
DeBenedetti, C., & Fletcher, S. (2010, October 1). The Top 25 Beers in the World. Men's Journal.
Diatz, D. (2012, February 12). Transforming Mead into a New Brew: Young Entrepreneurs Aim to Make
Ancient Drink Fresh and Hip. The Register Guard.
Felsenstein, D. (1995). Dealing With 'Induced Migration' in University Impact Studies. Research in Higher
Education, 457-472.
Felstein, D. (1995). Dealing With 'Induced Migration' in University Impact Studies. Research in Higher
Education, 457-472.
Great Western Malting. (2012). Locations. Retrieved June 6, 2012, from Great Western Malting est. 1934:
http://greatwesternmalting.com/
Indie Hops. (2010). Pellet Mill. Retrieved June 6, 2012, from Indie Hops: Oregon Grown:
http://indiehops.com/index.asp
McDonald, S. B. (2012, May 3). Birth of a Brewery District: Three Beer Makers Plan Expansions in
Eugene's Whiteaker Neighborhood. The Register Guard.
Novet, J. (2011, September 16). Bend's Beer Boom. The Bulletin. Bend, Oregon, United States.
Retrieved June 3, 2012, from http://www.bendbulletin.com/
Oregon Employment Department. (2011). Covered Employment and Wages. Retrieved June 6, 2012,
from Qualityinfo.org: http://www.qualityinfo.org/olmisj/CEP
Oregon Employment Department. (2011). Industry Report: NAICS 311 - Food Manufacturing, Ownership:
Private Sector, Oregon Statewide.
Oregon Employment Department. (2011). Industry Report: NAICS 312 - Beverage and tobacco product
manufacturing, Ownership: Private Sector Oregon Statewide. Oregon Employment Department.
Oregon Employment Department. (2011). Lane County 2011 Covered Employment and Wages Summary
Report.
Oregon Employment Department. (2012). Occupational Information Center. Retrieved May 28, 2012,
from Qualityinfo.org: http://www.qualityinfo.org/olmisj/OIC
O'Sullivan, A. (2009). Urban Economics (7 ed.). (A. E. Hilbert, Ed.) New York: Douglas Reiner.
Rooney, B. (2010). Lane County Food and Beverage Industries Add Jobs During the Recession. Oregon
Employment Department.
Rooney, B. (2012). Agriculture in Lane County. Oregon Employment Department.
Shah-Ganai, J. (2011, November). COST-BENEFIT ANALYSIS OF IMPLEMENTING WASTEWATER
TREATMENT. Retrieved June 05, 2012, from
http://digitalcommons.calpoly.edu/cgi/viewcontent.cgi?article=1093&context=agbsp
Soubbotina, T. P. (2004). Beyond Economic Growth (2 ed.). (J. Didier, Ed.) Washington D.C.: THE
WORLD BANK.
Soubbotina, T. P. (2004). Beyond Economic Growth (2 ed.). (J. Didier, Ed.) Washington D.C.: THE
WORLD BANK.
Soubbotina, T. P. (2004). Beyond Economic Growth (2 ed.). (J. Didier, Ed.) Washington D.C.: THE
WORLD BANK.
Stevens, B., & Lahr, M. (1988). Regional economic multipliers: Definitions, measurement, and application.
Economic Development Quarterly, 88-96.
U.S. Census Bureau. (2010). American Community Survey. Retrieved June 05, 2012, from
http://www.census.gov/acs/www/
Ward, B., Taylor, P., & Whitelaw, E. (2012, February 12). With Better Capital Investments Come
Rewards. The Register Guard.

36
Wikipedia. (2012, April 10). Retrieved May 15, 2012, from Wikipedia: http://en.wikipedia.org/wiki/Foodie
World Bank . (1998, April). Social Capital Working Paper. Retrieved May 14, 2012, from
http://web.worldbank.org/WBSITE/EXTERNAL/TOPICS/EXTSOCIALDEVELOPMENT/EXTTSOC
IALCAPITAL/0,,contentMDK:20185164~menuPK:418217~pagePK:148956~piPK:216618~theSite
PK:401015
Related Documents