This information was prepared by Coriolis solely for the use of our client; it is not to be relied on by any third party without prior written consent. Food & Beverage Information Project 2011 Depth Sector Stream – Seafood Final Report October 2011; v1.72 www.foodandbeverage.govt.nz

Welcome message from author
This document is posted to help you gain knowledge. Please leave a comment to let me know what you think about it! Share it to your friends and learn new things together.
Transcript
This information was prepared by Coriolis solely for the use of our client; it is not to be relied on by any third party without prior written consent.
Food & Beverage Information Project 2011Depth Sector Stream – Seafood
Final ReportOctober 2011; v1.72
www.foodandbeverage.govt.nz
Coriolis is a strategic management consulting andmarket research firm
We work with organisations to help them grow. For corporations, thatoften means developing strategies for revenue growth. Forgovernments, it means working on national economic development. Fornon‐profits, it means helping to grow their social impact.
We address all the problems that are involved in growth: strategy,marketing, pricing, innovation, new product development, new markets,organisation, leadership, economic competitiveness.
We bring to our clients specialised industry and functional expertise.We invest significant resources in building knowledge. We see it as ourmission to bring this knowledge to our clients and we publish much of itfor the benefit of others.
A hallmark of our work is rigorous, fact‐based analysis, grounded inproven methodologies. We rely on data because it provides clarity andaligns people.
However, we deliver results, not reports. To that end, we work side byside with our clients to create and implement practical solutions.
The Coriolis name
The coriolis force, named for French physicist Gaspard Coriolis (1792‐1843), may be seen on a large scale in the movement of winds andocean currents on the rotating earth. It dominates weather patterns,producing the counterclockwise flow observed around low‐pressurezones in the Northern Hemisphere and the clockwise flow around suchzones in the Southern Hemisphere. To us it means understanding thebig picture before you get into the details.
PO Box 90‐509, Victoria Street West, Auckland 1142, New ZealandTel: +64 9 623 1848 www.coriolisresearch.com
The objective of this report is to provide a factual source of high quality information on the current situation in the New Zealand seafood sector for four audiences:
‐ Investors (domestic or international)‐ Industry participants (firms & individuals)‐ Government (across all roles and responsibilities)‐ Scientific researchers (academic, government & firm)
It creates a common set of facts and figures on the current situation in the industry.
It draws conclusions on potential industry strategic directionsand highlights opportunities for further investment.
It forms a part of the wider Food & Beverage Information Project and will be updated annually.
The opinions expressed in this report represent those of the industry participants interviewed and the authors. These do not necessarily represent those of Coriolis Limited or the New Zealand Government.
Note: Sectors analysed in more depth on a rotating schedule, in 2011 this included Seafood and Nutraceuticals
TABLE OF CONTENTS
Section Page
Contents 4
Glossary of terms 5
Methodology & data sources 6
F&B IP Overview 7
Summary & conclusions 9
Sector overview 17
Wild capture 46
Aquaculture 85
Appendices
Oysters 113
Mussels 122
Salmon 134
Profiles of key firms 156
Supplementary material 162
GLOSSARY OF TERMS
PAGE 5
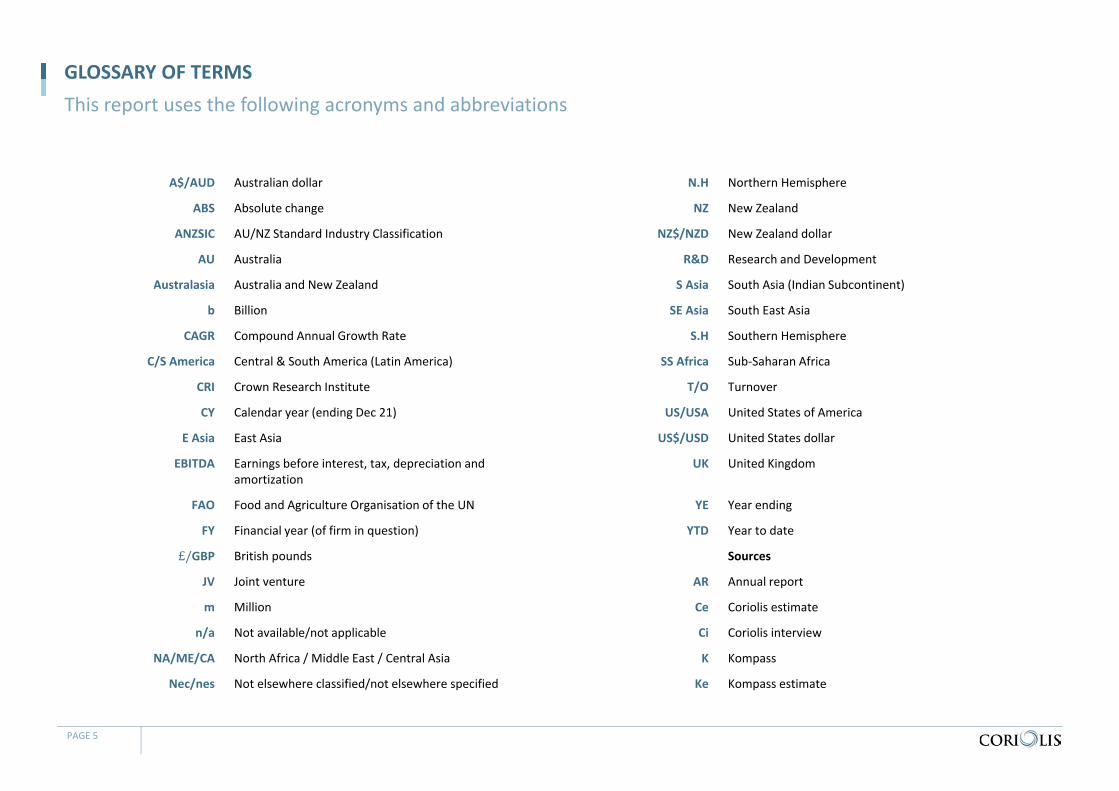
This report uses the following acronyms and abbreviations
A$/AUD Australian dollar N.H Northern Hemisphere
ABS Absolute change NZ New Zealand
ANZSIC AU/NZ Standard Industry Classification NZ$/NZD New Zealand dollar
AU Australia R&D Research and Development
Australasia Australia and New Zealand S Asia South Asia (Indian Subcontinent)
b Billion SE Asia South East Asia
CAGR Compound Annual Growth Rate S.H Southern Hemisphere
C/S America Central & South America (Latin America) SS Africa Sub‐Saharan Africa
CRI Crown Research Institute T/O Turnover
CY Calendar year (ending Dec 21) US/USA United States of America
E Asia East Asia US$/USD United States dollar
EBITDA Earnings before interest, tax, depreciation and amortization
UK United Kingdom
FAO Food and Agriculture Organisation of the UN YE Year ending
FY Financial year (of firm in question) YTD Year to date
£/GBP British pounds Sources
JV Joint venture AR Annual report
m Million Ce Coriolis estimate
n/a Not available/not applicable Ci Coriolis interview
NA/ME/CA North Africa / Middle East / Central Asia K Kompass
Nec/nes Not elsewhere classified/not elsewhere specified Ke Kompass estimate
METHODOLOGY & DATA SOURCES
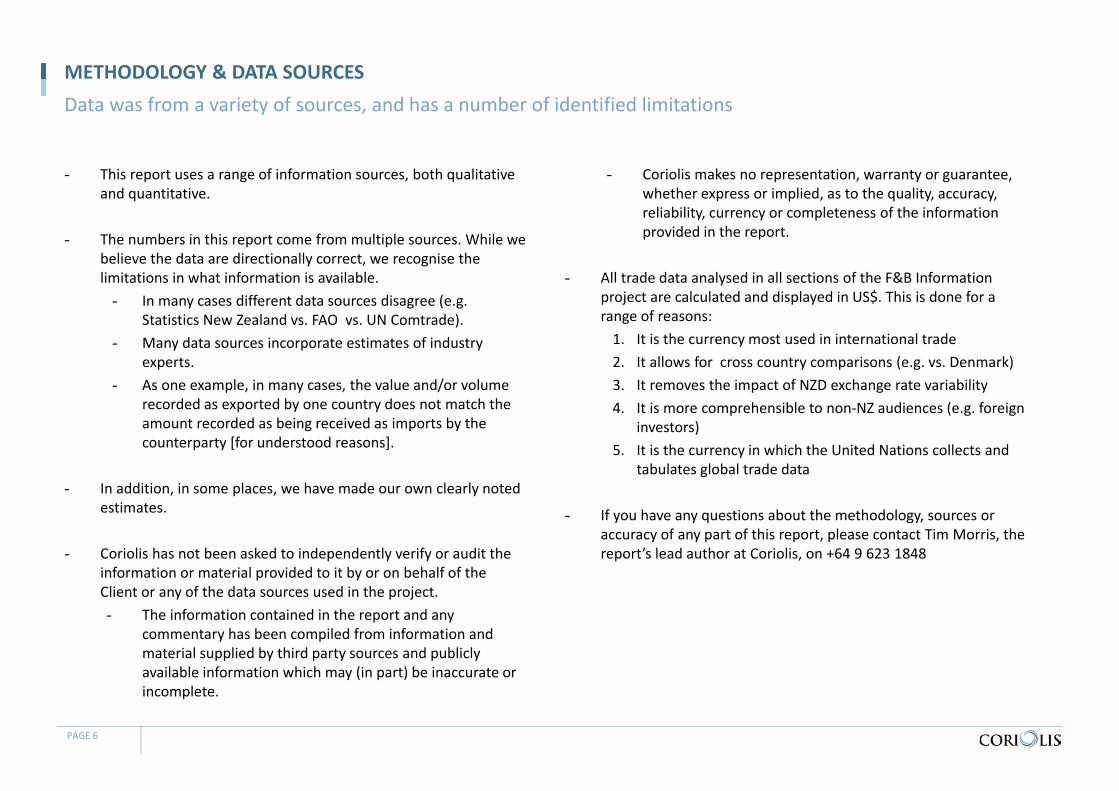
- This report uses a range of information sources, both qualitative and quantitative.
- The numbers in this report come from multiple sources. While we believe the data are directionally correct, we recognise the limitations in what information is available. - In many cases different data sources disagree (e.g.
Statistics New Zealand vs. FAO vs. UN Comtrade). - Many data sources incorporate estimates of industry
experts. - As one example, in many cases, the value and/or volume
recorded as exported by one country does not match the amount recorded as being received as imports by the counterparty [for understood reasons].
- In addition, in some places, we have made our own clearly noted estimates.
- Coriolis has not been asked to independently verify or audit the information or material provided to it by or on behalf of the Client or any of the data sources used in the project.- The information contained in the report and any
commentary has been compiled from information and material supplied by third party sources and publicly available information which may (in part) be inaccurate or incomplete.
- Coriolis makes no representation, warranty or guarantee, whether express or implied, as to the quality, accuracy, reliability, currency or completeness of the information provided in the report.
- All trade data analysed in all sections of the F&B Information project are calculated and displayed in US$. This is done for a range of reasons:1. It is the currency most used in international trade2. It allows for cross country comparisons (e.g. vs. Denmark)3. It removes the impact of NZD exchange rate variability4. It is more comprehensible to non‐NZ audiences (e.g. foreign
investors)5. It is the currency in which the United Nations collects and
tabulates global trade data
- If you have any questions about the methodology, sources or accuracy of any part of this report, please contact Tim Morris, the report’s lead author at Coriolis, on +64 9 623 1848
PAGE 6
Data was from a variety of sources, and has a number of identified limitations
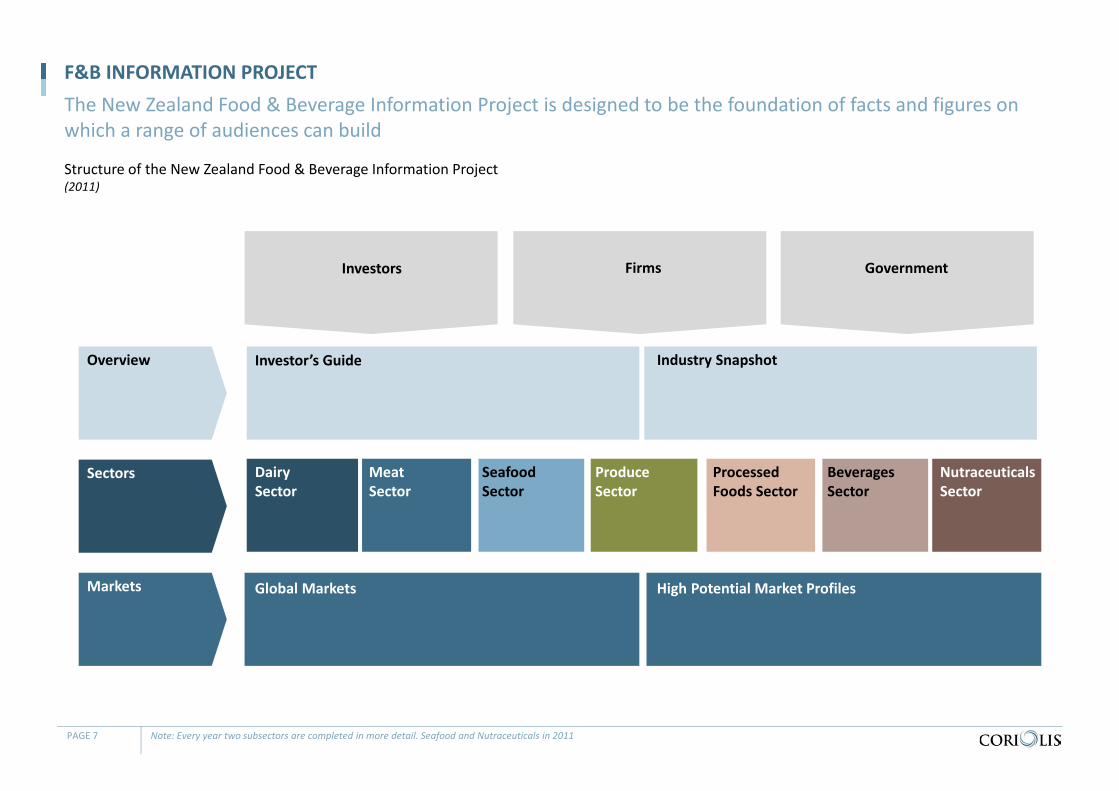
Structure of the New Zealand Food & Beverage Information Project(2011)
F&B INFORMATION PROJECTThe New Zealand Food & Beverage Information Project is designed to be the foundation of facts and figures on which a range of audiences can build
PAGE 7 Note: Every year two subsectors are completed in more detail. Seafood and Nutraceuticals in 2011
Dairy Sector
Meat Sector
ProduceSector
Seafood Sector
NutraceuticalsSector
Processed Foods Sector
Beverages Sector
Investor’s Guide
Global Markets
Overview
Sectors
Industry Snapshot
Markets High Potential Market Profiles
FirmsInvestors Government
Structure of the New Zealand Food & Beverage Information Project(2011)
SEAFOOD SECTOR ANALYSISThis analysis of the New Zealand seafood sector forms a part of the wider Food & Beverage Information Project
PAGE 8
FirmsInvestors Government
Dairy Sector
Meat Sector
ProduceSector
Seafood Sector
NutraceuticalsSector
Processed Foods Sector
Beverages Sector
Investor’s Guide
Global Markets
Overview
Markets
Sectors
Industry Snapshot
High Potential Market Profiles
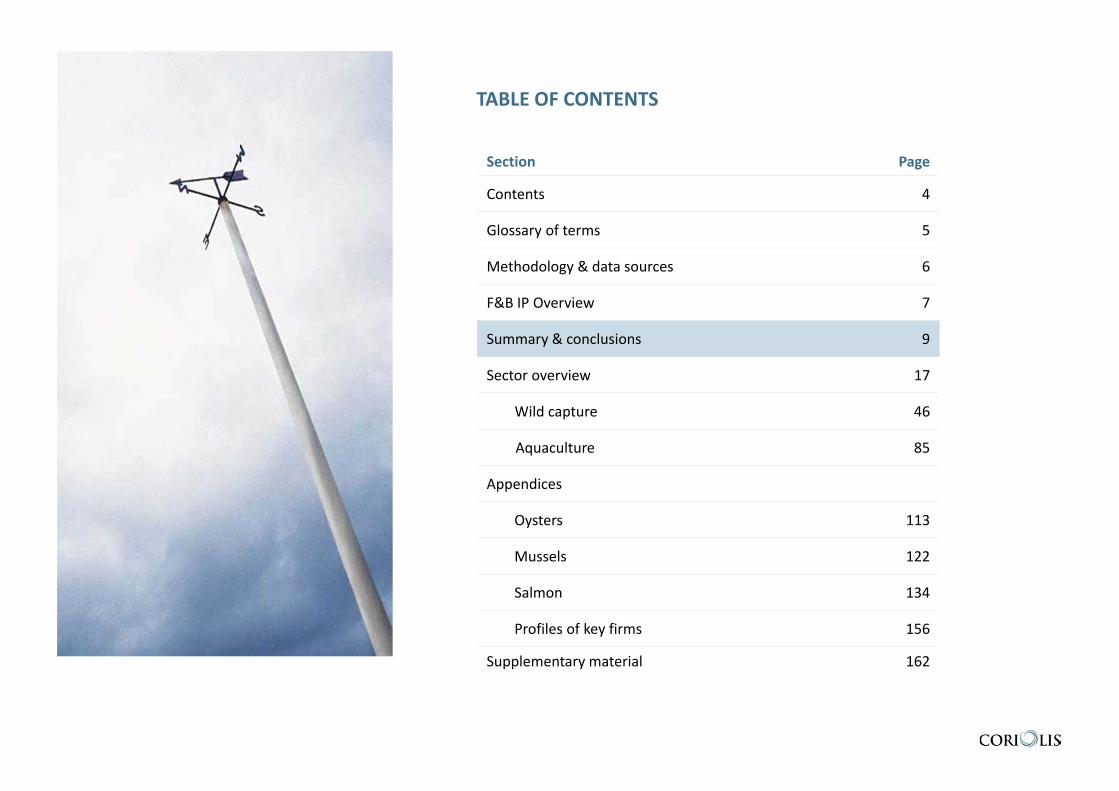
TABLE OF CONTENTS
Section Page
Contents 4
Glossary of terms 5
Methodology & data sources 6
F&B IP Overview 7
Summary & conclusions 9
Sector overview 17
Wild capture 46
Aquaculture 85
Appendices
Oysters 113
Mussels 122
Salmon 134
Profiles of key firms 156
Supplementary material 162
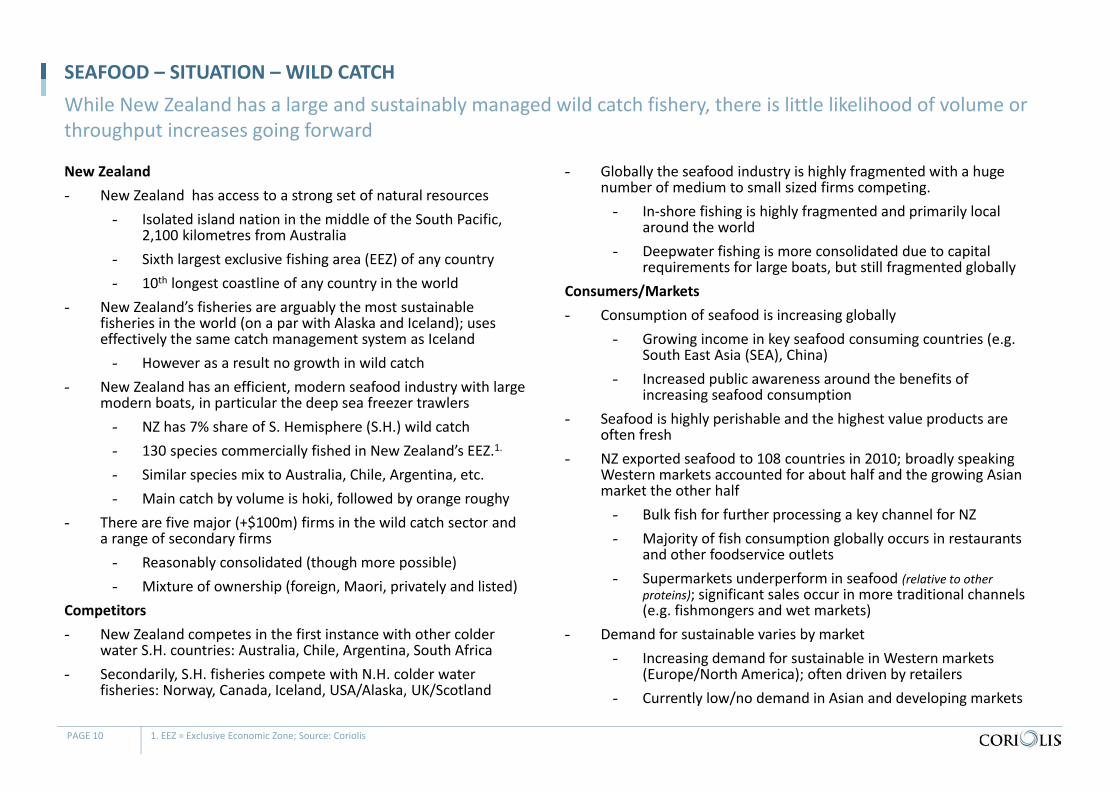
SEAFOOD – SITUATION – WILD CATCH
New Zealand- New Zealand has access to a strong set of natural resources
- Isolated island nation in the middle of the South Pacific, 2,100 kilometres from Australia
- Sixth largest exclusive fishing area (EEZ) of any country - 10th longest coastline of any country in the world
- New Zealand’s fisheries are arguably the most sustainable fisheries in the world (on a par with Alaska and Iceland); uses effectively the same catch management system as Iceland- However as a result no growth in wild catch
- New Zealand has an efficient, modern seafood industry with large modern boats, in particular the deep sea freezer trawlers- NZ has 7% share of S. Hemisphere (S.H.) wild catch- 130 species commercially fished in New Zealand’s EEZ.1.
- Similar species mix to Australia, Chile, Argentina, etc. - Main catch by volume is hoki, followed by orange roughy
- There are five major (+$100m) firms in the wild catch sector and a range of secondary firms- Reasonably consolidated (though more possible) - Mixture of ownership (foreign, Maori, privately and listed)
Competitors- New Zealand competes in the first instance with other colder
water S.H. countries: Australia, Chile, Argentina, South Africa- Secondarily, S.H. fisheries compete with N.H. colder water
fisheries: Norway, Canada, Iceland, USA/Alaska, UK/Scotland
- Globally the seafood industry is highly fragmented with a huge number of medium to small sized firms competing. - In‐shore fishing is highly fragmented and primarily local
around the world- Deepwater fishing is more consolidated due to capital
requirements for large boats, but still fragmented globallyConsumers/Markets- Consumption of seafood is increasing globally
- Growing income in key seafood consuming countries (e.g. South East Asia (SEA), China)
- Increased public awareness around the benefits of increasing seafood consumption
- Seafood is highly perishable and the highest value products are often fresh
- NZ exported seafood to 108 countries in 2010; broadly speaking Western markets accounted for about half and the growing Asian market the other half- Bulk fish for further processing a key channel for NZ- Majority of fish consumption globally occurs in restaurants
and other foodservice outlets- Supermarkets underperform in seafood (relative to other
proteins); significant sales occur in more traditional channels (e.g. fishmongers and wet markets)
- Demand for sustainable varies by market- Increasing demand for sustainable in Western markets
(Europe/North America); often driven by retailers - Currently low/no demand in Asian and developing markets
PAGE 10 1. EEZ = Exclusive Economic Zone; Source: Coriolis
While New Zealand has a large and sustainably managed wild catch fishery, there is little likelihood of volume or throughput increases going forward
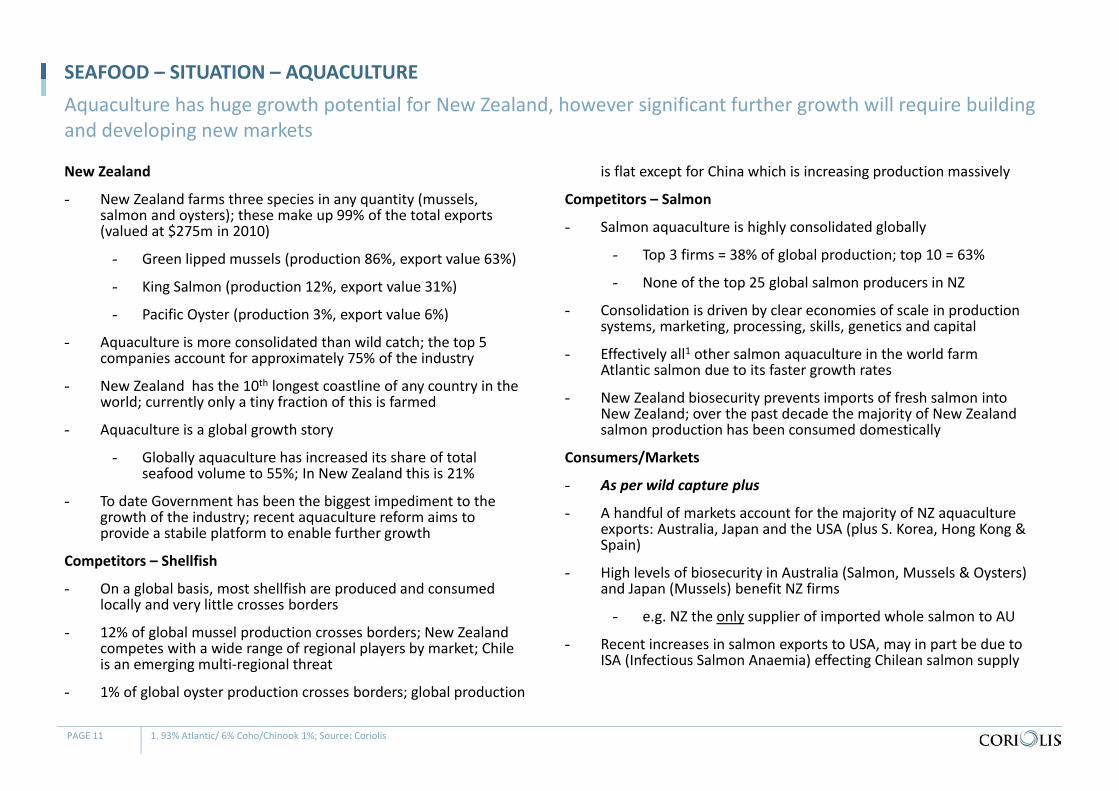
SEAFOOD – SITUATION – AQUACULTURE
New Zealand
- New Zealand farms three species in any quantity (mussels, salmon and oysters); these make up 99% of the total exports (valued at $275m in 2010)
- Green lipped mussels (production 86%, export value 63%)
- King Salmon (production 12%, export value 31%)
- Pacific Oyster (production 3%, export value 6%)
- Aquaculture is more consolidated than wild catch; the top 5 companies account for approximately 75% of the industry
- New Zealand has the 10th longest coastline of any country in the world; currently only a tiny fraction of this is farmed
- Aquaculture is a global growth story
- Globally aquaculture has increased its share of total seafood volume to 55%; In New Zealand this is 21%
- To date Government has been the biggest impediment to the growth of the industry; recent aquaculture reform aims to provide a stabile platform to enable further growth
Competitors – Shellfish
- On a global basis, most shellfish are produced and consumed locally and very little crosses borders
- 12% of global mussel production crosses borders; New Zealand competes with a wide range of regional players by market; Chile is an emerging multi‐regional threat
- 1% of global oyster production crosses borders; global production
is flat except for China which is increasing production massively
Competitors – Salmon
- Salmon aquaculture is highly consolidated globally
- Top 3 firms = 38% of global production; top 10 = 63%
- None of the top 25 global salmon producers in NZ
- Consolidation is driven by clear economies of scale in production systems, marketing, processing, skills, genetics and capital
- Effectively all1 other salmon aquaculture in the world farm Atlantic salmon due to its faster growth rates
- New Zealand biosecurity prevents imports of fresh salmon into New Zealand; over the past decade the majority of New Zealand salmon production has been consumed domestically
Consumers/Markets
- As per wild capture plus
- A handful of markets account for the majority of NZ aquaculture exports: Australia, Japan and the USA (plus S. Korea, Hong Kong & Spain)
- High levels of biosecurity in Australia (Salmon, Mussels & Oysters) and Japan (Mussels) benefit NZ firms
- e.g. NZ the only supplier of imported whole salmon to AU
- Recent increases in salmon exports to USA, may in part be due to ISA (Infectious Salmon Anaemia) effecting Chilean salmon supply
PAGE 11 1. 93% Atlantic/ 6% Coho/Chinook 1%; Source: Coriolis
Aquaculture has huge growth potential for New Zealand, however significant further growth will require building and developing new markets
Key metrics #(2010)
CAGR(00‐10)
CAGR(09‐10)
ABS(09‐10)
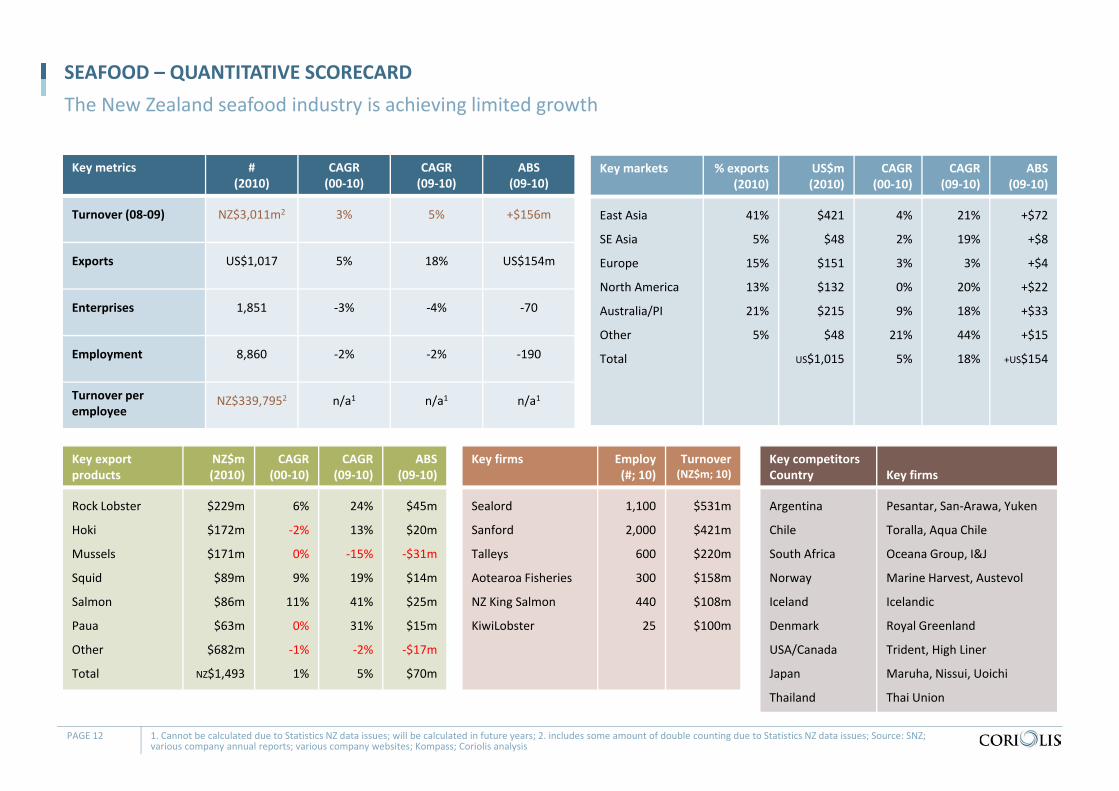
Turnover (08‐09) NZ$3,011m2 3% 5% +$156m
Exports US$1,017 5% 18% US$154m
Enterprises 1,851 ‐3% ‐4% ‐70
Employment 8,860 ‐2% ‐2% ‐190
Turnover per employee
NZ$339,7952 n/a1 n/a1 n/a1
SEAFOOD – QUANTITATIVE SCORECARD The New Zealand seafood industry is achieving limited growth
PAGE 12 1. Cannot be calculated due to Statistics NZ data issues; will be calculated in future years; 2. includes some amount of double counting due to Statistics NZ data issues; Source: SNZ; various company annual reports; various company websites; Kompass; Coriolis analysis
Key firms Employ(#; 10)
Turnover(NZ$m; 10)
Sealord
Sanford
Talleys
Aotearoa Fisheries
NZ King Salmon
KiwiLobster
1,100
2,000
600
300
440
25
$531m
$421m
$220m
$158m
$108m
$100m
Key markets % exports(2010)
US$m(2010)
CAGR(00‐10)
CAGR(09‐10)
ABS(09‐10)
East Asia
SE Asia
Europe
North America
Australia/PI
Other
Total
41%
5%
15%
13%
21%
5%
$421
$48
$151
$132
$215
$48
US$1,015
4%
2%
3%
0%
9%
21%
5%
21%
19%
3%
20%
18%
44%
18%
+$72
+$8
+$4
+$22
+$33
+$15
+US$154
Key competitorsCountry Key firms
Argentina
Chile
South Africa
Norway
Iceland
Denmark
USA/Canada
Japan
Thailand
Pesantar, San‐Arawa, Yuken
Toralla, Aqua Chile
Oceana Group, I&J
Marine Harvest, Austevol
Icelandic
Royal Greenland
Trident, High Liner
Maruha, Nissui, Uoichi
Thai Union
Key export products
NZ$m(2010)
CAGR(00‐10)
CAGR(09‐10)
ABS(09‐10)
Rock Lobster
Hoki
Mussels
Squid
Salmon
Paua
Other
Total
$229m
$172m
$171m
$89m
$86m
$63m
$682m
NZ$1,493
6%
‐2%
0%
9%
11%
0%
‐1%
1%
24%
13%
‐15%
19%
41%
31%
‐2%
5%
$45m
$20m
‐$31m
$14m
$25m
$15m
‐$17m
$70m
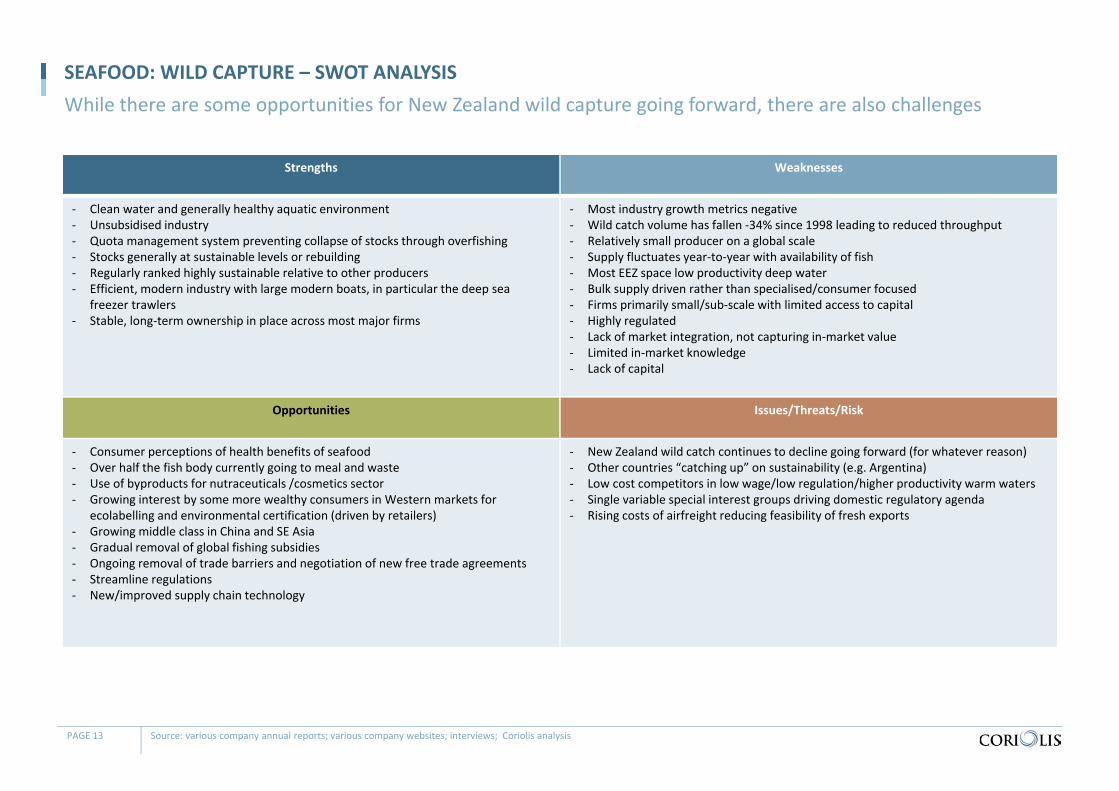
SEAFOOD: WILD CAPTURE – SWOT ANALYSISWhile there are some opportunities for New Zealand wild capture going forward, there are also challenges
PAGE 13 Source: various company annual reports; various company websites; interviews; Coriolis analysis
Strengths Weaknesses
‐ Clean water and generally healthy aquatic environment‐ Unsubsidised industry‐ Quota management system preventing collapse of stocks through overfishing‐ Stocks generally at sustainable levels or rebuilding‐ Regularly ranked highly sustainable relative to other producers‐ Efficient, modern industry with large modern boats, in particular the deep sea
freezer trawlers‐ Stable, long‐term ownership in place across most major firms
‐ Most industry growth metrics negative‐ Wild catch volume has fallen ‐34% since 1998 leading to reduced throughput‐ Relatively small producer on a global scale‐ Supply fluctuates year‐to‐year with availability of fish‐ Most EEZ space low productivity deep water‐ Bulk supply driven rather than specialised/consumer focused‐ Firms primarily small/sub‐scale with limited access to capital‐ Highly regulated‐ Lack of market integration, not capturing in‐market value‐ Limited in‐market knowledge‐ Lack of capital
Opportunities Issues/Threats/Risk
‐ Consumer perceptions of health benefits of seafood‐ Over half the fish body currently going to meal and waste‐ Use of byproducts for nutraceuticals /cosmetics sector‐ Growing interest by some more wealthy consumers in Western markets for
ecolabelling and environmental certification (driven by retailers)‐ Growing middle class in China and SE Asia‐ Gradual removal of global fishing subsidies‐ Ongoing removal of trade barriers and negotiation of new free trade agreements‐ Streamline regulations‐ New/improved supply chain technology
‐ New Zealand wild catch continues to decline going forward (for whatever reason)‐ Other countries “catching up” on sustainability (e.g. Argentina)‐ Low cost competitors in low wage/low regulation/higher productivity warm waters‐ Single variable special interest groups driving domestic regulatory agenda‐ Rising costs of airfreight reducing feasibility of fresh exports
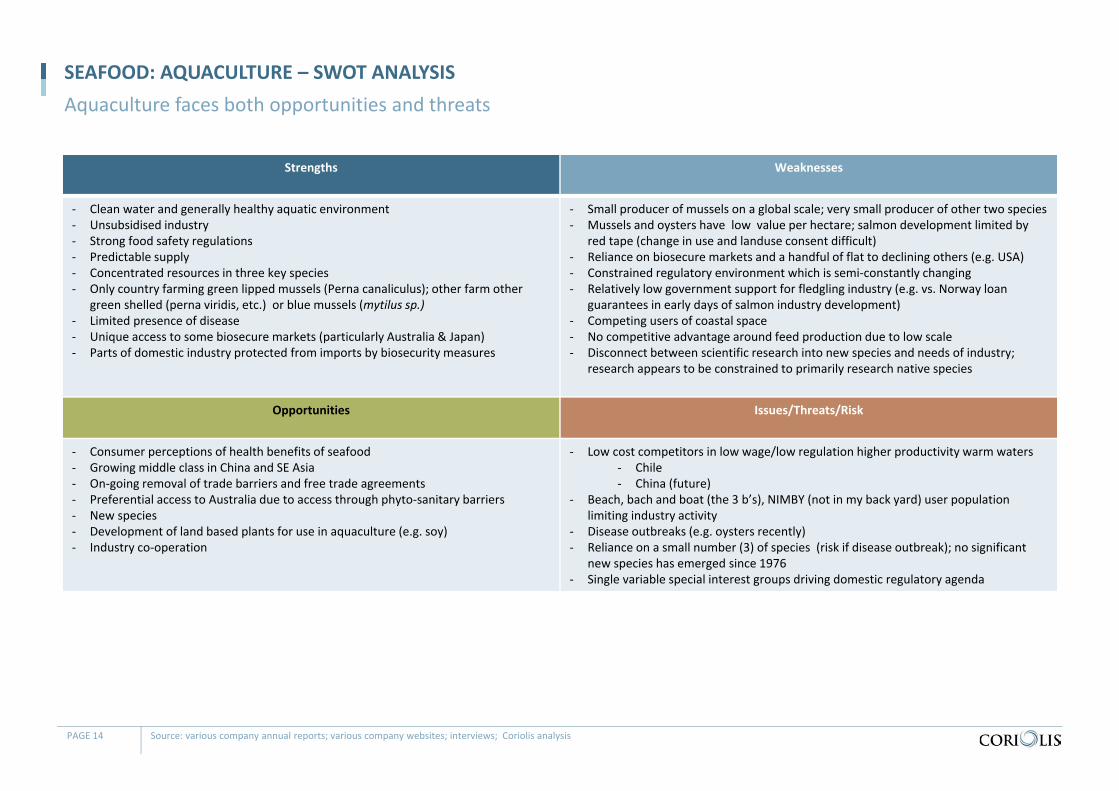
SEAFOOD: AQUACULTURE – SWOT ANALYSISAquaculture faces both opportunities and threats
PAGE 14 Source: various company annual reports; various company websites; interviews; Coriolis analysis
Strengths Weaknesses
‐ Clean water and generally healthy aquatic environment‐ Unsubsidised industry‐ Strong food safety regulations‐ Predictable supply‐ Concentrated resources in three key species‐ Only country farming green lipped mussels (Perna canaliculus); other farm other
green shelled (perna viridis, etc.) or blue mussels (mytilus sp.)‐ Limited presence of disease‐ Unique access to some biosecure markets (particularly Australia & Japan)‐ Parts of domestic industry protected from imports by biosecurity measures
‐ Small producer of mussels on a global scale; very small producer of other two species‐ Mussels and oysters have low value per hectare; salmon development limited by
red tape (change in use and landuse consent difficult) ‐ Reliance on biosecure markets and a handful of flat to declining others (e.g. USA)‐ Constrained regulatory environment which is semi‐constantly changing‐ Relatively low government support for fledgling industry (e.g. vs. Norway loan
guarantees in early days of salmon industry development)‐ Competing users of coastal space‐ No competitive advantage around feed production due to low scale‐ Disconnect between scientific research into new species and needs of industry;
research appears to be constrained to primarily research native species
Opportunities Issues/Threats/Risk
‐ Consumer perceptions of health benefits of seafood‐ Growing middle class in China and SE Asia‐ On‐going removal of trade barriers and free trade agreements‐ Preferential access to Australia due to access through phyto‐sanitary barriers‐ New species‐ Development of land based plants for use in aquaculture (e.g. soy)‐ Industry co‐operation
‐ Low cost competitors in low wage/low regulation higher productivity warm waters‐ Chile‐ China (future)
‐ Beach, bach and boat (the 3 b’s), NIMBY (not in my back yard) user population limiting industry activity
‐ Disease outbreaks (e.g. oysters recently)‐ Reliance on a small number (3) of species (risk if disease outbreak); no significant
new species has emerged since 1976‐ Single variable special interest groups driving domestic regulatory agenda
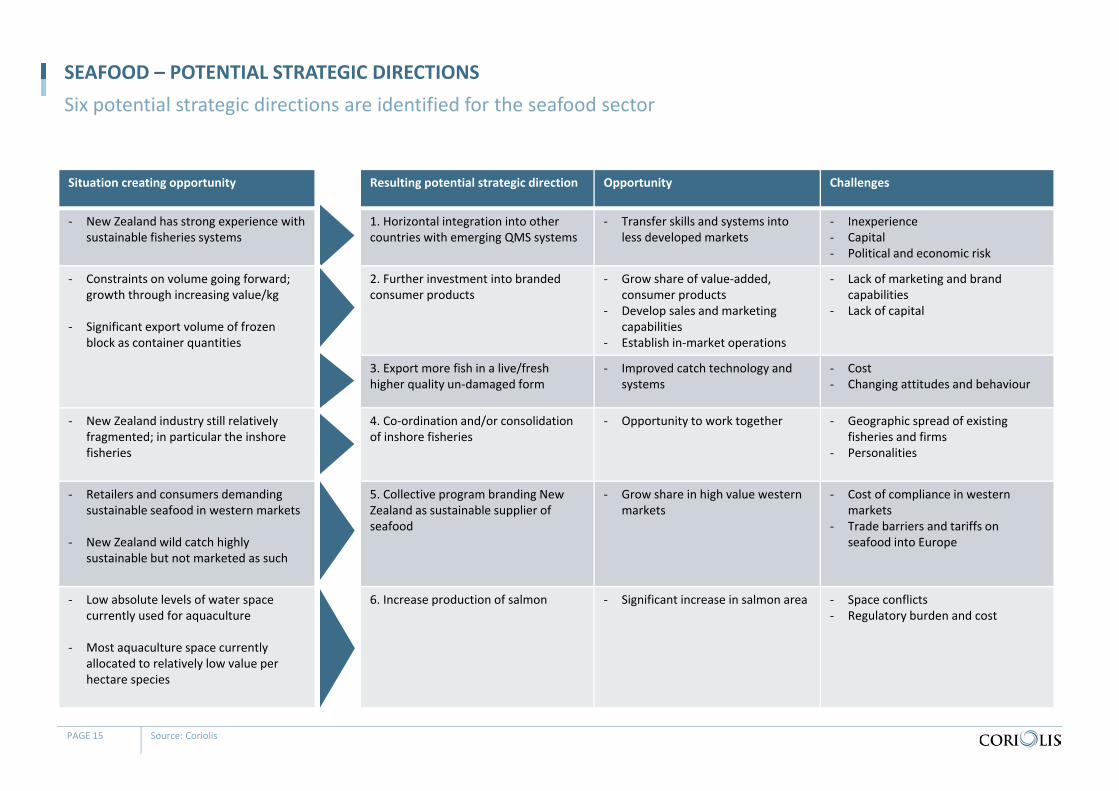
SEAFOOD – POTENTIAL STRATEGIC DIRECTIONSSix potential strategic directions are identified for the seafood sector
Situation creating opportunity Resulting potential strategic direction Opportunity Challenges
‐ New Zealand has strong experience with sustainable fisheries systems
1. Horizontal integration into other countries with emerging QMS systems
‐ Transfer skills and systems into less developed markets
‐ Inexperience‐ Capital‐ Political and economic risk
‐ Constraints on volume going forward; growth through increasing value/kg
‐ Significant export volume of frozen block as container quantities
2. Further investment into brandedconsumer products
‐ Grow share of value‐added, consumer products
‐ Develop sales and marketingcapabilities
‐ Establish in‐market operations
‐ Lack of marketing and brand capabilities
‐ Lack of capital
3. Export more fish in a live/fresh higher quality un‐damaged form
‐ Improved catch technology and systems
‐ Cost‐ Changing attitudes and behaviour
‐ New Zealand industry still relatively fragmented; in particular the inshore fisheries
4. Co‐ordination and/or consolidationof inshore fisheries
‐ Opportunity to work together ‐ Geographic spread of existing fisheries and firms
‐ Personalities
‐ Retailers and consumers demanding sustainable seafood in western markets
‐ New Zealand wild catch highly sustainable but not marketed as such
5. Collective program branding New Zealand as sustainable supplier of seafood
‐ Grow share in high value western markets
‐ Cost of compliance in westernmarkets
‐ Trade barriers and tariffs on seafood into Europe
‐ Low absolute levels of water space currently used for aquaculture
‐ Most aquaculture space currently allocated to relatively low value per hectare species
6. Increase production of salmon ‐ Significant increase in salmon area ‐ Space conflicts‐ Regulatory burden and cost
PAGE 15 Source: Coriolis
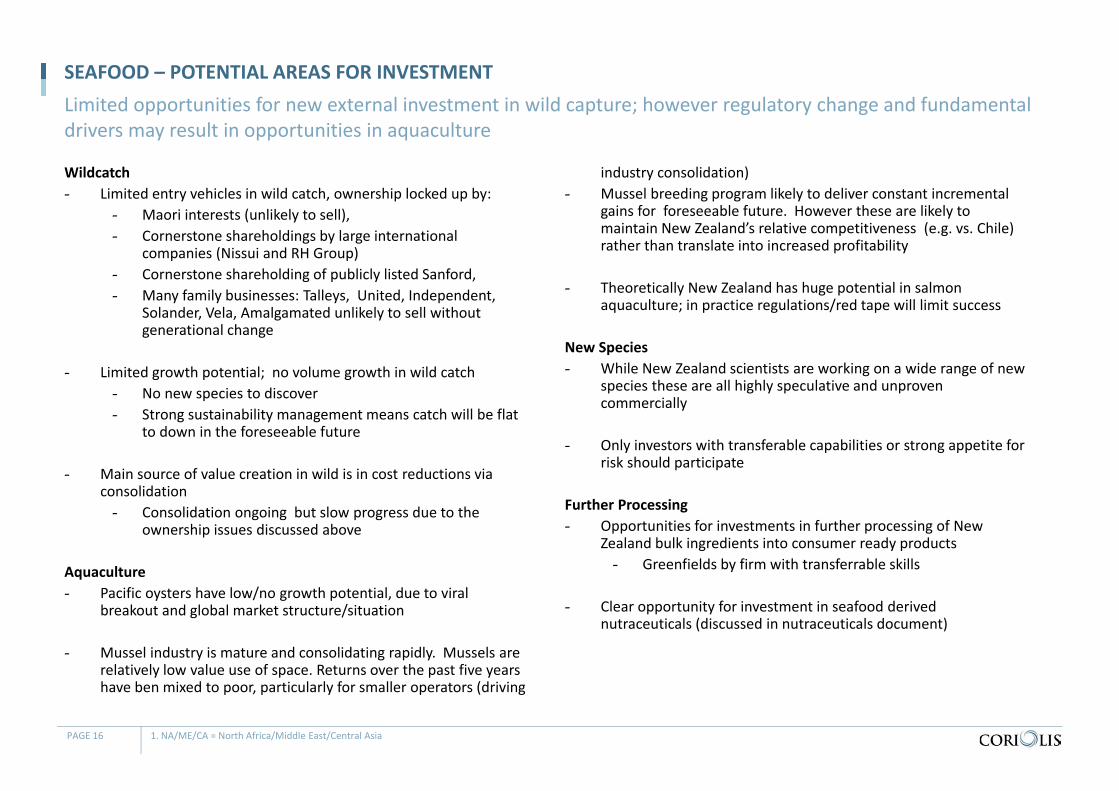
SEAFOOD – POTENTIAL AREAS FOR INVESTMENT
Wildcatch- Limited entry vehicles in wild catch, ownership locked up by:
- Maori interests (unlikely to sell), - Cornerstone shareholdings by large international
companies (Nissui and RH Group)- Cornerstone shareholding of publicly listed Sanford, - Many family businesses: Talleys, United, Independent,
Solander, Vela, Amalgamated unlikely to sell without generational change
- Limited growth potential; no volume growth in wild catch- No new species to discover- Strong sustainability management means catch will be flat
to down in the foreseeable future
- Main source of value creation in wild is in cost reductions via consolidation- Consolidation ongoing but slow progress due to the
ownership issues discussed above
Aquaculture- Pacific oysters have low/no growth potential, due to viral
breakout and global market structure/situation
- Mussel industry is mature and consolidating rapidly. Mussels are relatively low value use of space. Returns over the past five years have ben mixed to poor, particularly for smaller operators (driving
industry consolidation)- Mussel breeding program likely to deliver constant incremental
gains for foreseeable future. However these are likely to maintain New Zealand’s relative competitiveness (e.g. vs. Chile) rather than translate into increased profitability
- Theoretically New Zealand has huge potential in salmon aquaculture; in practice regulations/red tape will limit success
New Species- While New Zealand scientists are working on a wide range of new
species these are all highly speculative and unproven commercially
- Only investors with transferable capabilities or strong appetite for risk should participate
Further Processing- Opportunities for investments in further processing of New
Zealand bulk ingredients into consumer ready products - Greenfields by firm with transferrable skills
- Clear opportunity for investment in seafood derived nutraceuticals (discussed in nutraceuticals document)
PAGE 16 1. NA/ME/CA = North Africa/Middle East/Central Asia
Limited opportunities for new external investment in wild capture; however regulatory change and fundamental drivers may result in opportunities in aquaculture

TABLE OF CONTENTS
Section Page
Contents 4
Glossary of terms 5
Methodology & data sources 6
F&B IP Overview 7
Summary & conclusions 9
Sector overview 17
Wild capture 46
Aquaculture 85
Appendices
Oysters 113
Mussels 122
Salmon 134
Profiles of key firms 156
Supplementary material 162
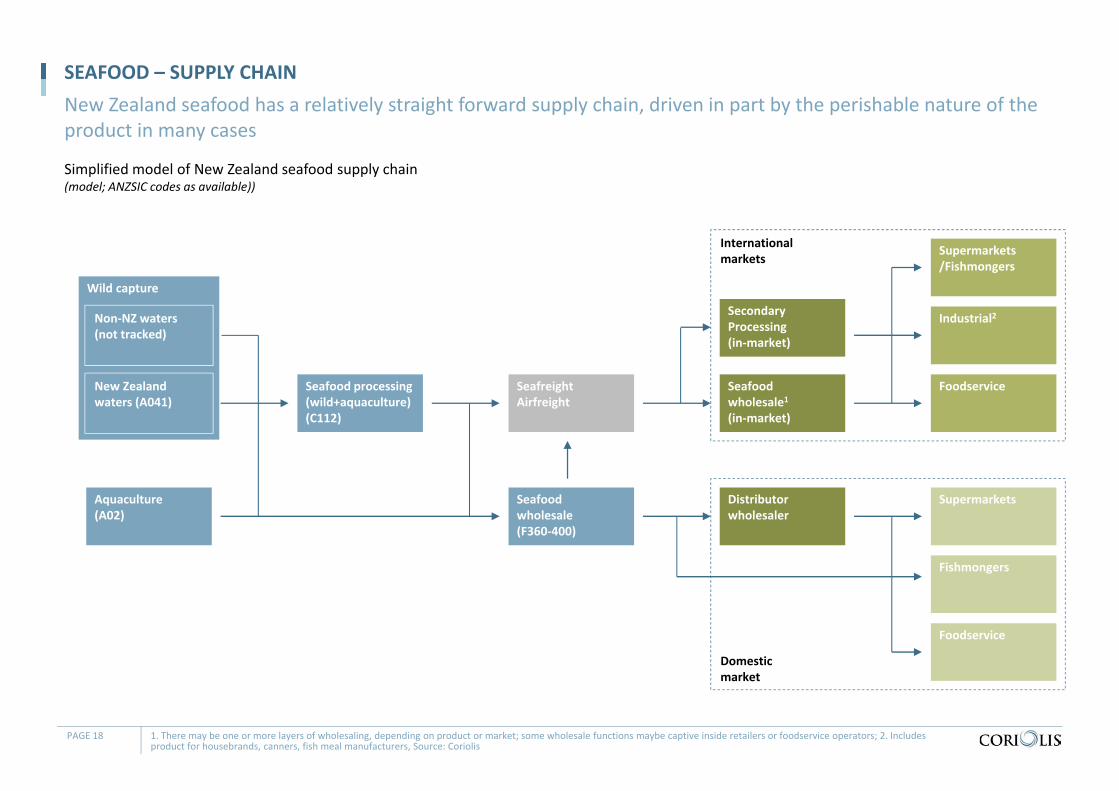
Simplified model of New Zealand seafood supply chain(model; ANZSIC codes as available))
SEAFOOD – SUPPLY CHAINNew Zealand seafood has a relatively straight forward supply chain, driven in part by the perishable nature of the product in many cases
PAGE 18 1. There may be one or more layers of wholesaling, depending on product or market; some wholesale functions maybe captive inside retailers or foodservice operators; 2. Includes product for housebrands, canners, fish meal manufacturers, Source: Coriolis
Aquaculture(A02)
New Zealand waters (A041)
Seafood processing (wild+aquaculture)(C112)
Seafood wholesale(F360‐400)
SeafreightAirfreight
Supermarkets
Fishmongers
Foodservice
Seafood wholesale1(in‐market)
Supermarkets/Fishmongers
Industrial2
Foodservice
Internationalmarkets
Domesticmarket
Non‐NZ waters(not tracked)
Wild capture
Distributorwholesaler
SecondaryProcessing(in‐market)
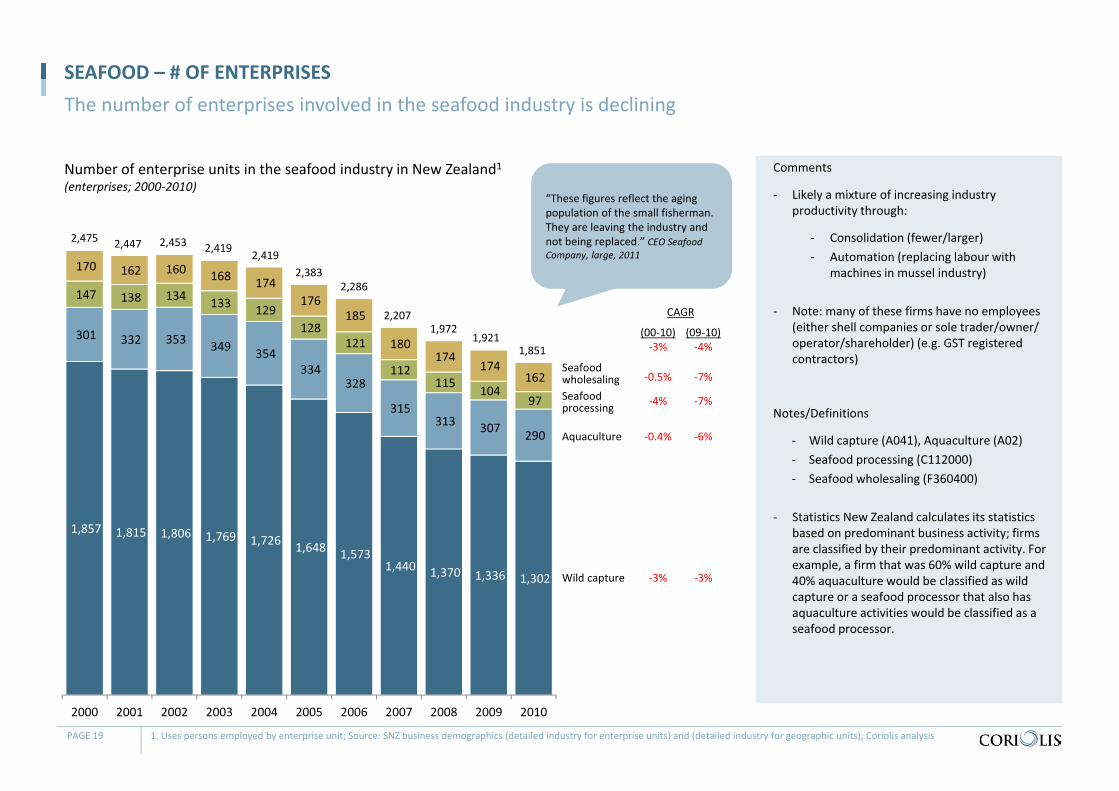
Number of enterprise units in the seafood industry in New Zealand1(enterprises; 2000‐2010)
SEAFOOD – # OF ENTERPRISESThe number of enterprises involved in the seafood industry is declining
PAGE 19 1. Uses persons employed by enterprise unit; Source: SNZ business demographics (detailed industry for enterprise units) and (detailed industry for geographic units); Coriolis analysis
Comments
‐ Likely a mixture of increasing industry productivity through:
‐ Consolidation (fewer/larger)‐ Automation (replacing labour with
machines in mussel industry)
‐ Note: many of these firms have no employees (either shell companies or sole trader/owner/ operator/shareholder) (e.g. GST registered contractors)
Notes/Definitions
‐ Wild capture (A041), Aquaculture (A02)‐ Seafood processing (C112000)‐ Seafood wholesaling (F360400)
‐ Statistics New Zealand calculates its statistics based on predominant business activity; firms are classified by their predominant activity. For example, a firm that was 60% wild capture and 40% aquaculture would be classified as wild capture or a seafood processor that also has aquaculture activities would be classified as a seafood processor.
1,857 1,815 1,806 1,769 1,726 1,648 1,573 1,440 1,370 1,336 1,302
301 332 353 349 354 334
328
315 313 307 290
147 138 134 133 129 128
121
112 115 104
97
170 162 160 168 174 176
185
180 174
174 162
2000 2001 2002 2003 2004 2005 2006 2007 2008 2009 2010
Wild capture
Aquaculture
Seafood processing
Seafood wholesaling
2,475 2,447 2,453 2,419 2,4192,383
2,286
2,2071,972
1,9211,851
(00‐10)‐3%
‐0.5%
‐4%
(09‐10)‐4%
‐7%
‐7%
CAGR
‐0.4% ‐6%
‐3% ‐3%
“These figures reflect the aging population of the small fisherman. They are leaving the industry and not being replaced.” CEO Seafood Company, large, 2011
SEAFOOD – DRIVERS OF DECLINE
1. Declining wild catch
- “The decline in revenue is due primarily to the decline in hoki catch. With a dramatic decrease in the hoki quota we saw a big decline in our revenue.” Seafood Company, large, 2011
- “Hoki was the biggest influence on those figures. Sales really reduced.” Seafood Company, large, 2011
2. Restructuring
- “Companies couldn’t compete with onshore processing; they had to take processing offshore or die.” Seafood Industry representative, 2011
- “Companies have had to restructure due to the lower [US] dollar.” CEO, Seafood Company, large, 2011
- “We have restructured and reduced the number of plants we have and consolidated in some areas. Our profit is up. We have good species.” CEO, Seafood Company, medium, 2011
- “There is consolidation of the inshore operations and mussels but not deepwater and not salmon. It had to happen in mussels. When the US dollar was at 45 cents everyone was making money, but when it was over 65 cents there was no money to be made. The industry stalled and had to restructure due to lack of funds.” CEO, Seafood Company, large, 2011
- “The economies of scale are with the sizes of the boats. Boat size matches the size of the fisheries. Small boats in‐shore and large boats offshore. This hasn’t really changed in the last decade.” CEO, Seafood Company, large, 2011
PAGE 20
Declining industry metrics were seen as driven by (1) declining wild catch, particularly hoki and (2) market pressures leading to restructuring to control costs
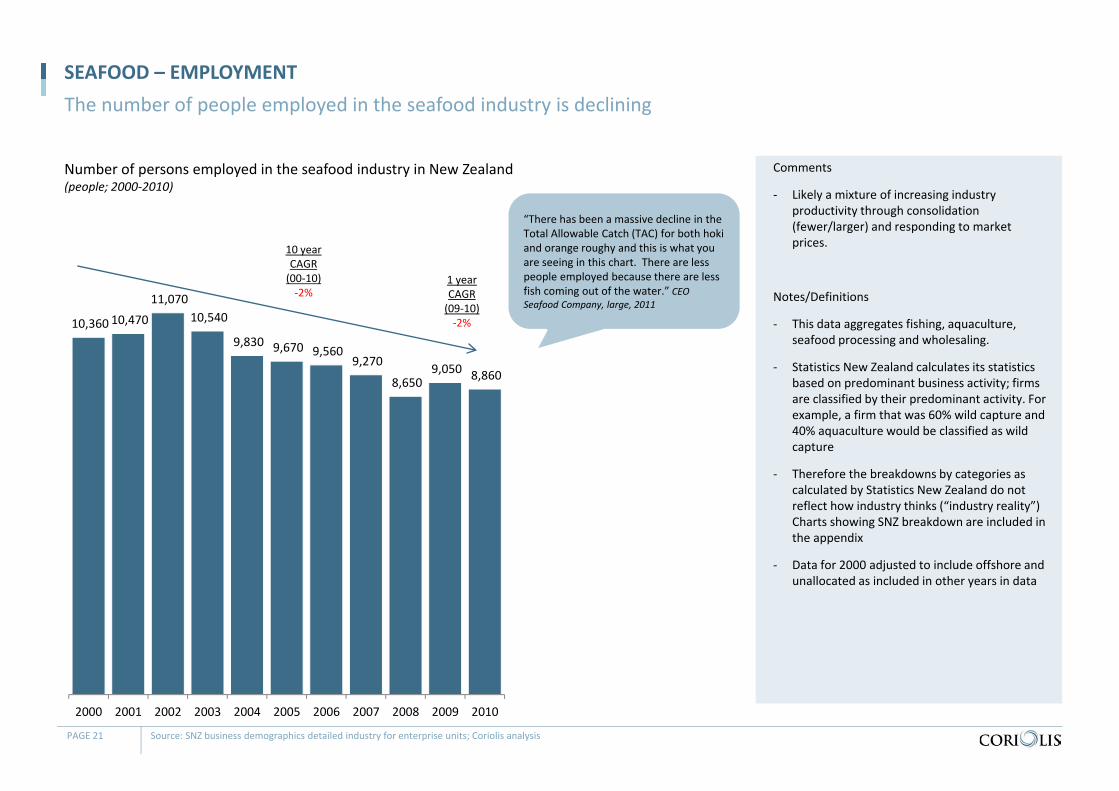
Number of persons employed in the seafood industry in New Zealand(people; 2000‐2010)
SEAFOOD – EMPLOYMENTThe number of people employed in the seafood industry is declining
PAGE 21 Source: SNZ business demographics detailed industry for enterprise units; Coriolis analysis
Comments
‐ Likely a mixture of increasing industry productivity through consolidation (fewer/larger) and responding to market prices.
Notes/Definitions
‐ This data aggregates fishing, aquaculture, seafood processing and wholesaling.
‐ Statistics New Zealand calculates its statistics based on predominant business activity; firms are classified by their predominant activity. For example, a firm that was 60% wild capture and 40% aquaculture would be classified as wild capture
‐ Therefore the breakdowns by categories as calculated by Statistics New Zealand do not reflect how industry thinks (“industry reality”) Charts showing SNZ breakdown are included in the appendix
‐ Data for 2000 adjusted to include offshore and unallocated as included in other years in data
10,360 10,470 11,070
10,540
9,830 9,670 9,560 9,270
8,650 9,050 8,860
2000 2001 2002 2003 2004 2005 2006 2007 2008 2009 2010
10 yearCAGR(00‐10)‐2%
1 yearCAGR(09‐10)‐2%
“There has been a massive decline in the Total Allowable Catch (TAC) for both hokiand orange roughy and this is what you are seeing in this chart. There are less people employed because there are less fish coming out of the water.” CEO Seafood Company, large, 2011
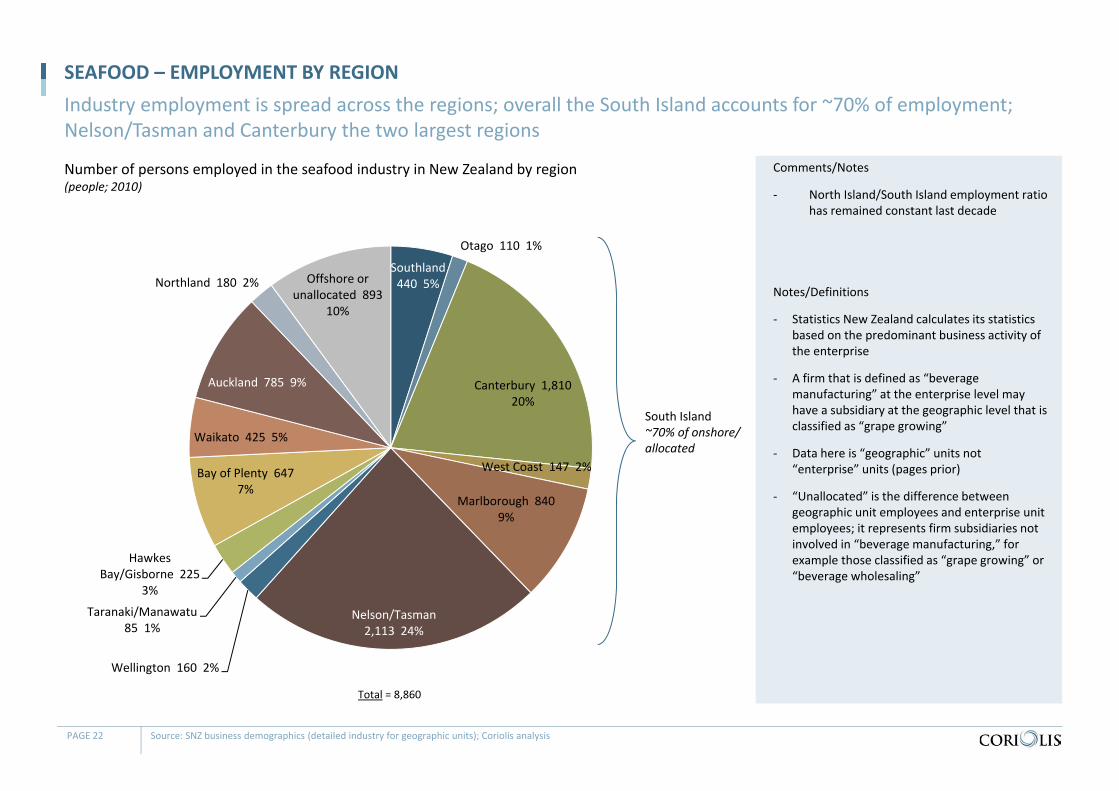
Number of persons employed in the seafood industry in New Zealand by region(people; 2010)
SEAFOOD – EMPLOYMENT BY REGIONIndustry employment is spread across the regions; overall the South Island accounts for ~70% of employment; Nelson/Tasman and Canterbury the two largest regions
PAGE 22 Source: SNZ business demographics (detailed industry for geographic units); Coriolis analysis
Comments/Notes
‐ North Island/South Island employment ratio has remained constant last decade
Notes/Definitions
‐ Statistics New Zealand calculates its statistics based on the predominant business activity of the enterprise
‐ A firm that is defined as “beverage manufacturing” at the enterprise level may have a subsidiary at the geographic level that is classified as “grape growing”
‐ Data here is “geographic” units not “enterprise” units (pages prior)
‐ “Unallocated” is the difference between geographic unit employees and enterprise unit employees; it represents firm subsidiaries not involved in “beverage manufacturing,” for example those classified as “grape growing” or “beverage wholesaling”
Total = 8,860
Southland 440 5%
Otago 110 1%
Canterbury 1,810 20%
West Coast 147 2%
Marlborough 840 9%
Nelson/Tasman 2,113 24%
Wellington 160 2%
Taranaki/Manawatu 85 1%
Hawkes Bay/Gisborne 225
3%
Bay of Plenty 647 7%
Waikato 425 5%
Auckland 785 9%
Northland 180 2% Offshore or unallocated 893
10%
South Island~70% of onshore/ allocated
540 490 555 480 440 455 500 440 445 455 440
357 424 405 461 450 433 260 150 123 103 110
1,805 1,890 2,000 1,980 1,825 1,810 1,640
1,655 1,485 1,795 1,810
168 138 148 153
123 148 98 133
151 121 147
715 780 765 710
655 700 680 725
635
855 840
3,135 3,025 3,208 3,088
2,742 2,695 2,790 2,745
2,508
2,296 2,113
248 348 393
265
205 210 220 275
205 175
160
177 159 133
124
115 88 82 86
87 98
85
236 241 219
196
248 208 160 197
193 197
225
446 501 502
530
380 540 715 620
630 590 647
515 555
590 595
565 545 510 460
445 425 425
980 835
1,030
945
930 830 855
830
760 850 785
259 172
213
172
240 257 374 233
226 280
180
779 912
909
841
912 751 676 721
757
810 893
2000 2001 2002 2003 2004 2005 2006 2007 2008 2009 2010
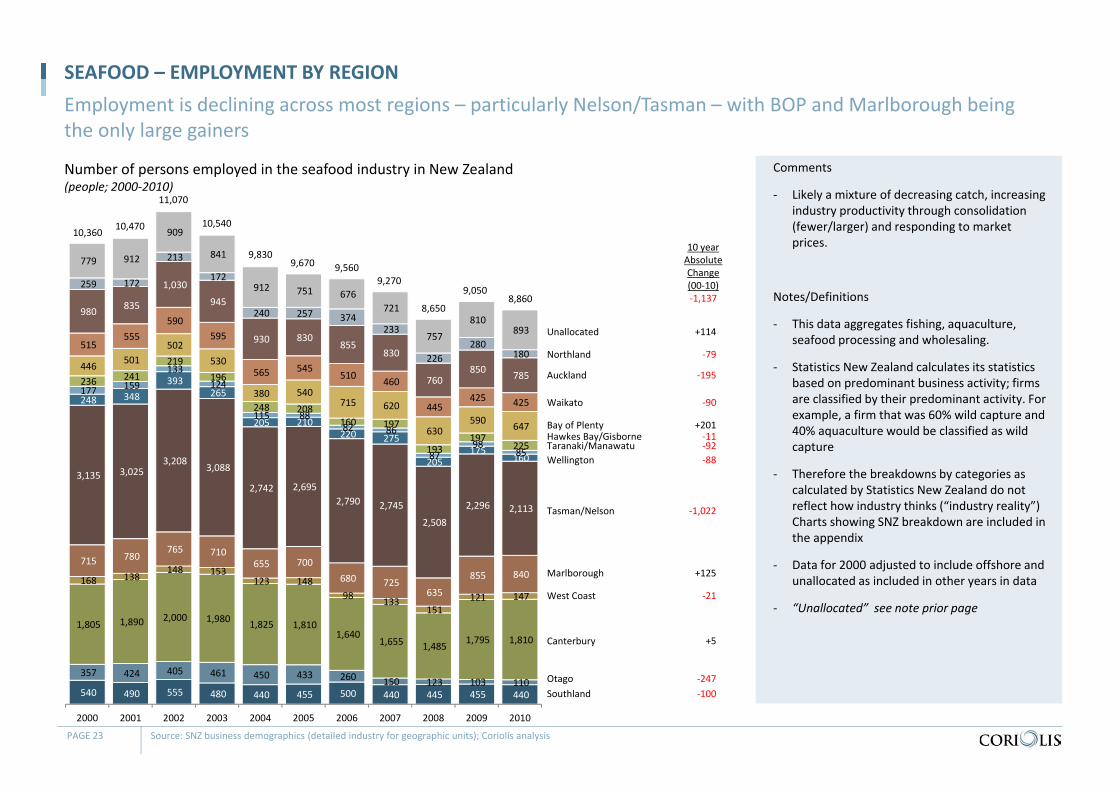
Number of persons employed in the seafood industry in New Zealand(people; 2000‐2010)
SEAFOOD – EMPLOYMENT BY REGIONEmployment is declining across most regions – particularly Nelson/Tasman – with BOP and Marlborough being the only large gainers
PAGE 23 Source: SNZ business demographics (detailed industry for geographic units); Coriolis analysis
Comments
‐ Likely a mixture of decreasing catch, increasing industry productivity through consolidation (fewer/larger) and responding to market prices.
Notes/Definitions
‐ This data aggregates fishing, aquaculture, seafood processing and wholesaling.
‐ Statistics New Zealand calculates its statistics based on predominant business activity; firms are classified by their predominant activity. For example, a firm that was 60% wild capture and 40% aquaculture would be classified as wild capture
‐ Therefore the breakdowns by categories as calculated by Statistics New Zealand do not reflect how industry thinks (“industry reality”) Charts showing SNZ breakdown are included in the appendix
‐ Data for 2000 adjusted to include offshore and unallocated as included in other years in data
‐ “Unallocated” see note prior page
10 yearAbsoluteChange(00‐10)‐1,137
SouthlandOtago
Canterbury
West Coast
Marlborough
Tasman/Nelson
WellingtonTaranaki/ManawatuHawkes Bay/GisborneBay of Plenty
Waikato
Auckland
Northland
Unallocated
10,360 10,470
11,070
10,540
9,8309,670 9,560
9,270
8,650
9,0508,860
‐100‐247
+5
‐21
+125
‐1,022
‐88‐92‐11
+201
‐90
‐195
‐79
+114
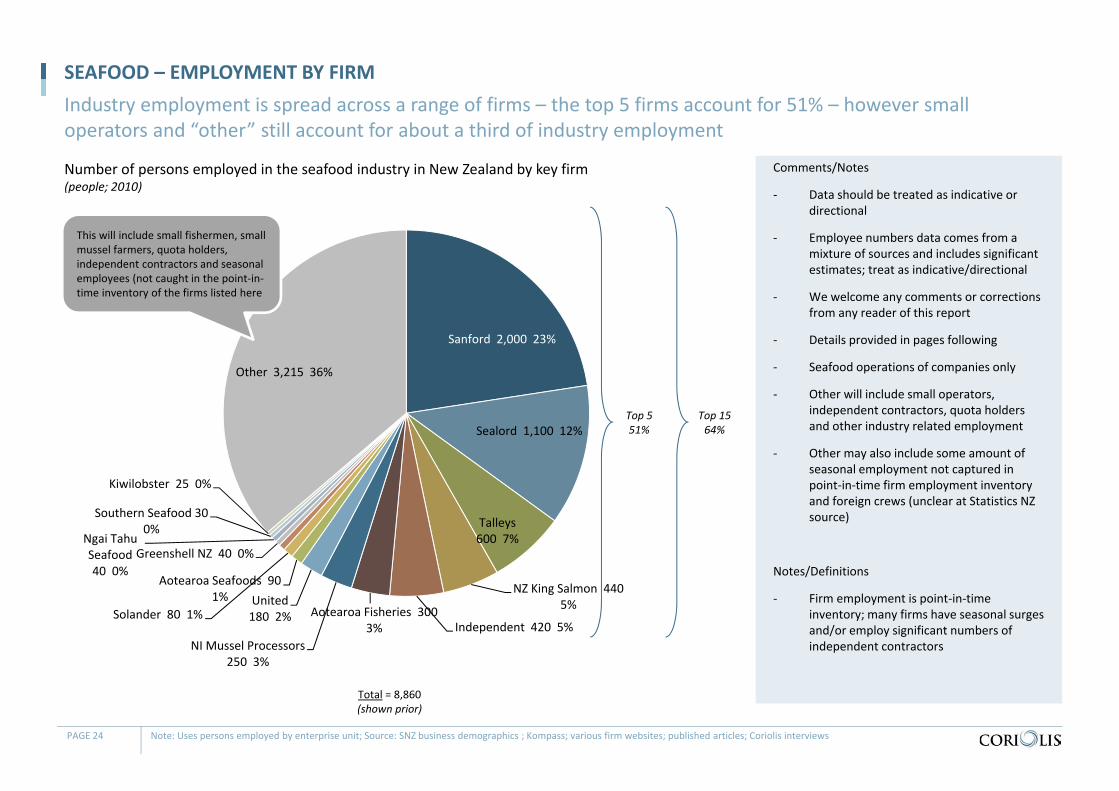
Number of persons employed in the seafood industry in New Zealand by key firm(people; 2010)
SEAFOOD – EMPLOYMENT BY FIRMIndustry employment is spread across a range of firms – the top 5 firms account for 51% – however small operators and “other” still account for about a third of industry employment
PAGE 24 Note: Uses persons employed by enterprise unit; Source: SNZ business demographics ; Kompass; various firm websites; published articles; Coriolis interviews
Comments/Notes
‐ Data should be treated as indicative or directional
‐ Employee numbers data comes from a mixture of sources and includes significant estimates; treat as indicative/directional
‐ We welcome any comments or corrections from any reader of this report
‐ Details provided in pages following
‐ Seafood operations of companies only
‐ Other will include small operators, independent contractors, quota holders and other industry related employment
‐ Other may also include some amount of seasonal employment not captured in point‐in‐time firm employment inventory and foreign crews (unclear at Statistics NZ source)
Notes/Definitions
‐ Firm employment is point‐in‐time inventory; many firms have seasonal surges and/or employ significant numbers of independent contractors
Sanford 2,000 23%
Sealord 1,100 12%
Talleys 600 7%
NZ King Salmon 440 5%
Independent 420 5%Aotearoa Fisheries 300
3%NI Mussel Processors
250 3%
United 180 2%
Aotearoa Seafoods 90 1%
Solander 80 1%
Greenshell NZ 40 0%Ngai Tahu Seafood 40 0%
Southern Seafood 30 0%
Kiwilobster 25 0%
Other 3,215 36%
Total = 8,860 (shown prior)
Top 1564%
This will include small fishermen, small mussel farmers, quota holders, independent contractors and seasonal employees (not caught in the point‐in‐time inventory of the firms listed here
Top 551%
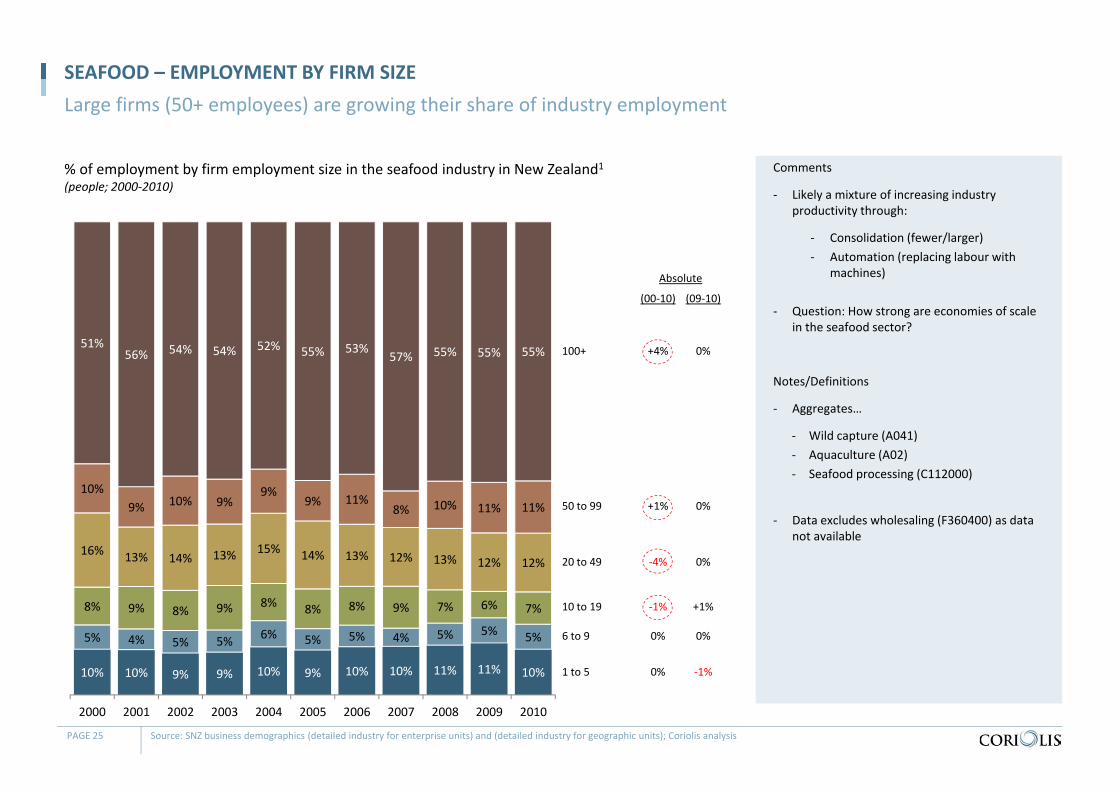
% of employment by firm employment size in the seafood industry in New Zealand1(people; 2000‐2010)
SEAFOOD – EMPLOYMENT BY FIRM SIZELarge firms (50+ employees) are growing their share of industry employment
PAGE 25 Source: SNZ business demographics (detailed industry for enterprise units) and (detailed industry for geographic units); Coriolis analysis
Comments
‐ Likely a mixture of increasing industry productivity through:
‐ Consolidation (fewer/larger)‐ Automation (replacing labour with
machines)
‐ Question: How strong are economies of scale in the seafood sector?
Notes/Definitions
‐ Aggregates…
‐ Wild capture (A041)‐ Aquaculture (A02)‐ Seafood processing (C112000)
‐ Data excludes wholesaling (F360400) as data not available
1 to 5
6 to 9
(00‐10) (09‐10)
Absolute
0% 0%
0% ‐1%10% 10% 9% 9% 10% 9% 10% 10% 11% 11% 10%
5% 4% 5% 5% 6% 5% 5% 4% 5% 5% 5%
8% 9% 8% 9% 8% 8% 8% 9% 7% 6% 7%
16% 13% 14% 13% 15% 14% 13% 12% 13% 12% 12%
10%9% 10% 9%
9%9% 11%
8% 10% 11% 11%
51%56% 54% 54% 52% 55% 53%
57% 55% 55% 55%
2000 2001 2002 2003 2004 2005 2006 2007 2008 2009 2010
10 to 19 ‐1% +1%
20 to 49 ‐4% 0%
50 to 99 +1% 0%
100+ +4% 0%
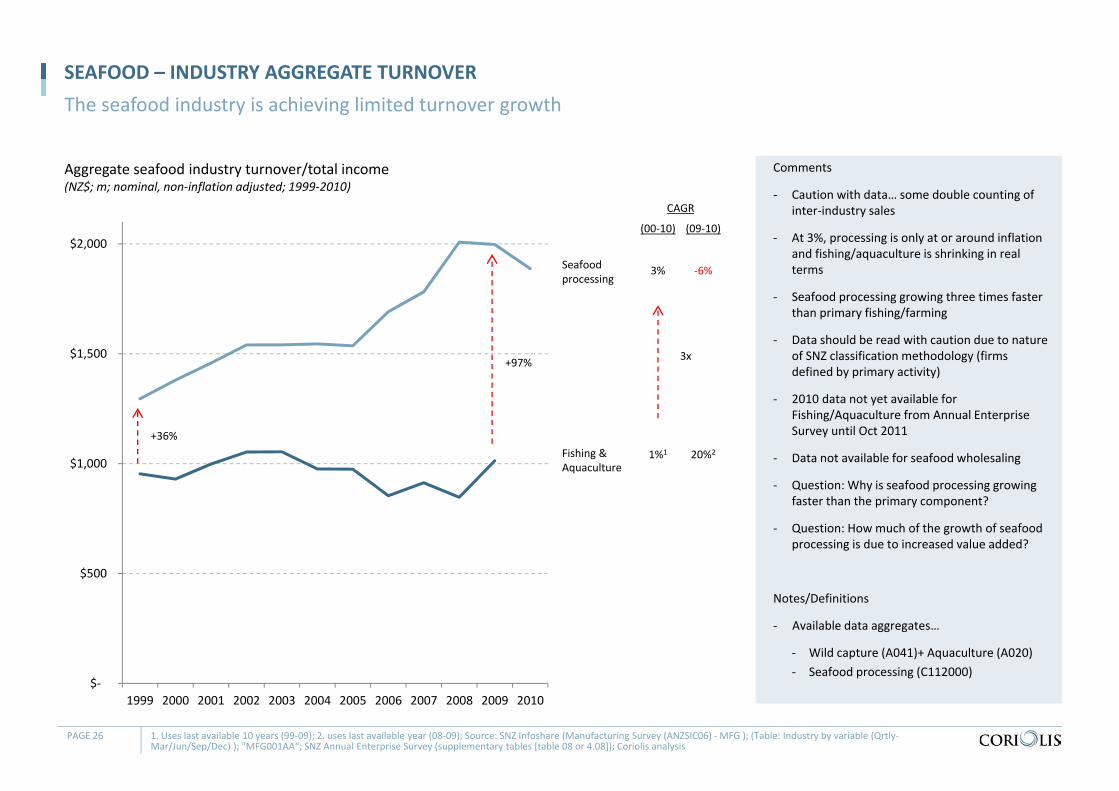
Aggregate seafood industry turnover/total income(NZ$; m; nominal, non‐inflation adjusted; 1999‐2010)
SEAFOOD – INDUSTRY AGGREGATE TURNOVERThe seafood industry is achieving limited turnover growth
PAGE 26 1. Uses last available 10 years (99‐09); 2. uses last available year (08‐09); Source: SNZ Infoshare (Manufacturing Survey (ANZSIC06) ‐MFG ); (Table: Industry by variable (Qrtly‐Mar/Jun/Sep/Dec) ); "MFG001AA“; SNZ Annual Enterprise Survey (supplementary tables [table 08 or 4.08]); Coriolis analysis
Comments
‐ Caution with data… some double counting of inter‐industry sales
‐ At 3%, processing is only at or around inflation and fishing/aquaculture is shrinking in real terms
‐ Seafood processing growing three times faster than primary fishing/farming
‐ Data should be read with caution due to nature of SNZ classification methodology (firms defined by primary activity)
‐ 2010 data not yet available for Fishing/Aquaculture from Annual Enterprise Survey until Oct 2011
‐ Data not available for seafood wholesaling
‐ Question: Why is seafood processing growing faster than the primary component?
‐ Question: How much of the growth of seafood processing is due to increased value added?
Notes/Definitions
‐ Available data aggregates…
‐ Wild capture (A041)+ Aquaculture (A020)‐ Seafood processing (C112000)
$‐
$500
$1,000
$1,500
$2,000
1999 2000 2001 2002 2003 2004 2005 2006 2007 2008 2009 2010
Seafood processing
Fishing & Aquaculture
(00‐10)
3%
1%1
(09‐10)
‐6%
20%2
CAGR
+36%
+97% 3x
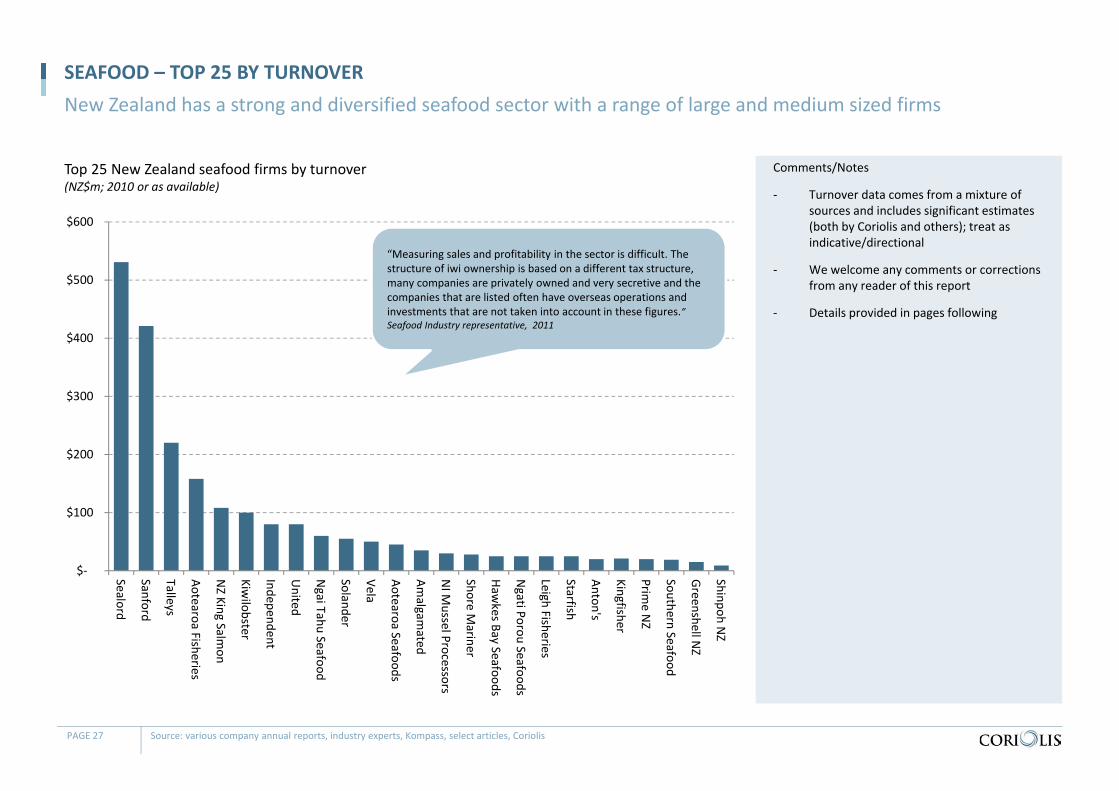
Top 25 New Zealand seafood firms by turnover(NZ$m; 2010 or as available)
SEAFOOD – TOP 25 BY TURNOVERNew Zealand has a strong and diversified seafood sector with a range of large and medium sized firms
PAGE 27 Source: various company annual reports, industry experts, Kompass, select articles, Coriolis
Comments/Notes
‐ Turnover data comes from a mixture of sources and includes significant estimates (both by Coriolis and others); treat as indicative/directional
‐ We welcome any comments or corrections from any reader of this report
‐ Details provided in pages following
$‐
$100
$200
$300
$400
$500
$600
Sealord
Sanford
Talleys
Aotearoa Fisheries
NZ King Salm
on
Kiwilobster
Independent
United
Ngai Tahu Seafood
Solander
Vela
Aotearoa Seafoods
Amalgam
ated
NI M
ussel Processors
Shore Mariner
Hawkes Bay Seafoods
Ngati Porou Seafoods
Leigh Fisheries
Starfish
Anton's
Kingfisher
Prime N
Z
Southern Seafood
Greenshell N
Z
Shinpoh NZ
“Measuring sales and profitability in the sector is difficult. The structure of iwi ownership is based on a different tax structure, many companies are privately owned and very secretive and the companies that are listed often have overseas operations and investments that are not taken into account in these figures.” Seafood Industry representative, 2011
1. Excludes Open Country Dairy and AFFCO; Source: various company annual reports (AR) ; various company websites (ws) ; Kompass (K) ; interviews (Ci) ; Coriolis analysis and estimates (Ce)
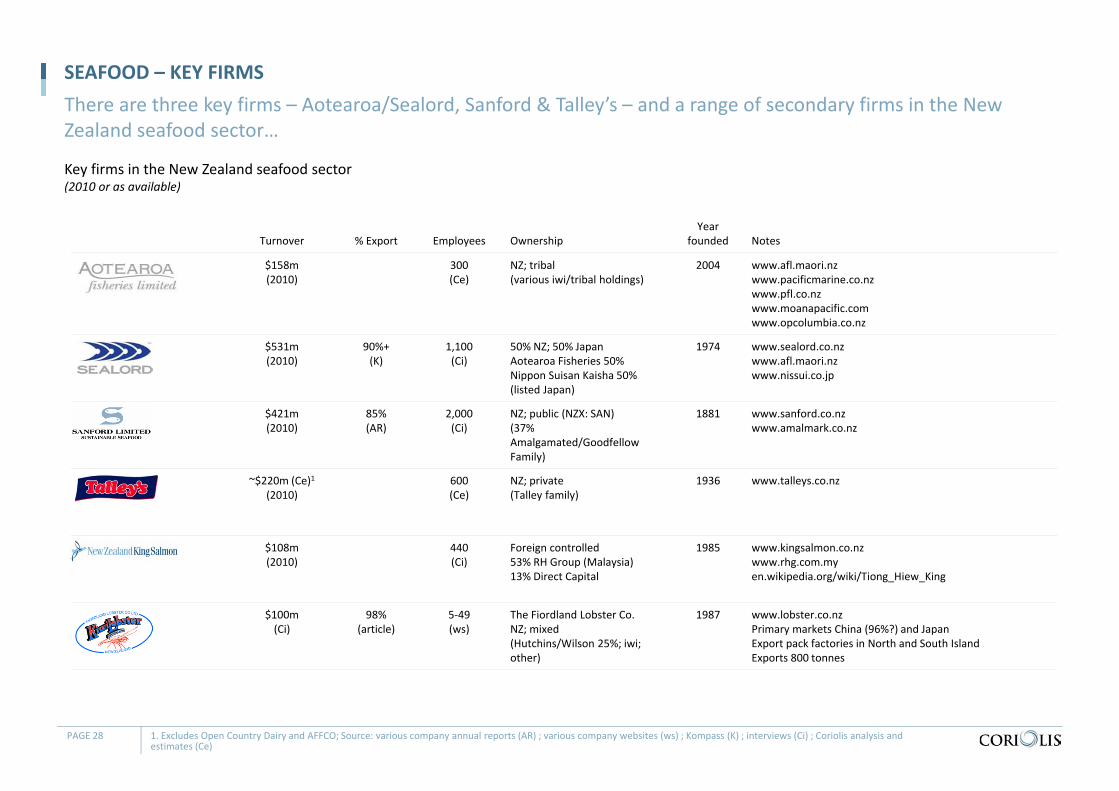
There are three key firms – Aotearoa/Sealord, Sanford & Talley’s – and a range of secondary firms in the New Zealand seafood sector…
Key firms in the New Zealand seafood sector(2010 or as available)
Turnover % Export Employees OwnershipYear
founded Notes
$158m(2010)
300(Ce)
NZ; tribal(various iwi/tribal holdings)
2004 www.afl.maori.nzwww.pacificmarine.co.nzwww.pfl.co.nzwww.moanapacific.comwww.opcolumbia.co.nz
$531m(2010)
90%+(K)
1,100(Ci)
50% NZ; 50% JapanAotearoa Fisheries 50%Nippon Suisan Kaisha 50%(listed Japan)
1974 www.sealord.co.nzwww.afl.maori.nzwww.nissui.co.jp
$421m(2010)
85% (AR)
2,000(Ci)
NZ; public (NZX: SAN)(37% Amalgamated/GoodfellowFamily)
1881 www.sanford.co.nzwww.amalmark.co.nz
~$220m (Ce)1(2010)
600(Ce)
NZ; private(Talley family)
1936 www.talleys.co.nz
$108m(2010)
440(Ci)
Foreign controlled53% RH Group (Malaysia)13% Direct Capital
1985 www.kingsalmon.co.nzwww.rhg.com.myen.wikipedia.org/wiki/Tiong_Hiew_King
$100m(Ci)
98%(article)
5‐49(ws)
The Fiordland Lobster Co.NZ; mixed(Hutchins/Wilson 25%; iwi; other)
1987 www.lobster.co.nzPrimary markets China (96%?) and JapanExport pack factories in North and South IslandExports 800 tonnes
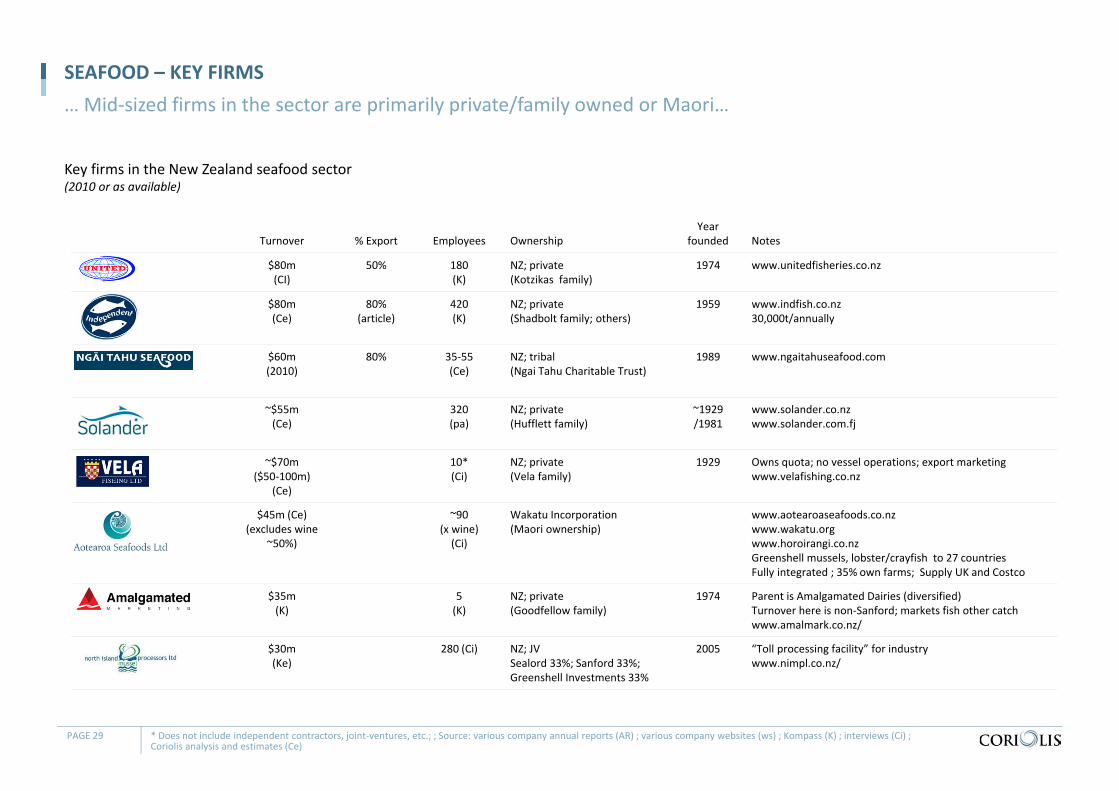
SEAFOOD – KEY FIRMS
PAGE 28
SEAFOOD – KEY FIRMS
* Does not include independent contractors, joint‐ventures, etc.; ; Source: various company annual reports (AR) ; various company websites (ws) ; Kompass (K) ; interviews (Ci) ; Coriolis analysis and estimates (Ce)
… Mid‐sized firms in the sector are primarily private/family owned or Maori…
Key firms in the New Zealand seafood sector(2010 or as available)
Turnover % Export Employees OwnershipYear
founded Notes
$80m(CI)
50% 180(K)
NZ; private(Kotzikas family)
1974 www.unitedfisheries.co.nz
$80m(Ce)
80%(article)
420(K)
NZ; private(Shadbolt family; others)
1959 www.indfish.co.nz30,000t/annually
$60m(2010)
80% 35‐55(Ce)
NZ; tribal(Ngai Tahu Charitable Trust)
1989 www.ngaitahuseafood.com
~$55m(Ce)
320(pa)
NZ; private(Hufflett family)
~1929/1981
www.solander.co.nzwww.solander.com.fj
~$70m($50‐100m)
(Ce)
10*(Ci)
NZ; private(Vela family)
1929 Owns quota; no vessel operations; export marketingwww.velafishing.co.nz
$45m (Ce)(excludes wine
~50%)
~90 (x wine) (Ci)
Wakatu Incorporation(Maori ownership)
www.aotearoaseafoods.co.nzwww.wakatu.orgwww.horoirangi.co.nzGreenshell mussels, lobster/crayfish to 27 countriesFully integrated ; 35% own farms; Supply UK and Costco
$35m(K)
5(K)
NZ; private(Goodfellow family)
1974 Parent is Amalgamated Dairies (diversified)Turnover here is non‐Sanford; markets fish other catchwww.amalmark.co.nz/
$30m(Ke)
280 (Ci) NZ; JVSealord 33%; Sanford 33%; Greenshell Investments 33%
2005 “Toll processing facility” for industrywww.nimpl.co.nz/
PAGE 29
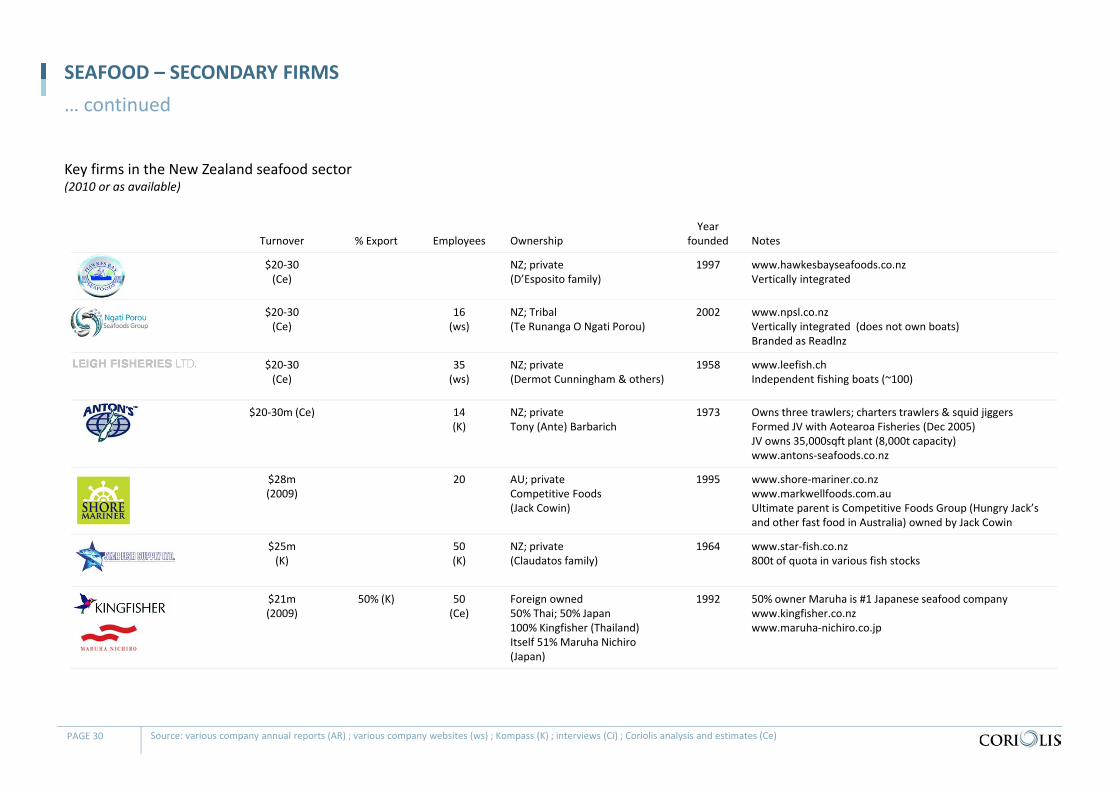
SEAFOOD – SECONDARY FIRMS
Source: various company annual reports (AR) ; various company websites (ws) ; Kompass (K) ; interviews (Ci) ; Coriolis analysis and estimates (Ce)
… continued
Key firms in the New Zealand seafood sector(2010 or as available)
Turnover % Export Employees OwnershipYear
founded Notes
$20‐30(Ce)
NZ; private(D’Esposito family)
1997 www.hawkesbayseafoods.co.nzVertically integrated
$20‐30(Ce)
16 (ws)
NZ; Tribal(Te Runanga O Ngati Porou)
2002 www.npsl.co.nzVertically integrated (does not own boats)Branded as Readlnz
$20‐30(Ce)
35(ws)
NZ; private (Dermot Cunningham & others)
1958 www.leefish.chIndependent fishing boats (~100)
$20‐30m (Ce) 14(K)
NZ; privateTony (Ante) Barbarich
1973 Owns three trawlers; charters trawlers & squid jiggersFormed JV with Aotearoa Fisheries (Dec 2005)JV owns 35,000sqft plant (8,000t capacity)www.antons‐seafoods.co.nz
$28m(2009)
20 AU; privateCompetitive Foods(Jack Cowin)
1995 www.shore‐mariner.co.nzwww.markwellfoods.com.auUltimate parent is Competitive Foods Group (Hungry Jack’sand other fast food in Australia) owned by Jack Cowin
$25m(K)
50(K)
NZ; private(Claudatos family)
1964 www.star‐fish.co.nz800t of quota in various fish stocks
$21m(2009)
50% (K) 50(Ce)
Foreign owned 50% Thai; 50% Japan100% Kingfisher (Thailand)Itself 51% Maruha Nichiro (Japan)
1992 50% owner Maruha is #1 Japanese seafood companywww.kingfisher.co.nzwww.maruha‐nichiro.co.jp
PAGE 30
SEAFOOD – SECONDARY FIRMS
Source: various company annual reports AR) ; various company websites (ws) ; Kompass (K) ; interviews (Ci) ; Coriolis analysis and estimates (Ce)
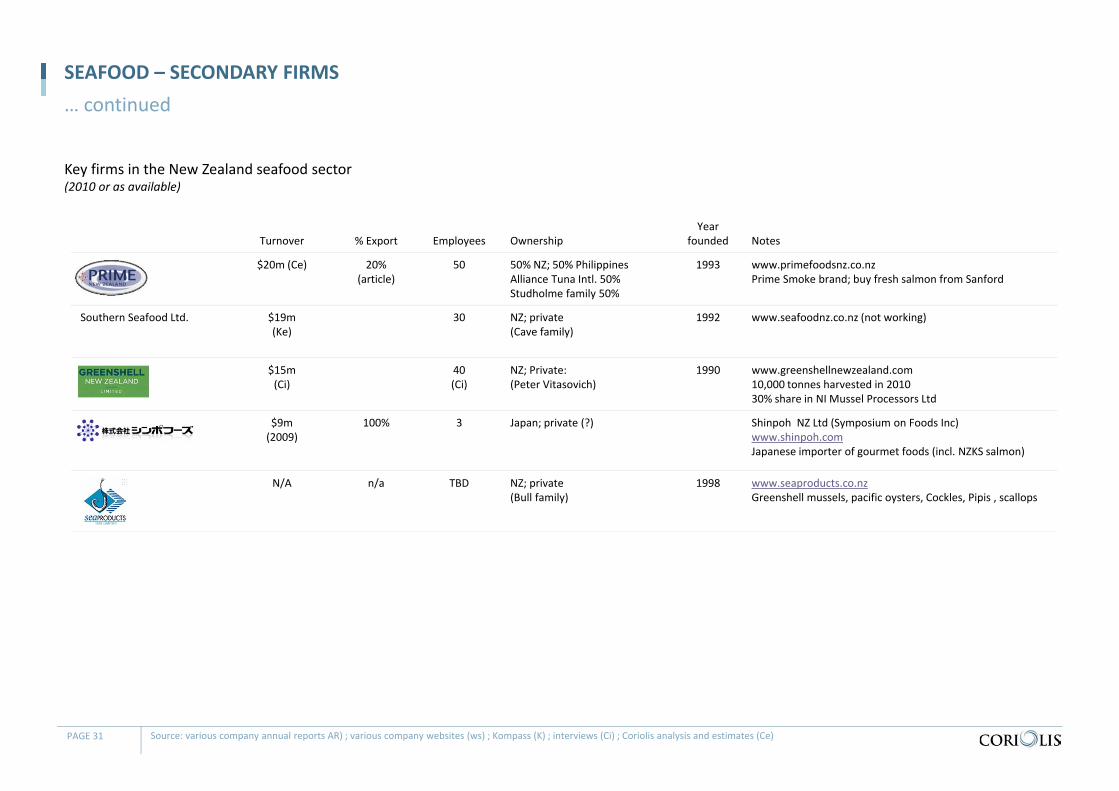
… continued
Key firms in the New Zealand seafood sector(2010 or as available)
Turnover % Export Employees OwnershipYear
founded Notes
$20m (Ce) 20%(article)
50 50% NZ; 50% PhilippinesAlliance Tuna Intl. 50%Studholme family 50%
1993 www.primefoodsnz.co.nzPrime Smoke brand; buy fresh salmon from Sanford
Southern Seafood Ltd. $19m(Ke)
30 NZ; private(Cave family)
1992 www.seafoodnz.co.nz (not working)
$15m(Ci)
40(Ci)
NZ; Private:(Peter Vitasovich)
1990 www.greenshellnewzealand.com10,000 tonnes harvested in 201030% share in NI Mussel Processors Ltd
$9m(2009)
100% 3 Japan; private (?) Shinpoh NZ Ltd (Symposium on Foods Inc)www.shinpoh.comJapanese importer of gourmet foods (incl. NZKS salmon)
N/A n/a TBD NZ; private(Bull family)
1998 www.seaproducts.co.nzGreenshell mussels, pacific oysters, Cockles, Pipis , scallops
PAGE 31
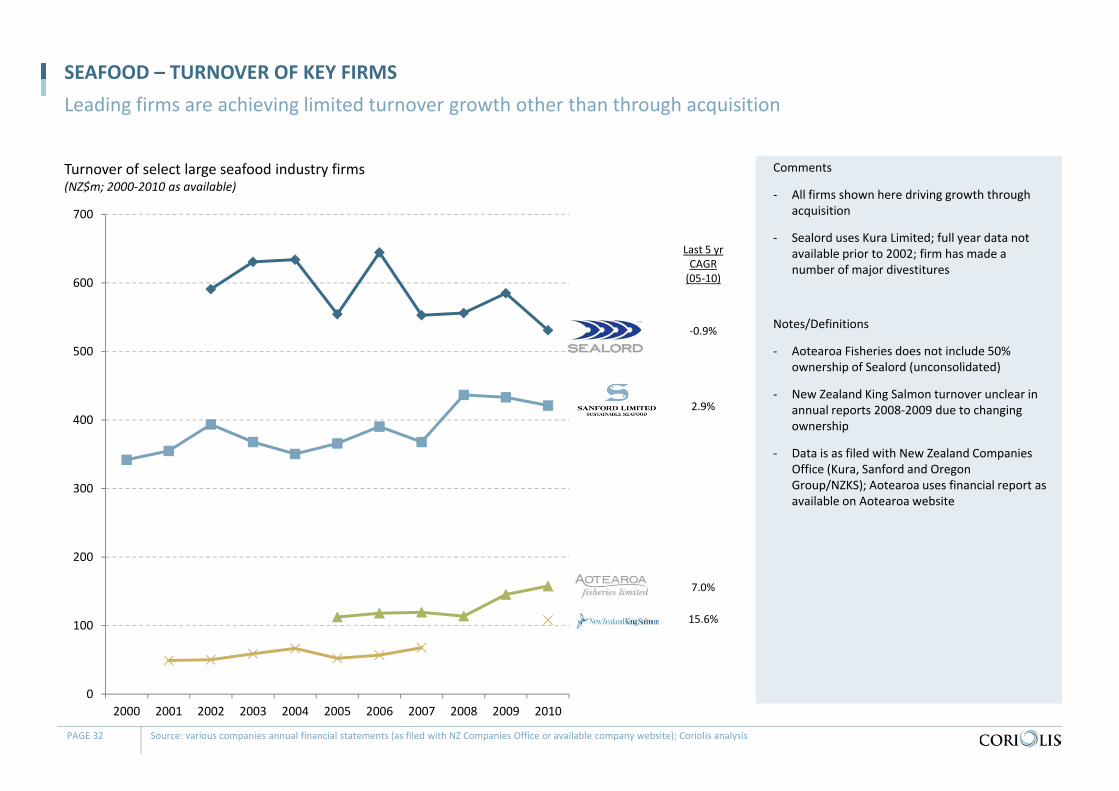
Turnover of select large seafood industry firms(NZ$m; 2000‐2010 as available)
SEAFOOD – TURNOVER OF KEY FIRMSLeading firms are achieving limited turnover growth other than through acquisition
PAGE 32 Source: various companies annual financial statements (as filed with NZ Companies Office or available company website); Coriolis analysis
Comments
‐ All firms shown here driving growth through acquisition
‐ Sealord uses Kura Limited; full year data not available prior to 2002; firm has made a number of major divestitures
Notes/Definitions
‐ Aotearoa Fisheries does not include 50% ownership of Sealord (unconsolidated)
‐ New Zealand King Salmon turnover unclear in annual reports 2008‐2009 due to changing ownership
‐ Data is as filed with New Zealand Companies Office (Kura, Sanford and Oregon Group/NZKS); Aotearoa uses financial report as available on Aotearoa website
0
100
200
300
400
500
600
700
2000 2001 2002 2003 2004 2005 2006 2007 2008 2009 2010
‐0.9%
Last 5 yrCAGR(05‐10)
2.9%
7.0%
15.6%
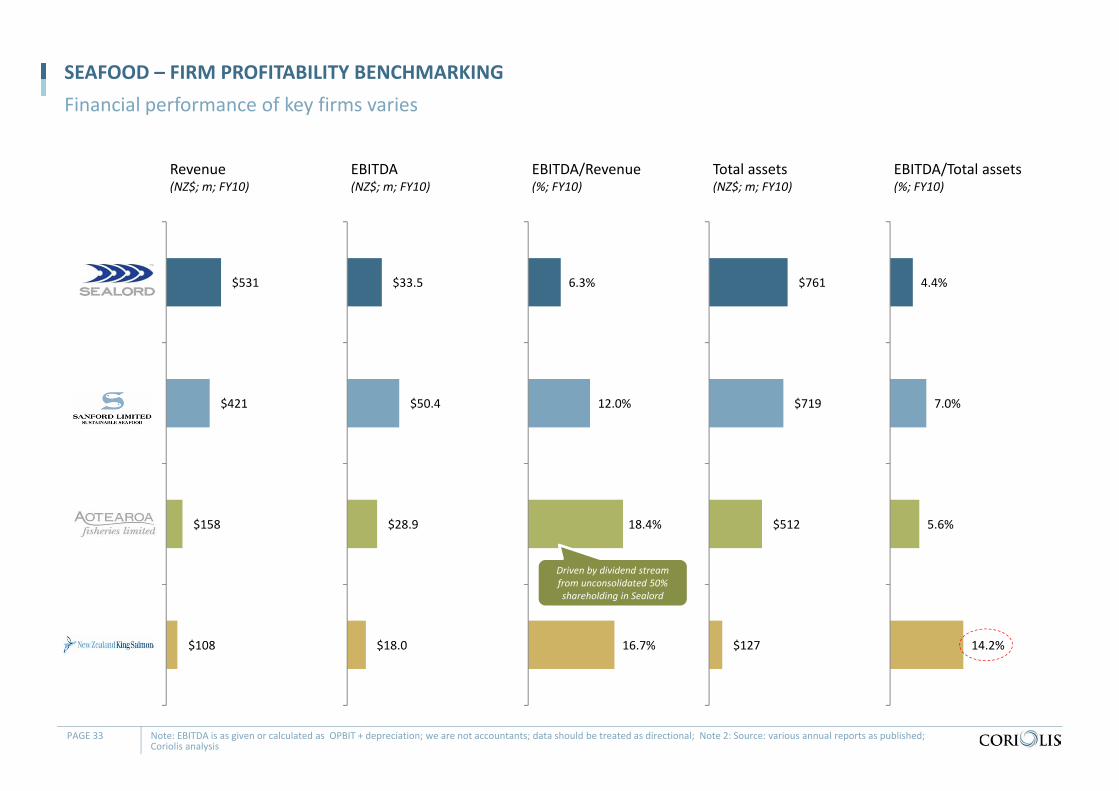
Revenue(NZ$; m; FY10)
SEAFOOD – FIRM PROFITABILITY BENCHMARKINGFinancial performance of key firms varies
PAGE 33 Note: EBITDA is as given or calculated as OPBIT + depreciation; we are not accountants; data should be treated as directional; Note 2: Source: various annual reports as published; Coriolis analysis
$531
$421
$158
$108
Sealord
Sanford
AotearoaFisheries
NZKS
EBITDA(NZ$; m; FY10)
$33.5
$50.4
$28.9
$18.0
EBITDA/Revenue(%; FY10)
6.3%
12.0%
18.4%
16.7%
Total assets(NZ$; m; FY10)
$761
$719
$512
$127
EBITDA/Total assets(%; FY10)
4.4%
7.0%
5.6%
14.2%
Driven by dividend stream from unconsolidated 50% shareholding in Sealord
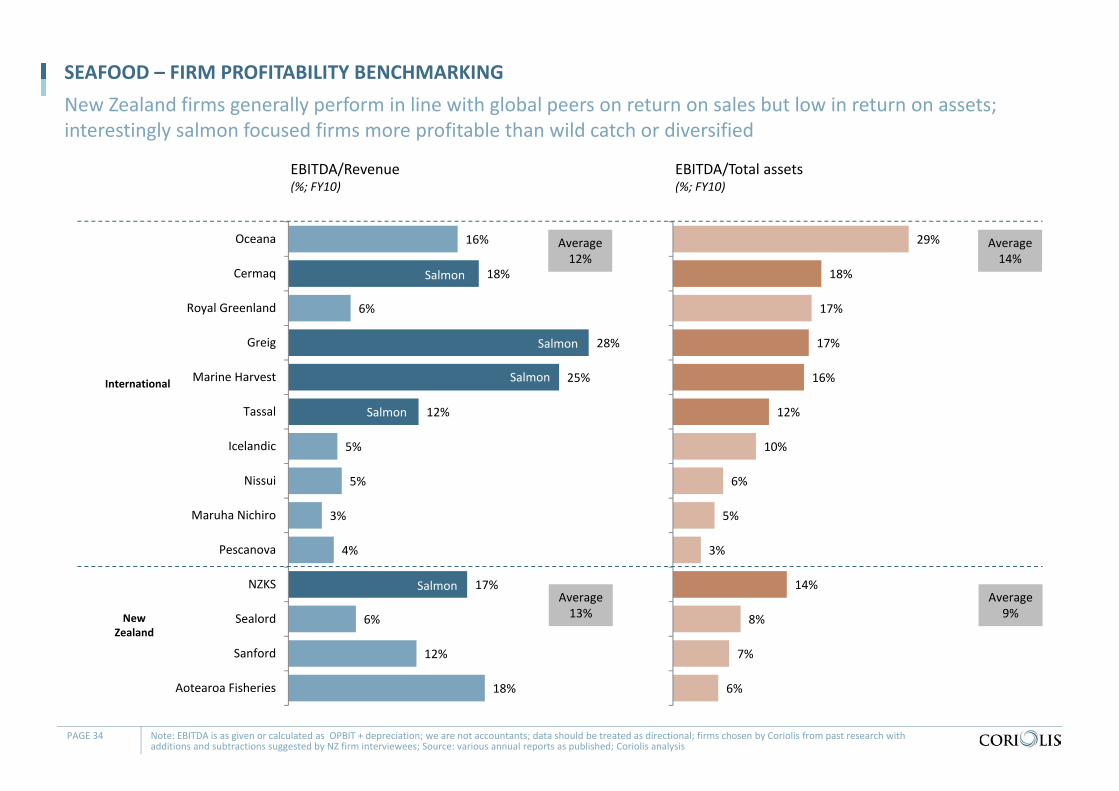
SEAFOOD – FIRM PROFITABILITY BENCHMARKINGNew Zealand firms generally perform in line with global peers on return on sales but low in return on assets; interestingly salmon focused firms more profitable than wild catch or diversified
PAGE 34 Note: EBITDA is as given or calculated as OPBIT + depreciation; we are not accountants; data should be treated as directional; firms chosen by Coriolis from past research with additions and subtractions suggested by NZ firm interviewees; Source: various annual reports as published; Coriolis analysis
16%
18%
6%
28%
25%
12%
5%
5%
3%
4%
17%
6%
12%
18%
Oceana
Cermaq
Royal Greenland
Greig
Marine Harvest
Tassal
Icelandic
Nissui
Maruha Nichiro
Pescanova
NZKS
Sealord
Sanford
Aotearoa Fisheries
EBITDA/Revenue(%; FY10)
29%
18%
17%
17%
16%
12%
10%
6%
5%
3%
14%
8%
7%
6%
EBITDA/Total assets(%; FY10)
New Zealand
International
Salmon
Salmon
Salmon
Salmon
Salmon
Average12%
Average13%
Average14%
Average9%
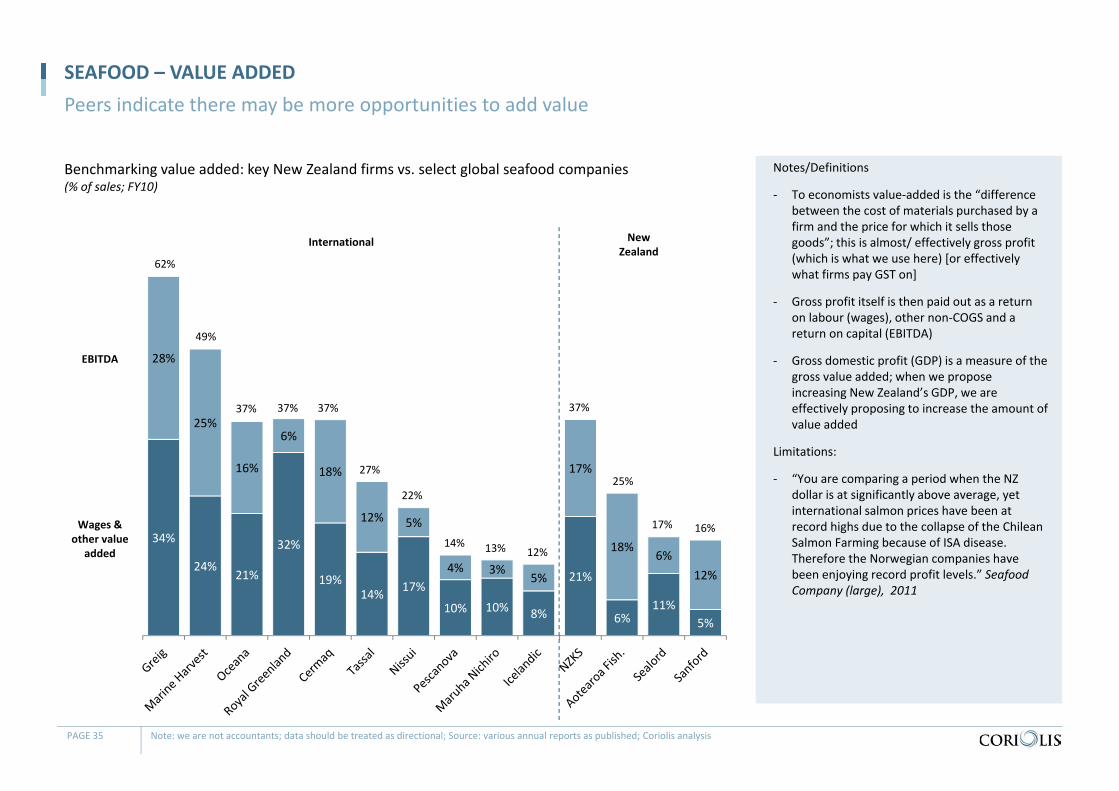
Benchmarking value added: key New Zealand firms vs. select global seafood companies(% of sales; FY10)
SEAFOOD – VALUE ADDEDPeers indicate there may be more opportunities to add value
PAGE 35 Note: we are not accountants; data should be treated as directional; Source: various annual reports as published; Coriolis analysis
Notes/Definitions
‐ To economists value‐added is the “difference between the cost of materials purchased by a firm and the price for which it sells those goods”; this is almost/ effectively gross profit (which is what we use here) [or effectively what firms pay GST on]
‐ Gross profit itself is then paid out as a return on labour (wages), other non‐COGS and a return on capital (EBITDA)
‐ Gross domestic profit (GDP) is a measure of the gross value added; when we propose increasing New Zealand’s GDP, we are effectively proposing to increase the amount of value added
Limitations:
‐ “You are comparing a period when the NZ dollar is at significantly above average, yet international salmon prices have been at record highs due to the collapse of the Chilean Salmon Farming because of ISA disease. Therefore the Norwegian companies have been enjoying record profit levels.” Seafood Company (large), 2011
34%
24%21%
32%
19%14% 17%
10% 10% 8%
21%
6%11%
5%
28%
25%
16%
6%
18%
12% 5%
4% 3%5%
17%
18%6%
12%
62%
49%
37% 37%
27%
22%
13% 12%
37%
25%
17% 16%
New Zealand
International
EBITDA
Wages & other value
added
37%
14%
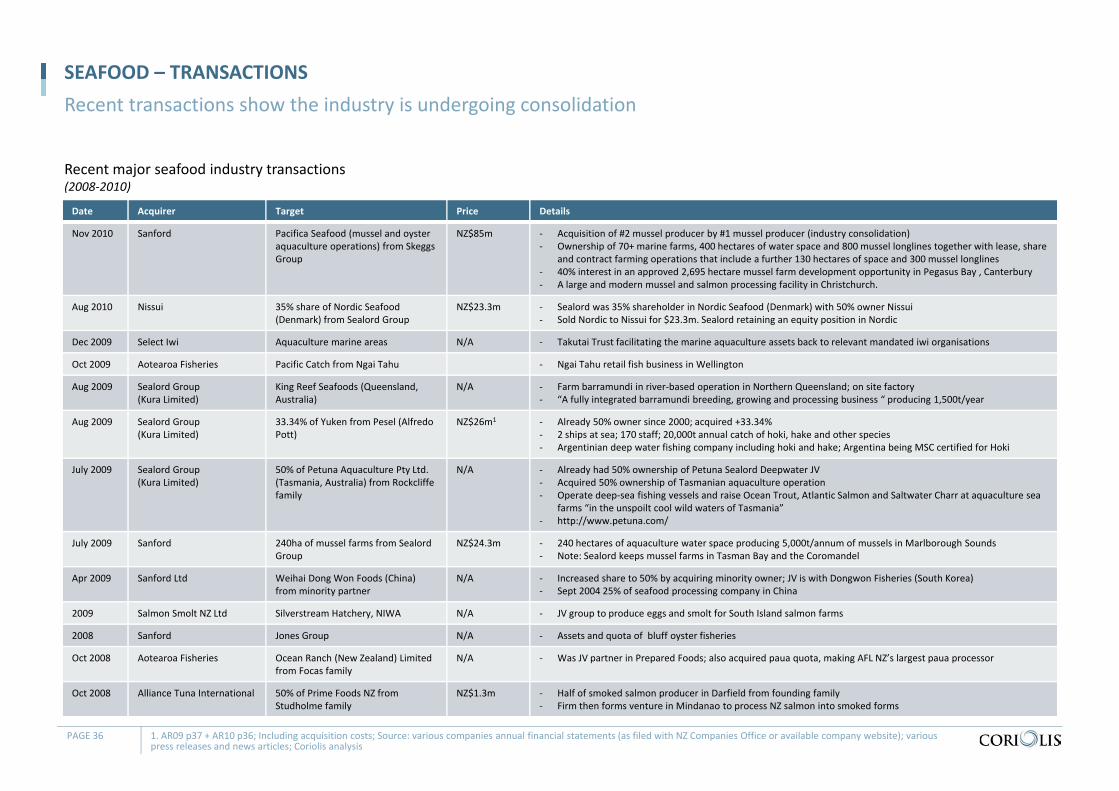
Recent major seafood industry transactions(2008‐2010)
SEAFOOD – TRANSACTIONSRecent transactions show the industry is undergoing consolidation
PAGE 36
Date Acquirer Target Price Details
Nov 2010 Sanford Pacifica Seafood (mussel and oyster aquaculture operations) from SkeggsGroup
NZ$85m ‐ Acquisition of #2 mussel producer by #1 mussel producer (industry consolidation)‐ Ownership of 70+ marine farms, 400 hectares of water space and 800 mussel longlines together with lease, share
and contract farming operations that include a further 130 hectares of space and 300 mussel longlines‐ 40% interest in an approved 2,695 hectare mussel farm development opportunity in Pegasus Bay , Canterbury‐ A large and modern mussel and salmon processing facility in Christchurch.
Aug 2010 Nissui 35% share of Nordic Seafood (Denmark) from Sealord Group
NZ$23.3m ‐ Sealord was 35% shareholder in Nordic Seafood (Denmark) with 50% owner Nissui‐ Sold Nordic to Nissui for $23.3m. Sealord retaining an equity position in Nordic
Dec 2009 Select Iwi Aquaculture marine areas N/A ‐ Takutai Trust facilitating the marine aquaculture assets back to relevant mandated iwi organisations
Oct 2009 Aotearoa Fisheries Pacific Catch from Ngai Tahu ‐ Ngai Tahu retail fish business in Wellington
Aug 2009 Sealord Group(Kura Limited)
King Reef Seafoods (Queensland, Australia)
N/A ‐ Farm barramundi in river‐based operation in Northern Queensland; on site factory‐ “A fully integrated barramundi breeding, growing and processing business “ producing 1,500t/year
Aug 2009 Sealord Group(Kura Limited)
33.34% of Yuken from Pesel (Alfredo Pott)
NZ$26m1 ‐ Already 50% owner since 2000; acquired +33.34% ‐ 2 ships at sea; 170 staff; 20,000t annual catch of hoki, hake and other species‐ Argentinian deep water fishing company including hoki and hake; Argentina being MSC certified for Hoki
July 2009 Sealord Group(Kura Limited)
50% of Petuna Aquaculture Pty Ltd. (Tasmania, Australia) from Rockcliffefamily
N/A ‐ Already had 50% ownership of Petuna Sealord Deepwater JV‐ Acquired 50% ownership of Tasmanian aquaculture operation‐ Operate deep‐sea fishing vessels and raise Ocean Trout, Atlantic Salmon and Saltwater Charr at aquaculture sea
farms “in the unspoilt cool wild waters of Tasmania”‐ http://www.petuna.com/
July 2009 Sanford 240ha of mussel farms from Sealord Group
NZ$24.3m ‐ 240 hectares of aquaculture water space producing 5,000t/annum of mussels in Marlborough Sounds‐ Note: Sealord keeps mussel farms in Tasman Bay and the Coromandel
Apr 2009 Sanford Ltd Weihai Dong Won Foods (China) from minority partner
N/A ‐ Increased share to 50% by acquiring minority owner; JV is with Dongwon Fisheries (South Korea)‐ Sept 2004 25% of seafood processing company in China
2009 Salmon Smolt NZ Ltd Silverstream Hatchery, NIWA N/A ‐ JV group to produce eggs and smolt for South Island salmon farms
2008 Sanford Jones Group N/A ‐ Assets and quota of bluff oyster fisheries
Oct 2008 Aotearoa Fisheries Ocean Ranch (New Zealand) Limited from Focas family
N/A ‐ Was JV partner in Prepared Foods; also acquired paua quota, making AFL NZ’s largest paua processor
Oct 2008 Alliance Tuna International 50% of Prime Foods NZ from Studholme family
NZ$1.3m ‐ Half of smoked salmon producer in Darfield from founding family‐ Firm then forms venture in Mindanao to process NZ salmon into smoked forms
1. AR09 p37 + AR10 p36; Including acquisition costs; Source: various companies annual financial statements (as filed with NZ Companies Office or available company website); various press releases and news articles; Coriolis analysis
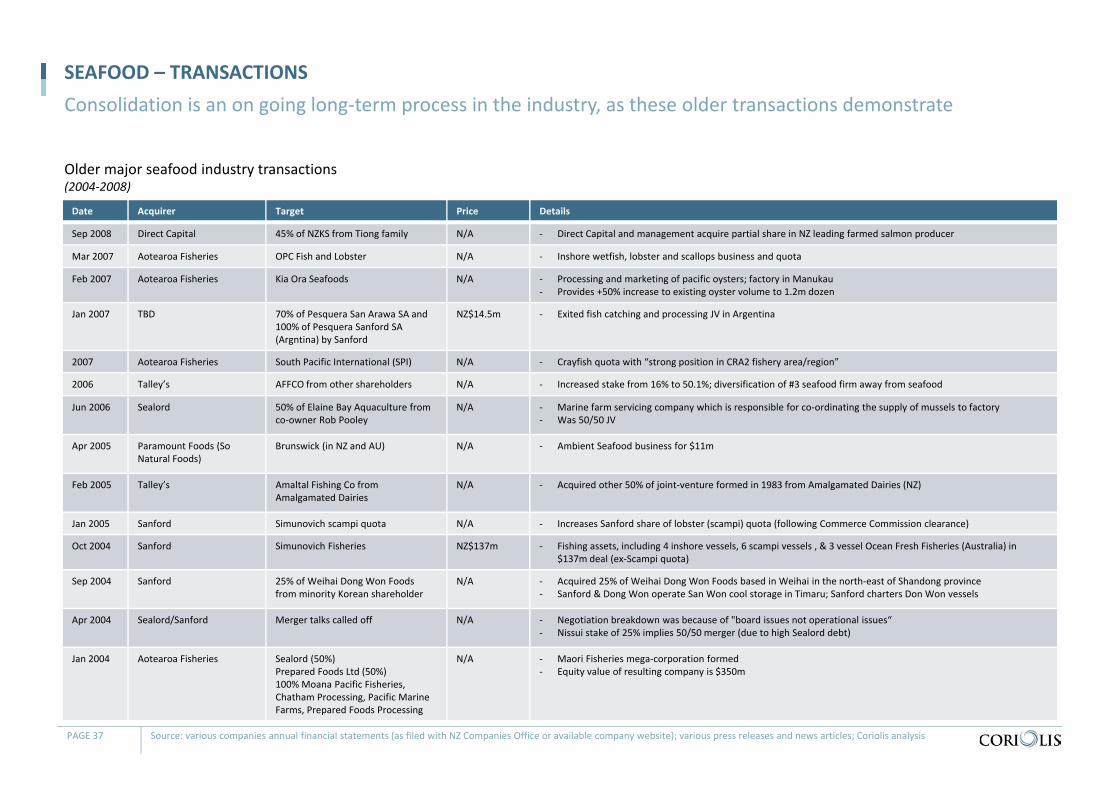
Older major seafood industry transactions(2004‐2008)
SEAFOOD – TRANSACTIONSConsolidation is an on going long‐term process in the industry, as these older transactions demonstrate
PAGE 37
Date Acquirer Target Price Details
Sep 2008 Direct Capital 45% of NZKS from Tiong family N/A ‐ Direct Capital and management acquire partial share in NZ leading farmed salmon producer
Mar 2007 Aotearoa Fisheries OPC Fish and Lobster N/A ‐ Inshore wetfish, lobster and scallops business and quota
Feb 2007 Aotearoa Fisheries Kia Ora Seafoods N/A ‐ Processing and marketing of pacific oysters; factory in Manukau‐ Provides +50% increase to existing oyster volume to 1.2m dozen
Jan 2007 TBD 70% of Pesquera San Arawa SA and 100% of Pesquera Sanford SA (Argntina) by Sanford
NZ$14.5m ‐ Exited fish catching and processing JV in Argentina
2007 Aotearoa Fisheries South Pacific International (SPI) N/A ‐ Crayfish quota with “strong position in CRA2 fishery area/region”
2006 Talley’s AFFCO from other shareholders N/A ‐ Increased stake from 16% to 50.1%; diversification of #3 seafood firm away from seafood
Jun 2006 Sealord 50% of Elaine Bay Aquaculture from co‐owner Rob Pooley
N/A ‐ Marine farm servicing company which is responsible for co‐ordinating the supply of mussels to factory‐ Was 50/50 JV
Apr 2005 Paramount Foods (So Natural Foods)
Brunswick (in NZ and AU) N/A ‐ Ambient Seafood business for $11m
Feb 2005 Talley’s Amaltal Fishing Co from Amalgamated Dairies
N/A ‐ Acquired other 50% of joint‐venture formed in 1983 from Amalgamated Dairies (NZ)
Jan 2005 Sanford Simunovich scampi quota N/A ‐ Increases Sanford share of lobster (scampi) quota (following Commerce Commission clearance)
Oct 2004 Sanford Simunovich Fisheries NZ$137m ‐ Fishing assets, including 4 inshore vessels, 6 scampi vessels , & 3 vessel Ocean Fresh Fisheries (Australia) in $137m deal (ex‐Scampi quota)
Sep 2004 Sanford 25% of Weihai Dong Won Foods from minority Korean shareholder
N/A ‐ Acquired 25% of Weihai Dong Won Foods based in Weihai in the north‐east of Shandong province‐ Sanford & Dong Won operate San Won cool storage in Timaru; Sanford charters Don Won vessels
Apr 2004 Sealord/Sanford Merger talks called off N/A ‐ Negotiation breakdown was because of "board issues not operational issues“‐ Nissui stake of 25% implies 50/50 merger (due to high Sealord debt)
Jan 2004 Aotearoa Fisheries Sealord (50%)Prepared Foods Ltd (50%)100% Moana Pacific Fisheries, Chatham Processing, Pacific Marine Farms, Prepared Foods Processing
N/A ‐ Maori Fisheries mega‐corporation formed‐ Equity value of resulting company is $350m
Source: various companies annual financial statements (as filed with NZ Companies Office or available company website); various press releases and news articles; Coriolis analysis
SEAFOOD – CONSOLIDATION
- “There has been a buyout of smaller players, increased ownership is in the hands of fewer players. There has been a consolidation of the top 10 companies.” GM, Seafood Company, medium, 2011
- “Consolidation will continue, but it will be opportunistic not strategic. The industry is family dominated, with families being active in the business. Only when there is a generational change, then there might be a sale. Companies with Maori ownership won’t sell.” CEO, Seafood Company, large, 2011
- “Seafood companies Sanford Limited, Sealord Group Limited and Kiwigreen Investments Limited have announced they have formed North Island Mussel Processors Limited (owned equally by the three parties) to consolidate their mussel processing requirements for GreenshellMussels grown in the Coromandel region…The new joint venture focuses on processing scale efficiencies made possible by the increased volumes of mussels farmed from the shareholder interests in the expanded Wilsons Bay sites approved over 2 years ago. The Kiwigreen facility in Tauranga was chosen as the most suitable site for this expansion because of its export port location and access to a larger labour pool.” Just‐food, online article, August 2005
PAGE 38
Industry consolidation is expected to continue, though at a limited pace
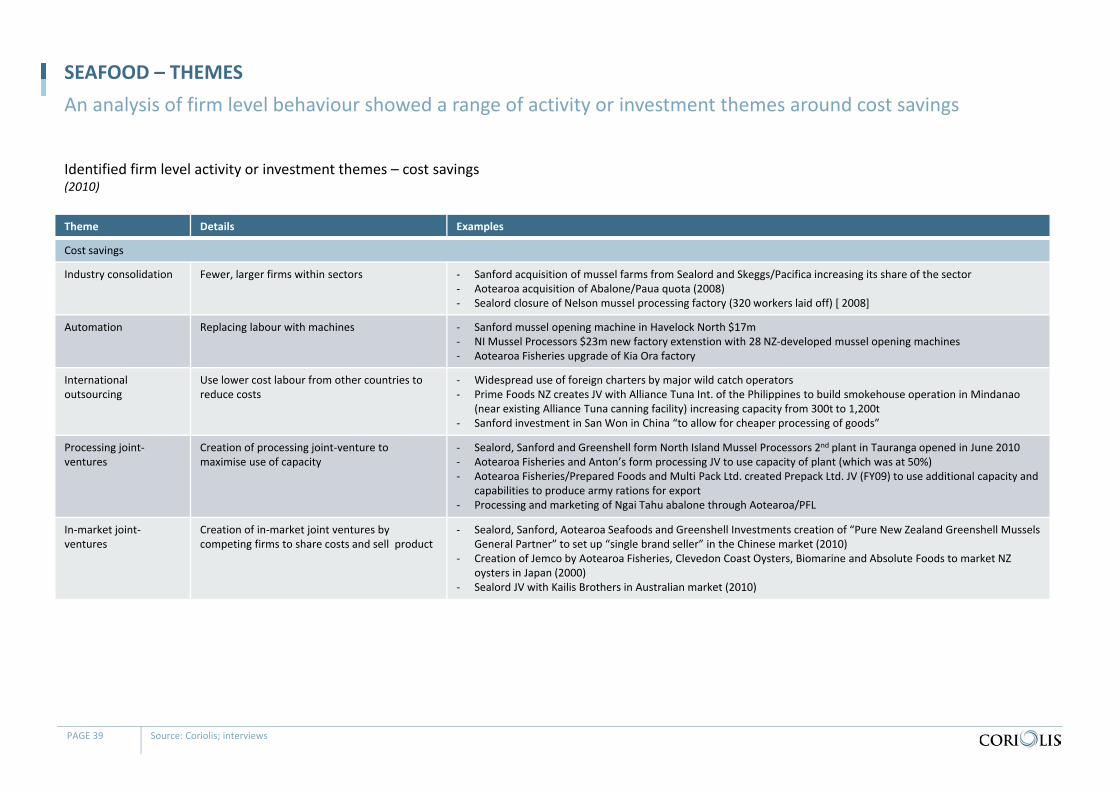
Theme Details Examples
Cost savings
Industry consolidation Fewer, larger firms within sectors ‐ Sanford acquisition of mussel farms from Sealord and Skeggs/Pacifica increasing its share of the sector‐ Aotearoa acquisition of Abalone/Paua quota (2008)‐ Sealord closure of Nelson mussel processing factory (320 workers laid off) [ 2008]
Automation Replacing labour with machines ‐ Sanford mussel opening machine in Havelock North $17m‐ NI Mussel Processors $23m new factory extenstion with 28 NZ‐developed mussel opening machines‐ Aotearoa Fisheries upgrade of Kia Ora factory
Internationaloutsourcing
Use lower cost labour from other countries to reduce costs
‐ Widespread use of foreign charters by major wild catch operators‐ Prime Foods NZ creates JV with Alliance Tuna Int. of the Philippines to build smokehouse operation in Mindanao
(near existing Alliance Tuna canning facility) increasing capacity from 300t to 1,200t‐ Sanford investment in San Won in China “to allow for cheaper processing of goods”
Processing joint‐ventures
Creation of processing joint‐venture to maximise use of capacity
‐ Sealord, Sanford and Greenshell form North Island Mussel Processors 2nd plant in Tauranga opened in June 2010‐ Aotearoa Fisheries and Anton’s form processing JV to use capacity of plant (which was at 50%)‐ Aotearoa Fisheries/Prepared Foods and Multi Pack Ltd. created Prepack Ltd. JV (FY09) to use additional capacity and
capabilities to produce army rations for export‐ Processing and marketing of Ngai Tahu abalone through Aotearoa/PFL
In‐market joint‐ventures
Creation of in‐market joint ventures by competing firms to share costs and sell product
‐ Sealord, Sanford, Aotearoa Seafoods and Greenshell Investments creation of “Pure New Zealand Greenshell Mussels General Partner” to set up “single brand seller” in the Chinese market (2010)
‐ Creation of Jemco by Aotearoa Fisheries, Clevedon Coast Oysters, Biomarine and Absolute Foods to market NZ oysters in Japan (2000)
‐ Sealord JV with Kailis Brothers in Australian market (2010)
Identified firm level activity or investment themes – cost savings(2010)
SEAFOOD – THEMESAn analysis of firm level behaviour showed a range of activity or investment themes around cost savings
PAGE 39 Source: Coriolis; interviews
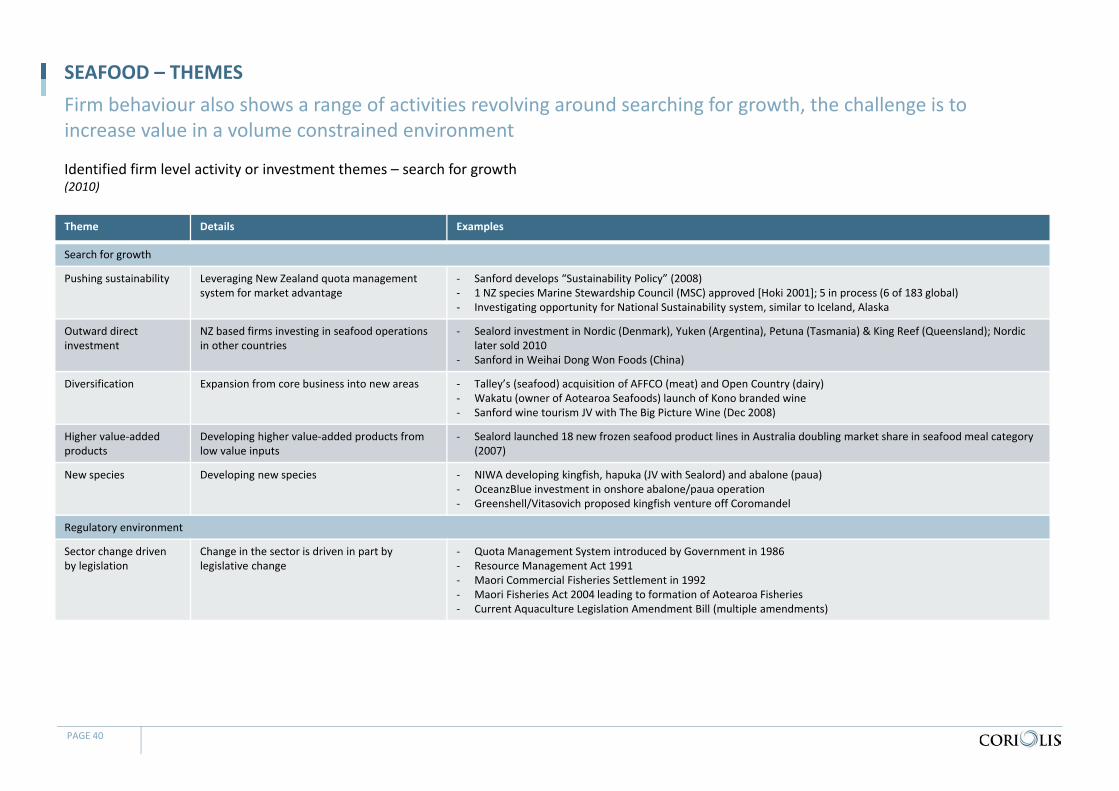
Theme Details Examples
Search for growth
Pushing sustainability Leveraging New Zealand quota management system for market advantage
‐ Sanford develops “Sustainability Policy” (2008)‐ 1 NZ species Marine Stewardship Council (MSC) approved [Hoki 2001]; 5 in process (6 of 183 global) ‐ Investigating opportunity for National Sustainability system, similar to Iceland, Alaska
Outward direct investment
NZ based firms investing in seafood operations in other countries
‐ Sealord investment in Nordic (Denmark), Yuken (Argentina), Petuna (Tasmania) & King Reef (Queensland); Nordic later sold 2010
‐ Sanford in Weihai Dong Won Foods (China)
Diversification Expansion from core business into new areas ‐ Talley’s (seafood) acquisition of AFFCO (meat) and Open Country (dairy)‐ Wakatu (owner of Aotearoa Seafoods) launch of Kono branded wine‐ Sanford wine tourism JV with The Big Picture Wine (Dec 2008)
Higher value‐added products
Developing higher value‐added products from low value inputs
‐ Sealord launched 18 new frozen seafood product lines in Australia doubling market share in seafood meal category (2007)
New species Developing new species ‐ NIWA developing kingfish, hapuka (JV with Sealord) and abalone (paua)‐ OceanzBlue investment in onshore abalone/paua operation‐ Greenshell/Vitasovich proposed kingfish venture off Coromandel
Regulatory environment
Sector change driven by legislation
Change in the sector is driven in part by legislative change
‐ Quota Management System introduced by Government in 1986‐ Resource Management Act 1991‐ Maori Commercial Fisheries Settlement in 1992‐ Maori Fisheries Act 2004 leading to formation of Aotearoa Fisheries ‐ Current Aquaculture Legislation Amendment Bill (multiple amendments)
Identified firm level activity or investment themes – search for growth(2010)
SEAFOOD – THEMESFirm behaviour also shows a range of activities revolving around searching for growth, the challenge is to increase value in a volume constrained environment
PAGE 40
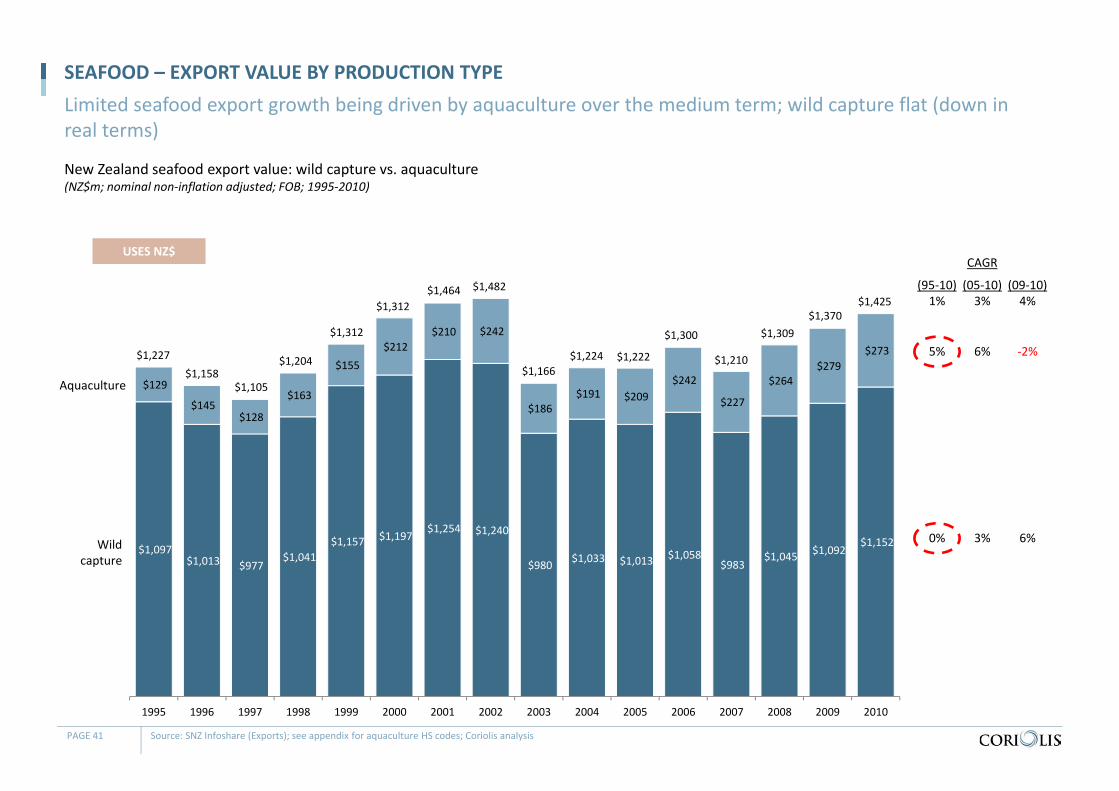
New Zealand seafood export value: wild capture vs. aquaculture(NZ$m; nominal non‐inflation adjusted; FOB; 1995‐2010)
SEAFOOD – EXPORT VALUE BY PRODUCTION TYPELimited seafood export growth being driven by aquaculture over the medium term; wild capture flat (down in real terms)
PAGE 41 Source: SNZ Infoshare (Exports); see appendix for aquaculture HS codes; Coriolis analysis
(95‐10)1%
(05‐10)3%
5% 6%
0% 3%
(09‐10)4%
‐2%
6%
CAGR
$1,097 $1,013 $977
$1,041 $1,157 $1,197
$1,254 $1,240
$980 $1,033 $1,013 $1,058 $983
$1,045 $1,092 $1,152
$129
$145 $128
$163
$155 $212
$210 $242
$186 $191 $209
$242
$227
$264 $279
$273
1995 1996 1997 1998 1999 2000 2001 2002 2003 2004 2005 2006 2007 2008 2009 2010
$1,227$1,158
$1,105
$1,204
$1,312
$1,312$1,464 $1,482
$1,166$1,224 $1,222
$1,300
$1,210
$1,309$1,370
$1,425
Aquaculture
Wild capture
USES NZ$
$114 $127 $122 $180 $184 $229
$152 $156 $141 $151 $152
$172 $167 $182 $174
$203 $202 $171
$168 $118 $86
$71 $75 $89 $28 $43
$37
$44 $61 $86
$50 $54 $58
$46 $48
$63 $70 $84
$57
$61 $51
$49 $31 $36
$32
$51 $46
$43
$47 $51
$54
$41 $42
$42
$27 $28
$30
$38 $35
$38
$408 $473
$462
$467 $526
$511
2005 2006 2007 2008 2009 2010
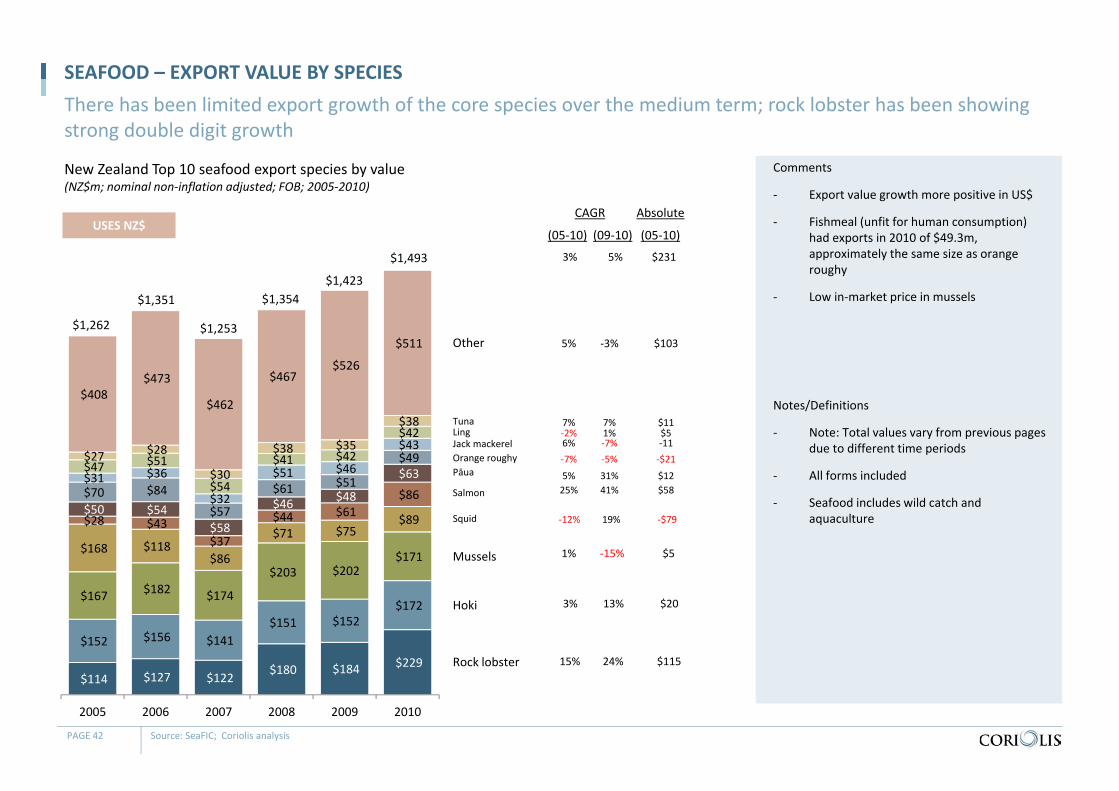
New Zealand Top 10 seafood export species by value(NZ$m; nominal non‐inflation adjusted; FOB; 2005‐2010)
SEAFOOD – EXPORT VALUE BY SPECIESThere has been limited export growth of the core species over the medium term; rock lobster has been showing strong double digit growth
PAGE 42 Source: SeaFIC; Coriolis analysis
Comments
‐ Export value growth more positive in US$
‐ Fishmeal (unfit for human consumption) had exports in 2010 of $49.3m, approximately the same size as orange roughy
‐ Low in‐market price in mussels
Notes/Definitions
‐ Note: Total values vary from previous pages due to different time periods
‐ All forms included
‐ Seafood includes wild catch and aquaculture
USES NZ$
Rock lobster
Hoki
Mussels
Pāua
LingJack mackerelOrange roughy
Other$1,262
$1,351
$1,253
$1,354$1,423
$1,493
Tuna
Salmon
Squid
‐7% ‐5% ‐$21
1% ‐15% $5
(05‐10) (09‐10)
CAGR Absolute
(05‐10)
3% 5% $231
15% 24% $115
5% ‐3% $103
25% 41% $585% 31% $12
‐12% 19% ‐$79
6% ‐7% ‐11‐2% 1% $57% 7% $11
3% 13% $20
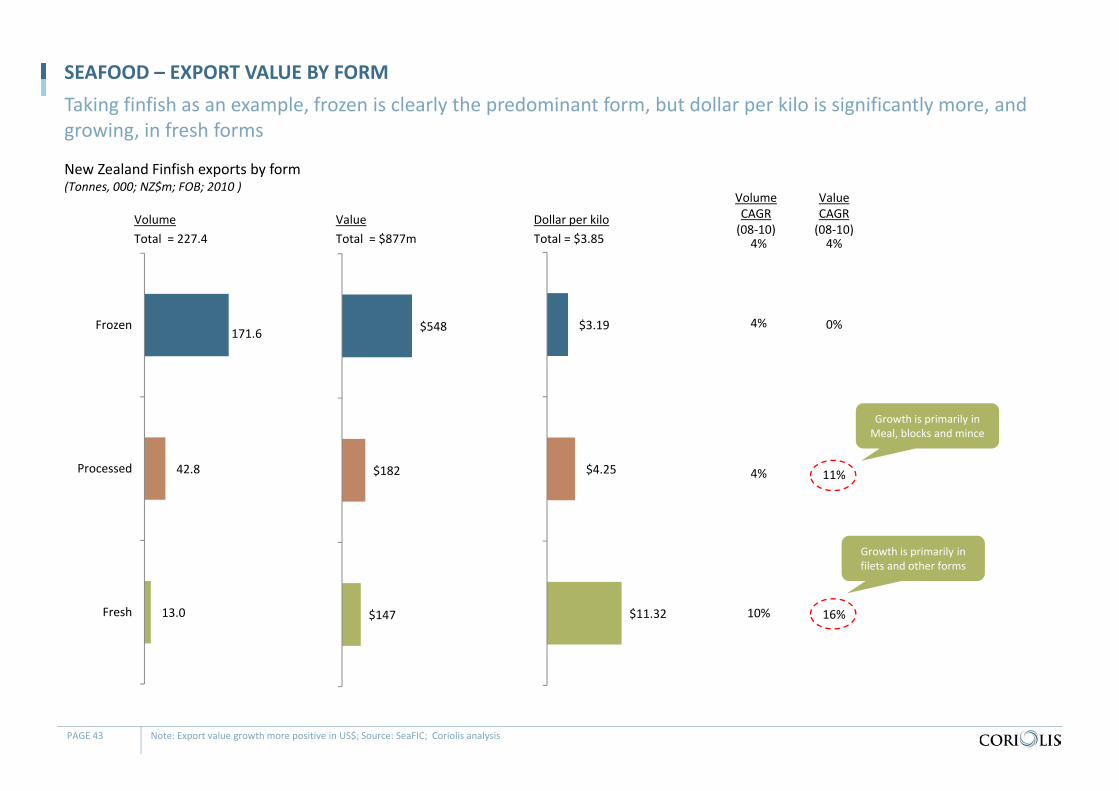
New Zealand Finfish exports by form(Tonnes, 000; NZ$m; FOB; 2010 )
SEAFOOD – EXPORT VALUE BY FORMTaking finfish as an example, frozen is clearly the predominant form, but dollar per kilo is significantly more, and growing, in fresh forms
PAGE 43 Note: Export value growth more positive in US$; Source: SeaFIC; Coriolis analysis
VolumeCAGR(08‐10)
171.6
42.8
13.0
Frozen
Processed
Fresh
VolumeTotal = 227.4
$548
$182
$147
ValueTotal = $877m
$3.19
$4.25
$11.32
Dollar per kiloTotal = $3.85
4%
4%
10%
ValueCAGR(08‐10)
0%
11%
16%
4% 4%
Growth is primarily in filets and other forms
Growth is primarily in Meal, blocks and mince
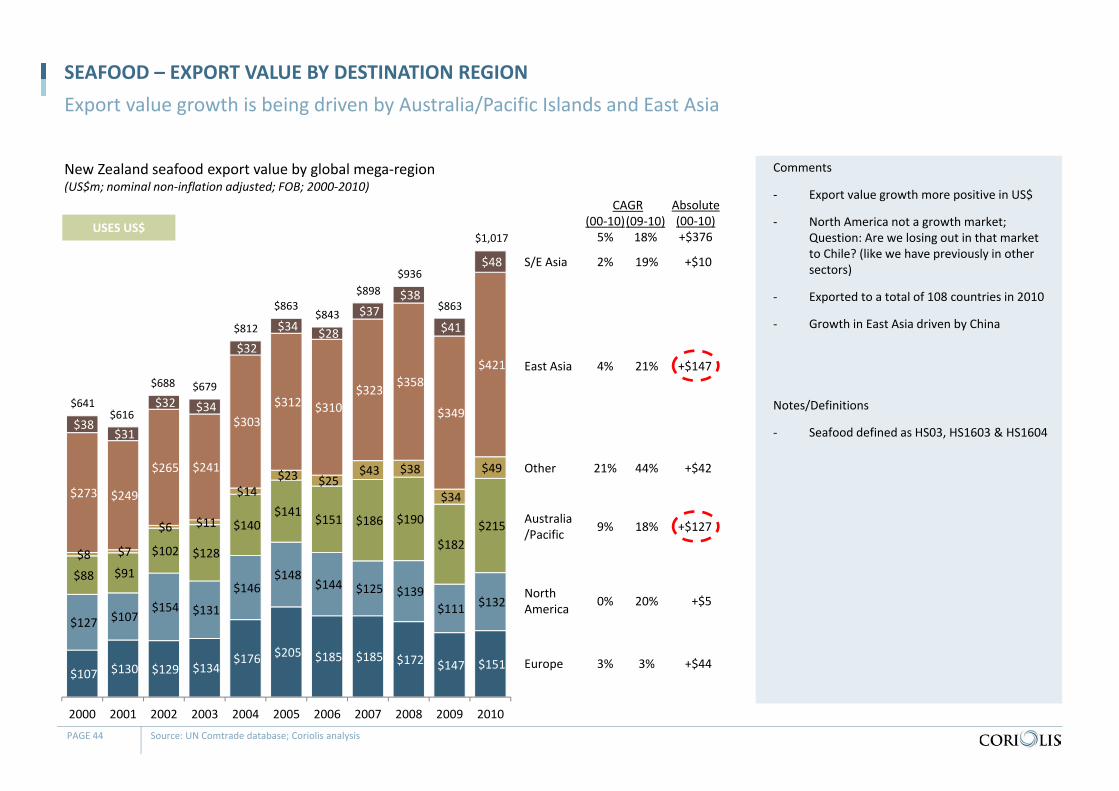
New Zealand seafood export value by global mega‐region (US$m; nominal non‐inflation adjusted; FOB; 2000‐2010)
SEAFOOD – EXPORT VALUE BY DESTINATION REGIONExport value growth is being driven by Australia/Pacific Islands and East Asia
PAGE 44 Source: UN Comtrade database; Coriolis analysis
Comments
‐ Export value growth more positive in US$
‐ North America not a growth market; Question: Are we losing out in that market to Chile? (like we have previously in other sectors)
‐ Exported to a total of 108 countries in 2010
‐ Growth in East Asia driven by China
Notes/Definitions
‐ Seafood defined as HS03, HS1603 & HS1604
$107 $130 $129 $134 $176 $205 $185 $185 $172 $147 $151
$127 $107 $154 $131
$146 $148
$144 $125 $139 $111 $132
$88 $91
$102 $128
$140 $141 $151 $186 $190
$182 $215
$8 $7
$6 $11
$14 $23 $25
$43 $38
$34
$49
$273 $249
$265 $241
$303 $312 $310
$323 $358
$349
$421
$38 $31
$32 $34
$32
$34 $28
$37 $38
$41
$48
2000 2001 2002 2003 2004 2005 2006 2007 2008 2009 2010
$641$616
$688 $679
$812
$863$843
$898$936
$863
$1,017
Europe
USES US$
North America
Australia/Pacific
Other
East Asia
S/E Asia
(00‐10)5%
3%
(09‐10)18%
3%
CAGR
0% 20%
9% 18%
21% 44%
4% 21%
2% 19%
Absolute(00‐10)+$376
+$44
+$5
+$127
+$42
+$147
+$10
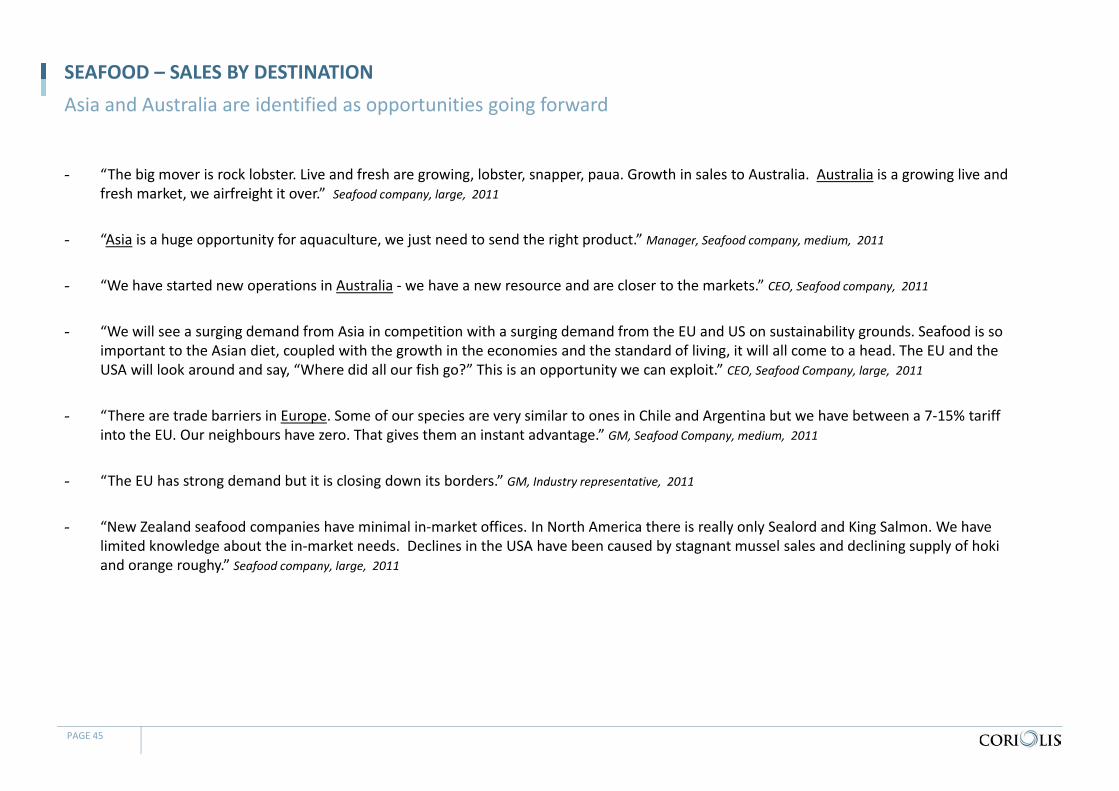
SEAFOOD – SALES BY DESTINATION
- “The big mover is rock lobster. Live and fresh are growing, lobster, snapper, paua. Growth in sales to Australia. Australia is a growing live and fresh market, we airfreight it over.” Seafood company, large, 2011
- “Asia is a huge opportunity for aquaculture, we just need to send the right product.” Manager, Seafood company, medium, 2011
- “We have started new operations in Australia ‐ we have a new resource and are closer to the markets.” CEO, Seafood company, 2011
- “We will see a surging demand from Asia in competition with a surging demand from the EU and US on sustainability grounds. Seafood is so important to the Asian diet, coupled with the growth in the economies and the standard of living, it will all come to a head. The EU and the USA will look around and say, “Where did all our fish go?” This is an opportunity we can exploit.” CEO, Seafood Company, large, 2011
- “There are trade barriers in Europe. Some of our species are very similar to ones in Chile and Argentina but we have between a 7‐15% tariff into the EU. Our neighbours have zero. That gives them an instant advantage.” GM, Seafood Company, medium, 2011
- “The EU has strong demand but it is closing down its borders.” GM, Industry representative, 2011
- “New Zealand seafood companies have minimal in‐market offices. In North America there is really only Sealord and King Salmon. We have limited knowledge about the in‐market needs. Declines in the USA have been caused by stagnant mussel sales and declining supply of hokiand orange roughy.” Seafood company, large, 2011
PAGE 45
Asia and Australia are identified as opportunities going forward
TABLE OF CONTENTS
Section Page
Contents 4
Glossary of terms 5
Methodology & data sources 6
F&B IP Overview 7
Summary & conclusions 9
Sector overview 17
Wild capture 46
Aquaculture 85
Appendices
Oysters 113
Mussels 122
Salmon 134
Profiles of key firms 156
Supplementary material 162
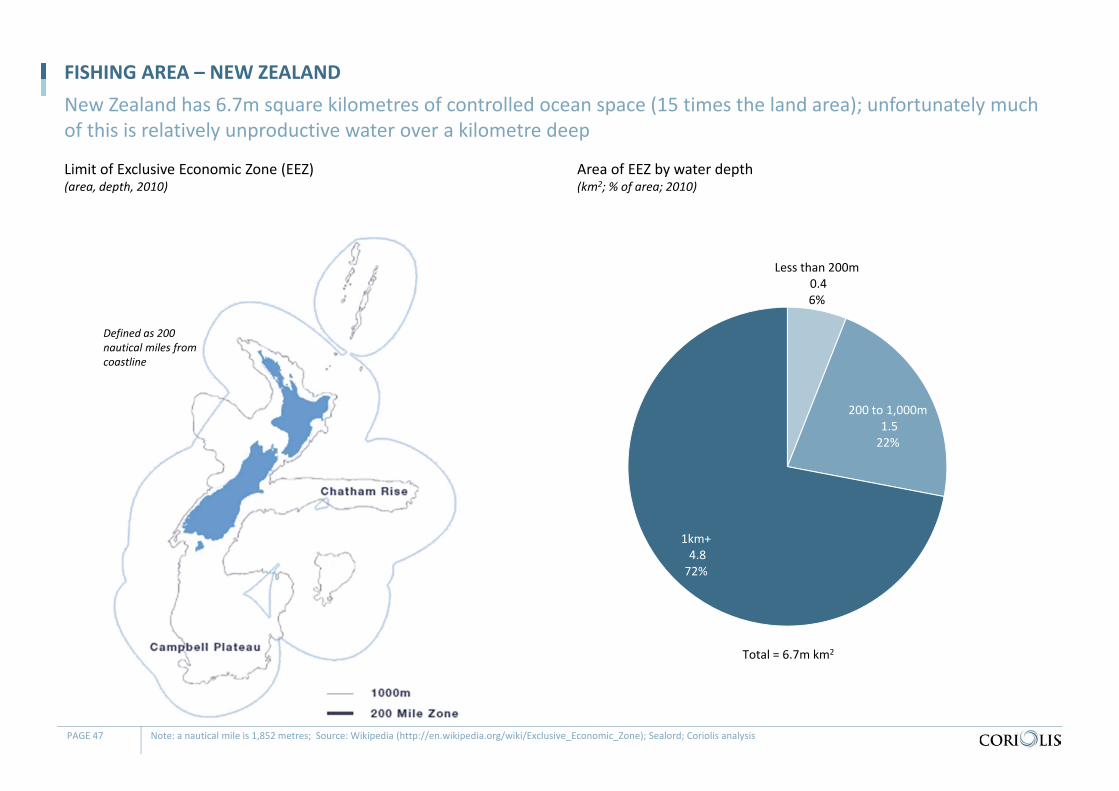
Defined as 200 nautical miles from coastline
Limit of Exclusive Economic Zone (EEZ)(area, depth, 2010)
FISHING AREA – NEW ZEALANDNew Zealand has 6.7m square kilometres of controlled ocean space (15 times the land area); unfortunately much of this is relatively unproductive water over a kilometre deep
PAGE 47 Note: a nautical mile is 1,852 metres; Source: Wikipedia (http://en.wikipedia.org/wiki/Exclusive_Economic_Zone); Sealord; Coriolis analysis
Less than 200m0.4 6%
200 to 1,000m1.5 22%
1km+4.8 72%
Total = 6.7m km2
Area of EEZ by water depth(km2; % of area; 2010)
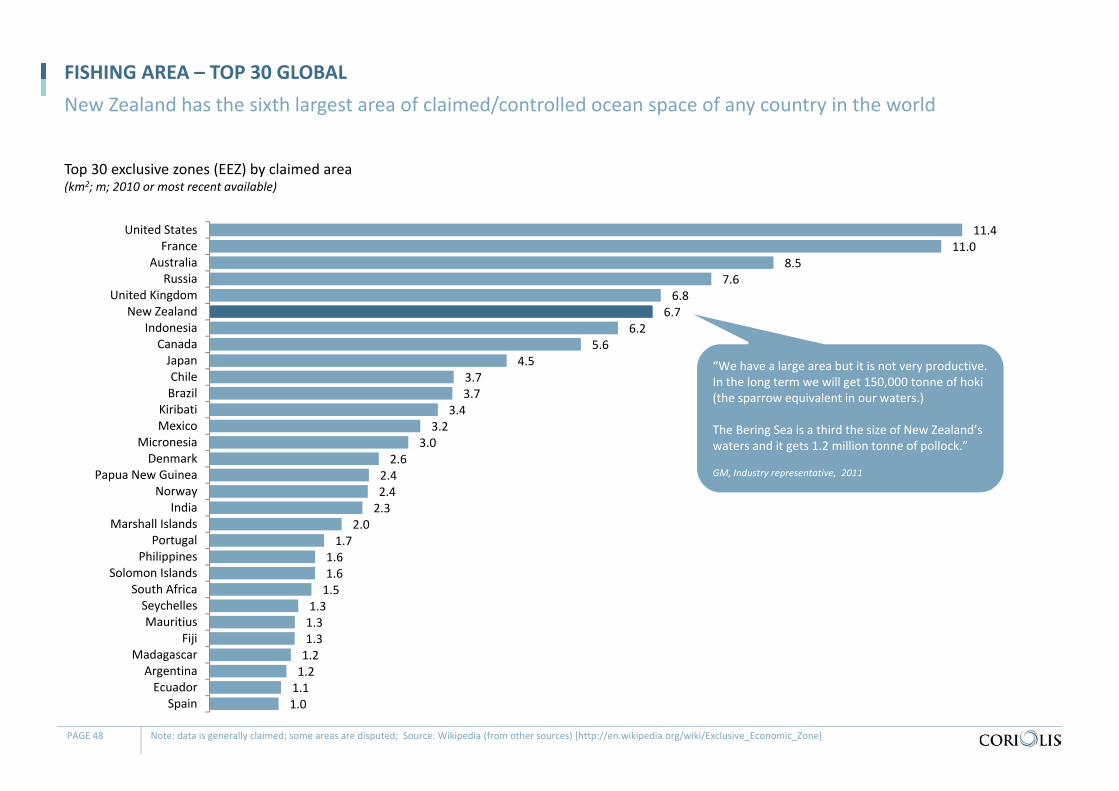
Top 30 exclusive zones (EEZ) by claimed area(km2; m; 2010 or most recent available)
FISHING AREA – TOP 30 GLOBALNew Zealand has the sixth largest area of claimed/controlled ocean space of any country in the world
PAGE 48 Note: data is generally claimed; some areas are disputed; Source: Wikipedia (from other sources) [http://en.wikipedia.org/wiki/Exclusive_Economic_Zone]
11.4 11.0
8.5 7.6
6.8 6.7
6.2 5.6
4.5 3.7 3.7
3.4 3.2
3.0 2.6
2.4 2.4 2.3
2.0 1.7
1.6 1.6 1.5
1.3 1.3 1.3 1.2 1.2 1.1 1.0
United States France
Australia Russia
United Kingdom New Zealand
Indonesia Canada Japan Chile Brazil
Kiribati Mexico
Micronesia Denmark
Papua New Guinea Norway
India Marshall Islands
Portugal Philippines
Solomon Islands South Africa Seychelles Mauritius
Fiji Madagascar Argentina Ecuador
Spain
“We have a large area but it is not very productive. In the long term we will get 150,000 tonne of hoki(the sparrow equivalent in our waters.)
The Bering Sea is a third the size of New Zealand’s waters and it gets 1.2 million tonne of pollock.”
GM, Industry representative, 2011
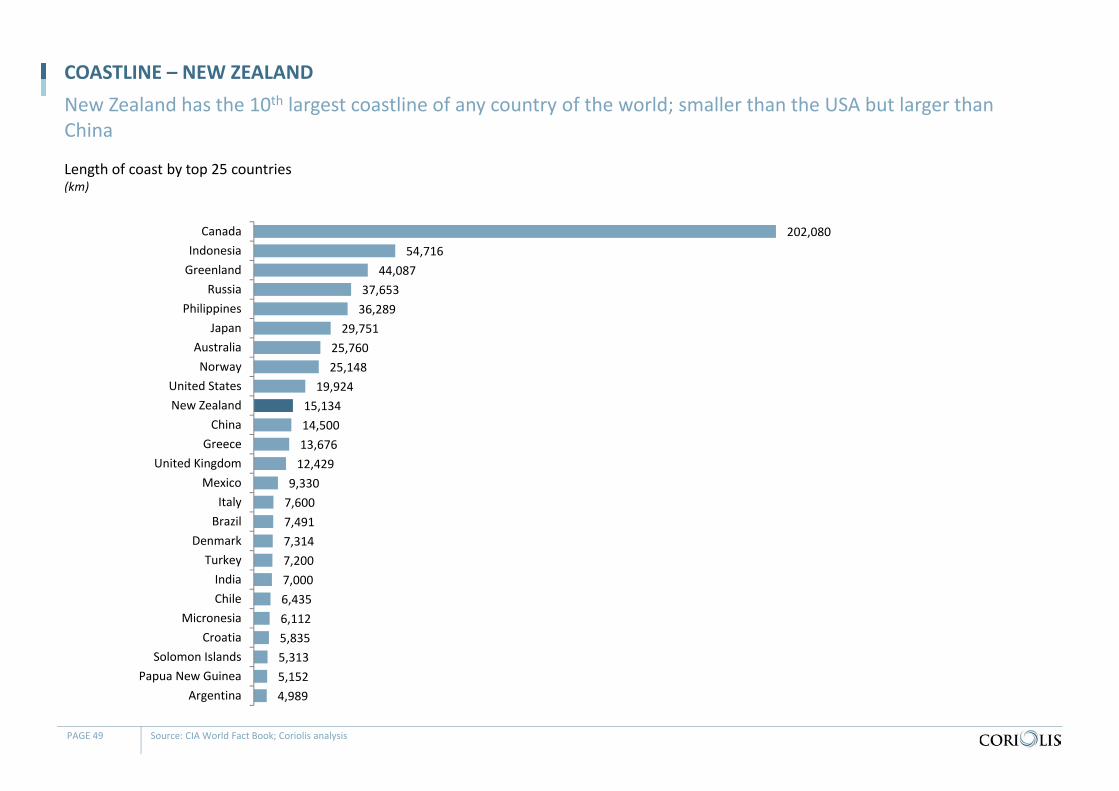
Length of coast by top 25 countries(km)
COASTLINE – NEW ZEALANDNew Zealand has the 10th largest coastline of any country of the world; smaller than the USA but larger than China
PAGE 49 Source: CIA World Fact Book; Coriolis analysis
202,080 54,716
44,087 37,653 36,289
29,751 25,760 25,148
19,924 15,134 14,500 13,676 12,429
9,330 7,600 7,491 7,314 7,200 7,000 6,435 6,112 5,835 5,313 5,152 4,989
CanadaIndonesiaGreenland
RussiaPhilippines
JapanAustraliaNorway
United StatesNew Zealand
ChinaGreece
United KingdomMexico
ItalyBrazil
DenmarkTurkeyIndiaChile
MicronesiaCroatia
Solomon IslandsPapua New Guinea
Argentina
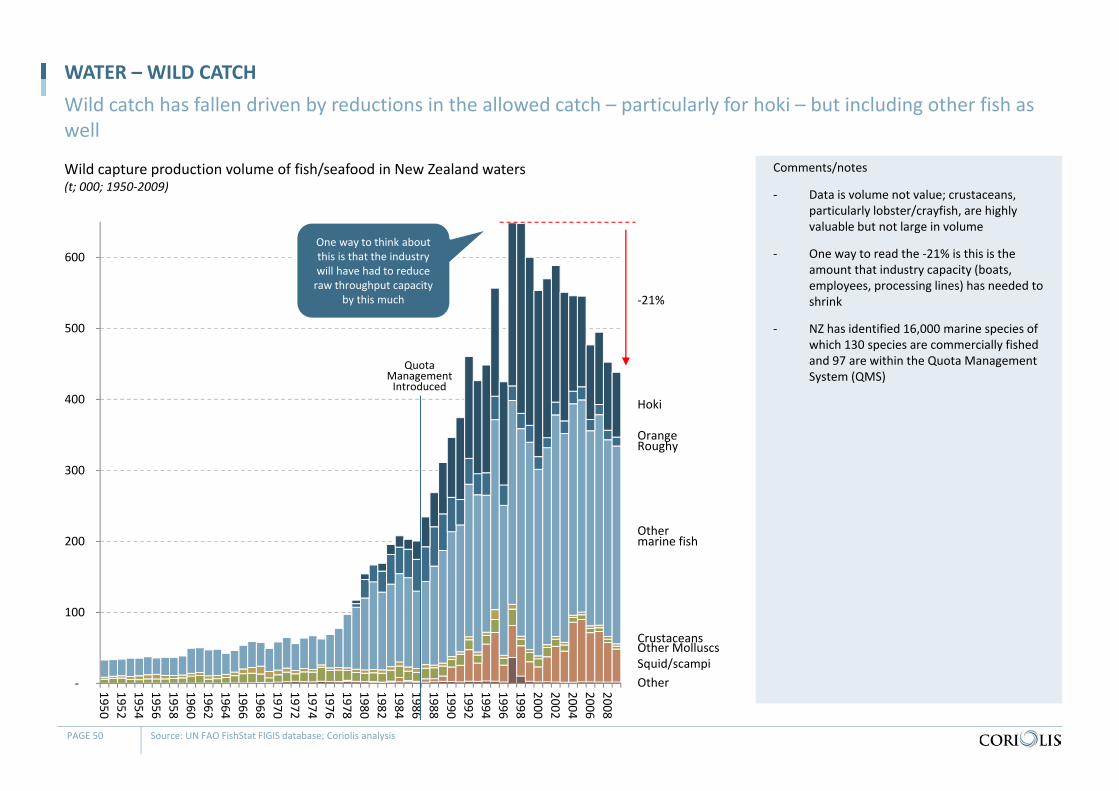
Wild capture production volume of fish/seafood in New Zealand waters(t; 000; 1950‐2009)
WATER – WILD CATCHWild catch has fallen driven by reductions in the allowed catch – particularly for hoki – but including other fish as well
PAGE 50 Source: UN FAO FishStat FIGIS database; Coriolis analysis
Comments/notes
‐ Data is volume not value; crustaceans, particularly lobster/crayfish, are highly valuable but not large in volume
‐ One way to read the ‐21% is this is the amount that industry capacity (boats, employees, processing lines) has needed to shrink
‐ NZ has identified 16,000 marine species of which 130 species are commercially fished and 97 are within the Quota Management System (QMS)
‐
100
200
300
400
500
600
195019521954195619581960196219641966196819701972197419761978198019821984198619881990199219941996199820002002200420062008
Hoki
Orange Roughy
Other marine fish
CrustaceansOther MolluscsSquid/scampiOther
‐21%
One way to think about this is that the industry will have had to reduce raw throughput capacity
by this much
QuotaManagementIntroduced
‐
100
200
300
400
500
600
19501953195619591962196519681971197419771980198319861989199219951998200120042007201020132016201920222025
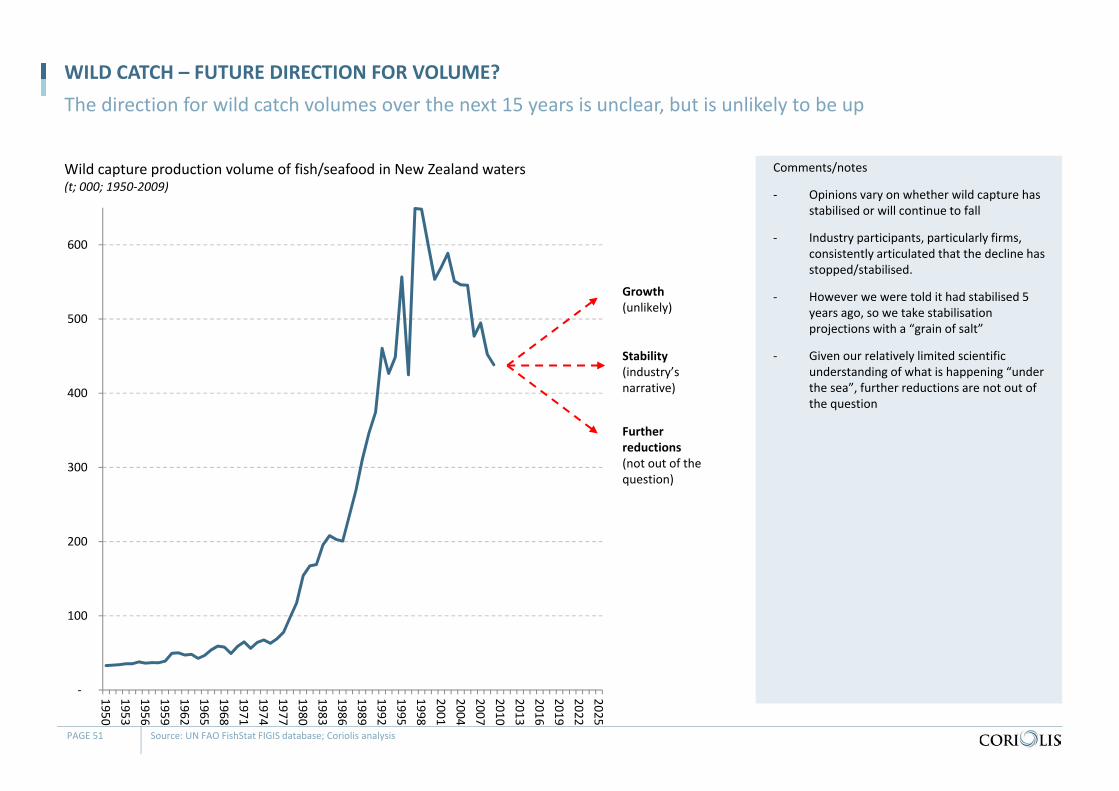
Wild capture production volume of fish/seafood in New Zealand waters(t; 000; 1950‐2009)
WILD CATCH – FUTURE DIRECTION FOR VOLUME?The direction for wild catch volumes over the next 15 years is unclear, but is unlikely to be up
PAGE 51 Source: UN FAO FishStat FIGIS database; Coriolis analysis
Comments/notes
‐ Opinions vary on whether wild capture has stabilised or will continue to fall
‐ Industry participants, particularly firms, consistently articulated that the decline has stopped/stabilised.
‐ However we were told it had stabilised 5 years ago, so we take stabilisation projections with a “grain of salt”
‐ Given our relatively limited scientific understanding of what is happening “under the sea”, further reductions are not out of the question
Further reductions(not out of the question)
Growth(unlikely)
Stability(industry’s narrative)
WILD CATCH
- “We can get a few more gains from utilising some stock, but there is not a lot of growth out there.” CEO, Seafood Company, large, 2011
- “There are no more fish out there, no major undiscovered fisheries. But there are some species that we are not fully utilising, like swordfish.” CEO, Seafood Company, large, 2011
- “We can’t triple the wild catch industry. There are no new wild species out there, and we certainly can’t triple volume of any. It’s damn hard.” CEO, Seafood Company, medium, 2011
- “There is the opportunity to gain more from the inshore stocks, but not a huge opportunity.” CEO, Seafood Company, large, 2011
- “This curve is a typical curve of a wild catch stock curve. It was decided we were taking too much hoki and the reductions in the quota helped manage the stock levels. They are slowly going back up and will be at 120 next year. This is why the quota management system works.” Seafood Company, large, 2011
PAGE 52
Interviewees did not see any major opportunities for growing wild catch
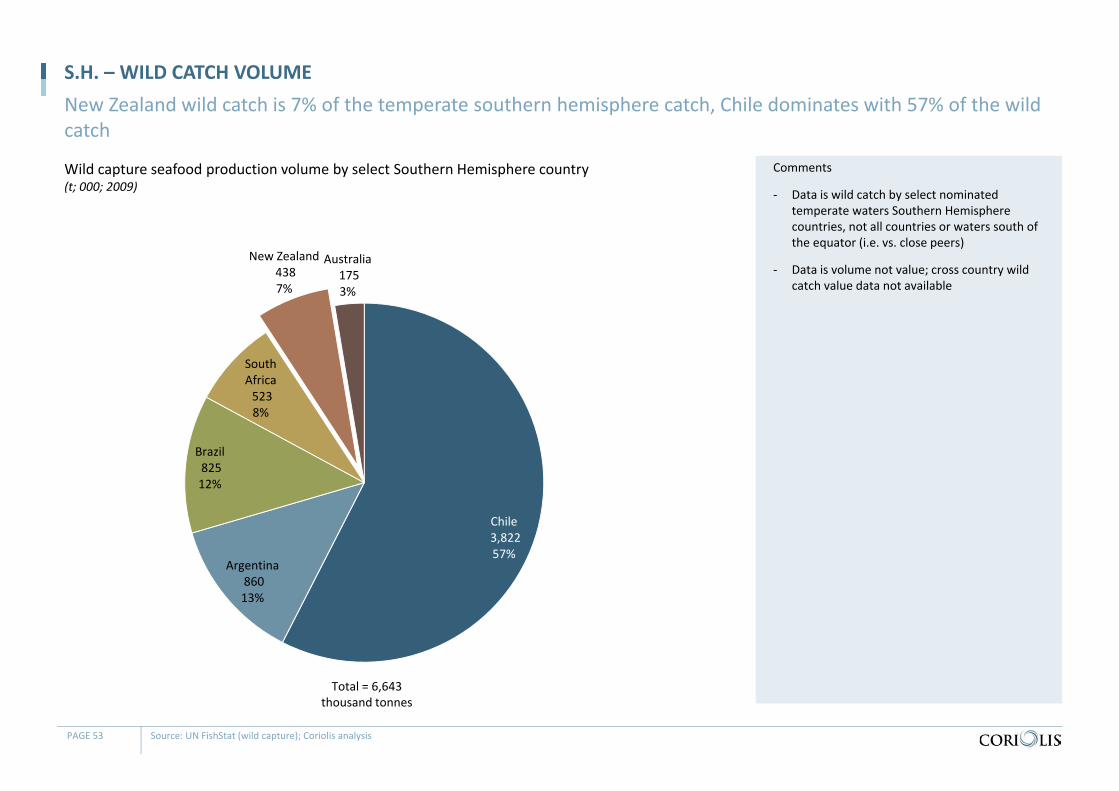
Wild capture seafood production volume by select Southern Hemisphere country(t; 000; 2009)
S.H. – WILD CATCH VOLUMENew Zealand wild catch is 7% of the temperate southern hemisphere catch, Chile dominates with 57% of the wild catch
PAGE 53 Source: UN FishStat (wild capture); Coriolis analysis
Comments
‐ Data is wild catch by select nominated temperate waters Southern Hemisphere countries, not all countries or waters south of the equator (i.e. vs. close peers)
‐ Data is volume not value; cross country wild catch value data not available
Chile3,822 57%
Argentina860 13%
Brazil825 12%
South Africa523 8%
New Zealand438 7%
Australia175 3%
Total = 6,643 thousand tonnes
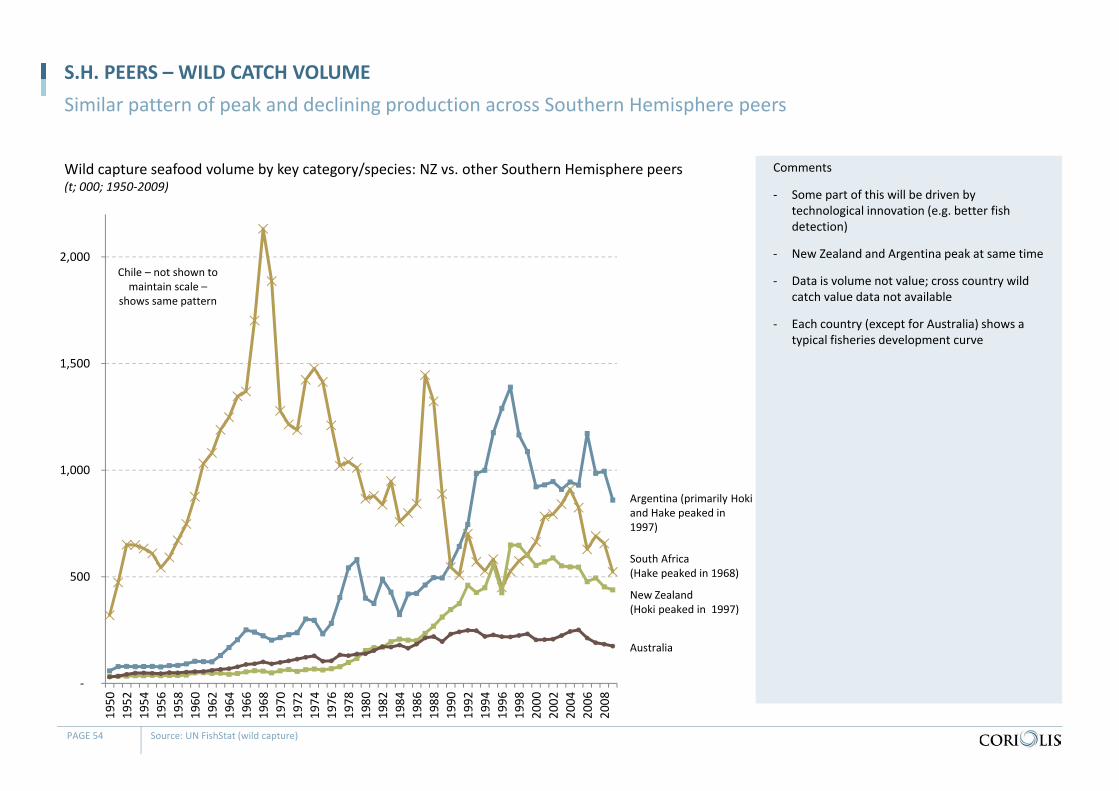
Wild capture seafood volume by key category/species: NZ vs. other Southern Hemisphere peers(t; 000; 1950‐2009)
S.H. PEERS – WILD CATCH VOLUMESimilar pattern of peak and declining production across Southern Hemisphere peers
PAGE 54 Source: UN FishStat (wild capture)
Comments
‐ Some part of this will be driven by technological innovation (e.g. better fish detection)
‐ New Zealand and Argentina peak at same time
‐ Data is volume not value; cross country wild catch value data not available
‐ Each country (except for Australia) shows a typical fisheries development curve
‐
500
1,000
1,500
2,000
1950
1952
1954
1956
1958
1960
1962
1964
1966
1968
1970
1972
1974
1976
1978
1980
1982
1984
1986
1988
1990
1992
1994
1996
1998
2000
2002
2004
2006
2008
Argentina (primarily Hoki and Hake peaked in 1997)
South Africa (Hake peaked in 1968)
New Zealand (Hoki peaked in 1997)
Australia
Chile – not shown to maintain scale –
shows same pattern
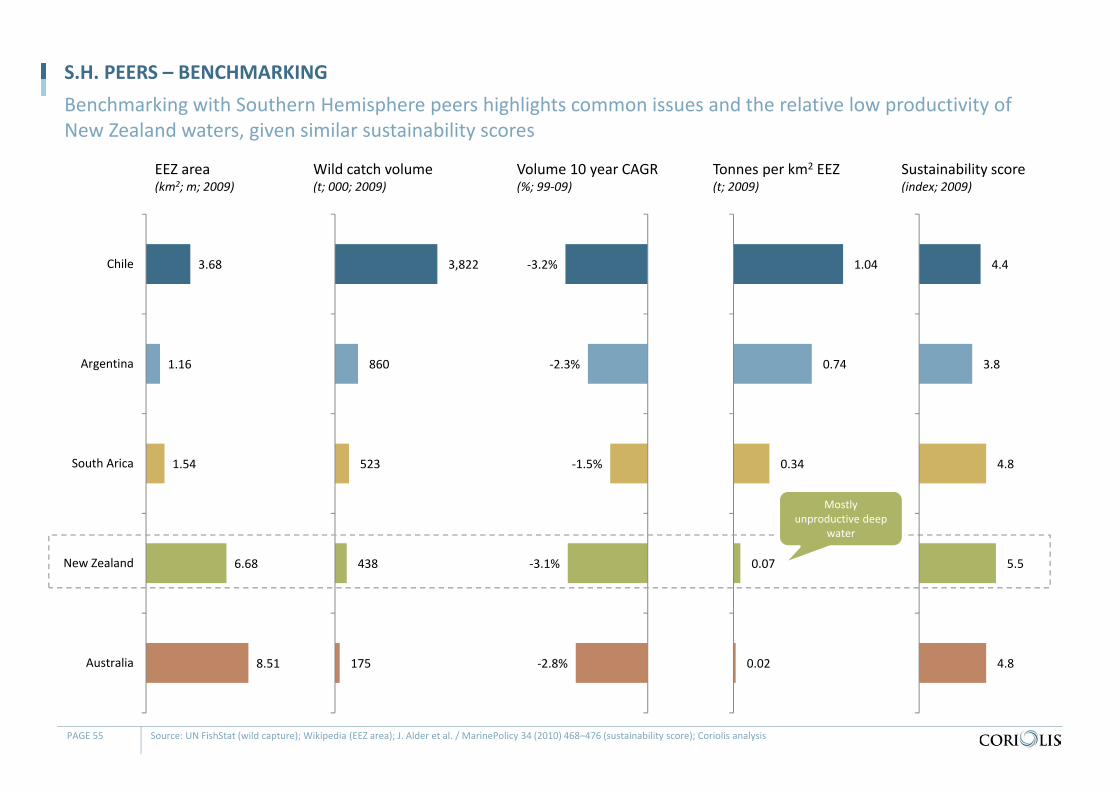
EEZ area(km2; m; 2009)
S.H. PEERS – BENCHMARKINGBenchmarking with Southern Hemisphere peers highlights common issues and the relative low productivity of New Zealand waters, given similar sustainability scores
PAGE 55 Source: UN FishStat (wild capture); Wikipedia (EEZ area); J. Alder et al. / MarinePolicy 34 (2010) 468–476 (sustainability score); Coriolis analysis
3.68
1.16
1.54
6.68
8.51
Chile
Argentina
South Arica
New Zealand
Australia
Volume 10 year CAGR(%; 99‐09)
‐3.2%
‐2.3%
‐1.5%
‐3.1%
‐2.8%
Wild catch volume(t; 000; 2009)
3,822
860
523
438
175
Tonnes per km2 EEZ(t; 2009)
1.04
0.74
0.34
0.07
0.02
Mostly unproductive deep
water
Sustainability score(index; 2009)
4.4
3.8
4.8
5.5
4.8
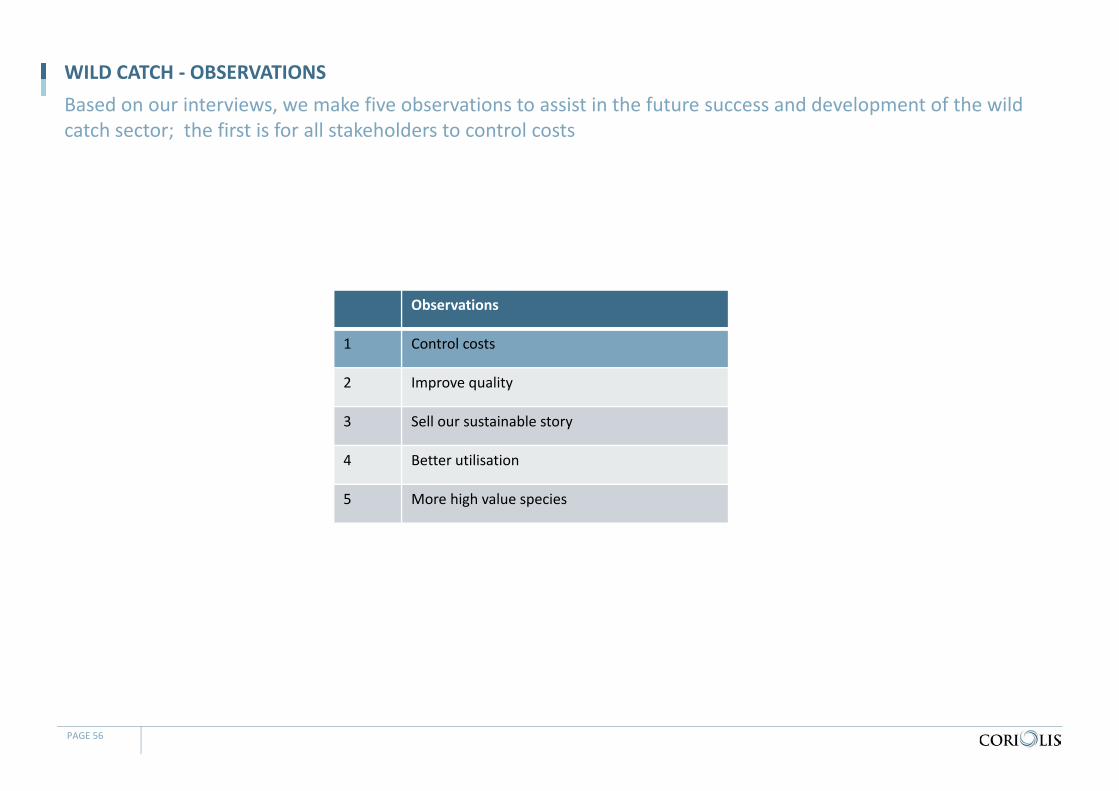
Observations
1 Control costs
2 Improve quality
3 Sell our sustainable story
4 Better utilisation
5 More high value species
WILD CATCH ‐ OBSERVATIONSBased on our interviews, we make five observations to assist in the future success and development of the wild catch sector; the first is for all stakeholders to control costs
PAGE 56
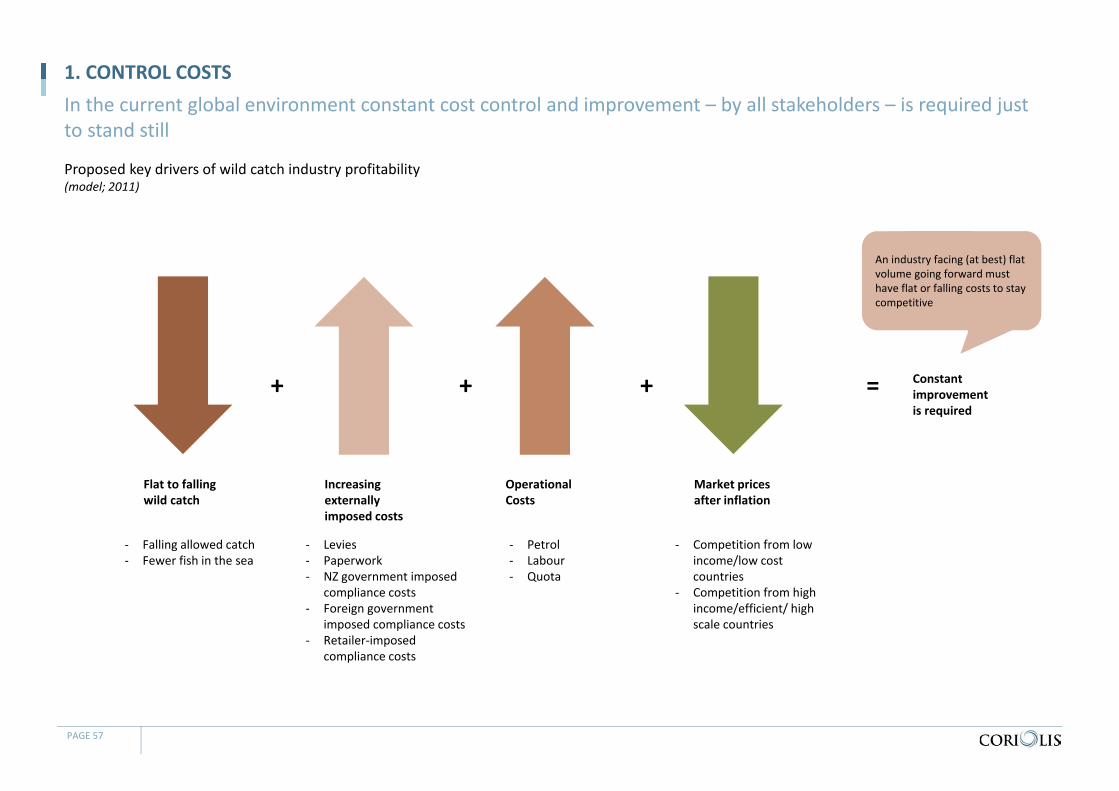
Proposed key drivers of wild catch industry profitability(model; 2011)
1. CONTROL COSTSIn the current global environment constant cost control and improvement – by all stakeholders – is required just to stand still
PAGE 57
Increasingexternally imposed costs
‐ Levies‐ Paperwork‐ NZ government imposed
compliance costs‐ Foreign government
imposed compliance costs‐ Retailer‐imposed
compliance costs
+ +
Operational Costs
‐ Petrol‐ Labour‐ Quota
Market prices after inflation
‐ Competition from low income/low cost countries
‐ Competition from high income/efficient/ high scale countries
= Constant improvement is required
Flat to falling wild catch
‐ Falling allowed catch‐ Fewer fish in the sea
+
An industry facing (at best) flat volume going forward must have flat or falling costs to stay competitive
1. CONTROL COSTS – IMPOSED
- “We have to control costs. There are increasing costs of compliance, its out of control. The change of government has seen a control of costs. Internal costs with NZFSA1 conditions, they copy draconian standards from the EU.” GM, Industry representative, 2011
- “The biggest barrier to our industries growth is the amount of regulation. There is so much regulation that we have to adhere to, on so many levels. We want to change the industry toward more self management. This will save huge amounts of money and time. We have a concept called “Managing our own ship” Seafood Industry Council representative, May 2011
- “Our industry is definitely over‐regulated… However I don’t think we will be trusted (or should be) to run our own ship. To have credibility we need to be managed externally.” CEO, Seafood Company, large, 2011
- “As an industry, we are over regulated. There are thousands of regulations relating to fisheries. They have accumulated over the years and they certainly add up. For wild catch we are held back by the rigidity of the QMS, but we need to work with government carefully and address issues step by step. The deepsea group work together really well, we just need to move in that direction for inshore fisheries groups. Regulation is an issue for stifling innovation.” CEO, Seafood Company, large, 2011
- “Reducing wild catch tonnages inevitably lead to lower returns based on a model of cutting costs and producing more. Did anyone say the words “commodity price slaves”? Manager, Seafood Research Industry, 2011
PAGE 58 1. New Zealand Food Safety Authority
The government must play its part by (1) continuously improving its efficiency and (2) holding or maintaining imposed overhead as a percent of industry turnover
1. CONTROL COSTS – THE ALTERNATIVE
- “When the cost gets too high, we move our business.” GM, Industry representative, 2011
- “If the cost of manufacturing gets too high, we will just move." MD, Seafood Company, large, 2011
- “We looked at offshore processing to decrease costs, and gravitate toward a more economic model. Canning in Spain and chuck with others, we couldn’t get the flavouring cost effective. We are now looking at quotes in Asia.” Manager, Seafood company, medium, 2011
- “In the medium term ‐ 10‐15 years ‐ we need to become less reliant on white frozen block, and more focused on value added. That probably won’t happen in New Zealand, its too hard to do it here and make money. There are high labour costs, low brand presence and a huge distance to market.” CEO, Seafood Company, large, 2011
PAGE 59
If costs are not controlled, the industry will continue to move overseas
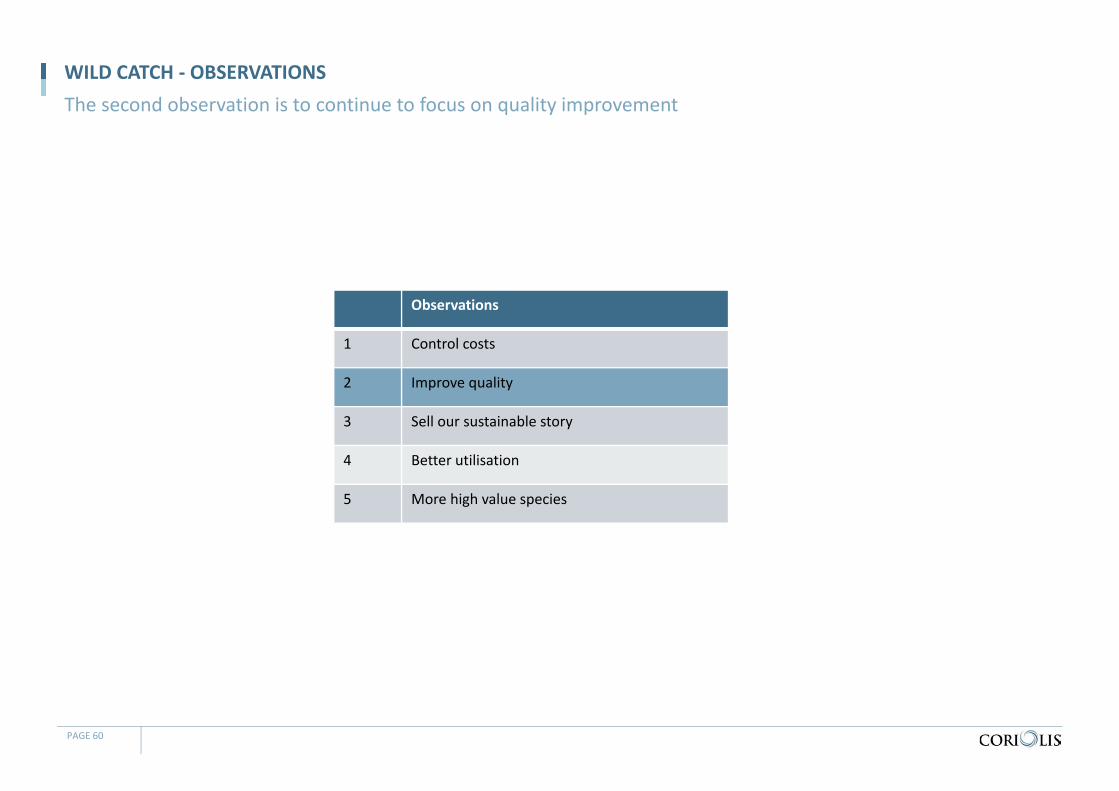
Observations
1 Control costs
2 Improve quality
3 Sell our sustainable story
4 Better utilisation
5 More high value species
WILD CATCH ‐ OBSERVATIONSThe second observation is to continue to focus on quality improvement
PAGE 60
2. IMPROVE QUALITY
- “Our failure to gain higher prices is a failure in value chain management. It starts with a failure to manage the quality of produce to meet high value consumer needs (we strive to meet minimum standards). It continues with an abrogation of market responsibility (“give me the best price on the beach”). Manager, Research industry body, 2011
- "The fishermen are revolting against bleached and canned paua. The returns for live paua to China are so much greater than for canned, and still so much goes canned." CEO, Medium Seafood Company, 2011
- "We need a species that fits into the white table cloth. The magic US$5/pound, that's the magic spot for white fish." Manager, Seafood representative, 2011
PAGE 61
Interviewees indicated there were opportunities to improve quality
2. IMPROVE QUALITY – PGP INVESTMENT
- “PSH has developed a prototype harvesting system that can be set to target specific species and fish size, allowing other animals, fish species and undersize fish to escape. The harvesting system would also be able to keep fish immersed in seawater, keeping them alive for longer and in better condition. The two key benefits will be increased sustainability of inshore and deepwater commercial fishing, and increased quality of catch.” PGP, Media statement, Feb 2011
- “A partnership between the Crown, Aotearoa Fisheries, Sanford and Sealord Group ‐ called Precision Seafood Harvesting ‐ plans to develop new wild fish harvesting technology that will allow more precise catches and fish to be landed fresher and in better condition. The partnership would be worth up to $52.6 million over six years, with half the funding coming from the Primary Growth Partnership. The technology aims to improve revenue by an estimated $100 million a year by 2029.” New Zealand Herald, Feb 2011
- “One hope with precision harvesting is that we will only catch the fish that we are fishing for, that should help preserve other species.” Seafood Company, large, 2011
PAGE 62
The recent “precision harvesting” Primary Growth Partnership (PGP) has committed to investing up to $52.6m in developing better wild catch technology
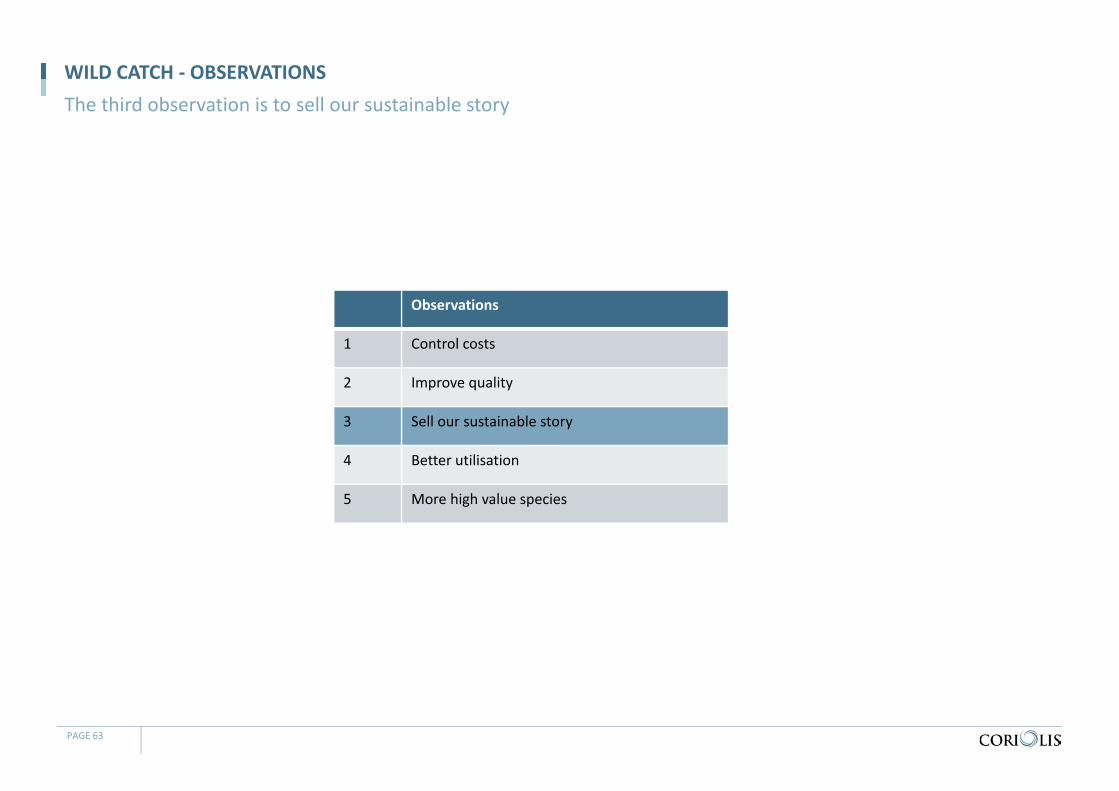
Observations
1 Control costs
2 Improve quality
3 Sell our sustainable story
4 Better utilisation
5 More high value species
WILD CATCH ‐ OBSERVATIONSThe third observation is to sell our sustainable story
PAGE 63
3. SELL SUSTAINABLE – WE ARE SUSTAINABLE
- “We will fish ourselves out of existence if we aren’t sustainable.“ CEO, Seafood Company, large, 2011
- “Our biggest advantage is the QMS. Those countries with a sustainable fishery will be better positioned in the future. With a growing global population and increased demand for fish, and healthy food, we are in a great position.” CEO, Seafood Company, medium, 2011
- “Our biggest strength is the fact that we have a sustainable resource. We manage the resource for now and for future generations. There are a lot of family businesses in the seafood sector and they want to make sure there is still a family business in the future.” GM, Seafood Company, medium, 2011
- “The QMS is a non‐political mechanism. In other countries they may have legislation that states a catch can’t be reduced more than 15% a year. In NZ that doesn't happen, if the scientists decide that the stock need to be protected, like in Hoki, then the quota is dropped as much as was needed. In the case of Hoki a 40% reduction. This keeps things off the political agenda.” Manager, Seafood Company, large, 2011
- “The future is sustainable fisheries. The only way to access retail markets in Europe and North America is with sustainable fisheries. The growth is in premium seafood and to be premium you have to be sustainable. Asia will very quickly, 10‐15 years catch up to Europe once the affluence levels increase.” CEO, Seafood Company, large, 2011
- “There is huge growth in sustainability. We have a reputation in the market that we are good to deal with, that we have integrity.” ,rSeafood Company, medium, 2011
PAGE 64
There was general agreement that New Zealand has a great fisheries management system
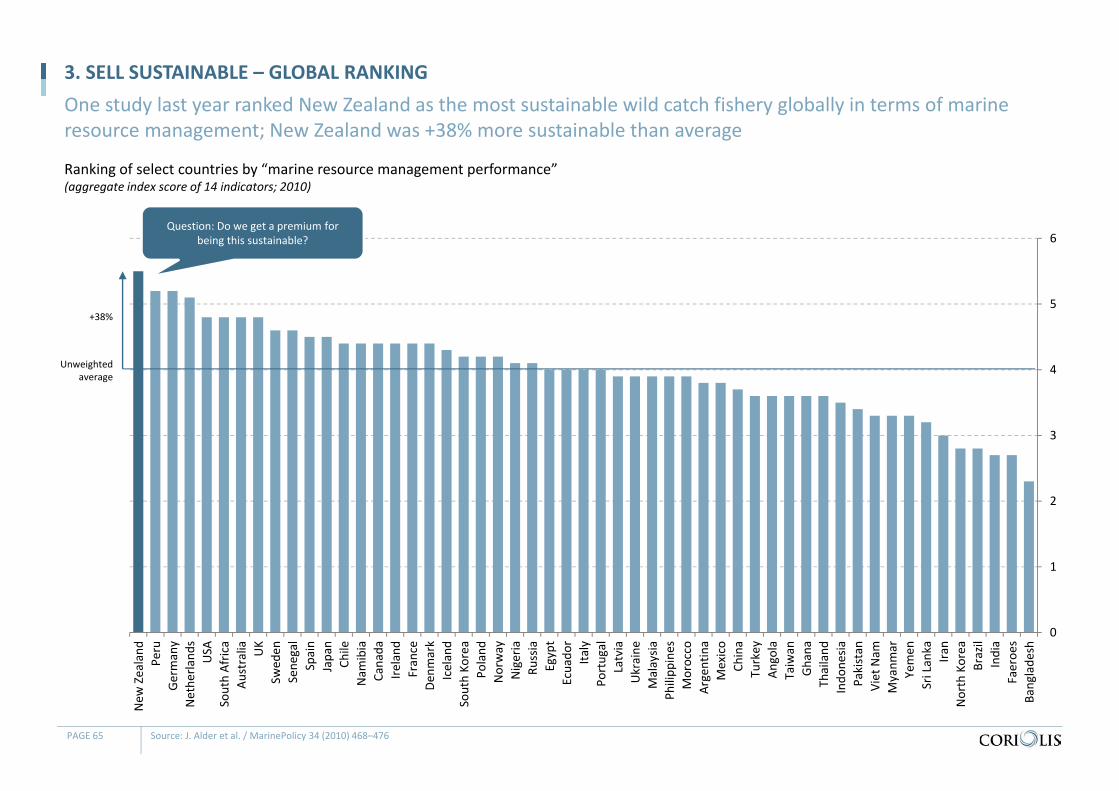
Ranking of select countries by “marine resource management performance”(aggregate index score of 14 indicators; 2010)
3. SELL SUSTAINABLE – GLOBAL RANKINGOne study last year ranked New Zealand as the most sustainable wild catch fishery globally in terms of marine resource management; New Zealand was +38% more sustainable than average
PAGE 65 Source: J. Alder et al. / MarinePolicy 34 (2010) 468–476
0
1
2
3
4
5
6
New
Zealand
Peru
Germany
Nethe
rland
sUSA
South Africa
Australia UK
Swed
enSene
gal
Spain
Japan
Chile
Nam
ibia
Canada
Ireland
France
Denm
ark
Iceland
South Ko
rea
Poland
Norway
Nigeria
Russia
Egypt
Ecuado
rIta
lyPo
rtugal
Latvia
Ukraine
Malaysia
Philipp
ines
Morocco
Argentina
Mexico
China
Turkey
Angola
Taiwan
Ghana
Thailand
Indo
nesia
Pakistan
Viet Nam
Myanm
arYemen
Sri Lanka
Iran
North Korea
Brazil
India
Faeroe
sBa
nglade
sh
Unweightedaverage
+38%
Question: Do we get a premium for being this sustainable?
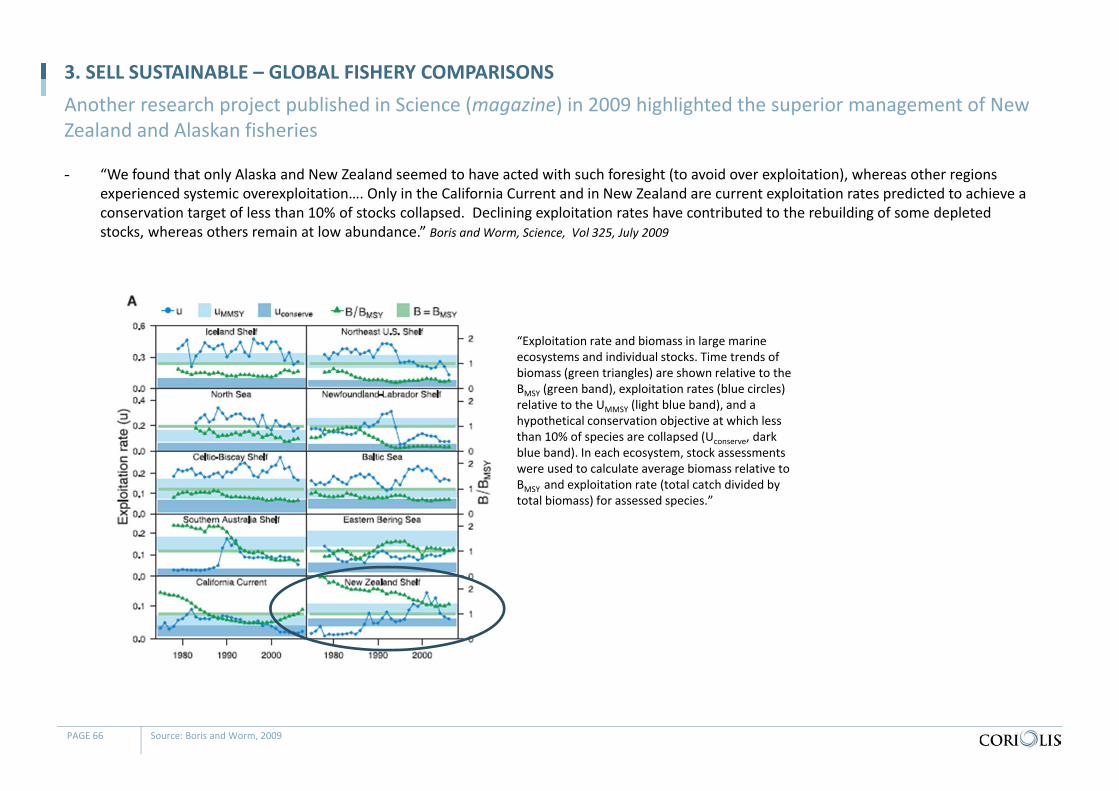
3. SELL SUSTAINABLE – GLOBAL FISHERY COMPARISONS
- “We found that only Alaska and New Zealand seemed to have acted with such foresight (to avoid over exploitation), whereas other regions experienced systemic overexploitation…. Only in the California Current and in New Zealand are current exploitation rates predicted to achieve a conservation target of less than 10% of stocks collapsed. Declining exploitation rates have contributed to the rebuilding of some depleted stocks, whereas others remain at low abundance.” Boris and Worm, Science, Vol 325, July 2009
PAGE 66 Source: Boris and Worm, 2009
Another research project published in Science (magazine) in 2009 highlighted the superior management of New Zealand and Alaskan fisheries
“Exploitation rate and biomass in large marine ecosystems and individual stocks. Time trends of biomass (green triangles) are shown relative to the BMSY (green band), exploitation rates (blue circles) relative to the UMMSY (light blue band), and a hypothetical conservation objective at which less than 10% of species are collapsed (Uconserve, dark blue band). In each ecosystem, stock assessments were used to calculate average biomass relative to BMSY and exploitation rate (total catch divided by total biomass) for assessed species.”
3. SELL SUSTAINABLE – WE MARKET OUR SUSTAINABILITY POORLY
- “Industry and Government need to get a consistent message out around our sustainable resource and practices. We don’t tell the story well enough. We only ever react to negative press around trawling or Greenpeace species issues. We don’t push the positive stories or press.” CEO, Seafood company, large, 2011
- “People in the industry know that we have a sustainable system with the QMS, but I don’t think we do a good job of selling that to the public.” Seafood Company, medium, 2011
- “We have a great system but do not manage our image well. We need to forward integrate into the market and get the story out there.” Seafood Company, large, 2011
- “An opportunity for the New Zealand seafood sector is to reach levels of sustainability that are recognised in Iceland. All their seafood and fisheries are recognised as sustainable. Alaska, Iceland and NZ are recognised in the industry as the best managed resources, but we don’t do a good job managing that image. The Marine Stewardship certification gets us a 7.5% premium in hoki, but its very expensive to get that certification. If we didn’t have the certification we would be shut out of many markets in the UK and EU.” Seafood Industry Council representative, May 2011
PAGE 67
There was general agreement that New Zealand was sustainable but did not do a good job of marketing that fact
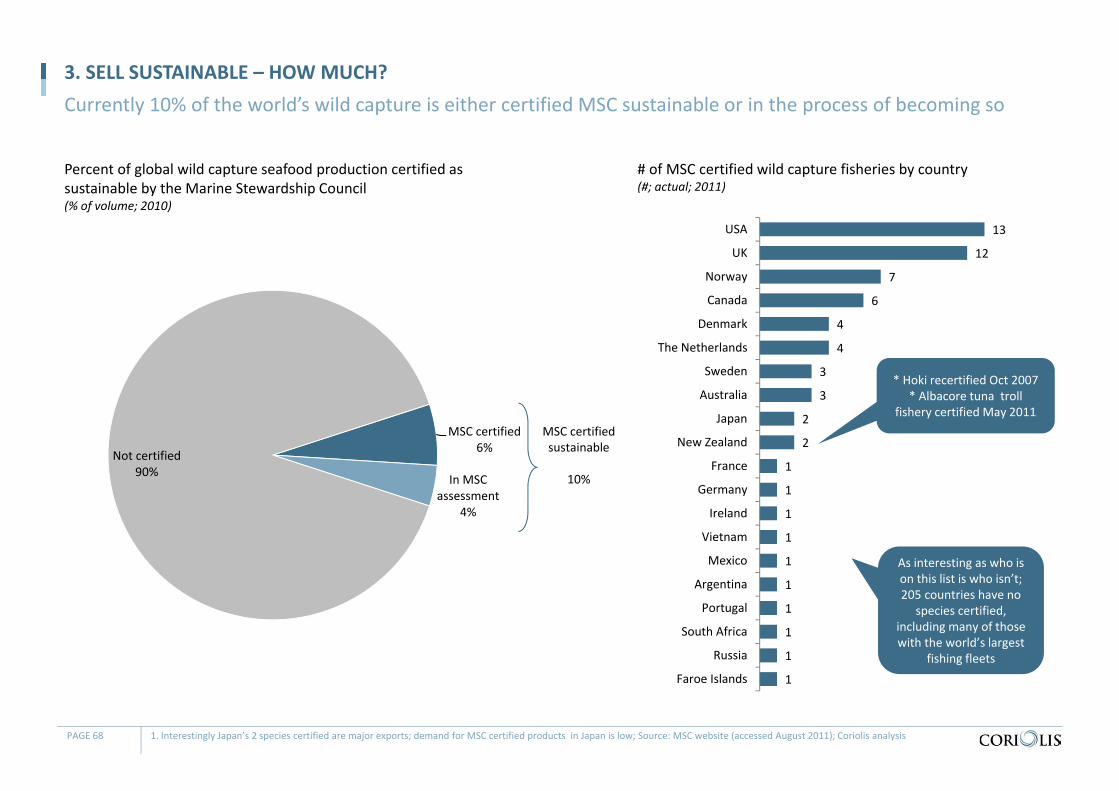
Percent of global wild capture seafood production certified as sustainable by the Marine Stewardship Council(% of volume; 2010)
3. SELL SUSTAINABLE – HOW MUCH?Currently 10% of the world’s wild capture is either certified MSC sustainable or in the process of becoming so
PAGE 68 1. Interestingly Japan’s 2 species certified are major exports; demand for MSC certified products in Japan is low; Source: MSC website (accessed August 2011); Coriolis analysis
MSC certified6%
In MSC assessment
4%
Not certified90%
MSC certified sustainable
10%
13
12
7
6
4
4
3
3
2
2
1
1
1
1
1
1
1
1
1
1
USA
UK
Norway
Canada
Denmark
The Netherlands
Sweden
Australia
Japan
New Zealand
France
Germany
Ireland
Vietnam
Mexico
Argentina
Portugal
South Africa
Russia
Faroe Islands
# of MSC certified wild capture fisheries by country(#; actual; 2011)
As interesting as who is on this list is who isn’t; 205 countries have no
species certified, including many of those with the world’s largest
fishing fleets
* Hoki recertified Oct 2007 * Albacore tuna troll
fishery certified May 2011
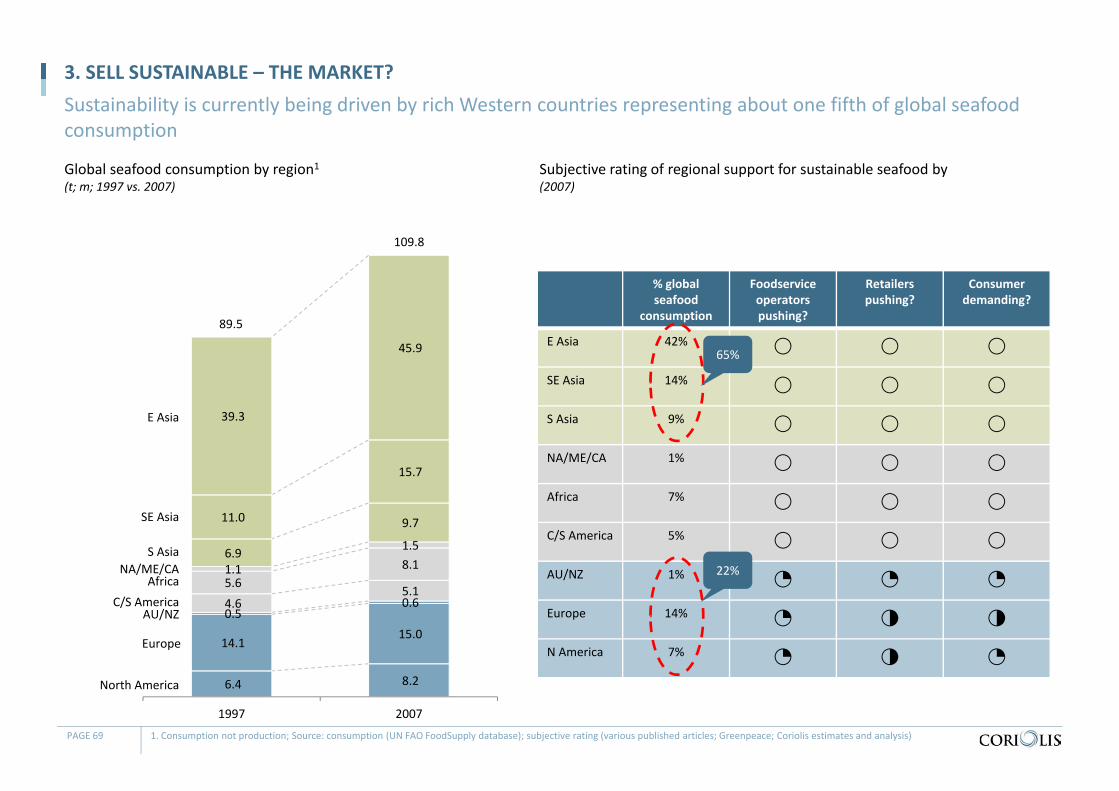
Global seafood consumption by region1(t; m; 1997 vs. 2007)
3. SELL SUSTAINABLE – THE MARKET?Sustainability is currently being driven by rich Western countries representing about one fifth of global seafood consumption
PAGE 69 1. Consumption not production; Source: consumption (UN FAO FoodSupply database); subjective rating (various published articles; Greenpeace; Coriolis estimates and analysis)
6.4 8.2
14.1 15.0
0.5 0.6 4.6 5.1 5.6 8.1 1.1
1.5 6.9
9.7 11.0
15.7
39.3
45.9
1997 2007
North America
Europe
AU/NZC/S America
AfricaNA/ME/CA
E Asia
SE Asia
S Asia
89.5
109.8
% global seafood
consumption
Foodserviceoperators pushing?
Retailers pushing?
Consumer demanding?
E Asia 42%
SE Asia 14%
S Asia 9%
NA/ME/CA 1%
Africa 7%
C/S America 5%
AU/NZ 1%
Europe 14%
N America 7%
Subjective rating of regional support for sustainable seafood by (2007)
22%
65%
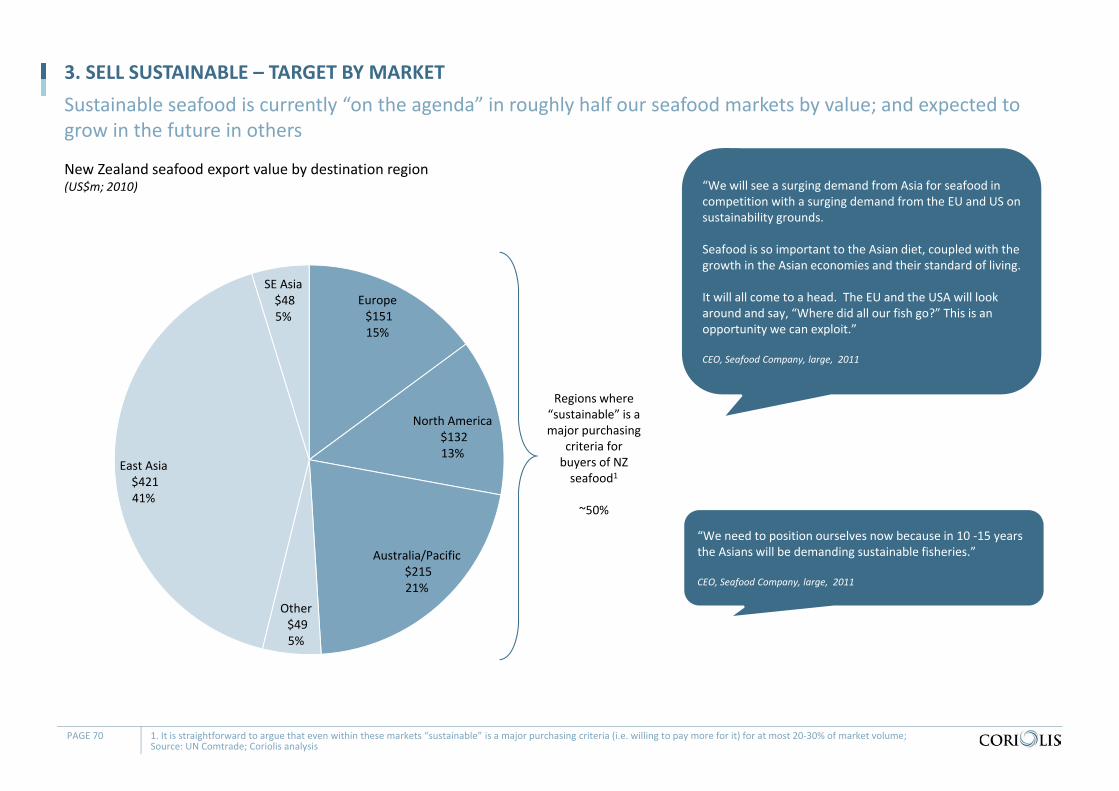
New Zealand seafood export value by destination region(US$m; 2010)
3. SELL SUSTAINABLE – TARGET BY MARKET Sustainable seafood is currently “on the agenda” in roughly half our seafood markets by value; and expected to grow in the future in others
PAGE 70 1. It is straightforward to argue that even within these markets “sustainable” is a major purchasing criteria (i.e. willing to pay more for it) for at most 20‐30% of market volume; Source: UN Comtrade; Coriolis analysis
Europe$151 15%
North America$132 13%
Australia/Pacific$215 21%
Other$49 5%
East Asia$421 41%
SE Asia$48 5%
Regions where “sustainable” is a major purchasing
criteria for buyers of NZ seafood1
~50%
“We will see a surging demand from Asia for seafood in competition with a surging demand from the EU and US on sustainability grounds.
Seafood is so important to the Asian diet, coupled with the growth in the Asian economies and their standard of living.
It will all come to a head. The EU and the USA will look around and say, “Where did all our fish go?” This is an opportunity we can exploit.”
CEO, Seafood Company, large, 2011
“We need to position ourselves now because in 10 ‐15 years the Asians will be demanding sustainable fisheries.”
CEO, Seafood Company, large, 2011
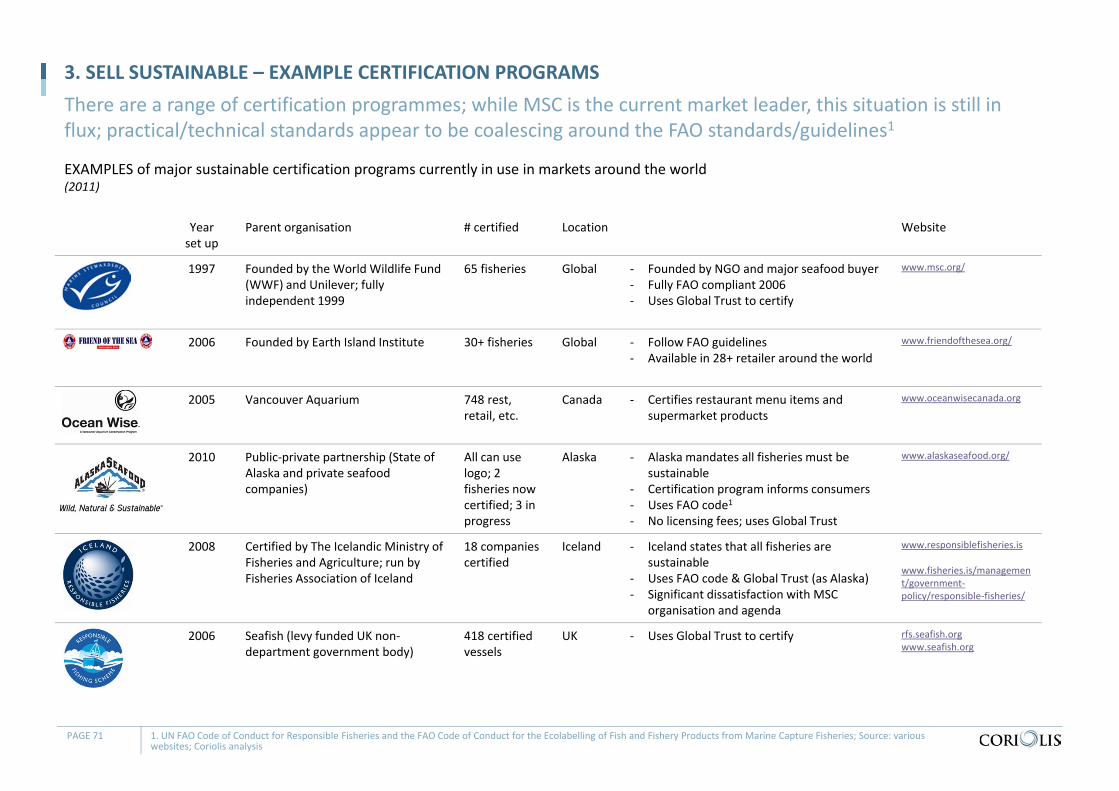
Yearset up
Parent organisation # certified Location Website
1997 Founded by the World Wildlife Fund (WWF) and Unilever; fully independent 1999
65 fisheries Global ‐ Founded by NGO and major seafood buyer‐ Fully FAO compliant 2006‐ Uses Global Trust to certify
www.msc.org/
2006 Founded by Earth Island Institute 30+ fisheries Global ‐ Follow FAO guidelines‐ Available in 28+ retailer around the world
www.friendofthesea.org/
2005 Vancouver Aquarium 748 rest, retail, etc.
Canada ‐ Certifies restaurant menu items and supermarket products
www.oceanwisecanada.org
2010 Public‐private partnership (State of Alaska and private seafood companies)
All can use logo; 2 fisheries now certified; 3 in progress
Alaska ‐ Alaska mandates all fisheries must be sustainable
‐ Certification program informs consumers‐ Uses FAO code1‐ No licensing fees; uses Global Trust
www.alaskaseafood.org/
2008 Certified by The Icelandic Ministry of Fisheries and Agriculture; run by Fisheries Association of Iceland
18 companies certified
Iceland ‐ Iceland states that all fisheries are sustainable
‐ Uses FAO code & Global Trust (as Alaska)‐ Significant dissatisfaction with MSC
organisation and agenda
www.responsiblefisheries.is
www.fisheries.is/management/government‐policy/responsible‐fisheries/
2006 Seafish (levy funded UK non‐department government body)
418 certified vessels
UK ‐ Uses Global Trust to certify rfs.seafish.orgwww.seafish.org
EXAMPLES of major sustainable certification programs currently in use in markets around the world(2011)
3. SELL SUSTAINABLE – EXAMPLE CERTIFICATION PROGRAMSThere are a range of certification programmes; while MSC is the current market leader, this situation is still in flux; practical/technical standards appear to be coalescing around the FAO standards/guidelines1
PAGE 71 1. UN FAO Code of Conduct for Responsible Fisheries and the FAO Code of Conduct for the Ecolabelling of Fish and Fishery Products from Marine Capture Fisheries; Source: various websites; Coriolis analysis
3. SELL SUSTAINABLE – DEVELOP OUR OWN SYSTEM
- “The “Iceland Responsible Fisheries” label and the “Alaska Seafood Markets Initiative” are good examples of where we could go; applying our own label. We could create a NZ brand, the clean green, sustainable fisheries and sell it to the retailers. That message does not come through at Expos.” Manager, Government Agency, 2011
- “We really need to push for encouraging a system that incorporates all of NZ as sustainable fishing resource. To have individual MSCcertification for individual species is really expensive, only large fisheries can afford it, like Hoki.” CEO, Seafood Company, large, 2011
- “Marine Stewardship Council certification is just one type of certifying agencies, there are a lot of others. We need our own.” CEO, Seafood Company, large, 2011
- “We need to manage our system of fisheries rather than the fish. The MSC is just one of a number of tools in the tool kit. We need to have National Standards. We need to have international recognition and accreditation. It’s not too far away. There is momentum to move toward the Icelandic type schemes.” CEO, Seafood Company, large, 2011
- “It would be fantastic if we could get a National Certification, but I’m not sure it would be recognised. It would need to be an independent body.” Seafood Company, large, 2011
PAGE 72 Source: http://www.fisheries.is/; http://www.alaskaseafood.org/
There is nothing more powerful than an idea whose time has come: the New Zealand government could copy Alaska and Iceland and certify all species in the QMS as sustainable
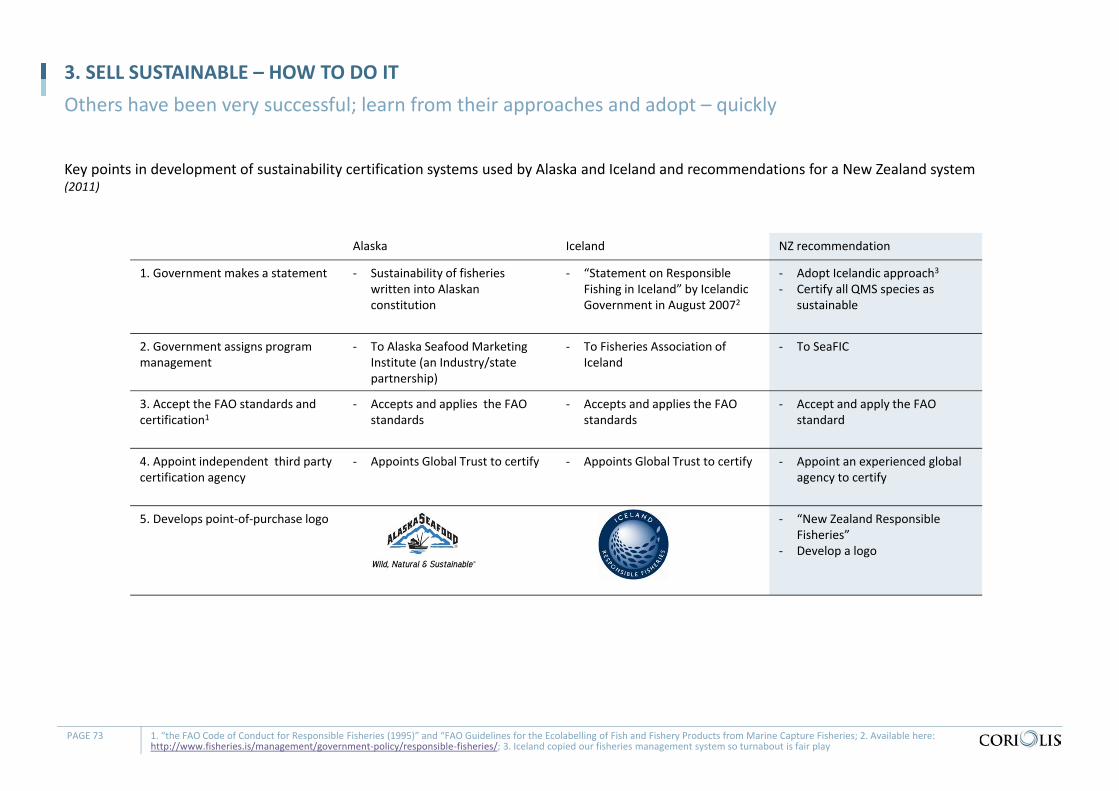
Alaska Iceland NZ recommendation
1. Government makes a statement ‐ Sustainability of fisheries written into Alaskan constitution
‐ “Statement on Responsible Fishing in Iceland” by IcelandicGovernment in August 20072
‐ Adopt Icelandic approach3‐ Certify all QMS species as
sustainable
2. Government assigns program management
‐ To Alaska Seafood Marketing Institute (an Industry/state partnership)
‐ To Fisheries Association of Iceland
‐ To SeaFIC
3. Accept the FAO standards andcertification1
‐ Accepts and applies the FAO standards
‐ Accepts and applies the FAOstandards
‐ Accept and apply the FAO standard
4. Appoint independent third party certification agency
‐ Appoints Global Trust to certify ‐ Appoints Global Trust to certify ‐ Appoint an experienced global agency to certify
5. Develops point‐of‐purchase logo ‐ “New Zealand Responsible Fisheries”
‐ Develop a logo
Key points in development of sustainability certification systems used by Alaska and Iceland and recommendations for a New Zealand system(2011)
3. SELL SUSTAINABLE – HOW TO DO ITOthers have been very successful; learn from their approaches and adopt – quickly
PAGE 73 1. “the FAO Code of Conduct for Responsible Fisheries (1995)” and “FAO Guidelines for the Ecolabelling of Fish and Fishery Products from Marine Capture Fisheries; 2. Available here: http://www.fisheries.is/management/government‐policy/responsible‐fisheries/; 3. Iceland copied our fisheries management system so turnabout is fair play
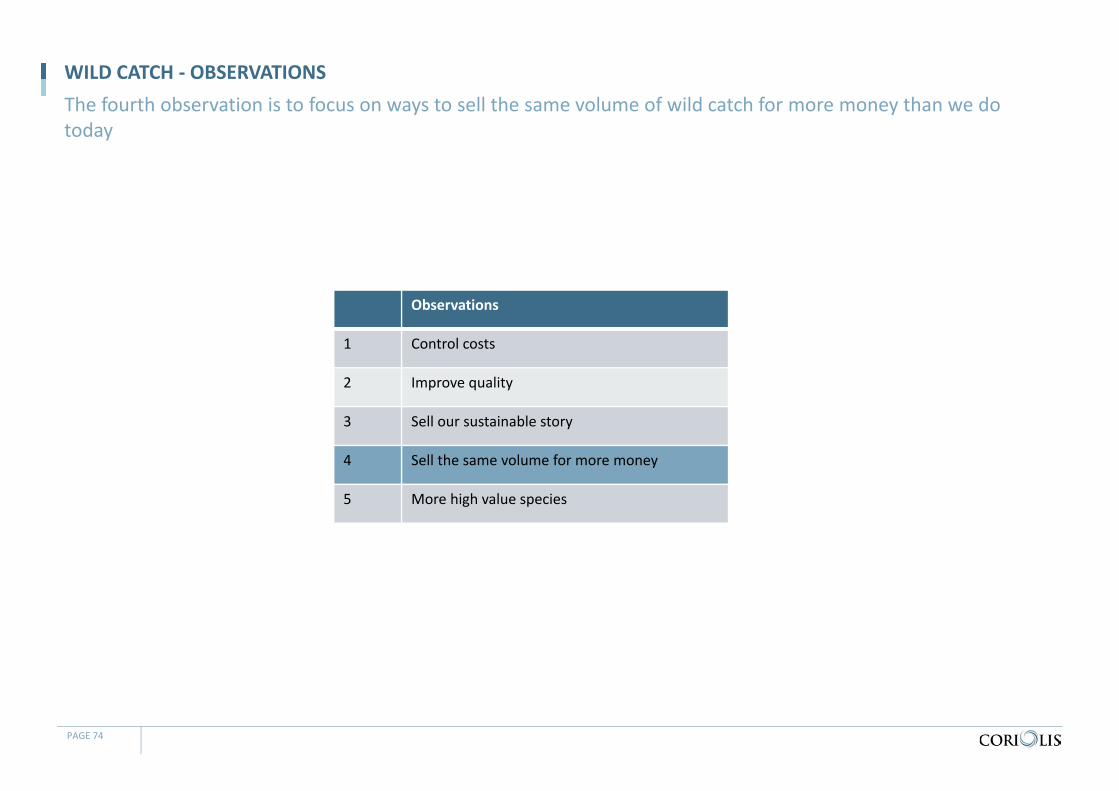
Observations
1 Control costs
2 Improve quality
3 Sell our sustainable story
4 Sell the same volume for more money
5 More high value species
WILD CATCH ‐ OBSERVATIONSThe fourth observation is to focus on ways to sell the same volume of wild catch for more money than we do today
PAGE 74
4. SAME FOR MORE – WRONG MENTALITY
- “The outstanding generality of the NZ Seafood industry is that we are commodity price takers, not market makers.” Manager, Seafood Industry body, 2011
- “We aren't adding value, we are traders. We are exporting the same frozen blocks.” CEO, Large Seafood Company, 2011
- “Our failure to gain higher prices is a failure in value chain management. It starts with a failure to manage the quality of produce to meet high value consumer needs (we strive to meet minimum standards). It continues with an abrogation of market responsibility (“give me the best price on the beach”). Harvest management decisions are taken with an over dependence on prices in the Sydney fish market. But we are in denial because we can always find a counter example.”Manager, Research industry body, 2011
- "We have no ability to successfully penetrate a market and market to the consumer who recognises and will pay for premium called NZ." CEO, Medium Seafood Company, 2011
- “The big companies get into a d‐‐k swinging competition. There are a lot of ego’s involved. As an industry we are production led and so the big guys do piss poor. There needs to be a culture change, the real growth is in driving the marketing, the big companies are traders. The same people have been in the industry for 20‐30 years, they can’t see a different way of doing things.” Manager, Medium sized Seafood Company, 2011
- “We are raw producers.” Manager, Government Agency, 2011
- “The industry is full of hunter gatherers; get as much as possible before the next guy. It’s the same in the meat industry. Unless a product is treated as a product, a cut or fillet, it has no value. Its taken as long as it has to develop an efficient business the way it is. It is difficult to change. Industry doesn’t see the value. Executives are rewarded on that basis, not risk. It is not in the culture of the industry.” Industry Executive, 2011
PAGE 75
The industry sees itself as primarily a volume‐seller of minimally processed ingredients
4. SAME FOR MORE – SELL THE SAME VOLUME FOR MORE MONEY
- “We can get three times the value by adding value, by coating it, portioning it, packaging it, but the return has to be there.” GM, Industry representative, 2011
- “We make more money than the big players selling branded product direct in the market.” CEO, marketing Company, 2011
- “In the medium term ‐ 10‐15 years ‐ we need to become less reliant on white frozen block, and more focused on value added.” Seafood Company, large, 2011
- “Sealord are an example of a successful branded product that does well in New Zealand and Australia. They have good brand presence, a sales team, consumer acceptance, consistent supply and a relationship with the retailer.” Seafood Company, large, 2011
- "We need to market high quality seafood, and put it beside wine and other premium food products." Manager, Seafood representative, 2011
- “We could do much better as an industry if we put more emphasis on producing higher value (from the consumers perspective, not ours) seafood and less emphasis on producing more and cutting costs. At present the emphasis is on the latter two with the result that poor marketing leads to the “opportunity” to take lower prices.” Manager, Seafood Industry body, 2011
- “Value added product is very stagnant in the NZ market. The NZ companies don’t understand the markets that well. NZ supermarkets are worlds apart from the Northern Hemisphere ones. We are good at producing not manufacturing, we never deal with the retailer.”Manager, Government Agency, 2011
- “If we have different formats, we can drive the price up. Packaging changes that are suitable for retail execution, then you can really increase the price. Packaging needs to be more consumer friendly.” Industry representative, 2011
PAGE 76
There is recognition of the benefits of moving toward value added products
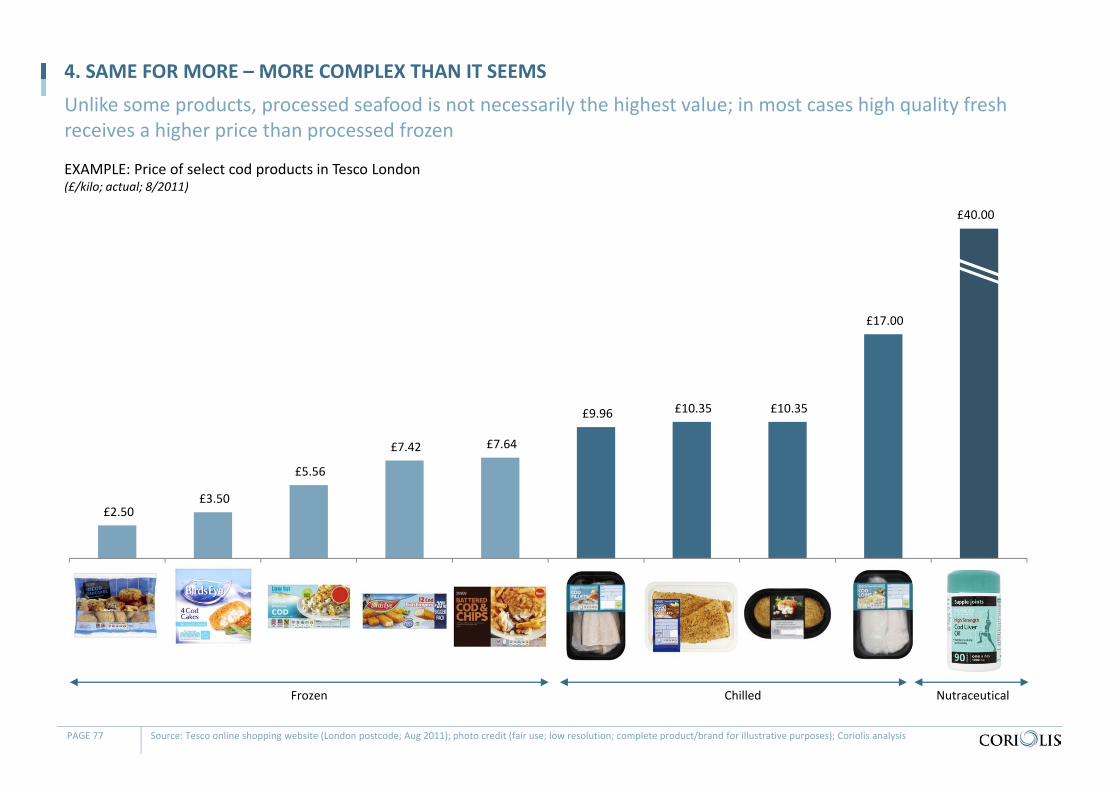
EXAMPLE: Price of select cod products in Tesco London(£/kilo; actual; 8/2011)
4. SAME FOR MORE – MORE COMPLEX THAN IT SEEMS
Unlike some products, processed seafood is not necessarily the highest value; in most cases high quality fresh receives a higher price than processed frozen
£2.50 £3.50
£5.56
£7.42 £7.64
£9.96 £10.35 £10.35
£17.00
Tesco BE Cod Cakes Battered Birds Eye Tesco w chips Fresh Lightly dusted Cod Melt Cod loins Cod Liver oil
PAGE 77 Source: Tesco online shopping website (London postcode; Aug 2011); photo credit (fair use; low resolution; complete product/brand for illustrative purposes); Coriolis analysis
£40.00
Frozen Chilled Nutraceutical
4. SAME FOR MORE – BEYOND STATUS QUO
- “One of the impediments to change in the NZ seafood industry is that too many people are making quite enough money from the status quo to be very interested in making changes. And then if they do want to make changes, there are plenty of people willing and able to advance all sorts of reasons why things shouldn’t be changed.” Manager, Seafood Research Industry, 2011
- “The industry is comfortable. They are making money doing what they are doing now.” Seafood Company, medium, 2011
- “Adding value is a great idea, but by the time you add up the packaging, getting certain cuts ‐ the problem is it adds to much cost and its not worth it. Our industry is adding cost not value.” CEO, Seafood Company, medium, 2011
- “Value added probably won’t happen in New Zealand. Its too hard to do it here and make money. There are high labour costs, low brand presence and a huge distance to market.” Seafood Company, large, 2011
- “Where we have overseas market alliances, the “added value” of these alliances seems to show up in the books of the in‐market operators and not in corporate NZ.”Manager, Seafood Research industry body, 2011
- “Reducing wild catch tonnages inevitably lead to lower returns based on a model of cutting costs and producing more. Did anyone say the words “commodity price slaves”? Manager, Seafood Research Industry body, 2011
- “The industry is young. 50‐60 years old only one or two generations. A lot of people in the industry are the founding fathers of the sector. Time will allow the industry to mature. It hasn’t really found its feet. We are just trying to grasp things like nutraceuticals now. We don’t know the potential value of what we have.” GM, Seafood Company, medium, 2011
PAGE 78
Selling the same volume for more money is easy to say; however moving forward may take time
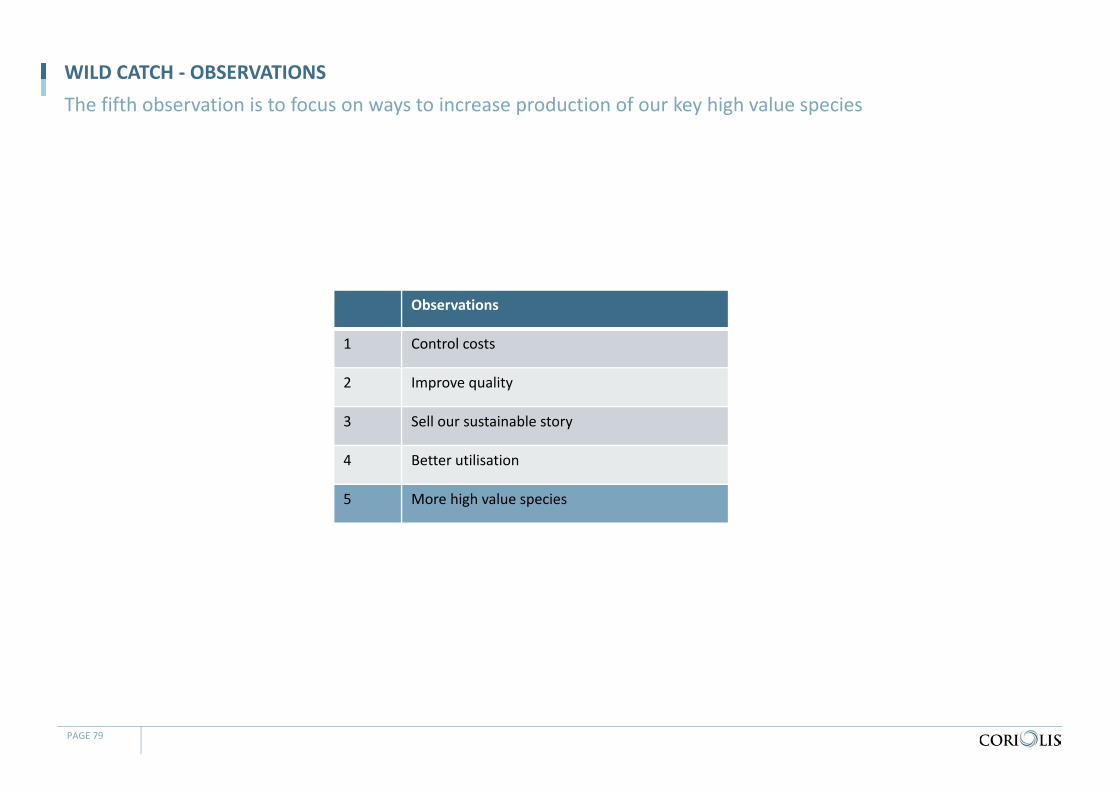
Observations
1 Control costs
2 Improve quality
3 Sell our sustainable story
4 Better utilisation
5 More high value species
WILD CATCH ‐ OBSERVATIONSThe fifth observation is to focus on ways to increase production of our key high value species
PAGE 79
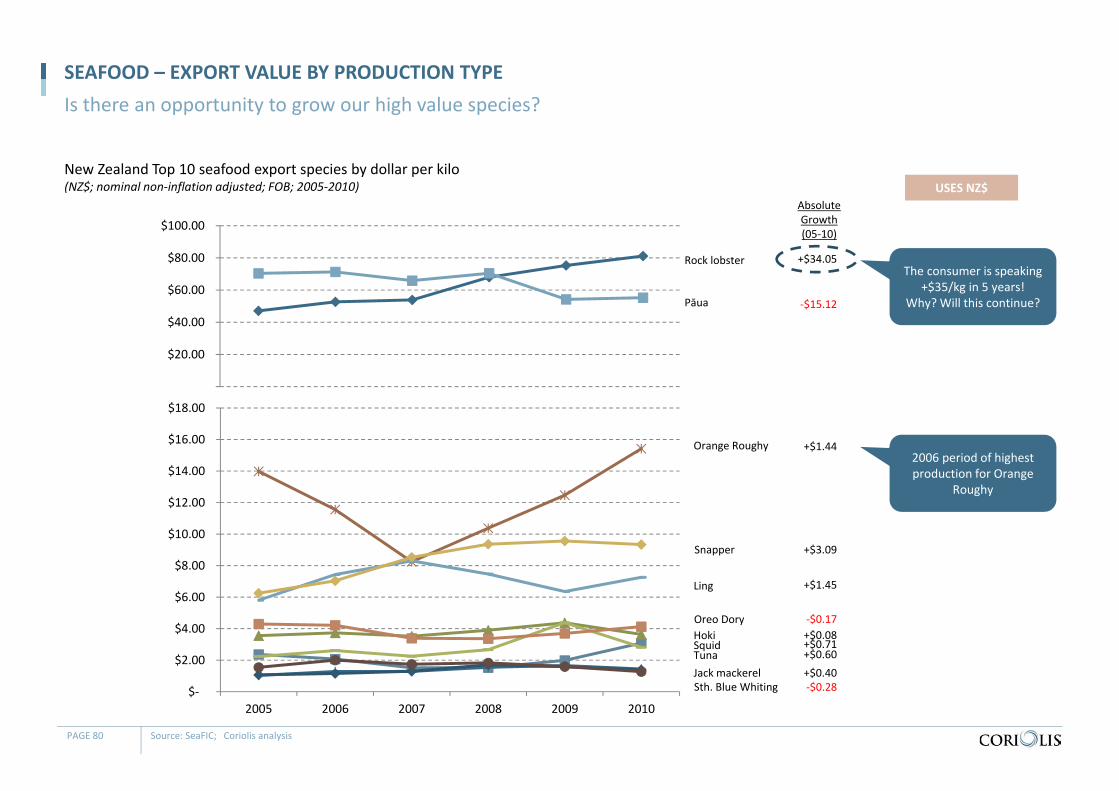
New Zealand Top 10 seafood export species by dollar per kilo(NZ$; nominal non‐inflation adjusted; FOB; 2005‐2010)
SEAFOOD – EXPORT VALUE BY PRODUCTION TYPEIs there an opportunity to grow our high value species?
PAGE 80 Source: SeaFIC; Coriolis analysis
USES NZ$
$‐
$2.00
$4.00
$6.00
$8.00
$10.00
$12.00
$14.00
$16.00
$18.00
2005 2006 2007 2008 2009 2010
$‐
$20.00
$40.00
$60.00
$80.00
$100.00
Rock lobster
Pāua
Hoki
Ling
Jack mackerel
Orange Roughy
Tuna
Snapper
Squid
AbsoluteGrowth(05‐10)
+$34.05
‐$15.12
+$1.44
+$3.09
+$1.45
+$0.08
+$0.60+$0.40
+$0.71
Oreo Dory ‐$0.17
Sth. Blue Whiting ‐$0.28
The consumer is speaking+$35/kg in 5 years!
Why? Will this continue?
2006 period of highest production for Orange
Roughy
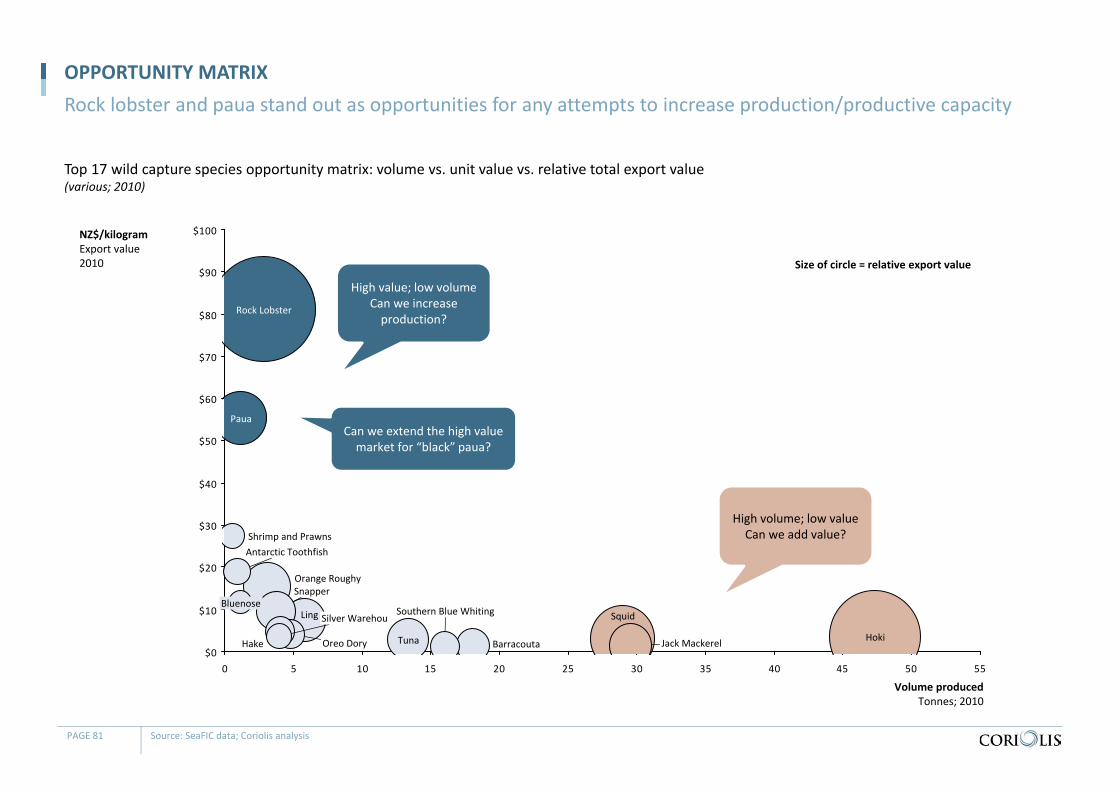
Top 17 wild capture species opportunity matrix: volume vs. unit value vs. relative total export value(various; 2010)
OPPORTUNITY MATRIXRock lobster and paua stand out as opportunities for any attempts to increase production/productive capacity
PAGE 81 Source: SeaFIC data; Coriolis analysis
$0
$10
$20
$30
$40
$50
$60
$70
$80
$90
$100
0 5 10 15 20 25 30 35 40 45 50 55
Shrimp and Prawns
Silver WarehouBluenose
Southern Blue Whiting
Oreo DoryHake
Antarctic Toothfish
Ling
Jack Mackerel
Orange Roughy
Barracouta
Snapper
Tuna
Paua
Squid
Hoki
Rock Lobster
NZ$/kilogramExport value2010
Volume producedTonnes; 2010
Size of circle = relative export value
High value; low volumeCan we increase production?
High volume; low valueCan we add value?
Can we extend the high value market for “black” paua?
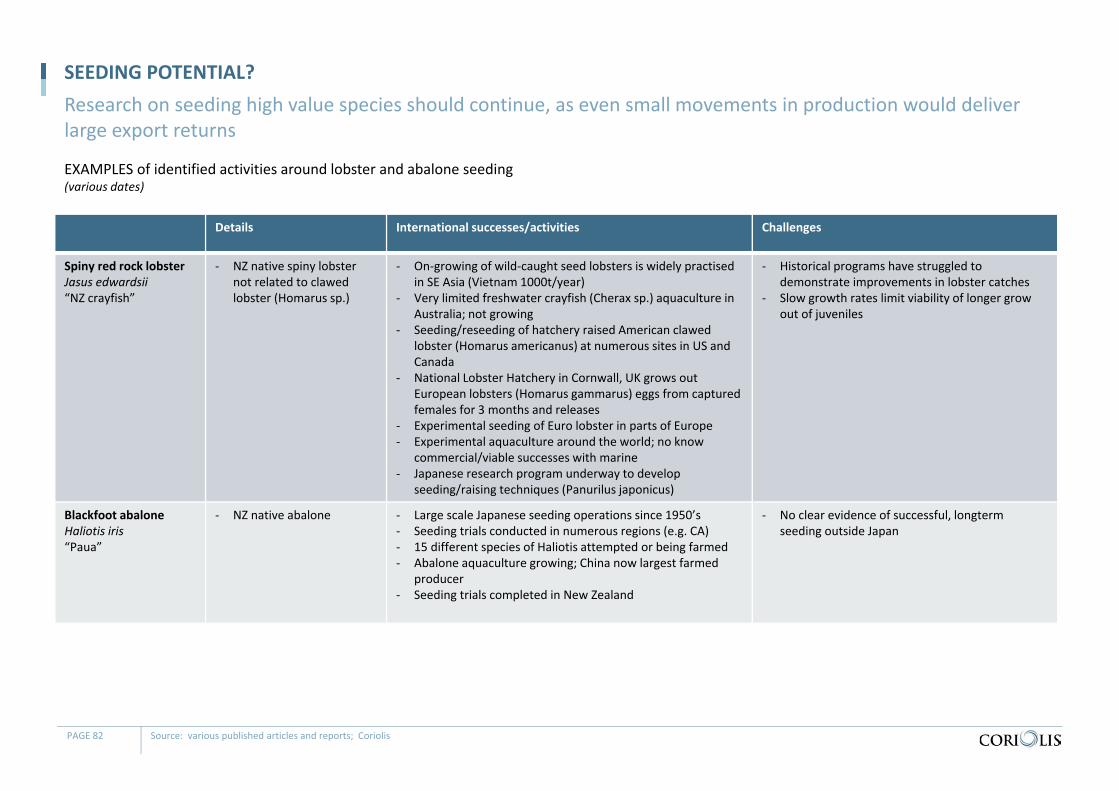
Details International successes/activities Challenges
Spiny red rock lobsterJasus edwardsii“NZ crayfish”
‐ NZ native spiny lobster not related to clawed lobster (Homarus sp.)
‐ On‐growing of wild‐caught seed lobsters is widely practised in SE Asia (Vietnam 1000t/year)
‐ Very limited freshwater crayfish (Cherax sp.) aquaculture in Australia; not growing
‐ Seeding/reseeding of hatchery raised American clawed lobster (Homarus americanus) at numerous sites in US and Canada
‐ National Lobster Hatchery in Cornwall, UK grows out European lobsters (Homarus gammarus) eggs from captured females for 3 months and releases
‐ Experimental seeding of Euro lobster in parts of Europe‐ Experimental aquaculture around the world; no know
commercial/viable successes with marine‐ Japanese research program underway to develop
seeding/raising techniques (Panurilus japonicus)
‐ Historical programs have struggled to demonstrate improvements in lobster catches
‐ Slow growth rates limit viability of longer grow out of juveniles
Blackfoot abaloneHaliotis iris“Paua”
‐ NZ native abalone ‐ Large scale Japanese seeding operations since 1950’s‐ Seeding trials conducted in numerous regions (e.g. CA)‐ 15 different species of Haliotis attempted or being farmed‐ Abalone aquaculture growing; China now largest farmed
producer‐ Seeding trials completed in New Zealand
‐ No clear evidence of successful, longtermseeding outside Japan
EXAMPLES of identified activities around lobster and abalone seeding (various dates)
SEEDING POTENTIAL?Research on seeding high value species should continue, as even small movements in production would deliver large export returns
PAGE 82 Source: various published articles and reports; Coriolis
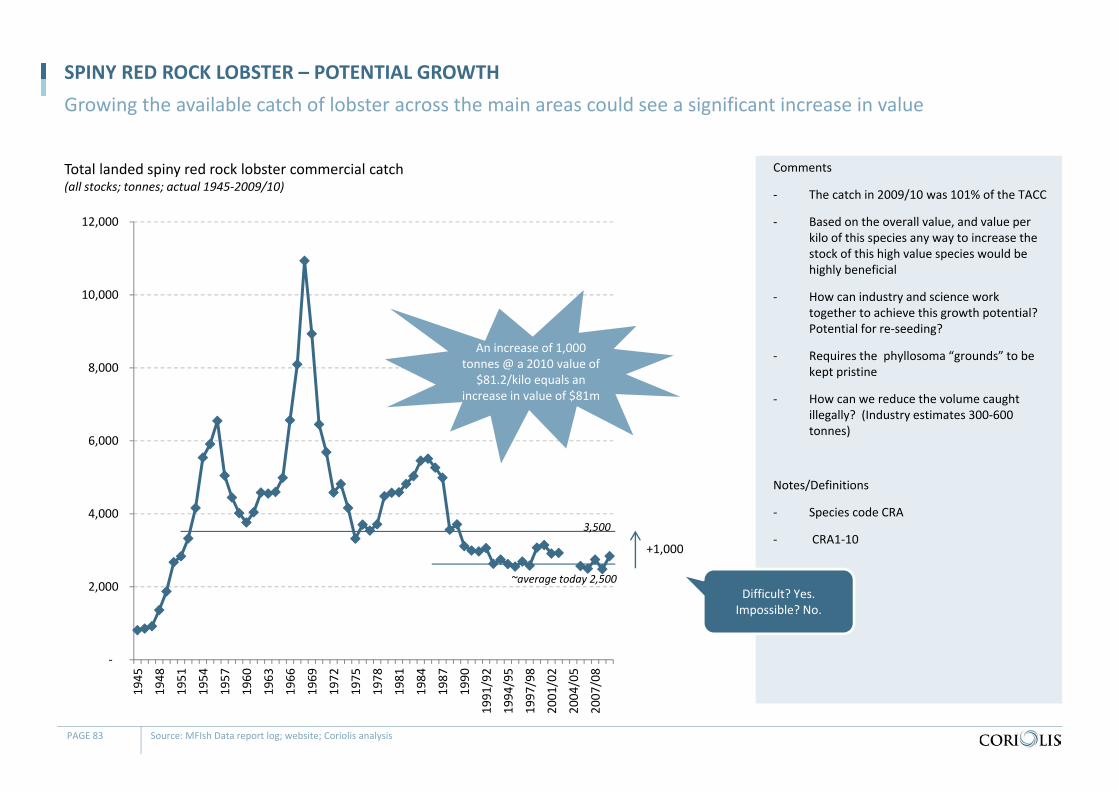
Total landed spiny red rock lobster commercial catch(all stocks; tonnes; actual 1945‐2009/10)
SPINY RED ROCK LOBSTER – POTENTIAL GROWTH Growing the available catch of lobster across the main areas could see a significant increase in value
PAGE 83 Source: MFIsh Data report log; website; Coriolis analysis
Comments
‐ The catch in 2009/10 was 101% of the TACC
‐ Based on the overall value, and value per kilo of this species any way to increase the stock of this high value species would be highly beneficial
‐ How can industry and science work together to achieve this growth potential? Potential for re‐seeding?
‐ Requires the phyllosoma “grounds” to be kept pristine
‐ How can we reduce the volume caught illegally? (Industry estimates 300‐600 tonnes)
Notes/Definitions
‐ Species code CRA
‐ CRA1‐10
‐
2,000
4,000
6,000
8,000
10,000
12,000
1945
1948
1951
1954
1957
1960
1963
1966
1969
1972
1975
1978
1981
1984
1987
1990
1991/92
1994/95
1997/98
2001/02
2004/05
2007/08
~average today 2,500
3,500
+1,000
An increase of 1,000 tonnes @ a 2010 value of
$81.2/kilo equals an increase in value of $81m
Difficult? Yes.Impossible? No.
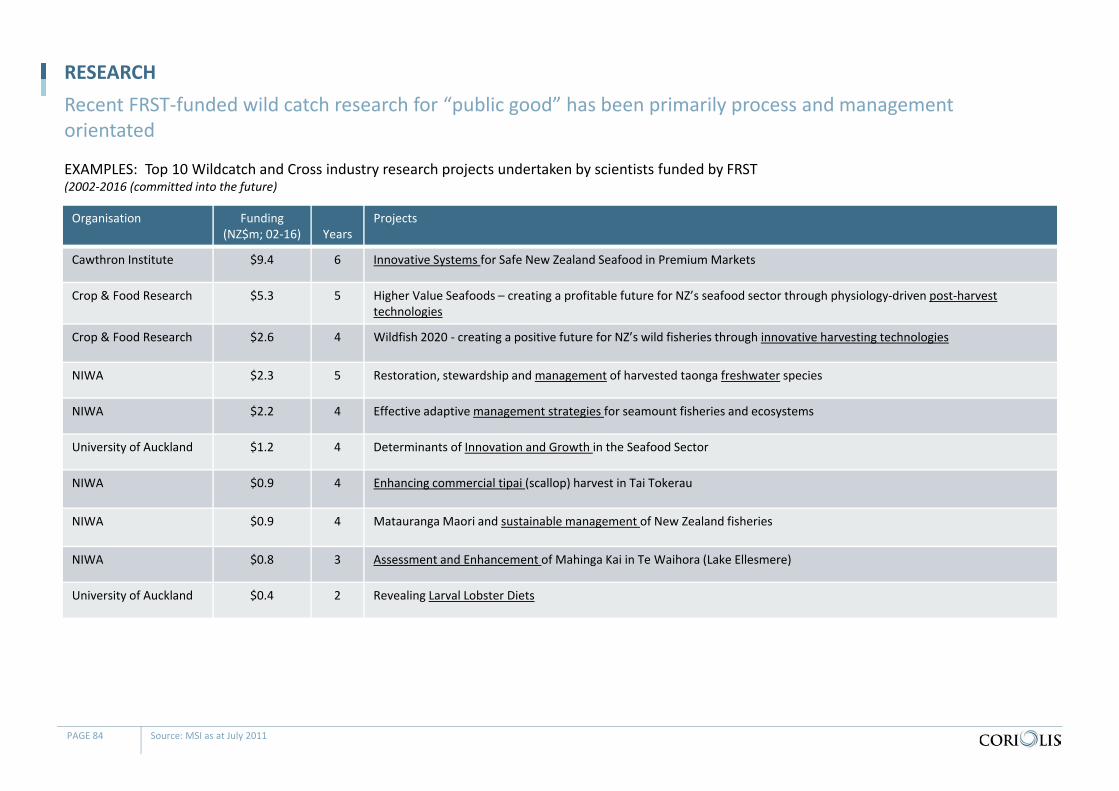
Organisation Funding(NZ$m; 02‐16) Years
Projects
Cawthron Institute $9.4 6 Innovative Systems for Safe New Zealand Seafood in Premium Markets
Crop & Food Research $5.3 5 Higher Value Seafoods – creating a profitable future for NZ’s seafood sector through physiology‐driven post‐harvest technologies
Crop & Food Research $2.6 4 Wildfish 2020 ‐ creating a positive future for NZ’s wild fisheries through innovative harvesting technologies
NIWA $2.3 5 Restoration, stewardship and management of harvested taonga freshwater species
NIWA $2.2 4 Effective adaptive management strategies for seamount fisheries and ecosystems
University of Auckland $1.2 4 Determinants of Innovation and Growth in the Seafood Sector
NIWA $0.9 4 Enhancing commercial tipai (scallop) harvest in Tai Tokerau
NIWA $0.9 4 Matauranga Maori and sustainable management of New Zealand fisheries
NIWA $0.8 3 Assessment and Enhancement of Mahinga Kai in Te Waihora (Lake Ellesmere)
University of Auckland $0.4 2 Revealing Larval Lobster Diets
EXAMPLES: Top 10 Wildcatch and Cross industry research projects undertaken by scientists funded by FRST(2002‐2016 (committed into the future)
RESEARCHRecent FRST‐funded wild catch research for “public good” has been primarily process and management orientated
PAGE 84 Source: MSI as at July 2011

TABLE OF CONTENTS
Section Page
Contents 4
Glossary of terms 5
Methodology & data sources 6
F&B IP Overview 7
Summary & conclusions 9
Sector overview 17
Wild capture 46
Aquaculture 85
Appendices
Oysters 113
Mussels 122
Salmon 134
Profiles of key firms 156
Supplementary material 162
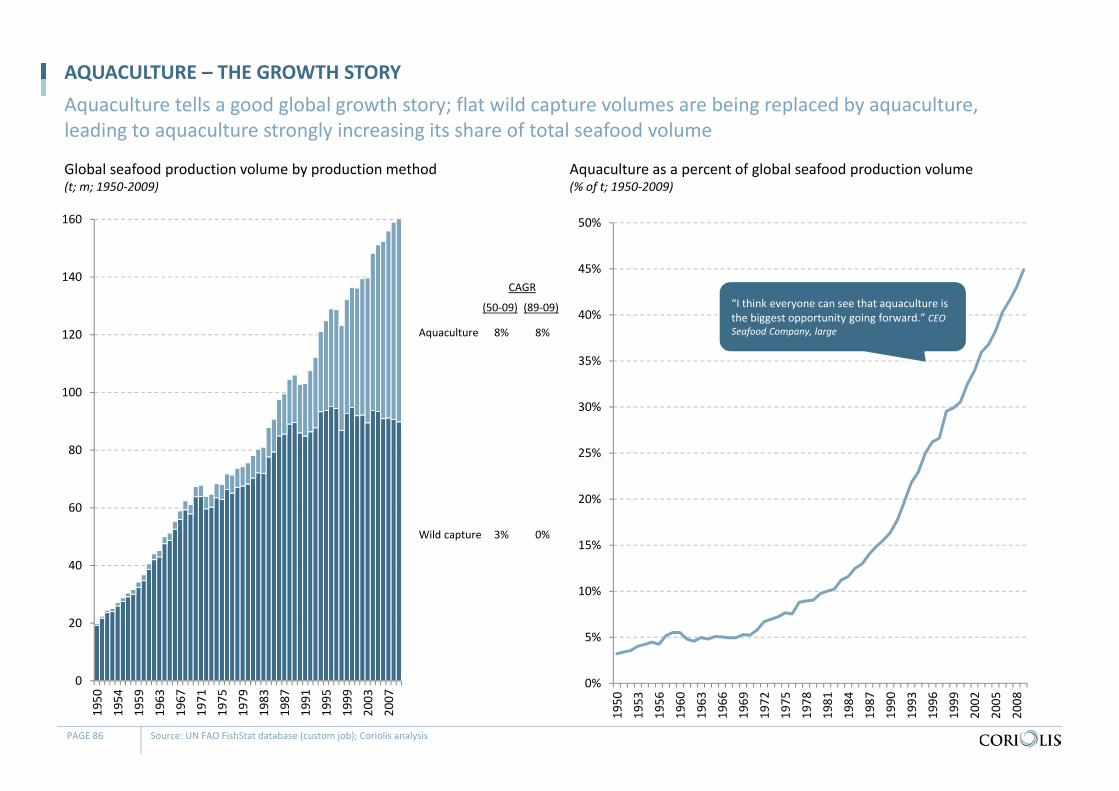
Global seafood production volume by production method(t; m; 1950‐2009)
AQUACULTURE – THE GROWTH STORYAquaculture tells a good global growth story; flat wild capture volumes are being replaced by aquaculture, leading to aquaculture strongly increasing its share of total seafood volume
PAGE 86 Source: UN FAO FishStat database (custom job); Coriolis analysis
0
20
40
60
80
100
120
140
160
1950
1954
1959
1963
1967
1971
1975
1979
1983
1987
1991
1995
1999
2003
2007
Aquaculture
Wild capture
Aquaculture as a percent of global seafood production volume(% of t; 1950‐2009)
0%
5%
10%
15%
20%
25%
30%
35%
40%
45%
50%
1950
1953
1956
1960
1963
1966
1969
1972
1975
1978
1981
1984
1987
1990
1993
1996
1999
2002
2005
2008
8%
3%
(50‐09)
8%
0%
(89‐09)
CAGR“I think everyone can see that aquaculture is the biggest opportunity going forward.” CEO Seafood Company, large
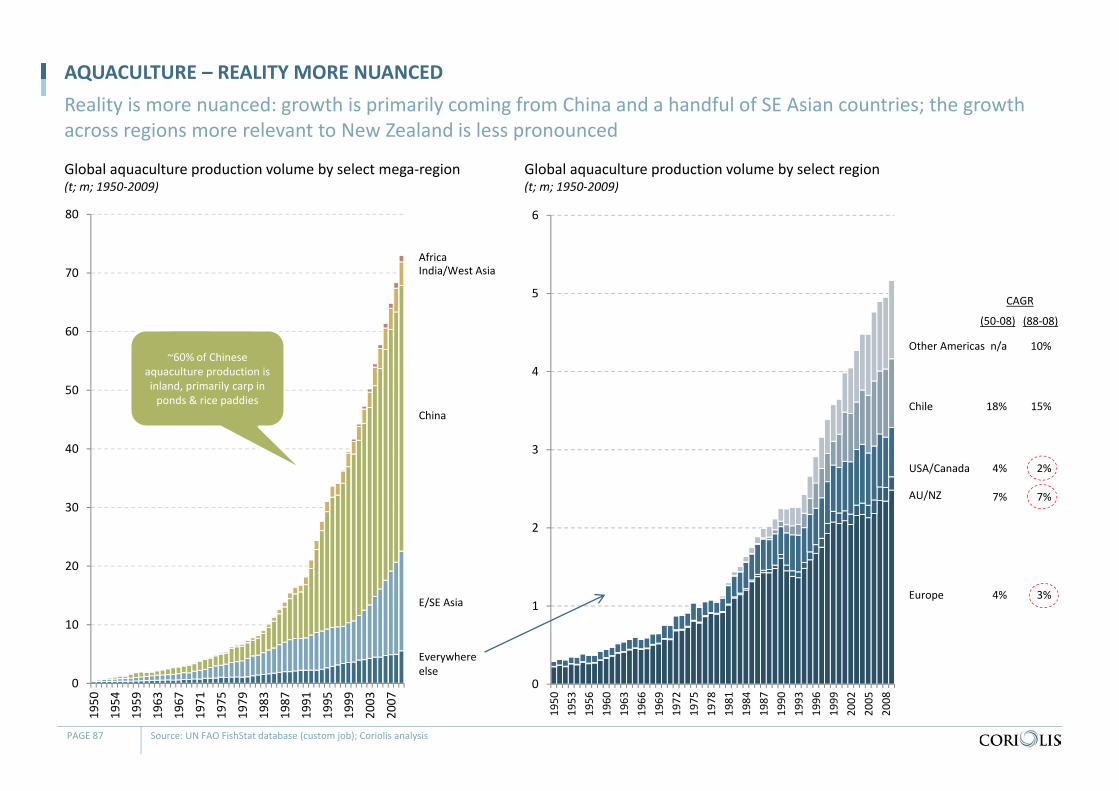
Global aquaculture production volume by select mega‐region(t; m; 1950‐2009)
AQUACULTURE – REALITY MORE NUANCEDReality is more nuanced: growth is primarily coming from China and a handful of SE Asian countries; the growth across regions more relevant to New Zealand is less pronounced
PAGE 87 Source: UN FAO FishStat database (custom job); Coriolis analysis
0
10
20
30
40
50
60
70
80
1950
1954
1959
1963
1967
1971
1975
1979
1983
1987
1991
1995
1999
2003
2007
Everywhere else
E/SE Asia
China
India/West AsiaAfrica
0
1
2
3
4
5
6
1950
1953
1956
1960
1963
1966
1969
1972
1975
1978
1981
1984
1987
1990
1993
1996
1999
2002
2005
2008
Europe
AU/NZ
USA/Canada
Chile
Other Americas n/a
(50‐08)
10%
(88‐08)
CAGR
4% 3%
7% 7%
4% 2%
18% 15%
Global aquaculture production volume by select region(t; m; 1950‐2009)
~60% of Chinese aquaculture production is inland, primarily carp in ponds & rice paddies
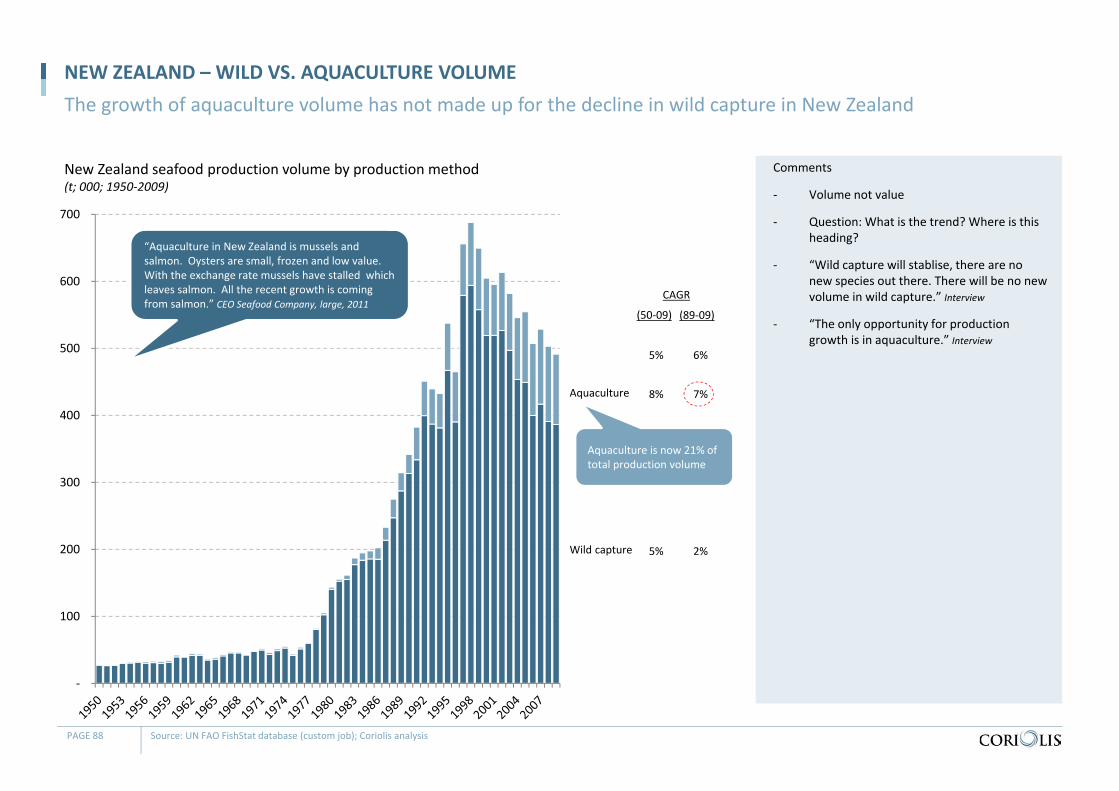
New Zealand seafood production volume by production method(t; 000; 1950‐2009)
NEW ZEALAND – WILD VS. AQUACULTURE VOLUMEThe growth of aquaculture volume has not made up for the decline in wild capture in New Zealand
PAGE 88 Source: UN FAO FishStat database (custom job); Coriolis analysis
Comments
‐ Volume not value
‐ Question: What is the trend? Where is this heading?
‐ “Wild capture will stablise, there are no new species out there. There will be no new volume in wild capture.” Interview
‐ “The only opportunity for production growth is in aquaculture.” Interview
‐
100
200
300
400
500
600
700
Wild capture
Aquaculture
5% 2%
8% 7%
(50‐09) (89‐09)
CAGR
5% 6%
“Aquaculture in New Zealand is mussels and salmon. Oysters are small, frozen and low value. With the exchange rate mussels have stalled which leaves salmon. All the recent growth is coming from salmon.” CEO Seafood Company, large, 2011
Aquaculture is now 21% of total production volume
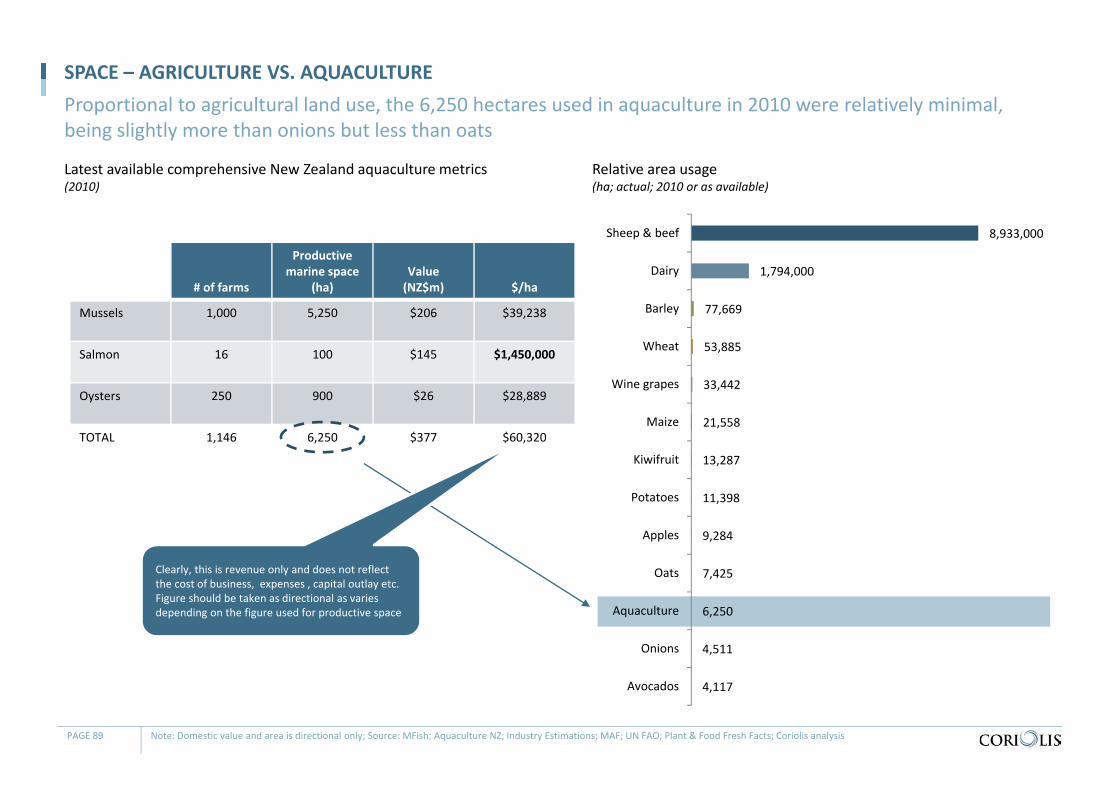
Latest available comprehensive New Zealand aquaculture metrics(2010)
SPACE – AGRICULTURE VS. AQUACULTUREProportional to agricultural land use, the 6,250 hectares used in aquaculture in 2010 were relatively minimal, being slightly more than onions but less than oats
PAGE 89 Note: Domestic value and area is directional only; Source: MFish; Aquaculture NZ; Industry Estimations; MAF; UN FAO; Plant & Food Fresh Facts; Coriolis analysis
# of farms
Productive marine space
(ha)Value(NZ$m) $/ha
Mussels 1,000 5,250 $206 $39,238
Salmon 16 100 $145 $1,450,000
Oysters 250 900 $26 $28,889
TOTAL 1,146 6,250 $377 $60,320
8,933,000
1,794,000
77,669
53,885
33,442
21,558
13,287
11,398
9,284
7,425
6,250
4,511
4,117
Sheep & beef
Dairy
Barley
Wheat
Wine grapes
Maize
Kiwifruit
Potatoes
Apples
Oats
Aquaculture
Onions
Avocados
Relative area usage(ha; actual; 2010 or as available)
Clearly, this is revenue only and does not reflect the cost of business, expenses , capital outlay etc. Figure should be taken as directional as varies depending on the figure used for productive space
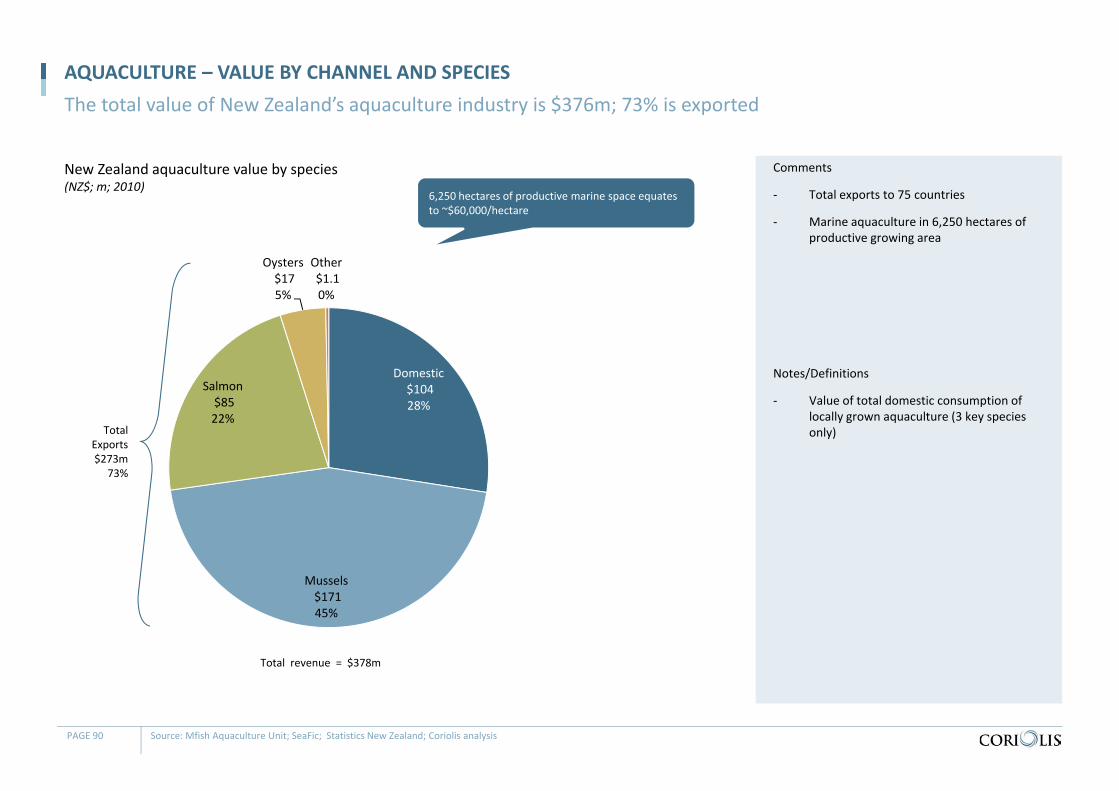
New Zealand aquaculture value by species(NZ$; m; 2010)
AQUACULTURE – VALUE BY CHANNEL AND SPECIES The total value of New Zealand’s aquaculture industry is $376m; 73% is exported
PAGE 90 Source: Mfish Aquaculture Unit; SeaFic; Statistics New Zealand; Coriolis analysis
Comments
‐ Total exports to 75 countries
‐ Marine aquaculture in 6,250 hectares of productive growing area
Notes/Definitions
‐ Value of total domestic consumption of locally grown aquaculture (3 key species only)
Domestic$104 28%
Mussels$171 45%
Salmon$85 22%
Oysters$17 5%
Other$1.1 0%
Total revenue = $378m
TotalExports$273m
73%
6,250 hectares of productive marine space equates to ~$60,000/hectare
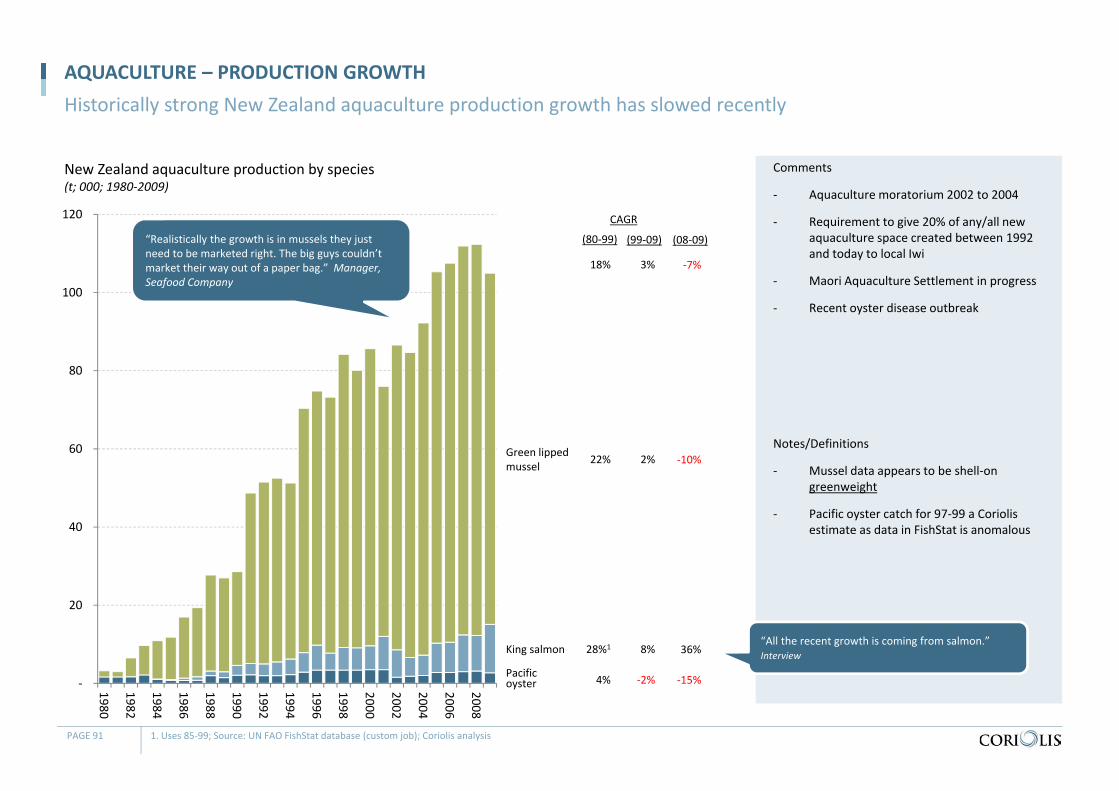
New Zealand aquaculture production by species(t; 000; 1980‐2009)
AQUACULTURE – PRODUCTION GROWTHHistorically strong New Zealand aquaculture production growth has slowed recently
PAGE 91 1. Uses 85‐99; Source: UN FAO FishStat database (custom job); Coriolis analysis
Comments
‐ Aquaculture moratorium 2002 to 2004
‐ Requirement to give 20% of any/all new aquaculture space created between 1992 and today to local Iwi
‐ Maori Aquaculture Settlement in progress
‐ Recent oyster disease outbreak
Notes/Definitions
‐ Mussel data appears to be shell‐on greenweight
‐ Pacific oyster catch for 97‐99 a Coriolis estimate as data in FishStat is anomalous
‐
20
40
60
80
100
120
1980
1982
1984
1986
1988
1990
1992
1994
1996
1998
2000
2002
2004
2006
2008King salmon
Green lipped mussel
Pacific oyster
18% 3%
(99‐09)
CAGR
4% ‐2%
28%1 8%
22% 2%
(80‐99)
‐7%
(08‐09)
‐15%
36%
‐10%
“Realistically the growth is in mussels they just need to be marketed right. The big guys couldn’t market their way out of a paper bag.” Manager, Seafood Company
“All the recent growth is coming from salmon.” Interview
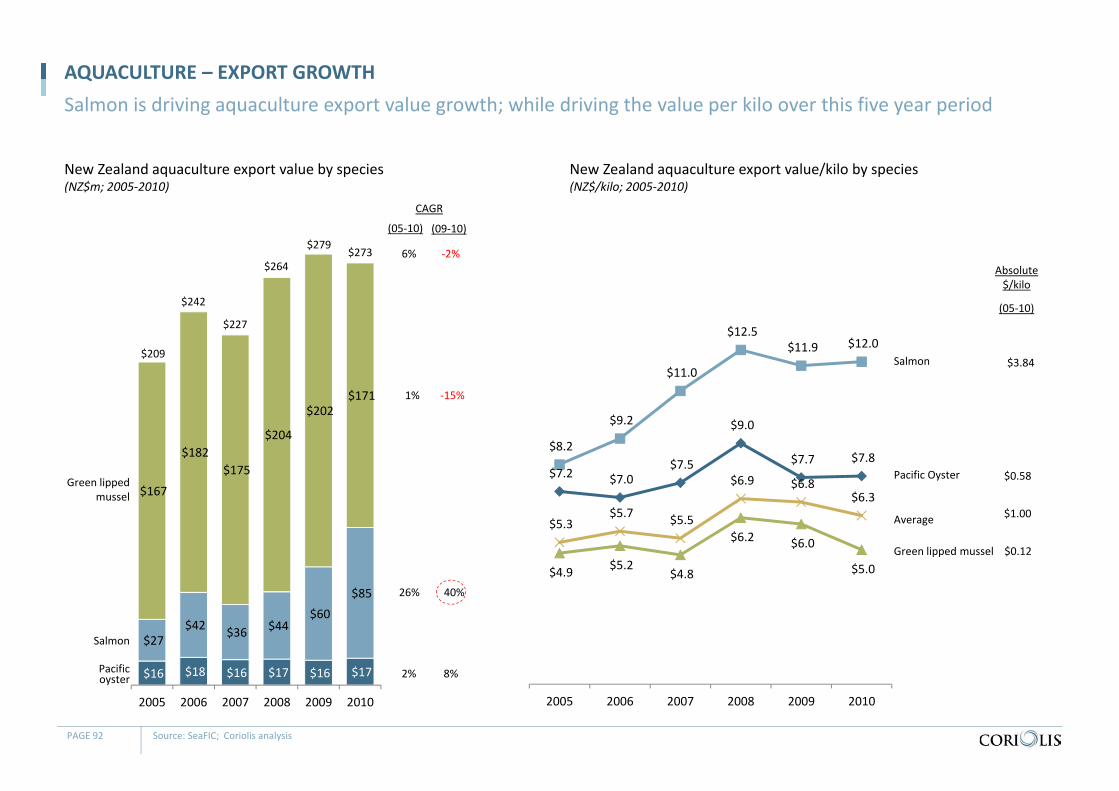
New Zealand aquaculture export value by species(NZ$m; 2005‐2010)
AQUACULTURE – EXPORT GROWTHSalmon is driving aquaculture export value growth; while driving the value per kilo over this five year period
PAGE 92 Source: SeaFIC; Coriolis analysis
Salmon
Green lipped mussel
Pacific oyster
6% ‐2%
(09‐10)
CAGR
2% 8%
26% 40%
1% ‐15%
(05‐10)
$16 $18 $16 $17 $16 $17
$27 $42 $36 $44
$60 $85
$167
$182 $175
$204
$202 $171
2005 2006 2007 2008 2009 2010
$7.2 $7.0 $7.5
$9.0
$7.7 $7.8 $8.2
$9.2
$11.0
$12.5 $11.9 $12.0
$4.9 $5.2 $4.8
$6.2 $6.0
$5.0
$5.3 $5.7 $5.5
$6.9 $6.8 $6.3
2005 2006 2007 2008 2009 2010
Salmon
Green lipped mussel
Pacific Oyster
Average
$209
$242
$227
$264
$279$273
New Zealand aquaculture export value/kilo by species(NZ$/kilo; 2005‐2010)
Absolute$/kilo
$0.12
$0.58
$3.84
(05‐10)
$1.00
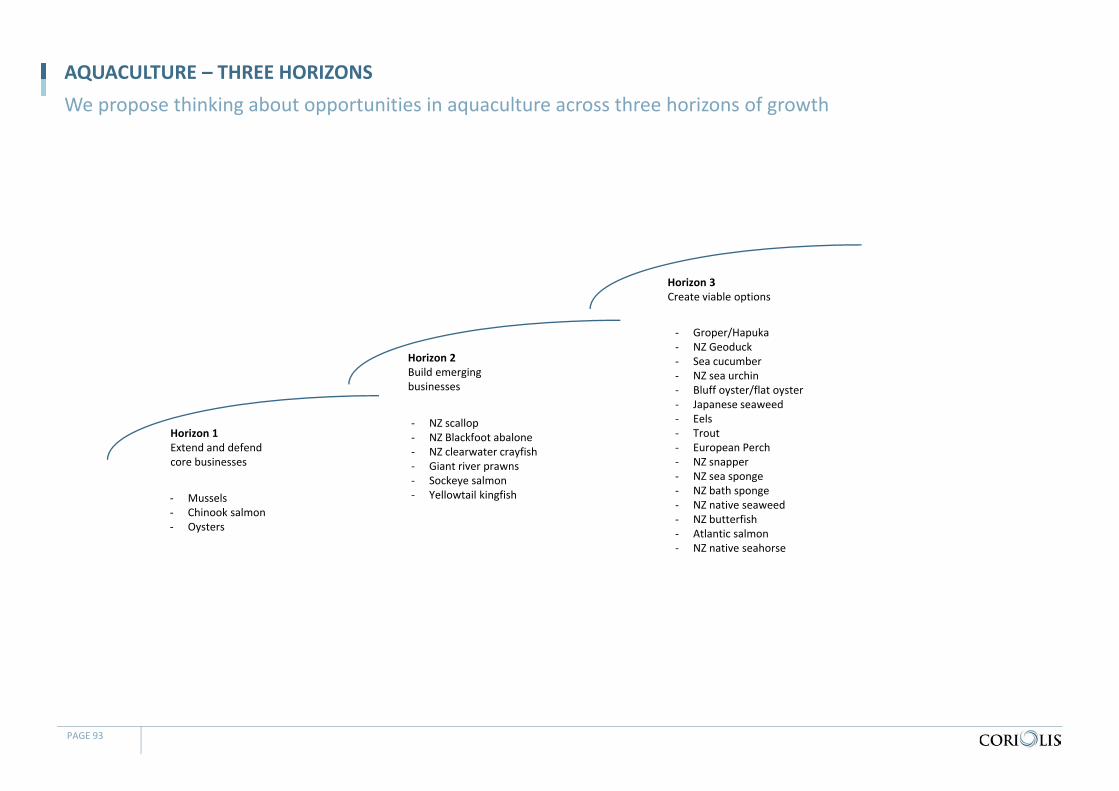
AQUACULTURE – THREE HORIZONSWe propose thinking about opportunities in aquaculture across three horizons of growth
PAGE 93
Horizon 1Extend and defend core businesses
Horizon 2Build emerging businesses
Horizon 3Create viable options
‐ Mussels‐ Chinook salmon‐ Oysters
‐ NZ scallop‐ NZ Blackfoot abalone‐ NZ clearwater crayfish‐ Giant river prawns‐ Sockeye salmon‐ Yellowtail kingfish
‐ Groper/Hapuka‐ NZ Geoduck‐ Sea cucumber‐ NZ sea urchin‐ Bluff oyster/flat oyster‐ Japanese seaweed ‐ Eels‐ Trout‐ European Perch‐ NZ snapper‐ NZ sea sponge‐ NZ bath sponge‐ NZ native seaweed‐ NZ butterfish‐ Atlantic salmon‐ NZ native seahorse
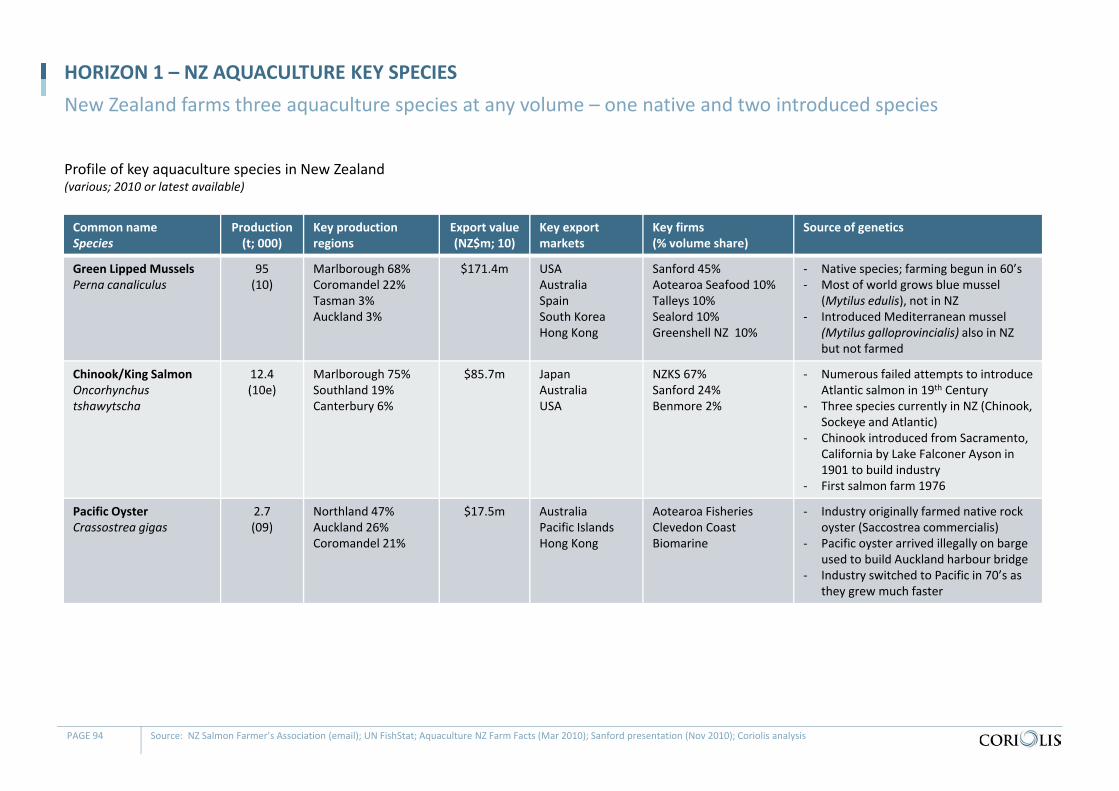
Common nameSpecies
Production(t; 000)
Key production regions
Export value (NZ$m; 10)
Key export markets
Key firms(% volume share)
Source of genetics
Green Lipped MusselsPerna canaliculus
95(10)
Marlborough 68%Coromandel 22%Tasman 3%Auckland 3%
$171.4m USAAustraliaSpainSouth KoreaHong Kong
Sanford 45%Aotearoa Seafood 10%Talleys 10%Sealord 10%Greenshell NZ 10%
‐ Native species; farming begun in 60’s‐ Most of world grows blue mussel
(Mytilus edulis), not in NZ‐ Introduced Mediterranean mussel
(Mytilus galloprovincialis) also in NZ but not farmed
Chinook/King SalmonOncorhynchustshawytscha
12.4 (10e)
Marlborough 75%Southland 19%Canterbury 6%
$85.7m JapanAustraliaUSA
NZKS 67%Sanford 24%Benmore 2%
‐ Numerous failed attempts to introduceAtlantic salmon in 19th Century
‐ Three species currently in NZ (Chinook, Sockeye and Atlantic)
‐ Chinook introduced from Sacramento, California by Lake Falconer Ayson in 1901 to build industry
‐ First salmon farm 1976
Pacific OysterCrassostrea gigas
2.7(09)
Northland 47%Auckland 26%Coromandel 21%
$17.5m Australia Pacific Islands Hong Kong
Aotearoa FisheriesClevedon CoastBiomarine
‐ Industry originally farmed native rock oyster (Saccostrea commercialis)
‐ Pacific oyster arrived illegally on barge used to build Auckland harbour bridge
‐ Industry switched to Pacific in 70’s as they grew much faster
Profile of key aquaculture species in New Zealand(various; 2010 or latest available)
HORIZON 1 – NZ AQUACULTURE KEY SPECIESNew Zealand farms three aquaculture species at any volume – one native and two introduced species
PAGE 94 Source: NZ Salmon Farmer’s Association (email); UN FishStat; Aquaculture NZ Farm Facts (Mar 2010); Sanford presentation (Nov 2010); Coriolis analysis
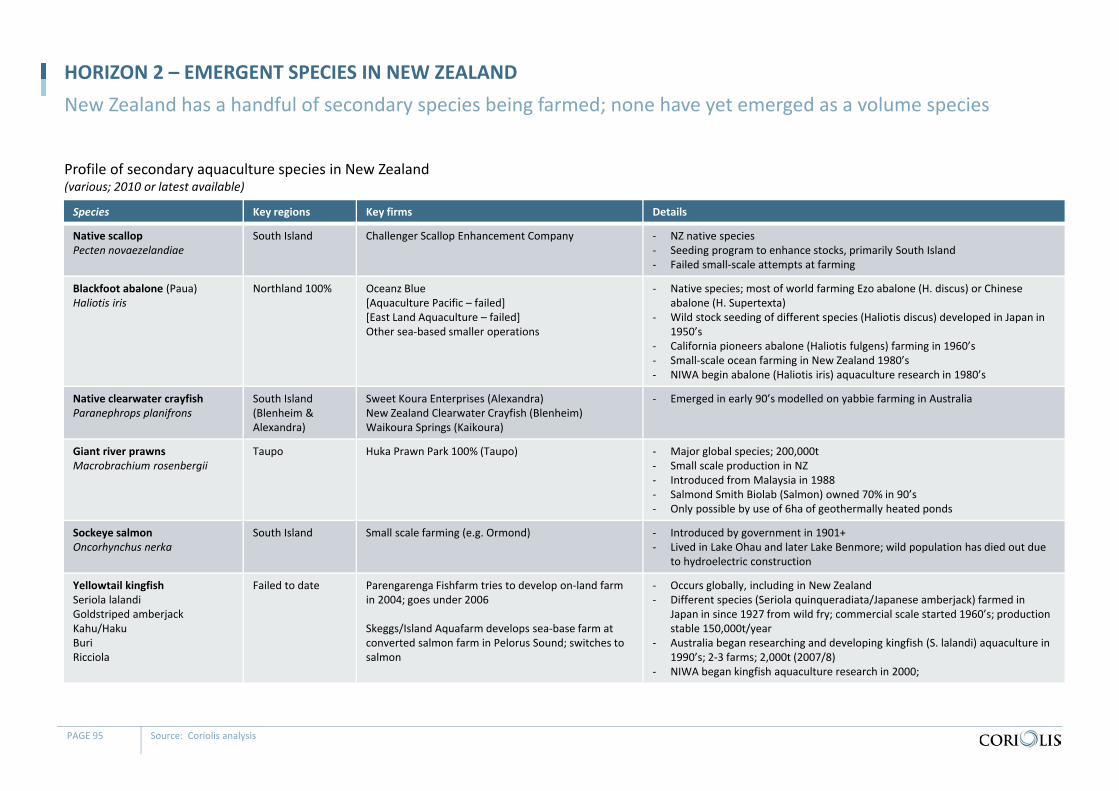
Species Key regions Key firms Details
Native scallopPecten novaezelandiae
South Island Challenger Scallop Enhancement Company ‐ NZ native species‐ Seeding program to enhance stocks, primarily South Island‐ Failed small‐scale attempts at farming
Blackfoot abalone (Paua)Haliotis iris
Northland 100% Oceanz Blue[Aquaculture Pacific – failed][East Land Aquaculture – failed]Other sea‐based smaller operations
‐ Native species; most of world farming Ezo abalone (H. discus) or Chinese abalone (H. Supertexta)
‐ Wild stock seeding of different species (Haliotis discus) developed in Japan in 1950’s
‐ California pioneers abalone (Haliotis fulgens) farming in 1960’s‐ Small‐scale ocean farming in New Zealand 1980’s‐ NIWA begin abalone (Haliotis iris) aquaculture research in 1980’s
Native clearwater crayfishParanephrops planifrons
South Island(Blenheim & Alexandra)
Sweet Koura Enterprises (Alexandra)New Zealand Clearwater Crayfish (Blenheim)Waikoura Springs (Kaikoura)
‐ Emerged in early 90’s modelled on yabbie farming in Australia
Giant river prawnsMacrobrachium rosenbergii
Taupo Huka Prawn Park 100% (Taupo) ‐ Major global species; 200,000t‐ Small scale production in NZ ‐ Introduced from Malaysia in 1988‐ Salmond Smith Biolab (Salmon) owned 70% in 90’s‐ Only possible by use of 6ha of geothermally heated ponds
Sockeye salmonOncorhynchus nerka
South Island Small scale farming (e.g. Ormond) ‐ Introduced by government in 1901+‐ Lived in Lake Ohau and later Lake Benmore; wild population has died out due
to hydroelectric construction
Yellowtail kingfishSeriola lalandiGoldstriped amberjackKahu/HakuBuriRicciola
Failed to date Parengarenga Fishfarm tries to develop on‐land farm in 2004; goes under 2006
Skeggs/Island Aquafarm develops sea‐base farm at converted salmon farm in Pelorus Sound; switches to salmon
‐ Occurs globally, including in New Zealand‐ Different species (Seriola quinqueradiata/Japanese amberjack) farmed in
Japan in since 1927 from wild fry; commercial scale started 1960’s; productionstable 150,000t/year
‐ Australia began researching and developing kingfish (S. lalandi) aquaculture in 1990’s; 2‐3 farms; 2,000t (2007/8)
‐ NIWA began kingfish aquaculture research in 2000;
Profile of secondary aquaculture species in New Zealand(various; 2010 or latest available)
HORIZON 2 – EMERGENT SPECIES IN NEW ZEALANDNew Zealand has a handful of secondary species being farmed; none have yet emerged as a volume species
PAGE 95 Source: Coriolis analysis
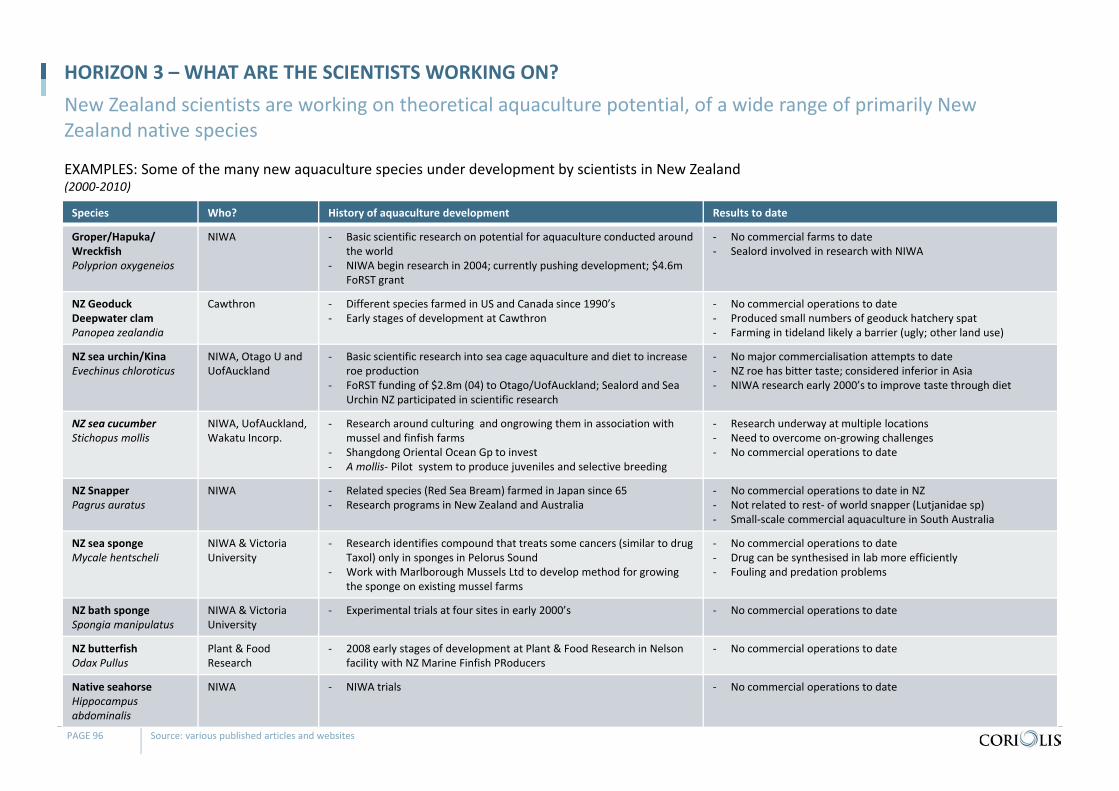
Species Who? History of aquaculture development Results to date
Groper/Hapuka/ WreckfishPolyprion oxygeneios
NIWA ‐ Basic scientific research on potential for aquaculture conducted around the world
‐ NIWA begin research in 2004; currently pushing development; $4.6m FoRST grant
‐ No commercial farms to date‐ Sealord involved in research with NIWA
NZ GeoduckDeepwater clamPanopea zealandia
Cawthron ‐ Different species farmed in US and Canada since 1990’s‐ Early stages of development at Cawthron
‐ No commercial operations to date‐ Produced small numbers of geoduck hatchery spat‐ Farming in tideland likely a barrier (ugly; other land use)
NZ sea urchin/KinaEvechinus chloroticus
NIWA, Otago U and UofAuckland
‐ Basic scientific research into sea cage aquaculture and diet to increase roe production
‐ FoRST funding of $2.8m (04) to Otago/UofAuckland; Sealord and Sea Urchin NZ participated in scientific research
‐ No major commercialisation attempts to date‐ NZ roe has bitter taste; considered inferior in Asia‐ NIWA research early 2000’s to improve taste through diet
NZ sea cucumberStichopus mollis
NIWA, UofAuckland, Wakatu Incorp.
‐ Research around culturing and ongrowing them in association with mussel and finfish farms
‐ Shangdong Oriental Ocean Gp to invest‐ A mollis‐ Pilot system to produce juveniles and selective breeding
‐ Research underway at multiple locations‐ Need to overcome on‐growing challenges‐ No commercial operations to date
NZ SnapperPagrus auratus
NIWA ‐ Related species (Red Sea Bream) farmed in Japan since 65‐ Research programs in New Zealand and Australia
‐ No commercial operations to date in NZ‐ Not related to rest‐ of world snapper (Lutjanidae sp)‐ Small‐scale commercial aquaculture in South Australia
NZ sea spongeMycale hentscheli
NIWA & Victoria University
‐ Research identifies compound that treats some cancers (similar to drug Taxol) only in sponges in Pelorus Sound
‐ Work with Marlborough Mussels Ltd to develop method for growing the sponge on existing mussel farms
‐ No commercial operations to date‐ Drug can be synthesised in lab more efficiently‐ Fouling and predation problems
NZ bath spongeSpongia manipulatus
NIWA & Victoria University
‐ Experimental trials at four sites in early 2000’s ‐ No commercial operations to date
NZ butterfishOdax Pullus
Plant & Food Research
‐ 2008 early stages of development at Plant & Food Research in Nelson facility with NZ Marine Finfish PRoducers
‐ No commercial operations to date
Native seahorseHippocampus abdominalis
NIWA ‐ NIWA trials ‐ No commercial operations to date
EXAMPLES: Some of the many new aquaculture species under development by scientists in New Zealand(2000‐2010)
HORIZON 3 – WHAT ARE THE SCIENTISTS WORKING ON? New Zealand scientists are working on theoretical aquaculture potential, of a wide range of primarily New Zealand native species
PAGE 96 Source: various published articles and websites
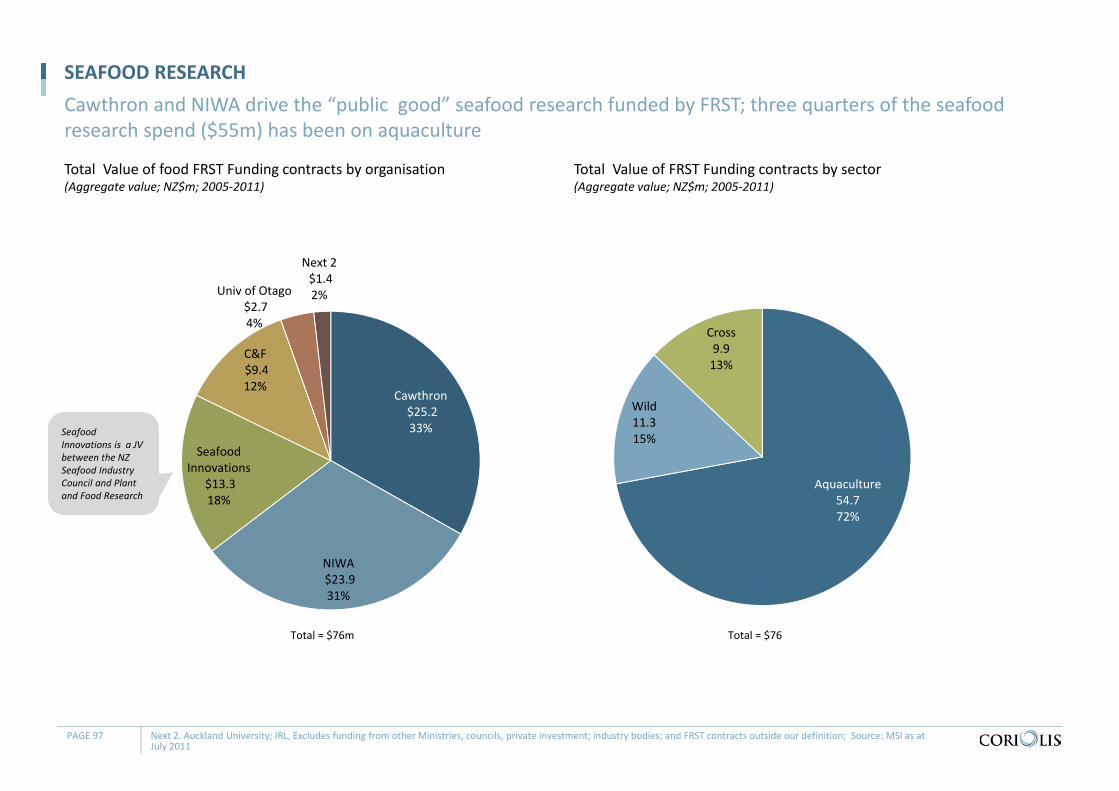
SEAFOOD RESEARCHCawthron and NIWA drive the “public good” seafood research funded by FRST; three quarters of the seafood research spend ($55m) has been on aquaculture
Total Value of food FRST Funding contracts by organisation(Aggregate value; NZ$m; 2005‐2011)
Total Value of FRST Funding contracts by sector(Aggregate value; NZ$m; 2005‐2011)
PAGE 97 Next 2. Auckland University; IRL, Excludes funding from other Ministries, councils, private investment; industry bodies; and FRST contracts outside our definition; Source: MSI as at July 2011
Cawthron$25.2 33%
NIWA$23.9 31%
Seafood Innovations
$13.3 18%
C&F$9.4 12%
Univ of Otago$2.7 4%
Next 2$1.4 2%
Aquaculture54.772%
Wild11.315%
Cross9.913%
Total = $76Total = $76m
Seafood Innovations is a JV between the NZ Seafood Industry Council and Plant and Food Research
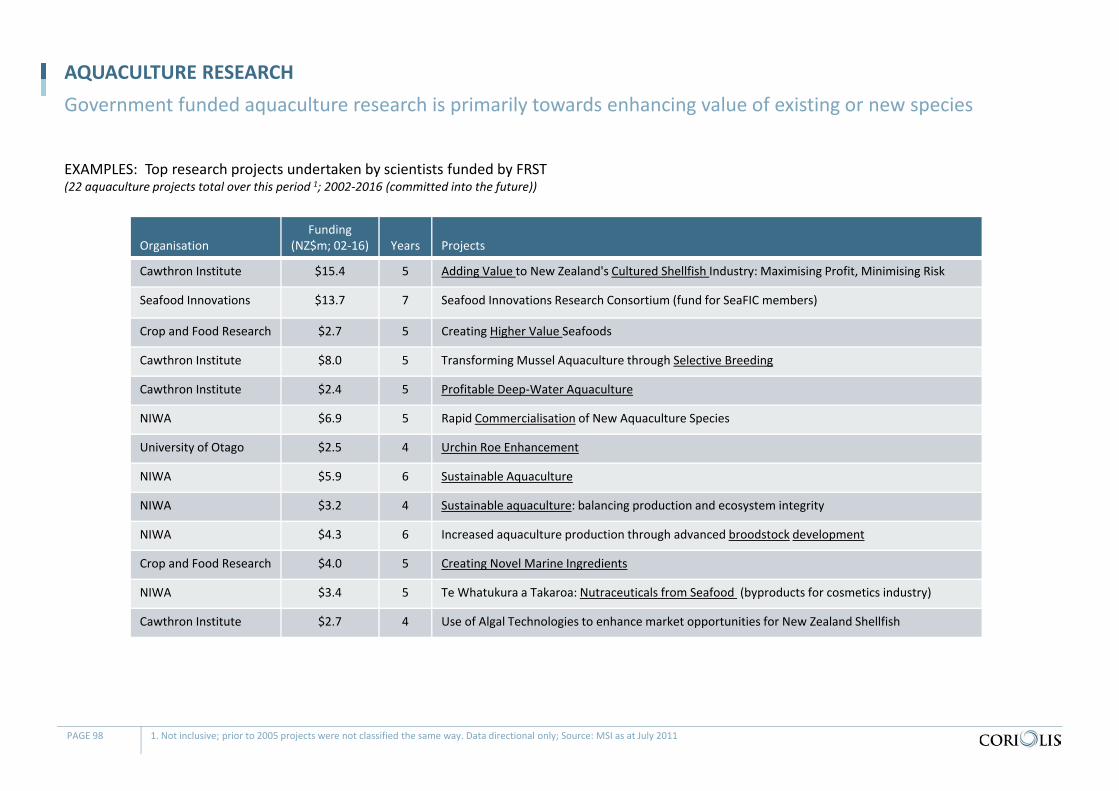
OrganisationFunding
(NZ$m; 02‐16) Years Projects
Cawthron Institute $15.4 5 Adding Value to New Zealand's Cultured Shellfish Industry: Maximising Profit, Minimising Risk
Seafood Innovations $13.7 7 Seafood Innovations Research Consortium (fund for SeaFIC members)
Crop and Food Research $2.7 5 Creating Higher Value Seafoods
Cawthron Institute $8.0 5 Transforming Mussel Aquaculture through Selective Breeding
Cawthron Institute $2.4 5 Profitable Deep‐Water Aquaculture
NIWA $6.9 5 Rapid Commercialisation of New Aquaculture Species
University of Otago $2.5 4 Urchin Roe Enhancement
NIWA $5.9 6 Sustainable Aquaculture
NIWA $3.2 4 Sustainable aquaculture: balancing production and ecosystem integrity
NIWA $4.3 6 Increased aquaculture production through advanced broodstock development
Crop and Food Research $4.0 5 Creating Novel Marine Ingredients
NIWA $3.4 5 Te Whatukura a Takaroa: Nutraceuticals from Seafood (byproducts for cosmetics industry)
Cawthron Institute $2.7 4 Use of Algal Technologies to enhance market opportunities for New Zealand Shellfish
EXAMPLES: Top research projects undertaken by scientists funded by FRST(22 aquaculture projects total over this period 1; 2002‐2016 (committed into the future))
AQUACULTURE RESEARCHGovernment funded aquaculture research is primarily towards enhancing value of existing or new species
PAGE 98 1. Not inclusive; prior to 2005 projects were not classified the same way. Data directional only; Source: MSI as at July 2011
Observations
1 Back salmon for growth
2 Realign science priorities
AQUACULTURE – OBSERVATIONSAquaculture observation number one: back salmon for growth
PAGE 99
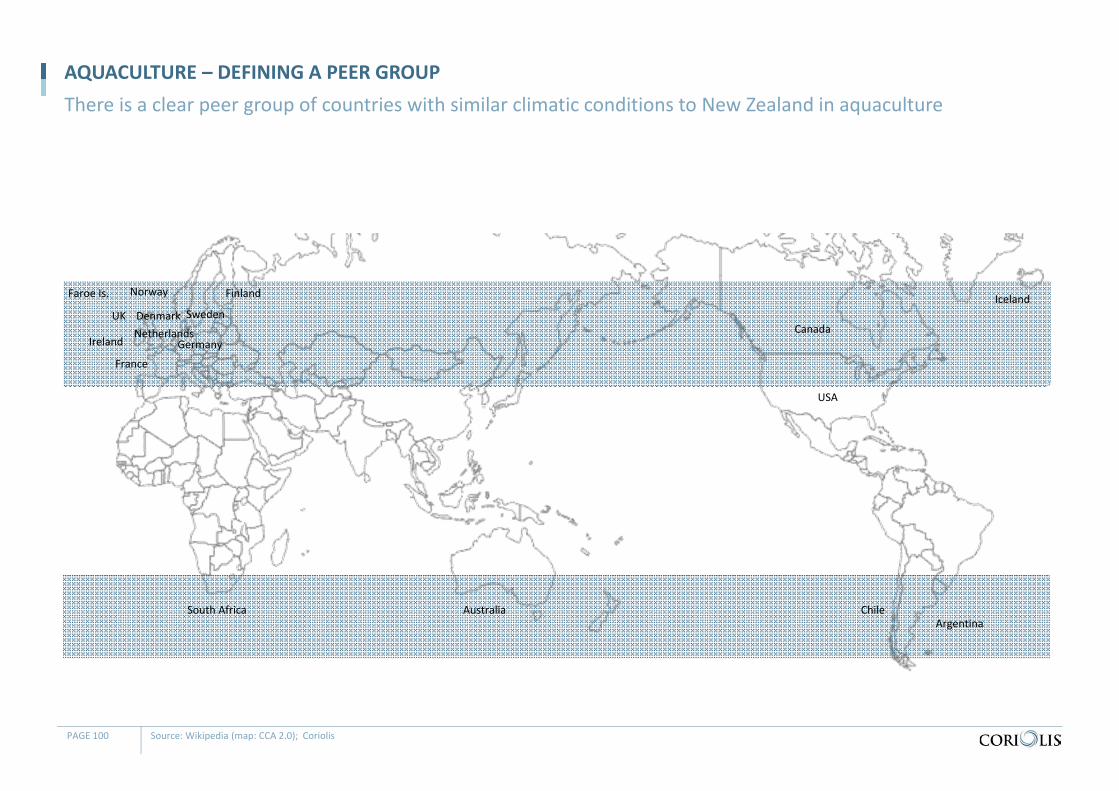
AQUACULTURE – DEFINING A PEER GROUPThere is a clear peer group of countries with similar climatic conditions to New Zealand in aquaculture
PAGE 100 Source: Wikipedia (map: CCA 2.0); Coriolis
ChileAustraliaSouth Africa
Canada
USA
Ireland
UK
Norway
Sweden
Finland Iceland
France
Denmark
GermanyNetherlands
Argentina
Faroe Is.
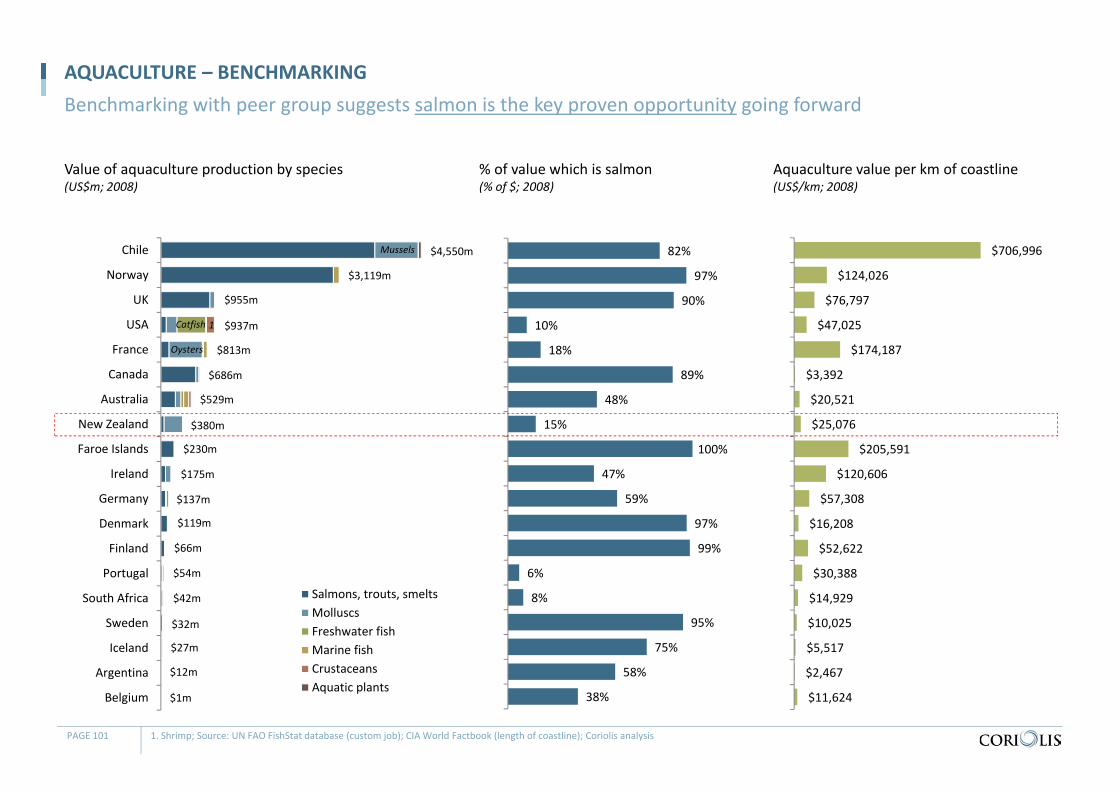
Value of aquaculture production by species(US$m; 2008)
AQUACULTURE – BENCHMARKINGBenchmarking with peer group suggests salmon is the key proven opportunity going forward
PAGE 101 1. Shrimp; Source: UN FAO FishStat database (custom job); CIA World Factbook (length of coastline); Coriolis analysis
Chile
Norway
UK
USA
France
Canada
Australia
New Zealand
Faroe Islands
Ireland
Germany
Denmark
Finland
Portugal
South Africa
Sweden
Iceland
Argentina
Belgium
Salmons, trouts, smeltsMolluscsFreshwater fishMarine fishCrustaceansAquatic plants
82%
97%
90%
10%
18%
89%
48%
15%
100%
47%
59%
97%
99%
6%
8%
95%
75%
58%
38%
$706,996
$124,026
$76,797
$47,025
$174,187
$3,392
$20,521
$25,076
$205,591
$120,606
$57,308
$16,208
$52,622
$30,388
$14,929
$10,025
$5,517
$2,467
$11,624
% of value which is salmon(% of $; 2008)
Aquaculture value per km of coastline(US$/km; 2008)
$380m
$529m
$686m
$813m
$937m
$955m
$3,119m
$4,550m
$230m
$175m
$137m
$119m
$66m
$54m
$42m
$32m
$27m
$12m
$1m
Catfish
Oysters
Mussels
1
SALMON – THE GREAT OPPORTUNITY
- “The biggest opportunity is salmon. We just need to maintain the premium, it’s a premium product, high fat content, great eating quality, it’s a very successful product.” Industry representative, 2011
- “We have worked out how to get a premium for King salmon; it’s a rare species. We have to because it takes more to feed, it’s not as efficient as Atlantic salmon. We get a 30‐40% premium.” CEO, Seafood company, large, 2011
- “Why not go for the low hanging fruit, like salmon, it is the biggest opportunity” Industry representative, 2011
- “The mussels are huge, but the salmon is still in its infancy. There is such opportunity there.” GM, Seafood Company, medium, 2011
- “Wild catch will stablise, there are no new species out there, and we are limited by supply. Growth will come from salmon.” CEO, large Seafood Company, 2011
- “New Zealand King Salmon is applying to increase its current production of 7,500 tonnes of salmon a year to 15,000 tonnes by 2015. If successful, New Zealand King Salmon believes it can double its production in three to five years in support of the aquaculture industry’s target of $1 billion in sales by 2025. ” New Zealand King Salmon, April 2011
- “Mt Cook Alpine Salmon CEO, Matthews is driving a bold $20 million expansion plan he says will fuel a 1400 per cent production increase for the company within four years…When Matthews took over, Mt Cook was producing 160 tonnes per year. This year it will produce 400 tonnes.And with a $20 million expansion, including a processing factory and a value‐added plant, Mathews says they will be turning out 1000 tonnes in 2012 and 2000 tones in 2013.” Matthews, CEO, Alpine Salmon, Aquaculture NZ, July 2011
PAGE 102
The salmon industry is heralded by many as a great opportunity with investors planning further expansions
SALMON – CHALLENGE – ACCESS TO SPACE
- “The salmon sector has got such huge potential. A unique product which is getting its feed conversion rate down which will increase productivity. All it needs is additional space allocated and it will hum. ” Industry body representative, 2011
- “The biggest limitation with salmon is the access to water space in the Marlborough Sounds. Some of the decisions we make and the places we deploy our efforts is so inefficient. We waste resources with bad decision‐making. 70% of all marine assets are in the wrong place. They are not producing what they should. We could move a farm 20 metres and double our production. The system is incapable of making decisions. We make the choice to have a small 14,000 tonne salmon industry as opposed to a 1m tonne one. Ideally we would be in Marlborough it has the infrastructure and great environment, close to the airport, town.” CEO, Seafood company, large, 2011
- “We want to change some space from mussels to salmon, the cost is just too prohibitive. The process is too much, it doesn’t make it feasible.” CEO, Seafood Company, medium, 2011
- “The whole water space allocation is a debacle. Salmon compared to mussels has 5 times the value to the water space. There is complete halt until the legislative reform. Salmon need more space to develop.” GM, Seafood Company, medium, 2011
- “The biggest hold up to development is the regulatory environment. Consenting process to get water space and the ability to change the use of the water space. Even when you do get a change it still takes 18 months to 2 years to start developing and selling something.” Manager, Seafood company, Medium, 2011
- “The industry needs scale. The government seems keen, yet access is still a huge issue.” CEO, Seafood Company, medium, 2011
- “Consent changes are a nightmare. We can change to salmon, but it is a huge cost.” Manager, Seafood company, Medium, 2011
PAGE 103
The salmon industry, in particular, is being held back by space limitations
SALMON – COPY NORWEGIAN SYSTEM?
- “It would be great to have a system like in Norway, it is a two stage process, a concession is granted the right to farm a certain volume. Then the second part is to negotiate with the regions for a site. In Norway there is an excess of space and regions encourage the farms for the employment and infrastructure development.” CEO, Seafood company, large, 2011
- “Do people really think that a country as developed as Norway have a salmon industry that is destroying the environment.” Staff, Government agency, 2011
PAGE 104
Norway has a successful salmon farming industry; New Zealand could consider copying its system
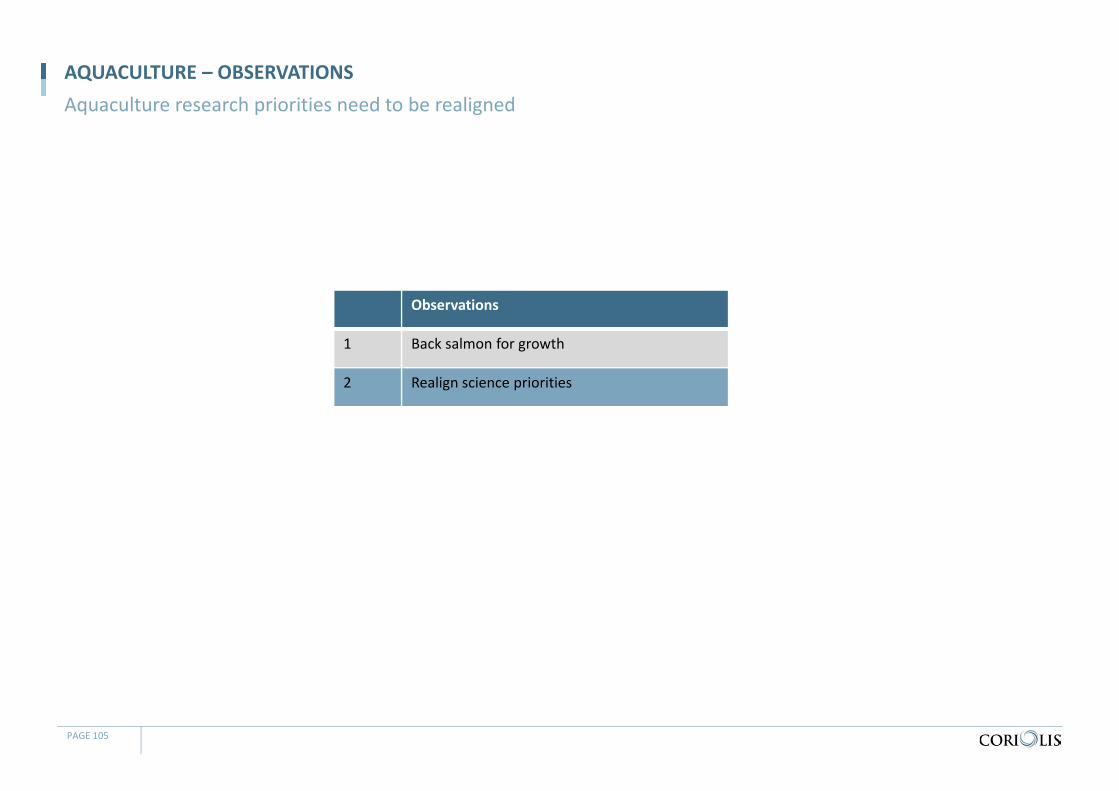
Observations
1 Back salmon for growth
2 Realign science priorities
AQUACULTURE – OBSERVATIONSAquaculture research priorities need to be realigned
PAGE 105
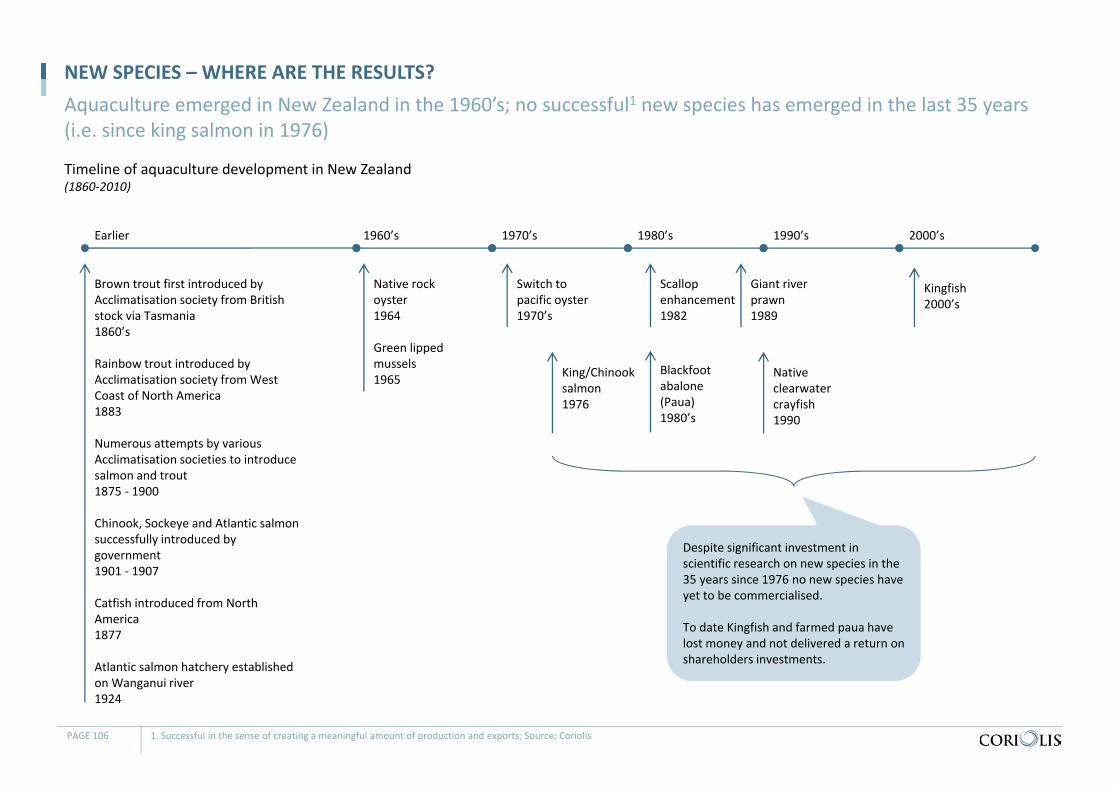
Timeline of aquaculture development in New Zealand(1860‐2010)
NEW SPECIES – WHERE ARE THE RESULTS? Aquaculture emerged in New Zealand in the 1960’s; no successful1 new species has emerged in the last 35 years (i.e. since king salmon in 1976)
PAGE 106 1. Successful in the sense of creating a meaningful amount of production and exports; Source: Coriolis
Earlier 1960’s 1970’s 1980’s 1990’s 2000’s
Native rock oyster1964
Green lipped mussels1965 King/Chinook
salmon1976
Scallop enhancement1982
Giant river prawn1989
Blackfootabalone(Paua)1980’s
Switch to pacific oyster1970’s
Brown trout first introduced by Acclimatisation society from British stock via Tasmania1860’s
Rainbow trout introduced by Acclimatisation society from West Coast of North America1883
Numerous attempts by various Acclimatisation societies to introduce salmon and trout1875 ‐ 1900
Chinook, Sockeye and Atlantic salmon successfully introduced by government1901 ‐ 1907
Catfish introduced from North America1877
Atlantic salmon hatchery established on Wanganui river1924
Native clearwatercrayfish1990
Kingfish2000’s
Despite significant investment in scientific research on new species in the 35 years since 1976 no new species have yet to be commercialised.
To date Kingfish and farmed paua have lost money and not delivered a return on shareholders investments.
HORIZON 2 – WHY NOT?
- “The problem with aquaculture is profit and aquaculture aren’t good bed fellows. Return on capital in this area is a problem.” CEO, Seafood Company, medium, 2011
- “Aquaculture just need to get on with it. But the biggest issue is getting a return on your investment. There would be very few mussel companies that could say they were doing that.” CEO, Seafood company, large, 2011
- “The combined effects of insufficient working capital, on‐going plant failures and spiralling costs had overtaken the business. Hence we made the decision to cease operations.” Winiata Brown, Chairman, Preengarenga Incorporation, quoted in Northern Advocate, June 2006
- “The Kingfish operation in Northland failed in 2006 owing $8m. They blamed the poor equipment for low yields.” Manager, 2011
- “You will suffer for 15 years trying to make money in new species. Tasmania have been trying to make it in Kingfish for years. They still haven't managed after 20 years.” CEO, Seafood company, large, 2011
- “New species will go from a standing start to cash positive in maybe 10 years. There is limited knowledge in the technology, markets, moving aquaculture into finfish will require very deep pockets. It will cost $50‐$100m to commercialise. You need scale ‐ at least 20 hectares. Why not go for the low hanging fruit, like salmon? Hapuka is a very risky proposition – a small egg size is very hard to feed and survive. It’s very expensive, unproven and unknown. It will take at least 10 years.” Industry body representative, 2011
- “There is a lot of under‐developed water space that needs capital ‐ with finfish especially. King Salmon would never have made it without foreign investment.” CEO, large Seafood Company, 2011
- “With Kingfish, the price is half what you get for salmon and it is higher cost, less efficient to fillet. Hapuka we have no experience. The fillet yields 40% as opposed to salmon which is 71%.” CEO, Seafood company, large, 2011
- “With salmon, they have big eggs that support the smelt; they are easy to manipulated, fertilise. With a kingfish, they have tiny eggs; there are problems with feeding and survival.” CEO, Seafood company, small, 2011
PAGE 107
Developing new species is both (1) highly risky [particularly around unproven species & technology] and (2) takes a long time to produce returns
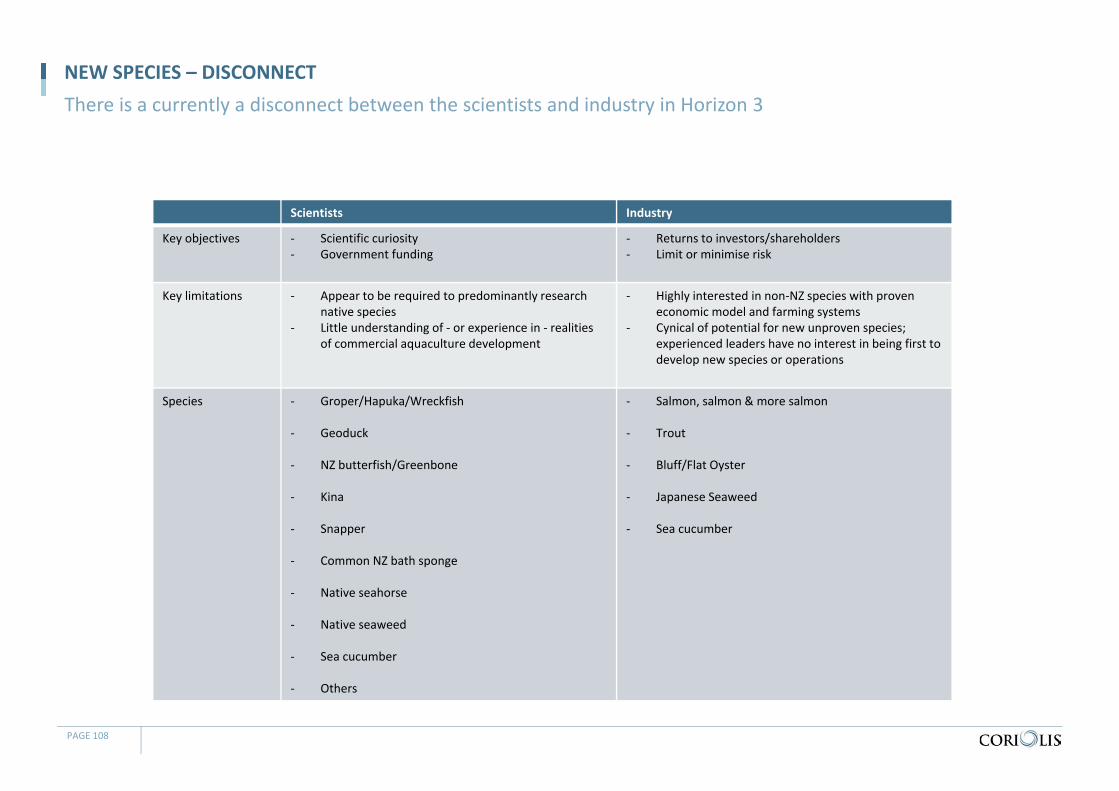
Scientists Industry
Key objectives ‐ Scientific curiosity‐ Government funding
‐ Returns to investors/shareholders‐ Limit or minimise risk
Key limitations ‐ Appear to be required to predominantly research native species
‐ Little understanding of ‐ or experience in ‐ realities of commercial aquaculture development
‐ Highly interested in non‐NZ species with proven economic model and farming systems
‐ Cynical of potential for new unproven species; experienced leaders have no interest in being first to develop new species or operations
Species ‐ Groper/Hapuka/Wreckfish
‐ Geoduck
‐ NZ butterfish/Greenbone
‐ Kina
‐ Snapper
‐ Common NZ bath sponge
‐ Native seahorse
‐ Native seaweed
‐ Sea cucumber
‐ Others
‐ Salmon, salmon & more salmon
‐ Trout
‐ Bluff/Flat Oyster
‐ Japanese Seaweed
‐ Sea cucumber
NEW SPECIES – DISCONNECTThere is a currently a disconnect between the scientists and industry in Horizon 3
PAGE 108
HORIZON 3 – SCEPTICAL
- “I think its just a hobby for the scientists to justify their positions.” CEO, large Seafood company, 2011
- “There is a huge opportunity for changing to new species but science and industry knowledge must be in balance. Science providers are keen to create but they don’t always understand the commercial realities of profitability and efficiencies. We need to work together to pick the winners. At the moment everything is random.” Owner, Seafood company, medium, 2011
- “Hapuka and Kingfish are huge ticket items, but there is no differentiation in the market between aquaculture and wild, but the aquaculture is a higher cost. Why would you bother?” Manager, Seafood company, Medium, 2011
- “Hapuka are being investigated, but I can’t see it happening.” CEO, large Seafood company, 2011
- “We know how to grow mussels, we have worked that out, but commercially growing finfish? Who knows how to do that? There are so many things to line up; the science, the regulations, the capital. It will take a lot of years. There is going to be no huge bonanza.” CEO, large Seafood company, 2011
- “With Kingfish give me $30m and I will make you $10m. Cleanseas lost about $45 million. Its not going to work. Geoducks aren't going to work, ours are too small, the demand is for the larger ones. The hapuka need at least $75 million to look at it and the return on investment just isn't there. Abalone have done it tough, they haven't had it easy. It has taken a lot longer than anticipated and the market reaction was complicated (with the colour). Oysters are labour intensive and have limited growing areas, they don’t work in open waters.” CEO, large Seafood company, 2011
- “Until we can find an aquaculture species that we can grow economically with a high end consumer and buyer then there is no point. We have relatively unproductive waters and high labour costs.” CEO, Seafood Company, large, 2011
PAGE 109
Industry was sceptical about commercialising new species
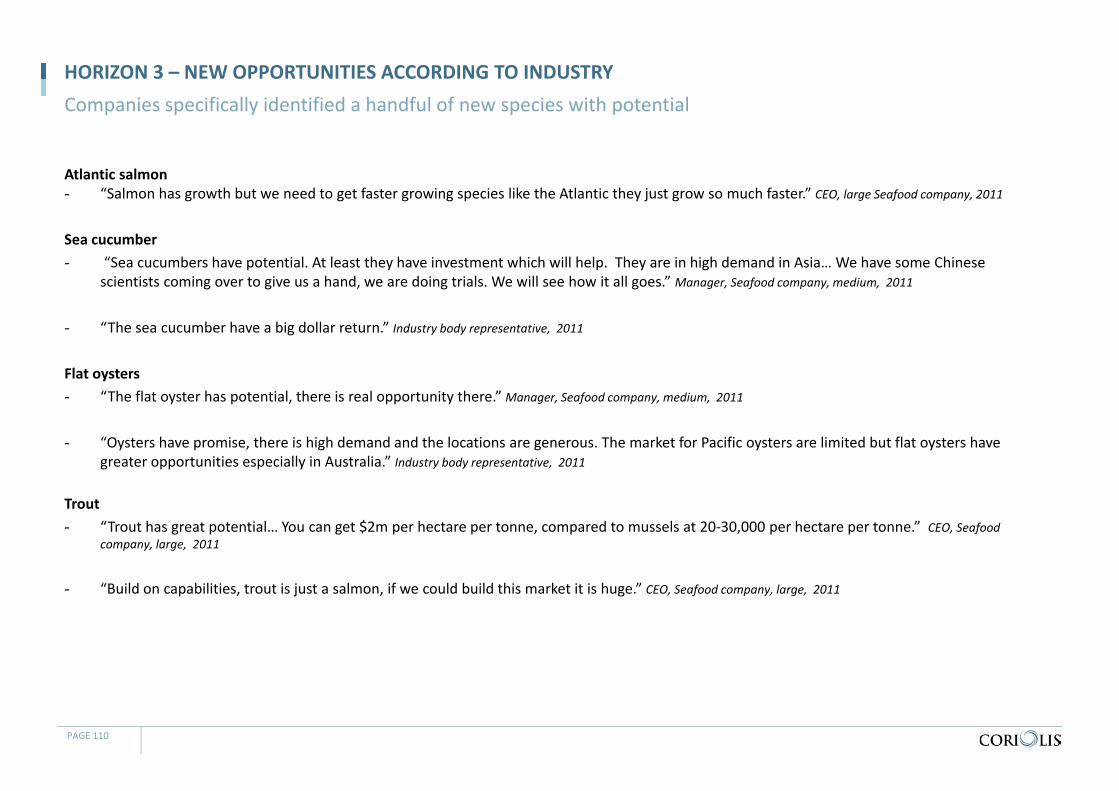
HORIZON 3 – NEW OPPORTUNITIES ACCORDING TO INDUSTRY
Atlantic salmon- “Salmon has growth but we need to get faster growing species like the Atlantic they just grow so much faster.” CEO, large Seafood company, 2011
Sea cucumber- “Sea cucumbers have potential. At least they have investment which will help. They are in high demand in Asia… We have some Chinese
scientists coming over to give us a hand, we are doing trials. We will see how it all goes.” Manager, Seafood company, medium, 2011
- “The sea cucumber have a big dollar return.” Industry body representative, 2011
Flat oysters- “The flat oyster has potential, there is real opportunity there.” Manager, Seafood company, medium, 2011
- “Oysters have promise, there is high demand and the locations are generous. The market for Pacific oysters are limited but flat oysters have greater opportunities especially in Australia.” Industry body representative, 2011
Trout - “Trout has great potential… You can get $2m per hectare per tonne, compared to mussels at 20‐30,000 per hectare per tonne.” CEO, Seafood
company, large, 2011
- “Build on capabilities, trout is just a salmon, if we could build this market it is huge.” CEO, Seafood company, large, 2011
PAGE 110
Companies specifically identified a handful of new species with potential
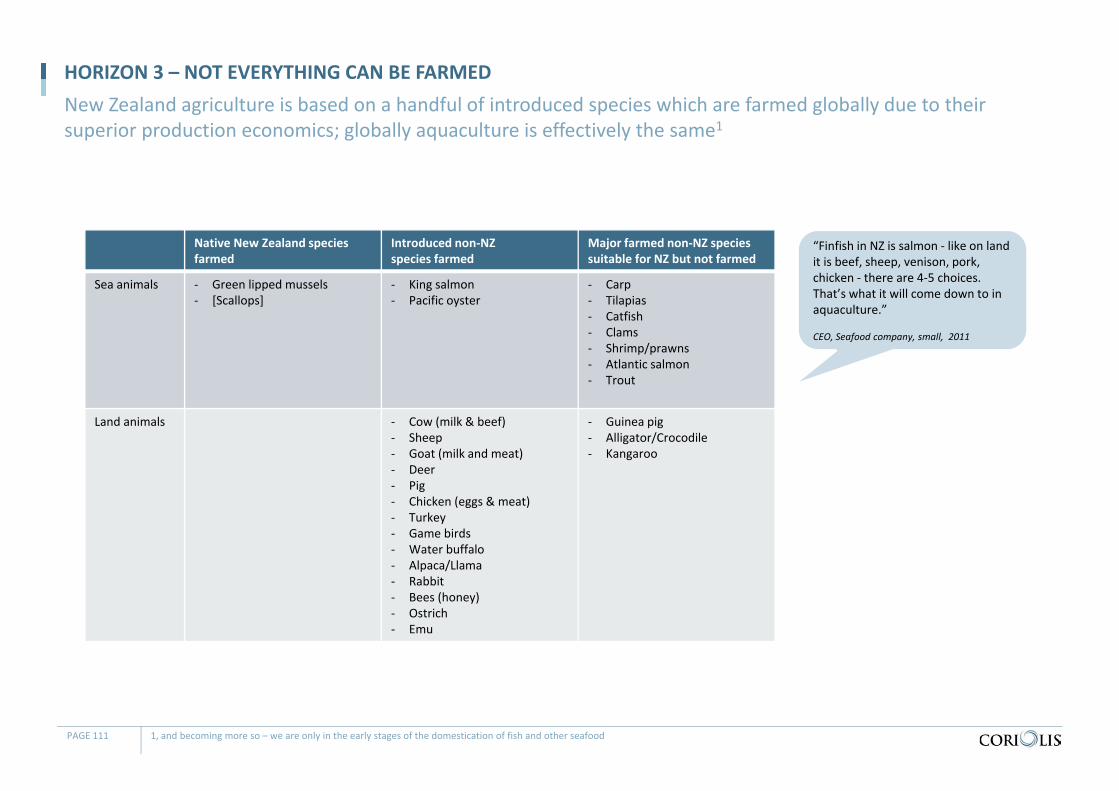
Native New Zealand species farmed
Introduced non‐NZspecies farmed
Major farmed non‐NZ species suitable for NZ but not farmed
Sea animals ‐ Green lipped mussels‐ [Scallops]
‐ King salmon‐ Pacific oyster
‐ Carp‐ Tilapias‐ Catfish‐ Clams‐ Shrimp/prawns‐ Atlantic salmon‐ Trout
Land animals ‐ Cow (milk & beef)‐ Sheep‐ Goat (milk and meat)‐ Deer‐ Pig‐ Chicken (eggs & meat)‐ Turkey‐ Game birds‐ Water buffalo‐ Alpaca/Llama‐ Rabbit‐ Bees (honey)‐ Ostrich‐ Emu
‐ Guinea pig‐ Alligator/Crocodile‐ Kangaroo
HORIZON 3 – NOT EVERYTHING CAN BE FARMEDNew Zealand agriculture is based on a handful of introduced species which are farmed globally due to their superior production economics; globally aquaculture is effectively the same1
PAGE 111 1, and becoming more so – we are only in the early stages of the domestication of fish and other seafood
“Finfish in NZ is salmon ‐ like on land it is beef, sheep, venison, pork, chicken ‐ there are 4‐5 choices. That’s what it will come down to in aquaculture.”
CEO, Seafood company, small, 2011
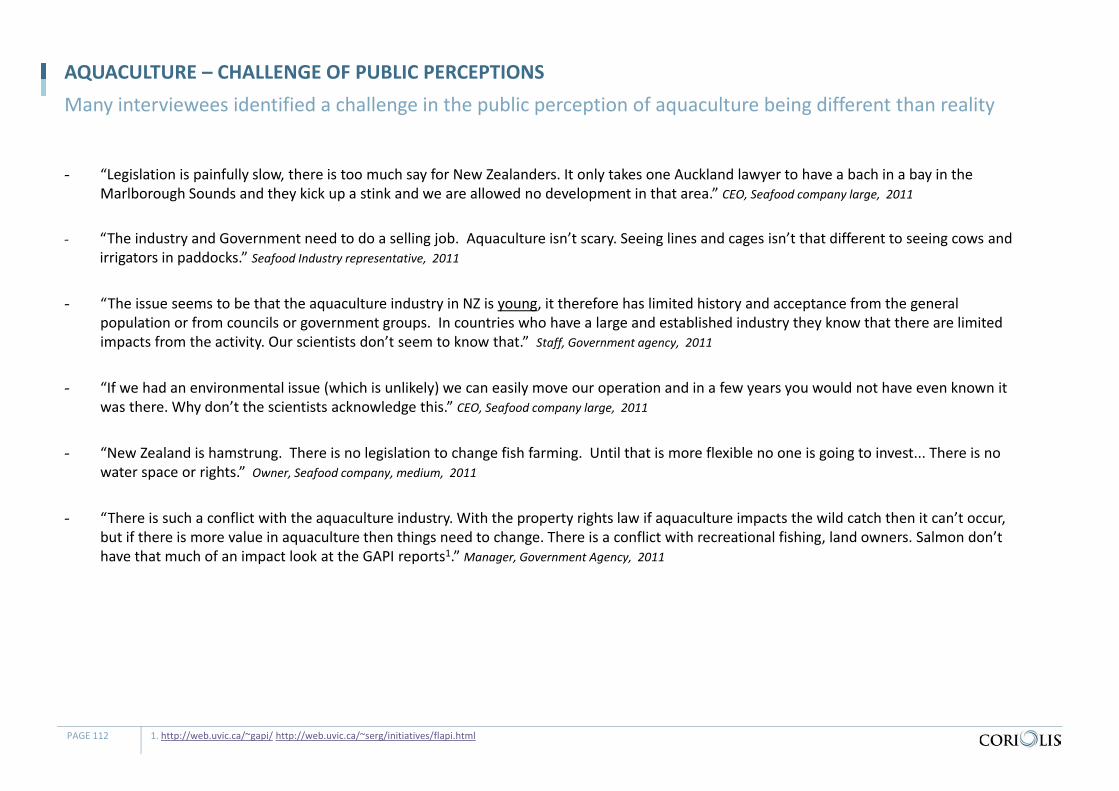
AQUACULTURE – CHALLENGE OF PUBLIC PERCEPTIONS
- “Legislation is painfully slow, there is too much say for New Zealanders. It only takes one Auckland lawyer to have a bach in a bay in the Marlborough Sounds and they kick up a stink and we are allowed no development in that area.” CEO, Seafood company large, 2011
- “The industry and Government need to do a selling job. Aquaculture isn’t scary. Seeing lines and cages isn’t that different to seeing cows and irrigators in paddocks.” Seafood Industry representative, 2011
- “The issue seems to be that the aquaculture industry in NZ is young, it therefore has limited history and acceptance from the general population or from councils or government groups. In countries who have a large and established industry they know that there are limited impacts from the activity. Our scientists don’t seem to know that.” Staff, Government agency, 2011
- “If we had an environmental issue (which is unlikely) we can easily move our operation and in a few years you would not have even known it was there. Why don’t the scientists acknowledge this.” CEO, Seafood company large, 2011
- “New Zealand is hamstrung. There is no legislation to change fish farming. Until that is more flexible no one is going to invest... There is no water space or rights.” Owner, Seafood company, medium, 2011
- “There is such a conflict with the aquaculture industry. With the property rights law if aquaculture impacts the wild catch then it can’t occur, but if there is more value in aquaculture then things need to change. There is a conflict with recreational fishing, land owners. Salmon don’t have that much of an impact look at the GAPI reports1.” Manager, Government Agency, 2011
PAGE 112 1. http://web.uvic.ca/~gapi/ http://web.uvic.ca/~serg/initiatives/flapi.html
Many interviewees identified a challenge in the public perception of aquaculture being different than reality
TABLE OF CONTENTS
Section Page
Contents 4
Glossary of terms 5
Methodology & data sources 6
F&B IP Overview 7
Summary & conclusions 9
Sector overview 17
Wild capture 46
Aquaculture 85
Appendices
Oysters 113
Mussels 122
Salmon 134
Profiles of key firms 156
Supplementary material 162
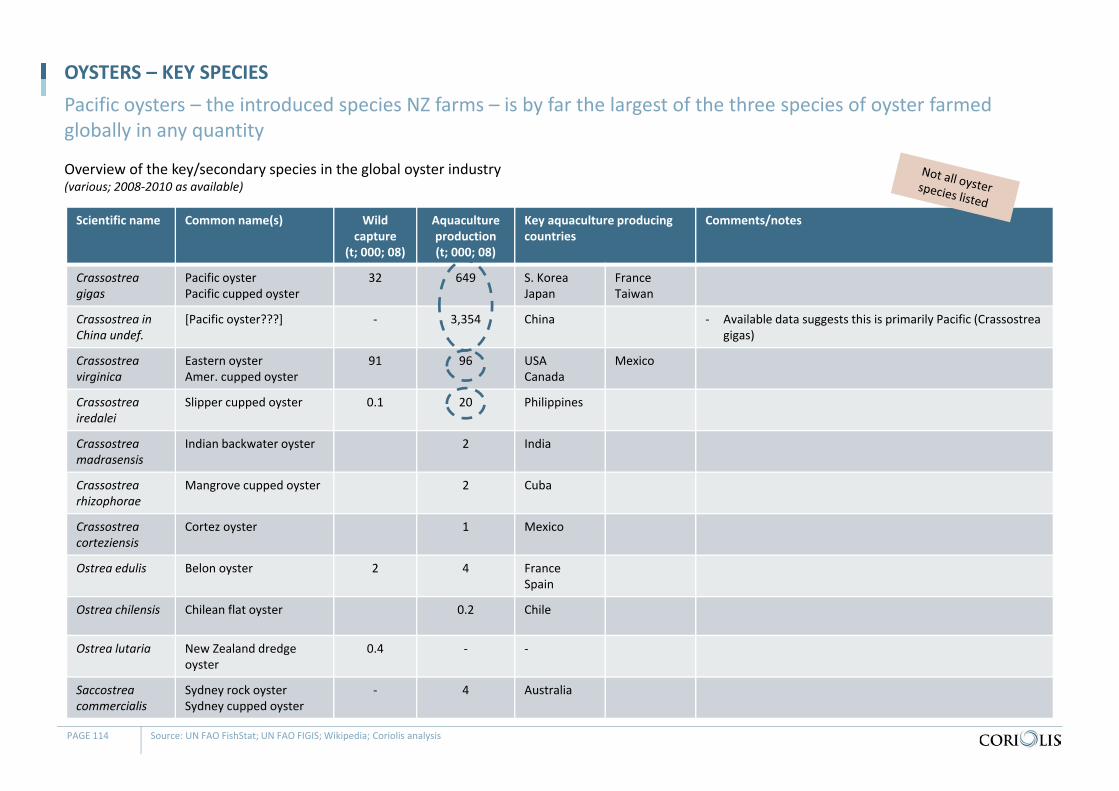
OYSTERS – KEY SPECIES
Source: UN FAO FishStat; UN FAO FIGIS; Wikipedia; Coriolis analysis
Pacific oysters – the introduced species NZ farms – is by far the largest of the three species of oyster farmed globally in any quantity
Overview of the key/secondary species in the global oyster industry(various; 2008‐2010 as available)
Scientific name Common name(s) Wild capture
(t; 000; 08)
Aquaculture production(t; 000; 08)
Key aquaculture producing countries
Comments/notes
Crassostreagigas
Pacific oysterPacific cupped oyster
32 649 S. KoreaJapan
FranceTaiwan
Crassostrea in China undef.
[Pacific oyster???] ‐ 3,354 China ‐ Available data suggests this is primarily Pacific (Crassostreagigas)
Crassostreavirginica
Eastern oysterAmer. cupped oyster
91 96 USACanada
Mexico
Crassostreairedalei
Slipper cupped oyster 0.1 20 Philippines
Crassostreamadrasensis
Indian backwater oyster 2 India
Crassostrearhizophorae
Mangrove cupped oyster 2 Cuba
Crassostreacorteziensis
Cortez oyster 1 Mexico
Ostrea edulis Belon oyster 2 4 FranceSpain
Ostrea chilensis Chilean flat oyster 0.2 Chile
Ostrea lutaria New Zealand dredge oyster
0.4 ‐ ‐
Saccostreacommercialis
Sydney rock oysterSydney cupped oyster
‐ 4 Australia
PAGE 114
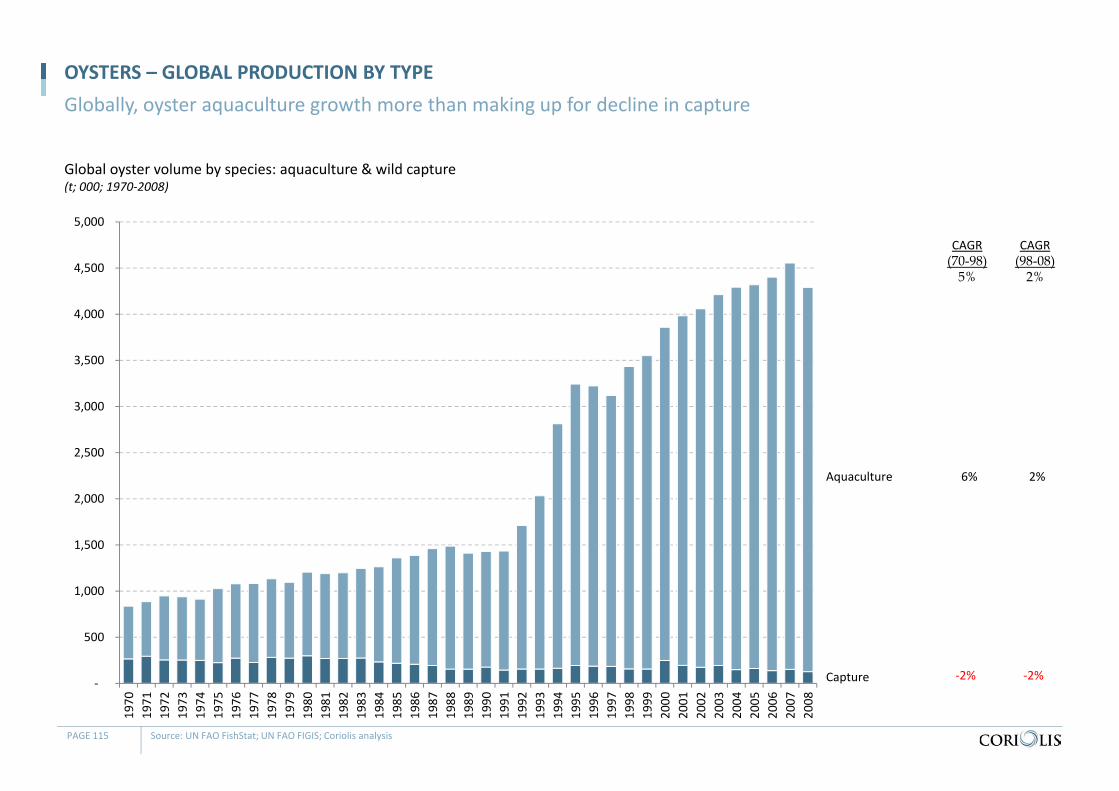
Global oyster volume by species: aquaculture & wild capture(t; 000; 1970‐2008)
OYSTERS – GLOBAL PRODUCTION BY TYPEGlobally, oyster aquaculture growth more than making up for decline in capture
PAGE 115 Source: UN FAO FishStat; UN FAO FIGIS; Coriolis analysis
Capture
Aquaculture
CAGR(70-98)5%
CAGR(98-08)2%
6% 2%
‐2% ‐2% ‐
500
1,000
1,500
2,000
2,500
3,000
3,500
4,000
4,500
5,000
1970
1971
1972
1973
1974
1975
1976
1977
1978
1979
1980
1981
1982
1983
1984
1985
1986
1987
1988
1989
1990
1991
1992
1993
1994
1995
1996
1997
1998
1999
2000
2001
2002
2003
2004
2005
2006
2007
2008
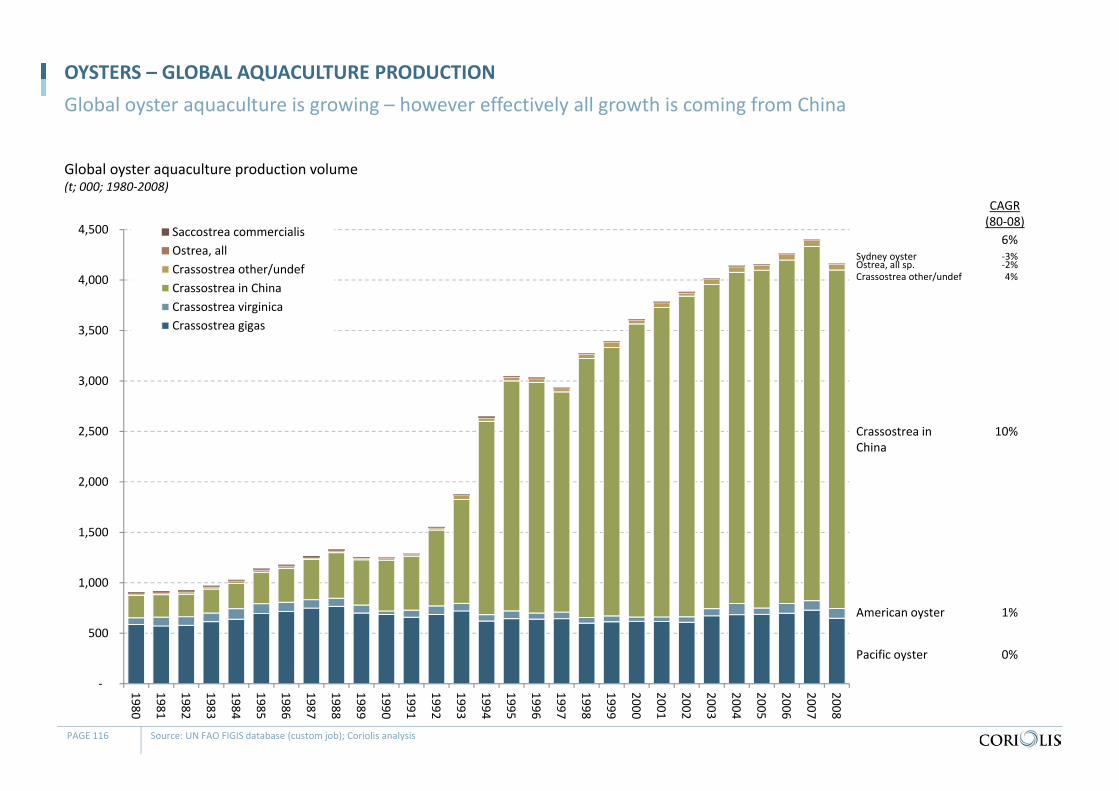
Global oyster aquaculture production volume(t; 000; 1980‐2008)
OYSTERS – GLOBAL AQUACULTURE PRODUCTIONGlobal oyster aquaculture is growing – however effectively all growth is coming from China
PAGE 116 Source: UN FAO FIGIS database (custom job); Coriolis analysis
‐
500
1,000
1,500
2,000
2,500
3,000
3,500
4,000
4,500
1980
1981
1982
1983
1984
1985
1986
1987
1988
1989
1990
1991
1992
1993
1994
1995
1996
1997
1998
1999
2000
2001
2002
2003
2004
2005
2006
2007
2008
Saccostrea commercialisOstrea, allCrassostrea other/undefCrassostrea in ChinaCrassostrea virginicaCrassostrea gigas
Pacific oyster
American oyster
Crassostrea in China
Ostrea, all sp.Sydney oyster
Crassostrea other/undef
0%
1%
10%
‐2%‐3%
4%
CAGR(80‐08)
6%
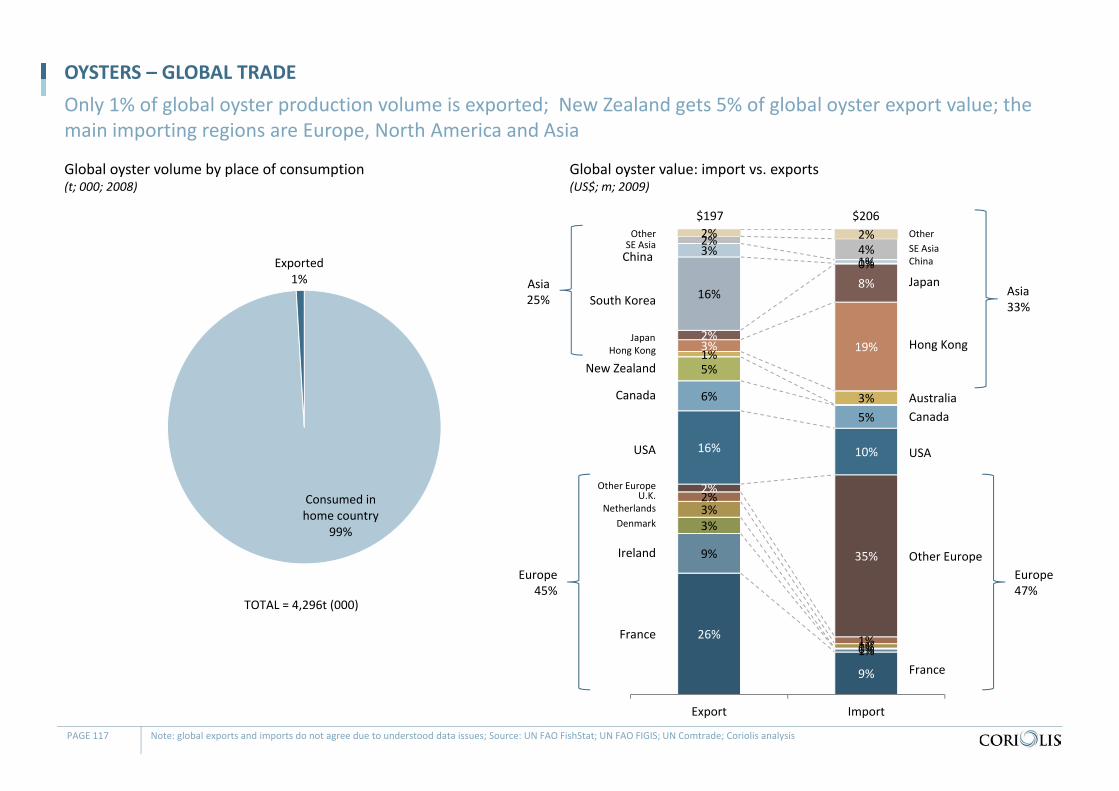
9%
26%1%
9%
0%
3%
1%
3%
1%
2%
35%
2%
10%16%
5%
6%
5%
3%
1% 19%3%
8%
2%
0%
16%
1%3% 4%2% 2%2%
ImportExport
Consumed in home country
99%
Exported1%
Global oyster volume by place of consumption(t; 000; 2008)
OYSTERS – GLOBAL TRADEOnly 1% of global oyster production volume is exported; New Zealand gets 5% of global oyster export value; the main importing regions are Europe, North America and Asia
PAGE 117 Note: global exports and imports do not agree due to understood data issues; Source: UN FAO FishStat; UN FAO FIGIS; UN Comtrade; Coriolis analysis
TOTAL = 4,296t (000)
France
Canada
USA
New ZealandHong Kong
SE AsiaOther
$206$197
Global oyster value: import vs. exports(US$; m; 2009)
Ireland
DenmarkNetherlands
U.K.Other Europe
Japan
South Korea
China
France
Canada
USA
Hong Kong
SE AsiaOther
Other Europe
Japan
China
Europe45%
Asia25%
Europe47%
Asia33%
Australia
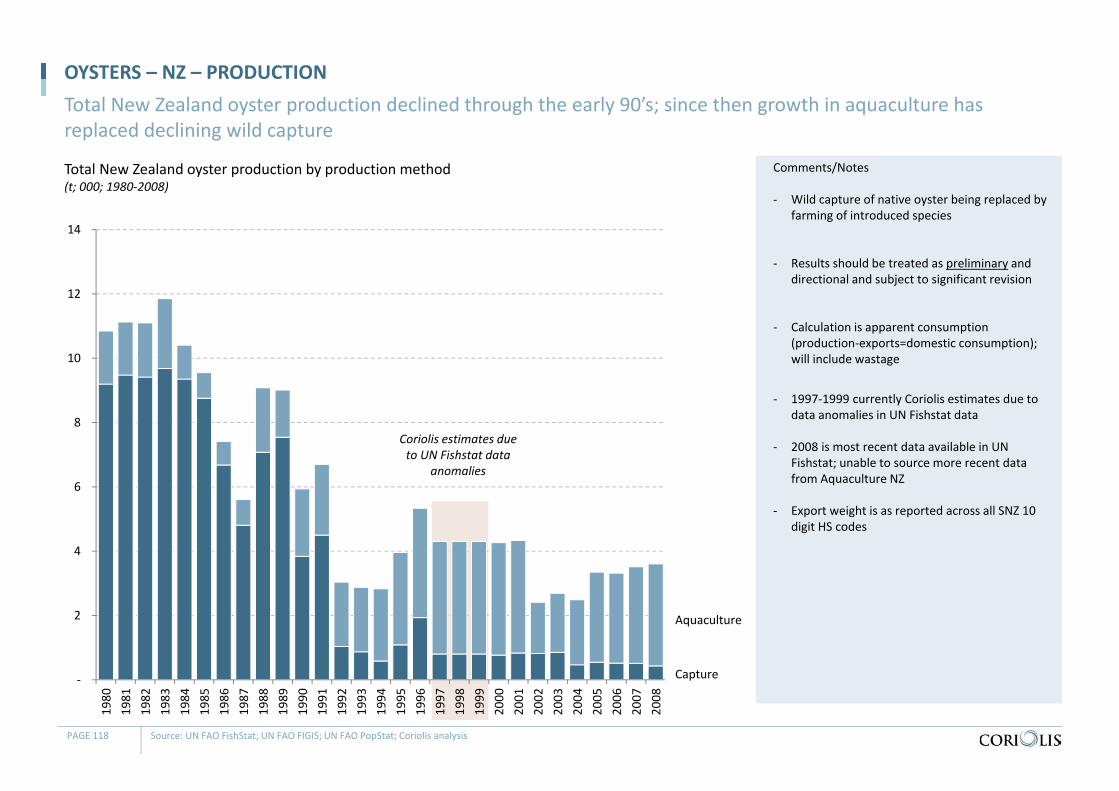
Total New Zealand oyster production by production method(t; 000; 1980‐2008)
OYSTERS – NZ – PRODUCTIONTotal New Zealand oyster production declined through the early 90’s; since then growth in aquaculture has replaced declining wild capture
PAGE 118 Source: UN FAO FishStat; UN FAO FIGIS; UN FAO PopStat; Coriolis analysis
Comments/Notes
‐ Wild capture of native oyster being replaced by farming of introduced species
‐ Results should be treated as preliminary and directional and subject to significant revision
‐ Calculation is apparent consumption (production‐exports=domestic consumption); will include wastage
‐ 1997‐1999 currently Coriolis estimates due to data anomalies in UN Fishstat data
‐ 2008 is most recent data available in UN Fishstat; unable to source more recent data from Aquaculture NZ
‐ Export weight is as reported across all SNZ 10 digit HS codes
‐
2
4
6
8
10
12
14
1980
1981
1982
1983
1984
1985
1986
1987
1988
1989
1990
1991
1992
1993
1994
1995
1996
1997
1998
1999
2000
2001
2002
2003
2004
2005
2006
2007
2008
Aquaculture
Capture
Coriolis estimates due to UN Fishstat data
anomalies
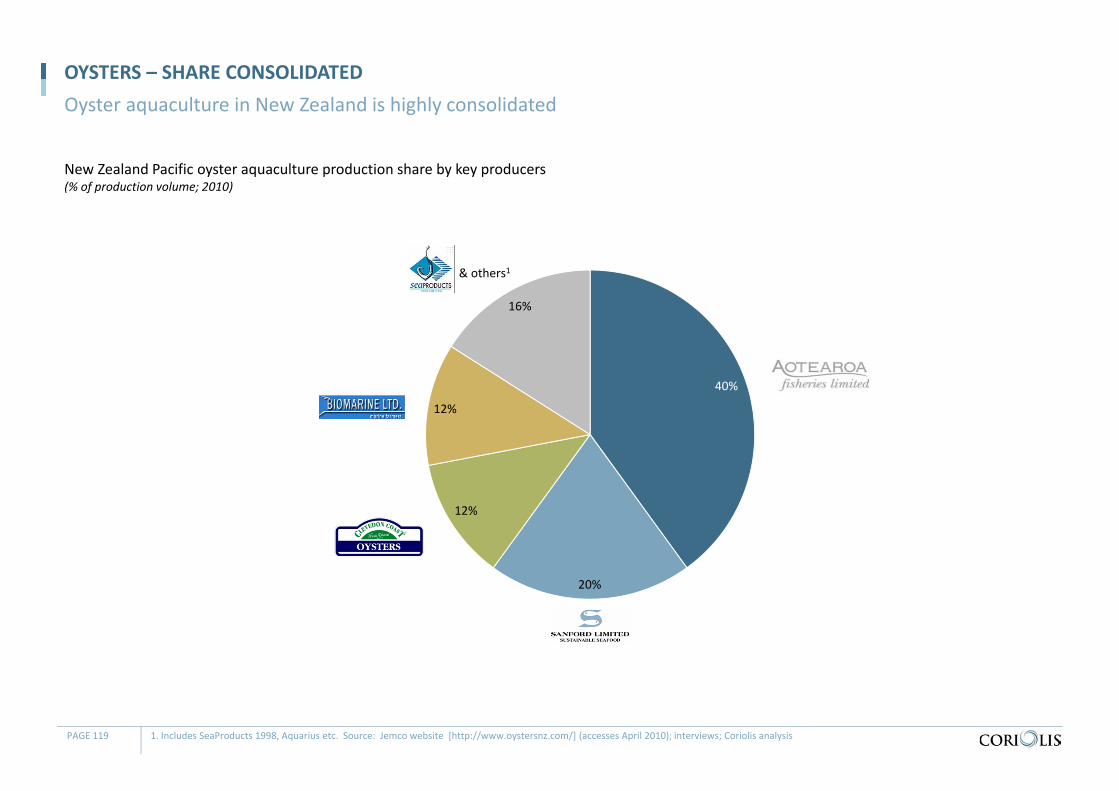
New Zealand Pacific oyster aquaculture production share by key producers(% of production volume; 2010)
OYSTERS – SHARE CONSOLIDATEDOyster aquaculture in New Zealand is highly consolidated
PAGE 119 1. Includes SeaProducts 1998, Aquarius etc. Source: Jemco website [http://www.oystersnz.com/] (accesses April 2010); interviews; Coriolis analysis
Oysters
40%
20%
12%
12%
16%
& others1
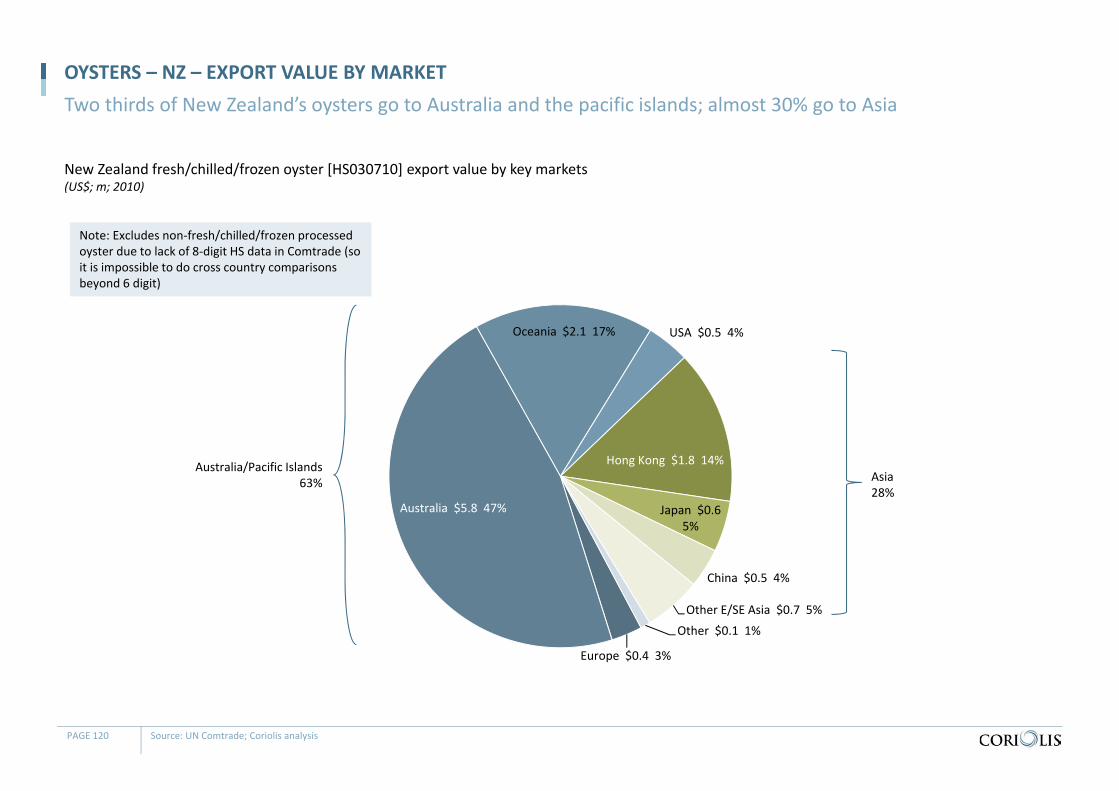
New Zealand fresh/chilled/frozen oyster [HS030710] export value by key markets(US$; m; 2010)
OYSTERS – NZ – EXPORT VALUE BY MARKETTwo thirds of New Zealand’s oysters go to Australia and the pacific islands; almost 30% go to Asia
PAGE 120 Source: UN Comtrade; Coriolis analysis
Europe $0.4 3%
Australia $5.8 47%
Oceania $2.1 17% USA $0.5 4%
Hong Kong $1.8 14%
Japan $0.6 5%
China $0.5 4%
Other E/SE Asia $0.7 5%
Other $0.1 1%
Australia/Pacific Islands63% Asia
28%
Note: Excludes non‐fresh/chilled/frozen processed oyster due to lack of 8‐digit HS data in Comtrade (so it is impossible to do cross country comparisons beyond 6 digit)
OYSTERS – NZ – DISEASE OUTBREAK
- “We are observing a series of viral pandemics in oyster stocks for which there are recognised environmental factors which can be anticipated to worsen in established production areas in the future. This would have been good news New Zealand oyster growers until the recent herpes virus outbreaks proved we are not free of the disease. The principal commercial oyster in NZ is the non‐native but widely farmed Pacific oyster. The small size of the NZ industry and the modest market placement of our products would suggest that we will not see the innovation and investment that would permit us to develop mitigation strategies or capitalise on respites from outbreaks. The current mortality events are anticipated to shrink the current industry. Northland Regional Council has expressed concern that the clean‐up of bankrupt or abandoned farms threatens the region with a substantial economic burden for clean‐up which will have a chilling effect on the creation of new farming capacity.” New Zealand Scientist, 2011
- “Northland oyster farmers are trying to stay positive as a mystery disease decimates what should be next season's harvest. The predicted massive reduction in the harvest could mean a $15 million loss of sales ‐ a devastating effect on the Northland producers' incomes and the regional economy. Two thirds of the country's oyster farms are in Northland, and the industry reaped $30 million in national sales last year. About 500 jobs are attached to the industry.” Northern Advocate, December 2010
PAGE 121
New Zealand oyster aquaculture appears to have a difficult future ahead
TABLE OF CONTENTS
Section Page
Contents 4
Glossary of terms 5
Methodology & data sources 6
F&B IP Overview 7
Summary & conclusions 9
Sector overview 17
Wild capture 46
Aquaculture 85
Appendices
Oysters 113
Mussels 122
Salmon 134
Profiles of key firms 156
Supplementary material 162
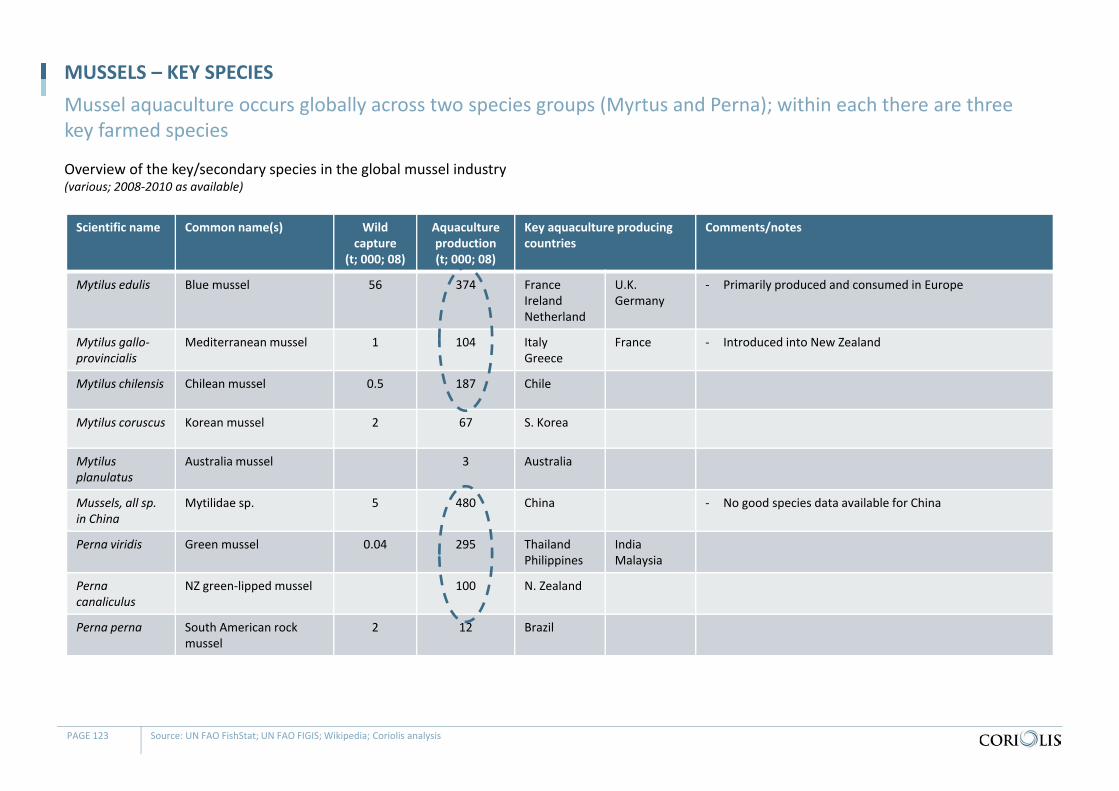
MUSSELS – KEY SPECIES
Source: UN FAO FishStat; UN FAO FIGIS; Wikipedia; Coriolis analysis
Mussel aquaculture occurs globally across two species groups (Myrtus and Perna); within each there are three key farmed species
Overview of the key/secondary species in the global mussel industry(various; 2008‐2010 as available)
Scientific name Common name(s) Wild capture
(t; 000; 08)
Aquaculture production(t; 000; 08)
Key aquaculture producing countries
Comments/notes
Mytilus edulis Blue mussel 56 374 FranceIrelandNetherland
U.K.Germany
‐ Primarily produced and consumed in Europe
Mytilus gallo‐provincialis
Mediterranean mussel 1 104 ItalyGreece
France ‐ Introduced into New Zealand
Mytilus chilensis Chilean mussel 0.5 187 Chile
Mytilus coruscus Korean mussel 2 67 S. Korea
Mytilusplanulatus
Australia mussel 3 Australia
Mussels, all sp. in China
Mytilidae sp. 5 480 China ‐ No good species data available for China
Perna viridis Green mussel 0.04 295 ThailandPhilippines
IndiaMalaysia
Pernacanaliculus
NZ green‐lipped mussel 100 N. Zealand
Perna perna South American rock mussel
2 12 Brazil
PAGE 123
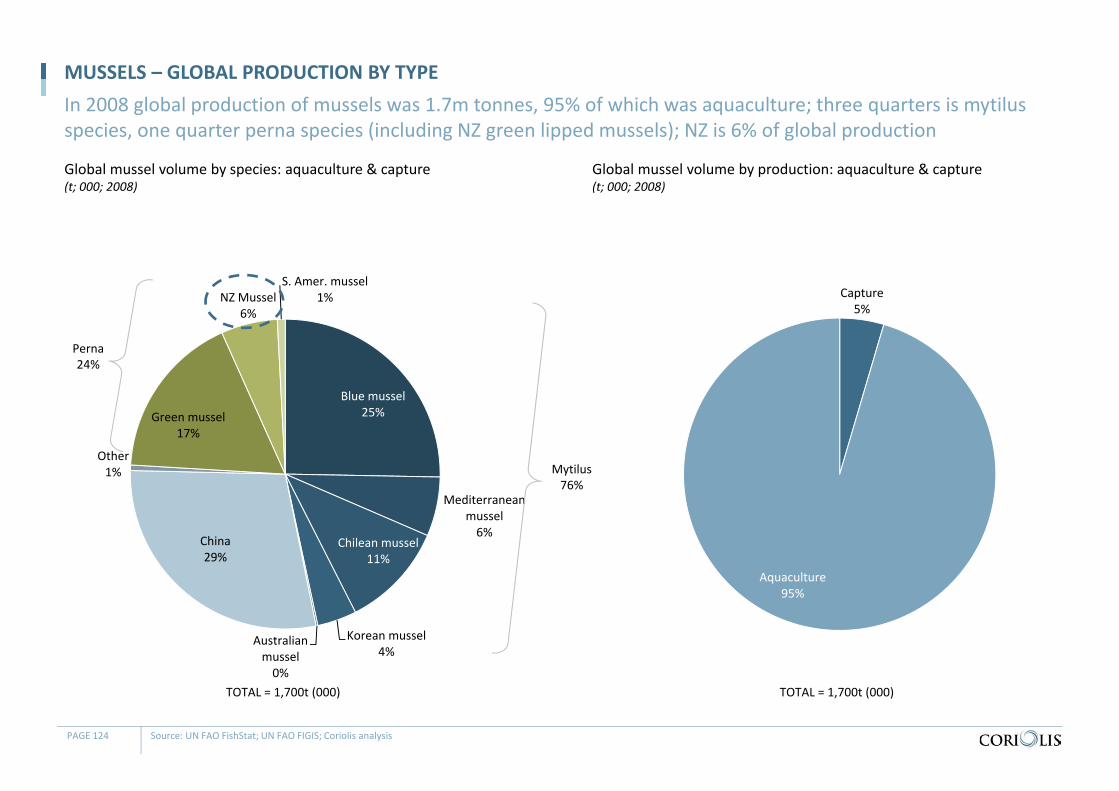
Global mussel volume by species: aquaculture & capture(t; 000; 2008)
MUSSELS – GLOBAL PRODUCTION BY TYPEIn 2008 global production of mussels was 1.7m tonnes, 95% of which was aquaculture; three quarters is mytilusspecies, one quarter perna species (including NZ green lipped mussels); NZ is 6% of global production
PAGE 124 Source: UN FAO FishStat; UN FAO FIGIS; Coriolis analysis
Blue mussel25%
Mediterranean mussel6%
Chilean mussel11%
Korean mussel4%
Australian mussel0%
China29%
Other1%
Green mussel17%
NZ Mussel6%
S. Amer. mussel1% Capture
5%
Aquaculture95%
TOTAL = 1,700t (000) TOTAL = 1,700t (000)
Global mussel volume by production: aquaculture & capture(t; 000; 2008)
Perna24%
Mytilus76%
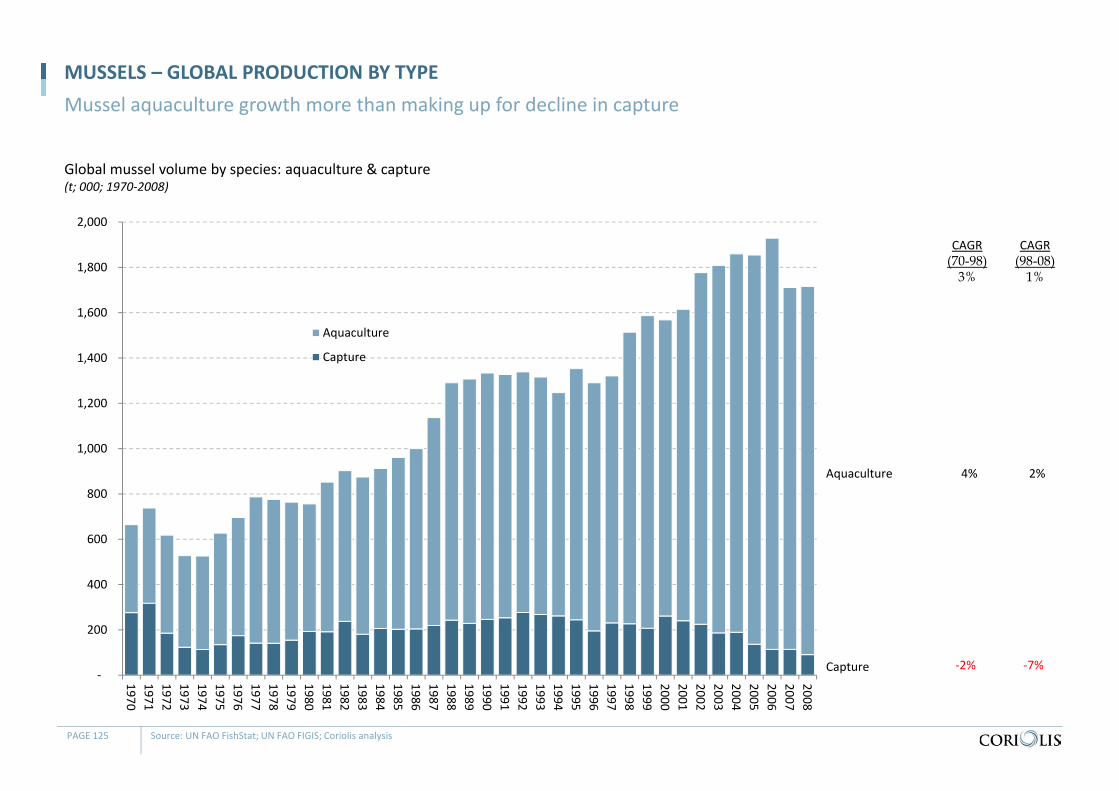
Global mussel volume by species: aquaculture & capture(t; 000; 1970‐2008)
MUSSELS – GLOBAL PRODUCTION BY TYPEMussel aquaculture growth more than making up for decline in capture
PAGE 125 Source: UN FAO FishStat; UN FAO FIGIS; Coriolis analysis
‐
200
400
600
800
1,000
1,200
1,400
1,600
1,800
2,000
197019711972197319741975197619771978197919801981198219831984198519861987198819891990199119921993199419951996199719981999200020012002200320042005200620072008
Aquaculture
Capture
Capture
Aquaculture
CAGR(70-98)3%
CAGR(98-08)1%
4% 2%
‐2% ‐7%
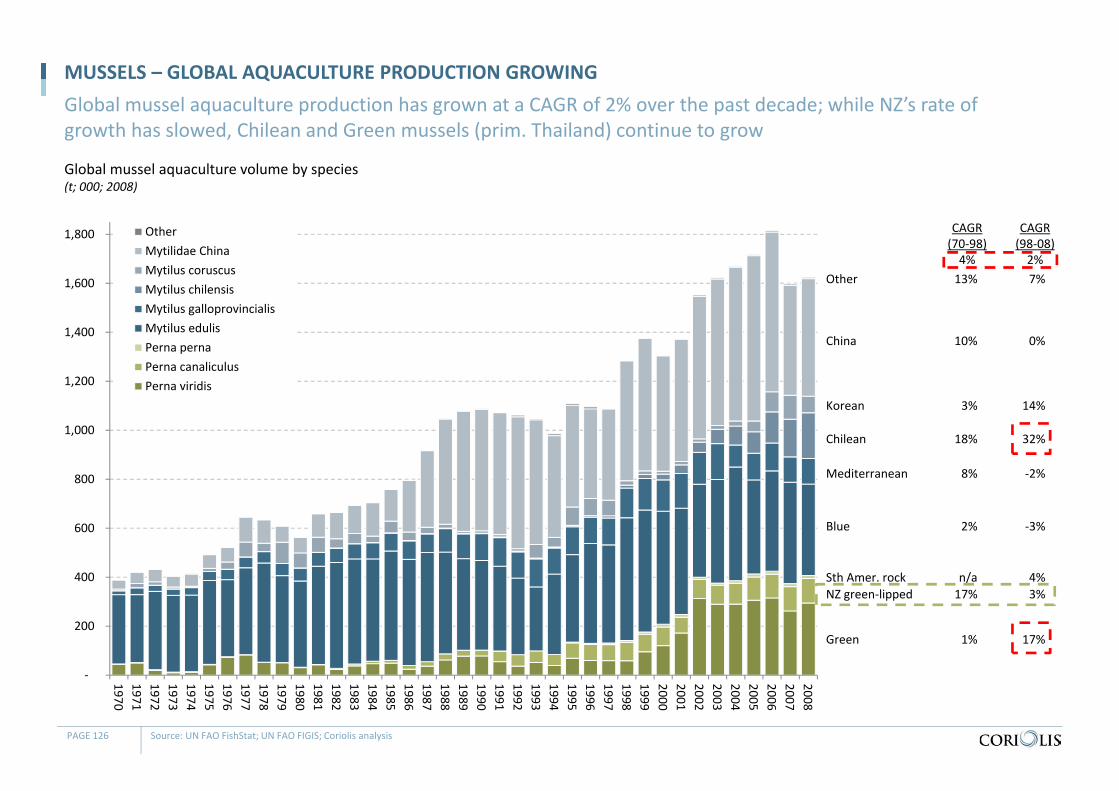
Global mussel aquaculture volume by species(t; 000; 2008)
MUSSELS – GLOBAL AQUACULTURE PRODUCTION GROWINGGlobal mussel aquaculture production has grown at a CAGR of 2% over the past decade; while NZ’s rate of growth has slowed, Chilean and Green mussels (prim. Thailand) continue to grow
PAGE 126 Source: UN FAO FishStat; UN FAO FIGIS; Coriolis analysis
‐
200
400
600
800
1,000
1,200
1,400
1,600
1,800
197019711972197319741975197619771978197919801981198219831984198519861987198819891990199119921993199419951996199719981999200020012002200320042005200620072008
OtherMytilidae ChinaMytilus coruscusMytilus chilensisMytilus galloprovincialisMytilus edulisPerna pernaPerna canaliculusPerna viridis
Green
NZ green‐lippedSth Amer. rock
Blue
Mediterranean
Chilean
Korean
China
Other
1%
17%n/a
2%
8%
18%
3%
10%
13%
CAGR(70‐98)4%
17%
3%4%
‐3%
‐2%
32%
14%
0%
7%
CAGR(98‐08)2%
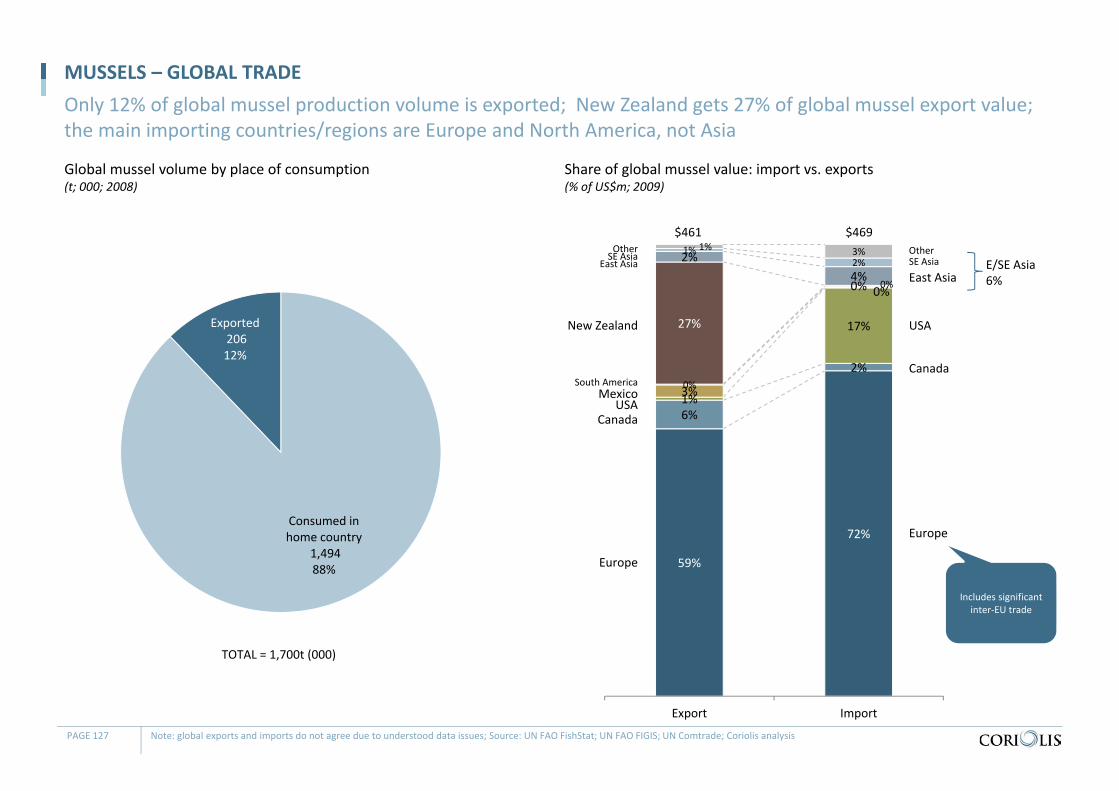
Global mussel volume by place of consumption(t; 000; 2008)
MUSSELS – GLOBAL TRADEOnly 12% of global mussel production volume is exported; New Zealand gets 27% of global mussel export value; the main importing countries/regions are Europe and North America, not Asia
PAGE 127 Note: global exports and imports do not agree due to understood data issues; Source: UN FAO FishStat; UN FAO FIGIS; UN Comtrade; Coriolis analysis
Consumed in home country
1,494 88%
Exported206 12%
TOTAL = 1,700t (000)
72%
59%
2%
6%
17%
1%
0%
3%
0%
0%
0%
27%
4%2% 2%1% 3%1%
ImportExport
Europe
CanadaUSA
Mexico
New Zealand
East AsiaSE AsiaOther
South America
$461 $469
Europe
Canada
USA
East AsiaSE AsiaOther
Share of global mussel value: import vs. exports(% of US$m; 2009)
Includes significant inter‐EU trade
E/SE Asia6%
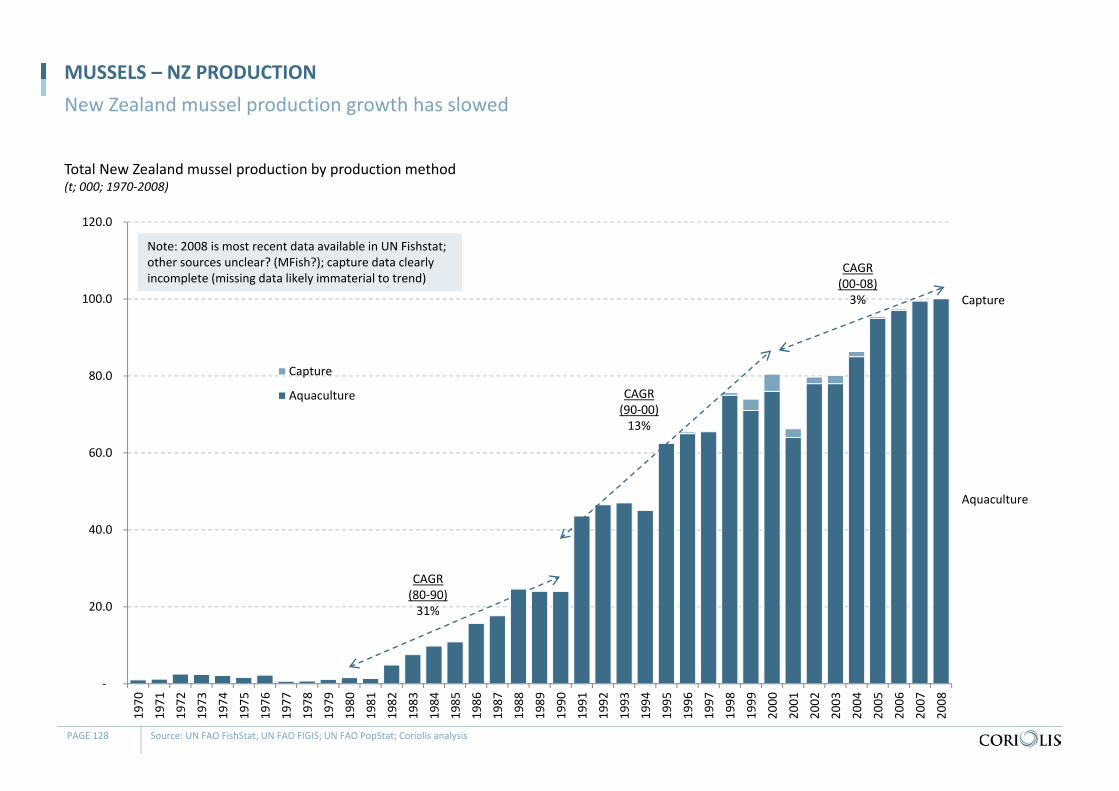
‐
20.0
40.0
60.0
80.0
100.0
120.0
1970
1971
1972
1973
1974
1975
1976
1977
1978
1979
1980
1981
1982
1983
1984
1985
1986
1987
1988
1989
1990
1991
1992
1993
1994
1995
1996
1997
1998
1999
2000
2001
2002
2003
2004
2005
2006
2007
2008
Capture
Aquaculture
Total New Zealand mussel production by production method(t; 000; 1970‐2008)
MUSSELS – NZ PRODUCTIONNew Zealand mussel production growth has slowed
PAGE 128 Source: UN FAO FishStat; UN FAO FIGIS; UN FAO PopStat; Coriolis analysis
Aquaculture
Capture
Note: 2008 is most recent data available in UN Fishstat; other sources unclear? (MFish?); capture data clearly incomplete (missing data likely immaterial to trend)
CAGR(80‐90)31%
CAGR(90‐00)13%
CAGR(00‐08)3%
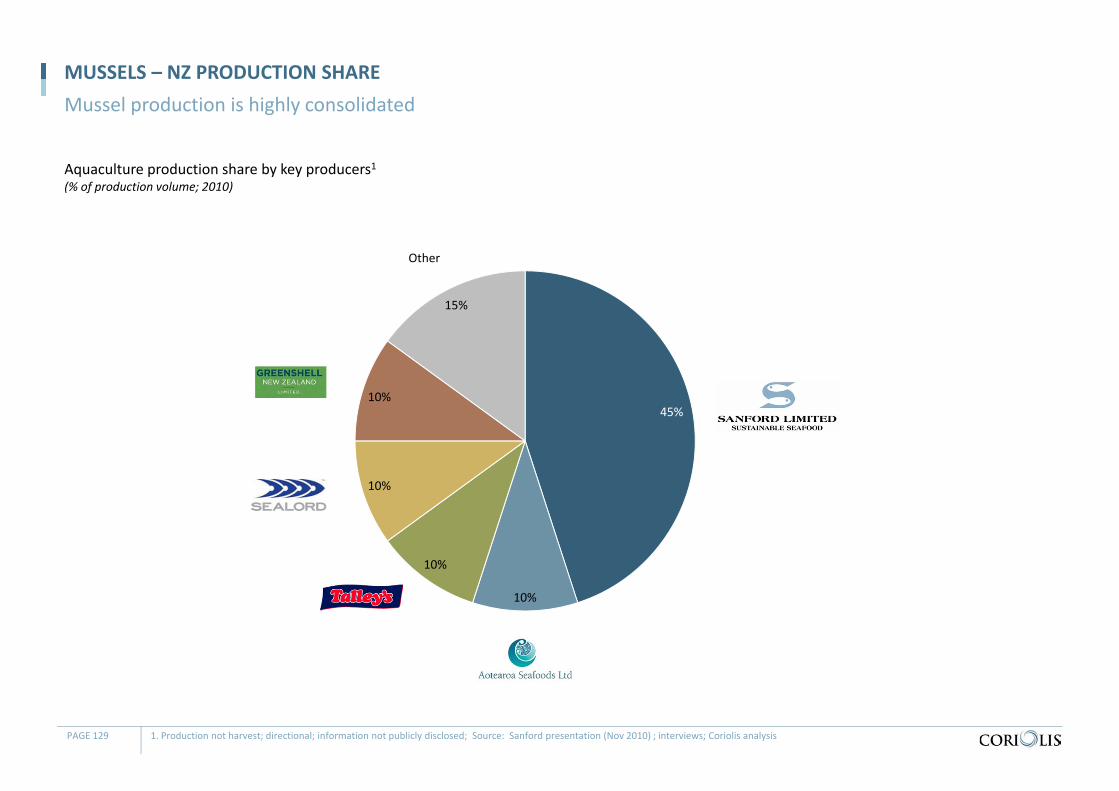
Aquaculture production share by key producers1(% of production volume; 2010)
MUSSELS – NZ PRODUCTION SHAREMussel production is highly consolidated
PAGE 129 1. Production not harvest; directional; information not publicly disclosed; Source: Sanford presentation (Nov 2010) ; interviews; Coriolis analysis
45%
10%
10%
10%
10%
15%
Other
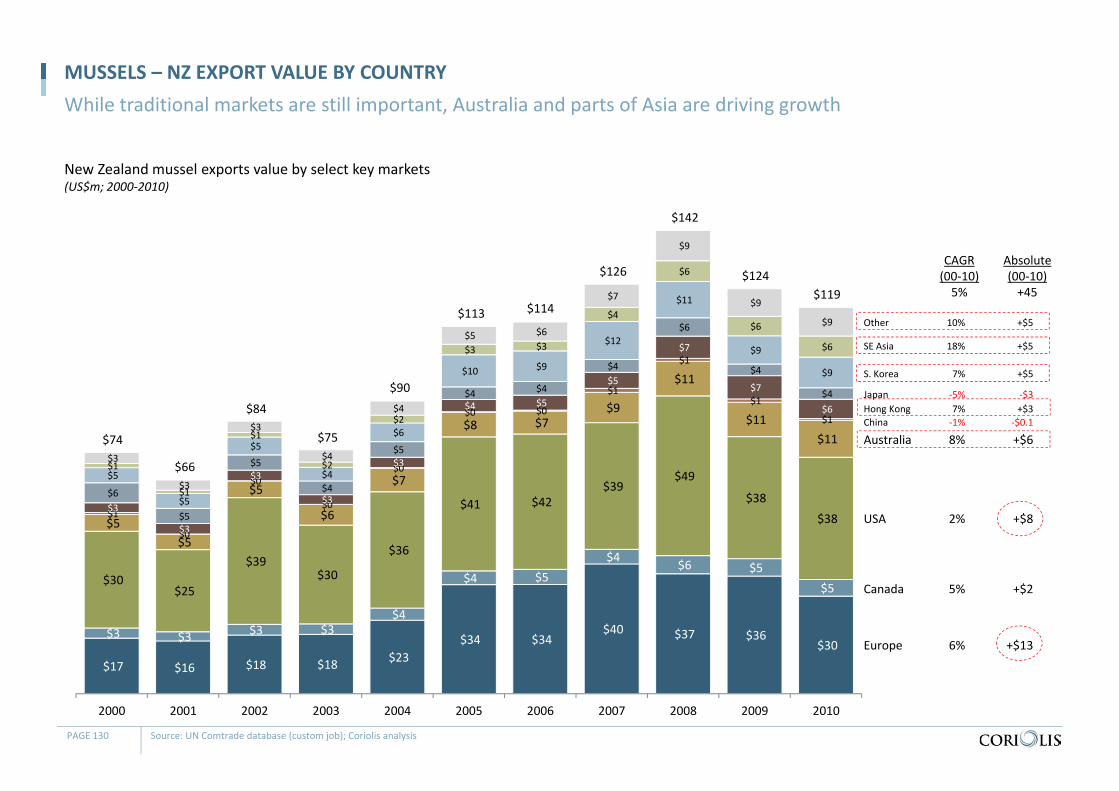
New Zealand mussel exports value by select key markets(US$m; 2000‐2010)
MUSSELS – NZ EXPORT VALUE BY COUNTRYWhile traditional markets are still important, Australia and parts of Asia are driving growth
PAGE 130 Source: UN Comtrade database (custom job); Coriolis analysis
$17 $16 $18 $18 $23 $34 $34
$40 $37 $36 $30
$3 $3 $3 $3 $4
$4 $5 $4 $6 $5
$5 $30 $25
$39 $30
$36
$41 $42 $39
$49
$38 $38 $5
$5
$5
$6
$7
$8 $7 $9
$11
$11 $11
$1
$0
$0
$0
$0
$0 $0
$1
$1
$1
$1
$3
$3
$3
$3
$3
$4 $5
$5
$7
$7
$6
$6
$5
$5
$4
$5
$4 $4
$4
$6
$4
$4
$5
$5
$5
$4
$6
$10 $9
$12
$11
$9
$9
$1
$1
$1
$2
$2
$3 $3
$4
$6
$6
$6
$3
$3
$3
$4
$4
$5 $6
$7
$9
$9
$9
2000 2001 2002 2003 2004 2005 2006 2007 2008 2009 2010
Europe
Canada
USA
AustraliaChina
Other
SE Asia
S. Korea
JapanHong Kong
$74
$66
$84
$75
$90
$113 $114
$126
$142
$124$119
6%
5%
2%
8%‐1%
10%
18%
7%
‐5%7%
CAGR(00‐10)5%
+$13
+$2
+$8
+$6‐$0.1
+$5
+$5
+$5
‐$3+$3
Absolute(00‐10)+45
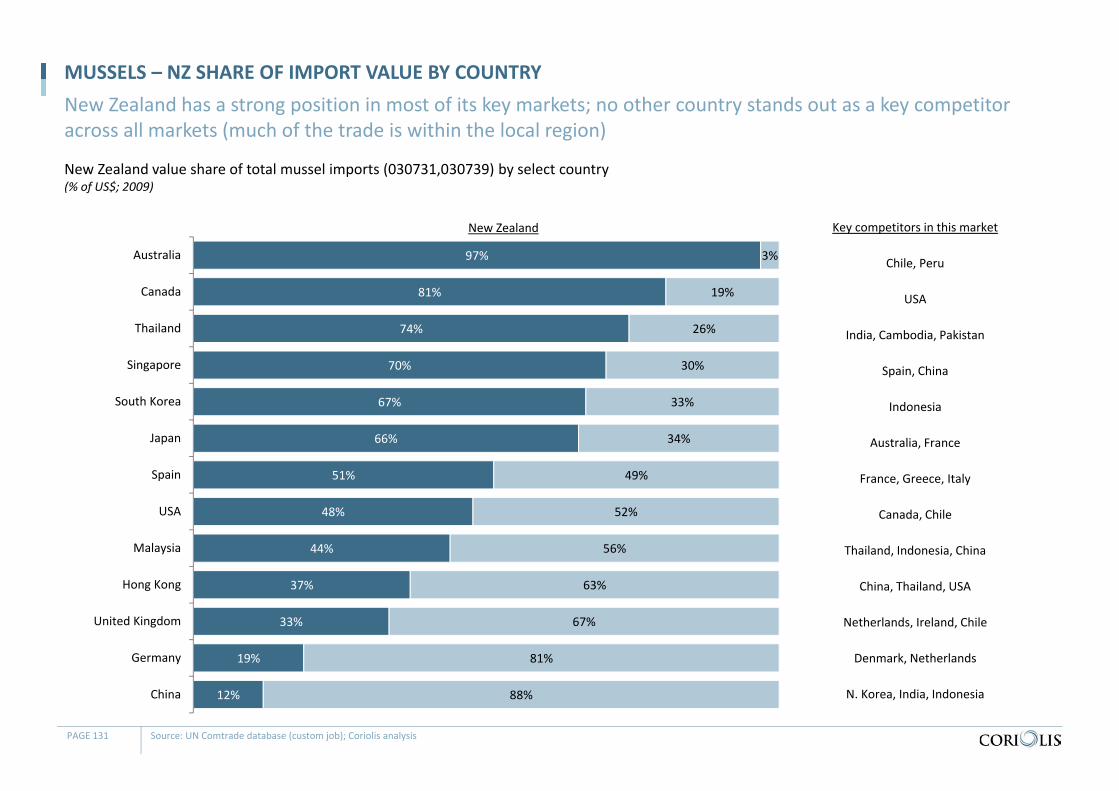
New Zealand value share of total mussel imports (030731,030739) by select country(% of US$; 2009)
MUSSELS – NZ SHARE OF IMPORT VALUE BY COUNTRYNew Zealand has a strong position in most of its key markets; no other country stands out as a key competitor across all markets (much of the trade is within the local region)
PAGE 131 Source: UN Comtrade database (custom job); Coriolis analysis
97%
81%
74%
70%
67%
66%
51%
48%
44%
37%
33%
19%
12%
3%
19%
26%
30%
33%
34%
49%
52%
56%
63%
67%
81%
88%
Australia
Canada
Thailand
Singapore
South Korea
Japan
Spain
USA
Malaysia
Hong Kong
United Kingdom
Germany
China
New Zealand Key competitors in this market
Chile, Peru
USA
India, Cambodia, Pakistan
Spain, China
Indonesia
Australia, France
France, Greece, Italy
Canada, Chile
Thailand, Indonesia, China
China, Thailand, USA
Netherlands, Ireland, Chile
Denmark, Netherlands
N. Korea, India, Indonesia
MUSSELS – NZ CHALLENGES
- “A price war between major processors, who are undercutting one another in the international market, is forcing independent growers from the industry… The price is absolutely diabolical. The few independent growers left are bone heads and just keep going ... we're either strong‐willed or stupid… [I’m] getting up to $650 per tonne green weight (with shells) compared with $1,230 four years ago.” Ray Thomas, Mussel Farmer, quoted in The Marlborough Express, Mar 2010
- “There is discontent within New Zealand's multimillion‐dollar mussel industry, with claims companies are undercutting one another. A "significant number" of people within the industry had expressed "extreme disquiet" about the pricing of mussels on the international market, said David Hogg, managing director of Richmond‐based Sea Health Foods, which last week announced it was closing. "Until there's a much greater effort to move the product we have in New Zealand to higher‐value markets, and stop the commoditisation and price‐taking in offshore markets, this industry will remain in a poor state," he said. The closure of Sea Health Foods, a mussel‐processing business, will see up to 75 staff lose their jobs, with some finishing today.
- The rising New Zealand dollar and the falling market for greenshell mussels had forced the closure, Mr Hogg said. The market price for the mussels, which were mainly exported to North America and Australia, had fallen from $2 to $1.40 per 453g. Mr Hogg said there were few offshore buyers for mussels, and they were driving down prices dramatically by forcing New Zealand companies to compete against each other. It was "completely and utterly wrong" if people thought the mussel industry was in a healthy state, he said. "The aquaculture industry has lofty targets. If they are going to rely on greenshell mussels, those targets are not reachable," Mr Hogg said.” Nelson Mail, Oct 2009
- “New Zealand mussel producers are undercutting each other in foreign markets and dragging down prices for the country's biggest aquaculture export. It's New Zealand producers shooting themselves in the foot.” Eric Barratt, Managing Director, Sanford, May 2010
- “Once the infrastructure is in place it has lower costs (than salmon) , so you can make good money. You can breakeven after 2‐3 years, but there are issues with the exchange rate and there are lower margins. Consolidation of the mussel industry will reduce set up costs, marketing, harvesting, production. There will be a consistent supply, increased quality, good grading, and more mechanism to drive productivity.” Industry body representative, 2011
PAGE 132
The mussel industry has faced challenges, primarily around exchange rate fluctuations
MUSSELS – NZ BREEDING PROGRAMME
- “A Government‐backed mussel‐breeding project aims to boost industry earnings by nearly $250 million. The $52.1 million project by Shellfish Production and Technology New Zealand (SPATnz) has been given $26.1 million of funding over seven years by the Government's Primary Growth Partnership.
- SPATnz is a collaboration by Sanford, Sealord Group and Wakatu Incorporation aiming to domesticate the New Zealand greenshell mussel. Toni Grant, chairwoman of the SPATnz steering group for the bid, said "it would enable the biggest development in the industry since the start of long‐line mussel farming nearly 40 years ago". "This project will revolutionise the industry by domesticating the mussel and developing selectively bred, high‐value product," Grant added. "It will create in excess of 1000 new jobs and add up to $230 million per year to the New Zealand economy at the completion of the project."
- The aquaculture sector is worth about $380 million, with a target to grow to $1 billion of annual revenue by 2025. Sanford managing director Eric Barratt said the project could help the industry hit its billion‐dollar target faster. "Just to grow sufficient spat for meeting the near‐term industry needs is going to be a huge undertaking.“
- Spat is harvested in the wild before being grown on farms and a hatchery would aim to produce product that would grow faster, bigger and better. "It's focused around selective breeding in the same way as our primary industries have used selective breeding on everything we do, whether it's plants or animals ... to get the maximum out of them," Barratt said. "This is just taking that same principle and applying it to mussels.“” New Zealand Herald, Feb 2011
- “There is a great opportunity to really understand the mussel and to provide a product that the public really want, we can alter the colour, the size the shape…all to suit their needs.” Manager, Seafood company, medium, 2011
- “The selective breeding of the mussel is such an opportunity to breed for particular variables; consistency, tenderness, flavour, size. We can breed for different markets. The productivity gains will be amazing. 35% in year one, then increasing to 37% , then 32%. They have an 18 month breeding cycle so it can happen pretty fast.” Industry body representative, 2011
PAGE 133
A Primary Growth Partnership (PGP) has recently committed to investing up to $52.1m in a program aimed at “domesticating” the New Zealand green lipped mussel
TABLE OF CONTENTS
Section Page
Contents 4
Glossary of terms 5
Methodology & data sources 6
F&B IP Overview 7
Summary & conclusions 9
Sector overview 17
Wild capture 46
Aquaculture 85
Appendices
Oysters 113
Mussels 122
Salmon 134
Profiles of key firms 156
Supplementary material 162
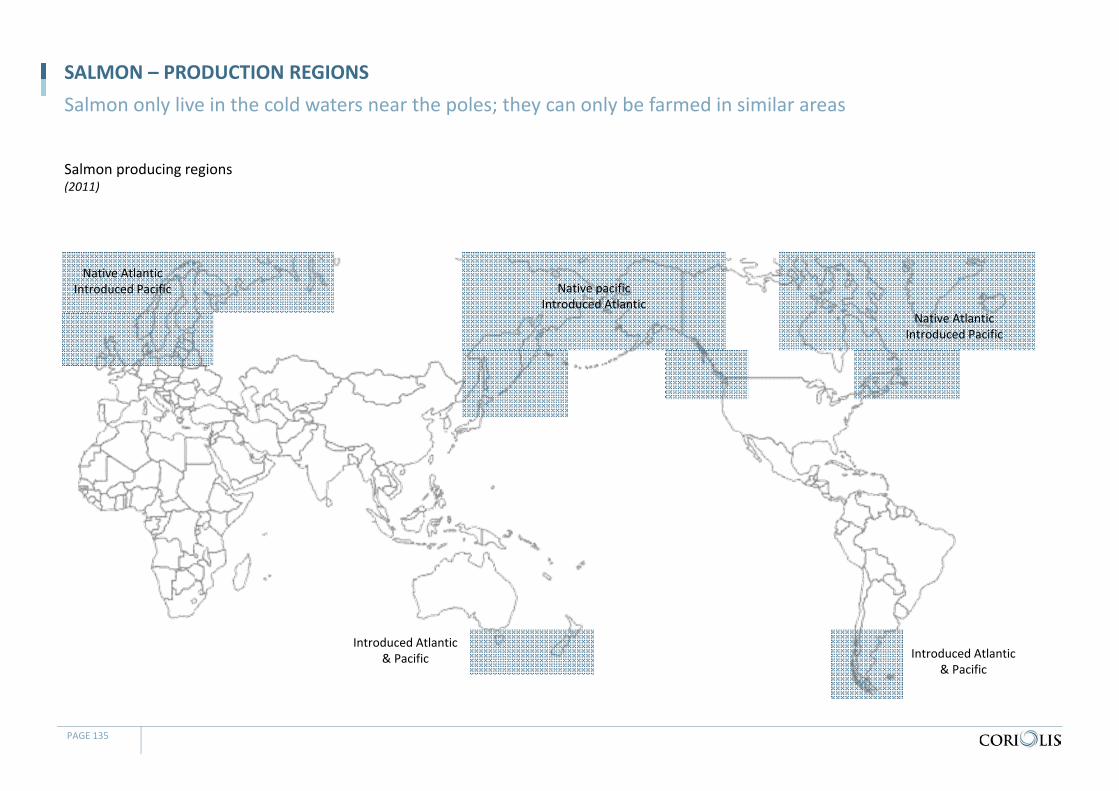
Salmon producing regions(2011)
SALMON – PRODUCTION REGIONSSalmon only live in the cold waters near the poles; they can only be farmed in similar areas
PAGE 135
Native pacificIntroduced Atlantic
Native AtlanticIntroduced Pacific
Native AtlanticIntroduced Pacific
Introduced Atlantic & Pacific Introduced Atlantic
& Pacific
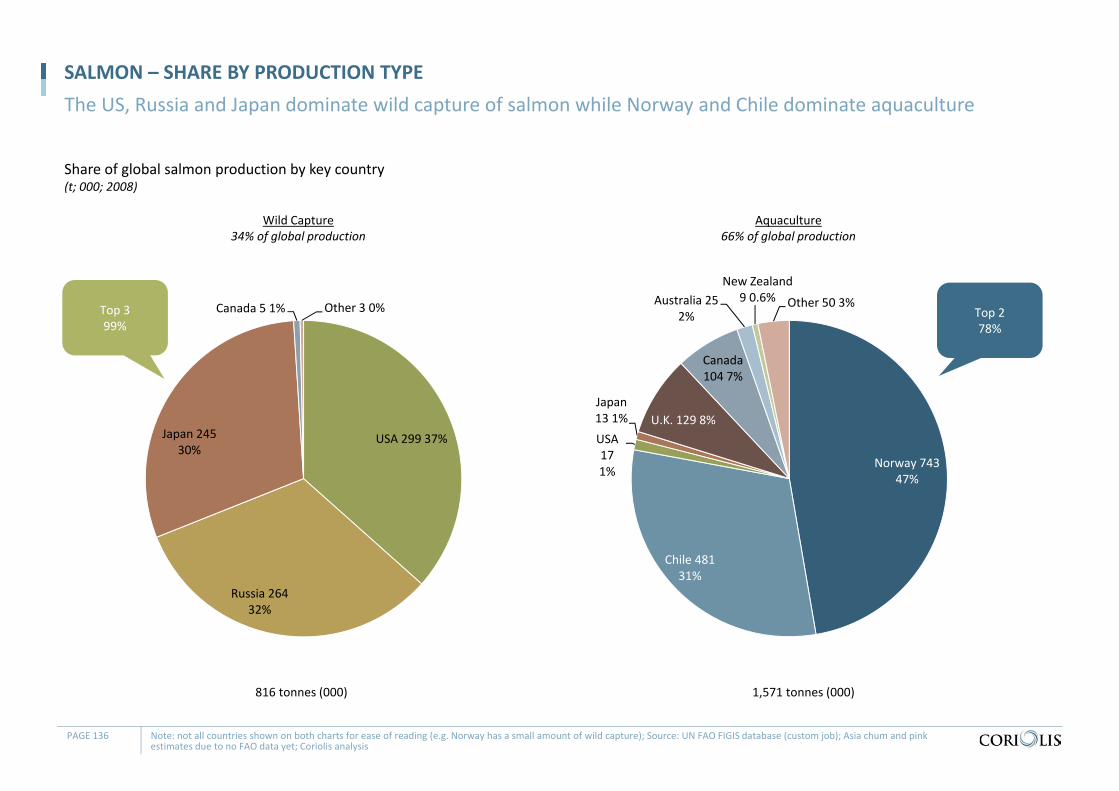
Share of global salmon production by key country(t; 000; 2008)
SALMON – SHARE BY PRODUCTION TYPEThe US, Russia and Japan dominate wild capture of salmon while Norway and Chile dominate aquaculture
PAGE 136 Note: not all countries shown on both charts for ease of reading (e.g. Norway has a small amount of wild capture); Source: UN FAO FIGIS database (custom job); Asia chum and pink estimates due to no FAO data yet; Coriolis analysis
USA 299 37%
Russia 264 32%
Japan 245 30%
Canada 5 1% Other 3 0%
Norway 743 47%
Chile 481 31%
USA 17 1%
Japan 13 1% U.K. 129 8%
Canada 104 7%
Australia 25 2%
New Zealand 9 0.6% Other 50 3%
1,571 tonnes (000)816 tonnes (000)
Aquaculture66% of global production
Wild Capture34% of global production
Top 2 78%
Top 3 99%
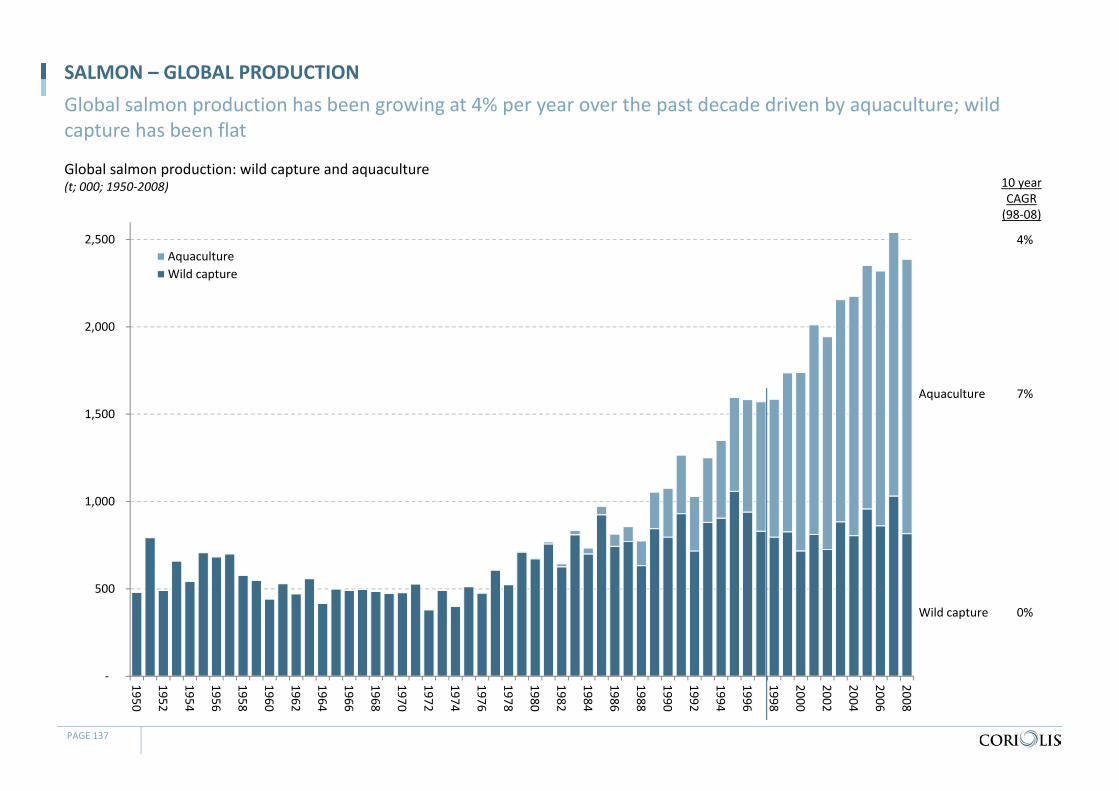
Global salmon production: wild capture and aquaculture(t; 000; 1950‐2008)
SALMON – GLOBAL PRODUCTIONGlobal salmon production has been growing at 4% per year over the past decade driven by aquaculture; wild capture has been flat
PAGE 137
‐
500
1,000
1,500
2,000
2,500
1950
1952
1954
1956
1958
1960
1962
1964
1966
1968
1970
1972
1974
1976
1978
1980
1982
1984
1986
1988
1990
1992
1994
1996
1998
2000
2002
2004
2006
2008
AquacultureWild capture
Wild capture
Aquaculture
0%
7%
10 yearCAGR(98‐08)
4%
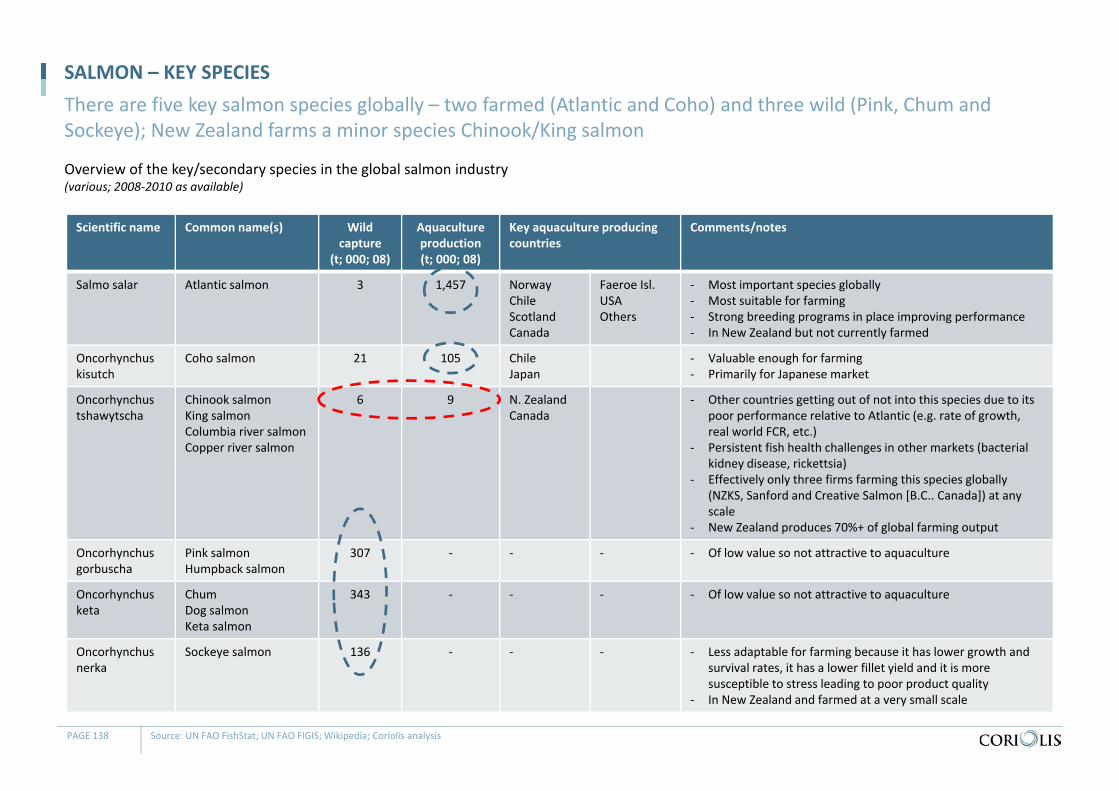
SALMON – KEY SPECIES
Source: UN FAO FishStat; UN FAO FIGIS; Wikipedia; Coriolis analysis
There are five key salmon species globally – two farmed (Atlantic and Coho) and three wild (Pink, Chum and Sockeye); New Zealand farms a minor species Chinook/King salmon
Overview of the key/secondary species in the global salmon industry(various; 2008‐2010 as available)
Scientific name Common name(s) Wild capture
(t; 000; 08)
Aquaculture production(t; 000; 08)
Key aquaculture producing countries
Comments/notes
Salmo salar Atlantic salmon 3 1,457 NorwayChileScotlandCanada
Faeroe Isl.USAOthers
‐ Most important species globally‐ Most suitable for farming‐ Strong breeding programs in place improving performance‐ In New Zealand but not currently farmed
Oncorhynchuskisutch
Coho salmon 21 105 ChileJapan
‐ Valuable enough for farming‐ Primarily for Japanese market
Oncorhynchustshawytscha
Chinook salmonKing salmonColumbia river salmonCopper river salmon
6 9 N. ZealandCanada
‐ Other countries getting out of not into this species due to its poor performance relative to Atlantic (e.g. rate of growth, real world FCR, etc.)
‐ Persistent fish health challenges in other markets (bacterial kidney disease, rickettsia)
‐ Effectively only three firms farming this species globally (NZKS, Sanford and Creative Salmon [B.C.. Canada]) at any scale
‐ New Zealand produces 70%+ of global farming output
Oncorhynchusgorbuscha
Pink salmonHumpback salmon
307 ‐ ‐ ‐ ‐ Of low value so not attractive to aquaculture
Oncorhynchusketa
ChumDog salmonKeta salmon
343 ‐ ‐ ‐ ‐ Of low value so not attractive to aquaculture
Oncorhynchusnerka
Sockeye salmon 136 ‐ ‐ ‐ ‐ Less adaptable for farming because it has lower growth and survival rates, it has a lower fillet yield and it is more susceptible to stress leading to poor product quality
‐ In New Zealand and farmed at a very small scale
PAGE 138
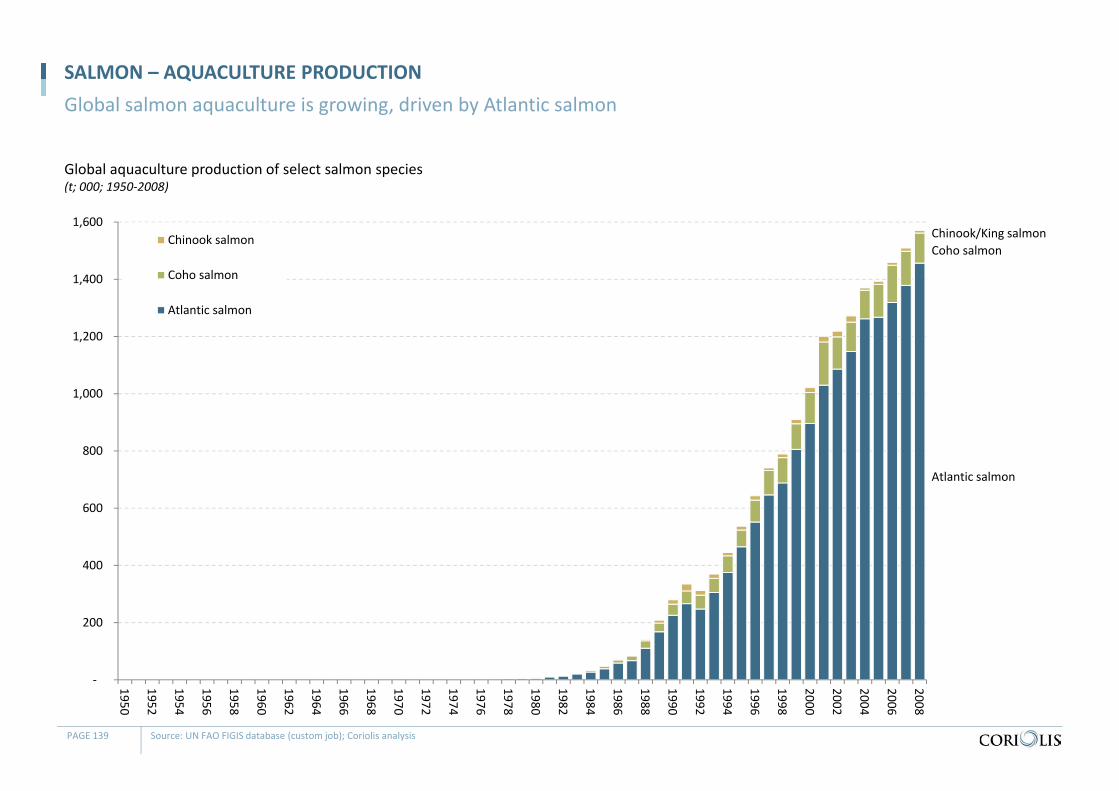
Global aquaculture production of select salmon species(t; 000; 1950‐2008)
SALMON – AQUACULTURE PRODUCTIONGlobal salmon aquaculture is growing, driven by Atlantic salmon
PAGE 139 Source: UN FAO FIGIS database (custom job); Coriolis analysis
‐
200
400
600
800
1,000
1,200
1,400
1,600
1950
1952
1954
1956
1958
1960
1962
1964
1966
1968
1970
1972
1974
1976
1978
1980
1982
1984
1986
1988
1990
1992
1994
1996
1998
2000
2002
2004
2006
2008
Chinook salmon
Coho salmon
Atlantic salmon
Atlantic salmon
Coho salmonChinook/King salmon
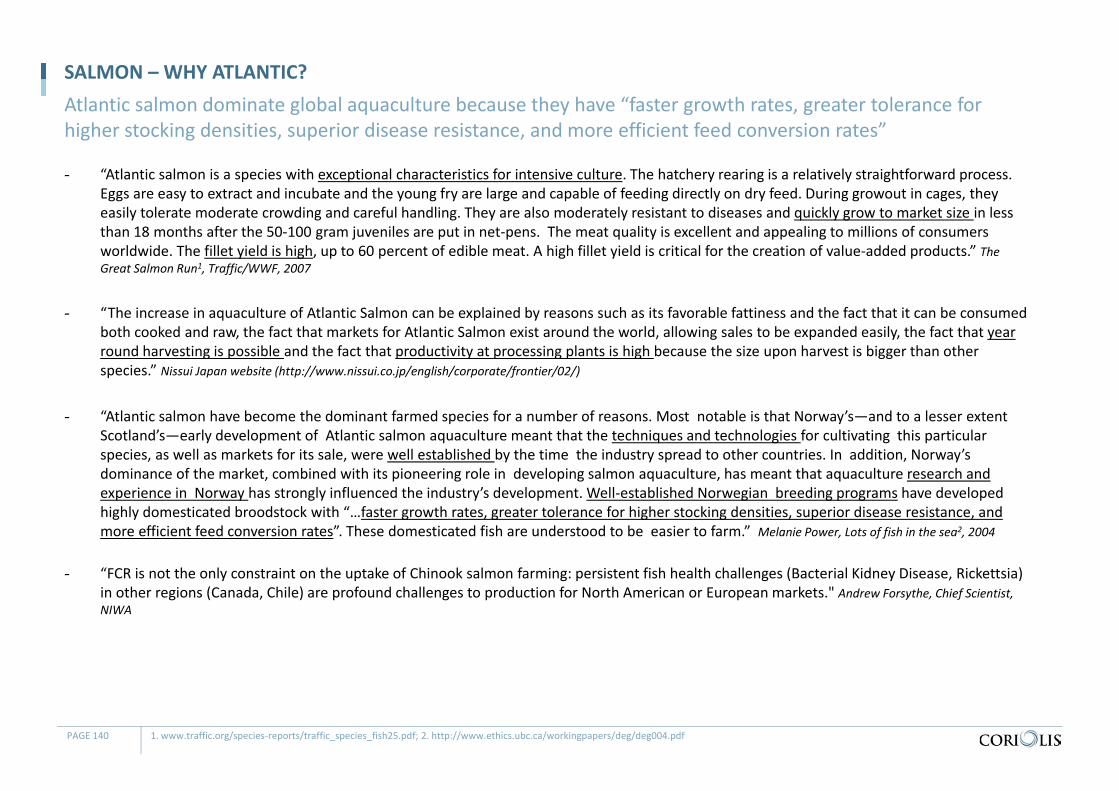
SALMON – WHY ATLANTIC?
- “Atlantic salmon is a species with exceptional characteristics for intensive culture. The hatchery rearing is a relatively straightforward process. Eggs are easy to extract and incubate and the young fry are large and capable of feeding directly on dry feed. During growout in cages, they easily tolerate moderate crowding and careful handling. They are also moderately resistant to diseases and quickly grow to market size in less than 18 months after the 50‐100 gram juveniles are put in net‐pens. The meat quality is excellent and appealing to millions of consumers worldwide. The fillet yield is high, up to 60 percent of edible meat. A high fillet yield is critical for the creation of value‐added products.” The Great Salmon Run1, Traffic/WWF, 2007
- “The increase in aquaculture of Atlantic Salmon can be explained by reasons such as its favorable fattiness and the fact that it can be consumed both cooked and raw, the fact that markets for Atlantic Salmon exist around the world, allowing sales to be expanded easily, the fact that year round harvesting is possible and the fact that productivity at processing plants is high because the size upon harvest is bigger than other species.” Nissui Japan website (http://www.nissui.co.jp/english/corporate/frontier/02/)
- “Atlantic salmon have become the dominant farmed species for a number of reasons. Most notable is that Norway’s—and to a lesser extent Scotland’s—early development of Atlantic salmon aquaculture meant that the techniques and technologies for cultivating this particular species, as well as markets for its sale, were well established by the time the industry spread to other countries. In addition, Norway’s dominance of the market, combined with its pioneering role in developing salmon aquaculture, has meant that aquaculture research and experience in Norway has strongly influenced the industry’s development. Well‐established Norwegian breeding programs have developed highly domesticated broodstock with “…faster growth rates, greater tolerance for higher stocking densities, superior disease resistance, and more efficient feed conversion rates”. These domesticated fish are understood to be easier to farm.” Melanie Power, Lots of fish in the sea2, 2004
- “FCR is not the only constraint on the uptake of Chinook salmon farming: persistent fish health challenges (Bacterial Kidney Disease, Rickettsia) in other regions (Canada, Chile) are profound challenges to production for North American or European markets." Andrew Forsythe, Chief Scientist, NIWA
PAGE 140 1. www.traffic.org/species‐reports/traffic_species_fish25.pdf; 2. http://www.ethics.ubc.ca/workingpapers/deg/deg004.pdf
Atlantic salmon dominate global aquaculture because they have “faster growth rates, greater tolerance for higher stocking densities, superior disease resistance, and more efficient feed conversion rates”
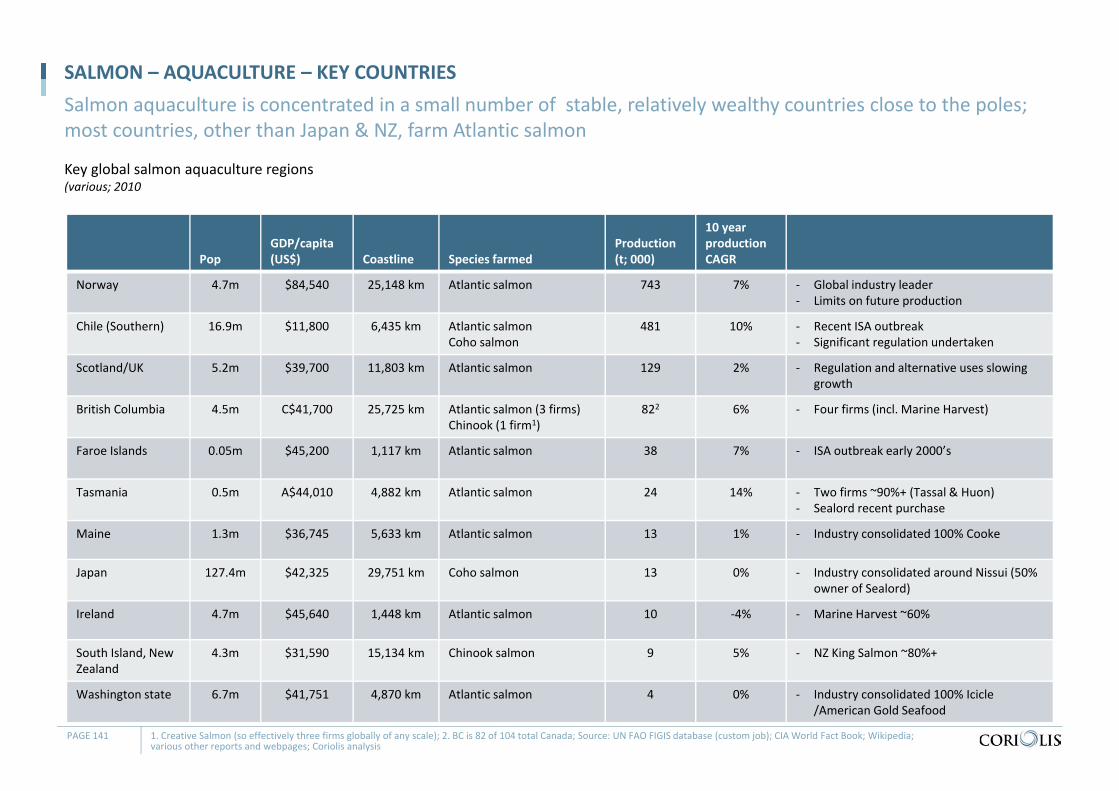
PopGDP/capita(US$) Coastline Species farmed
Production(t; 000)
10 year production CAGR
Norway 4.7m $84,540 25,148 km Atlantic salmon 743 7% ‐ Global industry leader ‐ Limits on future production
Chile (Southern) 16.9m $11,800 6,435 km Atlantic salmonCoho salmon
481 10% ‐ Recent ISA outbreak‐ Significant regulation undertaken
Scotland/UK 5.2m $39,700 11,803 km Atlantic salmon 129 2% ‐ Regulation and alternative uses slowing growth
British Columbia 4.5m C$41,700 25,725 km Atlantic salmon (3 firms)Chinook (1 firm1)
822 6% ‐ Four firms (incl. Marine Harvest)
Faroe Islands 0.05m $45,200 1,117 km Atlantic salmon 38 7% ‐ ISA outbreak early 2000’s
Tasmania 0.5m A$44,010 4,882 km Atlantic salmon 24 14% ‐ Two firms ~90%+ (Tassal & Huon)‐ Sealord recent purchase
Maine 1.3m $36,745 5,633 km Atlantic salmon 13 1% ‐ Industry consolidated 100% Cooke
Japan 127.4m $42,325 29,751 km Coho salmon 13 0% ‐ Industry consolidated around Nissui (50% owner of Sealord)
Ireland 4.7m $45,640 1,448 km Atlantic salmon 10 ‐4% ‐ Marine Harvest ~60%
South Island, New Zealand
4.3m $31,590 15,134 km Chinook salmon 9 5% ‐ NZ King Salmon ~80%+
Washington state 6.7m $41,751 4,870 km Atlantic salmon 4 0% ‐ Industry consolidated 100% Icicle /American Gold Seafood
Key global salmon aquaculture regions(various; 2010
SALMON – AQUACULTURE – KEY COUNTRIESSalmon aquaculture is concentrated in a small number of stable, relatively wealthy countries close to the poles; most countries, other than Japan & NZ, farm Atlantic salmon
PAGE 141 1. Creative Salmon (so effectively three firms globally of any scale); 2. BC is 82 of 104 total Canada; Source: UN FAO FIGIS database (custom job); CIA World Fact Book; Wikipedia; various other reports and webpages; Coriolis analysis
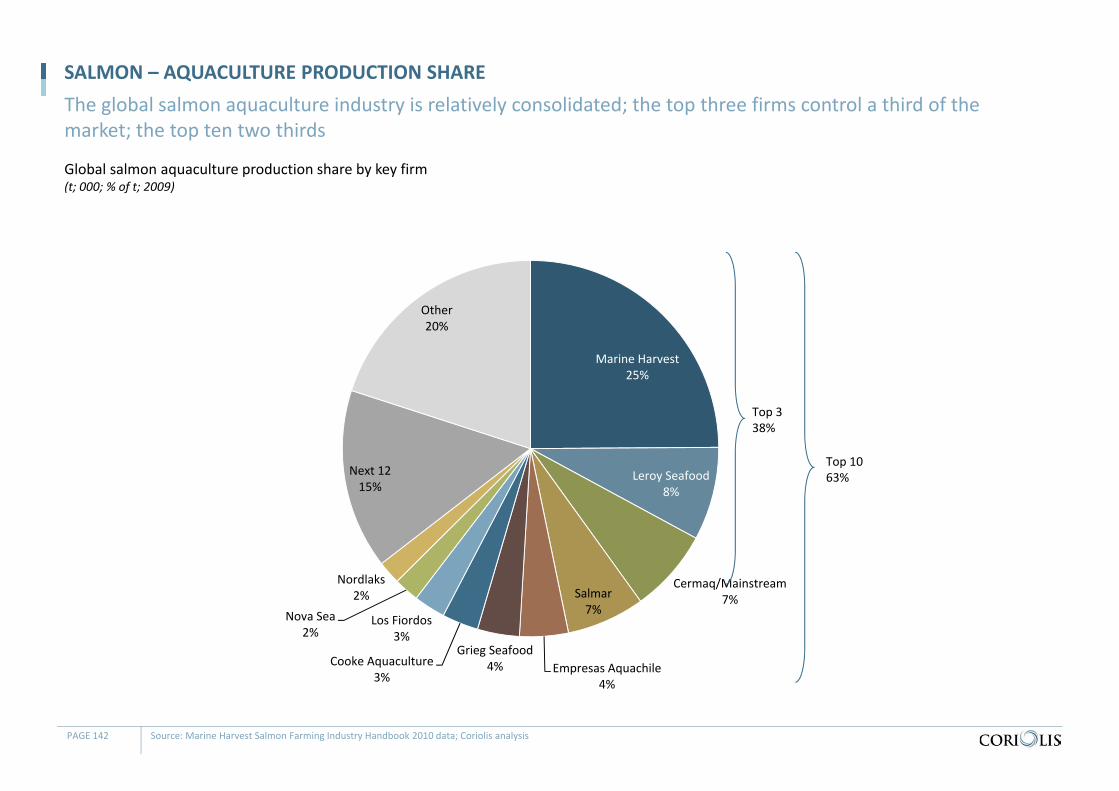
Global salmon aquaculture production share by key firm(t; 000; % of t; 2009)
SALMON – AQUACULTURE PRODUCTION SHAREThe global salmon aquaculture industry is relatively consolidated; the top three firms control a third of the market; the top ten two thirds
PAGE 142 Source: Marine Harvest Salmon Farming Industry Handbook 2010 data; Coriolis analysis
Marine Harvest25%
Leroy Seafood8%
Cermaq/Mainstream7%Salmar
7%
Empresas Aquachile4%
Grieg Seafood4%Cooke Aquaculture
3%
Los Fiordos3%
Nova Sea2%
Nordlaks2%
Next 1215%
Other20%
Top 338%
Top 1063%
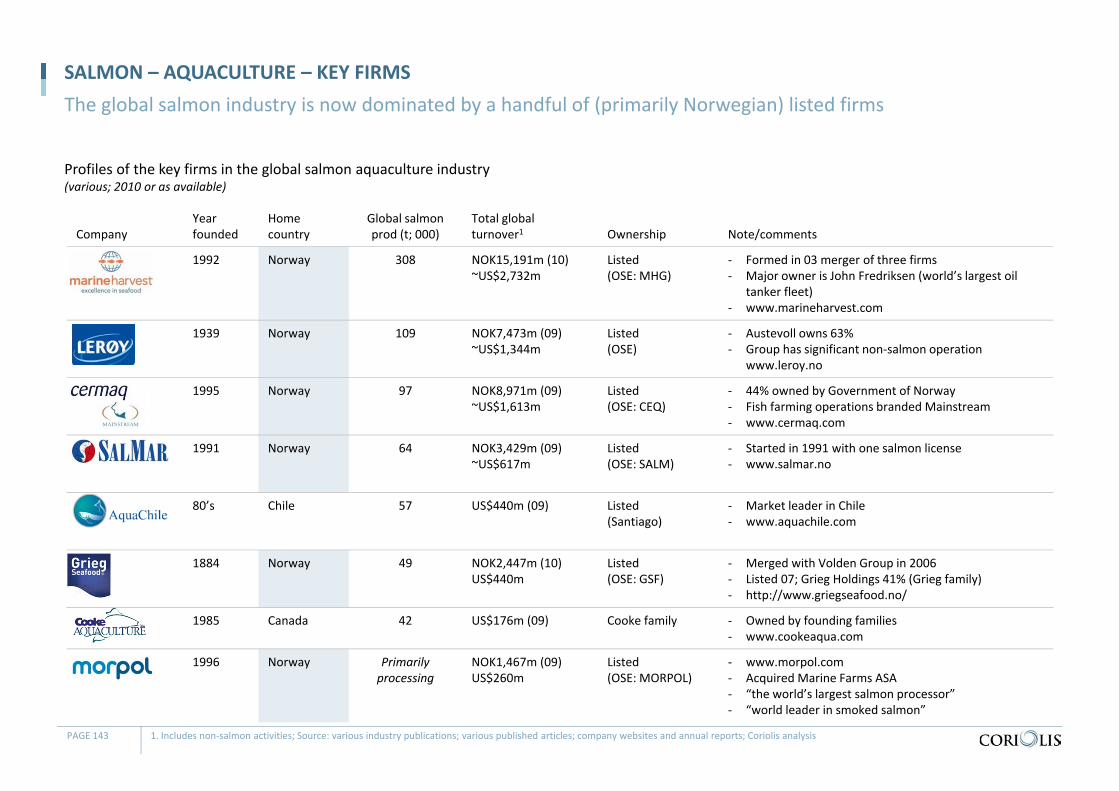
CompanyYear founded
Home country
Global salmon prod (t; 000)
Total global turnover1 Ownership Note/comments
1992 Norway 308 NOK15,191m (10)~US$2,732m
Listed (OSE: MHG)
‐ Formed in 03 merger of three firms‐ Major owner is John Fredriksen (world’s largest oil
tanker fleet)‐ www.marineharvest.com
1939 Norway 109 NOK7,473m (09)~US$1,344m
Listed (OSE)
‐ Austevoll owns 63%‐ Group has significant non‐salmon operation
www.leroy.no
1995 Norway 97 NOK8,971m (09)~US$1,613m
Listed (OSE: CEQ)
‐ 44% owned by Government of Norway‐ Fish farming operations branded Mainstream‐ www.cermaq.com
1991 Norway 64 NOK3,429m (09)~US$617m
Listed(OSE: SALM)
‐ Started in 1991 with one salmon license‐ www.salmar.no
80’s Chile 57 US$440m (09) Listed(Santiago)
‐ Market leader in Chile‐ www.aquachile.com
1884 Norway 49 NOK2,447m (10)US$440m
Listed(OSE: GSF)
‐ Merged with Volden Group in 2006‐ Listed 07; Grieg Holdings 41% (Grieg family)‐ http://www.griegseafood.no/
1985 Canada 42 US$176m (09) Cooke family ‐ Owned by founding families‐ www.cookeaqua.com
1996 Norway Primarily processing
NOK1,467m (09)US$260m
Listed(OSE: MORPOL)
‐ www.morpol.com‐ Acquired Marine Farms ASA‐ “the world’s largest salmon processor”‐ “world leader in smoked salmon”
Profiles of the key firms in the global salmon aquaculture industry(various; 2010 or as available)
SALMON – AQUACULTURE – KEY FIRMSThe global salmon industry is now dominated by a handful of (primarily Norwegian) listed firms
PAGE 143 1. Includes non‐salmon activities; Source: various industry publications; various published articles; company websites and annual reports; Coriolis analysis
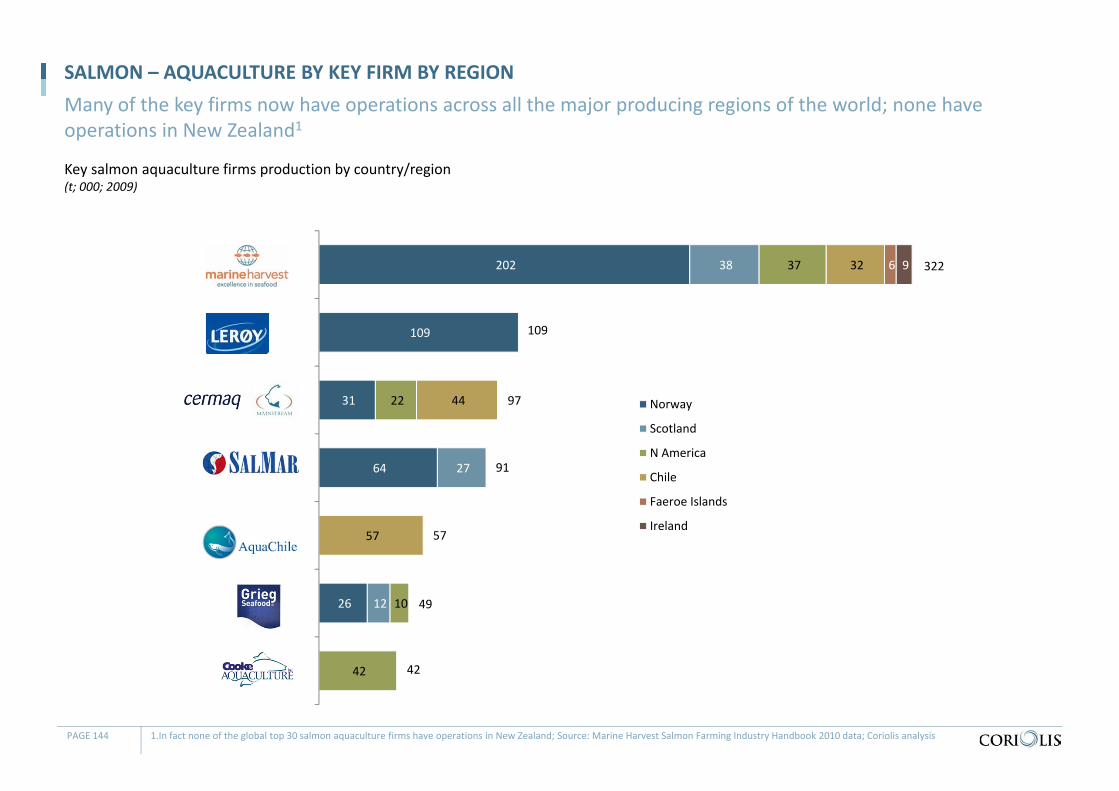
Key salmon aquaculture firms production by country/region(t; 000; 2009)
SALMON – AQUACULTURE BY KEY FIRM BY REGIONMany of the key firms now have operations across all the major producing regions of the world; none have operations in New Zealand1
PAGE 144 1.In fact none of the global top 30 salmon aquaculture firms have operations in New Zealand; Source: Marine Harvest Salmon Farming Industry Handbook 2010 data; Coriolis analysis
202
109
31
64
26
38
27
12
37
22
10
42
32
44
57
6 9
Norway
Scotland
N America
Chile
Faeroe Islands
Ireland
322
109
97
91
57
49
42
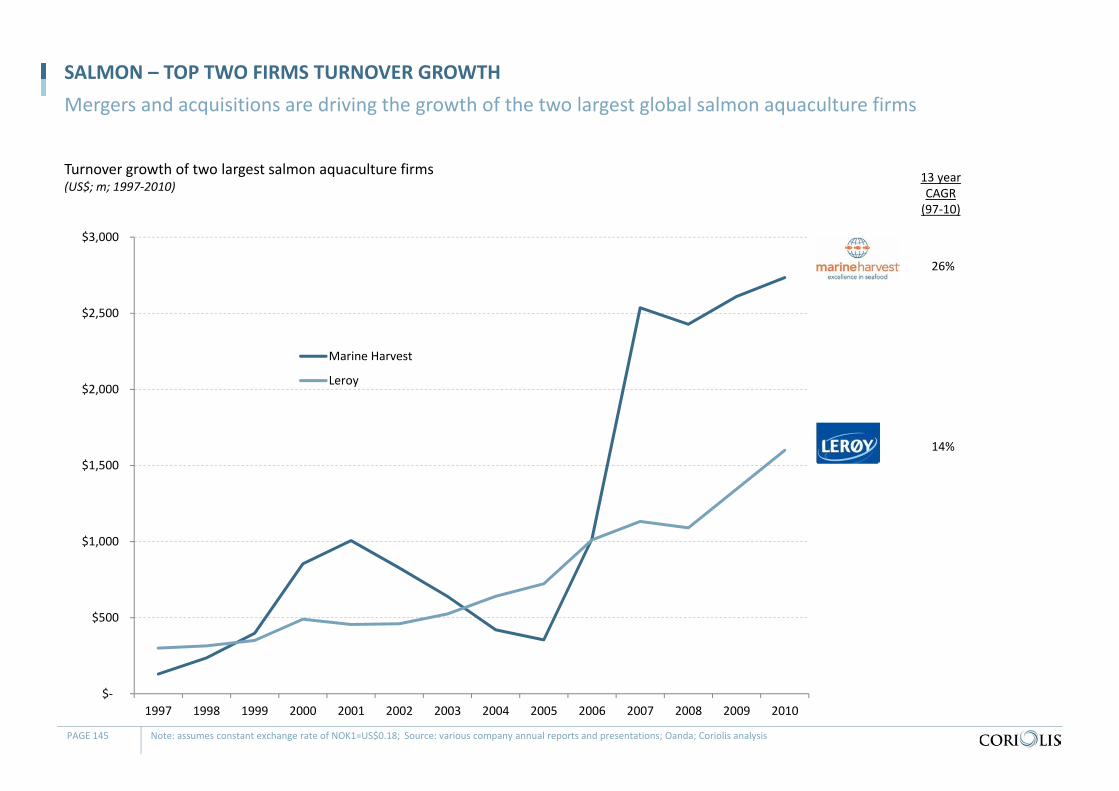
Turnover growth of two largest salmon aquaculture firms(US$; m; 1997‐2010)
SALMON – TOP TWO FIRMS TURNOVER GROWTHMergers and acquisitions are driving the growth of the two largest global salmon aquaculture firms
PAGE 145 Note: assumes constant exchange rate of NOK1=US$0.18; Source: various company annual reports and presentations; Oanda; Coriolis analysis
$‐
$500
$1,000
$1,500
$2,000
$2,500
$3,000
1997 1998 1999 2000 2001 2002 2003 2004 2005 2006 2007 2008 2009 2010
Marine Harvest
Leroy
26%
14%
13 yearCAGR(97‐10)
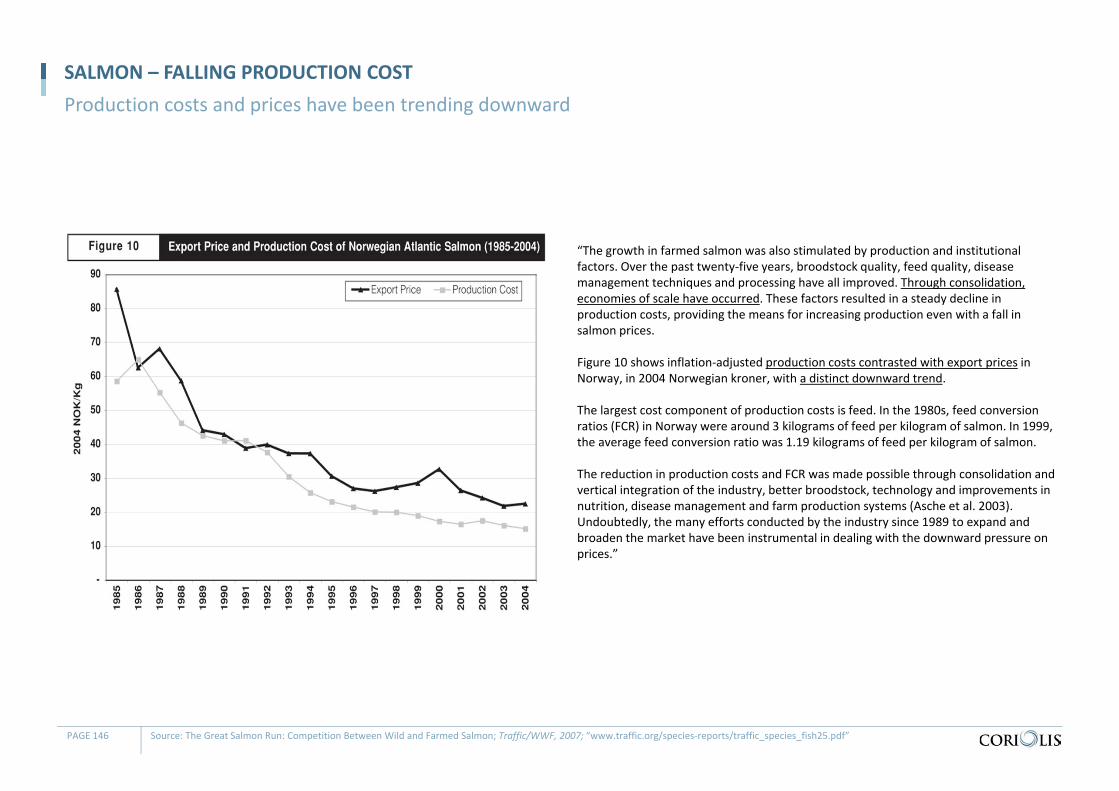
SALMON – FALLING PRODUCTION COSTProduction costs and prices have been trending downward
PAGE 146 Source: The Great Salmon Run: Competition Between Wild and Farmed Salmon; Traffic/WWF, 2007; “www.traffic.org/species‐reports/traffic_species_fish25.pdf”
“The growth in farmed salmon was also stimulated by production and institutional factors. Over the past twenty‐five years, broodstock quality, feed quality, disease management techniques and processing have all improved. Through consolidation, economies of scale have occurred. These factors resulted in a steady decline in production costs, providing the means for increasing production even with a fall in salmon prices.
Figure 10 shows inflation‐adjusted production costs contrasted with export prices in Norway, in 2004 Norwegian kroner, with a distinct downward trend.
The largest cost component of production costs is feed. In the 1980s, feed conversion ratios (FCR) in Norway were around 3 kilograms of feed per kilogram of salmon. In 1999, the average feed conversion ratio was 1.19 kilograms of feed per kilogram of salmon.
The reduction in production costs and FCR was made possible through consolidation and vertical integration of the industry, better broodstock, technology and improvements in nutrition, disease management and farm production systems (Asche et al. 2003). Undoubtedly, the many efforts conducted by the industry since 1989 to expand and broaden the market have been instrumental in dealing with the downward pressure on prices.”
SALMON – FURTHER CONSOLIDATION
- “Consolidation is on the cards. Smaller salmon farmers will use the opportunity now to sell some of their licenses to the bigger players.” Roar Husby, Chief Financial Officer, SalMar, Nov 2010
- “Marine Harvest can expand its existing business in Norway over the next two years… and then we will need to make acquisitions. The company is concentrating on fish‐health issues in Chile… In Scotland, the industry is fairly consolidated already, and in Canada, there are only three players.” Alf‐Helge Aarskog, Chief Executive Officer, Marine Harvest, Nov 2010
- “We could see both a lot of bolt‐on or add‐on acquisitions, but we also see the potential for several larger acquisitions.” Mikael Clement, analyst, Pareto Securities, Nov 2010
- “Grieg Seafood is well positioned for consolidation whether as a target or a purchaser.” Morten Vike, CEO, Grieg Seafood, Nov 2010
PAGE 147
There are expectation of further consolidation ahead
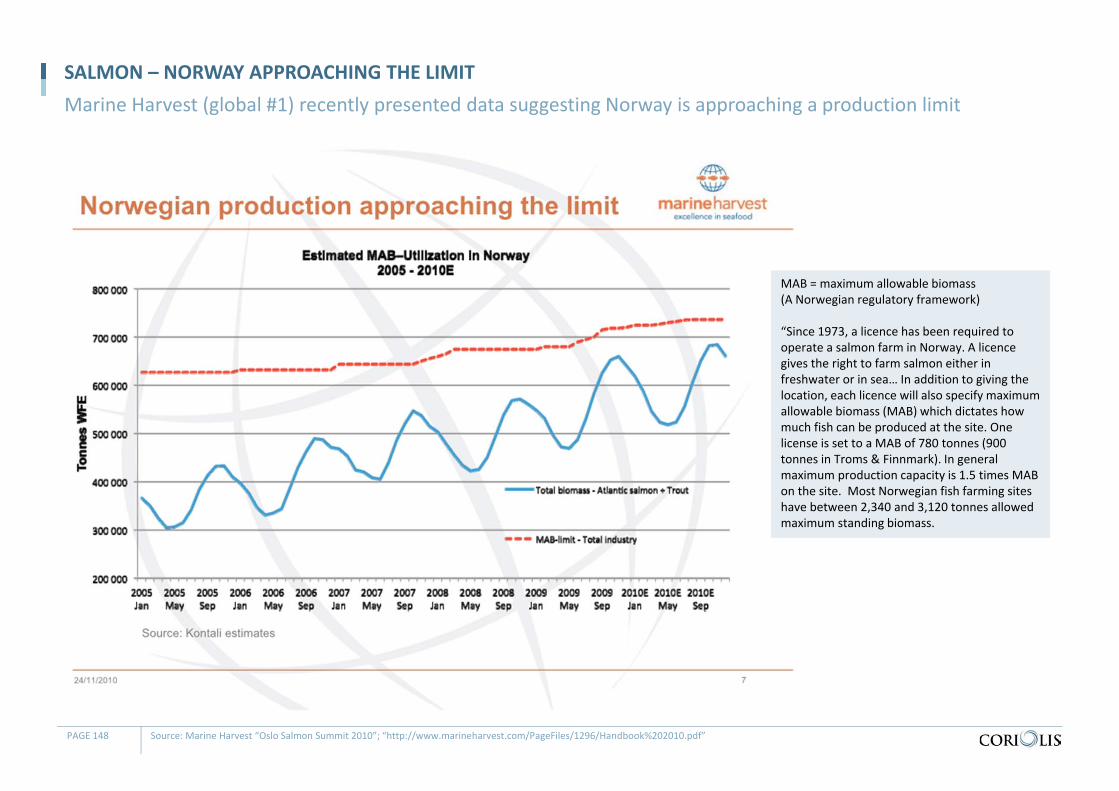
SALMON – NORWAY APPROACHING THE LIMITMarine Harvest (global #1) recently presented data suggesting Norway is approaching a production limit
PAGE 148 Source: Marine Harvest “Oslo Salmon Summit 2010”; “http://www.marineharvest.com/PageFiles/1296/Handbook%202010.pdf”
MAB = maximum allowable biomass(A Norwegian regulatory framework)
“Since 1973, a licence has been required to operate a salmon farm in Norway. A licence gives the right to farm salmon either in freshwater or in sea… In addition to giving the location, each licence will also specify maximum allowable biomass (MAB) which dictates how much fish can be produced at the site. One license is set to a MAB of 780 tonnes (900 tonnes in Troms & Finnmark). In general maximum production capacity is 1.5 times MAB on the site. Most Norwegian fish farming sites have between 2,340 and 3,120 tonnes allowed maximum standing biomass.
SALMON – DISEASE OUTBREAK IN CHILE
- “A deadly fish virus and scarce credit have clobbered the salmon sector in Chile, the world's No. 2 producer… Chile exported a record 445,000 tonnes of salmon and trout in 2008, worth just under $2.4 billion, up sharply from 2007 levels of 397,000 tonnes as salmon farmers harvested fish early to avoid ISA, which is like a deadly flu or cold for the most common Salar species, or Atlantic salmon. But Chile's leading industry association, SalmonChile, expects output to fall around 30 percent in 2009 to around 320,000 tonnes because early harvesting will mean production gaps this year and sees similar output levels in 2010. It expects to see a recovery in 2011.” Reuters Mar 2009
- “When a devastating virus swept through Chile’s farmed salmon stocks last year, some of the industry’s biggest players laid off thousands of workers, packed up operations and moved to unspoiled waters farther south along the Chilean coast. But the virus went with them. Last month, the Chilean government began hashing out tougher measures to improve the sanitary and environmental conditions of the troubled industry. But producers expect still deeper losses this year, as the virus continues to kill millions of fish slated for export to the United States and other countries. Government and industry officials say they have already taken important steps to improve the ways salmon are farmed. But the persistent problems, critics say, reveal that neither the industry nor the government has fully grasped the need for the far‐reaching changes required to protect not only consumers and the environment, but also one of Chile’s most important industries from itself. They are not the only ones concerned. In the midst of the virus crisis, Chile has continued to raise salmon for export with chemicals and medications not approved for use in the United States and Europe, according to documents from regulators.” New York Times, Feb 2009
- “Salmon prices are jumping after a sharp decline in global supply following the collapse of the Chilean industry following an outbreak of a fish disease.” Financial Times, Feb 2010
PAGE 149
An outbreak of ISA in Chile has “clobbered” its industry and increased world salmon prices
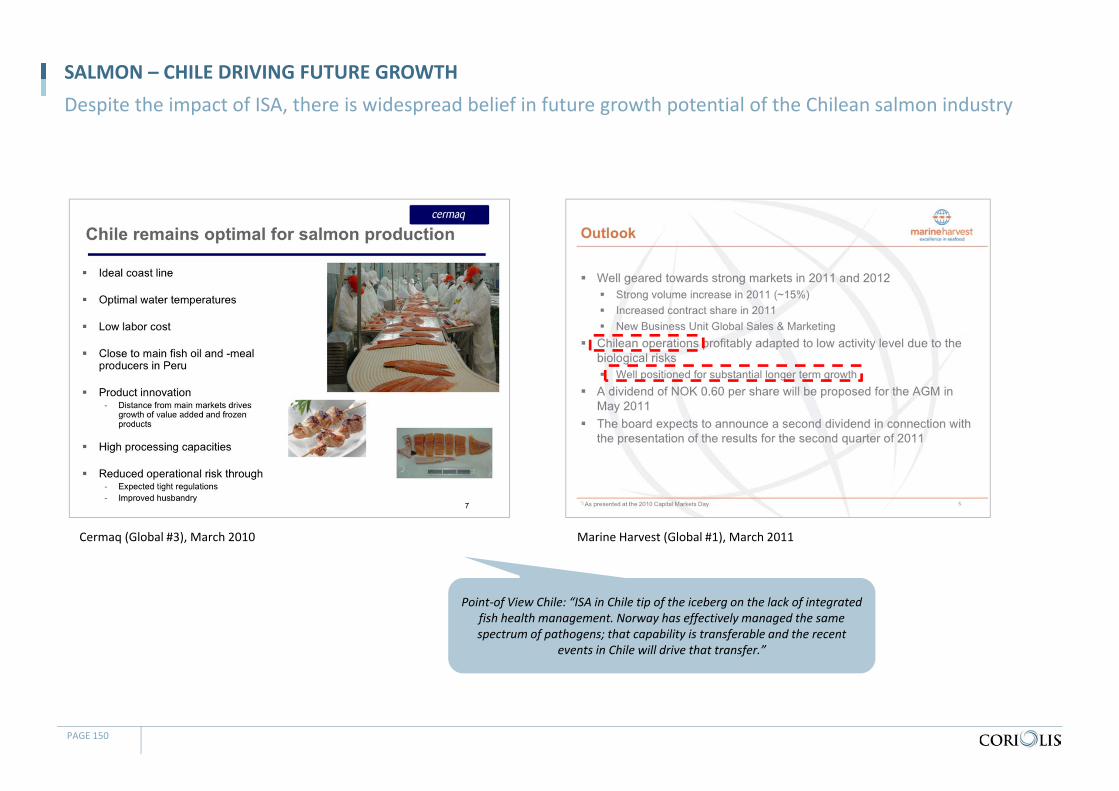
SALMON – CHILE DRIVING FUTURE GROWTH
PAGE 150
Despite the impact of ISA, there is widespread belief in future growth potential of the Chilean salmon industry
Cermaq (Global #3), March 2010 Marine Harvest (Global #1), March 2011
Point‐of View Chile: “ISA in Chile tip of the iceberg on the lack of integrated fish health management. Norway has effectively managed the same spectrum of pathogens; that capability is transferable and the recent
events in Chile will drive that transfer.”
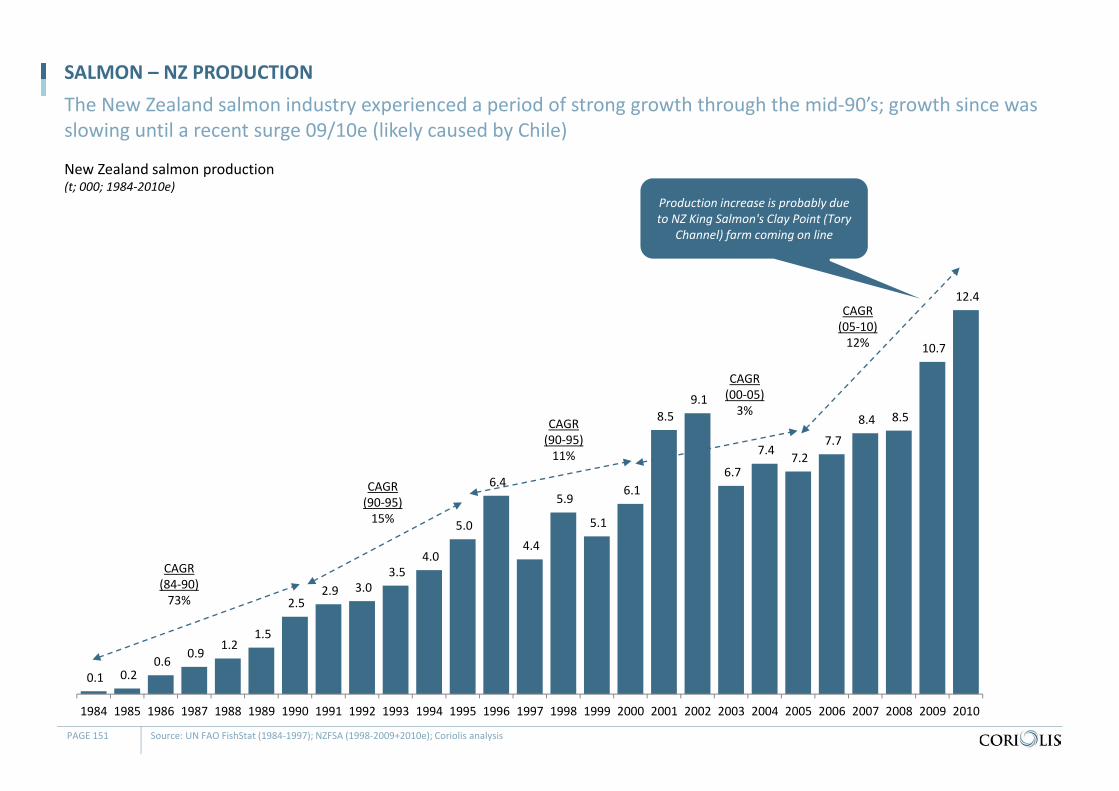
New Zealand salmon production(t; 000; 1984‐2010e)
SALMON – NZ PRODUCTIONThe New Zealand salmon industry experienced a period of strong growth through the mid‐90’s; growth since was slowing until a recent surge 09/10e (likely caused by Chile)
PAGE 151 Source: UN FAO FishStat (1984‐1997); NZFSA (1998‐2009+2010e); Coriolis analysis
0.1 0.2 0.6 0.9
1.2 1.5
2.5 2.9 3.0
3.5 4.0
5.0
6.4
4.4
5.9
5.1
6.1
8.5 9.1
6.7
7.4 7.2 7.7
8.4 8.5
10.7
12.4
1984 1985 1986 1987 1988 1989 1990 1991 1992 1993 1994 1995 1996 1997 1998 1999 2000 2001 2002 2003 2004 2005 2006 2007 2008 2009 2010
CAGR(84‐90)73%
CAGR(90‐95)15%
CAGR(90‐95)11%
CAGR(00‐05)3%
CAGR(05‐10)12%
Production increase is probably due to NZ King Salmon's Clay Point (Tory
Channel) farm coming on line
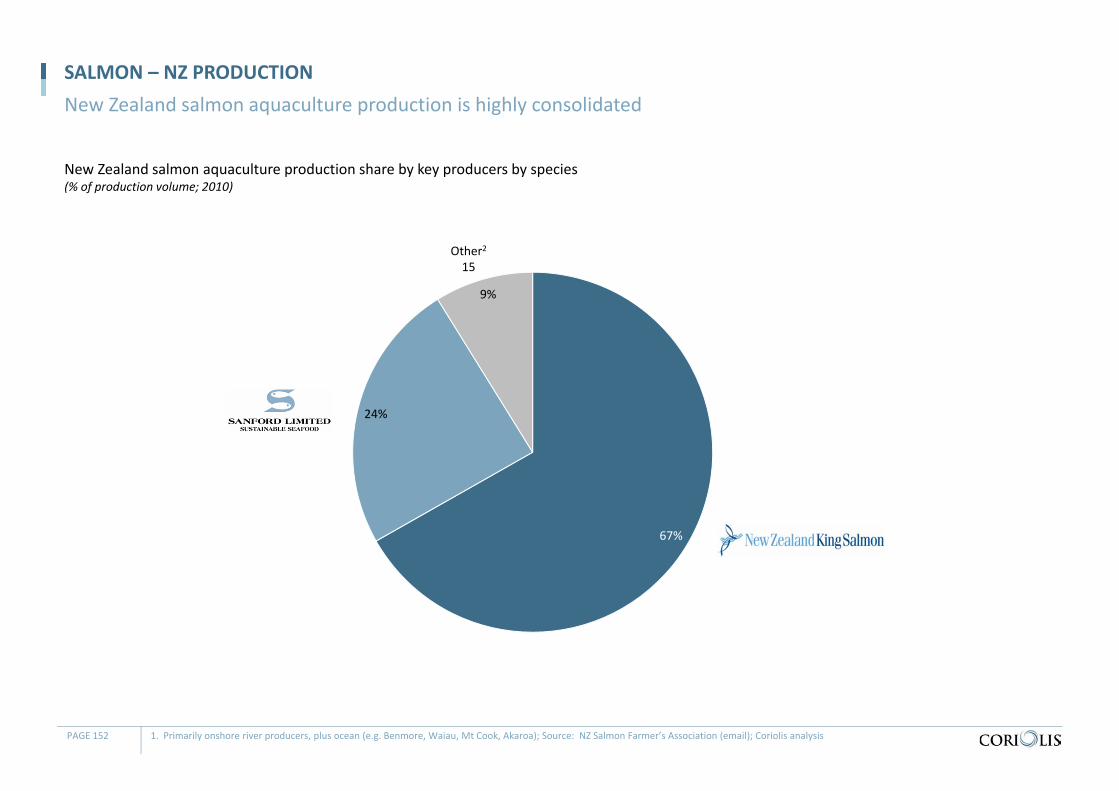
New Zealand salmon aquaculture production share by key producers by species(% of production volume; 2010)
SALMON – NZ PRODUCTIONNew Zealand salmon aquaculture production is highly consolidated
PAGE 152 1. Primarily onshore river producers, plus ocean (e.g. Benmore, Waiau, Mt Cook, Akaroa); Source: NZ Salmon Farmer’s Association (email); Coriolis analysis
67%
24%
9%
Other215
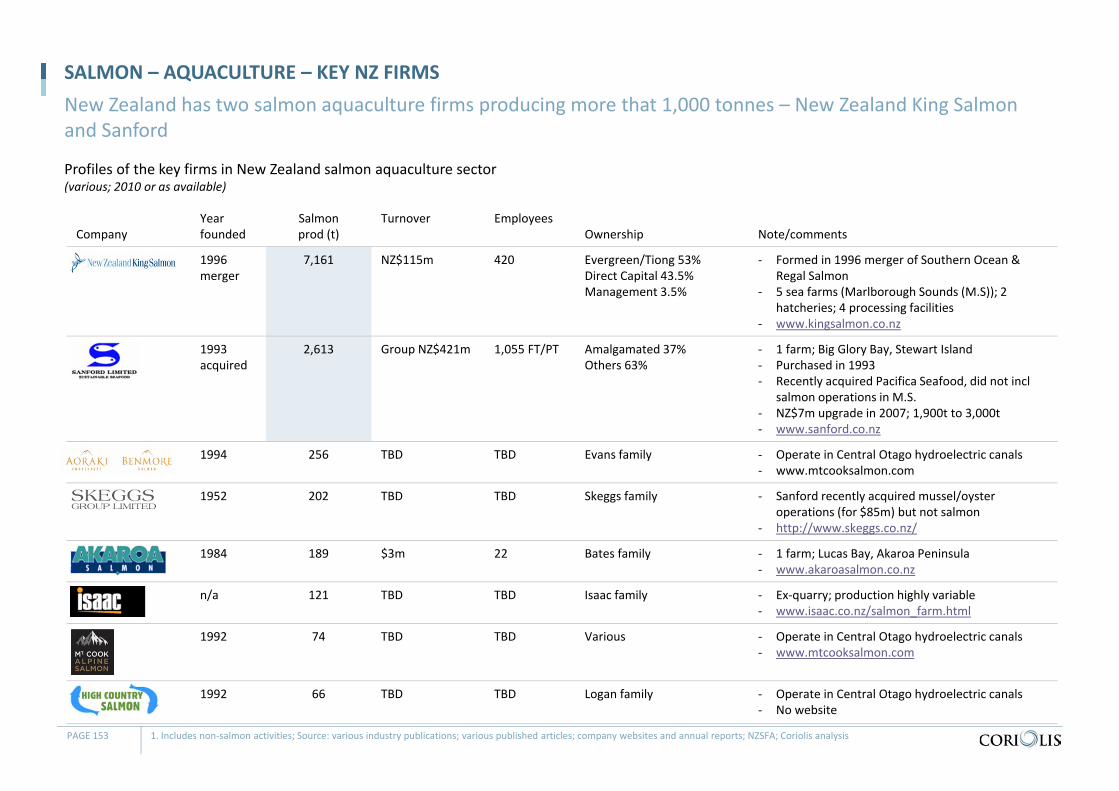
CompanyYear founded
Salmon prod (t)
Turnover EmployeesOwnership Note/comments
1996 merger
7,161 NZ$115m 420 Evergreen/Tiong 53%Direct Capital 43.5%Management 3.5%
‐ Formed in 1996 merger of Southern Ocean & Regal Salmon
‐ 5 sea farms (Marlborough Sounds (M.S)); 2 hatcheries; 4 processing facilities
‐ www.kingsalmon.co.nz
1993 acquired
2,613 Group NZ$421m 1,055 FT/PT Amalgamated 37%Others 63%
‐ 1 farm; Big Glory Bay, Stewart Island‐ Purchased in 1993‐ Recently acquired Pacifica Seafood, did not incl
salmon operations in M.S.‐ NZ$7m upgrade in 2007; 1,900t to 3,000t‐ www.sanford.co.nz
1994 256 TBD TBD Evans family ‐ Operate in Central Otago hydroelectric canals‐ www.mtcooksalmon.com
1952 202 TBD TBD Skeggs family ‐ Sanford recently acquired mussel/oyster operations (for $85m) but not salmon
‐ http://www.skeggs.co.nz/
1984 189 $3m 22 Bates family ‐ 1 farm; Lucas Bay, Akaroa Peninsula‐ www.akaroasalmon.co.nz
n/a 121 TBD TBD Isaac family ‐ Ex‐quarry; production highly variable‐ www.isaac.co.nz/salmon_farm.html
1992 74 TBD TBD Various ‐ Operate in Central Otago hydroelectric canals‐ www.mtcooksalmon.com
1992 66 TBD TBD Logan family ‐ Operate in Central Otago hydroelectric canals‐ No website
Profiles of the key firms in New Zealand salmon aquaculture sector(various; 2010 or as available)
SALMON – AQUACULTURE – KEY NZ FIRMSNew Zealand has two salmon aquaculture firms producing more that 1,000 tonnes – New Zealand King Salmon and Sanford
PAGE 153 1. Includes non‐salmon activities; Source: various industry publications; various published articles; company websites and annual reports; NZSFA; Coriolis analysis
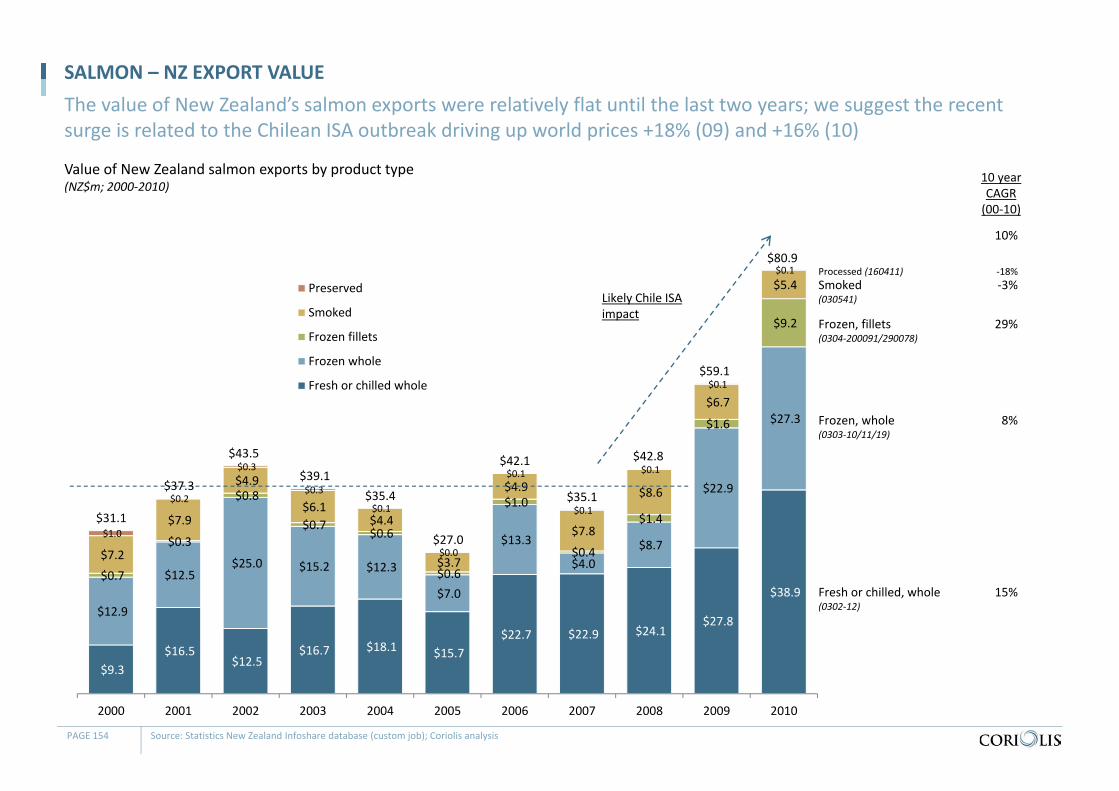
Value of New Zealand salmon exports by product type(NZ$m; 2000‐2010)
SALMON – NZ EXPORT VALUEThe value of New Zealand’s salmon exports were relatively flat until the last two years; we suggest the recent surge is related to the Chilean ISA outbreak driving up world prices +18% (09) and +16% (10)
PAGE 154 Source: Statistics New Zealand Infoshare database (custom job); Coriolis analysis
$9.3 $16.5
$12.5 $16.7 $18.1 $15.7
$22.7 $22.9 $24.1 $27.8
$38.9 $12.9
$12.5 $25.0 $15.2 $12.3
$7.0
$13.3
$4.0 $8.7
$22.9
$27.3
$0.7
$0.3
$0.8
$0.7 $0.6
$0.6
$1.0
$0.4
$1.4
$1.6
$9.2
$7.2
$7.9
$4.9
$6.1 $4.4
$3.7
$4.9
$7.8
$8.6
$6.7
$5.4
$1.0
$0.2
$0.3
$0.3
$0.1
$0.0
$0.1
$0.1
$0.1
$0.1
$0.1
2000 2001 2002 2003 2004 2005 2006 2007 2008 2009 2010
Preserved
Smoked
Frozen fillets
Frozen whole
Fresh or chilled whole
‐18%
15%
10 yearCAGR(00‐10)
Fresh or chilled, whole(0302‐12)
8%Frozen, whole(0303‐10/11/19)
29%Frozen, fillets(0304‐200091/290078)
Smoked(030541)
Processed (160411)‐3%
10%
$31.1
$37.3
$43.5
$39.1$35.4
$27.0
$42.1
$35.1
$42.8
$59.1
$80.9
Likely Chile ISA impact
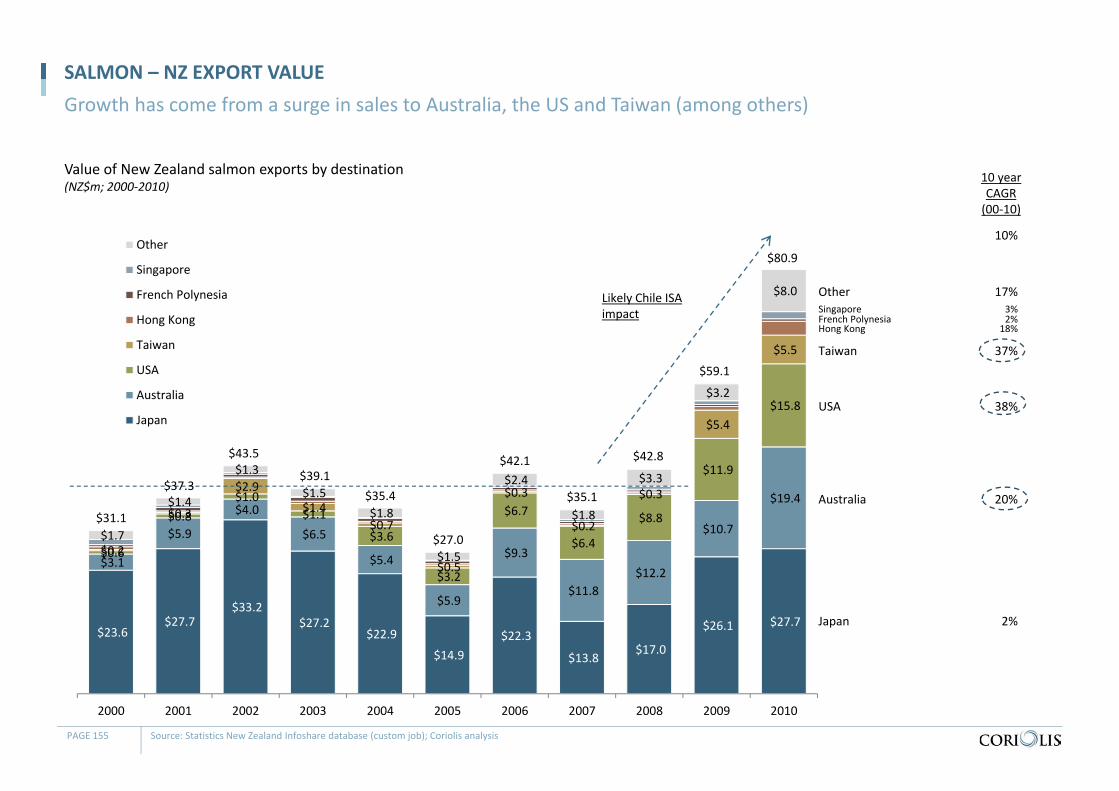
Value of New Zealand salmon exports by destination(NZ$m; 2000‐2010)
SALMON – NZ EXPORT VALUEGrowth has come from a surge in sales to Australia, the US and Taiwan (among others)
PAGE 155 Source: Statistics New Zealand Infoshare database (custom job); Coriolis analysis
$23.6 $27.7
$33.2 $27.2
$22.9
$14.9 $22.3
$13.8 $17.0
$26.1 $27.7
$3.1
$5.9
$4.0
$6.5
$5.4
$5.9
$9.3
$11.8 $12.2
$10.7
$19.4
$0.6
$0.8 $1.0
$1.1
$3.6
$3.2
$6.7
$6.4
$8.8
$11.9
$15.8
$0.2
$0.3
$2.9
$1.4 $0.7
$0.5
$0.3
$0.2
$0.3
$5.4
$5.5
$1.7
$1.4
$1.3
$1.5 $1.8
$1.5
$2.4
$1.8
$3.3
$3.2
$8.0
2000 2001 2002 2003 2004 2005 2006 2007 2008 2009 2010
Other
Singapore
French Polynesia
Hong Kong
Taiwan
USA
Australia
Japan
18%
2%
10 yearCAGR(00‐10)
Japan
20%Australia
38%USA
Taiwan
Hong Kong
37%
10%
$31.1
$37.3
$43.5
$39.1$35.4
$27.0
$42.1
$35.1
$42.8
$59.1
$80.9
2%French Polynesia3%Singapore
17%OtherLikely Chile ISA impact
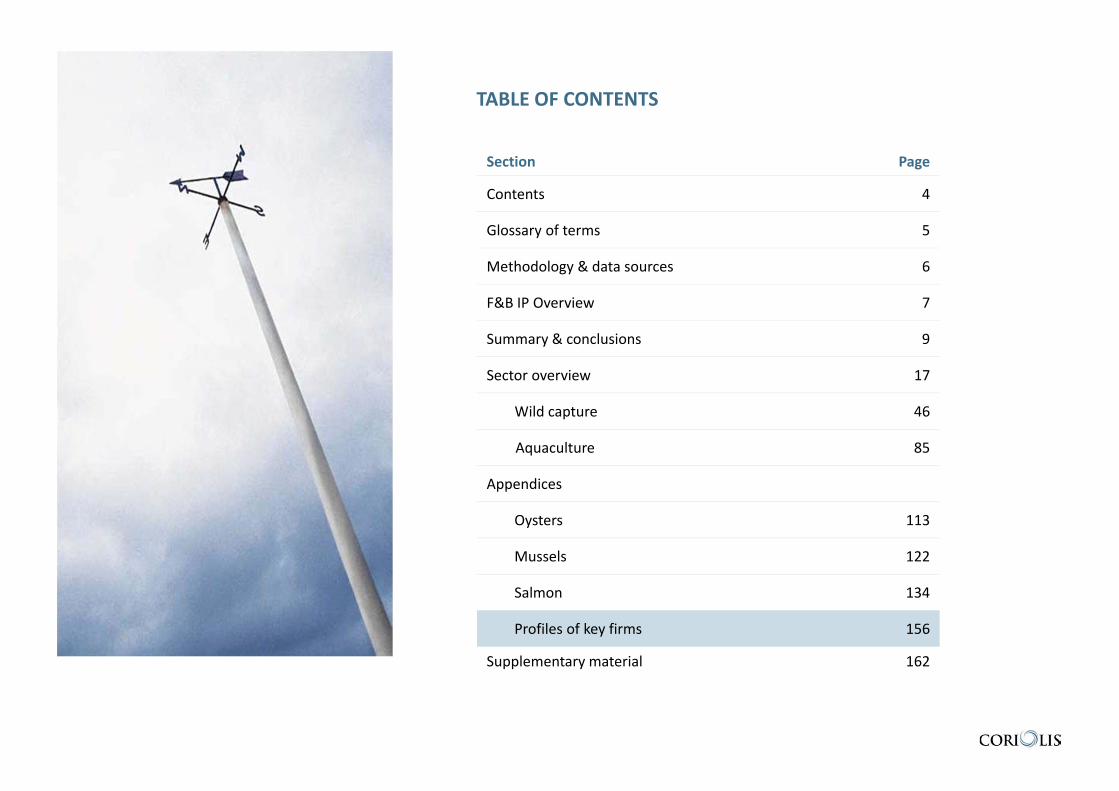
TABLE OF CONTENTS
Section Page
Contents 4
Glossary of terms 5
Methodology & data sources 6
F&B IP Overview 7
Summary & conclusions 9
Sector overview 17
Wild capture 46
Aquaculture 85
Appendices
Oysters 113
Mussels 122
Salmon 134
Profiles of key firms 156
Supplementary material 162
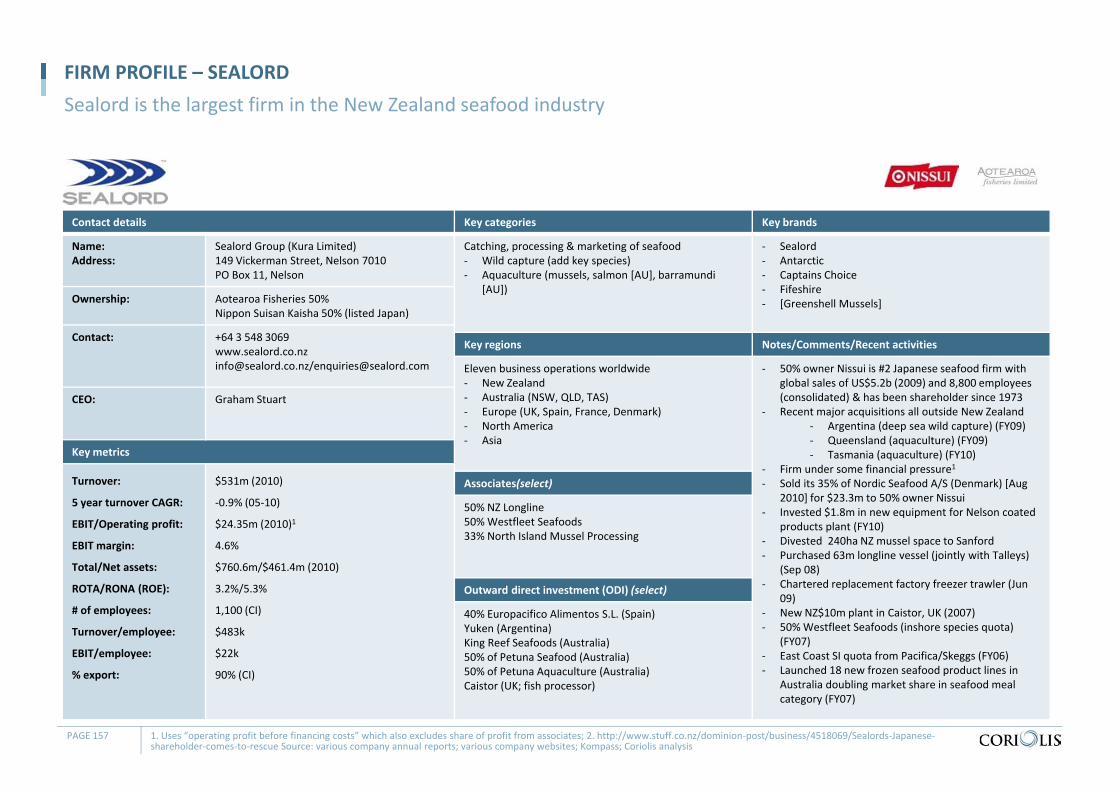
Contact details Key categories Key brands
Name:Address:
Sealord Group (Kura Limited)149 Vickerman Street, Nelson 7010PO Box 11, Nelson
Catching, processing & marketing of seafood‐ Wild capture (add key species)‐ Aquaculture (mussels, salmon [AU], barramundi
[AU])
‐ Sealord‐ Antarctic‐ Captains Choice‐ Fifeshire‐ [Greenshell Mussels]Ownership: Aotearoa Fisheries 50%
Nippon Suisan Kaisha 50% (listed Japan)
Contact: +64 3 548 [email protected]/[email protected]
Key regions Notes/Comments/Recent activities
Eleven business operations worldwide‐ New Zealand‐ Australia (NSW, QLD, TAS)‐ Europe (UK, Spain, France, Denmark)‐ North America‐ Asia
‐ 50% owner Nissui is #2 Japanese seafood firm with global sales of US$5.2b (2009) and 8,800 employees (consolidated) & has been shareholder since 1973
‐ Recent major acquisitions all outside New Zealand‐ Argentina (deep sea wild capture) (FY09)‐ Queensland (aquaculture) (FY09)‐ Tasmania (aquaculture) (FY10)
‐ Firm under some financial pressure1‐ Sold its 35% of Nordic Seafood A/S (Denmark) [Aug
2010] for $23.3m to 50% owner Nissui‐ Invested $1.8m in new equipment for Nelson coated
products plant (FY10)‐ Divested 240ha NZ mussel space to Sanford‐ Purchased 63m longline vessel (jointly with Talleys)
(Sep 08)‐ Chartered replacement factory freezer trawler (Jun
09)‐ New NZ$10m plant in Caistor, UK (2007)‐ 50% Westfleet Seafoods (inshore species quota)
(FY07)‐ East Coast SI quota from Pacifica/Skeggs (FY06)‐ Launched 18 new frozen seafood product lines in
Australia doubling market share in seafood meal category (FY07)
CEO: Graham Stuart
Key metrics
Turnover:
5 year turnover CAGR:
EBIT/Operating profit:
EBIT margin:
Total/Net assets:
ROTA/RONA (ROE):
# of employees:
Turnover/employee:
EBIT/employee:
% export:
$531m (2010)
‐0.9% (05‐10)
$24.35m (2010)1
4.6%
$760.6m/$461.4m (2010)
3.2%/5.3%
1,100 (CI)
$483k
$22k
90% (CI)
Associates(select)
50% NZ Longline50% Westfleet Seafoods33% North Island Mussel Processing
Outward direct investment (ODI) (select)
40% Europacifico Alimentos S.L. (Spain)Yuken (Argentina)King Reef Seafoods (Australia)50% of Petuna Seafood (Australia)50% of Petuna Aquaculture (Australia)Caistor (UK; fish processor)
FIRM PROFILE – SEALORDSealord is the largest firm in the New Zealand seafood industry
PAGE 157 1. Uses “operating profit before financing costs” which also excludes share of profit from associates; 2. http://www.stuff.co.nz/dominion‐post/business/4518069/Sealords‐Japanese‐shareholder‐comes‐to‐rescue Source: various company annual reports; various company websites; Kompass; Coriolis analysis
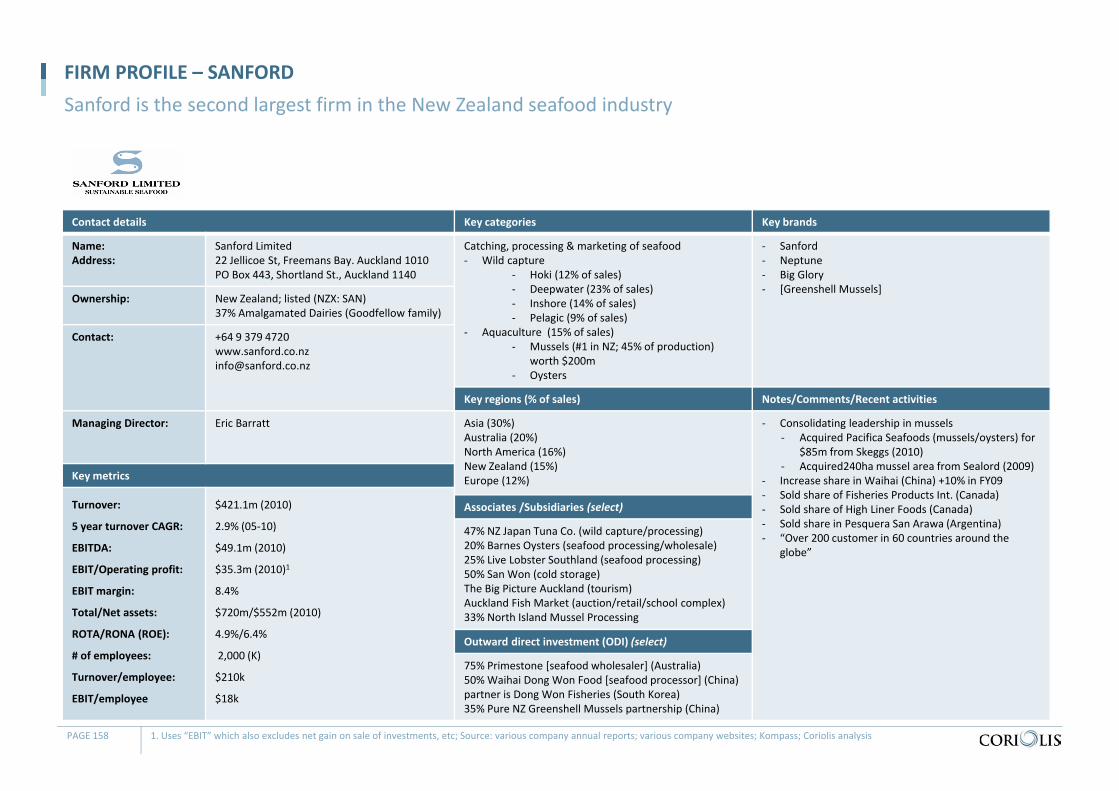
Contact details Key categories Key brands
Name:Address:
Sanford Limited22 Jellicoe St, Freemans Bay. Auckland 1010PO Box 443, Shortland St., Auckland 1140
Catching, processing & marketing of seafood‐ Wild capture
‐ Hoki (12% of sales)‐ Deepwater (23% of sales)‐ Inshore (14% of sales)‐ Pelagic (9% of sales)
‐ Aquaculture (15% of sales)‐ Mussels (#1 in NZ; 45% of production)
worth $200m‐ Oysters
‐ Sanford‐ Neptune‐ Big Glory‐ [Greenshell Mussels]
Ownership: New Zealand; listed (NZX: SAN)37% Amalgamated Dairies (Goodfellow family)
Contact: +64 9 379 [email protected]
Key regions (% of sales) Notes/Comments/Recent activities
Managing Director: Eric Barratt Asia (30%)Australia (20%)North America (16%)New Zealand (15%)Europe (12%)
‐ Consolidating leadership in mussels‐ Acquired Pacifica Seafoods (mussels/oysters) for
$85m from Skeggs (2010)‐ Acquired240ha mussel area from Sealord (2009)
‐ Increase share in Waihai (China) +10% in FY09‐ Sold share of Fisheries Products Int. (Canada)‐ Sold share of High Liner Foods (Canada)‐ Sold share in Pesquera San Arawa (Argentina)‐ “Over 200 customer in 60 countries around the
globe”
Key metrics
Turnover:
5 year turnover CAGR:
EBITDA:
EBIT/Operating profit:
EBIT margin:
Total/Net assets:
ROTA/RONA (ROE):
# of employees:
Turnover/employee:
EBIT/employee
$421.1m (2010)
2.9% (05‐10)
$49.1m (2010)
$35.3m (2010)1
8.4%
$720m/$552m (2010)
4.9%/6.4%
2,000 (K)
$210k
$18k
Associates /Subsidiaries (select)
47% NZ Japan Tuna Co. (wild capture/processing)20% Barnes Oysters (seafood processing/wholesale)25% Live Lobster Southland (seafood processing)50% San Won (cold storage)The Big Picture Auckland (tourism)Auckland Fish Market (auction/retail/school complex)33% North Island Mussel Processing
Outward direct investment (ODI) (select)
75% Primestone [seafood wholesaler] (Australia)50% Waihai Dong Won Food [seafood processor] (China) partner is Dong Won Fisheries (South Korea)35% Pure NZ Greenshell Mussels partnership (China)
FIRM PROFILE – SANFORDSanford is the second largest firm in the New Zealand seafood industry
PAGE 158 1. Uses “EBIT” which also excludes net gain on sale of investments, etc; Source: various company annual reports; various company websites; Kompass; Coriolis analysis
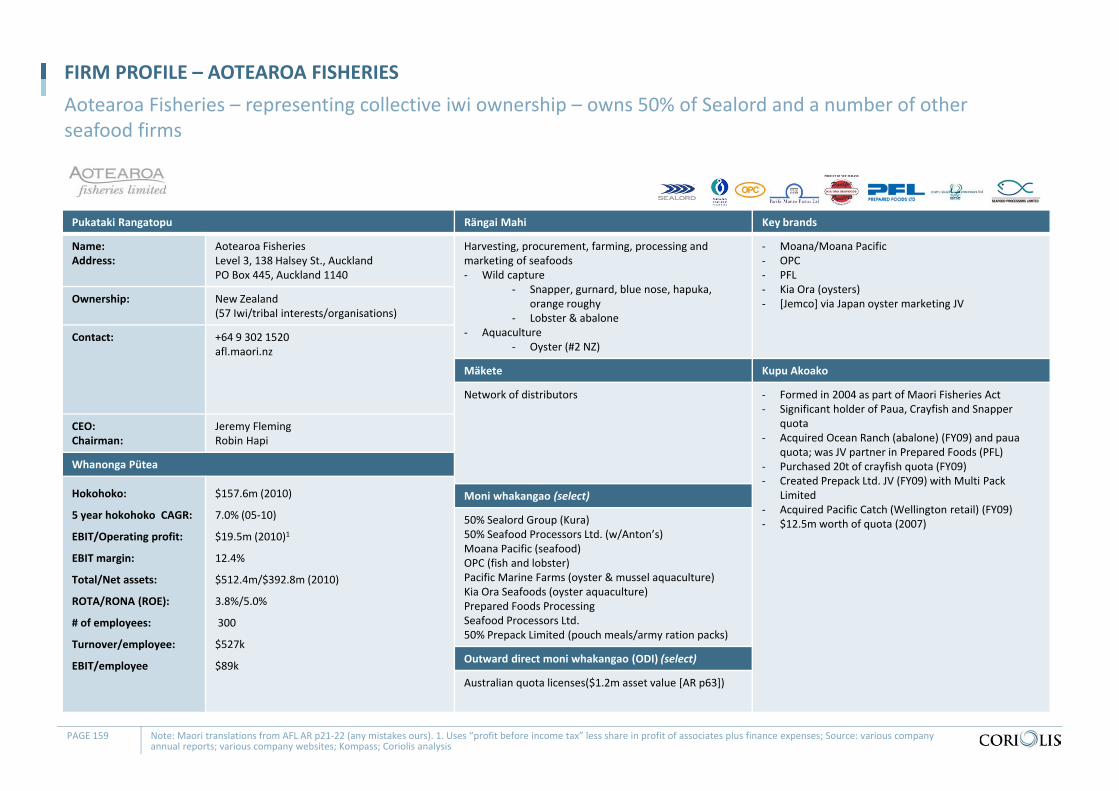
Pukataki Rangatopu Rängai Mahi Key brands
Name:Address:
Aotearoa FisheriesLevel 3, 138 Halsey St., AucklandPO Box 445, Auckland 1140
Harvesting, procurement, farming, processing and marketing of seafoods‐ Wild capture
‐ Snapper, gurnard, blue nose, hapuka,orange roughy
‐ Lobster & abalone‐ Aquaculture
‐ Oyster (#2 NZ)
‐ Moana/Moana Pacific‐ OPC‐ PFL‐ Kia Ora (oysters)‐ [Jemco] via Japan oyster marketing JVOwnership: New Zealand
(57 Iwi/tribal interests/organisations)
Contact: +64 9 302 1520afl.maori.nz
Mäkete Kupu Akoako
Network of distributors ‐ Formed in 2004 as part of Maori Fisheries Act‐ Significant holder of Paua, Crayfish and Snapper
quota‐ Acquired Ocean Ranch (abalone) (FY09) and paua
quota; was JV partner in Prepared Foods (PFL)‐ Purchased 20t of crayfish quota (FY09)‐ Created Prepack Ltd. JV (FY09) with Multi Pack
Limited‐ Acquired Pacific Catch (Wellington retail) (FY09)‐ $12.5m worth of quota (2007)
CEO:Chairman:
Jeremy FlemingRobin Hapi
Whanonga Pütea
Hokohoko:
5 year hokohoko CAGR:
EBIT/Operating profit:
EBIT margin:
Total/Net assets:
ROTA/RONA (ROE):
# of employees:
Turnover/employee:
EBIT/employee
$157.6m (2010)
7.0% (05‐10)
$19.5m (2010)1
12.4%
$512.4m/$392.8m (2010)
3.8%/5.0%
300
$527k
$89k
Moni whakangao (select)
50% Sealord Group (Kura)50% Seafood Processors Ltd. (w/Anton’s)Moana Pacific (seafood)OPC (fish and lobster)Pacific Marine Farms (oyster & mussel aquaculture)Kia Ora Seafoods (oyster aquaculture)Prepared Foods ProcessingSeafood Processors Ltd.50% Prepack Limited (pouch meals/army ration packs)
Outward direct moni whakangao (ODI) (select)
Australian quota licenses($1.2m asset value [AR p63])
FIRM PROFILE – AOTEAROA FISHERIES Aotearoa Fisheries – representing collective iwi ownership – owns 50% of Sealord and a number of other seafood firms
PAGE 159 Note: Maori translations from AFL AR p21‐22 (any mistakes ours). 1. Uses “profit before income tax” less share in profit of associates plus finance expenses; Source: various company annual reports; various company websites; Kompass; Coriolis analysis
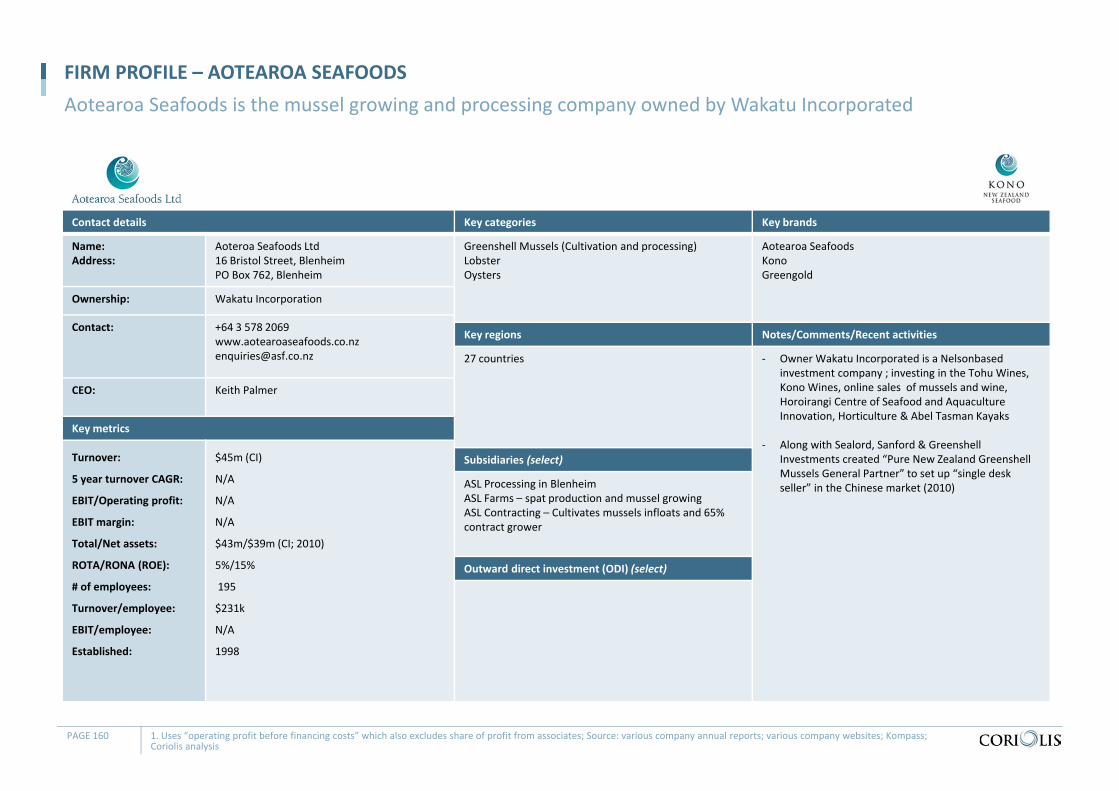
Contact details Key categories Key brands
Name:Address:
Aoteroa Seafoods Ltd16 Bristol Street, Blenheim PO Box 762, Blenheim
Greenshell Mussels (Cultivation and processing)LobsterOysters
Aotearoa SeafoodsKonoGreengold
Ownership: Wakatu Incorporation
Contact: +64 3 578 [email protected]
Key regions Notes/Comments/Recent activities
27 countries ‐ Owner Wakatu Incorporated is a Nelsonbasedinvestment company ; investing in the Tohu Wines, Kono Wines, online sales of mussels and wine, Horoirangi Centre of Seafood and Aquaculture Innovation, Horticulture & Abel Tasman Kayaks
‐ Along with Sealord, Sanford & GreenshellInvestments created “Pure New Zealand GreenshellMussels General Partner” to set up “single desk seller” in the Chinese market (2010)
CEO: Keith Palmer
Key metrics
Turnover:
5 year turnover CAGR:
EBIT/Operating profit:
EBIT margin:
Total/Net assets:
ROTA/RONA (ROE):
# of employees:
Turnover/employee:
EBIT/employee:
Established:
$45m (CI)
N/A
N/A
N/A
$43m/$39m (CI; 2010)
5%/15%
195
$231k
N/A
1998
Subsidiaries (select)
ASL Processing in BlenheimASL Farms – spat production and mussel growingASL Contracting – Cultivates mussels infloats and 65% contract grower
Outward direct investment (ODI) (select)
FIRM PROFILE – AOTEAROA SEAFOODSAotearoa Seafoods is the mussel growing and processing company owned by Wakatu Incorporated
PAGE 160 1. Uses “operating profit before financing costs” which also excludes share of profit from associates; Source: various company annual reports; various company websites; Kompass; Coriolis analysis
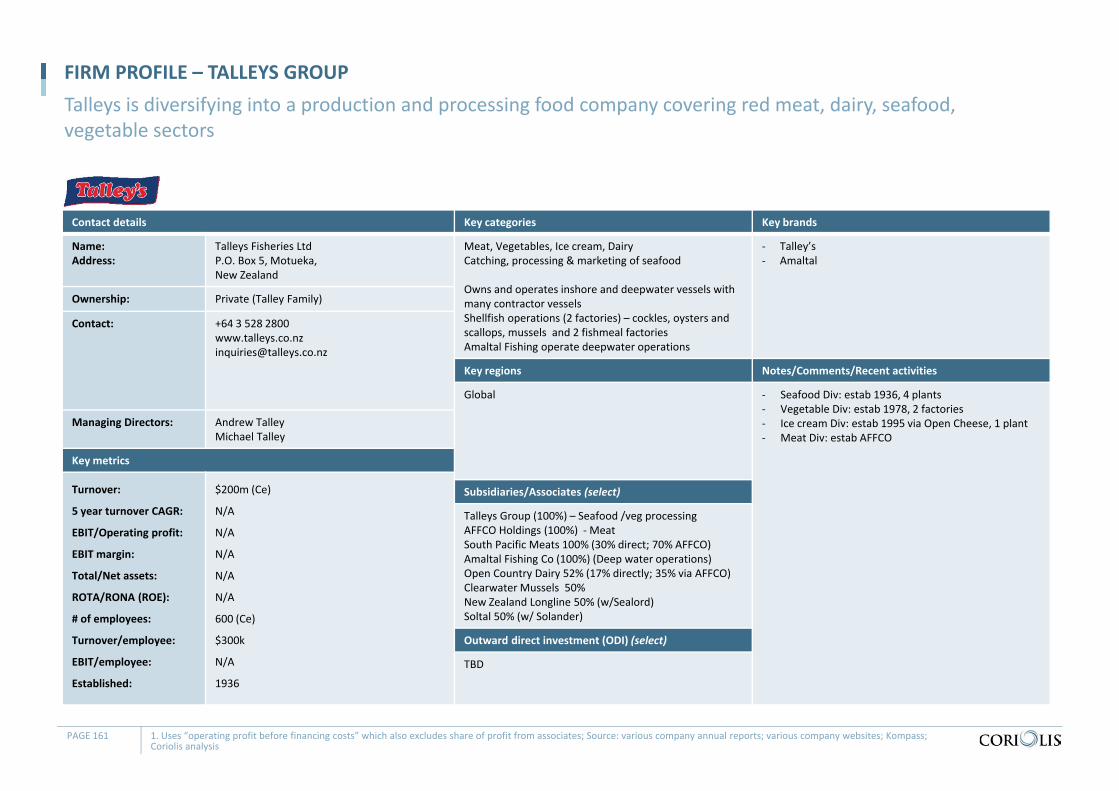
Contact details Key categories Key brands
Name:Address:
Talleys Fisheries LtdP.O. Box 5, Motueka, New Zealand
Meat, Vegetables, Ice cream, DairyCatching, processing & marketing of seafood
Owns and operates inshore and deepwater vessels with many contractor vesselsShellfish operations (2 factories) – cockles, oysters and scallops, mussels and 2 fishmeal factories Amaltal Fishing operate deepwater operations
‐ Talley’s‐ Amaltal
Ownership: Private (Talley Family)
Contact: +64 3 528 2800www.talleys.co.nz [email protected]
Key regions Notes/Comments/Recent activities
Global ‐ Seafood Div: estab 1936, 4 plants‐ Vegetable Div: estab 1978, 2 factories‐ Ice cream Div: estab 1995 via Open Cheese, 1 plant‐ Meat Div: estab AFFCO
Managing Directors: Andrew TalleyMichael Talley
Key metrics
Turnover:
5 year turnover CAGR:
EBIT/Operating profit:
EBIT margin:
Total/Net assets:
ROTA/RONA (ROE):
# of employees:
Turnover/employee:
EBIT/employee:
Established:
$200m (Ce)
N/A
N/A
N/A
N/A
N/A
600 (Ce)
$300k
N/A
1936
Subsidiaries/Associates (select)
Talleys Group (100%) – Seafood /veg processingAFFCO Holdings (100%) ‐MeatSouth Pacific Meats 100% (30% direct; 70% AFFCO)Amaltal Fishing Co (100%) (Deep water operations)Open Country Dairy 52% (17% directly; 35% via AFFCO) Clearwater Mussels 50%New Zealand Longline 50% (w/Sealord)Soltal 50% (w/ Solander)
Outward direct investment (ODI) (select)
TBD
FIRM PROFILE – TALLEYS GROUPTalleys is diversifying into a production and processing food company covering red meat, dairy, seafood, vegetable sectors
PAGE 161 1. Uses “operating profit before financing costs” which also excludes share of profit from associates; Source: various company annual reports; various company websites; Kompass; Coriolis analysis
TABLE OF CONTENTS
Section Page
Contents 4
Glossary of terms 5
Methodology & data sources 6
F&B IP Overview 7
Summary & conclusions 9
Sector overview 17
Wild capture 46
Aquaculture 85
Appendices
Oysters 113
Mussels 122
Salmon 134
Profiles of key firms 156
Supplementary material 162
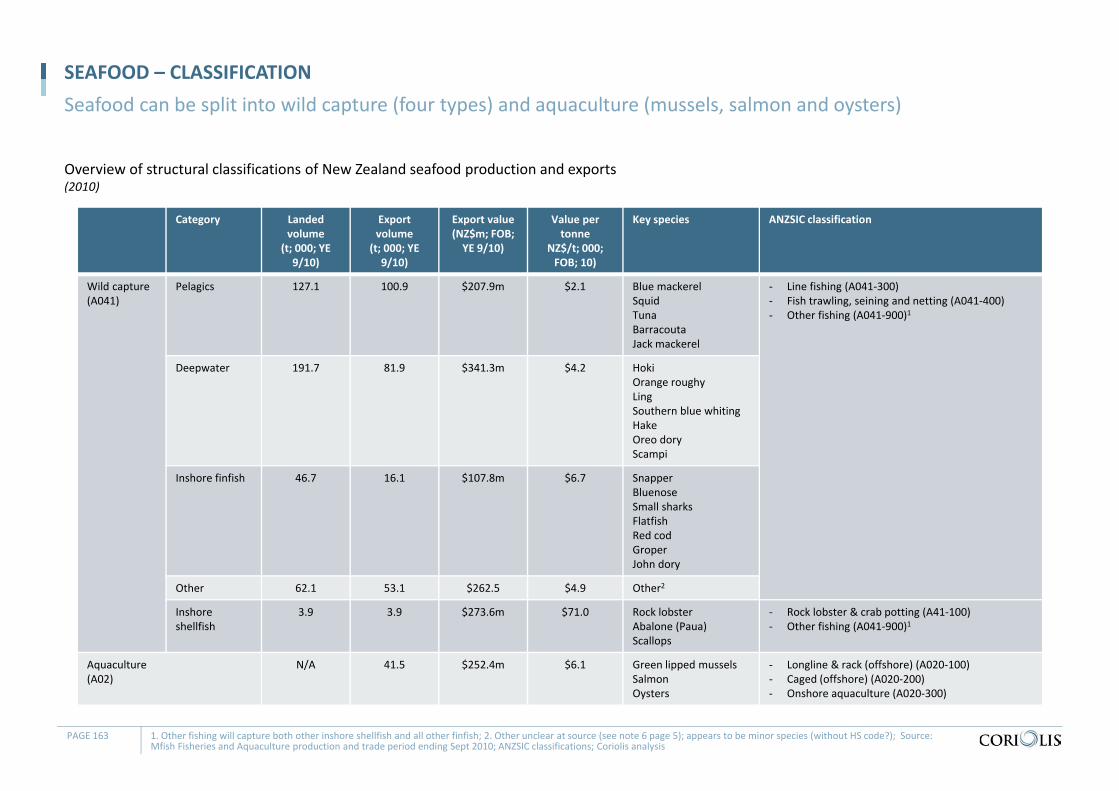
Category Landed volume
(t; 000; YE 9/10)
Export volume
(t; 000; YE 9/10)
Export value(NZ$m; FOB;YE 9/10)
Value per tonne
NZ$/t; 000;FOB; 10)
Key species ANZSIC classification
Wild capture(A041)
Pelagics 127.1 100.9 $207.9m $2.1 Blue mackerelSquidTunaBarracoutaJack mackerel
‐ Line fishing (A041‐300)‐ Fish trawling, seining and netting (A041‐400)‐ Other fishing (A041‐900)1
Deepwater 191.7 81.9 $341.3m $4.2 HokiOrange roughyLingSouthern blue whitingHakeOreo doryScampi
Inshore finfish 46.7 16.1 $107.8m $6.7 SnapperBluenoseSmall sharksFlatfishRed codGroperJohn dory
Other 62.1 53.1 $262.5 $4.9 Other2
Inshore shellfish
3.9 3.9 $273.6m $71.0 Rock lobsterAbalone (Paua)Scallops
‐ Rock lobster & crab potting (A41‐100)‐ Other fishing (A041‐900)1
Aquaculture(A02)
N/A 41.5 $252.4m $6.1 Green lipped musselsSalmonOysters
‐ Longline & rack (offshore) (A020‐100)‐ Caged (offshore) (A020‐200)‐ Onshore aquaculture (A020‐300)
Overview of structural classifications of New Zealand seafood production and exports(2010)
SEAFOOD – CLASSIFICATIONSeafood can be split into wild capture (four types) and aquaculture (mussels, salmon and oysters)
PAGE 163 1. Other fishing will capture both other inshore shellfish and all other finfish; 2. Other unclear at source (see note 6 page 5); appears to be minor species (without HS code?); Source: Mfish Fisheries and Aquaculture production and trade period ending Sept 2010; ANZSIC classifications; Coriolis analysis
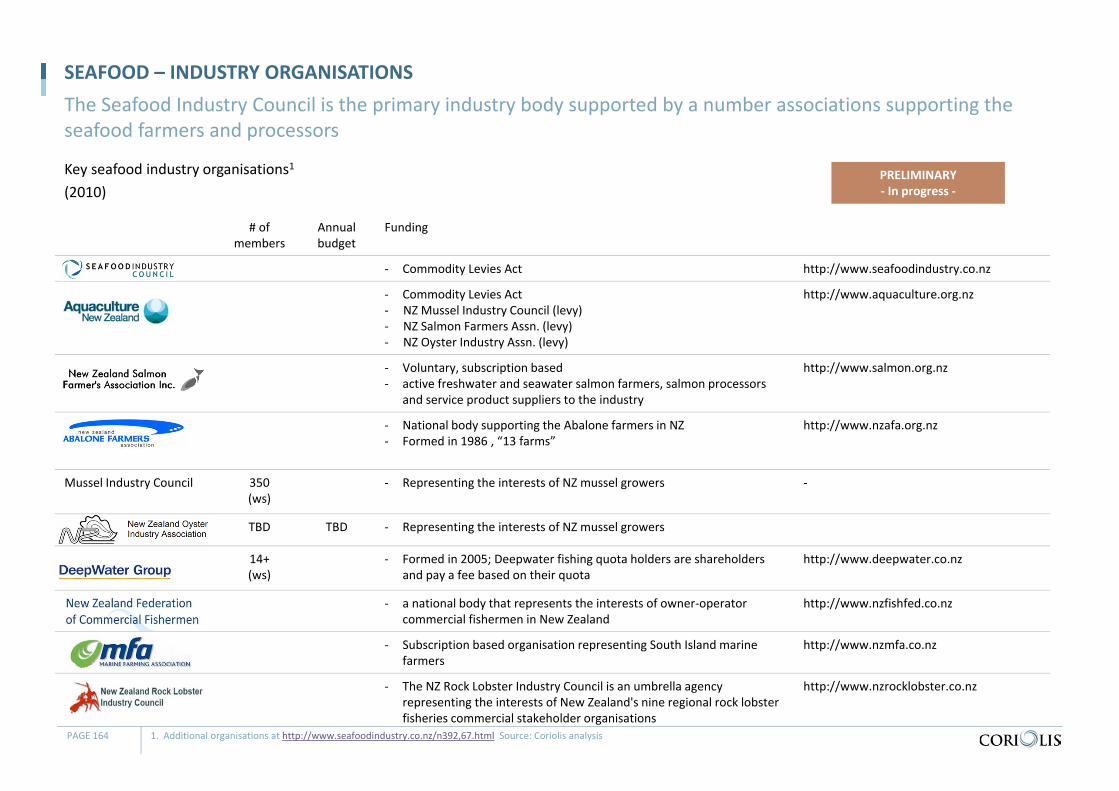
# of members
Annual budget
Funding
‐ Commodity Levies Act http://www.seafoodindustry.co.nz
‐ Commodity Levies Act‐ NZ Mussel Industry Council (levy)‐ NZ Salmon Farmers Assn. (levy)‐ NZ Oyster Industry Assn. (levy)
http://www.aquaculture.org.nz
‐ Voluntary, subscription based‐ active freshwater and seawater salmon farmers, salmon processors
and service product suppliers to the industry
http://www.salmon.org.nz
‐ National body supporting the Abalone farmers in NZ‐ Formed in 1986 , “13 farms”
http://www.nzafa.org.nz
Mussel Industry Council 350(ws)
‐ Representing the interests of NZ mussel growers ‐
NZ Oyster Industry TBD TBD ‐ Representing the interests of NZ mussel growers
14+(ws)
‐ Formed in 2005; Deepwater fishing quota holders are shareholders and pay a fee based on their quota
http://www.deepwater.co.nz
‐ a national body that represents the interests of owner‐operator commercial fishermen in New Zealand
http://www.nzfishfed.co.nz
‐ Subscription based organisation representing South Island marinefarmers
http://www.nzmfa.co.nz
‐ The NZ Rock Lobster Industry Council is an umbrella agency representing the interests of New Zealand's nine regional rock lobster fisheries commercial stakeholder organisations
http://www.nzrocklobster.co.nz
Key seafood industry organisations1
(2010)
SEAFOOD – INDUSTRY ORGANISATIONSThe Seafood Industry Council is the primary industry body supported by a number associations supporting the seafood farmers and processors
PAGE 164 1. Additional organisations at http://www.seafoodindustry.co.nz/n392,67.html Source: Coriolis analysis
PRELIMINARY‐ In progress ‐
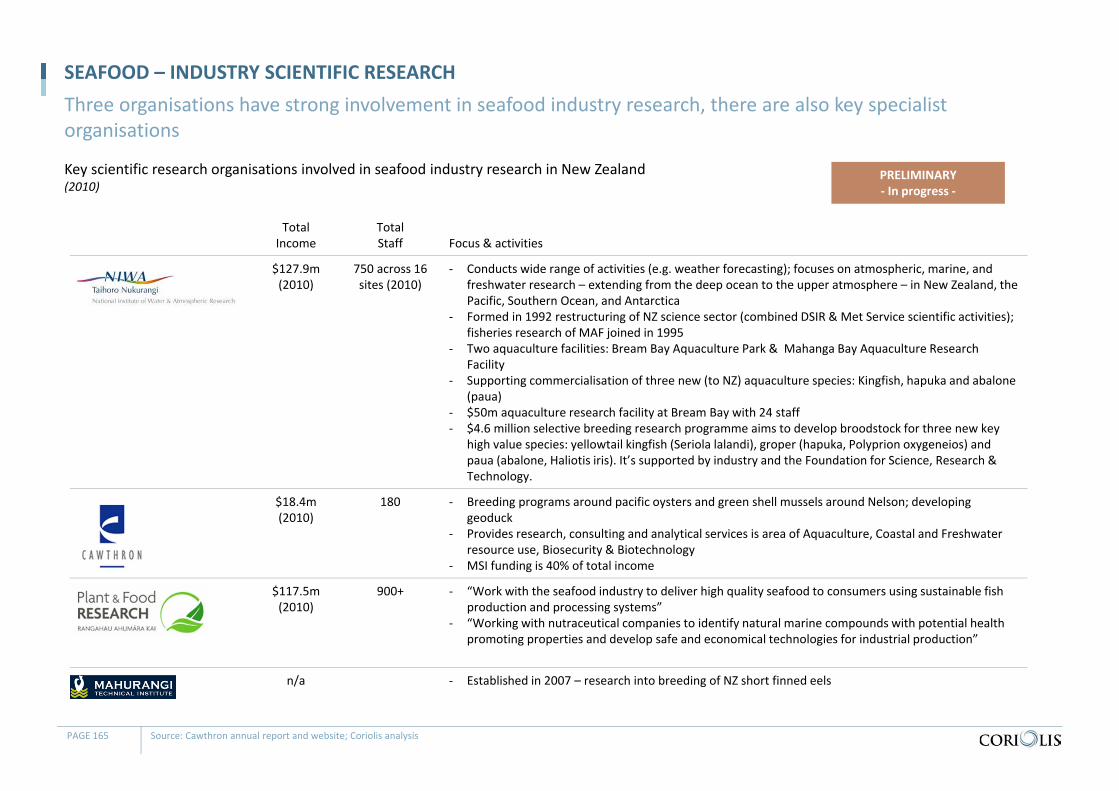
TotalIncome
TotalStaff Focus & activities
$127.9m(2010)
750 across 16 sites (2010)
‐ Conducts wide range of activities (e.g. weather forecasting); focuses on atmospheric, marine, and freshwater research – extending from the deep ocean to the upper atmosphere – in New Zealand, the Pacific, Southern Ocean, and Antarctica
‐ Formed in 1992 restructuring of NZ science sector (combined DSIR & Met Service scientific activities); fisheries research of MAF joined in 1995
‐ Two aquaculture facilities: Bream Bay Aquaculture Park & Mahanga Bay Aquaculture Research Facility
‐ Supporting commercialisation of three new (to NZ) aquaculture species: Kingfish, hapuka and abalone (paua)
‐ $50m aquaculture research facility at Bream Bay with 24 staff‐ $4.6 million selective breeding research programme aims to develop broodstock for three new key
high value species: yellowtail kingfish (Seriola lalandi), groper (hapuka, Polyprion oxygeneios) and paua (abalone, Haliotis iris). It’s supported by industry and the Foundation for Science, Research & Technology.
$18.4m(2010)
180 ‐ Breeding programs around pacific oysters and green shell mussels around Nelson; developing geoduck
‐ Provides research, consulting and analytical services is area of Aquaculture, Coastal and Freshwater resource use, Biosecurity & Biotechnology
‐ MSI funding is 40% of total income
$117.5m(2010)
900+ ‐ “Work with the seafood industry to deliver high quality seafood to consumers using sustainable fish production and processing systems”
‐ “Working with nutraceutical companies to identify natural marine compounds with potential health promoting properties and develop safe and economical technologies for industrial production”
n/a ‐ Established in 2007 – research into breeding of NZ short finned eels
Key scientific research organisations involved in seafood industry research in New Zealand(2010)
SEAFOOD – INDUSTRY SCIENTIFIC RESEARCHThree organisations have strong involvement in seafood industry research, there are also key specialist organisations
PAGE 165 Source: Cawthron annual report and website; Coriolis analysis
PRELIMINARY‐ In progress ‐
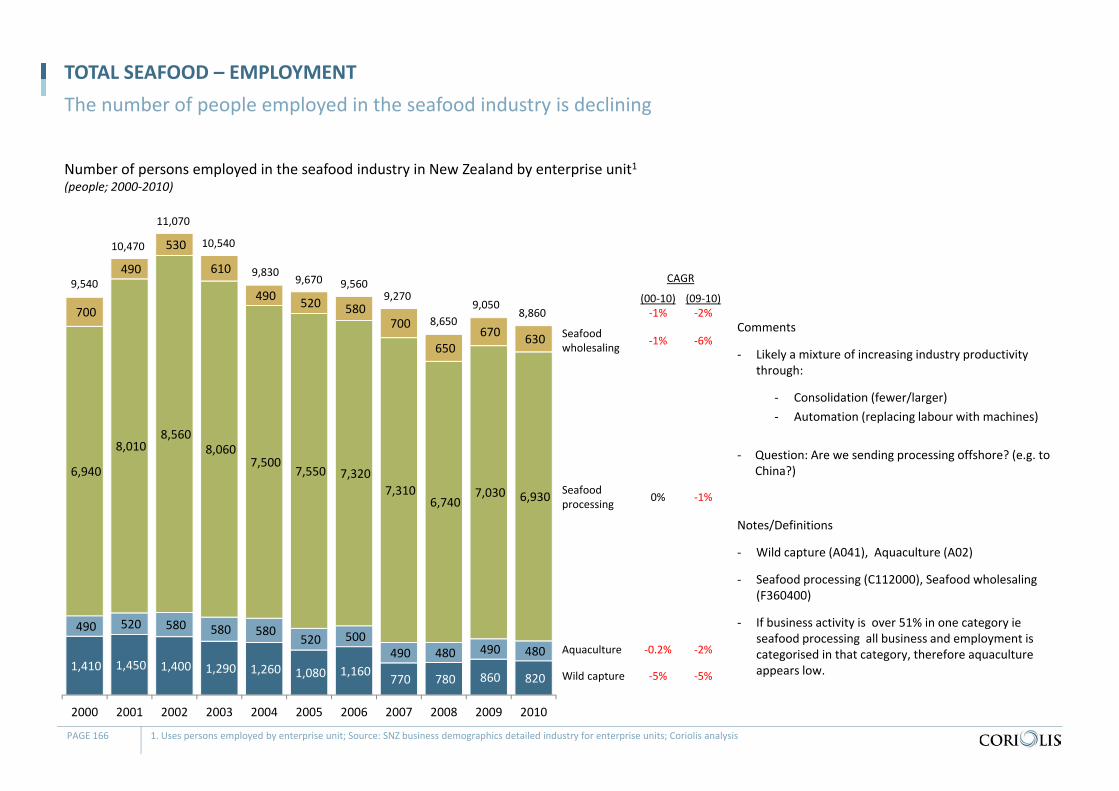
Number of persons employed in the seafood industry in New Zealand by enterprise unit1(people; 2000‐2010)
TOTAL SEAFOOD – EMPLOYMENTThe number of people employed in the seafood industry is declining
PAGE 166 1. Uses persons employed by enterprise unit; Source: SNZ business demographics detailed industry for enterprise units; Coriolis analysis
Comments
‐ Likely a mixture of increasing industry productivity through:
‐ Consolidation (fewer/larger)‐ Automation (replacing labour with machines)
‐ Question: Are we sending processing offshore? (e.g. to China?)
Notes/Definitions
‐ Wild capture (A041), Aquaculture (A02)
‐ Seafood processing (C112000), Seafood wholesaling (F360400)
‐ If business activity is over 51% in one category ieseafood processing all business and employment is categorised in that category, therefore aquaculture appears low.1,410 1,450 1,400 1,290 1,260 1,080 1,160 770 780 860 820
490 520 580 580 580 520 500
490 480 490 480
6,940
8,010 8,560
8,060 7,500
7,550 7,320 7,310
6,740 7,030 6,930
700
490
530
610
490 520 580 700
650 670 630
2000 2001 2002 2003 2004 2005 2006 2007 2008 2009 2010
Wild capture
Aquaculture
Seafood processing
Seafood wholesaling
9,540
10,470
11,070
10,540
9,8309,670 9,560
9,270
8,6509,050
8,860(00‐10)‐1%
‐1%
0%
(09‐10)‐2%
‐6%
‐1%
CAGR
‐0.2% ‐2%
‐5% ‐5%
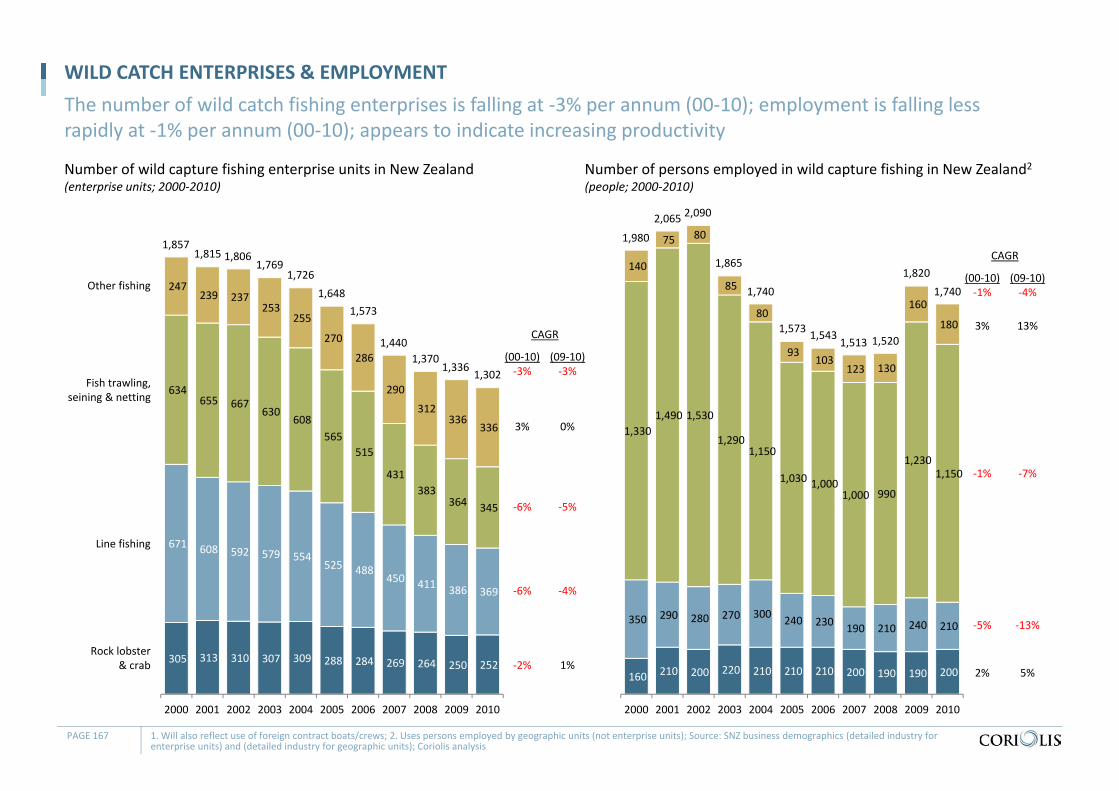
Number of wild capture fishing enterprise units in New Zealand(enterprise units; 2000‐2010)
WILD CATCH ENTERPRISES & EMPLOYMENTThe number of wild catch fishing enterprises is falling at ‐3% per annum (00‐10); employment is falling less rapidly at ‐1% per annum (00‐10); appears to indicate increasing productivity
PAGE 167 1. Will also reflect use of foreign contract boats/crews; 2. Uses persons employed by geographic units (not enterprise units); Source: SNZ business demographics (detailed industry for enterprise units) and (detailed industry for geographic units); Coriolis analysis
305 313 310 307 309 288 284 269 264 250 252
671 608 592 579 554 525 488
450 411 386 369
634 655 667
630 608
565 515
431 383
364 345
247 239 237
253 255
270
286
290
312 336
336
2000 2001 2002 2003 2004 2005 2006 2007 2008 2009 2010
Rock lobster& crab
Line fishing
Fish trawling, seining & netting
Other fishing
1,8571,815 1,806
1,7691,726
1,6481,573
1,4401,370
1,3361,302
(00‐10)‐3%
3%
‐6%
(09‐10)‐3%
0%
‐5%
CAGR
‐6% ‐4%
‐2% 1%160 210 200 220 210 210 210 200 190 190 200
350 290 280 270 300 240 230 190 210 240 210
1,330 1,490 1,530
1,290 1,150
1,030 1,000 1,000 990
1,230 1,150
140
75 80
85
80
93 103
123 130
160
180
2000 2001 2002 2003 2004 2005 2006 2007 2008 2009 2010
Number of persons employed in wild capture fishing in New Zealand2(people; 2000‐2010)
1,980
2,065 2,090
1,865
1,740
1,573 1,543 1,513 1,520
1,8201,740
(00‐10)‐1%
3%
‐1%
(09‐10)‐4%
13%
‐7%
CAGR
‐5% ‐13%
2% 5%
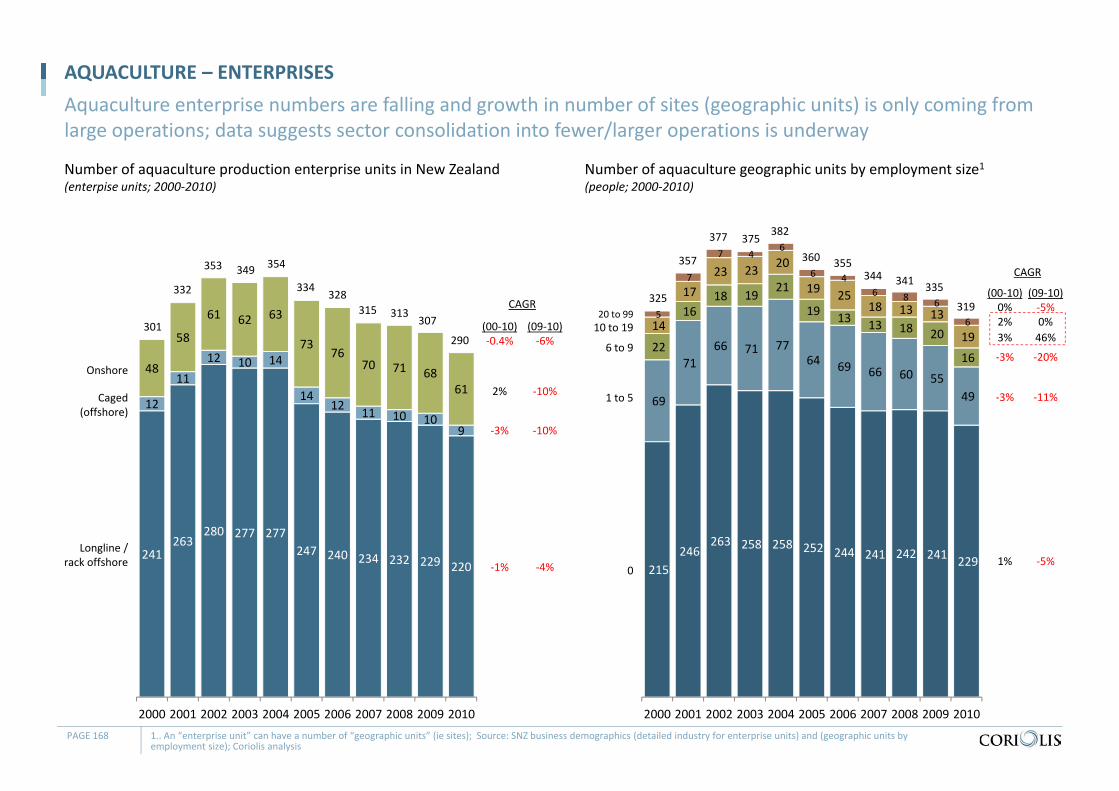
Number of aquaculture production enterprise units in New Zealand(enterpise units; 2000‐2010)
AQUACULTURE – ENTERPRISESAquaculture enterprise numbers are falling and growth in number of sites (geographic units) is only coming from large operations; data suggests sector consolidation into fewer/larger operations is underway
PAGE 168 1.. An “enterprise unit” can have a number of “geographic units” (ie sites); Source: SNZ business demographics (detailed industry for enterprise units) and (geographic units by employment size); Coriolis analysis
241263
280 277 277247 240 234 232 229 220
12
1112 10 14
1412 11 10 10
9
48
58
61 62 63
7376
70 71 6861
2000 2001 2002 2003 2004 2005 2006 2007 2008 2009 2010
Longline /rack offshore
Caged (offshore)
Onshore
301
332
353 349 354
334328
315 313307
290(00‐10)‐0.4%
2%
‐3%
(09‐10)‐6%
‐10%
‐10%
CAGR
‐1% ‐4%
Number of aquaculture geographic units by employment size1(people; 2000‐2010)
215 246
263 258 258 252 244 241 242 241 229
69
71 66 71 77
64 69 66 60 55 49
22
16 18 19 21
19 13 13 18 20
16
14
17 23 23 20
19 25 18 13 13
19
5
7
7 4 6
6 4 6 8 6
6
2000 2001 2002 2003 2004 2005 2006 2007 2008 2009 2010
0
1 to 5
6 to 9
325
357
377 375382
360 355344 341 335
319(00‐10)0%
‐3%
‐3%
(09‐10)‐5%
‐20%
‐11%
CAGR
1% ‐5%
10 to 1920 to 99
3% 46%2% 0%
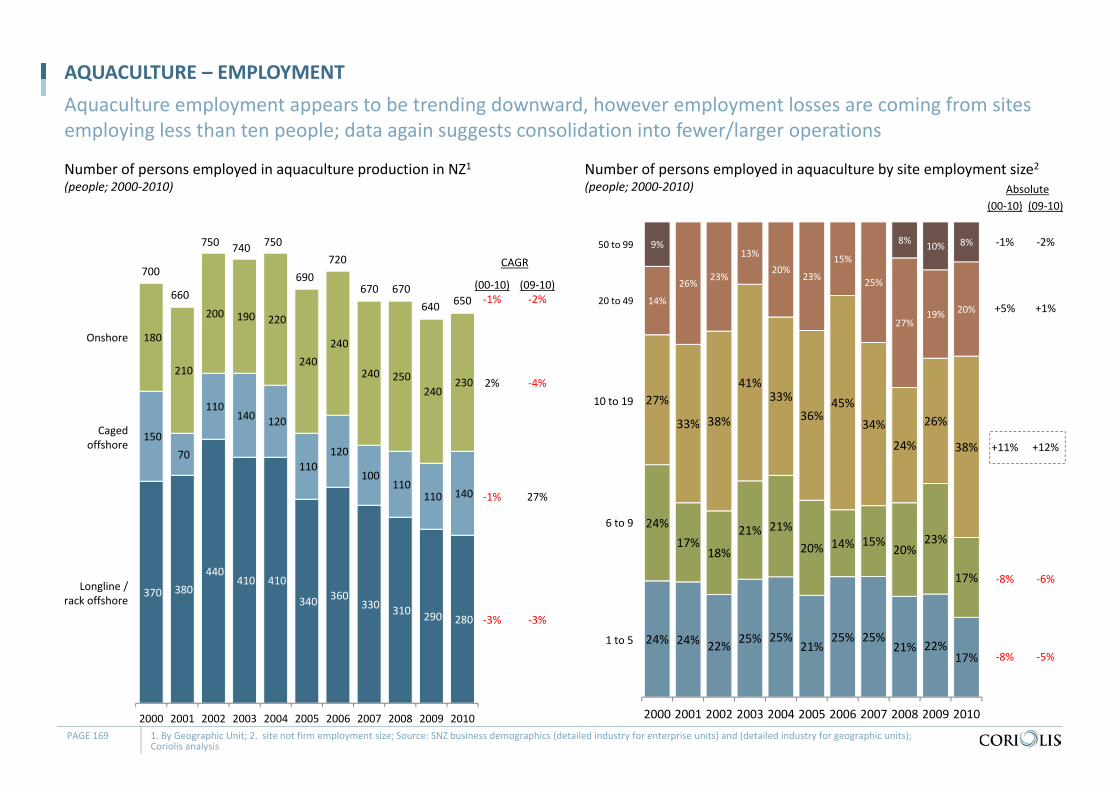
Number of persons employed in aquaculture production in NZ1(people; 2000‐2010)
AQUACULTURE – EMPLOYMENTAquaculture employment appears to be trending downward, however employment losses are coming from sites employing less than ten people; data again suggests consolidation into fewer/larger operations
PAGE 169 1. By Geographic Unit; 2. site not firm employment size; Source: SNZ business demographics (detailed industry for enterprise units) and (detailed industry for geographic units); Coriolis analysis
Number of persons employed in aquaculture by site employment size2(people; 2000‐2010)
370 380 440
410 410
340 360 330 310 290 280
150 70
110 140 120
110 120
100 110
110 140
180
210
200 190 220
240 240
240 250 240
230
2000 2001 2002 2003 2004 2005 2006 2007 2008 2009 2010
700
660
750 740 750
690720
670 670640 650
(00‐10)‐1%
2%
‐1%
(09‐10)‐2%
‐4%
27%
CAGR
‐3% ‐3%
Longline /rack offshore
Caged offshore
Onshore
24% 24% 22% 25% 25%21%
25% 25%21% 22%
17%
24%17%
18%
21% 21%
20% 14% 15%20%
23%
17%
27%
33% 38%
41%33%
36%45%
34%
24%
26%
38%
14%
26% 23%
13%20%
23%
15%
25%
27%19% 20%
9% 8% 10% 8%
2000 2001 2002 2003 2004 2005 2006 2007 2008 2009 2010
1 to 5
6 to 9
(00‐10)
+11%
‐8%
(09‐10)
+12%
‐6%
Absolute
‐8% ‐5%
10 to 19
20 to 49+5% +1%
‐1% ‐2%50 to 99
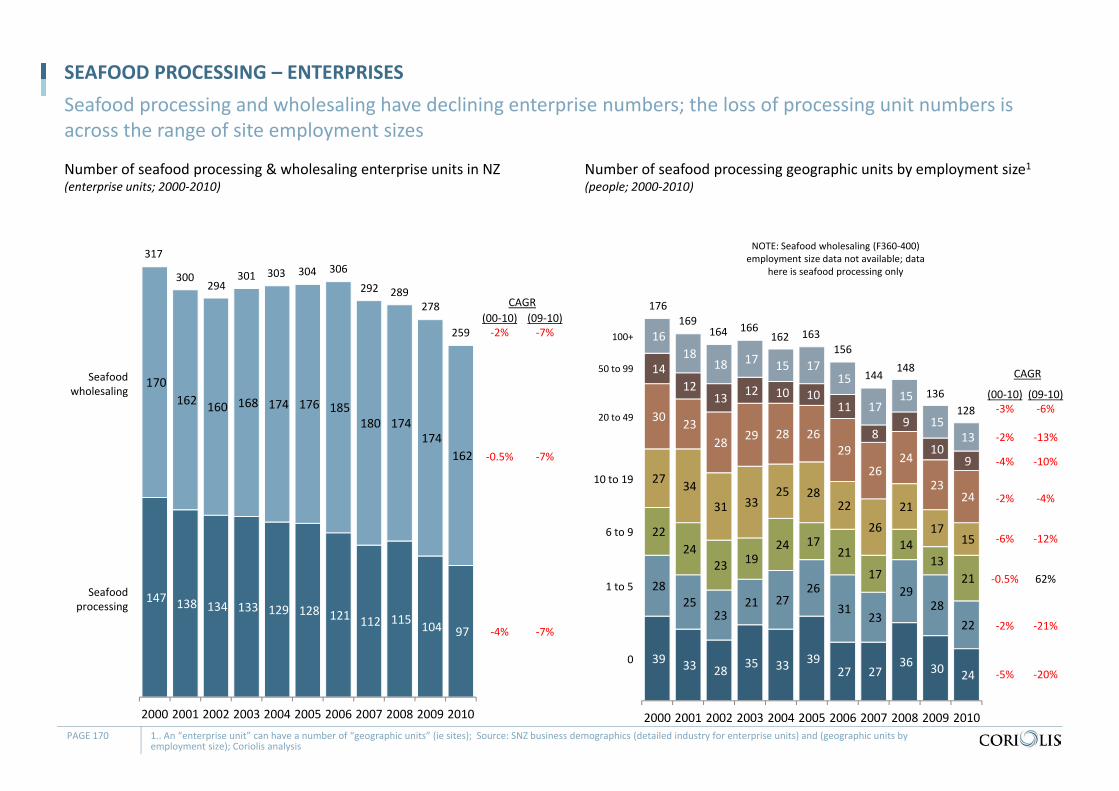
Number of seafood processing & wholesaling enterprise units in NZ(enterprise units; 2000‐2010)
SEAFOOD PROCESSING – ENTERPRISESSeafood processing and wholesaling have declining enterprise numbers; the loss of processing unit numbers is across the range of site employment sizes
PAGE 170 1.. An “enterprise unit” can have a number of “geographic units” (ie sites); Source: SNZ business demographics (detailed industry for enterprise units) and (geographic units by employment size); Coriolis analysis
147 138 134 133 129 128 121 112 115 104 97
170 162 160 168 174 176 185
180 174 174
162
2000 2001 2002 2003 2004 2005 2006 2007 2008 2009 2010
Seafoodprocessing
Seafood wholesaling
317
300294
301 303 304 306
292 289278
259(00‐10)‐2%
‐0.5%
(09‐10)‐7%
‐7%
CAGR
‐4% ‐7%
Number of seafood processing geographic units by employment size1(people; 2000‐2010)
39 33 28 35 33 39 27 27
36 30 24
28 25
23 21 27
26 31
23
29 28
22
22 24
23 19 24 17
21
17
14 13
21
27 34 31 33
25 28 22
26 21
17 15
30 23 28 29 28 26
29 26
24
23 24
14 12
13 12 10 10 11
8 9
10 9
16 18
18 17 15 17 15
17 15
15 13
2000 2001 2002 2003 2004 2005 2006 2007 2008 2009 2010
0
1 to 5
6 to 9
176169
164 166162 163
156
144148
136128
(00‐10)‐3%
‐6%
‐0.5%
(09‐10)‐6%
‐12%
62%
CAGR
‐5% ‐20%
10 to 19
20 to 49
50 to 99
100+
‐2% ‐21%
‐2% ‐4%
‐4% ‐10%
‐2% ‐13%
NOTE: Seafood wholesaling (F360‐400) employment size data not available; data
here is seafood processing only
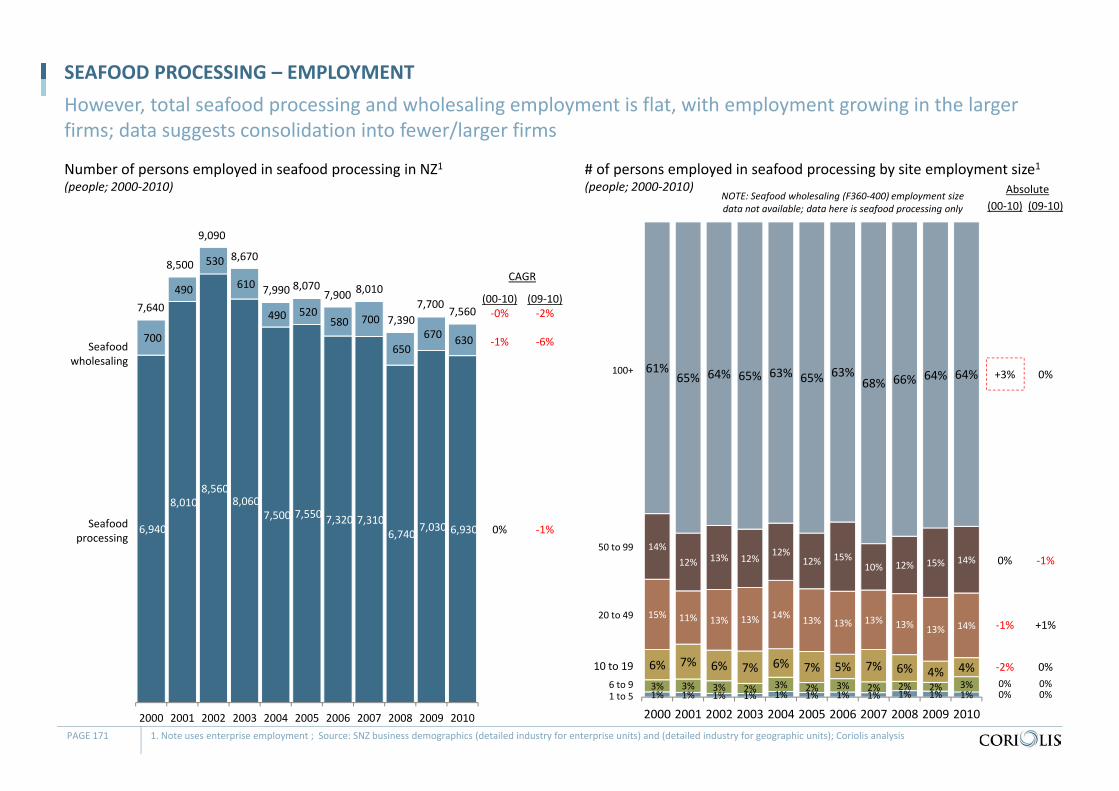
Number of persons employed in seafood processing in NZ1(people; 2000‐2010)
SEAFOOD PROCESSING – EMPLOYMENTHowever, total seafood processing and wholesaling employment is flat, with employment growing in the larger firms; data suggests consolidation into fewer/larger firms
PAGE 171 1. Note uses enterprise employment ; Source: SNZ business demographics (detailed industry for enterprise units) and (detailed industry for geographic units); Coriolis analysis
# of persons employed in seafood processing by site employment size1(people; 2000‐2010)
6,940
8,010 8,560
8,060 7,500 7,550 7,320 7,310
6,740 7,030 6,930
700
490
530
610
490 520 580 700
650 670 630
2000 2001 2002 2003 2004 2005 2006 2007 2008 2009 2010
7,640
8,500
9,090
8,670
7,990 8,070 7,900 8,010
7,3907,700 7,560
(00‐10)‐0%
‐1%
0%
(09‐10)‐2%
‐6%
‐1%
CAGR
1% 1% 1% 1% 1% 1% 1% 1% 1% 1% 1%3% 3% 3% 2% 3% 2% 3% 2% 2% 2% 3%
6% 7% 6% 7% 6% 7% 5% 7% 6% 4% 4%
15% 11% 13% 13% 14% 13% 13% 13% 13% 13% 14%
14%12% 13% 12% 12%
12% 15%10% 12% 15% 14%
61%65% 64% 65% 63% 65% 63%
68% 66% 64% 64%
2000 2001 2002 2003 2004 2005 2006 2007 2008 2009 20101 to 56 to 9
(00‐10)
‐2%
(09‐10)
0%
Absolute
‐1% +1%
10 to 19
20 to 49
0% ‐1%
+3% 0%
Seafoodprocessing
Seafood wholesaling
50 to 99
100+
0% 0%0% 0%
NOTE: Seafood wholesaling (F360‐400) employment size data not available; data here is seafood processing only
Related Documents