Following Virginia’s Career and Technical Education completers out of high school and into college A study of high school graduates’ college enrollment, persistence, and completion prepared by Deborah L. Jonas, Ph.D. Research & Analytic Insights Marshall Garland Gibson Consulting Ryoko Yamaguchi, Ph.D. Plus Alpha Research & Consulting October 2014 This report was prepared as part of a project that supports Virginia’s Career and Technical Education (CTE) leaders. The project aimed to provide descriptive information about CTE completers’ postsecondary and workforce outcomes. Funds for this research were provided from the Virginia Department of Education (VDOE) and the VLDS (Virginia Longitudinal Data System) program. All information contained herein is the opinion of the authors, and does not necessarily represent the views of VLDS, VDOE, or the Virginia Board of Education. An electronic copy of this report is available online, http://vlds.virginia.gov/media/2478/ctepostsecondary.pdf.

Welcome message from author
This document is posted to help you gain knowledge. Please leave a comment to let me know what you think about it! Share it to your friends and learn new things together.
Transcript

Following Virginia’s Career and Technical Education completers out of high school
and into college
A study of high school graduates’ college enrollment,
persistence, and completion
prepared by
Deborah L. Jonas, Ph.D. Research & Analytic Insights
Marshall Garland Gibson Consulting
Ryoko Yamaguchi, Ph.D. Plus Alpha Research & Consulting
October 2014
This report was prepared as part of a project that supports Virginia’s Career and Technical Education (CTE)
leaders. The project aimed to provide descriptive information about CTE completers’ postsecondary and
workforce outcomes. Funds for this research were provided from the Virginia Department of Education
(VDOE) and the VLDS (Virginia Longitudinal Data System) program. All information contained herein is the
opinion of the authors, and does not necessarily represent the views of VLDS, VDOE, or the Virginia Board of
Education. An electronic copy of this report is available online,
http://vlds.virginia.gov/media/2478/ctepostsecondary.pdf.

P a g e | i
Contents Table of Figures ................................................................................................................................ii
Executive summary ......................................................................................................................... 1
Key findings ................................................................................................................................. 1
Introduction .................................................................................................................................... 3
CTE programs in Virginia ............................................................................................................. 4
Research approach and data sources ............................................................................................. 5
Research Approach ..................................................................................................................... 5
Data sources ................................................................................................................................ 9
Data from graduates’ high school experiences .......................................................................... 9
Data from high school graduates’ postsecondary enrollment, persistence, and completion . 10
Study results .................................................................................................................................. 11
What were the characteristics of CTE completers and non-completers who graduated from
high school? .............................................................................................................................. 11
What were the postsecondary enrollment outcomes for CTE completers? ............................ 13
What were the postsecondary persistence rates for CTE completers? ................................... 15
What were the postsecondary completion outcomes for CTE completers? ........................... 17
What other high school factors were associated with graduates postsecondary enrollment,
persistence, and completion? ................................................................................................... 20
Summary and recommendations ................................................................................................. 21
The importance of high school course-taking .......................................................................... 22
Recommendations ........................................................................................................................ 23
Works Cited ................................................................................................................................... 26
Appendix A. Multinomial logistic regression methods and results ......................................... 29
Results of the multinomial regression models ......................................................................... 31
P a g e | ii
Table of Figures Figure 1. Conceptual model of CTE postsecondary and workforce outcomes .............................. 9
Figure 2. Percent of CTE completers in Virginia's 2008 and 2009 graduating cohorts ............... 12
Figure 3. Percent of CTE completers and non-completers who enrolled in college within one
year of high school graduation ..................................................................................... 14
Figure 4. Percentage of college-enrolled high school graduates, by college type and CTE
completion status ......................................................................................................... 14
Figure 5. Percentage of high school graduates who enrolled in college by CTE completer status,
high school diploma type, and first-year college enrollment type, 2008 high school
graduates. ..................................................................................................................... 15
Figure 6. Persistence into college years 2, 3, and 4 by college type, college-enrolled graduates
from the 2008 high school cohort ................................................................................ 16
Figure 7. Persistence rates, college-enrolled 2008 high school graduates, by CTE completer
status, diploma type, and college type ......................................................................... 17
Figure 8. Percentage of high school graduates who earned college credentials within five years
of high school graduation ............................................................................................. 18
Figure 9. Percentage of high school graduates who earned college credentials within five years,
by CTE completer status and high school diploma type ............................................... 19
Figure 10. Percentage of college-enrolled high school graduates college enrollment within one-
year of high school graduation by CTE completer status and high school diploma type
...................................................................................................................................... 20

P a g e | iii
This page intentionally left blank
P a g e | 1
Executive summary In Virginia, nearly half of all high school graduates—more than 40,000 graduates per year—
complete a career and technical education (CTE) program of study. Virginia’s CTE instructional
programs are designed to prepare young people for productive futures while meeting the
Virginia’s need for well-trained and industry-certified technical workers. They aim to integrate
instruction to ensure that students graduate meeting academic standards along with workplace
readiness and industry-specific technical skills. CTE programs prepare students for
postsecondary education, training, and for beginning careers. Programs vary in content, but
include a sequence of at least two courses in a career pathway as part of graduation
requirements.
Leadership in the Virginia Department of Education’s (VDOE’s) Office of Career and Technical
Education (CTE) regularly works with Virginia’s local educators to strengthen program quality,
with the goal of ensuring that all CTE graduates are prepared for success in college and careers.
As part of federal reporting requirements, VDOE’s CTE office prepares annual reports on the 9-
month college- and employment status of students who complete a CTE program of study (i.e.,
CTE completers). CTE leaders need more information about completers’ long-term college and
employment outcomes. Based on data available by using the Virginia Longitudinal Data System
(VLDS), this report is one of two prepared as part of a research project that followed CTE
completers from high school graduates in the 2008 and 2009 cohorts through the fall of 2013.
This report focuses on three postsecondary outcomes:
1. College enrollment within one year of high school graduation
2. Persistence of college-enrolled high school graduates
3. College completion rates
Using VLDS, our research team accessed college enrollment, persistence, and completion data
from in-state and out-of-state colleges and universities in the United States collected from the
State Council of Higher Education for Virginia and the National Student Clearinghouse.
Combined, these two data sources capture the vast majority of college enrollments and 2- and
4-year college degrees for Virginia’s high school graduates. These sources, while the best
currently available, do not capture all one-year credentials (e.g., technical and professional
licenses) that high school graduates may earn during or after a postsecondary education or
training experience.
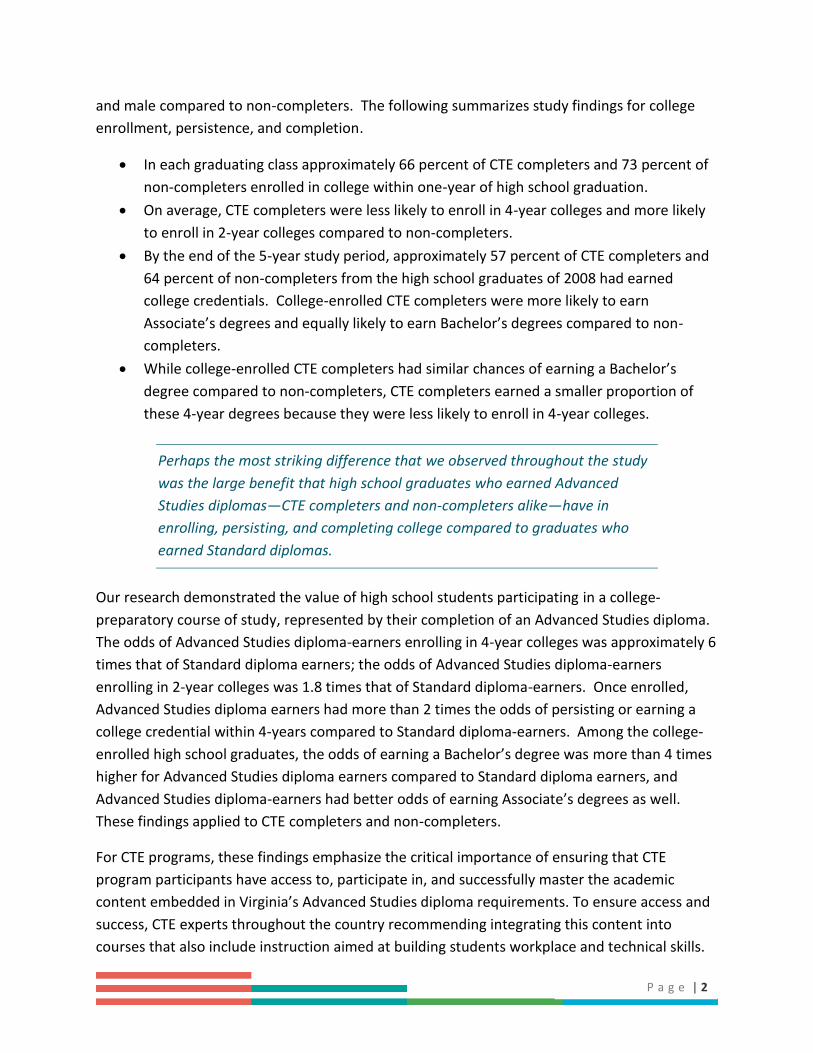
Key findings
Out of the 2008 sample of 77,006 and 2009 sample of 82,105 high school graduates,
approximately 45 percent were CTE completers. On average, CTE completers had lower high
school achievement and were more likely to be economically disadvantaged, African American,
P a g e | 2
and male compared to non-completers. The following summarizes study findings for college
enrollment, persistence, and completion.
In each graduating class approximately 66 percent of CTE completers and 73 percent of
non-completers enrolled in college within one-year of high school graduation.
On average, CTE completers were less likely to enroll in 4-year colleges and more likely
to enroll in 2-year colleges compared to non-completers.
By the end of the 5-year study period, approximately 57 percent of CTE completers and
64 percent of non-completers from the high school graduates of 2008 had earned
college credentials. College-enrolled CTE completers were more likely to earn
Associate’s degrees and equally likely to earn Bachelor’s degrees compared to non-
completers.
While college-enrolled CTE completers had similar chances of earning a Bachelor’s
degree compared to non-completers, CTE completers earned a smaller proportion of
these 4-year degrees because they were less likely to enroll in 4-year colleges.
Perhaps the most striking difference that we observed throughout the study
was the large benefit that high school graduates who earned Advanced
Studies diplomas—CTE completers and non-completers alike—have in
enrolling, persisting, and completing college compared to graduates who
earned Standard diplomas.
Our research demonstrated the value of high school students participating in a college-
preparatory course of study, represented by their completion of an Advanced Studies diploma.
The odds of Advanced Studies diploma-earners enrolling in 4-year colleges was approximately 6
times that of Standard diploma earners; the odds of Advanced Studies diploma-earners
enrolling in 2-year colleges was 1.8 times that of Standard diploma-earners. Once enrolled,
Advanced Studies diploma earners had more than 2 times the odds of persisting or earning a
college credential within 4-years compared to Standard diploma-earners. Among the college-
enrolled high school graduates, the odds of earning a Bachelor’s degree was more than 4 times
higher for Advanced Studies diploma earners compared to Standard diploma earners, and
Advanced Studies diploma-earners had better odds of earning Associate’s degrees as well.
These findings applied to CTE completers and non-completers.
For CTE programs, these findings emphasize the critical importance of ensuring that CTE
program participants have access to, participate in, and successfully master the academic
content embedded in Virginia’s Advanced Studies diploma requirements. To ensure access and
success, CTE experts throughout the country recommending integrating this content into
courses that also include instruction aimed at building students workplace and technical skills.
P a g e | 3
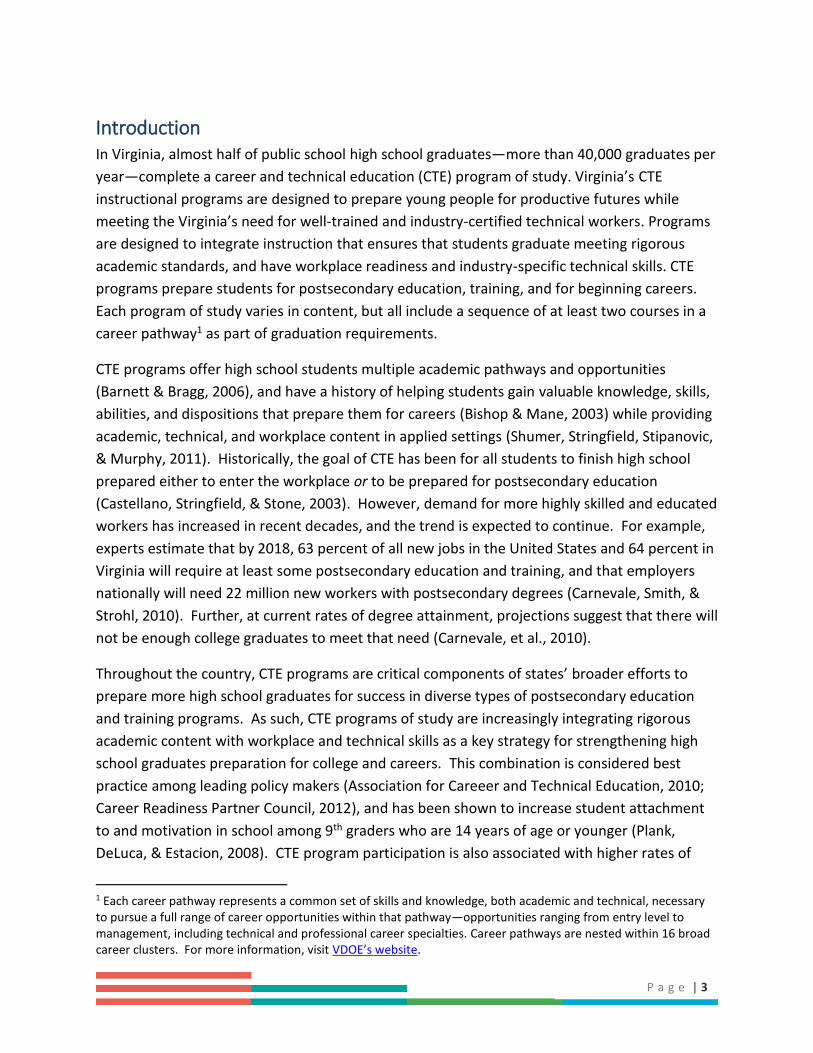
Introduction In Virginia, almost half of public school high school graduates—more than 40,000 graduates per
year—complete a career and technical education (CTE) program of study. Virginia’s CTE
instructional programs are designed to prepare young people for productive futures while
meeting the Virginia’s need for well-trained and industry-certified technical workers. Programs
are designed to integrate instruction that ensures that students graduate meeting rigorous
academic standards, and have workplace readiness and industry-specific technical skills. CTE
programs prepare students for postsecondary education, training, and for beginning careers.
Each program of study varies in content, but all include a sequence of at least two courses in a
career pathway1 as part of graduation requirements.
CTE programs offer high school students multiple academic pathways and opportunities
(Barnett & Bragg, 2006), and have a history of helping students gain valuable knowledge, skills,
abilities, and dispositions that prepare them for careers (Bishop & Mane, 2003) while providing
academic, technical, and workplace content in applied settings (Shumer, Stringfield, Stipanovic,
& Murphy, 2011). Historically, the goal of CTE has been for all students to finish high school
prepared either to enter the workplace or to be prepared for postsecondary education
(Castellano, Stringfield, & Stone, 2003). However, demand for more highly skilled and educated
workers has increased in recent decades, and the trend is expected to continue. For example,
experts estimate that by 2018, 63 percent of all new jobs in the United States and 64 percent in
Virginia will require at least some postsecondary education and training, and that employers
nationally will need 22 million new workers with postsecondary degrees (Carnevale, Smith, &
Strohl, 2010). Further, at current rates of degree attainment, projections suggest that there will
not be enough college graduates to meet that need (Carnevale, et al., 2010).
Throughout the country, CTE programs are critical components of states’ broader efforts to
prepare more high school graduates for success in diverse types of postsecondary education
and training programs. As such, CTE programs of study are increasingly integrating rigorous
academic content with workplace and technical skills as a key strategy for strengthening high
school graduates preparation for college and careers. This combination is considered best
practice among leading policy makers (Association for Careeer and Technical Education, 2010;
Career Readiness Partner Council, 2012), and has been shown to increase student attachment
to and motivation in school among 9th graders who are 14 years of age or younger (Plank,
DeLuca, & Estacion, 2008). CTE program participation is also associated with higher rates of
1 Each career pathway represents a common set of skills and knowledge, both academic and technical, necessary to pursue a full range of career opportunities within that pathway—opportunities ranging from entry level to management, including technical and professional career specialties. Career pathways are nested within 16 broad career clusters. For more information, visit VDOE’s website.
P a g e | 4
high school attendance and graduation (Bishop & Mane, 2004; Carnevale, Rose, & Hanson,
2012; Dare, 2006), including for students with disabilities (Shandra & Hogan, 2008).
Evidence is mixed on whether participating in CTE programs of study promote increased access
to and success in postsecondary education programs. While some studies show that on
average, high school graduates who complete a CTE program of study are more likely to enroll
in and graduate from college than similar graduates who were not CTE completers (Bishop and
Mane 2004; Dare 2006; Carnevale, Rose and Hanson 2012), others suggest that CTE has limited
influence after controlling for students high school coursetaking (DeLuca, Plank, & Estacion,
2006).
CTE programs in Virginia
In Virginia, high schools are required to implement “competency-based career and technical
education programs that integrate academic outcomes, career guidance, and job-seeking skills
for all secondary students.”2 Within this context, and requirements associated with federal
funding under the Perkins Act, schools have options to offer diverse CTE programs of study that
align with student interests and local labor needs. CTE programs of study fall within 16 Career
Clusters that were developed to “help students investigate careers and design their courses of
study to advanced their career goals” (Virginia Department of Education, 2014). CTE programs
are diverse, and prepare students for careers in fields such as health sciences; argriculture, food
and natural resources; arts, audio/video technology, and communitications; finance;
information technology; hospitality and tourism; and more. High school graduates are
considered “CTE Completers” after meeting Virginia’s high school graduation requirements3
and have completing a series of two or more CTE courses in a defined sequence.
VDOE’s CTE leaders are interested in using data and conducting research to better understand
the influence of CTE completion on graduates’ success when they leave high school—in college,
employment, and in the military. Using data available via VLDS (Virginia Longitudinal Data
System), this report describes postsecondary enrollment, persistence, and completion after
high school graduation for the Virginia public school graduating cohorts of 2008 and 2009. It is
one of two reports prepared as part of a broader research project assessing postsecondary and
employment outcomes several years after high school graduation (see Yamaguchi, Garland, &
Jonas, 2014).
2 From Virginia Standards of Quality, 2014, http://www.doe.virginia.gov/administrators/superintendents_memos/2014/183-14a.pdf. 3 See http://www.doe.virginia.gov/instruction/graduation/index.shtml.

P a g e | 5
Research approach and data sources This report describes outcomes for CTE completers compared to non-completers from the
public high school graduating cohorts of 2008 and 2009. We focused on answering the
following research questions:
1) What are the characteristics of CTE completers and non-completers who graduate from
high school?
2) What were the postsecondary enrollment outcomes for CTE completers?
3) What were the postsecondary persistence rates for CTE completers?
4) What other high school factors were associated with graduates postsecondary
enrollment, persistence, and completion?
We answered these questions using data made available through VLDS. VLDS is a system that
includes technology, people, policy, and governance. This system allows authorized users to
access data from multiple state agencies after it has gone through a complex double de-
identification process to ensure that individuals’ private, personal information are not provided
to research teams. Our research team, with sponsorship from VDOE, was authorized to access
high school, college, and wage records from VDOE, State Council of Higher Education for
Virginia (SCHEV), and the Virginia Employment Commission (VEC) records. This report used
data from VDOE and SCHEV only (see Yamaguchi, et al., 2014 for the corresponding report that
used employment records).
Research Approach
In answering the research questions, we set out to describe high school graduates’
postsecondary enrollment within one-year of high school graduation; assess whether college-
enrolled high school graduates remained in college, or persisted over time; and, whether they
earned a college credential. Using VLDS, we were able to calculate college enrollment in
graduates’ first year after high school; persistence in college through 2012; and degree
completion by fall 2013. This provided up to 4-years of college persistence data, and up to 5-
years of completion data for 2008 high school graduates.
We were also interested in understanding postsecondary outcome patterns for two other
factors: enrollment in 2- year versus 4-year colleges; and, whether high school diploma type
influenced postsecondary outcomes. Our interest in patterns of enrollment into 2- and 4-year
colleges stemmed from the nature of CTE programs themselves. Many of Virginia’s high school
CTE programs have articulation agreements with Virginia’s Community Colleges. While the
specifics of agreements at each high school vary, these types of agreements often enable
students to participate in college-level courses while in high school; help to ensure that high
school course content, learning experiences, and expectations align with the next steps in

P a g e | 6
education and training programs available in community colleges; and increase the chances
that high school graduates can experience seamless transitions from high school to college. As
such, it is possible that CTE completers’ enrollment patterns differ from those of non-
completers.
Our interest in understanding how high school diploma type influenced postsecondary
outcomes stems from national research demonstrating the critical role of high school courses in
predicting postsecondary outcomes (Adelman, 2006) and our previous research assessing
postsecondary outcomes for Virginia high school graduates. The minimum course
requirements in Virginia’s Advanced Studies diploma are aligned with courses that research
suggests are critical for college enrollment and success (Adelman, 2006). Also, previous
research in Virginia has shown that high school graduates’ diploma type is a strong predictor of
students’ college enrollment; enrollment directly in credit bearing college courses (Garland. et
al., 2011); success in college-level credit-bearing courses (Jonas, et al., 2012); and four-year
college persistence and completion (Jonas & Garland, 2014). This research has also shown that
the Standard diploma is associated with lower rates of postsecondary enrollment, persistence,
and completion relative to the Advanced Studies diploma. As such, we relied on the diploma
type as a categorical proxy measure for the rigor of the courses students took in high school
(Exhibit 1 for more information about minimum requirements students needed to meet to earn
Standard and Advanced Studies diplomas).

P a g e | 7
Exhibit 1. Description of minimum requirements for students to earn Virginia's Standard and Advanced Studies diplomas
Virginia has two diplomas that are federally recognized and available to all high school students, the Standard and Advanced Studies diploma. Students in this study who earned both diploma types were required to complete four years of high school English. Requirements for other core content areas varied by diploma type. The table below shows the minimum core course requirements for the 2008 cohort graduates earning each diploma type.4 The Advanced Studies diploma is aligned with the minimum course of study that students need to succeed in a four-year college program (Adelman, 2006). Students earning Virginia’s Advanced Studies diplomas were required to complete a course of study that included four years of content in each core content area and three years of foreign language. Students were required to complete mathematics courses that included Algebra II or higher, and science courses including chemistry or physics. Virginia’s 2008 and 2009 graduates who earned Standard diplomas were not required to participate in Algebra II, chemistry or physics, nor were they required to participate in foreign language courses. Major components of diploma requirements for Virginia's high school graduates of 2008
Diploma type Core Course Requirements Minimum high school credits required
Advanced Studies diploma English Mathematics* Lab Science History and Social Sciences Foreign Languages
4 4 4 4 3
Standard diploma English Mathematics** Lab Science History and Social Sciences Foreign Languages
4 3 3 3 0
* All courses were required to be at or above the level of algebra and include at least three different course selections from among: Algebra I, Geometry, Algebra II, or other mathematics courses above the level of Algebra II. **All courses were required to be at or above the level of Algebra and include at least two course selections from the following list: Algebra I, Geometry, Algebra II, or other mathematics courses above the level of algebra and geometry.
Throughout our research, we aimed to provide Virginia’s CTE leaders with information
describing the outcomes of CTE completers. We also calculated the enrollment, persistence,
and completion rates for high school graduates who were not CTE completers (or non-
completers), to serve as a comparison group. To provide this information, we calculated simple
descriptive statistics (i.e., numbers and percentages) for CTE completers and non-completers
who met each postsecondary outcome.
While the comparison between CTE completers and non-completers is informative, this direct
comparison does not take into account differences other than CTE completion status. To
4 Complete course requirements for each diploma may be found by visiting, http://www.doe.virginia.gov/instruction/graduation/index.shtml. The information available includes changes in graduation requirements that went into effect for first-time ninth graders entering high school in 2011/12 or later.

P a g e | 8
account for other differences in these populations, we used multivariate regression5 models to
interpret whether descriptive differences between outcomes for CTE completers and non-
completers were meaningful. The regression models enabled us to more closely approximate
“apples-to-apples” comparisons between CTE completers and non-completers. In each model,
we selected specific estimation procedures based on the measurement of the outcome of
interest. All models statistically controlled for student demographic characteristics and
program participation in high school, high school achievement, and school-level characteristics
using measures available within VLDS.
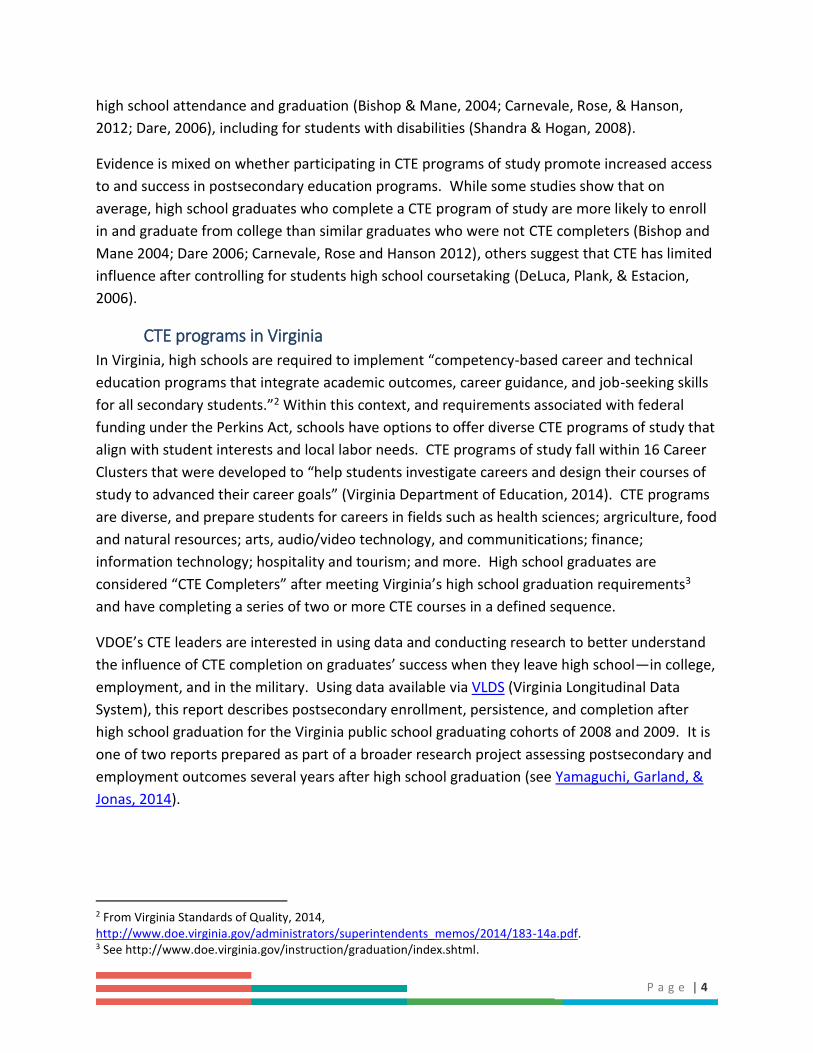
We developed the multivariate models based on the conceptual model of postsecondary and
workforce outcomes shown in Figure 1. In this study, we focused on postsecondary outcomes,
represented in Figure 1 by the green boxes. We controlled for student-level and school level
experiences, which are shown in blue in the figure. Items shown in gray were not included in
this study, but were included in statistical models used in Yamaguchi et al. (2014), which used
the same data to assess CTE completers’ workforce outcomes.
Student factors included in the statistical models were demographic information, high school
achievement, and attendance. Statistical controls for high school characteristics were created
by taking the average school achievement on state Algebra II and 11th grade writing tests6, and
diploma type; school population characteristics; and average attendance rates. We modeled
outcomes separately for 2- and 4-year colleges.7 To model college enrollment, we estimated
the influence of CTE completion and other factors on the full population of high school
graduates. We estimated separate models for the class of 2008 and 2009. To model
persistence and completion, we limited the sample population to college-enrolled students.
Complete results from the multivariate models are shown in Appendix A.
5 Multivariate analysis refers to statistical models that have 2 or more dependent (or outcome) variables. Multivariate regression includes one or more independent (or predictor) variables and 2 or more dependent (or outcome) variables. The statistical models used in this study included multiple independent variables and multiple, categorical dependent variables. 6 We chose to use the writing test and not the reading test based on previous research showing that Virginia’s 11th grade writing test was a stronger predictor of college outcomes than reading (Garland, et al., 2011). From that research, it was not clear whether this finding was related to the content—writing itself—or greater variability in the writing test scores relative to the reading scores. 7 Due to the small number of students who enrolled in less than 2-year programs, these students were included in the models for 2-year college enrollment, persistence, and completion.
P a g e | 9
Figure 1. Conceptual model of CTE postsecondary and workforce outcomes
Data sources
With authorization from VDOE and SCHEV, we used VLDS to request and receive de-identified,
individual records for students in the high school graduating cohorts of 2008 and 2009. We
accessed high school records from VDOE’s state administrative data, and postsecondary
records from SCHEV and the National Student Clearinghouse (NSC) records that VDOE
maintains. Based on VLDS secure methods, we were able to link records from individuals in the
data using a randomly generated identifier unique to the data we requested. All personal
information (e.g., names, social security and other identification numbers, date of birth) were
stripped from the data before they were securely transferred to the research team.
Data from graduates’ high school experiences
High school records included data for the Virginia On-Time Graduation Rate cohorts of 2008
and 2009. Records included student demographic characteristics (e.g., race/ethnicity,
economically disadvantaged status); program participation (e.g., support services for students
with disabilities and English learners); high school achievement based on scores from the
Virginia Algebra II and 11th grade writing tests; and high school diploma type.

P a g e | 10
Data from high school graduates’ postsecondary enrollment, persistence, and completion
Using VLDS, we obtained data for high school graduates’ postsecondary enrollment,
persistence, and degree completion from SCHEV and NSC. We combined the two sources of
postsecondary data to obtain the most complete, unduplicated data set available on Virginia’s
high school graduates who enroll in college nationwide (see Appendix B, Jonas, 2014, for more
information on the value of the combined data sets). Data from SCHEV were available through
the spring semester, 2012; data from NSC were available through fall 2013. Due to the
longitudinal nature of the persistence measure, and the importance of combining the two data
sets for this measure, persistence calculations ended in the spring of 2012, which follows the
2008 high school graduates for four years. Our college credential calculations were based on
earning a credential any time for which we had data, and are not dependent on longitudinal,
year-on-year linkages in the data. As such, we reported outcomes for 2008 high school
graduates who earned credentials using all of the data available at the time, which was for up
to 5 years after high school graduation.
Data from both SCHEV and NSC included the college in which the student was enrolled, college
type (4-year, 2-year, less than 2-year), enrollment dates and timing, and credentials earned.
We used this information to create the following outcome variables used in the project:
College enrollment: identifies students who enrolled in college within one-year of high
school graduation, excluding summer enrollments.
College persistence: identifies students who remained college-enrolled in each
subsequent school year, or, who had earned a credential in a prior semester. Including
students who earned a credential as part of our persistence definition ensures that the
results do not inadvertently penalize students who earned a credential and left college.
For example, students who earned a 1-year certificate in their first year of college are
counted as having persisted in all four years.
College completion: identifies students who earned 1-, 2-, and 4-year college
credentials by fall 2013.8 This enabled us to document credentials earned for up to 5
years for the 2008 graduates and up to 4 years for the 2009 graduates. We note here
8 One year programs typically provide students an opportunity for focused study in a specific subject, most often a vocational topic, while 2- and 4-year degree programs offer broader (at the undergraduate level) and more advanced platforms of study. It is important to note that this data set, which includes records from SCHEV and NSC, may not include all certificates awarded to high school graduates, but, is currently the most complete data available for Virginia high school graduates. More information about how Virginia defines college completion is available by reviewing SCHEV’s Guide to the Degrees Awarded Reports. For an overview of challenges related to one-year certificates and other non-degree credentials, see the report entitled, Creating a Competency-Based Credentialing Ecosystem (2014) published by the Center for Law and Social Policy (CLASP).

P a g e | 11
that data from the 2012/13 school year were limited to credentials that were
documented in the NSC data—SCHEV data were only available through spring 2012.
College-type: identifies students as enrolled in 2- or 4-year colleges based on each
student’s last enrollment during the first year after high school. For example, students
who enrolled in 2-year colleges in the first fall after high school graduation, and then
enrolled in a 4-year college in the spring of the same school year (e.g., 2008/2009) were
categorized as being enrolled in 4-year colleges under for this measure. Throughout the
enrollment and persistence calculations, we reported outcomes based on the college
type of high school graduates’ first year of college, regardless of students’ transfer
status in later years. For example, 2008 high school graduates who enrolled in 2-year
colleges for the 2008/09 school year and transferred to a 4-year college in 2009/10 were
categorized as 2-year college students in all of the enrollment and persistence
calculations. College completion data capture all degree types, regardless of the type of
college in which a student enrolled in the first year after high school graduation.
Study results Throughout the report, we display descriptive statistics (numbers and percentages) of CTE
completers and non-completers who met the enrollment, persistence, and completion
outcomes. We present the results using graphs that show CTE completers in purple and non-
completers in blue. We then use the results of the regression models to help investigate
whether observed differences in the descriptive outcomes were associated with CTE program
participation after adjusting for other differences between CTE and non-CTE completers.
What were the characteristics of CTE completers and non-completers who graduated
from high school?
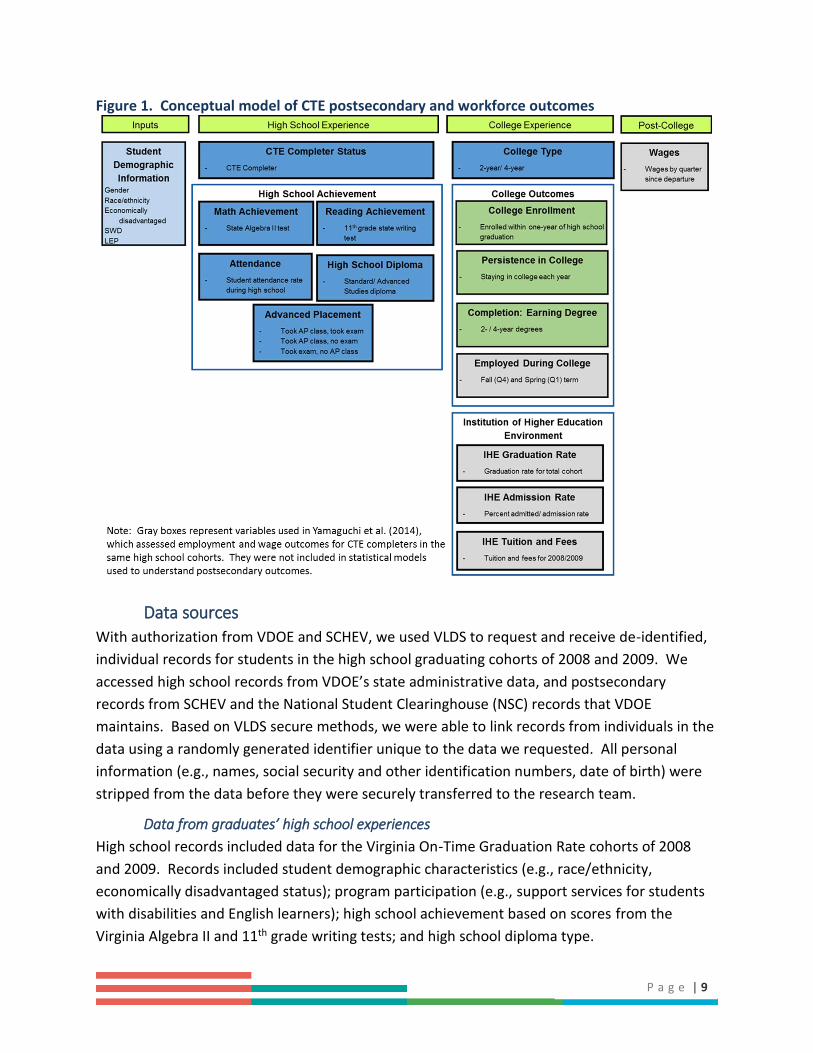
CTE completers comprised just under half of all high school graduates in the 2008 and 2009
cohorts (see Figure 2). The 43.5 percent of CTE completers in 2008 represents 33,464 high
school graduates, and in 2009, the number increased to 37,544.
P a g e | 12
Figure 2. Percent of CTE completers in Virginia's 2008 and 2009 graduating cohorts
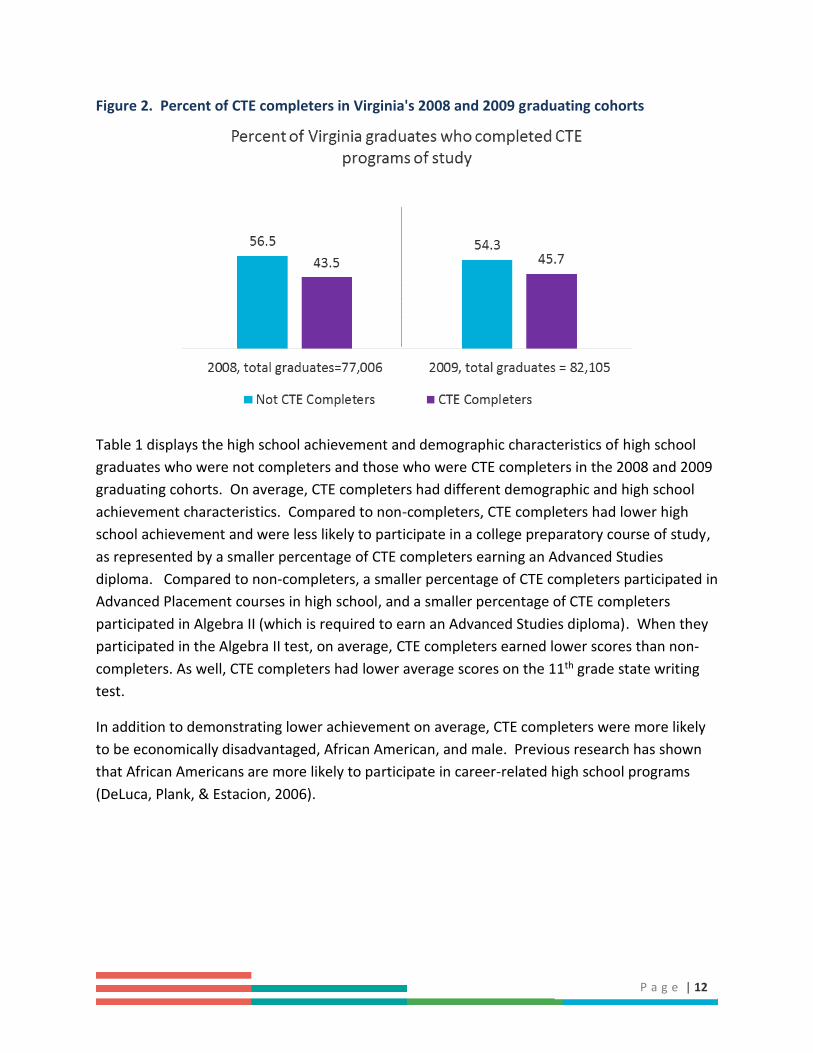
Table 1 displays the high school achievement and demographic characteristics of high school
graduates who were not completers and those who were CTE completers in the 2008 and 2009
graduating cohorts. On average, CTE completers had different demographic and high school
achievement characteristics. Compared to non-completers, CTE completers had lower high
school achievement and were less likely to participate in a college preparatory course of study,
as represented by a smaller percentage of CTE completers earning an Advanced Studies
diploma. Compared to non-completers, a smaller percentage of CTE completers participated in
Advanced Placement courses in high school, and a smaller percentage of CTE completers
participated in Algebra II (which is required to earn an Advanced Studies diploma). When they
participated in the Algebra II test, on average, CTE completers earned lower scores than non-
completers. As well, CTE completers had lower average scores on the 11th grade state writing
test.
In addition to demonstrating lower achievement on average, CTE completers were more likely
to be economically disadvantaged, African American, and male. Previous research has shown
that African Americans are more likely to participate in career-related high school programs
(DeLuca, Plank, & Estacion, 2006).
P a g e | 13
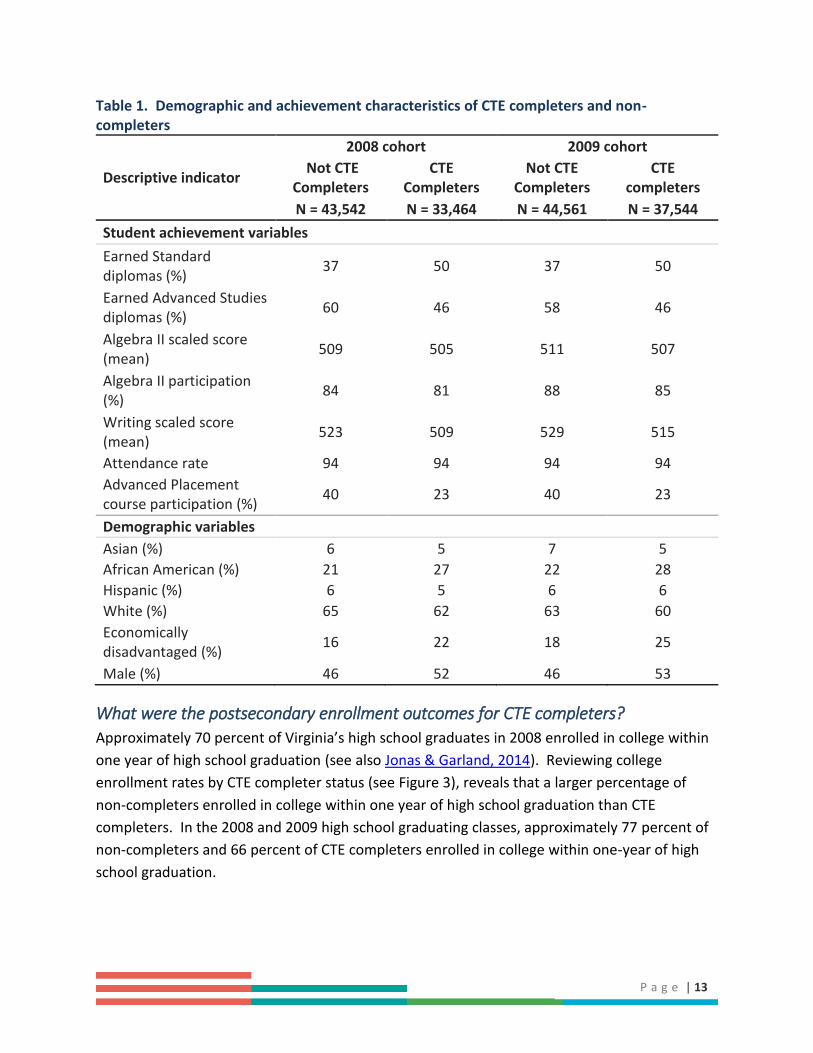
Table 1. Demographic and achievement characteristics of CTE completers and non-completers
2008 cohort 2009 cohort
Descriptive indicator Not CTE
Completers CTE
Completers Not CTE
Completers CTE
completers N = 43,542 N = 33,464 N = 44,561 N = 37,544
Student achievement variables
Earned Standard diplomas (%)
37 50 37 50
Earned Advanced Studies diplomas (%)
60 46 58 46
Algebra II scaled score (mean)
509 505 511 507
Algebra II participation (%)
84 81 88 85
Writing scaled score (mean)
523 509 529 515
Attendance rate 94 94 94 94
Advanced Placement course participation (%)
40 23 40 23
Demographic variables
Asian (%) 6 5 7 5
African American (%) 21 27 22 28
Hispanic (%) 6 5 6 6
White (%) 65 62 63 60
Economically disadvantaged (%)
16 22 18 25
Male (%) 46 52 46 53
What were the postsecondary enrollment outcomes for CTE completers?
Approximately 70 percent of Virginia’s high school graduates in 2008 enrolled in college within
one year of high school graduation (see also Jonas & Garland, 2014). Reviewing college
enrollment rates by CTE completer status (see Figure 3), reveals that a larger percentage of
non-completers enrolled in college within one year of high school graduation than CTE
completers. In the 2008 and 2009 high school graduating classes, approximately 77 percent of
non-completers and 66 percent of CTE completers enrolled in college within one-year of high
school graduation.

P a g e | 14
Figure 3. Percent of CTE completers and non-completers who enrolled in college within one year of high school graduation
Figure 4 displays the distribution of college-enrolled graduates by CTE completion status and
the type of college in which they enrolled in the first year after high school. Results show that
compared to non-completers, a larger percentage of college-enrolled CTE completers initially
enrolled in 2-year colleges and a smaller percentage of CTE completers enrolled in 4-year
colleges.
Figure 4. Percentage of college-enrolled high school graduates, by college type and CTE completion status
*Includes enrollments in 1-year postsecondary programs for which data were available.
P a g e | 15
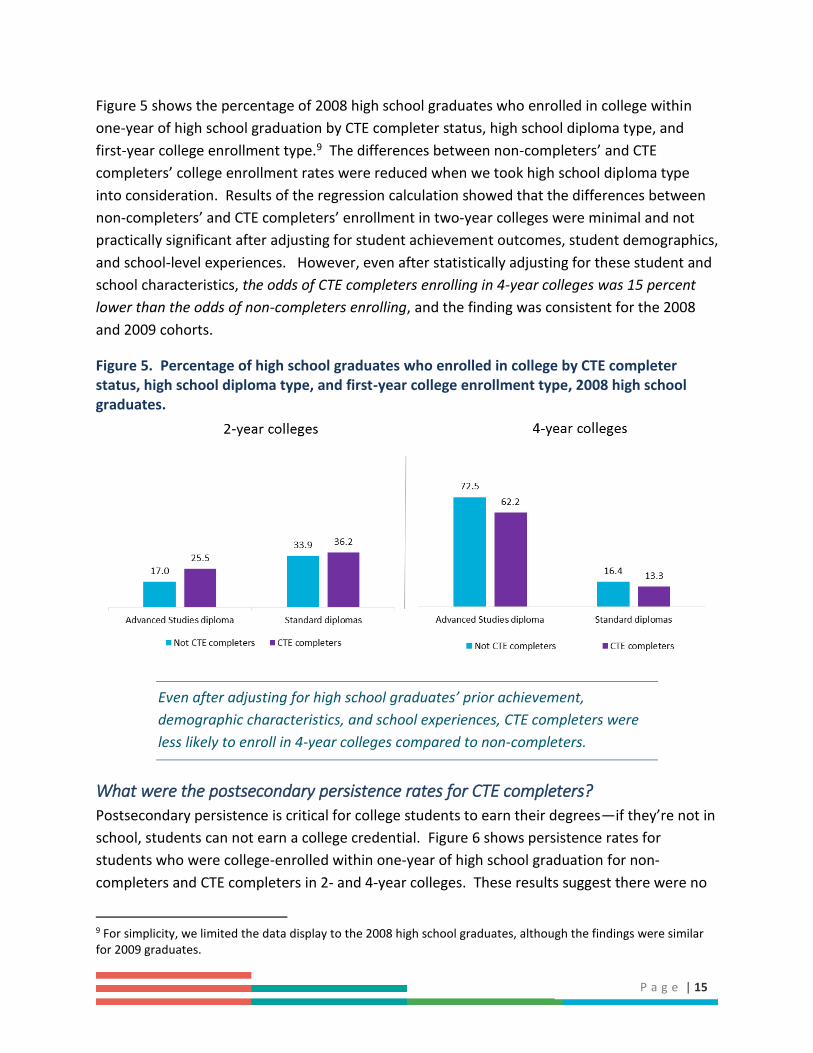
Figure 5 shows the percentage of 2008 high school graduates who enrolled in college within
one-year of high school graduation by CTE completer status, high school diploma type, and
first-year college enrollment type.9 The differences between non-completers’ and CTE
completers’ college enrollment rates were reduced when we took high school diploma type
into consideration. Results of the regression calculation showed that the differences between
non-completers’ and CTE completers’ enrollment in two-year colleges were minimal and not
practically significant after adjusting for student achievement outcomes, student demographics,
and school-level experiences. However, even after statistically adjusting for these student and
school characteristics, the odds of CTE completers enrolling in 4-year colleges was 15 percent
lower than the odds of non-completers enrolling, and the finding was consistent for the 2008
and 2009 cohorts.
Figure 5. Percentage of high school graduates who enrolled in college by CTE completer status, high school diploma type, and first-year college enrollment type, 2008 high school graduates.
Even after adjusting for high school graduates’ prior achievement,
demographic characteristics, and school experiences, CTE completers were
less likely to enroll in 4-year colleges compared to non-completers.
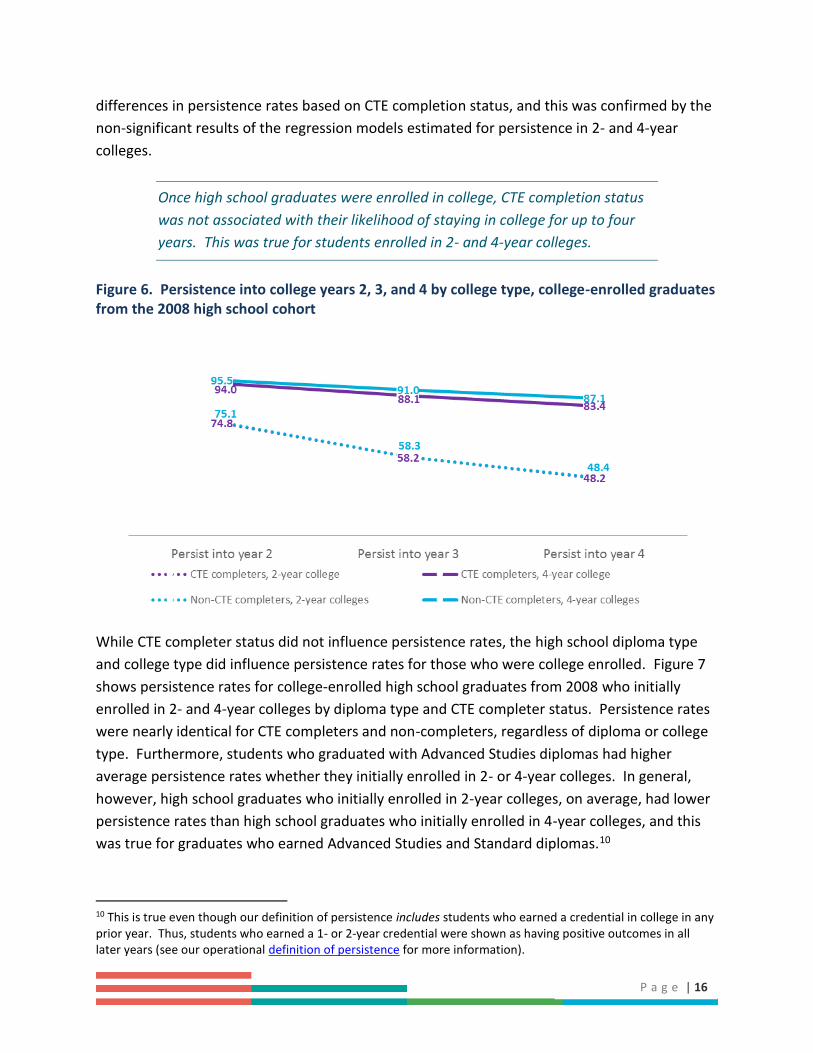
What were the postsecondary persistence rates for CTE completers?
Postsecondary persistence is critical for college students to earn their degrees—if they’re not in
school, students can not earn a college credential. Figure 6 shows persistence rates for
students who were college-enrolled within one-year of high school graduation for non-
completers and CTE completers in 2- and 4-year colleges. These results suggest there were no
9 For simplicity, we limited the data display to the 2008 high school graduates, although the findings were similar for 2009 graduates.
P a g e | 16
differences in persistence rates based on CTE completion status, and this was confirmed by the
non-significant results of the regression models estimated for persistence in 2- and 4-year
colleges.
Once high school graduates were enrolled in college, CTE completion status
was not associated with their likelihood of staying in college for up to four
years. This was true for students enrolled in 2- and 4-year colleges.
Figure 6. Persistence into college years 2, 3, and 4 by college type, college-enrolled graduates from the 2008 high school cohort
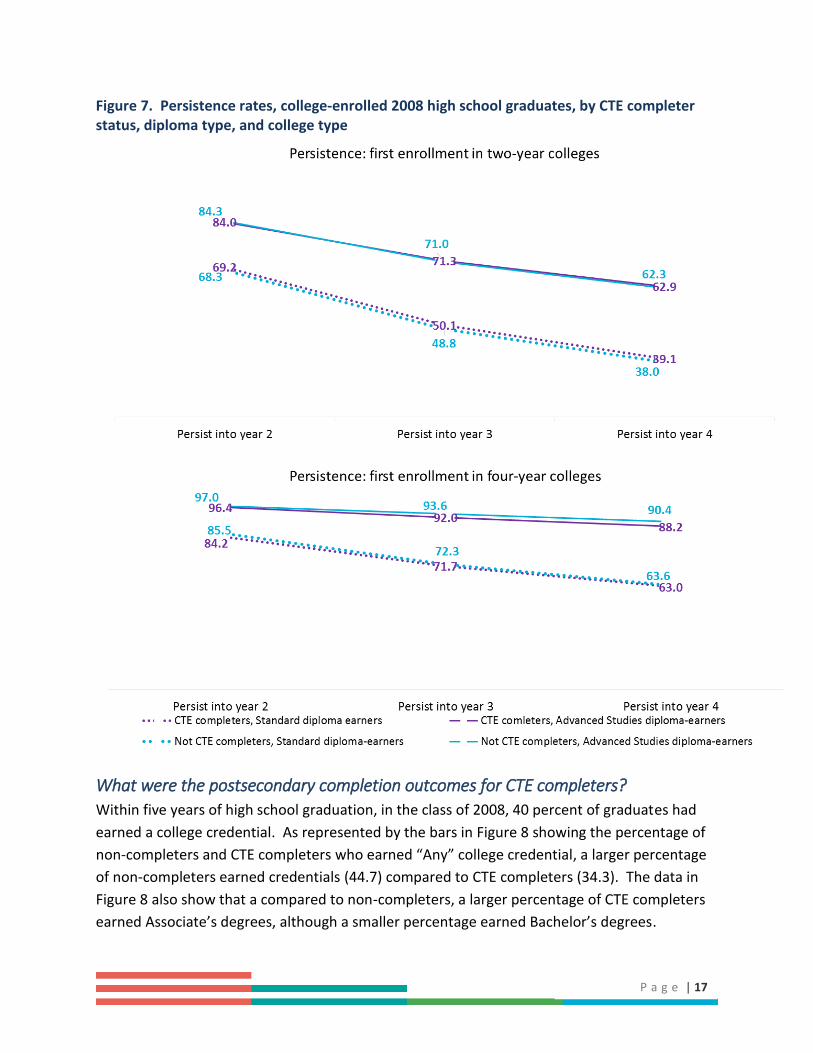
While CTE completer status did not influence persistence rates, the high school diploma type
and college type did influence persistence rates for those who were college enrolled. Figure 7
shows persistence rates for college-enrolled high school graduates from 2008 who initially
enrolled in 2- and 4-year colleges by diploma type and CTE completer status. Persistence rates
were nearly identical for CTE completers and non-completers, regardless of diploma or college
type. Furthermore, students who graduated with Advanced Studies diplomas had higher
average persistence rates whether they initially enrolled in 2- or 4-year colleges. In general,
however, high school graduates who initially enrolled in 2-year colleges, on average, had lower
persistence rates than high school graduates who initially enrolled in 4-year colleges, and this
was true for graduates who earned Advanced Studies and Standard diplomas.10
10 This is true even though our definition of persistence includes students who earned a credential in college in any prior year. Thus, students who earned a 1- or 2-year credential were shown as having positive outcomes in all later years (see our operational definition of persistence for more information).
P a g e | 17
Figure 7. Persistence rates, college-enrolled 2008 high school graduates, by CTE completer status, diploma type, and college type
What were the postsecondary completion outcomes for CTE completers?
Within five years of high school graduation, in the class of 2008, 40 percent of graduates had
earned a college credential. As represented by the bars in Figure 8 showing the percentage of
non-completers and CTE completers who earned “Any” college credential, a larger percentage
of non-completers earned credentials (44.7) compared to CTE completers (34.3). The data in
Figure 8 also show that a compared to non-completers, a larger percentage of CTE completers
earned Associate’s degrees, although a smaller percentage earned Bachelor’s degrees.

P a g e | 18
Figure 8. Percentage of high school graduates who earned college credentials within five years of high school graduation
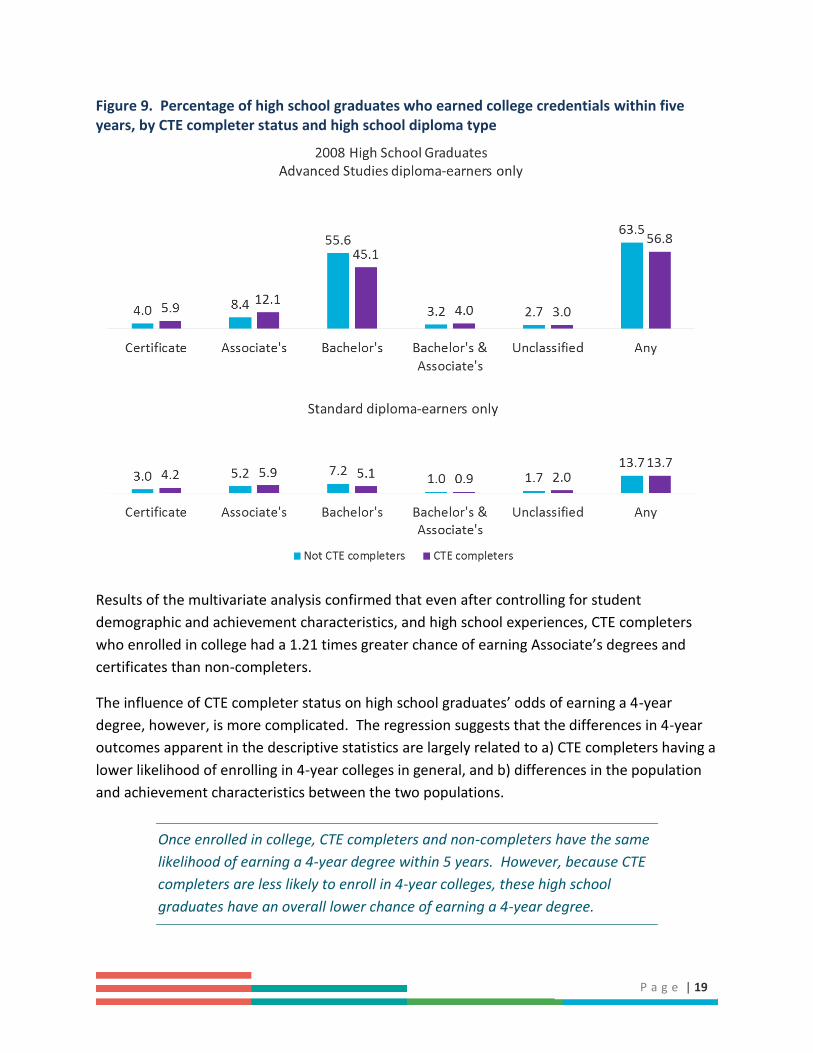
As was the case with postsecondary enrollment and persistence, whether or not high school
graduates participated in a college preparatory course of study, represented by the Advanced
Studies diploma, had the largest relative influence on whether or not high school graduates
earned a college credentials. Figure 9 shows the percentage of the 2008 high school graduates
who earned college credentials by CTE status and high school diploma type. Approximately 64
percent of non-completers who had earned Advanced Studies diplomas in high school had
earned a college credential within 5 years of high school graduation, and 57 percent (56.8) of
CTE completers who earned Advanced Studies diplomas earned a college credential within 5
years. For non-completers and CTE completers who earned Standard diplomas, just under 14
percent (13.7) earned college credentials within 5 years.
P a g e | 19
Figure 9. Percentage of high school graduates who earned college credentials within five years, by CTE completer status and high school diploma type
Results of the multivariate analysis confirmed that even after controlling for student
demographic and achievement characteristics, and high school experiences, CTE completers
who enrolled in college had a 1.21 times greater chance of earning Associate’s degrees and
certificates than non-completers.
The influence of CTE completer status on high school graduates’ odds of earning a 4-year
degree, however, is more complicated. The regression suggests that the differences in 4-year
outcomes apparent in the descriptive statistics are largely related to a) CTE completers having a
lower likelihood of enrolling in 4-year colleges in general, and b) differences in the population
and achievement characteristics between the two populations.
Once enrolled in college, CTE completers and non-completers have the same
likelihood of earning a 4-year degree within 5 years. However, because CTE
completers are less likely to enroll in 4-year colleges, these high school
graduates have an overall lower chance of earning a 4-year degree.

P a g e | 20
Specifically, the regression results suggest that once they are college-enrolled, CTE completers
have the same odds of earning a Bachelor’s degree as non-completers after controlling for
students’ high school demographic characteristics, achievement, and experiences.
Nonetheless, it is important to note that even if they can be as successful as non-completers in
4-year colleges, CTE completers cannot earn these degrees unless they enroll in 4-year
colleges—and CTE completers enroll in 4-year colleges at lower rates than non-completers who
are similarly qualified.
What other high school factors were associated with graduates postsecondary
enrollment, persistence, and completion?
Perhaps the most striking difference that may be observed throughout the results we
presented was the difference in postsecondary outcomes between high school graduates who
earned Advanced Studies diplomas and those who earned Standard diplomas. For example,
Figure 10 shows the percentage of high school graduates who enrolled in college within one-
year of graduating high school by diploma type and CTE completer status for the 2008 and 2009
graduating classes. Reviewing the data shows that approximately 40 percent more Advanced
Studies diploma-earners enrolled in college within one-year of high school graduation than
Standard diploma earners, regardless of CTE status.
Figure 10. Percentage of college-enrolled high school graduates college enrollment within one-year of high school graduation by CTE completer status and high school diploma type
The results of the regression model (see Appendix A) showed that differences associated with
diploma type remained strong after adjusting for other factors, such as student demographic
characteristics, English learner and disability status, achievement on high school Algebra II and
writing tests, and school experiences. The odds of Advanced Studies diploma-earners enrolling
in 4-year colleges was approximately 6 times that of Standard diploma earners; the odds of

P a g e | 21
Advanced Studies diploma-earners enrolling in 2-year colleges was 1.8 times that of Standard
diploma-earners. High school graduates who earned other diplomas for which only students
with disabilities are eligible had lower odds of enrolling in both 2- and 4-year colleges than
Standard diploma-earners.11
High school graduates who earned Advanced Studies diplomas also had more than 2 times the
odds of persisting into their fourth year of college, for both 2- and 4-year colleges; had more
than 4 times greater chances of earning a Bachelor’s degree within 5 years of high school
graduation; and had greater odds of earning Associate’s degrees.
Other factors were both statistically and practically significant in the regression models. For
example, student demographic characteristics, including race/ethnicity and economically
disadvantaged status influenced college enrollment, persistence, and completion. Also,
achievement on state Algebra II and writing assessments was associated with enrollment,
persistence and completion after controlling for other factors. Importantly, however,
differences in postsecondary outcomes that we observed between Standard and Advanced
Studies diploma-earners were larger than other differences between groups (details are
available in Appendix A). This finding is consistent with previous research, which showed that
taking and succeeding in a more rigorous course of study may reduce achievement gaps
between different demographic groups (Garland, et al., 2011; Jonas, et al., 2012).
Summary and recommendations This research project investigated the influence of CTE program completion on college
enrollment within one year of high school graduation, persistence for four years, and
graduation within five years. Initial analyses revealed that compared to high school graduates
who did not complete a CTE program of study, CTE completers, on average, had lower high
school achievement, were more likely to be economically disadvantaged, male, and African
American.
On average, a smaller proportion of CTE completers enroll in college and earn degrees.
However, statistical analysis suggests that some of these differences are related to students’
high school achievement and demographic factors.
Compared to non-completers who had similar high school achievement, demographic
characteristics, and high school experiences:
CTE completers were more likely to enroll in 2-year college;
11 Descriptive statistics for students who earned Virginia’s Special and Modified Standard diplomas are not shown due to small sample of such diploma-earners who enrolled in college.
P a g e | 22
o Had similar chances of persisting in 2-year colleges; and
o Had greater chances of earning an Associate’s degree
CTE completers were less likely to enroll in 4-year colleges;
o Once enrolled in college, CTE completers had equal chances of persisting in
college, and similar chances of earning a 4-year degree.
We found that CTE completers who enrolled in college have similar chances of earning a 4-year
degree as non-completers. Nonetheless, CTE completers did not earn 4-year degrees at similar
rates because they were less likely to enroll in 4-year colleges. This attainment gap should be
further investigated. CTE completers and those helping to guide students into college may be
more familiar with 2-year colleges, as a result of the strong ties between many high school CTE
programs and community colleges. However, this should in no way limit high school graduates’
opportunity to make informed choices about college enrollment. On average, bachelor-degree
earners have higher earnings that associate-degree earners, although this is not the case for all
types of college degrees. It is important that high schools support students’ success finding the
college match in a fully informed way—that includes understanding college costs and the
potential long-term pay-off of different degrees and even different colleges.
The importance of high school course-taking
The Advanced Studies diploma had the strongest unique influence on high school graduates’
college enrollment and completion. This diploma requires students to take a minimum set of
courses that most four-year colleges require for admission and, in Virginia’s community
colleges, is associated with a higher chance of students enrolling directly and being successful in
credit-bearing courses (Garland, et al., 2011; Jonas, et al., 2012). While previous studies
showed that descriptively, a larger proportion of students who earned the Advanced Studies
diploma persisted in college and earned degrees (Jonas & Garland, 2014), this study showed
that this remains true after controlling for other factors, including school environment, student
demographic characteristics, and student achievement factors, including CTE completion status,
outcomes on state Algebra II and writing tests and Advanced Placement course participation.
With guidance and support from the state, Virginia’s CTE programs are working towards
strengthening local CTE programs of study and integrating rigorous academic content that
aligns with a college-preparatory course of study. In their work, educators can strive to
integrate the academic content of the Advanced Studies diploma into CTE programs and
courses, which will provide students with both rigorous and relevant education they need for
long-term success.
Encouraging and restructuring CTE programs to give all high school graduates the opportunity
to earn the Advanced Studies diploma is important regardless of students interests in pursuing
a 4-year degree or higher. The evidence is clear that high school graduates who earn Virginia’s

P a g e | 23
Advanced Studies diplomas have a better chance at success in both 2- and 4- year colleges, and,
as a result, have more choices about their own futures.
While helping more students earn the Advanced Studies diploma, it is critical that high schools
ensure that students’ experiences in college-preparatory courses meet external standards, so
that students are exposed to and successful in high quality, rigorous courses expected of these
graduates. This study showed that high school students’ coursework matters more than any
other factor in high school that we examined. It is critical, however, that educators understand
the importance of maintaining the academic rigor in college preparatory courses. National
research makes clear that policy and practices that mandate college preparatory curriculum, on
their own, may not lead to increased college attendance or success (Allensworth, Nomi,
Montgomery, Lee, & Mazzeo, 2010). Rather, such policies may be provide only one piece of the
puzzle. In addition to policy changes, it is also critical to build high schools’ capacity to engage
lower performing students in more rigorous curriculum using different instructional
approaches. As well, it is critical that we build school systems’ capacity to strengthen students’
preparation before they reach high school—throughout grades K-8 (Dougherty & Mellor, 2009).
Recommendations The results of this study and others strongly suggest that schools and communities should
ensure that all students—CTE completers and non-completers—have access and opportunities
to successfully complete a program of study that is consistent with Virginia’s Advanced Studies
diploma. While state policy permits high school students to graduate without completing the
minimum requirements of the Advanced Studies diploma, it is important for CTE leaders
consider how best to implement the policy and develop practices that promote and
strengthens students’ preparation for college and careers. CTE programs are in the unique
position of already focusing on career skills, and, in Virginia, for several years, have been
striving to ensure that more completers earn Advanced Studies diplomas.
To further support of these local efforts, we recommend that state and local CTE leaders focus
on the following:
1) Start early—not later than 6th grade—to prepare students for success in course content
that will enable them to graduate with an Advanced Studies diploma. This will require
changes in local practice to strengthen instructional programs, increase differentiation,
and increase the availability of support systems for students who are not on track
towards earning an Advanced Studies diploma. Such efforts should focus on ensuring
students have the right foundational skills in core areas that facilitate success in diverse
high school courses.
P a g e | 24
2) Within CTE programs, review course content of existing programs of study to identify
gaps and strengthen programs, and validate program content with business and
industry. The review should focus on ensuring that all programs of study provide
students with access to content they need to earn Virginia’s Advanced Studies diploma,
and, encouraging students to take such pathways. Simultaneously, the process should
ensure that educators integrate academic, workplace, and technical content in courses,
rather than requiring students to take courses that separate content. This combination
offers students rigorous and relevant opportunities that prepare them for success after
high school. As well, such integrated content ensures that high school graduates are
prepared with skills they need to make their own choices about the future—whether
graduates’ choices take them into college or other type of postsecondary training, into
the military, or directly into a career. Changing CTE programs throughout the state will
take time—and requires strong leadership that engages educators, parents, business
leaders, and other community leaders in a process that may require significant local
change.
3) Conduct deeper program reviews that help strengthen administrators’ use of data to
guide instructional decisions, strengthen teaching, and improve student outcomes. Part
of this process involves the development of leading and lagging indicators of the rigor of
high school programs of study. Many Virginia school divisions already document the
diploma students are working towards (leading indicator) and earn upon graduation
(lagging indicator). With CTE programs, leaders can use these indicators to better
understand which students are on which pathway, and to identify programs, schools, or
pathways that may hinder students’ ability to earn the more demanding Advanced
Studies diploma. Additional information about using data to assess and monitor
progress within Virginia’s CTE programs is available in the College and Career Ready Self-
Assessment Tool for Virginia Career and Technical Education Programs (Jonas, Flory &
Sun, 2013), such as the importance of collecting data on students’ industry credentials
earned; participation and success in dual-credit programs; work-based learning
experiences; and more.
4) VDOE should continue to support local leaders’ successful use of existing data, and help
state and local leaders gather additional data that can provide critical information about
CTE program effectiveness. Virginia does not currently have access to two critical
student outcomes that, if they became available, would provide important information
about the impact of CTE programs on student outcomes. These are: a) employment for
high school graduates who did not enroll in a Virginia public or non-profit university, and
b) graduates’ military enlistment. In particular, understanding employment outcomes
for CTE completers who do not enroll in college is a high priority for VDOE’s CTE leaders.
To enable Virginia to connect de-identified high school records to de-identified state

P a g e | 25
employment records using VLDS, Virginia would need to add another agency to the
system that can independently connect to VDOE and VEC records. Other states have
demonstrated success by incorporating records from the Department of Motor Vehicles
(see Barrera, Singletary, & Brown, 2013).
5) VDOE’s CTE office should continue to leverage VLDS to assess the long-term outcomes
of CTE completers to gain a more nuanced understanding of the benefits of CTE
participation for high school students. This project, which includes the results
presented in this paper and those presented in Yamaguchi and colleagues (2014),
provided leaders with a high-level picture of 4- and 5-year outcomes for CTE completers.
However, additional information is important to continue to provide data-based
information to state and local program leaders. For example, given the state and
national focus on industry credentialing, it would be useful to conduct research
specifically focused on understanding outcomes of students who earned industry
credentials in high school. Another important direction for research would be to
develop a clear understanding of long-term outcomes for CTE completers who
participated in different career pathways in high school. Having this information can
provide students with direct evidence to help them make course-taking decisions.

P a g e | 26
Works Cited Adelman, C. (2006). The Toolbox Revisited: Paths to Degree Completion From High School
Through College. 2006: U.S. Department of Education.
Allensworth, E., Nomi, T., Montgomery, N., & Lee, V. (2009). College preparatory curriculum for
all: Academic consequences of requiring Algebra I and English I for ninth graders in
Chicago. Educational Evaluation and Policy Analysis, 31, 367-391.
Association for Career and Technical Education. (2010). What is “career ready”? Alexandria, VA.
Barnett, E. A., & Bragg, D. D. (2006). Academic pathways and increased opportunities for underserved students: Crosscutting themes and lessons learned. New Directions for Community Colleges, 135, 101-107.
Barrera, R., Singletary, K. J., & Brown, K. (2013). SLDS topical webinar summary: Using DMV
records to access social security numbers. Washington DC: IES SLDS program.
Bishop, J. H., & Mane, F. (2003). The impacts of career-technical education on high school completion and labor market success. Ithaca, NY: Center for Advanced Human Resources Studies Working Paper Series, Cornell University.
Bishop, J. H., & Mane, F. (2004). The impacts of career-technical education on high school labor market success. Economics of Education Review, 23, 381-402.
Carnevale, A. P., Rose, S. J., & Hanson, A. R. (2012). Certificates: Gateway to Gainful Employment and College Degrees. Washington DC: Georgetown University Center on Education and the Workforce.
Carnevale, A. P., Smith, N., & Strohl, J. (2010, June). Help wanted: Projections of jobs and
education requirements through 2018. Retrieved 2011, from Center on Education and
the Workforce, Georgetown University:
http://www9.georgetown.edu/grad/gppi/hpi/cew/pdfs/State-LevelAnalysis-web.pdf
Career Readiness Partner Council. (2012). Building blocks for change: What it means to be
career ready. Silver Spring, MD.
Castellano, M., Stringfield, S., & Stone, J. R. (2003). Secondary career and technical education and comprehensive school reform: Implications for research and practice. Review of Educational Research, 73(2), 231-272.
Dare, D. E. (2006). The role of career and technical education in facilitating student transitions to postsecondary education. New Directions for Community Colleges, 135, 73-80.
DeLuca, S., Plank, S., & Estacion, A. (2006). Does career and technical education affect college
enrollment? St. Paul, MN: National Research Center for Career and Technical Education.
P a g e | 27
Dougherty, C., & Mellor, L. (2009). Preparation Matters. Retrieved March 15, 2012, from
National Center for Educational Achievement:
http://www.nc4ea.org/linkservid/3D2C049D-CFCF-1F49-B20F714152BD9E25/showMeta/0/
Garland, M., LaTurner, J., Herrera, A., Jonas, D., & Dougherty, C. (2011). High School Predictors
of College Readiness: Determinants of Developmental Course Enrollment and Second-
Year Postsecondary Persistence in Virginia. Richmond VA: Virginia Department of
Education.
Jonas, D. L. (2014). Researchers Guide to Using VLDS. Herndon, Virginia: CIT Connect.
Jonas, D. L., Flory, M., & Sun, C. (2013). College and career ready self-assessment tool for
Virginia Career and Technical Education programs. Richmond, VA: Commonwealth of
Virginia Department of Education.
Jonas, D., & Garland, M. (2014). High school graduates’ four year college enrollment,
persistence, and completion. Herndon, VA: Center for Innovative Technology.
Jonas, D., Dougherty, C., Herrera, A., LaTurner, J., Garland, M., & Ware, A. (2012). High School
Predictors of College Readiness: Determinants of High School Graduates' Enrollment and
Successful Completion of First-Year Mathematics and English College Courses in Virginia.
Richmond, VA: Virginia Department of Education.
Plank, S. B., DeLuca, S., & Estacion, A. (2008). High school dropout and the role of career and technical education: A survival analysis of surviving high school. Sociology of Education, 81(October), 345-370.
Shandra, C. L., & Hogan, D. P. (2008). School-to-work program participation and the post-high school employment of young adults with disabilities. Journal of Vocational Rehabilitation, 29, 117-130.
Shumer, R., Stringfield, S., Stipanovic, N., & Murphy, N. (2011). Programs of study: A cross-study
examination of programs in three states. Louisville, KY: Natoinal Research Center for
Career and Technical Education.
State Council of Higher Education for Virginia. (2014, April 30). Graduation Rates, Institutional
Profile, 4-10 years, by subcohorts. Retrieved from SCHEV Research:
http://research.schev.edu/gradrates/subcohorts_instprofile.asp
Virginia Department of Education. (2014, August 6). Career and Technical Education. Retrieved
from Career Clusters:
http://www.doe.virginia.gov/instruction/career_technical/career_clusters/index.shtml

P a g e | 28
Yamaguchi, R., Garland, M. W., & Jonas, D. L. (2014). Long-term outcomes of high school CTE
completion in Virginia: Employment status and wages. Richmond, VA: VLDS.

P a g e | 29
Appendix A. Multinomial logistic regression methods and results In this study, we used multivariate regression models to interpret whether descriptive
differences between outcomes for CTE completers and non-completers were meaningful. We
developed separate models for outcomes related to enrollment, persistence, and completion.
To analyze data for each of these key outcomes, we operationalized each response variable as
an unordered, categorical indicator. For each outcome, we modeled the association between
the covariates and the response variables by fitting a multinomial logistic regression. Response
variables (outcomes) used in each model are shown in figure A-1.
Figure A-1. Response variables used in each multinomial logistic regression model
Enrollment (base outcome = no enrollment) o Enrollment in 2-year colleges o Enrollment in 4-year colleges.
Persistence* (base outcome = did not persist) o Persisted into year 2 o Persisted into year 3 o Persisted into year 4
College completion (base outcome = no college credential earned) o Associate’s degree or certificate o Bachelor’s degree o Bachelor’s degree and Associate’s degree
*We estimated separate persistence models for high school graduates who first enrolled in 2-year colleges and those who first enrolled in 4-year colleges.
Table A-1. Description of covariates used in multinomial regression models
Variable Name Variable description
Student Demographic Characteristics12
Economically disadvantaged status
Economically disadvantaged status
Limited English proficient status
Limited English Proficient status
Gender Student gender
Student Race/Ethnicity
Student's race category
Student had at least one primary disability
Student had at least one primary disability code
High School Experience and Achievement
CTE completer status CTE completer status upon high school graduation
12 Visit VDOE’s Specifications for Student Record Collection for more details on each of these variables.
P a g e | 30
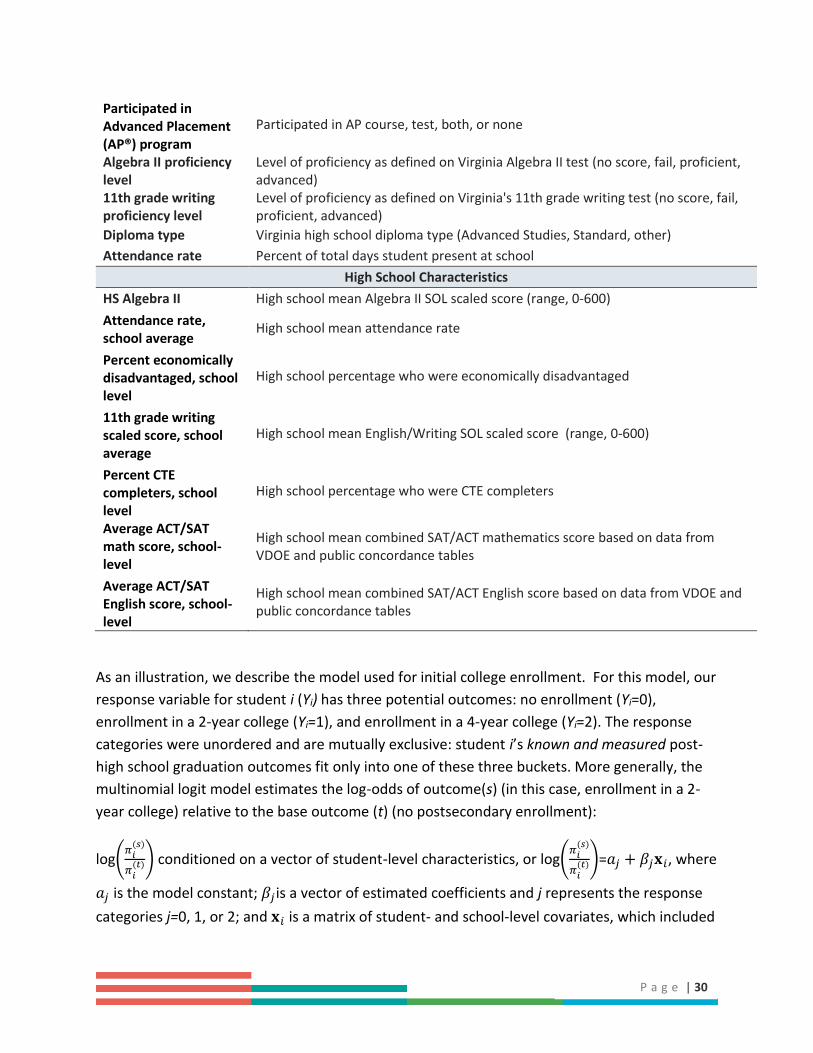
Participated in Advanced Placement (AP®) program
Participated in AP course, test, both, or none
Algebra II proficiency level
Level of proficiency as defined on Virginia Algebra II test (no score, fail, proficient, advanced)
11th grade writing proficiency level
Level of proficiency as defined on Virginia's 11th grade writing test (no score, fail, proficient, advanced)
Diploma type Virginia high school diploma type (Advanced Studies, Standard, other)
Attendance rate Percent of total days student present at school
High School Characteristics
HS Algebra II High school mean Algebra II SOL scaled score (range, 0-600)
Attendance rate, school average
High school mean attendance rate
Percent economically disadvantaged, school level
High school percentage who were economically disadvantaged
11th grade writing scaled score, school average
High school mean English/Writing SOL scaled score (range, 0-600)
Percent CTE completers, school level
High school percentage who were CTE completers
Average ACT/SAT math score, school-level
High school mean combined SAT/ACT mathematics score based on data from VDOE and public concordance tables
Average ACT/SAT English score, school-level
High school mean combined SAT/ACT English score based on data from VDOE and public concordance tables
As an illustration, we describe the model used for initial college enrollment. For this model, our
response variable for student i (Yi) has three potential outcomes: no enrollment (Yi=0),
enrollment in a 2-year college (Yi=1), and enrollment in a 4-year college (Yi=2). The response
categories were unordered and are mutually exclusive: student i’s known and measured post-
high school graduation outcomes fit only into one of these three buckets. More generally, the
multinomial logit model estimates the log-odds of outcome(s) (in this case, enrollment in a 2-
year college) relative to the base outcome (t) (no postsecondary enrollment):
log(𝜋𝑖(𝑠)
𝜋𝑖(𝑡)) conditioned on a vector of student-level characteristics, or log(
𝜋𝑖(𝑠)
𝜋𝑖(𝑡))=𝑎𝑗 + 𝛽𝑗𝐱𝑖, where
𝑎𝑗 is the model constant; 𝛽𝑗is a vector of estimated coefficients and j represents the response
categories j=0, 1, or 2; and 𝐱𝑖 is a matrix of student- and school-level covariates, which included

P a g e | 31
demographic characteristics, program participation, and high school achievement outcomes
(see Table A-1).
This specification allowed the research team to separately estimate the impact of CTE
participation (and other covariates) on the likelihood of the response category of interest (e.g.,
enrolling in a 2-year college; persisting into the 4th year; earning a Bachelor’s degree) relative to
a base outcome (for instance, not enrolling; not persisting; not earning the degree). This is
important, since different student characteristics and decisions are likely differentially
associated with the each outcome relative to the base category. We then transformed the
coefficients into relative risk ratios by exponentiating the log-odds to facilitate interpretation.
Each model’s standard errors are adjusted to account for clustering based on students’ high
school of attendance.
Results of the multinomial regression models
The following tables (Tables A-2, A-3, A-4, and A-5) display the results of the regression models
for college enrollment, persistence and completion. These models resulted in odds ratios,
which allowed us to compare the degree to which each factor (e.g., CTE completion, different
achievement levels, and students’ socio-economic status) influenced students’ likelihood of
being employed while in college.
In the results tables, we identified the outcomes that were statistically significant with asterisks
(*). However, given the large sample size, we also recognize that some of the statistically
significant results may have limited practical significance. As such, we used the following guide
to interpret the odds ratios throughout the paper.
Odds ratios of 1.0 (OR = 1): CTE completion (or other variable) did not influence the
odds of the target outcome (i.e., enrollment, persistence, or completion).
Odds ratios greater than 1.0 (OR > 1): CTE completion (or other variable) was associated
with higher odds of the target outcome occurring (i.e., enrollment, persistence, or
completion).
Odds ratios less than 1.0 (OR < 1: CTE completion (or other variable) was associated
with lower odds of the target outcome occurring (i.e., enrollment, persistence, or
completion).
When interpreting odds ratios, the magnitude is important. Odds ratios ranging from .90 – 1.10
were not considered meaningfully different from 1.0, even if they were statistically significant.
P a g e | 32
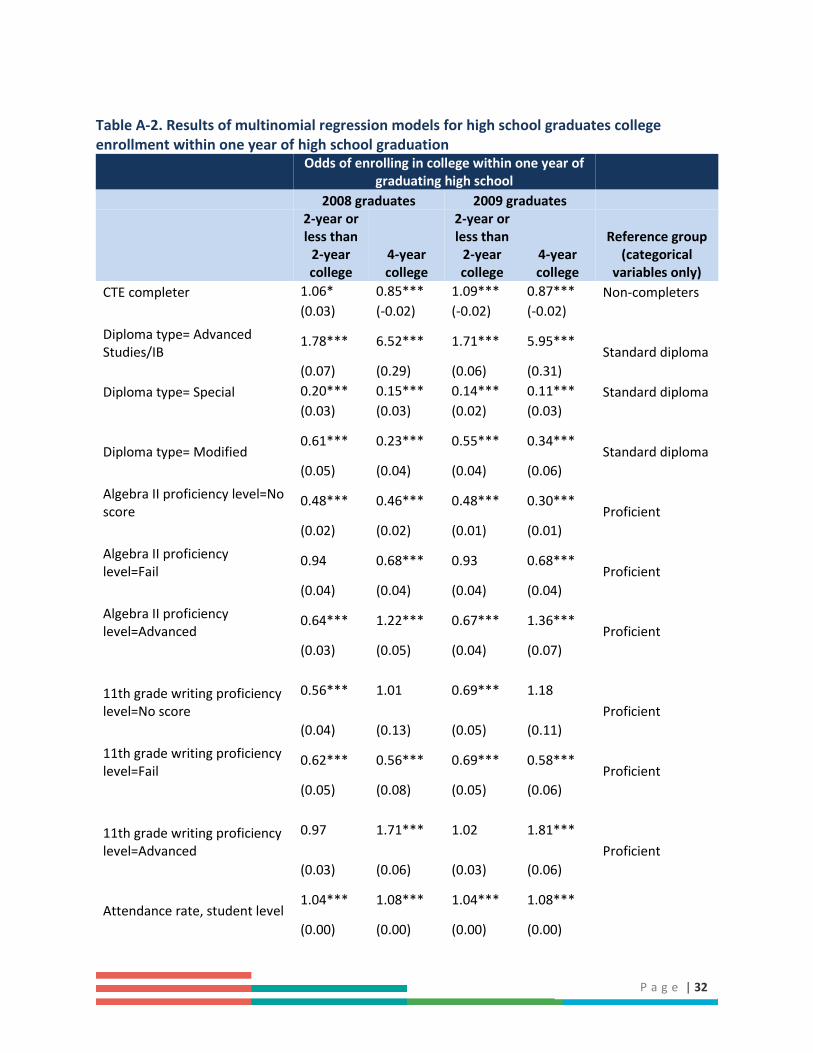
Table A-2. Results of multinomial regression models for high school graduates college enrollment within one year of high school graduation
Odds of enrolling in college within one year of
graduating high school
2008 graduates 2009 graduates
2-year or less than
2-year college
4-year college
2-year or less than
2-year college
4-year college
Reference group (categorical
variables only)
CTE completer 1.06* 0.85*** 1.09*** 0.87*** Non-completers
(0.03) (-0.02) (-0.02) (-0.02)
Diploma type= Advanced Studies/IB
1.78*** 6.52*** 1.71*** 5.95*** Standard diploma
(0.07) (0.29) (0.06) (0.31)
Diploma type= Special 0.20*** 0.15*** 0.14*** 0.11*** Standard diploma
(0.03) (0.03) (0.02) (0.03)
Diploma type= Modified 0.61*** 0.23*** 0.55*** 0.34***
Standard diploma
(0.05) (0.04) (0.04) (0.06)
Algebra II proficiency level=No score
0.48*** 0.46*** 0.48*** 0.30*** Proficient
(0.02) (0.02) (0.01) (0.01)
Algebra II proficiency level=Fail
0.94 0.68*** 0.93 0.68*** Proficient
(0.04) (0.04) (0.04) (0.04)
Algebra II proficiency level=Advanced
0.64*** 1.22*** 0.67*** 1.36*** Proficient
(0.03) (0.05) (0.04) (0.07)
11th grade writing proficiency level=No score
0.56*** 1.01 0.69*** 1.18
Proficient
(0.04) (0.13) (0.05) (0.11)
11th grade writing proficiency level=Fail
0.62*** 0.56*** 0.69*** 0.58*** Proficient
(0.05) (0.08) (0.05) (0.06)
11th grade writing proficiency level=Advanced
0.97 1.71*** 1.02 1.81***
Proficient
(0.03) (0.06) (0.03) (0.06)
Attendance rate, student level 1.04*** 1.08*** 1.04*** 1.08***
(0.00) (0.00) (0.00) (0.00)

P a g e | 33
Odds of enrolling in college within one year of
graduating high school
2008 graduates 2009 graduates
2-year or less than
2-year college
4-year college
2-year or less than
2-year college
4-year college
Reference group (categorical
variables only)
Participated in Advanced Placement (AP®) program
0.87** 2.70*** 1.01 2.98*** No AP participation
(0.04) (0.13) (0.05) (0.14)
Race/ethnicity=Unspecified 1.00 1.20 0.99 0.92
White
(0.10) (0.13) (0.08) (0.09)
Race/ethnicity=American Indian
0.72 0.78 0.93 0.85 White
(0.14) (0.15) (0.18) (0.19)
Race/ethnicity=Asian 1.45*** 1.23* 1.40*** 1.09 White
(0.10) (0.10) (0.10) (0.09)
Race/ethnicity=African American
0.85*** 1.84*** 0.93* 2.13*** White
(0.03) (0.10) (0.03) (0.11)
Race/ethnicity=Hispanic 0.90* 0.48*** 0.89* 0.49***
White
(0.05) (0.03) (0.04) (0.03)
Economically disadvantaged status
0.75*** 0.60*** 0.77*** 0.60*** Not economically disadvantaged
(0.02) (0.02) (0.02) (0.02)
Gender 0.77*** 0.82*** 0.75*** 0.78*** Female
(0.02) (0.02) (0.02) (0.02)
Student had at least one primary disability
1.30*** 1.09 1.29*** 1.07 No primary disability
(0.05) (0.05) (0.04) (0.05)
Limited English proficient status
0.85* 0.48*** 1.00 0.48*** No LEP flag
(0.06) (0.04) (0.07) (0.05)
Algebra II scaled score, school average
1.01*** 1.00 1.00** 1.00
(0.00) (0.00) (0.00) (0.00)
11th grade writing scaled score, school average
1.01*** 1.01*** 1.01*** 1.01***
(0.00) (0.00) (0.00) (0.00)
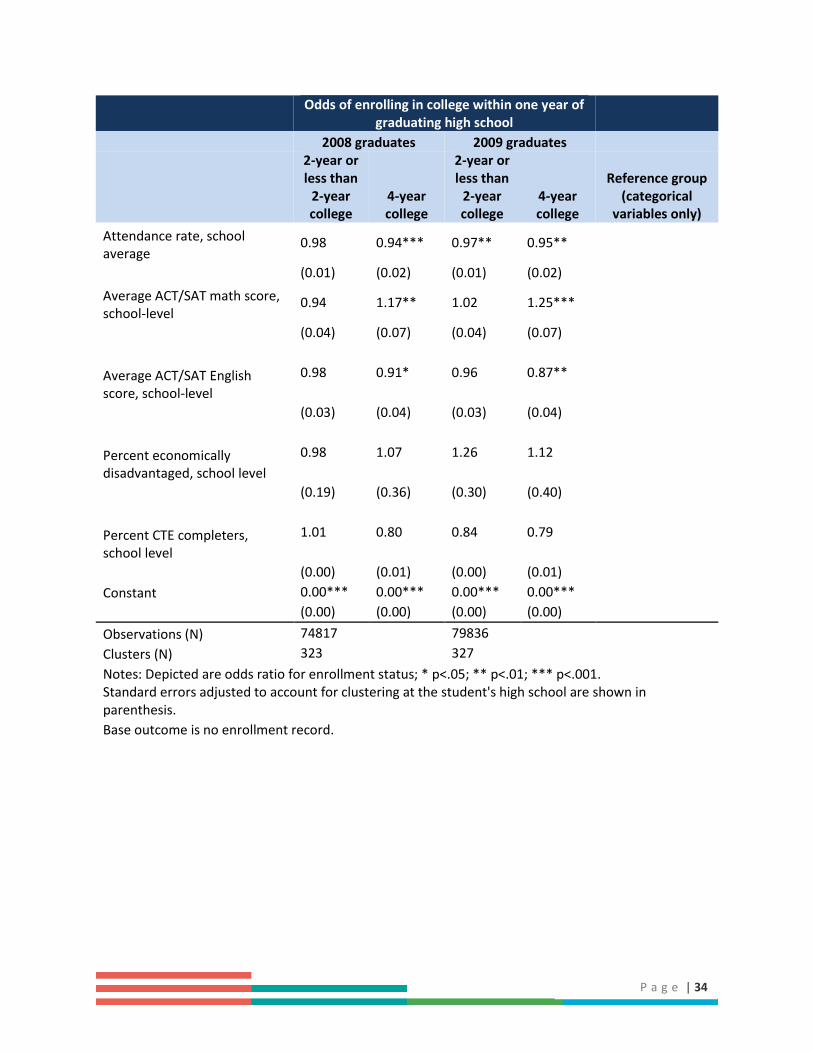
P a g e | 34
Odds of enrolling in college within one year of
graduating high school
2008 graduates 2009 graduates
2-year or less than
2-year college
4-year college
2-year or less than
2-year college
4-year college
Reference group (categorical
variables only)
Attendance rate, school average
0.98 0.94*** 0.97** 0.95**
(0.01) (0.02) (0.01) (0.02)
Average ACT/SAT math score, school-level
0.94 1.17** 1.02 1.25***
(0.04) (0.07) (0.04) (0.07)
Average ACT/SAT English score, school-level
0.98 0.91* 0.96 0.87**
(0.03) (0.04) (0.03) (0.04)
Percent economically disadvantaged, school level
0.98 1.07 1.26 1.12
(0.19) (0.36) (0.30) (0.40)
Percent CTE completers, school level
1.01 0.80 0.84 0.79
(0.00) (0.01) (0.00) (0.01)
Constant 0.00*** 0.00*** 0.00*** 0.00***
(0.00) (0.00) (0.00) (0.00)
Observations (N) 74817 79836
Clusters (N) 323 327
Notes: Depicted are odds ratio for enrollment status; * p<.05; ** p<.01; *** p<.001. Standard errors adjusted to account for clustering at the student's high school are shown in parenthesis.
Base outcome is no enrollment record.
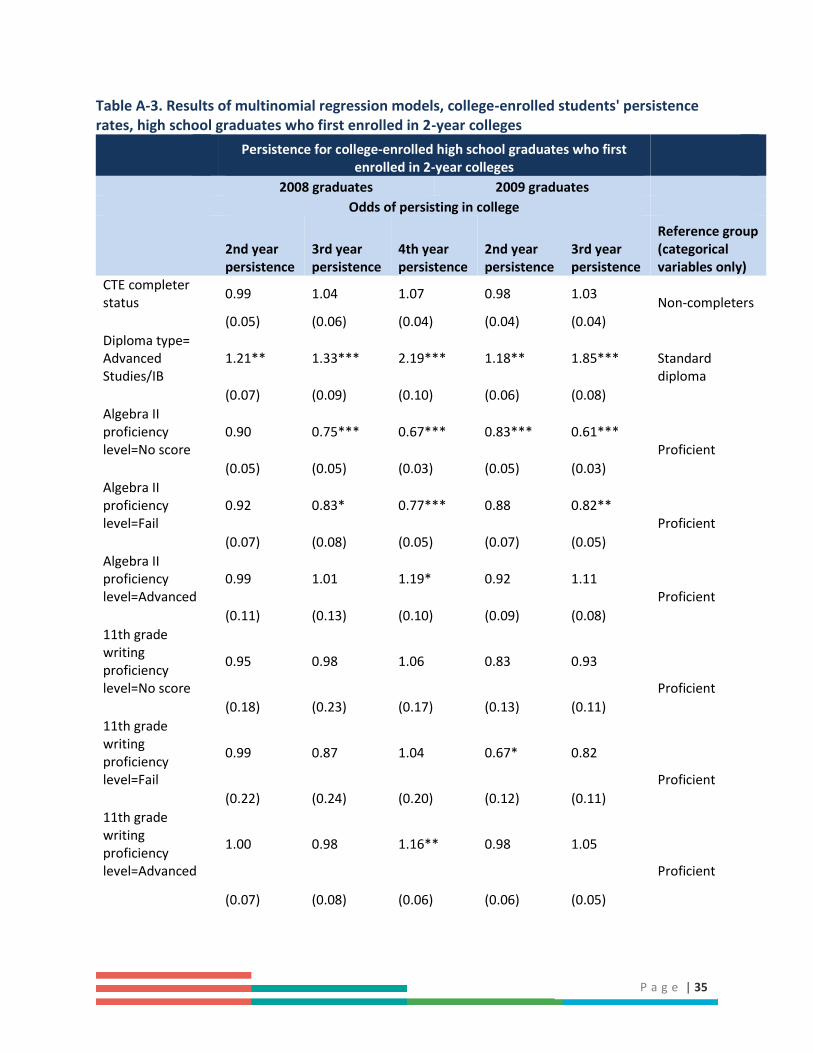
P a g e | 35
Table A-3. Results of multinomial regression models, college-enrolled students' persistence rates, high school graduates who first enrolled in 2-year colleges
Persistence for college-enrolled high school graduates who first enrolled in 2-year colleges
2008 graduates 2009 graduates
Odds of persisting in college
2nd year persistence
3rd year persistence
4th year persistence
2nd year persistence
3rd year persistence
Reference group (categorical variables only)
CTE completer status
0.99 1.04 1.07 0.98 1.03 Non-completers
(0.05) (0.06) (0.04) (0.04) (0.04) Diploma type= Advanced Studies/IB
1.21** 1.33*** 2.19*** 1.18** 1.85*** Standard diploma
(0.07) (0.09) (0.10) (0.06) (0.08) Algebra II proficiency level=No score
0.90 0.75*** 0.67*** 0.83*** 0.61*** Proficient
(0.05) (0.05) (0.03) (0.05) (0.03) Algebra II proficiency level=Fail
0.92 0.83* 0.77*** 0.88 0.82** Proficient
(0.07) (0.08) (0.05) (0.07) (0.05) Algebra II proficiency level=Advanced
0.99 1.01 1.19* 0.92 1.11 Proficient
(0.11) (0.13) (0.10) (0.09) (0.08) 11th grade writing proficiency level=No score
0.95 0.98 1.06 0.83 0.93
Proficient
(0.18) (0.23) (0.17) (0.13) (0.11) 11th grade writing proficiency level=Fail
0.99 0.87 1.04 0.67* 0.82
Proficient
(0.22) (0.24) (0.20) (0.12) (0.11) 11th grade writing proficiency level=Advanced
1.00 0.98 1.16** 0.98 1.05
Proficient
(0.07) (0.08) (0.06) (0.06) (0.05)

P a g e | 36
Persistence for college-enrolled high school graduates who first enrolled in 2-year colleges
2008 graduates 2009 graduates
Odds of persisting in college
2nd year persistence
3rd year persistence
4th year persistence
2nd year persistence
3rd year persistence
Reference group (categorical variables only)
Participated in Advanced Placement (AP®) program
1.11 1.08 1.37*** 1.15* 1.48*** No AP participation
(0.08) (0.10) (0.08) (0.08) (0.08)
Attendance rate, student level
1.02*** 1.02*** 1.05*** 1.01* 1.03*** White
(0.00) (0.00) (0.00) (0.00) (0.00)
Race/ethnicity= Unspecified
1.01 1.26 1.15 1.32 1.25 White
(0.24) (0.33) (0.22) (0.24) (0.18)
Race/ethnicity= American Indian
2.90* 2.15 1.80 0.37* 0.96 White
(1.45) (1.31) (0.84) (0.19) (0.27)
Race/ethnicity= Asian
1.47** 1.76*** 2.54*** 1.52** 2.67*** White
(0.21) (0.27) (0.28) (0.20) (0.27)
Race/ethnicity= African American
1.11 1.25** 0.91 1.17** 0.94 White
(0.07) (0.09) (0.05) (0.06) (0.04)
Race/ethnicity= Hispanic
1.03 1.24 1.19* 1.06 1.20** White
(0.11) (0.15) (0.10) (0.10) (0.08) Economically disadvantaged status
0.95 0.82* 0.80*** 0.81*** 0.69*** Not economically disadvantaged
(0.06) (0.06) (0.04) (0.04) (0.03)
Gender 0.86** 0.87** 0.78*** 0.81*** 0.70***
Female
(0.04) (0.05) (0.03) (0.03) (0.02) Student had at least one primary disability
1.15 1.15 1.14* 1.21** 1.18** No primary disability
(0.09) (0.10) (0.07) (0.08) (0.06)
Limited English proficient status
1.13 2.09*** 1.93*** 1.21 1.93*** No LEP flag
(0.20) (0.36) (0.26) (0.17) (0.20)

P a g e | 37
Persistence for college-enrolled high school graduates who first enrolled in 2-year colleges
2008 graduates 2009 graduates
Odds of persisting in college
2nd year persistence
3rd year persistence
4th year persistence
2nd year persistence
3rd year persistence
Reference group (categorical variables only)
Algebra II scaled score, school average
1.00 1.00 1.00 1.00 1.00
(0.00) (0.00) (0.00) (0.00) (0.00) 11th grade writing scaled score, school average
1.00 1.00 1.01*** 1.00 1.01**
(0.00) (0.00) (0.00) (0.00) (0.00)
Attendance rate, school average
0.99 0.97 0.96*** 1.01 0.99
(0.01) (0.02) (0.01) (0.01) (0.01)
Average ACT/SAT math score, school-level
0.97 1.02 1.06 1.10** 1.11***
(0.04) (0.05) (0.04) (0.04) (0.03)
Average ACT/SAT English score, school-level
1.04 1.04 1.00 0.92* 0.95*
(0.04) (0.05) (0.03) (0.03) (0.02) Percent economically disadvantaged, school level
0.97 1.46 1.39 1.39 1.50*
(0.22) (0.40) (0.26) (0.32) (0.27)
Percent CTE completers, school level
0.95 0.94 1.07 1.17 1.05
(0.16) (0.19) (0.15) (0.18) (0.13)
Constant 0.06 0.03 0.00*** 0.01*** 0.00***
(0.09) (0.05) (0.00) (0.01) (0.00)
Observations (N) 19321 22370 Notes: Depicted are odds ratio for persistence into each subsequent year; * p<.05; ** p<.01; *** p<.001. Standard errors adjusted to account for clustering at the student's high school are shown in parenthesis.

P a g e | 38
Persistence for college-enrolled high school graduates who first enrolled in 2-year colleges
2008 graduates 2009 graduates
Odds of persisting in college
2nd year persistence
3rd year persistence
4th year persistence
2nd year persistence
3rd year persistence
Reference group (categorical variables only)
Only students who earned a Standard or Advanced Diploma are included in the statistical models due to small cell sizes and over-determination.
Less-than-two-year colleges have been collapsed with 2-year colleges for estimation efficiency purposes
Base category is did not persist into the next year
Table A-4. Results of multinomial regression models, college-enrolled students' persistence rates, high school graduates who first enrolled in 4-year colleges
Persistence for college-enrolled high school graduates who first enrolled in 4-year colleges
2008 graduates 2009 graduates
Odds of persisting in college
2nd year persistence
3rd year persistence
4th year persistence
2nd year persistence
3rd year persistence
Reference group (categorical variables only)
CTE completer status
1.00 1.01 1.06 0.98 1.00 Non-completers
(0.08) (0.08) (0.06) (0.07) (0.06) Diploma type= Advanced Studies/IB
1.20* 1.53*** 2.98*** 1.40*** 2.43*** Standard diploma
(0.10) (0.14) (0.19) (0.12) (0.16) Algebra II proficiency level=No score
0.83 0.76** 0.83** 0.83 0.70*** Proficient
(0.08) (0.08) (0.06) (0.10) (0.06) Algebra II proficiency level=Fail
0.92 0.91 0.94 0.92 0.73** Proficient
(0.14) (0.15) (0.11) (0.13) (0.08) Algebra II proficiency level=Advanced
0.92 0.89 1.38*** 0.86 1.53*** Proficient
(0.10) (0.10) (0.11) (0.09) (0.12) 11th grade writing proficiency level=No score
1.05 0.87 0.95 0.97 1.01
Proficient
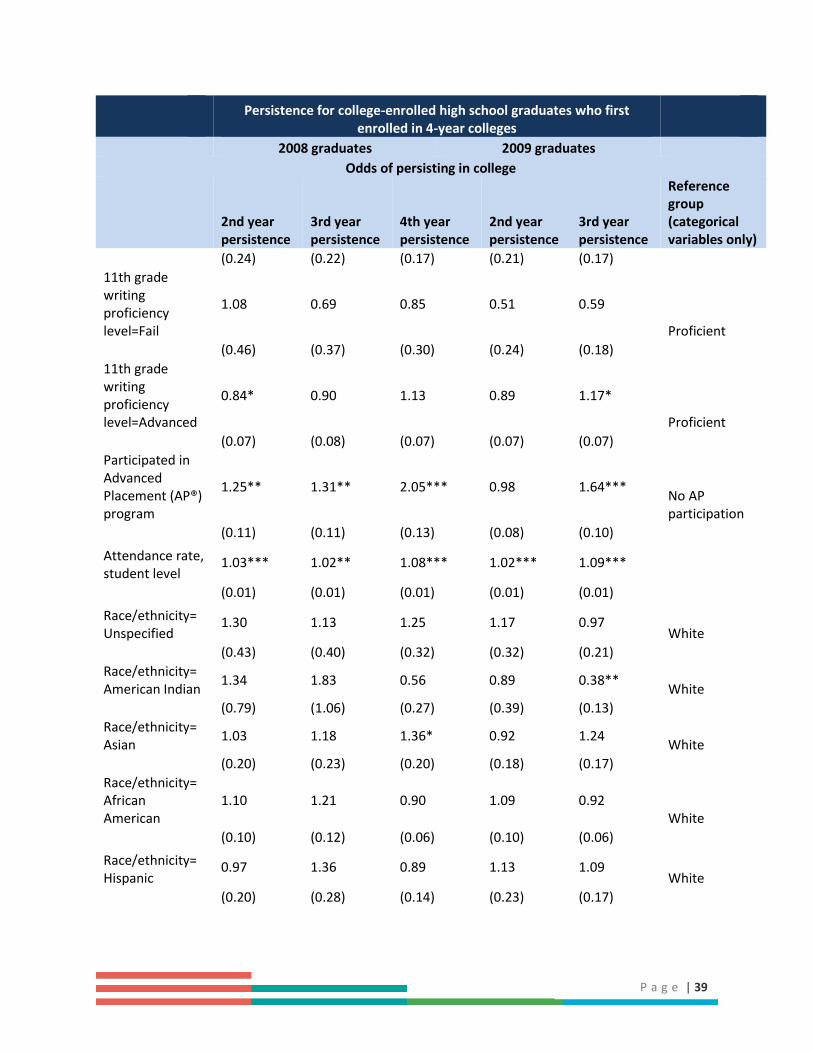
P a g e | 39
Persistence for college-enrolled high school graduates who first enrolled in 4-year colleges
2008 graduates 2009 graduates
Odds of persisting in college
2nd year persistence
3rd year persistence
4th year persistence
2nd year persistence
3rd year persistence
Reference group (categorical variables only)
(0.24) (0.22) (0.17) (0.21) (0.17) 11th grade writing proficiency level=Fail
1.08 0.69 0.85 0.51 0.59
Proficient
(0.46) (0.37) (0.30) (0.24) (0.18) 11th grade writing proficiency level=Advanced
0.84* 0.90 1.13 0.89 1.17*
Proficient
(0.07) (0.08) (0.07) (0.07) (0.07) Participated in Advanced Placement (AP®) program
1.25** 1.31** 2.05*** 0.98 1.64*** No AP participation
(0.11) (0.11) (0.13) (0.08) (0.10)
Attendance rate, student level
1.03*** 1.02** 1.08*** 1.02*** 1.09***
(0.01) (0.01) (0.01) (0.01) (0.01)
Race/ethnicity= Unspecified
1.30 1.13 1.25 1.17 0.97 White
(0.43) (0.40) (0.32) (0.32) (0.21) Race/ethnicity= American Indian
1.34 1.83 0.56 0.89 0.38** White
(0.79) (1.06) (0.27) (0.39) (0.13) Race/ethnicity= Asian
1.03 1.18 1.36* 0.92 1.24 White
(0.20) (0.23) (0.20) (0.18) (0.17) Race/ethnicity= African American
1.10 1.21 0.90 1.09 0.92 White
(0.10) (0.12) (0.06) (0.10) (0.06)
Race/ethnicity= Hispanic
0.97 1.36 0.89 1.13 1.09 White
(0.20) (0.28) (0.14) (0.23) (0.17)

P a g e | 40
Persistence for college-enrolled high school graduates who first enrolled in 4-year colleges
2008 graduates 2009 graduates
Odds of persisting in college
2nd year persistence
3rd year persistence
4th year persistence
2nd year persistence
3rd year persistence
Reference group (categorical variables only)
Economically disadvantaged status
0.68*** 0.65*** 0.55*** 0.81* 0.57*** Not economically disadvantaged
(0.07) (0.07) (0.04) (0.07) (0.04)
Gender 0.98 1.12 0.65*** 1.02 0.65*** Female
(0.07) (0.08) (0.04) (0.07) (0.03) Student had at least one primary disability
1.01 1.17 1.20 0.97 1.16 No primary disability
(0.16) (0.19) (0.14) (0.15) (0.13)
Limited English proficient status
1.47 1.06 1.53 0.81 1.26 No LEP flag
(0.51) (0.40) (0.42) (0.28) (0.30) Algebra II scaled score, school average
1.00 1.00 1.00 1.00 1.00
(0.00) (0.00) (0.00) (0.00) (0.00) 11th grade writing scaled score, school average
1.00 1.00 1.00 1.00 1.00
(0.00) (0.00) (0.00) (0.00) (0.00)
Attendance rate, school average
0.98 0.97 0.94*** 0.97 0.92***
(0.02) (0.02) (0.02) (0.02) (0.01) Average ACT/SAT math score, school-level
0.99 1.07 1.14* 1.01 1.17***
(0.07) (0.08) (0.06) (0.06) (0.06) Average ACT/SAT English score, school-level
1.01 1.02 1.00 1.01 0.94
(0.06) (0.07) (0.05) (0.06) (0.04)
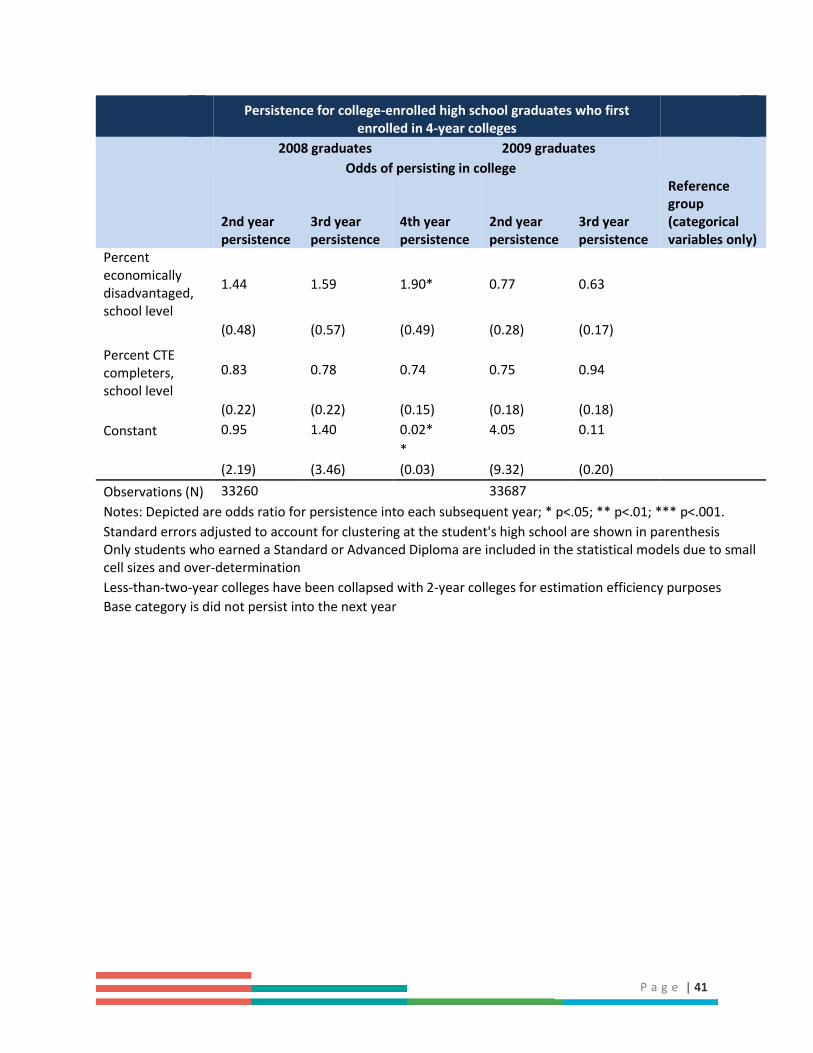
P a g e | 41
Persistence for college-enrolled high school graduates who first enrolled in 4-year colleges
2008 graduates 2009 graduates
Odds of persisting in college
2nd year persistence
3rd year persistence
4th year persistence
2nd year persistence
3rd year persistence
Reference group (categorical variables only)
Percent economically disadvantaged, school level
1.44 1.59 1.90* 0.77 0.63
(0.48) (0.57) (0.49) (0.28) (0.17)
Percent CTE completers, school level
0.83 0.78 0.74 0.75 0.94
(0.22) (0.22) (0.15) (0.18) (0.18)
Constant 0.95 1.40 0.02* 4.05 0.11
*
(2.19) (3.46) (0.03) (9.32) (0.20)
Observations (N) 33260 33687
Notes: Depicted are odds ratio for persistence into each subsequent year; * p<.05; ** p<.01; *** p<.001.
Standard errors adjusted to account for clustering at the student's high school are shown in parenthesis Only students who earned a Standard or Advanced Diploma are included in the statistical models due to small cell sizes and over-determination
Less-than-two-year colleges have been collapsed with 2-year colleges for estimation efficiency purposes
Base category is did not persist into the next year

P a g e | 42
Table A-5. Multinomial regression results, college-enrolled students' odds of earning a college credential
College credentials earned: college-enrolled high school graduates
2008 graduates
(5 years after high school graduation) 2009 graduates
(4 years after high school graduation)
Odds of earning college credentials
Associate's degree or certificate
Bachelor's degree (only)
Bachelor's and
Associate's degree
Associate's degree or certificate
Bachelor's degree (only)
Bachelor's and
Associate's degree
Reference group
(categorical variables only)
CTE completer status 1.21*** 0.92** 1.12 1.24*** 0.82*** 1.07 Non-completers
(0.06) (0.03) (0.07) (0.06) (0.04) (0.10) Diploma type= Advanced Studies/IB 1.42*** 4.35*** 2.45*** 1.24** 4.26*** 2.15**
Standard diploma
(0.10) (0.55) (0.32) (0.09) (0.59) (0.59) Diploma type= Special 0.63 2.90** 0.00*** 0.36 1.06 10.59*** Proficient
(0.27) (1.00) (0.00) (0.32) (0.80) (6.59) Diploma type= Modified 0.92 0.40** 1.12 0.80 0.82 2.15 Proficient
(0.21) (0.13) (0.89) (0.37) (0.42) (1.19) Algebra II proficiency level=No score 0.75*** 1.01 0.70* 0.63*** 0.67*** 0.46** Proficient
0.06 (0.07) (0.11) (0.06) (0.06) (0.11) Algebra II proficiency level=Fail 0.81*** 0.65*** 0.46*** 0.71*** 0.56*** 0.54*** Proficient
(0.05) (0.05) (0.08) (0.04) (0.07) (0.09)
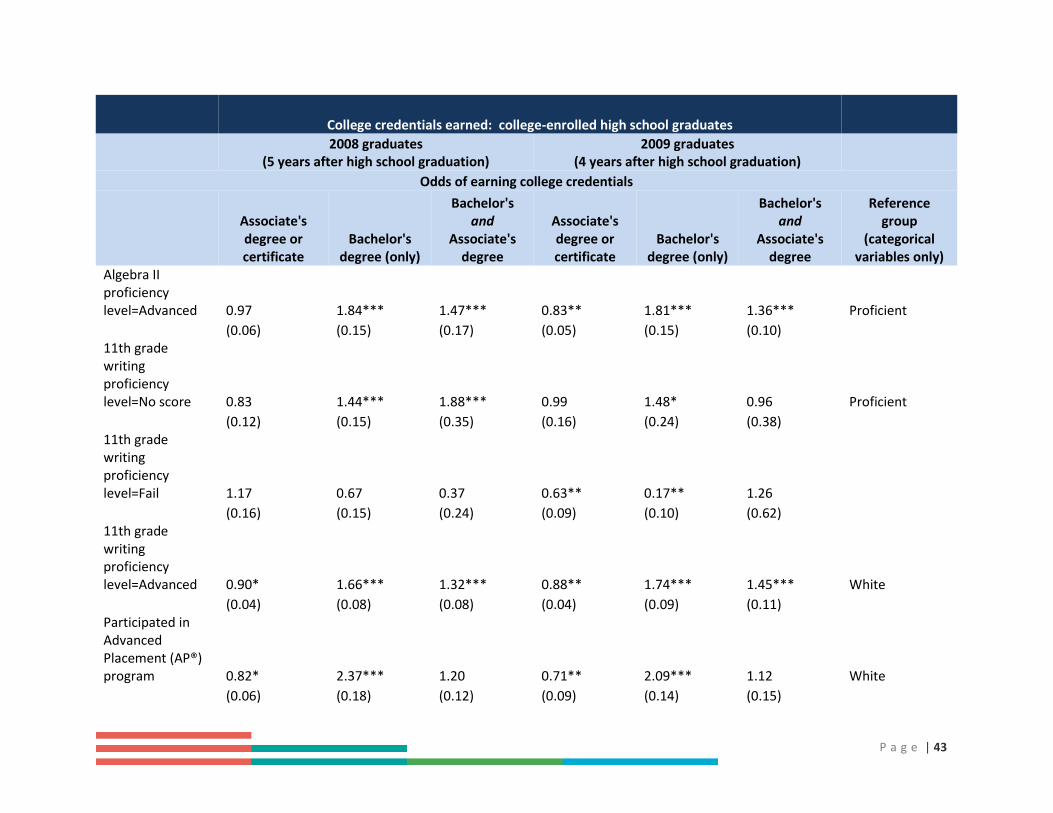
P a g e | 43
College credentials earned: college-enrolled high school graduates
2008 graduates
(5 years after high school graduation) 2009 graduates
(4 years after high school graduation)
Odds of earning college credentials
Associate's degree or certificate
Bachelor's degree (only)
Bachelor's and
Associate's degree
Associate's degree or certificate
Bachelor's degree (only)
Bachelor's and
Associate's degree
Reference group
(categorical variables only)
Algebra II proficiency level=Advanced 0.97 1.84*** 1.47*** 0.83** 1.81*** 1.36*** Proficient
(0.06) (0.15) (0.17) (0.05) (0.15) (0.10) 11th grade writing proficiency level=No score 0.83 1.44*** 1.88*** 0.99 1.48* 0.96 Proficient
(0.12) (0.15) (0.35) (0.16) (0.24) (0.38) 11th grade writing proficiency level=Fail 1.17 0.67 0.37 0.63** 0.17** 1.26
(0.16) (0.15) (0.24) (0.09) (0.10) (0.62) 11th grade writing proficiency level=Advanced 0.90* 1.66*** 1.32*** 0.88** 1.74*** 1.45*** White
(0.04) (0.08) (0.08) (0.04) (0.09) (0.11) Participated in Advanced Placement (AP®) program 0.82* 2.37*** 1.20 0.71** 2.09*** 1.12 White
(0.06) (0.18) (0.12) (0.09) (0.14) (0.15)
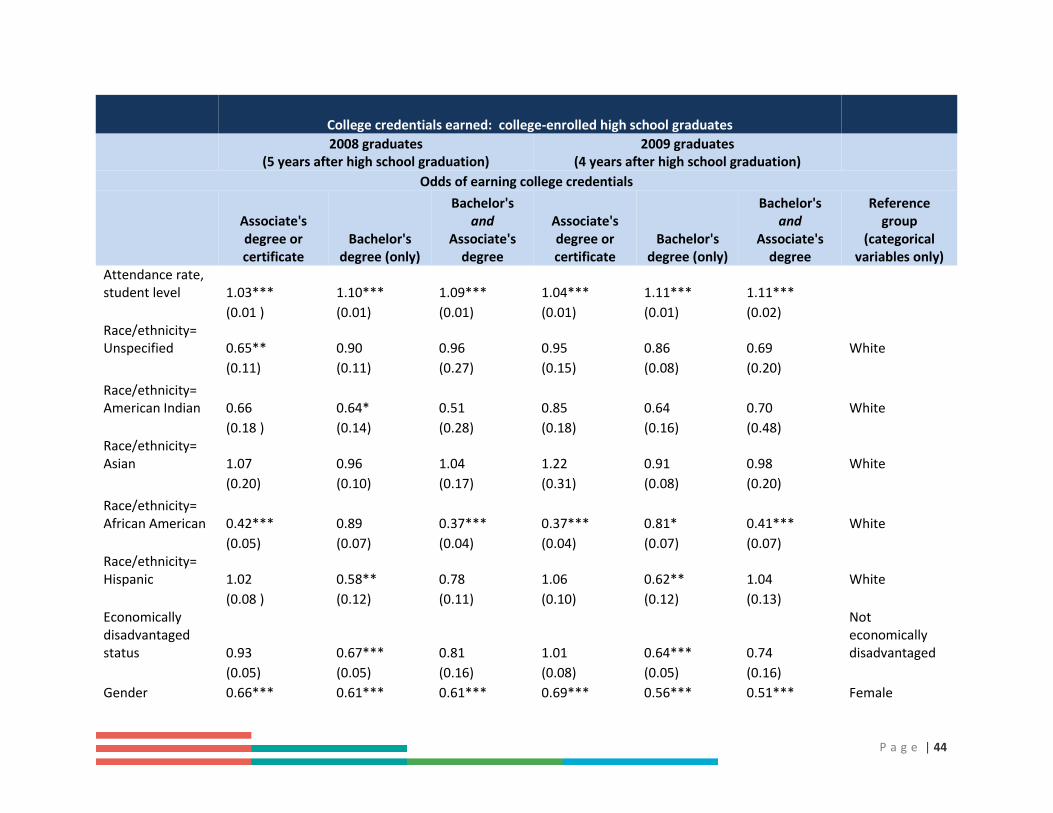
P a g e | 44
College credentials earned: college-enrolled high school graduates
2008 graduates
(5 years after high school graduation) 2009 graduates
(4 years after high school graduation)
Odds of earning college credentials
Associate's degree or certificate
Bachelor's degree (only)
Bachelor's and
Associate's degree
Associate's degree or certificate
Bachelor's degree (only)
Bachelor's and
Associate's degree
Reference group
(categorical variables only)
Attendance rate, student level 1.03*** 1.10*** 1.09*** 1.04*** 1.11*** 1.11***
(0.01 ) (0.01) (0.01) (0.01) (0.01) (0.02) Race/ethnicity= Unspecified 0.65** 0.90 0.96 0.95 0.86 0.69 White
(0.11) (0.11) (0.27) (0.15) (0.08) (0.20)
Race/ethnicity= American Indian 0.66 0.64* 0.51 0.85 0.64 0.70 White
(0.18 ) (0.14) (0.28) (0.18) (0.16) (0.48) Race/ethnicity= Asian 1.07 0.96 1.04 1.22 0.91 0.98 White
(0.20) (0.10) (0.17) (0.31) (0.08) (0.20)
Race/ethnicity= African American 0.42*** 0.89 0.37*** 0.37*** 0.81* 0.41*** White
(0.05) (0.07) (0.04) (0.04) (0.07) (0.07) Race/ethnicity= Hispanic 1.02 0.58** 0.78 1.06 0.62** 1.04 White
(0.08 ) (0.12) (0.11) (0.10) (0.12) (0.13) Economically disadvantaged status 0.93 0.67*** 0.81 1.01 0.64*** 0.74
Not economically disadvantaged
(0.05) (0.05) (0.16) (0.08) (0.05) (0.16)
Gender 0.66*** 0.61*** 0.61*** 0.69*** 0.56*** 0.51*** Female

P a g e | 45
College credentials earned: college-enrolled high school graduates
2008 graduates
(5 years after high school graduation) 2009 graduates
(4 years after high school graduation)
Odds of earning college credentials
Associate's degree or certificate
Bachelor's degree (only)
Bachelor's and
Associate's degree
Associate's degree or certificate
Bachelor's degree (only)
Bachelor's and
Associate's degree
Reference group
(categorical variables only)
(0.03) (0.02) (0.04) (0.03) (0.02) (0.05) Student had at least one primary disability 0.98 0.72** 0.70*** 1.10 0.68*** 0.51***
No primary disability
(0.07) (0.08) (0.07) (0.06) (0.06) (0.10)
Limited English proficient status 1.38*** 0.82 1.32** 1.58*** 0.66* 1.62** No LEP flag
(0.10) (0.17) (0.12) (0.09) (0.12) (0.24) Algebra II scaled score, school average 1.00* 1.00 1.00 1.00 1.00** 1.01
(0.00) (0.00) (0.00) (0.00) (0.00) (0.00) 11th grade writing scaled score, school average 1.00 1.00 1.01* 1.00 1.00 1.01
(0.00) (0.00) (0.01) (0.00) (0.00) (0.01)
Attendance rate, school average 0.98 0.94** 0.95** 0.96** 0.95* 0.93*
(0.02) (0.02) (0.02) (0.02) (0.02) (0.03) Average ACT/SAT math score, school-level 0.92 1.24** 0.95 0.90 1.22*** 0.94
(0.06) (0.09) (0.07) (0.06) (0.06) (0.08)
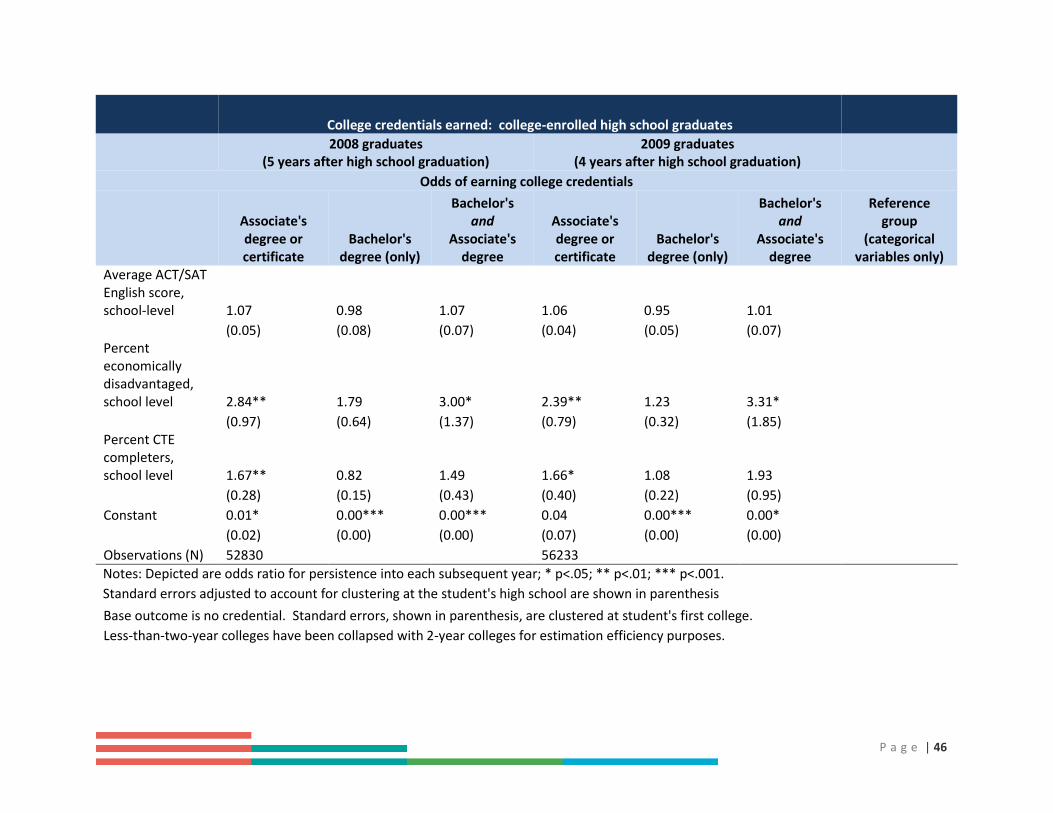
P a g e | 46
College credentials earned: college-enrolled high school graduates
2008 graduates
(5 years after high school graduation) 2009 graduates
(4 years after high school graduation)
Odds of earning college credentials
Associate's degree or certificate
Bachelor's degree (only)
Bachelor's and
Associate's degree
Associate's degree or certificate
Bachelor's degree (only)
Bachelor's and
Associate's degree
Reference group
(categorical variables only)
Average ACT/SAT English score, school-level 1.07 0.98 1.07 1.06 0.95 1.01
(0.05) (0.08) (0.07) (0.04) (0.05) (0.07) Percent economically disadvantaged, school level 2.84** 1.79 3.00* 2.39** 1.23 3.31*
(0.97) (0.64) (1.37) (0.79) (0.32) (1.85) Percent CTE completers, school level 1.67** 0.82 1.49 1.66* 1.08 1.93
(0.28) (0.15) (0.43) (0.40) (0.22) (0.95)
Constant 0.01* 0.00*** 0.00*** 0.04 0.00*** 0.00*
(0.02) (0.00) (0.00) (0.07) (0.00) (0.00)
Observations (N) 52830 56233
Notes: Depicted are odds ratio for persistence into each subsequent year; * p<.05; ** p<.01; *** p<.001.
Standard errors adjusted to account for clustering at the student's high school are shown in parenthesis
Base outcome is no credential. Standard errors, shown in parenthesis, are clustered at student's first college.
Less-than-two-year colleges have been collapsed with 2-year colleges for estimation efficiency purposes.
Related Documents