RESEARCH REPORT Following the Money on Fines and Fees The Misaligned Fiscal Incentives in Speeding Tickets Aravind Boddupalli Livia Mucciolo January 2022 STATE AND LOCAL FINANCE INITIATIVE

Welcome message from author
This document is posted to help you gain knowledge. Please leave a comment to let me know what you think about it! Share it to your friends and learn new things together.
Transcript
RESEARCH REPORT
Following the Money on
Fines and Fees The Misaligned Fiscal Incentives in Speeding Tickets
Aravind Boddupalli Livia Mucciolo
January 2022
S T A T E A N D L O C A L F I N A N C E I N I T I A T I V E
ABOUT THE URBAN INSTITUTE
The nonprofit Urban Institute is a leading research organization dedicated to developing evidence-based insights
that improve people’s lives and strengthen communities. For 50 years, Urban has been the trusted source for
rigorous analysis of complex social and economic issues; strategic advice to policymakers, philanthropists, and
practitioners; and new, promising ideas that expand opportunities for all. Our work inspires effective decisions
that advance fairness and enhance the well-being of people and places.
Copyright © January 2022. Urban Institute. Permission is granted for reproduction of this file, with attribution to
the Urban Institute. Cover image by Tim Meko.
Contents Acknowledgments iv
Executive Summary v
Following the Money on Fines and Fees 1
How Much Money Is Collected from Fines, Fees, and Forfeitures? 1
Where Does the Money Collected from Fines and Fees Go? A Closer Look at Speeding Tickets 5
Allocations of Speeding Ticket Fines 5
Allocations of Speeding Ticket Fees and Surcharges 9
The Role of Fines and Fees in Larger Justice Issues 11
Conclusions and Policy Implications 16
Appendix: Data and Methods 18
Notes 26
References 29
About the Authors 31
Statement of Independence 32
i v A C K N O W L E D G M E N T S
Acknowledgments This report was funded by the 2021 Hrabowski award at the Urban Institute, in honor of distinguished
former trustee Freeman A. Hrabowski III. We are grateful to all our funders, who make it possible for
Urban to advance its mission.
The views expressed are those of the authors and should not be attributed to the Urban Institute,
its trustees, or its funders. Funders do not determine research findings or the insights and
recommendations of Urban experts. Further information on the Urban Institute’s funding principles is
available at urban.org/fundingprinciples.
The authors would like to thank Richard Auxier, Tonantzin Carmona, Tim Curry, Lisa Foster, Tracy
Gordon, Brian Highsmith, Jesse Jannetta, Kim Rueben, and Joanna Weiss for invaluable feedback, and
Michael Marazzi and Renee Pendleton for copyediting.
E X E C U T I V E S U M M A R Y v
Executive Summary State and local governments collected $16 billion in fiscal year 2019 from financial penalties imposed
on people who had contact with the justice system, according to US Census Bureau data. These
penalties included speeding tickets (including those from automated traffic cameras), parking tickets,
court-imposed administrative fees, and forfeitures or seizures of property believed by law
enforcement officials to be connected to crimes.1
In total, fines, fees, and forfeitures account for less than 1 percent of total state and local general
revenue, but the way they are enforced can create unjust burdens. These financial penalties often
disproportionately fall on low-income people of color, particularly Black people (O’Neill, Kennedy, and
Harris 2021; Sances and You 2017). In addition, consequences for those unable to pay can be severe
(Menendez et al. 2019).
Reliance on fines, fees, and forfeitures as a revenue source can also engender conflicts of interest
for government officials. For example, states and localities have ramped up speeding ticket
enforcement and arrests for various violations in response to budgetary shortfalls and political
pressures (Makowsky, Stratmann, and Tabarrok 2019).
In this report, we first examine how much states and localities report collecting from fines, fees,
and forfeitures, highlighting the states and localities most reliant on them as a revenue source. While
the average state and local share of revenue from fines, fees, and forfeitures is relatively small, these
shares are larger for some local governments, especially small cities.
We then explore how revenue from some fines and fees (we exclude forfeitures from this
analysis) are allocated in each of the 50 states, the District of Columbia, and a handful of cities. We
specifically focus on speeding tickets as an illustrative example. Overall, we find that in at least 43
states, some portion of speeding ticket revenue is allocated toward a court or law enforcement fund.
This finding reveals the potential for conflicts of interest and misaligned fiscal incentives. That is,
police officers and judges might levy fines and fees with the intent of funding their respective
agencies, as was demonstrated by the 2015 US Department of Justice investigation into Ferguson,
Missouri’s police department (US Department of Justice 2015). We additionally find that many states
use fines and fees to fund general government services unrelated to cost recovery for the justice
system, such as special funds for health care or highway initiatives.
v i E X E C U T I V E S U M M A R Y
In tandem with a new focus on justice reforms, federal, state, and local leaders are increasingly
attentive to whether fines and fees are equitable mechanisms for penalizing those who have contact
with the justice system or even effective levers for raising revenue. But to get a full picture of this
problem, policymakers must also “follow the money” and understand what and who fines and fees
ultimately fund.
Following the Money on
Fines and Fees The theory behind the imposition of financial penalties in the justice system assumes that fines
penalize and deter certain behaviors while fees recover some of the costs involved in administration.
Fees are not unique to the justice system; state and local governments collect earmarked charges for
public utilities, for example. However, the relationship is markedly different with the justice system
because the people obligated to pay often do not have any alternatives and are often those least able
to pay. This dynamic is more fraught because of the racial inequities in policing and sentencing
practices across the United States, particularly those that perpetuate harms against Black and Latinx2
people (The Sentencing Project 2018).
Below, we first look at how much states and localities collect from all fines, fees, and forfeitures,
highlighting those governments most reliant on such revenues. Then we explore where each state
allocates revenue from speeding ticket fines and any associated fees or surcharges, based on their
varying legal provisions. Lastly, we discuss historical and present-day context on the role of fines and
fees in larger justice issues.
How Much Money Is Collected from Fines, Fees, and
Forfeitures?
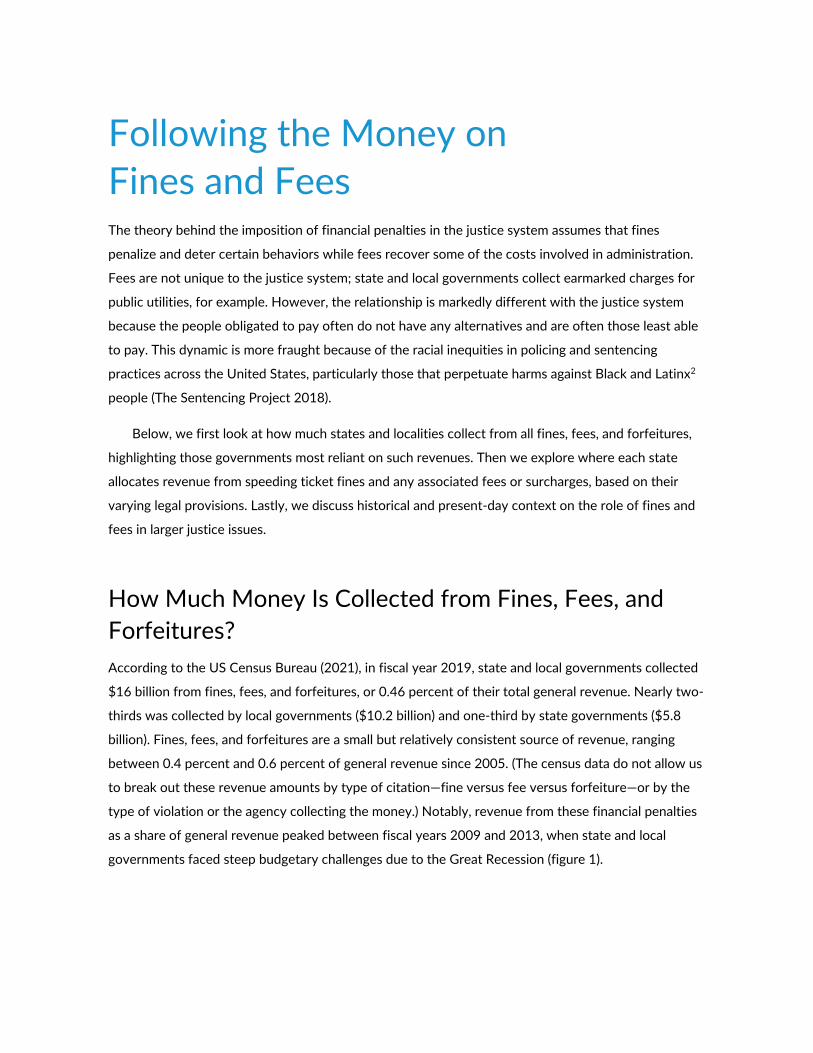
According to the US Census Bureau (2021), in fiscal year 2019, state and local governments collected
$16 billion from fines, fees, and forfeitures, or 0.46 percent of their total general revenue. Nearly two-
thirds was collected by local governments ($10.2 billion) and one-third by state governments ($5.8
billion). Fines, fees, and forfeitures are a small but relatively consistent source of revenue, ranging
between 0.4 percent and 0.6 percent of general revenue since 2005. (The census data do not allow us
to break out these revenue amounts by type of citation—fine versus fee versus forfeiture—or by the
type of violation or the agency collecting the money.) Notably, revenue from these financial penalties
as a share of general revenue peaked between fiscal years 2009 and 2013, when state and local
governments faced steep budgetary challenges due to the Great Recession (figure 1).
2 F O L L O W I N G T H E M O N E Y O N F I N E S A N D F E E S
FIGURE 1
Fines, Fees, and Forfeitures Revenue
Share of general revenue, all state and local governments combined, fiscal years 2005–2019
URBAN INSTITUTE
Source: US Census Bureau (2021).
Among state governments, California ($1.0 billion), Texas ($505 million), North Carolina ($305
million), Virginia ($298 million), and Florida ($258 million) collected the most revenue from fines, fees,
and forfeitures in fiscal year 2019. However, as a share of general revenue, Alabama (0.7 percent),
Louisiana (0.6 percent), North Carolina, Oregon, and Virginia (each 0.5 percent) relied the most on
fines, fees, and forfeitures.
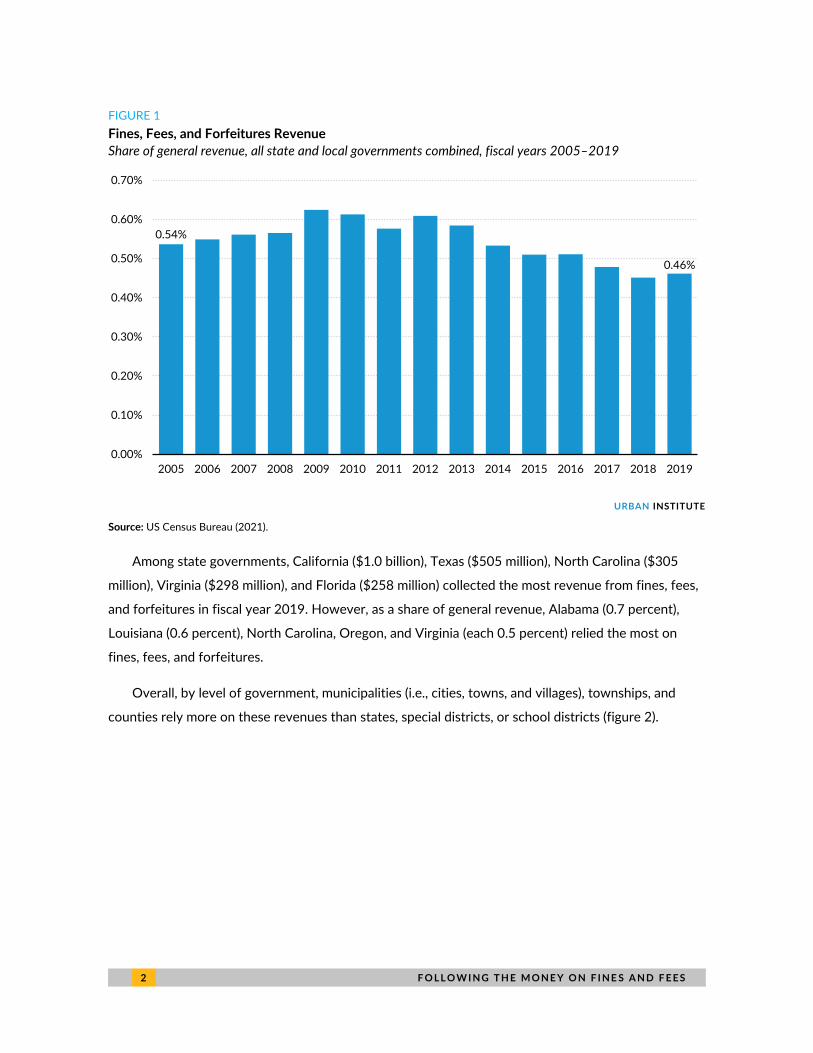
Overall, by level of government, municipalities (i.e., cities, towns, and villages), townships, and
counties rely more on these revenues than states, special districts, or school districts (figure 2).
0.54%
0.46%
0.00%
0.10%
0.20%
0.30%
0.40%
0.50%
0.60%
0.70%
2005 2006 2007 2008 2009 2010 2011 2012 2013 2014 2015 2016 2017 2018 2019
F O L L O W I N G T H E M O N E Y O N F I N E S A N D F E E S 3
FIGURE 2
Fines, Fees, and Forfeitures Revenue
Share of general revenue by level of government, fiscal year 2017
URBAN INSTITUTE
Source: US Census Bureau (2020).
On average, smaller cities—those with populations under 10,000—collected 3.4 percent of their
general revenue from fines, fees, and forfeitures, whereas larger cities—those with populations over a
million—collected 1.1 percent. Smaller cities that were most reliant on these revenue sources were
disproportionately in Arkansas, Georgia, Louisiana, New York, Oklahoma, and Texas, largely in rural or
high-poverty areas (see also Maciag 2019).
According to US Census Bureau data, only six small cities (including towns and villages) relied on
fines, fees, and forfeitures for over half of their general revenue in each of fiscal years 2007, 2012,
and 2017: Anacoco, Louisiana; Fisher, Louisiana; Grady, Arkansas; Hanging Rock, Ohio; Jamestown,
South Carolina; and Oliver, Georgia. All six jurisdictions are small, with populations under 1,000
people, are located near major highways, and spent at least one-third of their budgets on law
enforcement activities in 2017. These places have also been labeled “speed traps” because of their
aggressive traffic ticketing practices.3
Among the 100 largest cities by population in fiscal year 2019, New York ($1.1 billion), Chicago
($338 million), the District of Columbia ($202 million), Los Angeles ($149 million), and Boston ($74
million) raised the most from fines, fees, and forfeitures. New York, by far the most populous city in
the United States, raised over $1 billion from fines, fees, and forfeitures, but as a share of general
revenue, these contributed only 1 percent of the city’s total funds. The large cities most reliant on
0.3%
0.6%
1.1%
0.5%
0.04%
0.1%
0.0% 0.3% 0.6% 0.9% 1.2%
State
County
Municipality
Township
Special district
School district
4 F O L L O W I N G T H E M O N E Y O N F I N E S A N D F E E S
fines, fees, and forfeitures for their budgets in fiscal year 2019 were Chicago (3.9 percent);4 Jersey
City, New Jersey (3.9 percent); and Fremont, California (3.5 percent).5
Investigations into Chicago, the most populous among the subset of most reliant cities noted
above, have revealed that aggressive ticketing practices, especially in neighborhoods with higher
shares of low-income Black residents, have trapped thousands of households in cycles of debt and
bankruptcy.6 Previous research has also demonstrated that, among the thousands of city governments
that had law enforcement departments in 2007, there was a significant positive relationship between
fines, fees, and forfeitures revenue per capita and the share of total population that was Black (Sances
and You 2017). McIntire and Keller also found that the 730 cities that rely most on fines, fees, and
forfeitures to fund their budgets are disproportionately located in Southern states with more Black
residents.7
Higher reliance on fines, fees, and forfeitures may also be a function of fiscal constraints placed
upon local governments. Many states do not authorize their localities to levy income taxes, limit sales
tax rates, and may also impose stringent tax revenue and expenditure limits (Pagano and Hoene 2018).
State governments will also sometimes “preempt” revenue policies pursued by local governments,
disallowing them from passing reforms that do not abide by the will of state legislatures (Blair et al.
2020). These constraints shorten the menu of revenue options available to localities. It is also worth
noting that such anti-tax policies have a long history of being closely intertwined with racial inequities
(Leachman et al. 2018).
Certain types of fines, fees, and forfeitures can be particularly troubling sources of revenue to
fund public services. For example, a share of revenue comes from payments levied on those in jails or
prisons. These can be inequitable because mass incarceration disproportionately harms Black and
Latinx households across the United States (The Sentencing Project 2018). In 2019, for instance,
Virginia’s jails collected about $47 million, or 5 percent of their operating budgets, from canteen sales,
telephone fees, work release fees, booking fees, and medical co-pays; these amounted to about
$1,700 in jail fees per incarcerated person (Mai 2021).
State and local officials should also note that fines, fees, and forfeitures can often be an unreliable
source of revenue for funding day-to-day government operations, since a significant portion of those
levied do not result in actual revenue. Case studies in Florida, New Mexico, and Texas counties found
that judges rarely held hearings to establish whether defendants had the means to pay the charges
levied against them (Menendez et al. 2019). In fact, some conservative estimates have shown that
outstanding court debt likely totals well over $27 billion across the nation (Hammons 2021).8
F O L L O W I N G T H E M O N E Y O N F I N E S A N D F E E S 5
Where Does the Money Collected from Fines and Fees
Go? A Closer Look at Speeding Tickets
Our research examined how revenue is allocated from a specific subset of fines and fees: speeding
tickets. Every state and the District of Columbia has some form of monetary penalty levied on those
found to be in violation of speeding laws.9 Allocations (also referred to as “distributions” or “deposits”)
from speeding tickets can vary widely across government levels; state rules can differ from those of
cities or counties.
For feasibility and state-by-state comparisons, we limit our study primarily to state-level statutes,
constitutional provisions, or other fiscal documents. Furthermore, we limit our analysis to the most
general form of speeding tickets in each state, excluding separate fines or specific surcharges for
excessive speeding or speeding in certain state- or locally designated areas, such as highway work
zones or school zones. General speeding tickets may include a “base fine” and an additional fee or
surcharge; where relevant, we look at all components as long as they are mandatory and as long as the
legal language applicable to a “base fine” is also applicable to the related fee. We categorize each
state’s speeding ticket fines and fees revenue into one of four allocation categories:
1. State general fund only
2. Local general funds (e.g., city or county)
3. General funds plus non–law enforcement or non–court funds
4. Any court or law enforcement funds
In most states, revenue from speeding tickets is distributed across a variety of funds that span our
criteria. In such cases, we categorize a state in the highest applicable category; that is, a state is
categorized as “4. Any court or law enforcement funds” even if a small portion of revenue goes into a
court or law enforcement fund and the rest goes to the state general fund. Similarly, a state is
categorized as “2. Local general funds (e.g., city or county)” if, in addition to a state general fund
allocation, some amount is also distributed to a city or county general fund. More information is
available in the appendix.
Allocations of Speeding Ticket Fines
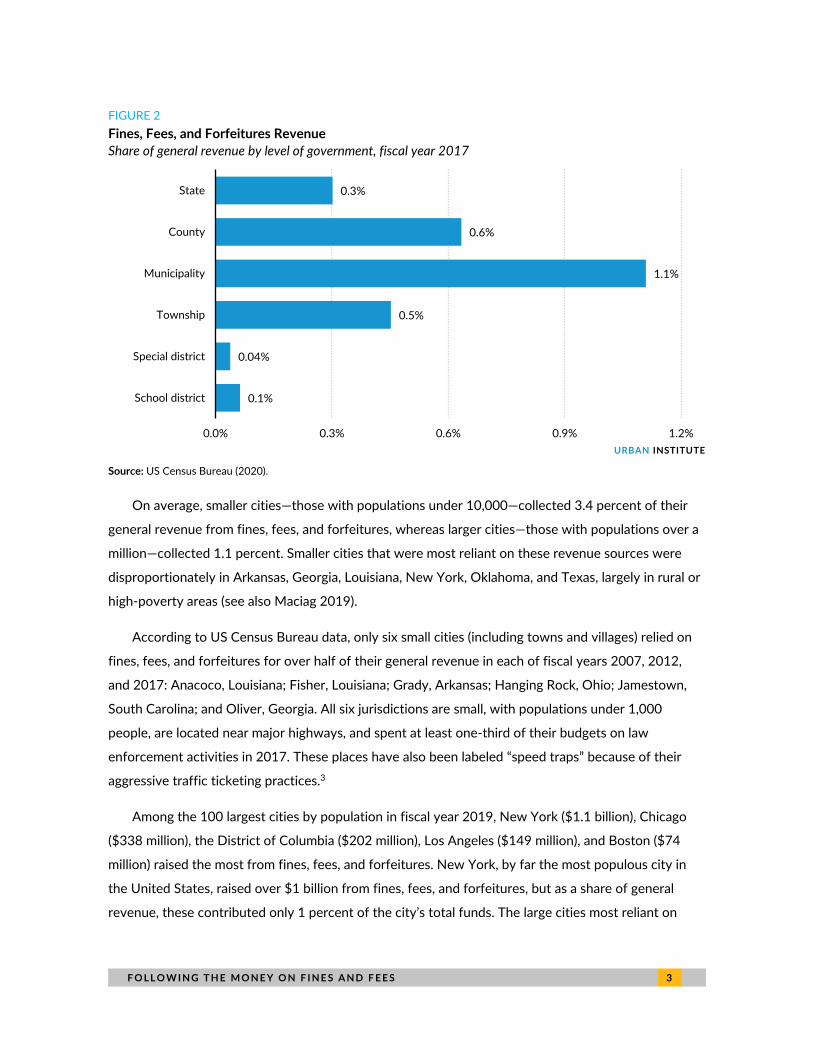
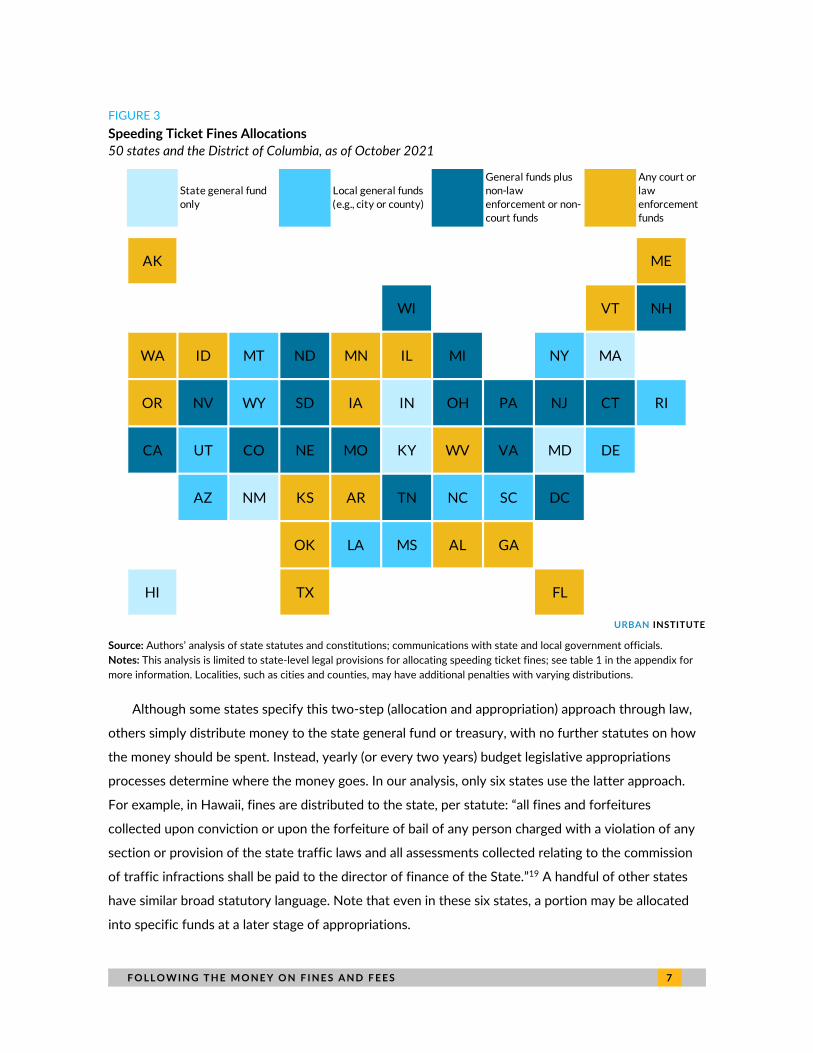
Across all 50 states and the District of Columbia, we find that 17 states distribute a portion of their
speeding ticket fine revenue to court or law enforcement funds (figure 3). Such funds include, but are
6 F O L L O W I N G T H E M O N E Y O N F I N E S A N D F E E S
not limited to, a Criminal Justice Information System Fund (Kansas), a Peace Officers Standards and
Training Fund (Idaho), and a Court Technology Fund (Vermont).
States allocate revenue into the funds as either a percentage of the base fine amount or a set
dollar amount from each ticket. Most states that distribute money to a law enforcement or court fund
also distribute some part of the revenue to a state or local general fund. In Maine, for example, 94
percent of the fine goes to the state general fund and 6 percent goes to the Law Enforcement Agency
Reimbursement Fund.10 Similarly, 91 percent of the fine in Iowa goes to the state court administrator,
and 9 percent goes to the county general fund.11 An example of a state that allocates some of the
money as a set dollar amount is Vermont, where $12.50 of each fine goes to the state’s Court
Technology Fund. The rest of the money goes into different funds, depending on the type of road
where the violation occurred (e.g., interstate, state, or local) and the speed limit.12 In Arkansas, fines go
to the state or county Administration of Justice Fund.13 Within the state’s fund, money is deposited
into 21 further funds, including the Judges Retirement Fund, Justice Building Fund, and Division of
Arkansas State Police Fund.14
We classified states that initially deposit speeding ticket fines into a general fund but later
explicitly (i.e., per statute) allocate some portion of it into a court or law enforcement fund into
category 4. For instance, in Oregon, fines go to the city, county, or state treasurer depending on which
law enforcement agency or officer enforced the violation.15 Fine money that is remitted to the county
then goes to a court facilities security account (40 percent) as well as to drug and alcohol programs
and a fund for the costs of planning, operating, and maintaining county juvenile and adult corrections
programs and facilities (60 percent).16
Another example is Idaho, where 10 percent of a speeding ticket fine is deposited in the state
treasury, of which 86 percent goes to the state general fund and 14 percent goes to the Peace
Officers Standards and Training Fund. The other 90 percent of the original ticket amount is divided
between the Highway Distribution Account (45.0 percent), the District Court Fund (22.5 percent), and
the Public School Income Fund (22.5 percent).17
Alaska also specifies a pathway for allocating revenue generated from fines. First, the funds
(considered program receipts by the state) are deposited into the state’s general fund. The legislature
may then appropriate the money into the Alaska Police Training Fund; from there, it can be further
appropriated to the Department of Public Safety for the Public Safety Training Public Academy, to the
Alaska Police Standards Council for law enforcement and corrections training, or to municipalities that
have their own police training programs.18
F O L L O W I N G T H E M O N E Y O N F I N E S A N D F E E S 7
FIGURE 3
Speeding Ticket Fines Allocations
50 states and the District of Columbia, as of October 2021
URBAN INSTITUTE
Source: Authors’ analysis of state statutes and constitutions; communications with state and local government officials.
Notes: This analysis is limited to state-level legal provisions for allocating speeding ticket fines; see table 1 in the appendix for
more information. Localities, such as cities and counties, may have additional penalties with varying distributions.
Although some states specify this two-step (allocation and appropriation) approach through law,
others simply distribute money to the state general fund or treasury, with no further statutes on how
the money should be spent. Instead, yearly (or every two years) budget legislative appropriations
processes determine where the money goes. In our analysis, only six states use the latter approach.
For example, in Hawaii, fines are distributed to the state, per statute: “all fines and forfeitures
collected upon conviction or upon the forfeiture of bail of any person charged with a violation of any
section or provision of the state traffic laws and all assessments collected relating to the commission
of traffic infractions shall be paid to the director of finance of the State.”19 A handful of other states
have similar broad statutory language. Note that even in these six states, a portion may be allocated
into specific funds at a later stage of appropriations.
AK ME
WI VT NH
WA ID MT ND MN IL MI NY MA
OR NV WY SD IA IN OH PA NJ CT RI
CA UT CO NE MO KY WV VA MD DE
AZ NM KS AR TN NC SC DC
OK LA MS AL GA
HI TX FL
State general fund
only
Local general funds
(e.g., city or county)
General funds plus
non-law
enforcement or non-
court funds
Any court or
law
enforcement
funds
8 F O L L O W I N G T H E M O N E Y O N F I N E S A N D F E E S
Eleven other states distribute speeding ticket fines to local general funds, including city and
county general funds. For example, both Mississippi and Wyoming allocate collected revenues into
county general funds,20 whereas a third of states (16 states and the District of Columbia) allocate their
fines to general funds and non–police or non–law enforcement funds. These states mostly allocate
their money toward state highway safety funds and school funds. New Jersey and Ohio, for example,
allocate their entire speeding ticket fine revenues into state highway funds.21
BOX 1
Transparency in Revenue Allocations
State reporting on speeding ticket allocations is inconsistent and difficult to interpret. In a number of
states, we required clarifications from state and local legislative and budgetary experts to conclude
where the funds are allocated.
Other states, however, demonstrated transparency. In Arizona, California, Connecticut, Michigan,
and Wisconsin, for example, we found summaries prepared by legislative, judicial, or transportation
agencies; in Idaho, New Mexico, and Oklahoma, we found clearly relayed statutes; and in Vermont and
Washington, we found helpful secondary analyses.
We found the most succinct reporting of revenue allocations in South Dakota. The state’s Unified
Judicial System lays out that, for a $117.50 speeding ticket issued on an interstate highway,
allocations are as follows:
◼ $39 to the school district in the county where the violation occurred
◼ $30 to the Law Enforcement Officer Training Fund
◼ $23.50 to the Unified Judicial System for court automation
◼ $11 to the 911 Telecommunicator Training Fund
◼ $6 to the Court Appointed Attorney & Public Defender Fund
◼ $5 to the Victim’s Compensation Fund
◼ $2 to the Court Appointed Special Advocates Fund
◼ $1 to the Abused and Neglected Child Defense Fund
Source: South Dakota Unified Judicial System (2020).
F O L L O W I N G T H E M O N E Y O N F I N E S A N D F E E S 9
Allocations of Speeding Ticket Fees and Surcharges
Most people may consider the entire point of a speeding ticket to be a mandatory fine or penalty, but
many jurisdictions impose additional mandatory fees or surcharges. In fact, the amount of a “base fine”
can be as low as 5 to 10 dollars in some states,22 but additional fees and surcharges make a huge
difference in how much a speeding ticket finally costs the recipient. Although fines are levied in
response to a conviction or violation and are meant to serve as a deterrence or punishment, fees may
bear no relation to the severity of the offense committed. These are meant to raise revenue and to
shift the costs of operating the justice system (as well as other general government services) from
typical taxes (income, property, or sales taxes) to essentially a tax on those who come into contact
with the court system.
We find that some form of fees or surcharges are levied in addition to speeding ticket fines in
every state except Montana (and the District of Columbia). Although most fees cover court costs and
administrative expenses, various states have begun to append a range of small fees to fund specific
government programs unrelated to courts.
It is also important to note here that for those who are liable for these speeding tickets, this
distinction between the fine and fee components may not be relevant; to them, it may simply be the
difference between a speeding ticket that they are able to pay, or one they cannot afford and
therefore they face additional penalties.
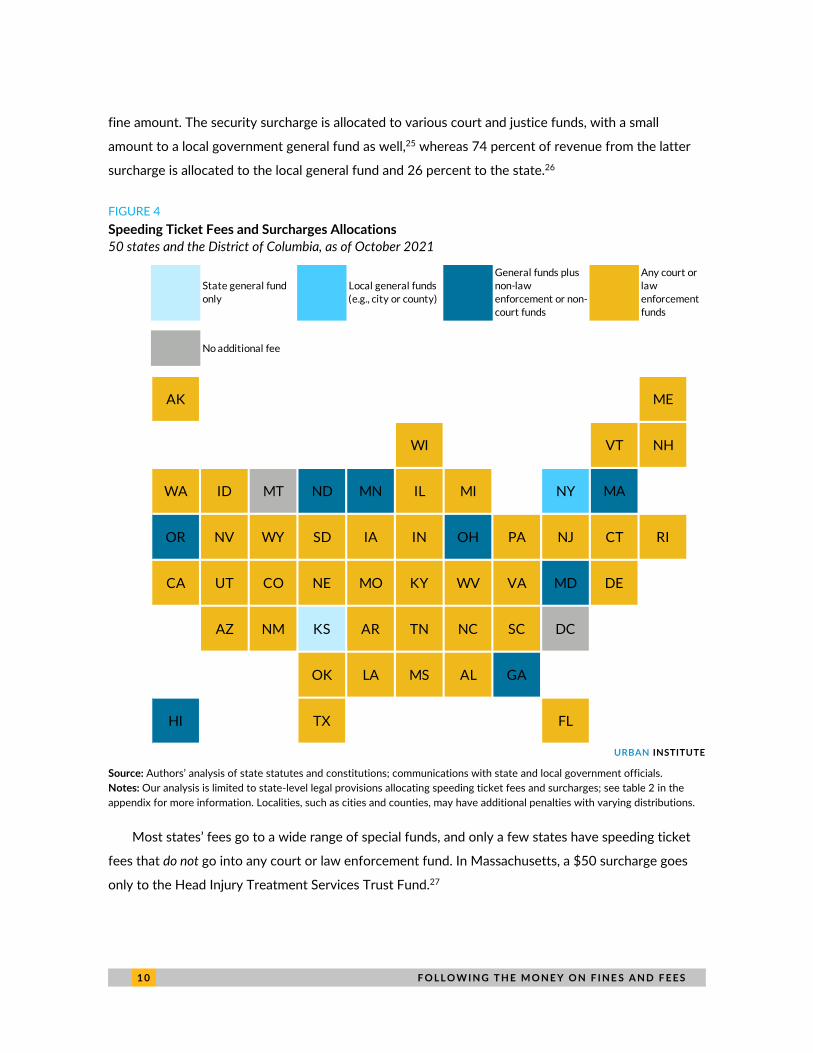
Using the same categories we used to classify fines, we find that 39 states distribute some portion
of additional fees and surcharges on speeding tickets into a court or law enforcement fund (figure 4).
We find that many states enforce fees or surcharges that are extraneous to judicial procedures.
For example, in Kentucky a speeding ticket will include a $100 court cost along with a $20 court
fee; a $10 fee for operation of a telephonic behavioral health jail triage system; and a $10 fee for the
training, salaries, and equipment of the Kentucky Internet Crimes Against Children Task Force.23
These fees and surcharges generate a total of $150 in penalties on top of the base fine amount, and
the revenue goes to a variety of funds and programs, including but not limited to the state general
fund, Kentucky Local Correctional Facilities Construction Authority, the Spinal Cord and Head Injury
Research Trust Fund, the Traumatic Brain Injury Trust Fund, and the Justice and Public Safety Cabinet
for background checks on firearm purchasers.24
Another state that levies additional penalties on top of fines is Utah. Utah’s courts impose two
surcharges on speeding fines, a $60 security surcharge and a surcharge that is 35 percent of the base
1 0 F O L L O W I N G T H E M O N E Y O N F I N E S A N D F E E S
fine amount. The security surcharge is allocated to various court and justice funds, with a small
amount to a local government general fund as well,25 whereas 74 percent of revenue from the latter
surcharge is allocated to the local general fund and 26 percent to the state.26
FIGURE 4
Speeding Ticket Fees and Surcharges Allocations
50 states and the District of Columbia, as of October 2021
URBAN INSTITUTE
Source: Authors’ analysis of state statutes and constitutions; communications with state and local government officials.
Notes: Our analysis is limited to state-level legal provisions allocating speeding ticket fees and surcharges; see table 2 in the
appendix for more information. Localities, such as cities and counties, may have additional penalties with varying distributions.
Most states’ fees go to a wide range of special funds, and only a few states have speeding ticket
fees that do not go into any court or law enforcement fund. In Massachusetts, a $50 surcharge goes
only to the Head Injury Treatment Services Trust Fund.27
AK ME
WI VT NH
WA ID MT ND MN IL MI NY MA
OR NV WY SD IA IN OH PA NJ CT RI
CA UT CO NE MO KY WV VA MD DE
AZ NM KS AR TN NC SC DC
OK LA MS AL GA
HI TX FL
State general fund
only
Local general funds
(e.g., city or county)
General funds plus
non-law
enforcement or non-
court funds
Any court or
law
enforcement
funds
No additional fee
F O L L O W I N G T H E M O N E Y O N F I N E S A N D F E E S 1 1
An accumulation of small fees can far exceed the base fine itself, a fact that contributes to the
high incidence of unpaid speeding tickets and outstanding court debt overall. Our analysis found at
least two states (California and West Virginia) that clearly dictate how revenue from partial payments
may be allocated. In West Virginia, for example, partial payments of fines and costs are credited in
sequential order to various funds: a Regional Jail Fund, followed by a Magistrate Court Fund and a
Worthless Check Fund.28
Altogether, we did not see a meaningful relationship between the state-level allocation rules
underpinning speeding ticket fines or fees and the amount of revenue raised from fines, fees, and
forfeitures. In other words, states that allow speeding ticket revenues to be retained by courts or law
enforcement agencies, per initial allocation rules (and excluding any varying local rules) may not
cumulatively rely more on fines and fees to fund their total budgets.
In addition to state-level allocations, we explored local-level allocations of fines and fees for only
the subset of large localities that raised the most or relied the most on fine and fee revenue, per the
above discussion of US Census Bureau data. Local officials in four cities (Boston, Chicago, Irvine, and
New York) told us that fines and fees are primarily allocated to their respective local general funds.
Fremont officials said that such revenues are allocated between the city’s general fund and other
special revenue funds but did not specify which special revenue funds. Los Angeles officials directed
us to a public financial data portal, which showed allocations in detail: nearly 91 percent in fiscal year
2019 went to the city’s general fund; 5 percent went to the City Attorney Consumer Protection Fund;
2 percent went to the Traffic Safety Fund; 1 percent went to the Code Compliance Fund; and smaller
shares went to the Narcotics Analysis Laboratory Fund, the Housing Production Revolving Fund, and a
few others.29 Garland, Texas, officials said about 82 percent in fiscal year 2019 went to the city’s
general fund, and the rest went to the SafeLight Fund, which helped administer the city’s red light
camera enforcement program (now defunct).
The Role of Fines and Fees in Larger Justice Issues
Over the past decade, nearly every state has expanded the range of criminal and civil court fees it
levies, including charging defendants for government services that previously had been paid for with
general tax revenues. This distinction matters because, ideally, a well-functioning justice system exists
as a public service for the benefit of all residents. As of 2014, defendants could be billed for public
defense lawyers in over 40 states, and inmates could be charged for jail or prison room and board
costs in another 40-plus.30
1 2 F O L L O W I N G T H E M O N E Y O N F I N E S A N D F E E S
Every stage of the justice system in the United States, each of which involves varying levels and
types of fines and fees, is closely intertwined with racial inequities, be it policing, pretrial, sentencing,
parole, or reentry following prison (The Sentencing Project 2018). For example, case studies in
Chicago, the District of Columbia, and others have revealed disproportionately high rates of traffic
tickets in neighborhoods with higher shares of Black residents.31
Such case studies exploring racial inequities in the administration and burden of fines and fees
have increased over recent decades. However, financial penalties for people who have contact with
the justice system have been around for centuries, and these penalties were historically used as a tool
to discriminate and to enable indentured servitude (Williamson 2020).
In broad outlines, the Jim Crow fiscal-carceral system functioned as follows. First, a state
or county official would, typically on the flimsiest of pretexts, convict a black person of a
“crime.” Some were crimes of poverty, such as vagrancy; others were violations of the
racist social code, such as ‘speaking loudly in the presence of white women.’ An enormous
range of behaviors were newly criminalized, and the penalties for those crimes were
extreme; “pig laws,” for instance, made stealing a hog a felony. In some areas, nonpayment
of taxes resulted in “hiring out” as forced labor—this despite constitutional prohibition of
imprisonment for debt. Then, instead of going to prison, convicts served their terms
working for employers who had signed contracts with the state or county. Convicts were
often leased en masse to the owners of mines, brickmaking or turpentine factories, and
similar enterprises.
—Vanessa Williamson, The Long Shadow of White Supremacist Fiscal Policy.
Unlike other state and local revenue sources such as income taxes, fines and fees are not typically
levied on a graduated scale. And in most states, unlike property taxes, fines and fees revenues are not
subject to state constitutional limits on how much can be levied or how much can be raised in a given
year (Yang 2017). Furthermore, most judges do not conduct “ability to pay” assessments when issuing
fines and when considering defendants who have failed to pay outstanding fees and fines (Martinez et
al. 2021). This is despite the US Supreme Court’s 1983 ruling in Bearden v. Georgia that said, “courts
may not incarcerate an individual for nonpayment of a fine or restitution without first holding a
F O L L O W I N G T H E M O N E Y O N F I N E S A N D F E E S 1 3
hearing on the individual’s ability to pay and making a finding that the failure to pay was willful”
(American Bar Association 2018).
Those unable to pay their fines and fees are often not provided alternatives, such as lenient
payment plans or community service, but instead face dire consequences. Based on rules that vary by
state, outstanding justice debt can lead to surcharge fees, high interest rates, bench warrants, driver’s
license suspension, disenfranchisement of voting rights, loss of job, lowering of credit score, and even
incarceration (Menendez et al. 2019). And neighborhoods with higher amounts of outstanding justice
debt per capita are likelier to have more residents of color and higher shares of residents living in
poverty; these neighborhoods also tend to have increased future poverty rates because of the justice
debt (O’Neill, Kennedy, and Harris 2021).
If fines and fees are used to fund day-to-day government operations or new initiatives, the
incentives to levy them go beyond deterrence of individual behavior. Previous research has
demonstrated that arrest rates of Black and Latinx people for drug-related violations or driving under
the influence have increased during times of local fiscal distress; this relationship was stronger in
places where law enforcement departments were allowed to retain funds from forfeitures (Makowsky,
Stratmann, and Tabarrok 2019).
Revenue-motivated policing and sentencing practices can undermine public trust and the
perceived legitimacy of the justice system. Previous research has demonstrated that if the general
public believes that police are operating by conventions of personal discretion rather than fair and
impartial legal proceedings, they are less likely to perceive law enforcement officers as having
legitimate authority (Murphy and Barkworth 2014; Murphy, Hinds, and Fleming 2008). And
defendants may be more likely to plead guilty if they believe that is the only way to avoid incurring
legal expenses in a protracted trial (Savitsky 2012).
State and local fiscal reforms, including limits on other revenue sources, can affect officer discretion
in ticketing practices. For example, after Proposition 2½ in Massachusetts placed limitations on
municipal property tax revenues, local law enforcement officers began to issue traffic citations more
aggressively, especially to out-of-town and out-of-state drivers (Makowsky and Stratmann 2009).
1 4 F O L L O W I N G T H E M O N E Y O N F I N E S A N D F E E S
BOX 2
Administering a “Broken Budget Model”
According to the Florida Clerks of Court Operations Corporation (2018), funding courts through fines
and fees is a “broken budget model” wherein clerks must rely on traffic citations for budgetary needs
but the funds raised are insufficient to meet the costs of administering the justice system; the authors
additionally noted that “clerks are committed to working with the legislature on a long-term solution.”
Menendez and colleagues (2019) showed that New Mexico and Texas localities are spending
$0.41 to $1.17 for each dollar ultimately raised in fines and fees on just compliance costs arising from
in-court proceedings and jail for defendants; these numbers would be even higher if costs for
processing warrants, issuing arrests, suspending drivers’ licenses, and administering parole and
probation were accounted for. Furthermore, incarcerating those unable to pay off their justice debt
can be an especially expensive use of government funds that does not lead to any increase in
revenues whatsoever, even though it is predicated on the goal of pushing future violators to pay their
fines and fees to avoid similar consequences. Many state and local governments do not publish or
closely track data on the range of costs involved with ensuring compliance with fines and fees,
including costs for public defenders, parole and probation officers, and license and revenue agencies.
In smaller cities, fines and fees may divert judges and police officers from other duties. Goldstein,
Sances, and You (2018) found that the rate of violent crimes solved decreases when a local
government’s reliance on fines, fees, and forfeitures revenue increases. Because judges and police
officers can be especially overburdened by the various capacities in which they serve in smaller
communities, enforcing fines and fees may come at the cost of ensuring public safety.
Sources: Florida Clerks of Court Operations Corporation (2018); Goldstein, Sances, and You (2018); Menendez et al. (2019).
The monumental investigation of Ferguson, Missouri by the US Department of Justice (2015)
found extensive evidence of the city finance director, municipal court, and police department using
fines and fees for perverse revenue-generation purposes. For example, the city’s finance director
increased the amounts of fines and asked police to increase ticket writing and municipal code
enforcement in order to make up for sales tax shortfalls and to “deliver [a] 10% increase” (US
Department of Justice 2015). In response, the police chief changed patrol assignments and shift
schedules to increase traffic enforcement and collections. The investigation also found significant and
consistent racial disparities throughout police and court enforcement actions, along with evidence of
racial biases and stereotypes against Black residents in local official email communications. The
investigation concluded that the department’s actions compromised public safety by focusing on
revenues and violated federal laws by imposing disparate harms upon Ferguson’s Black residents (US
Department of Justice 2015).
F O L L O W I N G T H E M O N E Y O N F I N E S A N D F E E S 1 5
Across the nation, understanding the connections between fines and fees and racial inequities
would be more straightforward if all states and localities collected and made available more data on
their policing and sentencing practices. For example, in a recent ProPublica investigation, Richard
Webster noted that 22 states have instituted traffic stop data collection laws, most recently California,
Colorado, the District of Columbia, Illinois, Oregon, and Virginia.32 However, in their current form,
these laws can have key limitations. Louisiana’s rules exempt law enforcement agencies from
collecting and disbursing data if they have an “anti-racial-profiling policy” in place. This has meant that
many local agencies do not submit data to the state or the public. Furthermore, Louisiana’s laws
require officers to record the race of drivers based on the “observation and perception of the law
enforcement officer”; in practice, this has contributed to serious inconsistencies in Jefferson Parish’s
traffic records that, in part, cover up potential officer misconduct.33
In a recent New York Times investigation, McIntire and Keller found that over the past five years,
more than 400 unarmed civilian drivers across the country have been killed by police officers pursuing
them under suspicion of nonviolent crimes, such as speeding or license infractions.34 The authors
documented how traffic ticket revenues shape traffic enforcement. Under federal highway safety
grants, for example, at least 20 states use traffic stop quotas as a police performance measure, even
though federal officials noted the grants do not require or encourage such evaluations. For example,
the police chief of Windsor, Virginia, sent an email to officers in January 2021 reminding them that
they were “required to write a minimum of two tickets per hour while on grant time and there is zero
tolerance.”35
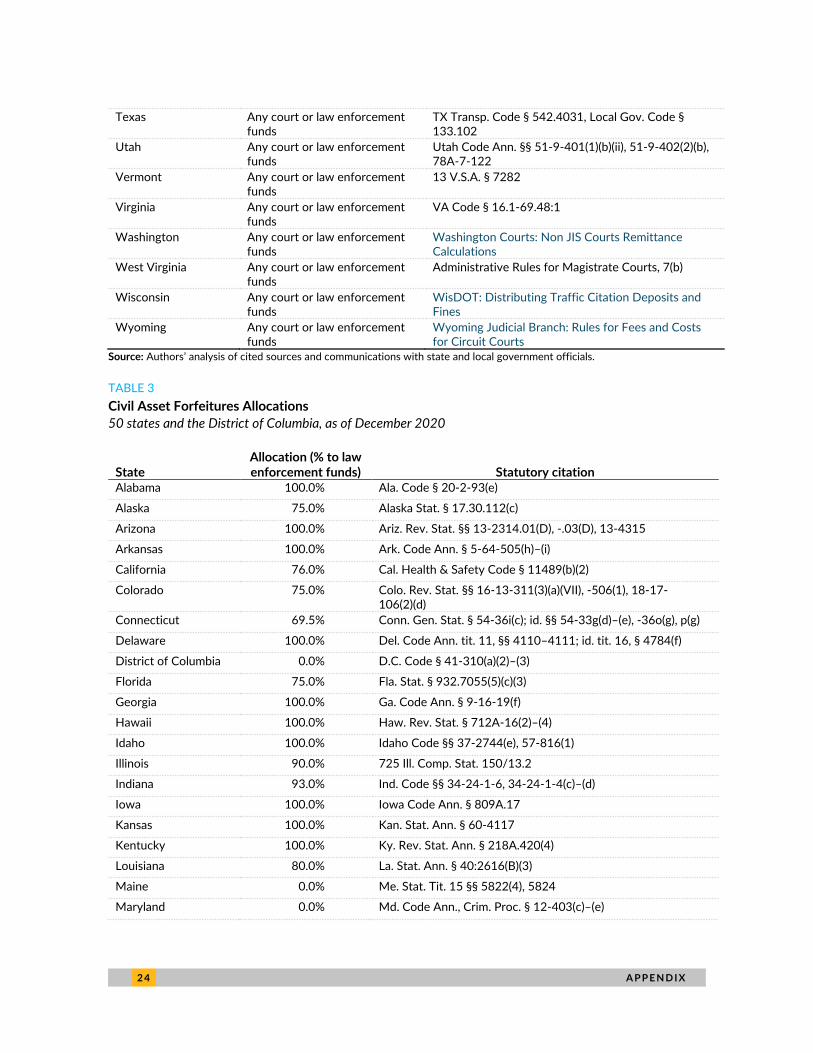
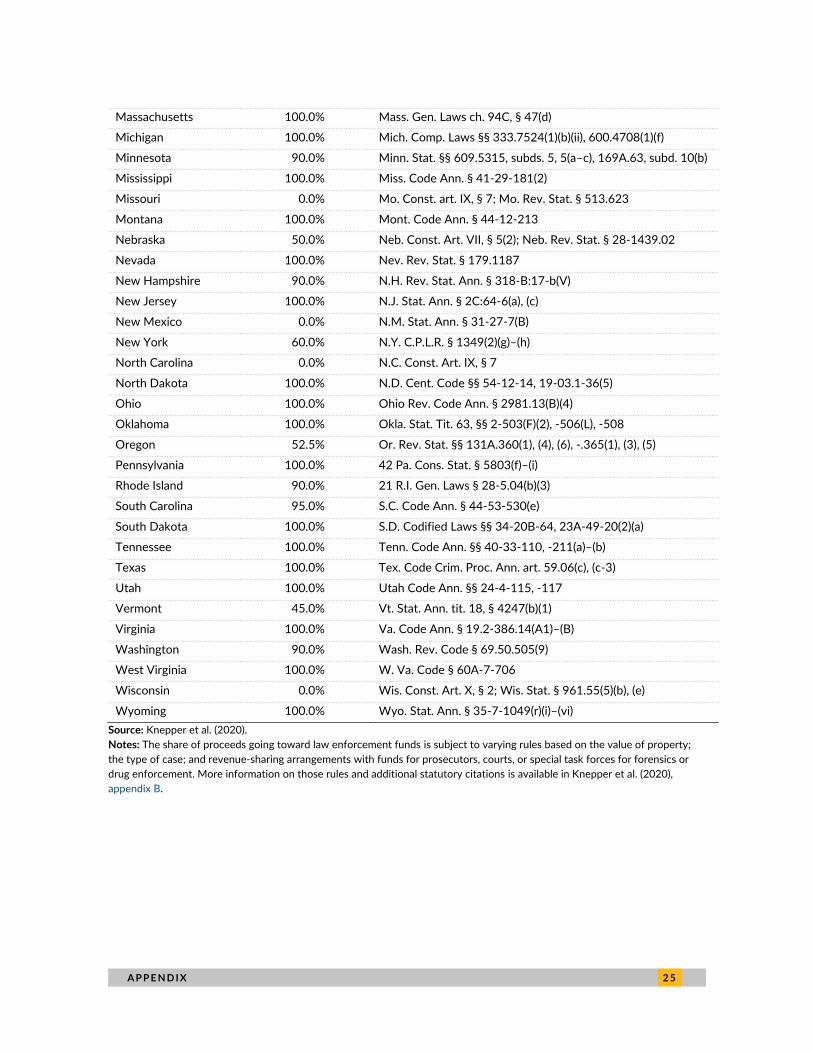
Last, we focus our main analysis on the allocations of speeding ticket fines and fees, in part
because previous research has already shed light on misaligned fiscal incentives for forfeitures.
Knepper and colleagues (2020) demonstrated that in most states, police departments that seize cash
or property related to a crime can keep all or most of it (see table 3 in the appendix for state-by-state
information on civil asset forfeiture laws). Only the District of Columbia, Maine, Maryland, Missouri,
New Mexico, North Carolina, and Wisconsin have explicit rules that disallow their law enforcement
departments from retaining forfeiture proceeds; however, those restrictions are sometimes bypassed.
Holcomb, Kovandzic, and Williams (2011) noted that in states that restrict conflicts of interest, local
law enforcement agencies sometimes rely on federal “equitable sharing” mechanisms. These
arrangements allow local law enforcement to transfer assets and property seized in relation to
violations of federal laws directly to the federal government (as opposed to the state government),
and the federal government returns to the local entity a share of the proceeds.
1 6 F O L L O W I N G T H E M O N E Y O N F I N E S A N D F E E S
Conclusions and Policy Implications
In some ways, fines and fees are considered similar to general charges; they both belong in the
category of nontax revenue sources that (1) are not typically subject to constitutional limits restricting
the amount state and local governments can tax, (2) are not levied as a share of income or wealth, and
(3) are utilized in part to “charge” residents for government services. Over the past few decades,
general charges, such as highway tolls, metered parking, public university tuition, and public hospital
payments, have composed a growing share of state and local government revenues. We know that
reliance on fines, fees, and forfeitures as a revenue source has not grown as much as these general
charges, per the US Census Bureau data. But there is a key difference between the motivation for and
impacts of financial penalties and those of general user charges. Unlike general charges, which are
often levied in exchange for certain benefits to those choosing to pay for a service (for example, a
parking space or a higher education degree), fines and fees are disproportionately levied on those least
able to pay and are mostly levied without alternatives (such as community service or a payment plan).
For some, fines and fees may also evoke so-called sin taxes on alcohol and tobacco products: both
revenue categories are meant, in part, to change behaviors, and both can be fairly regressive in their
burdens by income. But consumption of alcohol and tobacco products is presumably by consumer
choice, unlike fines and fees, which are discriminatorily levied and often unjustly enforced.
Furthermore, previous research has shown that fees, in particular court-related costs, have little to no
deterrent effects and can instead lead to more debt and worsen livelihoods (Bannon, Nagrecha, and
Diller 2010; Harris, Evans, and Beckett 2010). For these reasons and more, fines and fees warrant
reexamination within state and local finance models.
Although there is a growing understanding of how fines and fees impose unjust burdens and
engender perverse fiscal incentives, meaningful reforms are fairly nascent. During the COVID-19
pandemic, some states, including Michigan and Oregon, relaxed enforcement of penalties for
nonpayment of fines and fees.36 In 2018, San Francisco eliminated locally controlled administrative
fees levied on those exiting the justice system and also waived over $32 million in unpaid debt.37 In
California, overall, where over a quarter of fines and fees revenue goes to state trial courts, the state is
piloting ability-to-pay adjudications, has shifted fines and fees funding streams over to the general
fund, and has eliminated driver’s license suspensions for nonpayment.38 The state’s nonpartisan
Legislative Analyst’s Office recommends that the state increase legislative control by depositing most
fine and fee revenues in the general fund and that it consolidate various types of court fees.39 In New
York, the End Predatory Court Fees Act (S.3979/A.2348), which is presently in committee, seeks to
eliminate the state-level mandatory surcharge as well as parole and probation fees, revise the way
F O L L O W I N G T H E M O N E Y O N F I N E S A N D F E E S 1 7
judges set fines, and end incarceration and commissary garnishment for unpaid fines and fees.40 Such
examples, however, remain exceptions and not the norm.
In 2015, after the Department of Justice’s Ferguson investigation, Missouri introduced a limit of
30 percent of annual revenue that localities may derive from most financial penalties (changed to 20
percent shortly after passage), with the excess to be disbursed by the state to school districts. Initially,
the limit was lower (12.5 percent) for St. Louis County, which includes Ferguson, but that rule was
held unconstitutional by the Missouri Supreme Court.41 However, even 10 percent of general revenue
from fines, fees, and forfeitures would be exceptionally high among states and localities across the
country.
Our analysis is a first step in exploring how revenue allocations from one specific type of violation
(speeding tickets) could perpetuate harmful fiscal incentives across localities. We find that in at least
43 states, some portion of speeding ticket fines, fees, or surcharges is allocated toward a court or law
enforcement fund. We also find that in 13 states, including Arkansas, Iowa, and Washington, a
significant share of revenue from both speeding ticket fines and fees is allocated to special funds
dedicated to court or law enforcement activities.
Because we are unable to ascertain how exactly money from fines and fees is eventually spent,
our findings do not conclude whether an allocation into the state general fund is always better or
worse than an allocation into a court or law enforcement fund. For example, a state may direct its
fines and fees revenue only into its own general fund, but then, during the legislative appropriations
process, distribute the funds to law enforcement agencies or courts based on how much revenue each
raised. And we know from the Ferguson investigation that state and local leaders are cognizant of the
potential for revenue generation from fines and fees. This means that leaders at these levels can push
for aggressive enforcement to raise general funds, not just funds for courts or law enforcement
agencies. Prior literature has highlighted, however, that severing the relationship between revenue
collections and budgeting for justice administration and enforcement activities could help reduce fiscal
incentives in policing and sentencing (Makowsky 2019).
Legal rules that empower courts and law enforcement agencies to pursue revenue generation
through the justice system can undermine public safety and trust. They can also exacerbate the racial
disparities that underpin policing and sentencing practices across the United States. To the extent that
state-level allocations of revenues help determine how funds are eventually spent, our findings show
cause for concern over misaligned fiscal incentives and the potential for conflicts of interest over fines
and fees.
1 8 A P P E N D I X
Appendix: Data and Methods For data on how much money states and localities collect from fines, fees, and forfeitures, we examine
the US Census Bureau’s Census of Governments (2020) and its Annual Survey of State and Local
Government Finances (2021). The latest available data for the 50 states and the District of Columbia,
as well as most large cities and counties with over 200,000 people, are for fiscal year 2019. The latest
available data that cover every city, township, or other small local government unit in the country are
for fiscal year 2017. This information can also be found within specific state and local annual financial
reports, but the census data are the most comprehensive national accounting of local finances and
make standardization and comparisons of revenue amounts more feasible. Neither census data nor the
handful of state-level and city-level analyses we encountered provided a detailed breakdown of these
revenues by type of penalty (fine versus fee versus forfeiture) or by the type of violation or the agency
collecting the money.
For data on how speeding ticket fines and fees are allocated, we rely on state statutes, codes, and
constitutional provisions. All states and the District of Columbia publish revised statutes or provisions
that reflect the current version of law. We researched and reviewed the specific state statutes
surrounding the distribution of fine revenues for speeding violations for each state. We began our
search for relevant state statutes through the 50-State Criminal Justice Debt Reform Builder
developed at Harvard Law School.42 This website has a Law Explorer tool that lets users find laws
relating to “revenue flow” as well as other justice topics. Although not exhaustive, the tool initially
guided our search by pointing us to where statutes relating to the disbursement of traffic fines and
fees are usually located within state statutes. We then directly looked into state statutory websites.
State statutes are complex and lengthy, and they vary in their organization. To minimize the
amount of time spent searching through state websites, we used common phrases and words
associated with the collection of revenue to refine our search. Some of these included “disposition of
fines,” “deposit/receipt of funds,” “remittances,” “use of proceeds,” and “distribution of revenue.” Most
states codify the disposition of traffic fines statutes under a motor vehicles title, though sometimes
the statute is located under court and judicial titles. It was helpful to first find the statute where a
speeding offense or violation is defined and to make note of the statute number. Sometimes statutes
reference other statutes by number instead of title. For example, the Ohio law for disposition of fines
relating to traffic offenses does not directly reference speeding in its text; instead, it references
different chapters within the code. Since Chapter 4511 houses traffic laws and laws on the operation
A P P E N D I X 1 9
of motor vehicles, including speeding laws, we were able to confirm that Ohio Rev. Code Ann. §
4501.06 is applicable to revenue from speeding ticket fines.43
Once we found the appropriate statute, we categorized each state into its allocation category
depending on how it distributes speeding ticket fines revenue:
1. State general fund only
2. Local general funds (e.g., city or county)
3. General funds plus non–law enforcement or non–court funds
4. Any court or law enforcement funds
We applied the same methodology to find and categorize the distribution of additional fees (in
addition to the “base” fines) associated with speeding tickets. We compiled all relevant legal language
in one place per state, which allowed us to determine each state’s allocations overall.
In most states, revenue from speeding tickets is distributed across a variety of funds that span our
criteria. In such cases, we categorize a state in the highest applicable category; that is, a state is
categorized as “4. Any court or law enforcement funds” even if a small portion of revenue goes into a
court or law enforcement fund and the rest goes to the state general fund. Similarly, a state is
categorized as “2. Local general funds (e.g., city or county)” if, in addition to a state general fund
allocation, some amount is also distributed to a city or county general fund.
See tables 1 and 2 for each state’s allocation category and corresponding statute citation for
speeding ticket revenues. Additionally, see table 3 for each state’s information for civil asset
forfeitures, per Knepper and colleagues (2020).
For states whose statutory or constitutional provisions were difficult to locate, we sought help
from state and local government officials, such as legislative librarians, legal counsel, court officials,
revenue and budget department directors, and treasury specialists. These personnel have expertise in
their states’ statutes and laws, as well as an awareness of any recently enacted legislation that may not
yet be reflected in online collections. In total, we contacted a handful of officials each in over 30 states
and 10 localities; most officials responded through email or phone communications, whereas a handful
processed our queries as Freedom of Information Act or public information record requests.
Our research on allocation rules and misaligned fiscal incentives is not exhaustive for several
reasons: we focus only on speeding ticket revenues, we primarily study state-level rules, we do not
make a distinction between the types of court or law enforcement funds where revenue from fines
2 0 A P P E N D I X
and fees are allocated, we do not have detailed breakdowns of exactly how much of the speeding
ticket revenues go to court or law enforcement funds, and we look only at initial allocations and not
how the funds are eventually spent. In future research, we hope to untangle some of these
unanswered questions.
Although we have endeavored to be as transparent and comprehensive as possible, comparing
statutory provisions across states is a convoluted process, and we may have missed some provisions.
However, our analysis may serve as a foundation for investigating how laws for allocating speeding
ticket revenues, and for the fines and fees connected with them, can embed fiscal incentives for
aggressive and unjust policing and sentencing practices.
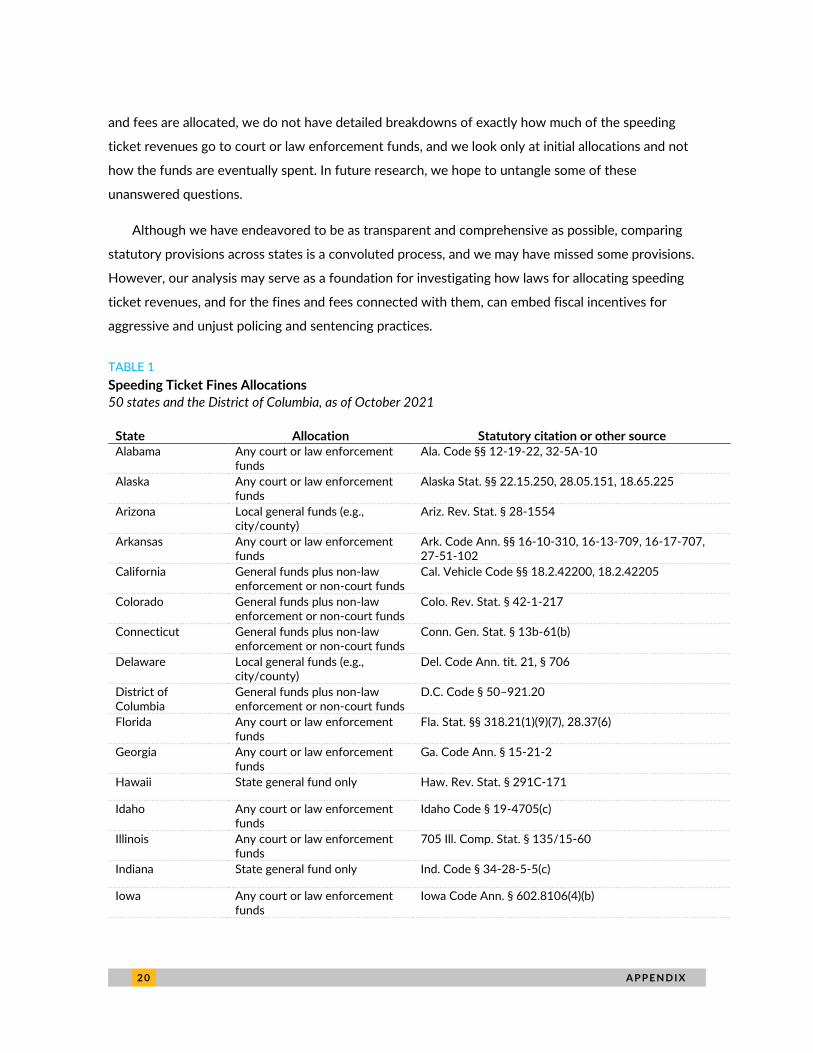
TABLE 1
Speeding Ticket Fines Allocations
50 states and the District of Columbia, as of October 2021
State Allocation Statutory citation or other source Alabama Any court or law enforcement
funds Ala. Code §§ 12-19-22, 32-5A-10
Alaska Any court or law enforcement funds
Alaska Stat. §§ 22.15.250, 28.05.151, 18.65.225
Arizona Local general funds (e.g., city/county)
Ariz. Rev. Stat. § 28-1554
Arkansas Any court or law enforcement funds
Ark. Code Ann. §§ 16-10-310, 16-13-709, 16-17-707, 27-51-102
California General funds plus non-law enforcement or non-court funds
Cal. Vehicle Code §§ 18.2.42200, 18.2.42205
Colorado General funds plus non-law enforcement or non-court funds
Colo. Rev. Stat. § 42-1-217
Connecticut General funds plus non-law enforcement or non-court funds
Conn. Gen. Stat. § 13b-61(b)
Delaware Local general funds (e.g., city/county)
Del. Code Ann. tit. 21, § 706
District of Columbia
General funds plus non-law enforcement or non-court funds
D.C. Code § 50–921.20
Florida Any court or law enforcement funds
Fla. Stat. §§ 318.21(1)(9)(7), 28.37(6)
Georgia Any court or law enforcement funds
Ga. Code Ann. § 15-21-2
Hawaii State general fund only Haw. Rev. Stat. § 291C-171
Idaho Any court or law enforcement funds
Idaho Code § 19-4705(c)
Illinois Any court or law enforcement funds
705 Ill. Comp. Stat. § 135/15-60
Indiana State general fund only Ind. Code § 34-28-5-5(c)
Iowa Any court or law enforcement funds
Iowa Code Ann. § 602.8106(4)(b)
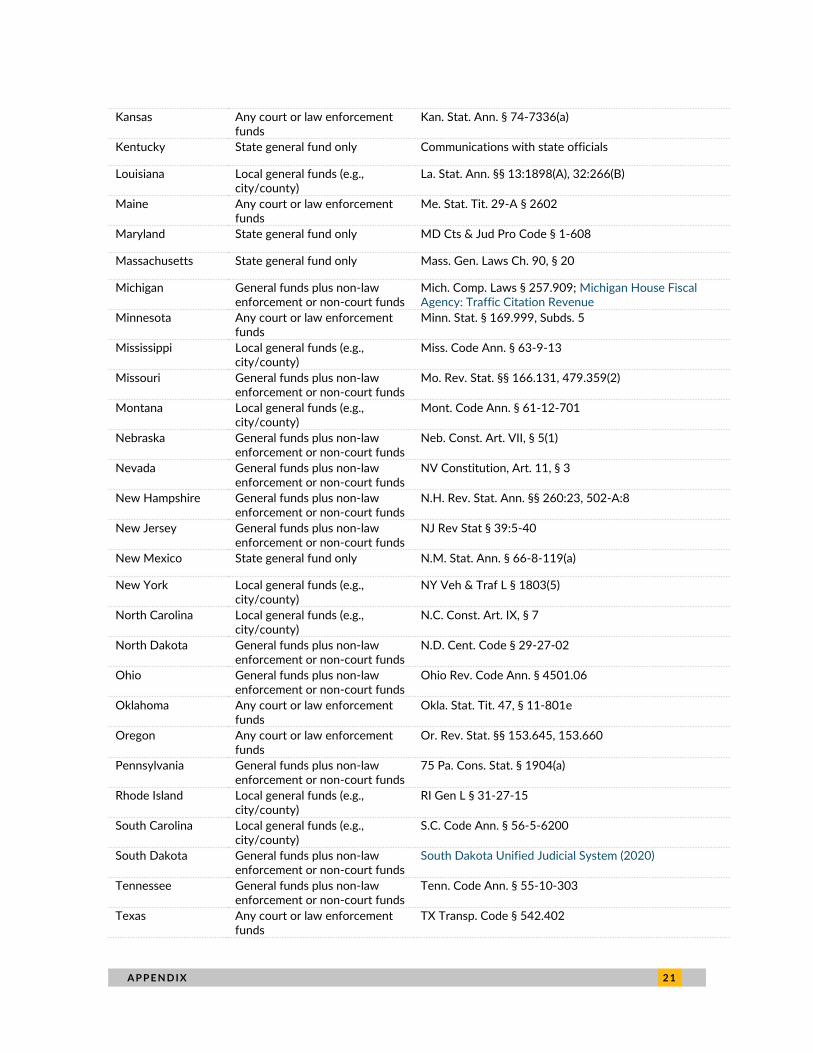
A P P E N D I X 2 1
Kansas Any court or law enforcement funds
Kan. Stat. Ann. § 74-7336(a)
Kentucky State general fund only Communications with state officials
Louisiana Local general funds (e.g., city/county)
La. Stat. Ann. §§ 13:1898(A), 32:266(B)
Maine Any court or law enforcement funds
Me. Stat. Tit. 29-A § 2602
Maryland State general fund only MD Cts & Jud Pro Code § 1-608
Massachusetts State general fund only Mass. Gen. Laws Ch. 90, § 20
Michigan General funds plus non-law enforcement or non-court funds
Mich. Comp. Laws § 257.909; Michigan House Fiscal Agency: Traffic Citation Revenue
Minnesota Any court or law enforcement funds
Minn. Stat. § 169.999, Subds. 5
Mississippi Local general funds (e.g., city/county)
Miss. Code Ann. § 63-9-13
Missouri General funds plus non-law enforcement or non-court funds
Mo. Rev. Stat. §§ 166.131, 479.359(2)
Montana Local general funds (e.g., city/county)
Mont. Code Ann. § 61-12-701
Nebraska General funds plus non-law enforcement or non-court funds
Neb. Const. Art. VII, § 5(1)
Nevada General funds plus non-law enforcement or non-court funds
NV Constitution, Art. 11, § 3
New Hampshire General funds plus non-law enforcement or non-court funds
N.H. Rev. Stat. Ann. §§ 260:23, 502-A:8
New Jersey General funds plus non-law enforcement or non-court funds
NJ Rev Stat § 39:5-40
New Mexico State general fund only N.M. Stat. Ann. § 66-8-119(a)
New York Local general funds (e.g., city/county)
NY Veh & Traf L § 1803(5)
North Carolina Local general funds (e.g., city/county)
N.C. Const. Art. IX, § 7
North Dakota General funds plus non-law enforcement or non-court funds
N.D. Cent. Code § 29-27-02
Ohio General funds plus non-law enforcement or non-court funds
Ohio Rev. Code Ann. § 4501.06
Oklahoma Any court or law enforcement funds
Okla. Stat. Tit. 47, § 11-801e
Oregon Any court or law enforcement funds
Or. Rev. Stat. §§ 153.645, 153.660
Pennsylvania General funds plus non-law enforcement or non-court funds
75 Pa. Cons. Stat. § 1904(a)
Rhode Island Local general funds (e.g., city/county)
RI Gen L § 31-27-15
South Carolina Local general funds (e.g., city/county)
S.C. Code Ann. § 56-5-6200
South Dakota General funds plus non-law enforcement or non-court funds
South Dakota Unified Judicial System (2020)
Tennessee General funds plus non-law enforcement or non-court funds
Tenn. Code Ann. § 55-10-303
Texas Any court or law enforcement funds
TX Transp. Code § 542.402
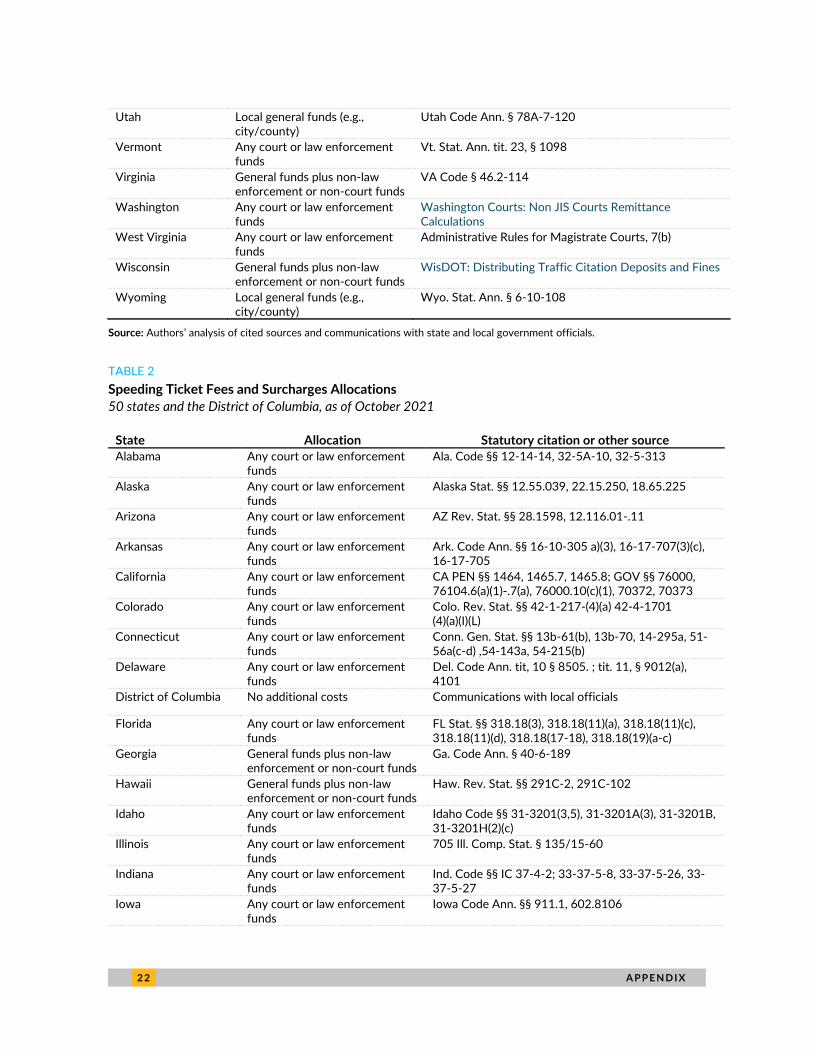
2 2 A P P E N D I X
Utah Local general funds (e.g., city/county)
Utah Code Ann. § 78A-7-120
Vermont Any court or law enforcement funds
Vt. Stat. Ann. tit. 23, § 1098
Virginia General funds plus non-law enforcement or non-court funds
VA Code § 46.2-114
Washington Any court or law enforcement funds
Washington Courts: Non JIS Courts Remittance Calculations
West Virginia Any court or law enforcement funds
Administrative Rules for Magistrate Courts, 7(b)
Wisconsin General funds plus non-law enforcement or non-court funds
WisDOT: Distributing Traffic Citation Deposits and Fines
Wyoming Local general funds (e.g., city/county)
Wyo. Stat. Ann. § 6-10-108
Source: Authors’ analysis of cited sources and communications with state and local government officials.
TABLE 2
Speeding Ticket Fees and Surcharges Allocations
50 states and the District of Columbia, as of October 2021
State Allocation Statutory citation or other source
Alabama Any court or law enforcement funds
Ala. Code §§ 12-14-14, 32-5A-10, 32-5-313
Alaska Any court or law enforcement funds
Alaska Stat. §§ 12.55.039, 22.15.250, 18.65.225
Arizona Any court or law enforcement funds
AZ Rev. Stat. §§ 28.1598, 12.116.01-.11
Arkansas Any court or law enforcement funds
Ark. Code Ann. §§ 16-10-305 a)(3), 16-17-707(3)(c), 16-17-705
California Any court or law enforcement funds
CA PEN §§ 1464, 1465.7, 1465.8; GOV §§ 76000, 76104.6(a)(1)-.7(a), 76000.10(c)(1), 70372, 70373
Colorado Any court or law enforcement funds
Colo. Rev. Stat. §§ 42-1-217-(4)(a) 42-4-1701 (4)(a)(I)(L)
Connecticut Any court or law enforcement funds
Conn. Gen. Stat. §§ 13b-61(b), 13b-70, 14-295a, 51-56a(c-d) ,54-143a, 54-215(b)
Delaware Any court or law enforcement funds
Del. Code Ann. tit, 10 § 8505. ; tit. 11, § 9012(a), 4101
District of Columbia No additional costs Communications with local officials
Florida Any court or law enforcement funds
FL Stat. §§ 318.18(3), 318.18(11)(a), 318.18(11)(c), 318.18(11)(d), 318.18(17-18), 318.18(19)(a-c)
Georgia General funds plus non-law enforcement or non-court funds
Ga. Code Ann. § 40-6-189
Hawaii General funds plus non-law enforcement or non-court funds
Haw. Rev. Stat. §§ 291C-2, 291C-102
Idaho Any court or law enforcement funds
Idaho Code §§ 31-3201(3,5), 31-3201A(3), 31-3201B, 31-3201H(2)(c)
Illinois Any court or law enforcement funds
705 Ill. Comp. Stat. § 135/15-60
Indiana Any court or law enforcement funds
Ind. Code §§ IC 37-4-2; 33-37-5-8, 33-37-5-26, 33-37-5-27
Iowa Any court or law enforcement funds
Iowa Code Ann. §§ 911.1, 602.8106
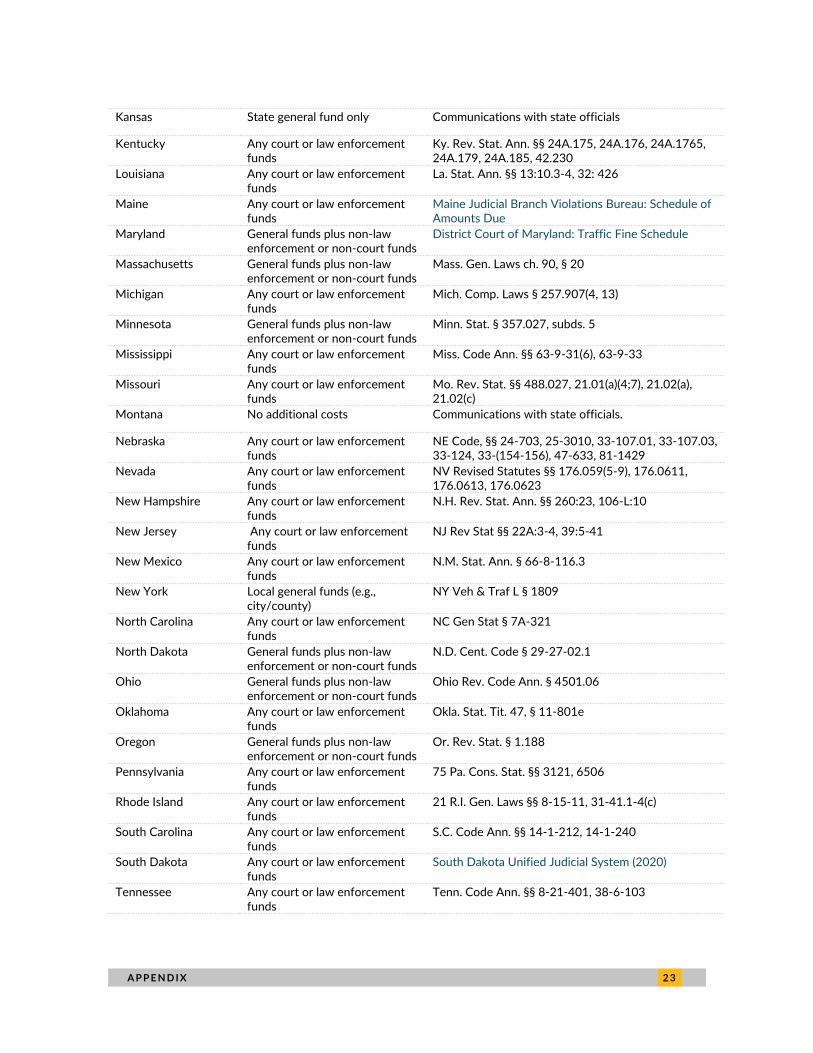
A P P E N D I X 2 3
Kansas State general fund only Communications with state officials
Kentucky Any court or law enforcement funds
Ky. Rev. Stat. Ann. §§ 24A.175, 24A.176, 24A.1765, 24A.179, 24A.185, 42.230
Louisiana Any court or law enforcement funds
La. Stat. Ann. §§ 13:10.3-4, 32: 426
Maine Any court or law enforcement funds
Maine Judicial Branch Violations Bureau: Schedule of Amounts Due
Maryland General funds plus non-law enforcement or non-court funds
District Court of Maryland: Traffic Fine Schedule
Massachusetts General funds plus non-law enforcement or non-court funds
Mass. Gen. Laws ch. 90, § 20
Michigan Any court or law enforcement funds
Mich. Comp. Laws § 257.907(4, 13)
Minnesota General funds plus non-law enforcement or non-court funds
Minn. Stat. § 357.027, subds. 5
Mississippi Any court or law enforcement funds
Miss. Code Ann. §§ 63-9-31(6), 63-9-33
Missouri Any court or law enforcement funds
Mo. Rev. Stat. §§ 488.027, 21.01(a)(4;7), 21.02(a), 21.02(c)
Montana No additional costs Communications with state officials.
Nebraska Any court or law enforcement funds
NE Code, §§ 24-703, 25-3010, 33-107.01, 33-107.03, 33-124, 33-(154-156), 47-633, 81-1429
Nevada Any court or law enforcement funds
NV Revised Statutes §§ 176.059(5-9), 176.0611, 176.0613, 176.0623
New Hampshire Any court or law enforcement funds
N.H. Rev. Stat. Ann. §§ 260:23, 106-L:10
New Jersey Any court or law enforcement funds
NJ Rev Stat §§ 22A:3-4, 39:5-41
New Mexico Any court or law enforcement funds
N.M. Stat. Ann. § 66-8-116.3
New York Local general funds (e.g., city/county)
NY Veh & Traf L § 1809
North Carolina Any court or law enforcement funds
NC Gen Stat § 7A-321
North Dakota General funds plus non-law enforcement or non-court funds
N.D. Cent. Code § 29-27-02.1
Ohio General funds plus non-law enforcement or non-court funds
Ohio Rev. Code Ann. § 4501.06
Oklahoma Any court or law enforcement funds
Okla. Stat. Tit. 47, § 11-801e
Oregon General funds plus non-law enforcement or non-court funds
Or. Rev. Stat. § 1.188
Pennsylvania Any court or law enforcement funds
75 Pa. Cons. Stat. §§ 3121, 6506
Rhode Island Any court or law enforcement funds
21 R.I. Gen. Laws §§ 8-15-11, 31-41.1-4(c)
South Carolina Any court or law enforcement funds
S.C. Code Ann. §§ 14-1-212, 14-1-240
South Dakota Any court or law enforcement funds
South Dakota Unified Judicial System (2020)
Tennessee Any court or law enforcement funds
Tenn. Code Ann. §§ 8-21-401, 38-6-103
2 4 A P P E N D I X
Texas Any court or law enforcement funds
TX Transp. Code § 542.4031, Local Gov. Code § 133.102
Utah Any court or law enforcement funds
Utah Code Ann. §§ 51-9-401(1)(b)(ii), 51-9-402(2)(b), 78A-7-122
Vermont Any court or law enforcement funds
13 V.S.A. § 7282
Virginia Any court or law enforcement funds
VA Code § 16.1-69.48:1
Washington Any court or law enforcement funds
Washington Courts: Non JIS Courts Remittance Calculations
West Virginia Any court or law enforcement funds
Administrative Rules for Magistrate Courts, 7(b)
Wisconsin Any court or law enforcement funds
WisDOT: Distributing Traffic Citation Deposits and Fines
Wyoming Any court or law enforcement funds
Wyoming Judicial Branch: Rules for Fees and Costs for Circuit Courts
Source: Authors’ analysis of cited sources and communications with state and local government officials.
TABLE 3
Civil Asset Forfeitures Allocations
50 states and the District of Columbia, as of December 2020
State Allocation (% to law enforcement funds) Statutory citation
Alabama 100.0% Ala. Code § 20-2-93(e)
Alaska 75.0% Alaska Stat. § 17.30.112(c)
Arizona 100.0% Ariz. Rev. Stat. §§ 13-2314.01(D), -.03(D), 13-4315
Arkansas 100.0% Ark. Code Ann. § 5-64-505(h)–(i)
California 76.0% Cal. Health & Safety Code § 11489(b)(2)
Colorado 75.0% Colo. Rev. Stat. §§ 16-13-311(3)(a)(VII), -506(1), 18-17-106(2)(d)
Connecticut 69.5% Conn. Gen. Stat. § 54-36i(c); id. §§ 54-33g(d)–(e), -36o(g), p(g)
Delaware 100.0% Del. Code Ann. tit. 11, §§ 4110–4111; id. tit. 16, § 4784(f)
District of Columbia 0.0% D.C. Code § 41-310(a)(2)–(3)
Florida 75.0% Fla. Stat. § 932.7055(5)(c)(3)
Georgia 100.0% Ga. Code Ann. § 9-16-19(f)
Hawaii 100.0% Haw. Rev. Stat. § 712A-16(2)–(4)
Idaho 100.0% Idaho Code §§ 37-2744(e), 57-816(1)
Illinois 90.0% 725 Ill. Comp. Stat. 150/13.2
Indiana 93.0% Ind. Code §§ 34-24-1-6, 34-24-1-4(c)–(d)
Iowa 100.0% Iowa Code Ann. § 809A.17
Kansas 100.0% Kan. Stat. Ann. § 60-4117
Kentucky 100.0% Ky. Rev. Stat. Ann. § 218A.420(4)
Louisiana 80.0% La. Stat. Ann. § 40:2616(B)(3)
Maine 0.0% Me. Stat. Tit. 15 §§ 5822(4), 5824
Maryland 0.0% Md. Code Ann., Crim. Proc. § 12-403(c)–(e)
A P P E N D I X 2 5
Massachusetts 100.0% Mass. Gen. Laws ch. 94C, § 47(d)
Michigan 100.0% Mich. Comp. Laws §§ 333.7524(1)(b)(ii), 600.4708(1)(f)
Minnesota 90.0% Minn. Stat. §§ 609.5315, subds. 5, 5(a–c), 169A.63, subd. 10(b)
Mississippi 100.0% Miss. Code Ann. § 41-29-181(2)
Missouri 0.0% Mo. Const. art. IX, § 7; Mo. Rev. Stat. § 513.623
Montana 100.0% Mont. Code Ann. § 44-12-213
Nebraska 50.0% Neb. Const. Art. VII, § 5(2); Neb. Rev. Stat. § 28-1439.02
Nevada 100.0% Nev. Rev. Stat. § 179.1187
New Hampshire 90.0% N.H. Rev. Stat. Ann. § 318-B:17-b(V)
New Jersey 100.0% N.J. Stat. Ann. § 2C:64-6(a), (c)
New Mexico 0.0% N.M. Stat. Ann. § 31-27-7(B)
New York 60.0% N.Y. C.P.L.R. § 1349(2)(g)–(h)
North Carolina 0.0% N.C. Const. Art. IX, § 7
North Dakota 100.0% N.D. Cent. Code §§ 54-12-14, 19-03.1-36(5)
Ohio 100.0% Ohio Rev. Code Ann. § 2981.13(B)(4)
Oklahoma 100.0% Okla. Stat. Tit. 63, §§ 2-503(F)(2), -506(L), -508
Oregon 52.5% Or. Rev. Stat. §§ 131A.360(1), (4), (6), -.365(1), (3), (5)
Pennsylvania 100.0% 42 Pa. Cons. Stat. § 5803(f)–(i)
Rhode Island 90.0% 21 R.I. Gen. Laws § 28-5.04(b)(3)
South Carolina 95.0% S.C. Code Ann. § 44-53-530(e)
South Dakota 100.0% S.D. Codified Laws §§ 34-20B-64, 23A-49-20(2)(a)
Tennessee 100.0% Tenn. Code Ann. §§ 40-33-110, -211(a)–(b)
Texas 100.0% Tex. Code Crim. Proc. Ann. art. 59.06(c), (c-3)
Utah 100.0% Utah Code Ann. §§ 24-4-115, -117
Vermont 45.0% Vt. Stat. Ann. tit. 18, § 4247(b)(1)
Virginia 100.0% Va. Code Ann. § 19.2-386.14(A1)–(B)
Washington 90.0% Wash. Rev. Code § 69.50.505(9)
West Virginia 100.0% W. Va. Code § 60A-7-706
Wisconsin 0.0% Wis. Const. Art. X, § 2; Wis. Stat. § 961.55(5)(b), (e)
Wyoming 100.0% Wyo. Stat. Ann. § 35-7-1049(r)(i)–(vi)
Source: Knepper et al. (2020).
Notes: The share of proceeds going toward law enforcement funds is subject to varying rules based on the value of property;
the type of case; and revenue-sharing arrangements with funds for prosecutors, courts, or special task forces for forensics or
drug enforcement. More information on those rules and additional statutory citations is available in Knepper et al. (2020),
appendix B.
2 6 N O T E S
Notes
1 Per the US Census Bureau, fines and fees include “civil penalties (e.g., for violating court orders); court fees if
levied upon conviction of a crime or violation; court-ordered restitutions to crime victims where government
actually collects the monies; and forfeits of deposits held for performance guarantees or against loss or damage
(such as forfeited bail and collateral)” and exclude “penalties relating to tax delinquency, library fines, and sale
of confiscated property.” More information can be found in US Census Bureau (2006, 4–40).
2 We are committed to employing inclusive language whenever possible, though we acknowledge that not every
member of these groups may identify with these terms. Language is constantly evolving, and so will we.
3 Dave Munday, “Jamestown: Speed trap, S.C.,” The Post and Courier (Charleston, SC), October 26, 2009; updated
December 8, 2016; Jessica Savage, “Oliver Police Department under Review by State Agency for Writing
Illegal Speeding Tickets,” WTOC 11 (Savannah, GA), August 13, 2020.
4 According to Chicago’s 2022 budget, “fines, forfeitures, and penalties” make up 9.5 percent of the city’s
“general operating funds.” The city’s definitions may differ from those of the US Census Bureau. More
information can be found in the city’s 2022 Budget Overview (page 41).
5 Per the US Census Bureau’s data on the top 100 cities by population in fiscal year 2019, Irvine, California,
relied the most on fines and fees (6.9 percent of budget). However, these numbers may be misreported. We
reached out to local officials in Irvine and seven other cities to clarify whether their census amounts for fiscal
year 2019 were accurate. Irvine and Garland, Texas officials provided us with amounts that were significantly
different from those reported by the US Census Bureau: for Irvine, local officials said the amount was $1.3
million, versus $31 million as reported by the census, whereas Garland officials told us $6.5 million, versus $9.6
million reported in the census. In Irvine’s case, in particular, the disparity is notable because the census data’s
fiscal year 2019 amount is much higher than prior years’ ($2.3 million in 2017 and $6.1 million in 2018). We do
not include Garland and Irvine in our tabulation of most reliant cities.
6 “Driven into Debt: How Tickets Burden the Poor,” ProPublica, accessed September 2021.
7 Mike McIntire and Michael H. Keller, “The Demand for Money Behind Many Police Traffic Stops,” The New
York Times, October 31, 2021.
8 This study analyzed the total amount of court debt owed in about 25 states. Complete data across all states
and localities in the country would likely reveal significantly higher estimates.
9 Based on the literature, available revenue data from the US Census Bureau, and communications with state
and local government officials, we are unable to ascertain what share of all fines and fees revenue comes from
speeding tickets. But we do know that these penalties are among the more prominent sources of fines and fees
revenue collected by state and local governments. For example, we learned in communications with New
Hampshire court officials, that 22 percent of all motor vehicle fines revenue came from speeding violations
between November 2020 and November 2021.
10 Me. Stat. tit. 29-A § 2602, Jurisdiction.
11 Iowa Code Ann. § 602.8106, Collection of Fees in Criminal Cases and Disposition of Fees and Fines.
12 Emily Corwin, “You Paid Your Speeding Ticket. Here’s Where Your Money Went,” Vermont Public Radio, April
30, 2018.
13 Ark. Code Ann. § 27-51-102, Penalties Generally—Disposition of Fines.
14 Ark. Code Ann. § 16-10-310, State Administration of Justice Fund—Distribution of Revenue.
15 Or. Rev. Stat. Ann. § 153.645, Disposition of Fines for Traffic Offenses.
N O T E S 2 7
16 Or. Rev. Stat. Ann. § 153.660, Use of Amounts Paid to County Treasurer.
17 Idaho Code § 19-4705, Payment of Fines and Forfeitures—Satisfaction of Judgment—Disposition—
Apportionment.
18 Alaska Stat. § 18.65.225, Alaska Police Training Fund.
19 Haw. Rev. Stat. § 291C-171, Disposition of Fines and Forfeitures. Despite this broad statutory language,
Hawaii’s rules make exceptions elsewhere: for example, those found in violation of rules for mandatory seat
belts and child passenger restraints are levied surcharges, with proceeds allocated to the state’s neurotrauma
and trauma system special funds (Haw. Rev. Stat. § 321H-4, Neurotrauma Special Fund; State of Hawaii
Department of Health 2015).
20 Miss. Code Ann. § 63-9-13; Wyo. Stat. Ann § 6-10-108, Disposition of Fines.
21 N.J. Stat. Ann. § 39:4-97.2, Driving, Operating a Motor Vehicle in an Unsafe Manner, Offense Created; Fines;
Surcharges; Ohio Rev. Code Ann. § 4501.06, Public Safety—Highway Purposes Fund.
22 FindLaw staff and Steve Foley, “Speeding: State Laws,” FindLaw, April 7, 2021.
23 Ky. Rev. Stat. Ann. § 24A.175, Court Costs for Criminal Cases in District Court—Payment Required—
Exceptions—Treatment of Minor Defendant; see also § 24A.176, § 24A.1765, § 24A.179, and § 24A.185.
24 Ky. Rev. Stat. Ann. § 42.320, Court Cost Distribution Fund—Disbursements—Payments into General Fund.
25 Utah Code Ann. § 78A-7-122, Security Surcharge—Application—Deposit in Restricted Accounts.
26 Utah Code Ann. § 51-9-401, Surcharge—Application.
27 Mass. Gen. Laws ch. 90, § 20, Penalties and Punishments.
28 W. Va. Code § §50-3-2a, Payment by Electronic Payments, Credit Card Payments, Cash, Money Orders, or
Certified Checks; Payment Plan; Failure to Pay Fines Results in a Late Fee and Judgment Lien.
29 Los Angeles City Controller, “City Revenue by Month,” Control Panel L.A., 2021. Per instructions from Los
Angeles city officials, we filtered by “Revenue Source Category: 48” and “Fiscal Year: 2019” to obtain the
relevant information.
30 Joseph Shapiro, “As Court Fees Rise, the Poor Are Paying the Price,” National Public Radio, May 19, 2014.
31 Sarah Calame and Aravind Boddupalli, “Fines and Forfeitures and Racial Disparities,” TaxVox (blog), Urban-
Brookings Tax Policy Center, October 2020; John D. Harden, “D.C. Parking, Traffic Tickets Snowball into
Financial Hardships,” The Washington Post, August 2021.
32 Richard Webster, ““If Everybody’s White, There Can’t Be Any Racial Bias”: The Disappearance of Hispanic
Drivers From Traffic Records.” ProPublica, November 22, 2021.
33 Richard Webster, ““If Everybody’s White, There Can’t Be Any Racial Bias”: The Disappearance of Hispanic
Drivers From Traffic Records.” ProPublica, November 22, 2021.
34 McIntire and Keller, “The Demand for Money.”
35 McIntire and Keller, “The Demand for Money.”
36 “COVID-19 Fines & Fees Policy Tracker,” Fines and Fees Justice Center, accessed March 2021.
37 “Press Release: San Francisco to Become First County in the Nation to Eliminate All Locally Controlled Fees
Assessed from People Exiting the Criminal Justice System,” City of San Francisco Office of the Treasurer & Tax
Collector,” May 22, 2018.
2 8 N O T E S
38 “Improving California’s Criminal Fine and Fee System,” Legislative Analyst’s Office, January 5, 2016; “Overview
of Criminal Fine and Fee System,” Legislative Analyst’s Office, May 13, 2021.
39 “Improving California’s Criminal Fine and Fee System.”
40 “Press Release & Video: Lawmakers & Advocates Rally for Bill to End Predatory Court Fines & Fees,” Fines and
Fees Justice Center, 2021.
41 Mo. Ann. Stat. § 479.359, Political Subdivisions to Annually Calculate Percentage of Revenue from Municipal
Ordinance Violations and Minor Traffic Violations—Limitation on Percentage—Addendum to Report, Contents.
42 “50-State Criminal Justice Debt Reform Builder: Revenue Flow,” National Criminal Justice Debt Initiative,
Criminal Justice Policy Program, Harvard Law School, accessed October 29, 2021.
43 Ohio Rev. Code Ann. § 4501.06, Public Safety—Highway Purposes Fund.
R E F E R E N C E S 2 9
References American Bar Association. 2018. Ten Guidelines on Court Fines and Fees. Chicago: ABA.
Bannon, Alicia, Mitali Nagrecha, and Rebekah Diller. October 2010. Criminal Justice Debt: A Barrier to Reentry. New
York, NY: Brennan Center for Justice.
Blair, Hunter, David Cooper, Julia Wolfe, and Jaimie Worker. 2020. Preempting Progress. Washington, DC:
Economic Policy Institute.
Florida Clerks of Court Operations Corporation. 2018. “Clerks’ Broken Budget Model.” Tallahassee, FL: Clerks of
Court Operations Corporation.
Goldstein, Rebecca, Michael W. Sances, and Hye Young You. 2018. “Exploitative Revenues, Law Enforcement,
and the Quality of Government Service.” Urban Affairs Review 56 (1): 5–31. doi:1078087418791775.
Hammons, Brianna. 2021. Tip of the Iceberg: How Much Criminal Justice Debt Does the US Really Have? New York,
NY: Fines and Fees Justice Center.
Harris, Alexes, Heather Evans, and Katherine Beckett. May 2010. “Drawing Blood from Stones: Legal Debt and
Social Inequality in the Contemporary United States.” American Journal of Sociology 115 (6): 1753–99.
Hawaii State Department of Health. 2015. Report to the Twenty-Eighth Legislature: Pursuant to Section 321-22.5 (g).
Honolulu, HI: Hawaii State Department of Health.
Holcomb, Jefferson E., Tomislav V. Kovandzic, and Marian R. Williams. 2011. “Civil Asset Forfeiture, Equitable
Sharing, and Policing for Profit in the United States.” Journal of Criminal Justice 39 (3): 273–85.
Knepper, Lisa, Jennifer McDonald, Kathy Sanchez, and Elyse Smith Pohl. 2020. Policing for Profit: The Abuse of Civil
Asset Forfeitures. 3rd edition. Arlington, VA: Institute for Justice.
Leachman, Michael, Michael Mitchell, Nicholas Johnson, and Erica Williams. 2018. Advancing Racial Equity with
State Tax Policy. Washington, DC: Center on Budget and Policy Priorities.
Maciag, Mike. August 2019. “Addicted to Fines.” Governing. Washington, DC.
Mai, Chris. June 2021. The High Price of Using Justice Fines and Fees to Fund Government in Virginia. New York: Vera
Institute for Justice.
Makowsky, Michael. March 2019. A Proposal to End Regressive Taxation Through Law Enforcement. Washington,
DC: Brookings Institution.
Makowsky, Michael D., and Thomas Stratmann. 2009. “Political Economy at Any Speed: What Determines Traffic
Citations.” American Economic Review 99 (1): 509–27.
Makowsky, Michael, Thomas Stratmann, and Alex Tabarrok. 2019. “To Serve and Collect: The Fiscal and Racial
Determinants of Law Enforcement.” The Journal of Legal Studies 48 (1): 189–216.
Martinez, Andrew, Yolaine Menyard, Violet Sullivan, and Conor Mulvaney. June 2021. It Takes More Than a Tool to
Ensure Fairness: A Snapshot of Ability-to-Pay Tools for Fines and Fees. New York, NY: Center for Court
Innovation.
Menendez, Matthew, Lauren-Brooke Eisen, Noah Atchison, and Michael Crowley. 2019. The Steep Costs of
Criminal Justice Fees and Fines. New York: Brennan Center for Justice.
Murphy, Kristina, and Julie Barkworth. April 2014. “Victim Willingness to Report Crime to Police: Does Procedural
Justice or Outcome Matter Most?” Victims & Offenders 9 (2): 178–204.
Murphy, Kristina, Lyn Hinds, and Jenny Fleming. May 2008. Encouraging Public Cooperation and Support for
Police. Policing & Society 18 (2): 136–55.
3 0 R E F E R E N C E S
O’Neill, Kate K., Ian Kennedy, and Alexes Harris. 2021. “Debtors’ Blocks: How Monetary Sanctions Make
Between-Neighborhood Racial and Economic Inequalities Worse.” Sociology of Race and Ethnicity, published
online ahead of print, November 20. doi:10.1177/23326492211057817.
Pagano, Michael, and Christopher W. Hoene. 2018. City Budgets in an Era of Increased Uncertainty. Washington,
DC: Brookings Institution.
Sances, Michael W., and Hye Young You. July 2017. “Who Pays for Government? Descriptive Representation and
Exploitative Revenue Sources.” The Journal of Politics 79 (3): 1090–94.
Savitsky, Douglas. May 2012. “Is Plea Bargaining a Rational Choice? Plea Bargaining as an Engine of Racial
Stratification and Overcrowding in the United States Prison System.” Rationality and Society 24 (2): 131–67.
South Dakota Unified Judicial System. July 2020. “For a $117.50 Speeding Ticket on Interstate Highway Including
Fines & Costs This Is Where Your $$$ Goes….” Pierre, SD: Unified Judicial System.
The Sentencing Project. 2018. Report to the United Nations on Racial Disparities in the US Criminal Justice System.
Washington, DC: The Sentencing Project.
US Census Bureau. 2006. Government Finance and Employment Classification Manual. Washington, DC: US Census
Bureau.
———. 2020. Census of Governments, 2017. Washington, DC: US Census Bureau.
———. 2021. Annual Survey of State and Local Government Finances. Washington, DC: US Census Bureau.
US Department of Justice. March 2015. Investigation of the Ferguson Police Department. Washington, DC: US
Department of Justice.
Williamson, Vanessa. November 2020. The Long Shadow of White Supremacist Fiscal Policy. Washington, DC:
Urban-Brookings Tax Policy Center.
Yang, Crystal S. 2017. “Local Labor Markets and Criminal Recidivism.” Journal of Public Economics 147:16–29.
A B O U T T H E A U T H O R S 3 1
About the Authors Aravind Boddupalli is a research associate in the Urban-Brookings Tax Policy Center. He graduated
summa cum laude from the University of Minnesota, Twin Cities, with a BA in economics and political
science.
Livia Mucciolo is a research assistant in the Urban-Brookings Tax Policy Center. She graduated magna
cum laude from Brown University and holds a BA in economics and public health.
STATEMENT OF INDEPENDENCE
The Urban Institute strives to meet the highest standards of integrity and quality in its research and analyses and
in the evidence-based policy recommendations offered by its researchers and experts. We believe that operating
consistent with the values of independence, rigor, and transparency is essential to maintaining those standards.
As an organization, the Urban Institute does not take positions on issues, but it does empower and support its
experts in sharing their own evidence-based views and policy recommendations that have been shaped by
scholarship. Funders do not determine our research findings or the insights and recommendations of our experts.
Urban scholars and experts are expected to be objective and follow the evidence wherever it may lead.
500 L’Enfant Plaza SW
Washington, DC 20024
www.urban.org
Related Documents