Sensors and Actuators B 181 (2013) 361–367 Contents lists available at SciVerse ScienceDirect Sensors and Actuators B: Chemical journa l h o mepage: www.elsevier.com/locate/snb Focused-ion-beam-fabricated Au/Ag multilayered nanorod array as SERS-active substrate for virus strain detection Kundan Sivashanmugan a , Jiunn-Der Liao a,b,∗ , Jin-Wei You a , Chao-Liang Wu c,d a Department of Materials Science and Engineering, National Cheng Kung University, 1 University Road, Tainan 70101, Taiwan b Center for Micro/Nano Science and Technology, National Cheng Kung University, 1 University Road, Tainan 70101, Taiwan c Department of Biochemistry and Molecular Biology, National Cheng Kung University, 1 University Road, Tainan 70101, Taiwan d Institute of Basic Medical Sciences, National Cheng Kung University, 1 University Road, Tainan 70101, Taiwan a r t i c l e i n f o Article history: Received 8 November 2012 Received in revised form 16 January 2013 Accepted 18 January 2013 Available online xxx Keywords: Surface-enhanced Raman scattering Focused ion beam Multi-layered nanorod arrays Enhancement factor Influenza virus strains a b s t r a c t A surface-enhanced Raman scattering (SERS) substrate was fabricated as well ordered Au/Ag multilay- ered nanorod arrays (fibAu/Ag R n , n = 0–4) via the focused ion beam technique for the detection of the influenza A virus strain. Since the shape, thickness, space between nanorods, and dimensions affect the performance of SERS, these factors were optimized before the fabrication of the substrate by varying the thickness of the Au layer (4 variables), Ag layer (3 variables), and their corresponding Ag/Au repeated layers. Au/Ag multilayers with the optimal thickness were used to fabricate the designed SERS substrate. The results indicate that Ag layer plays an important role in the improvement of SERS mechanism by inducing the electromagnetic effect at the Au surface. The as-prepared fibAu/Ag R n substrate serves as an excellent SERS substrate, even verified at a very low concentration using rhodamine 6G as a reference, e.g., it exhibited an enhancement factor ranging from 2.62 × 10 6 to 1.74 × 10 7 using the proposed SERS substrate. Furthermore, the influenza A virus strains (A/WSN/33 (H1N1), A/England/12/64 (H2N2), and A/Philippine/2/82 (H3N2)) could be well distinguished at a low concentration of 10 6 PFU/ml. © 2013 Elsevier B.V. All rights reserved. 1. Introduction Respiratory tract infections, acute diseases caused by the influenza virus, are a major public health concern. However, the accurate detection of influenza virus strains takes time and requires a considerable concentration of the virus [1,2]. Methods for the laboratory diagnosis of influenza include the immunofluoresence test, enzyme-linked immunosorbent assay (ELISA) [3], hemadsorp- tion [4], and reverse transcriptase polymer chain reaction (PCR) [5]. They provide excellent sensitivity, enabling the detection of spe- cific influenza diagnostics. However, particular labeling techniques are required, placing constraints on some potential applications. Compared to established analytical techniques such as ELISA and immunofluorescence, surface-enhanced Raman scattering (SERS) is an extremely sensitive and selective technique for detecting sur- face species. Most of the signal enhancement in SERS compared to conventional Raman is attributed to the large increase in the generated local electric field [6,7]. A strong Raman signal is gen- erated when analyte molecules interact with a metal surface, i.e., ∗ Corresponding author at: Department of Materials Science and Engineering, National Cheng Kung University, 1 University Road, Tainan 70101, Taiwan. Tel.: +886 6 2757575x62971; fax: +886 6 2346290. E-mail address: [email protected] (J.-D. Liao). a SERS-active substrate [8,9]. The principle of SERS can be gener- ally explained by a combination of an electromagnetic mechanism that describes the surface electron movement in the substrate and a chemical mechanism that is related to the charge transfer between the substrate and the analyte molecules [10–14]. SERS-active sub- strates based on localized surface plasmon resonance (LSPR) have been restricted to the noble metals (e.g., Ag, Au, Cu) and transi- tion metals (e.g., Pt, Pd, Ru, Rh, Fe, Co, Ni) [15–19]. Some metals in the form of nanoparticles (NPs) or nanostructures (NSs) may induce strong light scattering and an enhancement of the local elec- tromagnetic field in the vicinity of NPs or NSs. Particularly large enhancements of the electromagnetic field, called hot spots, can be found between adjacent NPs or at the edge of an NS [20]. NPs and NSs are novel tools for detecting Raman-active species at the nanometer scale. SERS-active substrates can be obtained either by the solvent-cast deposition of colloidal NPs [19] or by lithography techniques such as electron beam lithography [21,22] and nano-indentation [23]. The fabrication methods create high- precision regular patterns. SERS-active substrates have been used to detect nucleoproteins, oligonucleotides, and viruses [23–26]. Most of the fabrication methods focus on achieving large enhance- ment factors, but have low reproducibility and high cost, and generally lack the requisite characteristics needed to make SERS a platform-enabling technology. In recent years, the present authors have made reproducible SERS-active substrates with Au nanorod 0925-4005/$ – see front matter © 2013 Elsevier B.V. All rights reserved. http://dx.doi.org/10.1016/j.snb.2013.01.035

Welcome message from author
This document is posted to help you gain knowledge. Please leave a comment to let me know what you think about it! Share it to your friends and learn new things together.
Transcript
Fs
Ka
b
c
d
a
ARRAA
KSFMEI
1
iaalttTcaCiiftge
NT
0h
Sensors and Actuators B 181 (2013) 361– 367
Contents lists available at SciVerse ScienceDirect
Sensors and Actuators B: Chemical
journa l h o mepage: www.elsev ier .com/ locate /snb
ocused-ion-beam-fabricated Au/Ag multilayered nanorod array as SERS-activeubstrate for virus strain detection
undan Sivashanmugana, Jiunn-Der Liaoa,b,∗, Jin-Wei Youa, Chao-Liang Wuc,d
Department of Materials Science and Engineering, National Cheng Kung University, 1 University Road, Tainan 70101, TaiwanCenter for Micro/Nano Science and Technology, National Cheng Kung University, 1 University Road, Tainan 70101, TaiwanDepartment of Biochemistry and Molecular Biology, National Cheng Kung University, 1 University Road, Tainan 70101, TaiwanInstitute of Basic Medical Sciences, National Cheng Kung University, 1 University Road, Tainan 70101, Taiwan
r t i c l e i n f o
rticle history:eceived 8 November 2012eceived in revised form 16 January 2013ccepted 18 January 2013vailable online xxx
eywords:
a b s t r a c t
A surface-enhanced Raman scattering (SERS) substrate was fabricated as well ordered Au/Ag multilay-ered nanorod arrays (fibAu/Ag Rn, n = 0–4) via the focused ion beam technique for the detection of theinfluenza A virus strain. Since the shape, thickness, space between nanorods, and dimensions affect theperformance of SERS, these factors were optimized before the fabrication of the substrate by varying thethickness of the Au layer (4 variables), Ag layer (3 variables), and their corresponding Ag/Au repeatedlayers. Au/Ag multilayers with the optimal thickness were used to fabricate the designed SERS substrate.
urface-enhanced Raman scatteringocused ion beamulti-layered nanorod arrays
nhancement factornfluenza virus strains
The results indicate that Ag layer plays an important role in the improvement of SERS mechanism byinducing the electromagnetic effect at the Au surface. The as-prepared fibAu/Ag Rn substrate serves as anexcellent SERS substrate, even verified at a very low concentration using rhodamine 6G as a reference,e.g., it exhibited an enhancement factor ranging from 2.62 × 10⁶ to 1.74 × 10⁷ using the proposed SERSsubstrate. Furthermore, the influenza A virus strains (A/WSN/33 (H1N1), A/England/12/64 (H2N2), andA/Philippine/2/82 (H3N2)) could be well distinguished at a low concentration of 106 PFU/ml.
. Introduction
Respiratory tract infections, acute diseases caused by thenfluenza virus, are a major public health concern. However, theccurate detection of influenza virus strains takes time and requires
considerable concentration of the virus [1,2]. Methods for theaboratory diagnosis of influenza include the immunofluoresenceest, enzyme-linked immunosorbent assay (ELISA) [3], hemadsorp-ion [4], and reverse transcriptase polymer chain reaction (PCR) [5].hey provide excellent sensitivity, enabling the detection of spe-ific influenza diagnostics. However, particular labeling techniquesre required, placing constraints on some potential applications.ompared to established analytical techniques such as ELISA and
mmunofluorescence, surface-enhanced Raman scattering (SERS)s an extremely sensitive and selective technique for detecting sur-ace species. Most of the signal enhancement in SERS compared
o conventional Raman is attributed to the large increase in theenerated local electric field [6,7]. A strong Raman signal is gen-rated when analyte molecules interact with a metal surface, i.e.,∗ Corresponding author at: Department of Materials Science and Engineering,ational Cheng Kung University, 1 University Road, Tainan 70101, Taiwan.el.: +886 6 2757575x62971; fax: +886 6 2346290.
E-mail address: [email protected] (J.-D. Liao).
925-4005/$ – see front matter © 2013 Elsevier B.V. All rights reserved.ttp://dx.doi.org/10.1016/j.snb.2013.01.035
© 2013 Elsevier B.V. All rights reserved.
a SERS-active substrate [8,9]. The principle of SERS can be gener-ally explained by a combination of an electromagnetic mechanismthat describes the surface electron movement in the substrate and achemical mechanism that is related to the charge transfer betweenthe substrate and the analyte molecules [10–14]. SERS-active sub-strates based on localized surface plasmon resonance (LSPR) havebeen restricted to the noble metals (e.g., Ag, Au, Cu) and transi-tion metals (e.g., Pt, Pd, Ru, Rh, Fe, Co, Ni) [15–19]. Some metalsin the form of nanoparticles (NPs) or nanostructures (NSs) mayinduce strong light scattering and an enhancement of the local elec-tromagnetic field in the vicinity of NPs or NSs. Particularly largeenhancements of the electromagnetic field, called hot spots, can befound between adjacent NPs or at the edge of an NS [20].
NPs and NSs are novel tools for detecting Raman-active speciesat the nanometer scale. SERS-active substrates can be obtainedeither by the solvent-cast deposition of colloidal NPs [19] or bylithography techniques such as electron beam lithography [21,22]and nano-indentation [23]. The fabrication methods create high-precision regular patterns. SERS-active substrates have been usedto detect nucleoproteins, oligonucleotides, and viruses [23–26].Most of the fabrication methods focus on achieving large enhance-
ment factors, but have low reproducibility and high cost, andgenerally lack the requisite characteristics needed to make SERS aplatform-enabling technology. In recent years, the present authorshave made reproducible SERS-active substrates with Au nanorod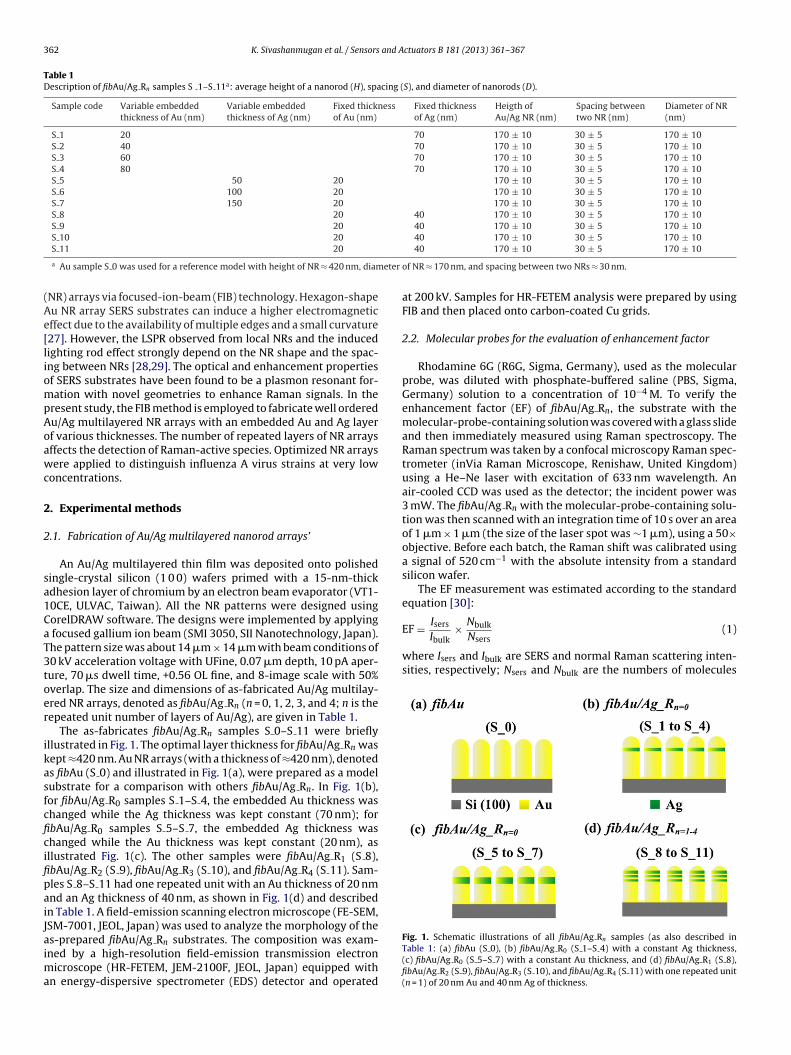
362 K. Sivashanmugan et al. / Sensors and Actuators B 181 (2013) 361– 367
Table 1Description of fibAu/Ag Rn samples S 1–S 11a: average height of a nanorod (H), spacing (S), and diameter of nanorods (D).
Sample code Variable embeddedthickness of Au (nm)
Variable embeddedthickness of Ag (nm)
Fixed thicknessof Au (nm)
Fixed thicknessof Ag (nm)
Heigth ofAu/Ag NR (nm)
Spacing betweentwo NR (nm)
Diameter of NR(nm)
S 1 20 70 170 ± 10 30 ± 5 170 ± 10S 2 40 70 170 ± 10 30 ± 5 170 ± 10S 3 60 70 170 ± 10 30 ± 5 170 ± 10S 4 80 70 170 ± 10 30 ± 5 170 ± 10S 5 50 20 170 ± 10 30 ± 5 170 ± 10S 6 100 20 170 ± 10 30 ± 5 170 ± 10S 7 150 20 170 ± 10 30 ± 5 170 ± 10S 8 20 40 170 ± 10 30 ± 5 170 ± 10S 9 20 40 170 ± 10 30 ± 5 170 ± 10S 10 20 40 170 ± 10 30 ± 5 170 ± 10
eter
(Ae[liompAoawc
2
2
sa1CaT3toer
ikasfcficifipaiJaima
EF = sers
Ibulk× bulk
Nsers(1)
where Isers and Ibulk are SERS and normal Raman scattering inten-sities, respectively; Nsers and Nbulk are the numbers of molecules
S 11 20
a Au sample S 0 was used for a reference model with height of NR ≈ 420 nm, diam
NR) arrays via focused-ion-beam (FIB) technology. Hexagon-shapeu NR array SERS substrates can induce a higher electromagneticffect due to the availability of multiple edges and a small curvature27]. However, the LSPR observed from local NRs and the inducedighting rod effect strongly depend on the NR shape and the spac-ng between NRs [28,29]. The optical and enhancement propertiesf SERS substrates have been found to be a plasmon resonant for-ation with novel geometries to enhance Raman signals. In the
resent study, the FIB method is employed to fabricate well orderedu/Ag multilayered NR arrays with an embedded Au and Ag layerf various thicknesses. The number of repeated layers of NR arraysffects the detection of Raman-active species. Optimized NR arraysere applied to distinguish influenza A virus strains at very low
oncentrations.
. Experimental methods
.1. Fabrication of Au/Ag multilayered nanorod arrays’
An Au/Ag multilayered thin film was deposited onto polishedingle-crystal silicon (1 0 0) wafers primed with a 15-nm-thickdhesion layer of chromium by an electron beam evaporator (VT1-0CE, ULVAC, Taiwan). All the NR patterns were designed usingorelDRAW software. The designs were implemented by applying
focused gallium ion beam (SMI 3050, SII Nanotechnology, Japan).he pattern size was about 14 �m × 14 �m with beam conditions of0 kV acceleration voltage with UFine, 0.07 �m depth, 10 pA aper-ure, 70 �s dwell time, +0.56 OL fine, and 8-image scale with 50%verlap. The size and dimensions of as-fabricated Au/Ag multilay-red NR arrays, denoted as fibAu/Ag Rn (n = 0, 1, 2, 3, and 4; n is theepeated unit number of layers of Au/Ag), are given in Table 1.
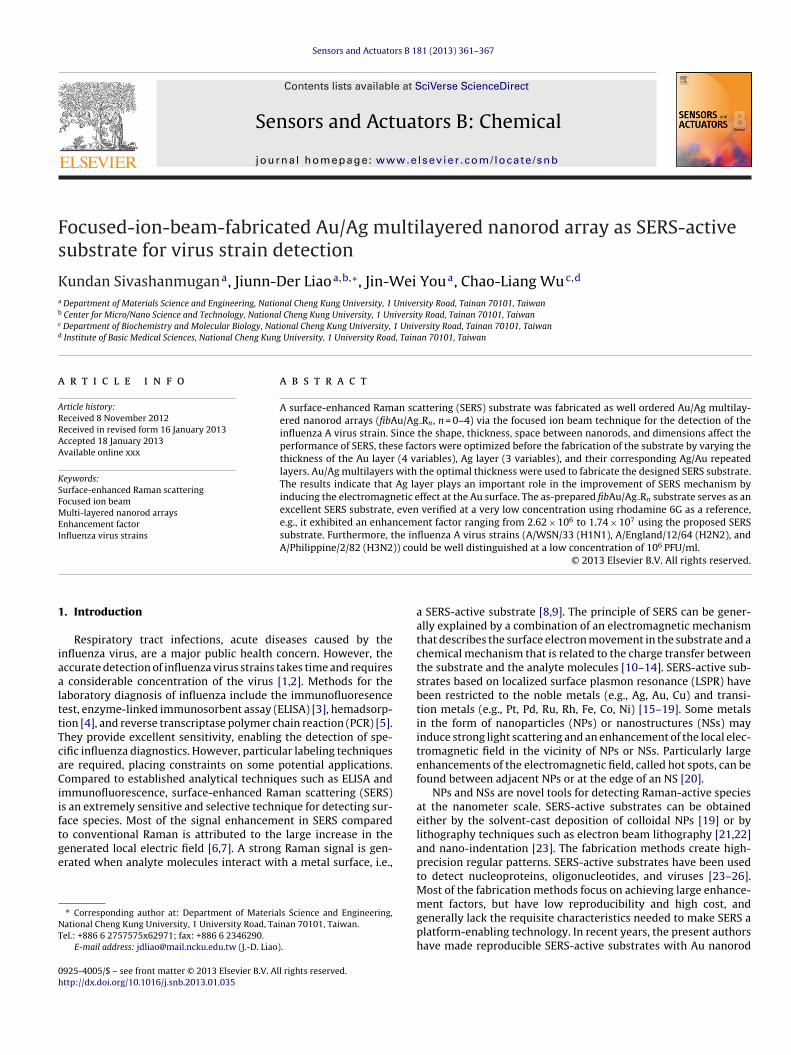
The as-fabricates fibAu/Ag Rn samples S 0–S 11 were brieflyllustrated in Fig. 1. The optimal layer thickness for fibAu/Ag Rn wasept ≈420 nm. Au NR arrays (with a thickness of ≈420 nm), denoteds fibAu (S 0) and illustrated in Fig. 1(a), were prepared as a modelubstrate for a comparison with others fibAu/Ag Rn. In Fig. 1(b),or fibAu/Ag R0 samples S 1–S 4, the embedded Au thickness washanged while the Ag thickness was kept constant (70 nm); forbAu/Ag R0 samples S 5–S 7, the embedded Ag thickness washanged while the Au thickness was kept constant (20 nm), asllustrated Fig. 1(c). The other samples were fibAu/Ag R1 (S 8),bAu/Ag R2 (S 9), fibAu/Ag R3 (S 10), and fibAu/Ag R4 (S 11). Sam-les S 8–S 11 had one repeated unit with an Au thickness of 20 nmnd an Ag thickness of 40 nm, as shown in Fig. 1(d) and describedn Table 1. A field-emission scanning electron microscope (FE-SEM,SM-7001, JEOL, Japan) was used to analyze the morphology of the
s-prepared fibAu/Ag Rn substrates. The composition was exam-ned by a high-resolution field-emission transmission electronicroscope (HR-FETEM, JEM-2100F, JEOL, Japan) equipped withn energy-dispersive spectrometer (EDS) detector and operated
40 170 ± 10 30 ± 5 170 ± 10
of NR ≈ 170 nm, and spacing between two NRs ≈ 30 nm.
at 200 kV. Samples for HR-FETEM analysis were prepared by usingFIB and then placed onto carbon-coated Cu grids.
2.2. Molecular probes for the evaluation of enhancement factor
Rhodamine 6G (R6G, Sigma, Germany), used as the molecularprobe, was diluted with phosphate-buffered saline (PBS, Sigma,Germany) solution to a concentration of 10−4 M. To verify theenhancement factor (EF) of fibAu/Ag Rn, the substrate with themolecular-probe-containing solution was covered with a glass slideand then immediately measured using Raman spectroscopy. TheRaman spectrum was taken by a confocal microscopy Raman spec-trometer (inVia Raman Microscope, Renishaw, United Kingdom)using a He–Ne laser with excitation of 633 nm wavelength. Anair-cooled CCD was used as the detector; the incident power was3 mW. The fibAu/Ag Rn with the molecular-probe-containing solu-tion was then scanned with an integration time of 10 s over an areaof 1 �m × 1 �m (the size of the laser spot was ∼1 �m), using a 50×objective. Before each batch, the Raman shift was calibrated usinga signal of 520 cm−1 with the absolute intensity from a standardsilicon wafer.
The EF measurement was estimated according to the standardequation [30]:
I N
Fig. 1. Schematic illustrations of all fibAu/Ag Rn samples (as also described inTable 1: (a) fibAu (S 0), (b) fibAu/Ag R0 (S 1–S 4) with a constant Ag thickness,(c) fibAu/Ag R0 (S 5–S 7) with a constant Au thickness, and (d) fibAu/Ag R1 (S 8),fibAu/Ag R2 (S 9), fibAu/Ag R3 (S 10), and fibAu/Ag R4 (S 11) with one repeated unit(n = 1) of 20 nm Au and 40 nm Ag of thickness.
K. Sivashanmugan et al. / Sensors and Actuators B 181 (2013) 361– 367 363
F , (b) lal ic factm S 9 a
caiaRofi
2
AATvtpTfev
3
S
ig. 2. FE-SEM images of the as-fabricated fibAu/Ag R2 (sample S 9): (a) top viewateral view showing height and layer sequence of NRs; (d) the illustrated geometr
ulti-layered sample S 9; and (f)–(i) backscattering electron images of the samples
ontributing to the inelastic scattering intensity respectively evalu-ted by SERS and normal Raman scattering measurements. Ramanntensity was averaged from ten consecutive measurements. Thes-prepared fibAu/Ag Rn substrate with PBS solution was initiallyaman-inactive and used as the reference for the calculationf EF when Raman-active R6G molecules were adsorbed withinbAu/Ag Rn.
.3. Influenza A virus and virus strain detections
The optimized samples were employed to detect the influenza virus strain, namely influenza A/WSN/33 (H1N1), influenza/Philippine/2/82 (H3N2), and influenza A/England/12/64 (H2N2).hese target viruses were obtained from National Cheng Kung Uni-ersity Hospital, Tainan, Taiwan [31]. Standard protocols were usedo propagate all the viruses. Viral titers were determined by thelaque assay. All of the viruses were stored at −20 ◦C before use.he titers of the original stocks of influenza A virus had 106 plaqueorming units (PFU)/ml. The original stocks were diluted to differ-nt titers in PBS for further use. 5 �l from different dilutions of eachirus was placed on fibAu/Ag Rn substrates.
. Results and discussion
The morphology of fibAu/Ag Rn was respectively analyzed by FE-EM and HR-FETEM. The fabrication of hexagonal shape NRs with a
teral view, and (c) top and lateral views of diameter, space, and shape sizes andor of NR; (e) HR-FETEM image with (f) EDS line scan analysis along the line in thend S 11, respectively.
specified spacing between two consecutive NRs was maintained byadjusting the working current and etching time during FIB fabrica-tion. The cross sectional view of FE-SEM and HR-FETEM images forthe fibAu/Ag R0 or n was also prepared by FIB. Fig. 2(a) and (b) showFE-SEM images of the top and side views of e.g., fibAu/Ag Rn sam-ple S 9; those of samples S 3 and S 4 were given in SupplementaryData 1. Both NR length and diameter of the fibAu/Ag R0 or n were170 ± 10 nm with a patterned area of 14 �m × 14 �m. The spac-ing between two NRs was ≈30 ± 5 nm, as listed in Table 1. Thenon-repeating part (i.e., the supporting layer underneath NR) offibAu/Ag Rn was expected to act as the reference layer for all thefibAu/Ag Rn, as shown in Fig. 2(c) and illustrated in Fig. 2(d). How-ever, the repeated layer could be effectively optimized based onthe size and dimension of target species. As the repeated layerwas increased, the reference layer was decreased without changingthe entire thickness (i.e., the thickness of 420 nm for fibAu/Ag Rn
was maintained.). Fig. 2(e) and (f) show HR-FETEM images offibAu/Ag Rn sample S 9. EDS line mapping over 300 × 300 nm areawas demonstrated in Fig. 2(f), where a content of 3.04 wt% C,16.75 wt% Cu K, 44.49 wt% Ag L, and 35.72 wt% Au L was measuredand shown by the scanned lines. Note that the contents of C andCu were obtained from carbon-coated Cu grids. This result sug-
gests that NR contained approximately equal ratio of Au:Ag in themultilayer of NRs. In addition, HR-FETEM backscattering electronimages of samples S 9 and S 11 were shown in Fig. 2(g)–(i). Thebackscattering resolution of the sample S 9 was distinct by 3.0 and
364 K. Sivashanmugan et al. / Sensors and Actuators B 181 (2013) 361– 367
F u/Ag
( tensitii
9woimeu
3S
fip(bNtpSsH1pftwFd
ib
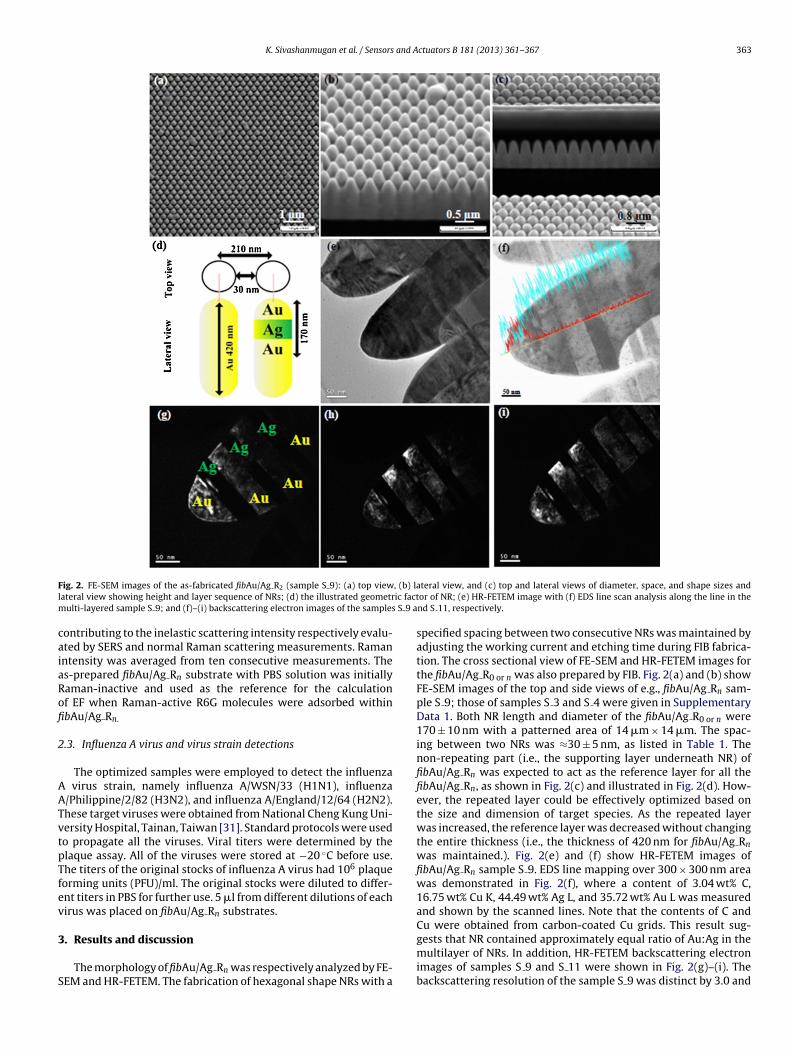
ig. 3. (a) Raman-active peaks of 10−4 M R6G molecules on the pristine Au and fibA10−4 M) at 1362 cm−1 was used as the index for the relation of relative Raman inntensities versus (c) S 0 and S 1–S 4 and (d) S 0 and S 5–S 7 were compared.
.0 nm at 3 kV, as shown in Fig. 2(g) and (h), respectively. Fig. 2(i)as the sample S 11, which was obviously exposed repeating layer
f Au and Ag. The distinction was made by the regions correspond-ng to each separated contrast; Au (white) and Ag (black) was then
arked in Fig. 2(g). From HR-FETEM images using backscatteringlectron and EDS modes, NR was presumably composed of individ-al layer without alloying.
.1. Evaluation and optimization of the fibAu/Ag Rn samples asERS-active substrates
The fabrication technique allows for the formation ofbAu/Ag Rn substrates with identical geometric but distinct opticalroperties, which can range from the visible to the near-infraredNIR) spectral regions [32]. The fibAu/Ag Rn substrates can exciteoth longitudinal and transverse plasmon resonances [33]. MetallicSs can sustain plasmon modes which couple with strongly elec-
romagnetic radiation at their surface [34]. R6G was chosen as arobe molecule. R6G solution (10−4 M) was used to determine theERS effect for samples S 0–S 7 via Raman spectroscopy. The sen-itivity and enhancement effect of R6G were determined using ae–Ne laser with a wavelength of 633 nm. In Fig. 3(a), the peak at362 cm−1 corresponds to R6G (�(C C), aromatics), indicating theresence of R6G on the substrate. A high LSPR effect was observedrom the embedded Ag layer of NRs with respect to the thickness ofhe Ag layer. The enhancement of the peak intensity at 1362 cm−1
as compared to those of reference samples S 0–S 7, as shown inig. 3(b). The LSPR of Au/Ag enhances SERS properties, while Raman
ipoles excite LSPR at the interface of pure metals.The SERS EF was determined from Eq. (1). The highest peakntensity (Ipeak) for samples S 0–S 7 was recorded as the specificand and treated as the Isers value in Eq. (1). The ideal average Nsers
R0 samples S 0–S 7 were examined by Raman laser wavelength of 633 nm, (b) R6Ges with respect to samples S 0–S 7. The enhancement factors and relative Raman
value (≈5.15 × 10⁴ molecules) was obtained from the volume of thewell ordered monolayer of R6G ideally adsorbed on fibAu/Ag Rn,because the detectable dimension ≈1 �m3 is multiplied and thevalue Nsers is correlated with the concentration of 10−4 M R6G solu-tion. The spot size of the laser and the average value of Nbluk wereobtained as ≈1 �m2 and ≈3.3 × 10⁹ molecules, respectively. TheIbulk values were measured as ≈275 (arbitrary units). The abovevalues were substituted into Eq. (1) to calculate the SERS EFs forS 0–S 7. The values were shown in Fig. 3(c) and (d). Generally, thesize and thickness of the multilayer affects the LSPR and Ramanintensity. The LSPR and Raman intensity can be improved by adjus-ting the thickness of the Au and Ag layers on the nanoscale. In Fig. 3,varying the thickness of Au (samples S 1–S 4) with a fixed Ag thick-ness resulted in a large enhancement in the Raman intensity and EF.Similarly, varying the thickness of Ag (samples S 5–S 7) with a fixedAu thickness resulted in an enhancement in EF and Raman inten-sity. The results suggest that the analyte is in a more polarized formon fibAu versus fibAu/Ag Rn substrates. Another important differ-ence between the SERS signal on the metal arrays is the differencein the overall SERS intensity. fibAu/Ag Rn substrates always exhibithigher SERS signals and more defined peak shapes compared tothose of the corresponding fibAu substrates. When the thicknessesof the Ag layer and Au layer were increased, the interface LSPR res-onance between two consecutive NRs increased, which improvedthe EF.
3.2. Evaluation of the repeating layer (fibAu/Ag Rn) samples asSERS-active substrates
All these factors were kept constant in the experiment forthe surface area of the NR arrays. Assuming that the shape ofeach NR tip is cylindrical, the surface area is proportional to the
K. Sivashanmugan et al. / Sensors and A
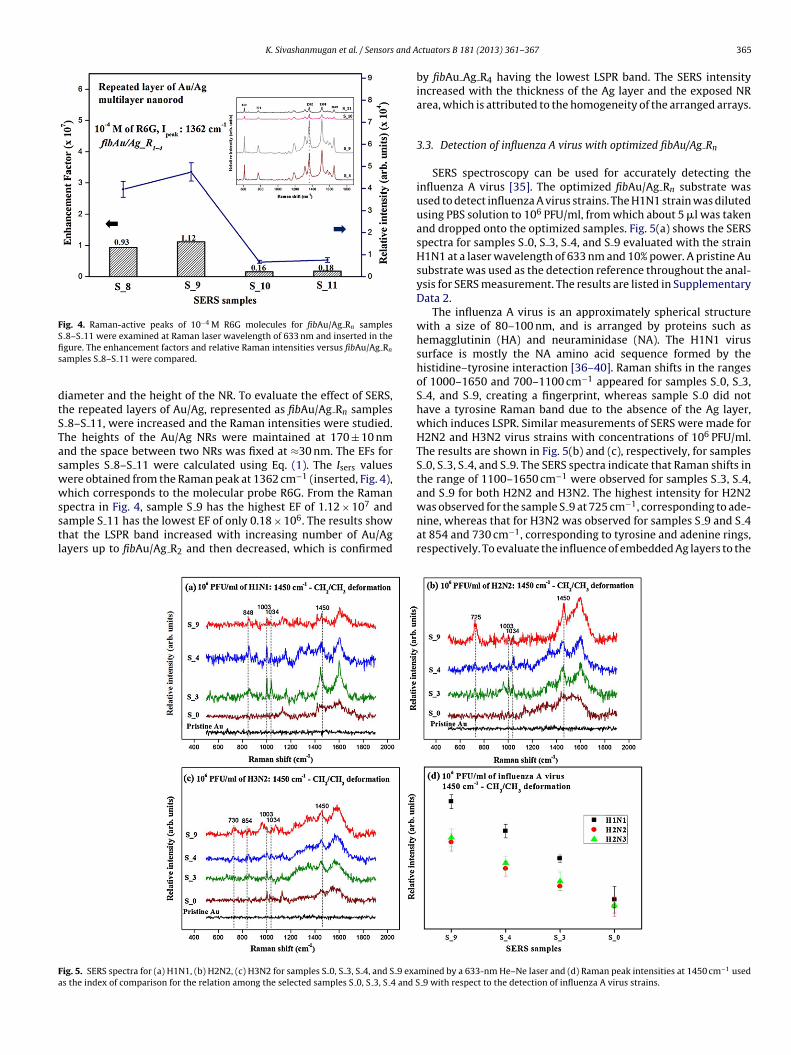
Fig. 4. Raman-active peaks of 10−4 M R6G molecules for fibAu/Ag Rn samplesS 8–S 11 were examined at Raman laser wavelength of 633 nm and inserted in thefis
dtSTaswwsstl
−1
Fa
gure. The enhancement factors and relative Raman intensities versus fibAu/Ag Rn
amples S 8–S 11 were compared.
iameter and the height of the NR. To evaluate the effect of SERS,he repeated layers of Au/Ag, represented as fibAu/Ag Rn samples
8–S 11, were increased and the Raman intensities were studied.he heights of the Au/Ag NRs were maintained at 170 ± 10 nmnd the space between two NRs was fixed at ≈30 nm. The EFs foramples S 8–S 11 were calculated using Eq. (1). The Isers valuesere obtained from the Raman peak at 1362 cm−1 (inserted, Fig. 4),hich corresponds to the molecular probe R6G. From the Raman
7
pectra in Fig. 4, sample S 9 has the highest EF of 1.12 × 10 andample S 11 has the lowest EF of only 0.18 × 10⁶. The results showhat the LSPR band increased with increasing number of Au/Agayers up to fibAu/Ag R2 and then decreased, which is confirmedig. 5. SERS spectra for (a) H1N1, (b) H2N2, (c) H3N2 for samples S 0, S 3, S 4, and S 9 exas the index of comparison for the relation among the selected samples S 0, S 3, S 4 and S
ctuators B 181 (2013) 361– 367 365
by fibAu Ag R4 having the lowest LSPR band. The SERS intensityincreased with the thickness of the Ag layer and the exposed NRarea, which is attributed to the homogeneity of the arranged arrays.
3.3. Detection of influenza A virus with optimized fibAu/Ag Rn
SERS spectroscopy can be used for accurately detecting theinfluenza A virus [35]. The optimized fibAu/Ag Rn substrate wasused to detect influenza A virus strains. The H1N1 strain was dilutedusing PBS solution to 106 PFU/ml, from which about 5 �l was takenand dropped onto the optimized samples. Fig. 5(a) shows the SERSspectra for samples S 0, S 3, S 4, and S 9 evaluated with the strainH1N1 at a laser wavelength of 633 nm and 10% power. A pristine Ausubstrate was used as the detection reference throughout the anal-ysis for SERS measurement. The results are listed in SupplementaryData 2.
The influenza A virus is an approximately spherical structurewith a size of 80–100 nm, and is arranged by proteins such ashemagglutinin (HA) and neuraminidase (NA). The H1N1 virussurface is mostly the NA amino acid sequence formed by thehistidine–tyrosine interaction [36–40]. Raman shifts in the rangesof 1000–1650 and 700–1100 cm−1 appeared for samples S 0, S 3,S 4, and S 9, creating a fingerprint, whereas sample S 0 did nothave a tyrosine Raman band due to the absence of the Ag layer,which induces LSPR. Similar measurements of SERS were made forH2N2 and H3N2 virus strains with concentrations of 106 PFU/ml.The results are shown in Fig. 5(b) and (c), respectively, for samplesS 0, S 3, S 4, and S 9. The SERS spectra indicate that Raman shifts inthe range of 1100–1650 cm−1 were observed for samples S 3, S 4,and S 9 for both H2N2 and H3N2. The highest intensity for H2N2
was observed for the sample S 9 at 725 cm , corresponding to ade-nine, whereas that for H3N2 was observed for samples S 9 and S 4at 854 and 730 cm−1, corresponding to tyrosine and adenine rings,respectively. To evaluate the influence of embedded Ag layers to themined by a 633-nm He–Ne laser and (d) Raman peak intensities at 1450 cm−1 used 9 with respect to the detection of influenza A virus strains.
366 K. Sivashanmugan et al. / Sensors and Actuators B 181 (2013) 361– 367
F s (a) siA viral
edSioSSlps
ediStbldefbbaN
4
tiTomott
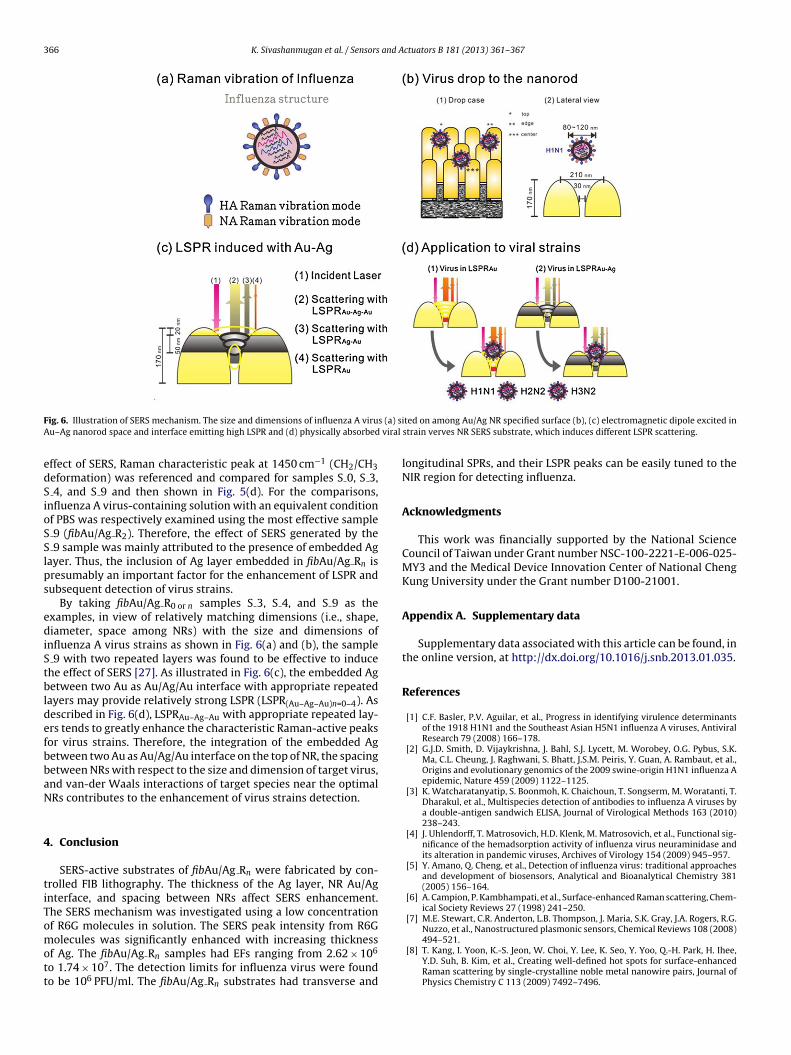
ig. 6. Illustration of SERS mechanism. The size and dimensions of influenza A viruu–Ag nanorod space and interface emitting high LSPR and (d) physically absorbed
ffect of SERS, Raman characteristic peak at 1450 cm−1 (CH2/CH3eformation) was referenced and compared for samples S 0, S 3,4, and S 9 and then shown in Fig. 5(d). For the comparisons,
nfluenza A virus-containing solution with an equivalent conditionf PBS was respectively examined using the most effective sample
9 (fibAu/Ag R2). Therefore, the effect of SERS generated by the9 sample was mainly attributed to the presence of embedded Ag
ayer. Thus, the inclusion of Ag layer embedded in fibAu/Ag Rn isresumably an important factor for the enhancement of LSPR andubsequent detection of virus strains.
By taking fibAu/Ag R0 or n samples S 3, S 4, and S 9 as thexamples, in view of relatively matching dimensions (i.e., shape,iameter, space among NRs) with the size and dimensions of
nfluenza A virus strains as shown in Fig. 6(a) and (b), the sample 9 with two repeated layers was found to be effective to inducehe effect of SERS [27]. As illustrated in Fig. 6(c), the embedded Agetween two Au as Au/Ag/Au interface with appropriate repeated
ayers may provide relatively strong LSPR (LSPR(Au–Ag–Au)n=0–4). Asescribed in Fig. 6(d), LSPRAu–Ag–Au with appropriate repeated lay-rs tends to greatly enhance the characteristic Raman-active peaksor virus strains. Therefore, the integration of the embedded Agetween two Au as Au/Ag/Au interface on the top of NR, the spacingetween NRs with respect to the size and dimension of target virus,nd van-der Waals interactions of target species near the optimalRs contributes to the enhancement of virus strains detection.
. Conclusion
SERS-active substrates of fibAu/Ag Rn were fabricated by con-rolled FIB lithography. The thickness of the Ag layer, NR Au/Agnterface, and spacing between NRs affect SERS enhancement.he SERS mechanism was investigated using a low concentrationf R6G molecules in solution. The SERS peak intensity from R6G
olecules was significantly enhanced with increasing thicknessf Ag. The fibAu/Ag Rn samples had EFs ranging from 2.62 × 10⁶
o 1.74 × 10⁷. The detection limits for influenza virus were foundo be 106 PFU/ml. The fibAu/Ag Rn substrates had transverse and
ted on among Au/Ag NR specified surface (b), (c) electromagnetic dipole excited instrain verves NR SERS substrate, which induces different LSPR scattering.
longitudinal SPRs, and their LSPR peaks can be easily tuned to theNIR region for detecting influenza.
Acknowledgments
This work was financially supported by the National ScienceCouncil of Taiwan under Grant number NSC-100-2221-E-006-025-MY3 and the Medical Device Innovation Center of National ChengKung University under the Grant number D100-21001.
Appendix A. Supplementary data
Supplementary data associated with this article can be found, inthe online version, at http://dx.doi.org/10.1016/j.snb.2013.01.035.
References
[1] C.F. Basler, P.V. Aguilar, et al., Progress in identifying virulence determinantsof the 1918 H1N1 and the Southeast Asian H5N1 influenza A viruses, AntiviralResearch 79 (2008) 166–178.
[2] G.J.D. Smith, D. Vijaykrishna, J. Bahl, S.J. Lycett, M. Worobey, O.G. Pybus, S.K.Ma, C.L. Cheung, J. Raghwani, S. Bhatt, J.S.M. Peiris, Y. Guan, A. Rambaut, et al.,Origins and evolutionary genomics of the 2009 swine-origin H1N1 influenza Aepidemic, Nature 459 (2009) 1122–1125.
[3] K. Watcharatanyatip, S. Boonmoh, K. Chaichoun, T. Songserm, M. Woratanti, T.Dharakul, et al., Multispecies detection of antibodies to influenza A viruses bya double-antigen sandwich ELISA, Journal of Virological Methods 163 (2010)238–243.
[4] J. Uhlendorff, T. Matrosovich, H.D. Klenk, M. Matrosovich, et al., Functional sig-nificance of the hemadsorption activity of influenza virus neuraminidase andits alteration in pandemic viruses, Archives of Virology 154 (2009) 945–957.
[5] Y. Amano, Q. Cheng, et al., Detection of influenza virus: traditional approachesand development of biosensors, Analytical and Bioanalytical Chemistry 381(2005) 156–164.
[6] A. Campion, P. Kambhampati, et al., Surface-enhanced Raman scattering, Chem-ical Society Reviews 27 (1998) 241–250.
[7] M.E. Stewart, C.R. Anderton, L.B. Thompson, J. Maria, S.K. Gray, J.A. Rogers, R.G.Nuzzo, et al., Nanostructured plasmonic sensors, Chemical Reviews 108 (2008)
494–521.[8] T. Kang, I. Yoon, K.-S. Jeon, W. Choi, Y. Lee, K. Seo, Y. Yoo, Q.-H. Park, H. Ihee,Y.D. Suh, B. Kim, et al., Creating well-defined hot spots for surface-enhancedRaman scattering by single-crystalline noble metal nanowire pairs, Journal ofPhysics Chemistry C 113 (2009) 7492–7496.
and A
[
[
[
[
[
[
[
[
[
[
[
[
[
[
[
[
[
[
[
[
[
[
[
[
[[
[
[
[
[
[
K. Sivashanmugan et al. / Sensors
[9] Y. Fang, N-H. Seong, D.D. Dlott, et al., Measurement of the distribution ofsite enhancements in surface-enhanced Raman scattering, Science 321 (2008)388–392.
10] J.P. Camden, J.A. Dieringer, Y. Wang, D.J. Masiello, L.D. Marks, G.C. Schatz, R.P.Van Duyne, et al., Probing the structure of single-molecule surface-enhancedRaman scattering hot spots, Journal of the American Chemical Society 130(2008) 12616–12617.
11] J.A. Dieringer, R.B. Lettan II, K.A. Scheidt, R.P. Van Duyne, et al., A frequencydomain existence proof of single-molecule surface-enhanced Raman spec-troscopy, Journal of the American Chemical Society 129 (2007) 16249–16256.
12] S.E.J. Bell, N.M.S. Sirimuthu, et al., Surface-enhanced Raman spectroscopy(SERS) for sub-micromolar detection of DNA/RNA mononucleotides, Journalof the American Chemical Society 128 (2006) 15580–15581.
13] Y.C. Cao, R. Jin, C.A. Mirkin, et al., Nanoparticles with Raman spectroscopicfingerprints for DNA and RNA detection, Science 297 (2002) 1536–1540.
14] A. Barhoumi, D. Zhang, F. Tam, N.J. Halas, et al., Surface-enhanced Ramanspectroscopy of DNA, Journal of the American Chemical Society 130 (2008)5523–5529.
15] Z.Q. Tian, B. Ren, Y. Wu, et al., Surface-enhanced Raman scattering: from nobleto transition metals and from rough surfaces to ordered nanostructures, Journalof Physics Chemistry B 106 (2002) 9463–9483.
16] B. Ren, X.F. Lin, Z.L. Yang, G.K. Liu, R.F. Aroca, B.W. Mao, et al., Surface-enhancedRaman scattering in the ultraviolet spectral region: UV-SERS on rhodium andruthenium electrodes, Journal of the American Chemical Society 125 (2003)9598–9599.
17] A.V. Whitney, B.D. Myers, R.P. Vanduyne, et al., Sub-100 nm triangularnanopores fabricated with the reactive ion etching variant of nanospherelithography and angle-resolved nanosphere lithography, Nano Letters 4 (2004)1507–1511.
18] C.L. Haynes, R.P. Vanduyne, et al., Dichroic optical properties of extendednanostructures fabricated using angle-resolved nanosphere lithography, NanoLetters 3 (2003) 939–943.
19] Z.Q. Tian, B. Ren, J.F. Li, Z.L. Yang, et al., Expanding generality of surface-enhanced Raman spectroscopy with borrowing SERS activity strategy,Chemical Communications 34 (2007) 3514–3534.
20] F. Le, D.W. Brandl, Y.A. Urzhumov, H. Wang, J. Kundu, N.J. Halas, J. Aizpurua,Peter Nordlander, et al., Metallic nanoparticle arrays: a common substratefor both surface-enhanced Raman scattering and surface-enhanced infraredabsorption, American Chemical Society Nano 2 (4) (2008) 707–718.
21] E.C. Le Ru, J. EtchegoinGrand, N. Felidj, J. Aubard, G. Levi, A. Hohenau, J.R. Krenn,et al., Surface enhanced Raman spectroscopy on nanolithography-preparedsubstrates, Current Applied Physics 8 (2008) 467–470.
22] G. Das, F. Mecarini, F. Gentile, F. De Angelis, M.H.G. Kumar, P. Candeloro, C. Lib-erale, G. Cuda, E. Di Fabrizio, et al., Nano-patterned SERS substrate: applicationfor protein analysis vs. temperature, Biosensor and Bioelectronics 24 (2009)1693–1699.
23] C.W. Chang, J.D. Liao, Y.Y. Lin, C.C. Weng, et al., Fabrication of nano-indentedcavities on Au for the detection of chemically-adsorbed DTNB molecularprobes through SERS effect, Journal of Colloid and Interface Science 358 (2011)384–391.
24] P.D. Bao, T.Q. Huang, X.M. Liu, T.Q. Wu, et al., Surface-enhanced Raman spec-troscopy of insect nuclear polyhedrosis virus, Journal Raman Spectroscopy 32(4) (2001) 227–230.
25] C.W. Chang, J.D. Liao, A.L. Shiau, C.K. Yao, et al., Non-labeled virus detectionusing inverted triangular Au nano-cavities arrayed as SERS-active substrate,Sensor and Actuators B: Chemical 156 (1) (2011) 471–478.
26] (a) C.W. Chang, J.D. Liao, Y.Y. Lin, C.C. Weng, et al., Detecting very small quan-tity of molecular probes in solution using nano-mechanically made Au-cavitiesarray with SERS-active effect, Sensor and Actuators B: Chemical 153 (1) (2011)271–276;(b) C.K. Yao, J.D. Liao, C.W. Chang, J.R. Lin, et al., Spatially reinforced nano-cavityarray as the SERS-active substrate for detecting hepatitis virus core antigen atlow concentrations, Sensors and Actuators B 174 (2012) 478–484.
27] (a) Y.Y. Lin, J.D. Liao, Y.H. Ju, C.W. Chang, A.L. Shiau, et al., Focused ionbeam-fabricated Au micro/nanostructures used as a surface enhanced Ramanscattering-active substrate for trace detection of molecules and influenza virus,Nanotechnology 22 (2011) 185308–185316;(b) Y.Y. Lin, J.D. Liao, M.L. Yang, C.L. Wu, et al., Target-size embracing dimension
for sensitive detection of viruses with various sizes and influenza virus strains,Biosensors and Bioelectronics 35 (2012) 447–451.28] Z. Xie, J. Tao, Y. Lu, K. Lin, J. Yan, P. Wang, H. Ming, et al., Polymer opticalfiber SERS sensor with gold nanorods, Optical Communications 282 (3) (2009)439–442.
ctuators B 181 (2013) 361– 367 367
29] J. Grand, M. Lamy de la Chapelle, J.L. Bijeon, P.M. Adam, A. Vial, P. Royer, et al.,Role of localized surface plasmons in surface-enhanced Raman scattering ofshape-controlled metallic particles in regular arrays, Physical Review B 72 (3)(2005) 033404–033407.
30] K.L. Wustholz, C.L. Brosseau, F. Casadio, R.P.V. Duyne, et al., Surface-enhancedRaman spectroscopy of dyes: from single molecules to the artists’ canvas, Phys-ical Chemistry Chemical Physics 11 (2009) 7350–7359.
31] M.L. Yang, Y.H. Chen, S.W. Wang, Y.J. Huang, C.H. Leu, N.C. Yeh, C.Y. Chu, C.C. Lin,G.S. Shieh, Y.L. Chen, J.R. Wang, C.H. Wang, C.L. Wu, A.L. Shiau, et al., Galectin-1binds to Influenza Virus 1 and Ameliorates Influenza pathogenesis, Journal ofVirology 85 (19) (2011) 10010–10020.
32] Y.F. Hunag, Y.W. Lin, H.T. Chang, et al., Control of the surface charges ofAu–Ag nanorods: selective detection of iron in the presence of poly(sodium4-styrenesulfonate), Langmuir 23 (2007) 12777–12781.
33] P.R. Evans, W.R. Hendren, R. Atkinson, R.J. Pollard, et al., Optical transmissionmeasurements of silver, silver–gold alloy and silver–gold segmented nanorodsin thin film alumina, Nanotechnology 19 (2008) 465708–465716.
34] S.A. Maier, Plasmonics: Fundamentals and Applications, Springer, US, 2007.35] S. Shanmukh, L. Jones, J. Driskell, Y. Zhao, R. Dluhy, R.A. Tripp, et al.,
Rapid and sensitive detection of respiratory virus molecular signaturesusing a silver nanorod array SERS substrate, Nano Letters 6 (11) (2006)2630–2636.
36] H. Han, X. Yan, R. Dong, G. Ban, K. Li, et al., Analysis of serum from type IIdiabetes mellitus and diabetic complication using surface-enhanced Ramanspectra (SERS), Applied Physics B 94 (2009) 667–672.
37] D.K. Byarugaba, M.F. Ducatez, B. Erima, E.A. Mworozi, M. Millard, H. Kibuuka,L. Lukwago, J. Bwogi, B.B. Kaira, D. Mimbe, D.C. Schnabel, S. Krauss, D. Darnell,R.J. Webby, R.G. Webster, F. Wabwire-Mangen, et al., Molecular epidemiologyof Influenza A/H3N2 viruses circulating in Uganda, PLoS ONE 6 (11) (2011)e27803–e27813.
38] I. Notingher, et al., Raman spectroscopy cell-based biosensors, Sensors 7 (8)(2007) 1343–1358.
39] E. van der Vries, F.F. Stelma, C.A.B. Boucher, et al., Emergence of a multidrug-resistant pandemic Influenza A (H1N1) Virus, New England Journal of Medicine363 (14) (2010) 1381–1382.
40] W.T. Cheng, M.T. Liu, H.N. Liu, S.Y. Lin, et al., Micro-Raman spectroscopy usedto identify and grade human skin pilomatrixoma, Microscopy Research andTechnique 68 (2005) 75–79.
Biographies
Kundan Sivashanmugan is currently pursuing his Ph.D. degree at Department ofMaterials Science and Engineering (MSE), National Cheng-Kung University (NCKU),Tainan, Taiwan. He received his M.Sc., Physics and M.Phil., Nanoscience and Tech-nology degrees at Bharathiar University, Coimbatore, India in 2009 and 2011,respectively. His current research interest is focused on the fabrication of SERS-active substrates for fast-screening detection platform on “food contamination andvirus” using a focused ion beam and nano-indentation technique.
Jiunn-Der Liao is currently the distinguished professor at Department of MSE,NCKU, Tainan, Taiwan. He obtained his B.S. degree at the same department, NCKUin 1984, M.S. degrees at K.U. Leuven (Belgium) in 1990 and 1991, respectively,and Ph.D. degree at ENS Mines (France) in 1994. He also worked at University ofHeidelberg (Germany) as a research fellow from 1995 to 1996 and Chung YuanChristian University (Taiwan) as Associate Professor from 1996 to 2002. His currentresearch interests are focused upon (1) mechanics of biomaterials, e.g., tissue engi-neering, scaffold materials, cell–surface interactions, nano-indentation, mechanicaltransduction; (2) plasma chemistry and plasma processing, e.g., plasma genera-tion, plasma diagnoses, plasma physics and chemistry, metal vapor vacuum arc,plasma ion immersion; (3) nano-fabrication and nano-characterization, e.g., focusedion beam based nano-fabrication, micro-contact imprinting, synchrotron-based andlaboratory-based high resolution analyses.
Jin-Wei You obtained his B.S. and M.S. degrees at Department MSE from NCKU in2010 and 2012, respectively. The research topic of his Master degree was focused onthe fabrication of SERS-active substrate (dimensionally controlled) for fast screeningdetection platform on “virus” by using a focused ion beam technique.
Chao-Liang Wu is currently the distinguished professor at Department of Bio-chemistry and Molecular Biology, NCKU, Tainan, Taiwan. Currently his research isconcentrating on Lesch-Nyhan syndrome, an inherited neurological disorder andNeurological studies.
Related Documents