SPECIALS Giving Away Wealth? Trade Effects of the Yuan Devaluation Martin T. Braml and Marina Steininger The ifo Export Climate – A Leading Indicator to Forecast German Export Growth Christian Grimme and Robert Lehmann SPOTLIGHT The Asylum, Migration, and Integration Fund of the EU Chang Woon Nam TRENDS Statistic Update FOCUS Economic Sanctions Peter A. G. van Bergeijk, Gerald Schneider and Patrick M. Weber, Anders Åslund, Iikka Korhonen, John J. Forrer and Kathleen Harrington, Christian von Soest 04 2019 Winter Vol. 20

Welcome message from author
This document is posted to help you gain knowledge. Please leave a comment to let me know what you think about it! Share it to your friends and learn new things together.
Transcript

SPECIALS
Giving Away Wealth? Trade Effects of the Yuan DevaluationMartin T. Braml and Marina Steininger
The ifo Export Climate – A Leading Indicator to Forecast German Export Growth Christian Grimme and Robert Lehmann
SPOTLIGHT
The Asylum, Migration, and Integration Fund of the EUChang Woon Nam
TRENDS
Statistic Update
FOCUS
Economic SanctionsPeter A. G. van Bergeijk, Gerald Schneider and Patrick M. Weber, Anders Åslund, Iikka Korhonen,
John J. Forrer and Kathleen Harrington, Christian von Soest
042019
Winter Vol. 20

CESifo ForumISSN 1615-245X (print version)ISSN 2190-717X (electronic version) A quarterly journal on European economic issuesPublisher and distributor: ifo Institute, Poschingerstr. 5, 81679 Munich, GermanyTelephone +49 89 9224-0, telefax +49 89 9224-98 53 69, email [email protected] subscription rate: €50.00Single subscription rate: €15.00Shipping not includedEditor: Chang Woon Nam ([email protected])Indexed in EconLitReproduction permitted only if source is stated and copy is sent to the ifo Institute.
www.cesifo.org
FOCUS
Economic SanctionsCan the Sanction Debate Be Resolved? 3Peter A. G. van Bergeijk
Biased, But Surprisingly Effective: Economic Coercion after the Cold War 9Gerald Schneider and Patrick M. Weber
Western Economic Sanctions on Russia over Ukraine, 2014-2019 14Anders Åslund
Economic Sanctions on Russia and Their Effects 19Iikka Korhonen
The Trump Administration’s Use of Trade Tariffs as Economic Sanctions 23John J. Forrer and Kathleen Harrington
Individual Sanctions: Toward a New Research Agenda 28Christian von Soest
SPECIALS
Giving Away Wealth? Trade Effects of the Yuan Devaluation 32Martin T. Braml and Marina Steininger
The ifo Export Climate – A Leading Indicator to Forecast German Export Growth 36Christian Grimme and Robert Lehmann
SPOTLIGHT
The Asylum, Migration, and Integration Fund of the EU 43Chang Woon Nam
TRENDS
Statistics Update 46
VOLUME 20, NUMBER 4, Winter 2019


3
FOCUS
CESifo Forum 4 / 2019 December Volume 20
Peter A. G. van BergeijkCan the Sanction Debate Be Resolved?
The debate over whether economic sanctions ‘work’ is mired in scholarly limbo.
David A. Baldwin (2000, 80)
INTRODUCTION
It is both disturbing and puzzling that despite many decades of research by the brightest minds we have still not been able to arrive at a consensus on the pertinent question “do sanctions work?” This is cer-tainly not because the literature has not dealt with this issue. Figure 1 provides an admittedly rough and mechanic, but still useful characterization of the post-Second World War literature.1 Figure 1 indicates both the amount and growth of research on economic sanctions and the role that failure and success have always played in the academic debate 1 I use Google Scholar because it also covers books that have al-ways been and continue to be important academic outlets for my topic.
Economic Sanctions
Peter A. G. van BergeijkErasmus University, International Institute of Social Studies
on economic sanctions.2 This makes the puzzle that the debate on sanctions has not been resolved even more baffling.
The remainder of this article is organized as fol-lows. In the next section we will take a look at the debate on the effectiveness of economic sanctions and the underlying factors. The third section derives some stylized facts regarding this debate, followed by the fourth section which discusses possible ex -planations for this development. The final section suggests an alternative methodological approach that could help to bring the debate closer to a solution.
PRE- VERSUS POST-1990
My own involvement with the sanction debate started in the second half of the 1980s. In those days, economic sanctions were definitely not con-sidered effective tools to change the politics and policies of the target nation. The sanctions against the apartheid regimes of Rhodesia and South Africa had been analyzed in depth by leading scholars of the time and their verdict on the utility of economic sanctions was negative. Galtung (1967), for example, in a highly influential article had developed a theory of economic sanctions using Rhodesia as an exam-ple and with a sobering conclusion: he cautioned
that his finding that the sanc-tions had not been effective did not mean that sanctions could not be effective; the influential study by Wallen-steen (1968, 262) however concluded that “[t]he general picture is that economic sanc-
2 The analysis on which these findings are based cover more characteristics and concepts of the sanctions debate (van Bergeijk 2020). It is interesting to note that the literature considered the ex ante threat aspect of economic sanctions from the start, so well before game theoretic analyses were in vogue. The analysis also reveals dynamic developments in the literature such as the fact that the share of ‘punishment’ and ‘reward’ starts to increase from about one-fifth around 1990 to be-tween one-half and two-thirds only in the most recent decade.
Note: Total economic sanctions reports the number of results returned for (‘economic sanctions’). For a key concept (e.g. success) the number of returned results relates to searching for (‘economic sanctions’ success).Source: Google scholar.
Number of Google Scholar Hits for ʻEconomic Sanctions’ and Three Key Concepts by Decade (1950–2019)
© ifo Institute
0
5000
10000
15000
20000
25000
1950s 1960s 1970s 1980s 1990s 2000s 2010s
Success Failure Effectiveness Threat Total economic sanctions
Figure 1

4
FOCUS
CESifo Forum 4 / 2019 December Volume 20
tions have been unsuccessful as a means of influence in the international system”. Indeed, in the early 1980s, the other UN sanction of that epoch (against South Africa during apartheid) was at that time also considered to be a failure; this was also true of other high-profile cases such as sanctions against Cuba and the Soviet Union or, for that matter, the OPEC oil embargo. Barber (1979, 384) summarized the state of affairs as follows: “[a]lthough there are some difficulties of evaluation, there is a strong con-sensus that sanctions have not been successful in achieving their primary objectives”. Lindsay (1986), while recognizing the potential utility of sanctions as domestic and international symbols, concluded that sanctions generally failed with respect to com-pliance, subversion, or deterrence.
Why did the profession arrive at this verdict? First and foremost, it was pointed out that it would hardly be possible to bring about the political unity that is necessary for forceful embargoes and boycotts, and that – even if established – such mea-sures would be easy to evade (Adler-Karlsson 1982). Also, the time between the announcement of the intention to impose sanctions and the actual im -plementation of those measures was long, offer- ing sanction targets the option to adapt, for ins- tance through stockpiling and restructuring the economy (Seeler 1982). Moreover, it was recognized that compliance with highly visible pressure, such as economic sanctions, would erode the target’s lead-ership both at home and abroad (Lindsay 1986) and compliance was thus associated with high political costs in several arenas. Finally, the 1980s also brought the numbers that seemed to support this consensus when Hufbauer and Schott in 1985 published their seminal study Economic Sanctions Reconsidered, which for the first time coded a large number of sanc-tion cases. Amongst their findings, the sobering fact still stands out that two out of three economic sanc-tions failed. The empirics thus seemed to support the consensus and some, like Pape (1997), have argued that the numerical case against sanctions is even stronger.
The research puzzle that motivates this paper is the fact the sanction debate con-tinues today. Perhaps one might be inclined to relate this state of affairs to the fact that the conditions for sanction success have dra-matically changed since the 1980s, as I argued in the mid-1990s (van Bergeijk 1994 and 1995). Indeed, the end of the superpower conflict enabled UN sanctions to be implemented quickly and
comprehensively: the severe, wide-ranging, and almost watertight sanctions against Iraq in 1990 were implemented in four days. Globalization, more over, opened up many economies that previ-ously could not have been hurt by economic sanc- tions. Apartheid ended. Since the conditions of time and place would appear to have changed to the benefit of (potential) success, one might expect the balance of evidence to have shifted from the negative consensus in the 1980s to a more posi-tive evaluation in recent decades. However, as will become clear in the next section, the literature has actually become more inclined to discuss and find ineffectiveness.
THE MORE WE LEARN, THE LESS WE KNOW?
Figure 2 provides another first rough charac- teri zation of the problem at hand. The key charac-teristics identified in Figure 1 appear as the upper ‘success’ and ‘failure’ lines. The numbers are in percent of the total for economic sanctions (that is: the red line in Figure 1); so, the focus in Figure 2 is on the re lative importance of concepts rather than on absolute numbers. Over the post-Second World War period these shares are stable. I have added four key attributes of the sanction debate, including shares for ‘effective’, ‘effectiveness’, ‘ineffective’, and ‘in effectiveness’. Whereas ‘effective’ and ‘effectiveness’ over the whole period appear to be common concepts in the sanction debate (with a score that is comparable to ‘failure’ and ‘success’), we see that ‘ineffective’ and ‘ineffectiveness’ start from a significantly lower share, but since the 1990s have been catching up (an increase of 25 percent-age points). This observation illustrates that the in- effectiveness of sanctions plays a larger role in the debate.
The fact that the concepts of ‘ineffective’ and ‘ineffectiveness’ have become more frequent attri-
0102030405060708090
1950s 1970s 1990s 2010s
Success Effective EffectivenessFailure Ineffective Ineffectiveness
Note: Total economic sanctions reports the number of results returned for (‘economic sanctions’). For a key concept (e.g., success) the number of returned results relates to searching for (‘economic sanctions’ success).Source: Google scholar.
ʻIneffective’ and ʻIneffectiveness’ Have Become Much More Important Attributes in the Sanction Literature Share in Total Economic Sanctions (Google Scholar hits for key concepts by decade, 1950–2019)
%
© ifo Institute
Figure 2

5
FOCUS
CESifo Forum 4 / 2019 December Volume 20
butes in the sanction debate could reflect a more balanced approach, a mere change in language, or an underlying empirical trend. It is a piece of the puzzle, but we have to dig deeper. Therefore, Fig-ure 3 reports the t-values for the trade variable in the 36 empirical studies on success/effectiveness and failure/in effectiveness of economic sanctions that include a trade variable amongst the explanatory or controlling variables.3 The reason to take a look at the role of trade in the sanction debate is that sanc-tions cannot be expected to change behavior if the amount of trade between sanction sender and sanc-tion target is negligible – for me as an economist: if anything should be associated with sanction suc-cess and failure, then it is the level of pre-sanction trade that could be hit by the sanctions. The t-val-ues are appropriate measures because they focus on sign and significance and also because they are di mensionless (thus avoiding distortions of compa-rability due to slightly different operationalizations of trade).
Figure 3 shows reported t-values in empirical stud-ies (each dot is a regression/specification) over time and makes two points. First, it shows that after initial agree-ment in the mid-1980s and 1990s on the positive impact of trade on success and fail-ure of economic sanctions, after the turn of the century negative trade coefficients become more common so 3 The data collection is part of a proj-ect at my Institute for which a good three hundred estimates were collect-ed from 36 studies that appeared in the period between 1985 to 2018 inclusive (most of these studies appeared in peer-reviewed journals), see Demena et al. (2019).
that the literature gets less and less conclusive. This is not so much due to insigni- ficant findings as to disper-sion. Indeed, highly signi-ficant negative coefficients go hand in hand with highly significant positive values. Second, Figure 3 provides a kernel plot that reveals the same issue – not from the perspective of increased dis-persion, but from the point of view of the overall conclu-sion that can be drawn from the primary studies. The ker-nel function shows that year by year the primary studies show a decreasing average
and that the average in 2018 is close to becoming insignificant. So, the conclusion from Figure 3 is that no conversion emerges on the impact of a key variable and that disagreement on its sign (and size) has increased meaningfully and statistically over time.
Figure 4 provides some detailed findings of a deeper analysis of this phenomenon, as it reports on meta-regressions for trade and two other key de -terminants of sanction success: sanction duration and prior relations. Duration and prior relations are also key ingredients of the economic analysis (Dizaji and van Bergeijk 2013). The longer sanctions are in effect, the better the target can adjust, because adjustment of production structures and reallo- cation of the factors of production takes time. If prior relations are bad, then a potential target could pre-empt the sanction and reduce its impact either by proactive reorientation on new markets or by stock-piling. The results of the meta-regression analyses that use study characteristics as controlling vari-
Source: Demena et al. (2019).
Reported t-Values of Trade Coefficient Reported in 36 Primary Studies Published in 1985–2018
© ifo Institute
−4
−2
0
2
4
6
t−values of the reported ES
Publication year of the study
95% CI t−values of the reported ES lpoly smooth
1985 1988 1991 1994 1997 2000 2015 20182012200920062003
Figure 3
-3
-2
-1
0
1
2
3
Trade linkage (N=100) Duration (N=73) Prior relations (N=60)
BiasGenuine effect
Source: Benalcazar Jativa (2018), Kimararungu (2018) and Reta (2018).
Meta Regression Analyses for Three Determinants of Sanction Success (Genuine Effect and Bias)
© ifo Institute
Figure 4

6
FOCUS
CESifo Forum 4 / 2019 December Volume 20
ables and relate to different (but overlapping) sub-samples of the empirical sanctions literature are sobering. While the primary studies on average report that the signs of trade, duration, and prior relations conform to a priori theoretical expec-tations, the meta-regression analysis is that this is mainly due to publication bias away from zero. Indeed, the genuine effects are always very small. The implication of this finding is that the litera- ture appears to exaggerate the importance of the three determinants for the success of economic sanctions.
All in all, we have uncovered that the literature on economic sanctions can be characterized by three stylized facts:
1. the empirical post-Second World War literature shows an increasing association between eco-nomic sanctions and their ineffectiveness since the 1990s;
2. the findings that are reported in the empirical literature show an increasing dispersion and inconclusiveness since the turn of the millen-nium; and
3. the post-1985 empirical literature suffers from significant bias in the reported results.
In the next section I will discuss potential explana-tions for this phenomenon.
WHY DOES THE DEBATE MOVE TOWARDS FURTHER INCONCLUSIVENESS?
It is actually not uncommon to find that the litera- ture on a topic develops in opposite directions, that seminal results are contested, and/or that pub lication bias is significant in a literature. We can thus resort to research that has found and dis-cussed similar results. According to Robert Goldfarb (1995), the time pattern of findings in economics very often starts with a paper that reports a new and exciting statistically significant result and initiates a stream of skeptical publications that contest the original result and, in a later round new papers contest the contestations, and so on, until the literature converges to a consensus. In any emerging scientific field, many findings are ‘preliminary’ and often contradictory due to the pro- cess of finding out the true effect (van Bergeijk and Lazzaroni 2015). At first sight, Figure 3 would seem to represent such a trend, starting with a highly significant trade parameter that adjusts to more accurate smaller values over time. Indeed, the ker-nel function suggests that skepticism is doing its job in science, but in fact it does not. We can observe that findings pro and contra rest on increasingly sta-tistically more significant findings. Figure 3 shows no convergence but divergence in statistically sig-nificant positive and negative results, and Goldfarb’s
theory cannot provide an explanation for the state of affairs in sanction research.
So, let us take a look at explanations for publi-cation bias that according to Figure 4 is a severe problem. Publication bias is a bias that is intro-duced into the publication process by selection of parti cular results. This can occur in the referee procedure. Editors and referees will prefer convinc-ing papers and all too often they look for papers with large and highly significant coefficients. It is thus more difficult to publish less significant findings, and this biases what we see in the journals. In the same vein, it is easier to publish a paper that cont-radicts rather than confirms existing knowledge. Confirmation tells us something that ‘we already know’.
It is, however, not only the publication pro- cess that creates bias. Researchers are typically intrinsically motivated. Economic sanctions are applied for a great many issues, including adher-ence to human rights, and like all economic ac -tivities they have important external effects (e.g., on health). Obviously, economic sanctions are ap- plied in a context of international conflict with dif-ferent impacts on sender and target. For some, sanc-tions are an alternative to outright war. Also, the tension between sanctions and free trade is a re- levant issue. All in all, sanctions have a high socie-tal and poli tical relevance and therefore research-ers might be (explicitly or implicitly) driven by their ideals or ideologies to report results that fit their worldview in relation to problem identification, solutions, as well as instruments (and, importantly, they may ignore results that contradict their view of the world). If so, political cycles and geopolitics can to a large extent explain both the publication bias as well as the lack of convergence and absence of a consensus.
The problem with the sanction literature is, moreover, that empirical research is by and large based on three data collections (Peksen 2019), namely Hufbauer et al. (1985, 1990 and 2007); Mor-gan et al. (2009 and 2014); and Biersteker et al. (2018). While these datasets are referred to as large-N data-sets, meaning they contain a large number of sanc-tion episodes (the unit of analysis/observation), the number of episodes is small by the usual standards. The label large-N was earned because before 1985 comparative research of economic sanctions would be based on a few handfuls of cases. So, 1985 is a watershed year because, thanks to the seminal study by Hufbauer et al., the number of cases exceeded one hundred. Later work updated, extended, and also brought new types of sanctions into the pic-ture, but essentially all empirical research is ask-ing questions to a quite limited set of data that is all constructed in similar ways. Despite the large-N epitaph, the sample is by most standards small – especially if subsets of specific sanction goals or

7
FOCUS
CESifo Forum 4 / 2019 December Volume 20
senders are considered. A related problem is that updates of the data often coincide with changes in coding, so that results for even a similar set of cases can differ from data version to data version (van Bergeijk and Siddique 2017).4 My conclusion is that we need a new approach: the large-N datasets have been an important step forward, but as illustrated in Figure 3 and 4 cannot bring us closer to a consen-sus. So, what to do?
A FUTURE FOR SANCTION RESEARCH?
In order to resolve the sanction debate, we will need new ways of looking at the (in)effectiveness and impact of economic sanctions, because the current approaches do not show that the field is moving towards consensus. This requires a change in the dominant methodology, which presently evaluates and codes the judgment of scientists and policymak-ers on the success/failure of sanctions and uses this data to establish covariates and determinants of the outcomes of economic sanction cases. The aim is to reach a general conclusion, but this comes at the cost of a deeper understanding of country-specific relationships
The alternative avoids the subjective evalu-ations and relies on empirically established rela-tionships. Such an approach starts with a revival of country or case studies. Using the sanction target as the unit of observation enables researchers to bring much-needed detail on country- and/or econ-omy-specific characteristics into the picture. Data on trade structure, production, elasticities, political systems, et cetera are available for countries, but bringing such items into the realm of the traditional large-N studies is not feasible. The large-N is not sufficiently large, and we would soon be left without degrees of freedom.
Country case studies could also include the dynamic development of political and (socio)eco-nomic variables that is missing from our current analysis of success and failure (Peksen 2019). An example of such a case study is the Vector Auto Regressive model that I developed with Sajjad Dizaji regarding sanctions against Iran (Dizaji and van Ber-geijk 2013). VAR models could be a preferred tool of analysis because they allow for flexible structures, and also because the data requirements are not too demanding. As we showed in our article, we can con-struct a VAR model that shows how sanctions over time impact the economy and the political system; actually we find that the reduction of oil and gas rents due to the sanctions generates economic costs that act as incentives to move towards a more de- mocratic setting. An important finding is that this effect is significant in the first two years only and
4 In the context of this article, it is important to note that the findings for trade linkage, duration, and prior relations are not influ-enced by the data vintage.
indeed turns negative after six or seven years. The driver of these dynamics is that adjustment of eco-nomic structures mitigates the economic – and thereby the political – impact of the sanctions.
In conclusion, we need more VAR studies for countries that have become the target of economic sanctions. This will help us to understand differ-ences and communalities between the cases. Once we have sufficient country studies, we can attempt to synthesize this research by means of a meta- analysis. Of course, we cannot predict if this research strategy will provide a consensus, but it will bring new knowledge and perspectives on the sanction process that are currently not available.
REFERENCES
Adler-Karlsson, G. (1982), “Instruments of Economic Coercion and Their Use,” in F. A. M. Alting von Geusau and J. Pelkmans, eds., National eco-nomic security: Perceptions, Threats and Policies, John F. Kennedy Insti-tute, Tilburg, 160–182.
Baldwin, D. A. (2000), “The Sanctions Debate and the Logic of Choice”, International Security 24, 80–107.
Barber, J. (1979), “Economic Sanctions as a Policy Instrument”, Interna-tional Affairs 55, 367–384.
Benalcazar Jativa, G. F. (2018), Prior Political Relations Works: A Meta-Anal-ysis of Its Effect on the Success of Economic Sanctions, International Insti-tute of Social Studies, The Hague.
Biersteker, T. J., S. E. Eckert, M. Tourinho and H. Zuzana (2018), “UN Targeted Sanctions Datasets (1991–2013)”, Journal of Peace Research 55, 404–412.
Demena, B. A., A. Reta, G. Benalcazar Jativa, P. Kimararungu and P. A. G. van Bergeijk (2019), Publication Bias of Economic Sanction Research: A Meta-analysis of the Impact of Trade-Linkage, Duration, and Prior Relations on Sanction Success, Paper presented at the 19th Jan Tinbergen European Peace Science Conference, The Hague.
Dizaji, S. F. and P. A. G. van Bergeijk (2013), “Potential Early-phase Success and Ultimate Failure of Economic Sanctions: A VAR Approach with an Application to Iran”, Journal of Peace Research 50, 721–736.
Galtung, J. (1967), “On the Effects of International Economic Sanctions, with Examples from the Case of Rhodesia”, World Politics 19, 378–416.
Goldfarb, R. S. (1995), “The Economist-as-audience Needs a Methodology of Plausible Inference”, Journal of Economic Methodology 2, 201–222.
Hufbauer, G. C. and J. J. Schott (1985), Economic Sanctions Reconsidered: History and Current Policy, Peterson Institute, Washington DC.
Hufbauer, G. C., J. J. Schott and K. A. Elliott (1990), Economic Sanctions Reconsidered: History and Current Policy, Peterson Institute, Washington DC.
Hufbauer, G. C., J. J. Schott, K. A. Elliott and B. Oegg (2007), Economic Sanctions Reconsidered, 2nd Edition, Peterson Institute, Washington DC.
Kimararungu, P. B. (2018), The Effectiveness of Duration on the Success of Economic Sanctions: A Meta-analysis, International Institute of Social Studies, The Hague.
Lindsay, J. M. (1986), “Trade Sanctions as Policy Instruments: A Re-exam-ination”, International Studies Quarterly 30, 153–173.
Morgan, T. C., N. Bapat and V. Krustev (2009), “The Threat and Imposition of Sanctions, 1971–2000”, Conflict Management and Peace Science 26, 92–110.
Morgan, T. C., N. Bapat and Y. Kobayashi (2014), “Threat and Imposition of Economic Sanctions 1945–2005: Updating the TIES Dataset”, Conflict Management and Peace Science 31, 541–558.
Pape, R. A. (1997), “Why Economic Sanctions Do Not Work”, International security 22, 90–136.
Peksen, D. (2019), “When Do Imposed Economic Sanctions Work? A Criti-cal Review of the Sanctions Effectiveness Literature”, Defence and Peace Economics 30, 635–647.
Reta, A. S. (2018), The Impact of International Trade on The Success of Economic Sanctions: A Meta Regression Analysis, International Institute of Social Studies, The Hague.

8
FOCUS
CESifo Forum 4 / 2019 December Volume 20
Seeler, H. J. (1982), “Wirtschaftssanktionen als zweifelhaftes Instrument der Außenpolitik”, Europa-Archiv 37, 611–618.
Van Bergeijk, P. A. G. (1994), Economic Diplomacy, Trade, and Commercial Policy: Positive and Negative Sanctions in a New World Order, Edward Elgar, Cheltenham.
Van Bergeijk, P. A. G. (1995), “The Impact of Economic Sanctions in the 1990s”, The World Economy 18, 443–455.
Van Bergeijk, P. A. G. (ed., 2020), Research Handbook on Economic Sanc-tions, Edward Elgar, Cheltenham.
Van Bergeijk, P. A. G. and S. Lazzaroni (2015), “Macroeconomics of Natural Disasters: Strengths and Weaknesses of Meta-analysis versus Review of Literature”, Risk Analysis 35, 1050–1072.
Van Bergeijk, P. A. G. and M. S. H. Siddiquee (2017), “Biased Sanctions? Methodological Change in Economic Sanctions Reconsidered and Its Implications”, International Interactions 43, 879–893.
Wallensteen, P. (1968), “Characteristics of Economic Sanctions”, Journal of Peace Research 5, 248–267.

9
FOCUS
CESifo Forum 4 / 2019 December Volume 20
Gerald Schneider and Patrick M. WeberBiased, But Surprisingly Effective: Economic Coercion after the Cold War
INTRODUCTION1
Economic sanctions face a major puzzle: senders – i.e., governments and international organizations such as the European Union (EU) and the United Nations (UN) – frequently employ them to elicit concessions from a target, be it an organization or a sovereign state, that is accused of acting against the values of the Western powers or the international community. However, the popularity of restrictive measures among the foreign-policy-making elite does not correspond to the public image that eco-nomic coercion enjoys. In June 2014, only 46 percent of German interviewees supported stronger sanc-tions against Russia (Onderco 2017). This lack of sup-port is likely due to the belief that such an escalation would hurt own interests and that coercive plans were doomed to failure in the first place. An unholy coalition of the far right and far left, often supported by business and trade union leaders, has repeatedly called for a suspension of the sanctions.
This article analyzes the sanction threats and impositions by the EU, the UN, and the US in the period between 1989 and 2015, demonstrating that the popular perception of economic coercion is largely mistaken. We show against the backdrop of high-profile failures that the sanction threats and impositions of the United States and the two Inter-national Governmental Organizations (IGOs) were often striving to achieve the dominant goal of pro-tecting key liberal values such as the protection of free elections and human rights, but that the design of the coercive measures was frequently flawed.
Our analysis focuses on the onset and the effec-tiveness of sanctions. We compare realized and potential sanctions, demonstrating first what we call the ‘double bias’ in the sanction regimes of the three senders. This deficiency can manifest itself in what we dub ‘over-sanctioning’ or ‘under-sanction-ing’. The latter category implies that certain poten-tial targets are punished lightly or not at all despite their misdeed. Over-sanctioning includes cases
1 The authors gratefully acknowledge financial support through the Beethoven scheme of the German Research Foundation (DFG) and the Polish National Science Center (NCN): Project UMO-2014/15/G/HS5/04845, DFG code: 749/15. Schneider would also like to thank the Zeit-Stiftung Ebelin und Gerd Bucerius and the German Marshall Fund for their support through the 2018 Helmut Schmidt fellowship.
Gerald SchneiderUniversity of Konstanz
where a potential target falls victim to a sanction for reasons contradicting the liberal values that the EU, the UN, and the US have defended in the post-Cold War era. This form of bias also represents instances in which the senders exerted economic coercion in an excessive manner that did not match the extent to which other targets were sanctioned by the respec-tive sender because of similar alleged misbehaviors.
We show in a second step that sanctions fre-quently reach their goals. Depending on the measure of effectiveness, economic coercion has worked on average in 30 to 50 percent of all examined cases in the post-Cold War era. The analysis demonstrates that the European Union was more successful with its sanctions than the United States. This is, how-ever, largely a consequence of the ability of the latter sender to coerce targets into the desired change of behavior through a mere sanction threat (Weber and Schneider 2019a). Our analysis also rejects the opti-mistic expectation that targeted sanctions are more effective than traditional coercive measures, such as import or export restrictions. We conclude with a comparison of the success rate of sanctions against other foreign-policy tools and a discussion of how the current excessive usage of restrictive measures will affect the capacity of the EU and the US to issue successful sanctions in the future.
THE TRANSFORMATION OF THE WESTERN SANCTION REGIME
At the height of the Cold War, Thomas C. Schelling sketched the strategic understanding of economic sanctions that still holds today (Schelling 1967). According to the Nobel laureate, sanctions follow the logic of deterrence: a sender tries to convince a target through the threat or the imposition of costly measures to alter its behavior or to abandon a planned action. To be credible, sanctions need, in this perspective, to be costly for both the target and the sender. This strategic nature of economic coer-cion suggests that, in cases where economic inte-gration of the sender and the target is sufficiently large, both sides experience losses after the onset of the arm-twisting attempts. On the other hand, this strategic reasoning contradicts the still widespread perception that economic coercion is ‘stupid’, to quote Helmut Schmidt’s comment on the Western reaction to the annexation of Crimea (Palmer and Spörl 2015). Without a credible threat to hurt one-self in the event of non-compliance, sanctions do not work.
Early sanctions research was quite pessimistic about the success of sanctions. The more recent lit-erature is more optimistic, pointing out that pioneer-ing studies did not take threats into account, which senders frequently issue before the implementation of sanctions (Morgan et al. 2014). This omission often biases estimates of how effective sanctions are.
Patrick M. WeberUniversity of Konstanz

10
FOCUS
CESifo Forum 4 / 2019 December Volume 20
Another line of criticism argues that the human-itarian side effects of sanctions often dwarf the losses that the targeted political leaders have to endure in the wake of economic sanctions. Sensa-tionalist reports about how the sanctions against the regime of Saddam Hussein increased child mortality in Iraq spurred the way for the introduction of what have been called ‘smart sanctions’. These sanctions, which are now referred to in a more modest way as ‘targeted measures’, take aim at a country’s political and economic elites through travel bans, the freez-ing of personal assets, and other costly steps. Recent research shows that such targeted sanctions do not function differently than traditional sanctions, as the targeted governments try to shield their support-ers against economic losses through a shift in public spending and increased subsidies (Ahn and Ludema 2019). Our own studies show that we cannot rule out that the average sanction has adverse humanitar-ian side effects, but that the estimated scale of the negative public health repercussions was relatively small (Schneider and Shevchuk 2019). Since the early 2000s, sanctions have also been increasingly target-ing a country’s financial sector. One exemplary case are the joint sanctions by the EU, the UN, and the US against Iran and its ambition to become a nuclear power, starting in 2006. Sanctions that include finan-cial measures are, however, not necessarily more effective than conventional tools of economic state-craft (Weber and Schneider 2019b).
The three senders on which we focus here issued 325 sanction threats and impositions during the lib-eral era that started in 1989 with the collapse of the Berlin Wall and ended in 2016 with the Brexit refer-endum and the election of the 45th US President. Figure 1 shows how the 209 sanctions that the three senders imposed alone or jointly with each other evolved over time. A sanction threat preceded 148 of these cases – and an additional 116 threats did not result in sanctions being imposed.
Note that the increasing number of ongoing sanctions in the early 2000s is largely a consequence of the attempt by President George W. Bush to pre-vent allies and other states from signing and rati-fying the Rome Statute of the International Crimi-nal Court. This episode indicates that sanctions did not always follow a liberal agenda in the time period under examination. If we compare the official motives of the senders for threatened and imposed sanctions, all senders examined here frequently refer to human rights violations, the development of nuclear weapons, or other offenses against the liberal world order as reasons for the coercive mea-sures. One can broadly differentiate between sanc-tions imposed because of domestic issues within the target state and those imposed because of motives related to international security (e.g., political or mil-itary interventions, territorial disputes, production and proliferation of drugs and weapons, alignment choices, and support of terror organizations). Two out of three sanctions by all senders were imposed because of domestic issues in the target state. If one takes into account the series of US sanctions relating to the formation of the International Crimi-nal Court, half of the imposed US sanctions refer to international issues.
Figure 2 shows the number of threatened and imposed sanctions per sender or combination of senders. The United States relied most frequently on this foreign-policy tool in the 1990s and early 2000s. The US’s superpower status and low internal deci-sion-making costs explain why it was the most fre-quent sender. The US President can initiate sanctions through executive acts, while the European Union needs the consent of all 28 – after Brexit, 27 – mem-ber states. The EU, with its higher decision-making costs, is the second most active sender and also fre-quently builds alliances with the US or the UN.
The sanction profiles of the three senders differ geographically and with regard to the instruments
used. The United States imposed sanctions against countries on all continents during the time period cov-ered in this article. While the EU is also globally active, the supranational organization did not participate in sanction initiatives in Latin America until 2017, when it joined the US in taking coercive measures against Venezuela. The UN, by contrast, is mainly active in sanctioning African countries. However, these sanctions are significantly more severe than the ones imposed by the two other senders because the UN almost never imposes aid Source: Authors' own compilation.
Ongoing Sanctions per Year by the EU, the US, and the UN (1989 to 2015)
© ifo Institute
0
20
40
60
1990 1995 2000 2005 2010 2015
Number of ongoing sanctionsNumber of ongoing EU sanctions
Number of ongoing US sanctionsNumber of ongoing UN sanctions
Figure 1
11
FOCUS
CESifo Forum 4 / 2019 December Volume 20
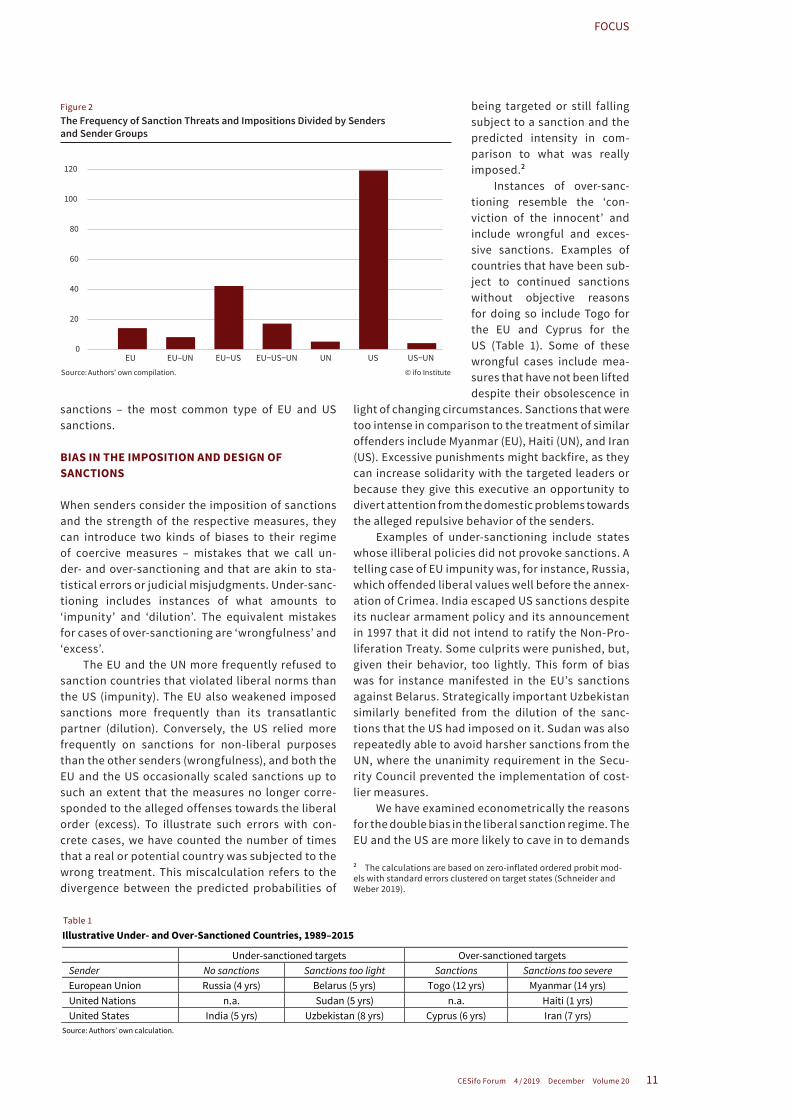
sanctions – the most common type of EU and US sanctions.
BIAS IN THE IMPOSITION AND DESIGN OF SANCTIONS
When senders consider the imposition of sanctions and the strength of the respective measures, they can introduce two kinds of biases to their regime of coercive measures – mistakes that we call un- der- and over-sanctioning and that are akin to sta-tistical errors or judicial misjudgments. Under-sanc-tioning includes instances of what amounts to ‘impunity’ and ‘dilution’. The equivalent mistakes for cases of over-sanctioning are ‘wrongfulness’ and ‘excess’.
The EU and the UN more frequently refused to sanction countries that violated liberal norms than the US (impunity). The EU also weakened imposed sanctions more frequently than its transatlantic partner (dilution). Conversely, the US relied more frequently on sanctions for non-liberal purposes than the other senders (wrongfulness), and both the EU and the US occasionally scaled sanctions up to such an extent that the measures no longer corre-sponded to the alleged offenses towards the liberal order (excess). To illustrate such errors with con-crete cases, we have counted the number of times that a real or potential country was subjected to the wrong treatment. This miscalculation refers to the divergence between the predicted probabilities of
being targeted or still falling subject to a sanction and the predicted intensity in com-parison to what was really imposed.2
Instances of over-sanc-tioning resemble the ‘con-viction of the innocent’ and include wrongful and exces-sive sanctions. Examples of countries that have been sub-ject to continued sanctions without objective reasons for doing so include Togo for the EU and Cyprus for the US (Table 1). Some of these wrongful cases include mea-sures that have not been lifted despite their obsolescence in
light of changing circumstances. Sanctions that were too intense in comparison to the treatment of similar offenders include Myanmar (EU), Haiti (UN), and Iran (US). Excessive punishments might backfire, as they can increase solidarity with the targeted leaders or because they give this executive an opportunity to divert attention from the domestic problems towards the alleged repulsive behavior of the senders.
Examples of under-sanctioning include states whose illiberal policies did not provoke sanctions. A telling case of EU impunity was, for instance, Russia, which offended liberal values well before the annex-ation of Crimea. India escaped US sanctions despite its nuclear armament policy and its announcement in 1997 that it did not intend to ratify the Non-Pro-liferation Treaty. Some culprits were punished, but, given their behavior, too lightly. This form of bias was for instance manifested in the EU’s sanctions against Belarus. Strategically important Uzbekistan similarly benefited from the dilution of the sanc-tions that the US had imposed on it. Sudan was also repeatedly able to avoid harsher sanctions from the UN, where the unanimity requirement in the Secu-rity Council prevented the implementation of cost-lier measures.
We have examined econometrically the reasons for the double bias in the liberal sanction regime. The EU and the US are more likely to cave in to demands
2 The calculations are based on zero-inflated ordered probit mod-els with standard errors clustered on target states (Schneider and Weber 2019).
Source: Authors' own compilation.
The Frequency of Sanction Threats and Impositions Divided by Senders and Sender Groups
© ifo Institute
0
20
40
60
80
100
120
EU EU–UN EU−US EU−US−UN UN US US−UN
Figure 2
Table 1 Illustrative Under- and Over-Sanctioned Countries, 1989–2015
Under-sanctioned targets Over-sanctioned targets Sender No sanctions Sanctions too light Sanctions Sanctions too severe European Union Russia (4 yrs) Belarus (5 yrs) Togo (12 yrs) Myanmar (14 yrs) United Nations n.a. Sudan (5 yrs) n.a. Haiti (1 yrs) United States India (5 yrs) Uzbekistan (8 yrs) Cyprus (6 yrs) Iran (7 yrs)
Source: Authors’ own calculation.
Table 1

12
FOCUS
CESifo Forum 4 / 2019 December Volume 20
for lighter sanctions if there are close economic ties to the target or if the country is economically power-ful. A strong diaspora of the target in the two send-ers, by contrast, increases the chance of forceful economic measures. Although both the EU and the US thus give in to the pressure from powerful lob-bies to scale the sanctions down or up, both senders react more strongly to what we call the ‘objective reasons’ for sanctions. Human rights violations, mil-itary coups, and the latency of a nuclear weapons program are among the offenses of the liberal world order that have increased the chance of economic sanctions in the post-Cold War era.
UNILATERAL SANCTIONS ARE LESS EFFECTIVE
Sanctions are deemed effective in the deterrence logic of Nobel laureate Schelling if the target makes the demanded policy concession. The first quanti-tative assessment of sanctions argued that the scope of the sanctions and thus the senders’ level of ambition should also play a role in these evalu-ations (Hufbauer and Schott 1985; Hufbauer et al. 1990). This reasoning has led to the development of a 16-point scale that considers the product of two four-point scales for policy outcome and sanction contribution. A sanction is considered effective if its score is nine or above. In the period that we examined, the effectiveness of the 209 imposed sanctions was 33 percent. The track record of both the EU and the UN was, at 45.7 percent (81 sanc- tions) and 41.2 percent (34), much better than that of the US, which imposed sanctions in 182 cases and had a success rate of 30.2 percent.
The main reason for this divergence is that the US is more successful with its threats than both the EU and the UN. The Threats and Imposition of Economic Sanctions (TIES) database (Morgan et al. 2014) and the similar EUSANCT Dataset (Weber and Schneider 2019b) also assess threats and their effec-tiveness. Table 2 shows how successful the three senders were with their measures. We distinguish here between unilateral and multilateral measures for the US and the EU. As UN sanctions are by defi-nition multilateral, we differentiate for those cases of economic coercion where the EU or the US issued separate sanctions with an extended scope.
The EU was successful only with four of its 16 uni-lateral sanction threats, and only nine percent of its 67 multilateral warnings to the target reached their goals. An example of a successful threat was against its own member state Croatia, which had planned to protect its citizens against prosecution abroad, but caved in to the demand to drop the planned reform. The UN had a success rate of 22.2 percent with its 45 threats; and 42.9 percent of its 21 sanc-tions together with the EU or the US were success-ful. A successful threat by the UN occurred against Bulgaria: the post-Communist state was among the busters of an arms embargo. The US was successful with 40.7 percent of its unilateral threats, whereas the ratio of successful threats by the US within mul-tilateral teams was about seven percentage points lower.
Both the EU and the US were less success-ful with their unilateral sanctions than with their multilateral ones. Examples of successful multi- lateral efforts where the EU had the lead include the sanctions against Guatemala (1993, HSE score 16), Iran (2006, HSE score 12), and Malawi (1992, HSE score 16). Successful unilateral sanctions of the US were for instance imposed against Bolivia (1991, HSE score 16), Kuwait (1991, HSE score 9), and Laos (1994, HSE score 12). The sanctions in 2002 against tiny Mauritius resulted in the acceptance of a bilateral treaty through which transfers of US persons to the International Criminal Court were prohibited.
CONCLUSION
While the leading role of the United States in the use of sanctions is not surprising, skeptics of the European integration project might be surprised to learn that the supranational organization has es -tablished itself as the second most important sen-der of sanctions. Institutional reforms have enabled the EU to use economic sanctions as a foreign-policy tool and thereby compensate for its lack of military power.
The success rate of economic sanctions that we report is similar to the effectiveness of related for-eign-policy instruments. Mediation efforts in coun-tries suffering political instability were for instance
Table 2 Success Rates of Sanction Threats and Impositions (Number of Cases in Parentheses)
All senders EU EU unilat-eral
UN UN without EU/US
US US unilat-eral
Threats 29.9% (264) 9.0% (67)
25.0% (16)
22.2% (45)
42.9% (21)
33.0% (200) 40.7% (155)
Sanctions 50.7% (209) 63.0% (81)
50.0% (10)
64.7% (34)
75.0% (4)
48.4% (182) 41.3% (109)
All cases 57.5% (325) 61.8% (102) 47.4% (19)
64.9% (57)
61.9% (21)
56.9% (276) 55.4% (195)
Source: Authors’ own calculation.
Table 2

13
FOCUS
CESifo Forum 4 / 2019 December Volume 20
successful in 53.8 percent of all cases examined,3
and another examination shows that roughly 50 per- cent of the US military interventions from 1990 to 2016 fully reached their objectives (Kavanagh et al. 2019).
We acknowledge that the liberal sanction regime that we describe in this article has never been a per-fect one. The occasional misuse of economic power to coerce allies and other nations into a submissive foreign policy and the surprisingly frequent tar- geting of relatively innocent actors certainly con-tribute to the impression in the developing world and elsewhere that economic sanctions often do not aim at the betterment of international affairs. As we have shown, the sanction regime is considerably biased; if a target country is politically or econom-ically important, only minuscule concessions are demanded, if any at all.
Nevertheless, we have also shown that the lib-eral sanction regime was working quite well overall from 1989 to 2015. The higher effectiveness of mul-tilateral measures bodes ill for the unilateral course that the 45th US President pursues. If the EU and the US, after the election of a new President, want to restore their fairly effective sanction regime, they should employ economic coercion neither routinely nor indiscriminately. They should rather reconsider the main insight of Schelling’s conjecture that a sanction policy needs to be credible and that sanc-tion threats and impositions should therefore be designed carefully.
REFERENCES
Ahn, D. P. and R. D. Ludema (2019), “The Sword and the Shield: The Economics of Targeted Sanctions”, CESifo Working Paper 7620.
Hufbauer, G. C. and J. J. Schott (1985), Economic Sanctions Reconsidered: History and Current Policy, Institute for International Economics, Washington DC.
Hufbauer, G. C., J. J. Schott and K. A. Elliott (1990), Economic Sanctions Reconsidered. History and Current Policy, 2nd Edition, Institute for Interna-tional Economics, Washington DC.
Kavanagh, J., B. Frederick, A. Stark, N. Chandler, M. L. Smith, M. Povlock, L. E. Davis, and E. Geist (2019), Characteristics of Successful U.S. Military Interventions, Rand Corporation, Santa Monica.
Morgan, T. C., N. Bapat and Y. Kobayashi (2014), “Threat and Imposition of Economic Sanctions 1945–2005: Updating the TIES Dataset”, Conflict Management and Peace Science 31, 541–558.
Onderco, M. (2017), “Public Support for Coercive Diplomacy: Exploring Public Opinion Data from Ten European Countries”, European Journal of Political Research 56, 401–418.
Palmer, H. and G. Spörl (2015), The Last of His Kind: What Helmut Schmidt Meant to Germany and the World, SPIEGEL ONLINE, https://www.spiegel.de/international/germany/helmut-schmidt-was-a-father-figure-for-ger-many-a-1062438.html.
Regan, P. M. and M. S. Meachum (2014), “Data on Interventions During Periods of Political Instability”, Journal of Peace Research 51, 127–135.
Schelling, T. C. (1967), “The Strategy of Inflicting Costs”, in R. N. McKean, ed., Issues in Defense Economics, Columbia University Press, New York, 105–127.
3 Calculation based on the dataset presented in Regan and Mea-chum (2014).
Schneider, G. and O. Shevchuk (2019), “A Price Worth Paying? Humanitarian Side-Effects of Economic Coercion, 1989 to 2015”, Working Paper, University of Konstanz.
Schneider, G. and P. M. Weber (2019), “If Russia Were in Africa: Analyzing the Double Bias of EU and US Sanctions”, Working Paper, University of Konstanz.
Weber, P. M., and G. Schneider (2019a), “How Many Hands to Make Sanc-tions Work? Comparing EU and US Sanctioning Efforts”, Working Paper, University of Konstanz.
Weber, P. M. and G. Schneider (2019b), “Making the World Safe for Liberalism? Evaluating the Western Sanctions Regime with a New Data-set”, Working Paper, University of Konstanz.

14
FOCUS
CESifo Forum 4 / 2019 December Volume 20
Anders ÅslundWestern Economic Sanctions on Russia over Ukraine, 2014–2019
In comparison with other countries, the United States is particularly keen on economic sanctions, and it is becoming ever more so. In the US foreign policy debate, the point is often made that sanctions are not a foreign policy, only one of many tools. In practice, however, sanctions have become a major feature of US foreign policy. For many years, the United States has been reluctant to expand foreign aid, which has been highly unpopular with the elec-torate. Diplomacy does not have a high standing in the United States. Under George W. Bush, military force dominated foreign policy, resulting in the long and costly wars in Afghanistan and Iraq. After these traditional forms of foreign policy have been found wanting, economic sanctions have gained promi-nence under Presidents Barack Obama and Donald Trump.
For policymakers, economic sanctions have many attractions. No Americans have to be sent abroad and no troops are being killed. Nor do they involve any budget allocations. For a big country with limited foreign trade such as the United States, the cost of sanctions appears small. Thus, sanctions have become the US foreign policy tool of choice. The United States has imposed sanctions on dozens of countries, most severely so against Cuba, North Korea, Iran, Syria, and Venezuela.
As sanctions have proliferated, they have become more specific with regard to aim and means. The purpose of this paper is to investigate the Western sanctions on Russia related to Ukraine. First, why were they imposed and what was their aim? Second, what effects have they had? Which sanctions have been most effective? What prob- lems have arisen? Third, what has Russia’s effect been? Finally, what lessons can be drawn for the future?
SANCTIONS ON RUSSIA OVER UKRAINE
On 18 March 2014 Russia annexed Crimea, swiftly integrating it into Russia. This came as a complete surprise to the West. Military support for Ukraine was never considered an option, but the West felt it had to do something, so it imposed sanctions. Rus-sia offered a special challenge. With an economy roughly three times as large as Iran’s, Russia was the biggest economy the West had sanctioned.
Anders ÅslundAtlantic Council and Georgetown University
In March 2014, the European Union and the United States announced Crimea-related sanctions with visa bans and assets freezes on individuals and companies accused of undermining democracy, misappropriating Ukrainian property, and violating human rights. Gradually both the US and the EU have expanded their sanctions to people responsible for Russian policy on Crimea and enterprises operating there. Ukraine has cut off almost everything − elec-tricity, water, trade, and transportation − isolating Crimea from the outside world.1
A novelty was that the United States sanctioned four of Putin’s cronies, namely Yuri Kovalchuk, Ark-ady and Boris Rotenberg, and Gennady Timchenko, as well as their Bank Rossiya. The EU sanctioned Kovalchuk and Arkady Rotenberg as well, and a fifth crony Nikolai Shamalov, but it has not sanctioned Boris Rotenberg or Gennady Timchenko because they are Finnish citizens. These sanctions were based on the insight that Russia was a kleptocracy. Similarly, sanctions were imposed on enterprises owned by the state or cronies, and only exceptionally on private enterprises.
The aim of the Crimea-related sanctions was primarily to isolate and stalemate Crimea economi-cally, but also to punish the culprits, to stop Russia’s aggression, and to deter Russia from further aggres-sion. Crimea remains utterly isolated, although the common view is that nothing will happen until the Putin regime ends in Moscow. The standard parallel is with the Baltic countries after the Soviet occu-pation of them in 1940, which the United States never recognized, and in 1991 they restored their inde- pendence. Major trade sanctions on commodities such as oil and gas were out of the question, because their effects would be too great on the Western economies.
The Crimea-related sanctions did not deter the Kremlin from proceeding with further aggression in Ukraine. In April 2014, anonymous Russian special forces tried to repeat their success in eastern and southern Ukraine, but unrest took root only in parts of Ukraine’s two easternmost regions of Donetsk and Luhansk. As the Ukrainian military advanced against the Russian-backed forces, Russia sent in regular troops in August.
In response the United States imposed more substantial sectoral sanctions on Russia on 16 July, and the EU did so on 31 July. Most other Western allies − Japan, Canada, Australia, New Zealand, Switzerland and Australia − joined the US-EU sanc-tions but no developing country did. The July 2014 sanctions went much further than the Crimea sanc-tions. They covered three sectors: finance, oil, and defense technology, focusing on large state compa-nies. Also, individuals responsible for Russian policy in the occupied territories and enterprises involved 1 Aleksashenko (2016) offers an excellent and detailed analysis and CRS (2019) provides all the relevant details.

15
FOCUS
CESifo Forum 4 / 2019 December Volume 20
were sanctioned. The financial sanctions prohibit- ed lending to the sanctioned state banks and com-panies for 30 days or more, and the European Bank for Reconstruction and Development was blocked from offering new financing in Russia. The energy sanctions were limited to three kinds of oil devel-opment: deep offshore drilling, arctic offshore, and tight oil. They did not harm production in the short term, but in the long term. The EU insisted that gas must not be subject to any sanctions because of its great dependence on Russian gas (CRS 2019).
The United States coordinated the sanctions over Crimea and Eastern Ukraine with the EU and other allies, reinforcing their impact. After the flood-gates had been opened, the US has imposed one sanction after the other on Russia. In December 2012, the US adopted the Sergey Magnitsky Act for human rights sanctions. It proceeded with sanctions related to Syria and North Korea, and in December 2016 sanctions because of cyber and election inter-ference were imposed. In response to Russia’s use of nerve gas in the United Kingdom, the US imposed new sanctions based on the 1991 Chemical and Bio-logical Weapons Control Act (Fried 2018).
President Barack Obama imposed the Ukraine- related US sanctions through presidential executive orders, which meant that they could be modified at any time. During the election campaign in 2016, Donald Trump repeatedly criticized the US sanctions on Russia, arousing fear that he would actually abol-ish them. Therefore, the US Congress codified these sanctions into law in the Combating America’s Ad -versaries through Sanctions Act (CAATSA), which President Trump signed into law on 2 August, so that the president no longer could alter the Russia sanc-tions without the consent of Congress.
In April 2018, the US Treasury issued its first Ukraine-related sanctions based on CAATSA. They were so severe that they caused a shock. The Trea-sury sanctioned 24 people and 14 enterprises. Most of the people sanctioned were quite close to Putin, in cluding his former son-in-law Kirill Shamalov. Sev-eral big oligarchs were sanctioned, notably Oleg Deripaska. These were designations, meaning that no US person was allowed to do any business with these people or enterprises. Finally, these sanc-tions hit some very big enterprises, notably Deri-paska’s company Rusal, which was a listed company and accounted for 6 percent of global aluminum production.
The sanctions on Russia have not been severe in comparison with those on Cuba, Iran, North Korea, and Venezuela, but they are becoming increasingly more severe. In the summer of 2019, even Russian sovereign debt was sanctioned, though Russia can still use the international bank clearing system SWIFT (Åslund 2019).
None of the Western sanctions is directed against trade. Russia’s dominant exports are oil
and gas, accounting for two-thirds of all Russian ex- ports. If Russian oil had been sanctioned, oil prices would have skyrocketed to the benefit of the Krem-lin. Moreover, the Europeans opposed any sanction on Gazprom. Similarly, Russia’s substantial metal exports were too important to be sanctioned.
EFFECTS ON RUSSIAN POLICY AND ECONOMY
The effects of sanctions are multiple. Did they change Kremlin behavior? What was the economic effect of the sanctions? The Western sanctions were imposed in parallel with the oil price collapse in 2014, which makes it difficult to separate the two impacts.
The Crimea sanctions aimed to isolate Crimea for the foreseeable future, which seems to have been attained. Even big Russian state companies such as Sberbank and VTB refuse to do business in Crimea because of the particularly severe Western sanc-tions on Crimea. Instead, already sanctioned Rus- sian banks and state banks designed for occupied territories have moved in, showing that these sanc-tions are a severe deterrent (Åslund 2018).
The sanctions related to eastern Ukraine had several goals. First and foremost, they were sup-posed to incite the Kremlin to stop the Russian mil-itary offensive, aiming at taking ‘Novorossiya’, the southern and eastern Ukraine, about which Putin spoke so eloquently on 17 April 2014 (Putin 2014). Putin did drop Novorossiya from his speeches, while it was always less probable that the Kremlin would evacuate eastern Ukraine.
Economically, the most important sanctions have been the financial sanctions connected to Rus-sian aggression in eastern Ukraine. Western banks were afraid of being trapped. Even the four big Chinese state banks obeyed the US financial sanc-tions, because they have activities in the United States and all dollars pass through New York, thus being subject to US jurisdiction, allowing the US authorities to impose sizable fines.
The most obvious effect of the financial sanc-tions is the development of the size of Russian total foreign debt. It declined from USD 732 billion in June 2014 to USD 482 billion in June 2019 − that is a re -duction of USD 250 billion or 16 percent of GDP (Cen-tral Bank of Russia 2019). Russian corporations had no choice but to pay off their debt service as it fell due, and they had hardly any possibilities of refinanc-ing. Without sanctions, Russian foreign debt would probably have increased by a similar amount, as was the case in most of the world (Pestova and Mamonov 2019). Thus, the sanctions might have forced Rus-sian entities to forgo investments of up to 32 percent of GDP in the course of five years, or 6.4 percent of GDP a year in investment, which is a lot. The sanctions have also aggravated Russia’s already low credit rating, rendering foreign capital not only scarcer but also more expensive.

16
FOCUS
CESifo Forum 4 / 2019 December Volume 20
In 2015, the IMF assessed the impact: “model- based estimates suggest that sanctions and coun-tersanctions could initially reduce real GDP by 1 to 1.5 percent. Prolonged sanctions could lead to a cumulative output loss over the medium term of up to 9 percent of GDP, as lower capital accumulation and technological transfers weakens already de -clining productivity growth” (IMF 2015, 5). In 2019, the IMF returned to this issue, but with a rather different question and methodology. It noted that Russia’s economic growth decelerated sharply after the global financial crisis, and then even more starting in 2014. The IMF took the low growth rate expected in 2013 and asked why it was even lower. Its analytical work based on economic models found that sanctions accounted for lower growth to the tune of 0.2 percent of GDP, oil prices were responsi-ble for 0.6 percent of GDP, and fiscal, financial, and monetary factors for another 0.4 percent of GDP (IMF 2019). A discussion paper from the Bank of Fin-land Institute for Economies in Transition comes to a similar result but does not quantify it (Pestova and Mamonov 2019).
These studies pose different questions. Orig-inally the IMF had expected higher growth in the future, while in its analysis in 2019, it asked why the prior low growth rate had become even lower. The impact of the lower oil price is not in doubt, but most of the adjustments of fiscal and monetary policy should be seen as the impact of sanctions, forcing the Kremlin to save hard currency at the expense of investments. Therefore, the IMF assessment of 2015 appears more relevant.
By contrast, the cost to the West of the Western sanctions and the Russian countersanctions has been minimal. Russian imports fell sharply in 2014 and 2015, but because of the falling oil price, and the EU has maintained its large market share in Russia of about 45 percent. Plausibly, Gros and Di Salvo (2017) have concluded that the position of Euro-pean exporters in the Russian market has not been infringed because of the EU sanctions. The impact of the Russian countersanctions on agro-food imports from the EU has been minimal. Russian imports of these goods have fallen by about EUR 400 million, which is less than 0.3 percent of EU GDP, while overall EU exports of these goods have increased because of increased sales to other markets.
The sanctions on Russian oil development focus on long-term developments of Arctic and deep off-shore drilling and tight oil and have no immediate or even medium-term impact. The sanctions on defense technology are difficult to evaluate, but neither have a direct economic impact.
The systemic impact is all the more obvious. Sanctions are the opposite of economic integration, making Russia and the West grow apart. Each sanc-tion provokes maintenance sanctions and counter-measures. Both sides protect themselves through
increasing isolation. Businessmen have to calcu-late with sanction risks, credit risks, and eventually with reputational risks. Although Putin’s cronies and state corporations have been singled out for Western sanctions, the sanctions seem to have reinforced the role of both the state and the cronies in the econ-omy, while many bona fide private businessmen flee abroad.
In 2013, before the Western sanctions were ini-tiated, Putin started isolating Russia with ‘deoff-shorization’ and import substitution. Big Russian businessmen face the choice of staying in Russia and reducing their links to the West or selling their assets in Russia and moving to the West. By and large, the elite from the 1990s makes the latter choice, which is reflected in even larger capital flight than before 2014 and minimal foreign direct investment in Russia.
OFFICIAL RUSSIAN REACTIONS
Through his many public statements, Putin has made clear what he thinks of sanctions. He reacted the most against the Magnitsky Act and the West-ern March 2014 sanctions against his close friends, which blocked them from visas, cut them out from the Western financial system, and potentially froze their assets in the West. By contrast, he played down the impact of the sectoral sanctions, and he imposed the countersanctions on food for the Russian people himself.
What really upset Putin was transparency, the release of the Panama Papers on 3 April 2016, which revealed his apparent offshore holdings of at least USD 2 billion through his cellist friend Sergei Roldugin. The eminent Russian journalists Andrei Soldatov and Irina Borogan have recorded the Kremlin response. On 7 April, Putin attacked the journalists who had released the Panama Papers: “what did they do? They manufactured an informa-tion product. They found some of my friends and acquaintances. […] There are many, many people in the background − it is impossible to understand who they are, and there is a close-up photo of your humble servant in the foreground. […] Besides, we now know from Wikileaks that officials and state agencies in the US are behind all this!” (Borogan and Soldatov 2017, 314–319).
When it came to his close friends (Kovalchuk, the Rotenbergs, Timchenko), Putin took it extremely personally. He defended them repeatedly and pas-sionately in public. On 17 April 2014, in his annual phone-in program with the people, Putin took this obviously planted question: “these sanctions hit several major businessmen such as Yury Kovalchuk, Gennady Timchenko, and the Rotenberg brothers. They are rumored to be your personal friends and part of your inner circle and that their fortunes were made thanks to that friendship. […] Don’t you

17
FOCUS
CESifo Forum 4 / 2019 December Volume 20
get the feeling that the main target of the EU sanc- tions is you, personally?” (Putin 2014). Putin stood up for his friends: “it looks as if they are trying to make me the object of these sanctions. As for the people you mentioned, they are indeed my good acquain-tances, my friends. But for the most part they had made their fortunes before we even met. […] Mr. Tim-chenko’s wife had serious surgery and was unable to pay for it because her bank account and credit cards were frozen. This is a flagrant violation of human rights” (Putin 2014).
As a consequence of the European sanctions against Rotenberg, Italy froze luxury properties belonging to Arkady Rotenberg in September 2014. These assets included the Berg Luxury hotel in Rome and properties in Sardinia, which together were valued at USD 36 million (Rudnitsky and Sirletti 2014). The Russian Duma responded by authorizing the Kremlin to seize foreign assets in Russia and use them as compensation for individuals and businesses being hurt by Western sanctions over the Ukraine crisis. This bill was called the ‘Roten-berg Law’ (Kramer 2014). In 2017, Putin signed an alternative Rotenberg Law. The Russian state itself would offer compensation out of the state coffers to Russian individuals who had suffered from Western sanctions. Because of the sanctions Arkady Roten-berg transferred much of his ownership to his son Igor (Chellanova et al. 2014).
Since the Russian economy is so much smaller than the Western economy, Russia cannot respond effectively without hurting itself more. It sanctioned some Western officials, which was of little conse-quence. Russia has imposed one group of serious sanctions, but on its own people. In August 2014, the Kremlin introduced ‘countersanctions’ against food imports from the countries that had imposed sanctions on Russia.2 Many other kinds of sanctions were discussed, such as prohibition of flights over Russian territory, but they were never adopted (Kramer 2014). The Kremlin realized that Russia was the underdog.
For years, Putin denied that the Western sanc-tions cost Russia anything, but on 20 June 2019, in his big annual phone-in program with the Russian people, Putin changed tone and admitted that the Western sanctions were costly to Russia. But he did so in a very strange statement: “Russia fell short by about USD 50 billion as a result of these restrictions during these years, starting in 2014. The European Union lost USD 240 billion, the US USD 17 billion […] and Japan USD 27 billion” (Putin 2019). His vague statement does not clarify what he refers to or for what period, and the numbers make no sense. The only important point is that he agreed that the sanc-tions are costly to Russia.
2 “Putin Extends Russia’s Countersanctions on Western Food”, Radio Free Europe/Radio Liberty, 30 June 2017.
CONCLUSION
Many lessons can be drawn from the Western sanc-tions on Russia. The most obvious conclusion is that these sanctions were feasible and have had great tenacity, while many argued that the Euro-pean Union would break them. However, sanctions tend to be inert. As Russia has not withdrawn from eastern Ukraine, there was no logical ground to end the sanctions (Fried 2019). Although the EU had to renew the sanctions initially every half year and later every year, this has been done ever more eas-ily. Western trade with Russia has declined, mainly because of lower oil prices and thus less Russian exports since 2014, and Russia is so insignificant for Western exporters that the pro-Russian enterprise lobby is not very significant. Russia was not too large to be sanctioned. Nor has Western trade with Russia declined disproportionately.
The general lessons about sanctions are that the more limited and targeted the aim, the more likely the success (Hufbauer et al. 2009). The Crimean sanctions were designed to hold in the long run and to keep Crimea isolated, which remains true. The sanctions related to Russia’s aggression in eastern Ukraine stopped the Russian offensive in July 2014, but they have not persuaded the Kremlin to with-draw from that territory.
Another general lesson is that the broader the alliance behind the sanctions, the more likely they are to succeed (Hufbauer et al. 2009). The US ad -ministration under President Barack Obama was crucially aware of this. Its strong office of sanctions in the State Department pursued high-level co -ordination of the Russia sanctions with the EU and other allies. Without providing any public explana-tion, President Donald Trump abolished the State Department office of sanctions. As a consequence, coordination of sanctions both within the US gov-ernment and with allies was weakened, as sanctions policy was effectively transferred to the Treasury Department (Mortlock and O’Toole 2018). The US Congress distrusts President Trump and has seized more initiative, in particular by adopting the CAATSA in July 2017. The Trump administration has reduced the coordination with allies and the number of uni-lateral US sanctions on Russia has increased. So far this has not broken the sanctions regime, but Trump remains the greatest threat.
After the US sanctioned Rusal in April 2018, the US Treasury appears to have realized that the com-pany was too big to sanction because it caused havoc on the global aluminum and alumina markets. After prolonged negotiations and numerous extensions, the US Treasury finally declared victory and delisted Rusal. The real explanation was that the undesired effects were too great (US Treasury 2019).
For the rest, the design of the sanctions appears to have worked well. As President Putin himself has

18
FOCUS
CESifo Forum 4 / 2019 December Volume 20
emphasized, he is most concerned about his friends and top officials being personally sanctioned. The financial sanctions have obvious and significant effects on Russia’s economic growth. The Kremlin has successfully increased its international currency reserves, but it has done so with considerable cost to the standard of living that has fallen for each of the last five years. The capital outflows from Russia have not slowed down but rather accelerated with the sanctions.
A serious shortcoming of the Russia sanctions, however, is that few assets of sanctioned business-men have actually been frozen. To some extent, this is negligence of national authorities, but the do minant reason is the prevalence of completely anonymous companies. In the UK, the government does not know the owner of 100,000 buildings, and in the United States there are at least two million anonymous companies. In 2018, the EU adopted its Fifth Anti-Money Laundering Directive, which demands that all member countries establish reg-istries with the ultimate beneficiary owners of all companies. In the US, legislation on similar reg-istries to be established with the Financial Crimes Enforcement Network of the US Treasury is currently being considered.
REFERENCES
Aleksashenko, S. (2016), Evaluating Western Sanctions on Russia, Atlantic Council, Washington DC.
Åslund, A. (2018), Kremlin Aggression in Ukraine: The Price Tag, Atlantic Council, 19 March 2018, https://www.atlanticcouncil.org/publications/reports/kremlin-aggression-in-ukraine-the-price-tag.
Åslund, A. (2019), Russia’s Crony Capitalism: The Path from Market Econ-omy to Kleptocracy, Yale University Press, New Haven CT.
Borogan, I. and A. Soldatov (2017), The Red Web: The Struggle Between Russia’s Digital Dictators and the New Online Revolutionaries, PublicAffairs, New York.
Central Bank of Russia (2019), External Debt of the Russian Federation, http://www.cbr.ru/eng/statistics/print.aspx?file=credit_statsistics/debt_an_det_new_e.htm&pid=svs&sid=itm_272.
Chellanova, M., A. Filatov and Y. Fedorov (2014), “Biznes – na detakh”, Vedomosti, 13 October 2014.
Congressional Research Service (CRS, 2019), U.S. Sanctions on Russia, 11 January, Washington DC.
Fried, D. (2018), Hearing on Outside Perspectives on Russia Sanctions: Current Effectiveness and Potential for Next Steps, Committee on Banking, Housing, and Urban Affairs, US Senate, 6 September.
Fried, D. (2019), Lift Sanctions on Russia? Really?, Atlantic Council, 2 August, https://www.atlanticcouncil.org/blogs/new-atlanticist/lift-sanctions-on-russia-really.
Gros, D. and M. Di Salvo (2017), Revisiting Sanctions on Russia and Coun-tersanctions on the EU: The Economic Impact Three Years Later, Center for European Policy Studies, Brussels.
Hufbauer, G. C., J. J. Schott, K. A. Elliott and B. Oegg (2009), Economic Sanctions Re-Considered, Peterson Institute for International Economics, Washington DC.
International Monetary Fund (IMF, 2015), Russian Federation: 2015 Article IV Consultation, Country Report no. 15/211, Washington DC.
International Monetary Fund (IMF, 2019), Russian Federation: 2019 Article IV Consultation, Country Report no. 19/260, Washington DC.
Kramer, A. E. (2014), “Russia Seeks Sanctions Tit for Tat,” New York Times, 8 October.
Mortlock, D. and B. O’Toole (2018), US Sanctions: Using Coercive Economic and Financial Tools Effectively, Atlantic Council Issue Brief, November, Washington DC.
Pestova, A. and M. Mamonov (2019), “Should We Care? The Economic Effects of Financial Sanctions on the Russian Economy”, BOFIT Discussion Paper 13, Bank of Finland Institute for Economies in Transition.
Putin, V. V. (2014), Direct Line with Vladimir Putin, 17 April, www.kremlin.ru.
Putin, V. V. (2019), Direct Line with Vladimir Putin, 20 June, www.kremlin.ru.
Rudnitsky, J. and S. Sirletti (2014), Putin Billionaire’s Assets Frozen in Italy Over Sanctions, Bloomberg, 23 September.
US Department of the Treasury (2019), OFAC Delists En+, Rusal, and EuroSibEnergo, Press release, 27 January, https://home.treasury.gov/news/press-releases/sm592.

19
FOCUS
CESifo Forum 4 / 2019 December Volume 20
Iikka KorhonenEconomic Sanctions on Russia and Their Effects
In 2014 both the European Union member states and the United States introduced a wide variety of eco-nomic sanctions against Russia as a consequence of the illegal annexation of Crimea and for under-mining territorial integrity of Ukraine. They were joined in these actions by e.g., Canada, Norway, and Australia. The first round of sanctions in March 2014 was relatively mild, but the sanctions enacted in July and August 2014 (i.e., after the downing of Malaysian Airlines flight MH-17 with a Russian mis-sile) were more stringent, including restrictions on debt financing for several large Russian companies (Christie 2016). Russia countered fairly soon with its own countersanctions, which ended exports of sev-eral types to foodstuffs from the sanctioning coun-tries to Russia.
This note reviews the recent literature on the economic effects of sanctions on Russia. The emerg-ing consensus seems to be that sanctions have had a detrimental effect on Russia’s economic per-formance during the past years. However, their relative significance pales in comparison with the effects of oil prices on the Russian economy. Sanc-tions seem to have worked mostly through reducing Russian companies’ access to foreign finance (Kor-honen 2019). Also, apparently the relatively recent unilateral sanctions – i.e., sanctions not coordinated with the European Union – by the United States have increased uncertainty related to many Russian companies. This can have adverse economic effects going forward.
Russia’s own countersanctions have also had their economic effects. Food variety in Russia has been reduced and food prices are higher (Volchkova et al. 2018). At the same time, production of some varieties has increased. Russia has also explicitly linked the countersanctions to its general import substitution policy, and even their timing is now different from the EU sanctions, which are renewed every six months. Therefore, it is prudent to assume that even if the EU were to end its sanctions today, Russia’s food import ban would stay in place for a long time (Korhonen et al. 2018).
RATIONALE FOR ECONOMIC SANCTIONS AGAINST RUSSIA
Recent economic sanctions against Russia and some other countries (Syria, Iran, Venezuela, North Korea) have sparked a renewed interest in sanctions as a
Iikka KorhonenThe Bank of Finland Institute for Econo-mies in Transition
tool of foreign policy. Gould-Davies (2018) provides an overview of the issues related to goals and costs of imposing sanctions on a country. In the present context it suffices to reiterate his conclusion on the goals of sanctions against Russia: “[the sanctions’] aim was not to compel Russia to reverse its policy by ending its intervention in Ukraine and returning Crimea. Rather, they were intended to achieve three goals. First, to deter Russia from escalating its mil-itary aggression. Second, to condemn violation of international law and European norms by making clear there could be no normal relationship with the violator. Third, to encourage Russia to agree a po -litical settlement by increasing the costs of its behav-ior” (Gould-Davies 2018).
Also, the relatively narrow scope of sanctions against Russia allows us to conclude that the aim was never to ruin the Russian economy or engineer a significant decrease in the living standards of or -dinary Russians. Therefore, their design is quite different from e.g., sanctions imposed on Iran and North Korea.
It should also be noted that this is perhaps the first time that economic sanctions have been used against such a large and well-integrated part of the global economy. At market exchange rates, Rus-sia’s GDP in 2018 was the world’s 12th largest. It is the world’s largest exporter of natural gas and the world’s largest or second largest exporter of crude oil (depending on Saudi Arabia’s output level). This means that any constraining actions against Russia would also have repercussions outside the country. Russian companies and banks have traditionally been active in global financial markets, etc.
ECONOMIC SANCTIONS AGAINST RUSSIA AND ITS COUNTERSANCTIONS
The initial round of sanctions was relatively mild. It included restrictions on travel, asset freezes, and the proscribing of business dealings with certain in -dividuals and enterprises, including entities based in Crimea and Sevastopol (Korhonen et al. 2018). After the downing of flight MH-17, sanctions were tight-ened considerably in many areas. The export and import of arms was forbidden, as was the export of dual-use goods for military use. Exports of certain types of goods related to oil exploration and produc-tion were also banned.
Most significant perhaps was the curtailing of long-term financing of Russian companies that had no direct involvement with the fighting in Donetsk and Luhansk regions. Investors in the EU and the US were forbidden to provide long-term financing to Sberbank, VTB, Gazprombank, Rosselkhozbank (Russian agricultural bank), and VEB (Russia’s state-owned development bank). Initially, the financing ban applied only to loans with maturities longer than 90 days or equity financing; later, the threshold

20
FOCUS
CESifo Forum 4 / 2019 December Volume 20
was lowered to 30 days. The long-term financing ban was also extended to oil giant Rosneft, oil pipeline company Transneft, oil exploration and refiner Gaz-promneft, as well as several companies operating in the military sector.
Russia reacted to the sanctions imposed by the US and EU in July 2014 by restricting imports of selected food products, including fish, fresh milk and dairy products, and fruits and vegetables (Simola 2014). As mentioned above, these counter-sanctions also fit very well into the overall strategy of import substitution, which had been adopted well before the annexation of Crimea, the war in eastern Ukraine, and the resulting sanctions.
ECONOMIC EFFECTS OF SANCTIONS
In recent years, Russia’s economic performance has not been stellar (Figure 1). Growth decelerated already in 2012 and 2013, even though the price of oil remained high at over USD 100 per barrel. In 2014, Russia’s GDP increased by 0.7 percent, and in 2015 it declined by 2.3 percent. After its recovery, Russia’s GDP growth has continued to trail global economic growth, meaning that Russia’s share in the global economy continues to decline. But how much of this disappointing economic performance can be attributed to sanctions? To answer this question, we need to take note of Russia’s weak economic perfor-mance before the sanctions as well. The answer to this question is further complicated by the develop-ments in the market for crude oil. The price of Urals crude oil declined almost 50 percent between June 2014 and early 2015. As hydrocarbons constitute approximately two-thirds of Russia’s merchandise exports and half of tax intake at the federal level, this price drop was a massive shock to the Russian economy. Oil prices declined further during 2015 before bottoming out in early 2016.
Although there were some relatively immediate assessments of the effects of the sanctions on Rus-sia (Citibank 2015; IMF 2015; Gurvich and Prilepskiy 2015; and World Bank 2015), in this note I shall con-
centrate on more recent studies. These are able to utilize more data from the post-sanctions regime. Furthermore, Russia’s national accounts have been revised, which in some cases has changed annual growth figures quite a bit. For example, Rosstat’s estimate of the GDP drop in 2015, which now stands at − 2.3 percent, also shifted between the first es timate and the final release by more than 1.5 per-centage points, i.e., the Russian economy was much more resilient than originally thought. Such revi-sions naturally make interpretation of the earlier studies and direct comparison to more recent ones difficult.
Table 1 summarizes some very recent papers concerning the macroeconomic effects of sanctions on Russia. First, the IMF (2019) looks at Russia’s growth slowdown between 2014 and 2018 with the help of international macroeconomic models, and concludes that sanctions reduced Russia’s growth rate by 0.2 percentage points every year during that period. However, other factors, including Russia’s own macroeconomic policies, were more import-ant. Low oil prices shaved off approximately 0.7 per-centage points from GDP growth per annum. As was explained above, the oil price effect clearly seems to have a much larger effect on Russia’s economic fortunes.
Second, also Pestova and Mamonov (2019) find that oil prices have been more important in driving Russia’s GDP growth than sanctions. Using a Bayes-ian vector-autoregressive model, they determine that the cumulative effect of sanctions in 2014 and 2015 decreased the Russian GDP by 1.2 percent. They argue that sanctions have worked via reduced investment by Russian companies. Third, Barsegyan (2019) finds using synthetic control method that, on average, Russia’s per capita GDP is 1.5 percent lower between 2014 and 2017 than it would have been with-out sanctions. Sanctions work by e.g., reducing for-eign direct investment.
However, it should be noted that not all papers agree on the effects of sanctions on the Russian economy. Kholodilin and Netšunajev (2019) employ a
structural vector-autoregres-sive model and examine the effects of sanctions on Russia and the euro area. They are much more skeptical about the effects of sanctions on Russian GDP, asserting that any negative effect from sanc-tions likely occurred between mid-2014 and early 2016. Also, it is difficult to ascertain the statistical significance of the effect. However, sanctions have had a clear negative influence on the real effective exchange rate of the ruble.
-15
-10
-5
0
5
10
15
2007 2009 2011 2013 2015 2017 2019Source: Rosstat.
Russia’s GDP Growth
Growth (%, year-on-year)
© ifo Institute
Figure 1

21
FOCUS
CESifo Forum 4 / 2019 December Volume 20
Sanctions have worked through both foreign trade and financing, even though these two avenues also interact. Trade effects can be detected for both Russia and the sanctioning countries. Crozet and Hinz (2019) look at the effect of sanctions on foreign trade between Russia and other countries. They determine that Russia lost some USD 54 billion in exports from the beginning of sanctions to the end of 2015. Western countries imposing sanctions lost approximately USD 42 billion in exports to Russia, with more than 90 percent of this loss borne by the EU countries. Interestingly, most of this reduction in trade happened in goods that neither side had banned. Trade declined perhaps because of reduced availability of finance or greater risk aversion.
Belin and Hanousek (2019) find somewhat smaller trade effects from sanctions than Crozet and Hinz (2019) when they look at the differential effect of the EU and Russian sanctions. Exports from the sanctioning countries to Russia were USD 10.5 bil-lion smaller from mid-2014 to the end of 2016 than in the absence of sanctions, with the effect coming mostly from Russia’s countersanctions.
Cheptea and Gaigné (2018) assess that less than half of the drop in the EU exports to Russia in goods that Russia sanctioned was due to sanctions them-selves. The bulk of the export decline came from a weaker ruble and the decrease in Russian purchas-ing power. This result would again stress the im -portance of the oil price for the general economic performance of Russia and for the purchasing power of Russians.
Fritz et al. (2017) apply a counterfactual analysis based on an econometric model to assess sanctions’ effect on the EU countries’ exports to Rus-sia. They find that EU exports to Russia between 2014 and 2016 were USD 35 billion lower (11 percent lower com-pared to the baseline) than they would have been without the sanctions. In this analysis, the export drop was largest in agricultural goods targeted by Russia’s countersanctions. However, exports declined in
many other categories as well, hinting at the importance of trade finance and its availabil-ity as well as the importance of the price of oil.
As Western sanctions have also targeted individual Russian companies, Ahn and Ludema (2019) ask whether Russian companies under sanctions performed differ-
ently from their peers. Using company-level data they conclude that has indeed been the case. Tar-geted companies have performed poorly relative to other companies with similar characteristics. For example, their operating revenue falls by one-quar-ter and their total assets by approximately one-half in comparison to the control group. Targeted firms have also had to cut staff and face a higher proba-bility of going out of business. This result tells us that economic sanctions can be designed in a way that is detrimental to the targets while allowing other com-panies to operate in a more normal fashion.
One avenue for both company-level and macro effects of sanctions is the availability of finance. Based on many papers discussed in this note, one can surmise that sanctions have worked to reduce investment in Russia. Curtailed availability of foreign financing is most likely one reason for this lackluster investment development.
Figure 2 shows the evolution of Russia’s foreign debt. It is clear that the foreign funding of Russian banks in particular has been affected by financial sanctions. The foreign debt of Russian banks peaked in March 2014 at USD 214 billion, thereafter de- clining to USD 74 billion in September 2019, a reduc-tion of 65 percent. The dominant position of Sber-bank and VTB, which are under sanctions, likely accounts for much of Russia’s decoupling from global capital markets.
An issue that is not often discussed in the public is that, at least for banks, no other source of external financing has been found. While e.g., foreign direct
Table 1 Summary of Recent Studies on the Impact of Sanctions on Russian GDP
Paper Period Effect IMF (2019) 2014–2018 − 0.2 p.p. per annum Pestova and Mamonov (2019)
2014–2015 − 1.2% by the end of 2015
Kholodilin and Netšunajev (2019)
2014–2016 No statistically significant effect
Barsegyan (2019) 2014–2017 Level of per capita GDP on average 1.5% lower
Source: Korhonen (2019).
Table 1
2002 2003 2004 2005 2006 20082007 2010 201220112009 2013 2014 2015 2016 2017 201920180
100
200
300
400
500
600
700
800Banks Other sectors
Russia’s Foreign Debt
Source: Bank of Russia. © ifo Institute
USD bn
Figure 2

22
FOCUS
CESifo Forum 4 / 2019 December Volume 20
investment from China and India into Russia’s energy sector has grown, the Russian banking sector has not found outside debt investors. For many international banks the prospect of being blacklisted by the US Treasury is simply too large a risk to take.
Using partially confidential BIS data, Korhonen and Koskinen (2019) present evidence that net cap-ital flows from the sanctioning countries’ banks to Russia declined by USD 700 million per quarter after sanctions more than capital flows from other coun-tries declined. This confirms the discussion about the lack of outside investors.
CONCLUDING REMARKS
Even though the most recent news from eastern Ukraine is somewhat encouraging, it will most likely take several years for all the stipulations of the Minsk agreement to be met. This also means that the lift-ing of EU and US sanctions is still some ways off. Moreover, the way the United States has introduced many additional sanctions against Russian entities and individuals since 2018 – sometimes almost as if against the wishes of the US president – would lead many to believe that in the immediate future there will be more economic sanctions, not less. This is also true for Russia’s countersanctions. As they are now part of Russia’s more comprehensive import substitution program, it would be quite optimistic to expect them to be lifted anytime soon.
It therefore appears that Russia and its most important trading partner – the European Union – have in many ways become less integrated as a result of Russia’s aggressive foreign policy and violations of international laws. While sanctions have in all likeli-hood helped to deter a further deterioration of the situation in eastern Ukraine, it is currently difficult to be optimistic about a speedy resolution to the crisis.
REFERENCES
Ahn, D. P. and R. D. Ludema (2019), “The Sword and the Shield: The Eco-nomics of Targeted Sanctions”, CESifo Working Paper 7620.
Barsegyan, G. (2019), “Sanctions and Countersanctions: What Did They Do?”, BOFIT Discussion Paper, forthcoming.
Belin, M. and J. Hanousek (2019), “Which Sanctions Matter? Analysis of the EU/Russian Sanctions of 2014”, CEPR Discussion Paper 13549.
Cheptea, A. and C. Gaigné (2018), “Russian Food Embargo and the Lost Trade”, SMART-LERECO Working Paper 18-05.
Christie, E. H. (2016), “The Design and Impact of Western Economic Sanc-tions against Russia”, RUSI Journal 161(3), 52–64.
Citibank (2015), Russia Macro View – Not Too Anxious About Sanctions, https://ir.citi.com/Ns6%2BuSgO5bg45MCK6HCwlUVxbZo5TXkL%2BBrY-Q2S19pKubi3rbFbTU255d6er4oAaBvV4bqrOgYE%3D.
Crozet, M. and J. Hinz (2019), Friendly Fire: The Trade Impact of the Russia Sanctions and Countersanctions, https://matthieucrozet.weebly.com/uploads/6/0/2/7/60271695/sanctionsep.pdf.
Fritz, O., E. Christen, F. Sinabell and J. Hinz (2017). Russia’s and the EU’s Sanctions – Economic and Trade Effects, Compliance, and the Way Forward, European Parliament, Policy Department, Directorate-General for External Policies, http://www.europarl.europa.eu/RegData/etudes/STUD/2017/603847/EXPO_STU(2017)603847_EN.pdf.
Gould-Davies, N. (2018), Economic Effects and Political Impacts: Assessing Western Sanctions on Russia, BOFIT Policy Brief 8/2018.
Gurvich, E. and I. Prilepskyi (2015), “The Impact of Financial Sanctions on the Russian Economy”, Russian Journal of Economics 1, 359–385.
International Monetary Fund (IMF, 2015), Russian Federation – Article IV Staff Report, Washington DC.
International Monetary Fund (IMF, 2019), Russian Federation – Article IV Staff Report, Washington DC.
Kholodilin, K. A. and A. Netšunajev (2019), “Crimea and Punishment: The Impact of Sanctions on Russian Economy and Economies of the Euro Area”, Baltic Journal of Economics 19, 39–51.
Korhonen, I. (2019), Sanctions and Countersanctions – What Are Their Eco-nomic Effects in Russia and Elsewhere?, BOFIT Policy Brief 2/2019.
Korhonen, I. and K. Koskinen (2019), “Did Sanctions Reduce Capital Flows to Russia? Evidence from Bilateral Data”, BOFIT Discussion Paper, forthcoming.
Korhonen, I., H. Simola and L. Solanko (2018), Sanctions, Countersanc-tions, and Russia – Effects on Economy, Trade, and Finance, BOFIT Policy Brief 4/2018.
Pestona, A. and M. Mamonov (2019), “Should We Care? The Economic Effects of Financial Sanctions on the Russian Economy”, BOFIT Discussion Paper 13/2019.
Simola, H. (2014), Russia’s Restrictions on Food Imports, BOFIT Policy Brief 8/2014.
Volchkova, N., P. Kuznetsova and N. Turdeyeva (2018), Losers and Winners of Russian Countersanctions: A Welfare Analysis, FREE Policy Brief, https://freepolicybriefs.org/wp-content/uploads/2018/09/freepolicy-briefs_oct1.pdf.
World Bank (2015), Russia Economic Report 33: The Dawn of a New Eco-nomic Era?, Washington DC, https://www.worldbank.org/en/country/russia/publication/russia-economic-report-33.

23
FOCUS
CESifo Forum 4 / 2019 December Volume 20
John J. Forrer and Kathleen HarringtonThe Trump Administration’s Use of Trade Tariffs as Economic Sanctions
OVERVIEW
The Trump administration’s enthusiasm for eco-nomic sanctions has been reflected in their equally passionate embrace of trade tariffs. Both foreign policy tools have been used to excess well beyond the practices of past administrations. Even most notable is the unprecedented re-purposing of trade tariffs as economic sanctions. Rather than using tariffs as intended by statute to adjust conditions for imports in response to unfair practices with trade partners, the Trump administration has threatened and imposed tariffs to pressure countries to change policies they oppose – the exact rationale behind the use of economic sanctions. The use of trade tar-iffs as economic sanctions raises important ques-tions about the legitimacy and effectiveness of such a practice.
TRUMP ADMINISTRATION’S AGGRESSIVE USE OF ECONOMIC SANCTIONS
The Trump administration’s use of economic sanc-tions is best characterized as aggressive, particularly when compared to previous administrations. Eco-nomic sanctions have become a go-to foreign pol-icy tool to support its ‘America First’ foreign policy strategy. According to the US Treasury Department data, in 2017, the United States placed sanctions on 1,500 people, companies, and entities (Harrell 2019). This is 50 percent more than has ever been added to
John F. ForrerGeorge Washington University
the US Treasury’s Specially Designated Nations and Blocked Persons List (SDN) in any single year, based on an analysis by the law firm Gibson Dunn (2019). The majority of these sanctions were related to nuclear-related sanctions on Iran, enhanced sanc-tions against Russia, and sanctions on Venezuelan people and entities (Gibson Dunn 2019).
The analysis shown in Figure 1 provides a clear visual of the uptick in sanctions during the Trump administration. In the years 2017 through 2018, there is a dramatic increase in additions to the Specially Designated Nations and Blocked Per-son’s list. Compare that sharp sloping increase from 2017–2018 to the ebb-and-flow rhythms that characterized the experience earlier in this century during the Bush administration (2002–2009) and the Obama administration from 2009 to early 2016. Neither the Obama nor Bush administrations made more than 800 additions to the SDN list during their entire tenure, but the Trump administration quickly exceeded the 800 actions cap characteristic of pre-vious administrartions.
Fundamentally, sanctions are a collection of tools designed to inflict economic losses on coun-tries, institutions, and/or individuals sufficient to induce a sought-after change in policy and behav-ior. The US Office of Foreign Assets Control (OFAC) defines sanctions as both broad-based and oriented geographically, which would include the tariffs against countries such as Cuba and Iran, while other forms of sanctions are considered more ‘targeted’. These targeted sanctions are applied in cases of counter-terrorism, counter-narcotics and focus on specific individuals and entities. These programs may encompass broad prohibitions at the country level as well as sanctions directed at specified tar-gets (US Department of the Treasury 2018). Sanc-tions are one of many government tools available to further specified national security and foreign policy goals.
In addition to a disproportionate reliance on economic sanctions as the favored foreign pol-icy tool, there has been enhanced use of second-
ary sanctions by the Trump administration. Secondary sanctions are a tool designed to push foreign countries, companies, and individuals into halting business dealings with countries and entities on which primary economic sanctions have been imposed (Harrell 2019). This aggressive push is evident in countries such as Venezuela, where US National Security Advi-sor John Bolton threatened sweeping bans on companies and individuals attempting to
Kathleen HarringtonGeorge Washington University
0
200
400
600
800
1000
1200
1400
1600
2001 2002 2003 2004 2005 2006 2007 2008 2009 2010 2011 2012 2013 2014 2015 2016 2017 2018
ᵃ US Treasury’s Specially Designated Nations and Blocked Persons List .Source: Gibsondunn.com; US Department of the Treasury.
Additions to the SDN List ᵃ by Year
Number of newly sanctioned parties
© ifo Institute
Bush Obama Trump
Figure 1

24
FOCUS
CESifo Forum 4 / 2019 December Volume 20
conduct business in Venezu-ela; bans that applied across hundreds of companies and individuals (Goodman and Smith 2019). The broad scope of secondary sanctions, such as those applied to Venezuela, cause significant fringe dam-age to allied countries such as Spain and France, countries who still have oil and avia-tion companies operating in Venezuela. Or the threats of secondary sanctions against every country that conducted commerce with Iran following the US abrogation of their par-ticipation in the Joint Comprehensive Plan of Action (JCPOA) − see also Calamur (2018).
The Trump administration’s liberal use of pri-mary and secondary sanctions is a tool to compel others to adhere to US national security and for-eign policy goals. The Trump administration’s cor-responding aggressive use of trade tariffs has lured what has been a clear distinction between sanctions as applied through the US Treasury Department and tariffs pushed forward through the United States Trade Representative (USTR) and the US Department of Commerce. Employing these two separate for-eign policy tools as one in the same raises question: should tariffs and sanctions be used in a similar way and with similar justifications, and if they are being used in similar ways, what effect might the dual-use purpose of these foreign tools have on effectiveness of US foreign policy?
USE OF SANCTIONS AND TRADE TARIFFS
Similar to its expansive use of economic sanctions, the Trump administration has also imposed trade tariffs on allies and adversaries at an alarming rate. USTR has announced not only more tariffs in terms of volume of products globally, but the executive body has also applied tariffs at a higher percentage level (Office of the United States Trade Representative 2019). A more specific example of this ramping up of tariffs is exemplified through the tar-iffs imposed on China. The Peterson Institute for Interna-tional Economics developed two graphics to showcase the ramp-up of the China tariffs.
Figure 2 highlights the increased percentage of the tariff rate threatened by the Trump administration
throughout the year. Increasing how much a prod-uct is taxed is one method of using tariffs aggres-sively, and China’s exports into the United States were threatened by increasingly high percentages of tariff tax rates. Along a similar vein, Figure 3 highlights the percentage of US imports from China subject to special US trade protection. The United States has maintained a special protection tariff towards China since the 1980’s, but this figure high-lights how much more expansive this special tariff protection has become in the Trump administration (Bown and Zhang 2019b). In essence, the admin-istration is threatening to apply the special tariff protection on more products being imported from China. Both the percentage rate of the tariff and the amount of imports affected by the tariffs have are markedly higher, revealing an aggressive use of tar-iffs. Threatened tariff rates and volumes are used by the Trump administration as leverage points to further an ‘American first’ economic policy, and in response to China’s unfair trade practices related to the forced transfer of American technology and intellectual property (Office of the United States Trade Representative 2019).
In their use of tariffs against China and in numer-ous other instances, the Trump administration
0
5
10
15
20
25
30
2017 2018 10 May 2019 1 September2019
1 October2019
15 December2019
Section 301 Aluminum Steel
Washer Solar 2017
Source: Based on data from Bown (2019); author’s calculation.
US Average Tariffs on Imports from China
© ifo Institute
%
3.1%
12.0%
17.6%
21.0%
23.8%26.6%
Figure 2
0
10
20
30
40
50
1980 1985 1990 1995 2000 2005 2010 2015
Other Electronics and electrical machineryPlastics MetalsTextiles and apparel
Source: Bown and Zhang (2019b).
US Imports from China Covered by Special Protection by Sector 1980–2018
© ifo Institute
%
Pre-WTO Post-WTO accession
Figure 3

25
FOCUS
CESifo Forum 4 / 2019 December Volume 20
flaunts trade tariffs as a foreign policy tool used for similar purposes as economic sanction. The use of tariffs as economic sanctions raises serious ques-tions about the statutory authority and indented goals of this familiar foreign policy tool. Evidence of the Trump administration’s sanctions-like use of tariffs is best demonstrated through the tariff taxes applied on Turkey. The ‘Turkey tariffs’ highlight the increasingly nebulous and nefarious roles tariffs play in the administration’s foreign policy. The first of the tariffs affecting Turkey began on 8 March 2018, when President Trump issued a Presidential Proclamation to impose an overall 25-percent ad valorem tax on steel articles imported to the United States from abroad (The White House 2018a). This was applied broadly, across a number of countries.
However, a second presidential proclamation was issued a few months later, on 10 August 2018. This proclamation set to adjust imports of steel into the US, but this time, the proclamation was target-ing specific countries. This second proclamation (the August 10 proclamation) had the stated and legally authorized goal of increasing domestic capacity uti-lization and ensuring the viability of the domestic steel industry (The White House 2018b). The Procla-mation investigation conducted by the US Depart-ment of Commerce recommended that a tariff be applied on certain countries, and Turkey was specif-ically targeted. Turkey is one of the major exporters of steel for domestic use in the United States. Using executive authority granted through Section 232 of the Trade Expansion Act of 1962,1 the tariff levels determined in this August 10 proclamation went into effect. The United States imposed a 50-percent ad valorem tariff rate on steel articles imported from Turkey, a dramatic doubling of the previous 25-per-cent tariff imposed in March.
The tariffs on Turkey illustrate their creep into the realm of sanctions. The tariffs have an under-pinning justification of national security, a terri-tory typically reserved for sanctions. Invoking the national security clause of the Trade Expansion Act to justify sanctions on Turkey is not credible and it is clear the tariffs were imposed to cause economic hardship on Turkey. Also, the messaging surround-ing these tariffs also was more aligned with the fur-therance of foreign policy goals typically befitting a sanction. External messaging through social media outlets such as Twitter explicitly stated that the tar-iff was punishment on Turkish political actions. An August 16, 2018 tweet from Donald Trump’s handle @realDonaldTrump proclaimed the ad valorem tar-iffs imposed just six days before were a reaction to Turkey’s detainment of Pastor Andrew Brunson, a major foreign policy concern happening at the same time. The tweet states “we will pay nothing for the release of an innocent man, but we are cutting back 1 See Public Law 87-794-Oct. 11, 1962, https://www.gpo.gov/fdsys/pkg/STATUTE-76/pdf/STATUTE-76-Pg872.pdf.
on Turkey!” ‘Cutting back’ signals the effects of the ad valorem tax: reducing Turkish steel imports by the United States. Such a justification was absent from the official Presidential Proclamations announcing the tariffs.
Around this same time, in early August the US Treasury Department’s Office of Foreign Assets Con-trol imposed sanctions targeting two Turkish offi-cials, Minister of Justice Abdulhamit Gul and Minister of Interior Suleyman Soylu, for their role in the arrest and detention of Pastor Brunson. These sanctions had the explicit goal of forcefully expressing the US’ position that Brunson’s continued prosecution was wrongful (US Department of the Treasury 2018). The tariffs and sanctions imposed upon Turkey had sig-nificant overlap both in timing and intent, and again, highlight the heavy use of both policy tools by the Trump administration, but also the significant cross-over of the role of tariffs.
TRADE TARIFFS AS ECONOMIC SANCTIONS: A GOOD OR BAD IDEA?2
The basic justification for economic sanctions is that economic losses that are sufficiently painful will con-vince another country to change a policy objected to by the sending country. At the same time, countries’ vulnerability to economic sanctions vary widely, and may have many viable options that help them evade the actual effects of an economic sanction. At the heart of a successful economic sanctions pol-icy is knowing (i) how much economic suffering is required to compel the target country to yield and make the sought after change in policy; and (ii) an ability to implement sanctions in such a way that results in real economic losses commensurate with the planned level of losses (Forrer 2017).
The determination of the success of economic sanctions is problematic. Research on economic sanction episodes throughout history have struggled to make a definitive case on the role played by eco-nomic sanctions in determining the outcomes of the events (Hufbauer et al. 2007; Askari et al. 2003). Once imposed, as long as the offending policy remains intact, sanctions could be viewed as a failed effort. If sanctions are removed before the policy has been revoked, claims of failure or premature action could be offered. And if the policy targeted by sanctions is revoked, sanctions can be highlighted as the reason for the change, even if other factors caused the pol-icy change. As in all situations, ‘sanctions don’t work until they do’.
The cost-effectiveness of economic sanctions is more easily assessed. Economic sanctions cause
2 The terms trade tariffs and economic sanctions tend to be used interchangeably as both a tool of foreign policy – a foreign policy strategy – and a legal action taken based on an authority granted to a government agency. Our discussion on trade tariffs as economic sanctions addresses the first sense of the terms largely unanticipat-ed by the second sense.

26
FOCUS
CESifo Forum 4 / 2019 December Volume 20
intended and anticipated economic losses to govern-ment agencies, firms, and individuals in the sending and target countries. Innocent communities also suf-fer economic (and personal) losses due to economic sanctions. Since all these losses can be estimated, an assessment could be made as to whether the value of a change in the offending policy is worth the losses suffered by all parties. It also opens up for consid-eration the question of whether an alternative to economic sanctions would be more cost-effective in achieving the foreign policy goal.
In the context of economic sanctions, trade tariffs might be seen as simply ‘economic sanc-tions-lite’: rather than banning a specific economic activity, trade tariffs have the effect of raising prices on designate products and services, and thereby discouraging their purchase. But economic sanc-tions can be designed with great nuance relating to the level of economic loses and who bears those loses. In practice, trade tariffs do not enhance the capacities of a country to stylize sanctions to have the desired effects. In addition, trade tariffs suffer from the same set of design and enforcement chal-lenges faced by economic sanctions that limit their effectiveness:
‒ Limited enforcement capacities‒ Smuggling‒ Fraud‒ Evasion‒ Re-exporting
Trade tariffs offer no more advantages over eco-nomic sanctions as the legal instruments used to inflict economic losses on countries in an effort to change their policies. But using trade tariffs as eco-nomic sanctions does pervert the established public policy justification for imposing any trade tariff, and thereby undermines public accountability of govern-ment actions taken to pursue foreign policy goals.
Placing a tariff on exports from another country raises the price on those goods and services to the consumers in the country imposing the tariffs. The tariff can be in the form of a fixed fee or percentage of the cost per item. The resultant price increase gives an economic advantage to domestic firms compared to foreign exporting firms. Such a market interven-tion through the use of trade tariffs that are justified by very specific conditions has specific rationales behind this approach.
The adoption of a trade tariff against specific goods and services requires that a finding be con-ducted that shows evidence of unfair trade practices. Such a finding not only justifies the adoption from a public policy perspective, but the analysis of the trade practices in question provides valuable infor-mation to determine the form of the remediate trade tariff. At their core, trade tariffs are justified by cor-recting an unfair trade relationship between coun-
tries. The scope and scale of the tariff – to accomplish that goal – must be tailored to the specific situation. Trade tariffs are by design intended to correct – or at a minimum remediate – trade relationships that impose an unfair condition on a country. Trade tariffs are justified due to their ability to claim that it is solv-ing an existing problem and making it ‘right’.
Alternatively, economic sanctions are justified by the argument that suffering experienced by the sanctioned country is sufficient to persuade it to alter the offending policy in question. It is recog-nized that economic pain on innocents will result in both the sanctioning and target countries, but the importance of achieving the foreign policy in ques-tion should account for this unavoidable collateral as part of the price paid when using an economic sanc-tion. Economic sanctions are justified by pressuring other countries to adopt desired policies.
But to make matters worse, trade tariffs have become the easiest ‘path of least resistance’ for the Trump administration to adopt foreign policies. In the Trump administration, trade tariffs have become the ‘poor person’s’ economic sanctions. Relying on a clause that allows trade tariffs to be invoked at the discretion of the President, trade tariffs allow a path of least resistance to placing economic sanc-tions-like activity on countries in dispute with the US, but not necessarily involving trade issues.
CONCLUSION
The use of trade tariffs to impose economic sanc-tions on other countries may be consistent with the Trump administration campaign of assailing US trade agreements as unfair, and providing a political jus-tification for using trade tariffs as the best remedy, and impinging on the territory of economic sanc-tions. But the conventional policy justification for using trade tariffs as economic sanctions has been circumvented, undermining public accountability for the actions taken by the government and their effectiveness. Any administration that intends to continue using tariffs as a ‘sanction-lite’ tool should have their use clarified and codified in a revision of existing legislative authority. A legislation change would ideally bring more statutory clarity defining the two economic tools (sanctions and tariffs) and could set a foundation for a more accountable for-eign policy approach by and across government agencies. Greater clarity on the boundaries of trade tariffs to advance purposeful US foreign policy would be an available step in that direction.
REFERENCES
Askari, H. G, J. Forrer, H. Teegen and J. Yang (2003), Case Studies of U.S. Economic Sanctions – The Chinese, Cuban, and Iranian Experience, Praeger Publishers, Westport CT.
Bown, C. P. (2019), US-China Trade War: The Guns of August, Peterson Institute for International Economics, 20 September,

27
FOCUS
CESifo Forum 4 / 2019 December Volume 20
https://www.piie.com/blogs/trade-and-investment-policy-watch/us-china-trade-war-guns-august.
Bown, C. P. and E. Zhang, (2019a), Trump’s Trade War against China Covers Historically Huge Amount of Imports, Peterson Institute for Inter-national Economics, 1 May, https://www.piie.com/research/piie-charts/trumps-trade-war-against-china-covers-historically-huge-amount-imports.
Bown, C. P. and E. Zhang (2019b), Trump’s 2019 Protection Could Push China Back to Smoot-Hawley Tariff Levels, 14 May, Peterson Institute for International Economics, https://www.piie.com/blogs/trade-and-investment-policy-watch/trumps-2019-protection-could-push-china-back-smoot-hawley.
Calamur, K. (2018), “Trump Goes from Threatening Iran to Threatening the World”, The Atlantic Magazine, 7 August, https://www.theatlantic.com/international/archive/2018/08/trump-iran-tweet/566948/.
Forrer, J. (2017), Aligning Economic Sanctions, Atlantic Council Issue Brief, 19 October.
Gibson Dunn (2019), 2018 Year-End Sanctions Update, 11 February, https://www.gibsondunn.com/2018-year-end-sanctions-update/.
Goodman, J. and S. Smith (2019), “Bolton Warns Foreigners That Violate Venezuelan Asset Freeze”, AP News, 6 August, https://apnews.com/7314263d68924c2990e52f1ff1ea99d8.
Harrell, P. E. (2019), “Trump’s Use of Sanctions Is Nothing Like Obama’s”, Foreign Policy Magazine, 5 October, https://foreignpolicy.com/2019/10/05/trump-sanctions-iran-venezuela-russia-north-korea-different-obamas/.
Hufbauer, G. C., J. J. Schott, K. A. Elliott and B. Oegg (2007), Economic Sanctions Reconsidered: Case Studies of U.S. Economic Sanctions, Peterson Institute for International Economics, Washington DC.
Office of the United States Trade Representative (2019), USTR Issues Tariffs on Chinese Products in Response to Unfair Trade Practices, Press Releases, 15 June, https://ustr.gov/about-us/policy-offices/press-office/press-releases/2018/june/ustr-issues-tariffs-chinese-products.
The White House (2018a), Presidential Proclamation Adjusting Imports of Steel into the United States, Press Releases, 8 March, https://www.whitehouse.gov/presidential-actions/presidential-proclamation-adjusting-imports-steel-united-states/.
The White House (2018b), Presidential Proclamation Adjusting Imports of Steel into the United States, Press Releases, 10 August, https://www.whitehouse.gov/presidential-actions/presidential-proclamation-adjusting-imports-steel-united-states-5/.
Trump, D. (@realDonald Trump, 2018), Tweet, 1 August at 4:30 pm, https://twitter.com/realdonaldtrump/status/1030235363258851328?lang=en.
US Department of the Treasury (2018a), Resource Center: Financial Sanc-tions, https://www.treasury.gov/resource-center/sanctions/Programs/Pages/faq_10_page.aspx.
US Department of the Treasury (2018b), Treasury Sanctions Turkish Officials with Leading Roles in Unjust Detention of U.S. Pastor Andrew Brunson, Press Releases, 1 August, https://home.treasury.gov/news/press-releases/sm453.

28
FOCUS
CESifo Forum 4 / 2019 December Volume 20
Christian von SoestIndividual Sanctions: Toward a New Research Agenda
INTRODUCTION
Individual sanctions are an important subcategory of economic sanctions, and an inextricable part of the global security and human rights regime that has informed international and national politics since the end of the Cold War. Shaping the international trend of individualizing accountability (Sikkink 2009), the United Nations, the United States, and the European Union, as the main global sanction senders, blacklist individuals to hold them accountable for the proliferation of weapons of mass destruction (WMDs), the instigation of armed conflict, the trafficking of narcotics, or the violation of human rights.
In all its current 14 sanctions regimes, the UN has blocked the travels and frozen the assets of purported perpetrators (Biersteker et al. 2016). The US for its part has implemented a list of ‘Specially Designated Nationals and Blocked Persons’ since 1994, which has grown tremendously over the years and presently contains over 1,200 pages of designated individuals and companies. Recently, an undersecretary of the US Treasury dubbed its Office of Foreign Assets Control (OFAC), which is responsible for blacklisting, “the beating heart of US sanctions authorities […] to change behavior, disrupt illicit finance, and advance foreign policy priorities across the globe” (Mandelker 2019). Even the EU, which only started to impose sanctions autonomously in 2004, now runs a consolidated sanctions list that comprises almost 500 pages of listed persons and entities (as of November 2019).
However, we still lack fundamental knowledge about the selection criteria and indeed the effects of this important subcategory of economic sanctions. In response, this article sets out to provide the basis for a new research agenda that focuses on the specificities of individual sanctions.
THE MOVE TOWARD INDIVIDUAL ACCOUNTABILITY
The emerging international human rights regime of moving from state responsibility to the individual (criminal) accountability of rulers for crimes that they commit while in office has, in tandem with the 9/11 terrorist attacks, acted as a major boost for sanctions targeting specific individuals. They also appear more humane alternatives to comprehensive sanctions that fall on the entire population of a targeted country. Following Wallensteen and Grusell
Christian von SoestGIGA German Institute of Global and Area Studies, Hamburg
(2012, 208), “[t]he idea of targeting sanctions at individuals not only was an innovative way for making sanctions legitimate in the international system. […] It was morally appealing to demonstrate that decisionmakers were not personally exempt from the impact and reactions that their policies were causing”.
The main idea is to impose personal costs that coerce listed decisionmakers, terrorists, or regime supporters into changing their behavior, to constrain their room for maneuver, or simply to send signals of disapproval to them – as well as to an international and domestic audience (Giumelli 2013). However, the use of these individual sanctions varies considerably: while in the Central African Republic, for instance, grave human rights violations and atrocities resulted in only 13 individuals being put on blacklists, the US and the EU designated more than 200 highlevel Zimbabwean decisionmakers – including former president Robert Mugabe and almost all government ministers – to protest electoral manipulation in that country. Even though scholars and practitioners alike deem sanctions that target top decisionmakers most effective in changing the policies in question, as well as in sending strong signals about international norms, only rarely are presidents blacklisted. Currently, just Venezuela’s Nicolás Maduro and Syria’s Bashar alAssad have asset freezes and travel bans imposed on them, while other heads of government who have committed the same or even more egregious human rights violations are not targeted by the UN, the US, or the EU. What accounts for these vast differences? As of now, we are unable to systematically explain this variance in the selection of individual sanctions targets.
Important analyses that focus on the ethical and legal implications of individual sanctions listings do not contain comprehensive scrutiny of the number and characteristics of designated individuals. The same holds true for assessments – most often from a legal perspective – of judicial challenges to individual designations, most notably the 2008 Kadi case heard before the European Court of Justice (Kokott and Sobotta 2012), and regarding the rights of listed persons (for example, Heupel 2013). Thus, despite their ubiquitous use and the emergence of an intense debate about the legal and normative implications of imposing individual sanctions, we still know little about how and why the UN and Western powers target specific individuals. Nor are we sufficiently aware of what effects – intended and unintended – indi vidual sanctions (in conjunction with more comprehensive economic sanctions) have.
Academics and practitioners seeking to gain new insights about the targeting and the effects of sanctions therefore need to focus on individual sanctions as an important subcategory of the overall phenomenon. Currently, even the existing empirical

29
FOCUS
CESifo Forum 4 / 2019 December Volume 20
work on targeted sanctions (Biersteker et al. 2016) bundles together different measures – namely, those against specific economic sectors and those against individuals – instead of looking at the specific characteristics, logic, and processes underlying the sanctioning of individuals (Figure 1).
Systematically analyzing the number of blacklisted individuals and their proximity to political decision-making in the target country would allow for the detailed examination of UN, US, and EU listings. Only if we better understand these selection processes can we say more about whether and how individual sanctions actually work (Hufbauer et al. 2007; Pape 1997).
ANALYZING THE TARGETING OF INDIVIDUAL SANCTIONS
When a decision to impose travel bans and asset freezes is made, decisionmakers in the UN, the US, and the EU choose how many and which persons they target. The blacklisting decisions comprise two dimensions that need to be assessed: (1) the number of blacklisted individuals, and (2) their closeness to political decisionmaking in the target country (the ‘position’).
A New Analytic Framework
From the research on comprehensive and targeted sanctions, we can infer that the choice to impose individual sanctions is strategic, and determined by a complex combination of threat perceptions, domestic and international pressures, and rela tionships with the target (Nossal 1994; von Soest and Wahman 2015). Sanction senders weigh the potential benefits of achieving their goals through individual sanctions against their political/securityre lated, social, and economic costs. To account for the decisionmaking process in the UN, the US, and the EU, sanctions research should take into consideration four crucial dimensions that together all potentially shape the decision to blacklist individuals: trigger events, issue salience, sendertar
get relations, and sender characteristics.
Trigger Events
The pressure to sanction individuals will be especially strong when drastic trigger events – such as the killing of the Saudi Arabian regime critic Jamal Khashoggi in 2018, or the annexation of Crimea by Russian forces in 2014 – draw global attention and provide justification for
foreign intervention. Terrorist attacks or successful coups d’état (Powell and Thyne 2011) are further blatant signals to the international arena that global peace and security are being threatened, and human rights and democratic norms violated (Peksen et al. 2014). In these instances, we would expect to see particularly decisive action taken against the involved individuals by the UN, the US, and the EU.
Issue Salience
The readiness to impose individual sanctions also depends on the nature of the ‘disputed policy’ (Dorussen and Mo 2001) – as seen from the perspective of the senders. The UN, the US, and the EU will be particularly inclined to impose sanctions on in dividuals who directly threaten their direct interests and/or who are characterized as ‘a threat to in ternational peace and security’ (United Nations 1945). Ending the proliferation of WMDs, terminating armed conflict, and countering terrorism will therefore be particularly salient goals that from the perspective of senders necessitate the imposition of sanctions on – potentially – responsible individuals, be they the politically responsible decisionmakers, members of the security apparatus, the engineers needed to construct nuclear facilities, or arms dealers. Addressing issues such as money laundering and drug trafficking also have direct repercussions for sanctionsending entities.
Sender-target Relations
Senders take geostrategic reasoning as well as their political and economic costs into consideration when deciding how many and which individuals to target. The senders’ potential costs for issuing sanctions vary greatly depending on (a) the existing political, military, economic, and social relations between sender and target; as well as (b) the target’s political strength and standing within the global economy. In the economic realm, earlier research emphasized the importance of trade links
Source: Author’s own compilation.
Comprehensive, Targeted, and Individual Sanctions
© ifo Institute
Comprehensive sanctions
Complete trade embargo
Affects the whole population
Targeted sanctions
Selective sanctions
Affect certaineconomic sectors and social groups
Individual sanctions
Affect selected individuals – e.g., members of the poli-tical elite
Figure 1

30
FOCUS
CESifo Forum 4 / 2019 December Volume 20
(McLean and Whang 2010) and foreign direct investment (Lektzian and Biglaiser 2013). This calculation should also influence the propensity to sanction (highranking) in dividuals from particular countries, most notably the president and members of their cabinet – as powerful states could retaliate. A prominent example are the agricultural sanctions that Russia imposed in response to Western measures in 2014 (Timofeev 2018). Western senders might also be reluctant to target top policymakers and a high number of individuals from regimes that are generally supportive of Western security and broader political objectives.
Sender Characteristics
Despite exhibiting similar basic threat perceptions and issue salience considerations, the three main global sanction senders – the UN, the US, and the EU – differ in terms of their (a) basic goals and (b) in ternal coherence, both of which influence their blacklisting behavior. Most fundamentally, we can expect more decisive individual sanctions listing (in terms of the number and position of blacklisted in dividuals) the greater the sender’s internal coherence is.
‒ The UN is the prime international body seeking to guarantee international peace and security. General listing decisions are made by the Unit ed Nations Security Council (UNSC), “a highly politicized body” (Biersteker et al. 2016, 15) that is dominated by its five permanent (P5) mem bers: China, France, Russia, the United Kingdom, and the US. As the P5 have diverging geostrategic interests and norms (with Russia and China generally being more ‘sanction skeptical’), UNSC members will generally agree only on the ‘lowest common denominator’ and target only in dividuals whose sanctioning is acceptable to all P5 members.
‒ Compared to the UN and the US, the EU is a new autonomous sanction sender. The ‘Basic Principles on the Use of Restrictive Measures (Sanctions)’ (European Union 2004) established the Union’s own sanctions policy. Within the Union’s complex legal framework, most sanctions are issued under its Common Foreign and Security Policy – which requires unanimity between all 28 (at the time of writing) member states for moving forward with its main decisions. Nevertheless, the EU has sought to swiftly react to transgressions and target responsible individuals. In addition, in line with its selfunderstanding as a union of liberal values, the EU
has recurrently used its restrictive measures to strengthen human rights and democracy abroad.
‒ The US is by far the most coherent and active global sanction sender. Not only is it a key sponsor of UN sanctions but it also regularly applies unilateral individual (and comprehensive) ones too—that is, without the authorization of the UNSC. Since the 9/11 terrorist attacks, the US has entered into a ‘new era of financial warfare’ (Zarate 2013) and systematically uses the country’s dominant position within the global fi nancial system to block the funding of state and nonstate actors whom it perceives as a threat to its security interests. In addition, the US regularly undertakes unilateral action for international democracy and human rights promotion. Since the passing of the 2012 Magnitsky Act, the US even has a special law that requires the gov ernment to freeze the assets of pur ported human rights offenders and ban them from entering the countr y. Fur thermore, assistance must automatically be terminated in the event of a coup or with evidence of nuclear proliferation (Miller 2014). As the US is the most coherent actor, and also the one least constrained by due process concerns, the number of individuals targeted by it is significantly higher than by the UN or the EU.
Figure 2 below summarizes the four main factors that influence senders’ decision to blacklist an individual, ones that should hence be analyzed closely in future research.
Steps to Overcome the Research Lacunae
The research agenda on individual sanctions can guide both largeN and smallN investigations on the topic. In recent years, the availability of digital trace data (often termed ‘big data’) has massively expanded, as has the possibility to automatically extract and systematically analyze this data with the help of computer processing. As the UN, the US, and the EU provide their blacklists in machinereadable formats on their websites, these could be used for the compilation of new data on individual sanctions targeting as well as for statistical analyses assessing the blacklisting of individuals. The individual entries could be linked to the legal documents that provide
Source: Author’s own compilation.
Summary of Main Factors Influencing Blacklisting Decisions
© ifo Institute
Trigger eventsIssue salienceSender-target relationsSender characteristics
Number of listed individualsPosition of listed individuals
Figure 2

31
FOCUS
CESifo Forum 4 / 2019 December Volume 20
the sanctions goal – meaning the reason why a specific individual was blacklisted.
Based on the considerations presented in this article, qualitative analysis would allow us to re construct in greater detail the complex decisionmaking processes that drive listing strategies. Semistructured interviews could be used to assess the considerations and perspectives of decisionmakers and administrators underpinning the listing strategies of the UN, the US, and the EU. The method is particularly suited to elucidating the multifaceted dynamics behind individual target se lection and could therefore help to explain how listing decisions are being made.
CONCLUSION
The UN, the US, and the EU all have increasingly stressed the ‘individual accountability’ of policymakers, human rights violators, arms traders, and countless other individuals who facilitate incriminated policies. The use and design of individual sanctions – and, more specifically, the selection of persons to be sanctioned – has important practical and normative implications for decisionmakers from both state institutions and advocacy organizations, as well as for the general public.
In order to learn more about whether and how sanctions ‘work’, research and policy need to focus more on individual sanctions as a decisive subcategory of the overall phenomenon. A new research agenda on individual sanctions must start with identifying the listing patterns, taking into consideration at least four crucial dimensions: trigger events, issue salience, sendertarget relations, and sender characteristics. This promises to provide new insights into which individuals are selected as sanction targets and why, how listed individuals react, and in turn, under what conditions individual sanctions lead to a hardening of positions or induce a change of behavior.
REFERENCES
Biersteker, T. J., M. Tourinho and S. E. Eckert (2016), “Thinking about United Nations Targeted Sanctions”, in T. Biersteker, S. E. Eckert and M. Tourinho, eds., Targeted Sanctions: The Impacts and Effectiveness of United Nations Action, Cambridge University Press, Cambridge, 11–37.
Dorussen, H. and J. Mo (2001), “Ending Economic Sanctions: Audience Costs and RentSeeking as Commitment Strategies”, Journal of Conflict Resolution 45, 395–426.
European Union (2004), Basic Principles on the Use of Restrictive Measures (Sanctions), Brussels.
Giumelli, F. (2013), The Success of Sanctions: Lessons Learned from the EU Experience, Ashgate, Farnham.
Heupel, M. (2013), “With Power Comes Responsibility: Human Rights Protection in United Nations Sanctions Policy”, European Journal of Inter-national Relations 19, 773–796.
Hufbauer, G. C., J. J. Schott, K. A. Elliott and B. Oegg (2007), Economic Sanctions Reconsidered, Peterson Institute of International Economics, Washington DC.
Kokott, J. and C. Sobotta (2012), “The Kadi Case – Constitutional Core Values and International Law – Finding the Balance? ”, European Journal of International Law 23, 1015–1024.
Lektzian, D. and G. Biglaiser (2013), “Investment, Opportunity, and Risk: Do US Sanctions Deter or Encourage Global Investment?”, International Studies Quarterly 57, 65–78.
Mandelker, S. (2019), Statement of Under Secretary Sigal Mandelker Before the US House Appropriations Subcommittee on Financial Services and General Government, 22 March, https://home.treasury.gov/news/pressreleases/sm624.
McLean, E. V. and T. Whang (2010), “Friends or Foes? Major Trading Partners and the Success of Economic Sanctions”, International Studies Quar-terly 54, 427–447.
Miller, N. L. (2014), “The Secret Success of Nonproliferation Sanctions”, International Organization 68, 913–944.
Nossal, K. R. (1994), Rain Dancing: Sanctions in Canadian and Australian Foreign Policy, University of Toronto Press, Toronto.
Pape, R. A. (1997), “Why Economic Sanctions Do Not Work”, International Security 22, 90–136.
Peksen, D., T. M. Peterson and A. C. Drury (2014), “Mediadriven Humanitarianism? News Media Coverage of Human Rights Abuses and the Use of Economic Sanctions”, International Studies Quarterly 58, 855–866.
Powell, J. M. and C. L. Thyne (2011), “Global Instances of Coups from 1950 to 2010: A New Dataset”, Journal of Peace Research 48, 249–259.
Sikkink, K. (2009), “From State Responsibility to Individual Criminal Accountability: A New Regulatory Model for Core Human Rights Violations”, in W. Mattli and N. Woods, eds., The Politics of Global Regulation, Princeton University Press, Princeton, 121150.
Timofeev, I. (2018), Sanctions against Russia: Escalation Scenarios and Countermeasures, Russian International Affairs Council, Moscow.
United Nations (1945), Charter of the United Nations, http://www.un.org/en/documents/charter/.
Von Soest, C. and M. Wahman (2015), “Not All Dictators Are Equal: Coups, Fraudulent Elections, and the Selective Targeting of Democratic Sanctions”, Journal of Peace Research 52, 17–31.
Wallensteen, P. and H. Grusell (2012), “Targeting the Right Targets? The UN Use of Individual Sanctions”, Global Governance: A Review of Multi-lateralism and International Organizations 18, 207–230.
Zarate, J. C. (2013), Treasury’s War: The Unleashing of a New Era of Finan-cial Warfare, PublicAffairs, New York.

32
SPECIAL
CESifo Forum 4 / 2019 December Volume 20
Martin T. Braml and Marina Steininger
Giving Away Wealth? Trade Effects of the Yuan Devaluation The recent devaluation of the Chinese currency as a result of the ongoing trade dispute with the United States also has an impact on Europe. This article looks at the trade effects of a 10-percent and 20-percent Yuan devaluation according to cal-culations from the ifo Trade Model, based on the assumption of a normal reaction of the Chinese current account. Besides usual trade diversion effects, Germany and Europe also benefit in a sec-ond way from the Sino-American trade dispute: the devaluation of the Yuan, which makes Chinese goods cheaper for consumers in Europe. In a realistic scenario, we expect gains in real incomes for the German economy of EUR 413–499 million. Income growth for the rest of the EU (without Germany) would amount to EUR 1.9–2.8 billion. The devalua-tion goes hand in hand with income losses for the Chinese economy and, at the same time, lowers the costs of the trade dispute for the United States.
The US-China trade conflict, which has been ongoing since the election of Donald Trump as US President, has entered a new phase with the deval-uation of the Chinese currency, the Renminbi- Yuan,1 on 5 August 2019. While the People’s Bank of China suggested that the devaluation was the result of ordinary market movements triggered by newly announced US tariffs, President Trump once again accused China of ‘currency manipulation’ (Xinhua 2019).2 The devaluation was generally interpreted as a response to the announced US tariffs on all Chi-nese imports (Bloomberg 2019).
THE YUAN DEVALUATION AS CONTINUATION OF THE TRADE WAR
We will not go any further into currency manipulation below; however, it should be noted that the Yuan has seen three phases of devaluation since the beginning of 2018 (Figure 1): between June and 1 Hereinafter referred to as ‘Yuan’ for clarity.2 See tweet below from 5 August 2019: https://twitter.com/realdonaldtrump/status/1158350120649408513.
Martin T. Bramlifo Institute
August 2018, in early May 2019, and in the first half of August 2019. The two sharp devaluations in 2019, in particular, were preceded by announce-ments of new US import duties on Chinese goods, as shown in a comparison with the Peterson Ins-titute’s Trade War Timeline (Bown and Kolb 2019). Furthermore, market observers indicate that the Chinese central bank has recently even pushed the Yuan exchange rate up with support opera-tions, which diametrically opposes the under-valuation accusations (WirtschaftsWoche 2019). The International Monetary Fund (IMF) does not see any signals for currency manipulation in the sense of an artificially low exchange rate either (Daniel and Yan 2019).
Figure 2 shows the US bilateral current account positions vis-à-vis China. The high US deficit of around 2 percent of economic output is not only what led to the US trade war; it also reflects the extent to which both sides can retaliate with counter measures. The US trade deficit in goods of some USD 400 billion in 2018 means that the United States can impose special tariffs on more Chinese goods than vice versa. That is why China is using the devaluation of the Yuan as leverage in the trade dispute: because of the lack of alternatives. With reference to the Prussian military theorist Carl von Clausewitz, the Economist calls this a ‘continuation of trade policy by other means’ (The Economist 2019). In any case, the current USD/CNY exchange rate of 7.1 is down around 13 percent on the two-year high in spring 2018. This means that additional US duties can be compensated via the exchange rate channel in such a way that Chinese goods do not lose their price competitiveness in US markets despite these tariffs. However, the price for holding on to market share is high, because a devaluation of the Yuan that is directly proportional to US tariffs means that the tariff burden lies entirely with Chinese pro-ducers and not with American consumers. Zoller-Ry-dzek and Felbermayr (2018) also find a higher tar-iff incidence for China, quantified by a real trade model, whereas Amiti et al. (2019) and Fajgelbaum
Marina Steiningerifo Institute
6.20
6.40
6.60
6.80
7.00
7.20
2018 2019
Note: Exchange rate, weekly. Source: Federal Reserve Bank of St. Louis.
Exchange rate CNY/USD
© ifo Institute
CNY/USD Exchange Rate 2018–2019Figure 1

33
SPECIAL
CESifo Forum 4 / 2019 December Volume 20
et al. (2019) present empirical evidence primarily for rising US consumer prices and hence a domestic tariff incidence. As caveat: all three analyses refer to a period before 2019 or do not take the exchange rate channel into account. Leaving a consideration of welfare economics to one side, the devaluation of the Yuan could cause a further increase of the US trade deficit with China – depending on the respec-tive import demand and export supply elasticities. This unintended side effect of US trade policy is somewhat ironic, since the policy aim is precisely to reduce the bilateral deficit.
The main difference between additional duties and simultaneous currency devaluations is that the latter have an erga omnes effect, thus an effect on all trading partners, while US tariffs apply inter partes, i.e., only to China, in disregard of the most- favored-nation principle enshrined in WTO law. Consequently, China has made its terms of trade worse for the rest of the world. These third-country effects of the Sino-American trade war go beyond the dimension of normal trade diversions and are part of the following considerations and calcu- lations.
REACTION OF THE CHINESE CURRENT ACCOUNT
The Chinese current account balance has fallen sharply over the past decade (Fig-ure 3). What had been a sur-plus of 10 percent measured by economic output fell to 0.4 percent in 2018, meaning that it is roughly balanced right now. The IMF even fore-casts current account deficits for the near future. It is gen-erally assumed that trade pol-icy (e.g., tariffs) largely has no effect on the current account balance, as it does not change
national saving and invest-ment decisions.3 However, things are somewhat differ- ent when it comes to the effects of exchange rate policy. Subject to the Mar-shall-Lerner condition, for example, a currency deval-uation with a balanced cur-rent account leads, all else being equal, to an increase in the current account balance (J-Curve Effect). This is also regarded as the ‘normal reac-tion’ of the current account (Borchert 1975). Moreover, a current account response to
the exchange rate is an empirical fact (Cline 2010; Goldstein and Lardy 2008; Ren et al. 2018), even if the underlying elasticity approach is criticized by theories (McKinnon and Schnabl 2009). Only if a nominal devaluation is accompanied by a real de- valuation, there will be a change in the current account. This condition holds in the short term by assuming price stickiness. For this reason, an increase in China’s current account is an expected consequence of the devaluation of the Yuan, at least in the short term. In the very case of China, political control of the current account does not seem implausible even on a medium-term basis. Financing projects such as the Belt & Road Ini- tiative calls for permanent current account sur-pluses, without which no net foreign assets can be built up. What is more, the Chinese government also has the necessary tools at its disposal: capital controls and a high government share with corres-ponding possibilities for state saving. That is why we will simulate the effects of a medium-term increase in the current account below.
3 Nevertheless, bilateral current account positions may shift. This distortion is mainly due to an asymmetric customs policy, i.e., when there is discrimination between different trading partners.
-2.5
-2.0
-1.5
-1.0
-0.5
0.0
0.5
2003 2004 2005 2006 2007 2008 2009 2010 2011 2012 2013 2014 2015 2016 2017 2018-500
-400
-300
-200
-100
0
100
Goods ServicesPrimary income Secondary incomeCurrent account balance Current account balance (% of GDP)
Note: Figures in USD billion, red line refers to right ordinate (% of GDP).Source: US Bureau of Economic Analysis. © ifo Institute
US-China Current Account Balance and Sub-balances 2003‒2018
USD billion % of GDP
Figure 2
-2
0
2
4
6
8
10
-100
0
100
200
300
400
500
2003 2005 2007 2009 2011 2013 2015 2017 2019 2021 2023Note: The blue line refers to the right ordinate and the grey line refers to the left ordinate. Figures from 2019 onwards are projections.Source: IMF World Economic Outlook.
China’s Current Account Balance 2003–2024
USD billion
© ifo Institute
% of GDP
Figure 3

34
SPECIAL
CESifo Forum 4 / 2019 December Volume 20
TRADE EFFECTS OF A PERMANENT INCREASE IN CHINESE CURRENT ACCOUNT
With the ifo Trade Model,4 the effects of an exog-enous change in the Chinese current account are quantified in a static general equilibrium setting. The increase in China’s current account by 3.25 per-cent or 6.5 percent of GDP corresponds to a real devaluation of the Yuan of 10 percent (scenario 1a) and 20 percent (scenario 1b), respectively.5 As the total of all current account balances has to be zero, the current account balances of all other countries will be reduced on a GDP-weighted basis by the same amount in absolute terms as China’s current account increases. These scenarios solely simulate the expected devaluation compared to the initial level without further adjustments. Scenarios 2a and 2b extend the expected devaluations by taking into consideration the effects of an escalating tariff war between China and the United States.6 Scenario 3 serves as a comparison with earlier results and sim-ulates an escalating tariff war between China and the United States without Yuan devaluation.7
Table 1 shows the change in real income8 in the countries and regions concerned. The economic costs of devaluation alone for the Chinese economy amount to EUR 4.2 billion or EUR 8.4 billion, depend-ing on the size of the devaluation. All other countries benefit – on aggregate by EUR 2.4 or 5.4 billion. On balance, the losses exceed the profits, indicating a decline in global production efficiency. The cur-rency devaluation is, therefore, a negative-sum game. It is interesting to note that the United States benefits more from the 10-percent devaluation than the entire rest of the world, including the EU. This changes with a 20-percent devaluation, under which the EU’s absolute gains in real income would reach 4 For a detailed description of the model − see Aichele et al. (2016); Caliendo and Parro (2015).5 This corresponds to the average current account exchange rate elasticities of Cline (2010); and Goldstein and Lardy (2008).6 25 percent protective tariff on US imports from China, worth USD 250 billion, + 10-percent protective tariff on US imports from China, worth USD 300 billion. China responds with countermeasures and introduces a 10-percent protective tariff on US goods − see Felber-mayr and Steininger (2019) for further simulations.7 See ifo press release of 13 August 2019, https://www.ifo.de/en/node/44814. There are minor differences in the underlying GDP data. It has been updated for this paper.8 Defined as the total of domestic value added, customs revenue, and international transfers.
about 85 percent of the US level. The signs of these changes are plausible, as the real exchange ratio between foreign and domestically produced goods deteriorates in the event of a real devaluation to the detriment of China.
As scenario 3 shows, gains in real income mate-rialize for Germany and Europe as long as China and the US impose tariffs only on each other. These result from trade diversions – increased demand for European products in China and the US and increased supply of Chinese and American prod-ucts in Europe. Scenarios 2a and 2b now combine the effects of devaluation (1a and 1b) with the effects of the tariff war. In this case, the aggre-gate cost to China of additional tariffs and the de- valuation amounts to an income loss of EUR 29.2 bil-lion and EUR 33.7 billion, respectively, while Ger-many records real income growth of EUR 413 mil-lion and EUR 499 million, respectively. Only if the Yuan depreciates by 20 percent the US losses from an escalating tariff war (scenario 3) turn into a wel-fare gain. Although the 10-percent Yuan devaluation causes the US income loss to crumble, it remains negative.
With regard to trade relations, it can be seen that a devaluation of the Yuan – whether brought about consciously or unconsciously – together with the corresponding consequences for the Chinese current account will not lead to any increase in wel-fare in China. Indeed, the opposite is true, as making exports cheaper means a transfer of wealth to other countries. In contrast to a trade dispute conducted solely through tariffs, in which retaliating with counter-tariffs is the dominant strategy in response to unilaterally imposed tariffs, there are no positive effects associated with a currency devaluation or an increase in the current account balance. The trans-fer of wealth to the rest of the world associated with this reduces the costs of the trade conflict for the US and increases the benefits for non-participating third countries such as the EU.
Another motive for the devaluation could be to maintain the level of production and thus also employment in China. As a frictionless model that assumes full employment, the ifo Trade Model can-not simulate employment effects. However, contrary to the widespread opinion that current account sur-
Table 1 Changes in Real Income, Different Scenarios (in EUR Million)
Yuan devaluation Yuan devaluation + US-China tariff war US-China tariff war 1a 1b 2a 2b 3
China – 4,235 – 8,440 29,267 – 33,786 – 24,621 Germany 15 147 413 499 348 Rest of the EU 505 1,520 1,944 2,816 1,404 Rest of the world 461 2,208 5,675 6,513 5,130 United States 1,418 1,969 397 476 – 1,593
Note: Real income is the sum of aggregated domestic value added, customs revenue, and international transfers. Scenario 1a/1b simulate a 10-percent/20-percent Yuan devaluation, scenario 2a/2b simulate an additional escalating tariff war, and scenario 3 solely simulates a tariff war between the United States and China without devalu-ation.
Source: ifo simulations and World Bank (2019).
Table 1

35
SPECIAL
CESifo Forum 4 / 2019 December Volume 20
pluses, all else being equal, lead to higher employ-ment, Braml et al. (2018) empirically find a negative correlation between employment and the current account balance.9
CONCLUSION
As shown, Germany and the EU benefit from an esca-lating trade conflict between the United States and China not only in the form of trade diversion effects, but also by a devaluation of the Yuan. The trade conflict undoubtedly causes economic harm due to increased uncertainty and political risks. However economic gains may still arise due to such welfare transfers.10 The exchange rate channel, which was approximated in this paper by the increase in China’s current account surplus, and through which Chinese products become more favorable for German con-sumers and producers, more than outweighs damp-ening effects on demand due to the rise in prices of German and European products in China.
REFERENCES
Aichele, R., G. Felbermayr and I. Heiland (2016), “Going Deep: The Trade and Welfare Effects of TTIP Revised”, ifo Working Paper 219.
Amiti, M., S. J. Redding and D. Weinstein (2019), “The Impact of the 2018 Trade War on US Prices and Welfare”, CEPR Discussion Paper 13564.
Bloomberg (2918), “China Warming to Idea of Yuan as Trade War Weapon, Analysts Say”, 5 August, https://www.bloomberg.com/news/articles/2019-08-05/china-war-ming-to-idea-of-Yuan-as-trade-war-weapon-analysts-say.
Borchert, M. (1975), “Die Marshall-Lerner-Bedingung”, Wirtschaftswissen-schaftliches Studium – WiSt 4, 391–393.
Bown, C. P. and M. Kobl (2019), “Trump’s Trade War Timeline: An Up-to-Date Guide”, Trade and Investment Policy Watch Blog, Updated 23 August, https://www.piie.com/sites/default/files/documents/trump-trade-war-timeline.pdf.
Braml, M. T., G. J. Felbermayr and L. Wilbert (2018), “Exportieren Länder mit Leistungsbilanzüberschuss Arbeitslosigkeit?”, ifo Schnelldienst 71(16), 20–25.
Caliendo, L. and F. Parro (2015), “Estimates of the Trade and Welfare Effects of NAFTA”, Review of Economic Studies 82, 1–44.
Cline, W. R. (2010), Renminbi Undervaluation, China’s Surplus, and the US Trade Deficit, Policy Briefs PB10-20, Peterson Institute for International Economics, Washington DC.
Daniel, J. and T. Yan (2019), Transcript of Press Call on the Publication of the 2019 China Article IV Staff Report, International Monetary Fund, 13 August, https://www.imf.org/en/News/Articles/2019/08/13/tr08092019-transcript-of-the-press-conference-on-china-article-iv-consultations-report.
Fajgelbaum, P. D., P. K. Goldberg, P. J. Kennedy and A. K. Khandel-wal (2019), “The Return to Protectionism”, NBER Working Paper 25638.
Felbermayr, G. and M. Steininger (2019), Trump’s Trade Attack on China – Who Laughs Last?, EconPol Policy Brief 13.
Goldstein, M. and N. R. Lardy (2008), “China’s Exchange Rate Policy: An Overview of Some Key Issues”, in M. Goldstein und N. R. Lardy, eds., Debating China’s Exchange Rate Policy, Peterson Institute for International Economics, Washington DC, 1–75.
McKinnon, R. and G. Schnabl (2009), “China’s Financial Conundrum and Global Imbalances”, BIS Working Papers 277.
9 The correlation in the estimated model with country-specific effects even points in the opposite direction, thus showing that un-employment decreases with the current account balance.10 The simulations do not include an estimate of the increase in un-certainties and political risks that the devaluation of the Yuan brings about.
Ren, Y., Y. Xiaomin and Z. Wanru (2018), “The Effects of RMB Internation-alization on Balance of Payments in China”, Advances in Social Science, Education and Humanities Research 223, 170–178.
The Economist (2019), “The Trade War Escalates, and the Fog of War Descends”, 8 August, https://www.economist.com/finance-and-economics/2019/08/08/the-trade-war-escalates-and-the-fog-of-war-descends.
WirtschaftsWoche (2019), “Yuan fällt an Auslandsbörsen auf Rekordtief”, 6 August, https://www.wiwo.de/finanzen/boerse/devisen-Yuan-fa-ellt-an-auslandsboersen-auf-rekordtief/24874994.html.
Xinhua (2019), “Economic Watch: China Confident of Keeping Yuan Stable”, 6 August, http://www.xinhuanet.com/englis-h/2019-08/06/c_138286016.htm.
Zoller-Rydzek, B. and G. J. Felbermayr (2018), Who Is Paying for the Trade War with China, EconPol Policy Brief 11.

36
SPECIAL
CESifo Forum 4 / 2019 December Volume 20
Christian Grimme and Robert LehmannThe ifo Export Climate – A Leading Indicator to Forecast German Export Growth
INTRODUCTION
Over the last 25 years there has been an excep-tionally large increase in trade globalization. The increase in globalization is mainly reflected in a higher interconnectedness of value-added chains between economies. Therefore, export and import developments have become increasingly import-ant for the growth of gross domestic product (GDP). Focusing on Germany, a very open economy, exports are the second largest component of GDP after pri-vate consumption. In addition, comparing the stan-dard deviations of the different GDP components, export growth is extremely volatile and thus heavily influences fluctuations in GDP. Therefore, accurately forecasting exports has become increasingly import-ant in applied forecasting work.1
Particularly in short-term forecasting, monthly indicators help us to generate precise export fore-casts for the current and the next quarter. Indica-tors have the advantage that they are released at a higher frequency compared to national account fig-ures, which are available only on a quarterly basis and published with a delay of about two months after the end of the current quarter. In contrast, hard indicators, such as foreign new orders or monthly foreign trade, are released much sooner. Particu-larly interesting for forecasting is survey data, which is published even earlier and is not usually subject to revisions.
This study presents the ifo Export Climate, a leading indicator for forecasting German exports.2
The ifo Export Climate is based on business and consumer confidence of Germany’s main trading partners and also takes into account Germany’s interna-tional price competitiveness. By modelling international
1 See Hanslin and Scheufele (2019) for Swiss and German exports, Leh-mann (2019) for a study on European countries, and Keck et al. (2009) for the OECD 25. Grimme et al. (2019) analyze the performance of different indicators in forecasting imports for six different countries.2 The ifo Export Climate has already been presented in a German article by Elstner et al. (2013). We thank Maxi-milian Müller-Bardorff for his valuable research assistance.
demand and the relative price of German products, the ifo Export Climate reflects changes in foreign demand for German goods.
To assess the performance of the ifo Export Climate in forecasting German exports, its predic- tive quality is evaluated using statistical and eco-nometric methods. It turns out that the ifo Export Climate performs well for current-quarter forecasts and is the best-performing indicator for next-quar-ter forecasts. Therefore, the ifo Export Climate provides a valuable indicator for short-term fore-casting of German exports. The indicator is updat- ed monthly and published on the ifo homepage. The underlying idea of the ifo Export Climate was also adopted by Lehmann (2019) for a set of 18 Euro- pean countries. He finds that the Export Climates are among the best performing survey-based indicators.
The next section presents the construction of the ifo Export Climate. In the third section, we ana-lyze the forecasting performance of the ifo Export Climate. First, we discuss further potential leading indicators. Second, using cross-correlations, we look at common fluctuations of the indicators and export growth. We also describe the issue of publication lags. Afterwards, we evaluate the forecasting perfor-mance of the ifo Export Climate based on a pseudo out-of-sample forecasting exercise. The final section concludes.
CONSTRUCTION OF THE IFO EXPORT CLIMATE
The ifo Export Climate consists of two components. The first part is world demand, which is proxied by global business and consumer sentiment of Germa-ny’s most important export markets. The construc-tion of world demand is described in detail below. The second sub-chapter tackles the price competi-tiveness of Germany. This measure indicates how competitive the German economy is in comparison to its trading partners. Figure 1 shows the structure of the ifo Export Climate in graphical form. Both com-ponents are weighted differently in the ifo Export Climate. The computation of these weights is also explained below.
Christian Grimmeifo Institute
Robert Lehmannifo Institute
Construction of the ifo Export Climate
© ifo Institute
World demand Price competetiveness
ifo Export Climate
Note: The weights were determined based on a regression in which exports are explained by the two components of the ifo Export Climate.Source: Authors’ compilation.
Weight: 0.76 Weight: 0.24
Figure 1

37
SPECIAL
CESifo Forum 4 / 2019 December Volume 20
Construction of the World Demand Proxy
Global world demand is proxied by business and con-sumer sentiment of a total of 44 countries, covering more than 90 percent of the sales markets for German exports.3 The business confidence of each country is approximated by an industrial confidence indicator. For the European countries, we use the industrial confidence indicators (ICI) from the European Com-mission, which are harmonized across the member states (European Commission 2016). For most of the other countries outside Europe, we mostly use Busi-ness Confidence Indexes (BCI) provided by national sources. To approximate business confidence in the United States and China, we rely on the Purchasing Managers’ Index (PMI) from the Institute for Supply Management (ISM) and the National Bureau of Sta-tistics China, respectively; for Thailand, we use the BCI provided by the Bank of Thailand. The consumer confidence indicators are taken from the European Commission for the European countries and from national sources for all remaining countries. Both confidence indicators – business and consumer – are seasonally adjusted and standardized to have zero mean and a standard deviation of one.
The construction of world demand is determined in two steps. First, we proxy a trading partner’s over-all demand by weighting its business and consumer sentiment. The weights are calculated as the ratio of the volume of exports of consumption goods from Germany to the respective trading partner and the sum of German exports of consumption and invest-ment goods to the respective trading partner. Coun-try-specific weights for business and consumer sentiment are used to reflect the differences in the relative importance of German exports of consumer
3 The 44 countries comprise all member states of the European Union (except Croatia), Israel, Norway, the Russian Federation, Swit-zerland, Turkey, a selection of North and South American countries (Brazil, Chile, Mexico, and the United States), a number of Asian countries (China, India, Indonesia, Japan, South Korea, and Thai-land), Australia and New Zealand, and South Africa.
and investment goods across its trading partners. Country-specific export data is extracted from the UN Comtrade Database. This database allows us to split a country’s exports with respect to destination and broad economic categories (BEC).4
Second, country-specific demand is aggre-gated using country-specific weights to form world demand. The weights reflect the importance of a trading partner for Germany’s exports and is com-puted as the volume of exports from Germany to the trading partner divided by the total volume of exports by Germany. The data is taken from the IMF’s Direction of Trade Statistics.
Figure 2 displays the construction of a coun-try’s demand using the example of the two countries France and China. Germany’s total exports to China are comprised of consumption goods only to a small extent (7%), while 93% of the exports are investment goods. In contrast, about 17% of Germany’s exports to France are consumer goods and 83% are invest-ment goods. Overall, France enters world demand with a higher share, because the total share of Ger-man exports to France (about 9%) is larger than the corresponding share for China (about 8%).5
Price Competitiveness
The proxy for German price competitiveness is the real effective exchange rate (REER) with respect to Germany’s 36 major trading partners. The REER is the nominal effective exchange rate, taking into account the ratio of foreign to Germany’s consumer prices. The data is taken from the Deutsche Bundesbank.6
4 As we are interested in consumer versus investment goods ex-ports, we rely on the consumer goods definition by the UN. Based on this definition, consumer goods are mainly the sum of food and bev-erages for household consumption, processed fuels and lubricants, non-industrial transport equipment, and consumer goods that are not specified in any other BEC. Investment goods are capital goods and industrial transport equipment.5 Since about 90 percent of all export markets are included in the ifo Export Climate, the country shares of total German exports are transformed to 100 percent.6 Since the time series is only available starting in 1993, the years
Example for Construction of World Demand
© ifo Institute
World demand
Demand of France Demand of China
Consumer sentiment China Business sentiment ChinaConsumer sentiment France Business sentiment France
Notes: Export shares are for 2018; consumer and investment goods shares are for 2016, computed from the latest data available.Source: Authors’ compilation.
Export share of China (7.8%)Export share of France (8.8%)
Consumer goods exports (17%)
Consumer goods exports (7%)
Investment goods exports (93%)
Investment goods exports (83%)
[...]
Figure 2

38
SPECIAL
CESifo Forum 4 / 2019 December Volume 20
Figure 3 plots both the price competitiveness and world demand. To improve readability, both time series are standardized to achieve uniform scal-ing. World demand is subject to cyclical fluctuations and thus captures the demand for German products, which is strongly dependent on the global economy. In contrast, price competitiveness is much flatter. It reflects the comparatively slow-moving price com-ponent of German exports in the ifo Export Climate.7
In the following, both world demand and the change in price competitiveness enter the ifo Export Climate using their standardized values.
The weights of the Export Climate’s two com-ponents – the combined confidence indicators and the price competitiveness – are computed following the two-step procedure by Kilian et al. (2007). In the first step, we estimate a regression, in which the quarterly growth rates of exports (∆Export) is the dependent variable. The explanatory variables are the current value and four lags of the change in the price competitiveness (∆PC):
(1) ∆𝐸𝐸𝐸𝐸𝐸𝐸𝐸𝐸𝐸𝐸𝐸𝐸𝐸𝐸𝐸𝐸𝐸𝐸𝐸𝐸𝐸𝐸𝐸𝐸𝑡𝑡𝑡𝑡 = 𝛼𝛼𝛼𝛼 + 𝛽𝛽𝛽𝛽1∆𝑃𝑃𝑃𝑃𝑃𝑃𝑃𝑃𝑡𝑡𝑡𝑡 + . . . + 𝛽𝛽𝛽𝛽5∆𝑃𝑃𝑃𝑃𝑃𝑃𝑃𝑃𝑡𝑡𝑡𝑡𝑡𝑡 + 𝜀𝜀𝜀𝜀𝑡𝑡𝑡𝑡
Including lags, this takes into account that there is a delayed response of exports to changes in rel-ative prices. The estimation of equation (1) yields an adjusted R² of 17 percent. This indicates that 17 percent of the variation ∆Export of is explained by ∆PC. In the second step, equation (1) is extended to include world demand (∆WD) using its current value and four lags:
(2) ∆𝐸𝐸𝐸𝐸𝐸𝐸𝐸𝐸𝐸𝐸𝐸𝐸𝐸𝐸𝐸𝐸𝐸𝐸𝐸𝐸𝐸𝐸𝐸𝐸𝑡𝑡𝑡𝑡 = 𝛼𝛼𝛼𝛼 + 𝛽𝛽𝛽𝛽1∆𝑃𝑃𝑃𝑃𝑃𝑃𝑃𝑃𝑡𝑡𝑡𝑡 + . . . + 𝛽𝛽𝛽𝛽5∆𝑃𝑃𝑃𝑃𝑃𝑃𝑃𝑃𝑡𝑡𝑡𝑡𝑡𝑡 + 𝛾𝛾𝛾𝛾1𝑊𝑊𝑊𝑊𝑊𝑊𝑊𝑊𝑡𝑡𝑡𝑡 + . . . + 𝛾𝛾𝛾𝛾5𝑊𝑊𝑊𝑊𝑊𝑊𝑊𝑊𝑡𝑡𝑡𝑡𝑡𝑡 + 𝜀𝜀𝜀𝜀𝑡𝑡𝑡𝑡
∆𝐸𝐸𝐸𝐸𝐸𝐸𝐸𝐸𝐸𝐸𝐸𝐸𝐸𝐸𝐸𝐸𝐸𝐸𝐸𝐸𝐸𝐸𝐸𝐸𝑡𝑡𝑡𝑡 = 𝛼𝛼𝛼𝛼 + 𝛽𝛽𝛽𝛽1∆𝑃𝑃𝑃𝑃𝑃𝑃𝑃𝑃𝑡𝑡𝑡𝑡 + . . . + 𝛽𝛽𝛽𝛽5∆𝑃𝑃𝑃𝑃𝑃𝑃𝑃𝑃𝑡𝑡𝑡𝑡𝑡𝑡 + 𝛾𝛾𝛾𝛾1𝑊𝑊𝑊𝑊𝑊𝑊𝑊𝑊𝑡𝑡𝑡𝑡 + . . . + 𝛾𝛾𝛾𝛾5𝑊𝑊𝑊𝑊𝑊𝑊𝑊𝑊𝑡𝑡𝑡𝑡𝑡𝑡 + 𝜀𝜀𝜀𝜀𝑡𝑡𝑡𝑡
1991 and 1992 are extrapolated using the rates of change of the price competitiveness with respect to 26 trading partners. For an evaluation of different competitiveness indicators, see Ca’Zorzi and Schnatz (2007).7 The plot also shows that price competitiveness is a non-station-ary variable. Therefore, in the following, this variable is included in log differences in the ifo Export Climate.
The adjusted R² increases to 69 percent. Due to the much higher explanatory power, world demand is more important for the dynamics of German exports. This is in line with Danninger and Joutz (2008); and Grimme and Thürwächter (2015), who show that price competitive-ness explains only a compar-atively small part of Germa-ny’s export growth. Finally, the weight of the price com-petitiveness is computed by dividing the adjusted R² from equation (1) to that of equa-tion (2). This yields a weight of 25 percent for the price com-
petitiveness. Therefore, the price competitiveness and world demand enter the ifo Export Climate with a weight of 0.25 and 0.75, respectively.
Figure 4 plots the ifo Export Climate together with German export growth. Both series display a strong co-movement.
FORECASTING PERFORMANCE OF THE IFO EXPORT CLIMATE
Further Potential Predictors
To judge the relevance of the ifo Export Climate for applied export forecasting, we need to compare its forecasting performance to the performance of other predictors. All predictors are seasonally adjusted.
‒ Exports – special trade classification: the most straightforward quantitative indicator is export in delimitation of special trade, which is released monthlybytheGermanStatisticalOffice.Itsolelycaptures traded goods that have been produced or processed in Germany. This series represents a large component of exports in delimitation of national accounts. Since the special trade figures are published only in nominal terms, we deflate them using the monthly available export price index released by the Deutsche Bundesbank. To doso,wefirstshiftthepriceindexbackbyonemonth and use this lagged series to deflate nomi-nal exports. The resulting series has a slightly hig-her correlation with real exports in delimitation of national accounts than when exports in delimit-ation of special trade are deflated with the cont-emporaneous price index. This is because prices are collected once the contract has been signed, while national accounting standards measure tra-ded goods at the time of the border crossing.
‒ New foreign orders: another prominent indicator is new orders in the German manufacturing indus-
-5
-4
-3
-2
-1
0
1
2
3
1991 1993 1995 1997 1999 2001 2003 2005 2007 2009 2011 2013 2015 2017 2019
World demandPrice competitiveness
Notes: World demand is computed based on business and consumer sentiment of Germany’s 44 major trading partners. Price competitiveness is the real effective exchange rate with respect to Germany’s 36 major trading partners; the series is obtained from the Deutsche Bundesbank. Both series are standardized to have zero mean and a standard deviation of one.Source: Deutsche Bundesbank; European Commission; national sources; authors’ calculations.
Components of ifo Export Climate
Standard deviations
© ifo Institute
Figure 3

39
SPECIAL
CESifo Forum 4 / 2019 December Volume 20
try from abroad released by the German Statisti-calOffice.Sinceordersmustbeprocessedfirst,they may be a good indicator for future exports.
‒ Price competitiveness: in addition to the indi-cators describing the real economy, we also rely on a price measure. As exports are directly linked to the relative price competitiveness position of the domestic economy within the world market, information about relative prices should contain signals that may help forecast export growth. Weuse the real effective exchange ratebasedon consumer prices against 37 industrial coun-tries, which is released monthly by the Deutsche Bundesbank.
‒ ifo New Foreign Orders assessment: each month the ifo Institute asks firms to assess their current foreign order-book levels.
‒ ifo Export Expectations: each month the ifo Ins-titute asks firms about their export expectations for the next three months.
Correlation Analysis and Publication Lags
The evaluation of the indicators starts with a cross-correlation analysis. Cross-correlations pro-vide information on whether and to what extent or in which direction there is a correlation between the indicators and export growth. Before, all indicators
are converted to quarterly frequency by averaging the monthly values; new orders, the real effective exchange rate, and exports in delim-itation of special trade are transformed to growth rates. Table 1 shows the cross- correlations.
The first row shows that the auto-correlation of exports − the correlation ofexports in delimitation of national accounts with its own lags − is not very high.This is another indication
that export growth is not very persistent, but prob-ably more volatile. The second row displays the very high contemporaneous correlation between exports in delimitation of national accounts and exports in delimitation of special trade with a correlation coef-ficient of 0.95. New orders have a high contemporary correlation with exports (0.65). The indicator also exhibits a strong lead correlation of one quarter with exports (0.58). In contrast, the price competitiveness – measured by the real effective exchange rate – is weakly negatively correlated with exports, since an increase in the exchange rate means an appreciation of the domestic currency, which translates into a deterioration of the price competitiveness. The con-temporaneous correlation with exports is relatively low as are the lead correlations. ifo New Orders have a high contemporary correlation with exports (0.66) and a good lead correlation of one quarter (0.50). The ifo Export Expectations have, in addition to a high contemporary correlation (0.59), leading properties for one quarter (0.35). Finally, the ifo Export Climate has a contemporary correlation coefficient of 0.50. Therefore, the correlation analysis gives a first indi-cation that the ifo Export Climate may be a good indi-cator for German exports.
When interpreting correlation coefficients, one needs to take into account that the monthly time series are available with different time delays.
-5-4-3-2-101234
-25-20-15-10
-505
101520
1991 1993 1995 1997 1999 2001 2003 2005 2007 2009 2011 2013 2015 2017 2019
Real exports ifo Export Climate
Notes: Real exports: growth in real exports of Germany (year -over-year rates). ifo Export Climate: standardized to have zero mean and a standard deviation of one.Source: German Statistical Office; computation of authors.
ifo Export Climate and Real Exports
Real export growth rate
© ifo Institute
Standard deviations
Figure 4
Table 1 Cross-Correlation of Indicators and Real Exports (National Accounts)
Lead of indicator Lag of indicator 4 3 2 1 0 – 1 – 2 – 3 – 4
Real export (national accounts) – 0.01 0.05 0.18 0.29 1.00 0.29 0.18 0.05 – 0.01 Nominal export (special trade) – 0.06 0.06 0.14 0.33 0.95 0.19 0.02 0.06 0.06 Real export (special trade) – 0.09 0.10 0.17 0.38 0.95 0.17 0.01 0.05 0.06 Foreign new orders 0.04 0.14 0.33 0.58 0.65 0.22 0.03 – 0.07 – 0.14 Real eff. exchange rate – 0.09 – 0.05 – 0.11 – 0.13 – 0.32 – 0.02 – 0.13 0.03 0.15 ifo Foreign Orders – 0.07 0.05 0.27 0.50 0.66 0.52 0.23 0.05 – 0.21 ifo Export Expectations – 0.22 – 0.14 0.01 0.35 0.59 0.62 0.50 0.34 0.13 ifo Export Climate – 0.23 – 0.17 – 0.01 0.29 0.50 0.58 0.56 0.44 0.24 Notes: The cross-correlations are calculated between the quarterly growth rates of real exports (in delimitation of national accounts) and the respective indicator. The indicators special trade exports, foreign new orders, and exchange rate are in quarterly log-differences, ifo Foreign Orders are in quarterly differences, and ifo Export Expectations and ifo Export Climate are not transformed.
Source: Calculations of the authors.
Table 1

40
SPECIAL
CESifo Forum 4 / 2019 December Volume 20
Table 2 shows the availability of the monthly indica-tors for the quarterly economic forecasts that are released by the ifo Institute. The months in the col-umns indicate which values of the current quarter are available for the respective indicator. Typically, indicators based on survey data, such as the three ifo variables, are available for the first two months of the current quarter, while indicators based on hard data, such as foreign new orders and exports in delimitation of special trade, are available only for the first month. This means that real exports in delimitation of special trade may still not be the best predictor, even though this series has the highest contemporaneous correlation with real exports in delimitation of national accounts. As a result, the ifo indicators have an informational advantage over the hard indicators, which may be particularly valuable due to the volatility of exports.
Out-of-sample Forecasting Performance
In this section, we assess the performance of each of the indicators with respect to forecasting the quar-terly growth rates of German exports in the current and the following quarters. We use the following forecasting model for the current quarter:
(3) ∆𝐸𝐸𝐸𝐸𝐸𝐸𝐸𝐸𝐸𝐸𝐸𝐸𝐸𝐸𝐸𝐸𝐸𝐸𝐸𝐸𝐸𝐸𝐸𝐸𝑡𝑡𝑡𝑡� = 𝛼𝛼𝛼𝛼11� + 𝛽𝛽𝛽𝛽11�𝐼𝐼𝐼𝐼𝐼𝐼𝐼𝐼𝑑𝑑𝑑𝑑𝑖𝑖𝑖𝑖𝑖𝑖𝑖𝑖𝑖𝑖𝑖𝑖𝐸𝐸𝐸𝐸𝐸𝐸𝐸𝐸𝐸𝐸𝐸𝐸𝑡𝑡𝑡𝑡 + . . . + 𝛽𝛽𝛽𝛽𝑝𝑝𝑝𝑝𝑝11�𝐼𝐼𝐼𝐼𝐼𝐼𝐼𝐼𝑑𝑑𝑑𝑑𝑖𝑖𝑖𝑖𝑖𝑖𝑖𝑖𝑖𝑖𝑖𝑖𝐸𝐸𝐸𝐸𝐸𝐸𝐸𝐸𝐸𝐸𝐸𝐸𝑡𝑡𝑡𝑡𝑡𝑝𝑝𝑝𝑝 ,
where ∆𝐸𝐸𝐸𝐸𝐸𝐸𝐸𝐸𝐸𝐸𝐸𝐸𝐸𝐸𝐸𝐸𝐸𝐸𝐸𝐸𝐸𝐸𝐸𝐸𝑡𝑡𝑡𝑡� is the forecast of quarter-on-quar-ter real export growth, Indicatort denotes the cur-rent quarterly value of one of the leading indicators, while Indicatort -p is lag p of the leading indicator. The monthly leading indicators are transformed to quar-terly frequency. As described in the previous section, for some of the indicators only the first month of the current quarter is available, for others the first two months are known. We take this into account in the conversion to quarterly values, so that the current quarterly value contains only the average of the available months. Finally, the indicators export spe-cial trade, foreign new orders, and exchange rate enter as log-differences, respectively; ifo Foreign Orders are considered in first differences; and ifo Export Expectations and ifo Export Climate are not transformed.
For the forecast of the following quarter, the forecasting model must be slightly changed since we do not have any values for the leading indicator in t + 1:
(4) ∆𝐸𝐸𝐸𝐸𝐸𝐸𝐸𝐸𝐸𝐸𝐸𝐸𝐸𝐸𝐸𝐸𝐸𝐸𝐸𝐸𝐸𝐸𝐸𝐸𝑡𝑡𝑡𝑡𝑡𝑡� = 𝛼𝛼𝛼𝛼𝑡2� + 𝛽𝛽𝛽𝛽𝑡2�𝐼𝐼𝐼𝐼𝐼𝐼𝐼𝐼𝐼𝐼𝐼𝐼𝐼𝐼𝐼𝐼𝐼𝐼𝐼𝐼𝐼𝐼𝐼𝐼𝐸𝐸𝐸𝐸𝐸𝐸𝐸𝐸𝐸𝐸𝐸𝐸𝑡𝑡𝑡𝑡 + . . . + 𝛽𝛽𝛽𝛽𝑞𝑞𝑞𝑞𝑡𝑡𝑡�𝐼𝐼𝐼𝐼𝐼𝐼𝐼𝐼𝐼𝐼𝐼𝐼𝐼𝐼𝐼𝐼𝐼𝐼𝐼𝐼𝐼𝐼𝐼𝐼𝐸𝐸𝐸𝐸𝐸𝐸𝐸𝐸𝐸𝐸𝐸𝐸𝑡𝑡𝑡𝑡𝑡𝑞𝑞𝑞𝑞
The evaluation of the forecasting performance
of the models is based on pseudo-out-of-sample forecasts.8 Out-of-sample means that the period for the estimation of the models’ parameters does not include the forecasted quarter. The term pseudo illustrates that the forecasts refer to peri-ods for which realized data is already available. In our case, the first estimation period is from 1991:Q1 to 2005:Q1. Using models (3) and (4), forecasts are produced for the current quarter (2005:Q2) and the next quarter (2005:Q3) using one particular leading indicator. These forecasts are then com-pared to the actual values to determine forecast errors for the current and the next quarter. Then, the estimation period is extended by one quarter to cover 1991:Q1 to 2005:Q2, forecasts are generated for the third and fourth quarter of 2005, and fore-cast errors are computed using the actual values. This procedure is repeated up to the most recent data point, so that the last estimation sample covers the period 1991:Q1 to 2019:Q2. In sum, 57 forecast errors for the current quarter and 56 forecast errors for the next quarter are produced for each leading indicator.9
We assess the forecast errors separately for the current quarter (h=0) and the next quarter (h=1) for each indicator (IND) based on the root mean squared errors (RMSE):
(5) 𝑅𝑅𝑅𝑅𝑅𝑅𝑅𝑅𝑅𝑅𝑅𝑅𝑅𝑅𝑅𝑅ℎ𝐼𝐼𝐼𝐼𝐼𝐼𝐼𝐼𝐼𝐼𝐼𝐼 = � 1𝑇𝑇𝑇𝑇ℎ∑ (∆𝑅𝑅𝑅𝑅𝐸𝐸𝐸𝐸𝐸𝐸𝐸𝐸𝐸𝐸𝐸𝐸𝐸𝐸𝐸𝐸𝐸𝐸𝐸𝐸� 𝑡𝑡𝑡𝑡𝑡ℎ − ∆𝑅𝑅𝑅𝑅𝐸𝐸𝐸𝐸𝐸𝐸𝐸𝐸𝐸𝐸𝐸𝐸𝐸𝐸𝐸𝐸𝐸𝐸𝐸𝐸𝑡𝑡𝑡𝑡𝑡ℎ)2𝑡𝑡𝑡𝑡𝑡𝑇𝑇𝑇𝑇ℎ ,
8 The choice of the number of lags p and q of the leading indicator in models (3) and (4) is based on the Bayesian Information Criterion (BIC). The parameters of the models are estimated with OLS.9 We use real-time data for this exercise. Using the final vintage data does not change our main findings. Also, using exports of goods instead of exports of goods and services does not change the main results. We also experimented with including lags of export growth in models (3) and (4), which does not change the main findings; how-ever, using own lags results in a deterioration of the absolute fore-cast performance of the indicators. This is because export growth is not very persistent (see the first row of Table 3).
Table 2 Availability of Indicators for ifo Business Cycle Forecasts
Ifo Business Cycle forecasts
Indicator Spring
(March) Summer
(June) Autumn
(September) Winter
(December) Export special trade Jan. April July Oct. Foreign orders Jan. April July Oct. Exchange rate Jan., Feb. April, May July, Aug. Oct., Nov. ifo Orders Jan., Feb. April, May July, Aug. Oct., Nov. ifo Export Expectations Jan., Feb. April, May July, Aug. Oct., Nov. ifo Export Climate Jan., Feb. April, May July, Aug. Oct., Nov. Note: The months listed for each indicator shows how many months of the current quarter are available at the time of the ifo business cycle forecasts.
Source: German Statistical Office, Deutsche Bundesbank, ifo Institute.
Table 2

41
SPECIAL
CESifo Forum 4 / 2019 December Volume 20
where Th denotes the number of forecasts pro-duced for each horizon. The forecast error for quar-ter t+h is the squared difference of the forecast (∆𝐸𝐸𝐸𝐸𝐸𝐸𝐸𝐸𝐸𝐸𝐸𝐸𝐸𝐸𝐸𝐸𝐸𝐸𝐸𝐸𝐸𝐸𝐸𝐸� 𝑡𝑡𝑡𝑡𝑡𝑡) and actual export growth (∆𝐸𝐸𝐸𝐸𝐸𝐸𝐸𝐸𝐸𝐸𝐸𝐸𝐸𝐸𝐸𝐸𝐸𝐸𝐸𝐸𝐸𝐸𝐸𝐸𝑡𝑡𝑡𝑡𝑡𝑡) . The difference is squared to capture the absolute size, since a forecast may prove to be too high or too low, resulting in a forecast error being either positive or negative. Squaring the forecast error also means that large errors are weighted more heavily. Sum-ming over all forecast errors for horizon h, dividing by the number of forecasts Th, and taking the squared root yields the average forecast error. The lower the RMSE, the better the forecasting performance of the respective indicator.
To assess the relative performance of an indica-tor, we calculate the relative RMSE or Theil’s U as the ratio of the RMSE of the indicator model and that of a specific reference model:
(6) 𝑇𝑇𝑇𝑇𝑇𝑒𝑒𝑒𝑒𝑒𝑒𝑒𝑒𝑒𝑒𝑒𝑒´𝑠𝑠𝑠𝑠 𝑈𝑈𝑈𝑈ℎ𝐼𝐼𝐼𝐼𝐼𝐼𝐼𝐼𝐼𝐼𝐼𝐼 = 𝑅𝑅𝑅𝑅𝑅𝑅𝑅𝑅𝑅𝑅𝑅𝑅𝑅𝑅𝑅𝑅ℎ𝐼𝐼𝐼𝐼𝐼𝐼𝐼𝐼𝐼𝐼𝐼𝐼
𝑅𝑅𝑅𝑅𝑅𝑅𝑅𝑅𝑅𝑅𝑅𝑅𝑅𝑅𝑅𝑅ℎ𝑅𝑅𝑅𝑅𝑅𝑅𝑅𝑅𝑅𝑅𝑅𝑅
where 𝑅𝑅𝑅𝑅𝑅𝑅𝑅𝑅𝑅𝑅𝑅𝑅𝑅𝑅𝑅𝑅ℎ𝑅𝑅𝑅𝑅𝑅𝑅𝑅𝑅𝑅𝑅𝑅𝑅 is derived by replacing ∆𝐸𝐸𝐸𝐸𝐸𝐸𝐸𝐸𝐸𝐸𝐸𝐸𝐸𝐸𝐸𝐸𝐸𝐸𝐸𝐸𝐸𝐸𝐸𝐸� 𝑡𝑡𝑡𝑡𝑡𝑡 with ∆𝐸𝐸𝐸𝐸𝐸𝐸𝐸𝐸𝐸𝐸𝐸𝐸𝐸𝐸𝐸𝐸𝐸𝐸𝐸𝐸𝐸𝐸𝐸𝐸� 𝑡𝑡𝑡𝑡𝑡𝑡
𝑅𝑅𝑅𝑅𝑅𝑅𝑅𝑅𝑅𝑅𝑅𝑅 in Equation (5), ∆𝐸𝐸𝐸𝐸𝐸𝐸𝐸𝐸𝐸𝐸𝐸𝐸𝐸𝐸𝐸𝐸𝐸𝐸𝐸𝐸𝐸𝐸𝐸𝐸� 𝑡𝑡𝑡𝑡𝑡𝑡𝑅𝑅𝑅𝑅𝑅𝑅𝑅𝑅𝑅𝑅𝑅𝑅 denotes
the forecast of a reference model. The further the Theil’s U lies below a value of 1, the more accurate the indicator model forecasts compared to a refer-ence model. As reference models we use an AR(r)-model and a random walk model.10 10 An AR(r)-model for forecast horizon h is: ∆𝐸𝐸𝐸𝐸𝐸𝐸𝐸𝐸𝐸𝐸𝐸𝐸𝐸𝐸𝐸𝐸𝐸𝐸𝐸𝐸𝐸𝐸𝐸𝐸� 𝑡𝑡𝑡𝑡𝑡𝑡
𝑅𝑅𝑅𝑅𝑅𝑅𝑅𝑅𝑅𝑅𝑅𝑅 = 𝛼𝛼𝛼𝛼𝛼 + �̂�𝛽𝛽𝛽1𝑡∆𝐸𝐸𝐸𝐸𝐸𝐸𝐸𝐸𝐸𝐸𝐸𝐸𝐸𝐸𝐸𝐸𝐸𝐸𝐸𝐸𝐸𝐸𝐸𝐸𝑡𝑡𝑡𝑡−1 + … + �̂�𝛽𝛽𝛽𝑟𝑟𝑟𝑟𝑡∆𝐸𝐸𝐸𝐸𝐸𝐸𝐸𝐸𝐸𝐸𝐸𝐸𝐸𝐸𝐸𝐸𝐸𝐸𝐸𝐸𝐸𝐸𝐸𝐸𝑡𝑡𝑡𝑡−𝑟𝑟𝑟𝑟 ; the lag length r
Table 3 shows the results from the pseu- do-out-of-sample forecasts for the current quarter (at the top) and for the next quarter (at the bottom). Bold values show a good forecasting performance (RMSE < 3, Theil’s U << 1). For the forecast of the current quarter, most of the indicators have much lower RMSEs compared to both reference models. Therefore, indicators such as special trade, for- eign new orders, and the three ifo variables are good predictors for forecasting export growth in the cur-rent quarter. In contrast, price competitiveness, as proxied by the real effective exchange rate, have a similar RMSE value as the two reference models, so that this indicator is of only limited use as an instrument for the current-quarter forecast. For the forecast of the next quarter, the ifo indicators, and especially the ifo Export Climate, perform much better than the rest of the indicators. In contrast to the other indicators, the RMSEs of the ifo indi-cators are clearly below those of the reference models. Therefore, the ifo Export Climate and the other two ifo indicators are the most reliable pre-dictors for the forecast of export growth for the next quarter.
is based on the Bayesian Information Criterion (BIC). For both fore-cast horizons, a random walk model yields: ∆𝐸𝐸𝐸𝐸𝐸𝐸𝐸𝐸𝐸𝐸𝐸𝐸𝐸𝐸𝐸𝐸𝐸𝐸𝐸𝐸𝐸𝐸𝐸𝐸� 𝑡𝑡𝑡𝑡𝑡𝑡
𝑅𝑅𝑅𝑅𝑅𝑅𝑅𝑅𝑅𝑅𝑅𝑅 = ∆𝐸𝐸𝐸𝐸𝐸𝐸𝐸𝐸𝐸𝐸𝐸𝐸𝐸𝐸𝐸𝐸𝐸𝐸𝐸𝐸𝐸𝐸𝐸𝐸𝑡𝑡𝑡𝑡−1. Table 3 Pseudo-out-of-sample Forecasting Performance of Different Indicators for Export Growth
Current quarter
RMSE Theil's U
Indicator against AR(p) against random walk Nominal export special trade 2.26 0.64 0.62 Real export special trade 2.32 0.66 0.64 Foreign new orders 2.24 0.64 0.62 Real eff. exchange rate 3.50 1.00 0.96 ifo Foreign Orders 2.28 0.65 0.63 ifo Export Expectations 2.14 0.61 0.59 ifo Export Climate 2.35 0.67 0.65 Univariate AR(r) 3.52 Random walk 3.63
Next quarter
RMSE Theil's U
Indicator against AR(p) against random walk Nominal export special trade 3.58 1.02 0.80 Real export special trade 3.59 1.02 0.80 Foreign new orders 3.26 0.93 0.73 Real eff. Exchange Rate 3.71 1.06 0.83 ifo Foreign Orders 2.92 0.83 0.65 ifo Export Expectations 2.87 0.81 0.64 ifo Export Climate 2.68 0.76 0.60 Univariate AR(r) 3.52 Random walk 4.48 Standard deviation of export growth 2.47 Notes: The target series to forecast are real-time quarterly growth rates of total exports in delimitation of national accounts. The forecast errors are computed with respect to the first release. Bold values indicate a good forecasting performance of the respective indicator (𝑅𝑅𝑅𝑅𝑅𝑅𝑅𝑅𝑅𝑅𝑅𝑅𝑅𝑅𝑅𝑅 < 3, 𝑇𝑇𝑇𝑇ℎ𝑒𝑒𝑒𝑒𝑒𝑒𝑒𝑒𝑙𝑙𝑙𝑙′𝑠𝑠𝑠𝑠 𝑈𝑈𝑈𝑈 ≪ 1). The top shows results for the current quarter (h=0), the bottom for the next quarter (h=1). The lag length of the reference AR(r)-model is BIC-optimized. For the current quarter, only the first month is available for special trade exports and foreign new orders; for the ifo indicators and the real effective exchange rate, the first two months are available. Special trade exports, foreign new orders, and the real effective exchange rate are in log-differences, ifo Orders are in differences, and ifo Export Expectations and ifo Export Climate are not transformed.
Source: Calculations by authors.
Table 3

42
SPECIAL
CESifo Forum 4 / 2019 December Volume 20
CONCLUSION
This study presents a leading indicator for export forecasting: the ifo Export Climate. This indicator is constructed using survey data from business and consumer surveys and also includes a measure for price competitiveness. Using the example of Ger-many, we show that this indicator performs well for short-term forecasting. In particular, we find that the ifo Export Climate is the best-performing indicator for the forecast of the next quarter. Due to the good performance of the indicator, the ifo Institute has been using the ifo Export Climate as a predictor for German exports in all its business cycle forecasts for many years.
REFERENCES
Ca’ Zorzi, M. and B. Schnatz (2007), “Explaining and Forecasting Euro Area Exports – Which Competitiveness Indicator Performs Best?”, European Central Bank Working Paper 833.
Danninger, S. and F. Joutz (2008), “What Explains Germany’s Rebounding Export Market Share?”, CESifo Economic Studies 54, 681–714.
Elstner, S., C. Grimme and U. Haskamp (2013), “Das ifo Exportklima – ein Frühindikator für die deutsche Exportprognose”, ifo Schnelldienst 66(4), 36–42.
European Commission (2016), The Joint Harmonised EU Programme of Business and Consumer Surveys – User Guide, Brussels.
Grimme, C., R. Lehmann and M. Nöller (2019), “Forecasting Imports with Information From Abroad”, ifo Working Paper 294.
Grimme, C. and C. Thürwächter (2015), “Der Einfluss des Wechselkurses auf den deutschen Export – Simulationen mit Fehlerkorrekturmodellen”, ifo Schnelldienst 68(20), 35–38.
Hanslin, S. and R. Scheufele (2019), “PMIs: Reliable Indicators for Exports?”, Review of International Economics 27, 711–734.
Keck, A., A. Raubold and A. Truppia A. (2009), “Forecasting International Trade: A Time Series Approach”, OECD Journal: Journal of Business Cycle Measurement and Analysis 2009(2), 157–176.
Kilian, L., A. Rebucci and N. Spatafora (2009), “Oil Shocks and External Balances”, Journal of International Economics 77, 181–194.
Lehmann, R. (2019), “Forecasting Exports across Europe: What Are the Superior Survey Indicators?”, CESifo Working Paper 7846.

43
SPOTLIGHT
CESifo Forum 4 / 2019 December Volume 20
Chang Woon Nam*
The Asylum, Migration, and Integration Fund of the EUThe Asylum, Migration, and Integration Fund (AMIF) of the EU,1 established for the period 2014–2020 with a total sum of EUR 3.137 billion for the seven years, is designed to promote the effi- cient management of migration flows and their implementation, as well as to strengthen and de -velop a common EU approach to asylum and im- migration. All EU member states except Den- mark participate in the implementation of this fund. Major beneficiaries of the support programs and projects implemented under the AMIF in- clude state and federal authorities, local public bodies, non-governmental organizations (NGOs), humanitarian orga nizations, private and pub-lic law companies, and education and research organizations.
More precisely, the AMIF aims to contribute to the achievement of specific objectives in the follow-ing promotion areas:
‒ ‘Asylum’: development of the Common European AsylumSystem(CEAS)byensuringtheefficientand uniform application of the EU legislation in this field;
‒ ‘Legal migration and integration’: promotion of the legal migration to EU countries in line with the labor market needs, and the effective integration of non-EU nationals; and
‒ ‘Return’: implementation of fair and effec- tive return strategies, aimed also at preven-ting irregular migration, with an emphasis on sus tainability and effectiveness of the return process.2
Of the total sum of EUR 3.137 billion, an amount of EUR 2.752 billion (= 88 percent) is earmarked for the EU member states’ ‘national programs’, and EUR 385 million (= 12 percent) for Union action, emergency aid, the European Migration Network
1 See also https://www.eu-foerdermittel.eu/asyl-migrations-und-in-tegrationsfonds-amif-zum-thema-integration/; and https://ec.euro-pa.eu/home-affairs/financing/fundings/migration-asylum-borders/asylum-migration-integration-fund_en.2 In addition, the AMIF also emphasizes the so-called ‘Solidarity’ objectives ensuring that EU member states that are most affected by migration and asylum flows can count on solidarity from other EU na-tions.
(EMN),3 and technical assistance from the European Commission (the so-called ‘direct management’). In other words, the AMIF contributes mainly to the co-financing of national programs (the ‘shared management’). In this context, the EU countries are responsible for their multiannual national pro-grams, covering the entire period 2014–2020. These programs are prepared, implemented, monitored, and evaluated by the responsible authorities in the individual EU nations, in partnership with the rele-vant stakeholders in the relevant field, including also the civil society. The EU co-financing share of the projects accounts for 75 percent in general. Under special circumstances, the share can reach up to 90 percent. The AMIF budget allocated for Germany for the same period of time amounts to approximately EUR 208 million.4
As mentioned above, the remaining 12 per-cent of the total amount aims at supporting the Union actions and emergency assistance: concrete actions to be funded through this instrument include improvement of accommodation and reception ser-vices for asylum seekers; information measures and campaigns in non-EU countries on legal migra-tion channels; education and language training for non-EU nationals; assistance to vulnerable persons belonging to the target groups of AMIF; information exchange and cooperation between EU member states; and training for staff on topics of relevance to AMIF. Part of AMIF is also managed by the European Commission via EU actions, which include calls for proposals, procurement, direct awards, and delega-tion agreements (Table 1).
IMPLEMENTATION OF THE AMIF NATIONAL PROGRAM IN GERMANY
The individual EU member states shall designate their own (national) authorities responsible for imple-menting the AMIF national program. In Germany, the National Center for the Administration of the Euro-pean Refugee Fund at the Federal Office for Migra-
3 The AMIF provides financial resources for the EMN activities and its future development. The EMN aims to respond to EU institu-tions’ and to EU member state authorities’ and institutions’ needs for information on migration and asylum by providing up-to-date, objective, reliable, and comparable data, with a view to supporting policy-making (https://ec.europa.eu/home-affairs/what-we-do/networks/european_migration_network_en; https://ec.europa.eu/home-affairs/financing/fundings/migration-asylum-borders/asy-lum-migration-integration-fund/european-migration-network_en).4 Around 11 percent of the funding under the shared management will be allocated to Specific Actions (implemented under the na-tional programs of EU members, but responding to specific Union priorities) and to support the Union Resettlement Programs (URP). The URP are voluntary programs through which EU countries aim to provide international protection and a durable solution in their territories to refugees and displaced persons identified as eligible for resettlement by UNHCR. They include actions the EU members im-plement to assess the resettlement needs and transfer the persons concerned to their territories, with a view to granting them a secure legal status and to promoting their effective integration (https://ec.europa.eu/home-affairs/e-library/glossary/resettlement-pro-gramme_en). A similar financial mechanism is foreseen for the trans-fer of beneficiaries of international protection from an EU State with high migratory pressure to another.
* ifo Institute and University of Applied Management Ismaning

44
SPOTLIGHT
CESifo Forum 4 / 2019 December Volume 20
tion and Refugees (BAMF) is responsible for awarding grants within this financial support framework.5
Common European Asylum System (CEAS)
In the context of the asylum and refugee policy, Ger-many attempts to ensure an adequate reception of asylum seekers and a speedy and constitutional asylum procedure, and also strives to continuously develop it further. The implementation and com-pletion of the CEAS is acknowledged crucial for this purpose. Of the aforementioned EUR 208 million earmarked for the period 2014–2020, approximately EUR 60 million of AMIF’s fund will be allocated to this area, which promotes the earlier identification of asylum seekers with special needs in reception (and also in the asylum procedure) as well as better consideration of their (specific) needs in a more stan-dardized way.
For the field of ‘admission’, Germany sees fur-ther enhancement of national standards with regard to admission conditions as urgently necessary, which will in turn enable more flexible adaptation of accommodation capacities and continuous de -velopment of other activities related to the reception (e.g., access to first orientation, care, counselling, assistance, and information services). Moreover, the speed-up of the asylum procedure should ideally be combined with high quality decision-making, which can also be guaranteed, for example, by stan-dardizing the information quality on countries of origin.
Better professional exchanges and further train-ing of those actors who are involved in reception and asylum procedures are also required on the national level. In addition, closer cooperation with all rele-vant counterparts on the EU level also appears to be desirable for the further development of CEAS. In this context, Germany is also striving to expand its ‘Resettlement Program’, which was implemented in 2012.6
5 See http://www.bamf.de/SharedDocs/Anlagen/DE/Downloads/Infothek/EU_AMIF/nationales-programm.html?nn=5045180.6 In the framework of the German Resettlement Program, a contin-gent of refugees in need of special protection has been permanently admitted to Germany every year since 2012. These are persons who reside in the first receiving states and have neither a positive perspective for the future nor a prospect of return – see https://www.bmi.bund.de/DE/themen/migration/asyl-fluechtlingsschutz/
Integration of Third-country Nationals and Legal Migration
German integration policy aims at providing the peo-ple with a migration background equal opportunities for education, personal development, and carrier advancement as well as for their professional and social participation, which will in turn strengthen the social cohesion in this country. This objective applies equally to third-country nationals and EU citizens. Yet, according to Articles 8–10 of Regulation 516/2014/EU, AMIF’s funds will directly benefit only third-country nationals and, if it serves the effective implementation of the measure, their closest rela-tives. Germany intends to use approx. EUR 92 million of AMIF funds in this area.
As was the case with the European Integration Fund (2007–2013),7 the AMIF is intended to supple-ment and further develop the existing strategic instruments of integration policy in this country, enforced on the basis of the German Residence Act, which additionally encompasses the measures for establishing a culture of welcome and recognition of third-country nationals.
Return
German ‘return’ policy applies the so-called inte-grated return management approach, which com-bines various strategic measures such as counselling, return support, enhanced reintegration in the coun-try of origin, etc.8 Here, the voluntary return takes precedence over the forced repatriation. Germany plans to spend around EUR 45 million of the avail-
humanitaere-aufnahmeprogramme/humanitaere-aufnahmepro-gramme-node.html.7 The European Integration Fund (EIF) was merged into the AMIF in 2014. The general objective of the EIF was to support EU member states’ efforts to enable third-country nationals of different econom-ic, social, cultural, religious, linguistic, and ethnic backgrounds to fulfil the conditions for residence and to integrate more easily into European society. Refugees and displaced persons, beneficiaries of subsidiary protection, and EU citizens were not promoted. Projects for this target group were supported in five different fields of ac-tion: (1) integration and language; (2) integration and community; (3) intercultural dialogue; (4) indicators and evaluation methods to measure progress, adapt policies and measures, and facilitate coordination of comparative learning; and (5) national networking, exchange, and intercultural capacity building (http://www.bamf.de/DE/DasBAMF/EU-Fonds/SOLID/EIF/eif-node.html).8 See https://www.bmi.bund.de/DE/themen/migration/rueckkehr-politik/rueckkehrpolitik-node.html.
Table 1 Expired EU Calls for AMIF Proposals Deadline Call for proposals in the area of integration of third-country nationals (2018) (AMIF-2018-AG-INTE) 31/01/2019 Call for proposals to support awareness raising and information campaigns on the risks of irregular migration in selected third countries (2017) (AMIF-2017-AG-INFO) 05/04/2018
Call for proposals in the area of integration of third-country nationals (2017) (AMIF-2017-AG-INTE) 01/03/2018 Call for proposals on the actions in the area of integration (HOME/2015/AMIF/AG/INTE) 29/02/2016 Call for proposals on the actions addressing trafficking in human beings, in particular the integration and the safe and sustainable return of victims of trafficking in human beings (HOME/2015/AMIF/AG/THBX) 16/02/2016
Call for proposals on the actions in the area of monitoring of forced return (HOME/2015/AMIF/AG/FRTM) 11/02/2016 Source: https://ec.europa.eu/home-affairs/financing/fundings/migration-asylum-borders/asylum-migration-integration-fund/union-actions_en.
s
Table 1

45
SPOTLIGHT
CESifo Forum 4 / 2019 December Volume 20
able AMIF funds on this important migration policy. These AMIF funds will primarily be used to support the continuation and expansion of initiatives, partic-ularly in the fields of better coordination of national measures to promote and repatriate people, and the networking of the actors involved at the federal, Länder, and local levels as well as of the NGOs. Addi-tional support strategies addressing the voluntary return include: the need-based further development of the German REAG/GARP support program;9 the stimulation of greater publicity for the possibilities of return support in Germany; and the creation and expansion of sustainable, social, and economic rein-tegration opportunities in the country of origin, etc.
9 With the Reintegration and Emigration Program for Asylum Seek-ers in Germany / Government Assisted Repatriation Program (REAG/GARP), the Federal Government and the Länder support persons in their voluntary return to their country of origin or in their onward mi-gration to a host country – see http://www.bamf.de/DE/Rueckkehr/FoerderprogrammREAGGARP/foerderprogramm-reag-garp-node.html.

46
TRENDS
CESifo Forum 4 / 2019 December Volume 20
Financial Conditions in the Euro Area
-202468
101214
2006 2007 2008 2009 2010 2011 2012 2013 2014 2015 2016 2017 2018 2019
ᵃ Annual percentage change (3-month moving average).Source: European Central Bank. © ifo Institute
Change in M3ᵃ
%
ECB reference value 4.5%
The annual growth rate of M3 stood at 5.6% in October 2019, unchanged from previous month. The three-month average of the annual growth rate of M3 over the period from August 2019 to October 2019 reached also 5.6%.
-7
-6
-5
-4
-3
-2
-1
020062007200820092010201120122013201420152016201720182019
Note: MCI index is calculated as a (smoothed) weighted average of real short-term interest rates (nominal rate minus core inflation rate HCPI) and the real effective exchange rate of the euro.Source: European Central Bank; calculations by the ifo Institute. © ifo Institute
Monetary Conditions Index
1994 = 0 (inverted scale)monetary
easing
monetarytightening
Average (1999–2018)
Between April 2010 and July 2011, the monetary conditions index had remained stable. Its rapid upward trend since August 2011 had led to the first peak in July 2012, signaling greater monetary easing. In particular, this was the result of decreasing real short-term interest rates. In May 2017 the index had reached the highest level in the investigated period since 2004 and its slow downward trend was observed thereafter. Yet since October 2018 a gradual increase started and the index reached the highest level in October 2019 again, which is comparable to that of May 2017.
100
200
300
400
500
600
2006 2007 2008 2009 2010 2011 2012 2013 2014 2015 2016 2017 2018 2019
Euro STOXX 50 Dow Jones industrial German share index (DAX)
Source: Deutsche Börse; Dow Jones; STOXX. © ifo Institute
Stock Market Indices
January 1996 = 100
The German stock index DAX increased in November 2019, averaging 13,201 points compared to 12,285 points in September 2019. The Euro STOXX also increased from 3,515 to 3,693 in the same period of time. The Dow Jones Industrial was not an exception: it also increased, averaging 27,815 points in November 2019, compared to 26,877 points in September 2019.
In the three-month period from September 2019 to November 2019 short-term interest rates increased: the three-month EURIBOR rate amounted to – 0.40% in November 2019 compared to – 0.42 in September 2019. The ten-year bond yields declined from 0.23% in July 2019 to 0.07% in September 2019, while the yield spread increased from 0.35% to 0.40% between September 2019 and November 2019.
-2
0
2
4
6
2006 2007 2008 2009 2010 2011 2012 2013 2014 2015 2016 2017 2018 2019
Yield spread Short-term Long-term
ᵃ Weighted average (GDP weights).Source: European Central Bank. © ifo Institute
Nominal Interest Rates ᵃ
%

47
TRENDS
CESifo Forum 4 / 2019 December Volume 20
-10
-5
0
5
10
2016 2017 2018 2019
Industrial confidenceᵃConsumer confidenceᵇ
Source: European Commision. © ifo Institute
EU28 Industrial and Consumer Confidence IndicatorsPercentage balance, seasonally adjusted
%
In November 2019, the industrial confidence indicator increased by 0.3 in both the EU28 and the euro area (EA19). The consumer confidence indicator also increased by 0.6 in the EU28 and by 0.4 in the EA19 in November 2019.
a Theindustrialconfidenceindicatorisanaverageofresponses(balances)tothequestionson production expectations, order-books and stocks (the latter with inverted sign).
b Newconsumerconfidenceindicators,calculatedasanarithmeticaverageofthefollowingquestions:financialandgeneraleconomicsituation(overthenext12months),unemploy-ment expectations (over the next 12 months) and savings (over the next 12 months). Sea-sonally adjusted data.
68
70
72
74
76
78
80
82
84
86
-70
-60
-50
-40
-30
-20
-10
0
10
20
2016 2017 2018 2019
Capacity utilization
Source: European Commission. © ifo Institute
EU28 Capacity Utilisation and Order Books in the Manufacturing Industry
Balance %Assessment of order books
Managers’ assessment of order books reached – 18.8 in November 2019, compared to – 18.4 in October 2019. In September 2019 the indicator had amounted to – 18.0. Capacity utilizationamountedto81.1inthefourthquarterof2019,downfrom81.6inthethirdquarterof2019.
2006 2007 2008 2009 2010 2011 2012 2013 2014 2015 2016 2017 2018 2019-8
-6
-4
-2
0
2
4
6
EA19
EU28
Source: Eurostat.
Gross Domestic Product in Constant 2010 PricesPercentage change over previous year
© ifo Institute
%
According to the Eurostat estimates, GDP grew by 0.2% in the euro area (EA19), and by 0.3%intheEU28duringthethirdquarterof2019,comparedtothepreviousquarter.Inthesecondquarterof2019theGDPhadgrownby0.2%inbothzones.Comparedtothethirdquarterof2018,i.e.,yearoveryear,seasonallyadjustedGDProseby1.2%intheEA19andby1.4%intheEU28inthethirdquarterof2019.
60
70
80
90
100
110
120
2006 2007 2008 2009 2010 2011 2012 2013 2014 2015 2016 2017 2018 2019Source: European Commission. © ifo Institute
EU28 Economic Sentiment IndicatorSeasonally adjusted
1990–2012 = 100
In November 2019 the Economic Sentiment Indicator (ESI) increased slightly in the euro area(by0.5pointsto101.3),andtheEU28(by0.9pointsto100.0).InbothzonestheESIhas recently reached its long-term average.
EU Survey Results
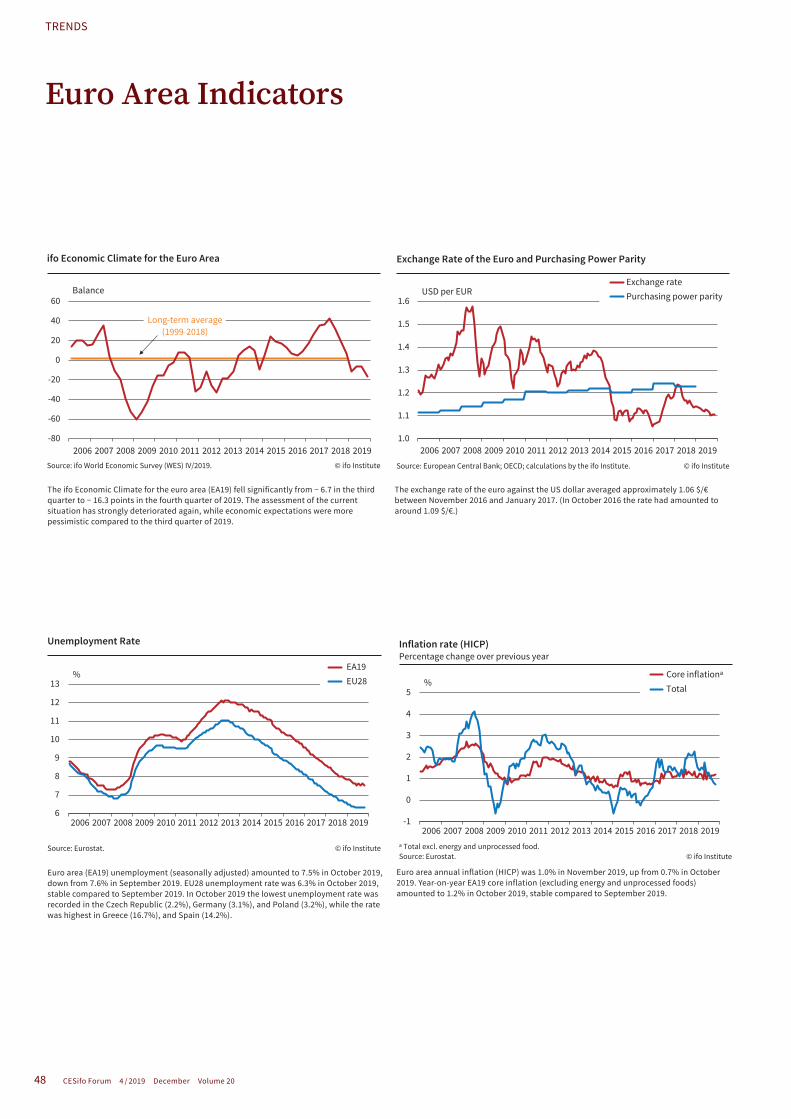
48
TRENDS
CESifo Forum 4 / 2019 December Volume 20
Euro Area Indicators
6
7
8
9
10
11
12
13
2006 2007 2008 2009 2010 2011 2012 2013 2014 2015 2016 2017 2018 2019
EA19 EU28
Source: Eurostat. © ifo Institute
Unemployment Rate
%
Euro area (EA19) unemployment (seasonally adjusted) amounted to 7.5% in October 2019, down from 7.6% in September 2019. EU28 unemployment rate was 6.3% in October 2019, stable compared to September 2019. In October 2019 the lowest unemployment rate was recordedintheCzechRepublic(2.2%),Germany(3.1%),andPoland(3.2%),whiletheratewas highest in Greece (16.7%), and Spain (14.2%).
-1
0
1
2
3
4
5
2006 2007 2008 2009 2010 2011 2012 2013 2014 2015 2016 2017 2018 2019
Core inflationᵃ Total
ᵃ Total excl. energy and unprocessed food.Source: Eurostat. © ifo Institute
Inflation rate (HICP)Percentage change over previous year
%
Euroareaannualinflation(HICP)was1.0%inNovember2019,upfrom0.7%inOctober2019. Year-on-year EA19 core inflation (excluding energy and unprocessed foods) amounted to 1.2% in October 2019, stable compared to September 2019.
-80
-60
-40
-20
0
20
40
60
2006 2007 2008 2009 2010 2011 2012 2013 2014 2015 2016 2017 2018 2019Source: ifo World Economic Survey (WES) IV/2019. © ifo Institute
ifo Economic Climate for the Euro Area
Balance
Long-term average (1999–2018)
TheifoEconomicClimatefortheeuroarea(EA19)fellsignificantlyfrom−6.7inthethirdquarterto−16.3pointsinthefourthquarterof2019.Theassessmentofthecurrentsituation has strongly deteriorated again, while economic expectations were more pessimisticcomparedtothethirdquarterof2019.
2006 2007 2008 2009 2010 2011 2012 2013 2014 2015 2016 2017 2018 2019
Exchange rate Purchasing power parity
Source: European Central Bank; OECD; calculations by the ifo Institute. © ifo Institute
Exchange Rate of the Euro and Purchasing Power Parity
USD per EUR1.6
1.0
1.1
1.3
1.2
1.5
1.4
The exchange rate of the euro against the US dollar averaged approximately 1.06 $/€ between November 2016 and January 2017. (In October 2016 the rate had amounted to around 1.09 $/€.)
Related Documents


