FOCUS BALANCE SCALE Annual Report 2003

Welcome message from author
This document is posted to help you gain knowledge. Please leave a comment to let me know what you think about it! Share it to your friends and learn new things together.
Transcript
CapitaLand Limited168 Robinson Road #30-01 Capital TowerSingapore 068912
Tel: (65) 6823 3200
Fax: (65) 6820 2202
Web Site: www.capitaland.com
FOCUSBALANCESCALEAnnual Report 2003
FOC
US B
ALA
NC
E SCA
LE C
apitaLand Limited A
nnual Report 2003
CL AR03 cover A/W-OK 17/03/2004 05:54 PM Page 1

PROFILE
CapitaLand is one of the largest listed property companies in Asia.Headquartered in Singapore, the multinational company’s core businessesin property, hospitality, property services and real estate financial servicesare focused in gateway cities in Asia, Australia and Europe. In thesecountries, CapitaLand is in partnership with reputable local players andhas established a management team that understands the market,business practices and socio-economic factors.
The company’s hospitality businesses, in hotels and serviced residences,span more than 60 cities around the world. CapitaLand also leverages onits significant real estate asset base and market knowledge to develop fee-based products and services in Singapore and the region.
The listed subsidiaries and associates of CapitaLand Limited includeRaffles Holdings, The Ascott Group, Australand Property Group (which is listed both in Singapore and Australia) and CapitaMall Trust.
1 Raffles Hotel Le Royal, Phnom Penh
2 Swissôtel Chicago3 Swissôtel The Stamford and
Raffles The Plaza, Singapore4 Swissôtel Métropole, Geneva5 Citadines Paris Louvre, Paris6 Somerset Salcedo, Manila
7 The Ascott Kuala Lumpur8 The Ascott Beijing9 The Loft, Singapore10 Balmain Shores, Sydney11 Regency Park, Sydney12 SunGlade, Singapore13 Canary Riverside, London14 Shinjuku Tower, Japan
15 Plaza Singapura, Singapore16 Tampines Mall, Singapore17 Technopark @ Chai Chee,
Singapore18 Caltex House, Singapore19 Springleaf Tower, Singapore20 Capital Tower, Singapore
CapitaLand Group’s properties on the front cover are:1
2
3
4
5
6
7
8
9
10
11
12
13
14
15
16
17
18
19
20 This Annual Report may contain forward-looking statements that involve risks and uncertainties. Actual future performance, outcomes and results may differ materially from those expressedin forward-looking statements as a result of a number of risks, uncertainties and assumptions. Representative examples of these factors include (without limitation) general industry andeconomic conditions, interest rate trends, cost of capital and capital availability, availability of real estate properties, competition from other companies and venues for the sale/distribution ofgoods and services, shifts in customer demands, customers and partners, changes in operating expenses, including employee wages, benefits and training, governmental and public policychanges and the continued availability of financing in the amounts and the terms necessary to support future business. You are cautioned not to place undue reliance on these forward-looking statements, which are based on current view of management on future events.
CapitaLand Limited168 Robinson Road#30-01 Capital TowerSingapore 068912Tel: (65) 6823 3200Fax: (65) 6820 [email protected]
CapitaLand Commercial Limited39 Robinson Road#18-01 Robinson PointSingapore 068911Tel: (65) 6536 1188Fax: (65) 6536 [email protected]
CapitaLand Financial Limited39 Robinson Road#18-01 Robinson PointSingapore 068911Tel: (65) 6536 1188Fax: (65) 6536 [email protected]
CapitaLand Residential Limited8 Shenton Way#21-01 Temasek TowerSingapore 068811Tel: (65) 6820 2188Marketing hotline: (65) 6826 6800Fax: (65) 6820 [email protected]
The Ascott Group Limited8 Shenton Way #13-01 Temasek TowerSingapore 068811Tel: (65) 6220 8222Fax: (65) 6227 2220www.the-ascott.comir&[email protected]
Raffles Holdings Limited2 Stamford Road#06-01 Raffles City Convention CentreSingapore 178882Tel: (65) 6339 8377Fax: (65) 6339 [email protected]
PREMAS International LimitedBlk 750 Oasis Chai Chee RoadTechnopark @ Chai Chee #01-01Singapore 469000Tel: (65) 6876 0088Fax: (65) 6538 [email protected]
AuditorsKPMG16 Raffles Quay#22-00 Hong Leong BuildingSingapore 048581Tel: (65) 6213 3388Fax: (65) 6225 6157(Engagement Partner since financial year ended 31 December 2001: Martha Tan Hui Keng)
RegistrarLim Associates (Pte) Ltd10 Collyer Quay#19-08 Ocean BuildingSingapore 049315Tel: (65) 6536 5355Fax: (65) 6536 1360
MAIN CONTACTS
Con
cept
and
Des
ign
by E
quus
w
ww
.equ
us-d
esig
n.co
m
� �
� �
����� ���� ���� � � ���� � ��� �� � �� ��� ����������� �� ��������� � ��� ������� �������������� �� ����� ��� �� ���!��" �� ������
#$���%���&���'���(���$�)�*��#'�#+�'���$)'����(���
&$�'������)������$�������
� � � � � � � �� � ������ �����SL174649 DL-MAC5 09.03.04 175#
HTS1P361C
CL AR03 cover A/W-OK 17/03/2004 05:55 PM Page 2
1
Cap
itaLa
ndA
R 0
3FO
CUS
BA
LAN
CE S
CALE
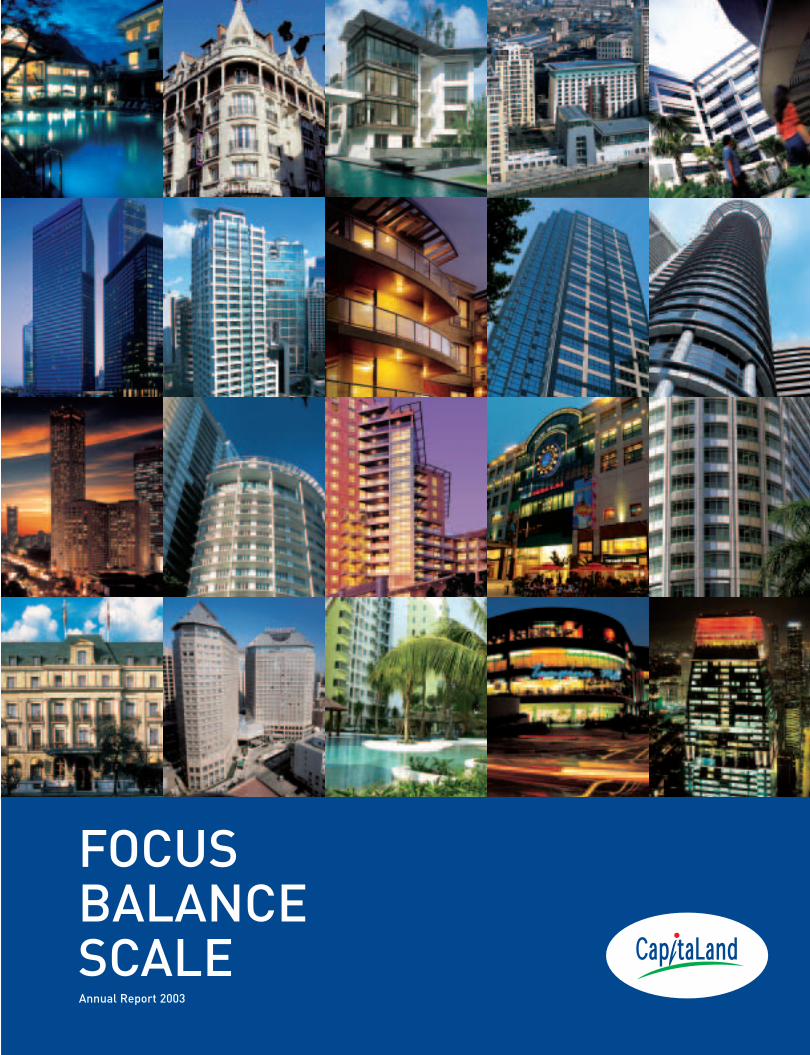
2 Our Reach4 Financial Highlights6 Focus8 Balance10 Scale12 Letter to Shareholders18 Board of Directors19 Directors’ Profile22 Corporate Directory23 International Advisory Panel24 Group Structure 25 Council of CEOs26 Year in Brief 29 Corporate Office30 At a Glance32 Residential36 Commercial40 Property Services
44 Hotels48 Serviced Residences52 Financial Services55 Portfolio Details59 Portfolio Analysis60 Investor Relations
Cost ManagementStrategic Corporate Marketing
61 Human ResourcesInformation Technology
62 Social Responsibility64 Performance Review70 Economic Value Added
Statements71 Value Added Statements72 5-Year Financial Summary73 Statutory Accounts74 Directors’ Report
90 Statement by Directors91 Report of the Auditors92 Balance Sheets93 Profit and Loss Accounts94 Statements of Changes
in Equity96 Consolidated Statement
of Cash Flows98 Notes to the Financial
Statements152 Financial Calendar153 Corporate Governance161 Additional Information166 Shareholding Statistics168 Notice of Annual
General Meeting171 Proxy Form172 Notes to Proxy Form
CONTENTS
OUR MISSION
To build a world-class property company with international presence that:• creates sustainable shareholder value• delivers quality products and services• attracts and develops quality human capital
CL AR03 1-29 A/W.OK 17/03/2004 05:58 PM Page 1
HOTELS
SERVICED RESIDENCES
RESIDENTIAL
COMMERCIAL
PROPERTY SERVICES
FINANCIAL SERVICES
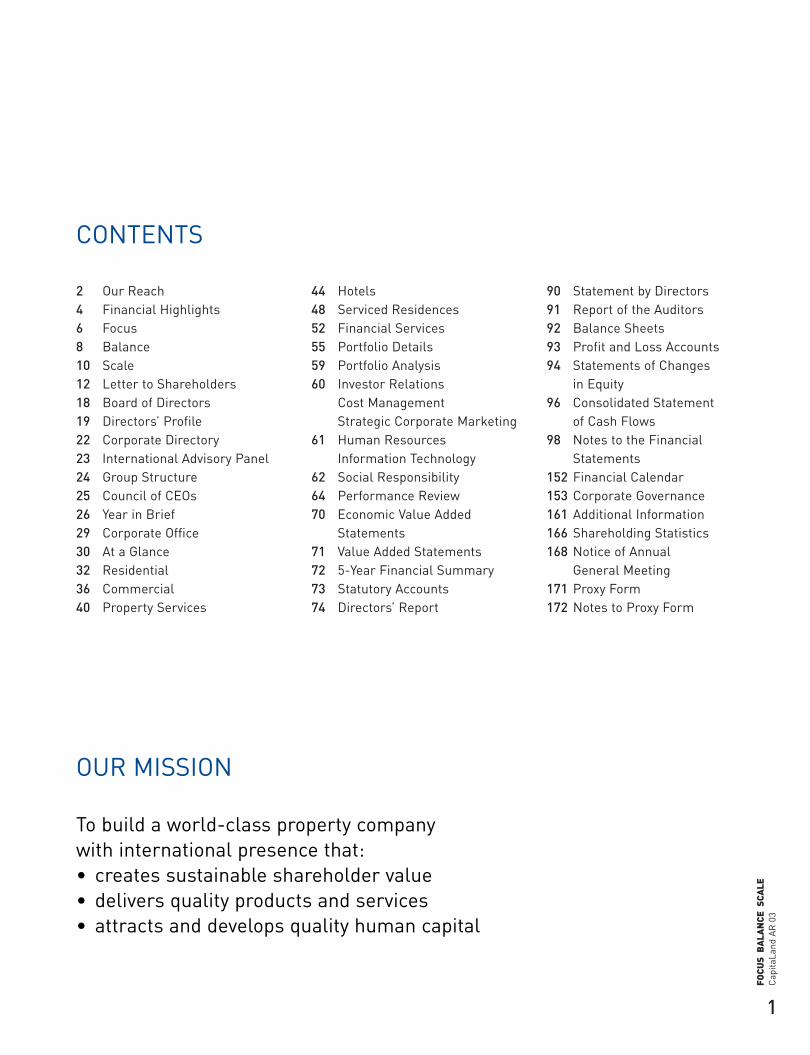
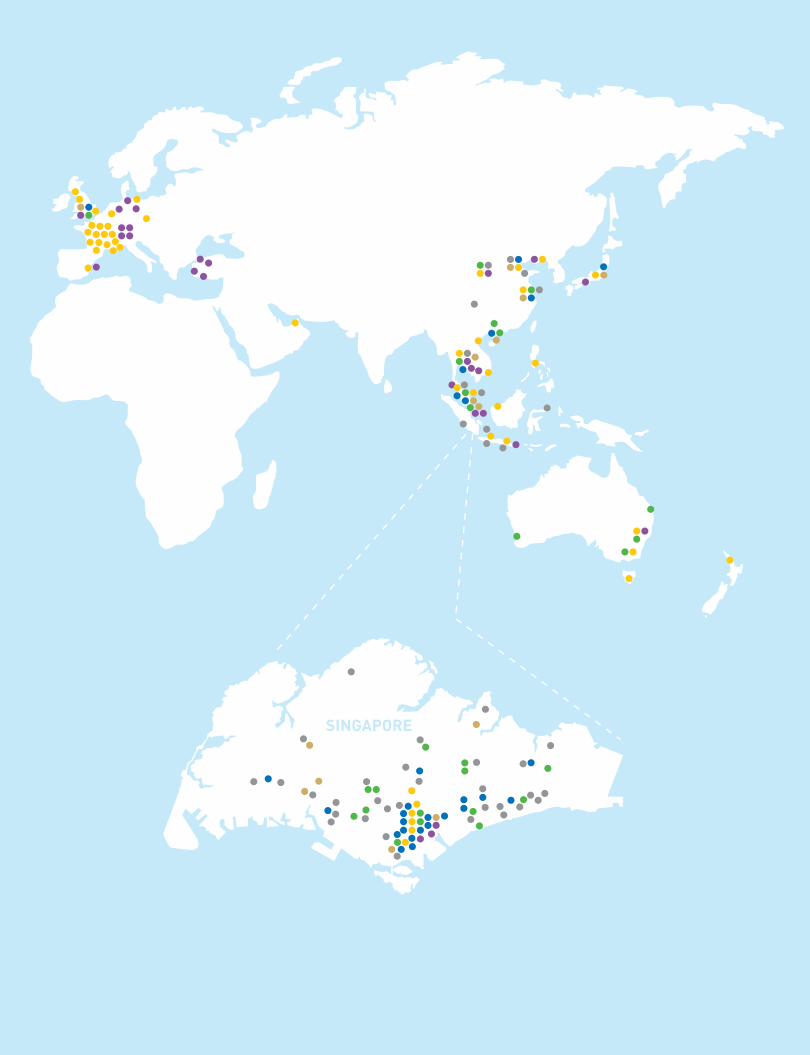
OUR REACH – Our businesses span more than 70 cities in 24 countries
KEY GATEWAYCITIES:
BangkokBeijingDubaiHong KongLondonMelbourneShanghaiSingaporeSydneyTokyo
GLOBALPRESENCE:
ASIA- PACIFIC
AustraliaBrisbanePerthHobartSydneyMelbourne
CambodiaPhnom PenhSiem Reap
ChinaBeijingChengduDalianGuangzhouHong KongQingdaoShanghaiTianjinWuhanXiamen
IndonesiaBaliBandungBintanJakartaManadoPalembangSurabaya
JapanOsakaTokyo
MalaysiaJohorKuala LumpurKuchingPenang
New ZealandAuckland
PhilippinesManila
Singapore
ThailandBangkokPhuket
VietnamHanoiHo Chi Minh City
EUROPE
BelgiumBrussels
FranceAix-en-ProvenceBordeauxCannesGaillardGenéveGrenobleLilleLyonMarseilleMontpellierNiceParisStrasbourgToulouse
GermanyBerlinDüsseldorfHamburg
NetherlandsAmsterdam
SpainBarcelonaMallorca
SwitzerlandBaselGenevaMontreuxZürich
TurkeyBursaGöcekIzmirIstanbul
UKLondonGlasgowManchester
MIDDLE EAST
UAEDubai
THE AMERICAS
CarribeanCanouan Island,The Grenadines
EcuadorQuito
PeruLima
USAAtlantaChicagoLos AngelesNew York
All information as at 31 December 2003
CL AR03 1-29 A/W.OK 17/03/2004 05:58 PM Page 2
SINGAPORE
CL AR03 1-29 A/W.OK 17/03/2004 05:59 PM Page 3
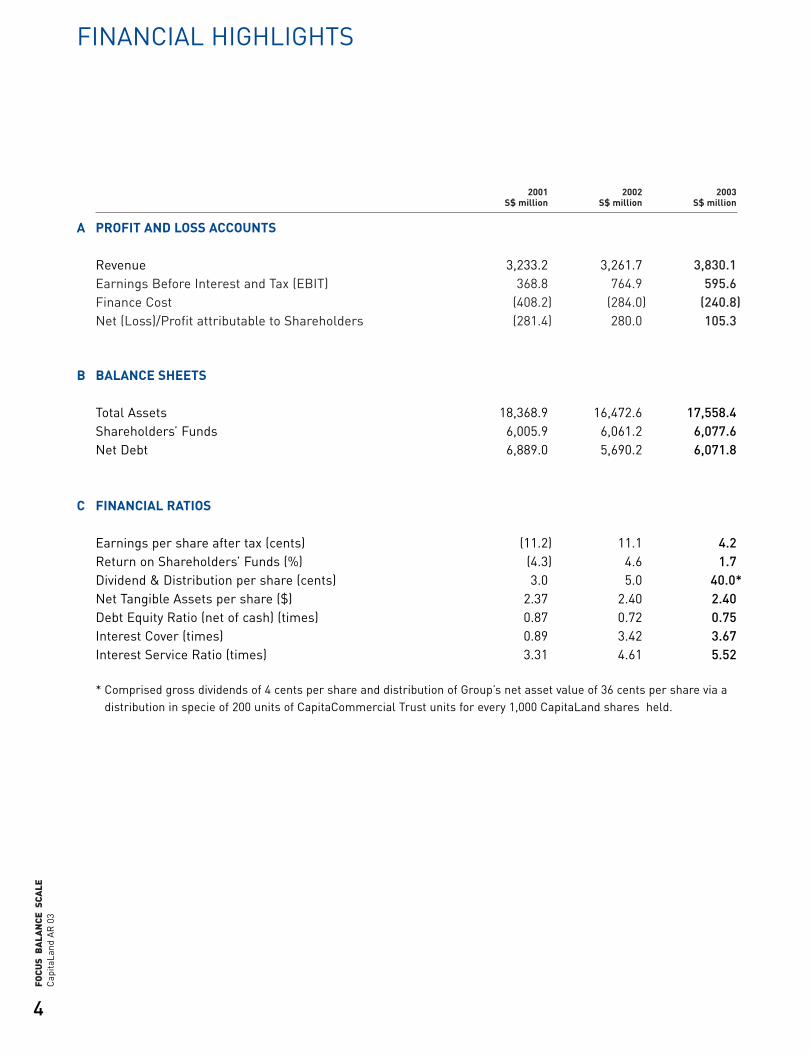
FINANCIAL HIGHLIGHTS
2001 2002 2003S$ million S$ million S$ million
A PROFIT AND LOSS ACCOUNTS
Revenue 3,233.2 3,261.7 3,830.1Earnings Before Interest and Tax (EBIT) 368.8 764.9 595.6Finance Cost (408.2) (284.0) (240.8)Net (Loss)/Profit attributable to Shareholders (281.4) 280.0 105.3
B BALANCE SHEETS
Total Assets 18,368.9 16,472.6 17,558.4Shareholders’ Funds 6,005.9 6,061.2 6,077.6Net Debt 6,889.0 5,690.2 6,071.8
C FINANCIAL RATIOS
Earnings per share after tax (cents) (11.2) 11.1 4.2Return on Shareholders’ Funds (%) (4.3) 4.6 1.7Dividend & Distribution per share (cents) 3.0 5.0 40.0*Net Tangible Assets per share ($) 2.37 2.40 2.40Debt Equity Ratio (net of cash) (times) 0.87 0.72 0.75Interest Cover (times) 0.89 3.42 3.67Interest Service Ratio (times) 3.31 4.61 5.52
* Comprised gross dividends of 4 cents per share and distribution of Group’s net asset value of 36 cents per share via adistribution in specie of 200 units of CapitaCommercial Trust units for every 1,000 CapitaLand shares held.
4
Cap
itaLa
ndA
R 0
3FO
CUS
BA
LAN
CE S
CALE
CL AR03 4-5-OK 17/03/2004 06:00 PM Page 4
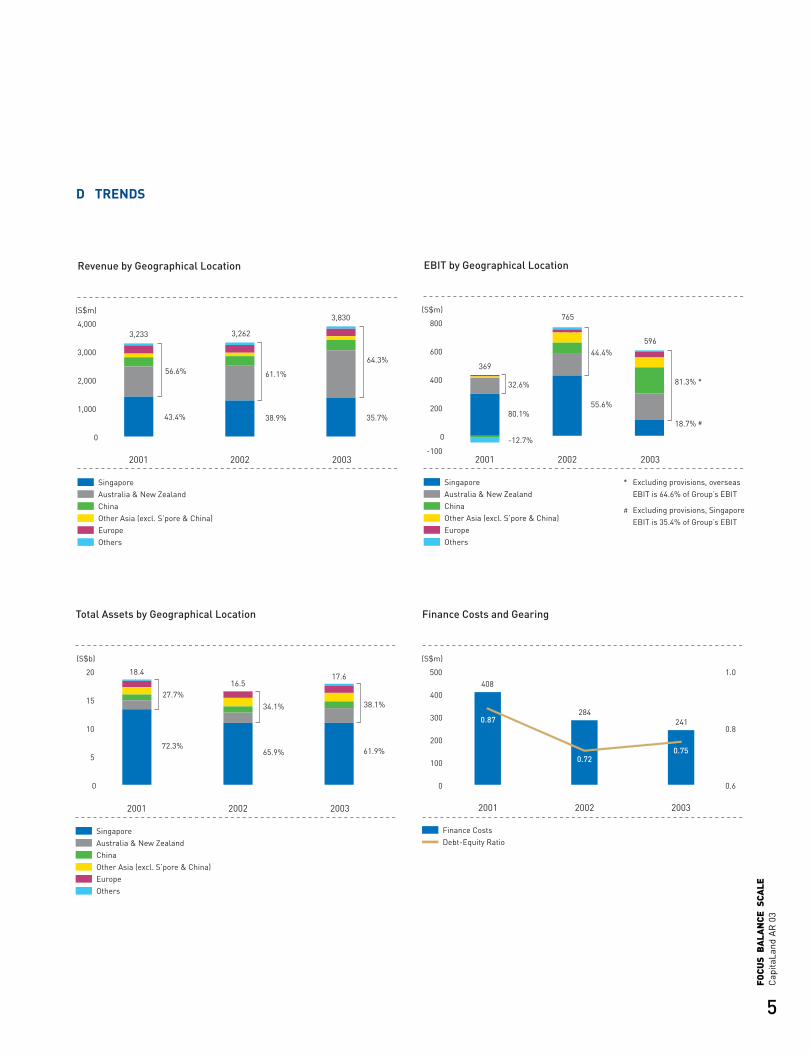
Revenue by Geographical Location
(S$m)
0
1,000
2,000
3,000
4,000
SingaporeAustralia & New ZealandChinaOther Asia (excl. S’pore & China)EuropeOthers
2001 2002 2003
3,233 3,262
3,830
56.6% 61.1%
38.9%
64.3%
35.7%43.4%
Total Assets by Geographical Location
(S$b)
0
5
10
15
20
SingaporeAustralia & New ZealandChinaOther Asia (excl. S’pore & China)EuropeOthers
2001 2002 2003
18.416.5
17.6
27.7%34.1%
65.9%
38.1%
61.9%72.3%
EBIT by Geographical Location
(S$m)
0
200
-100
400
600
800
SingaporeAustralia & New ZealandChinaOther Asia (excl. S’pore & China)EuropeOthers
2001 2002 2003
369
3,262
765
596
* Excluding provisions, overseas EBIT is 64.6% of Group’s EBIT
# Excluding provisions, Singapore EBIT is 35.4% of Group’s EBIT
32.6%
44.4%
55.6%
81.3% *
18.7% #80.1%
-12.7%
Finance Costs and Gearing
(S$m)
2001 2002 2003
0
100
200
300
400
500
0.6
0.8
1.0
Finance CostsDebt-Equity Ratio
408
0.87
0.720.75
284241
5
Cap
itaLa
ndA
R 0
3FO
CUS
BA
LAN
CE S
CALE
D TRENDS
CL AR03 4-5-OK 17/03/2004 06:00 PM Page 5

CL AR03 1-29 A/W.OK 17/03/2004 06:02 PM Page 6

7
Cap
itaLa
ndA
R 0
3FO
CUS
BA
LAN
CE S
CALE
We focus on our corecompetences in real estateand hospitality businesses.For real estate, we are inselected key gateway citiesthat are cosmopolitan and commercially vibrant.
FOCUS
CL AR03 1-29 A/W.OK 17/03/2004 06:02 PM Page 7

CL AR03 1-29 A/W.OK 17/03/2004 06:02 PM Page 8

9
Cap
itaLa
ndA
R 0
3FO
CUS
BA
LAN
CE S
CALE
We have a balanced portfolioof trading, investment and fee-based businesses inSingapore and overseas. Weare flexible and nimble to seekand seize growth opportunitiesin mature and new markets.
BALANCE
CL AR03 1-29 A/W.OK 17/03/2004 06:02 PM Page 9

CL AR03 1-29 A/W.OK 17/03/2004 06:02 PM Page 10
11
Cap
itaLa
ndA
R 0
3FO
CUS
BA
LAN
CE S
CALE
We have grown to a significantscale internationally and in keygateway cities. Our hospitalitybusiness has a global presencewith highly visible brandrecognition. Given our widegeographic reach, we are ableto attract global talents andinternational partners.
SCALE
CL AR03 1-29 A/W.OK 17/03/2004 06:02 PM Page 11

12
Cap
itaLa
ndA
R 0
3FO
CUS
BA
LAN
CE S
CALE
Dear Shareholders,The Group revenue in 2003 was S$3.83 billion, a17.4% increase compared to S$3.26 billion in 2002.At the operating level, the Group’s underlying profits excluding the value of property revaluation,performed better than 2002. Excluding provisionsand portfolio gains, the Group’s 2003 PATMI (profitafter tax and minority interests) was S$210.6 million,compared to the 2002 PATMI of S$172.3 million, a22.2% increase. All of this was achieved despite theadverse effects of the Severe Acute RespiratorySyndrome (SARS) in Asia and war in Iraq.
At the end of the year, the Group did a comprehensiverevaluation of the capital values of its investmentproperties in accordance with its standard practiceand the decline in values reduced the Group’s profitto S$105.3 million after tax and minority interests.Finance costs were S$240.8 million, which wereS$43.2 million or 15.2% lower than S$284.0 million in 2002.
In the course of the year, we strengthened our balance sheet and generated healthy net cashflow from our operations, in excess of S$1.3 billion in2003, comparable to 2002. Overall, the Group was ina strong position to weather these difficult marketconditions and deliver on its ‘Focus, Balance, Scale’strategy, raise asset productivity, and grow highervalue added services.
Benefiting from a Multi-Local Operations StrategyBy having a geographically spread portfolio, theGroup was able to take advantage of the differentproperty cycles and risk-return profiles in thedifferent markets and reduce its reliance on any one market. During the SARS outbreak, for example,our global presence beyond Asia helped mitigate thenegative impact of SARS in the Asian countries. Moreimportantly, the overseas expansion has provided theGroup with a strong platform for robust, profitablegrowth. Over the next five years, the Group plans tohave at least 75% of its total earnings from overseas.
CHINAThe year also saw the Group taking further steps toadd depth and breadth to our multi-local strategy.This strategy calls for a deep appreciation of therespective domestic real estate markets. In China, weexpanded our residential development business. InBeijing, we acquired a 1.09 million square feet site inthe Chaoyang District, near the Olympic Park, whereapproximately 2,000 quality condominium units canbe developed over the next three to five years. Todate, CapitaLand has built over 4,000 condominiumunits in Shanghai, with another 6,000 units underplanning and development in Shanghai and Beijing.Our two new projects in Shanghai – La Cité and Oasis Riviera – received enthusiastic response.
LETTER TO SHAREHOLDERS
PHILIP YEOChairman
LIEW MUN LEONGPresident and CEO
CL AR03 1-29 A/W.OK 17/03/2004 06:02 PM Page 12
13
Cap
itaLa
ndA
R 0
3FO
CUS
BA
LAN
CE S
CALE
Our three commercial properties in China arestrategically located within thriving central businessdistricts. In 2003, we completed the development of Raffles City Shanghai. Since its opening inNovember, the retail podium of Raffles City Shanghaihas achieved 100% occupancy with an increasing flowof shoppers, because of its location in the heart ofthe Shanghai business district. Another commercialcomplex, located in Luwan’s Huaihai Road centralbusiness district, will be completed by 2005. Thesecommercial properties are in addition to PidemcoTower in the Huangpu central business district.
Our hospitality and property services businesses alsohave a strong presence in China. The Ascott Groupis the largest international player in the servicedresidence sector, with 1,600 units; Raffles Holdingshas 750 hotel rooms in Beijing and Dalian; whilePREMAS manages 19.2 million square feet of realestate in five Chinese cities.
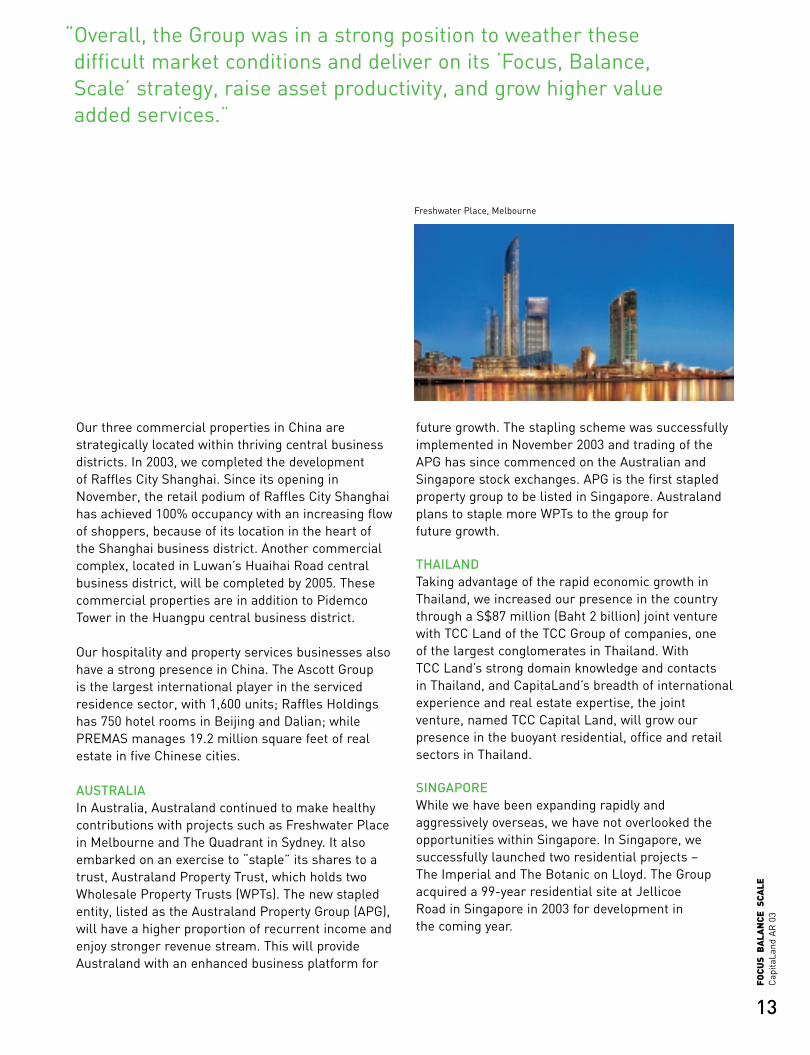
AUSTRALIAIn Australia, Australand continued to make healthycontributions with projects such as Freshwater Placein Melbourne and The Quadrant in Sydney. It alsoembarked on an exercise to “staple” its shares to atrust, Australand Property Trust, which holds twoWholesale Property Trusts (WPTs). The new stapledentity, listed as the Australand Property Group (APG),will have a higher proportion of recurrent income andenjoy stronger revenue stream. This will provideAustraland with an enhanced business platform for
future growth. The stapling scheme was successfullyimplemented in November 2003 and trading of theAPG has since commenced on the Australian andSingapore stock exchanges. APG is the first stapledproperty group to be listed in Singapore. Australandplans to staple more WPTs to the group for future growth.
THAILANDTaking advantage of the rapid economic growth inThailand, we increased our presence in the countrythrough a S$87 million (Baht 2 billion) joint venturewith TCC Land of the TCC Group of companies, one of the largest conglomerates in Thailand. With TCC Land’s strong domain knowledge and contacts in Thailand, and CapitaLand’s breadth of internationalexperience and real estate expertise, the jointventure, named TCC Capital Land, will grow ourpresence in the buoyant residential, office and retailsectors in Thailand.
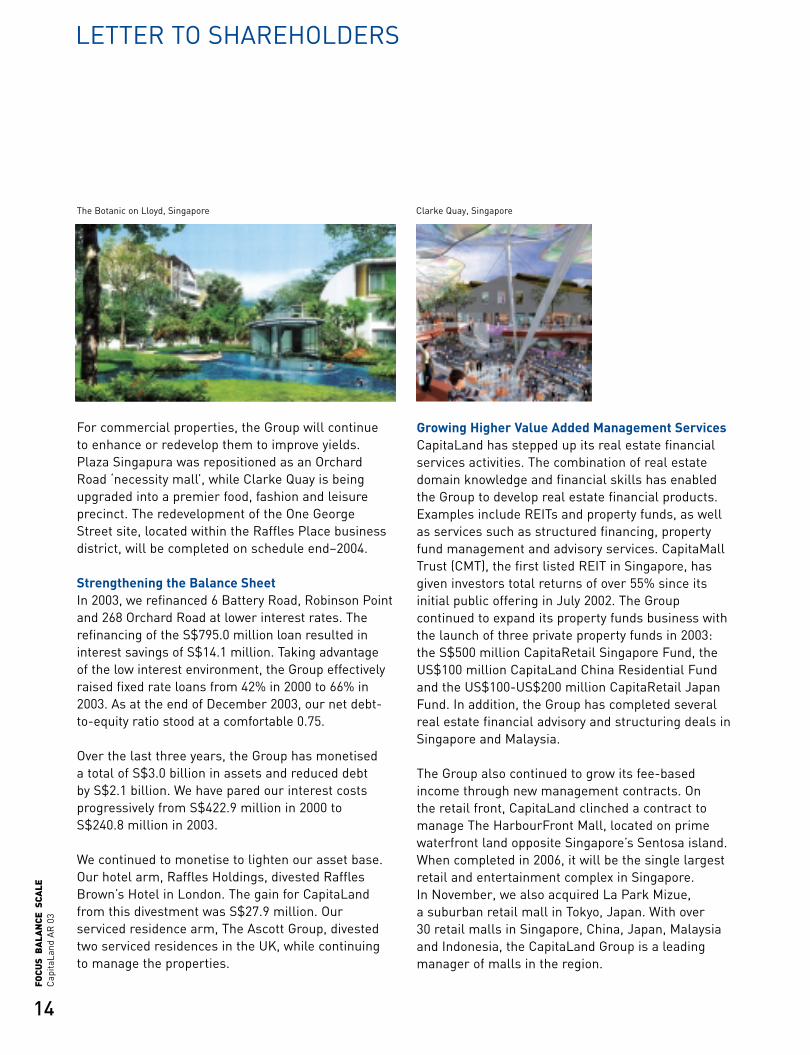
SINGAPOREWhile we have been expanding rapidly andaggressively overseas, we have not overlooked theopportunities within Singapore. In Singapore, wesuccessfully launched two residential projects – The Imperial and The Botanic on Lloyd. The Groupacquired a 99-year residential site at Jellicoe Road in Singapore in 2003 for development in the coming year.
“Overall, the Group was in a strong position to weather thesedifficult market conditions and deliver on its ‘Focus, Balance,Scale’ strategy, raise asset productivity, and grow higher valueadded services.”
Freshwater Place, Melbourne
CL AR03 1-29 A/W.OK 17/03/2004 06:02 PM Page 13
14
Cap
itaLa
ndA
R 0
3FO
CUS
BA
LAN
CE S
CALE
For commercial properties, the Group will continue to enhance or redevelop them to improve yields.Plaza Singapura was repositioned as an OrchardRoad ‘necessity mall’, while Clarke Quay is beingupgraded into a premier food, fashion and leisureprecinct. The redevelopment of the One GeorgeStreet site, located within the Raffles Place businessdistrict, will be completed on schedule end–2004.
Strengthening the Balance SheetIn 2003, we refinanced 6 Battery Road, Robinson Pointand 268 Orchard Road at lower interest rates. Therefinancing of the S$795.0 million loan resulted ininterest savings of S$14.1 million. Taking advantage of the low interest environment, the Group effectivelyraised fixed rate loans from 42% in 2000 to 66% in2003. As at the end of December 2003, our net debt-to-equity ratio stood at a comfortable 0.75.
Over the last three years, the Group has monetised a total of S$3.0 billion in assets and reduced debt by S$2.1 billion. We have pared our interest costsprogressively from S$422.9 million in 2000 to S$240.8 million in 2003.
We continued to monetise to lighten our asset base.Our hotel arm, Raffles Holdings, divested RafflesBrown’s Hotel in London. The gain for CapitaLandfrom this divestment was S$27.9 million. Ourserviced residence arm, The Ascott Group, divestedtwo serviced residences in the UK, while continuingto manage the properties.
Growing Higher Value Added Management ServicesCapitaLand has stepped up its real estate financialservices activities. The combination of real estatedomain knowledge and financial skills has enabledthe Group to develop real estate financial products.Examples include REITs and property funds, as wellas services such as structured financing, propertyfund management and advisory services. CapitaMallTrust (CMT), the first listed REIT in Singapore, hasgiven investors total returns of over 55% since itsinitial public offering in July 2002. The Groupcontinued to expand its property funds business withthe launch of three private property funds in 2003:the S$500 million CapitaRetail Singapore Fund, theUS$100 million CapitaLand China Residential Fundand the US$100-US$200 million CapitaRetail JapanFund. In addition, the Group has completed severalreal estate financial advisory and structuring deals inSingapore and Malaysia.
The Group also continued to grow its fee-basedincome through new management contracts. On the retail front, CapitaLand clinched a contract tomanage The HarbourFront Mall, located on primewaterfront land opposite Singapore’s Sentosa island.When completed in 2006, it will be the single largestretail and entertainment complex in Singapore. In November, we also acquired La Park Mizue, a suburban retail mall in Tokyo, Japan. With over 30 retail malls in Singapore, China, Japan, Malaysiaand Indonesia, the CapitaLand Group is a leadingmanager of malls in the region.
The Botanic on Lloyd, Singapore Clarke Quay, Singapore
LETTER TO SHAREHOLDERS
CL AR03 1-29 A/W.OK 17/03/2004 06:03 PM Page 14

15
Cap
itaLa
ndA
R 0
3FO
CUS
BA
LAN
CE S
CALE
CapitaLand’s hospitality arms have been activelysecuring more management contracts. In 2003,Raffles Holdings clinched four managementcontracts, in Osaka (Japan), Bangkok and Phuket(Thailand), and Canouan Island (The Grenadines inthe Caribbean). This has added more than 1,000rooms to its hotel portfolio. It has also purchased the balance of the stake it did not already own in itsflagship property, Raffles Hotel. During the year, TheAscott Group secured six new management contractsin Australia, China, Thailand, Malaysia, and the Gulfregion. It will manage two prime serviced residencesin Dubai in the United Arab Emirates.
Talent Management & Employee DevelopmentThe Group places strong emphasis on thedevelopment of human capital. Senior management iscommitted to the identification of talent through closemonitoring of job performance and regular contact.This includes small group and one-on-one sessionsbetween the CEO and senior management and theidentified talents. Such sessions are held not only inSingapore but also overseas to include overseas staff.In 2003, a new talent development initiative was the CapitaLand Management Programme (CMP),conducted by senior management. CMP’s two-dayprogramme focuses on the Group’s values andincorporates “hands on” management lessons foryoung managers and executives. Other initiativesincluded new development programmes like the
Essentials of Business Management Programme and the Strategic Business Leadership Programme.These have been launched to inculcate key leadershipcompetencies at various levels. Promising CapitaLandexecutives are also sent for programmes in graduatebusiness schools such as Harvard, INSEAD, IMD,Stanford and Wharton.
Corporate GovernanceAt CapitaLand, we firmly believe that integrity,excellence, professionalism and commitment formthe bedrock for a sound system of policies, practicesand internal controls. CapitaLand came out tops in corporate governance polls by regional financialmagazines, FinanceAsia and Asiamoney, and a studyof 180 listed-property companies in Asia-Pacific bythe National University of Singapore. CapitaLand alsoclinched the Most Transparent Company Award in the Property category from the Securities InvestorsAssociation (Singapore) for the third consecutive year.
Nai Lert Park, Bangkok
“At CapitaLand, we firmly believe that integrity, excellence,professionalism and commitment form the bedrock for asound system of policies, practices and internal controls.”
CL AR03 1-29 A/W.OK 17/03/2004 06:03 PM Page 15
16
Cap
itaLa
ndA
R 0
3FO
CUS
BA
LAN
CE S
CALE
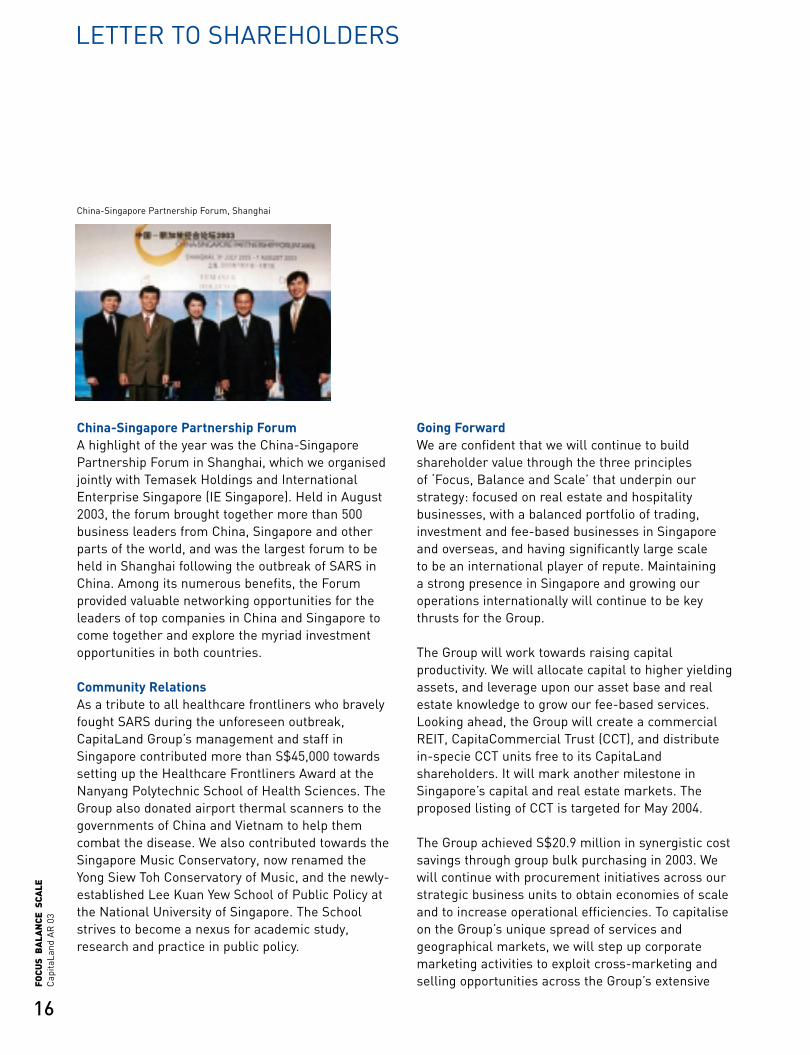
China-Singapore Partnership ForumA highlight of the year was the China-SingaporePartnership Forum in Shanghai, which we organisedjointly with Temasek Holdings and InternationalEnterprise Singapore (IE Singapore). Held in August2003, the forum brought together more than 500business leaders from China, Singapore and otherparts of the world, and was the largest forum to beheld in Shanghai following the outbreak of SARS inChina. Among its numerous benefits, the Forumprovided valuable networking opportunities for theleaders of top companies in China and Singapore tocome together and explore the myriad investmentopportunities in both countries.
Community RelationsAs a tribute to all healthcare frontliners who bravelyfought SARS during the unforeseen outbreak,CapitaLand Group’s management and staff inSingapore contributed more than S$45,000 towardssetting up the Healthcare Frontliners Award at theNanyang Polytechnic School of Health Sciences. TheGroup also donated airport thermal scanners to thegovernments of China and Vietnam to help themcombat the disease. We also contributed towards theSingapore Music Conservatory, now renamed theYong Siew Toh Conservatory of Music, and the newly-established Lee Kuan Yew School of Public Policy atthe National University of Singapore. The Schoolstrives to become a nexus for academic study,research and practice in public policy.
Going ForwardWe are confident that we will continue to buildshareholder value through the three principles of ‘Focus, Balance and Scale’ that underpin ourstrategy: focused on real estate and hospitalitybusinesses, with a balanced portfolio of trading,investment and fee-based businesses in Singaporeand overseas, and having significantly large scale to be an international player of repute. Maintaining a strong presence in Singapore and growing ouroperations internationally will continue to be keythrusts for the Group.
The Group will work towards raising capitalproductivity. We will allocate capital to higher yieldingassets, and leverage upon our asset base and realestate knowledge to grow our fee-based services.Looking ahead, the Group will create a commercialREIT, CapitaCommercial Trust (CCT), and distributein-specie CCT units free to its CapitaLandshareholders. It will mark another milestone inSingapore’s capital and real estate markets. Theproposed listing of CCT is targeted for May 2004.
The Group achieved S$20.9 million in synergistic costsavings through group bulk purchasing in 2003. Wewill continue with procurement initiatives across ourstrategic business units to obtain economies of scaleand to increase operational efficiencies. To capitaliseon the Group’s unique spread of services andgeographical markets, we will step up corporatemarketing activities to exploit cross-marketing andselling opportunities across the Group’s extensive
LETTER TO SHAREHOLDERS
China-Singapore Partnership Forum, Shanghai
CL AR03 1-29 A/W.OK 17/03/2004 06:03 PM Page 16
17
Cap
itaLa
ndA
R 0
3FO
CUS
BA
LAN
CE S
CALE
network of client and business contacts. A StrategicCorporate Marketing unit has been formed, tospearhead initiatives to better market the Group as a whole.
In the span of three short years, CapitaLand hasemerged as a highly regarded international propertyand hospitality Group. Our success is attributable to our shareholders, customers, tenants, serviceproviders and partners. We would like to thank themall for their support, confidence and trust.
In particular, we wish to express our deepappreciation to our Board members for theirinvaluable contributions. In 2003, we welcomed Mr Richard Hale, who joined our Board on 10February 2003, and Mr Andrew Buxton, who wasappointed a Director with effect from 1 June 2003.
In October, CapitaLand’s International Advisory Panel(IAP), comprising industry leaders, chief executivesand experts from the corporate world, met inSingapore to discuss the Group’s internationalstrategy. Our management has benefited greatly from the advice of both the Board and the IAP.
Of equal significance is the contribution from ourstaff. We wish to commend them for their hard work.Together, we will achieve a successful 2004.
PHILIP YEO LIEW MUN LEONGChairman President and CEO
27 February 2004
“The Group will work towards raising capital productivity. We willallocate capital to higher yielding assets, and leverage upon our assetbase and real estate knowledge to grow our fee-based services.”
Riding the Strategic Inflection PointDuring the economic boom in the early ’90s, easy financing led to the build up of an excessive supply of real estate in many Asiancountries. The Asian financial crisis and the bursting of the property bubble highlighted the weakness of the real estate industry,which was speculative and too focused on expectations of capital appreciation. Following the crisis, banks became more cautiousin their real estate lending. This meant that the financing mechanism for Asian real estate had to change, bringing about a“Strategic Inflection Point”, where the ownership and funding of real estate will see a fundamental shift to public and private realestate capital markets.
Unlike traditional Asian real estate firms, capital market investors are strongly focused on yields. Real estate investment productswith recurrent income that appeal to these investors will grow, as seen in the rapidly growing interest in REITs in Asia. As capitalmarkets play an important role in promoting international investment in real estate, this will also increase the pace ofinternationalisation of the Asian real estate industry.
CapitaLand saw the change in the real estate landscape and began to build its capabilities in financial skills to ride this strategicinflection point. The Group has added skills in origination, structuring, distribution and risk management to its core real estatedomain knowledge, asset base and industry networks. It already has an impressive track record for pioneering REITs in Singapore,creating offshore property funds and various other financial initiatives.
CL AR03 1-29 A/W.OK 17/03/2004 06:03 PM Page 17
18
Cap
itaLa
ndA
R 0
3FO
CUS
BA
LAN
CE S
CALE
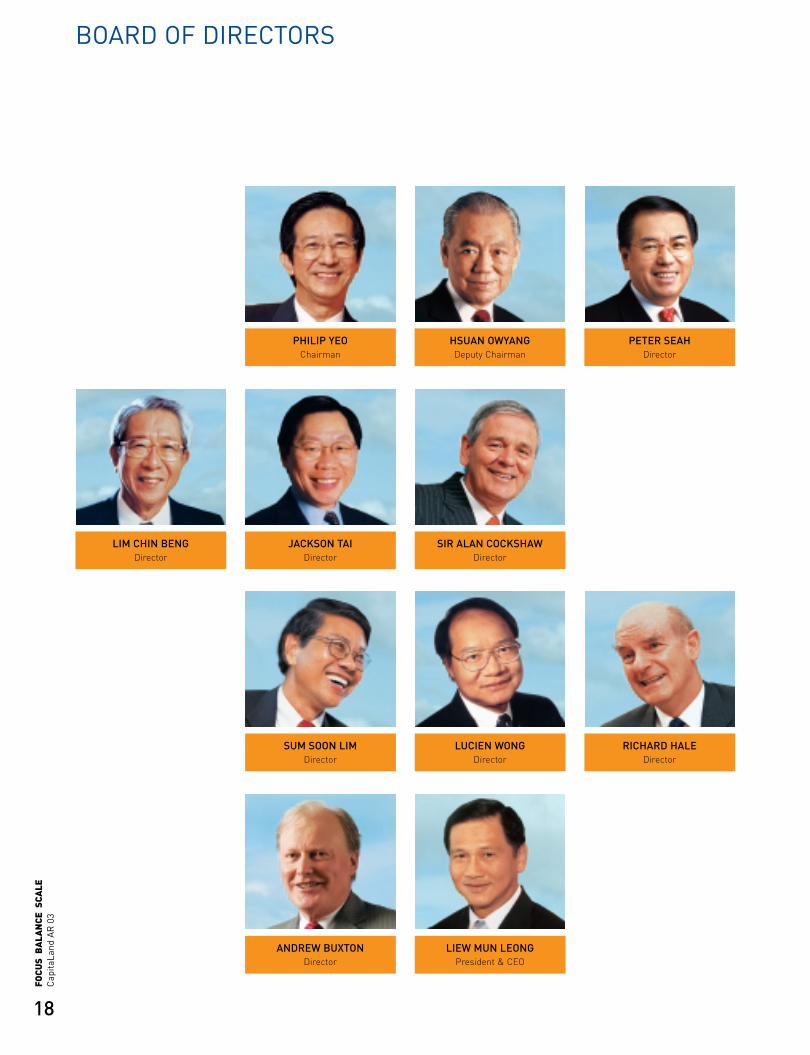
BOARD OF DIRECTORS
PHILIP YEOChairman
HSUAN OWYANGDeputy Chairman
PETER SEAHDirector
LIM CHIN BENGDirector
JACKSON TAIDirector
SUM SOON LIMDirector
SIR ALAN COCKSHAWDirector
LUCIEN WONGDirector
RICHARD HALEDirector
ANDREW BUXTONDirector
LIEW MUN LEONGPresident & CEO
CL AR03 1-29 A/W.OK 17/03/2004 06:03 PM Page 18

19
Cap
itaLa
ndA
R 0
3FO
CUS
BA
LAN
CE S
CALE
PHILIP YEOChairmanMr Philip Yeo, a Non-ExecutiveIndependent Director, joined theCapitaLand Board on 15 September 1999and was elected Chairman on the sameday. He was last re-elected as Director atCapitaLand’s Annual General Meeting on 9 May 2003. In addition, Mr Yeo is alsoChairman of CapitaLand’s InvestmentCommittee.
Mr Yeo’s current directorships in othercompanies include United Overseas Bank,Industrial & Commercial Bank, SingaporePrecision Industries 2000 Pte Ltd,SilkRoute Holdings Pte Ltd, A-Bio PharmaPte Ltd and InfoSys Technologies Limited.
Mr Yeo is currently the Chairman of the Agency for Science, Technology &Research and Co-Chairman of theSingapore Economic Development Board(EDB). He was Chairman of the EDB fromJanuary 1986 to January 2001. He hadserved in the Ministry of Defence from1970, holding several appointmentsincluding as the Permanent Secretary. He set up the National Computer Boardand became its first Chairman from 1981to 1987.
Mr Yeo graduated in 1970 in AppliedScience (Industrial Engineering) from the University of Toronto, Canada, under aColombo Plan Scholarship. He also holds aMaster of Science (Systems Engineering),1974 from the University of Singapore and a Master in Business Administration,1976 from Harvard University, USA, as a Fulbright scholar. In 1997, he washonoured with a Doctor of Engineering by his alma mater, University of Toronto.
HSUAN OWYANGDeputy ChairmanMr Hsuan Owyang, a Non-ExecutiveIndependent Director, joined theCapitaLand Board on 20 November 2000and was elected Deputy Chairman on the same day. He was last re-elected asDirector at CapitaLand’s Annual GeneralMeeting on 9 May 2003.
Mr Owyang is Chairman of CapitaLand’sFinance and Budget Committee andDeputy Chairman of CapitaLand’sInvestment Committee, and also sits onCapitaLand’s Executive Resource andCompensation Committee and NominatingCommittee. Mr Owyang is also Chairmanof CapitaMall Trust Management Limited.
In addition, Mr Owyang is Chairman, Board of Governors of The Institute ofPolicy Studies, N.M. Rothschild & Sons (Singapore) Limited and AyalaInternational Holdings Limited. He is also a Director of MobileOne Limited andformer Chairman of Transpac IndustrialHoldings Limited, both companies listedon the SGX-ST.
He served on the Board of Singapore’sHousing Development Board (HDB) since1977 and was appointed Chairman of the HDB in 1983 until his retirement inOctober 1998. Mr Owyang had extensivebanking experience and worked on WallStreet for 12 years as an investmentadvisor. He was also Director and GeneralManager of Overseas Union Bank which he was associated with for more than 18years before his appointment as ExecutiveDeputy Chairman of Post Office SavingsBank until 1988.
Mr Owyang is a graduate of the Universityof Dubuque, USA with a BSc in BusinessAdministration. He also holds a Master inBusiness Administration from HarvardUniversity, USA.
PETER SEAH DirectorMr Peter Seah, a Non-Executive Director,joined the CapitaLand Board on 18December 2001 and is also serving as Chairman of CapitaLand’s ExecutiveResource and Compensation Committeeand Nominating Committee. He was lastre-elected as Director at CapitaLand’sAnnual General Meeting on 2 May 2002.
Currently, Mr Seah is Chairman ofSembCorp Industries Ltd and SingaporeTechnologies Engineering Ltd and is adirector of various companies in the Singapore Technologies Group. He sits onthe boards of Government of Singapore
Investment Corporation Pte Ltd, Instituteof Defence & Strategic Studies and theDefence Science and Technology Agency.He also serves as Vice President ofSingapore Chinese Chamber of Commerce& Industry and Treasurer of SingaporeBusiness Federation.
Mr Peter Seah assumed his currentposition as President & CEO of SingaporeTechnologies Pte Ltd on 1 December 2001.Prior to this, Mr Seah was with OverseasUnion Bank (OUB) since 1977, holdingseveral senior positions and becoming itsPresident & CEO in 1991. Mr Seah retiredas Vice Chairman and CEO from OUB on 30 September 2001.
Mr Seah graduated from the University of Singapore with an honours degree inbusiness administration in 1968.
LIM CHIN BENGDirectorMr Lim Chin Beng, a Non-ExecutiveIndependent Director, joined theCapitaLand Board on 23 February 1998 and was last re-elected as Director atCapitaLand’s Annual General Meeting on 9 May 2003. Mr Lim is also a Member of CapitaLand’s Executive Resource andCompensation Committee and Nominating Committee.
Currently, Mr Lim is Chairman of The Ascott Group Limited, SingaporeTechnologies Aerospace Limited,Singapore Press Holdings Limited, SPHMediaWorks Ltd and Valuair Ltd. He is alsoa Director of StarHub Limited, PontiacLand Private Limited and Press Foundationof Singapore Ltd. He is a Member of thePublic Service Commission.
Mr Lim has 30 years of experience in the aviation industry beginning with theMalaysian Airlines in the 1960s. In the1970s, he helped start up SingaporeAirlines and was its Managing Directorfrom 1972 to 1982. Mr Lim retired asDeputy Chairman of Singapore Airlines in1996. Between 1991 to 1997, Mr Lim wasalso Singapore’s Ambassador to Japan.
DIRECTORS’ PROFILE
CL AR03 1-29 A/W.OK 17/03/2004 06:03 PM Page 19

20
Cap
itaLa
ndA
R 0
3FO
CUS
BA
LAN
CE S
CALE
Mr Lim is a graduate from the University of Malaya with BA (Economics) (Honours).He also attended an AdvancedManagement Program at the HarvardBusiness School, USA in 1973.
JACKSON TAIDirectorMr Jackson Tai, a Non-ExecutiveIndependent Director, joined theCapitaLand Board on 20 November 2000and was last re-elected as Director atCapitaLand’s Annual General Meeting on 2 May 2001. In addition, Mr Jackson Tai is a Member of CapitaLand’s InvestmentCommittee, Executive Resource andCompensation Committee, NominatingCommittee and Finance and Budget Committee.
Currently, Mr Tai is Vice Chairman andCEO of DBS Group Holdings and DBSBank, and also Chairman of the DBSGroup Holdings’ Management Committee.He is also Chairman of DBS GroupHoldings (Hong Kong) Ltd. Prior to joiningDBS Bank, Mr Tai was a Managing Directorof J P Morgan & Co’s Investment BankingDivision.
Besides CapitaLand, Mr Tai is a Director of Singapore Telecommunications Limited.He also sits on the Boards of Jones LangLaSalle Incorporated, DBS Bank (HongKong) Limited and MasterCard Asia/Pacific.
Mr Tai graduated with a BSc degree fromthe Rensselaer Polytechnic Institute, USA. He also holds a Master of BusinessAdministration from Harvard University,USA.
SIR ALAN COCKSHAWDirectorSir Alan Cockshaw, a Non-ExecutiveIndependent Director, joined theCapitaLand Board on 1 July 1999 and waslast re-elected as Director at CapitaLand’sAnnual General Meeting on 2 May 2002. He is a Member of CapitaLand’s ExecutiveResource and Compensation Committeeand Nominating Committee.
Currently, Sir Alan is also Chairman of theRoxboro Group Plc, HPR Holdings Ltd.,PCS International Ltd, and ShawbridgeManagement Ltd.
Based in the UK, his early career wasspent in both the public and privatesectors. In 1973, he joined Fairclough Civil Engineering and was appointed ChiefExecutive in 1978 and a Member of themain board of Fairclough ConstructionGroup in 1981. In 1982, Faircloughacquired the Press Group and in so doingcreated the AMEC Group where Sir Alanbecame Group Chief Executive in 1984 andChairman in 1988. He retired from AMECin 1997. Sir Alan has also held a number of public positions on behalf of the UKGovernment and was Chairman of EnglishPartnerships, the national regenerationagency, and the Commission for the NewTowns, which merged in 1999. He is a Past President of the Institution of CivilEngineers and a Fellow of the RoyalAcademy of Engineering.
Sir Alan holds an Honorary Degree ofDoctor of Engineering and an HonoraryDegree of Doctor of Science.
SUM SOON LIMDirectorMr Sum Soon Lim, a Non-ExecutiveDirector, joined the CapitaLand Board on23 October 1998 and was last re-elected asDirector at CapitaLand’s Annual GeneralMeeting on 9 May 2003. In addition, MrSum is Chairman of CapitaLand’s RiskCommittee and Corporate DisclosureCommittee. He is also a Member ofCapitaLand’s Audit Committee.
Mr Sum’s directorships include CharteredSemiconductor Manufacturing Ltd,Singapore Technologies Telemedia Pte Ltd,Singapore Health Services Pte Ltd, VertexVenture Holdings Ltd and Singapore Press Holdings Ltd. Mr Sum is also aCommissioner of PT Indonesian SatelliteCorporation (Indosat) and a Member of theSecurities Industry Council. He formerlysat on the Board of ST Assembly TestServices Ltd, a public company listed onthe SGX-ST.
Mr Sum has worked for the SingaporeEconomic Development Board, DBS Bank,J P Morgan Inc, Overseas Union Bank and Nuri Holdings (S) Pte Ltd, a privateinvestment holding company. Mr Sum is a Corporate Advisor to SingaporeTechnologies Pte Ltd and TemasekHoldings (Private) Limited.
Mr Sum is a graduate of the University of Nottingham, UK with a BSc (Hons) inProduction Engineering.
LUCIEN WONG DirectorMr Lucien Wong, a Non-ExecutiveIndependent Director, joined theCapitaLand Board on 20 November 2000and was last re-elected as Director atCapitaLand’s Annual General Meeting on 2 May 2001. In addition, Mr Wong is aMember of CapitaLand’s Audit Committee,Corporate Disclosure Committee and Risk Committee.
He is also a Director of SingaporeTechnologies Engineering Ltd, a publiccompany listed on the SGX-ST.
Mr Wong is the Managing Partner of Allen& Gledhill. He has been in legal practicefor more than 20 years, specialising incorporate and finance work and has beeninvolved in several landmark corporatetransactions in Singapore.
Mr Wong is a graduate in LLB (Honours)from the University of Singapore.
RICHARD HALEDirectorMr Richard Hale, a Non-ExecutiveIndependent Director, joined theCapitaLand Board on 10 February 2003,and was appointed as Chairman ofCapitaLand’s Audit Committee and aMember of CapitaLand’s Risk Committeeon the same day. He was last re-elected as Director at CapitaLand’s AnnualGeneral Meeting on 9 May 2003.
DIRECTORS’ PROFILE
CL AR03 1-29 A/W.OK 17/03/2004 06:03 PM Page 20
21
Cap
itaLa
ndA
R 0
3FO
CUS
BA
LAN
CE S
CALE
Mr Hale also sits on the Board of TheAscott Group Limited (Ascott) and is Chairman and Member of Ascott’sNominating Committee and ExecutiveResource and Compensation Committee,respectively.
In addition, he is a Fellow of the SingaporeInstitute of Directors and also sits on theBoards of Sembcorp Industries Ltd andMarco Polo Developments Ltd, companieslisted on the SGX-ST, and of WildlifeReserves Singapore Pte Ltd and World-Wide Shipping Agency (Singapore) Pte Ltd.
Mr Hale started his career with TheHongkong and Shanghai BankingCorporation Ltd in October 1958 andserved in London, Paris, Hong Kong,Germany, Malaysia, Japan and Singaporebefore retiring from the Bank as CEOSingapore and Director in March 1995.From July 1995 to September 1997, heacted as advisor on environmental mattersfor HSBC Holdings Plc London based inSingapore. Mr Hale was ExecutiveChairman of SNP Corporation Ltd from 1 April 1999 to April 2000, and also served as Chairman of the SingaporeInternational Chamber of Commerce for 1993 and 1994. He was formerly aGovernor of United World College of South East Asia, Singapore.
Mr Hale is a Fellow of the CharteredInstitute of Bankers, London.
ANDREW BUXTONDirectorMr Andrew Buxton, a Non-ExecutiveIndependent Director, joined theCapitaLand Board on 1 June 2003. He isalso a Director of CapitaLand FinancialLimited, a subsidiary of CapitaLand.
Currently, Mr Buxton is Deputy Chairmanof Xansa Plc, Chairman of Allied SchoolsLimited, a group of private schools in theUnited Kingdom, and Chairman of Heart of the City, an organisation which assistsbusinesses based in the City of London insupporting the wider community. He is
also Chairman of the Saudi BritishBusiness Council which promotes tradebetween Saudi Arabia and Great Britain.
Mr Buxton retired in 1999 as ExecutiveChairman of Barclays Bank Plc. He joinedBarclays in 1963 and rose to be in chargeof the Bank’s Corporate Division, becomingChairman in 1993. After his retirement, hebecame the Senior Advisor to the Barclaysgroup on Middle East business until 2003.
He was President of the British BankersAssociation from 1998 to 2002, and was a Member of the Court of the Bank ofEngland from 1997 to 2001. He was alsoChairman of the Charing Cross andWestminster Medical School in London,and a Governor of the Imperial College of Science, Technology and Medicine.
Mr Buxton holds a Masters Degree inPolitics, Philosophy and Economics fromOxford University. He has also beenawarded an Honorary Doctor of Sciencefrom the City University, London, and is a Fellow of the Institute of Bankers.
Mr Buxton was honoured in the Queen’sBirthday Honours in June 2003 when he was made a Companion of the MostDistinguished Order of St. Michael and St. George (CMG).
LIEW MUN LEONG President & CEOMr Liew Mun Leong is President & CEO of CapitaLand. He joined the CapitaLandBoard as Director on 1 January 1997 and was last re-elected as Director atCapitaLand’s Annual General Meeting on 9 May 2003. He also serves onCapitaLand’s Investment Committee,Nominating Committee, CorporateDisclosure Committee and Finance and Budget Committee.
Concurrently, Mr Liew is Deputy Chairmanof The Ascott Group Limited and RafflesHoldings Limited, subsidiaries ofCapitaLand listed on the SGX-ST. He isDeputy Chairman of CapitaMall TrustManagement Limited, the manager ofCapitaMall Trust, the first listed real estateinvestment trust in Singapore. He is alsoChairman of CapitaLand ResidentialLimited, CapitaLand Commercial Limitedand PREMAS International Limited, andDeputy Chairman of CapitaLand Financial Limited.
In addition, Mr Liew is Chairman of the Board of Governors of TemasekPolytechnic and a Board Member of thePublic Utilities Board.
With more than 25 years of internationalexperience in construction and real estatein Singapore and overseas, Mr Liew led anumber of public sector infrastructuraldevelopment projects in Singapore,including the successful development and construction of Changi InternationalAirport. For five years, he was CEO ofSingapore Institute of Standards andIndustrial Research (SISIR), a statutoryboard responsible for Singapore’s nationalstandards and industrial research anddevelopment to support the manufacturingindustry in Singapore. Thereafter, heheaded a public listed engineering andconstruction company in Singapore. From 1997 to 1998, Mr Liew was also thePresident of International Organisation for Standardisation (ISO).
Mr Liew graduated from the University ofSingapore with a civil engineering degreein 1970 and is a registered professionalcivil engineer.
CL AR03 1-29 A/W.OK 17/03/2004 06:03 PM Page 21
22
Cap
itaLa
ndA
R 0
3FO
CUS
BA
LAN
CE S
CALE
CORPORATE DIRECTORY
BOARD OF DIRECTORS
Philip Yeo Liat KokChairman
Hsuan OwyangDeputy Chairman
Liew Mun LeongPresident & CEO
in alphabetical order:
Andrew BuxtonSir Alan CockshawRichard Edward HaleLim Chin BengPeter Seah Lim HuatSum Soon LimJackson Peter TaiLucien Wong Yuen Kuai
Company SecretaryTan Wah Nam
Assistant Company SecretaryJessica Lum
Audit CommitteeRichard Edward HaleSum Soon LimLucien Wong Yuen Kuai
Investment CommitteePhilip Yeo Liat KokHsuan OwyangLiew Mun LeongJackson Peter TaiLui Chong Chee
Executive Resource andCompensation CommitteePeter Seah Lim HuatHsuan OwyangSir Alan CockshawLim Chin BengJackson Peter Tai
Nominating CommitteePeter Seah Lim HuatHsuan OwyangLiew Mun LeongSir Alan CockshawLim Chin BengJackson Peter Tai
Finance and Budget CommitteeHsuan OwyangLiew Mun LeongJackson Peter TaiLui Chong Chee
Corporate Disclosure CommitteeSum Soon LimLiew Mun LeongLucien Wong Yuen Kuai
Risk CommitteeSum Soon LimRichard Edward HaleLucien Wong Yuen Kuai
Registered Address168 Robinson Road#30-01 Capital TowerSingapore 068912Telephone: (65) 6823 3200Facsimile: (65) 6820 2202
RegistrarLim Associates (Pte) Ltd10 Collyer Quay #19-08 Ocean BuildingSingapore 049315Telephone: (65) 6536 5355Facsimile: (65) 6536 1360
AuditorsKPMG16 Raffles Quay#22-00 Hong Leong BuildingSingapore 048581Telephone: (65) 6213 3388Facsimile: (65) 6225 6157(Engagement Partner since financialyear ended 31 December 2001: MarthaTan Hui Keng)
Principal Bankers• Australia and New Zealand Banking
Group Limited• BNP Paribas• Citibank N.A.• Credit Agricole Indosuez• Commonwealth Bank of Australia• DBS Bank Ltd• Hang Seng Bank Limited• Malayan Banking Berhad• Mizuho Corporate Bank, Ltd.• Oversea-Chinese Banking
Corporation Limited• Standard Chartered Bank• Sumitomo Mitsui Banking
Corporation• The Hongkong and Shanghai
Banking Corporation Limited• United Overseas Bank Limited• Westpac Banking Corporation
CL AR03 1-29 A/W.OK 17/03/2004 06:03 PM Page 22
23
Cap
itaLa
ndA
R 0
3FO
CUS
BA
LAN
CE S
CALE
INTERNATIONAL ADVISORY PANEL
The CapitaLand International Advisory Panel (IAP) was formed in late 1999, as part of the Group’s effort to tap theexperiences and advice of corporate leaders from regional and global companies. The Panel meets once a year to adviseand exchange views with management on global trends and regional developments, and provides inputs on the Group’sstrategies and businesses. Chaired by Sir Alan Cockshaw, the IAP currently has 11 members, comprising industry leadersand chief executives of global corporations from Asia, Europe and the United States. The members of the CapitaLand IAP are:
The 6th CapitaLand IAP Meeting was held in Singapore in November 2003. The focus of this meeting was on CapitaLand’sinternational strategy. The CapitaLand International Forum was also held in conjunction with the IAP meeting, during whichthree Panel members, namely Dr Kenneth Courtis, Dr Victor Fung and Mr Jan Doets, together with Professor Tommy Kohand Mr Jackson Tai, shared their views on global competition and the implications for Singapore’s real estate industry.
Looking ahead, CapitaLand will continue to tap on the Panel’s international expertise and networks to guide the Group in itsoverseas strategies and its efforts to build a global network of partners and investors.
Sir Alan CockshawChairman, PCS International LimitedThe Roxboro Group PLCUnited Kingdom
Dr Kenneth CourtisVice Chairman, Goldman Sachs (Japan) LimitedJapan
Jan D. DoetsCEO, ING Real EstateNetherlands
Dr Fu Yu NingDirector & President, China Merchants Holdings Co., LtdPeople’s Republic of China
Dr Victor FungGroup Chairman, Li & Fung Distribution (Management) LtdHong Kong
Vernon R Loucks, JrChairman, The Aethena Group, LLC United States
Alasdair G MorrisonChairman & CEO, Morgan Stanley AsiaHong Kong
Joseph E Robert, JrChairman & CEO, The J E Robert CompaniesUnited States
Dr Vichit SuraphongchaiChairman of Executive Committee, The Siam Commercial Bank Public Co LtdThailand
Tan Sri Datuk Dr Ahmad Tajuddin Bin AliChairman, Gas Malaysia Sdn Bhd,Malaysia
Ms Marjorie YangChairman, Esquel GroupHong Kong
CL AR03 1-29 A/W.OK 17/03/2004 06:03 PM Page 23
24
Cap
itaLa
ndA
R 0
3FO
CUS
BA
LAN
CE S
CALE
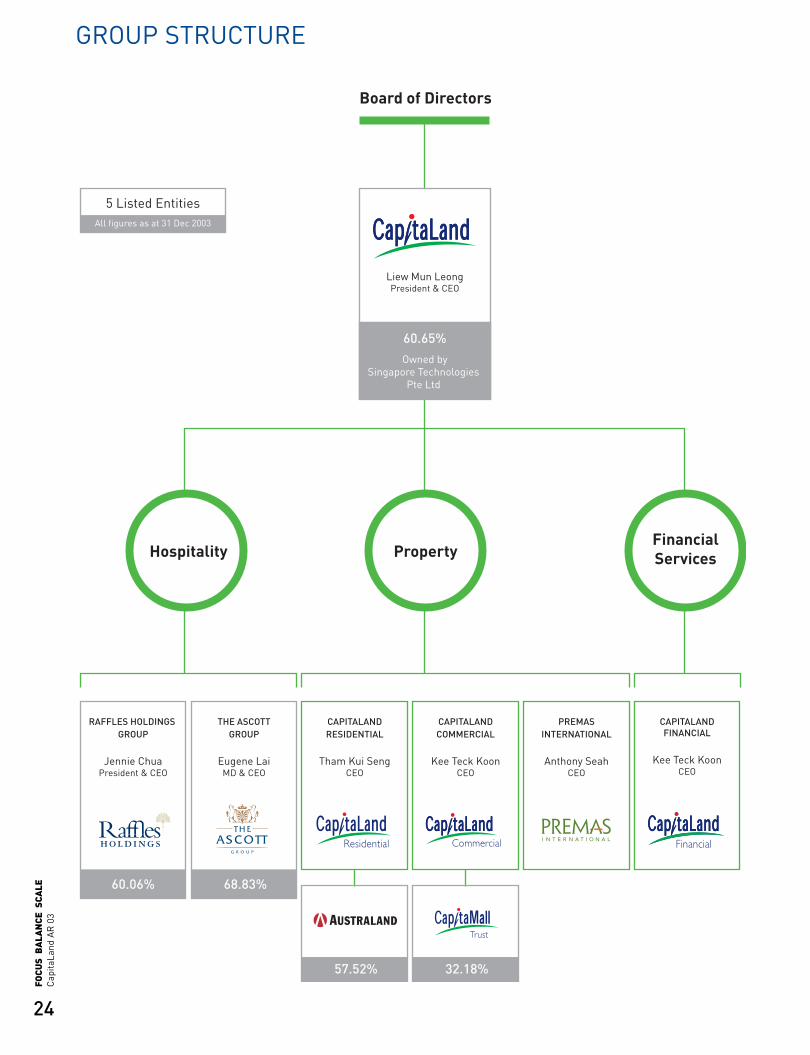
Hospitality
Board of Directors
Liew Mun LeongPresident & CEO
5 Listed EntitiesAll figures as at 31 Dec 2003
RAFFLES HOLDINGS GROUP
Jennie ChuaPresident & CEO
60.06% 68.83%
THE ASCOTTGROUP
Eugene LaiMD & CEO
57.52%
CAPITALANDRESIDENTIAL
Tham Kui SengCEO
32.18%
CAPITALANDCOMMERCIAL
Kee Teck KoonCEO
PropertyFinancialServices
PREMASINTERNATIONAL
Anthony SeahCEO
CAPITALANDFINANCIAL
Kee Teck KoonCEO
Owned bySingapore Technologies
Pte Ltd
60.65%
GROUP STRUCTURE
CL AR03 1-29 A/W.OK 17/03/2004 06:03 PM Page 24
25
Cap
itaLa
ndA
R 0
3FO
CUS
BA
LAN
CE S
CALE
COUNCIL OF CEOS
MR LIEW MUN LEONGPresident and Chief Executive Officer – CapitaLand Limited Mr Liew is President and Chief Executive Officer ofCapitaLand and Deputy Chairman of The Ascott Group,Raffles Holdings and CapitaMall Trust. He has more than 25 years’ experience in the construction and real estateindustries. Mr Liew is also Chairman of Temasek Polytechnicand a past President of the International Organisation forStandardisation (ISO). Mr Liew graduated from the Universityof Singapore with a Bachelor of Engineering degree and is aregistered civil engineer.
MR LUI CHONG CHEEChief Financial Officer – CapitaLand Limited Mr Lui is Chief Financial Officer of CapitaLand, a Director of Australand Property Group, CapitaMall Trust and RafflesHoldings. Prior to this, Mr Lui was Managing Director ofCiticorp Investment Bank (Singapore) Limited. He has 15 years’ experience in investment banking. Mr Lui holds an MBA in Finance and International Economics and aBachelor of Science degree in Business Administration(magna cum laude) from New York University.
MR KEE TECK KOONChief Executive Officer – CapitaLand Commercial Limitedand CapitaLand Financial LimitedMr Kee is the Chief Executive Officer of CapitaLandCommercial and CapitaLand Financial, and a Director ofAustraland Property Group. Prior to this, he was ManagingDirector and Chief Executive Officer of The Ascott Group. Mr Kee was previously Chief Executive Officer of SomersetHoldings and Senior Vice President of Pidemco Land. He is also Vice Chairman of the Singapore Institute ofManagement. Mr Kee holds a Master of Arts degree inEngineering Science from Oxford University.
MR THAM KUI SENGChief Executive Officer – CapitaLand Residential Limited Mr Tham is the Chief Executive Officer of CapitaLandResidential Limited and Chief Corporate Officer ofCapitaLand Limited. He is also Chairman of AustralandProperty Group and Deputy Chairman of United MalayanLand Bhd. Mr Tham holds a Bachelor of Arts degree inEngineering Science from Oxford University.
MS JENNIE CHUAPresident and Chief Executive Officer – Raffles Holdings LimitedMs Chua is the President & Chief Executive Officer ofRaffles Holdings Limited and concurrently Chairman &Chief Executive Officer of Raffles International, the hotelmanagement arm of Raffles Holdings. Earlier in her career,she was General Manager of Raffles Hotel. Prior to that,she was the Director of the Singapore Convention Bureau. Ms Chua is Chairman of the Community Chest and serveson the Boards of several companies, statutory boards andgovernment committees, both local and international. Sheholds a Bachelor of Science from Cornell University and ispresently on the University’s Board of Trustees.
MR EUGENE LAIManaging Director and Chief Executive Officer – The Ascott Group LimitedMr Lai was previously an MD of The Carlyle Group, a US-based global private equity firm, and a director ofRaffles Holdings Ltd. From 1997 to 2001, Mr Lai held senior positions at Schroders and Salomon Smith Barney.Mr Lai, who is qualified as a lawyer in New York, England,Singapore and Malaysia, was also an attorney in New Yorkand Singapore. He has a Bachelor's degree in Law with firstclass honours from the London School of Economics &Political Science, and a Master’s degree in Law fromHarvard University.
MR ANTHONY SEAHChief Executive Officer – PREMAS International Limited Mr Seah is the Chief Executive Officer of PREMASInternational and Head of CapitaLand’s Synergistic Cost Management Division. He was previously PidemcoLand’s Executive Vice President for residential investment,marketing and development. Prior to that, Mr Seah was Chief Executive Officer of a public listed engineering andconstruction company. He holds a Bachelor of Engineering(Civil) degree and a postgraduate diploma in BusinessAdministration from the National University of Singapore, and is a registered professional engineer.
CL AR03 1-29 A/W.OK 17/03/2004 06:03 PM Page 25
26
Cap
itaLa
ndA
R 0
3FO
CUS
BA
LAN
CE S
CALE
YEAR IN BRIEF
January• Seven Raffles International hotels
were named best hotels in theworld by Condé Nast Traveler andTravel + Leisure in their respectiveJanuary 2003 issues.
• PREMAS International formed ajoint venture company, PREMAS(THAILAND) CO., LTD. to provideintegrated total real estatemanagement services in Thailand.
February• The Ascott Group completed the
acquisition of a 50% interest inCitadines which operates a portfolio of serviced residences in Europe.
• CapitaLand Commercial completedthe concept plan to createSingapore’s premier food, fashionand leisure precinct at Clarke Quay.
March• UM Land launched Seri Bukit
Ceylon, a serviced residence projectin Kuala Lumpur, Malaysia. TheAscott Group acquired 48 units ofserviced apartments and securedthe contract to manage theresidence.
April• Raffles International signed a lease
agreement with the Nankai ElectricRailway Co. to operate the 548-room Nankai South Tower HotelOsaka as the Swissôtel NankaiOsaka.
• CapitaLand Financial providedadvisory services for the issue ofnotes in connection with thesecuritisation of The Waterinacondominium in Singapore. Thesenotes were listed on the Singaporeand Luxembourg stock exchanges.
May• CapitaLand divested in Indonesia,
its entire 50% stake in the issuedcapital of PT Tropical Amethyst, inline with its strategy to focus on itscore business.
• CapitaLand Group set up the“Healthcare Frontliners Award” for nursing students at NanyangPolytechnic’s School of HealthSciences, Singapore, as a tribute to healthcare frontliners during the SARS outbreak.
• CapitaLand China launched the 719-unit La Cité in Xuhui District,Shanghai. The condominium wasconferred a Gold Award for “Mostpopular residential development in Shanghai 2003” in the high-midmarket segment.
June• CapitaMall Trust issued
119.8 million new units to partlyfinance the acquisition of IMMBuilding, to overwhelmingresponse.
• Raffles Holdings sold its RafflesBrown’s Hotel in London for £51.5 million (S$160.9 million),achieving a gain on the divestment.
• Raffles International signed amanagement agreement to operate the 338-room Nai Lert Park Hotel in Bangkok.
• The Ascott Group opened its secondserviced residence in Tokyo, the 79-unit Somerset Azabu East; andSomerset Suwan Park View, a 152-unit serviced residence in Bangkok.In Melbourne, Ascott secured themanagement contract for a 127-unitserviced residence and rebranded itSomerset Botanic Gardens.
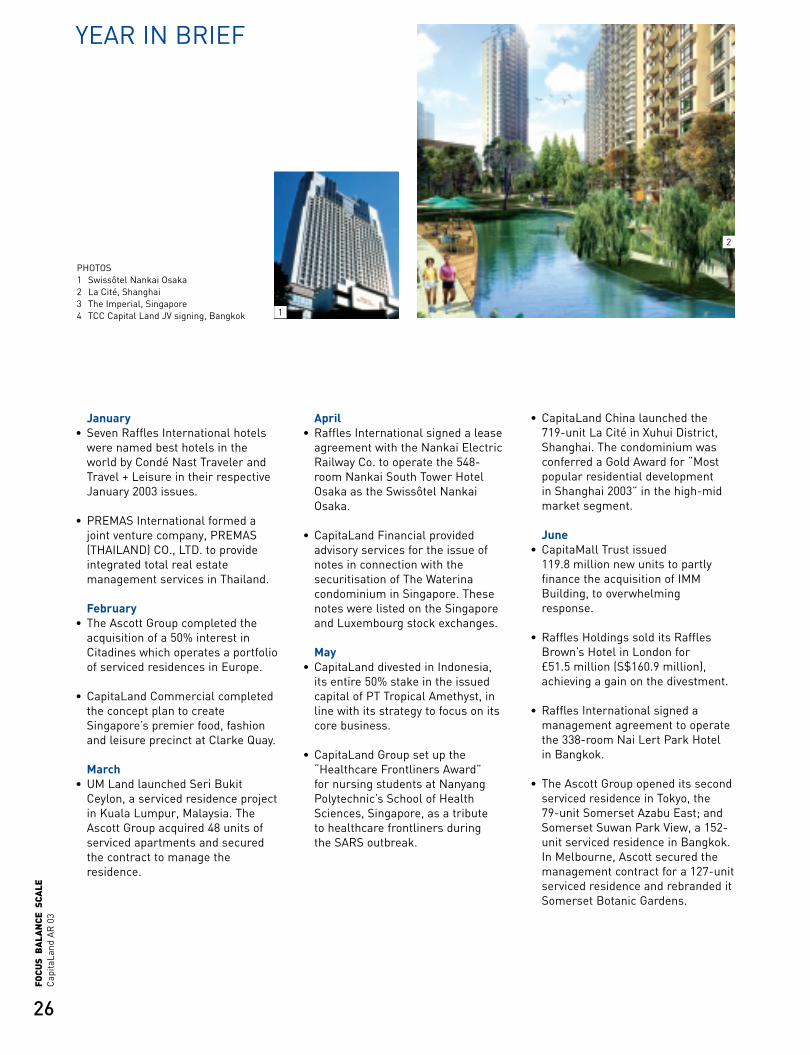
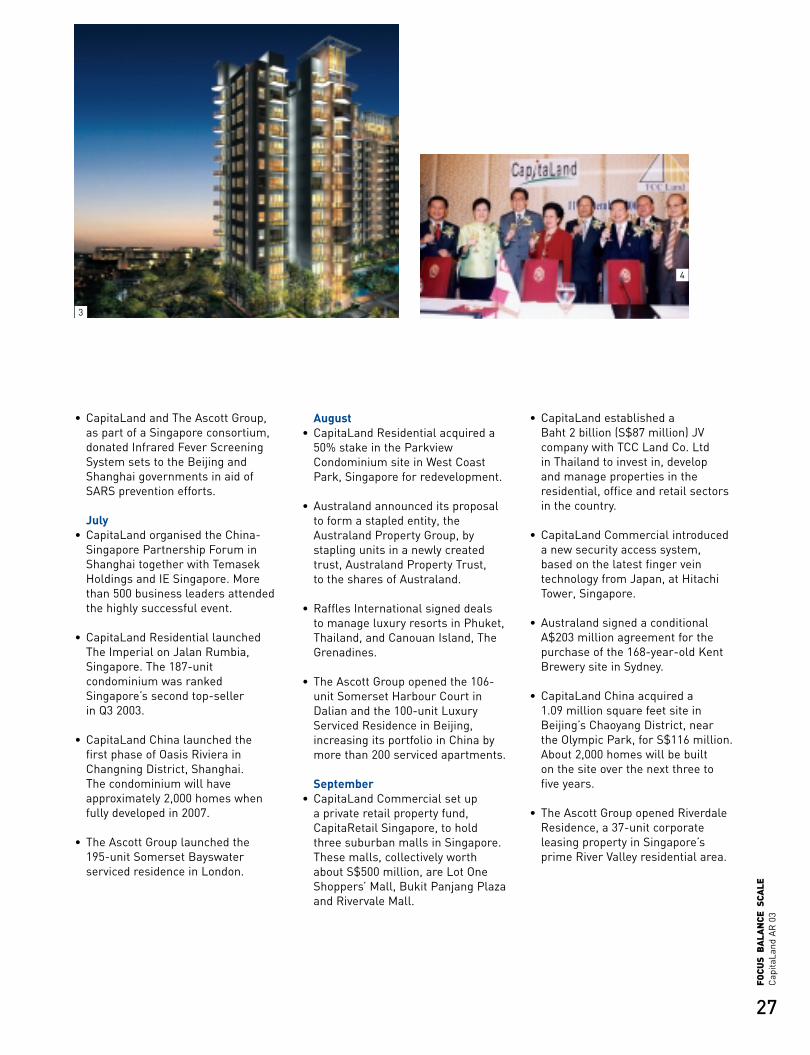
PHOTOS1 Swissôtel Nankai Osaka2 La Cité, Shanghai3 The Imperial, Singapore4 TCC Capital Land JV signing, Bangkok 1
2
CL AR03 1-29 A/W.OK 17/03/2004 06:03 PM Page 26
27
Cap
itaLa
ndA
R 0
3FO
CUS
BA
LAN
CE S
CALE
• CapitaLand and The Ascott Group,as part of a Singapore consortium,donated Infrared Fever ScreeningSystem sets to the Beijing andShanghai governments in aid of SARS prevention efforts.
July• CapitaLand organised the China-
Singapore Partnership Forum inShanghai together with TemasekHoldings and IE Singapore. Morethan 500 business leaders attendedthe highly successful event.
• CapitaLand Residential launchedThe Imperial on Jalan Rumbia,Singapore. The 187-unitcondominium was rankedSingapore’s second top-seller in Q3 2003.
• CapitaLand China launched the first phase of Oasis Riviera inChangning District, Shanghai. The condominium will haveapproximately 2,000 homes whenfully developed in 2007.
• The Ascott Group launched the 195-unit Somerset Bayswaterserviced residence in London.
August• CapitaLand Residential acquired a
50% stake in the ParkviewCondominium site in West CoastPark, Singapore for redevelopment.
• Australand announced its proposalto form a stapled entity, theAustraland Property Group, bystapling units in a newly createdtrust, Australand Property Trust, to the shares of Australand.
• Raffles International signed deals to manage luxury resorts in Phuket,Thailand, and Canouan Island, TheGrenadines.
• The Ascott Group opened the 106-unit Somerset Harbour Court inDalian and the 100-unit LuxuryServiced Residence in Beijing,increasing its portfolio in China bymore than 200 serviced apartments.
September• CapitaLand Commercial set up
a private retail property fund,CapitaRetail Singapore, to holdthree suburban malls in Singapore.These malls, collectively worthabout S$500 million, are Lot OneShoppers’ Mall, Bukit Panjang Plazaand Rivervale Mall.
• CapitaLand established a Baht 2 billion (S$87 million) JVcompany with TCC Land Co. Ltd in Thailand to invest in, develop and manage properties in theresidential, office and retail sectorsin the country.
• CapitaLand Commercial introduceda new security access system,based on the latest finger veintechnology from Japan, at HitachiTower, Singapore.
• Australand signed a conditionalA$203 million agreement for thepurchase of the 168-year-old KentBrewery site in Sydney.
• CapitaLand China acquired a 1.09 million square feet site inBeijing’s Chaoyang District, near the Olympic Park, for S$116 million.About 2,000 homes will be built on the site over the next three tofive years.
• The Ascott Group opened RiverdaleResidence, a 37-unit corporateleasing property in Singapore’sprime River Valley residential area.
3
4
CL AR03 1-29 A/W.OK 17/03/2004 06:03 PM Page 27

28
Cap
itaLa
ndA
R 0
3FO
CUS
BA
LAN
CE S
CALE
YEAR IN BRIEF
October• CapitaLand Commercial
repositioned Plaza Singapura as aone-stop family-oriented centrealong Orchard Road, with theopening of anchor hypermart,Carrefour Singapore.
• CapitaLand Residential successfullytendered for the 99-year leaseholdJellicoe site in Singapore. A 43-storey condominium with about 500homes is planned for the site,including 16 art-deco conservedshophouses.
• The Ascott Group completed the sale of Somerset KensingtonGardens, a 40-unit servicedresidence in central London, whilecontinuing to manage the property,as part of its asset light strategy.
• CapitaLand China held a ground-breaking ceremony for Grade-Aoffice tower, Plot 9-1 in LuwanDistrict, Shanghai.
November • CapitaLand Commercial was
appointed the retail developmentmanager for The HarbourFront Mall.The development will be the singlelargest retail and entertainmentcomplex in Singapore whencompleted in 2006.
• CapitaLand Residential releasedThe Botanic on Lloyd, a boutiqueresidential project in Singapore with60 apartments and six gardenterraces.
• CapitaLand China opened RafflesCity Shanghai retail mall with eightlevels of lifestyle, entertainment andF&B outlets.
• CapitaLand Commercial acquired La Park Mizue, a suburban retailmall in Tokyo, for about S$80 million.The mall, CapitaLand’s first in Japan,is intended to be seed investment forthe CapitaRetail Japan Fund.
• The Ascott Group launched 565 newSomerset serviced apartments inAustralia. Two new residences inMelbourne and Sydney wereopened, and four properties inSydney, Melbourne and Hobart were rebranded.
• The Ascott Group’s 56-unitSomerset on the Pier servicedresidence in Hobart won theTasmanian Tourism Awards 2003 for deluxe accommodation.
• Australand completed its staplingprogramme. The stapled entity,Australand Property Group,commenced trading on theAustralian and Singapore stock exchanges.
December• CapitaMall Trust issued 45 million
new units to finance the investmentof S$58 million (about a 27% stake)in junior bonds in the CapitaRetailSingapore Fund, to overwhelmingretail investor response.
• The Ascott Group secured amanagement contract for two primeserviced residences, totalling 250units in Dubai, United Arab Emirates.
• Raffles Holdings completed theacquisition of the balance 43.33%shareholding in Raffles Hotel.
PHOTOS5 Plot 9 – 1 at Luwan District, Shanghai6 Somerset on the Pier, Hobart
5
6
CL AR03 1-29 A/W.OK 17/03/2004 06:03 PM Page 28
29
Cap
itaLa
ndA
R 0
3FO
CUS
BA
LAN
CE S
CALE
CORPORATE OFFICE
LIEW MUN LEONG President & CEO
THAM KUI SENG Chief Corporate Officer
LAI CHOON HUNG Deputy Chief Corporate Officer
LUI CHONG CHEE Chief Financial Officer
ANTHONY SEAH Chief, SynergisticCost Management(until 18 September 2003)
in alphabetical order:
STEVEN CHOO Senior Vice President Research & Corporate Development
GAN JUAY KIAT Senior Vice President Corporate Planning
LAM WEI SIONG Senior Vice PresidentRisk Assessment
OLIVIER LIM Senior Vice President Corporate Finance
BASSKARAN NAIR Senior Vice PresidentCommunications
NANCY NG Senior Vice President Human Resource & Corporate Services
MARTIN TAN Head, Strategic Corporate Marketing(wef 19 September 2003)
TAN WAH NAM Company Secretary
HAROLD WOO Vice PresidentEquity Markets
CL AR03 1-29 A/W.OK 17/03/2004 06:03 PM Page 29
30
Cap
itaLa
ndA
R 0
3FO
CUS
BA
LAN
CE S
CALE
AT A GLANCE
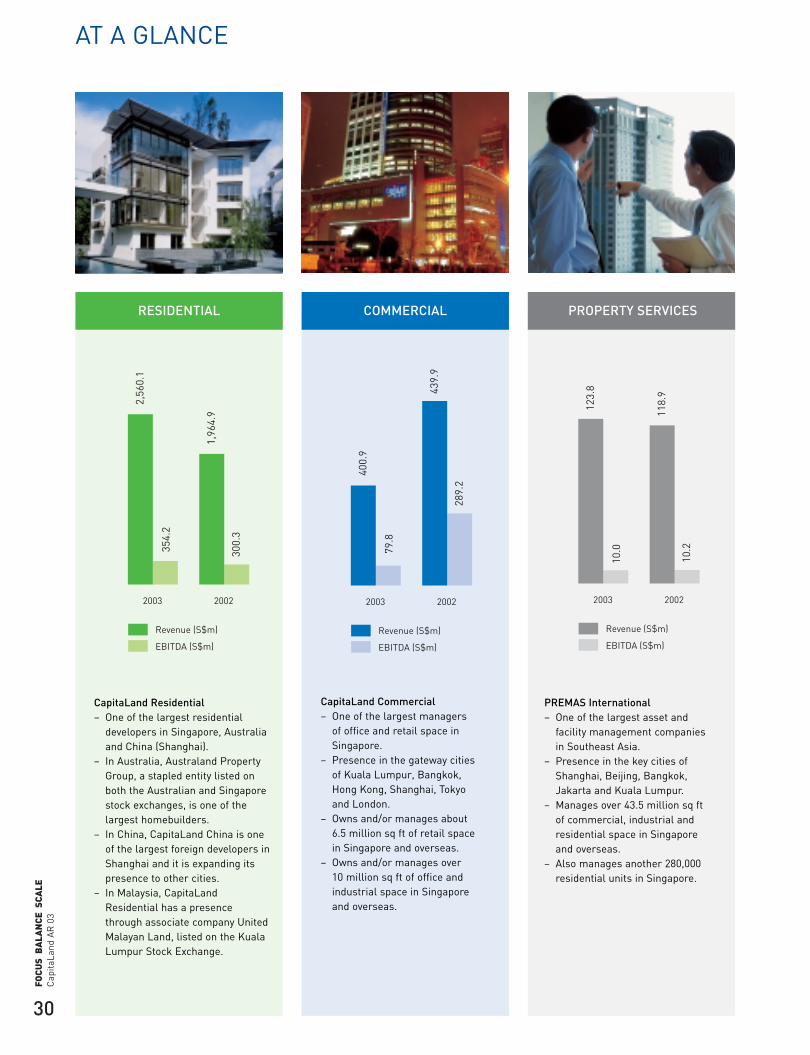
CapitaLand Residential– One of the largest residential
developers in Singapore, Australiaand China (Shanghai).
– In Australia, Australand PropertyGroup, a stapled entity listed onboth the Australian and Singaporestock exchanges, is one of thelargest homebuilders.
– In China, CapitaLand China is oneof the largest foreign developers inShanghai and it is expanding itspresence to other cities.
– In Malaysia, CapitaLandResidential has a presencethrough associate company UnitedMalayan Land, listed on the KualaLumpur Stock Exchange.
RESIDENTIAL
PREMAS International– One of the largest asset and
facility management companies in Southeast Asia.
– Presence in the key cities ofShanghai, Beijing, Bangkok,Jakarta and Kuala Lumpur.
– Manages over 43.5 million sq ft of commercial, industrial andresidential space in Singapore and overseas.
– Also manages another 280,000residential units in Singapore.
PROPERTY SERVICES
2003 2002
2,56
0.1
354.
2
Revenue (S$m)
EBITDA (S$m)
1,96
4.9
300.
3
2003 200212
3.8
10.0
Revenue (S$m)
EBITDA (S$m)
118.
9
10.2
CapitaLand Commercial– One of the largest managers
of office and retail space inSingapore.
– Presence in the gateway cities of Kuala Lumpur, Bangkok, Hong Kong, Shanghai, Tokyo and London.
– Owns and/or manages about 6.5 million sq ft of retail space in Singapore and overseas.
– Owns and/or manages over 10 million sq ft of office andindustrial space in Singapore and overseas.
COMMERCIAL
2003 2002
Revenue (S$m)
EBITDA (S$m)
400.
9
79.8
439.
9
289.
2
CL AR03 30-54 (SBU) A/W.OK 17/03/2004 06:14 PM Page 30
31
Cap
itaLa
ndA
R 0
3FO
CUS
BA
LAN
CE S
CALE
FINANCIAL SERVICES
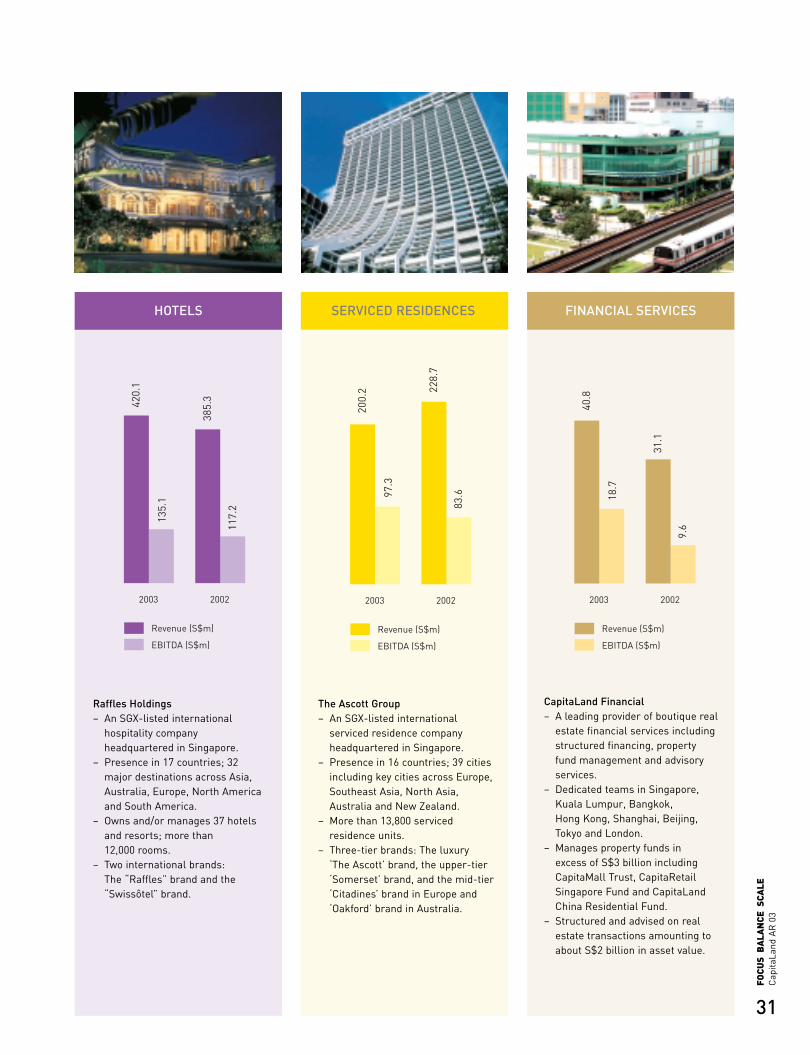
The Ascott Group– An SGX-listed international
serviced residence companyheadquartered in Singapore.
– Presence in 16 countries; 39 citiesincluding key cities across Europe,Southeast Asia, North Asia,Australia and New Zealand.
– More than 13,800 servicedresidence units.
– Three-tier brands: The luxury ‘The Ascott’ brand, the upper-tier‘Somerset’ brand, and the mid-tier‘Citadines’ brand in Europe and‘Oakford’ brand in Australia.
SERVICED RESIDENCES
Raffles Holdings– An SGX-listed international
hospitality companyheadquartered in Singapore.
– Presence in 17 countries; 32major destinations across Asia,Australia, Europe, North Americaand South America.
– Owns and/or manages 37 hotelsand resorts; more than 12,000 rooms.
– Two international brands: The “Raffles” brand and the“Swissôtel” brand.
HOTELS
2003 2002
40.8
18.7
Revenue (S$m)
EBITDA (S$m)31
.1
9.6
2003 2002
200.
2
97.3
Revenue (S$m)
EBITDA (S$m)
228.
7
83.6
2003 2002
420.
1
135.
1
Revenue (S$m)
EBITDA (S$m)
385.
3
117.
2
CapitaLand Financial– A leading provider of boutique real
estate financial services includingstructured financing, propertyfund management and advisoryservices.
– Dedicated teams in Singapore,Kuala Lumpur, Bangkok, Hong Kong, Shanghai, Beijing,Tokyo and London.
– Manages property funds in excess of S$3 billion includingCapitaMall Trust, CapitaRetailSingapore Fund and CapitaLandChina Residential Fund.
– Structured and advised on realestate transactions amounting toabout S$2 billion in asset value.
CL AR03 30-54 (SBU) A/W.OK 17/03/2004 06:14 PM Page 31
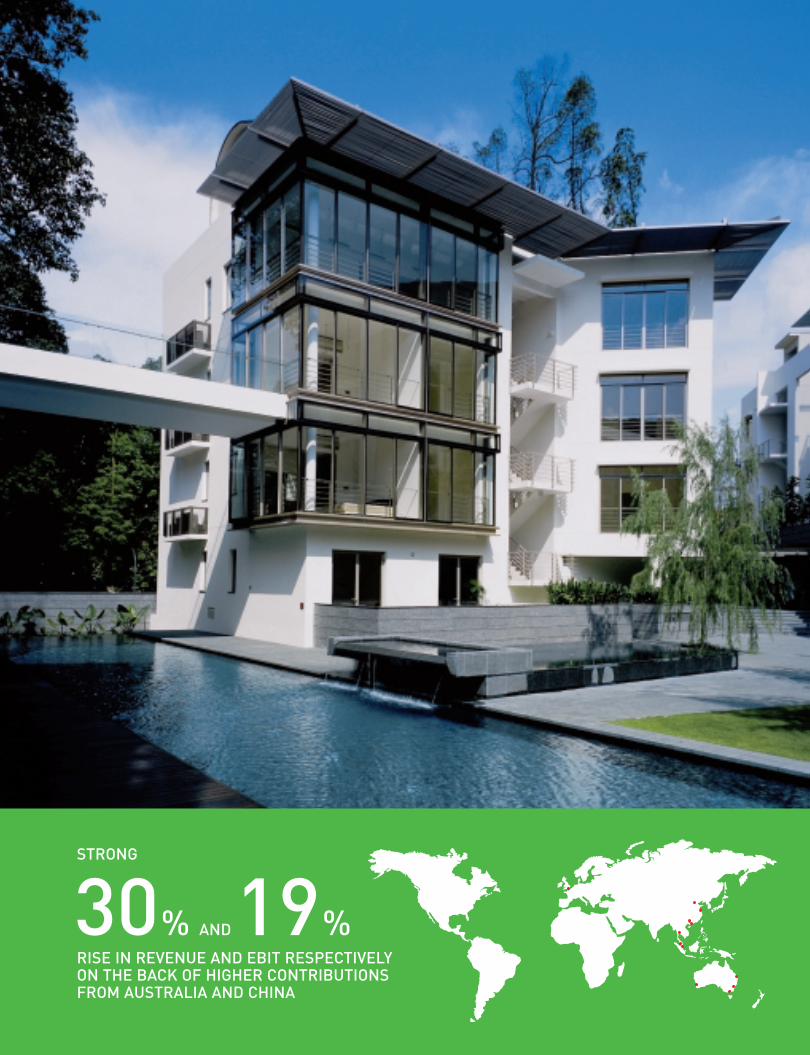
STRONG
RISE IN REVENUE AND EBIT RESPECTIVELYON THE BACK OF HIGHER CONTRIBUTIONSFROM AUSTRALIA AND CHINA
30% AND 19%
CL AR03 30-54 (SBU) A/W.OK 17/03/2004 06:14 PM Page 32
33
Cap
itaLa
ndA
R 0
3FO
CUS
BA
LAN
CE S
CALE
RESIDENTIAL
THAM KUI SENG Chief Executive OfficerCapitaLand Residential Limited
BUSINESS STRATEGY/PERFORMANCE
Q1 What is your business strategy?
A1 The key thrust of our strategy is to improve capitalproductivity, by increasing asset turnover anddeploying more capital to higher yielding markets.Building on our success in Australia and China, wewill continue to explore opportunities to tap on growth markets overseas.
We will also continue to focus on product leadership.Our emphasis is on creating distinctive and beautifulhomes that are comfortable and yet highly functional.
Q2 Are you pleased with the performance of CapitaLandResidential in 2003?
A2 We are pleased with the strong performance achievedfor the financial year 2003, on the back of highercontributions from our Australia and China operations.
We saw higher revenue achieved for all our three key markets: Singapore, Australia and China. Ourrevenue of S$2,560.1 million for 2003 was 30.3%, or S$595.2 million, higher compared to the previousyear. The EBIT of S$349.2 million represented an18.9% increase compared to 2002.
SINGAPORE
Q3 How did your Singapore operations perform duringthe year?
A3 In Singapore, we saw revenue increase by 24% for theyear 2003. SARS affected sales in the first half, but theresidential market generally stabilised towards theend of the year.
We released two high-end projects – The Imperial andThe Botanic on Lloyd. Both developments were verywell received.
Q4 Did you acquire any new sites for development?
A4 We have been selectively looking out for goodleasehold or suburban sites. During the year, we successfully tendered for the 99-year leaseholdsite at Jellicoe Road. We also took a 50% stake in theParkview Condominium site in West Coast Park.
These acquisitions, together with our existing primefreehold sites, will give us a balanced portfolio offreehold and leasehold sites for development over the next few years.
AUSTRALIA
Q5 How did you perform in Australia this year?
A5 In Australia, net profit after tax for Australandincreased 5.3% to A$95.2 million. We saw a 21.4%increase in revenue to A$1,405.4 million and EBITgrew by 17.6% to A$161.2 million.
As at end-2003, Australand held approximately A$508 million pre-sales for its wholly-owned and jointventure apartment projects. Pre-commitments werealso negotiated in respect of more than 130,000 squaremetres of industrial space and 10,000 square metres of commercial space during the year.
CL AR03 30-54 (SBU) A/W.OK 17/03/2004 06:15 PM Page 33
34
Cap
itaLa
ndA
R 0
3FO
CUS
BA
LAN
CE S
CALE
Q6 What were some of your major initiatives in Australiafor the year?
A6 During the year, we acquired two major sites fordevelopment – the 5.7-hectare Kent Brewery site inNew South Wales for A$203 million, and a 31-hectareland parcel at Hope Island on the Gold Coast for A$90 million.
Australand also launched two wholesale propertytrusts in 2003, with a total estimated on completionvalue of approximately A$354 million.
In November 2003, the ordinary shares of Australandwere successfully stapled with units in a newly createdtrust, Australand Property Trust. The stapled entitywill have a higher proportion of recurrent income anda strengthened revenue stream, which provides it witha good platform for future growth. The stapled entity,which is listed as Australand Property Group (APG),commenced trading in November 2003 on both the Australian and Singapore stock exchanges.
CHINA
Q7 Are you pleased with the performance of your China operations?
A7 Our China operations contributed a revenue of S$318.6 million, from strong sales chalked up for Summit Residences, La Cité and Oasis Riviera.EBIT for China operations rose by 69% to S$118.5million, recording robust growth compared to theprevious year.
Q8 China is growing at a very fast pace. What were someof the major developments by CapitaLand in thismarket?
A8 We released two new projects in Shanghai in 2003.The 719-unit La Cité in Xuhui District was launched inMay 2003. The units released were almost fully sold bythe end of the year. La Cité was conferred a GoldAward for “Most popular residential development inShanghai 2003” for the high-mid market segment.
We also launched the first phase of Oasis Riviera,which is located in Shanghai’s Changning District. The development will have approximately 2,000 homeswhen fully developed in 2007. We continue to look outfor more prime sites for development in Shanghai.
During the year, we also acquired a site in ChaoyangDistrict, Beijing. The 1.09 million square feet site nearthe Olympic Park will allow us to build about 2,000homes over the next three to five years.
OUTLOOK/GOING FORWARD
Q9 What is your broad strategy, going forward, for theresidential business?
A9 We will continue to expand our presence in our three key markets: Singapore, Australia and China. In addition, we will actively explore opportunities innew markets.
RESIDENTIAL
2
1
CL AR03 30-54 (SBU) A/W.OK 17/03/2004 06:15 PM Page 34
35
Cap
itaLa
ndA
R 0
3FO
CUS
BA
LAN
CE S
CALE
Q10 What are the plans for new launches in Singapore?
A10 With signs of recovery in the Singapore economy, we plan to release some 800 to 1,000 homes fromprojects including Tanglin Residences and the newlyacquired site at Jellicoe Road.
Q11 What is your strategy in Australia?
A11 In Australia, our medium term strategy is to increasethe level of recurrent income from income producingproperties and to reduce the group’s dependence ondevelopment profits. We will do this through staplingmore wholesale property trusts. For 2004, we intendto submit a proposal to staple Australand WholesaleProperty Trust 3, depending on market conditions.
Q12 What are some of your plans for China in 2004?
A12 We plan to release over 1,000 units in China, fromprojects including La Cité and Oasis Riviera inShanghai. The earlier phases for both projects werevery well received by homebuyers in China and unitsreleased thus far are almost fully sold. We will alsolaunch our first residential development in Beijing in 2004.
Q13 Are you looking at investing in other cities in China?
A13 We are actively looking at opportunities in Guangzhou.In addition, we are selectively exploring other second-tier cities in China.
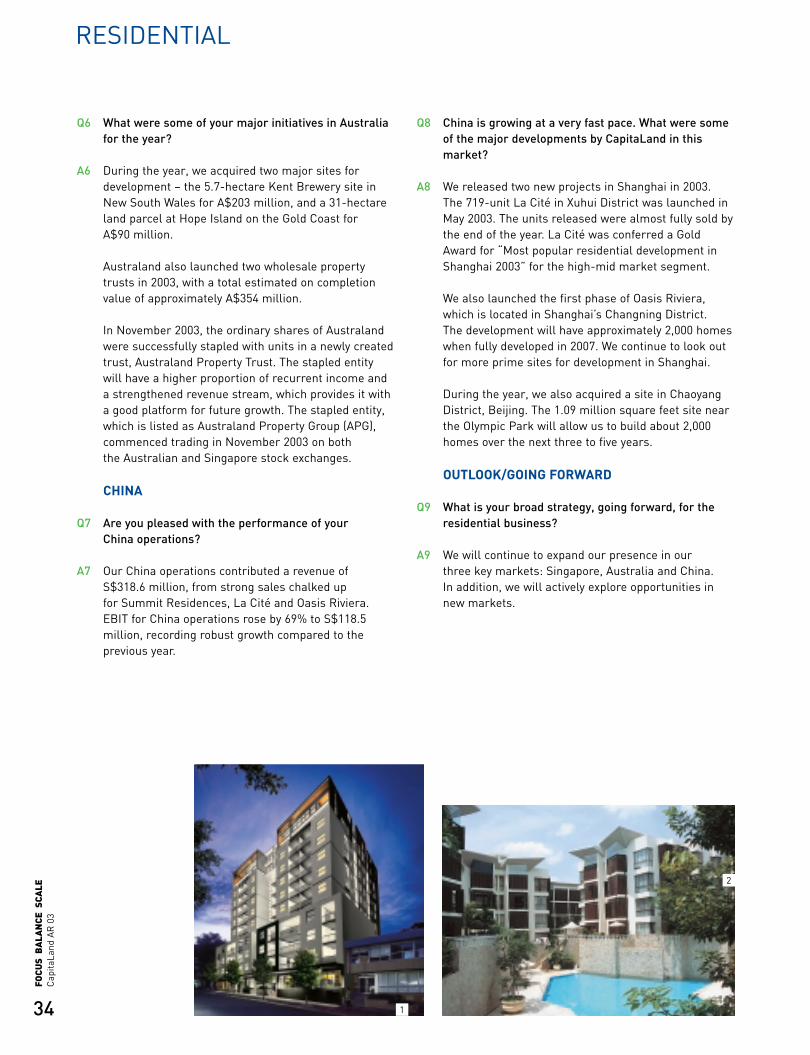
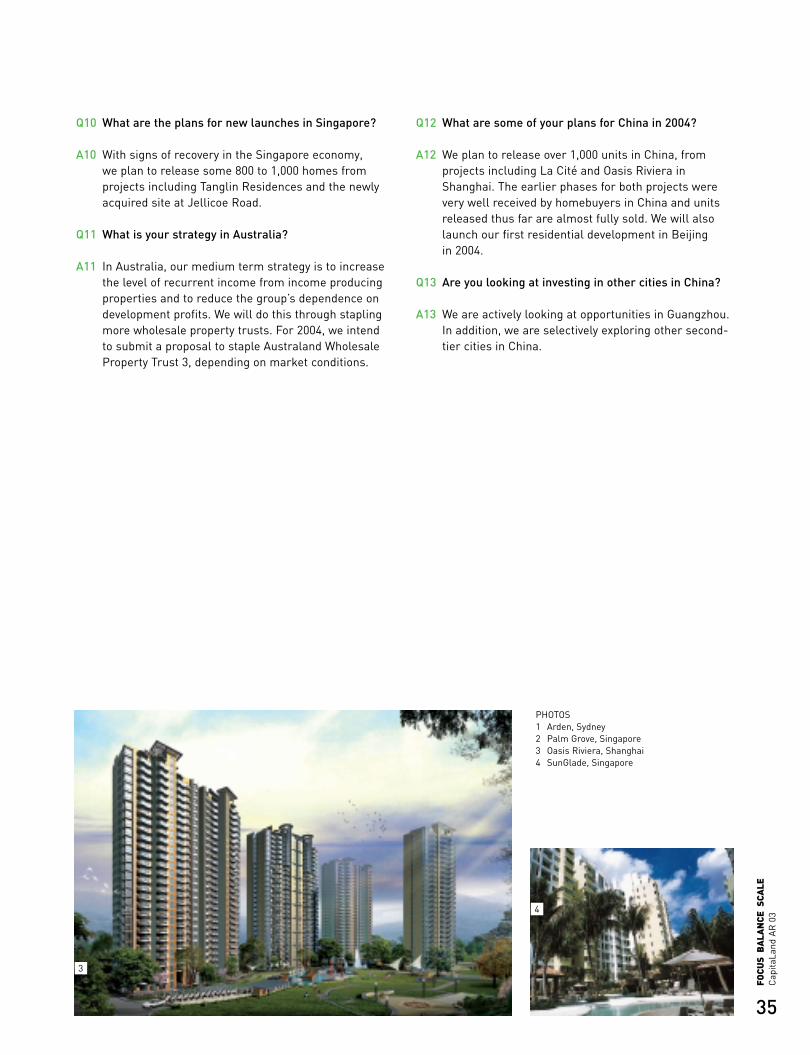
PHOTOS1 Arden, Sydney2 Palm Grove, Singapore 3 Oasis Riviera, Shanghai4 SunGlade, Singapore
3
4
CL AR03 30-54 (SBU) A/W.OK 17/03/2004 06:15 PM Page 35
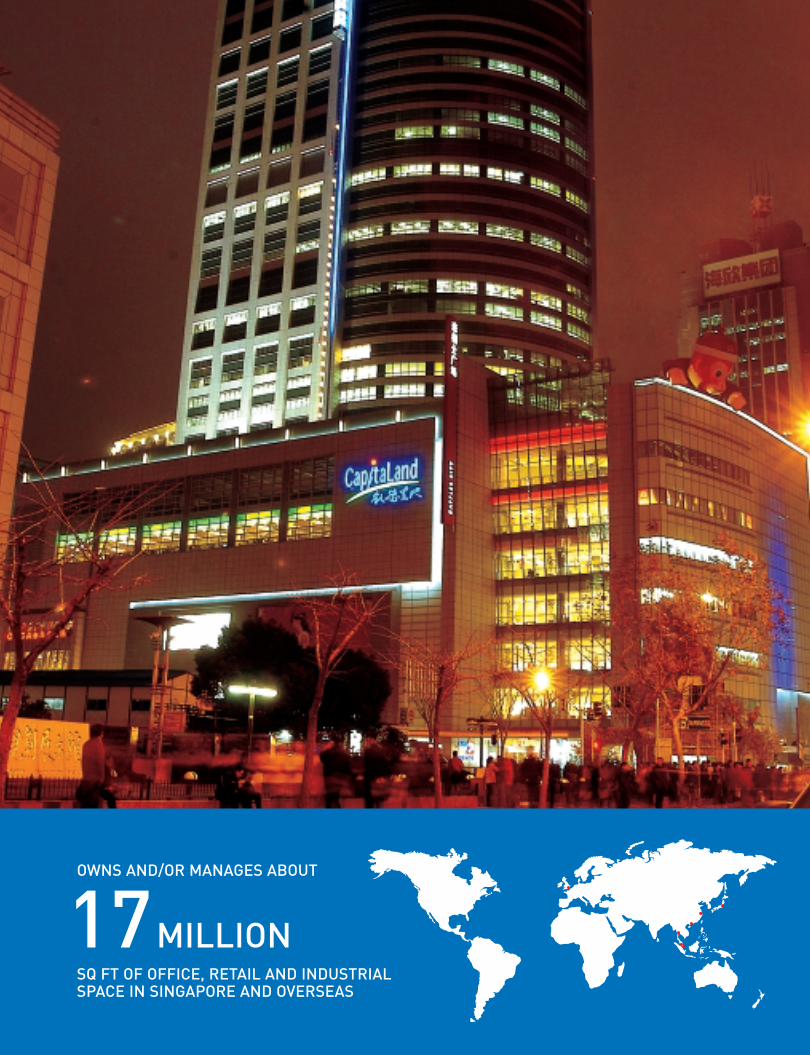
OWNS AND/OR MANAGES ABOUT
SQ FT OF OFFICE, RETAIL AND INDUSTRIALSPACE IN SINGAPORE AND OVERSEAS
17MILLION
CL AR03 30-54 (SBU) A/W.OK 17/03/2004 06:15 PM Page 36
37
Cap
itaLa
ndA
R 0
3FO
CUS
BA
LAN
CE S
CALE
COMMERCIAL
KEE TECK KOON Chief Executive OfficerCapitaLand Commercial Limited
BUSINESS STRATEGY/PERFORMANCE
Q1 What is your business strategy?
A1 CapitaLand Commercial today owns and/or manages a portfolio of approximately 6.5 million square feet of retail properties and shopping centres, and over 10 million square feet of office and industrialproperties in Singapore and overseas.
Our business strategy is to strengthen and grow ourintegrated real estate delivery capabilities to createvalue for our shareholders and investors throughsuperior asset yields and productivity. We also want to be the preferred investor/manager or partner tofinancial and strategic investors who have interest ininvesting in commercial real estate in geographies inwhich we have a presence.
Q2 What are the new initiatives undertaken during theyear which have contributed to the achievement ofyour goals in Singapore?
A2 For our retail portfolio, we have created more netlettable area and enhanced the rental potential ofexisting spaces such as Tampines Mall and Junction 8,both of which we manage. At Plaza Singapura,upgrading, repositioning and better retail planninghave resulted in an improved shopping experience anda surge in pedestrian traffic. Its stabilised annual yieldhas now grown to over 6%.
Our success in creating new benchmarks forenhancing the value of retail properties in Singaporehas not gone unnoticed. In 2003, we secured newmanagement contracts, including HarbourFront Mall,which will be the largest retail development inSingapore; three malls owned by private retail fund,CapitaRetail Singapore (CRS); IMM Building which wasacquired by CapitaMall Trust (CMT); and La ParkMizue, a suburban mall in Tokyo. The three CRS mallsare Lot One Shoppers’ Mall, Rivervale Mall and BukitPanjang Plaza, all of which are located in denselypopulated suburban areas in Singapore.
Our office occupancy as at end 2003 hit 86%, whichwas 5% above the market, reflecting the quality of our portfolio. We stepped up our tenant relationsprogramme and added more platforms for interactionand dialogue with office tenants during the year. We also introduced various initiatives aimed atbenefiting tenants like purchasing electrical power in bulk and passing on the savings to them.
Again, our efforts have not gone unnoticed, as ourflagship office building, Capital Tower, was accordedfurther accolades during the year. This includedreceiving the Building Construction Authority’s EnergyEfficient Building Award (New and Existing BuildingCategory) and emerging first runner-up at the ASEAN Energy Awards 2003. Capital Tower was alsocommended as one of the best office developments in the world by FIABCI, a prestigious international real estate body.
Q3 CapitaLand is the leading manager of retail space inSingapore. What are the key asset enhancementinitiatives planned for 2004?
A3 We are really excited about the asset enhancementwork planned for Clarke Quay. We want to turn ClarkeQuay into an icon in Southeast Asia by creating apremier food, fashion and leisure precinct by theSingapore River.
We completed the concept plan for the new Clarke Quay and appointed renowned internationalarchitectural firm, Alsop Architects, to help us withthe design. This new concept will leverage on thesite’s unique historical heritage, its prime SingaporeRiver frontage, and the proximity to the recentlyopened MRT station. The project is targeted to becompleted in two years and Clarke Quay will remainopen for business during this time.
CL AR03 30-54 (SBU) A/W.OK 17/03/2004 06:15 PM Page 37
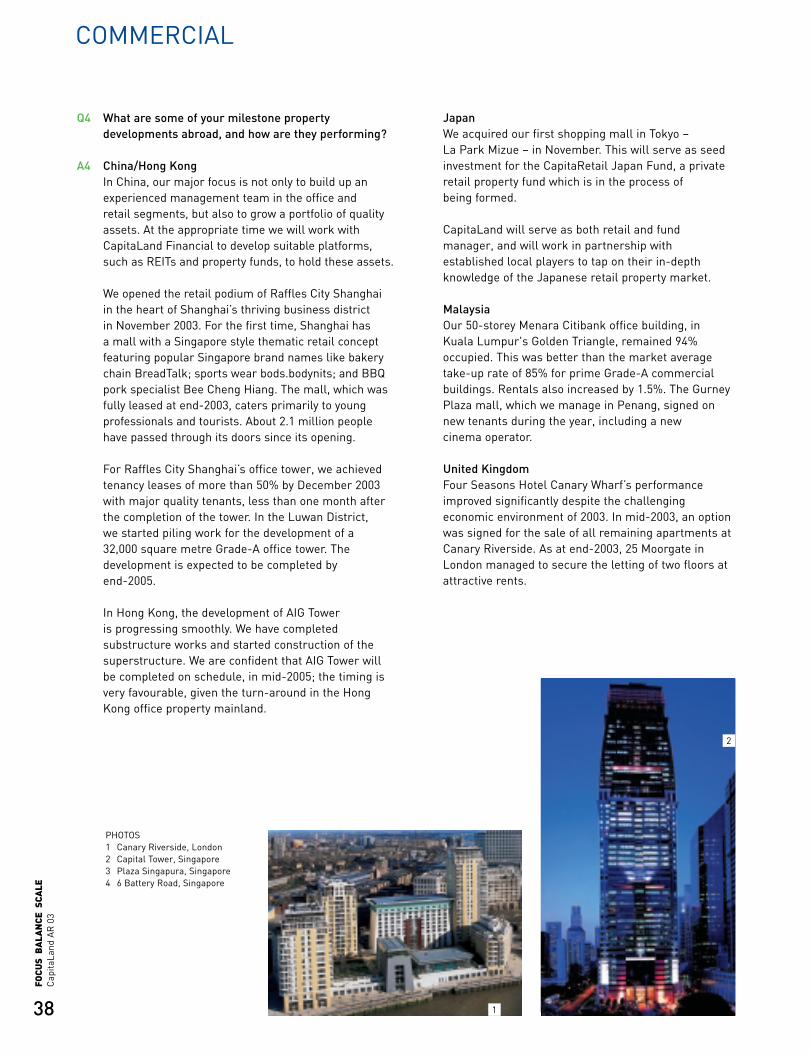
38
Cap
itaLa
ndA
R 0
3FO
CUS
BA
LAN
CE S
CALE
Q4 What are some of your milestone propertydevelopments abroad, and how are they performing?
A4 China/Hong KongIn China, our major focus is not only to build up anexperienced management team in the office and retail segments, but also to grow a portfolio of qualityassets. At the appropriate time we will work withCapitaLand Financial to develop suitable platforms,such as REITs and property funds, to hold these assets.
We opened the retail podium of Raffles City Shanghaiin the heart of Shanghai’s thriving business district in November 2003. For the first time, Shanghai has a mall with a Singapore style thematic retail conceptfeaturing popular Singapore brand names like bakerychain BreadTalk; sports wear bods.bodynits; and BBQpork specialist Bee Cheng Hiang. The mall, which wasfully leased at end-2003, caters primarily to youngprofessionals and tourists. About 2.1 million peoplehave passed through its doors since its opening.
For Raffles City Shanghai’s office tower, we achievedtenancy leases of more than 50% by December 2003with major quality tenants, less than one month after the completion of the tower. In the Luwan District, we started piling work for the development of a 32,000 square metre Grade-A office tower. Thedevelopment is expected to be completed by end-2005.
In Hong Kong, the development of AIG Tower is progressing smoothly. We have completedsubstructure works and started construction of thesuperstructure. We are confident that AIG Tower willbe completed on schedule, in mid-2005; the timing isvery favourable, given the turn-around in the HongKong office property mainland.
JapanWe acquired our first shopping mall in Tokyo – La Park Mizue – in November. This will serve as seedinvestment for the CapitaRetail Japan Fund, a privateretail property fund which is in the process of being formed.
CapitaLand will serve as both retail and fundmanager, and will work in partnership withestablished local players to tap on their in-depthknowledge of the Japanese retail property market.
MalaysiaOur 50-storey Menara Citibank office building, inKuala Lumpur's Golden Triangle, remained 94%occupied. This was better than the market averagetake-up rate of 85% for prime Grade-A commercialbuildings. Rentals also increased by 1.5%. The GurneyPlaza mall, which we manage in Penang, signed on new tenants during the year, including a new cinema operator.
United KingdomFour Seasons Hotel Canary Wharf’s performanceimproved significantly despite the challengingeconomic environment of 2003. In mid-2003, an optionwas signed for the sale of all remaining apartments atCanary Riverside. As at end-2003, 25 Moorgate inLondon managed to secure the letting of two floors atattractive rents.
COMMERCIAL
PHOTOS1 Canary Riverside, London2 Capital Tower, Singapore3 Plaza Singapura, Singapore4 6 Battery Road, Singapore
1
2
CL AR03 30-54 (SBU) A/W.OK 17/03/2004 06:15 PM Page 38
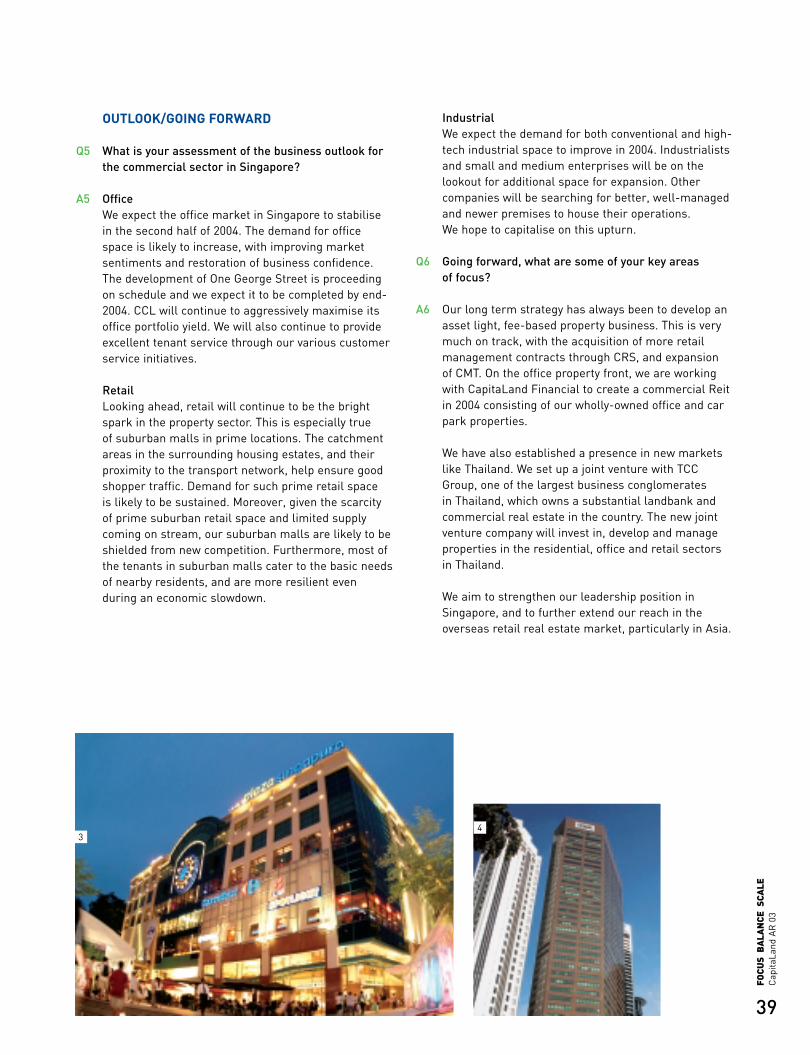
39
Cap
itaLa
ndA
R 0
3FO
CUS
BA
LAN
CE S
CALE
OUTLOOK/GOING FORWARD
Q5 What is your assessment of the business outlook forthe commercial sector in Singapore?
A5 OfficeWe expect the office market in Singapore to stabilisein the second half of 2004. The demand for officespace is likely to increase, with improving marketsentiments and restoration of business confidence.The development of One George Street is proceedingon schedule and we expect it to be completed by end-2004. CCL will continue to aggressively maximise itsoffice portfolio yield. We will also continue to provideexcellent tenant service through our various customerservice initiatives.
RetailLooking ahead, retail will continue to be the brightspark in the property sector. This is especially true of suburban malls in prime locations. The catchmentareas in the surrounding housing estates, and theirproximity to the transport network, help ensure goodshopper traffic. Demand for such prime retail space is likely to be sustained. Moreover, given the scarcityof prime suburban retail space and limited supplycoming on stream, our suburban malls are likely to beshielded from new competition. Furthermore, most ofthe tenants in suburban malls cater to the basic needsof nearby residents, and are more resilient evenduring an economic slowdown.
IndustrialWe expect the demand for both conventional and high-tech industrial space to improve in 2004. Industrialistsand small and medium enterprises will be on thelookout for additional space for expansion. Othercompanies will be searching for better, well-managedand newer premises to house their operations. We hope to capitalise on this upturn.
Q6 Going forward, what are some of your key areas of focus?
A6 Our long term strategy has always been to develop anasset light, fee-based property business. This is verymuch on track, with the acquisition of more retailmanagement contracts through CRS, and expansion of CMT. On the office property front, we are workingwith CapitaLand Financial to create a commercial Reitin 2004 consisting of our wholly-owned office and car park properties.
We have also established a presence in new marketslike Thailand. We set up a joint venture with TCCGroup, one of the largest business conglomerates in Thailand, which owns a substantial landbank andcommercial real estate in the country. The new jointventure company will invest in, develop and manageproperties in the residential, office and retail sectorsin Thailand.
We aim to strengthen our leadership position inSingapore, and to further extend our reach in theoverseas retail real estate market, particularly in Asia.
34
CL AR03 30-54 (SBU) A/W.OK 17/03/2004 06:15 PM Page 39
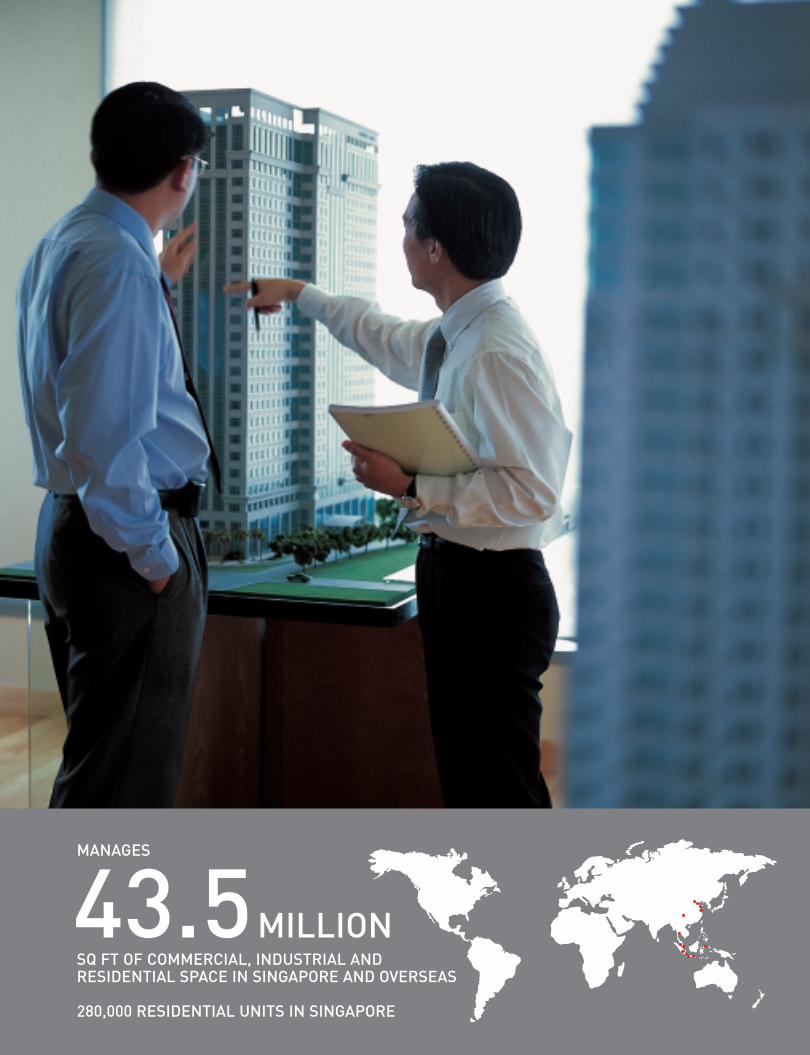
SQ FT OF COMMERCIAL, INDUSTRIAL ANDRESIDENTIAL SPACE IN SINGAPORE AND OVERSEAS
280,000 RESIDENTIAL UNITS IN SINGAPORE
43.5MILLION
MANAGES
CL AR03 30-54 (SBU) A/W.OK 17/03/2004 06:16 PM Page 40
41
Cap
itaLa
ndA
R 0
3FO
CUS
BA
LAN
CE S
CALE
PROPERTY SERVICES
ANTHONY SEAH Chief Executive OfficerPREMAS International Limited
BUSINESS STRATEGY/PERFORMANCE
Q1 What is your business strategy?
A1 Our strategy is to continue to increase fee-basedinnovative services and products. For example, wecreated the Facility Management Retainer Scheme, inwhich customers pay a retainer fee for the provision ofbasic building management services, including add-oncustomised solutions based on their specific needs.
We also want to seize the opportunities presented by the strong trends in outsourcing and offer anoperational yield-based management. We haveintegrated up from basic maintenance-type services to total facility management and yield enhancement.
In short, our vision is to be the total real estatemanager and a leader in managing technologicalfacilities. We have expanded and leveraged on ourdomain knowledge in Total Building Performancetechnology to maximise yields and create lasting value for our customers.
Q2 How did PREMAS International perform in 2003?What were the key revenue drivers?
A2 Despite the year’s difficult economic outlook, PREMASInternational continued to show steady growth bywinning new contracts, developing new lines ofbusiness opportunities, leveraging on strategicalliances for business generation, and divestingbusiness areas that we felt could be better served by others.
For the financial year ended 31 December 2003,PREMAS achieved a turnover of S$123.8 million, an increase of 4.1% over the previous year's S$118.9 million. This was mainly attributable to new facility management and consulting contractssecured, both in Singapore as well as overseas.
SINGAPORE
Q3 What are some of the key initiatives and significantachievements in 2003?
A3 We stepped up our efforts for facility managementcontracts, clinching a contract for 45 schools inSingapore in April 2003, and a five-year integratedfacility management contract with ST Assembly TestServices (STATS) in August. Apart from enhancingoperational efficiencies and cost savings, leveragingon PREMAS’ strengths in facility management andengineering allows STATS to focus on its corecompetency of semiconductor manufacturing.Synergistic partnerships with clients such as STATShas enabled us to execute our vision to become theleader in managing technological facilities.
During the year, PREMAS also expanded its businessportfolio and launched several new initiatives. Theseinitiatives included engineering audits and in-housedevelopment of remote monitoring capabilities forenhanced safety and greater reliability of managedfacilities. We also sought ways to enhance yieldsderived from our managed assets.
We are particularly proud of our PREMAS EnergyCentre, set up in 2001. The Centre provides EnergyAudit, Management and Procurement services. Ourportfolio comprises commercial buildings, hotels,shopping centres, manufacturing facilities andhospitals.
CL AR03 30-54 (SBU) A/W.OK 17/03/2004 06:16 PM Page 41
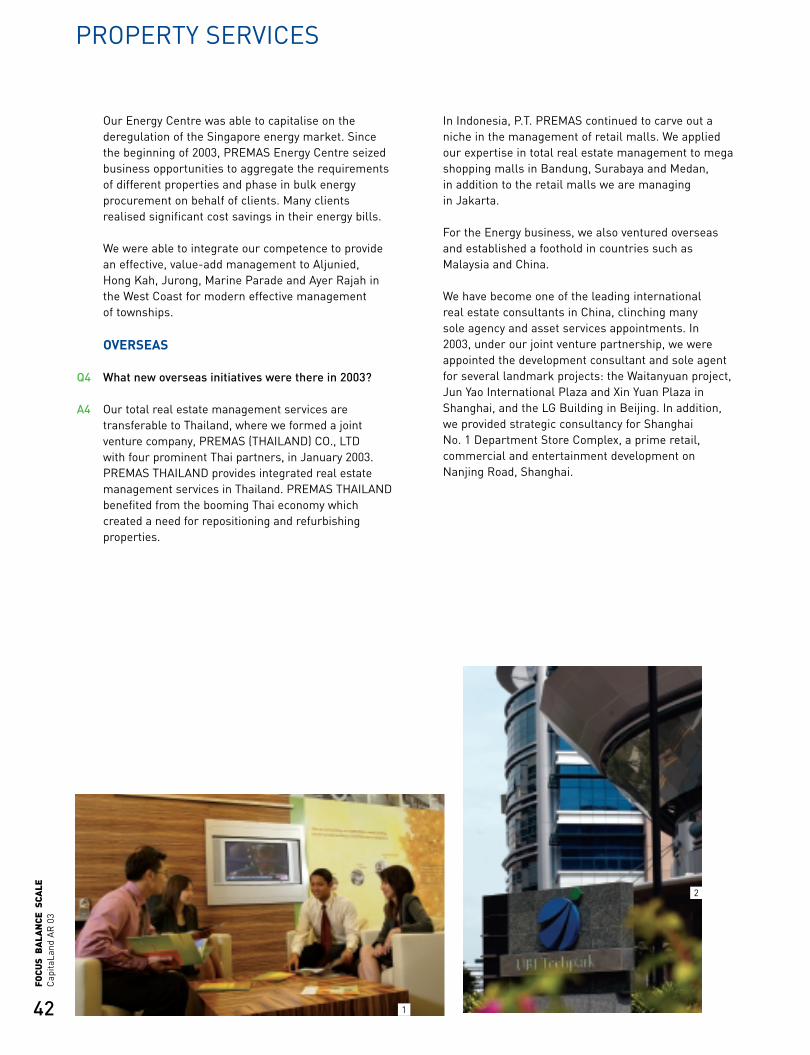
42
Cap
itaLa
ndA
R 0
3FO
CUS
BA
LAN
CE S
CALE
Our Energy Centre was able to capitalise on thederegulation of the Singapore energy market. Sincethe beginning of 2003, PREMAS Energy Centre seizedbusiness opportunities to aggregate the requirementsof different properties and phase in bulk energyprocurement on behalf of clients. Many clientsrealised significant cost savings in their energy bills.
We were able to integrate our competence to providean effective, value-add management to Aljunied, Hong Kah, Jurong, Marine Parade and Ayer Rajah inthe West Coast for modern effective management of townships.
OVERSEAS
Q4 What new overseas initiatives were there in 2003?
A4 Our total real estate management services aretransferable to Thailand, where we formed a jointventure company, PREMAS (THAILAND) CO., LTD with four prominent Thai partners, in January 2003.PREMAS THAILAND provides integrated real estatemanagement services in Thailand. PREMAS THAILANDbenefited from the booming Thai economy whichcreated a need for repositioning and refurbishingproperties.
In Indonesia, P.T. PREMAS continued to carve out aniche in the management of retail malls. We appliedour expertise in total real estate management to megashopping malls in Bandung, Surabaya and Medan, in addition to the retail malls we are managing in Jakarta.
For the Energy business, we also ventured overseasand established a foothold in countries such asMalaysia and China.
We have become one of the leading international real estate consultants in China, clinching many sole agency and asset services appointments. In 2003, under our joint venture partnership, we wereappointed the development consultant and sole agentfor several landmark projects: the Waitanyuan project,Jun Yao International Plaza and Xin Yuan Plaza inShanghai, and the LG Building in Beijing. In addition,we provided strategic consultancy for Shanghai No. 1 Department Store Complex, a prime retail,commercial and entertainment development onNanjing Road, Shanghai.
PROPERTY SERVICES
1
2
CL AR03 30-54 (SBU) A/W.OK 17/03/2004 06:16 PM Page 42
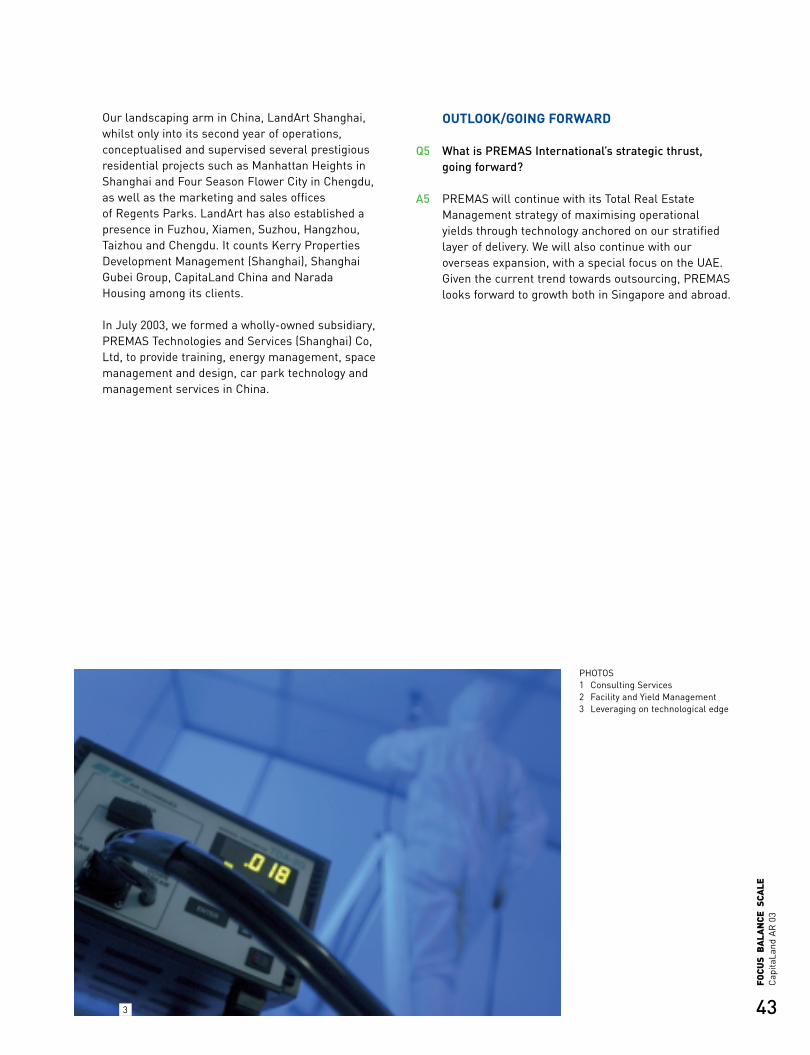
43
Cap
itaLa
ndA
R 0
3FO
CUS
BA
LAN
CE S
CALE
Our landscaping arm in China, LandArt Shanghai,whilst only into its second year of operations,conceptualised and supervised several prestigiousresidential projects such as Manhattan Heights inShanghai and Four Season Flower City in Chengdu, as well as the marketing and sales offices of Regents Parks. LandArt has also established apresence in Fuzhou, Xiamen, Suzhou, Hangzhou,Taizhou and Chengdu. It counts Kerry PropertiesDevelopment Management (Shanghai), ShanghaiGubei Group, CapitaLand China and Narada Housing among its clients.
In July 2003, we formed a wholly-owned subsidiary,PREMAS Technologies and Services (Shanghai) Co,Ltd, to provide training, energy management, spacemanagement and design, car park technology andmanagement services in China.
OUTLOOK/GOING FORWARD
Q5 What is PREMAS International’s strategic thrust,going forward?
A5 PREMAS will continue with its Total Real EstateManagement strategy of maximising operationalyields through technology anchored on our stratifiedlayer of delivery. We will also continue with ouroverseas expansion, with a special focus on the UAE.Given the current trend towards outsourcing, PREMASlooks forward to growth both in Singapore and abroad.
PHOTOS1 Consulting Services2 Facility and Yield Management3 Leveraging on technological edge
3
CL AR03 30-54 (SBU) A/W.OK 17/03/2004 06:16 PM Page 43

INCREASE IN FY 2003 OPERATING PATMI
S$416 MILLION CAPITAL DISTRIBUTION
60%
CL AR03 30-54 (SBU) A/W.OK 17/03/2004 06:16 PM Page 44
45
Cap
itaLa
ndA
R 0
3FO
CUS
BA
LAN
CE S
CALE
BUSINESS STRATEGY/PERFORMANCE
Q1 Industry observers have noted that there has been a change of tactics on expansion. How has Raffles’business strategy changed?
A1 In April 2003, the Group implemented a refocuseddemand-driven business strategy. Firstly, wereorganised our hotel operations around our twodistinctive brands (Raffles Hotels & Resorts andSwissôtel Hotels & Resorts). This will ensure betterresponsiveness to market and customer demands,and direct bottom-line accountability. Secondly, werestructured costs and corporate support structuresto achieve greater operational efficiencies and costmanagement; and thirdly, we pursued asset-lightaccretive growth through a mix of managementcontracts, leases and equity participation and to swap assets where appropriate, to improve returns.
SINGAPORE/OVERSEAS
Q2 What was the impact of SARS on business?
A2 In 1H 2003, hotels within the Group which wereaffected by SARS intensified their cost containmentmeasures, as there were limited opportunities todrive top-line revenue. These measures includedreductions in staffing costs, implementation ofaccelerated vacation and no-pay leave, andrationalisation of F&B operations to improve yield.
In Singapore, operating conditions were extremelychallenging. However, our hotels traded at RevPARpremiums to their competitive sets during this period,due to various innovative promotions to tap domesticbusiness, which helped to partially offset thedecrease in international business.
The Group’s diversified global presence, in part,cushioned against the twin threat of war and SARSand helped make it more resilient. By 2H 2003,business rebounded to pre-SARS levels in terms of occupancy.
Q3 What were some of the significant initiatives in 2003for Raffles, both in Singapore and globally?
A3 Raffles Holdings has been successful in the pursuit of our asset-light growth strategy and added fourmanagement contracts to our portfolio in 2003. InApril and June, the Group secured new managementcontracts for two existing hotels in Osaka, Japan andin Bangkok, Thailand without equity participation.Swissôtel Nankai Osaka was launched in Septemberwhile Nai Lert Park Bangkok was launched inJanuary 2004. In August, the Group secured acontract to manage the Raffles Resort Phuket inThailand with 20% equity participation, as well as a contract to manage the Raffles Resort CanouanIsland, the Grenadines, without equity participation.
HOTELS
JENNIE CHUA President andChief Executive OfficerRaffles Holdings Limited
CL AR03 30-54 (SBU) A/W.OK 17/03/2004 06:16 PM Page 45
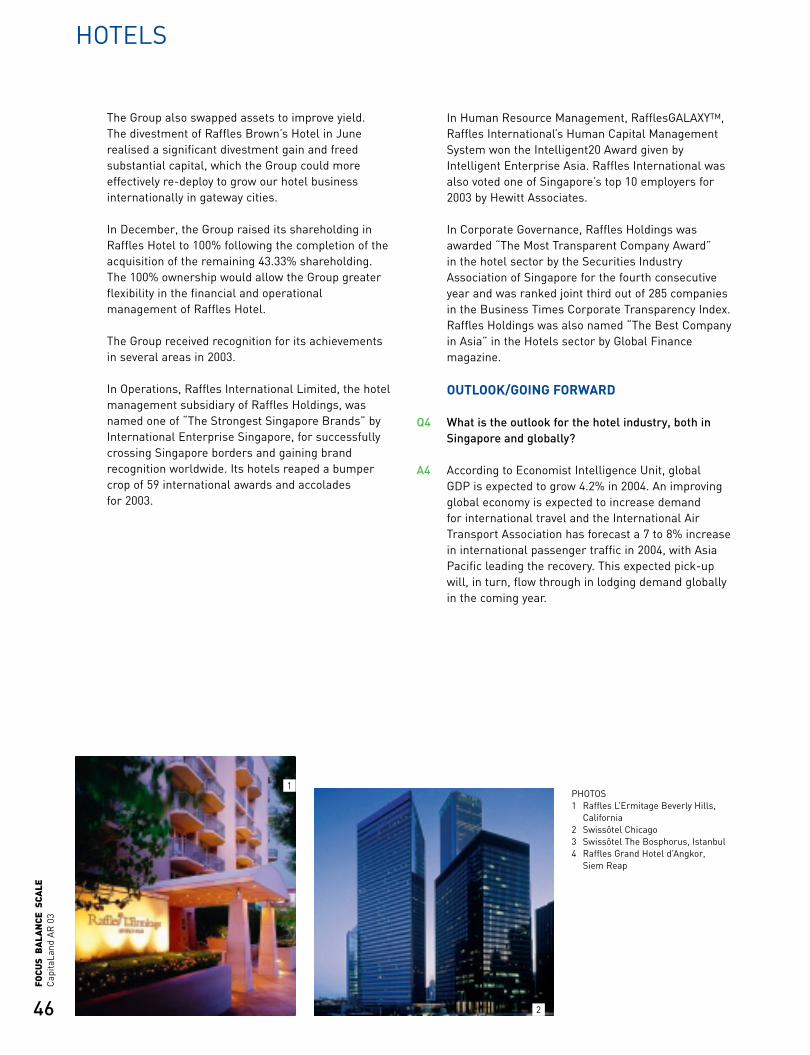
46
Cap
itaLa
ndA
R 0
3FO
CUS
BA
LAN
CE S
CALE
The Group also swapped assets to improve yield. The divestment of Raffles Brown’s Hotel in Junerealised a significant divestment gain and freedsubstantial capital, which the Group could moreeffectively re-deploy to grow our hotel businessinternationally in gateway cities.
In December, the Group raised its shareholding inRaffles Hotel to 100% following the completion of theacquisition of the remaining 43.33% shareholding.The 100% ownership would allow the Group greaterflexibility in the financial and operationalmanagement of Raffles Hotel.
The Group received recognition for its achievementsin several areas in 2003.
In Operations, Raffles International Limited, the hotelmanagement subsidiary of Raffles Holdings, wasnamed one of “The Strongest Singapore Brands” byInternational Enterprise Singapore, for successfullycrossing Singapore borders and gaining brandrecognition worldwide. Its hotels reaped a bumpercrop of 59 international awards and accolades for 2003.
In Human Resource Management, RafflesGALAXYTM,Raffles International’s Human Capital ManagementSystem won the Intelligent20 Award given byIntelligent Enterprise Asia. Raffles International wasalso voted one of Singapore’s top 10 employers for2003 by Hewitt Associates.
In Corporate Governance, Raffles Holdings wasawarded “The Most Transparent Company Award” in the hotel sector by the Securities IndustryAssociation of Singapore for the fourth consecutiveyear and was ranked joint third out of 285 companiesin the Business Times Corporate Transparency Index.Raffles Holdings was also named “The Best Companyin Asia” in the Hotels sector by Global Financemagazine.
OUTLOOK/GOING FORWARD
Q4 What is the outlook for the hotel industry, both inSingapore and globally?
A4 According to Economist Intelligence Unit, global GDP is expected to grow 4.2% in 2004. An improvingglobal economy is expected to increase demand for international travel and the International AirTransport Association has forecast a 7 to 8% increasein international passenger traffic in 2004, with AsiaPacific leading the recovery. This expected pick-upwill, in turn, flow through in lodging demand globallyin the coming year.
HOTELS
PHOTOS1 Raffles L’Ermitage Beverly Hills,
California2 Swissôtel Chicago3 Swissôtel The Bosphorus, Istanbul4 Raffles Grand Hotel d’Angkor,
Siem Reap
1
2
CL AR03 30-54 (SBU) A/W.OK 17/03/2004 06:16 PM Page 46
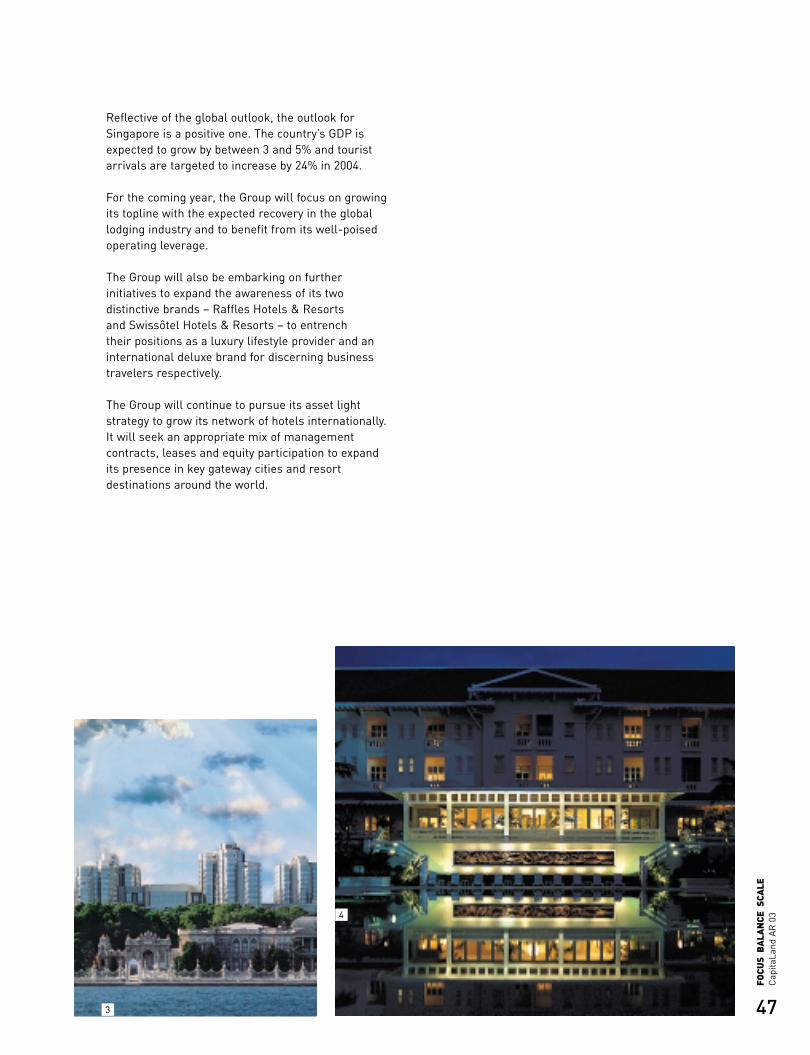
47
Cap
itaLa
ndA
R 0
3FO
CUS
BA
LAN
CE S
CALE
Reflective of the global outlook, the outlook forSingapore is a positive one. The country’s GDP isexpected to grow by between 3 and 5% and touristarrivals are targeted to increase by 24% in 2004.
For the coming year, the Group will focus on growingits topline with the expected recovery in the globallodging industry and to benefit from its well-poisedoperating leverage.
The Group will also be embarking on furtherinitiatives to expand the awareness of its twodistinctive brands – Raffles Hotels & Resorts and Swissôtel Hotels & Resorts – to entrench their positions as a luxury lifestyle provider and aninternational deluxe brand for discerning businesstravelers respectively.
The Group will continue to pursue its asset lightstrategy to grow its network of hotels internationally.It will seek an appropriate mix of managementcontracts, leases and equity participation to expandits presence in key gateway cities and resortdestinations around the world.
3
4
CL AR03 30-54 (SBU) A/W.OK 17/03/2004 06:16 PM Page 47
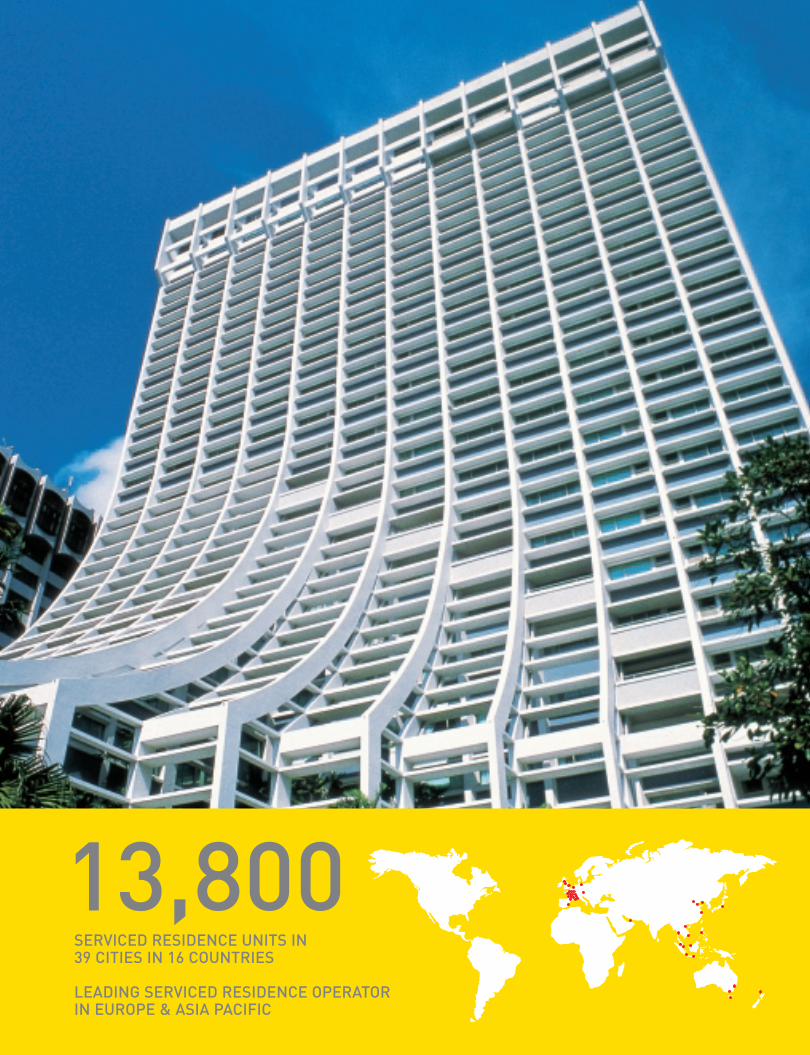
SERVICED RESIDENCE UNITS IN 39 CITIES IN 16 COUNTRIES
LEADING SERVICED RESIDENCE OPERATORIN EUROPE & ASIA PACIFIC
13,800
CL AR03 30-54 (SBU) A/W.OK 17/03/2004 06:17 PM Page 48
49
Cap
itaLa
ndA
R 0
3FO
CUS
BA
LAN
CE S
CALE
BUSINESS STRATEGY/PERFORMANCE
Q1 What is your business strategy?
A1 Our vision is to be the world’s leading internationalserviced residence company, in terms of financialperformance and internationally recognised brands.
We set ourselves five goals:• Strengthen our customer base of top global
companies and top national companies in thecountries we operate
• Be the top serviced residence operator in everymarket we operate, in occupancy and rates
• Be the top serviced residence brand in every marketwe operate, in brand awareness and brand premium
• Grow to 22,500 units by 2008• Achieve ‘best in class’ infrastructure and team.
These ambitious goals set a clear direction for thebusiness, and for the team to take the company togreater heights.
Q2 What were Ascott’s significant initiatives in 2003?
A2 We grew our core serviced residence businesssubstantially in 2003. Ascott is today the leadingserviced residence operator in Asia Pacific and Europewith over 13,800 serviced apartments in 39 cities in 16 countries.
We achieved a net profit of S$18.5 million despitedifficult operating conditions for the global hospitalityindustry due to the Iraq war, severe acute respiratorysyndrome and sluggish global economy.
We reached new heights in our global coverage. In February, we acquired a 50 per cent interest inCitadines, which enlarged our portfolio by over 5,100 serviced apartments in 18 cities in Europe.
In China, we solidified our position as the country’slargest operator by launching two new residences inBeijing and Dalian, increasing our presence to 1,600units in Shanghai, Beijing, Tianjin and Dalian.
At mid-year, we opened the 152-unit Somerset SuwanPark View in Bangkok, 195-unit Somerset Bayswaterin London and 79-unit Somerset Azabu East in Tokyo.
In Australia, we increased our share of the upper-tierserviced residence market by launching 565 newSomerset serviced apartments. With eight Somersetresidences, Ascott now commands critical mass inSydney, Melbourne and Hobart.
In December, we secured management contracts fortwo prime serviced residences with 250 units in Dubai.Our entry into the Gulf region through collaborationwith one of its largest developers provides an excellentspringboard to further opportunities in the area.
With the substantial growth in 2003, we now have astronger platform to provide our customers withgreater choice and convenience around the world.
We also made good progress on our asset lightstrategy. We grew fee income by securing six newserviced residence management contracts with 730units. We also divested our stakes in three servicedresidences in Thailand and UK, while continuing tomanage two of the divested properties.
SERVICED RESIDENCES
EUGENE LAI Managing Director & Chief Executive Officer The Ascott Group Limited
CL AR03 30-54 (SBU) A/W.OK 17/03/2004 06:17 PM Page 49
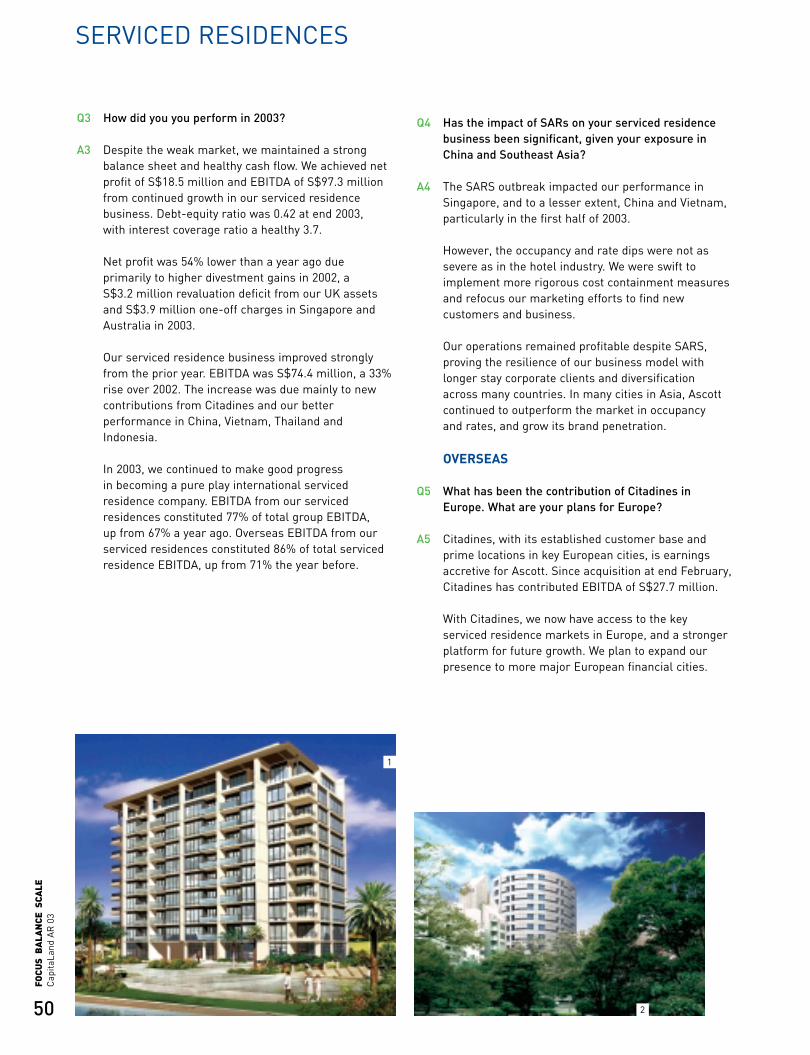
50
Cap
itaLa
ndA
R 0
3FO
CUS
BA
LAN
CE S
CALE
Q3 How did you you perform in 2003?
A3 Despite the weak market, we maintained a strongbalance sheet and healthy cash flow. We achieved netprofit of S$18.5 million and EBITDA of S$97.3 millionfrom continued growth in our serviced residencebusiness. Debt-equity ratio was 0.42 at end 2003, with interest coverage ratio a healthy 3.7.
Net profit was 54% lower than a year ago dueprimarily to higher divestment gains in 2002, a S$3.2 million revaluation deficit from our UK assetsand S$3.9 million one-off charges in Singapore andAustralia in 2003.
Our serviced residence business improved stronglyfrom the prior year. EBITDA was S$74.4 million, a 33%rise over 2002. The increase was due mainly to newcontributions from Citadines and our betterperformance in China, Vietnam, Thailand andIndonesia.
In 2003, we continued to make good progress in becoming a pure play international servicedresidence company. EBITDA from our servicedresidences constituted 77% of total group EBITDA, up from 67% a year ago. Overseas EBITDA from ourserviced residences constituted 86% of total servicedresidence EBITDA, up from 71% the year before.
Q4 Has the impact of SARs on your serviced residencebusiness been significant, given your exposure inChina and Southeast Asia?
A4 The SARS outbreak impacted our performance inSingapore, and to a lesser extent, China and Vietnam,particularly in the first half of 2003.
However, the occupancy and rate dips were not assevere as in the hotel industry. We were swift toimplement more rigorous cost containment measuresand refocus our marketing efforts to find newcustomers and business.
Our operations remained profitable despite SARS,proving the resilience of our business model withlonger stay corporate clients and diversification across many countries. In many cities in Asia, Ascottcontinued to outperform the market in occupancy and rates, and grow its brand penetration.
OVERSEAS
Q5 What has been the contribution of Citadines inEurope. What are your plans for Europe?
A5 Citadines, with its established customer base andprime locations in key European cities, is earningsaccretive for Ascott. Since acquisition at end February,Citadines has contributed EBITDA of S$27.7 million.
With Citadines, we now have access to the keyserviced residence markets in Europe, and a strongerplatform for future growth. We plan to expand ourpresence to more major European financial cities.
SERVICED RESIDENCES
1
2
CL AR03 30-54 (SBU) A/W.OK 17/03/2004 06:17 PM Page 50
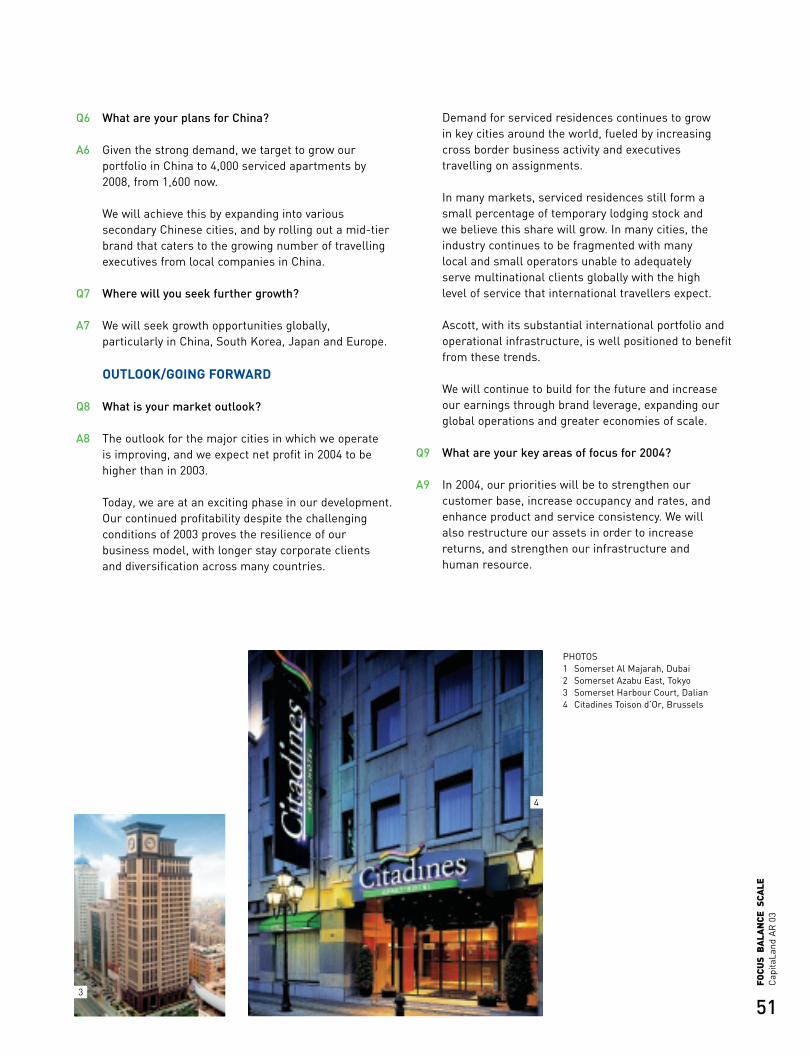
51
Cap
itaLa
ndA
R 0
3FO
CUS
BA
LAN
CE S
CALE
Q6 What are your plans for China?
A6 Given the strong demand, we target to grow ourportfolio in China to 4,000 serviced apartments by2008, from 1,600 now.
We will achieve this by expanding into varioussecondary Chinese cities, and by rolling out a mid-tierbrand that caters to the growing number of travellingexecutives from local companies in China.
Q7 Where will you seek further growth?
A7 We will seek growth opportunities globally,particularly in China, South Korea, Japan and Europe.
OUTLOOK/GOING FORWARD
Q8 What is your market outlook?
A8 The outlook for the major cities in which we operate is improving, and we expect net profit in 2004 to behigher than in 2003.
Today, we are at an exciting phase in our development.Our continued profitability despite the challengingconditions of 2003 proves the resilience of ourbusiness model, with longer stay corporate clients and diversification across many countries.
Demand for serviced residences continues to grow in key cities around the world, fueled by increasingcross border business activity and executivestravelling on assignments.
In many markets, serviced residences still form asmall percentage of temporary lodging stock and we believe this share will grow. In many cities, theindustry continues to be fragmented with many local and small operators unable to adequately serve multinational clients globally with the high level of service that international travellers expect.
Ascott, with its substantial international portfolio andoperational infrastructure, is well positioned to benefitfrom these trends.
We will continue to build for the future and increaseour earnings through brand leverage, expanding ourglobal operations and greater economies of scale.
Q9 What are your key areas of focus for 2004?
A9 In 2004, our priorities will be to strengthen ourcustomer base, increase occupancy and rates, andenhance product and service consistency. We will also restructure our assets in order to increasereturns, and strengthen our infrastructure and human resource.
PHOTOS1 Somerset Al Majarah, Dubai2 Somerset Azabu East, Tokyo3 Somerset Harbour Court, Dalian4 Citadines Toison d’Or, Brussels
3
4
CL AR03 30-54 (SBU) A/W.OK 17/03/2004 06:17 PM Page 51

MORE THAN
OF ASSETS UNDER MANAGEMENT
S$ 3BILLION
CL AR03 30-54 (SBU) A/W.OK 17/03/2004 06:17 PM Page 52
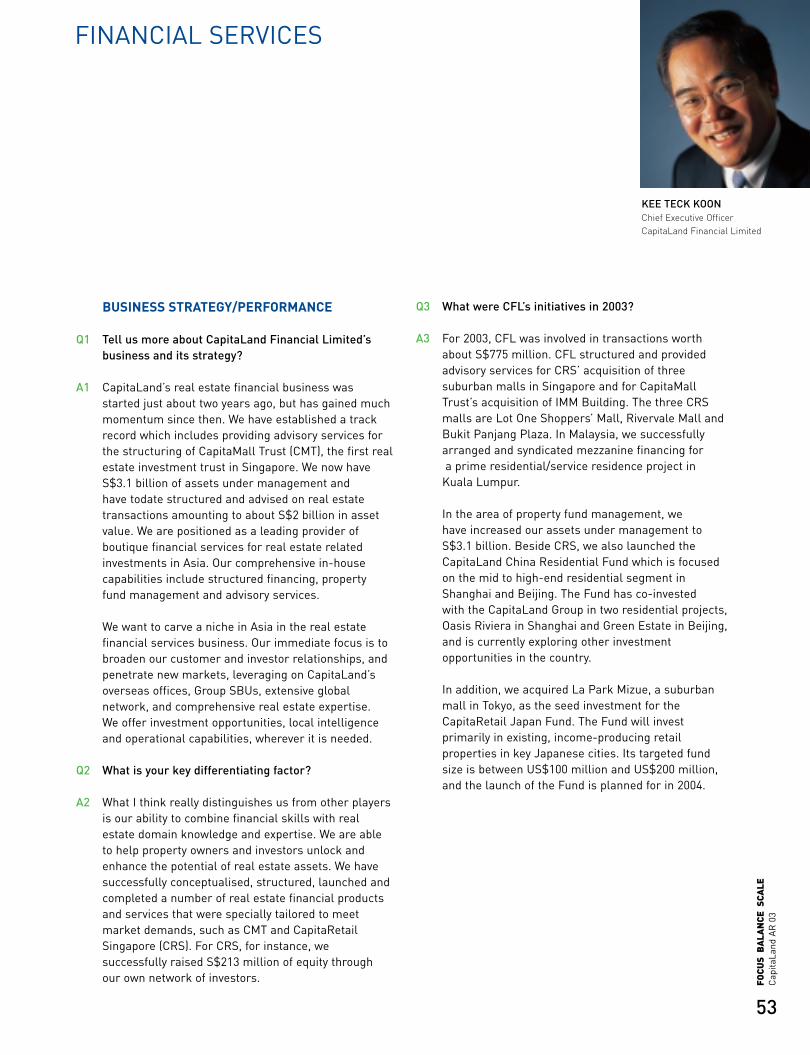
53
Cap
itaLa
ndA
R 0
3FO
CUS
BA
LAN
CE S
CALE
FINANCIAL SERVICES
KEE TECK KOON Chief Executive OfficerCapitaLand Financial Limited
BUSINESS STRATEGY/PERFORMANCE
Q1 Tell us more about CapitaLand Financial Limited’sbusiness and its strategy?
A1 CapitaLand’s real estate financial business wasstarted just about two years ago, but has gained muchmomentum since then. We have established a trackrecord which includes providing advisory services forthe structuring of CapitaMall Trust (CMT), the first realestate investment trust in Singapore. We now haveS$3.1 billion of assets under management and have todate structured and advised on real estatetransactions amounting to about S$2 billion in assetvalue. We are positioned as a leading provider ofboutique financial services for real estate relatedinvestments in Asia. Our comprehensive in-housecapabilities include structured financing, propertyfund management and advisory services.
We want to carve a niche in Asia in the real estatefinancial services business. Our immediate focus is tobroaden our customer and investor relationships, andpenetrate new markets, leveraging on CapitaLand’soverseas offices, Group SBUs, extensive globalnetwork, and comprehensive real estate expertise. We offer investment opportunities, local intelligenceand operational capabilities, wherever it is needed.
Q2 What is your key differentiating factor?
A2 What I think really distinguishes us from other playersis our ability to combine financial skills with realestate domain knowledge and expertise. We are ableto help property owners and investors unlock andenhance the potential of real estate assets. We havesuccessfully conceptualised, structured, launched andcompleted a number of real estate financial productsand services that were specially tailored to meetmarket demands, such as CMT and CapitaRetailSingapore (CRS). For CRS, for instance, wesuccessfully raised S$213 million of equity throughour own network of investors.
Q3 What were CFL’s initiatives in 2003?
A3 For 2003, CFL was involved in transactions worthabout S$775 million. CFL structured and providedadvisory services for CRS’ acquisition of threesuburban malls in Singapore and for CapitaMallTrust’s acquisition of IMM Building. The three CRSmalls are Lot One Shoppers’ Mall, Rivervale Mall andBukit Panjang Plaza. In Malaysia, we successfullyarranged and syndicated mezzanine financing fora prime residential/service residence project in
Kuala Lumpur.
In the area of property fund management, we have increased our assets under management toS$3.1 billion. Beside CRS, we also launched theCapitaLand China Residential Fund which is focusedon the mid to high-end residential segment inShanghai and Beijing. The Fund has co-invested with the CapitaLand Group in two residential projects,Oasis Riviera in Shanghai and Green Estate in Beijing,and is currently exploring other investmentopportunities in the country.
In addition, we acquired La Park Mizue, a suburbanmall in Tokyo, as the seed investment for theCapitaRetail Japan Fund. The Fund will investprimarily in existing, income-producing retailproperties in key Japanese cities. Its targeted fundsize is between US$100 million and US$200 million,and the launch of the Fund is planned for in 2004.
CL AR03 30-54 (SBU) A/W.OK 17/03/2004 06:17 PM Page 53
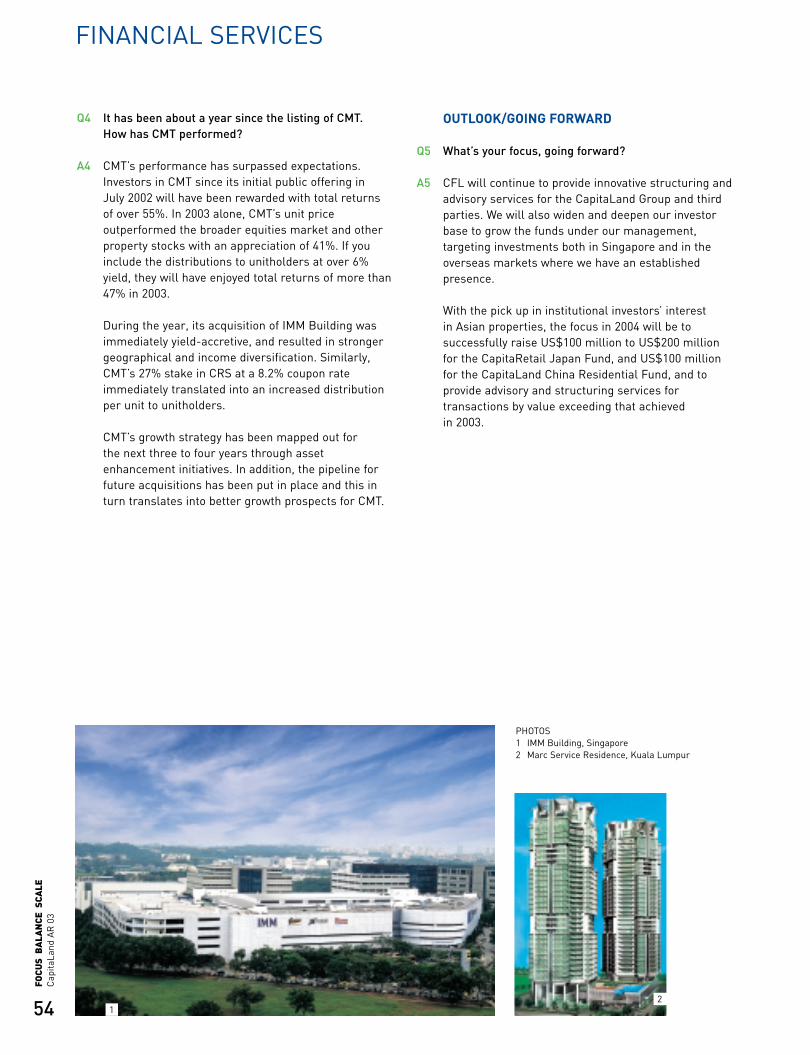
54
Cap
itaLa
ndA
R 0
3FO
CUS
BA
LAN
CE S
CALE
Q4 It has been about a year since the listing of CMT. How has CMT performed?
A4 CMT’s performance has surpassed expectations.Investors in CMT since its initial public offering in July 2002 will have been rewarded with total returns of over 55%. In 2003 alone, CMT’s unit priceoutperformed the broader equities market and otherproperty stocks with an appreciation of 41%. If youinclude the distributions to unitholders at over 6%yield, they will have enjoyed total returns of more than47% in 2003.
During the year, its acquisition of IMM Building wasimmediately yield-accretive, and resulted in strongergeographical and income diversification. Similarly,CMT’s 27% stake in CRS at a 8.2% coupon rateimmediately translated into an increased distributionper unit to unitholders.
CMT’s growth strategy has been mapped out for the next three to four years through assetenhancement initiatives. In addition, the pipeline forfuture acquisitions has been put in place and this inturn translates into better growth prospects for CMT.
OUTLOOK/GOING FORWARD
Q5 What’s your focus, going forward?
A5 CFL will continue to provide innovative structuring andadvisory services for the CapitaLand Group and thirdparties. We will also widen and deepen our investorbase to grow the funds under our management,targeting investments both in Singapore and in theoverseas markets where we have an establishedpresence.
With the pick up in institutional investors’ interest in Asian properties, the focus in 2004 will be tosuccessfully raise US$100 million to US$200 million for the CapitaRetail Japan Fund, and US$100 millionfor the CapitaLand China Residential Fund, and toprovide advisory and structuring services fortransactions by value exceeding that achieved in 2003.
FINANCIAL SERVICES
PHOTOS1 IMM Building, Singapore2 Marc Service Residence, Kuala Lumpur
12
CL AR03 30-54 (SBU) A/W.OK 17/03/2004 06:18 PM Page 54
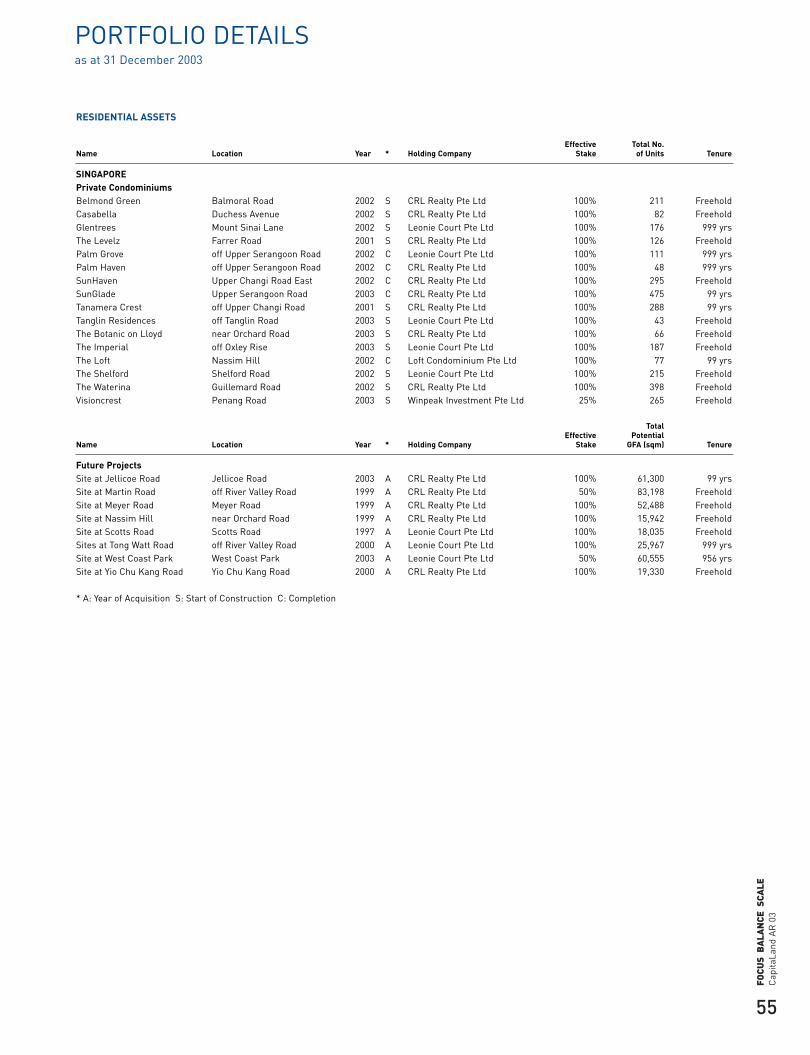
55
Cap
itaLa
ndA
R 0
3FO
CUS
BA
LAN
CE S
CALE
PORTFOLIO DETAILSas at 31 December 2003
RESIDENTIAL ASSETS
Effective Total No.Name Location Year * Holding Company Stake of Units Tenure
SINGAPOREPrivate CondominiumsBelmond Green Balmoral Road 2002 S CRL Realty Pte Ltd 100% 211 FreeholdCasabella Duchess Avenue 2002 S CRL Realty Pte Ltd 100% 82 FreeholdGlentrees Mount Sinai Lane 2002 S Leonie Court Pte Ltd 100% 176 999 yrsThe Levelz Farrer Road 2001 S CRL Realty Pte Ltd 100% 126 FreeholdPalm Grove off Upper Serangoon Road 2002 C Leonie Court Pte Ltd 100% 111 999 yrsPalm Haven off Upper Serangoon Road 2002 C CRL Realty Pte Ltd 100% 48 999 yrsSunHaven Upper Changi Road East 2002 C CRL Realty Pte Ltd 100% 295 FreeholdSunGlade Upper Serangoon Road 2003 C CRL Realty Pte Ltd 100% 475 99 yrsTanamera Crest off Upper Changi Road 2001 S CRL Realty Pte Ltd 100% 288 99 yrsTanglin Residences off Tanglin Road 2003 S Leonie Court Pte Ltd 100% 43 FreeholdThe Botanic on Lloyd near Orchard Road 2003 S CRL Realty Pte Ltd 100% 66 FreeholdThe Imperial off Oxley Rise 2003 S Leonie Court Pte Ltd 100% 187 FreeholdThe Loft Nassim Hill 2002 C Loft Condominium Pte Ltd 100% 77 99 yrsThe Shelford Shelford Road 2002 S Leonie Court Pte Ltd 100% 215 FreeholdThe Waterina Guillemard Road 2002 S CRL Realty Pte Ltd 100% 398 FreeholdVisioncrest Penang Road 2003 S Winpeak Investment Pte Ltd 25% 265 Freehold
Total Effective Potential
Name Location Year * Holding Company Stake GFA (sqm) Tenure
Future ProjectsSite at Jellicoe Road Jellicoe Road 2003 A CRL Realty Pte Ltd 100% 61,300 99 yrs Site at Martin Road off River Valley Road 1999 A CRL Realty Pte Ltd 50% 83,198 FreeholdSite at Meyer Road Meyer Road 1999 A CRL Realty Pte Ltd 100% 52,488 FreeholdSite at Nassim Hill near Orchard Road 1999 A CRL Realty Pte Ltd 100% 15,942 FreeholdSite at Scotts Road Scotts Road 1997 A Leonie Court Pte Ltd 100% 18,035 FreeholdSites at Tong Watt Road off River Valley Road 2000 A Leonie Court Pte Ltd 100% 25,967 999 yrsSite at West Coast Park West Coast Park 2003 A Leonie Court Pte Ltd 50% 60,555 956 yrs Site at Yio Chu Kang Road Yio Chu Kang Road 2000 A CRL Realty Pte Ltd 100% 19,330 Freehold
* A: Year of Acquisition S: Start of Construction C: Completion
CL AR03 55-63 A/W.OK 17/03/2004 06:23 PM Page 55

PORTFOLIO DETAILSas at 31 December 2003
56
Cap
itaLa
ndA
R 0
3FO
CUS
BA
LAN
CE S
CALE
RESIDENTIAL ASSETS
TotalEffective Saleable Total No.
Name Location Year * Holding Company Stake Area (sqm) of Units Tenure
CHINAOasis Riviera Changning District, Shanghai 2003 S Shanghai Ning Xin Real 80.5% 270,000 2,000 70
Estate Development Co., Ltd (estimated)
La Cité Xuhui District, Shanghai 2003 S Shanghai Xin Xu Property 99% 115,277 719 70Development Co., Ltd
Summit Panorama Pudong District, Shanghai 2003 C Shanghai Pudong Xinxiang 66.5% 155,989 939 70Real Estate Development Co., Ltd
Summit Residences Pudong District, Shanghai 2002 S Shanghai Pudong Xinxiang 66.5% 129,000 913 70Real Estate Development Co., Ltd
Manhattan Heights Jing’an District, Shanghai 2002 C Shanghai Xin Li Property 100% 36,175 254 70Development Co., Ltd
Site at Xiao Guan Bei Li Chaoyang District, Beijing 2002 A Beijing Ruihua Real Estate 62% 209,000 1,450 70Development Co., Ltd (estimated)
Site at Wa Li Road Chaoyang District, Beijing 2003 A Bejing Xin Kai Real Estate 88.5% 272,000 2,000 70Development Co., Ltd (GFA) (estimated)
HONG KONGHong Kong Parkview Repulse Bay 1999 A Central Hill Limited 75% 9,726 40 75+75 Blk 15 (option to renew)
MALAYSIASuasana Sentral Kuala Lumpur Sentral 2002 C OneSentral Park Sdn Bhd 49% 66,984 400 Freehold
* A: Year of Acquisition S: Start of Construction C: Completion
CL AR03 55-63 A/W.OK 17/03/2004 06:23 PM Page 56
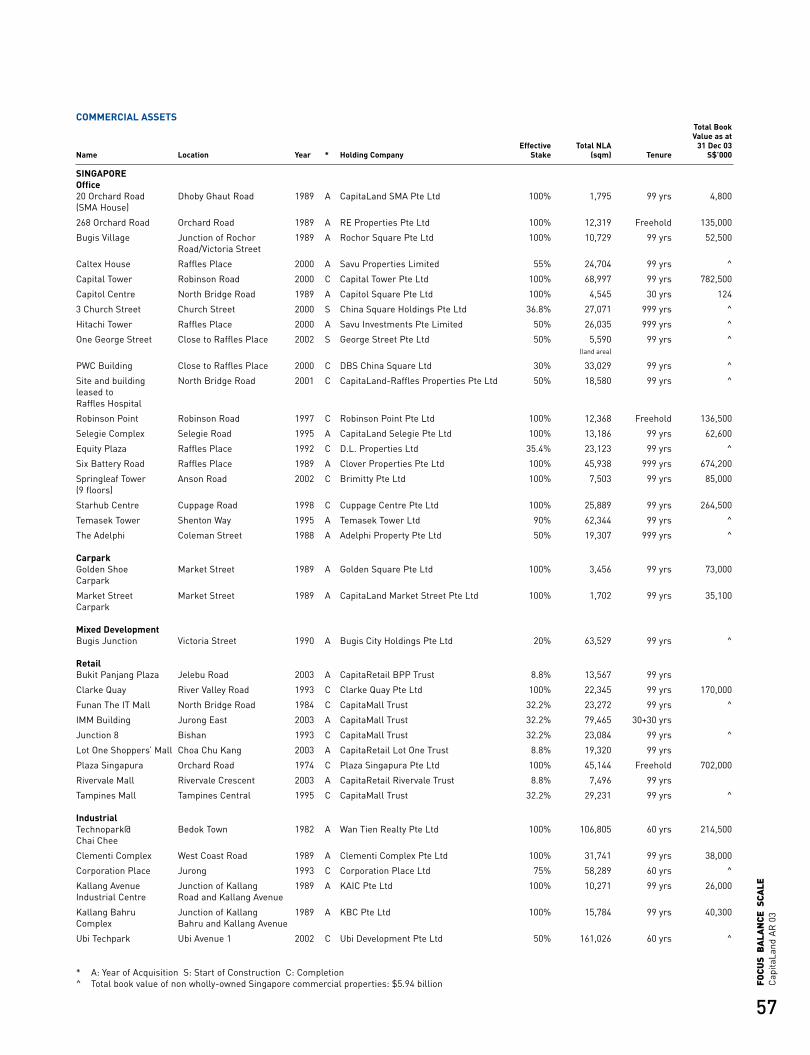
57
Cap
itaLa
ndA
R 0
3FO
CUS
BA
LAN
CE S
CALE
COMMERCIAL ASSETSTotal BookValue as at
Effective Total NLA 31 Dec 03Name Location Year * Holding Company Stake (sqm) Tenure S$’000
SINGAPOREOffice20 Orchard Road Dhoby Ghaut Road 1989 A CapitaLand SMA Pte Ltd 100% 1,795 99 yrs 4,800 (SMA House)
268 Orchard Road Orchard Road 1989 A RE Properties Pte Ltd 100% 12,319 Freehold 135,000
Bugis Village Junction of Rochor 1989 A Rochor Square Pte Ltd 100% 10,729 99 yrs 52,500Road/Victoria Street
Caltex House Raffles Place 2000 A Savu Properties Limited 55% 24,704 99 yrs ^
Capital Tower Robinson Road 2000 C Capital Tower Pte Ltd 100% 68,997 99 yrs 782,500
Capitol Centre North Bridge Road 1989 A Capitol Square Pte Ltd 100% 4,545 30 yrs 124
3 Church Street Church Street 2000 S China Square Holdings Pte Ltd 36.8% 27,071 999 yrs ^
Hitachi Tower Raffles Place 2000 A Savu Investments Pte Limited 50% 26,035 999 yrs ^
One George Street Close to Raffles Place 2002 S George Street Pte Ltd 50% 5,590 99 yrs ^ (land area)
PWC Building Close to Raffles Place 2000 C DBS China Square Ltd 30% 33,029 99 yrs ^
Site and building North Bridge Road 2001 C CapitaLand-Raffles Properties Pte Ltd 50% 18,580 99 yrs ^leased to Raffles Hospital
Robinson Point Robinson Road 1997 C Robinson Point Pte Ltd 100% 12,368 Freehold 136,500
Selegie Complex Selegie Road 1995 A CapitaLand Selegie Pte Ltd 100% 13,186 99 yrs 62,600
Equity Plaza Raffles Place 1992 C D.L. Properties Ltd 35.4% 23,123 99 yrs ^
Six Battery Road Raffles Place 1989 A Clover Properties Pte Ltd 100% 45,938 999 yrs 674,200
Springleaf Tower Anson Road 2002 C Brimitty Pte Ltd 100% 7,503 99 yrs 85,000(9 floors)
Starhub Centre Cuppage Road 1998 C Cuppage Centre Pte Ltd 100% 25,889 99 yrs 264,500
Temasek Tower Shenton Way 1995 A Temasek Tower Ltd 90% 62,344 99 yrs ^
The Adelphi Coleman Street 1988 A Adelphi Property Pte Ltd 50% 19,307 999 yrs ^
CarparkGolden Shoe Market Street 1989 A Golden Square Pte Ltd 100% 3,456 99 yrs 73,000Carpark
Market Street Market Street 1989 A CapitaLand Market Street Pte Ltd 100% 1,702 99 yrs 35,100Carpark
Mixed DevelopmentBugis Junction Victoria Street 1990 A Bugis City Holdings Pte Ltd 20% 63,529 99 yrs ^
RetailBukit Panjang Plaza Jelebu Road 2003 A CapitaRetail BPP Trust 8.8% 13,567 99 yrs
Clarke Quay River Valley Road 1993 C Clarke Quay Pte Ltd 100% 22,345 99 yrs 170,000
Funan The IT Mall North Bridge Road 1984 C CapitaMall Trust 32.2% 23,272 99 yrs ^
IMM Building Jurong East 2003 A CapitaMall Trust 32.2% 79,465 30+30 yrs
Junction 8 Bishan 1993 C CapitaMall Trust 32.2% 23,084 99 yrs ^
Lot One Shoppers’ Mall Choa Chu Kang 2003 A CapitaRetail Lot One Trust 8.8% 19,320 99 yrs
Plaza Singapura Orchard Road 1974 C Plaza Singapura Pte Ltd 100% 45,144 Freehold 702,000
Rivervale Mall Rivervale Crescent 2003 A CapitaRetail Rivervale Trust 8.8% 7,496 99 yrs
Tampines Mall Tampines Central 1995 C CapitaMall Trust 32.2% 29,231 99 yrs ^
IndustrialTechnopark@ Bedok Town 1982 A Wan Tien Realty Pte Ltd 100% 106,805 60 yrs 214,500Chai Chee
Clementi Complex West Coast Road 1989 A Clementi Complex Pte Ltd 100% 31,741 99 yrs 38,000
Corporation Place Jurong 1993 C Corporation Place Ltd 75% 58,289 60 yrs ^
Kallang Avenue Junction of Kallang 1989 A KAIC Pte Ltd 100% 10,271 99 yrs 26,000Industrial Centre Road and Kallang Avenue
Kallang Bahru Junction of Kallang 1989 A KBC Pte Ltd 100% 15,784 99 yrs 40,300Complex Bahru and Kallang Avenue
Ubi Techpark Ubi Avenue 1 2002 C Ubi Development Pte Ltd 50% 161,026 60 yrs ^
* A: Year of Acquisition S: Start of Construction C: Completion^ Total book value of non wholly-owned Singapore commercial properties: $5.94 billion
CL AR03 55-63 A/W.OK 17/03/2004 06:23 PM Page 57
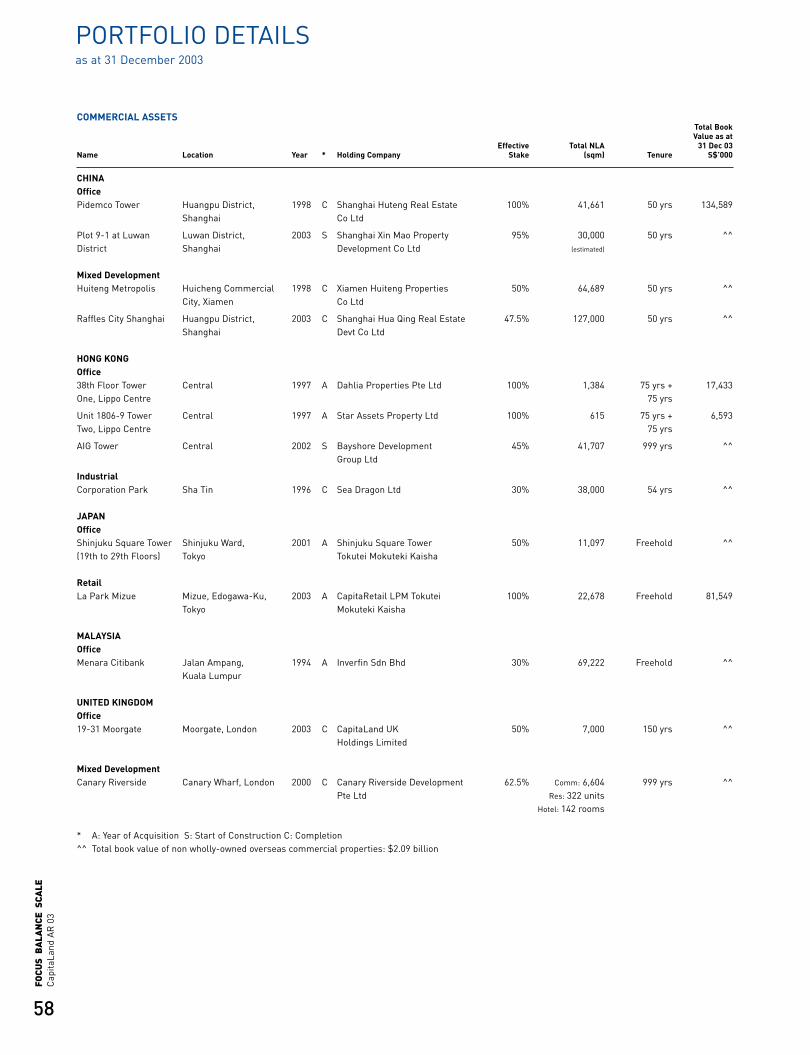
58
Cap
itaLa
ndA
R 0
3FO
CUS
BA
LAN
CE S
CALE
COMMERCIAL ASSETSTotal BookValue as at
Effective Total NLA 31 Dec 03Name Location Year * Holding Company Stake (sqm) Tenure S$’000
CHINAOfficePidemco Tower Huangpu District, 1998 C Shanghai Huteng Real Estate 100% 41,661 50 yrs 134,589
Shanghai Co Ltd
Plot 9-1 at Luwan Luwan District, 2003 S Shanghai Xin Mao Property 95% 30,000 50 yrs ^^District Shanghai Development Co Ltd (estimated)
Mixed DevelopmentHuiteng Metropolis Huicheng Commercial 1998 C Xiamen Huiteng Properties 50% 64,689 50 yrs ^^
City, Xiamen Co Ltd
Raffles City Shanghai Huangpu District, 2003 C Shanghai Hua Qing Real Estate 47.5% 127,000 50 yrs ^^Shanghai Devt Co Ltd
HONG KONGOffice38th Floor Tower Central 1997 A Dahlia Properties Pte Ltd 100% 1,384 75 yrs + 17,433One, Lippo Centre 75 yrs
Unit 1806-9 Tower Central 1997 A Star Assets Property Ltd 100% 615 75 yrs + 6,593Two, Lippo Centre 75 yrs
AIG Tower Central 2002 S Bayshore Development 45% 41,707 999 yrs ^^Group Ltd
IndustrialCorporation Park Sha Tin 1996 C Sea Dragon Ltd 30% 38,000 54 yrs ^^
JAPANOfficeShinjuku Square Tower Shinjuku Ward, 2001 A Shinjuku Square Tower 50% 11,097 Freehold ^^(19th to 29th Floors) Tokyo Tokutei Mokuteki Kaisha
RetailLa Park Mizue Mizue, Edogawa-Ku, 2003 A CapitaRetail LPM Tokutei 100% 22,678 Freehold 81,549
Tokyo Mokuteki Kaisha
MALAYSIAOfficeMenara Citibank Jalan Ampang, 1994 A Inverfin Sdn Bhd 30% 69,222 Freehold ^^
Kuala Lumpur
UNITED KINGDOMOffice19-31 Moorgate Moorgate, London 2003 C CapitaLand UK 50% 7,000 150 yrs ^^
Holdings Limited
Mixed DevelopmentCanary Riverside Canary Wharf, London 2000 C Canary Riverside Development 62.5% Comm: 6,604 999 yrs ^^
Pte Ltd Res: 322 unitsHotel: 142 rooms
* A: Year of Acquisition S: Start of Construction C: Completion^^ Total book value of non wholly-owned overseas commercial properties: $2.09 billion
PORTFOLIO DETAILSas at 31 December 2003
CL AR03 55-63 A/W.OK 17/03/2004 06:23 PM Page 58

59
Cap
itaLa
ndA
R 0
3FO
CUS
BA
LAN
CE S
CALE
PORTFOLIO ANALYSIS
6,999
1,649
2,202
3,687
CapitaLand CommercialCapitaLand ResidentialAscottRaffles
Property Value by SBU (S$m)
ResidentialOfficeRetailIndustrialMixed DevelopmentHotelServiced ResidenceOthers
3,325
1,723164
679
1,393
392
Property Value by Sector (S$m)
4,7512,111
The Group’s property portfolio as at 31 December 2003comprised residential development properties, investmentproperties, serviced residences and hotels owned bysubsidiaries, associated and joint venture companies.
In the following analysis, the values attributable to theCapitaLand Group are used. Investment properties arestated at their market values while residential developmentproperties are stated at book costs (net of any provisionsmade). Properties treated as fixed assets are stated at book cost.
SingaporeHong KongChinaJapanSoutheast AsiaAustraliaEuropeUSA
9,680
1,255 96
1,022
155599
1,185
544
Property Value by Region (S$m)
CL AR03 55-63 A/W.OK 17/03/2004 06:23 PM Page 59
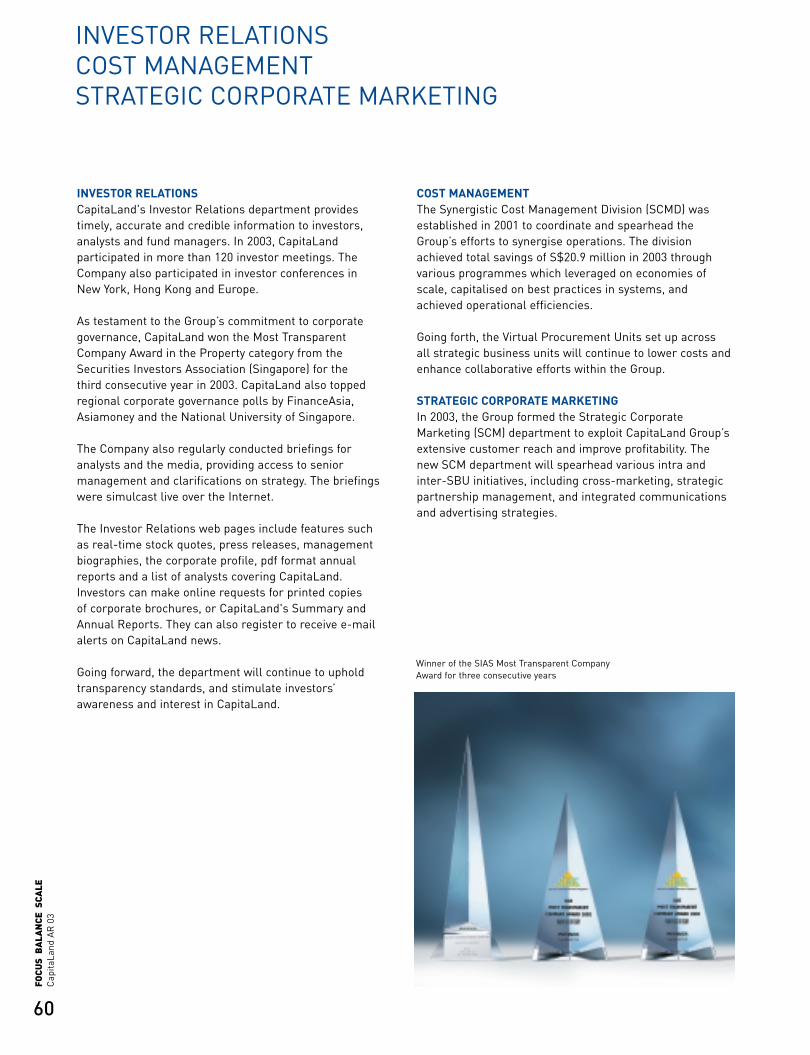
60
Cap
itaLa
ndA
R 0
3FO
CUS
BA
LAN
CE S
CALE
INVESTOR RELATIONSCapitaLand's Investor Relations department providestimely, accurate and credible information to investors,analysts and fund managers. In 2003, CapitaLandparticipated in more than 120 investor meetings. TheCompany also participated in investor conferences in New York, Hong Kong and Europe.
As testament to the Group’s commitment to corporategovernance, CapitaLand won the Most TransparentCompany Award in the Property category from theSecurities Investors Association (Singapore) for the third consecutive year in 2003. CapitaLand also toppedregional corporate governance polls by FinanceAsia, Asiamoney and the National University of Singapore.
The Company also regularly conducted briefings foranalysts and the media, providing access to seniormanagement and clarifications on strategy. The briefingswere simulcast live over the Internet.
The Investor Relations web pages include features such as real-time stock quotes, press releases, managementbiographies, the corporate profile, pdf format annualreports and a list of analysts covering CapitaLand.Investors can make online requests for printed copies of corporate brochures, or CapitaLand's Summary andAnnual Reports. They can also register to receive e-mailalerts on CapitaLand news.
Going forward, the department will continue to upholdtransparency standards, and stimulate investors’awareness and interest in CapitaLand.
COST MANAGEMENTThe Synergistic Cost Management Division (SCMD) wasestablished in 2001 to coordinate and spearhead theGroup’s efforts to synergise operations. The divisionachieved total savings of S$20.9 million in 2003 throughvarious programmes which leveraged on economies ofscale, capitalised on best practices in systems, andachieved operational efficiencies.
Going forth, the Virtual Procurement Units set up across all strategic business units will continue to lower costs andenhance collaborative efforts within the Group.
STRATEGIC CORPORATE MARKETINGIn 2003, the Group formed the Strategic CorporateMarketing (SCM) department to exploit CapitaLand Group’sextensive customer reach and improve profitability. Thenew SCM department will spearhead various intra andinter-SBU initiatives, including cross-marketing, strategicpartnership management, and integrated communicationsand advertising strategies.
INVESTOR RELATIONSCOST MANAGEMENTSTRATEGIC CORPORATE MARKETING
Winner of the SIAS Most Transparent CompanyAward for three consecutive years
CL AR03 55-63 A/W.OK 17/03/2004 06:24 PM Page 60
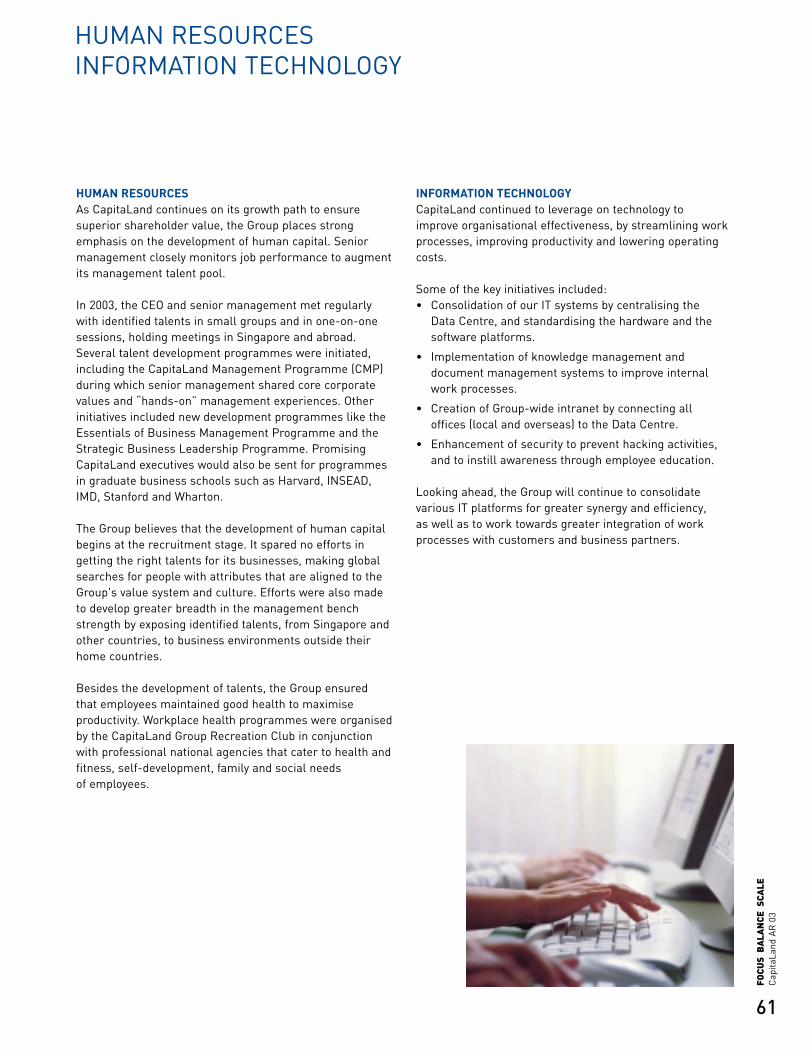
61
Cap
itaLa
ndA
R 0
3FO
CUS
BA
LAN
CE S
CALE
HUMAN RESOURCESAs CapitaLand continues on its growth path to ensuresuperior shareholder value, the Group places strongemphasis on the development of human capital. Seniormanagement closely monitors job performance to augmentits management talent pool.
In 2003, the CEO and senior management met regularlywith identified talents in small groups and in one-on-onesessions, holding meetings in Singapore and abroad.Several talent development programmes were initiated,including the CapitaLand Management Programme (CMP)during which senior management shared core corporatevalues and “hands-on” management experiences. Otherinitiatives included new development programmes like theEssentials of Business Management Programme and theStrategic Business Leadership Programme. PromisingCapitaLand executives would also be sent for programmesin graduate business schools such as Harvard, INSEAD,IMD, Stanford and Wharton.
The Group believes that the development of human capitalbegins at the recruitment stage. It spared no efforts ingetting the right talents for its businesses, making globalsearches for people with attributes that are aligned to theGroup's value system and culture. Efforts were also madeto develop greater breadth in the management benchstrength by exposing identified talents, from Singapore andother countries, to business environments outside theirhome countries.
Besides the development of talents, the Group ensured that employees maintained good health to maximiseproductivity. Workplace health programmes were organisedby the CapitaLand Group Recreation Club in conjunctionwith professional national agencies that cater to health andfitness, self-development, family and social needs of employees.
INFORMATION TECHNOLOGYCapitaLand continued to leverage on technology to improve organisational effectiveness, by streamlining workprocesses, improving productivity and lowering operatingcosts.
Some of the key initiatives included: • Consolidation of our IT systems by centralising the
Data Centre, and standardising the hardware and thesoftware platforms.
• Implementation of knowledge management anddocument management systems to improve internalwork processes.
• Creation of Group-wide intranet by connecting all offices (local and overseas) to the Data Centre.
• Enhancement of security to prevent hacking activities,and to instill awareness through employee education.
Looking ahead, the Group will continue to consolidatevarious IT platforms for greater synergy and efficiency, as well as to work towards greater integration of workprocesses with customers and business partners.
HUMAN RESOURCESINFORMATION TECHNOLOGY
CL AR03 55-63 A/W.OK 17/03/2004 06:24 PM Page 61
62
Cap
itaLa
ndA
R 0
3FO
CUS
BA
LAN
CE S
CALE
SOCIAL RESPONSIBILITY
As a responsible corporate citizen, the Group participatedactively both in Singapore and overseas to support the less privileged and to create vibrant communities. This commitment to people, both its own staff and thecommunity at large, is encapsulated in its mission,‘Building for People’.
Some of the areas of involvement were youth and education,the elderly and health-related issues.
SINGAPOREStaff participation in charity and community is a hallmarkfeature of the Group’s community relations programme.CapitaLand staff celebrated National Day at the RainbowCentre with children suffering from Autism, Down’sSyndrome or multiple disabilities. Other initiatives included‘Arts for Charity’, a school holiday programme for childrenwith special needs, and a charity auction for Bright HillEvergreen Home. More than 50 PREMAS International staffalso visited the old folks of Geylang East Home for the Aged.
In addition, the Group also helped groom talent fromSingapore and abroad, through donations to the Yong SiewToh Conservatory of Music and to the Lee Kuan Yew School of Public Policy, which is part of the NationalUniversity of Singapore.
Community relations activities were also organised at various CapitaLand-managed malls. Over the year,CapitaMall Trust was the venue sponsor for fund-raising by charitable organisations such as the Community Chestand Lion’s Home. Other activities organised in the mallsincluded the monthly Community Sunday at Junction 8 forunemployed youths; the Innovation Fair at Tampines Mall,to promote entrepreneurship amongst students; and anational fencing competition for children at Funan The IT Mall.
Raffles The Plaza and Swissôtel The Stamford raisedS$39,000 for the Spastic Children’s Association School,their adopted charity. Raffles Hotel raised S$338,000 forfive Singapore charities: MINDS Guillemard GardensSchool, AWWA Teach ME, Moral Home Help Service (West),Hospice Home Care Service and Riding for the Disabled.Swissôtel Merchant Court also donated to their adoptedcharity, the Children’s Aids Home.
The Ascott Group’s employees in Singapore organisedChristmas bazaars in aid of the Movement for theIntellectually Disabled of Singapore (MINDS), SingaporeAssociation for the Visually Handicapped and SingaporeSpastic Children’s Association. Ascott matched the fundsraised on a dollar-for-dollar basis.
At Clarke Quay, community events included ‘Shall WeDance’, part of the government’s ‘Romancing Singapore’efforts, and an ‘Arti Party’, which is a staging of visual arts,poetry, music, dance and drama performances. We alsoparticipated in a ‘Food & Heritage Trail’, and organised afund-raising tri-challenge of roller-blading, cycling andrunning as part of ‘Play! Singapore’.
The outbreak of SARS spurred the Group to set up theHealthcare Frontliners Award at the Nanyang PolytechnicSchool of Health Sciences, as a tribute to nurses inSingapore.
OVERSEASGiven our global reach, the Group, especially hospitalityarms Raffles Holdings and The Ascott Group, had strongcommunity activities in the countries where they operate.
In China, the Group donated a 3,000 square metre landparcel in Shanghai to the local Ju Yuan School, as a schoolextension and for other sports and recreational activities.We also donated airport thermal scanners to thegovernments of China and Vietnam.
In Cambodia, Raffles Grand Hotel d’Angkor, Siem Reap and Raffles Hotel Le Royal, Phnom Penh continued theRendering Encouragement, Assistance, Care and Hope(REACH) programme. Management and staff donated toys,clothes, school uniforms, bicycles, books and stationary toneedy children. Staff also participated in the Angkor WatMarathon to raise money for landmine victims.
CL AR03 55-63 A/W.OK 17/03/2004 06:24 PM Page 62
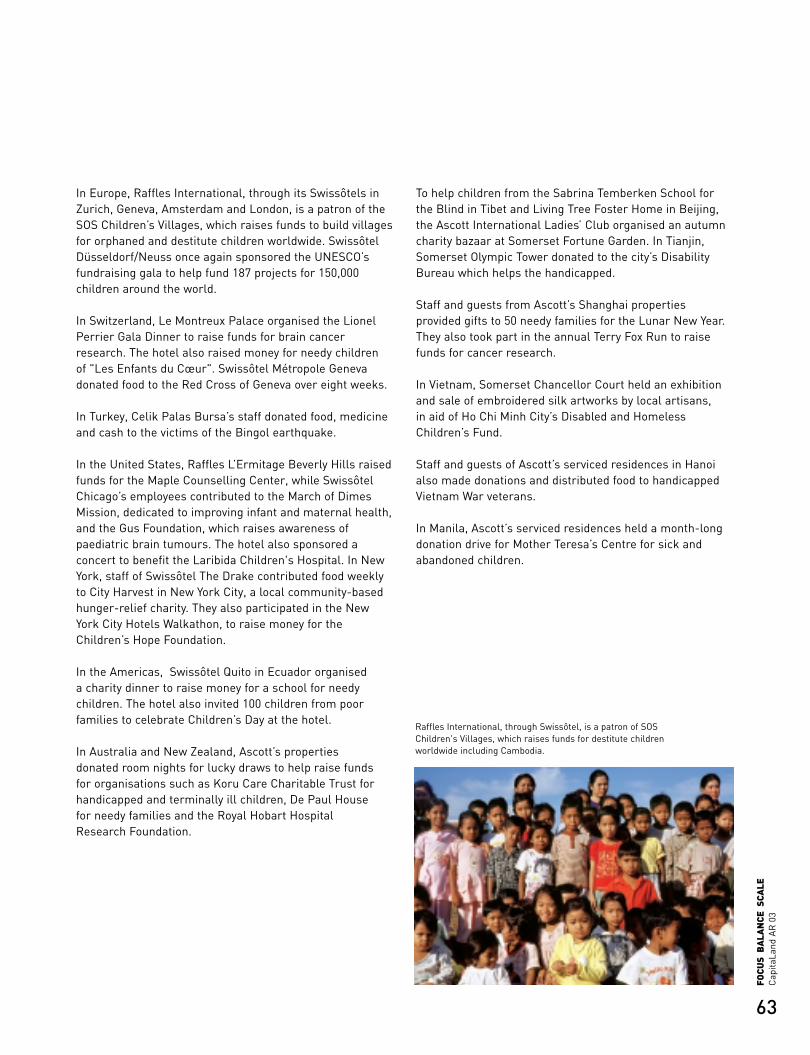
63
Cap
itaLa
ndA
R 0
3FO
CUS
BA
LAN
CE S
CALE
In Europe, Raffles International, through its Swissôtels inZurich, Geneva, Amsterdam and London, is a patron of theSOS Children’s Villages, which raises funds to build villagesfor orphaned and destitute children worldwide. SwissôtelDüsseldorf/Neuss once again sponsored the UNESCO’sfundraising gala to help fund 187 projects for 150,000children around the world.
In Switzerland, Le Montreux Palace organised the LionelPerrier Gala Dinner to raise funds for brain cancerresearch. The hotel also raised money for needy children of "Les Enfants du Cœur". Swissôtel Métropole Genevadonated food to the Red Cross of Geneva over eight weeks.
In Turkey, Celik Palas Bursa’s staff donated food, medicineand cash to the victims of the Bingol earthquake.
In the United States, Raffles L’Ermitage Beverly Hills raisedfunds for the Maple Counselling Center, while SwissôtelChicago’s employees contributed to the March of DimesMission, dedicated to improving infant and maternal health,and the Gus Foundation, which raises awareness ofpaediatric brain tumours. The hotel also sponsored aconcert to benefit the Laribida Children's Hospital. In NewYork, staff of Swissôtel The Drake contributed food weeklyto City Harvest in New York City, a local community-basedhunger-relief charity. They also participated in the NewYork City Hotels Walkathon, to raise money for theChildren’s Hope Foundation.
In the Americas, Swissôtel Quito in Ecuador organised a charity dinner to raise money for a school for needychildren. The hotel also invited 100 children from poorfamilies to celebrate Children’s Day at the hotel.
In Australia and New Zealand, Ascott’s properties donated room nights for lucky draws to help raise funds for organisations such as Koru Care Charitable Trust forhandicapped and terminally ill children, De Paul House for needy families and the Royal Hobart Hospital Research Foundation.
To help children from the Sabrina Temberken School forthe Blind in Tibet and Living Tree Foster Home in Beijing,the Ascott International Ladies’ Club organised an autumncharity bazaar at Somerset Fortune Garden. In Tianjin,Somerset Olympic Tower donated to the city’s DisabilityBureau which helps the handicapped.
Staff and guests from Ascott’s Shanghai propertiesprovided gifts to 50 needy families for the Lunar New Year.They also took part in the annual Terry Fox Run to raisefunds for cancer research.
In Vietnam, Somerset Chancellor Court held an exhibitionand sale of embroidered silk artworks by local artisans, in aid of Ho Chi Minh City’s Disabled and HomelessChildren’s Fund.
Staff and guests of Ascott’s serviced residences in Hanoialso made donations and distributed food to handicappedVietnam War veterans.
In Manila, Ascott’s serviced residences held a month-longdonation drive for Mother Teresa’s Centre for sick andabandoned children.
Raffles International, through Swissôtel, is a patron of SOSChildren's Villages, which raises funds for destitute childrenworldwide including Cambodia.
CL AR03 55-63 A/W.OK 17/03/2004 06:24 PM Page 63
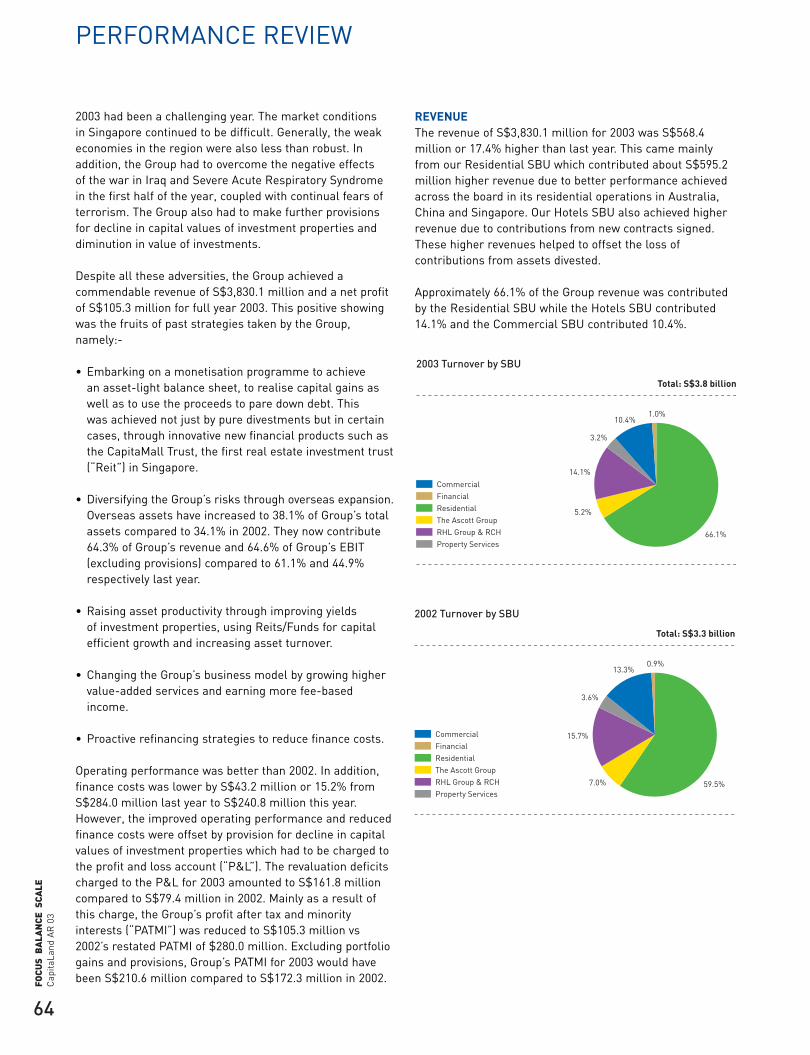
64
Cap
itaLa
ndA
R 0
3FO
CUS
BA
LAN
CE S
CALE
PERFORMANCE REVIEW
2003 had been a challenging year. The market conditions in Singapore continued to be difficult. Generally, the weakeconomies in the region were also less than robust. Inaddition, the Group had to overcome the negative effects of the war in Iraq and Severe Acute Respiratory Syndromein the first half of the year, coupled with continual fears ofterrorism. The Group also had to make further provisionsfor decline in capital values of investment properties anddiminution in value of investments.
Despite all these adversities, the Group achieved acommendable revenue of S$3,830.1 million and a net profit of S$105.3 million for full year 2003. This positive showingwas the fruits of past strategies taken by the Group,namely:-
• Embarking on a monetisation programme to achieve an asset-light balance sheet, to realise capital gains aswell as to use the proceeds to pare down debt. This was achieved not just by pure divestments but in certaincases, through innovative new financial products such asthe CapitaMall Trust, the first real estate investment trust(“Reit”) in Singapore.
• Diversifying the Group’s risks through overseas expansion.Overseas assets have increased to 38.1% of Group’s totalassets compared to 34.1% in 2002. They now contribute64.3% of Group’s revenue and 64.6% of Group’s EBIT(excluding provisions) compared to 61.1% and 44.9%respectively last year.
• Raising asset productivity through improving yields of investment properties, using Reits/Funds for capitalefficient growth and increasing asset turnover.
• Changing the Group’s business model by growing highervalue-added services and earning more fee-basedincome.
• Proactive refinancing strategies to reduce finance costs.
Operating performance was better than 2002. In addition,finance costs was lower by S$43.2 million or 15.2% fromS$284.0 million last year to S$240.8 million this year.However, the improved operating performance and reducedfinance costs were offset by provision for decline in capitalvalues of investment properties which had to be charged tothe profit and loss account (“P&L”). The revaluation deficitscharged to the P&L for 2003 amounted to S$161.8 millioncompared to S$79.4 million in 2002. Mainly as a result ofthis charge, the Group’s profit after tax and minorityinterests (“PATMI”) was reduced to S$105.3 million vs2002’s restated PATMI of $280.0 million. Excluding portfoliogains and provisions, Group’s PATMI for 2003 would havebeen S$210.6 million compared to S$172.3 million in 2002.
REVENUEThe revenue of S$3,830.1 million for 2003 was S$568.4million or 17.4% higher than last year. This came mainlyfrom our Residential SBU which contributed about S$595.2million higher revenue due to better performance achievedacross the board in its residential operations in Australia,China and Singapore. Our Hotels SBU also achieved higherrevenue due to contributions from new contracts signed.These higher revenues helped to offset the loss ofcontributions from assets divested.
Approximately 66.1% of the Group revenue was contributedby the Residential SBU while the Hotels SBU contributed14.1% and the Commercial SBU contributed 10.4%.
66.1%
10.4%1.0%
5.2%
3.2%
14.1%
2003 Turnover by SBU
CommercialFinancialResidentialThe Ascott Group RHL Group & RCHProperty Services
Total: S$3.8 billion
59.5%
13.3%0.9%
7.0%
3.6%
15.7%
2002 Turnover by SBU
CommercialFinancialResidentialThe Ascott Group RHL Group & RCHProperty Services
Total: S$3.3 billion
CL AR03 64-72 A/W-OK 17/03/2004 06:26 PM Page 64

65
Cap
itaLa
ndA
R 0
3FO
CUS
BA
LAN
CE S
CALE
In terms of geographical analysis, the revenue fromSingapore operations as a percentage of Group’s revenuedecreased steadily over the past three years as a result of increased overseas contribution. Singapore’s revenuecontributed 35.7% of Group’s revenue while the majoroverseas contributors were from Australia and New Zealand(43.7%), China (9.4%) and Europe (6.9%). Australia’s revenuecame from our listed residential stapled entity, AustralandProperty Group, as well as from Ascott’s Oakford chain ofserviced residences and Raffles Holdings’ Swissôtel Sydney.Contribution from China came mainly from the robustresidential sales in Shanghai while Europe’s turnover wasmainly contributed by Raffles’ Swissôtel hotel chain andCommercial SBU’s Canary Riverside development.
ANALYSIS OF RESULTS Operating profit of S$685.8 million was 8.0% better than the S$634.8 million in 2002. However, portfolio gains of S$99.8 million was much lower than 2002 while provisionsof S$190.0 million was significantly higher due mainly tohigher revaluation deficits being charged to the profit andloss account compared to the previous year. As a result,Group earnings before interest and tax (“EBIT”) for 2003was S$595.6 million, a decrease of 22.1% over 2002.
SBUs which achieved higher EBIT were the Residential and Financial SBUs. The Residential SBU achieved EBIT of S$349.2 million, an 18.9% increase from S$293.8 million in 2002. The improvement came from the robust sales ofChina projects and higher contribution from Australand dueto higher activity as well as the appreciation of A$. TheFinancial SBU recorded EBIT of S$18.6 million comparedwith S$7.4 million the previous year due to higherstructuring and advisory fees earned.
The other SBUs recorded lower EBIT. Commercial & Hotels SBUs’ EBIT of S$72.7 million and S$60.2 millionrespectively were lower than the S$281.1 million and S$65.5 million recorded in 2002 due to higher revaluationdeficits charged to the profit and loss account. There wasalso absence of material portfolio gains for CommercialSBU this year. For the Serviced Residence SBU, the EBITwas S$54.7 million compared to S$65.4 million in 2002.Operationally, the core operations improved but this wasoffset by lower contribution from its non-core retail andresidential businesses which have been steadily phased out. The Property Services SBU’s EBIT of S$8.0 million wasmarginally lower by S$0.3 million due to lower margins as a result of stiffer competition.
35.7%
6.9% 0.9%
43.7%
3.4%
9.4%
2003 Turnover by Geographical Location
SingaporeAustralia & New ZealandChinaOther Asia (excl. S’pore & China)EuropeOthers
Total: S$3.8 billion
38.9%
8.4% 1.1%
37.4%
3.7%
10.5%
2002 Turnover by Geographical Location
SingaporeAustralia & New ZealandChinaOther Asia (excl. S’pore & China)EuropeOthers
Total: S$3.3 billion
73
19
349
55 60
832
2003 EBIT by SBU
(S$m)
Total: S$596 million
0
50
100
150
200
250
300
350
CommercialFinancialResidentialThe Ascott Group (after conso adjms)RHL Group & RCH (after conso adjms)Property ServicesOthers
CL AR03 64-72 A/W-OK 17/03/2004 06:26 PM Page 65
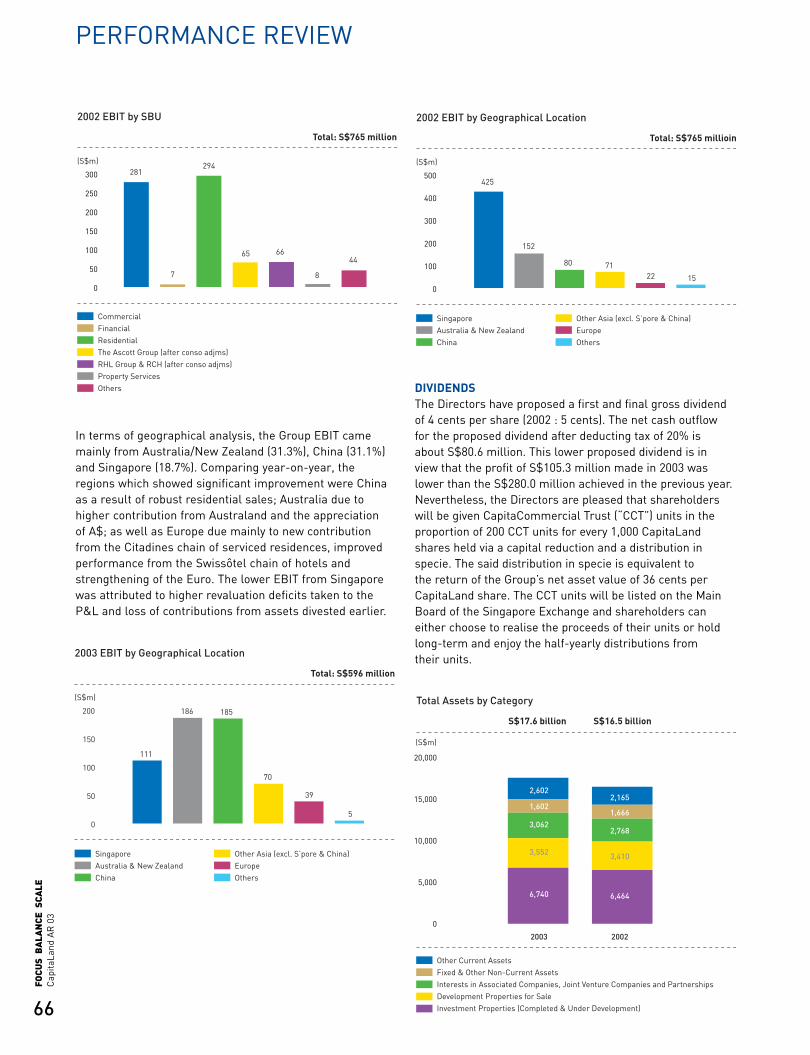
66
Cap
itaLa
ndA
R 0
3FO
CUS
BA
LAN
CE S
CALE
In terms of geographical analysis, the Group EBIT camemainly from Australia/New Zealand (31.3%), China (31.1%)and Singapore (18.7%). Comparing year-on-year, theregions which showed significant improvement were Chinaas a result of robust residential sales; Australia due tohigher contribution from Australand and the appreciation of A$; as well as Europe due mainly to new contributionfrom the Citadines chain of serviced residences, improvedperformance from the Swissôtel chain of hotels andstrengthening of the Euro. The lower EBIT from Singaporewas attributed to higher revaluation deficits taken to theP&L and loss of contributions from assets divested earlier.
DIVIDENDSThe Directors have proposed a first and final gross dividendof 4 cents per share (2002 : 5 cents). The net cash outflowfor the proposed dividend after deducting tax of 20% is about S$80.6 million. This lower proposed dividend is in view that the profit of S$105.3 million made in 2003 waslower than the S$280.0 million achieved in the previous year.Nevertheless, the Directors are pleased that shareholderswill be given CapitaCommercial Trust (“CCT”) units in theproportion of 200 CCT units for every 1,000 CapitaLandshares held via a capital reduction and a distribution inspecie. The said distribution in specie is equivalent to the return of the Group’s net asset value of 36 cents perCapitaLand share. The CCT units will be listed on the MainBoard of the Singapore Exchange and shareholders caneither choose to realise the proceeds of their units or holdlong-term and enjoy the half-yearly distributions from their units.
281
7
294
65 66
8
44
2002 EBIT by SBU
(S$m)
Total: S$765 million
0
50
100
150
200
250
300
CommercialFinancialResidentialThe Ascott Group (after conso adjms)RHL Group & RCH (after conso adjms)Property ServicesOthers
S$17.6 billion S$16.5 billion
2003 2002
Total Assets by Category
(S$m)
Other Current AssetsFixed & Other Non-Current AssetsInterests in Associated Companies, Joint Venture Companies and PartnershipsDevelopment Properties for SaleInvestment Properties (Completed & Under Development)
0
5,000
10,000
15,000
20,000
2,6022,165
1,666
2,768
3,410
6,464
1,602
3,062
3,552
6,740
PERFORMANCE REVIEW
111
186 185
70
39
5
2003 EBIT by Geographical Location
(S$m)
Total: S$596 million
0
50
100
150
200
SingaporeAustralia & New ZealandChina
Other Asia (excl. S’pore & China)EuropeOthers
425
152
80 7122 15
2002 EBIT by Geographical Location
(S$m)
Total: S$765 millioin
0
100
200
300
400
500
SingaporeAustralia & New ZealandChina
Other Asia (excl. S’pore & China)EuropeOthers
CL AR03 64-72 A/W-OK 17/03/2004 06:26 PM Page 66
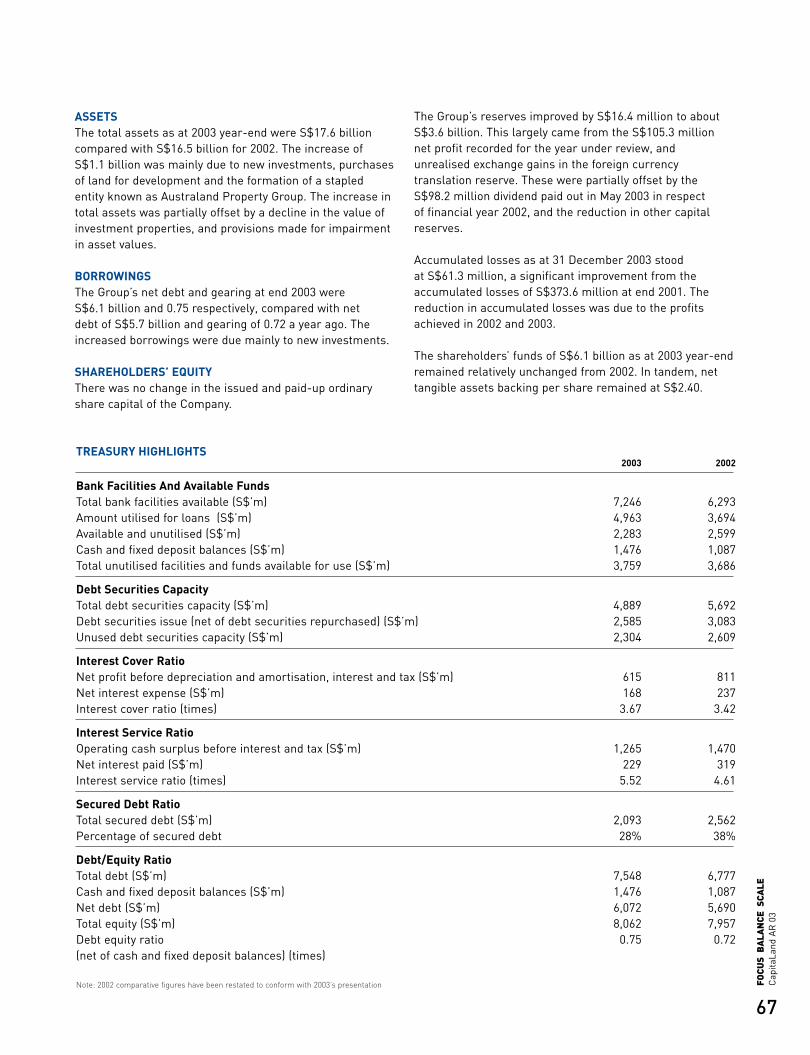
67
Cap
itaLa
ndA
R 0
3FO
CUS
BA
LAN
CE S
CALE
ASSETS The total assets as at 2003 year-end were S$17.6 billioncompared with S$16.5 billion for 2002. The increase of S$1.1 billion was mainly due to new investments, purchasesof land for development and the formation of a stapledentity known as Australand Property Group. The increase intotal assets was partially offset by a decline in the value ofinvestment properties, and provisions made for impairmentin asset values.
BORROWINGS The Group’s net debt and gearing at end 2003 were S$6.1 billion and 0.75 respectively, compared with net debt of S$5.7 billion and gearing of 0.72 a year ago. Theincreased borrowings were due mainly to new investments.
SHAREHOLDERS’ EQUITYThere was no change in the issued and paid-up ordinaryshare capital of the Company.
The Group’s reserves improved by S$16.4 million to aboutS$3.6 billion. This largely came from the S$105.3 millionnet profit recorded for the year under review, andunrealised exchange gains in the foreign currencytranslation reserve. These were partially offset by theS$98.2 million dividend paid out in May 2003 in respect of financial year 2002, and the reduction in other capitalreserves.
Accumulated losses as at 31 December 2003 stood at S$61.3 million, a significant improvement from theaccumulated losses of S$373.6 million at end 2001. Thereduction in accumulated losses was due to the profitsachieved in 2002 and 2003.
The shareholders’ funds of S$6.1 billion as at 2003 year-endremained relatively unchanged from 2002. In tandem, nettangible assets backing per share remained at S$2.40.
TREASURY HIGHLIGHTS 2003 2002
Bank Facilities And Available Funds Total bank facilities available (S$’m) 7,246 6,293Amount utilised for loans (S$’m) 4,963 3,694Available and unutilised (S$’m) 2,283 2,599Cash and fixed deposit balances (S$’m) 1,476 1,087Total unutilised facilities and funds available for use (S$’m) 3,759 3,686
Debt Securities Capacity Total debt securities capacity (S$’m) 4,889 5,692Debt securities issue (net of debt securities repurchased) (S$’m) 2,585 3,083Unused debt securities capacity (S$’m) 2,304 2,609
Interest Cover Ratio Net profit before depreciation and amortisation, interest and tax (S$’m) 615 811 Net interest expense (S$’m) 168 237 Interest cover ratio (times) 3.67 3.42
Interest Service Ratio Operating cash surplus before interest and tax (S$’m) 1,265 1,470 Net interest paid (S$’m) 229 319 Interest service ratio (times) 5.52 4.61
Secured Debt Ratio Total secured debt (S$’m) 2,093 2,562 Percentage of secured debt 28% 38%
Debt/Equity Ratio Total debt (S$’m) 7,548 6,777 Cash and fixed deposit balances (S$’m) 1,476 1,087 Net debt (S$’m) 6,072 5,690 Total equity (S$’m) 8,062 7,957 Debt equity ratio 0.75 0.72 (net of cash and fixed deposit balances) (times)
Note: 2002 comparative figures have been restated to conform with 2003’s presentation
CL AR03 64-72 A/W-OK 17/03/2004 06:26 PM Page 67
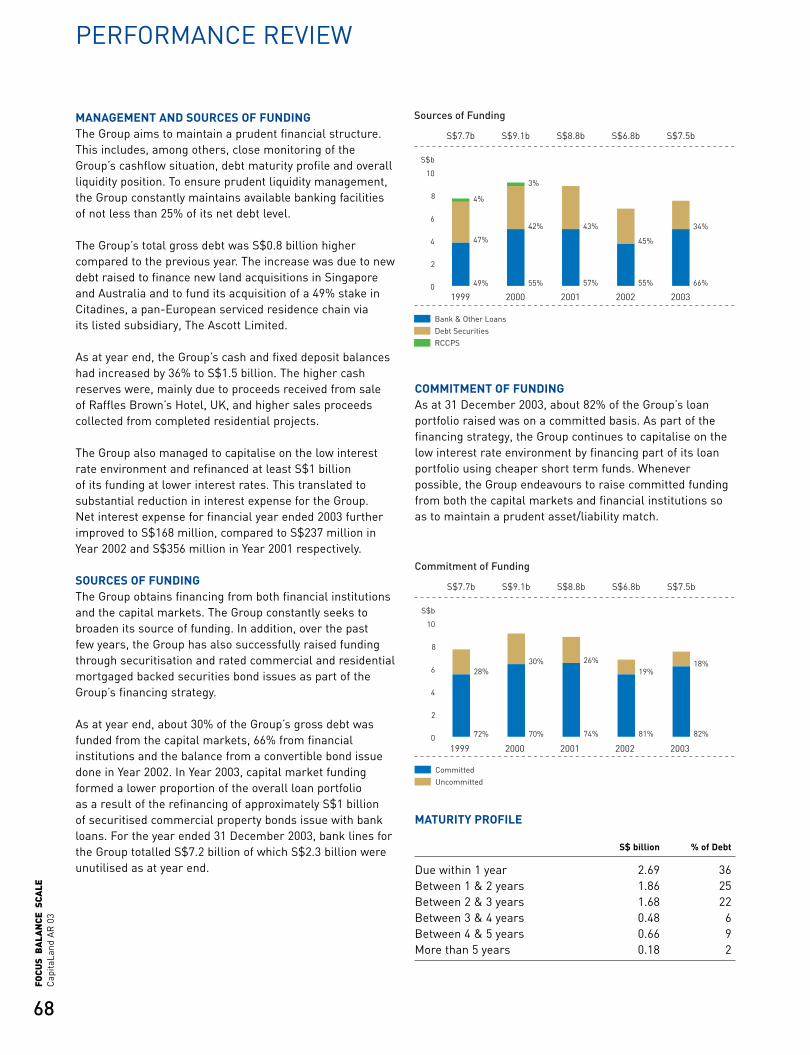
68
Cap
itaLa
ndA
R 0
3FO
CUS
BA
LAN
CE S
CALE
MANAGEMENT AND SOURCES OF FUNDINGThe Group aims to maintain a prudent financial structure.This includes, among others, close monitoring of theGroup’s cashflow situation, debt maturity profile and overallliquidity position. To ensure prudent liquidity management,the Group constantly maintains available banking facilities of not less than 25% of its net debt level.
The Group’s total gross debt was S$0.8 billion highercompared to the previous year. The increase was due to newdebt raised to finance new land acquisitions in Singaporeand Australia and to fund its acquisition of a 49% stake inCitadines, a pan-European serviced residence chain via its listed subsidiary, The Ascott Limited.
As at year end, the Group’s cash and fixed deposit balanceshad increased by 36% to S$1.5 billion. The higher cashreserves were, mainly due to proceeds received from sale of Raffles Brown’s Hotel, UK, and higher sales proceedscollected from completed residential projects.
The Group also managed to capitalise on the low interestrate environment and refinanced at least S$1 billion of its funding at lower interest rates. This translated tosubstantial reduction in interest expense for the Group. Net interest expense for financial year ended 2003 furtherimproved to S$168 million, compared to S$237 million inYear 2002 and S$356 million in Year 2001 respectively.
SOURCES OF FUNDINGThe Group obtains financing from both financial institutionsand the capital markets. The Group constantly seeks tobroaden its source of funding. In addition, over the past few years, the Group has also successfully raised fundingthrough securitisation and rated commercial and residentialmortgaged backed securities bond issues as part of theGroup’s financing strategy.
As at year end, about 30% of the Group’s gross debt wasfunded from the capital markets, 66% from financialinstitutions and the balance from a convertible bond issuedone in Year 2002. In Year 2003, capital market fundingformed a lower proportion of the overall loan portfolio as a result of the refinancing of approximately S$1 billion of securitised commercial property bonds issue with bankloans. For the year ended 31 December 2003, bank lines for the Group totalled S$7.2 billion of which S$2.3 billion wereunutilised as at year end.
COMMITMENT OF FUNDINGAs at 31 December 2003, about 82% of the Group’s loanportfolio raised was on a committed basis. As part of thefinancing strategy, the Group continues to capitalise on thelow interest rate environment by financing part of its loanportfolio using cheaper short term funds. Wheneverpossible, the Group endeavours to raise committed fundingfrom both the capital markets and financial institutions soas to maintain a prudent asset/liability match.
MATURITY PROFILE
S$ billion % of Debt
Due within 1 year 2.69 36Between 1 & 2 years 1.86 25Between 2 & 3 years 1.68 22Between 3 & 4 years 0.48 6Between 4 & 5 years 0.66 9More than 5 years 0.18 2
Sources of Funding
S$b
S$7.7b S$9.1b S$8.8b S$6.8b S$7.5b
1999 2000 2001 2002 2003 0
2
4
6
8
10
Bank & Other LoansDebt SecuritiesRCCPS
49%
47%
4%
3%
42% 43%
57%
45%
55%
34%
66%55%
Commitment of Funding
S$b
S$7.7b S$9.1b S$8.8b S$6.8b S$7.5b
1999 2000 2001 2002 20030
2
4
6
8
10
CommittedUncommitted
72%
28%30% 26%
74%
19%
81%
18%
82%70%
PERFORMANCE REVIEW
CL AR03 64-72 A/W-OK 17/03/2004 06:26 PM Page 68
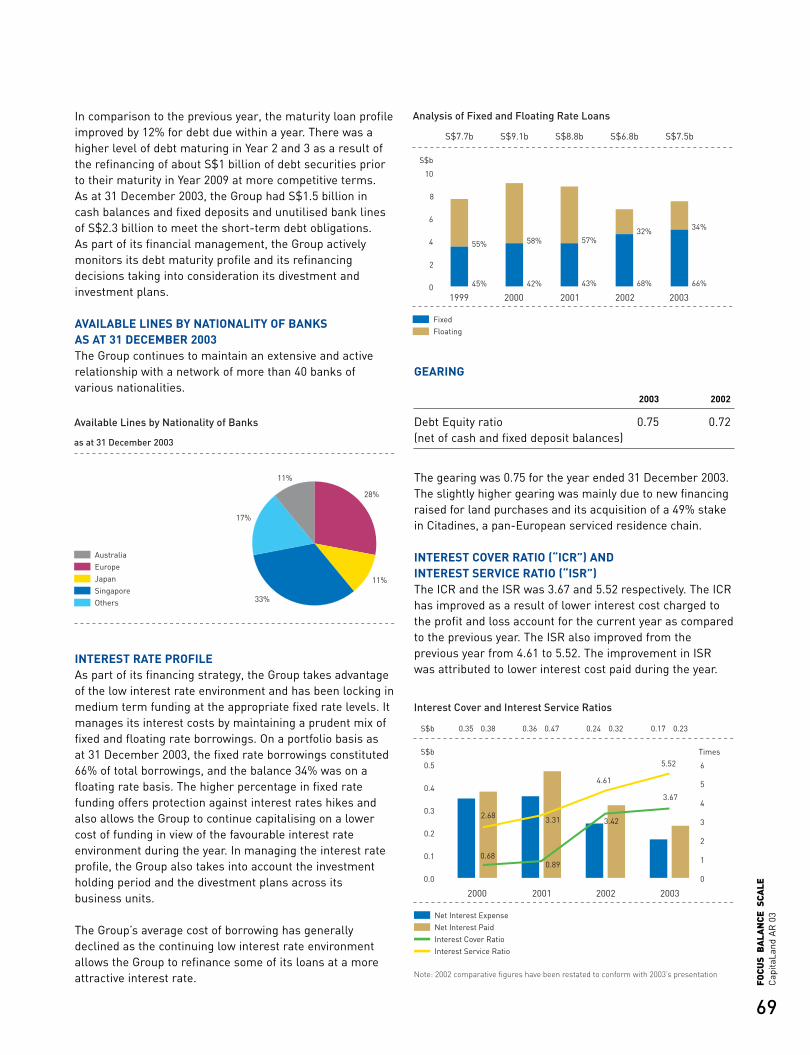
69
Cap
itaLa
ndA
R 0
3FO
CUS
BA
LAN
CE S
CALE
In comparison to the previous year, the maturity loan profileimproved by 12% for debt due within a year. There was ahigher level of debt maturing in Year 2 and 3 as a result ofthe refinancing of about S$1 billion of debt securities prior to their maturity in Year 2009 at more competitive terms. As at 31 December 2003, the Group had S$1.5 billion incash balances and fixed deposits and unutilised bank linesof S$2.3 billion to meet the short-term debt obligations. As part of its financial management, the Group activelymonitors its debt maturity profile and its refinancingdecisions taking into consideration its divestment andinvestment plans.
AVAILABLE LINES BY NATIONALITY OF BANKS AS AT 31 DECEMBER 2003The Group continues to maintain an extensive and activerelationship with a network of more than 40 banks ofvarious nationalities.
INTEREST RATE PROFILE As part of its financing strategy, the Group takes advantageof the low interest rate environment and has been locking inmedium term funding at the appropriate fixed rate levels. Itmanages its interest costs by maintaining a prudent mix offixed and floating rate borrowings. On a portfolio basis as at 31 December 2003, the fixed rate borrowings constituted66% of total borrowings, and the balance 34% was on afloating rate basis. The higher percentage in fixed ratefunding offers protection against interest rates hikes andalso allows the Group to continue capitalising on a lowercost of funding in view of the favourable interest rateenvironment during the year. In managing the interest rateprofile, the Group also takes into account the investmentholding period and the divestment plans across its business units.
The Group’s average cost of borrowing has generallydeclined as the continuing low interest rate environmentallows the Group to refinance some of its loans at a moreattractive interest rate.
GEARING
2003 2002
Debt Equity ratio 0.75 0.72(net of cash and fixed deposit balances)
The gearing was 0.75 for the year ended 31 December 2003.The slightly higher gearing was mainly due to new financingraised for land purchases and its acquisition of a 49% stake in Citadines, a pan-European serviced residence chain.
INTEREST COVER RATIO (“ICR”) AND INTEREST SERVICE RATIO (“ISR”)The ICR and the ISR was 3.67 and 5.52 respectively. The ICRhas improved as a result of lower interest cost charged tothe profit and loss account for the current year as comparedto the previous year. The ISR also improved from theprevious year from 4.61 to 5.52. The improvement in ISRwas attributed to lower interest cost paid during the year.
28%
11%
33%
11%
17%
Available Lines by Nationality of Banks
AustraliaEuropeJapanSingaporeOthers
as at 31 December 2003
Analysis of Fixed and Floating Rate Loans
S$b
S$7.7b S$9.1b S$8.8b S$6.8b S$7.5b
1999 2000 2001 2002 20030
2
4
6
8
10
FixedFloating
45%
55% 58% 57%
43%
32%
68%
34%
66%42%
Interest Cover and Interest Service Ratios
S$b Times
2000 2001 2002 2003
0.0
0.1
0.2
0.3
0.4
0.5
0
1
2
3
4
5
6
Net Interest ExpenseNet Interest PaidInterest Cover RatioInterest Service Ratio
Note: 2002 comparative figures have been restated to conform with 2003’s presentation
0.35 0.38 0.36
2.68 3.31
4.61
5.52
3.67
3.42
0.890.68
0.47S$b 0.24 0.32 0.17 0.23
CL AR03 64-72 A/W-OK 17/03/2004 06:26 PM Page 69
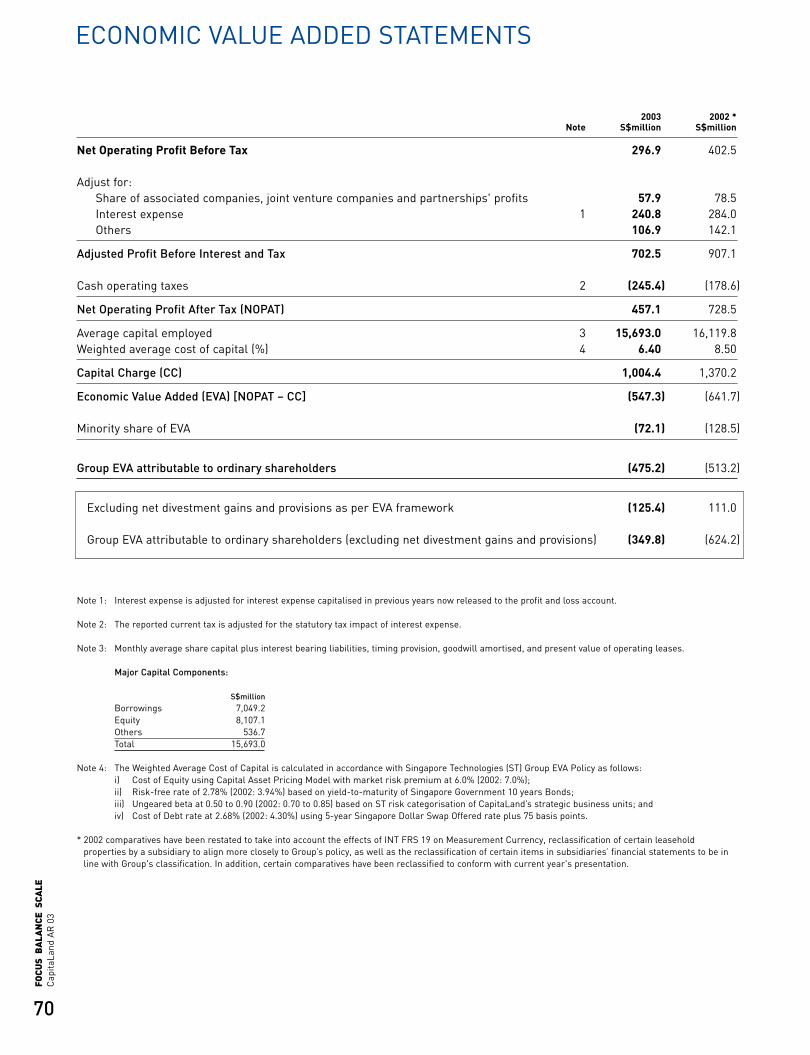
70
Cap
itaLa
ndA
R 0
3FO
CUS
BA
LAN
CE S
CALE
ECONOMIC VALUE ADDED STATEMENTS
2003 2002 *Note S$million S$million
Net Operating Profit Before Tax 296.9 402.5
Adjust for:Share of associated companies, joint venture companies and partnerships' profits 57.9 78.5 Interest expense 1 240.8 284.0 Others 106.9 142.1
Adjusted Profit Before Interest and Tax 702.5 907.1
Cash operating taxes 2 (245.4) (178.6)
Net Operating Profit After Tax (NOPAT) 457.1 728.5
Average capital employed 3 15,693.0 16,119.8 Weighted average cost of capital (%) 4 6.40 8.50
Capital Charge (CC) 1,004.4 1,370.2
Economic Value Added (EVA) [NOPAT – CC] (547.3) (641.7)
Minority share of EVA (72.1) (128.5)
Group EVA attributable to ordinary shareholders (475.2) (513.2)
Excluding net divestment gains and provisions as per EVA framework (125.4) 111.0
Group EVA attributable to ordinary shareholders (excluding net divestment gains and provisions) (349.8) (624.2)
Note 1: Interest expense is adjusted for interest expense capitalised in previous years now released to the profit and loss account.
Note 2: The reported current tax is adjusted for the statutory tax impact of interest expense.
Note 3: Monthly average share capital plus interest bearing liabilities, timing provision, goodwill amortised, and present value of operating leases.
Major Capital Components:
S$millionBorrowings 7,049.2 Equity 8,107.1 Others 536.7 Total 15,693.0
Note 4: The Weighted Average Cost of Capital is calculated in accordance with Singapore Technologies (ST) Group EVA Policy as follows:i) Cost of Equity using Capital Asset Pricing Model with market risk premium at 6.0% (2002: 7.0%);ii) Risk-free rate of 2.78% (2002: 3.94%) based on yield-to-maturity of Singapore Government 10 years Bonds;iii) Ungeared beta at 0.50 to 0.90 (2002: 0.70 to 0.85) based on ST risk categorisation of CapitaLand’s strategic business units; andiv) Cost of Debt rate at 2.68% (2002: 4.30%) using 5-year Singapore Dollar Swap Offered rate plus 75 basis points.
* 2002 comparatives have been restated to take into account the effects of INT FRS 19 on Measurement Currency, reclassification of certain leaseholdproperties by a subsidiary to align more closely to Group’s policy, as well as the reclassification of certain items in subsidiaries’ financial statements to be inline with Group's classification. In addition, certain comparatives have been reclassified to conform with current year's presentation.
CL AR03 64-72 A/W-OK 17/03/2004 06:26 PM Page 70
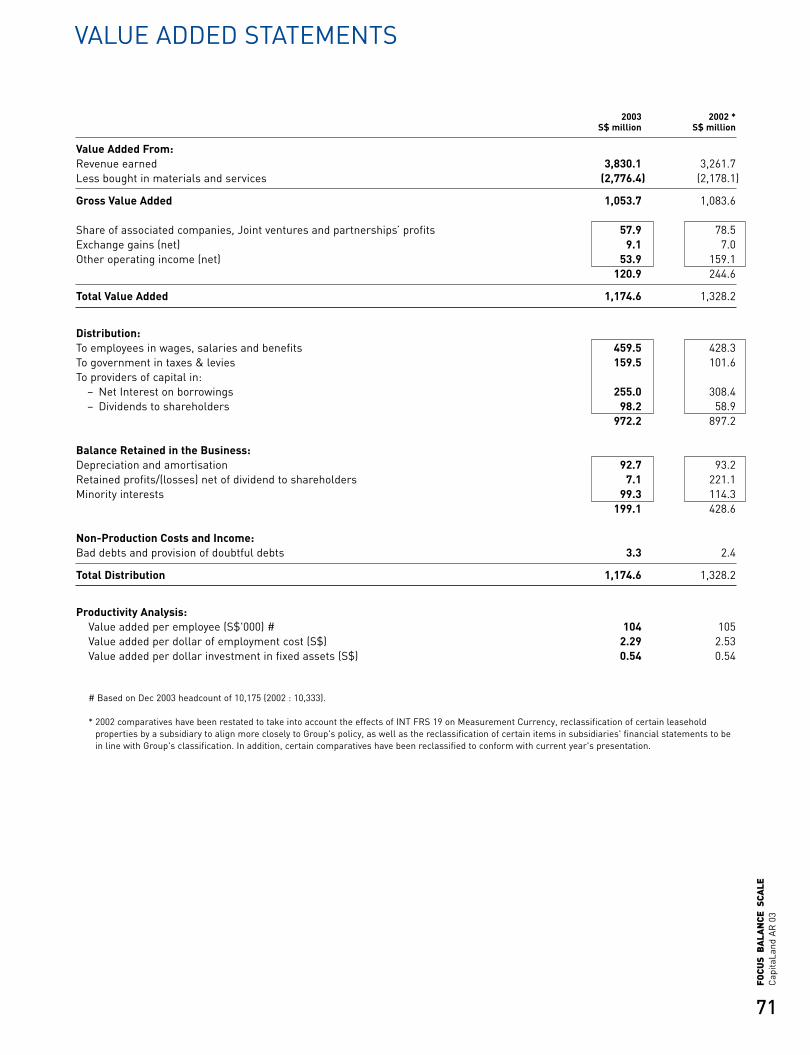
71
Cap
itaLa
ndA
R 0
3FO
CUS
BA
LAN
CE S
CALE
VALUE ADDED STATEMENTS
2003 2002 *S$ million S$ million
Value Added From:Revenue earned 3,830.1 3,261.7 Less bought in materials and services (2,776.4) (2,178.1)
Gross Value Added 1,053.7 1,083.6
Share of associated companies, Joint ventures and partnerships’ profits 57.9 78.5 Exchange gains (net) 9.1 7.0 Other operating income (net) 53.9 159.1
120.9 244.6
Total Value Added 1,174.6 1,328.2
Distribution:To employees in wages, salaries and benefits 459.5 428.3 To government in taxes & levies 159.5 101.6 To providers of capital in:
– Net Interest on borrowings 255.0 308.4 – Dividends to shareholders 98.2 58.9
972.2 897.2
Balance Retained in the Business:Depreciation and amortisation 92.7 93.2 Retained profits/(losses) net of dividend to shareholders 7.1 221.1 Minority interests 99.3 114.3
199.1 428.6
Non-Production Costs and Income:Bad debts and provision of doubtful debts 3.3 2.4
Total Distribution 1,174.6 1,328.2
Productivity Analysis:Value added per employee (S$'000) # 104 105Value added per dollar of employment cost (S$) 2.29 2.53Value added per dollar investment in fixed assets (S$) 0.54 0.54
# Based on Dec 2003 headcount of 10,175 (2002 : 10,333).
* 2002 comparatives have been restated to take into account the effects of INT FRS 19 on Measurement Currency, reclassification of certain leaseholdproperties by a subsidiary to align more closely to Group's policy, as well as the reclassification of certain items in subsidiaries' financial statements to bein line with Group's classification. In addition, certain comparatives have been reclassified to conform with current year's presentation.
CL AR03 64-72 A/W-OK 17/03/2004 06:26 PM Page 71
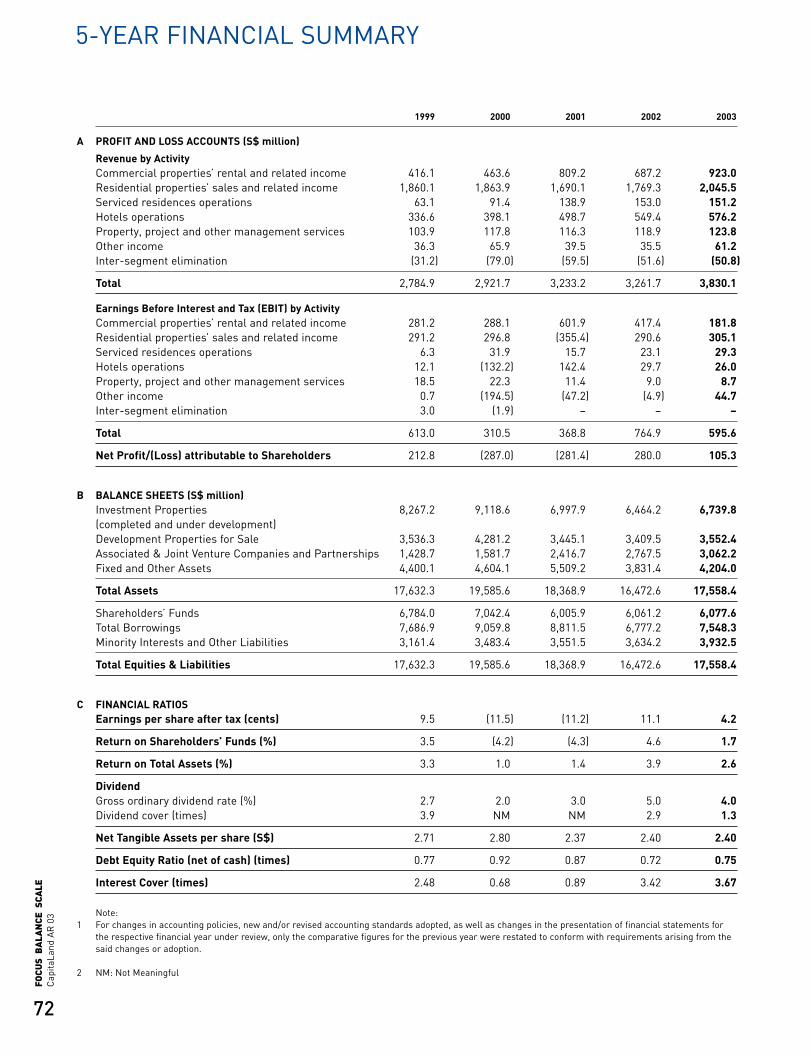
72
Cap
itaLa
ndA
R 0
3FO
CUS
BA
LAN
CE S
CALE
5-YEAR FINANCIAL SUMMARY
1999 2000 2001 2002 2003
A PROFIT AND LOSS ACCOUNTS (S$ million)
Revenue by ActivityCommercial properties’ rental and related income 416.1 463.6 809.2 687.2 923.0Residential properties’ sales and related income 1,860.1 1,863.9 1,690.1 1,769.3 2,045.5Serviced residences operations 63.1 91.4 138.9 153.0 151.2Hotels operations 336.6 398.1 498.7 549.4 576.2Property, project and other management services 103.9 117.8 116.3 118.9 123.8Other income 36.3 65.9 39.5 35.5 61.2Inter-segment elimination (31.2) (79.0) (59.5) (51.6) (50.8)
Total 2,784.9 2,921.7 3,233.2 3,261.7 3,830.1
Earnings Before Interest and Tax (EBIT) by ActivityCommercial properties’ rental and related income 281.2 288.1 601.9 417.4 181.8Residential properties’ sales and related income 291.2 296.8 (355.4) 290.6 305.1Serviced residences operations 6.3 31.9 15.7 23.1 29.3Hotels operations 12.1 (132.2) 142.4 29.7 26.0Property, project and other management services 18.5 22.3 11.4 9.0 8.7Other income 0.7 (194.5) (47.2) (4.9) 44.7Inter-segment elimination 3.0 (1.9) – – –
Total 613.0 310.5 368.8 764.9 595.6
Net Profit/(Loss) attributable to Shareholders 212.8 (287.0) (281.4) 280.0 105.3
B BALANCE SHEETS (S$ million)Investment Properties 8,267.2 9,118.6 6,997.9 6,464.2 6,739.8(completed and under development)Development Properties for Sale 3,536.3 4,281.2 3,445.1 3,409.5 3,552.4Associated & Joint Venture Companies and Partnerships 1,428.7 1,581.7 2,416.7 2,767.5 3,062.2Fixed and Other Assets 4,400.1 4,604.1 5,509.2 3,831.4 4,204.0
Total Assets 17,632.3 19,585.6 18,368.9 16,472.6 17,558.4
Shareholders’ Funds 6,784.0 7,042.4 6,005.9 6,061.2 6,077.6Total Borrowings 7,686.9 9,059.8 8,811.5 6,777.2 7,548.3Minority Interests and Other Liabilities 3,161.4 3,483.4 3,551.5 3,634.2 3,932.5
Total Equities & Liabilities 17,632.3 19,585.6 18,368.9 16,472.6 17,558.4
C FINANCIAL RATIOSEarnings per share after tax (cents) 9.5 (11.5) (11.2) 11.1 4.2
Return on Shareholders’ Funds (%) 3.5 (4.2) (4.3) 4.6 1.7
Return on Total Assets (%) 3.3 1.0 1.4 3.9 2.6
DividendGross ordinary dividend rate (%) 2.7 2.0 3.0 5.0 4.0Dividend cover (times) 3.9 NM NM 2.9 1.3
Net Tangible Assets per share (S$) 2.71 2.80 2.37 2.40 2.40
Debt Equity Ratio (net of cash) (times) 0.77 0.92 0.87 0.72 0.75
Interest Cover (times) 2.48 0.68 0.89 3.42 3.67
Note:1 For changes in accounting policies, new and/or revised accounting standards adopted, as well as changes in the presentation of financial statements for
the respective financial year under review, only the comparative figures for the previous year were restated to conform with requirements arising from thesaid changes or adoption.
2 NM: Not Meaningful
CL AR03 64-72 A/W-OK 17/03/2004 06:26 PM Page 72

STATUTORYACCOUNTS
74 Directors’ Report90 Statement by Directors91 Report of the Auditors92 Balance Sheets93 Profit and Loss Accounts94 Statements of Changes in Equity96 Consolidated Statement of Cash Flows98 Notes to the Financial Statements
CONTENTS
CapL Acc03 proof 04_OKp73-151 17/03/2004 06:41 PM Page 73
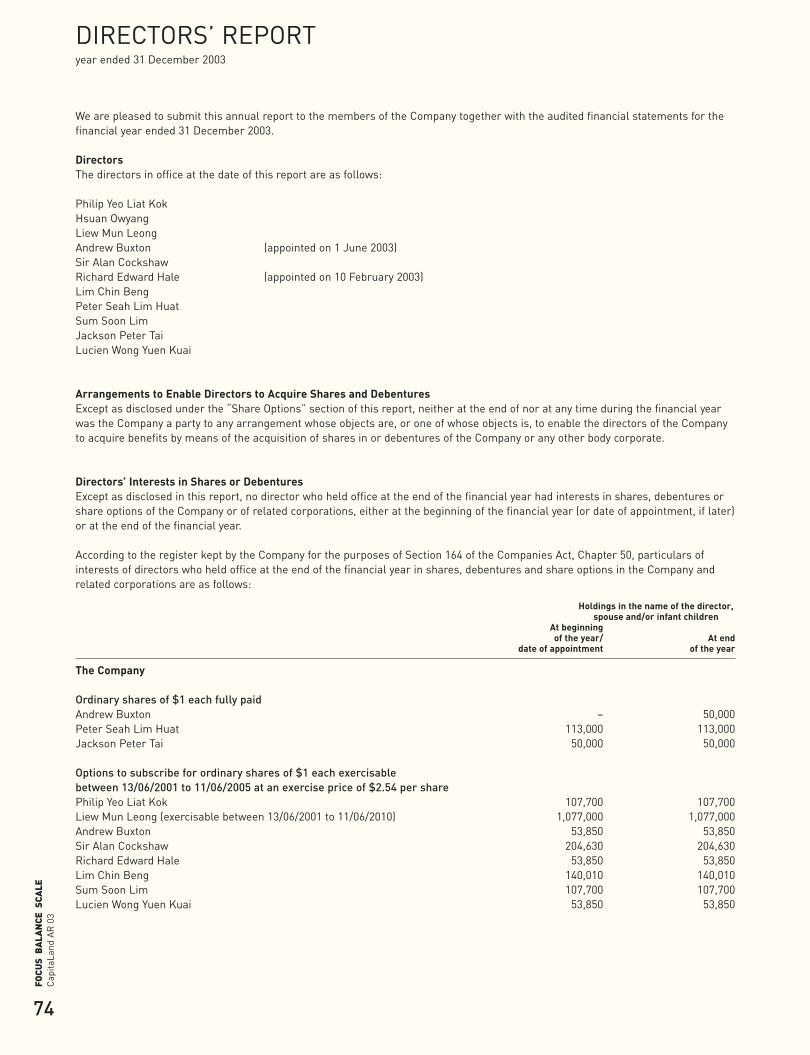
74
Cap
itaLa
ndA
R 0
3FO
CUS
BA
LAN
CE S
CALE
DIRECTORS’ REPORT year ended 31 December 2003
We are pleased to submit this annual report to the members of the Company together with the audited financial statements for thefinancial year ended 31 December 2003.
DirectorsThe directors in office at the date of this report are as follows:
Philip Yeo Liat KokHsuan OwyangLiew Mun LeongAndrew Buxton (appointed on 1 June 2003)Sir Alan CockshawRichard Edward Hale (appointed on 10 February 2003)Lim Chin BengPeter Seah Lim HuatSum Soon LimJackson Peter TaiLucien Wong Yuen Kuai
Arrangements to Enable Directors to Acquire Shares and DebenturesExcept as disclosed under the “Share Options” section of this report, neither at the end of nor at any time during the financial yearwas the Company a party to any arrangement whose objects are, or one of whose objects is, to enable the directors of the Companyto acquire benefits by means of the acquisition of shares in or debentures of the Company or any other body corporate.
Directors’ Interests in Shares or DebenturesExcept as disclosed in this report, no director who held office at the end of the financial year had interests in shares, debentures orshare options of the Company or of related corporations, either at the beginning of the financial year (or date of appointment, if later)or at the end of the financial year.
According to the register kept by the Company for the purposes of Section 164 of the Companies Act, Chapter 50, particulars ofinterests of directors who held office at the end of the financial year in shares, debentures and share options in the Company andrelated corporations are as follows:
Holdings in the name of the director,spouse and/or infant children
At beginning of the year/ At end
date of appointment of the year
The Company
Ordinary shares of $1 each fully paidAndrew Buxton – 50,000Peter Seah Lim Huat 113,000 113,000Jackson Peter Tai 50,000 50,000
Options to subscribe for ordinary shares of $1 each exercisable between 13/06/2001 to 11/06/2005 at an exercise price of $2.54 per sharePhilip Yeo Liat Kok 107,700 107,700Liew Mun Leong (exercisable between 13/06/2001 to 11/06/2010) 1,077,000 1,077,000Andrew Buxton 53,850 53,850Sir Alan Cockshaw 204,630 204,630Richard Edward Hale 53,850 53,850Lim Chin Beng 140,010 140,010Sum Soon Lim 107,700 107,700Lucien Wong Yuen Kuai 53,850 53,850
CapL Acc03 proof 04_OKp73-151 17/03/2004 08:10 PM Page 74

75
Cap
itaLa
ndA
R 0
3FO
CUS
BA
LAN
CE S
CALE
Directors’ Interests in Shares or Debentures (cont’d)
Holdings in the name of the director, spouse and/or infant children
At beginning of the year/ At end
date of appointment of the year
The Company (cont’d)
Options to subscribe for ordinary shares of $1 each exercisable between 05/08/2001 to 03/08/2005 at an exercise price of $2.51 per shareHsuan Owyang 100,000 100,000Liew Mun Leong 50,000 50,000Sum Soon Lim 80,000 80,000Jackson Peter Tai 50,000 50,000
Options to subscribe for ordinary shares of $1 each exercisable between 19/06/2002 to 18/06/2006 at an exercise price of $2.50 per sharePhilip Yeo Liat Kok 150,000 150,000Hsuan Owyang 220,000 220,000Liew Mun Leong (exercisable between 19/06/2002 to 18/06/2011) 800,000 800,000Andrew Buxton 40,000 40,000Sir Alan Cockshaw 220,000 220,000Richard Edward Hale 30,000 30,000Lim Chin Beng 120,000 120,000Sum Soon Lim 150,000 150,000Jackson Peter Tai 170,000 170,000Lucien Wong Yuen Kuai 100,000 100,000
Options to subscribe for ordinary shares of $1 each exercisable between 11/05/2003 to 10/05/2007 at an exercise price of $1.71 per sharePhilip Yeo Liat Kok 120,000 120,000Hsuan Owyang 150,000 150,000Liew Mun Leong (exercisable between 11/05/2003 to 10/05/2012) 800,000 800,000Andrew Buxton 40,000 40,000Sir Alan Cockshaw 100,000 100,000Richard Edward Hale 15,000 15,000Lim Chin Beng 90,000 90,000Peter Seah Lim Huat 90,000 90,000Sum Soon Lim 100,000 100,000Jackson Peter Tai 100,000 100,000Lucien Wong Yuen Kuai 70,000 70,000
Options to subscribe for ordinary shares of $1 each exercisable between 01/03/2004 to 28/02/2008 at an exercise price of $1.02 per sharePhilip Yeo Liat Kok – 120,000Hsuan Owyang – 150,000Liew Mun Leong (exercisable between 01/03/2004 to 28/02/2013) – 800,000Andrew Buxton 40,000 40,000Sir Alan Cockshaw – 110,000Richard Edward Hale – 126,000Lim Chin Beng – 120,000Peter Seah Lim Huat – 90,000Sum Soon Lim – 100,000Jackson Peter Tai – 90,00Lucien Wong Yuen Kuai – 80,000
Conditional award of performance shares to be delivered after 2004Liew Mun Leong (250,000 performance shares) 0 to 500,000 # 0 to 500,000 #
Conditional award of performance shares to be delivered after 2005Liew Mun Leong (400,000 performance shares) – 0 to 800,000 #
CapL Acc03 proof 04_OKp73-151 17/03/2004 06:41 PM Page 75

76
Cap
itaLa
ndA
R 0
3FO
CUS
BA
LAN
CE S
CALE
DIRECTORS’ REPORT year ended 31 December 2003
Directors’ Interests in Shares or Debentures (cont’d)
Holdings in the name of the director, spouse and/or infant children
At beginning of the year/ At end
date of appointment of the year
Related Corporations
Chartered Semiconductor Manufacturing LtdOrdinary shares of $0.26 each fully paidPhilip Yeo Liat Kok 40,000 40,000Sum Soon Lim 350,000 350,000
Options to subscribe for ordinary shares of $0.26 each exercisable between 07/10/1999 to 07/10/2004 at an exercise price of $0.94 per shareSum Soon Lim 16,748 16,748
Options to subscribe for ordinary shares of $0.26 each exercisable between 07/10/1999 to 07/10/2004 at an exercise price of $0.80 per shareSum Soon Lim 41,870 41,870
Options to subscribe for ordinary shares of $0.26 each exercisable between 29/04/2000 to 29/04/2004 at an exercise price of $2.86 per shareSum Soon Lim 70,331 70,331
Options to subscribe for ordinary shares of $0.26 each exercisable between 29/10/2000 to 29/10/2004 at an exercise price of $2.86 per shareSum Soon Lim 23,443 23,443
Options to subscribe for ordinary shares of $0.26 each exercisable between 06/04/2001 to 06/04/2005 at an exercise price of $14.24 per shareSum Soon Lim 93,775 93,775
Options to subscribe for ordinary shares of $0.26 each exercisable between 03/10/2001 to 03/10/2005 at an exercise price of $10.12 per shareSum Soon Lim 93,775 93,775
Options to subscribe for ordinary shares of $0.26 each exercisable between 28/03/2002 to 28/03/2006 at an exercise price of $4.05 per shareSum Soon Lim 46,887 46,887
Options to subscribe for ordinary shares of $0.26 each exercisable between 15/08/2002 to 15/08/2006 at an exercise price of $4.26 per shareSum Soon Lim 46,887 46,887
Options to subscribe for ordinary shares of $0.26 each exercisable between 22/02/2003 to 22/02/2007 at an exercise price of $3.46 per sharePeter Seah Lim Huat 23,443 23,443Sum Soon Lim 46,887 46,887
Options to subscribe for ordinary shares of $0.26 each exercisable between 30/08/2003 to 30/08/2007 at an exercise price of $1.86 per sharePeter Seah Lim Huat 46,887 46,887Sum Soon Lim 46,887 46,887
Options to subscribe for ordinary shares of $0.26 each exercisable between 28/02/2004 to 28/02/2008 at an exercise price of $0.72 per sharePeter Seah Lim Huat – 40,000Sum Soon Lim – 25,000
CapL Acc03 proof 04_OKp73-151 17/03/2004 06:41 PM Page 76
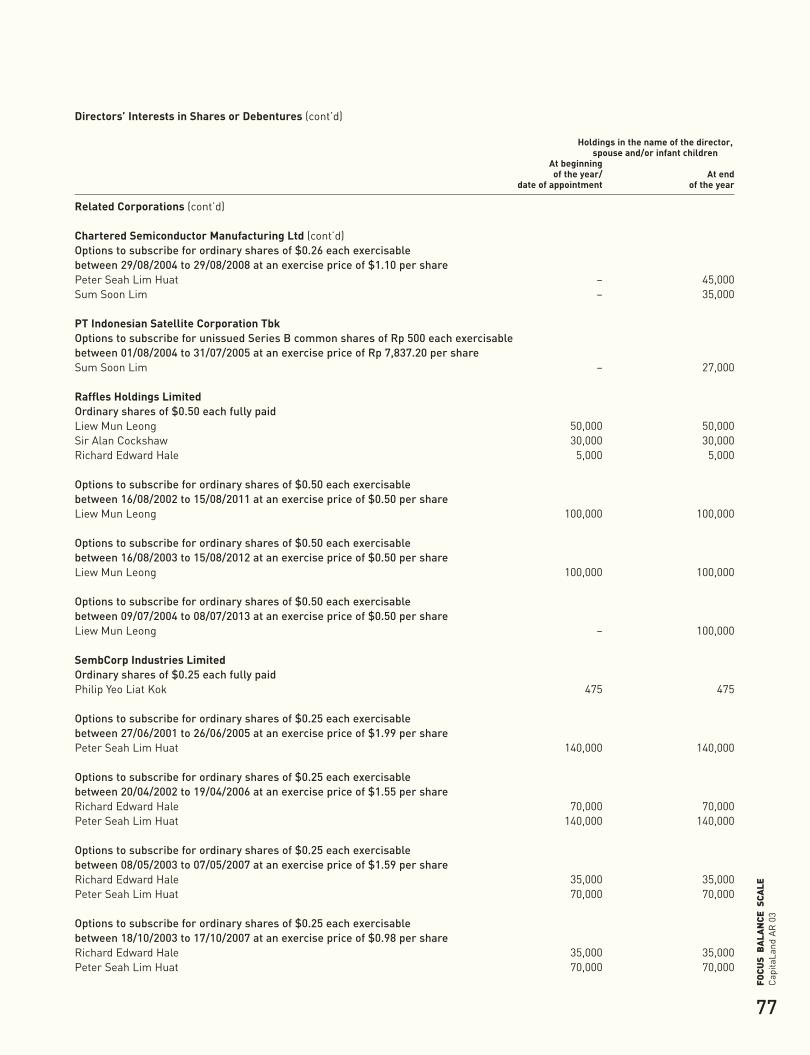
77
Cap
itaLa
ndA
R 0
3FO
CUS
BA
LAN
CE S
CALE
Directors’ Interests in Shares or Debentures (cont’d)
Holdings in the name of the director, spouse and/or infant children
At beginning of the year/ At end
date of appointment of the year
Related Corporations (cont’d)
Chartered Semiconductor Manufacturing Ltd (cont’d)Options to subscribe for ordinary shares of $0.26 each exercisable between 29/08/2004 to 29/08/2008 at an exercise price of $1.10 per sharePeter Seah Lim Huat – 45,000Sum Soon Lim – 35,000
PT Indonesian Satellite Corporation TbkOptions to subscribe for unissued Series B common shares of Rp 500 each exercisable between 01/08/2004 to 31/07/2005 at an exercise price of Rp 7,837.20 per shareSum Soon Lim – 27,000
Raffles Holdings LimitedOrdinary shares of $0.50 each fully paidLiew Mun Leong 50,000 50,000Sir Alan Cockshaw 30,000 30,000Richard Edward Hale 5,000 5,000
Options to subscribe for ordinary shares of $0.50 each exercisable between 16/08/2002 to 15/08/2011 at an exercise price of $0.50 per shareLiew Mun Leong 100,000 100,000
Options to subscribe for ordinary shares of $0.50 each exercisable between 16/08/2003 to 15/08/2012 at an exercise price of $0.50 per shareLiew Mun Leong 100,000 100,000
Options to subscribe for ordinary shares of $0.50 each exercisable between 09/07/2004 to 08/07/2013 at an exercise price of $0.50 per shareLiew Mun Leong – 100,000
SembCorp Industries LimitedOrdinary shares of $0.25 each fully paidPhilip Yeo Liat Kok 475 475
Options to subscribe for ordinary shares of $0.25 each exercisable between 27/06/2001 to 26/06/2005 at an exercise price of $1.99 per sharePeter Seah Lim Huat 140,000 140,000
Options to subscribe for ordinary shares of $0.25 each exercisable between 20/04/2002 to 19/04/2006 at an exercise price of $1.55 per shareRichard Edward Hale 70,000 70,000Peter Seah Lim Huat 140,000 140,000
Options to subscribe for ordinary shares of $0.25 each exercisable between 08/05/2003 to 07/05/2007 at an exercise price of $1.59 per shareRichard Edward Hale 35,000 35,000Peter Seah Lim Huat 70,000 70,000
Options to subscribe for ordinary shares of $0.25 each exercisable between 18/10/2003 to 17/10/2007 at an exercise price of $0.98 per shareRichard Edward Hale 35,000 35,000Peter Seah Lim Huat 70,000 70,000
CapL Acc03 proof 04_OKp73-151 17/03/2004 06:41 PM Page 77
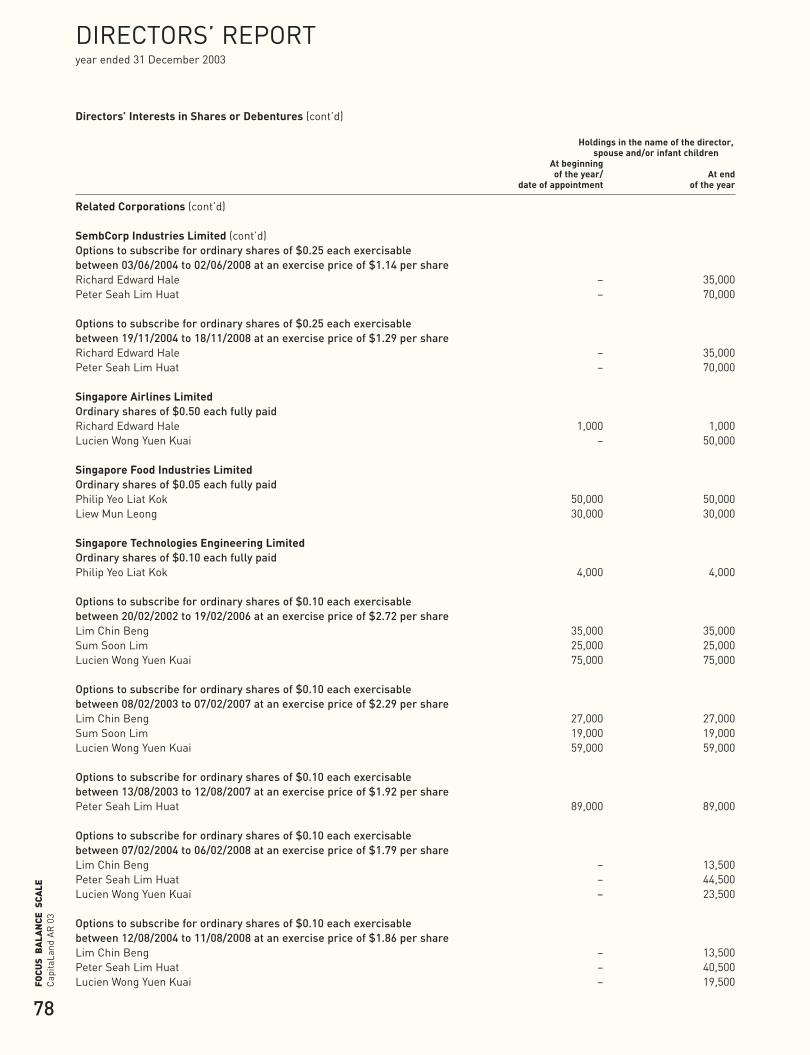
78
Cap
itaLa
ndA
R 0
3FO
CUS
BA
LAN
CE S
CALE
DIRECTORS’ REPORT year ended 31 December 2003
Directors’ Interests in Shares or Debentures (cont’d)
Holdings in the name of the director, spouse and/or infant children
At beginning of the year/ At end
date of appointment of the year
Related Corporations (cont’d)
SembCorp Industries Limited (cont’d)Options to subscribe for ordinary shares of $0.25 each exercisable between 03/06/2004 to 02/06/2008 at an exercise price of $1.14 per shareRichard Edward Hale – 35,000Peter Seah Lim Huat – 70,000
Options to subscribe for ordinary shares of $0.25 each exercisable between 19/11/2004 to 18/11/2008 at an exercise price of $1.29 per shareRichard Edward Hale – 35,000Peter Seah Lim Huat – 70,000
Singapore Airlines LimitedOrdinary shares of $0.50 each fully paidRichard Edward Hale 1,000 1,000Lucien Wong Yuen Kuai – 50,000
Singapore Food Industries LimitedOrdinary shares of $0.05 each fully paidPhilip Yeo Liat Kok 50,000 50,000Liew Mun Leong 30,000 30,000
Singapore Technologies Engineering LimitedOrdinary shares of $0.10 each fully paidPhilip Yeo Liat Kok 4,000 4,000
Options to subscribe for ordinary shares of $0.10 each exercisable between 20/02/2002 to 19/02/2006 at an exercise price of $2.72 per shareLim Chin Beng 35,000 35,000Sum Soon Lim 25,000 25,000Lucien Wong Yuen Kuai 75,000 75,000
Options to subscribe for ordinary shares of $0.10 each exercisable between 08/02/2003 to 07/02/2007 at an exercise price of $2.29 per shareLim Chin Beng 27,000 27,000Sum Soon Lim 19,000 19,000Lucien Wong Yuen Kuai 59,000 59,000
Options to subscribe for ordinary shares of $0.10 each exercisable between 13/08/2003 to 12/08/2007 at an exercise price of $1.92 per sharePeter Seah Lim Huat 89,000 89,000
Options to subscribe for ordinary shares of $0.10 each exercisable between 07/02/2004 to 06/02/2008 at an exercise price of $1.79 per shareLim Chin Beng – 13,500Peter Seah Lim Huat – 44,500Lucien Wong Yuen Kuai – 23,500
Options to subscribe for ordinary shares of $0.10 each exercisable between 12/08/2004 to 11/08/2008 at an exercise price of $1.86 per shareLim Chin Beng – 13,500Peter Seah Lim Huat – 40,500Lucien Wong Yuen Kuai – 19,500
CapL Acc03 proof 04_OKp73-151 17/03/2004 06:41 PM Page 78
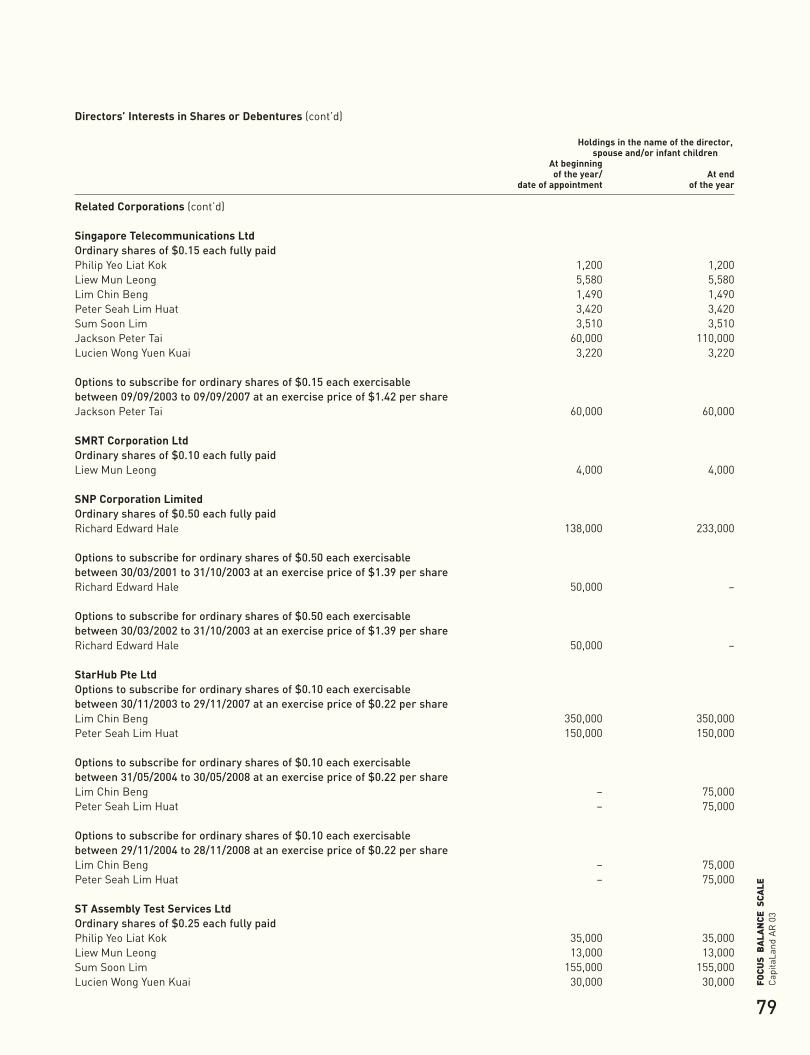
79
Cap
itaLa
ndA
R 0
3FO
CUS
BA
LAN
CE S
CALE
Directors’ Interests in Shares or Debentures (cont’d)
Holdings in the name of the director, spouse and/or infant children
At beginning of the year/ At end
date of appointment of the year
Related Corporations (cont’d)
Singapore Telecommunications LtdOrdinary shares of $0.15 each fully paidPhilip Yeo Liat Kok 1,200 1,200Liew Mun Leong 5,580 5,580Lim Chin Beng 1,490 1,490Peter Seah Lim Huat 3,420 3,420Sum Soon Lim 3,510 3,510Jackson Peter Tai 60,000 110,000Lucien Wong Yuen Kuai 3,220 3,220
Options to subscribe for ordinary shares of $0.15 each exercisable between 09/09/2003 to 09/09/2007 at an exercise price of $1.42 per shareJackson Peter Tai 60,000 60,000
SMRT Corporation LtdOrdinary shares of $0.10 each fully paidLiew Mun Leong 4,000 4,000
SNP Corporation LimitedOrdinary shares of $0.50 each fully paidRichard Edward Hale 138,000 233,000
Options to subscribe for ordinary shares of $0.50 each exercisable between 30/03/2001 to 31/10/2003 at an exercise price of $1.39 per shareRichard Edward Hale 50,000 –
Options to subscribe for ordinary shares of $0.50 each exercisable between 30/03/2002 to 31/10/2003 at an exercise price of $1.39 per shareRichard Edward Hale 50,000 –
StarHub Pte LtdOptions to subscribe for ordinary shares of $0.10 each exercisable between 30/11/2003 to 29/11/2007 at an exercise price of $0.22 per shareLim Chin Beng 350,000 350,000Peter Seah Lim Huat 150,000 150,000
Options to subscribe for ordinary shares of $0.10 each exercisable between 31/05/2004 to 30/05/2008 at an exercise price of $0.22 per shareLim Chin Beng – 75,000Peter Seah Lim Huat – 75,000
Options to subscribe for ordinary shares of $0.10 each exercisable between 29/11/2004 to 28/11/2008 at an exercise price of $0.22 per shareLim Chin Beng – 75,000Peter Seah Lim Huat – 75,000
ST Assembly Test Services LtdOrdinary shares of $0.25 each fully paidPhilip Yeo Liat Kok 35,000 35,000Liew Mun Leong 13,000 13,000Sum Soon Lim 155,000 155,000Lucien Wong Yuen Kuai 30,000 30,000
CapL Acc03 proof 04_OKp73-151 17/03/2004 06:41 PM Page 79
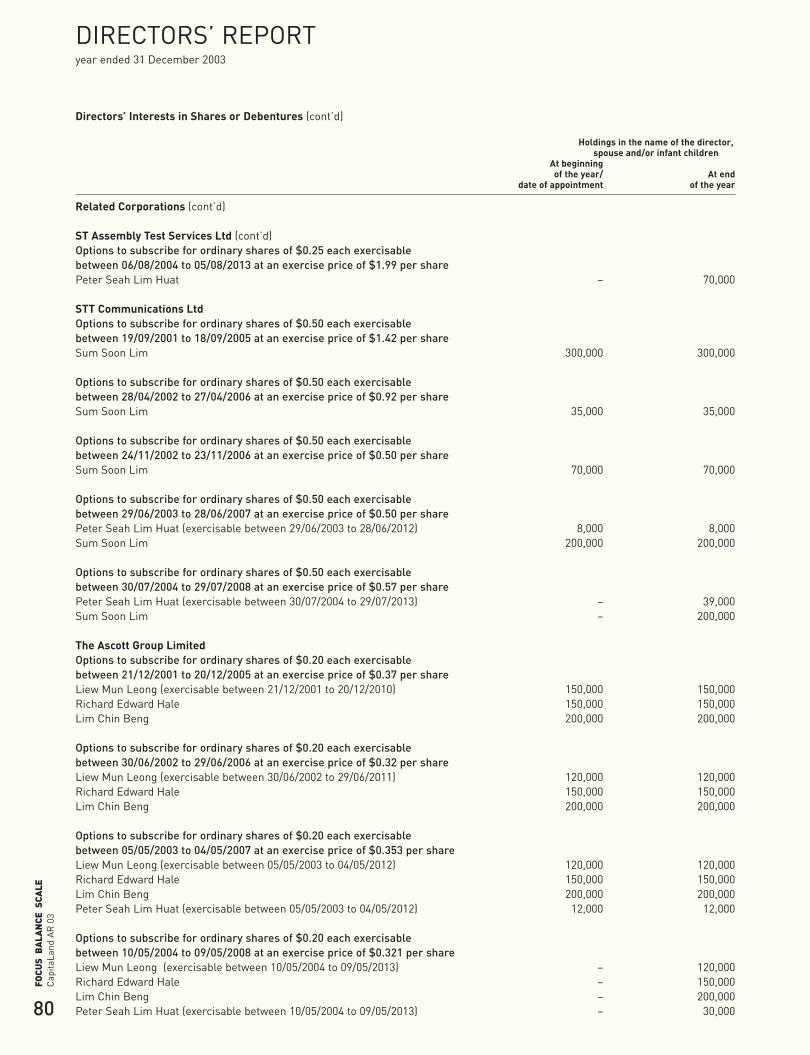
80
Cap
itaLa
ndA
R 0
3FO
CUS
BA
LAN
CE S
CALE
DIRECTORS’ REPORT year ended 31 December 2003
Directors’ Interests in Shares or Debentures (cont’d)
Holdings in the name of the director, spouse and/or infant children
At beginning of the year/ At end
date of appointment of the year
Related Corporations (cont’d)
ST Assembly Test Services Ltd (cont’d)Options to subscribe for ordinary shares of $0.25 each exercisable between 06/08/2004 to 05/08/2013 at an exercise price of $1.99 per sharePeter Seah Lim Huat – 70,000
STT Communications LtdOptions to subscribe for ordinary shares of $0.50 each exercisable between 19/09/2001 to 18/09/2005 at an exercise price of $1.42 per shareSum Soon Lim 300,000 300,000
Options to subscribe for ordinary shares of $0.50 each exercisable between 28/04/2002 to 27/04/2006 at an exercise price of $0.92 per shareSum Soon Lim 35,000 35,000
Options to subscribe for ordinary shares of $0.50 each exercisable between 24/11/2002 to 23/11/2006 at an exercise price of $0.50 per shareSum Soon Lim 70,000 70,000
Options to subscribe for ordinary shares of $0.50 each exercisable between 29/06/2003 to 28/06/2007 at an exercise price of $0.50 per sharePeter Seah Lim Huat (exercisable between 29/06/2003 to 28/06/2012) 8,000 8,000Sum Soon Lim 200,000 200,000
Options to subscribe for ordinary shares of $0.50 each exercisable between 30/07/2004 to 29/07/2008 at an exercise price of $0.57 per sharePeter Seah Lim Huat (exercisable between 30/07/2004 to 29/07/2013) – 39,000Sum Soon Lim – 200,000
The Ascott Group LimitedOptions to subscribe for ordinary shares of $0.20 each exercisable between 21/12/2001 to 20/12/2005 at an exercise price of $0.37 per shareLiew Mun Leong (exercisable between 21/12/2001 to 20/12/2010) 150,000 150,000Richard Edward Hale 150,000 150,000Lim Chin Beng 200,000 200,000
Options to subscribe for ordinary shares of $0.20 each exercisable between 30/06/2002 to 29/06/2006 at an exercise price of $0.32 per shareLiew Mun Leong (exercisable between 30/06/2002 to 29/06/2011) 120,000 120,000Richard Edward Hale 150,000 150,000Lim Chin Beng 200,000 200,000
Options to subscribe for ordinary shares of $0.20 each exercisable between 05/05/2003 to 04/05/2007 at an exercise price of $0.353 per shareLiew Mun Leong (exercisable between 05/05/2003 to 04/05/2012) 120,000 120,000Richard Edward Hale 150,000 150,000Lim Chin Beng 200,000 200,000Peter Seah Lim Huat (exercisable between 05/05/2003 to 04/05/2012) 12,000 12,000
Options to subscribe for ordinary shares of $0.20 each exercisable between 10/05/2004 to 09/05/2008 at an exercise price of $0.321 per shareLiew Mun Leong (exercisable between 10/05/2004 to 09/05/2013) – 120,000Richard Edward Hale – 150,000Lim Chin Beng – 200,000Peter Seah Lim Huat (exercisable between 10/05/2004 to 09/05/2013) – 30,000
CapL Acc03 proof 04_OKp73-151 17/03/2004 06:41 PM Page 80

81
Cap
itaLa
ndA
R 0
3FO
CUS
BA
LAN
CE S
CALE
Directors’ Interests in Shares or Debentures (cont’d)
Holdings in the name of the director, spouse and/or infant children
At beginning of the year/ At end
date of appointment of the year
Related Corporations (cont’d)
Vertex Technology Fund LtdOrdinary shares of US$1 each fully paidSum Soon Lim 300 300
Vertex Technology Fund (II) LtdOrdinary shares of US$1 each fully paidPhilip Yeo Liat Kok 50 50Liew Mun Leong 100 100Sum Soon Lim 500 500
Redeemable preference shares of US$0.01 each fully paidPhilip Yeo Liat Kok 50 50Liew Mun Leong 100 100Sum Soon Lim 500 500
# The actual number of performance shares to be delivered will depend on the achievement of set targets over a three-year period. For achievements that arebelow 80% of the targets, no performance shares will be given while for achievements that exceed targets by more than 100%, more performance sharesthan the original award could be delivered up to a maximum of 200% of the original award.
Mr Lucien Wong Yuen Kuai’s interest in the ordinary shares of $0.50 each in Singapore Airlines Limited has changed from 50,000 asat 31 December 2003 to 60,000 as at 21 January 2004.
Save as aforesaid, there was no change in any of the above-mentioned directors’ interests in the Company and related corporationsbetween the end of the financial year and 21 January 2004.
Directors’ Interests in ContractsDuring the financial year, the directors’ interests in contracts relate to: (i) advisory fees from related corporations received by adirector of the Company in his capacity as Corporate Advisor to these companies for provision of strategic, organisational andcorporate finance advisory services; and (ii) the purchase of a residential unit in one of the Group’s projects in China by a director ofthe Company. In addition, professional fees as disclosed in the accompanying notes to the financial statements, were paid by theGroup to firms in which three other directors are members.
Except as disclosed, no other director has received or become entitled to receive a benefit by reason of a contract made by theCompany or a related corporation with the director, or with a firm of which he is a member or with a company in which he has asubstantial financial interest.
Share Options(a) CapitaLand Share Option Plan, Performance Share Plan and Restricted Stock Plan 2000
The Share Option Plan, Performance Share Plan and Restricted Stock Plan (collectively referred to as the “Share Plans”) of theCompany were approved and adopted by its members at an Extraordinary General Meeting held on 16 November 2000.
The Executive Resource and Compensation Committee of the Company has been designated as the Committee responsible forthe administration of the Share Plans. The Committee comprises the following members:
Mr Peter Seah Lim Huat (Chairman)Mr Hsuan OwyangSir Alan CockshawMr Lim Chin BengMr Jackson Peter Tai
The Share Option Plan is the basic share incentive scheme which is more widely applied across the Group whereas thePerformance Share Plan and Restricted Stock Plan apply only to key executives and the awards granted under these two Plansare only released or vested after achievement of pre-determined targets and/or after the satisfactory completion of time-basedservice conditions.
CapL Acc03 proof 04_OKp73-151 17/03/2004 06:41 PM Page 81
82
Cap
itaLa
ndA
R 0
3FO
CUS
BA
LAN
CE S
CALE
DIRECTORS’ REPORT year ended 31 December 2003
Share Options (cont’d)(a) CapitaLand Share Option Plan, Performance Share Plan and Restricted Stock Plan 2000 (cont’d)
Under the Share Option Plan, options are granted to eligible participants exercisable during a certain period and at a certainprice as set out below.
Under the Performance Share Plan, awards are granted. Awards represent the right of a participant to receive fully paid shares,their equivalent cash value or combinations thereof, free of charge, upon the participant achieving prescribed performancetarget(s). Awards are released once the Committee is satisfied that the prescribed target(s) have been achieved. There are novesting periods beyond the performance achievement periods.
Under the Restricted Stock Plan, awards granted vest only after the satisfactory completion of time-based service conditions orwhere the award is performance-related, after a further period of service beyond the performance target completion date(performance-based restricted awards). No minimum vesting periods are prescribed under the Restricted Stock Plan and thelength of the vesting period in respect of each award will be determined on a case-by-case basis. Performance-based restrictedawards differ from awards granted under the Performance Share Plan in that an extended vesting period is imposed beyond theperformance target completion date.
The principal terms of the Share Plans are:
• Plans Size and DurationThe total number of new shares over which options may be granted pursuant to the Share Option Plan, when added to thenumber of new shares issued and issuable in respect of all options granted thereunder and all awards granted under thePerformance Share Plan and Restricted Stock Plan, shall not exceed 15% of the issued share capital of the Company on theday preceding the relevant date of grant.
The Share Plans shall continue in force at the discretion of the Committee, subject to a maximum period of 10 yearscommencing on 16 November 2000, provided always that the Share Plans may continue beyond the above stipulated periodwith the approval of shareholders in general meeting and of any relevant authorities which may then be required.
Notwithstanding the expiry or termination of the Share Plans, any outstanding options held by and/or awards made toparticipants prior to such expiry or termination will continue to remain valid.
• Participants of the Share PlansIn respect of the Share Option Plan, the following persons shall be eligible to participate:
– Group Executives who have attained the age of 21 years and hold such rank as may be designated by the Committee fromtime to time;
– Non-Executive Directors who, in the opinion of the Committee, have contributed or will contribute to the success of theGroup; and
– Executives of Parent Group (that is Singapore Technologies Group) and Executives of Associated Companies (over whichthe Company has operational control) who have attained the age of 21 years and hold such rank as may be designated bythe Committee from time to time and who, in the opinion of the Committee, have contributed or will contribute to thesuccess of the Group.
In respect of the Performance Share Plan and Restricted Stock Plan, the following persons shall be eligible to participate:
– Group Executives who have attained the age of 21 years and hold such rank as may be designated by the Committee fromtime to time (including those Parent Group Executives and Non-Executive Directors of the Parent Group who meet theforegoing age and rank criteria and whose services have been seconded to a company within the Group and who shall beregarded as Group Executives for the purposes of the Performance Share Plan and Restricted Stock Plan);
– Non-Executive Directors (other than Non-Executive Directors of Parent Group) who, in the opinion of the Committee, havecontributed or will contribute to the success of the Group; and
– Executives of Associated Companies who have attained the age of 21 years and hold such rank as may be designated bythe Committee from time to time and who, in the opinion of the Committee, have contributed or will contribute to thesuccess of the Group.
Persons who are the Company’s controlling shareholders or their associates as defined in the SGX-ST Listing Manual are noteligible to participate in all the Share Plans.
CapL Acc03 proof 04_OKp73-151 17/03/2004 06:41 PM Page 82
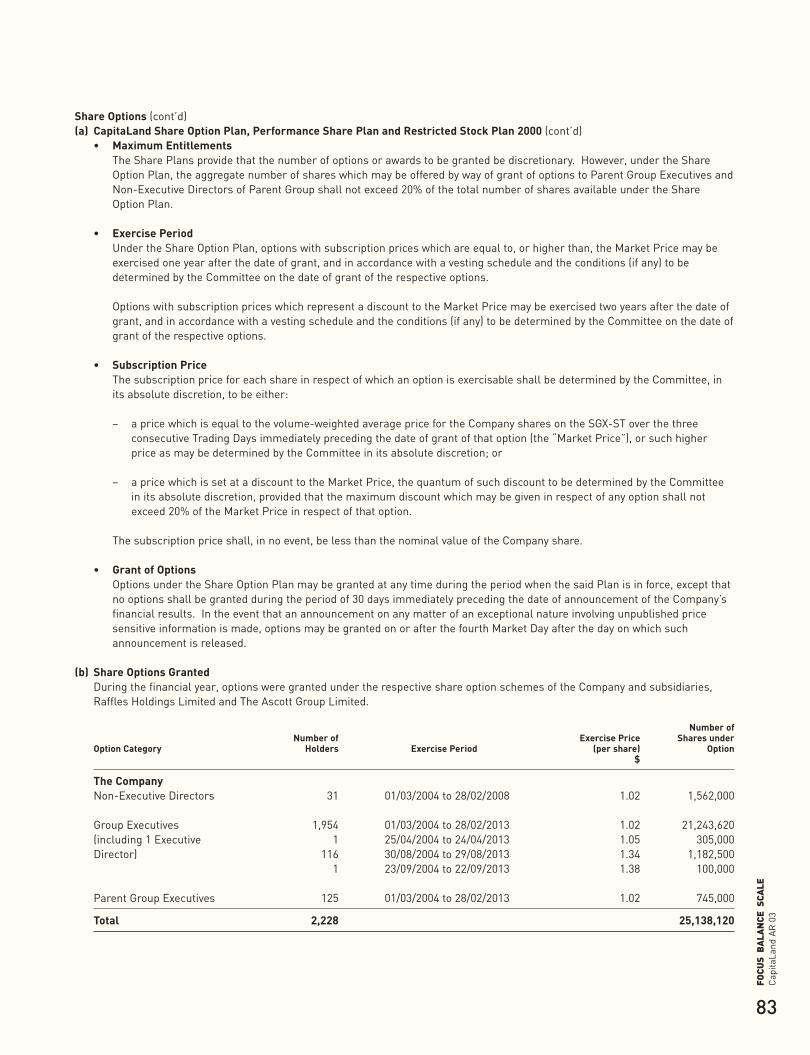
83
Cap
itaLa
ndA
R 0
3FO
CUS
BA
LAN
CE S
CALE
Share Options (cont’d)(a) CapitaLand Share Option Plan, Performance Share Plan and Restricted Stock Plan 2000 (cont’d)
• Maximum EntitlementsThe Share Plans provide that the number of options or awards to be granted be discretionary. However, under the ShareOption Plan, the aggregate number of shares which may be offered by way of grant of options to Parent Group Executives andNon-Executive Directors of Parent Group shall not exceed 20% of the total number of shares available under the ShareOption Plan.
• Exercise PeriodUnder the Share Option Plan, options with subscription prices which are equal to, or higher than, the Market Price may beexercised one year after the date of grant, and in accordance with a vesting schedule and the conditions (if any) to bedetermined by the Committee on the date of grant of the respective options.
Options with subscription prices which represent a discount to the Market Price may be exercised two years after the date ofgrant, and in accordance with a vesting schedule and the conditions (if any) to be determined by the Committee on the date ofgrant of the respective options.
• Subscription PriceThe subscription price for each share in respect of which an option is exercisable shall be determined by the Committee, inits absolute discretion, to be either:
– a price which is equal to the volume-weighted average price for the Company shares on the SGX-ST over the threeconsecutive Trading Days immediately preceding the date of grant of that option (the “Market Price”), or such higherprice as may be determined by the Committee in its absolute discretion; or
– a price which is set at a discount to the Market Price, the quantum of such discount to be determined by the Committeein its absolute discretion, provided that the maximum discount which may be given in respect of any option shall notexceed 20% of the Market Price in respect of that option.
The subscription price shall, in no event, be less than the nominal value of the Company share.
• Grant of OptionsOptions under the Share Option Plan may be granted at any time during the period when the said Plan is in force, except thatno options shall be granted during the period of 30 days immediately preceding the date of announcement of the Company’sfinancial results. In the event that an announcement on any matter of an exceptional nature involving unpublished pricesensitive information is made, options may be granted on or after the fourth Market Day after the day on which suchannouncement is released.
(b) Share Options Granted During the financial year, options were granted under the respective share option schemes of the Company and subsidiaries,Raffles Holdings Limited and The Ascott Group Limited.
Number ofNumber of Exercise Price Shares under
Option Category Holders Exercise Period (per share) Option$
The CompanyNon-Executive Directors 31 01/03/2004 to 28/02/2008 1.02 1,562,000
Group Executives 1,954 01/03/2004 to 28/02/2013 1.02 21,243,620(including 1 Executive 1 25/04/2004 to 24/04/2013 1.05 305,000Director) 116 30/08/2004 to 29/08/2013 1.34 1,182,500
1 23/09/2004 to 22/09/2013 1.38 100,000
Parent Group Executives 125 01/03/2004 to 28/02/2013 1.02 745,000
Total 2,228 25,138,120
CapL Acc03 proof 04_OKp73-151 17/03/2004 06:41 PM Page 83
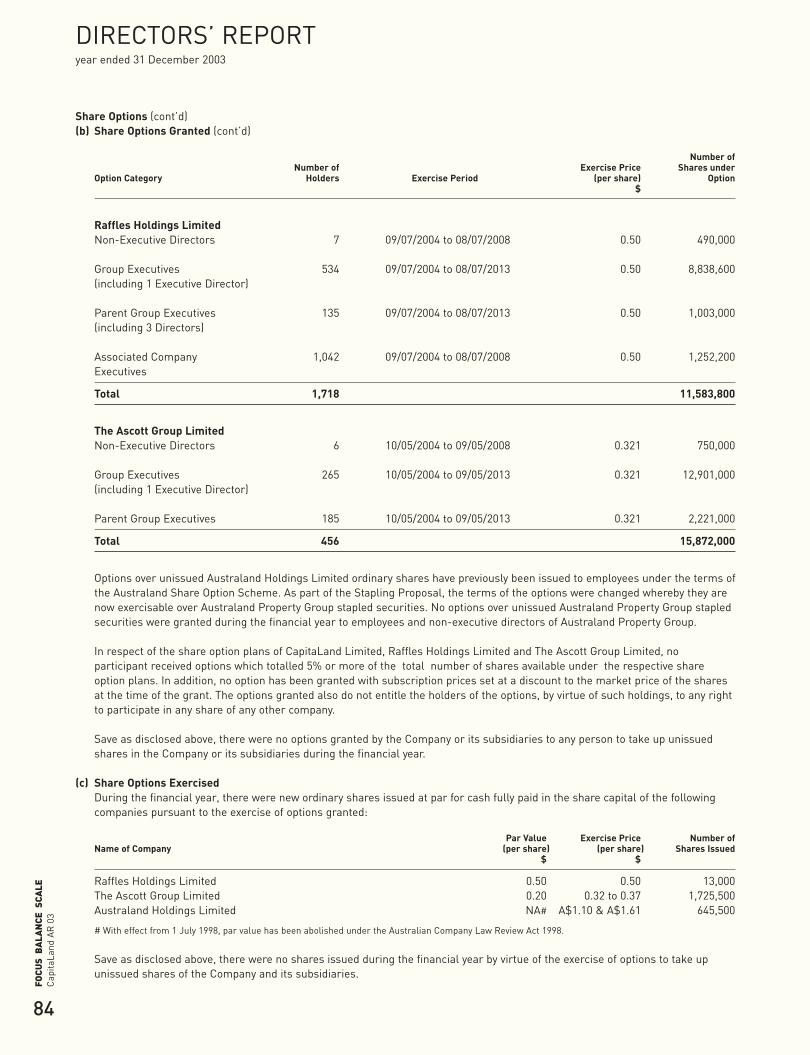
84
Cap
itaLa
ndA
R 0
3FO
CUS
BA
LAN
CE S
CALE
DIRECTORS’ REPORT year ended 31 December 2003
Share Options (cont’d)(b) Share Options Granted (cont’d)
Number ofNumber of Exercise Price Shares under
Option Category Holders Exercise Period (per share) Option$
Raffles Holdings LimitedNon-Executive Directors 7 09/07/2004 to 08/07/2008 0.50 490,000
Group Executives 534 09/07/2004 to 08/07/2013 0.50 8,838,600(including 1 Executive Director)
Parent Group Executives 135 09/07/2004 to 08/07/2013 0.50 1,003,000(including 3 Directors)
Associated Company 1,042 09/07/2004 to 08/07/2008 0.50 1,252,200Executives
Total 1,718 11,583,800
The Ascott Group LimitedNon-Executive Directors 6 10/05/2004 to 09/05/2008 0.321 750,000
Group Executives 265 10/05/2004 to 09/05/2013 0.321 12,901,000(including 1 Executive Director)
Parent Group Executives 185 10/05/2004 to 09/05/2013 0.321 2,221,000
Total 456 15,872,000
Options over unissued Australand Holdings Limited ordinary shares have previously been issued to employees under the terms ofthe Australand Share Option Scheme. As part of the Stapling Proposal, the terms of the options were changed whereby they arenow exercisable over Australand Property Group stapled securities. No options over unissued Australand Property Group stapledsecurities were granted during the financial year to employees and non-executive directors of Australand Property Group.
In respect of the share option plans of CapitaLand Limited, Raffles Holdings Limited and The Ascott Group Limited, noparticipant received options which totalled 5% or more of the total number of shares available under the respective shareoption plans. In addition, no option has been granted with subscription prices set at a discount to the market price of the sharesat the time of the grant. The options granted also do not entitle the holders of the options, by virtue of such holdings, to any rightto participate in any share of any other company.
Save as disclosed above, there were no options granted by the Company or its subsidiaries to any person to take up unissuedshares in the Company or its subsidiaries during the financial year.
(c) Share Options Exercised During the financial year, there were new ordinary shares issued at par for cash fully paid in the share capital of the followingcompanies pursuant to the exercise of options granted:
Par Value Exercise Price Number of Name of Company (per share) (per share) Shares Issued
$ $
Raffles Holdings Limited 0.50 0.50 13,000The Ascott Group Limited 0.20 0.32 to 0.37 1,725,500Australand Holdings Limited NA# A$1.10 & A$1.61 645,500
# With effect from 1 July 1998, par value has been abolished under the Australian Company Law Review Act 1998.
Save as disclosed above, there were no shares issued during the financial year by virtue of the exercise of options to take upunissued shares of the Company and its subsidiaries.
CapL Acc03 proof 04_OKp73-151 17/03/2004 06:41 PM Page 84
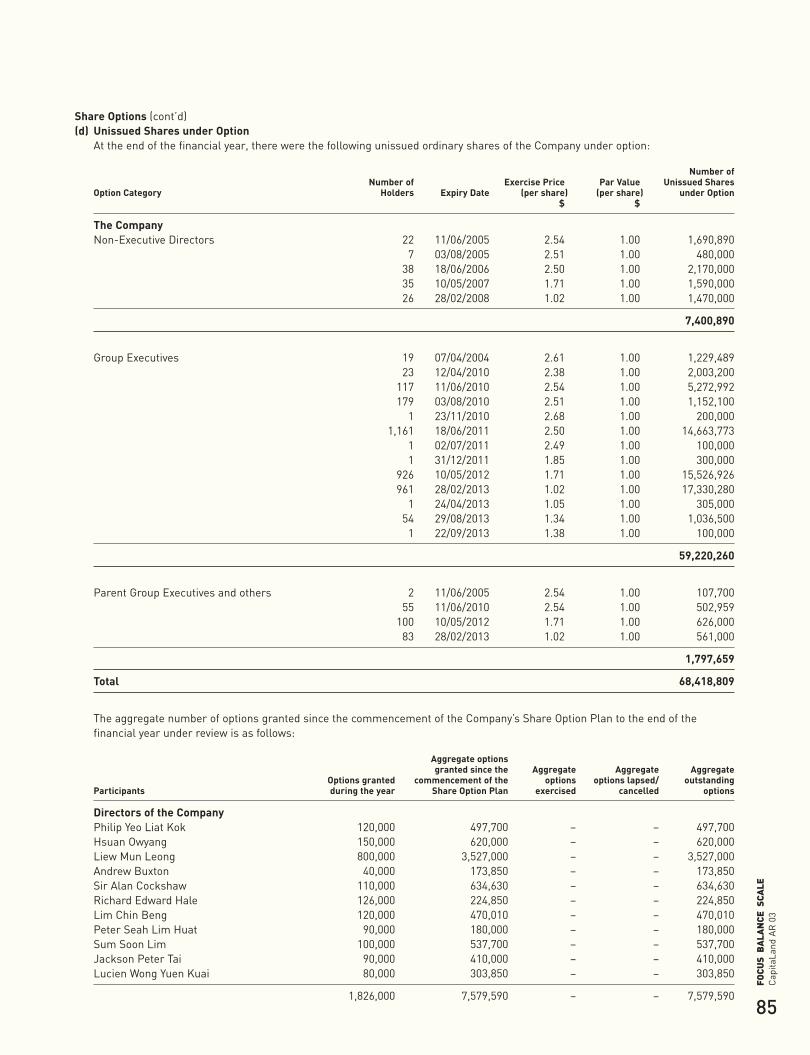
85
Cap
itaLa
ndA
R 0
3FO
CUS
BA
LAN
CE S
CALE
Share Options (cont’d)(d) Unissued Shares under Option
At the end of the financial year, there were the following unissued ordinary shares of the Company under option:
Number ofNumber of Exercise Price Par Value Unissued Shares
Option Category Holders Expiry Date (per share) (per share) under Option$ $
The CompanyNon-Executive Directors 22 11/06/2005 2.54 1.00 1,690,890
7 03/08/2005 2.51 1.00 480,00038 18/06/2006 2.50 1.00 2,170,00035 10/05/2007 1.71 1.00 1,590,00026 28/02/2008 1.02 1.00 1,470,000
7,400,890
Group Executives 19 07/04/2004 2.61 1.00 1,229,48923 12/04/2010 2.38 1.00 2,003,200
117 11/06/2010 2.54 1.00 5,272,992179 03/08/2010 2.51 1.00 1,152,100
1 23/11/2010 2.68 1.00 200,0001,161 18/06/2011 2.50 1.00 14,663,773
1 02/07/2011 2.49 1.00 100,0001 31/12/2011 1.85 1.00 300,000
926 10/05/2012 1.71 1.00 15,526,926961 28/02/2013 1.02 1.00 17,330,280
1 24/04/2013 1.05 1.00 305,00054 29/08/2013 1.34 1.00 1,036,500
1 22/09/2013 1.38 1.00 100,000
59,220,260
Parent Group Executives and others 2 11/06/2005 2.54 1.00 107,70055 11/06/2010 2.54 1.00 502,959
100 10/05/2012 1.71 1.00 626,00083 28/02/2013 1.02 1.00 561,000
1,797,659
Total 68,418,809
The aggregate number of options granted since the commencement of the Company’s Share Option Plan to the end of thefinancial year under review is as follows:
Aggregate options granted since the Aggregate Aggregate Aggregate
Options granted commencement of the options options lapsed/ outstandingParticipants during the year Share Option Plan exercised cancelled options
Directors of the CompanyPhilip Yeo Liat Kok 120,000 497,700 – – 497,700Hsuan Owyang 150,000 620,000 – – 620,000Liew Mun Leong 800,000 3,527,000 – – 3,527,000Andrew Buxton 40,000 173,850 – – 173,850Sir Alan Cockshaw 110,000 634,630 – – 634,630Richard Edward Hale 126,000 224,850 – – 224,850Lim Chin Beng 120,000 470,010 – – 470,010Peter Seah Lim Huat 90,000 180,000 – – 180,000Sum Soon Lim 100,000 537,700 – – 537,700Jackson Peter Tai 90,000 410,000 – – 410,000Lucien Wong Yuen Kuai 80,000 303,850 – – 303,850
1,826,000 7,579,590 – – 7,579,590
CapL Acc03 proof 04_OKp73-151 17/03/2004 06:41 PM Page 85
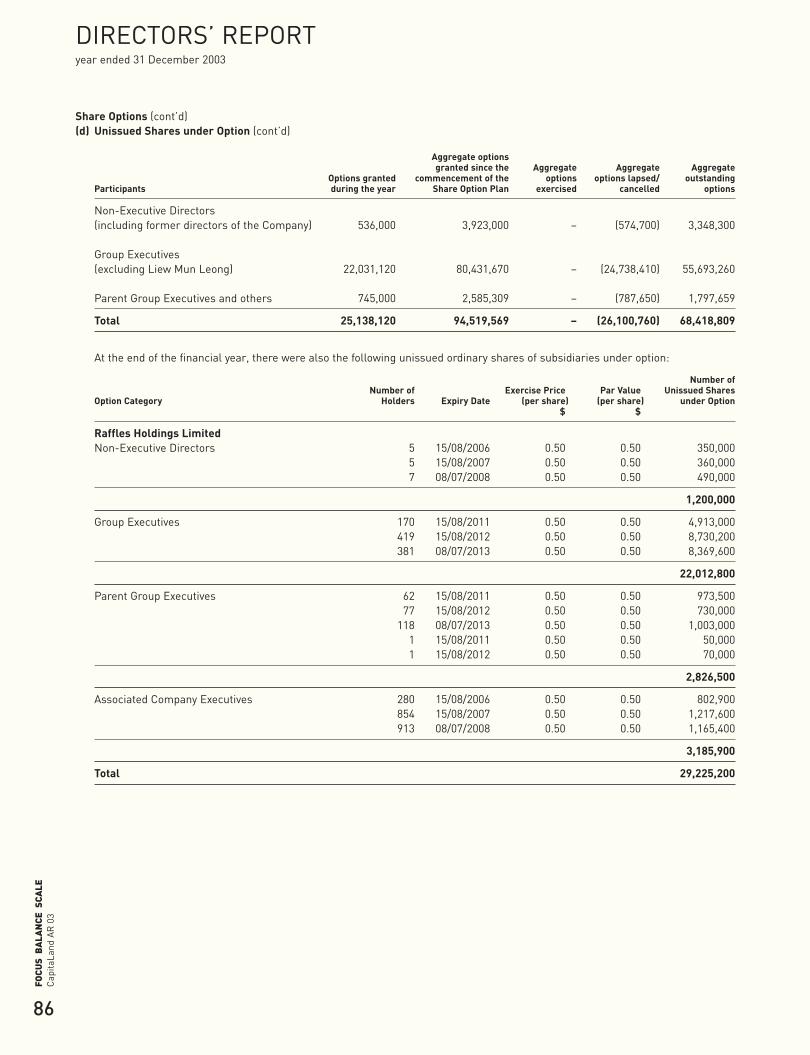
86
Cap
itaLa
ndA
R 0
3FO
CUS
BA
LAN
CE S
CALE
DIRECTORS’ REPORT year ended 31 December 2003
Share Options (cont’d)(d) Unissued Shares under Option (cont’d)
Aggregate options granted since the Aggregate Aggregate Aggregate
Options granted commencement of the options options lapsed/ outstandingParticipants during the year Share Option Plan exercised cancelled options
Non-Executive Directors(including former directors of the Company) 536,000 3,923,000 – (574,700) 3,348,300
Group Executives(excluding Liew Mun Leong) 22,031,120 80,431,670 – (24,738,410) 55,693,260
Parent Group Executives and others 745,000 2,585,309 – (787,650) 1,797,659
Total 25,138,120 94,519,569 – (26,100,760) 68,418,809
At the end of the financial year, there were also the following unissued ordinary shares of subsidiaries under option:
Number ofNumber of Exercise Price Par Value Unissued Shares
Option Category Holders Expiry Date (per share) (per share) under Option$ $
Raffles Holdings LimitedNon-Executive Directors 5 15/08/2006 0.50 0.50 350,000
5 15/08/2007 0.50 0.50 360,0007 08/07/2008 0.50 0.50 490,000
1,200,000
Group Executives 170 15/08/2011 0.50 0.50 4,913,000419 15/08/2012 0.50 0.50 8,730,200381 08/07/2013 0.50 0.50 8,369,600
22,012,800
Parent Group Executives 62 15/08/2011 0.50 0.50 973,50077 15/08/2012 0.50 0.50 730,000
118 08/07/2013 0.50 0.50 1,003,0001 15/08/2011 0.50 0.50 50,0001 15/08/2012 0.50 0.50 70,000
2,826,500
Associated Company Executives 280 15/08/2006 0.50 0.50 802,900854 15/08/2007 0.50 0.50 1,217,600913 08/07/2008 0.50 0.50 1,165,400
3,185,900
Total 29,225,200
CapL Acc03 proof 04_OKp73-151 17/03/2004 06:41 PM Page 86
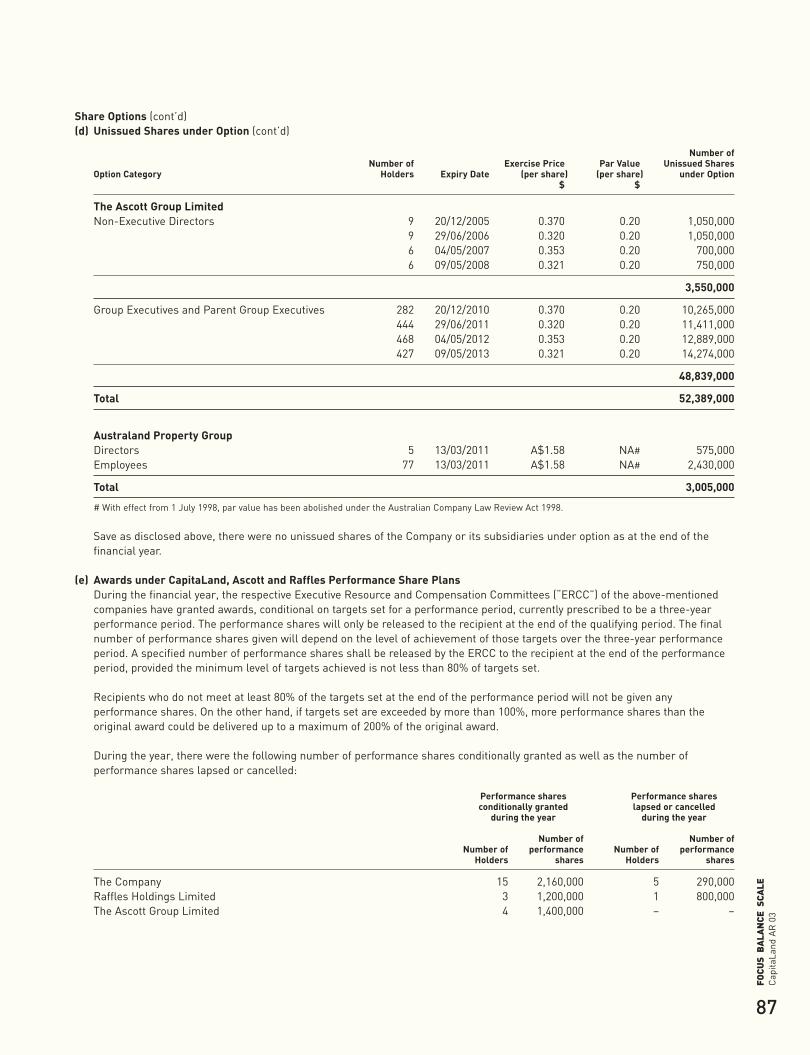
87
Cap
itaLa
ndA
R 0
3FO
CUS
BA
LAN
CE S
CALE
Share Options (cont’d)(d) Unissued Shares under Option (cont’d)
Number ofNumber of Exercise Price Par Value Unissued Shares
Option Category Holders Expiry Date (per share) (per share) under Option$ $
The Ascott Group LimitedNon-Executive Directors 9 20/12/2005 0.370 0.20 1,050,000
9 29/06/2006 0.320 0.20 1,050,0006 04/05/2007 0.353 0.20 700,0006 09/05/2008 0.321 0.20 750,000
3,550,000
Group Executives and Parent Group Executives 282 20/12/2010 0.370 0.20 10,265,000444 29/06/2011 0.320 0.20 11,411,000468 04/05/2012 0.353 0.20 12,889,000427 09/05/2013 0.321 0.20 14,274,000
48,839,000
Total 52,389,000
Australand Property GroupDirectors 5 13/03/2011 A$1.58 NA# 575,000Employees 77 13/03/2011 A$1.58 NA# 2,430,000
Total 3,005,000
# With effect from 1 July 1998, par value has been abolished under the Australian Company Law Review Act 1998.
Save as disclosed above, there were no unissued shares of the Company or its subsidiaries under option as at the end of thefinancial year.
(e) Awards under CapitaLand, Ascott and Raffles Performance Share PlansDuring the financial year, the respective Executive Resource and Compensation Committees (“ERCC”) of the above-mentionedcompanies have granted awards, conditional on targets set for a performance period, currently prescribed to be a three-yearperformance period. The performance shares will only be released to the recipient at the end of the qualifying period. The finalnumber of performance shares given will depend on the level of achievement of those targets over the three-year performanceperiod. A specified number of performance shares shall be released by the ERCC to the recipient at the end of the performanceperiod, provided the minimum level of targets achieved is not less than 80% of targets set.
Recipients who do not meet at least 80% of the targets set at the end of the performance period will not be given anyperformance shares. On the other hand, if targets set are exceeded by more than 100%, more performance shares than theoriginal award could be delivered up to a maximum of 200% of the original award.
During the year, there were the following number of performance shares conditionally granted as well as the number ofperformance shares lapsed or cancelled:
Performance shares Performance sharesconditionally granted lapsed or cancelled
during the year during the year
Number of Number ofNumber of performance Number of performance
Holders shares Holders shares
The Company 15 2,160,000 5 290,000Raffles Holdings Limited 3 1,200,000 1 800,000The Ascott Group Limited 4 1,400,000 – –
CapL Acc03 proof 04_OKp73-151 17/03/2004 06:41 PM Page 87
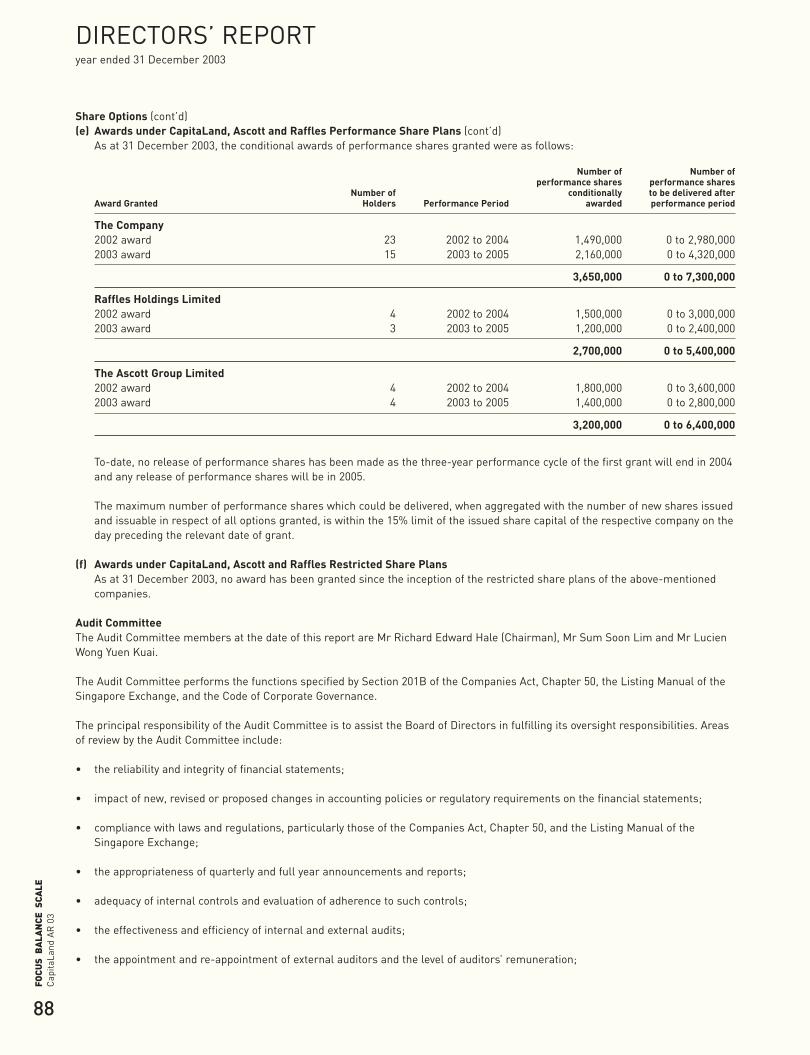
88
Cap
itaLa
ndA
R 0
3FO
CUS
BA
LAN
CE S
CALE
DIRECTORS’ REPORT year ended 31 December 2003
Share Options (cont’d)(e) Awards under CapitaLand, Ascott and Raffles Performance Share Plans (cont’d)
As at 31 December 2003, the conditional awards of performance shares granted were as follows:
Number of Number ofperformance shares performance shares
Number of conditionally to be delivered afterAward Granted Holders Performance Period awarded performance period
The Company2002 award 23 2002 to 2004 1,490,000 0 to 2,980,0002003 award 15 2003 to 2005 2,160,000 0 to 4,320,000
3,650,000 0 to 7,300,000
Raffles Holdings Limited2002 award 4 2002 to 2004 1,500,000 0 to 3,000,0002003 award 3 2003 to 2005 1,200,000 0 to 2,400,000
2,700,000 0 to 5,400,000
The Ascott Group Limited2002 award 4 2002 to 2004 1,800,000 0 to 3,600,0002003 award 4 2003 to 2005 1,400,000 0 to 2,800,000
3,200,000 0 to 6,400,000
To-date, no release of performance shares has been made as the three-year performance cycle of the first grant will end in 2004and any release of performance shares will be in 2005.
The maximum number of performance shares which could be delivered, when aggregated with the number of new shares issuedand issuable in respect of all options granted, is within the 15% limit of the issued share capital of the respective company on theday preceding the relevant date of grant.
(f) Awards under CapitaLand, Ascott and Raffles Restricted Share PlansAs at 31 December 2003, no award has been granted since the inception of the restricted share plans of the above-mentionedcompanies.
Audit CommitteeThe Audit Committee members at the date of this report are Mr Richard Edward Hale (Chairman), Mr Sum Soon Lim and Mr LucienWong Yuen Kuai.
The Audit Committee performs the functions specified by Section 201B of the Companies Act, Chapter 50, the Listing Manual of theSingapore Exchange, and the Code of Corporate Governance.
The principal responsibility of the Audit Committee is to assist the Board of Directors in fulfilling its oversight responsibilities. Areasof review by the Audit Committee include:
• the reliability and integrity of financial statements;
• impact of new, revised or proposed changes in accounting policies or regulatory requirements on the financial statements;
• compliance with laws and regulations, particularly those of the Companies Act, Chapter 50, and the Listing Manual of theSingapore Exchange;
• the appropriateness of quarterly and full year announcements and reports;
• adequacy of internal controls and evaluation of adherence to such controls;
• the effectiveness and efficiency of internal and external audits;
• the appointment and re-appointment of external auditors and the level of auditors’ remuneration;
CapL Acc03 proof 04_OKp73-151 17/03/2004 06:41 PM Page 88
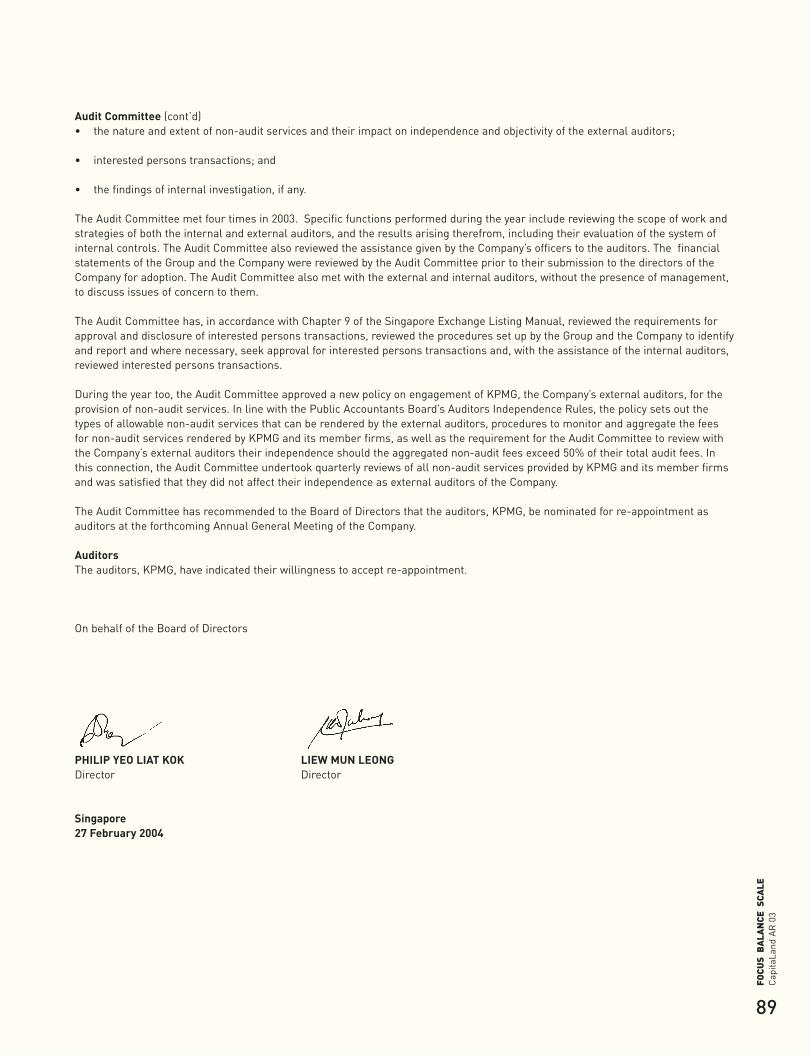
89
Cap
itaLa
ndA
R 0
3FO
CUS
BA
LAN
CE S
CALE
Audit Committee (cont’d)• the nature and extent of non-audit services and their impact on independence and objectivity of the external auditors;
• interested persons transactions; and
• the findings of internal investigation, if any.
The Audit Committee met four times in 2003. Specific functions performed during the year include reviewing the scope of work andstrategies of both the internal and external auditors, and the results arising therefrom, including their evaluation of the system ofinternal controls. The Audit Committee also reviewed the assistance given by the Company’s officers to the auditors. The financialstatements of the Group and the Company were reviewed by the Audit Committee prior to their submission to the directors of theCompany for adoption. The Audit Committee also met with the external and internal auditors, without the presence of management,to discuss issues of concern to them.
The Audit Committee has, in accordance with Chapter 9 of the Singapore Exchange Listing Manual, reviewed the requirements forapproval and disclosure of interested persons transactions, reviewed the procedures set up by the Group and the Company to identifyand report and where necessary, seek approval for interested persons transactions and, with the assistance of the internal auditors,reviewed interested persons transactions.
During the year too, the Audit Committee approved a new policy on engagement of KPMG, the Company’s external auditors, for theprovision of non-audit services. In line with the Public Accountants Board’s Auditors Independence Rules, the policy sets out thetypes of allowable non-audit services that can be rendered by the external auditors, procedures to monitor and aggregate the feesfor non-audit services rendered by KPMG and its member firms, as well as the requirement for the Audit Committee to review withthe Company’s external auditors their independence should the aggregated non-audit fees exceed 50% of their total audit fees. Inthis connection, the Audit Committee undertook quarterly reviews of all non-audit services provided by KPMG and its member firmsand was satisfied that they did not affect their independence as external auditors of the Company.
The Audit Committee has recommended to the Board of Directors that the auditors, KPMG, be nominated for re-appointment asauditors at the forthcoming Annual General Meeting of the Company.
AuditorsThe auditors, KPMG, have indicated their willingness to accept re-appointment.
On behalf of the Board of Directors
PHILIP YEO LIAT KOK LIEW MUN LEONGDirector Director
Singapore27 February 2004
CapL Acc03 proof 04_OKp73-151 17/03/2004 06:41 PM Page 89

90
Cap
itaLa
ndA
R 0
3FO
CUS
BA
LAN
CE S
CALE
STATEMENT BY DIRECTORS year ended 31 December 2003
In our opinion:
(a) the financial statements set out on pages 92 to 151 are drawn up so as to give a true and fair view of the state of affairs of theGroup and of the Company as at 31 December 2003 and of the results and changes in equity of the Group and of the Companyand of the cash flows of the Group for the year ended on that date; and
(b) at the date of this statement, there are reasonable grounds to believe that the Company will be able to pay its debts as and whenthey fall due.
The Board of Directors has, on the date of this statement, authorised these financial statements for issue.
On behalf of the Board of Directors
PHILIP YEO LIAT KOK LIEW MUN LEONGDirector Director
Singapore27 February 2004
CapL Acc03 proof 04_OKp73-151 17/03/2004 06:41 PM Page 90
91
Cap
itaLa
ndA
R 0
3FO
CUS
BA
LAN
CE S
CALE
REPORT OF THE AUDITORS to the Members of CapitaLand Limited
We have audited the consolidated financial statements of the Group and the financial statements of the Company for the year ended31 December 2003 as set out on pages 92 to 151. These financial statements are the responsibility of the Company’s directors. Ourresponsibility is to express an opinion on these financial statements based on our audit.
We conducted our audit in accordance with Singapore Standards on Auditing. Those Standards require that we plan and perform theaudit to obtain reasonable assurance about whether the financial statements are free of material misstatement. An audit includesexamining, on a test basis, evidence supporting the amounts and disclosures in the financial statements. An audit also includesassessing the accounting principles used and significant estimates made by the directors, as well as evaluating the overall financialstatement presentation. We believe that our audit provides a reasonable basis for our opinion.
In our opinion:
(a) the financial statements are properly drawn up in accordance with the provisions of the Companies Act, Chapter 50 (the “Act”)and Singapore Financial Reporting Standards to give a true and fair view of the state of affairs of the Group and of the Companyas at 31 December 2003 and of the results and changes in equity of the Group and of the Company and of the cash flows of theGroup for the year ended on that date; and
(b) the accounting and other records (excluding registers) required by the Act to be kept by the Company and by those subsidiariesincorporated in Singapore of which we are the auditors have been properly kept in accordance with the provisions of the Act.
We have considered the financial statements and auditors’ reports of all the subsidiaries of which we have not acted as auditors, andalso considered the financial statements of those subsidiaries which are not required by the laws of their countries of incorporationto be audited, being financial statements that have been included in the consolidated financial statements of the Group. The namesof these subsidiaries are stated in note 46 to the financial statements.
We are satisfied that the financial statements of the subsidiaries that have been consolidated with the financial statements of theCompany are in form and content appropriate and proper for the purposes of the preparation of the consolidated financialstatements of the Group and we have received satisfactory information and explanations as required by us for those purposes.
The auditors’ reports on the financial statements of the subsidiaries were not subject to any qualification, and in respect of thesubsidiaries incorporated in Singapore, did not include any comment made under Section 207(3) of the Act.
KPMGCertified Public Accountants
Singapore27 February 2004
CapL Acc03 proof 04_OKp73-151 17/03/2004 06:41 PM Page 91
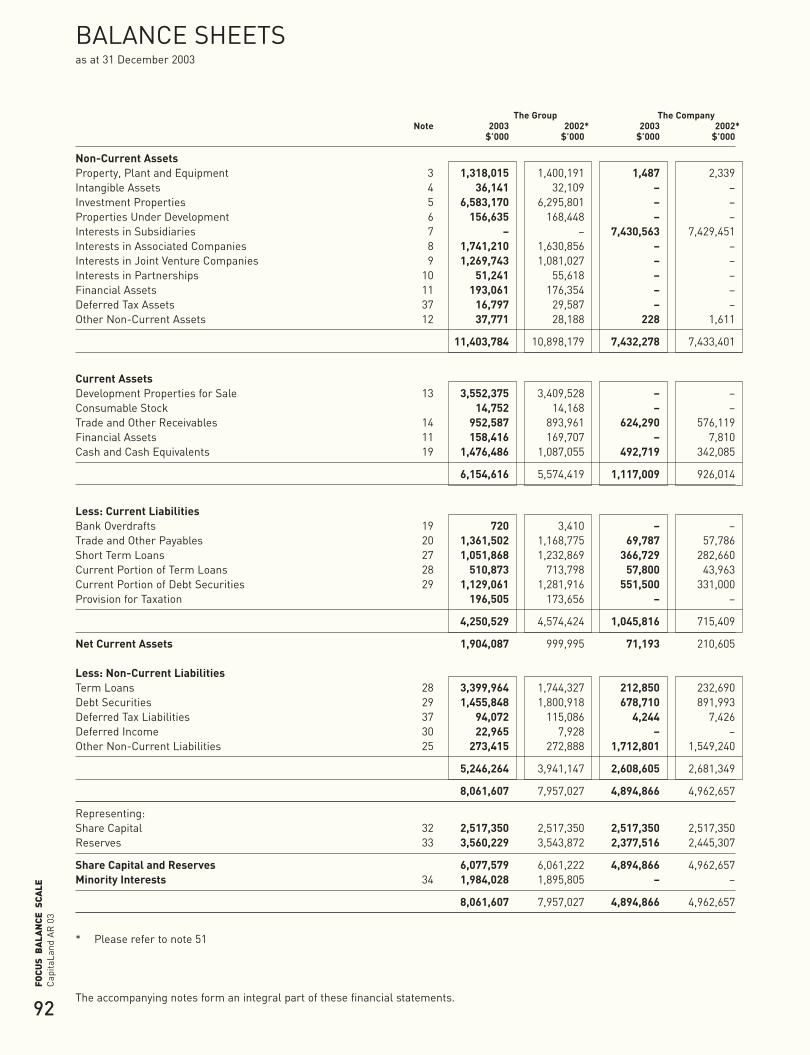
92
Cap
itaLa
ndA
R 0
3FO
CUS
BA
LAN
CE S
CALE
BALANCE SHEETS as at 31 December 2003
The Group The CompanyNote 2003 2002* 2003 2002*
$’000 $’000 $’000 $’000
Non-Current AssetsProperty, Plant and Equipment 3 1,318,015 1,400,191 1,487 2,339Intangible Assets 4 36,141 32,109 – –Investment Properties 5 6,583,170 6,295,801 – –Properties Under Development 6 156,635 168,448 – –Interests in Subsidiaries 7 – – 7,430,563 7,429,451Interests in Associated Companies 8 1,741,210 1,630,856 – –Interests in Joint Venture Companies 9 1,269,743 1,081,027 – –Interests in Partnerships 10 51,241 55,618 – –Financial Assets 11 193,061 176,354 – –Deferred Tax Assets 37 16,797 29,587 – –Other Non-Current Assets 12 37,771 28,188 228 1,611
11,403,784 10,898,179 7,432,278 7,433,401
Current AssetsDevelopment Properties for Sale 13 3,552,375 3,409,528 – –Consumable Stock 14,752 14,168 – –Trade and Other Receivables 14 952,587 893,961 624,290 576,119Financial Assets 11 158,416 169,707 – 7,810Cash and Cash Equivalents 19 1,476,486 1,087,055 492,719 342,085
6,154,616 5,574,419 1,117,009 926,014
Less: Current LiabilitiesBank Overdrafts 19 720 3,410 – –Trade and Other Payables 20 1,361,502 1,168,775 69,787 57,786Short Term Loans 27 1,051,868 1,232,869 366,729 282,660Current Portion of Term Loans 28 510,873 713,798 57,800 43,963Current Portion of Debt Securities 29 1,129,061 1,281,916 551,500 331,000Provision for Taxation 196,505 173,656 – –
4,250,529 4,574,424 1,045,816 715,409
Net Current Assets 1,904,087 999,995 71,193 210,605
Less: Non-Current LiabilitiesTerm Loans 28 3,399,964 1,744,327 212,850 232,690Debt Securities 29 1,455,848 1,800,918 678,710 891,993Deferred Tax Liabilities 37 94,072 115,086 4,244 7,426Deferred Income 30 22,965 7,928 – –Other Non-Current Liabilities 25 273,415 272,888 1,712,801 1,549,240
5,246,264 3,941,147 2,608,605 2,681,349
8,061,607 7,957,027 4,894,866 4,962,657
Representing:Share Capital 32 2,517,350 2,517,350 2,517,350 2,517,350Reserves 33 3,560,229 3,543,872 2,377,516 2,445,307
Share Capital and Reserves 6,077,579 6,061,222 4,894,866 4,962,657Minority Interests 34 1,984,028 1,895,805 – –
8,061,607 7,957,027 4,894,866 4,962,657
* Please refer to note 51
The accompanying notes form an integral part of these financial statements.
CapL Acc03 proof 04_OKp73-151 17/03/2004 06:41 PM Page 92
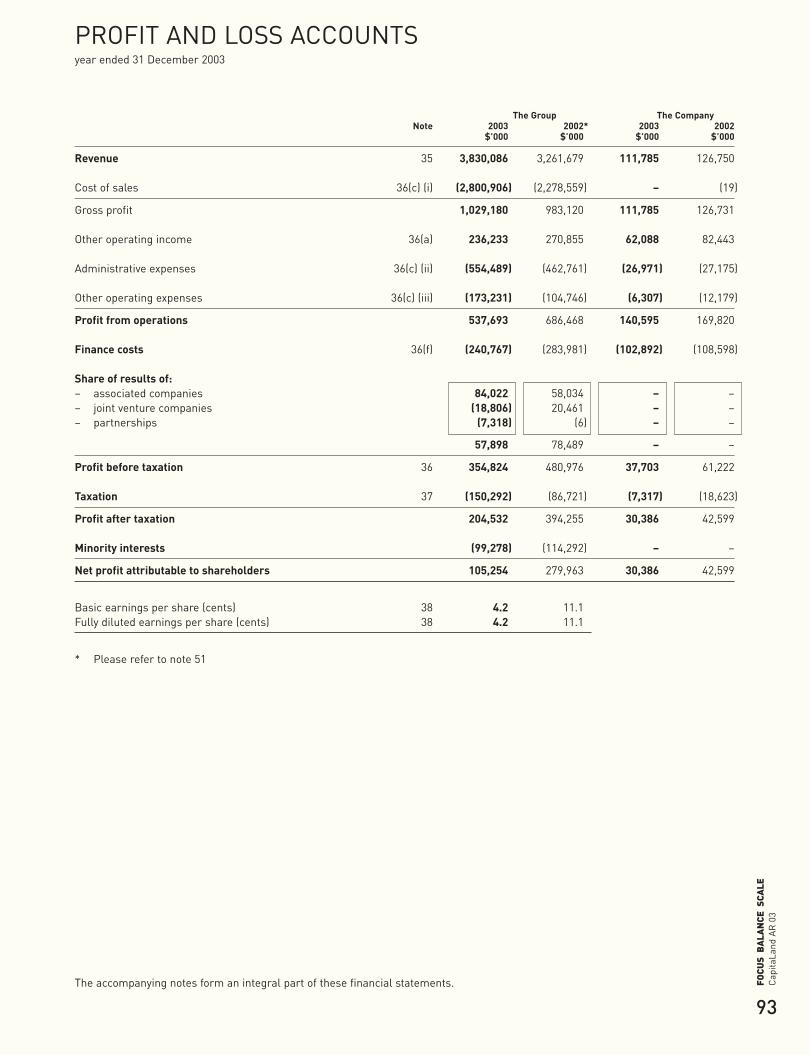
93
Cap
itaLa
ndA
R 0
3FO
CUS
BA
LAN
CE S
CALE
PROFIT AND LOSS ACCOUNTS year ended 31 December 2003
The Group The CompanyNote 2003 2002* 2003 2002
$’000 $’000 $’000 $’000
Revenue 35 3,830,086 3,261,679 111,785 126,750
Cost of sales 36(c) (i) (2,800,906) (2,278,559) – (19)
Gross profit 1,029,180 983,120 111,785 126,731
Other operating income 36(a) 236,233 270,855 62,088 82,443
Administrative expenses 36(c) (ii) (554,489) (462,761) (26,971) (27,175)
Other operating expenses 36(c) (iii) (173,231) (104,746) (6,307) (12,179)
Profit from operations 537,693 686,468 140,595 169,820
Finance costs 36(f) (240,767) (283,981) (102,892) (108,598)
Share of results of:– associated companies 84,022 58,034 – –– joint venture companies (18,806) 20,461 – –– partnerships (7,318) (6) – –
57,898 78,489 – –
Profit before taxation 36 354,824 480,976 37,703 61,222
Taxation 37 (150,292) (86,721) (7,317) (18,623)
Profit after taxation 204,532 394,255 30,386 42,599
Minority interests (99,278) (114,292) – –
Net profit attributable to shareholders 105,254 279,963 30,386 42,599
Basic earnings per share (cents) 38 4.2 11.1Fully diluted earnings per share (cents) 38 4.2 11.1
* Please refer to note 51
The accompanying notes form an integral part of these financial statements.
CapL Acc03 proof 04_OKp73-151 17/03/2004 06:41 PM Page 93

94
Cap
itaLa
ndA
R 0
3FO
CUS
BA
LAN
CE S
CALE
STATEMENTS OF CHANGES IN EQUITY year ended 31 December 2003
The Group The Company2003 2002* 2003 2002
$’000 $’000 $’000 $’000
Share capitalAt 1 January and 31 December 2,517,350 2,517,350 2,517,350 2,517,350
Share premiumAt 1 January and 31 December 3,429,376 3,429,376 2,161,144 2,161,144
Capital reserveAt 1 January, as previously reported 121,093 94,173 30,381 –Effect of adopting INT FRS-19 (15) (15) – –
At 1 January, restated 121,078 94,158 30,381 –Transfer to revenue reserves (19,275) (3,457) – –Convertible bonds – 30,381 – 30,381Others 31 (4) – –
At 31 December 101,834 121,078 30,381 30,381
Capital redemption reserveAt 1 January 3,867 3,867 313 313Transfer from revenue reserves on redemption of redeemable preference
shares by subsidiaries and joint venture companies 41 – – –
At 31 December 3,908 3,867 313 313
Revaluation reserveAt 1 January, as previously reported 41,233 340,503 – –Effect of change in accounting policy 41,450 35,955 – –
At 1 January, restated 82,683 376,458 – –Net deficit on revaluation of investment properties/
properties under development (92,123) (272,968) – –Realised revaluation reserve transferred to profit and
loss account (13,434) (129,408) – –Revaluation surplus on an investment property reclassed from
property, plant and equipment held by an associated company – 110,939 – –Share of associated and joint venture companies’
revaluation deficit (49,068) (81,288) – –Net deficit on revaluation of investment properties/properties
under development charged to profit and loss account 161,781 78,950 – –
At 31 December 89,839 82,683 – –
Foreign currency translation reserveAt 1 January, as previously reported (287) (12,313) – –Effect of change in accounting policy (192) 332 – –Effect of adopting INT FRS-19 (22,712) (22,947) – –
At 1 January, restated (23,191) (34,928) – –Exchange differences arising on– consolidation of foreign entities and translation of foreign
currency loans 40,648 4,844 – –– transfer to profit and loss account on dilution/disposal of subsidiaries
and associated companies (8,593) 6,893 – –
At 31 December 8,864 (23,191) – –
CapL Acc03 proof 04_OKp73-151 17/03/2004 06:41 PM Page 94

95
Cap
itaLa
ndA
R 0
3FO
CUS
BA
LAN
CE S
CALE
The Group The Company2003 2002* 2003 2002
Note $’000 $’000 $’000 $’000
Reserve on consolidationAt 1 January, as previously reported 17,502 6,528 – –Effect of change in accounting policy (2,147) (2,147) – –
At 1 January, restated 15,355 4,381 – –Transfer to profit and loss account on disposal of subsidiaries/
discontinuance of business (27,636) 10,974 – –
At 31 December (12,281) 15,355 – –
Accumulated (losses)/profitsAt 1 January, as previously reported (140,924) (373,555) 253,469 269,776Effect of change in accounting policy 35,208 46,115 – –Effect of adopting INT FRS-19 20,420 19,718 – –
At 1 January, restated (85,296) (307,722) 253,469 269,776Net profit for the year, restated 39 105,254 279,963 30,386 42,599Dividends 40 (98,177) (58,906) (98,177) (58,906)Disposal/Dilution of interest in subsidiary (2,326) (2,088) – –Transfer from capital reserve 19,275 3,457 – –Transfer to capital redemption reserve (41) – – –
At 31 December (61,311) (85,296) 185,678 253,469
Total capital and reserves 6,077,579 6,061,222 4,894,866 4,962,657
* Please refer to note 51
The accompanying notes form an integral part of these financial statements.
CapL Acc03 proof 04_OKp73-151 17/03/2004 06:41 PM Page 95
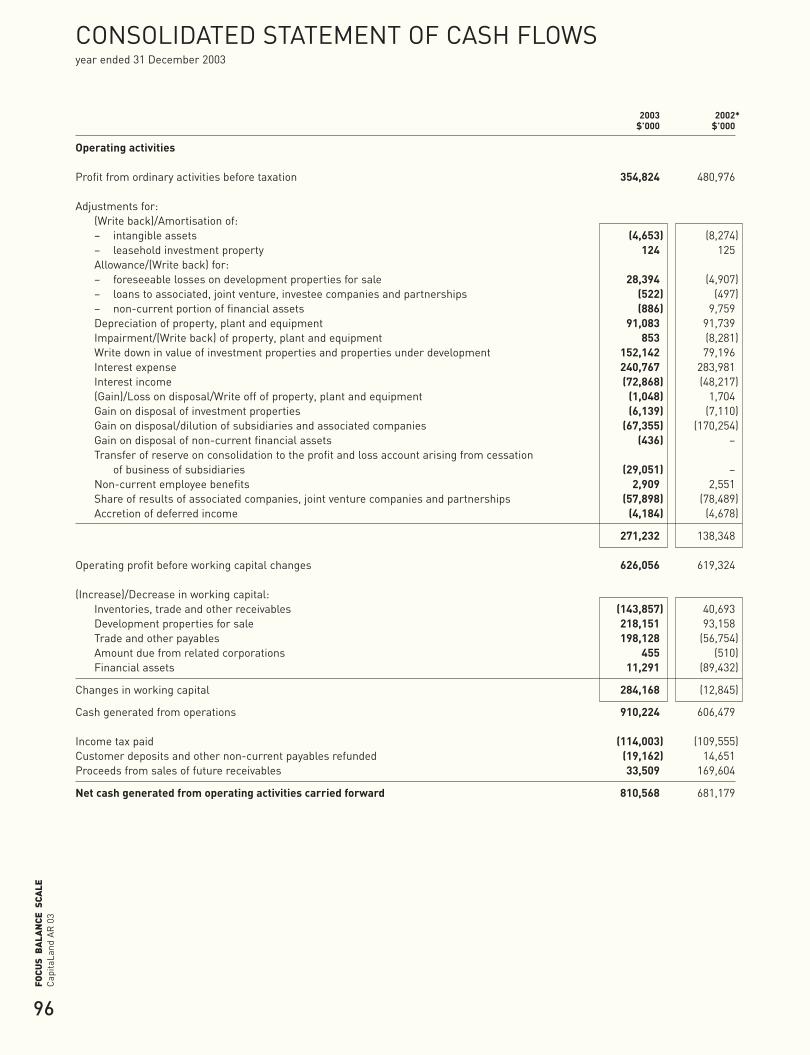
96
Cap
itaLa
ndA
R 0
3FO
CUS
BA
LAN
CE S
CALE
CONSOLIDATED STATEMENT OF CASH FLOWS year ended 31 December 2003
2003 2002*$’000 $’000
Operating activities
Profit from ordinary activities before taxation 354,824 480,976
Adjustments for:(Write back)/Amortisation of:– intangible assets (4,653) (8,274)– leasehold investment property 124 125Allowance/(Write back) for:– foreseeable losses on development properties for sale 28,394 (4,907)– loans to associated, joint venture, investee companies and partnerships (522) (497)– non-current portion of financial assets (886) 9,759Depreciation of property, plant and equipment 91,083 91,739Impairment/(Write back) of property, plant and equipment 853 (8,281)Write down in value of investment properties and properties under development 152,142 79,196Interest expense 240,767 283,981Interest income (72,868) (48,217)(Gain)/Loss on disposal/Write off of property, plant and equipment (1,048) 1,704Gain on disposal of investment properties (6,139) (7,110)Gain on disposal/dilution of subsidiaries and associated companies (67,355) (170,254)Gain on disposal of non-current financial assets (436) –Transfer of reserve on consolidation to the profit and loss account arising from cessation
of business of subsidiaries (29,051) –Non-current employee benefits 2,909 2,551Share of results of associated companies, joint venture companies and partnerships (57,898) (78,489)Accretion of deferred income (4,184) (4,678)
271,232 138,348
Operating profit before working capital changes 626,056 619,324
(Increase)/Decrease in working capital:Inventories, trade and other receivables (143,857) 40,693Development properties for sale 218,151 93,158Trade and other payables 198,128 (56,754)Amount due from related corporations 455 (510)Financial assets 11,291 (89,432)
Changes in working capital 284,168 (12,845)
Cash generated from operations 910,224 606,479
Income tax paid (114,003) (109,555)Customer deposits and other non-current payables refunded (19,162) 14,651Proceeds from sales of future receivables 33,509 169,604
Net cash generated from operating activities carried forward 810,568 681,179
CapL Acc03 proof 04_OKp73-151 17/03/2004 06:41 PM Page 96

97
Cap
itaLa
ndA
R 0
3FO
CUS
BA
LAN
CE S
CALE
Note 2003 2002*$’000 $’000
Net cash generated from operating activities brought forward 810,568 681,179
Investing activitiesProceeds from disposal of property, plant and equipment 39,527 19,950Purchase of property, plant and equipment (53,130) (88,776)(Increase)/Decrease in associated companies, joint venture companies and partnerships (368,829) 80,057Acquisition of investment properties and property under development (132,805) (81,794)(Increase)/Decrease in amounts owing by investee companies and other non-current receivables (30,146) 23Dividends received from associated companies, joint venture companies and partnerships 69,473 41,033Proceeds from disposal of investment properties and properties under development 37,926 20,149Proceeds from disposal of non-current financial assets 4,576 14,291Acquisition of remaining interest in a subsidiary (53,150) –Disposal of subsidiaries (net) 41 60,894 409,886Interest income received 63,823 19,084
Net cash (used in)/generated from investing activities (361,841) 433,903
Financing activitiesInterest expense paid (292,961) (338,390)(Repayment of)/Proceeds from loans from related corporations (26,647) 3,825(Repayment of)/Proceeds from loans from minority shareholders (69,739) 20,133Contribution from minority shareholders 134,425 61,568Proceeds from term loans 2,297,910 1,185,729Repayment of term loans (1,473,379) (2,030,074)Proceeds from debt securities 794,334 813,317Repayment of debt securities (1,271,750) (1,496,049)Dividends paid to minority shareholders (61,185) (113,979)Dividends paid to shareholders (98,177) (58,906)
Net cash used in financing activities (67,169) (1,952,826)
Net increase/(decrease) in Cash and Cash Equivalents 381,558 (837,744)Cash and Cash Equivalents at beginning of year 1,083,645 1,909,363Effect of Exchange Rate Changes on Cash Balances Held in Foreign Currencies 10,563 12,026
Cash and Cash Equivalents at end of year 19 1,475,766 1,083,645
* Please refer to note 51
The accompanying notes form an integral part of these financial statements.
CapL Acc03 proof 04_OKp73-151 17/03/2004 06:41 PM Page 97

98
Cap
itaLa
ndA
R 0
3FO
CUS
BA
LAN
CE S
CALE
NOTES TO THE FINANCIAL STATEMENTS year ended 31 December 2003
These notes form an integral part of the financial statements.
The financial statements were authorised for issue by the directors on 27 February 2004.
1. Domicile and ActivitiesCapitaLand Limited (the Company) is incorporated in the Republic of Singapore and has its registered office at 168, RobinsonRoad, #30-01, Capital Tower, Singapore 068912.
The principal activities of the Company during the financial year are those relating to investment holding and consultancyservices as well as the corporate headquarters which gives direction, provides management support services and integrates theactivities of its subsidiaries.
The principal activities of the significant subsidiaries are set out in note 46 to the accompanying financial statements.
The consolidated financial statements relate to the Company and its subsidiaries (referred to as the Group) and the Group’sinterests in associated companies, joint ventures and partnerships.
2. Summary of Significant Accounting Policies(a) Basis of preparation
The financial statements are prepared in accordance with Singapore Financial Reporting Standards (FRS) including relatedInterpretations promulgated by the Council on Corporate Disclosure and Governance.
The financial statements were previously prepared in accordance with Singapore Statements of Accounting Standard (SAS).There is no effect on the financial statements due to the transition from SAS to FRS.
The financial statements, which are expressed in Singapore dollars, are prepared on the historical cost basis except thatinvestment properties are stated at valuation and certain investments in securities are stated at market value.
The financial statement have been prepared in compliance with the same accounting policies and methods of computationadopted in the financial statement of the last financial year, except where new/revised accounting standards and changes inaccounting policies became effective for 2003 as detailed in note 39.
(b) Measurement currencyItems included in the financial statements of each entity in the Group are measured using the currency that best reflects theeconomic substance of the underlying events and circumstances relevant to that entity (the “measurement currency”). Theconsolidated financial statements and the financial statements of the Company are presented in Singapore dollars, which isthe measurement currency of the Company.
(c) Basis of consolidation(i) A subsidiary is a company in which the Group, directly or indirectly, holds more than half of the issued share capital, or
controls more than half of the voting power, or controls the composition of the board of directors. The consolidatedfinancial statements include the financial statements of the Company and its subsidiaries made up to the end of thefinancial year. All significant inter-company transactions are eliminated on consolidation.
(ii) For acquisition of subsidiaries which meet the criteria for merger relief under Section 69B of the Companies Act, Chapter50 and Singapore Financial Reporting Standard No. 22 “Business Combinations”, the assets, liabilities and results areaccounted for under the pooling of interests method. In the year of the merger, the prior year comparative figures of theGroup are restated as if the companies acquired have always been members of the Group.
For acquisition of subsidiaries which are accounted for under the purchase method, fair values are assigned to theassets, principally investment properties, land and buildings, owned by the subsidiaries at the date of acquisition asdetermined by the directors based on independent professional valuations. Any excess or deficiency of the purchaseconsideration over the fair values assigned to the net assets acquired is accounted for as goodwill or negative goodwillunder Note 2(f) “Intangible Assets” below.
(iii) The results of subsidiaries acquired and disposed of during the financial year are included in the consolidated financialstatements from the effective date of acquisition and up to the effective date of disposal respectively.
(iv) Where necessary, accounting policies for subsidiaries have been changed to be consistent with the policies adopted bythe Group.
CapL Acc03 proof 04_OKp73-151 17/03/2004 06:41 PM Page 98

99
Cap
itaLa
ndA
R 0
3FO
CUS
BA
LAN
CE S
CALE
2. Summary of Significant Accounting Policies (cont’d)(d) Foreign currencies
(i) Foreign currency transactionsMonetary assets and liabilities in foreign currencies, except for foreign currency liabilities hedged by forward exchangecontracts, are translated into Singapore dollars at rates of exchange approximate to those ruling at the balance sheetdate. Foreign currency assets and liabilities hedged by forward exchange contracts are translated into Singapore dollarsat the contracted forward exchange rates. Transactions in foreign currencies are translated at rates ruling on transactiondates. Translation differences are included in the profit and loss account, except:
• Where foreign currency loans provide an effective hedge against the net investment in foreign entities, exchangedifferences arising on the loans are recognised directly in equity until disposal of the investment.
• Where monetary items in substance form part of the Group’s net investment in the foreign entities, exchangedifferences arising on such monetary items are recognised directly in equity until disposal of the investment.
(ii) Foreign entitiesThe assets and liabilities of foreign entities are translated to Singapore dollars at the rates of exchange ruling at thebalance sheet date. The results of foreign entities are translated at the average exchange rates for the year. Goodwill andfair value adjustments arising on the acquisition of foreign entities are stated at exchange rates ruling on transactiondates. Exchange differences arising on translation are recognised directly in equity. On disposal, the accumulatedtranslation differences are recognised in the consolidated profit and loss account as part of the gain or loss on sale.
(e) Property, plant and equipment(i) Owned assets
Property, plant and equipment are stated at cost less accumulated depreciation and impairment losses.
(ii) Subsequent expenditureSubsequent expenditure relating to property, plant and equipment that has already been recognised is added to thecarrying amount of the asset when it is probable that future economic benefits, in excess of the originally assessedstandard of performance of the existing asset, will flow to the Group. All other subsequent expenditure is recognised asan expense in the period in which it is incurred.
(iii) DepreciationDepreciation is provided on the straight-line basis so as to write off the costs over their estimated useful lives as follows:
Hospitality leasehold land and buildings – lower of remaining business operation licence tenure or land leaseOther leasehold land and buildings – period of land lease Freehold buildings – 20 to 50 yearsHospitality plant, machinery, improvement,
furniture, fittings and equipment – 1 to 15 yearsOther plant, machinery and improvements – 3 to 10 yearsOther furniture, fittings and equipment – 2 to 5 yearsMotor vehicles – 5 years
Assets under construction are stated at cost. Expenditure relating to assets under construction (including interestexpenses) are capitalised when incurred. Depreciation will commence when the development is completed.
CapL Acc03 proof 04_OKp73-151 17/03/2004 06:41 PM Page 99
100
Cap
itaLa
ndA
R 0
3FO
CUS
BA
LAN
CE S
CALE
NOTES TO THE FINANCIAL STATEMENTS year ended 31 December 2003
2. Summary of Significant Accounting Policies (cont’d)(f) Intangible assets
(i) GoodwillGoodwill arising on acquisition represents the excess of the cost of acquisition over the fair value of the Group’s share ofthe identifiable net assets acquired. Goodwill is stated at cost less accumulated amortisation and impairment losses. Inrespect of associated companies and joint ventures, the carrying amount of goodwill is included in the carrying amount ofthe investment in the associated or joint venture companies. Goodwill is amortised and charged to the profit and lossaccount on a straight-line basis from the date of initial recognition over its estimated useful life of not more than 20 years.
Goodwill on acquisitions of subsidiaries, associated and joint venture companies that occurred prior to 1 January 2001was written off against reserves and has not been retroactively capitalised and amortised.
In arriving at the gain or loss on disposal of an entity, the unamortised balance of goodwill relating to the entity disposedof, or for acquisitions prior to 1 January 2001, the goodwill written off against reserves, is included as part of the cost ofthe investment.
(ii) Negative goodwillNegative goodwill arising on acquisition represents the excess of the fair value of the identifiable net assets acquired overthe cost of acquisition.
To the extent that negative goodwill relates to an expectation of future losses and expenses that are identified in the planof acquisition and can be measured reliably, but which have not yet been recognised, it is recognised in the profit and lossaccount when the future losses and expenses are recognised. Any remaining negative goodwill, but not exceeding the fairvalues of the non-monetary assets acquired, is recognised in the profit and loss account over the weighted average usefullife of those assets that are depreciable or amortisable. Negative goodwill in excess of the fair values of the non-monetary assets acquired is recognised immediately in the profit and loss account.
In respect of associated and joint venture companies, the carrying amount of negative goodwill is included in the carryingamount of the investment in the associated or joint venture companies.
(g) Investment properties and investment properties under development(i) Investment properties
Investment properties, which are not held with the intention of sale in the ordinary course of business, are stated atvaluation on an open market basis. Valuation is made by the directors on an annual basis based on internal valuation orindependent professional valuation. Independent professional valuation is made at least once every 3 years.
The net surplus or deficit on revaluation is taken to revaluation reserve except when the total of the reserve is notsufficient to cover a deficit on an aggregate basis within the same geographical segment, in which case the amount bywhich the deficit exceeds the amount in the revaluation reserve is charged to the profit and loss account.
Surplus on revaluation is released to the profit and loss account upon the sale of investment properties.
The value of investment properties with remaining lease period of 20 years or less are amortised over their remainingleasehold lives.
(ii) Major retrofitting or redevelopmentInvestment properties under or awaiting major retrofitting or redevelopment are stated at valuation immediately prior tothe commencement of retrofitting or redevelopment. Major retrofitting or redevelopment expenditure is stated at costless impairment losses.
Upon completion of major retrofitting or redevelopment, the carrying amounts are stated at valuation on the basis statedin 2(g)(i) above.
An impairment loss is recognised in the same way as a revaluation decrease.
CapL Acc03 proof 04_OKp73-151 17/03/2004 06:41 PM Page 100
101
Cap
itaLa
ndA
R 0
3FO
CUS
BA
LAN
CE S
CALE
2. Summary of Significant Accounting Policies (cont’d)(g) Investment properties and investment properties under development (cont’d)
(iii) Properties under developmentProperties under development are stated at specifically identified cost less impairment losses. Cost of property underdevelopment includes borrowing costs and other related expenditure which are capitalised as and when activities that arenecessary to get the asset ready for its intended use are in progress. An impairment loss is recognised in the same wayas a revaluation decrease.
Upon completion of the development, the amount is reclassified to investment properties. This will be stated at valuationon the basis stated in 2(g)(i) above.
(h) SubsidiariesInvestments in subsidiaries in the Company’s balance sheet are stated at cost less impairment losses.
(i) Associated and joint venture companies(i) An associated company is a company in which the Group has significant influence, but not control in the financial and
operating policy decisions.
(ii) A joint venture company is an enterprise over whose activities the Group has joint control established by contractualagreement.
(iii) In the Company’s balance sheet, investments in associated and joint venture companies are stated at cost lessimpairment losses. The results of the associated and joint venture companies are included in the Company’s profit andloss account to the extent of dividends received and receivable, provided the Company’s right to receive the dividend isestablished before the balance sheet date.
(iv) Investments in associated and joint venture companies accounted for in the consolidated financial statements under theequity method from the date that significant influence or joint control commences until the date that significant influenceor joint control ceases.
(v) The difference between the cost of acquisition and the Group’s share of the fair value of the net assets of associated andjoint venture companies at the date of acquisition is accounted for as goodwill or negative goodwill under Note 2(f)“Intangible Assets”.
(vi) The Group’s share of the post-acquisition results of the associated and joint venture companies included in theconsolidated profit and loss account using the most recent available audited financial statements. Where the auditedfinancial statements are not available, the Group’s share is based on the unaudited financial statements. Any differencesbetween the unaudited financial statements and the audited financial statements obtained subsequently are adjusted forin the following year.
The Group’s share of the post-acquisition retained profits and reserves of the associated and joint venture companies isincluded in the consolidated balance sheet under interests in associated and joint venture companies respectively.
(vii) On disposal of an associated or a joint venture company, any attributable amount of purchased goodwill not previouslyamortised or credited through the profit and loss account in respect of an acquisition prior to 1 January 2002 is includedin the calculation of the profit and loss on disposal.
(j) Joint venture operationsA joint venture operation is a contractual agreement whereby the Group and other parties undertake economic activitieswhich are subject to a joint contract. The proportionate consolidation accounting method is used for joint venture operationswhereby the Group’s share of each of the assets, liabilities, income and expense is combined on a line-by-line basis withsimilar items in the Group financial statements.
CapL Acc03 proof 04_OKp73-151 17/03/2004 06:41 PM Page 101
102
Cap
itaLa
ndA
R 0
3FO
CUS
BA
LAN
CE S
CALE
NOTES TO THE FINANCIAL STATEMENTS year ended 31 December 2003
2. Summary of Significant Accounting Policies (cont’d)(k) Partnerships
(i) A partnership is one where the Group has an interest and a share in the profit or loss and the net assets of thepartnership.
(ii) In the Company’s balance sheet, investments in partnerships are stated at cost less impairment losses.
(iii) Investments in partnerships are accounted for in the consolidated financial statements under the equity method.
(iv) The Group’s share of the post-acquisition results of the partnership is included in the consolidated profit and loss accountusing the most recent available audited financial statements. Where the audited financial statements are not available,the Group’s share is based on the unaudited financial statements. Any differences between the unaudited financialstatements and the audited financial statements obtained subsequently are adjusted for in the following year.
The Group’s share of the post-acquisition retained profits and reserves of the partnership is included in the consolidatedbalance sheet under interests in partnerships.
(l) Financial assets(i) Debt and equity securities held for the long term are stated at cost less allowance for diminution in value which are other
than temporary as determined by the directors for each debt and equity security individually. Any such allowances arerecognised as an expense in the profit and loss account.
(ii) Debt and equity securities held for the short term are classified as current assets, and are stated at the lower of cost andmarket value determined on a portfolio basis. Cost is determined on the weighted average basis. Any increases ordecreases in carrying amount are included in the profit and loss account.
(iii) Profits or losses on disposal of financial assets are determined as the difference between the net disposal proceeds andthe carrying amount of the financial assets and are accounted for in the profit and loss account as they arise.
(m) Development properties for saleDevelopment properties for sale are stated at the lower of cost plus, where appropriate, a portion of the attributable profit,and estimated net realisable value, net of progress billings. Cost of development properties include interest and other relatedexpenditure which are capitalised as and when activities that are necessary to get the assets ready for their intended use arein progress. Net realisable value represents the estimated selling price less costs to be incurred in selling the property.
(n) Consumable stockConsumable stock comprises principally food and beverages, maintenance supplies and spare parts. They are stated at lowerof cost and net realisable value. Cost is determined on a weighted average basis and includes all costs in bringing the stockto its present location and condition. Allowance is made where necessary for obsolete, slow-moving and defective stock.
(o) ImpairmentThe carrying amounts of the Group’s assets, other than development properties for sale and consumable stocks, arereviewed at each balance sheet date to determine whether there is any indication of impairment. If any such indication exists,the asset’s recoverable amount is estimated. For intangible assets that are not yet available for use, the recoverable amountis estimated at each balance sheet date.
An impairment loss is recognised whenever the carrying amount of an asset or its cash-generating unit exceeds itsrecoverable amount. An impairment loss in respect of land and buildings or investment property carried at revalued amountis recognised in the same way as a revaluation decrease. All other impairment losses are recognised in the profit and lossaccount.
(i) Calculation of recoverable amountThe recoverable amount is the greater of the asset’s net selling price and value in use. In assessing value in use, theestimated future cash flows are discounted to their present value using a pre-tax discount rate that reflects currentmarket assessments of the time value of money and the risks specific to the asset. For an asset that does not generatecash inflows largely independent of those from other assets, the recoverable amount is determined for the cash-generating unit to which the asset belongs.
CapL Acc03 proof 04_OKp73-151 17/03/2004 06:41 PM Page 102
103
Cap
itaLa
ndA
R 0
3FO
CUS
BA
LAN
CE S
CALE
2. Summary of Significant Accounting Policies (cont’d)(o) Impairment (cont’d)
(ii) Reversal of impairment lossAn impairment loss is reversed if there has been a change in the estimates used to determine the recoverable amount.An impairment loss is reversed only to the extent that the asset’s carrying amount does not exceed the carrying amountthat would have been determined, net of depreciation or amortisation, if no impairment loss had been recognised. Areversal of an impairment loss in respect of land and buildings or investment property carried at revalued amount isrecognised in the same way as a revaluation increase. All other reversals of impairment are recognised in the profit andloss account.
An impairment loss in respect of goodwill is not reversed unless the loss was caused by a specific external event of anexceptional nature that is not expected to recur, and the increase in recoverable amount relates clearly to the reversal ofthe effect of that specific event.
(p) Employee benefits(i) Short term employee benefits
All short term employee benefits, including accumulated compensated absences, are recognised in the profit and lossaccount in the period in which the employees render their services to the Company.
(ii) Defined contribution plansContributions to post-employment benefits under defined contribution plans are recognised as an expense in the profitand loss account as incurred.
(iii) Long service leaveLiabilities for other employee entitlements which are not expected to be paid or settled within twelve months of balancesheet date are accrued in respect of all employees at present values of future amounts expected to be paid based on aprojected weighted average increase in wage and salary rates. Expected future payments are discounted using interestrates on relevant government securities with terms to maturity that match, as closely as possible, the estimated futurecash outflows.
(iv) Equity compensation benefitsThe stock option programme allows Group employees to acquire shares of the Company. No compensation cost orobligation is recognised. When the options are exercised, equity is increased by the amount of the proceeds received.
(v) Performance sharesUnder the Performance Share Plan, the Company’s shares can be awarded to certain employees and directors of theGroup. An initial estimate would be made for the cost of compensation based on the number of shares expected to beawarded at the end of the performance period, valued at market price at the date of grant of the award. The cost ischarged to the profit and loss account on a basis that fairly reflects the manner in which the benefits will accrue to theemployee under the plan over the service period to which the performance criteria relate. At each reporting date, thecompensation cost is re-measured based on the latest estimate of the number of shares that will be awardedconsidering the performance criteria and the market price of the shares at the reporting date. Any increase or decreasein compensation costs over the previous estimate is recorded in that reporting period. The final measure of compensationcost is based on the number of shares ultimately awarded and the market price at the date the performance criteria are met.
(q) ProvisionsA provision is recognised in the balance sheet when the Group has a legal or constructive obligation as a result of a pastevent, and it is probable that an outflow of economic benefits will be required to settle the obligation.
(r) Deferred tax Deferred tax is provided in full, using the liability method, on temporary differences arising between the tax bases of assetsand liabilities and their carrying amounts in the financial statements. Temporary differences are not recognised for goodwillnot deductible for tax purposes and the initial recognition of assets or liabilities that affect neither accounting nor taxableprofit. The amount of deferred tax provided is based on the expected manner of realisation or settlement of the carryingamount of assets and liabilities, using tax rates enacted or substantively enacted at the balance sheet date.
A deferred tax asset is recognised to the extent that it is probable that future taxable profit will be available against which thetemporary differences can be utilised.
CapL Acc03 proof 04_OKp73-151 17/03/2004 06:41 PM Page 103
104
Cap
itaLa
ndA
R 0
3FO
CUS
BA
LAN
CE S
CALE
NOTES TO THE FINANCIAL STATEMENTS year ended 31 December 2003
2. Summary of Significant Accounting Policies (cont’d)(r) Deferred tax (cont’d)
Deferred tax is provided on temporary differences arising on investments in subsidiaries, associates and joint ventures,except where the timing of the reversal of the temporary difference can be controlled and it is probable that the temporarydifference will not be reversed in the foreseeable future.
(s) Revenue recognitionProvided it is probable that the economic benefits will flow to the Group and the revenue and costs, if applicable, can bemeasured reliably, revenue is recognised in the profit and loss account as follows:
(i) Rental incomeRental income is recognised on an accrual basis.
(ii) Development properties for saleThe Group recognises income on property development projects using the percentage of completion method. Profit isbrought into the financial statements only in respect of sales procured and to the extent that such profit relates to theprogress of construction work. The progress of the construction work is measured by the proportion of the constructioncosts incurred to date to the estimated total construction costs for each project.
(iii) Technical consultancy and management feeTechnical consultancy and management fee is recognised in the profit and loss account as and when services arerendered.
(iv) DividendsDividend income is recognised in the profit and loss account when the shareholder’s right to receive payment isestablished.
(v) Interest incomeInterest income is recognised on an accrual basis.
(vi) Club membershipsEntrance fees from club memberships are recognised in the profit and loss account when the amounts are due to bereceived. 50% of the entrance fees is set aside and included in deferred income. Deferred income is amortised over theremaining membership period.
(t) Borrowing costs(i) Borrowing costs are expensed in the profit and loss account in the period in which they are incurred, except to the extent
that they are capitalised as being directly attributable to the acquisition, construction or production of an asset whichnecessarily takes a substantial period of time to get ready for its intended use or sale.
(ii) The interest on borrowings capitalised is arrived at by reference to the actual rate of interest on borrowings fordevelopment purposes and, with regard to that part of the development cost financed out of general funds, at the averagerate of interest.
(u) Operating leasesRental payable under operating leases are accounted for in the profit and loss account on a straight-line basis over theperiods of the respective leases.
(v) Cash and cash equivalentsCash and cash equivalents comprise cash balances and bank deposits. For the purpose of the statement of cash flows, cashand cash equivalents are presented net of bank overdrafts which are repayable on demand and which form an integral part ofthe Group’s cash management.
(w) Segment reportingA segment is a distinguishable component of the Group that is engaged either in providing products or services (businesssegments), or in providing products or services within a particular economic environment (geographical segment), which issubject to risks and rewards that are different from those of other segments.
Segment information is presented in respect of the Group’s business and geographical segments and the Group’s internalreporting structure. The primary format, business segments, is based on the Group’s principal activities.
CapL Acc03 proof 04_OKp73-151 17/03/2004 06:41 PM Page 104
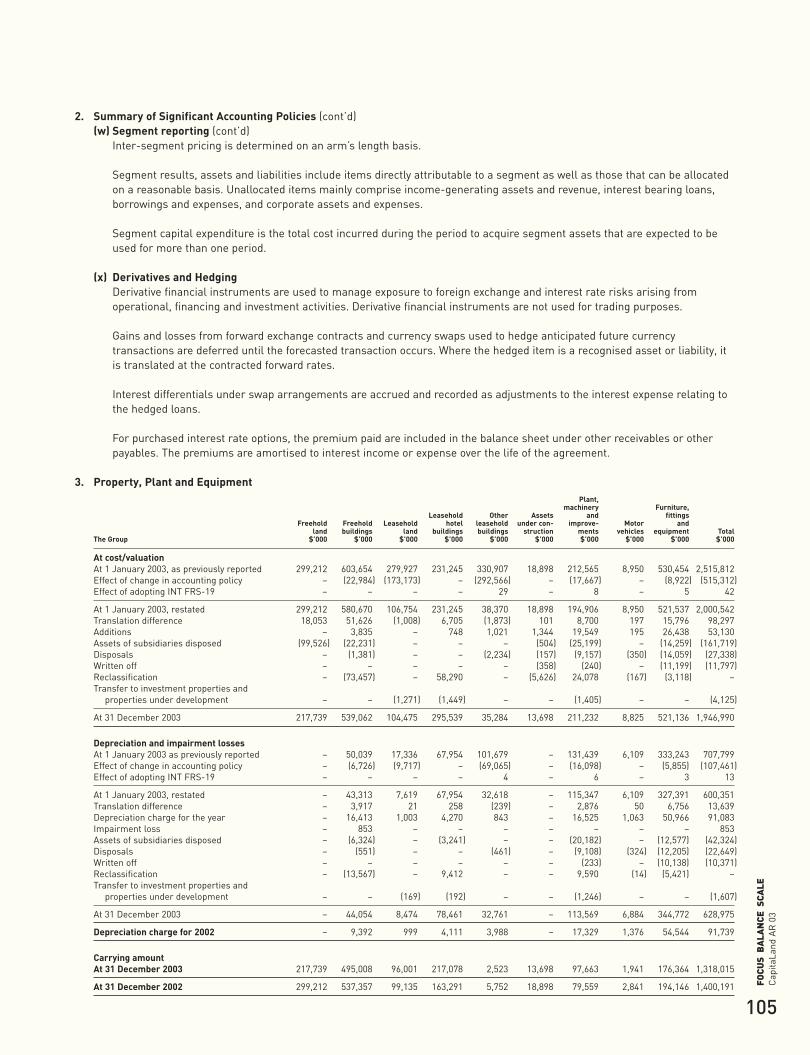
105
Cap
itaLa
ndA
R 0
3FO
CUS
BA
LAN
CE S
CALE
2. Summary of Significant Accounting Policies (cont’d)(w) Segment reporting (cont’d)
Inter-segment pricing is determined on an arm’s length basis.
Segment results, assets and liabilities include items directly attributable to a segment as well as those that can be allocatedon a reasonable basis. Unallocated items mainly comprise income-generating assets and revenue, interest bearing loans,borrowings and expenses, and corporate assets and expenses.
Segment capital expenditure is the total cost incurred during the period to acquire segment assets that are expected to beused for more than one period.
(x) Derivatives and HedgingDerivative financial instruments are used to manage exposure to foreign exchange and interest rate risks arising fromoperational, financing and investment activities. Derivative financial instruments are not used for trading purposes.
Gains and losses from forward exchange contracts and currency swaps used to hedge anticipated future currencytransactions are deferred until the forecasted transaction occurs. Where the hedged item is a recognised asset or liability, itis translated at the contracted forward rates.
Interest differentials under swap arrangements are accrued and recorded as adjustments to the interest expense relating tothe hedged loans.
For purchased interest rate options, the premium paid are included in the balance sheet under other receivables or otherpayables. The premiums are amortised to interest income or expense over the life of the agreement.
3. Property, Plant and EquipmentPlant,
machinery Furniture,Leasehold Other Assets and fittings
Freehold Freehold Leasehold hotel leasehold under con- improve- Motor andland buildings land buildings buildings struction ments vehicles equipment Total
The Group $’000 $’000 $’000 $’000 $’000 $’000 $’000 $’000 $’000 $’000
At cost/valuationAt 1 January 2003, as previously reported 299,212 603,654 279,927 231,245 330,907 18,898 212,565 8,950 530,454 2,515,812Effect of change in accounting policy – (22,984) (173,173) – (292,566) – (17,667) – (8,922) (515,312)Effect of adopting INT FRS-19 – – – – 29 – 8 – 5 42
At 1 January 2003, restated 299,212 580,670 106,754 231,245 38,370 18,898 194,906 8,950 521,537 2,000,542Translation difference 18,053 51,626 (1,008) 6,705 (1,873) 101 8,700 197 15,796 98,297Additions – 3,835 – 748 1,021 1,344 19,549 195 26,438 53,130Assets of subsidiaries disposed (99,526) (22,231) – – – (504) (25,199) – (14,259) (161,719)Disposals – (1,381) – – (2,234) (157) (9,157) (350) (14,059) (27,338)Written off – – – – – (358) (240) – (11,199) (11,797)Reclassification – (73,457) – 58,290 – (5,626) 24,078 (167) (3,118) –Transfer to investment properties and
properties under development – – (1,271) (1,449) – – (1,405) – – (4,125)
At 31 December 2003 217,739 539,062 104,475 295,539 35,284 13,698 211,232 8,825 521,136 1,946,990
Depreciation and impairment lossesAt 1 January 2003 as previously reported – 50,039 17,336 67,954 101,679 – 131,439 6,109 333,243 707,799Effect of change in accounting policy – (6,726) (9,717) – (69,065) – (16,098) – (5,855) (107,461)Effect of adopting INT FRS-19 – – – – 4 – 6 – 3 13
At 1 January 2003, restated – 43,313 7,619 67,954 32,618 – 115,347 6,109 327,391 600,351Translation difference – 3,917 21 258 (239) – 2,876 50 6,756 13,639Depreciation charge for the year – 16,413 1,003 4,270 843 – 16,525 1,063 50,966 91,083Impairment loss – 853 – – – – – – – 853Assets of subsidiaries disposed – (6,324) – (3,241) – – (20,182) – (12,577) (42,324)Disposals – (551) – – (461) – (9,108) (324) (12,205) (22,649)Written off – – – – – – (233) – (10,138) (10,371)Reclassification – (13,567) – 9,412 – – 9,590 (14) (5,421) –Transfer to investment properties and
properties under development – – (169) (192) – – (1,246) – – (1,607)
At 31 December 2003 – 44,054 8,474 78,461 32,761 – 113,569 6,884 344,772 628,975
Depreciation charge for 2002 – 9,392 999 4,111 3,988 – 17,329 1,376 54,544 91,739
Carrying amountAt 31 December 2003 217,739 495,008 96,001 217,078 2,523 13,698 97,663 1,941 176,364 1,318,015
At 31 December 2002 299,212 537,357 99,135 163,291 5,752 18,898 79,559 2,841 194,146 1,400,191
CapL Acc03 proof 04_OKp73-151 17/03/2004 06:41 PM Page 105
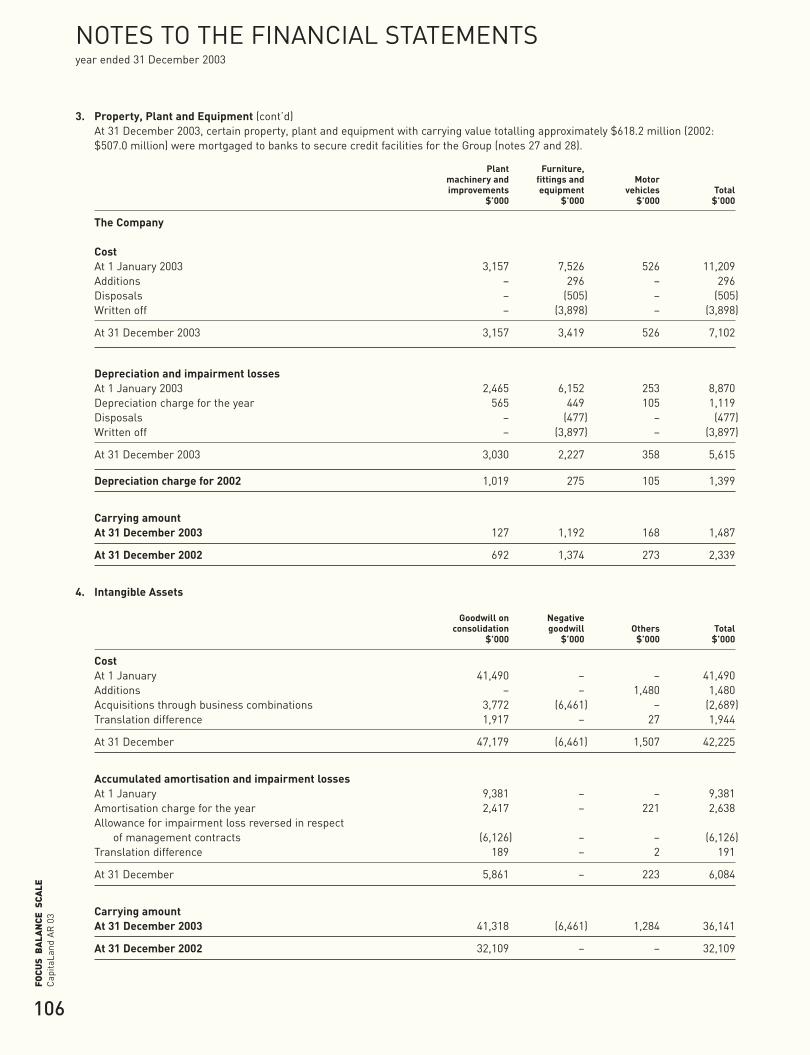
106
Cap
itaLa
ndA
R 0
3FO
CUS
BA
LAN
CE S
CALE
NOTES TO THE FINANCIAL STATEMENTS year ended 31 December 2003
3. Property, Plant and Equipment (cont’d)At 31 December 2003, certain property, plant and equipment with carrying value totalling approximately $618.2 million (2002:$507.0 million) were mortgaged to banks to secure credit facilities for the Group (notes 27 and 28).
Plant Furniture,machinery and fittings and Motorimprovements equipment vehicles Total
$’000 $’000 $’000 $’000
The Company
CostAt 1 January 2003 3,157 7,526 526 11,209Additions – 296 – 296Disposals – (505) – (505)Written off – (3,898) – (3,898)
At 31 December 2003 3,157 3,419 526 7,102
Depreciation and impairment lossesAt 1 January 2003 2,465 6,152 253 8,870Depreciation charge for the year 565 449 105 1,119Disposals – (477) – (477)Written off – (3,897) – (3,897)
At 31 December 2003 3,030 2,227 358 5,615
Depreciation charge for 2002 1,019 275 105 1,399
Carrying amountAt 31 December 2003 127 1,192 168 1,487
At 31 December 2002 692 1,374 273 2,339
4. Intangible Assets
Goodwill on Negativeconsolidation goodwill Others Total
$’000 $’000 $’000 $’000
CostAt 1 January 41,490 – – 41,490Additions – – 1,480 1,480Acquisitions through business combinations 3,772 (6,461) – (2,689)Translation difference 1,917 – 27 1,944
At 31 December 47,179 (6,461) 1,507 42,225
Accumulated amortisation and impairment lossesAt 1 January 9,381 – – 9,381Amortisation charge for the year 2,417 – 221 2,638Allowance for impairment loss reversed in respect
of management contracts (6,126) – – (6,126)Translation difference 189 – 2 191
At 31 December 5,861 – 223 6,084
Carrying amountAt 31 December 2003 41,318 (6,461) 1,284 36,141
At 31 December 2002 32,109 – – 32,109
CapL Acc03 proof 04_OKp73-151 17/03/2004 06:41 PM Page 106

107
Cap
itaLa
ndA
R 0
3FO
CUS
BA
LAN
CE S
CALE
5. Investment Properties
The GroupNote 2003 2002
$’000 $’000
(a) Freehold investment properties, at valuation 1,708,543 1,342,729Effect of change in accounting policy – 31,824
As restated 1,708,543 1,374,553
Leasehold investment properties, at valuation 4,874,503 4,428,516Effect of change in accounting policy – 492,484
As restated 4,874,503 4,921,000
Leasehold investment properties, at cost 2,021 2,021
Less:Accumulated amortisation
At 1 January (1,773) (1,648)Amortisation charge for the year 36(c)(ii) (124) (125)
At 31 December (1,897) (1,773)
124 248
6,583,170 6,295,801
(b) Investment properties are stated at directors’ valuation based on independent professional valuations carried out by thefollowing valuers, on the basis of open market valuations.
Valuation DateBI Appraisals Ltd (Hong Kong) November/December 2003CB Richard Ellis Hotel Limited (United Kingdom) December 2003CB Richard Ellis (Pte) Ltd December 2003CB Richard Ellis Pty Ltd December 2003Colliers International Consultancy & Valuation (Singapore) Pte Ltd November 2003Cuervo Appraiser Inc. (Philippines) November 2003DTZ Debenham Tie Leung October 2003FPD Savills Property Services (Shanghai) Co Ltd (China) November/December 2003FPD Savills (NSW) Pty Limited December 2003IKOMA CB Richard Ellis K.K. (Japan) October 2003Jones Lang LaSalle Property Consultants Pte Ltd November 2003Knight Frank Pte Ltd November/December 2003m3property Pty Ltd December 2003PT Artanila Permai October 2003Vigers J.B. Sdn Bhd (Malaysia) October 2003
(c) At 31 December 2003, certain investment properties with carrying value totalling approximately $1,683.0 million (2002:$1,834.5 million) were mortgaged to banks to secure credit facilities for the Group (note 28).
(d) Investment properties of the Group are held mainly for use by tenants under operating leases.
6. Properties Under Development
The Group2003 2002
$’000 $’000
Cost 224,141 221,128Less:
Allowance for anticipated valuation deficiencies on completion (67,506) (52,680)
156,635 168,448
(a) During the financial year, interest capitalised as cost of properties under development amounted to approximately $79,000(2002: $Nil).
CapL Acc03 proof 04_OKp73-151 17/03/2004 06:41 PM Page 107
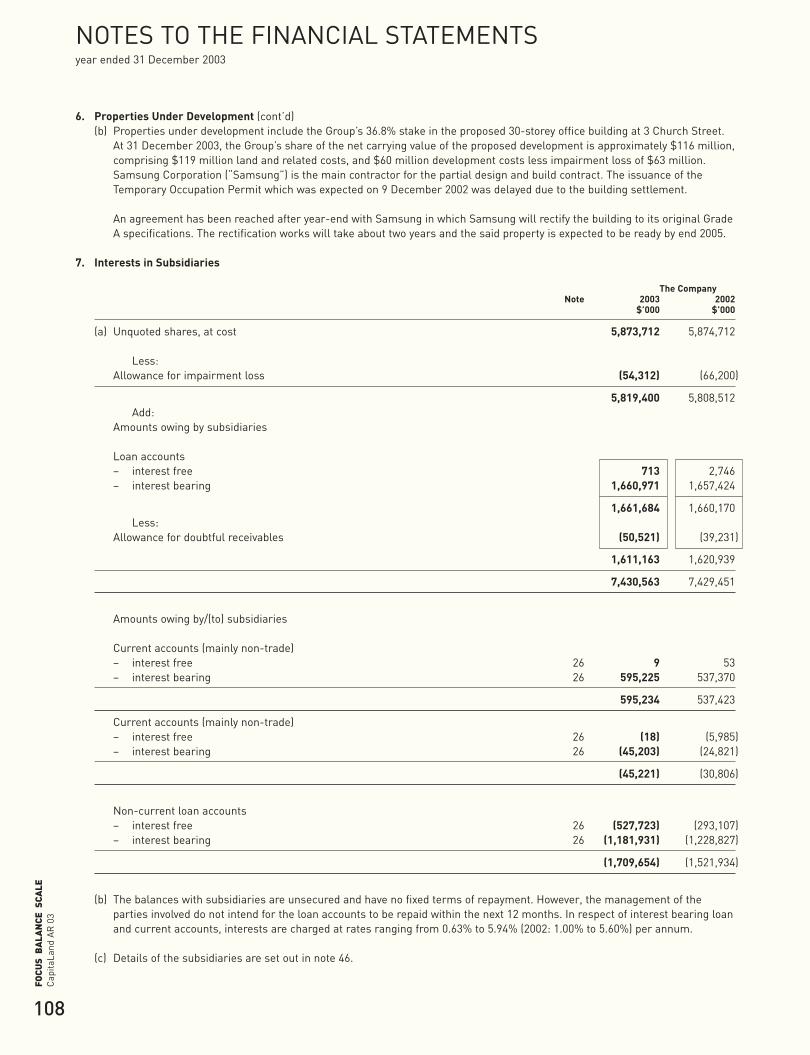
108
Cap
itaLa
ndA
R 0
3FO
CUS
BA
LAN
CE S
CALE
NOTES TO THE FINANCIAL STATEMENTS year ended 31 December 2003
6. Properties Under Development (cont’d)(b) Properties under development include the Group’s 36.8% stake in the proposed 30-storey office building at 3 Church Street.
At 31 December 2003, the Group’s share of the net carrying value of the proposed development is approximately $116 million,comprising $119 million land and related costs, and $60 million development costs less impairment loss of $63 million.Samsung Corporation (“Samsung”) is the main contractor for the partial design and build contract. The issuance of theTemporary Occupation Permit which was expected on 9 December 2002 was delayed due to the building settlement.
An agreement has been reached after year-end with Samsung in which Samsung will rectify the building to its original GradeA specifications. The rectification works will take about two years and the said property is expected to be ready by end 2005.
7. Interests in Subsidiaries
The CompanyNote 2003 2002
$’000 $’000
(a) Unquoted shares, at cost 5,873,712 5,874,712
Less:Allowance for impairment loss (54,312) (66,200)
5,819,400 5,808,512Add:
Amounts owing by subsidiaries
Loan accounts– interest free 713 2,746– interest bearing 1,660,971 1,657,424
1,661,684 1,660,170Less:
Allowance for doubtful receivables (50,521) (39,231)
1,611,163 1,620,939
7,430,563 7,429,451
Amounts owing by/(to) subsidiaries
Current accounts (mainly non-trade)– interest free 26 9 53– interest bearing 26 595,225 537,370
595,234 537,423
Current accounts (mainly non-trade)– interest free 26 (18) (5,985)– interest bearing 26 (45,203) (24,821)
(45,221) (30,806)
Non-current loan accounts– interest free 26 (527,723) (293,107)– interest bearing 26 (1,181,931) (1,228,827)
(1,709,654) (1,521,934)
(b) The balances with subsidiaries are unsecured and have no fixed terms of repayment. However, the management of theparties involved do not intend for the loan accounts to be repaid within the next 12 months. In respect of interest bearing loanand current accounts, interests are charged at rates ranging from 0.63% to 5.94% (2002: 1.00% to 5.60%) per annum.
(c) Details of the subsidiaries are set out in note 46.
CapL Acc03 proof 04_OKp73-151 17/03/2004 06:41 PM Page 108
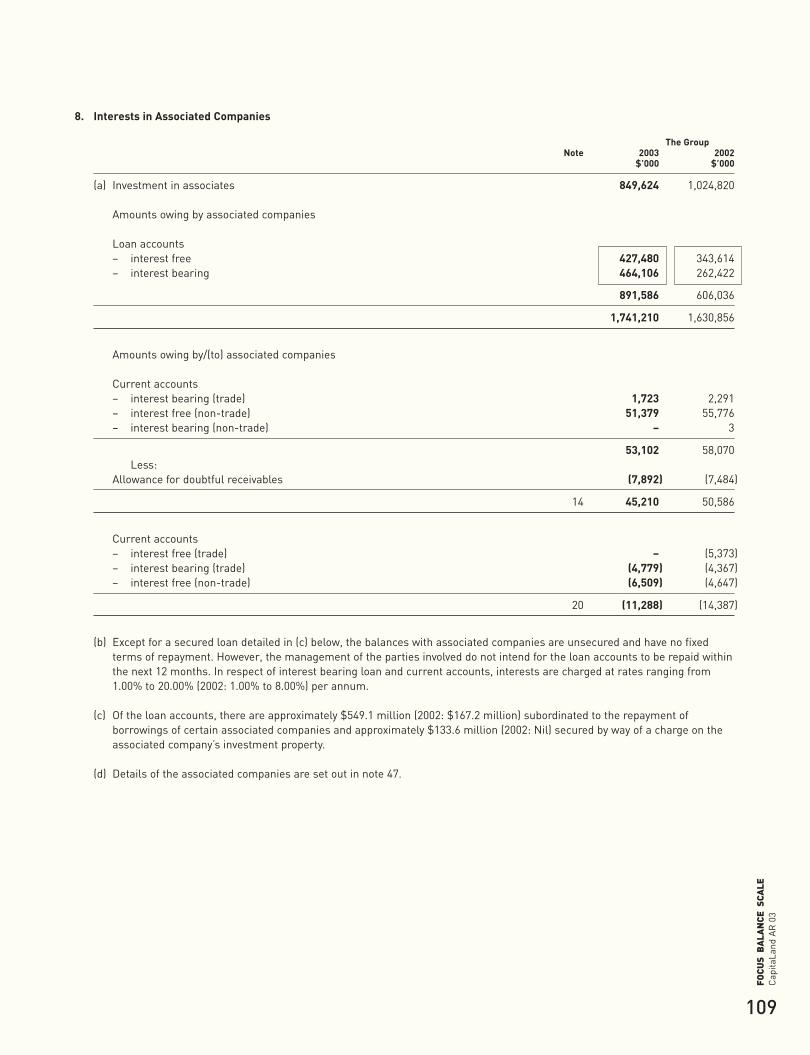
109
Cap
itaLa
ndA
R 0
3FO
CUS
BA
LAN
CE S
CALE
8. Interests in Associated Companies
The GroupNote 2003 2002
$’000 $’000
(a) Investment in associates 849,624 1,024,820
Amounts owing by associated companies
Loan accounts– interest free 427,480 343,614– interest bearing 464,106 262,422
891,586 606,036
1,741,210 1,630,856
Amounts owing by/(to) associated companies
Current accounts– interest bearing (trade) 1,723 2,291– interest free (non-trade) 51,379 55,776– interest bearing (non-trade) – 3
53,102 58,070Less:
Allowance for doubtful receivables (7,892) (7,484)
14 45,210 50,586
Current accounts– interest free (trade) – (5,373)– interest bearing (trade) (4,779) (4,367)– interest free (non-trade) (6,509) (4,647)
20 (11,288) (14,387)
(b) Except for a secured loan detailed in (c) below, the balances with associated companies are unsecured and have no fixedterms of repayment. However, the management of the parties involved do not intend for the loan accounts to be repaid withinthe next 12 months. In respect of interest bearing loan and current accounts, interests are charged at rates ranging from1.00% to 20.00% (2002: 1.00% to 8.00%) per annum.
(c) Of the loan accounts, there are approximately $549.1 million (2002: $167.2 million) subordinated to the repayment ofborrowings of certain associated companies and approximately $133.6 million (2002: Nil) secured by way of a charge on theassociated company’s investment property.
(d) Details of the associated companies are set out in note 47.
CapL Acc03 proof 04_OKp73-151 17/03/2004 06:41 PM Page 109
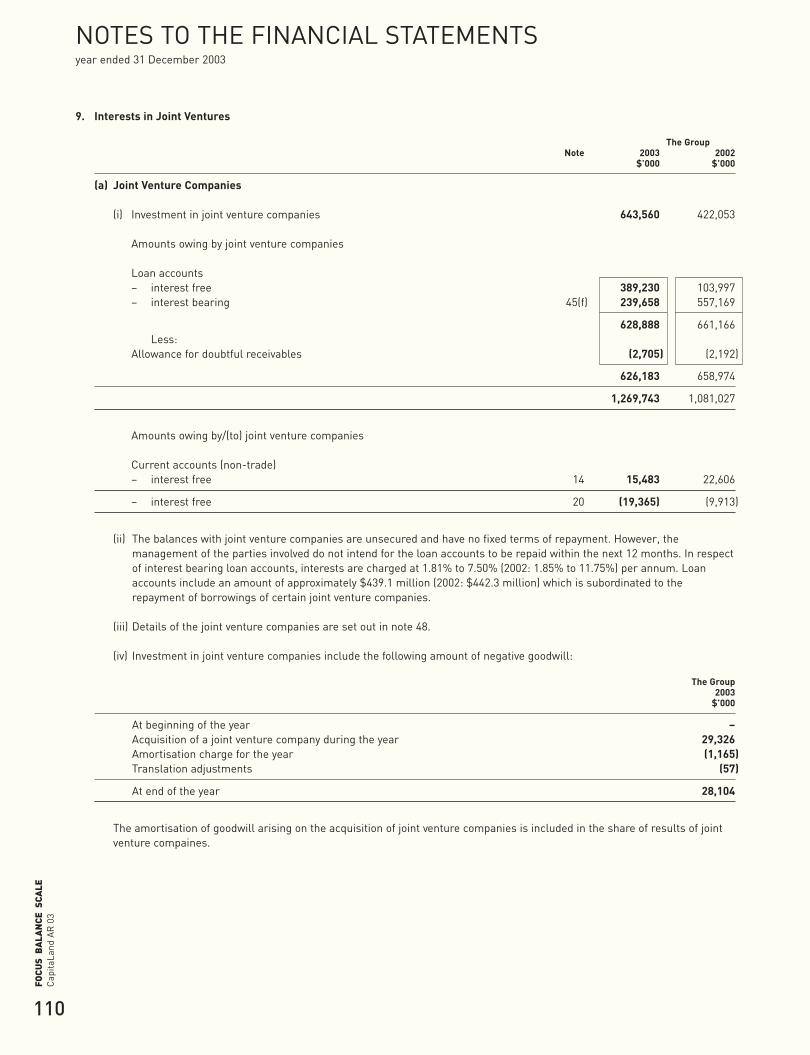
110
Cap
itaLa
ndA
R 0
3FO
CUS
BA
LAN
CE S
CALE
NOTES TO THE FINANCIAL STATEMENTS year ended 31 December 2003
9. Interests in Joint Ventures
The GroupNote 2003 2002
$’000 $’000
(a) Joint Venture Companies
(i) Investment in joint venture companies 643,560 422,053
Amounts owing by joint venture companies
Loan accounts– interest free 389,230 103,997– interest bearing 45(f) 239,658 557,169
628,888 661,166Less:
Allowance for doubtful receivables (2,705) (2,192)
626,183 658,974
1,269,743 1,081,027
Amounts owing by/(to) joint venture companies
Current accounts (non-trade)– interest free 14 15,483 22,606
– interest free 20 (19,365) (9,913)
(ii) The balances with joint venture companies are unsecured and have no fixed terms of repayment. However, themanagement of the parties involved do not intend for the loan accounts to be repaid within the next 12 months. In respectof interest bearing loan accounts, interests are charged at 1.81% to 7.50% (2002: 1.85% to 11.75%) per annum. Loanaccounts include an amount of approximately $439.1 million (2002: $442.3 million) which is subordinated to therepayment of borrowings of certain joint venture companies.
(iii) Details of the joint venture companies are set out in note 48.
(iv) Investment in joint venture companies include the following amount of negative goodwill:
The Group2003
$’000
At beginning of the year –Acquisition of a joint venture company during the year 29,326Amortisation charge for the year (1,165)Translation adjustments (57)
At end of the year 28,104
The amortisation of goodwill arising on the acquisition of joint venture companies is included in the share of results of jointventure compaines.
CapL Acc03 proof 04_OKp73-151 17/03/2004 06:41 PM Page 110
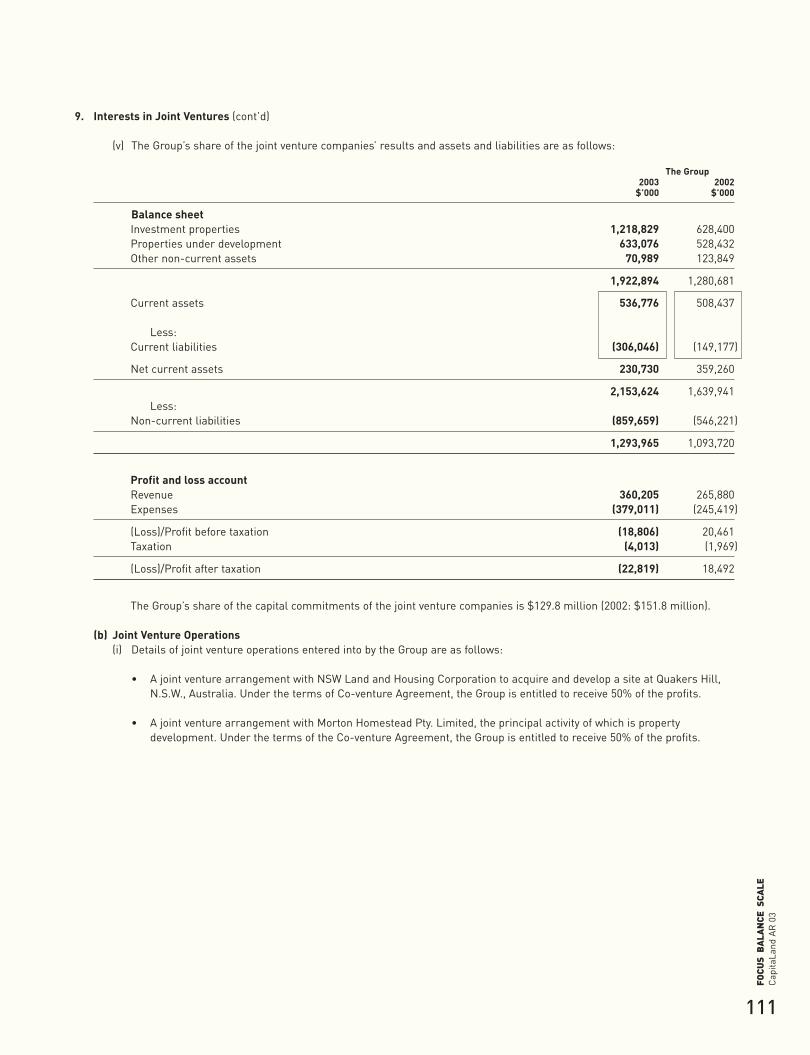
111
Cap
itaLa
ndA
R 0
3FO
CUS
BA
LAN
CE S
CALE
9. Interests in Joint Ventures (cont’d)
(v) The Group’s share of the joint venture companies’ results and assets and liabilities are as follows:
The Group2003 2002
$’000 $’000
Balance sheetInvestment properties 1,218,829 628,400Properties under development 633,076 528,432Other non-current assets 70,989 123,849
1,922,894 1,280,681
Current assets 536,776 508,437
Less:Current liabilities (306,046) (149,177)
Net current assets 230,730 359,260
2,153,624 1,639,941Less:
Non-current liabilities (859,659) (546,221)
1,293,965 1,093,720
Profit and loss accountRevenue 360,205 265,880Expenses (379,011) (245,419)
(Loss)/Profit before taxation (18,806) 20,461Taxation (4,013) (1,969)
(Loss)/Profit after taxation (22,819) 18,492
The Group’s share of the capital commitments of the joint venture companies is $129.8 million (2002: $151.8 million).
(b) Joint Venture Operations(i) Details of joint venture operations entered into by the Group are as follows:
• A joint venture arrangement with NSW Land and Housing Corporation to acquire and develop a site at Quakers Hill,N.S.W., Australia. Under the terms of Co-venture Agreement, the Group is entitled to receive 50% of the profits.
• A joint venture arrangement with Morton Homestead Pty. Limited, the principal activity of which is propertydevelopment. Under the terms of the Co-venture Agreement, the Group is entitled to receive 50% of the profits.
CapL Acc03 proof 04_OKp73-151 17/03/2004 06:41 PM Page 111
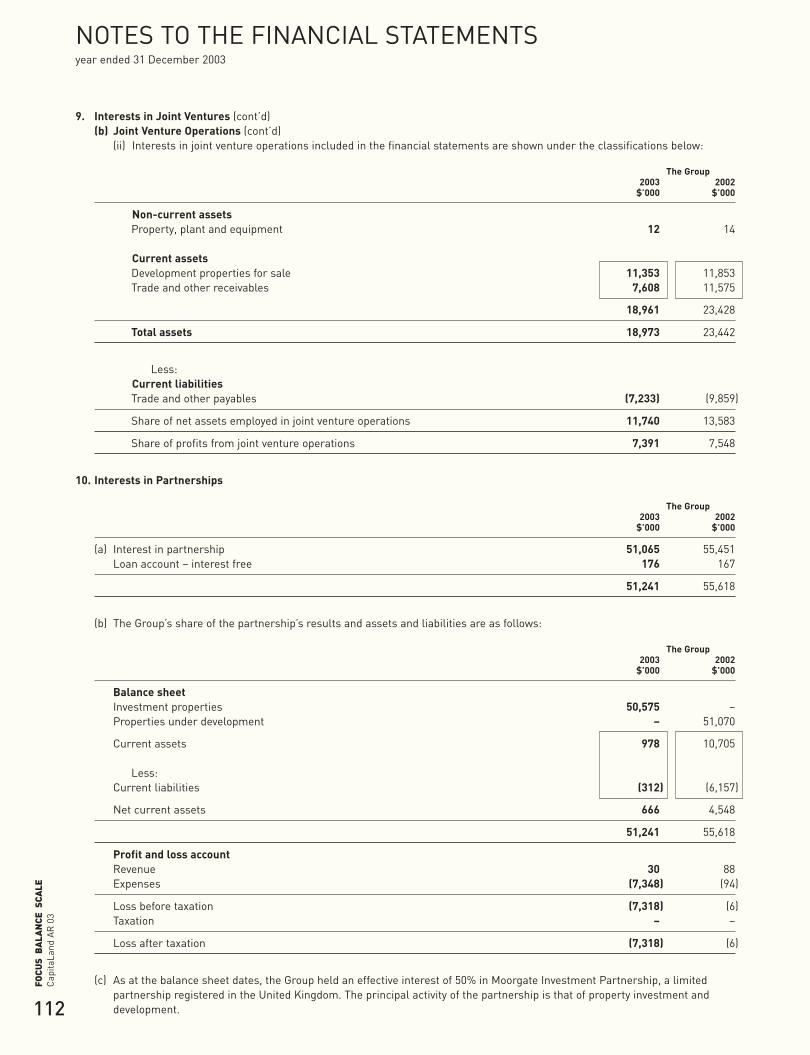
112
Cap
itaLa
ndA
R 0
3FO
CUS
BA
LAN
CE S
CALE
NOTES TO THE FINANCIAL STATEMENTS year ended 31 December 2003
9. Interests in Joint Ventures (cont’d)(b) Joint Venture Operations (cont’d)
(ii) Interests in joint venture operations included in the financial statements are shown under the classifications below:
The Group2003 2002
$’000 $’000
Non-current assetsProperty, plant and equipment 12 14
Current assetsDevelopment properties for sale 11,353 11,853Trade and other receivables 7,608 11,575
18,961 23,428
Total assets 18,973 23,442
Less:Current liabilitiesTrade and other payables (7,233) (9,859)
Share of net assets employed in joint venture operations 11,740 13,583
Share of profits from joint venture operations 7,391 7,548
10. Interests in Partnerships
The Group2003 2002
$’000 $’000
(a) Interest in partnership 51,065 55,451Loan account – interest free 176 167
51,241 55,618
(b) The Group’s share of the partnership’s results and assets and liabilities are as follows:
The Group2003 2002
$’000 $’000
Balance sheetInvestment properties 50,575 –Properties under development – 51,070
Current assets 978 10,705
Less:Current liabilities (312) (6,157)
Net current assets 666 4,548
51,241 55,618
Profit and loss accountRevenue 30 88Expenses (7,348) (94)
Loss before taxation (7,318) (6)Taxation – –
Loss after taxation (7,318) (6)
(c) As at the balance sheet dates, the Group held an effective interest of 50% in Moorgate Investment Partnership, a limitedpartnership registered in the United Kingdom. The principal activity of the partnership is that of property investment anddevelopment.
CapL Acc03 proof 04_OKp73-151 17/03/2004 06:41 PM Page 112

113
Cap
itaLa
ndA
R 0
3FO
CUS
BA
LAN
CE S
CALE
11. Financial AssetsThe Group
Note 2003 2002$’000 $’000
(a) Non-current financial assetsQuoted shares, at cost less write down 67,024 67,024Unquoted shares, at cost 110,588 105,285Quoted debt securities, at cost 2,000 1,000Other unquoted investments 1,000 13,361
180,612 186,670Less:
Allowance for impairment losses (51,370) (56,072)
129,242 130,598Amounts owing by investee companiesLoan accounts- interest free 34,426 24,260– interest bearing 45(f) 49,476 44,253
83,902 68,513Less:
Allowance for doubtful debts (20,083) (22,757)
63,819 45,756
Total 193,061 176,354
Market value:Quoted shares 51,090 32,623
Quoted debt securities 2,000 1,000
The Group The Company2003 2002 2003 2002
$’000 $’000 $’000 $’000
(b) Current financial assetsAt cost:Quoted shares 4,658 5,170 – –Quoted bonds – 10,155 – 10,155Other unquoted investments 155,121 158,280 – –
159,779 173,605 – 10,155Less:
Allowance for impairment losses (1,363) (3,898) – (2,345)
158,416 169,707 – 7,810
Market value:Quoted shares 3,284 3,617 – –
Quoted bonds – 7,261 – 7,261
(c) The balances with investee companies are unsecured and have no fixed terms of repayment. However, the management ofthe parties involved do not intend for the amounts to be repaid within the next 12 months. In respect of interest bearing loanaccounts, interests are charged at rates ranging from 1.00% to 6.00% (2002: 1.50% to 6.00%) per annum.
(d) Quoted and unquoted investments include investments in floating rate notes and bonds.
CapL Acc03 proof 04_OKp73-151 17/03/2004 06:41 PM Page 113
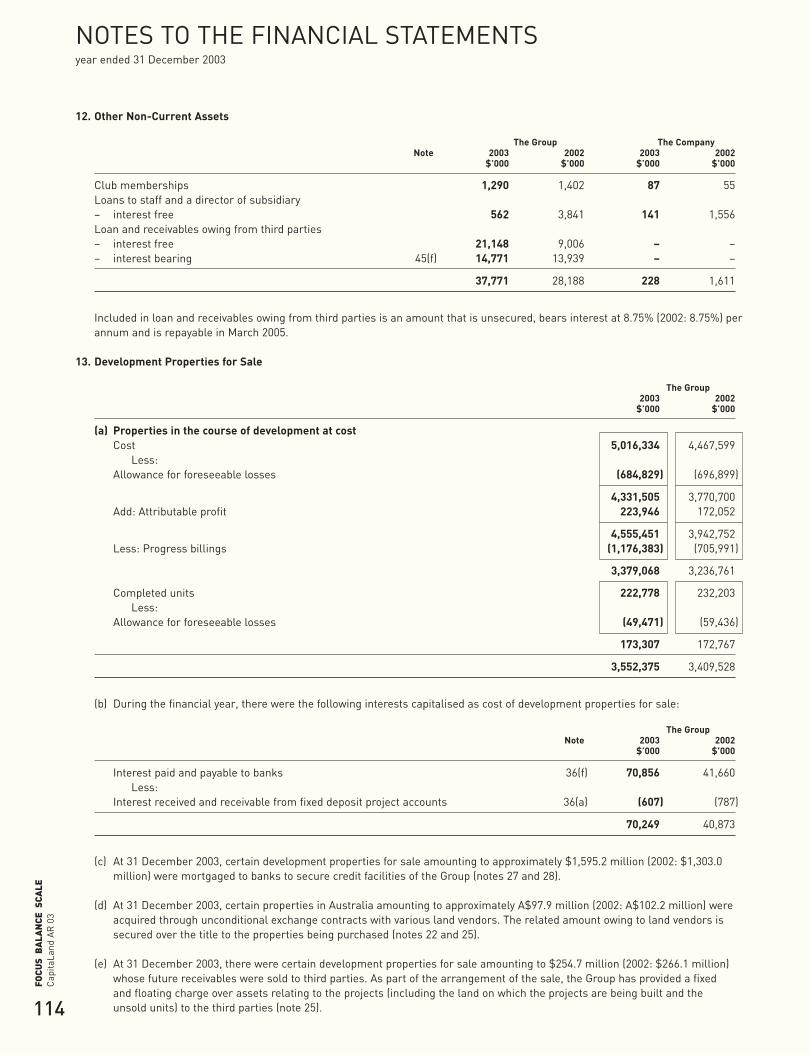
114
Cap
itaLa
ndA
R 0
3FO
CUS
BA
LAN
CE S
CALE
NOTES TO THE FINANCIAL STATEMENTS year ended 31 December 2003
12. Other Non-Current Assets
The Group The CompanyNote 2003 2002 2003 2002
$’000 $’000 $’000 $’000
Club memberships 1,290 1,402 87 55Loans to staff and a director of subsidiary– interest free 562 3,841 141 1,556Loan and receivables owing from third parties– interest free 21,148 9,006 – –– interest bearing 45(f) 14,771 13,939 – –
37,771 28,188 228 1,611
Included in loan and receivables owing from third parties is an amount that is unsecured, bears interest at 8.75% (2002: 8.75%) perannum and is repayable in March 2005.
13. Development Properties for Sale
The Group2003 2002
$’000 $’000
(a) Properties in the course of development at costCost 5,016,334 4,467,599
Less:Allowance for foreseeable losses (684,829) (696,899)
4,331,505 3,770,700Add: Attributable profit 223,946 172,052
4,555,451 3,942,752Less: Progress billings (1,176,383) (705,991)
3,379,068 3,236,761
Completed units 222,778 232,203Less:
Allowance for foreseeable losses (49,471) (59,436)
173,307 172,767
3,552,375 3,409,528
(b) During the financial year, there were the following interests capitalised as cost of development properties for sale:
The GroupNote 2003 2002
$’000 $’000
Interest paid and payable to banks 36(f) 70,856 41,660Less:
Interest received and receivable from fixed deposit project accounts 36(a) (607) (787)
70,249 40,873
(c) At 31 December 2003, certain development properties for sale amounting to approximately $1,595.2 million (2002: $1,303.0million) were mortgaged to banks to secure credit facilities of the Group (notes 27 and 28).
(d) At 31 December 2003, certain properties in Australia amounting to approximately A$97.9 million (2002: A$102.2 million) wereacquired through unconditional exchange contracts with various land vendors. The related amount owing to land vendors issecured over the title to the properties being purchased (notes 22 and 25).
(e) At 31 December 2003, there were certain development properties for sale amounting to $254.7 million (2002: $266.1 million)whose future receivables were sold to third parties. As part of the arrangement of the sale, the Group has provided a fixedand floating charge over assets relating to the projects (including the land on which the projects are being built and theunsold units) to the third parties (note 25).
CapL Acc03 proof 04_OKp73-151 17/03/2004 06:41 PM Page 114
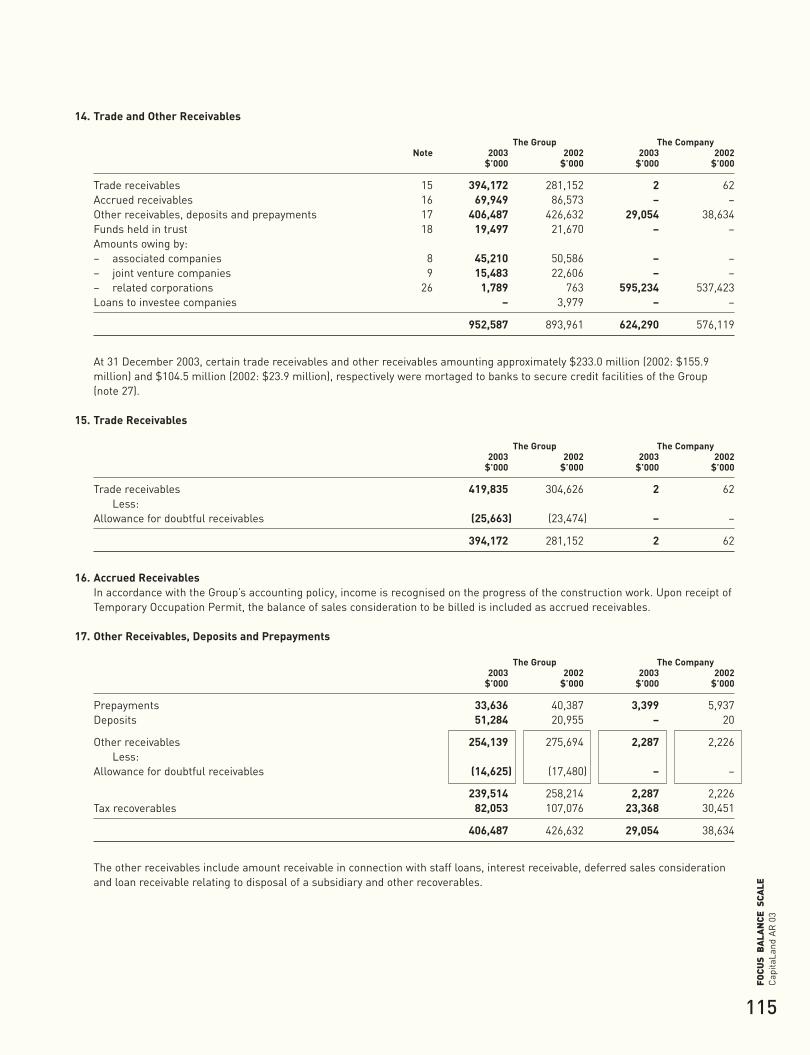
115
Cap
itaLa
ndA
R 0
3FO
CUS
BA
LAN
CE S
CALE
14. Trade and Other Receivables
The Group The CompanyNote 2003 2002 2003 2002
$’000 $’000 $’000 $’000
Trade receivables 15 394,172 281,152 2 62Accrued receivables 16 69,949 86,573 – –Other receivables, deposits and prepayments 17 406,487 426,632 29,054 38,634Funds held in trust 18 19,497 21,670 – –Amounts owing by:– associated companies 8 45,210 50,586 – –– joint venture companies 9 15,483 22,606 – –– related corporations 26 1,789 763 595,234 537,423Loans to investee companies – 3,979 – –
952,587 893,961 624,290 576,119
At 31 December 2003, certain trade receivables and other receivables amounting approximately $233.0 million (2002: $155.9million) and $104.5 million (2002: $23.9 million), respectively were mortaged to banks to secure credit facilities of the Group(note 27).
15. Trade Receivables
The Group The Company2003 2002 2003 2002
$’000 $’000 $’000 $’000
Trade receivables 419,835 304,626 2 62Less:
Allowance for doubtful receivables (25,663) (23,474) – –
394,172 281,152 2 62
16. Accrued ReceivablesIn accordance with the Group’s accounting policy, income is recognised on the progress of the construction work. Upon receipt ofTemporary Occupation Permit, the balance of sales consideration to be billed is included as accrued receivables.
17. Other Receivables, Deposits and Prepayments
The Group The Company2003 2002 2003 2002
$’000 $’000 $’000 $’000
Prepayments 33,636 40,387 3,399 5,937Deposits 51,284 20,955 – 20
Other receivables 254,139 275,694 2,287 2,226Less:
Allowance for doubtful receivables (14,625) (17,480) – –
239,514 258,214 2,287 2,226Tax recoverables 82,053 107,076 23,368 30,451
406,487 426,632 29,054 38,634
The other receivables include amount receivable in connection with staff loans, interest receivable, deferred sales considerationand loan receivable relating to disposal of a subsidiary and other recoverables.
CapL Acc03 proof 04_OKp73-151 17/03/2004 06:41 PM Page 115

116
Cap
itaLa
ndA
R 0
3FO
CUS
BA
LAN
CE S
CALE
NOTES TO THE FINANCIAL STATEMENTS year ended 31 December 2003
18. Funds Held in TrustFunds held in trust comprise fixed deposits and bank balances with banks and finance companies held on behalf of theCommissioner of Land, Public Utilities Board, the Housing and Development Board and related corporations:
The Group2003 2002
Note $’000 $’000
Fixed deposits 13,438 15,255Cash at banks 6,059 6,415
20 19,497 21,670
Funds held in trust include an amount of $890,000 (2002: $935,000) held on behalf of related corporations.
19. Cash and Cash Equivalents
The Group The Company2003 2002 2003 2002
$’000 $’000 $’000 $’000
Amounts held under “Project Account Rules – 1997 Ed”withdrawals from which are restricted to payments forexpenditure incurred on development projects 178,061 208,652 – –
Fixed deposits 1,033,157 614,225 492,384 340,600Cash at bank and in hand 265,268 264,178 335 1,485
1,476,486 1,087,055 492,719 342,085Bank overdrafts (unsecured) (720) (3,410) – –
Cash and cash equivalents in the statement of cash flows 1,475,766 1,083,645 492,719 342,085
(a) Amounts held under “Project Account Rules – 1997 Ed” of $106.3 million (2002: $93.4 million) were pledged as securities forthe term loans (note 28).
(b) Fixed deposits of $21.8 million (2002: $26.5 million) were pledged as securities for the term loans (note 28).
(c) At 31 December 2003, there was a charge over all monies from time to time standing to the credit of the project accountsamounting to $1.9 million (2002: $17.0 million) in respect of certain development properties for sale whose future receivableswere sold (note 25).
20. Trade and Other Payables
The Group The CompanyNote 2003 2002 2003 2002
$’000 $’000 $’000 $’000
Trade payables 222,270 136,337 267 –Accruals 21 706,987 588,643 23,696 26,388Other payables 22 227,604 255,037 11 12Rental and other deposits 23 72,542 53,271 2 2Funds held in trust 18 19,497 21,670 – –Contract work-in-progress 24 29,291 14,327 – –Provisions 25 37,890 54,503 – –Liability for employee benefits 31 8,959 16,359 590 578Amounts owing to: – associated companies 8 11,288 14,387 – –– joint venture companies 9 19,365 9,913 – –– related corporations 26 5,809 4,328 45,221 30,806
1,361,502 1,168,775 69,787 57,786
21. AccrualsAccruals include accrued development expenditure, accrued interest payable and accrued property, plant and equipmentpurchases.
CapL Acc03 proof 04_OKp73-151 17/03/2004 06:41 PM Page 116
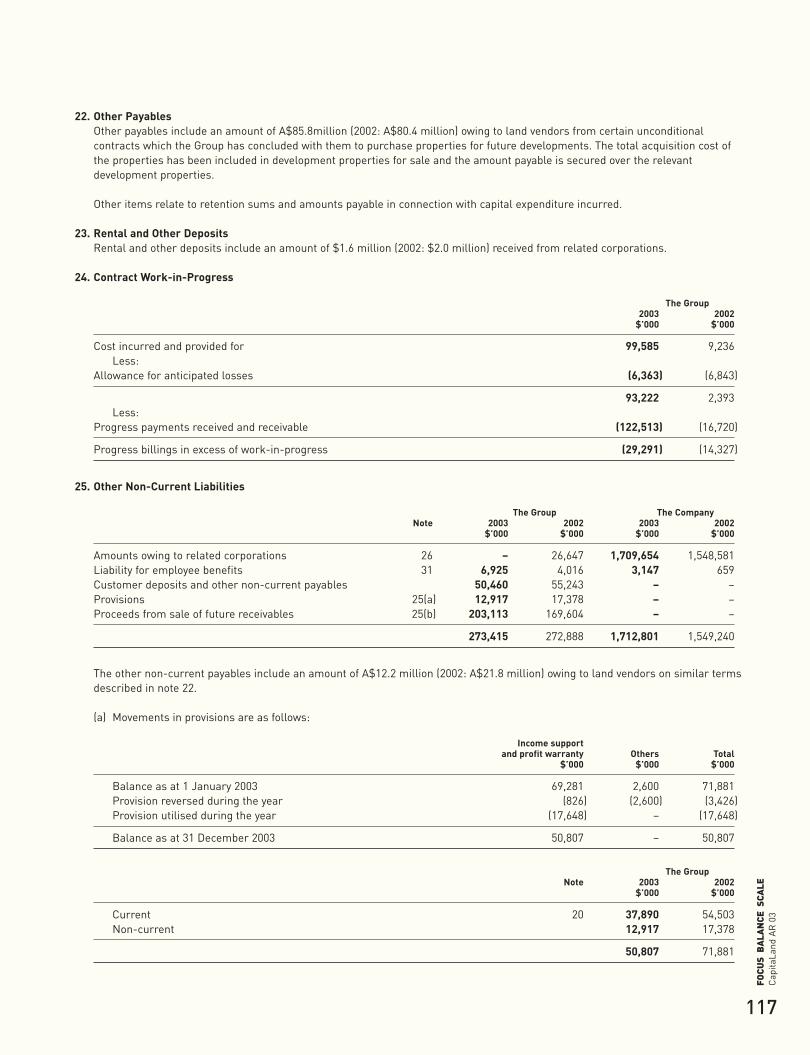
117
Cap
itaLa
ndA
R 0
3FO
CUS
BA
LAN
CE S
CALE
22. Other PayablesOther payables include an amount of A$85.8million (2002: A$80.4 million) owing to land vendors from certain unconditionalcontracts which the Group has concluded with them to purchase properties for future developments. The total acquisition cost ofthe properties has been included in development properties for sale and the amount payable is secured over the relevantdevelopment properties.
Other items relate to retention sums and amounts payable in connection with capital expenditure incurred.
23. Rental and Other DepositsRental and other deposits include an amount of $1.6 million (2002: $2.0 million) received from related corporations.
24. Contract Work-in-Progress
The Group2003 2002
$’000 $’000
Cost incurred and provided for 99,585 9,236Less:
Allowance for anticipated losses (6,363) (6,843)
93,222 2,393Less:
Progress payments received and receivable (122,513) (16,720)
Progress billings in excess of work-in-progress (29,291) (14,327)
25. Other Non-Current Liabilities
The Group The CompanyNote 2003 2002 2003 2002
$’000 $’000 $’000 $’000
Amounts owing to related corporations 26 – 26,647 1,709,654 1,548,581Liability for employee benefits 31 6,925 4,016 3,147 659Customer deposits and other non-current payables 50,460 55,243 – –Provisions 25(a) 12,917 17,378 – –Proceeds from sale of future receivables 25(b) 203,113 169,604 – –
273,415 272,888 1,712,801 1,549,240
The other non-current payables include an amount of A$12.2 million (2002: A$21.8 million) owing to land vendors on similar termsdescribed in note 22.
(a) Movements in provisions are as follows:
Income supportand profit warranty Others Total
$’000 $’000 $’000
Balance as at 1 January 2003 69,281 2,600 71,881Provision reversed during the year (826) (2,600) (3,426)Provision utilised during the year (17,648) – (17,648)
Balance as at 31 December 2003 50,807 – 50,807
The GroupNote 2003 2002
$’000 $’000
Current 20 37,890 54,503Non-current 12,917 17,378
50,807 71,881
CapL Acc03 proof 04_OKp73-151 17/03/2004 06:41 PM Page 117
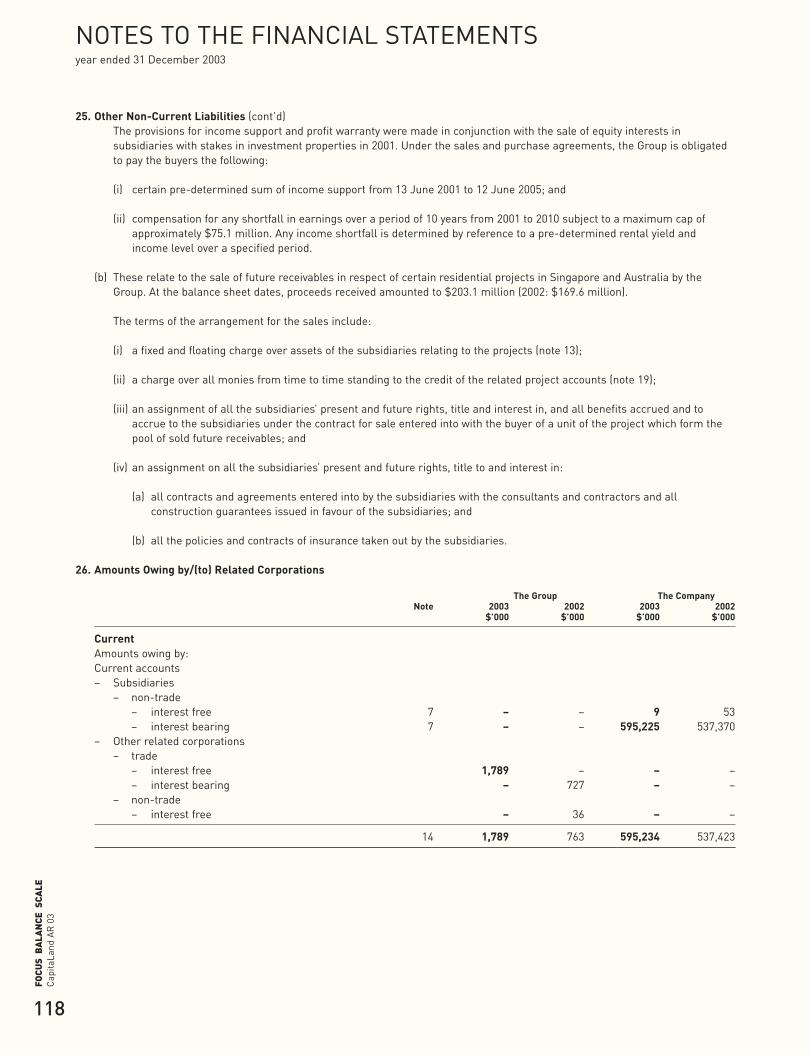
118
Cap
itaLa
ndA
R 0
3FO
CUS
BA
LAN
CE S
CALE
NOTES TO THE FINANCIAL STATEMENTS year ended 31 December 2003
25. Other Non-Current Liabilities (cont’d)The provisions for income support and profit warranty were made in conjunction with the sale of equity interests insubsidiaries with stakes in investment properties in 2001. Under the sales and purchase agreements, the Group is obligatedto pay the buyers the following:
(i) certain pre-determined sum of income support from 13 June 2001 to 12 June 2005; and
(ii) compensation for any shortfall in earnings over a period of 10 years from 2001 to 2010 subject to a maximum cap ofapproximately $75.1 million. Any income shortfall is determined by reference to a pre-determined rental yield andincome level over a specified period.
(b) These relate to the sale of future receivables in respect of certain residential projects in Singapore and Australia by theGroup. At the balance sheet dates, proceeds received amounted to $203.1 million (2002: $169.6 million).
The terms of the arrangement for the sales include:
(i) a fixed and floating charge over assets of the subsidiaries relating to the projects (note 13);
(ii) a charge over all monies from time to time standing to the credit of the related project accounts (note 19);
(iii) an assignment of all the subsidiaries’ present and future rights, title and interest in, and all benefits accrued and toaccrue to the subsidiaries under the contract for sale entered into with the buyer of a unit of the project which form thepool of sold future receivables; and
(iv) an assignment on all the subsidiaries’ present and future rights, title to and interest in:
(a) all contracts and agreements entered into by the subsidiaries with the consultants and contractors and allconstruction guarantees issued in favour of the subsidiaries; and
(b) all the policies and contracts of insurance taken out by the subsidiaries.
26. Amounts Owing by/(to) Related Corporations
The Group The CompanyNote 2003 2002 2003 2002
$’000 $’000 $’000 $’000
CurrentAmounts owing by:Current accounts– Subsidiaries
– non-trade– interest free 7 – – 9 53– interest bearing 7 – – 595,225 537,370
– Other related corporations– trade
– interest free 1,789 – – –– interest bearing – 727 – –
– non-trade– interest free – 36 – –
14 1,789 763 595,234 537,423
CapL Acc03 proof 04_OKp73-151 17/03/2004 06:41 PM Page 118
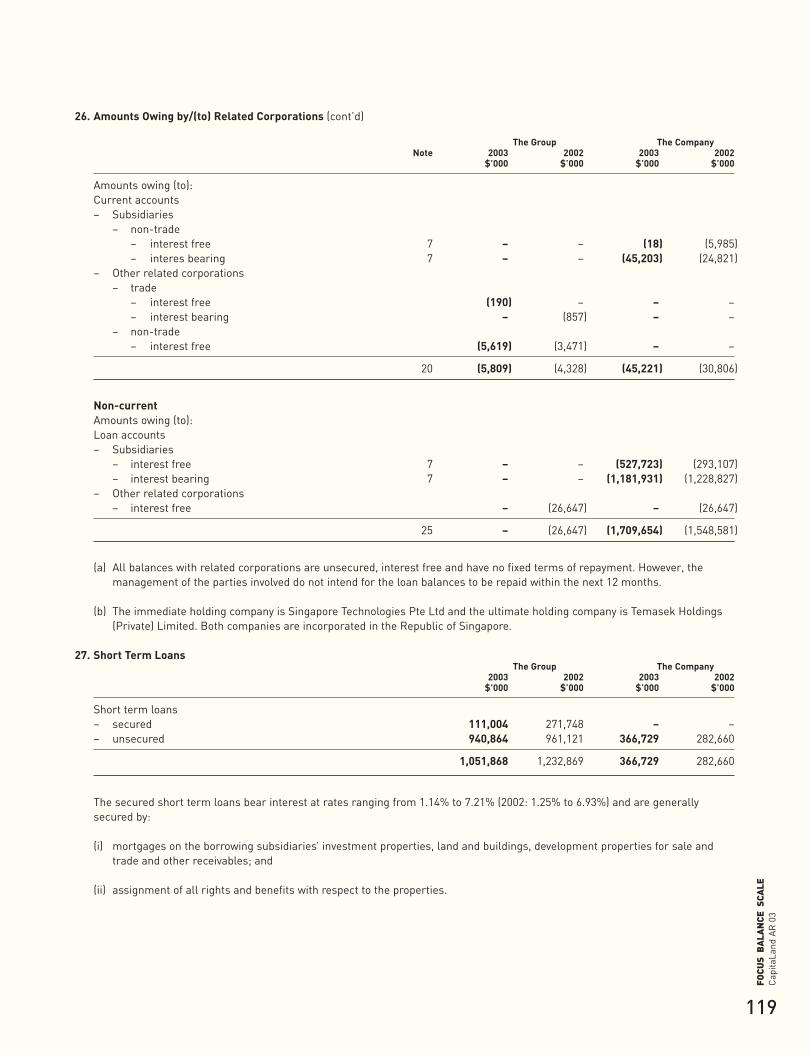
119
Cap
itaLa
ndA
R 0
3FO
CUS
BA
LAN
CE S
CALE
26. Amounts Owing by/(to) Related Corporations (cont’d)
The Group The CompanyNote 2003 2002 2003 2002
$’000 $’000 $’000 $’000
Amounts owing (to):Current accounts– Subsidiaries
– non-trade– interest free 7 – – (18) (5,985)– interes bearing 7 – – (45,203) (24,821)
– Other related corporations– trade
– interest free (190) – – –– interest bearing – (857) – –
– non-trade– interest free (5,619) (3,471) – –
20 (5,809) (4,328) (45,221) (30,806)
Non-currentAmounts owing (to):Loan accounts– Subsidiaries
– interest free 7 – – (527,723) (293,107)– interest bearing 7 – – (1,181,931) (1,228,827)
– Other related corporations– interest free – (26,647) – (26,647)
25 – (26,647) (1,709,654) (1,548,581)
(a) All balances with related corporations are unsecured, interest free and have no fixed terms of repayment. However, themanagement of the parties involved do not intend for the loan balances to be repaid within the next 12 months.
(b) The immediate holding company is Singapore Technologies Pte Ltd and the ultimate holding company is Temasek Holdings(Private) Limited. Both companies are incorporated in the Republic of Singapore.
27. Short Term LoansThe Group The Company
2003 2002 2003 2002$’000 $’000 $’000 $’000
Short term loans– secured 111,004 271,748 – –– unsecured 940,864 961,121 366,729 282,660
1,051,868 1,232,869 366,729 282,660
The secured short term loans bear interest at rates ranging from 1.14% to 7.21% (2002: 1.25% to 6.93%) and are generallysecured by:
(i) mortgages on the borrowing subsidiaries’ investment properties, land and buildings, development properties for sale andtrade and other receivables; and
(ii) assignment of all rights and benefits with respect to the properties.
CapL Acc03 proof 04_OKp73-151 17/03/2004 06:41 PM Page 119

120
Cap
itaLa
ndA
R 0
3FO
CUS
BA
LAN
CE S
CALE
NOTES TO THE FINANCIAL STATEMENTS year ended 31 December 2003
28. Term LoansThe Group The Company
2003 2002 2003 2002$’000 $’000 $’000 $’000
Term loans– secured 1,981,680 1,301,980 – –– unsecured 1,929,157 1,156,145 270,650 276,653
3,910,837 2,458,125 270,650 276,653
Repayable:– within 1 year 510,873 713,798 57,800 43,963– after 1 year 3,399,964 1,744,327 212,850 232,690
3,910,837 2,458,125 270,650 276,653
(i) Secured term loans
These comprise loans repayable:The Group The Company
2003 2002 2003 2002$’000 $’000 $’000 $’000
Within 1 year 382,123 302,706 – –
From 1 to 2 years 937,862 331,704 – –From 2 to 5 years 661,695 667,570 – –
After 1 year 1,599,557 999,274 – –
1,981,680 1,301,980 – –
The secured term loans bear interests ranging from 1.13% to 9.15% (2002: 1.13% to 8.50%) per annum. Details of the securedterm loans as at 31 December 2003 are as follows:
(a) Secured term loans include an amount of $200 million obtained in 2001, and due to mature in June 2010 with an early callredemption in June 2007. The loan bears interest from 3.71% to 4.79% per annum and is secured by a fixed and floatingcharge on the assets of the subsidiaries related to the projects, assignment of the sale and rental proceeds of the projectsand a charge on the monies in the Project Account of the projects.
(b) A bank loan of $90 million was obtained in 2003 and due to mature on 9 September 2005. The loan bears interest of 1.58% perannum and is secured by a fixed and floating charge on the assets of the subsidiary relating to a residential project, assignmentof the sale and rental proceeds of this project and a charge on the monies in the Project Account of the same project.
(c) A bank loan of HK$370 million (2002: HK$380 million) equivalent to $83 million (2002: $86 million) was secured by amortgage over an investment property of a borrowing subsidiary. The loan will be repaid on 30 November 2005.
(d) Subsidiary, Australand Holdings Limited (“Australand”), maintains a 2-year evergreen facility and the structure is a A$500million (2002: A$450 million) cash tranche and a A$100 million (2002: A$50 million) bank guarantee facility. The facility issecured by fixed and floating charges over the assets of Australand and its subsidiaries. Development properties for sale andreceivables were also subjected to registered equitable mortgages and specific project secured charges. The subsidiariesentered into a Deed of Guarantee and Indemnity whereby the subsidiaries guarantee the repayment of borrowings byAustraland. The interest rate prevailing as at 31 December 2003 was 6.53% (2002: 5.49%).
(e) Other term loans are generally secured by:
– mortgages on the borrowing subsidiaries’ property, plant and equipment, investment properties, properties underdevelopment, development properties for sale and trade receivables;
– pledge of shares of a subsidiary;
– pledge of fixed deposits; and
– assignments of all rights and benefits with respect to the properties.
CapL Acc03 proof 04_OKp73-151 17/03/2004 06:41 PM Page 120
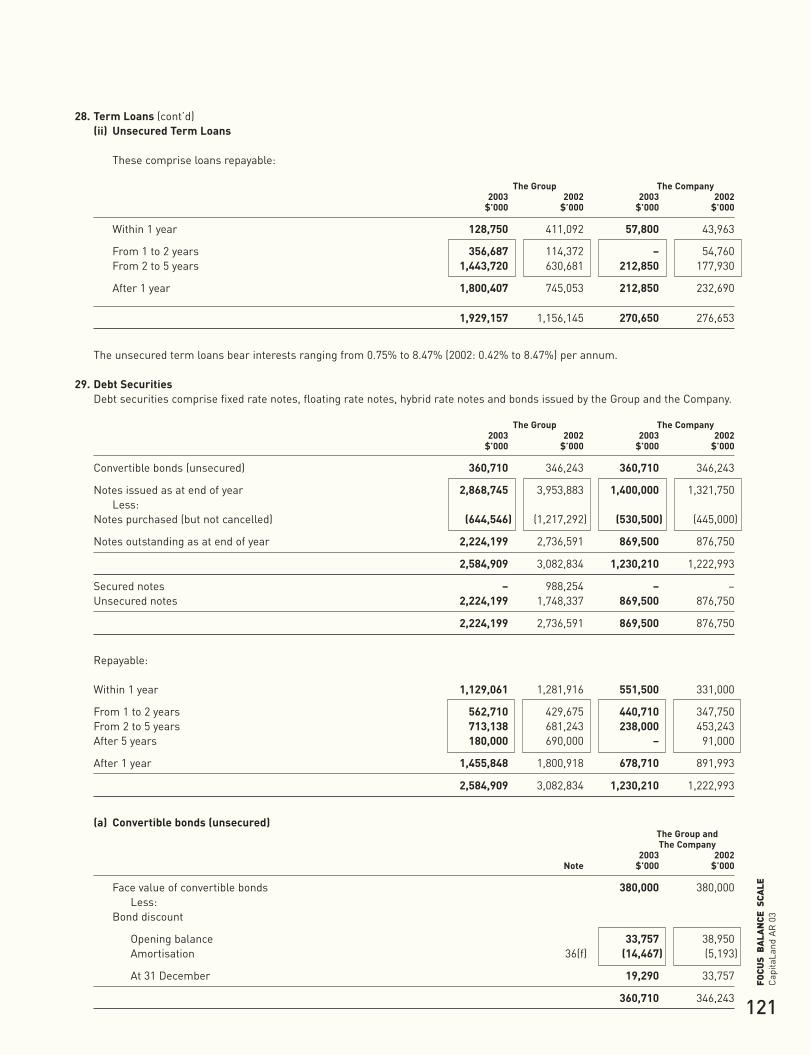
121
Cap
itaLa
ndA
R 0
3FO
CUS
BA
LAN
CE S
CALE
28. Term Loans (cont’d)(ii) Unsecured Term Loans
These comprise loans repayable:
The Group The Company2003 2002 2003 2002
$’000 $’000 $’000 $’000
Within 1 year 128,750 411,092 57,800 43,963
From 1 to 2 years 356,687 114,372 – 54,760From 2 to 5 years 1,443,720 630,681 212,850 177,930
After 1 year 1,800,407 745,053 212,850 232,690
1,929,157 1,156,145 270,650 276,653
The unsecured term loans bear interests ranging from 0.75% to 8.47% (2002: 0.42% to 8.47%) per annum.
29. Debt SecuritiesDebt securities comprise fixed rate notes, floating rate notes, hybrid rate notes and bonds issued by the Group and the Company.
The Group The Company2003 2002 2003 2002
$’000 $’000 $’000 $’000
Convertible bonds (unsecured) 360,710 346,243 360,710 346,243
Notes issued as at end of year 2,868,745 3,953,883 1,400,000 1,321,750Less:
Notes purchased (but not cancelled) (644,546) (1,217,292) (530,500) (445,000)
Notes outstanding as at end of year 2,224,199 2,736,591 869,500 876,750
2,584,909 3,082,834 1,230,210 1,222,993
Secured notes – 988,254 – –Unsecured notes 2,224,199 1,748,337 869,500 876,750
2,224,199 2,736,591 869,500 876,750
Repayable:
Within 1 year 1,129,061 1,281,916 551,500 331,000
From 1 to 2 years 562,710 429,675 440,710 347,750From 2 to 5 years 713,138 681,243 238,000 453,243After 5 years 180,000 690,000 – 91,000
After 1 year 1,455,848 1,800,918 678,710 891,993
2,584,909 3,082,834 1,230,210 1,222,993
(a) Convertible bonds (unsecured)The Group andThe Company
2003 2002Note $’000 $’000
Face value of convertible bonds 380,000 380,000Less:
Bond discount
Opening balance 33,757 38,950Amortisation 36(f) (14,467) (5,193)
At 31 December 19,290 33,757
360,710 346,243
CapL Acc03 proof 04_OKp73-151 17/03/2004 06:41 PM Page 121
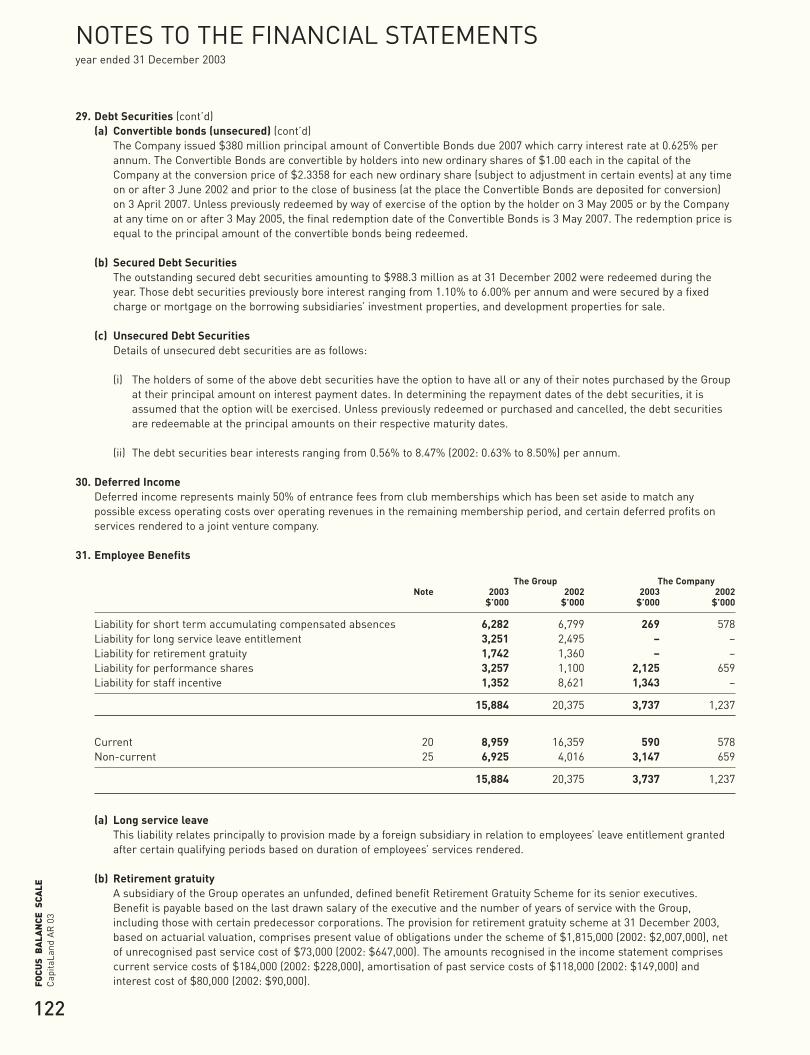
122
Cap
itaLa
ndA
R 0
3FO
CUS
BA
LAN
CE S
CALE
NOTES TO THE FINANCIAL STATEMENTS year ended 31 December 2003
29. Debt Securities (cont’d)(a) Convertible bonds (unsecured) (cont’d)
The Company issued $380 million principal amount of Convertible Bonds due 2007 which carry interest rate at 0.625% perannum. The Convertible Bonds are convertible by holders into new ordinary shares of $1.00 each in the capital of theCompany at the conversion price of $2.3358 for each new ordinary share (subject to adjustment in certain events) at any timeon or after 3 June 2002 and prior to the close of business (at the place the Convertible Bonds are deposited for conversion)on 3 April 2007. Unless previously redeemed by way of exercise of the option by the holder on 3 May 2005 or by the Companyat any time on or after 3 May 2005, the final redemption date of the Convertible Bonds is 3 May 2007. The redemption price isequal to the principal amount of the convertible bonds being redeemed.
(b) Secured Debt SecuritiesThe outstanding secured debt securities amounting to $988.3 million as at 31 December 2002 were redeemed during theyear. Those debt securities previously bore interest ranging from 1.10% to 6.00% per annum and were secured by a fixedcharge or mortgage on the borrowing subsidiaries’ investment properties, and development properties for sale.
(c) Unsecured Debt SecuritiesDetails of unsecured debt securities are as follows:
(i) The holders of some of the above debt securities have the option to have all or any of their notes purchased by the Groupat their principal amount on interest payment dates. In determining the repayment dates of the debt securities, it isassumed that the option will be exercised. Unless previously redeemed or purchased and cancelled, the debt securitiesare redeemable at the principal amounts on their respective maturity dates.
(ii) The debt securities bear interests ranging from 0.56% to 8.47% (2002: 0.63% to 8.50%) per annum.
30. Deferred IncomeDeferred income represents mainly 50% of entrance fees from club memberships which has been set aside to match anypossible excess operating costs over operating revenues in the remaining membership period, and certain deferred profits onservices rendered to a joint venture company.
31. Employee Benefits
The Group The CompanyNote 2003 2002 2003 2002
$’000 $’000 $’000 $’000
Liability for short term accumulating compensated absences 6,282 6,799 269 578Liability for long service leave entitlement 3,251 2,495 – –Liability for retirement gratuity 1,742 1,360 – –Liability for performance shares 3,257 1,100 2,125 659Liability for staff incentive 1,352 8,621 1,343 –
15,884 20,375 3,737 1,237
Current 20 8,959 16,359 590 578Non-current 25 6,925 4,016 3,147 659
15,884 20,375 3,737 1,237
(a) Long service leaveThis liability relates principally to provision made by a foreign subsidiary in relation to employees’ leave entitlement grantedafter certain qualifying periods based on duration of employees’ services rendered.
(b) Retirement gratuityA subsidiary of the Group operates an unfunded, defined benefit Retirement Gratuity Scheme for its senior executives.Benefit is payable based on the last drawn salary of the executive and the number of years of service with the Group,including those with certain predecessor corporations. The provision for retirement gratuity scheme at 31 December 2003,based on actuarial valuation, comprises present value of obligations under the scheme of $1,815,000 (2002: $2,007,000), netof unrecognised past service cost of $73,000 (2002: $647,000). The amounts recognised in the income statement comprisescurrent service costs of $184,000 (2002: $228,000), amortisation of past service costs of $118,000 (2002: $149,000) andinterest cost of $80,000 (2002: $90,000).
CapL Acc03 proof 04_OKp73-151 17/03/2004 06:41 PM Page 122
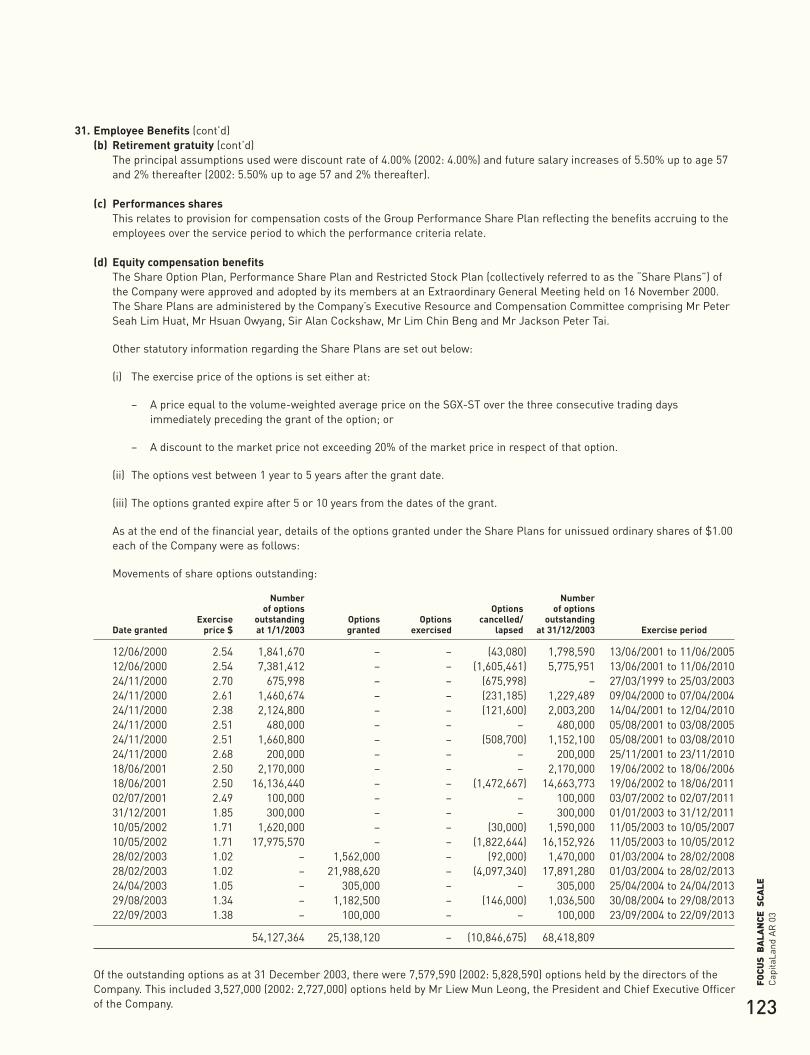
123
Cap
itaLa
ndA
R 0
3FO
CUS
BA
LAN
CE S
CALE
31. Employee Benefits (cont’d)(b) Retirement gratuity (cont’d)
The principal assumptions used were discount rate of 4.00% (2002: 4.00%) and future salary increases of 5.50% up to age 57and 2% thereafter (2002: 5.50% up to age 57 and 2% thereafter).
(c) Performances sharesThis relates to provision for compensation costs of the Group Performance Share Plan reflecting the benefits accruing to theemployees over the service period to which the performance criteria relate.
(d) Equity compensation benefitsThe Share Option Plan, Performance Share Plan and Restricted Stock Plan (collectively referred to as the “Share Plans”) ofthe Company were approved and adopted by its members at an Extraordinary General Meeting held on 16 November 2000.The Share Plans are administered by the Company’s Executive Resource and Compensation Committee comprising Mr PeterSeah Lim Huat, Mr Hsuan Owyang, Sir Alan Cockshaw, Mr Lim Chin Beng and Mr Jackson Peter Tai.
Other statutory information regarding the Share Plans are set out below:
(i) The exercise price of the options is set either at:
– A price equal to the volume-weighted average price on the SGX-ST over the three consecutive trading daysimmediately preceding the grant of the option; or
– A discount to the market price not exceeding 20% of the market price in respect of that option.
(ii) The options vest between 1 year to 5 years after the grant date.
(iii) The options granted expire after 5 or 10 years from the dates of the grant.
As at the end of the financial year, details of the options granted under the Share Plans for unissued ordinary shares of $1.00each of the Company were as follows:
Movements of share options outstanding:
Number Numberof options Options of options
Exercise outstanding Options Options cancelled/ outstandingDate granted price $ at 1/1/2003 granted exercised lapsed at 31/12/2003 Exercise period
12/06/2000 2.54 1,841,670 – – (43,080) 1,798,590 13/06/2001 to 11/06/200512/06/2000 2.54 7,381,412 – – (1,605,461) 5,775,951 13/06/2001 to 11/06/201024/11/2000 2.70 675,998 – – (675,998) – 27/03/1999 to 25/03/200324/11/2000 2.61 1,460,674 – – (231,185) 1,229,489 09/04/2000 to 07/04/200424/11/2000 2.38 2,124,800 – – (121,600) 2,003,200 14/04/2001 to 12/04/201024/11/2000 2.51 480,000 – – – 480,000 05/08/2001 to 03/08/200524/11/2000 2.51 1,660,800 – – (508,700) 1,152,100 05/08/2001 to 03/08/201024/11/2000 2.68 200,000 – – – 200,000 25/11/2001 to 23/11/201018/06/2001 2.50 2,170,000 – – – 2,170,000 19/06/2002 to 18/06/200618/06/2001 2.50 16,136,440 – – (1,472,667) 14,663,773 19/06/2002 to 18/06/201102/07/2001 2.49 100,000 – – – 100,000 03/07/2002 to 02/07/201131/12/2001 1.85 300,000 – – – 300,000 01/01/2003 to 31/12/201110/05/2002 1.71 1,620,000 – – (30,000) 1,590,000 11/05/2003 to 10/05/200710/05/2002 1.71 17,975,570 – – (1,822,644) 16,152,926 11/05/2003 to 10/05/201228/02/2003 1.02 – 1,562,000 – (92,000) 1,470,000 01/03/2004 to 28/02/200828/02/2003 1.02 – 21,988,620 – (4,097,340) 17,891,280 01/03/2004 to 28/02/201324/04/2003 1.05 – 305,000 – – 305,000 25/04/2004 to 24/04/201329/08/2003 1.34 – 1,182,500 – (146,000) 1,036,500 30/08/2004 to 29/08/201322/09/2003 1.38 – 100,000 – – 100,000 23/09/2004 to 22/09/2013
54,127,364 25,138,120 – (10,846,675) 68,418,809
Of the outstanding options as at 31 December 2003, there were 7,579,590 (2002: 5,828,590) options held by the directors of theCompany. This included 3,527,000 (2002: 2,727,000) options held by Mr Liew Mun Leong, the President and Chief Executive Officerof the Company.
CapL Acc03 proof 04_OKp73-151 17/03/2004 06:41 PM Page 123
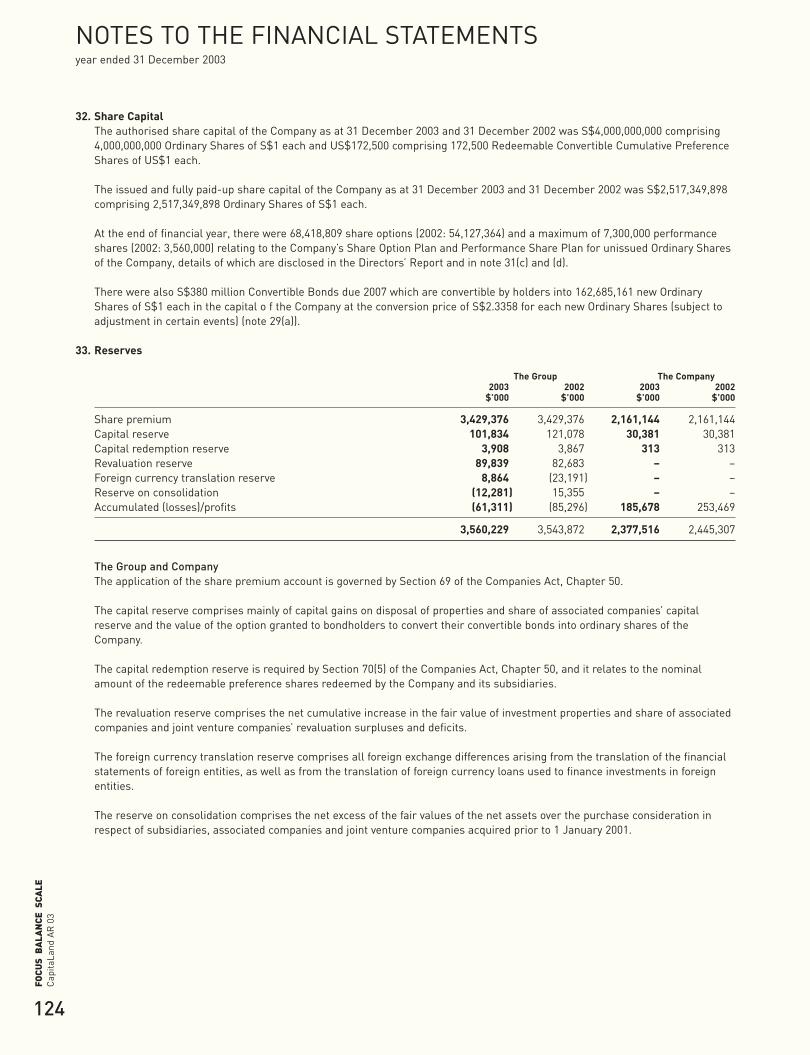
124
Cap
itaLa
ndA
R 0
3FO
CUS
BA
LAN
CE S
CALE
NOTES TO THE FINANCIAL STATEMENTS year ended 31 December 2003
32. Share CapitalThe authorised share capital of the Company as at 31 December 2003 and 31 December 2002 was S$4,000,000,000 comprising4,000,000,000 Ordinary Shares of S$1 each and US$172,500 comprising 172,500 Redeemable Convertible Cumulative PreferenceShares of US$1 each.
The issued and fully paid-up share capital of the Company as at 31 December 2003 and 31 December 2002 was S$2,517,349,898comprising 2,517,349,898 Ordinary Shares of S$1 each.
At the end of financial year, there were 68,418,809 share options (2002: 54,127,364) and a maximum of 7,300,000 performanceshares (2002: 3,560,000) relating to the Company’s Share Option Plan and Performance Share Plan for unissued Ordinary Sharesof the Company, details of which are disclosed in the Directors’ Report and in note 31(c) and (d).
There were also S$380 million Convertible Bonds due 2007 which are convertible by holders into 162,685,161 new OrdinaryShares of S$1 each in the capital o f the Company at the conversion price of S$2.3358 for each new Ordinary Shares (subject toadjustment in certain events) (note 29(a)).
33. Reserves
The Group The Company2003 2002 2003 2002
$’000 $’000 $’000 $’000
Share premium 3,429,376 3,429,376 2,161,144 2,161,144Capital reserve 101,834 121,078 30,381 30,381Capital redemption reserve 3,908 3,867 313 313Revaluation reserve 89,839 82,683 – –Foreign currency translation reserve 8,864 (23,191) – –Reserve on consolidation (12,281) 15,355 – –Accumulated (losses)/profits (61,311) (85,296) 185,678 253,469
3,560,229 3,543,872 2,377,516 2,445,307
The Group and CompanyThe application of the share premium account is governed by Section 69 of the Companies Act, Chapter 50.
The capital reserve comprises mainly of capital gains on disposal of properties and share of associated companies’ capitalreserve and the value of the option granted to bondholders to convert their convertible bonds into ordinary shares of theCompany.
The capital redemption reserve is required by Section 70(5) of the Companies Act, Chapter 50, and it relates to the nominalamount of the redeemable preference shares redeemed by the Company and its subsidiaries.
The revaluation reserve comprises the net cumulative increase in the fair value of investment properties and share of associatedcompanies and joint venture companies’ revaluation surpluses and deficits.
The foreign currency translation reserve comprises all foreign exchange differences arising from the translation of the financialstatements of foreign entities, as well as from the translation of foreign currency loans used to finance investments in foreignentities.
The reserve on consolidation comprises the net excess of the fair values of the net assets over the purchase consideration inrespect of subsidiaries, associated companies and joint venture companies acquired prior to 1 January 2001.
CapL Acc03 proof 04_OKp73-151 17/03/2004 06:41 PM Page 124
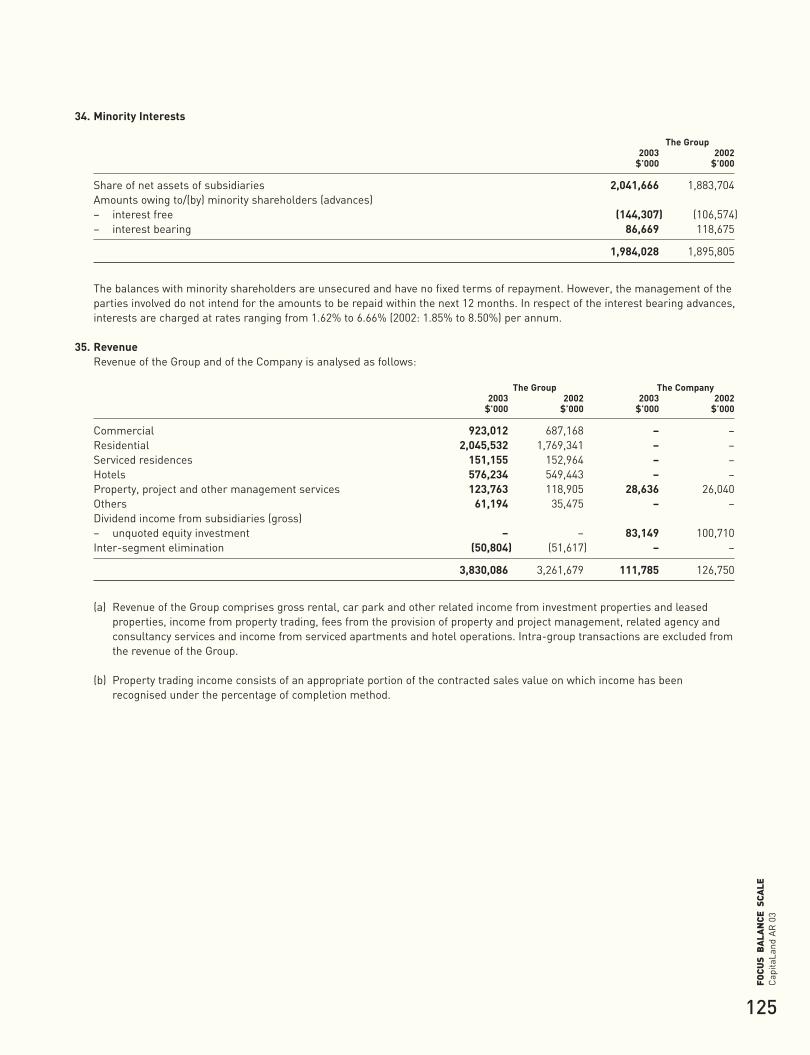
125
Cap
itaLa
ndA
R 0
3FO
CUS
BA
LAN
CE S
CALE
34. Minority Interests
The Group2003 2002
$’000 $’000
Share of net assets of subsidiaries 2,041,666 1,883,704Amounts owing to/(by) minority shareholders (advances)– interest free (144,307) (106,574)– interest bearing 86,669 118,675
1,984,028 1,895,805
The balances with minority shareholders are unsecured and have no fixed terms of repayment. However, the management of theparties involved do not intend for the amounts to be repaid within the next 12 months. In respect of the interest bearing advances,interests are charged at rates ranging from 1.62% to 6.66% (2002: 1.85% to 8.50%) per annum.
35. RevenueRevenue of the Group and of the Company is analysed as follows:
The Group The Company2003 2002 2003 2002
$’000 $’000 $’000 $’000
Commercial 923,012 687,168 – –Residential 2,045,532 1,769,341 – –Serviced residences 151,155 152,964 – –Hotels 576,234 549,443 – –Property, project and other management services 123,763 118,905 28,636 26,040Others 61,194 35,475 – –Dividend income from subsidiaries (gross)– unquoted equity investment – – 83,149 100,710Inter-segment elimination (50,804) (51,617) – –
3,830,086 3,261,679 111,785 126,750
(a) Revenue of the Group comprises gross rental, car park and other related income from investment properties and leasedproperties, income from property trading, fees from the provision of property and project management, related agency andconsultancy services and income from serviced apartments and hotel operations. Intra-group transactions are excluded fromthe revenue of the Group.
(b) Property trading income consists of an appropriate portion of the contracted sales value on which income has beenrecognised under the percentage of completion method.
CapL Acc03 proof 04_OKp73-151 17/03/2004 06:41 PM Page 125
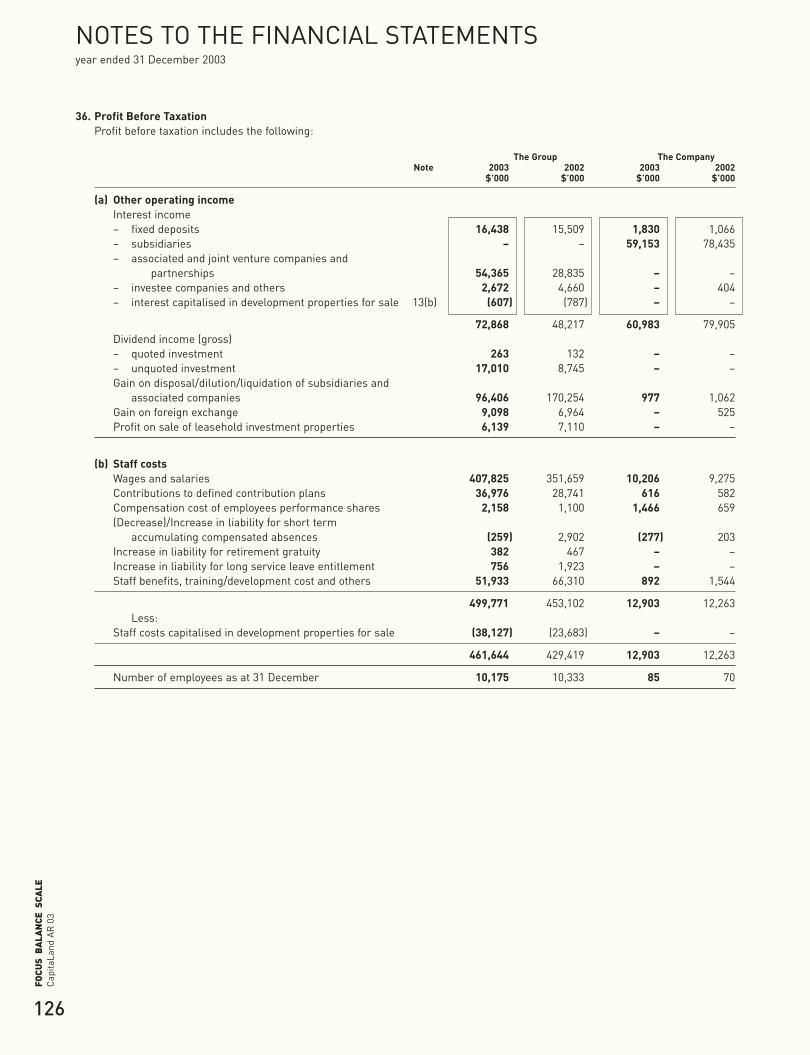
126
Cap
itaLa
ndA
R 0
3FO
CUS
BA
LAN
CE S
CALE
NOTES TO THE FINANCIAL STATEMENTS year ended 31 December 2003
36. Profit Before TaxationProfit before taxation includes the following:
The Group The CompanyNote 2003 2002 2003 2002
$’000 $’000 $’000 $’000
(a) Other operating incomeInterest income– fixed deposits 16,438 15,509 1,830 1,066– subsidiaries – – 59,153 78,435– associated and joint venture companies and
partnerships 54,365 28,835 – –– investee companies and others 2,672 4,660 – 404– interest capitalised in development properties for sale 13(b) (607) (787) – –
72,868 48,217 60,983 79,905Dividend income (gross)– quoted investment 263 132 – –– unquoted investment 17,010 8,745 – –Gain on disposal/dilution/liquidation of subsidiaries and
associated companies 96,406 170,254 977 1,062Gain on foreign exchange 9,098 6,964 – 525Profit on sale of leasehold investment properties 6,139 7,110 – –
(b) Staff costsWages and salaries 407,825 351,659 10,206 9,275Contributions to defined contribution plans 36,976 28,741 616 582Compensation cost of employees performance shares 2,158 1,100 1,466 659(Decrease)/Increase in liability for short term
accumulating compensated absences (259) 2,902 (277) 203Increase in liability for retirement gratuity 382 467 – –Increase in liability for long service leave entitlement 756 1,923 – –Staff benefits, training/development cost and others 51,933 66,310 892 1,544
499,771 453,102 12,903 12,263Less:
Staff costs capitalised in development properties for sale (38,127) (23,683) – –
461,644 429,419 12,903 12,263
Number of employees as at 31 December 10,175 10,333 85 70
CapL Acc03 proof 04_OKp73-151 17/03/2004 06:41 PM Page 126
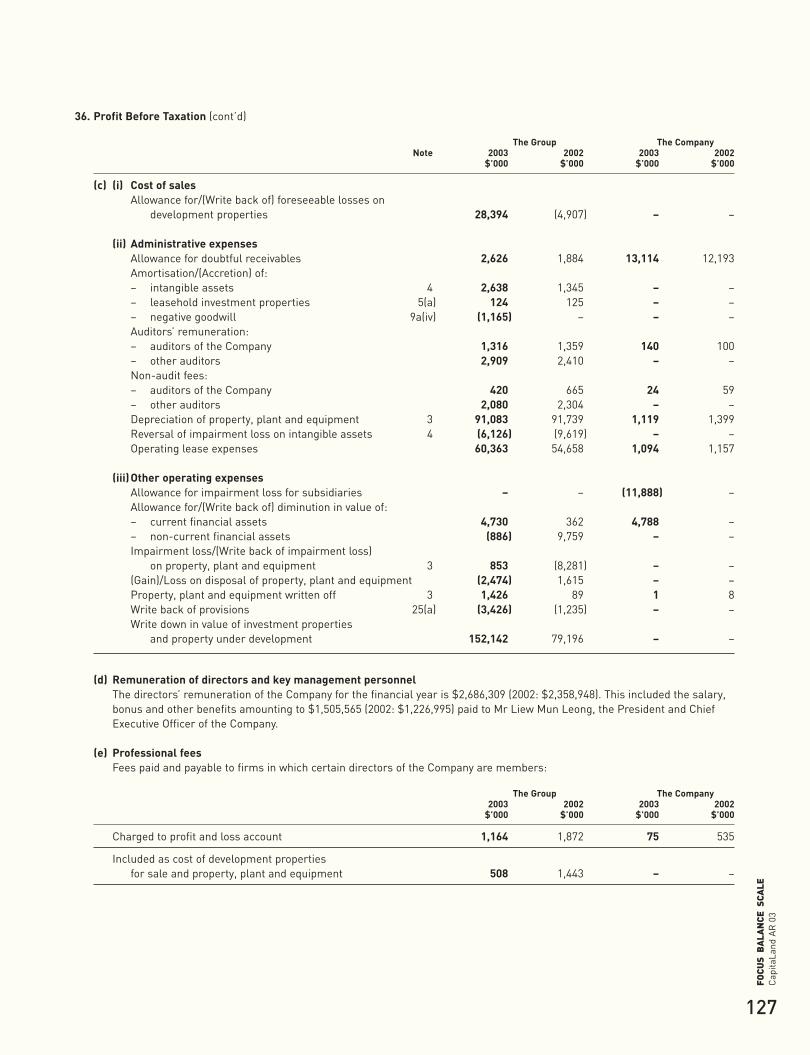
127
Cap
itaLa
ndA
R 0
3FO
CUS
BA
LAN
CE S
CALE
36. Profit Before Taxation (cont’d)
The Group The CompanyNote 2003 2002 2003 2002
$’000 $’000 $’000 $’000
(c) (i) Cost of salesAllowance for/(Write back of) foreseeable losses on
development properties 28,394 (4,907) – –
(ii) Administrative expensesAllowance for doubtful receivables 2,626 1,884 13,114 12,193Amortisation/(Accretion) of:– intangible assets 4 2,638 1,345 – –– leasehold investment properties 5(a) 124 125 – –– negative goodwill 9a(iv) (1,165) – – –Auditors’ remuneration:– auditors of the Company 1,316 1,359 140 100– other auditors 2,909 2,410 – –Non-audit fees:– auditors of the Company 420 665 24 59– other auditors 2,080 2,304 – –Depreciation of property, plant and equipment 3 91,083 91,739 1,119 1,399Reversal of impairment loss on intangible assets 4 (6,126) (9,619) – –Operating lease expenses 60,363 54,658 1,094 1,157
(iii)Other operating expensesAllowance for impairment loss for subsidiaries – – (11,888) –Allowance for/(Write back of) diminution in value of:– current financial assets 4,730 362 4,788 –– non-current financial assets (886) 9,759 – –Impairment loss/(Write back of impairment loss)
on property, plant and equipment 3 853 (8,281) – –(Gain)/Loss on disposal of property, plant and equipment (2,474) 1,615 – –Property, plant and equipment written off 3 1,426 89 1 8Write back of provisions 25(a) (3,426) (1,235) – –Write down in value of investment properties
and property under development 152,142 79,196 – –
(d) Remuneration of directors and key management personnelThe directors’ remuneration of the Company for the financial year is $2,686,309 (2002: $2,358,948). This included the salary,bonus and other benefits amounting to $1,505,565 (2002: $1,226,995) paid to Mr Liew Mun Leong, the President and ChiefExecutive Officer of the Company.
(e) Professional feesFees paid and payable to firms in which certain directors of the Company are members:
The Group The Company2003 2002 2003 2002
$’000 $’000 $’000 $’000
Charged to profit and loss account 1,164 1,872 75 535
Included as cost of development propertiesfor sale and property, plant and equipment 508 1,443 – –
CapL Acc03 proof 04_OKp73-151 17/03/2004 06:41 PM Page 127
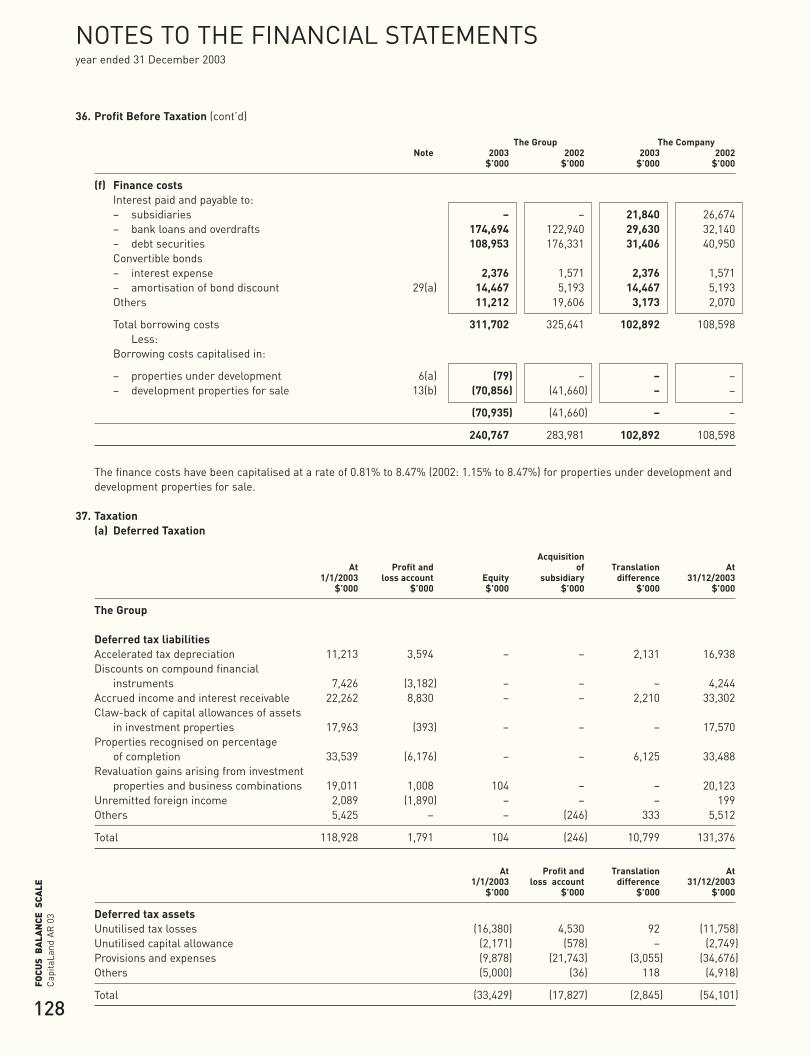
128
Cap
itaLa
ndA
R 0
3FO
CUS
BA
LAN
CE S
CALE
NOTES TO THE FINANCIAL STATEMENTS year ended 31 December 2003
36. Profit Before Taxation (cont’d)
The Group The CompanyNote 2003 2002 2003 2002
$’000 $’000 $’000 $’000
(f) Finance costsInterest paid and payable to:– subsidiaries – – 21,840 26,674– bank loans and overdrafts 174,694 122,940 29,630 32,140– debt securities 108,953 176,331 31,406 40,950Convertible bonds– interest expense 2,376 1,571 2,376 1,571– amortisation of bond discount 29(a) 14,467 5,193 14,467 5,193Others 11,212 19,606 3,173 2,070
Total borrowing costs 311,702 325,641 102,892 108,598Less:
Borrowing costs capitalised in:
– properties under development 6(a) (79) – – –– development properties for sale 13(b) (70,856) (41,660) – –
(70,935) (41,660) – –
240,767 283,981 102,892 108,598
The finance costs have been capitalised at a rate of 0.81% to 8.47% (2002: 1.15% to 8.47%) for properties under development anddevelopment properties for sale.
37. Taxation(a) Deferred Taxation
AcquisitionAt Profit and of Translation At
1/1/2003 loss account Equity subsidiary difference 31/12/2003$’000 $’000 $’000 $’000 $’000 $’000
The Group
Deferred tax liabilitiesAccelerated tax depreciation 11,213 3,594 – – 2,131 16,938Discounts on compound financial
instruments 7,426 (3,182) – – – 4,244Accrued income and interest receivable 22,262 8,830 – – 2,210 33,302Claw-back of capital allowances of assets
in investment properties 17,963 (393) – – – 17,570Properties recognised on percentage
of completion 33,539 (6,176) – – 6,125 33,488Revaluation gains arising from investment
properties and business combinations 19,011 1,008 104 – – 20,123Unremitted foreign income 2,089 (1,890) – – – 199Others 5,425 – – (246) 333 5,512
Total 118,928 1,791 104 (246) 10,799 131,376
At Profit and Translation At1/1/2003 loss account difference 31/12/2003
$’000 $’000 $’000 $’000
Deferred tax assetsUnutilised tax losses (16,380) 4,530 92 (11,758)Unutilised capital allowance (2,171) (578) – (2,749)Provisions and expenses (9,878) (21,743) (3,055) (34,676)Others (5,000) (36) 118 (4,918)
Total (33,429) (17,827) (2,845) (54,101)
CapL Acc03 proof 04_OKp73-151 17/03/2004 06:41 PM Page 128

129
Cap
itaLa
ndA
R 0
3FO
CUS
BA
LAN
CE S
CALE
37. Taxation (cont’d)(a) Deferred Taxation (cont’d)
At Profit and Translation At1/1/2003 loss account difference 31/12/2003
$’000 $’000 $’000 $’000
The Company
Deferred tax liabilitiesDiscounts on compound financial instruments 7,426 (3,182) – 4,244
Total 7,426 (3,182) – 4,244
Deferred tax liabilities and assets are offset when there is legally enforceable right to set off current tax assets against currenttax liabilities and when the deferred taxes relate to the same taxation authority.
The Group The Company2003 2002 2003 2002
$’000 $’000 $’000 $’000
Deferred tax liabilities 94,072 115,086 4,244 7,426Deferred tax assets (16,797) (29,587) – –
At 31 December 77,275 85,499 4,244 7,426
Deferred tax liabilities of $1.5 million (2002: $3.3 million) have not been recognised for withholding and other taxes that would bepayable upon the remittance of earnings of certain subsidiaries, as such amounts have been permanently reinvested. The totalunremitted earnings as at 31 December 2003 amounted to $19.1 million (2002: $32.8 million).
The Group The Company2003 2002 2003 2002
$’000 $’000 $’000 $’000
(b) Tax ChargeCurrent tax expense
The Company and its subsidiaries– Based on current year’s results 150,942 76,206 9,703 12,003– Under/(Over)provision in respect of prior years 958 (6,175) – 2,004– Group relief – – 796 5,997
151,900 70,031 10,499 20,004
– Based on current year’s results– Associated companies 10,415 11,373 – –– Joint venture companies 4,013 1,969 – –
14,428 13,342 – –
166,328 83,373 10,499 20,004
Deferred tax expense
The Company and its subsidiaries– Movements in temporary differences (14,620) 10,936 (3,182) (1,358)– Reduction in tax rates – (1,176) – (23)– Overprovision in respect of prior years (1,416) (6,412) – –
(16,036) 3,348 (3,182) (1,381)
150,292 86,721 7,317 18,623
CapL Acc03 proof 04_OKp73-151 17/03/2004 06:41 PM Page 129
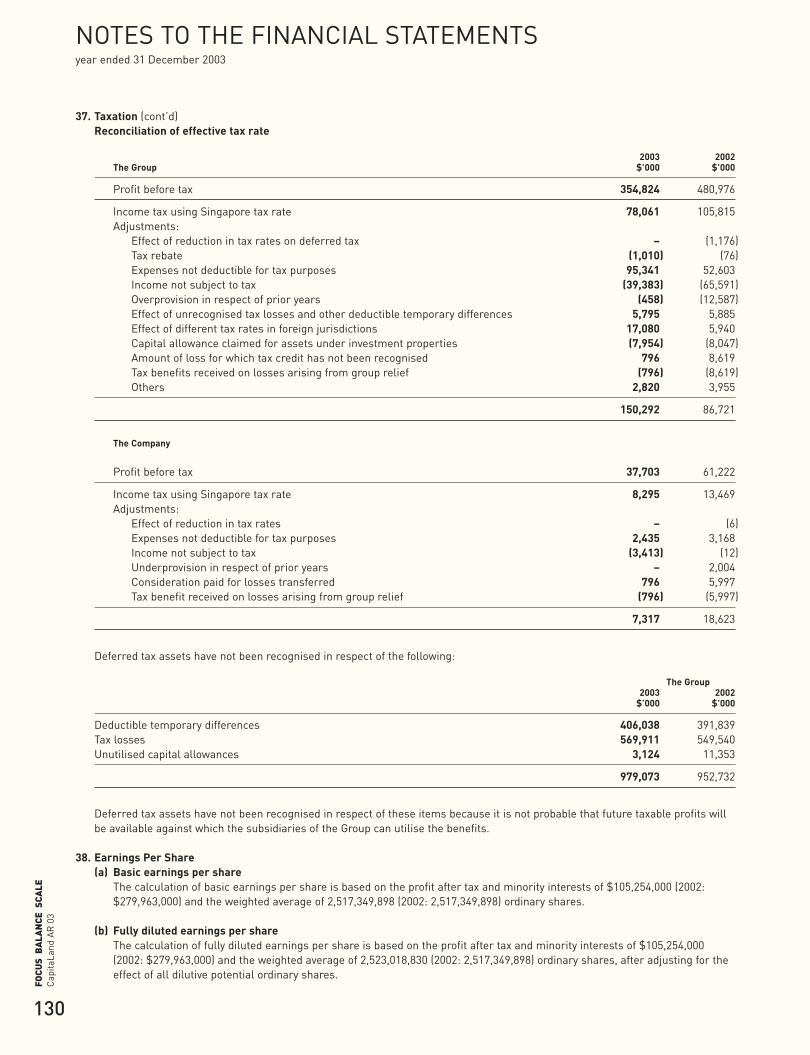
130
Cap
itaLa
ndA
R 0
3FO
CUS
BA
LAN
CE S
CALE
NOTES TO THE FINANCIAL STATEMENTS year ended 31 December 2003
37. Taxation (cont’d)Reconciliation of effective tax rate
2003 2002The Group $’000 $’000
Profit before tax 354,824 480,976
Income tax using Singapore tax rate 78,061 105,815Adjustments:
Effect of reduction in tax rates on deferred tax – (1,176)Tax rebate (1,010) (76)Expenses not deductible for tax purposes 95,341 52,603Income not subject to tax (39,383) (65,591)Overprovision in respect of prior years (458) (12,587)Effect of unrecognised tax losses and other deductible temporary differences 5,795 5,885Effect of different tax rates in foreign jurisdictions 17,080 5,940Capital allowance claimed for assets under investment properties (7,954) (8,047)Amount of loss for which tax credit has not been recognised 796 8,619Tax benefits received on losses arising from group relief (796) (8,619)Others 2,820 3,955
150,292 86,721
The Company
Profit before tax 37,703 61,222
Income tax using Singapore tax rate 8,295 13,469Adjustments:
Effect of reduction in tax rates – (6)Expenses not deductible for tax purposes 2,435 3,168Income not subject to tax (3,413) (12)Underprovision in respect of prior years – 2,004Consideration paid for losses transferred 796 5,997Tax benefit received on losses arising from group relief (796) (5,997)
7,317 18,623
Deferred tax assets have not been recognised in respect of the following:
The Group2003 2002
$’000 $’000
Deductible temporary differences 406,038 391,839Tax losses 569,911 549,540Unutilised capital allowances 3,124 11,353
979,073 952,732
Deferred tax assets have not been recognised in respect of these items because it is not probable that future taxable profits willbe available against which the subsidiaries of the Group can utilise the benefits.
38. Earnings Per Share(a) Basic earnings per share
The calculation of basic earnings per share is based on the profit after tax and minority interests of $105,254,000 (2002:$279,963,000) and the weighted average of 2,517,349,898 (2002: 2,517,349,898) ordinary shares.
(b) Fully diluted earnings per shareThe calculation of fully diluted earnings per share is based on the profit after tax and minority interests of $105,254,000(2002: $279,963,000) and the weighted average of 2,523,018,830 (2002: 2,517,349,898) ordinary shares, after adjusting for theeffect of all dilutive potential ordinary shares.
CapL Acc03 proof 04_OKp73-151 17/03/2004 06:41 PM Page 130
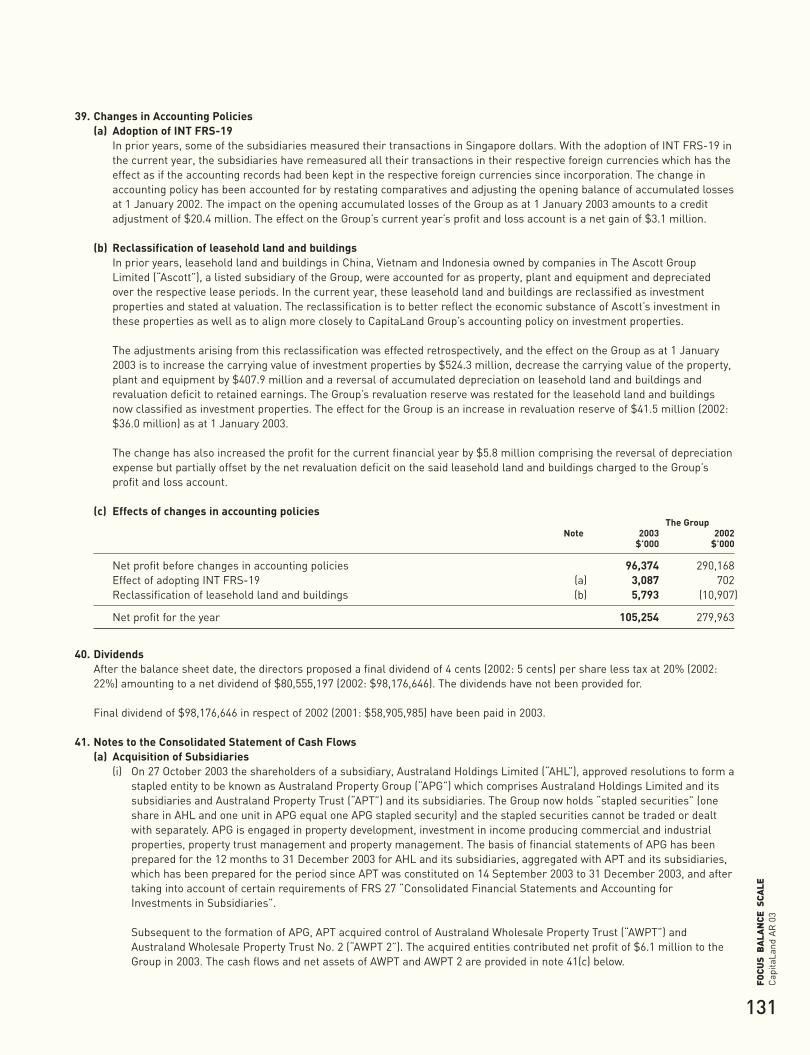
131
Cap
itaLa
ndA
R 0
3FO
CUS
BA
LAN
CE S
CALE
39. Changes in Accounting Policies(a) Adoption of INT FRS-19
In prior years, some of the subsidiaries measured their transactions in Singapore dollars. With the adoption of INT FRS-19 inthe current year, the subsidiaries have remeasured all their transactions in their respective foreign currencies which has theeffect as if the accounting records had been kept in the respective foreign currencies since incorporation. The change inaccounting policy has been accounted for by restating comparatives and adjusting the opening balance of accumulated lossesat 1 January 2002. The impact on the opening accumulated losses of the Group as at 1 January 2003 amounts to a creditadjustment of $20.4 million. The effect on the Group’s current year’s profit and loss account is a net gain of $3.1 million.
(b) Reclassification of leasehold land and buildingsIn prior years, leasehold land and buildings in China, Vietnam and Indonesia owned by companies in The Ascott GroupLimited (“Ascott”), a listed subsidiary of the Group, were accounted for as property, plant and equipment and depreciatedover the respective lease periods. In the current year, these leasehold land and buildings are reclassified as investmentproperties and stated at valuation. The reclassification is to better reflect the economic substance of Ascott’s investment inthese properties as well as to align more closely to CapitaLand Group’s accounting policy on investment properties.
The adjustments arising from this reclassification was effected retrospectively, and the effect on the Group as at 1 January2003 is to increase the carrying value of investment properties by $524.3 million, decrease the carrying value of the property,plant and equipment by $407.9 million and a reversal of accumulated depreciation on leasehold land and buildings andrevaluation deficit to retained earnings. The Group’s revaluation reserve was restated for the leasehold land and buildingsnow classified as investment properties. The effect for the Group is an increase in revaluation reserve of $41.5 million (2002:$36.0 million) as at 1 January 2003.
The change has also increased the profit for the current financial year by $5.8 million comprising the reversal of depreciationexpense but partially offset by the net revaluation deficit on the said leasehold land and buildings charged to the Group’sprofit and loss account.
(c) Effects of changes in accounting policiesThe Group
Note 2003 2002$’000 $’000
Net profit before changes in accounting policies 96,374 290,168Effect of adopting INT FRS-19 (a) 3,087 702Reclassification of leasehold land and buildings (b) 5,793 (10,907)
Net profit for the year 105,254 279,963
40. DividendsAfter the balance sheet date, the directors proposed a final dividend of 4 cents (2002: 5 cents) per share less tax at 20% (2002:22%) amounting to a net dividend of $80,555,197 (2002: $98,176,646). The dividends have not been provided for.
Final dividend of $98,176,646 in respect of 2002 (2001: $58,905,985) have been paid in 2003.
41. Notes to the Consolidated Statement of Cash Flows(a) Acquisition of Subsidiaries
(i) On 27 October 2003 the shareholders of a subsidiary, Australand Holdings Limited (“AHL”), approved resolutions to form astapled entity to be known as Australand Property Group (“APG”) which comprises Australand Holdings Limited and itssubsidiaries and Australand Property Trust (“APT”) and its subsidiaries. The Group now holds “stapled securities” (oneshare in AHL and one unit in APG equal one APG stapled security) and the stapled securities cannot be traded or dealtwith separately. APG is engaged in property development, investment in income producing commercial and industrialproperties, property trust management and property management. The basis of financial statements of APG has beenprepared for the 12 months to 31 December 2003 for AHL and its subsidiaries, aggregated with APT and its subsidiaries,which has been prepared for the period since APT was constituted on 14 September 2003 to 31 December 2003, and aftertaking into account of certain requirements of FRS 27 “Consolidated Financial Statements and Accounting forInvestments in Subsidiaries”.
Subsequent to the formation of APG, APT acquired control of Australand Wholesale Property Trust (“AWPT”) andAustraland Wholesale Property Trust No. 2 (“AWPT 2”). The acquired entities contributed net profit of $6.1 million to theGroup in 2003. The cash flows and net assets of AWPT and AWPT 2 are provided in note 41(c) below.
CapL Acc03 proof 04_OKp73-151 17/03/2004 06:41 PM Page 131
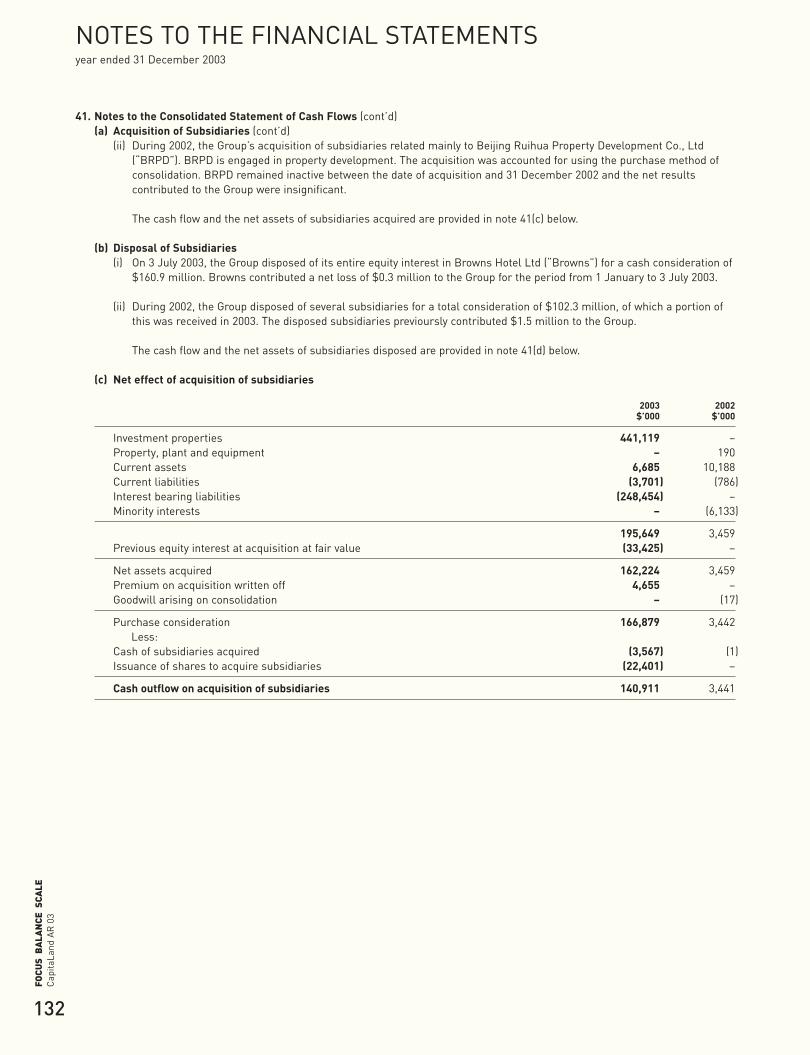
132
Cap
itaLa
ndA
R 0
3FO
CUS
BA
LAN
CE S
CALE
NOTES TO THE FINANCIAL STATEMENTS year ended 31 December 2003
41. Notes to the Consolidated Statement of Cash Flows (cont’d)(a) Acquisition of Subsidiaries (cont’d)
(ii) During 2002, the Group’s acquisition of subsidiaries related mainly to Beijing Ruihua Property Development Co., Ltd(“BRPD”). BRPD is engaged in property development. The acquisition was accounted for using the purchase method ofconsolidation. BRPD remained inactive between the date of acquisition and 31 December 2002 and the net resultscontributed to the Group were insignificant.
The cash flow and the net assets of subsidiaries acquired are provided in note 41(c) below.
(b) Disposal of Subsidiaries(i) On 3 July 2003, the Group disposed of its entire equity interest in Browns Hotel Ltd (“Browns”) for a cash consideration of
$160.9 million. Browns contributed a net loss of $0.3 million to the Group for the period from 1 January to 3 July 2003.
(ii) During 2002, the Group disposed of several subsidiaries for a total consideration of $102.3 million, of which a portion ofthis was received in 2003. The disposed subsidiaries previoursly contributed $1.5 million to the Group.
The cash flow and the net assets of subsidiaries disposed are provided in note 41(d) below.
(c) Net effect of acquisition of subsidiaries
2003 2002$’000 $’000
Investment properties 441,119 –Property, plant and equipment – 190Current assets 6,685 10,188Current liabilities (3,701) (786)Interest bearing liabilities (248,454) –Minority interests – (6,133)
195,649 3,459Previous equity interest at acquisition at fair value (33,425) –
Net assets acquired 162,224 3,459Premium on acquisition written off 4,655 –Goodwill arising on consolidation – (17)
Purchase consideration 166,879 3,442Less:
Cash of subsidiaries acquired (3,567) (1)Issuance of shares to acquire subsidiaries (22,401) –
Cash outflow on acquisition of subsidiaries 140,911 3,441
CapL Acc03 proof 04_OKp73-151 17/03/2004 06:41 PM Page 132
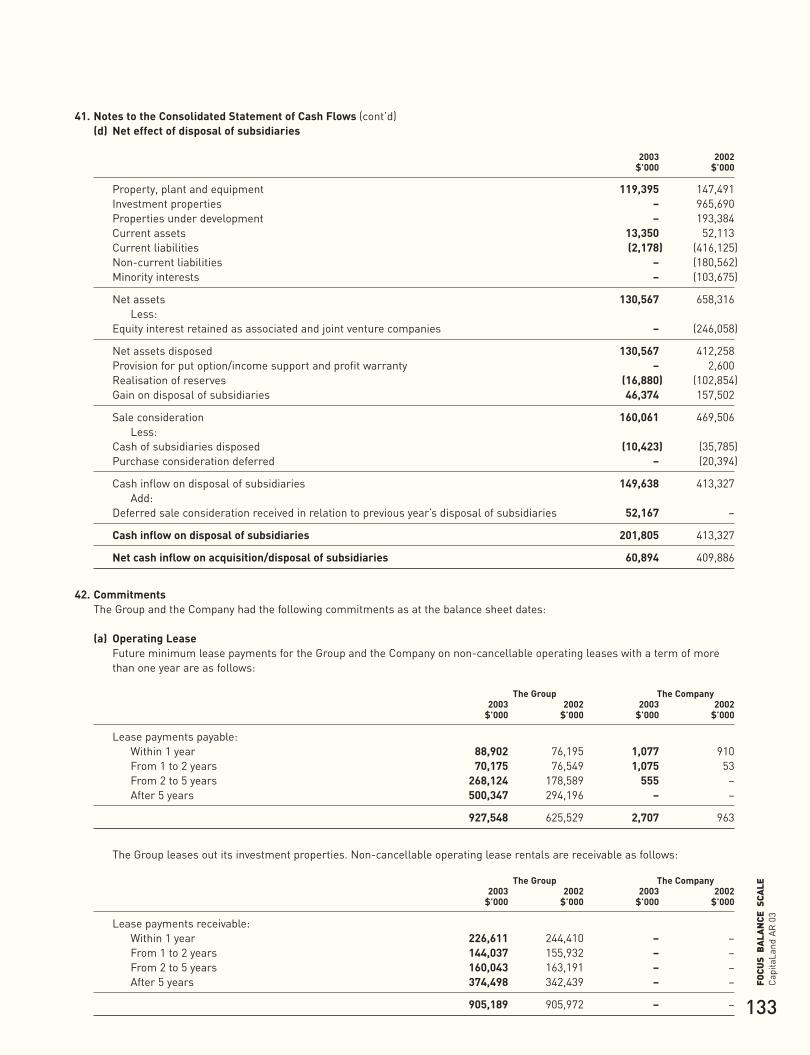
133
Cap
itaLa
ndA
R 0
3FO
CUS
BA
LAN
CE S
CALE
41. Notes to the Consolidated Statement of Cash Flows (cont’d)(d) Net effect of disposal of subsidiaries
2003 2002$’000 $’000
Property, plant and equipment 119,395 147,491Investment properties – 965,690Properties under development – 193,384Current assets 13,350 52,113Current liabilities (2,178) (416,125)Non-current liabilities – (180,562)Minority interests – (103,675)
Net assets 130,567 658,316Less:
Equity interest retained as associated and joint venture companies – (246,058)
Net assets disposed 130,567 412,258Provision for put option/income support and profit warranty – 2,600Realisation of reserves (16,880) (102,854)Gain on disposal of subsidiaries 46,374 157,502
Sale consideration 160,061 469,506Less:
Cash of subsidiaries disposed (10,423) (35,785)Purchase consideration deferred – (20,394)
Cash inflow on disposal of subsidiaries 149,638 413,327Add:
Deferred sale consideration received in relation to previous year’s disposal of subsidiaries 52,167 –
Cash inflow on disposal of subsidiaries 201,805 413,327
Net cash inflow on acquisition/disposal of subsidiaries 60,894 409,886
42. CommitmentsThe Group and the Company had the following commitments as at the balance sheet dates:
(a) Operating LeaseFuture minimum lease payments for the Group and the Company on non-cancellable operating leases with a term of morethan one year are as follows:
The Group The Company2003 2002 2003 2002
$’000 $’000 $’000 $’000
Lease payments payable:Within 1 year 88,902 76,195 1,077 910From 1 to 2 years 70,175 76,549 1,075 53From 2 to 5 years 268,124 178,589 555 –After 5 years 500,347 294,196 – –
927,548 625,529 2,707 963
The Group leases out its investment properties. Non-cancellable operating lease rentals are receivable as follows:
The Group The Company2003 2002 2003 2002
$’000 $’000 $’000 $’000
Lease payments receivable:Within 1 year 226,611 244,410 – –From 1 to 2 years 144,037 155,932 – –From 2 to 5 years 160,043 163,191 – –After 5 years 374,498 342,439 – –
905,189 905,972 – –
CapL Acc03 proof 04_OKp73-151 17/03/2004 06:41 PM Page 133
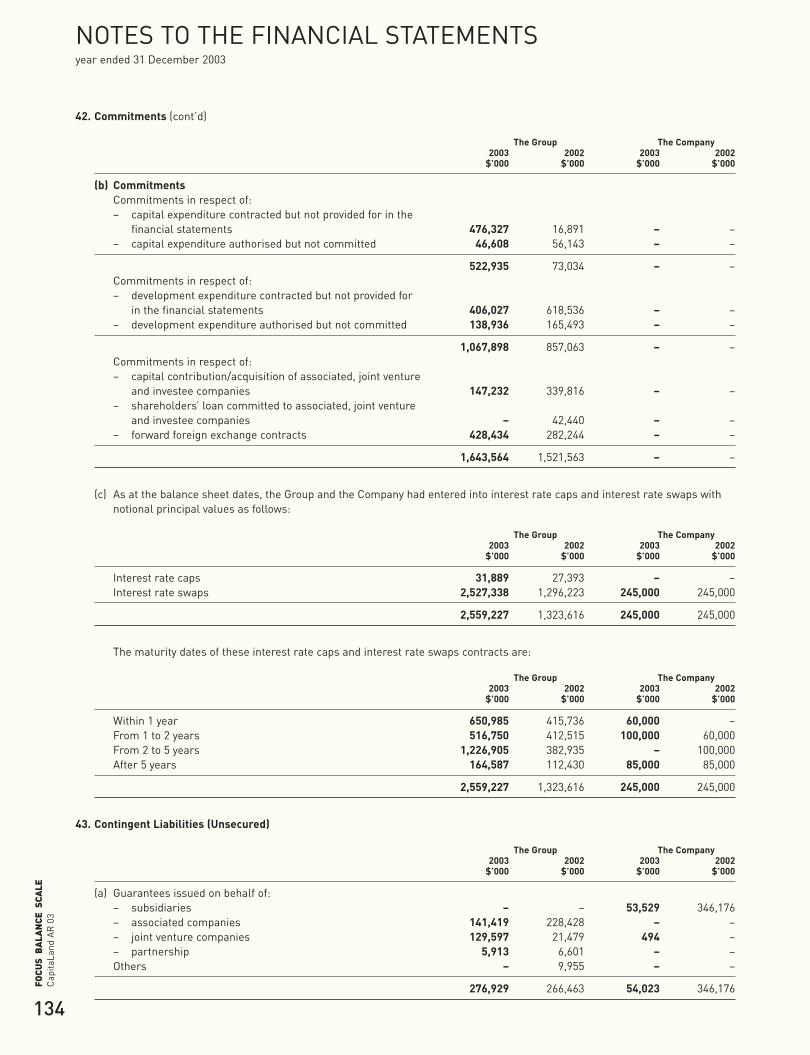
134
Cap
itaLa
ndA
R 0
3FO
CUS
BA
LAN
CE S
CALE
NOTES TO THE FINANCIAL STATEMENTS year ended 31 December 2003
42. Commitments (cont’d)
The Group The Company2003 2002 2003 2002
$’000 $’000 $’000 $’000
(b) CommitmentsCommitments in respect of:– capital expenditure contracted but not provided for in the
financial statements 476,327 16,891 – –– capital expenditure authorised but not committed 46,608 56,143 – –
522,935 73,034 – –Commitments in respect of:– development expenditure contracted but not provided for
in the financial statements 406,027 618,536 – –– development expenditure authorised but not committed 138,936 165,493 – –
1,067,898 857,063 – –Commitments in respect of:– capital contribution/acquisition of associated, joint venture
and investee companies 147,232 339,816 – –– shareholders’ loan committed to associated, joint venture
and investee companies – 42,440 – –– forward foreign exchange contracts 428,434 282,244 – –
1,643,564 1,521,563 – –
(c) As at the balance sheet dates, the Group and the Company had entered into interest rate caps and interest rate swaps withnotional principal values as follows:
The Group The Company2003 2002 2003 2002
$’000 $’000 $’000 $’000
Interest rate caps 31,889 27,393 – –Interest rate swaps 2,527,338 1,296,223 245,000 245,000
2,559,227 1,323,616 245,000 245,000
The maturity dates of these interest rate caps and interest rate swaps contracts are:
The Group The Company2003 2002 2003 2002
$’000 $’000 $’000 $’000
Within 1 year 650,985 415,736 60,000 –From 1 to 2 years 516,750 412,515 100,000 60,000From 2 to 5 years 1,226,905 382,935 – 100,000After 5 years 164,587 112,430 85,000 85,000
2,559,227 1,323,616 245,000 245,000
43. Contingent Liabilities (Unsecured)
The Group The Company2003 2002 2003 2002
$’000 $’000 $’000 $’000
(a) Guarantees issued on behalf of:– subsidiaries – – 53,529 346,176– associated companies 141,419 228,428 – –– joint venture companies 129,597 21,479 494 –– partnership 5,913 6,601 – –Others – 9,955 – –
276,929 266,463 54,023 346,176
CapL Acc03 proof 04_OKp73-151 17/03/2004 06:41 PM Page 134
135
Cap
itaLa
ndA
R 0
3FO
CUS
BA
LAN
CE S
CALE
43. Contingent Liabilities (Unsecured) (cont’d)(b) A subsidiary of the Group provided an interest servicing guarantee, to the extent of its share of investment, in respect of a
$300 million (2002: $300 million) bank loan granted to a joint venture company.
(c) A subsidiary of the Group provided a completion undertaking, cost overrun undertaking and interest shortfall undertaking tothe extent of its share of investment, in respect of a $230 million (2002: Nil) bank loan granted to certain associatedcompanies. In addition, the subsidiary provided a cash cover undertaking of approximately $0.7 million (2002: Nil) in respectof a bank guarantee for these associated companies.
(d) A stapled entity of the Group, Australand Property Group ("APG"), provided rental guarantees and income supportarrangements to tenants and owners of various residential and commercial buildings, which APG is developing or hascompleted development on. These arrangements require APG to guarantee the rental income of these properties for certainperiods of time. As at the date of this report, the management is of the opinion that based on the current sub-leaseproposals and forecasted sub-lease commitments, together with the allowances made within the development budgets forthese property developments, adequate allowance has been made in the financial statements for these potential obligations.
(e) Subsidiary, Australand Holdings Limited ("AHL"), entered into a rental support deed with the co-owners of the FreshwaterCommercial Tower, whereby Australand has agreed for the first 5 years after Practical Completion (estimated to be February2005) to guarantee the rent for the vacant tenancies as at Practical Completion. As at the date of this report, the total rentsupport, based upon the existing tenancy profile is A$12.1 million per annum. The guaranteed income amounts escalate atthe rate of 3.35% per annum. The management is of the opinion that based on the current sub-lease proposals andforecasted sub-lease commitments, together with the allowances made within the development forecasts for this project,adequate allowance has been made for these potential obligations.
(f) Subsidiary, AHL, provided certain guarantees to Australand Wholesale Property Trust No. 4 which include:
• Providing an underwritten yield of 8.75% per annum up to 30 June 2004 and 9.00% from 1 July 2004 up to and includingPractical Completion of the last property completed. It is estimated that this obligation will cease in February 2005.
• Ensuring that establishment costs of the Trust do not exceed a pre-determined maximum value. AHL is required toreimburse the Trust for any establishment costs exceeding these amounts.
• Controlling, managing and underwriting the development of each property so that the Trust bears minimal developmentand construction risk for properties under development.
• Guaranteeing the first year’s rent should a tenant not take occupation as a result of a Trust property not being completedand becoming available to the tenant in accordance with the agreement to lease.
In addition, further rental guarantees have been provided in respect of an existing development project, FreshwaterCommercial Tower (note 43(e)).
(g) Subsidiary, AHL, provided certain guarantees to Australand Wholesale Property Trust No. 5 which include:
• Providing an underwritten yield of 8.50% per annum up to including Practical Completion of the last property completed.It is estimated that this obligation will cease by 31 October 2004.
• Ensuring that establishment costs of the Trust do not exceed a pre-determined maximum value. AHL is required toreimburse the Trust for any establishment costs exceeding these amounts.
• Controlling, managing and underwriting the development of each property so that the Trust bears minimal developmentand construction risk for properties under development.
• Guaranteeing the first year’s rent should a tenant not take occupation as a result of a Trust property not being completedand becoming available to the tenant in accordance with the agreement to lease.
CapL Acc03 proof 04_OKp73-151 17/03/2004 06:41 PM Page 135
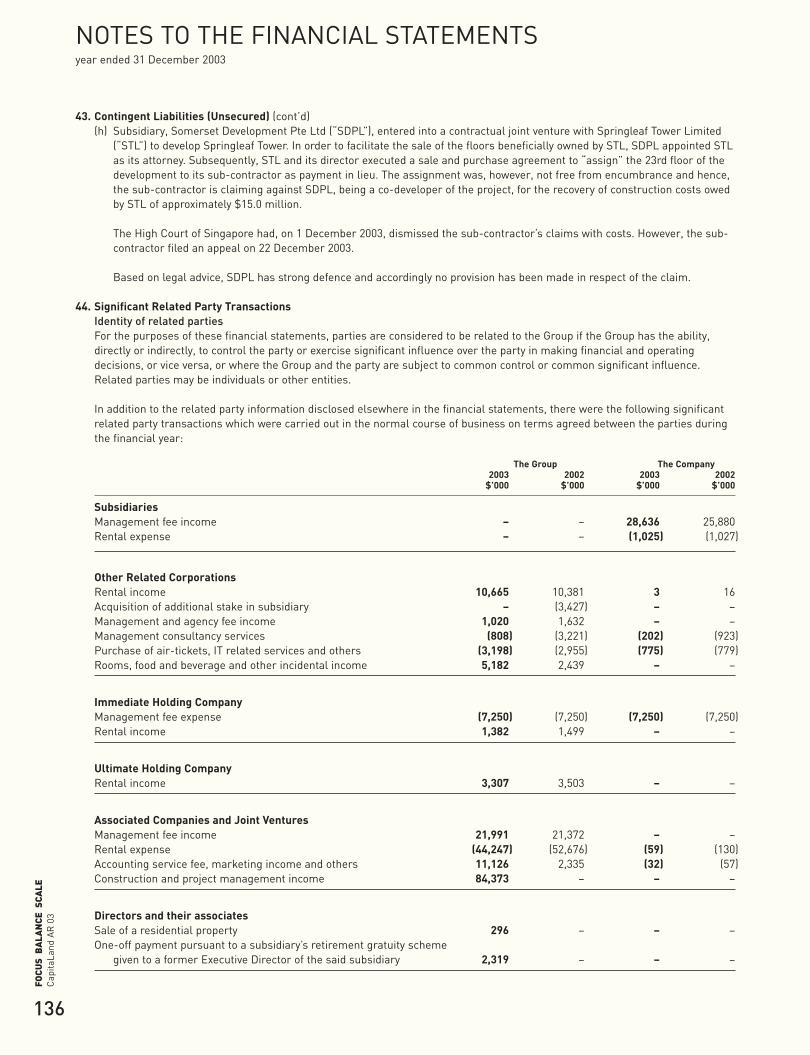
136
Cap
itaLa
ndA
R 0
3FO
CUS
BA
LAN
CE S
CALE
NOTES TO THE FINANCIAL STATEMENTS year ended 31 December 2003
43. Contingent Liabilities (Unsecured) (cont’d)(h) Subsidiary, Somerset Development Pte Ltd (“SDPL”), entered into a contractual joint venture with Springleaf Tower Limited
(“STL”) to develop Springleaf Tower. In order to facilitate the sale of the floors beneficially owned by STL, SDPL appointed STLas its attorney. Subsequently, STL and its director executed a sale and purchase agreement to “assign” the 23rd floor of thedevelopment to its sub-contractor as payment in lieu. The assignment was, however, not free from encumbrance and hence,the sub-contractor is claiming against SDPL, being a co-developer of the project, for the recovery of construction costs owedby STL of approximately $15.0 million.
The High Court of Singapore had, on 1 December 2003, dismissed the sub-contractor’s claims with costs. However, the sub-contractor filed an appeal on 22 December 2003.
Based on legal advice, SDPL has strong defence and accordingly no provision has been made in respect of the claim.
44. Significant Related Party TransactionsIdentity of related partiesFor the purposes of these financial statements, parties are considered to be related to the Group if the Group has the ability,directly or indirectly, to control the party or exercise significant influence over the party in making financial and operatingdecisions, or vice versa, or where the Group and the party are subject to common control or common significant influence.Related parties may be individuals or other entities.
In addition to the related party information disclosed elsewhere in the financial statements, there were the following significantrelated party transactions which were carried out in the normal course of business on terms agreed between the parties duringthe financial year:
The Group The Company2003 2002 2003 2002
$’000 $’000 $’000 $’000
SubsidiariesManagement fee income – – 28,636 25,880Rental expense – – (1,025) (1,027)
Other Related CorporationsRental income 10,665 10,381 3 16Acquisition of additional stake in subsidiary – (3,427) – –Management and agency fee income 1,020 1,632 – –Management consultancy services (808) (3,221) (202) (923)Purchase of air-tickets, IT related services and others (3,198) (2,955) (775) (779)Rooms, food and beverage and other incidental income 5,182 2,439 – –
Immediate Holding CompanyManagement fee expense (7,250) (7,250) (7,250) (7,250)Rental income 1,382 1,499 – –
Ultimate Holding CompanyRental income 3,307 3,503 – –
Associated Companies and Joint VenturesManagement fee income 21,991 21,372 – –Rental expense (44,247) (52,676) (59) (130)Accounting service fee, marketing income and others 11,126 2,335 (32) (57)Construction and project management income 84,373 – – –
Directors and their associatesSale of a residential property 296 – – –One-off payment pursuant to a subsidiary’s retirement gratuity scheme
given to a former Executive Director of the said subsidiary 2,319 – – –
CapL Acc03 proof 04_OKp73-151 17/03/2004 06:41 PM Page 136

137
Cap
itaLa
ndA
R 0
3FO
CUS
BA
LAN
CE S
CALE
45. Financial Instruments(a) Financial risk management objectives and policies
The Group and the Company are exposed to interest rate, foreign currency, credit and liquidity risks arising from itsdiversified portfolio business. The Group’s risk management approach seeks to minimise the potential material adverseeffects from these exposures. As a whole, the Group has implemented risk management policies and guidelines which setout its tolerance of risk and its general risk management philosophy. In connection with this, the Group has established aframework and process to monitor the exposures so as to ensure appropriate measures can be implemented on a timely andeffective manner.
(b) Interest rate riskThe Group’s exposure to market risk for changes in interest rate environment relates mainly to its investment in financialproducts and debt obligations.
The investment in financial products are mainly short term in nature and they are not held or issued for trading orspeculative purposes but were mainly placed in fixed deposits or short term commercial papers which yield better returnsthan cash at bank.
The Group manages its interest rate exposure by maintaining a prudent mix of fixed and floating rate borrowings. The Groupactively reviews its debt portfolio, taking into account the investment holding period and nature of its assets. This strategyallows it to capitalise on cheaper funding in a low interest rate environment and achieve certain level of protection againstrate hikes. The Group also uses hedging instruments such as interest rate swaps and caps to minimise its exposure tointerest rate volatility.
(c) Foreign currency riskThe Group operates internationally and is exposed to various currencies, mainly Australian dollars, Chinese renminbi, Euros,Hong Kong dollars, Japanese yen, Sterling pounds, Swiss francs and United States dollars.
The Group maintains a natural hedge, whenever possible, by borrowing in the currency of the country in which the propertyor investment is located or by borrowing in currencies that match the future revenue stream to be generated from itsinvestments.
Foreign exchange exposures in transactional currencies other than functional currencies of the operating entities are kept toan acceptable level.
In relation to its overseas investments in its foreign subsidiaries whose net assets are exposed to currency translation riskand which are held for long term investment purposes, the differences arising from such translation are recorded under theforeign currency translation reserve. These translation differences are reviewed and monitored on a regular basis.
(d) Credit riskThe Group has a diversified portfolio of businesses and at balance sheet date, there were no significant concentration ofcredit risk with any entity. The Group has guidelines governing the process of granting credit as a service or product providerin its respective segments of business. Investments and financial transactions are restricted with counterparties that meetthe appropriate credit criteria and of high credit standing.
(e) Liquidity riskThe Group actively manages its debt maturity profile, operating cash flows and the availability of funding so as to ensure thatall refinancing, repayment and funding needs are met. As part of its overall prudent liquidity management, the Groupmaintains sufficient level of cash or cash convertible investments to meet its working capital requirement. In addition, theGroup strives to maintain available banking facilities of a reasonable level to its overall debt position. As far as possible, theGroup will constantly raise committed funding from both capital markets and financial institutions and prudently balance itsportfolio with some short term funding so as to achieve overall cost effectiveness.
CapL Acc03 proof 04_OKp73-151 17/03/2004 06:41 PM Page 137
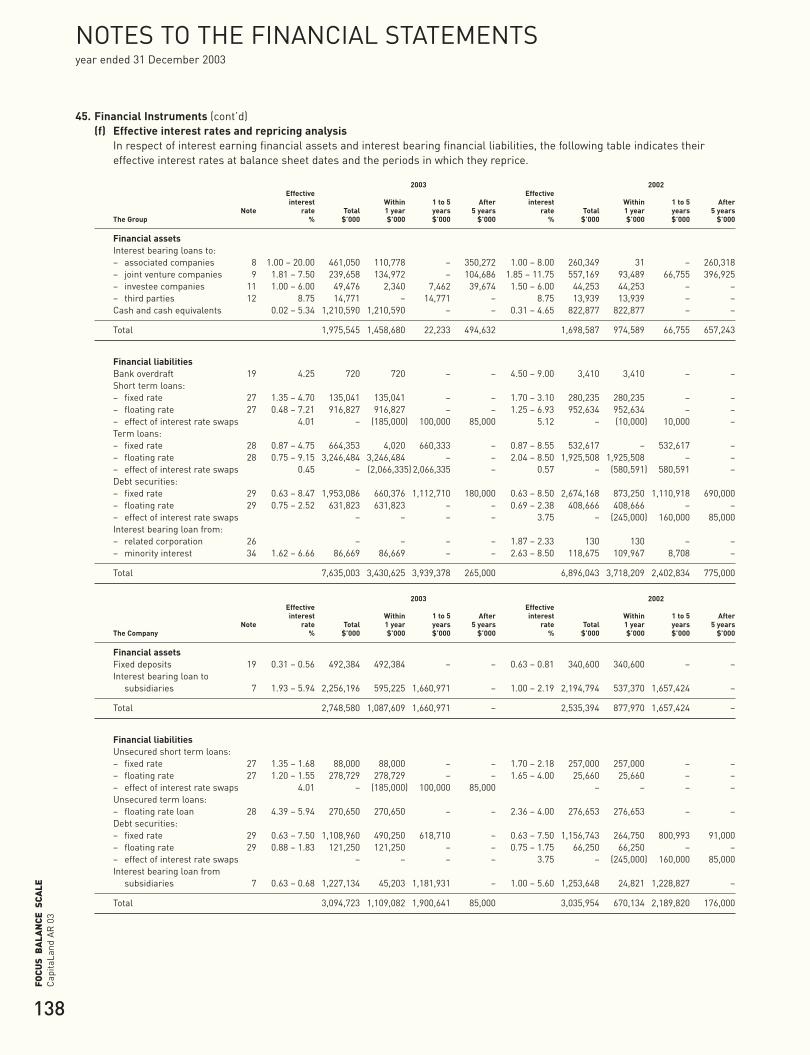
138
Cap
itaLa
ndA
R 0
3FO
CUS
BA
LAN
CE S
CALE
NOTES TO THE FINANCIAL STATEMENTS year ended 31 December 2003
45. Financial Instruments (cont’d)(f) Effective interest rates and repricing analysis
In respect of interest earning financial assets and interest bearing financial liabilities, the following table indicates theireffective interest rates at balance sheet dates and the periods in which they reprice.
2003 2002Effective Effectiveinterest Within 1 to 5 After interest Within 1 to 5 After
Note rate Total 1 year years 5 years rate Total 1 year years 5 yearsThe Group % $’000 $’000 $’000 $’000 % $’000 $’000 $’000 $’000
Financial assetsInterest bearing loans to:– associated companies 8 1.00 – 20.00 461,050 110,778 – 350,272 1.00 – 8.00 260,349 31 – 260,318– joint venture companies 9 1.81 – 7.50 239,658 134,972 – 104,686 1.85 – 11.75 557,169 93,489 66,755 396,925– investee companies 11 1.00 – 6.00 49,476 2,340 7,462 39,674 1.50 – 6.00 44,253 44,253 – –– third parties 12 8.75 14,771 – 14,771 – 8.75 13,939 13,939 – –Cash and cash equivalents 0.02 – 5.34 1,210,590 1,210,590 – – 0.31 – 4.65 822,877 822,877 – –
Total 1,975,545 1,458,680 22,233 494,632 1,698,587 974,589 66,755 657,243
Financial liabilitiesBank overdraft 19 4.25 720 720 – – 4.50 – 9.00 3,410 3,410 – –Short term loans:– fixed rate 27 1.35 – 4.70 135,041 135,041 – – 1.70 – 3.10 280,235 280,235 – –– floating rate 27 0.48 – 7.21 916,827 916,827 – – 1.25 – 6.93 952,634 952,634 – –– effect of interest rate swaps 4.01 – (185,000) 100,000 85,000 5.12 – (10,000) 10,000 –Term loans:– fixed rate 28 0.87 – 4.75 664,353 4,020 660,333 – 0.87 – 8.55 532,617 – 532,617 –– floating rate 28 0.75 – 9.15 3,246,484 3,246,484 – – 2.04 – 8.50 1,925,508 1,925,508 – –– effect of interest rate swaps 0.45 – (2,066,335) 2,066,335 – 0.57 – (580,591) 580,591 –Debt securities:– fixed rate 29 0.63 – 8.47 1,953,086 660,376 1,112,710 180,000 0.63 – 8.50 2,674,168 873,250 1,110,918 690,000– floating rate 29 0.75 – 2.52 631,823 631,823 – – 0.69 – 2.38 408,666 408,666 – –– effect of interest rate swaps – – – – 3.75 – (245,000) 160,000 85,000Interest bearing loan from:– related corporation 26 – – – – 1.87 – 2.33 130 130 – –– minority interest 34 1.62 – 6.66 86,669 86,669 – – 2.63 – 8.50 118,675 109,967 8,708 –
Total 7,635,003 3,430,625 3,939,378 265,000 6,896,043 3,718,209 2,402,834 775,000
2003 2002Effective Effectiveinterest Within 1 to 5 After interest Within 1 to 5 After
Note rate Total 1 year years 5 years rate Total 1 year years 5 yearsThe Company % $’000 $’000 $’000 $’000 % $’000 $’000 $’000 $’000
Financial assetsFixed deposits 19 0.31 – 0.56 492,384 492,384 – – 0.63 – 0.81 340,600 340,600 – –Interest bearing loan to
subsidiaries 7 1.93 – 5.94 2,256,196 595,225 1,660,971 – 1.00 – 2.19 2,194,794 537,370 1,657,424 –
Total 2,748,580 1,087,609 1,660,971 – 2,535,394 877,970 1,657,424 –
Financial liabilitiesUnsecured short term loans:– fixed rate 27 1.35 – 1.68 88,000 88,000 – – 1.70 – 2.18 257,000 257,000 – –– floating rate 27 1.20 – 1.55 278,729 278,729 – – 1.65 – 4.00 25,660 25,660 – –– effect of interest rate swaps 4.01 – (185,000) 100,000 85,000 – – – –Unsecured term loans:– floating rate loan 28 4.39 – 5.94 270,650 270,650 – – 2.36 – 4.00 276,653 276,653 – –Debt securities:– fixed rate 29 0.63 – 7.50 1,108,960 490,250 618,710 – 0.63 – 7.50 1,156,743 264,750 800,993 91,000– floating rate 29 0.88 – 1.83 121,250 121,250 – – 0.75 – 1.75 66,250 66,250 – –– effect of interest rate swaps – – – – 3.75 – (245,000) 160,000 85,000Interest bearing loan from
subsidiaries 7 0.63 – 0.68 1,227,134 45,203 1,181,931 – 1.00 – 5.60 1,253,648 24,821 1,228,827 –
Total 3,094,723 1,109,082 1,900,641 85,000 3,035,954 670,134 2,189,820 176,000
CapL Acc03 proof 04_OKp73-151 17/03/2004 06:41 PM Page 138
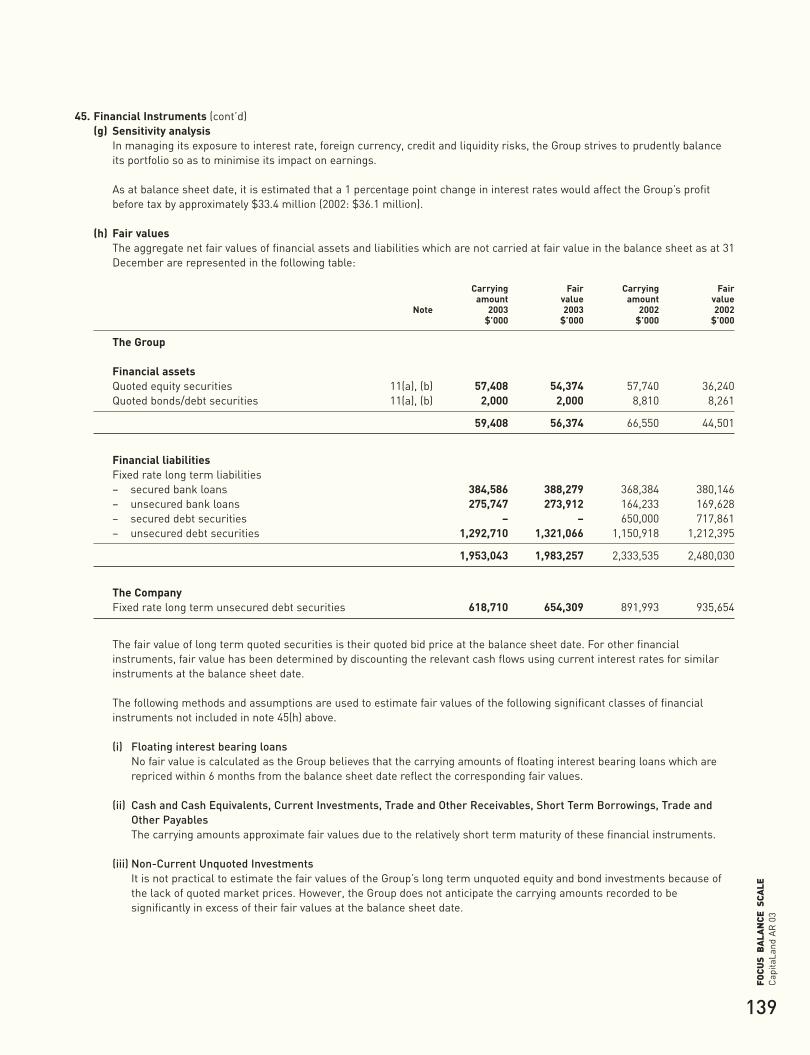
139
Cap
itaLa
ndA
R 0
3FO
CUS
BA
LAN
CE S
CALE
45. Financial Instruments (cont’d)(g) Sensitivity analysis
In managing its exposure to interest rate, foreign currency, credit and liquidity risks, the Group strives to prudently balanceits portfolio so as to minimise its impact on earnings.
As at balance sheet date, it is estimated that a 1 percentage point change in interest rates would affect the Group’s profitbefore tax by approximately $33.4 million (2002: $36.1 million).
(h) Fair valuesThe aggregate net fair values of financial assets and liabilities which are not carried at fair value in the balance sheet as at 31December are represented in the following table:
Carrying Fair Carrying Fairamount value amount value
Note 2003 2003 2002 2002$’000 $’000 $’000 $’000
The Group
Financial assetsQuoted equity securities 11(a), (b) 57,408 54,374 57,740 36,240Quoted bonds/debt securities 11(a), (b) 2,000 2,000 8,810 8,261
59,408 56,374 66,550 44,501
Financial liabilitiesFixed rate long term liabilities– secured bank loans 384,586 388,279 368,384 380,146– unsecured bank loans 275,747 273,912 164,233 169,628– secured debt securities – – 650,000 717,861– unsecured debt securities 1,292,710 1,321,066 1,150,918 1,212,395
1,953,043 1,983,257 2,333,535 2,480,030
The CompanyFixed rate long term unsecured debt securities 618,710 654,309 891,993 935,654
The fair value of long term quoted securities is their quoted bid price at the balance sheet date. For other financialinstruments, fair value has been determined by discounting the relevant cash flows using current interest rates for similarinstruments at the balance sheet date.
The following methods and assumptions are used to estimate fair values of the following significant classes of financialinstruments not included in note 45(h) above.
(i) Floating interest bearing loansNo fair value is calculated as the Group believes that the carrying amounts of floating interest bearing loans which arerepriced within 6 months from the balance sheet date reflect the corresponding fair values.
(ii) Cash and Cash Equivalents, Current Investments, Trade and Other Receivables, Short Term Borrowings, Trade and Other PayablesThe carrying amounts approximate fair values due to the relatively short term maturity of these financial instruments.
(iii) Non-Current Unquoted InvestmentsIt is not practical to estimate the fair values of the Group’s long term unquoted equity and bond investments because ofthe lack of quoted market prices. However, the Group does not anticipate the carrying amounts recorded to besignificantly in excess of their fair values at the balance sheet date.
CapL Acc03 proof 04_OKp73-151 17/03/2004 06:41 PM Page 139

140
Cap
itaLa
ndA
R 0
3FO
CUS
BA
LAN
CE S
CALE
NOTES TO THE FINANCIAL STATEMENTS year ended 31 December 2003
45. Financial Instruments (cont’d)(h) Fair values (cont’d)
(iv) Non-Current Loans Due from/to Subsidiaries, Associated Companies, Joint Venture Companies, Investee Companiesand Minority ShareholdersIt is not practical to estimate the fair value of non-current loan accounts due principally to a lack of fixed or repaymentterm entered by the parties involved. However, the Group does not anticipate the carrying amounts recorded at thebalance sheet date to be significantly different from the values that would eventually be received or settled.
(v) Unrecognised Financial InstrumentsThe valuation of financial instruments not recognised in the balance sheet detailed in this note reflects amounts whichthe Group expects to pay or receive to terminate the contracts (net of transaction costs) or replace the contracts at theircurrent market rates as at the balance sheet date.
The notional amount and net fair value of financial instruments not recognised in the balance sheet as at the balancesheet date:
Net fair Net fairvalue value
Notional (payable)/ Notional (payable)/amount receivable amount receivable
Note 2003 2003 2002 2002$’000 $’000 $’000 $’000
The GroupInterest rate swap agreements 42(c) 2,527,338 (24,583) 1,296,223 (45,646)Forward foreign exchange contracts 42(b) 428,434 1,204 282,244 424
2,955,772 (23,379) 1,578,467 (45,222)
The CompanyInterest rate swap agreements 42(c) 245,000 (17,498) 245,000 (29,221)
46. Subsidiaries(a) The subsidiaries directly held by the Company set out below are incorporated and conducting business in the Republic of Singapore:
Percentage Held Cost ofSubsidiaries Class of Shares by the Company Investments
2003 2002 2003 2002% % $’000 $’000
Alexandrite Land Pte Ltd Ordinary 100 100 * *
RedeemablePreference 100 100 4,200 4,200
Areca Investment Pte Ltd Ordinary 100 100 1,000 1,000
RedeemablePreference 100 100 674,150 674,150
Beauty World Pte Ltd Ordinary 100 100 36,280 36,280
Capital Tower Pte Ltd Ordinary 100 100 40,903 40,903
RedeemablePreference 100 100 158,503 158,503
CapitaLand Asia Pte Ltd (formerly known as Ordinary 100 100 * * Somerset International Holdings Pte Ltd)
CapitaLand Commercial Limited Ordinary 100 100 1,316,031 1,316,031
RedeemablePreference 100 100 500,000 500,000
Balance carried forward 2,731,067 2,731,067
CapL Acc03 proof 04_OKp73-151 17/03/2004 06:41 PM Page 140
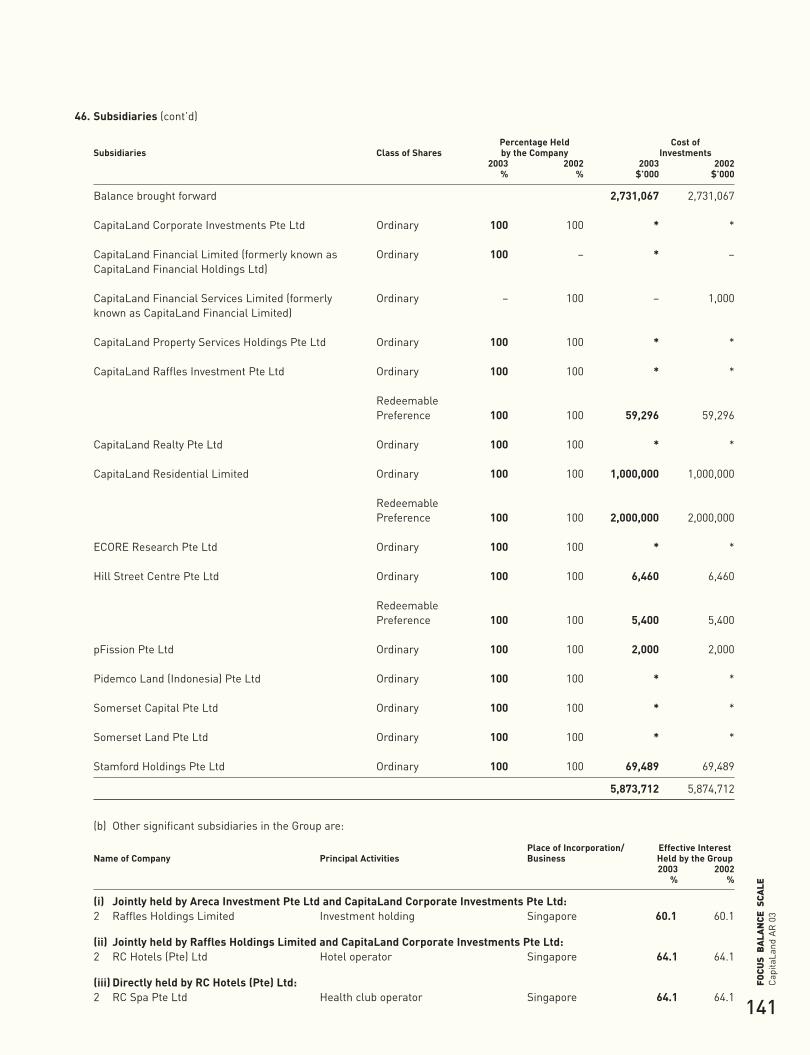
141
Cap
itaLa
ndA
R 0
3FO
CUS
BA
LAN
CE S
CALE
46. Subsidiaries (cont’d)
Percentage Held Cost ofSubsidiaries Class of Shares by the Company Investments
2003 2002 2003 2002% % $’000 $’000
Balance brought forward 2,731,067 2,731,067
CapitaLand Corporate Investments Pte Ltd Ordinary 100 100 * *
CapitaLand Financial Limited (formerly known as Ordinary 100 – * – CapitaLand Financial Holdings Ltd)
CapitaLand Financial Services Limited (formerly Ordinary – 100 – 1,000known as CapitaLand Financial Limited)
CapitaLand Property Services Holdings Pte Ltd Ordinary 100 100 * *
CapitaLand Raffles Investment Pte Ltd Ordinary 100 100 * *
RedeemablePreference 100 100 59,296 59,296
CapitaLand Realty Pte Ltd Ordinary 100 100 * *
CapitaLand Residential Limited Ordinary 100 100 1,000,000 1,000,000
RedeemablePreference 100 100 2,000,000 2,000,000
ECORE Research Pte Ltd Ordinary 100 100 * *
Hill Street Centre Pte Ltd Ordinary 100 100 6,460 6,460
RedeemablePreference 100 100 5,400 5,400
pFission Pte Ltd Ordinary 100 100 2,000 2,000
Pidemco Land (Indonesia) Pte Ltd Ordinary 100 100 * *
Somerset Capital Pte Ltd Ordinary 100 100 * *
Somerset Land Pte Ltd Ordinary 100 100 * *
Stamford Holdings Pte Ltd Ordinary 100 100 69,489 69,489
5,873,712 5,874,712
(b) Other significant subsidiaries in the Group are:
Place of Incorporation/ Effective InterestName of Company Principal Activities Business Held by the Group
2003 2002% %
(i) Jointly held by Areca Investment Pte Ltd and CapitaLand Corporate Investments Pte Ltd:2 Raffles Holdings Limited Investment holding Singapore 60.1 60.1
(ii) Jointly held by Raffles Holdings Limited and CapitaLand Corporate Investments Pte Ltd:2 RC Hotels (Pte) Ltd Hotel operator Singapore 64.1 64.1
(iii) Directly held by RC Hotels (Pte) Ltd:2 RC Spa Pte Ltd Health club operator Singapore 64.1 64.1
CapL Acc03 proof 04_OKp73-151 17/03/2004 06:41 PM Page 141
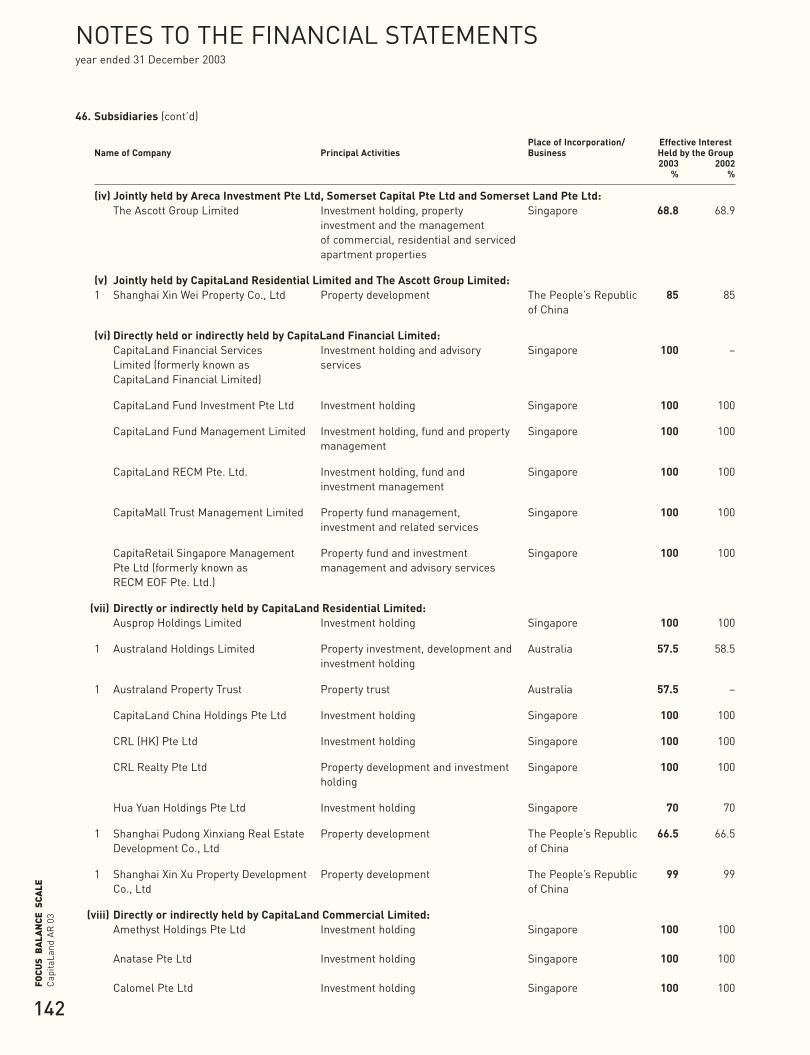
142
Cap
itaLa
ndA
R 0
3FO
CUS
BA
LAN
CE S
CALE
NOTES TO THE FINANCIAL STATEMENTS year ended 31 December 2003
46. Subsidiaries (cont’d)
Place of Incorporation/ Effective InterestName of Company Principal Activities Business Held by the Group
2003 2002% %
(iv) Jointly held by Areca Investment Pte Ltd, Somerset Capital Pte Ltd and Somerset Land Pte Ltd:The Ascott Group Limited Investment holding, property Singapore 68.8 68.9
investment and the management of commercial, residential and serviced apartment properties
(v) Jointly held by CapitaLand Residential Limited and The Ascott Group Limited:1 Shanghai Xin Wei Property Co., Ltd Property development The People’s Republic 85 85
of China
(vi) Directly held or indirectly held by CapitaLand Financial Limited:CapitaLand Financial Services Investment holding and advisory Singapore 100 –Limited (formerly known as servicesCapitaLand Financial Limited)
CapitaLand Fund Investment Pte Ltd Investment holding Singapore 100 100
CapitaLand Fund Management Limited Investment holding, fund and property Singapore 100 100management
CapitaLand RECM Pte. Ltd. Investment holding, fund and Singapore 100 100investment management
CapitaMall Trust Management Limited Property fund management, Singapore 100 100investment and related services
CapitaRetail Singapore Management Property fund and investment Singapore 100 100Pte Ltd (formerly known as management and advisory servicesRECM EOF Pte. Ltd.)
(vii) Directly or indirectly held by CapitaLand Residential Limited:Ausprop Holdings Limited Investment holding Singapore 100 100
1 Australand Holdings Limited Property investment, development and Australia 57.5 58.5investment holding
1 Australand Property Trust Property trust Australia 57.5 –
CapitaLand China Holdings Pte Ltd Investment holding Singapore 100 100
CRL (HK) Pte Ltd Investment holding Singapore 100 100
CRL Realty Pte Ltd Property development and investment Singapore 100 100holding
Hua Yuan Holdings Pte Ltd Investment holding Singapore 70 70
1 Shanghai Pudong Xinxiang Real Estate Property development The People’s Republic 66.5 66.5Development Co., Ltd of China
1 Shanghai Xin Xu Property Development Property development The People’s Republic 99 99Co., Ltd of China
(viii) Directly or indirectly held by CapitaLand Commercial Limited:Amethyst Holdings Pte Ltd Investment holding Singapore 100 100
Anatase Pte Ltd Investment holding Singapore 100 100
Calomel Pte Ltd Investment holding Singapore 100 100
CapL Acc03 proof 04_OKp73-151 17/03/2004 06:41 PM Page 142
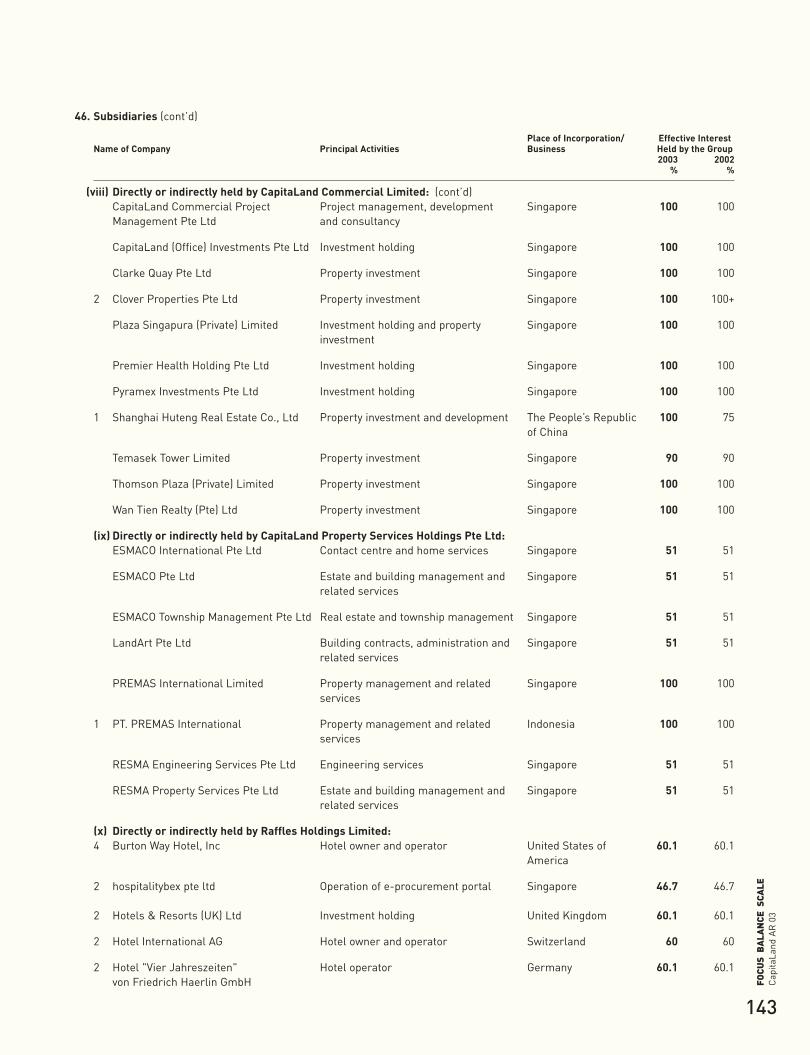
143
Cap
itaLa
ndA
R 0
3FO
CUS
BA
LAN
CE S
CALE
46. Subsidiaries (cont’d)
Place of Incorporation/ Effective InterestName of Company Principal Activities Business Held by the Group
2003 2002% %
(viii) Directly or indirectly held by CapitaLand Commercial Limited: (cont’d)CapitaLand Commercial Project Project management, development Singapore 100 100Management Pte Ltd and consultancy
CapitaLand (Office) Investments Pte Ltd Investment holding Singapore 100 100
Clarke Quay Pte Ltd Property investment Singapore 100 100
2 Clover Properties Pte Ltd Property investment Singapore 100 100+
Plaza Singapura (Private) Limited Investment holding and property Singapore 100 100investment
Premier Health Holding Pte Ltd Investment holding Singapore 100 100
Pyramex Investments Pte Ltd Investment holding Singapore 100 100
1 Shanghai Huteng Real Estate Co., Ltd Property investment and development The People’s Republic 100 75of China
Temasek Tower Limited Property investment Singapore 90 90
Thomson Plaza (Private) Limited Property investment Singapore 100 100
Wan Tien Realty (Pte) Ltd Property investment Singapore 100 100
(ix) Directly or indirectly held by CapitaLand Property Services Holdings Pte Ltd:ESMACO International Pte Ltd Contact centre and home services Singapore 51 51
ESMACO Pte Ltd Estate and building management and Singapore 51 51related services
ESMACO Township Management Pte Ltd Real estate and township management Singapore 51 51
LandArt Pte Ltd Building contracts, administration and Singapore 51 51related services
PREMAS International Limited Property management and related Singapore 100 100services
1 PT. PREMAS International Property management and related Indonesia 100 100services
RESMA Engineering Services Pte Ltd Engineering services Singapore 51 51
RESMA Property Services Pte Ltd Estate and building management and Singapore 51 51related services
(x) Directly or indirectly held by Raffles Holdings Limited:4 Burton Way Hotel, Inc Hotel owner and operator United States of 60.1 60.1
America
2 hospitalitybex pte ltd Operation of e-procurement portal Singapore 46.7 46.7
2 Hotels & Resorts (UK) Ltd Investment holding United Kingdom 60.1 60.1
2 Hotel International AG Hotel owner and operator Switzerland 60 60
2 Hotel "Vier Jahreszeiten" Hotel operator Germany 60.1 60.1von Friedrich Haerlin GmbH
CapL Acc03 proof 04_OKp73-151 17/03/2004 06:41 PM Page 143
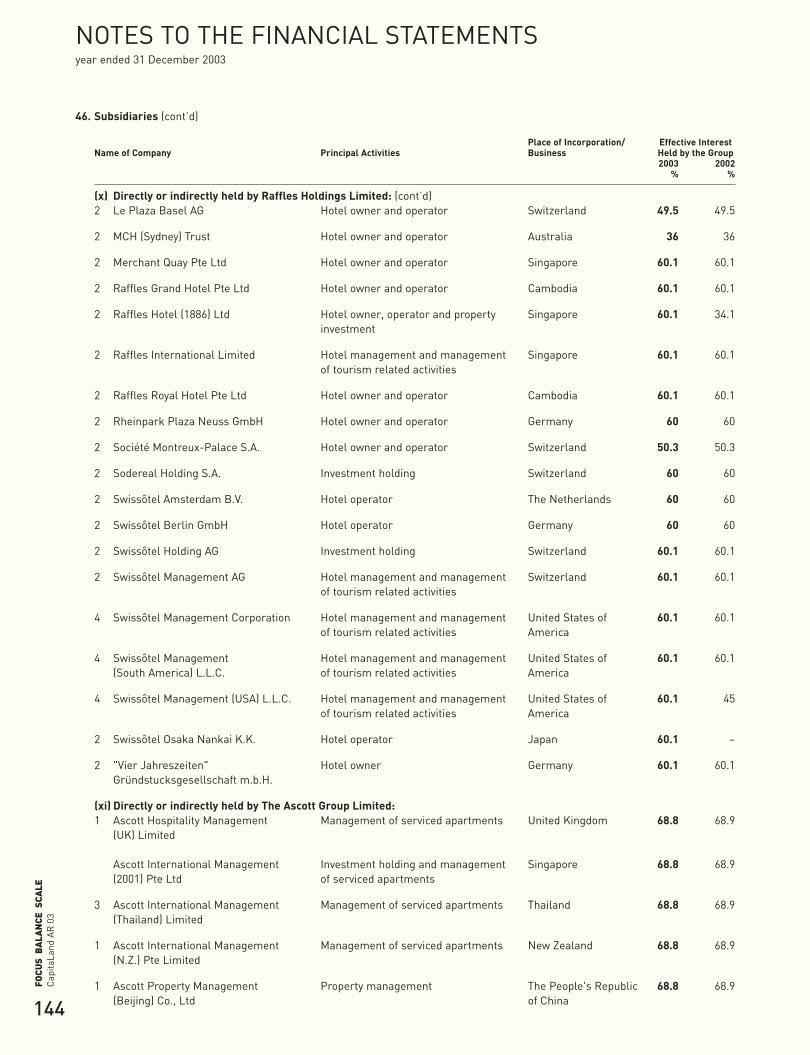
144
Cap
itaLa
ndA
R 0
3FO
CUS
BA
LAN
CE S
CALE
NOTES TO THE FINANCIAL STATEMENTS year ended 31 December 2003
46. Subsidiaries (cont’d)
Place of Incorporation/ Effective InterestName of Company Principal Activities Business Held by the Group
2003 2002% %
(x) Directly or indirectly held by Raffles Holdings Limited: (cont’d)2 Le Plaza Basel AG Hotel owner and operator Switzerland 49.5 49.5
2 MCH (Sydney) Trust Hotel owner and operator Australia 36 36
2 Merchant Quay Pte Ltd Hotel owner and operator Singapore 60.1 60.1
2 Raffles Grand Hotel Pte Ltd Hotel owner and operator Cambodia 60.1 60.1
2 Raffles Hotel (1886) Ltd Hotel owner, operator and property Singapore 60.1 34.1investment
2 Raffles International Limited Hotel management and management Singapore 60.1 60.1of tourism related activities
2 Raffles Royal Hotel Pte Ltd Hotel owner and operator Cambodia 60.1 60.1
2 Rheinpark Plaza Neuss GmbH Hotel owner and operator Germany 60 60
2 Société Montreux-Palace S.A. Hotel owner and operator Switzerland 50.3 50.3
2 Sodereal Holding S.A. Investment holding Switzerland 60 60
2 Swissôtel Amsterdam B.V. Hotel operator The Netherlands 60 60
2 Swissôtel Berlin GmbH Hotel operator Germany 60 60
2 Swissôtel Holding AG Investment holding Switzerland 60.1 60.1
2 Swissôtel Management AG Hotel management and management Switzerland 60.1 60.1of tourism related activities
4 Swissôtel Management Corporation Hotel management and management United States of 60.1 60.1of tourism related activities America
4 Swissôtel Management Hotel management and management United States of 60.1 60.1(South America) L.L.C. of tourism related activities America
4 Swissôtel Management (USA) L.L.C. Hotel management and management United States of 60.1 45of tourism related activities America
2 Swissôtel Osaka Nankai K.K. Hotel operator Japan 60.1 –
2 "Vier Jahreszeiten" Hotel owner Germany 60.1 60.1Gründstucksgesellschaft m.b.H.
(xi) Directly or indirectly held by The Ascott Group Limited:1 Ascott Hospitality Management Management of serviced apartments United Kingdom 68.8 68.9
(UK) Limited
Ascott International Management Investment holding and management Singapore 68.8 68.9(2001) Pte Ltd of serviced apartments
3 Ascott International Management Management of serviced apartments Thailand 68.8 68.9(Thailand) Limited
1 Ascott International Management Management of serviced apartments New Zealand 68.8 68.9(N.Z.) Pte Limited
1 Ascott Property Management Property management The People's Republic 68.8 68.9(Beijing) Co., Ltd of China
CapL Acc03 proof 04_OKp73-151 17/03/2004 06:41 PM Page 144
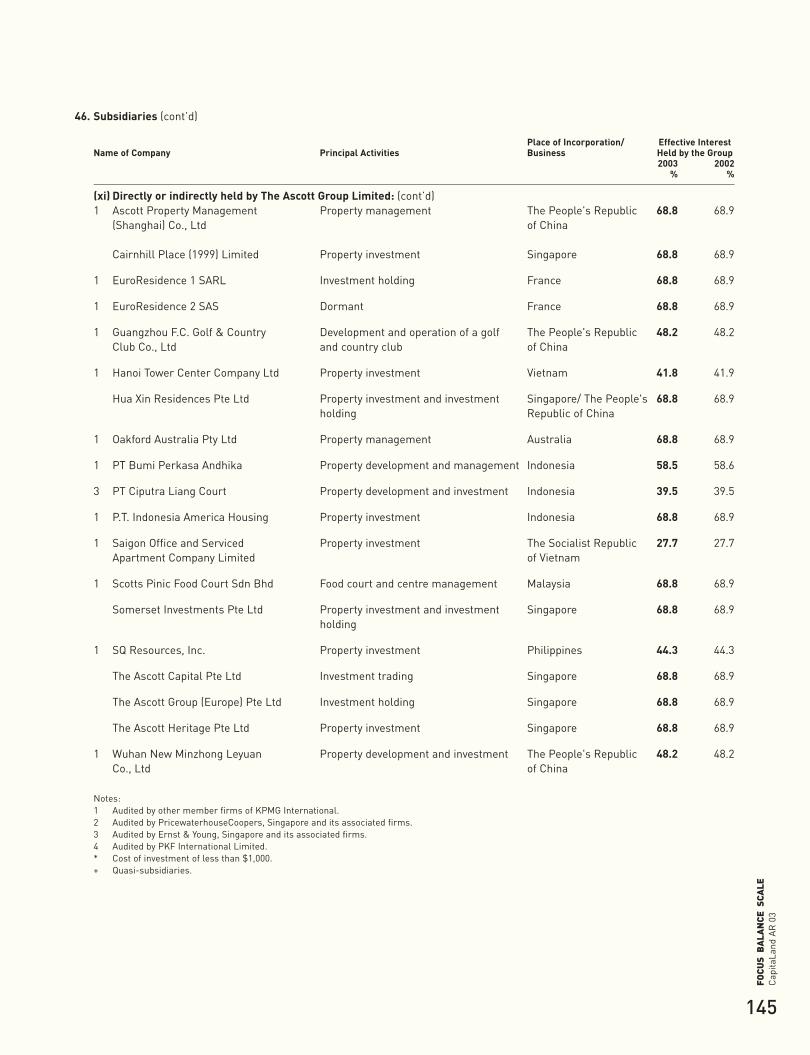
145
Cap
itaLa
ndA
R 0
3FO
CUS
BA
LAN
CE S
CALE
46. Subsidiaries (cont’d)
Place of Incorporation/ Effective InterestName of Company Principal Activities Business Held by the Group
2003 2002% %
(xi) Directly or indirectly held by The Ascott Group Limited: (cont’d)1 Ascott Property Management Property management The People's Republic 68.8 68.9
(Shanghai) Co., Ltd of China
Cairnhill Place (1999) Limited Property investment Singapore 68.8 68.9
1 EuroResidence 1 SARL Investment holding France 68.8 68.9
1 EuroResidence 2 SAS Dormant France 68.8 68.9
1 Guangzhou F.C. Golf & Country Development and operation of a golf The People's Republic 48.2 48.2Club Co., Ltd and country club of China
1 Hanoi Tower Center Company Ltd Property investment Vietnam 41.8 41.9
Hua Xin Residences Pte Ltd Property investment and investment Singapore/ The People's 68.8 68.9holding Republic of China
1 Oakford Australia Pty Ltd Property management Australia 68.8 68.9
1 PT Bumi Perkasa Andhika Property development and management Indonesia 58.5 58.6
3 PT Ciputra Liang Court Property development and investment Indonesia 39.5 39.5
1 P.T. Indonesia America Housing Property investment Indonesia 68.8 68.9
1 Saigon Office and Serviced Property investment The Socialist Republic 27.7 27.7Apartment Company Limited of Vietnam
1 Scotts Pinic Food Court Sdn Bhd Food court and centre management Malaysia 68.8 68.9
Somerset Investments Pte Ltd Property investment and investment Singapore 68.8 68.9holding
1 SQ Resources, Inc. Property investment Philippines 44.3 44.3
The Ascott Capital Pte Ltd Investment trading Singapore 68.8 68.9
The Ascott Group (Europe) Pte Ltd Investment holding Singapore 68.8 68.9
The Ascott Heritage Pte Ltd Property investment Singapore 68.8 68.9
1 Wuhan New Minzhong Leyuan Property development and investment The People's Republic 48.2 48.2Co., Ltd of China
Notes:1 Audited by other member firms of KPMG International.2 Audited by PricewaterhouseCoopers, Singapore and its associated firms.3 Audited by Ernst & Young, Singapore and its associated firms.4 Audited by PKF International Limited.* Cost of investment of less than $1,000.+ Quasi-subsidiaries.
CapL Acc03 proof 04_OKp73-151 17/03/2004 06:41 PM Page 145

146
Cap
itaLa
ndA
R 0
3FO
CUS
BA
LAN
CE S
CALE
NOTES TO THE FINANCIAL STATEMENTS year ended 31 December 2003
47. Associated CompaniesDetails of significant associated companies are as follows:
Place of Incorporation/ Effective InterestAssociated Companies Principal Activities Business Held by the Group
2003 2002% %
(i) Indirectly held by CapitaLand Financial Limited:3 I. P. Property Fund Asia Limited Investment in real estate Guernsey 20 20
CapitaLand China Residential Investment in real estate Singapore 42.7 –Fund Ltd
(ii) Indirectly held by CapitaLand Residential Limited:2 Bangi Heights Development Sdn. Bhd. Property investment and development Malaysia 45.2 45.2
2 United Malayan Land Bhd Investment holding Malaysia 21.6 21.6
2 Wingem Investment Pte Ltd Property investment and development Singapore 25 25
2 Winpeak Investment Pte Ltd Property investment and development Singapore 25 25
(iii) Indirectly held by CapitaLand Commercial Limited:CapitaMall Trust Property investment Singapore 32.2 33.3
(iv) Indirectly held by CapitaLand Property Services Holdings Pte Ltd:3 Bugis Junction Asset Management Property management and consultancy Singapore 42.9 42.9
Pte Ltd services
4 Cushman & Wakefield PREMAS Real estate valuation The People’s Republic 49 49Real Estate Consultants (Shanghai) and agency services of ChinaCo., Ltd.
1 PREMAS (THAILAND) CO., LTD. Asset and facility management Thailand 49 –
(v) Directly held by Raffles Holdings Limited:2 Tincel Properties (Private) Limited Real estate investment and Singapore 27 27
management
(vi) Directly or indirectly held by The Ascott Group Limited:1 Amanah Scotts Sdn Bhd Investment holding, property Malaysia 34.4 34.5
development and management
2 Hemliner Pte Ltd Investment holding Singapore 20.7 20.7
Notes:1 Audited by other member firms of KPMG International.2 Audited by PricewaterhouseCoopers, Singapore and its associated firms.3 Audited by Ernst & Young, Singapore and its associated firms.4 Audited by Shu Lun Pan Certified Public Accountants Co., Ltd.
CapL Acc03 proof 04_OKp73-151 17/03/2004 06:41 PM Page 146

147
Cap
itaLa
ndA
R 0
3FO
CUS
BA
LAN
CE S
CALE
48. Joint Venture CompaniesDetails of significant joint venture companies are as follows:
Place of Incorporation/ Effective InterestJoint Venture Companies Principal Activities Business Held by the Group
2003 2002% %
(i) Indirectly held by the Company:CapitaLand-Raffles Properties Pte Ltd Property development and investment Singapore 50 50
(ii) Indirectly held by CapitaLand Residential Limited:1 Chymont Pty Limited Property development Australia 28.8 29.3
1 Glenwood Land Pty Ltd Property development Australia 28.8 29.3
Riverwalk Promenade Pte Ltd Property investment and development Singapore 50 50
1 The Woolloomooloo Unit Trust Property development Australia 28.8 29.3
1 Trust Project No. 11 Unit Trust Property development Australia 28.8 29.3
1 W9 & 10 Construction Stage 3A Pty Ltd Property development Australia 28.8 29.3
1 W9 & 10 Stage 1 Pty Limited Property development Australia – 29.3
1 W9 & 10 Stage 2 Pty Limited Property development Australia 28.8 29.3
1 W9 & 10 Stage 4 Pty Limited Property development Australia 28.8 29.3
(iii) Indirectly held by CapitaLand Commercial Limited:Eureka Office Fund Pte Ltd Investment holding Singapore 50 50
(iv) Indirectly held by The Ascott Group Limited:1 Ascott Dilmun Holdings Limited Investment holding United Kingdom 34.4 34.5
3 IP Thai Property Fund Property investment Thailand 20.7 20.7
1 Mekong-Hacota Joint Venture Co., Ltd Property development and management The Socialist Republic 44.1 44.1of Vietnam
2 Oriville SAS Investment holding France 34.4 –
3 Sathorn Supsin Co., Ltd Property development and investment Thailand 20.7 –
3 Siam Real Estate Fund Property investment Thailand 27.5 27.6
Notes:1 Audited by other member firms of KPMG International.2 Audited by PricewaterhouseCoopers, Singapore and its associated firms.3 Audited by Ernst & Young, Singapore and its associated firms.
CapL Acc03 proof 04_OKp73-151 17/03/2004 06:41 PM Page 147
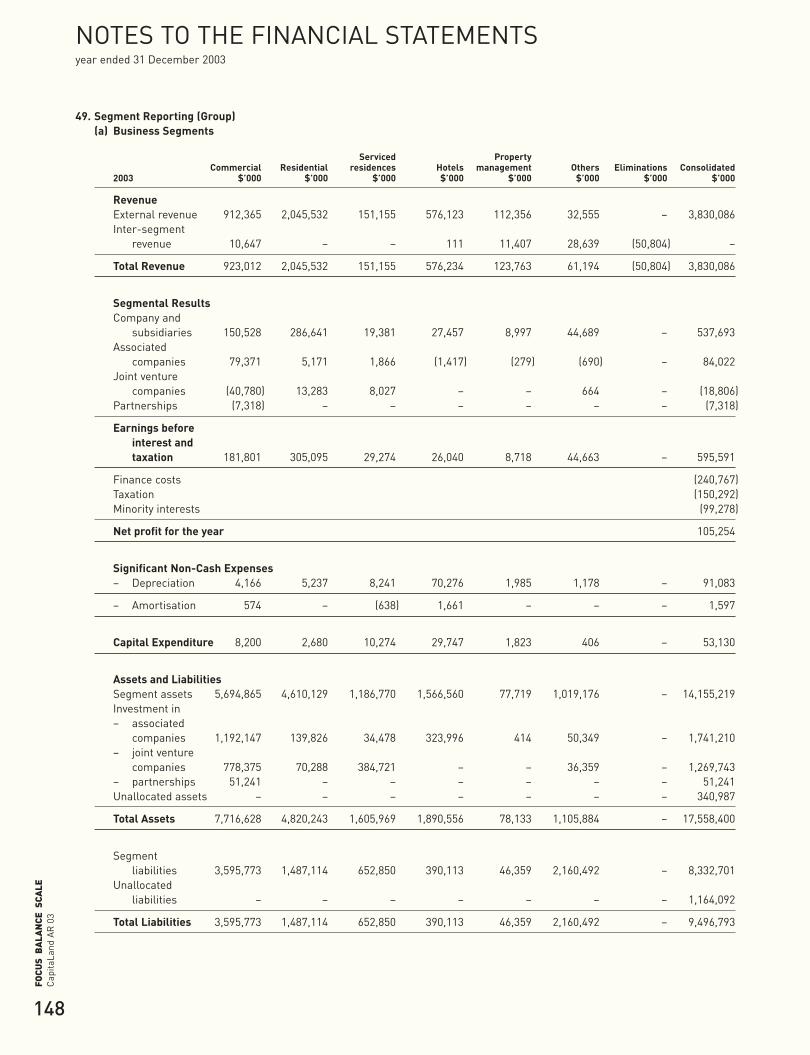
148
Cap
itaLa
ndA
R 0
3FO
CUS
BA
LAN
CE S
CALE
NOTES TO THE FINANCIAL STATEMENTS year ended 31 December 2003
49. Segment Reporting (Group)(a) Business Segments
Serviced PropertyCommercial Residential residences Hotels management Others Eliminations Consolidated
2003 $’000 $’000 $’000 $’000 $’000 $’000 $’000 $’000
RevenueExternal revenue 912,365 2,045,532 151,155 576,123 112,356 32,555 – 3,830,086Inter-segment
revenue 10,647 – – 111 11,407 28,639 (50,804) –
Total Revenue 923,012 2,045,532 151,155 576,234 123,763 61,194 (50,804) 3,830,086
Segmental ResultsCompany and
subsidiaries 150,528 286,641 19,381 27,457 8,997 44,689 – 537,693Associated
companies 79,371 5,171 1,866 (1,417) (279) (690) – 84,022Joint venture
companies (40,780) 13,283 8,027 – – 664 – (18,806)Partnerships (7,318) – – – – – – (7,318)
Earnings before interest and taxation 181,801 305,095 29,274 26,040 8,718 44,663 – 595,591
Finance costs (240,767)Taxation (150,292)Minority interests (99,278)
Net profit for the year 105,254
Significant Non-Cash Expenses– Depreciation 4,166 5,237 8,241 70,276 1,985 1,178 – 91,083
– Amortisation 574 – (638) 1,661 – – – 1,597
Capital Expenditure 8,200 2,680 10,274 29,747 1,823 406 – 53,130
Assets and LiabilitiesSegment assets 5,694,865 4,610,129 1,186,770 1,566,560 77,719 1,019,176 – 14,155,219Investment in – associated
companies 1,192,147 139,826 34,478 323,996 414 50,349 – 1,741,210– joint venture
companies 778,375 70,288 384,721 – – 36,359 – 1,269,743– partnerships 51,241 – – – – – – 51,241Unallocated assets – – – – – – – 340,987
Total Assets 7,716,628 4,820,243 1,605,969 1,890,556 78,133 1,105,884 – 17,558,400
Segment liabilities 3,595,773 1,487,114 652,850 390,113 46,359 2,160,492 – 8,332,701
Unallocated liabilities – – – – – – – 1,164,092
Total Liabilities 3,595,773 1,487,114 652,850 390,113 46,359 2,160,492 – 9,496,793
CapL Acc03 proof 04_OKp73-151 17/03/2004 06:41 PM Page 148

149
Cap
itaLa
ndA
R 0
3FO
CUS
BA
LAN
CE S
CALE
49. Segment Reporting (Group) (cont’d)(a) Business Segments (cont’d)
Serviced PropertyCommercial Residential residences Hotels management Others Eliminations Consolidated
2002 $’000 $’000 $’000 $’000 $’000 $’000 $’000 $’000
RevenueExternal revenue 672,861 1,769,341 152,964 549,356 107,685 9,472 – 3,261,679Inter-segment
revenue 14,307 – – 87 11,220 26,003 (51,617) –
Total Revenue 687,168 1,769,341 152,964 549,443 118,905 35,475 (51,617) 3,261,679
Segmental ResultsCompany and
subsidiaries 372,286 273,027 23,447 11,859 8,862 (3,013) – 686,468Associated
companies 39,030 6,119 (2,553) 17,810 169 (2,541) – 58,034Joint venture
companies 6,127 11,429 2,211 – – 694 – 20,461Partnerships (6) – – – – – – (6)
Earnings before interest and taxation 417,437 290,575 23,105 29,669 9,031 (4,860) – 764,957
Finance costs (283,981)Taxation (86,721)Minority interests (114,292)
Net profit for the year 279,963
Significant Non-Cash Expenses– Depreciation 6,766 7,207 9,982 64,277 1,915 1,592 – 91,739
– Amortisation 317 – 530 623 – – – 1,470
Capital Expenditure 6,355 7,973 11,163 56,077 3,537 738 – 85,843
Assets and LiabilitiesSegment assets 5,905,786 4,157,056 1,234,054 1,588,670 94,803 469,552 – 13,449,921Investment in– associated
companies 1,086,371 140,995 35,086 340,452 166 27,786 – 1,630,856– venture
companies 706,178 145,052 151,588 – – 78,209 – 1,081,027– partnerships 55,618 – – – – – – 55,618Unallocated assets – – – – – – – 255,176
Total Assets 7,753,953 4,443,103 1,420,728 1,929,122 94,969 575,547 – 16,472,598
Segment liabilities 3,841,938 1,662,932 547,845 368,701 54,798 552,333 – 7,028,547
Unallocated liabilities – – – – – – – 1,487,024
Total Liabilities 3,841,938 1,662,932 547,845 368,701 54,798 552,333 – 8,515,571
CapL Acc03 proof 04_OKp73-151 17/03/2004 06:41 PM Page 149
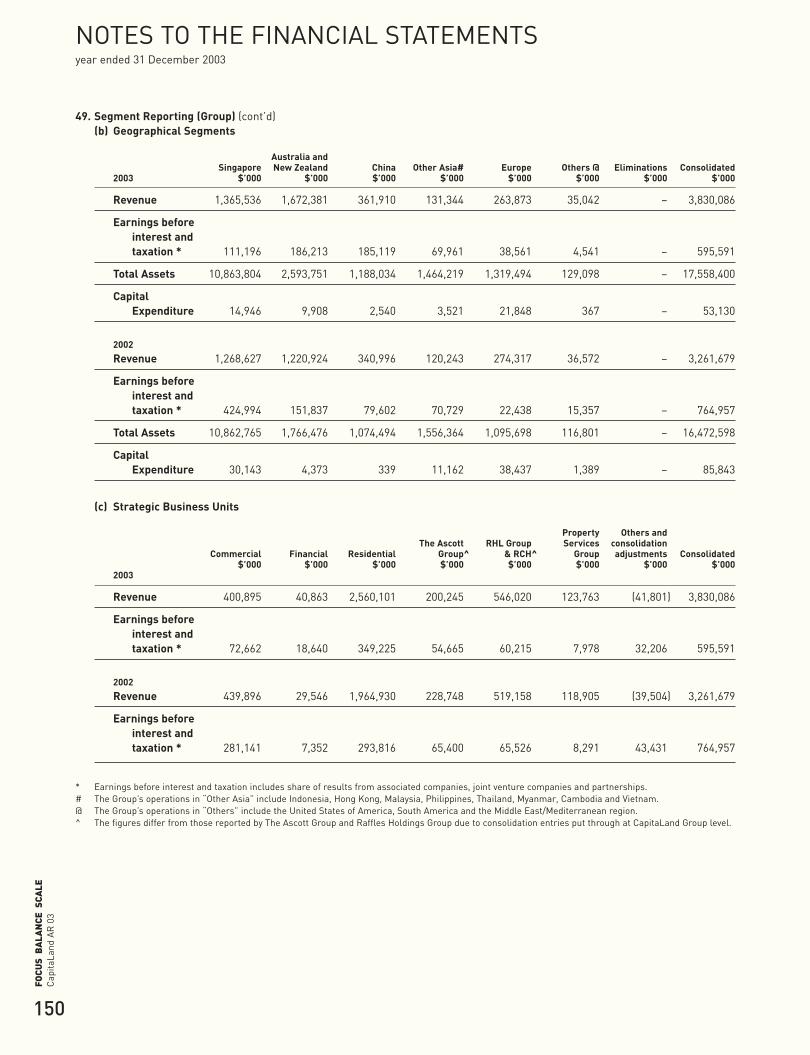
150
Cap
itaLa
ndA
R 0
3FO
CUS
BA
LAN
CE S
CALE
NOTES TO THE FINANCIAL STATEMENTS year ended 31 December 2003
49. Segment Reporting (Group) (cont’d)(b) Geographical Segments
Australia andSingapore New Zealand China Other Asia# Europe Others @ Eliminations Consolidated
2003 $’000 $’000 $’000 $’000 $’000 $’000 $’000 $’000
Revenue 1,365,536 1,672,381 361,910 131,344 263,873 35,042 – 3,830,086
Earnings before interest and taxation * 111,196 186,213 185,119 69,961 38,561 4,541 – 595,591
Total Assets 10,863,804 2,593,751 1,188,034 1,464,219 1,319,494 129,098 – 17,558,400
Capital Expenditure 14,946 9,908 2,540 3,521 21,848 367 – 53,130
2002
Revenue 1,268,627 1,220,924 340,996 120,243 274,317 36,572 – 3,261,679
Earnings before interest and taxation * 424,994 151,837 79,602 70,729 22,438 15,357 – 764,957
Total Assets 10,862,765 1,766,476 1,074,494 1,556,364 1,095,698 116,801 – 16,472,598
Capital Expenditure 30,143 4,373 339 11,162 38,437 1,389 – 85,843
(c) Strategic Business Units
Property Others andThe Ascott RHL Group Services consolidation
Commercial Financial Residential Group^ & RCH^ Group adjustments Consolidated$’000 $’000 $’000 $’000 $’000 $’000 $’000 $’000
2003
Revenue 400,895 40,863 2,560,101 200,245 546,020 123,763 (41,801) 3,830,086
Earnings before interest and taxation * 72,662 18,640 349,225 54,665 60,215 7,978 32,206 595,591
2002
Revenue 439,896 29,546 1,964,930 228,748 519,158 118,905 (39,504) 3,261,679
Earnings before interest and taxation * 281,141 7,352 293,816 65,400 65,526 8,291 43,431 764,957
* Earnings before interest and taxation includes share of results from associated companies, joint venture companies and partnerships.# The Group’s operations in “Other Asia” include Indonesia, Hong Kong, Malaysia, Philippines, Thailand, Myanmar, Cambodia and Vietnam.@ The Group’s operations in “Others” include the United States of America, South America and the Middle East/Mediterranean region.^ The figures differ from those reported by The Ascott Group and Raffles Holdings Group due to consolidation entries put through at CapitaLand Group level.
CapL Acc03 proof 04_OKp73-151 17/03/2004 06:41 PM Page 150
151
Cap
itaLa
ndA
R 0
3FO
CUS
BA
LAN
CE S
CALE
50. Subsequent Events(a) On 28 January 2004, Raffles Holdings Limited (“RH”), a subsidiary listed on the Singapore Exchange (“SGX-ST”), proposed a
capital distribution of $0.18 for each issued and paid-up share capital of RH amounting in aggregate to approximately $374.4million based on the issued and paid-up share capital of RH as at that date. The said distribution will be undertaken via acapital reduction in which RH’s ordinary shares’ par value will be reduced from $0.50 per share to $0.32 per share.Consequently, RH’s issued and paid-up share capital will be reduced from approximately $1,040 million to approximately$666 million.
The capital reduction and the capital distribution are conditional upon, inter alia, the passing of a special resolution byshareholders at an extraordinary general meeting to be convened and the approval of all relevant regulatory authorities.
(b) On 6 February 2004, the Company announced its proposal to establish Singapore’s first commercial real estate investmenttrust, known as CapitaCommercial Trust (“CCT”), by transferring seven prime commercial properties in the SingaporeCentral Business District to CCT at the independently appraised value of approximately $2.0185 billion. In conjunction withthis, there will be a capital reduction and a distribution in specie of approximately 60% of the issued CCT unitsj toshareholders in proportion to their shareholdings in the issued and paid-up ordinary share capital of the Company. For every1,000 shares owned, shareholders will receive 200 CCT units. An application has been made for CCT to be listed on the MainBoard of SGX-ST by way of an introduction. The capital reduction and distribution will be effected by way of a reduction ofapproximately $918 million in the share premium account of the Company.
The capital reduction and distribution in specie are conditional upon, inter alia, the passing of a special resolution byshareholders at an extraordinary general meeting to be convened, SGX-ST approval in-principle for the listing of CCT on theSGX-ST and the approval of all relevant regulatory authorities.
(c) The Group, through its wholly owned subsidiary, Birchvest Investment Pte Ltd, had on 5 February 2004 entered into aconditional sale and purchase agreement to sell its entire equity interest in RE Properties Pte Ltd which owns the investmentproperty at 268 Orchard Road. The sale consideration shall be the net asset value of RE Properties Pte Ltd as at thecompletion date and determined in accordance with the terms of the agreement which includes taking into account anagreed value of $135 million for the property. The transaction is due for completion in March 2004 and is not expected to haveany material impact on the net tangible assets and earnings per share of the Group for the financial year ending 31December 2004.
51. Comparative InformationComparatives in the financial statements have been changed from the previous year due to the adoption of the requirements ofINT FRS-19 as well as a change in accounting policies as described in note 39. In addition, the following comparatives have beenreclassified to conform with current year’s presentation:
The GroupProvision for taxation has been changed to $173,656,000 (previously reported: $143,325,000) and tax recoverables have beenchanged to $107,076,000 (previously reported $76,625,000). This arises from certain tax recoverables previously set-off againstprovision for taxation which have now been presented on a gross basis to better reflect the mode of settlement.
Other receivables have been changed to $275,694,000 (previously reported: $309,379,000) and minority interests have beenchanged to $1,895,805,000 (previously reported $1,857,790,000). This arises from certain amounts owing by minority interestpreviously included in other receivables which have now been reclassified.
The CompanyInterests in subsidiaries have been changed to $7,429,451,000 (previously reported: $7,196,761,000) and other non-currentliabilities have been changed to $1,549,240,000 (previously reported $1,316,550,000). This arises from certain amounts owingto/by certain subsidiaries previously presented on a net basis which have now been presented on a gross basis to better reflectthe mode of settlement with the counterparties.
CapL Acc03 proof 04_OKp73-151 17/03/2004 06:41 PM Page 151

152
Cap
itaLa
ndA
R 0
3FO
CUS
BA
LAN
CE S
CALE
FINANCIAL CALENDAR
Financial year ended 31 December 2003
Announcement of First Quarter Results 25 April 2003
Announcement of Half-year Results 11 August 2003
Announcement of Third Quarter Results 7 November 2003
Announcement of Full-year Results 6 February 2004
Annual General Meeting 12 April 2004
Books Closure Dates 19 April 2004 to 21 April 2004(both dates inclusive)
Proposed Payment of 2003 Final Dividend 30 April 2004
Financial year ending 31 December 2004
Proposed Announcement of First Quarter Results May 2004
Proposed Announcement of Half-year Results August 2004
Proposed Announcement of Third Quarter Results October 2004
Proposed Announcement of Full-year Results February 2005
CL AR03 152-172 A/W_OK 17/03/2004 06:43 PM Page 152
153
Cap
itaLa
ndA
R 0
3FO
CUS
BA
LAN
CE S
CALE
CapitaLand recognises and supports the Principles and spiritof the Code of Corporate Governance (the “Code”). We notethat each company needs to develop and maintain itscorporate governance process to meet its specific businessneeds and demands. We note also that the Guidance Notes of the Code may serve to flesh out the issues underlying eachof the Principles. We intend to keep focused on the substanceand spirit of the Principles of the Code even as we manage theoperations of the Company.
This Report sets out how our Company has effectively appliedthe principles of good corporate governance in a disclosure-based regime where the accountability of the Board to itsshareholders and the Management to the Board provide theframework for achieving a mutually beneficial tripartiterelationship aimed at creating and growing sustainableshareholder value.
The Group is committed to achieving high standards ofcorporate conduct. In the following sections covering each ofthe Principles, we have outlined our policies and practices.
(A) BOARD MATTERS
Board’s Conduct of its AffairsPrinciple 1: Every company should be headed by an effectiveBoard to lead and control the company.
Our Policy and Practices:
An effective board for CapitaLand and our listed subsidiariesmust be constituted with a majority of non-executive directorsindependent of Management, with the right core competenciesand diversity of experience to enable them in their collectivewisdom to contribute effectively. Every director is expected, in the course of his deliberation, to act in good faith, provideinsights and consider at all times, the interests of theCompany.
The key roles of our Board are to:• Guide the corporate strategy and directions of the Group;• Ensure that Senior Management discharges business
leadership and the highest quality of management skillswith integrity and enterprise; and
• Provide oversight in the proper conduct of the Group.
The positions of Chairman and Chief Executive Officer (“CEO”)are held by two persons in order to maintain an effectiveoversight.
The Board comprises 11 directors of whom 10 are non-executive directors. The Chairman is Mr Philip Yeo Liat Kok.The sole executive director is Mr Liew Mun Leong, who is thePresident & CEO.
The Board comprises business leaders and professionals withfinancial, banking and legal background. Profiles of thedirectors are found on pages 19 to 21 of the Annual Report.
The Board meets to review the key activities and businessstrategies of the Group. The Board meets regularly, at leastonce every quarter, to deliberate strategic policies of theGroup including significant acquisitions and disposals, approvethe annual budget, review the performance of the Group’sbusinesses and approve the release of the quarterly, half-yearly and full-year results. In addition, the Audit Committeehas been delegated the authority by the Board to review suchresults. A total of four Board meetings were held in 2003.
We believe that contribution from each director can bereflected in ways other than the reporting of attendance ofeach director at Board and committee meetings. A directorwould have been appointed on the strength of his calibre,experience, and stature, and his potential to contribute to the proper guidance of the Company and its businesses.
To focus on a director’s attendance at formal meetings alonemay lead to a narrow view of a director’s contribution. It mayalso not do justice to his contribution which can be in manydifferent forms, including Management’s access to him forguidance or exchange of views outside the formal environmentof Board meetings. In addition, he brings experiencedperspicacity and strategic networking relationships thatfurther the interests of the Group.
The matrix of the Board members’ participation in the variousBoard committees is provided on page 160 of this Report. Thisreflects each Board member’s additional responsibilities andspecial focus on the respective Board committees of theCompany.
The Board has adopted a set of internal controls which setsout approval limits for capital expenditure, investments anddivestments, bank borrowings and cheque signatoriesarrangements at Board level. Approval sublimits are alsoprovided at Management levels to facilitate operationalefficiency.
Changes to regulations and accounting standards aremonitored closely by Management. To keep pace withregulatory changes, where these changes have an importantbearing on the Company’s or directors’ disclosure obligations,directors are briefed either during Board meetings or atspecially-convened sessions conducted by professionals.
Newly-appointed directors are given briefings by Managementon the business activities of the Group and its strategicdirections.
All directors are also provided with relevant information on the Company’s policies and procedures relating togovernance issues including disclosure of interests insecurities, prohibitions on dealings in the Company’ssecurities, restrictions on disclosure of price sensitiveinformation and the disclosure of interests relating to certain property transactions.
CORPORATE GOVERNANCE
CL AR03 152-172 A/W_OK 17/03/2004 06:43 PM Page 153
154
Cap
itaLa
ndA
R 0
3FO
CUS
BA
LAN
CE S
CALE
Board Composition and BalancePrinciple 2: There should be a strong and independent elementon the Board, which is able to exercise objective judgment oncorporate affairs independently, in particular, fromManagement. No individual or small group of individualsshould be allowed to dominate the Board’s decision making.
Our Policy and Practices:
The majority of our directors are non-executive andindependent of Management. This enables Management tobenefit from their external, diverse and objective perspective ofissues that are brought before the Board. It would also enablethe Board to interact and work with Management through arobust exchange of ideas and views to help shape the strategicprocess. This, together with a clear separation of the role ofthe Chairman and the CEO, provides a healthy professionalrelationship between the Board and Management with clarityof roles and robust oversight as they deliberate on thebusiness activities of the Group.
The Board comprises 11 directors, 10 of whom are non-executive directors, independent of Management. Of the 10non-executive directors, eight are independent non-executivedirectors, who are independent of the principal shareholder.
The Board considers non-executive director, Mr Lucien WongYuen Kuai, an independent non-executive director, although hehas a relationship with the Company, falling under GuidanceNote 2.1(d), by virtue of his position as a managing partner ofM/s Allen & Gledhill rendering professional services to theGroup in fees aggregating more than $200,000.
Notwithstanding this relationship, the Board assesses him asan independent director due to his manifest ability to exercisestrong independent judgment in his deliberations in theinterests of the Company.
Mr Lucien Wong has conducted himself with professionalismand a high standard of duty and care as is required of hisprofession. He observes the ethical standards of his legalprofession and is most conscious of the need to disclose anyconflict of interests arising from his other engagements.
The Board is supported by Board committees to provideindependent oversight of Management. These Boardcommittees are the Audit Committee (“AC”), Executive Resourceand Compensation Committee (“ERCC”), Finance and BudgetCommittee (“FBC”), Investment Committee (“IC”), CorporateDisclosure Committee (“CDC”), Nominating Committee (“NC”)and Risk Committee (“RC”). The AC, ERCC and RC are made upof independent or non-executive directors. Other committeesmay be formed as dictated by business imperatives.
Membership of the different committees is carefully managedto ensure that there is equitable distribution of responsibilitiesamong Board members, to maximise the effectiveness of theBoard and foster active participation and contribution fromBoard members. Diversity of experience and appropriate skills
are also considered. The Company has also taken steps toensure that there are appropriate checks and balancesbetween the different committees. Hence, membership of theFBC and IC with more involvement in key business or executivedecisions, and membership of the AC with its oversight role,must be mutually exclusive.
Chairman and Chief Executive Officer Principle 3: There should be a clear division of responsibilitiesat the top of the company – the working of the Board and theexecutive responsibility of the company’s business – which willensure a balance of power and authority, such that no oneindividual represents a considerable concentration of power.
Our Policy and Practices:
We believe there must be a clear separation of the roles andresponsibilities between the Chairman and the President &CEO of the Company. The Chairman who is non-executive isresponsible for the Board and is free to act independently inthe best interests of the Company and shareholders, while theCEO is responsible for the running of the Group’s businesses.
The Chairman ensures that the members of the Board andManagement work together with integrity, competency andmoral authority, and that the Board engages Management in constructive debate on strategy, business operations,enterprise risk and other plans.
The President & CEO is a Board member and has full executiveresponsibilities over the business directions and operationaldecisions of the Group. The President & CEO, in consultationwith the Chairman, schedules Board meetings on a regularbasis and as and when required, and finalises the preparationof their agenda. He ensures the quality and timeliness of theflow of information between Management and the Board. He is also responsible for ensuring compliance with corporategovernance guidelines.
Board Membership Principle 4: There should be a formal and transparent process for the appointment of new directors to the Board. Asa principle of good corporate governance, all directors shouldbe required to submit themselves for re-nomination and re-election at regular intervals.
Our Policy and Practices:
We believe that Board renewal must be an ongoing process, to both ensure good governance, and maintain relevance to the changing needs of the Company and business. The CEO,where he is also a Board member, must also subject himselfto retirement and re-election by shareholders as part of Boardrenewal. Nomination and election of Board members are theprerogatives and proper rights of all shareholders.
The NC comprises Mr Peter Seah Lim Huat, Mr HsuanOwyang, Mr Liew Mun Leong, Sir Alan Cockshaw, Mr Lim ChinBeng and Mr Jackson Peter Tai.
CORPORATE GOVERNANCE
CL AR03 152-172 A/W_OK 17/03/2004 06:43 PM Page 154
155
Cap
itaLa
ndA
R 0
3FO
CUS
BA
LAN
CE S
CALE
The NC is chaired by a non-executive director who isindependent of Management, and comprises four independentnon-executive directors and an executive director, being thePresident & CEO.
While the Chairman of the NC is not regarded as independentwithin the context of the definition of “independence” in the Code, he is a non-executive director independent ofManagement with a clear separation of his role fromManagement in deliberations of the NC.
The NC ensures that the Board and Board committees in theGroup comprise individuals who are best able to dischargetheir responsibilities as directors having regard to the law andthe highest standards of corporate governance. In performingits role, the NC is guided by its Terms of Reference which sets out its responsibilities which include the identification of suitable candidates for appointments in the Group, inparticular, candidates who can value add to Managementthrough their contributions in the relevant strategic businessareas and such appointments will result in the constitution ofstrong and diverse boards. In particular, it reviews andrecommends:• Candidates to be CapitaLand’s nominees on the Boards and
Board committees of the listed companies within the Group;and
• Candidates to the Boards and Board committees of theholding companies of the strategic business units (“SBU”).
Our Articles of Association require one-third of our directors toretire and subject themselves to re-election by shareholders atevery Annual General Meeting (“AGM”) (“one-third rotationrule”). In other words, no director stays in office for more thanthree years without being re-elected by shareholders.
Our Articles of Association also provide for the CEO Boardmember to be subject to the one-third rotation rule as well.This is to separate his role as CEO from his position as a Boardmember, and to enable shareholders to exercise their full rightto select all Board members.
In addition, a newly-appointed director will submit himself forretirement and election at the AGM immediately following hisappointment. Thereafter, he is subject to the one-third rotationrule.
Board PerformancePrinciple 5: There should be a formal assessment of theeffectiveness of the Board as a whole and the contribution byeach director to the effectiveness of the Board.
Our Policy and Practices:
We believe that Board performance is ultimately reflected inthe performance of the Group. The Board should ensurecompliance with applicable laws and Board members shouldact in good faith, with due diligence and care in the bestinterests of the Company and its shareholders. In addition tothese fiduciary duties, the Board is charged with two key
responsibilities: setting strategic directions and ensuring that the Company is ably led. The measure of a Board’sperformance is also tested through its ability to lend support to Management, especially in times of crisis and to steer theGroup in the right direction.
The financial indicators set out in the Code as guides for theevaluation of directors are in our opinion more of a measure of Management’s performance and hence are less applicableto directors. In any case, such financial indicators provide asnapshot of a company’s performance, and do not fullymeasure the sustainable long term wealth and value creationof the Company.
The Board, through the delegation of its authority to the NC,has used its best efforts to ensure that directors appointedpossess the background, experience and knowledge intechnology, business, finance and management skills criticalto the Company’s business and that each director with hisspecial contribution brings to the Board an independent andobjective perspective to enable balanced and well-considereddecisions to be made.
Informal reviews of a Board’s performance are undertaken ona continual basis by the NC, with inputs from the other Boardmembers and the CEO. Renewal or replacement of Boardmembers do not necessarily reflect their contributions to date,but may be driven by the need to position and shape the Boardin line with the medium term needs of the Company and itsbusiness.
Access to InformationPrinciple 6: In order to fulfil their responsibilities, boardmembers should be provided with complete, adequate andtimely information prior to board meetings and on an on-going basis.
Our Policy and Practices:
We believe that the Board should be provided with timely andcomplete information prior to Board meetings and as andwhen the need arises. New Board members are fully briefedon the businesses of the Group.
Management is required to provide adequate and timelyinformation to the Board on Board affairs and issues thatrequire the Board’s decision, as well as ongoing reportsrelating to operational and financial performance of theCompany. The Articles of Association of the Company providefor directors to convene meetings by teleconferencing orvideoconferencing. Where a physical Board meeting is notpossible, timely communication with members of the Board iseffected through electronic means which include electronicmail, teleconferencing and videoconferencing. Alternatively,Management will arrange to personally meet and brief eachdirector before seeking the Board’s approval.
CL AR03 152-172 A/W_OK 17/03/2004 06:43 PM Page 155
156
Cap
itaLa
ndA
R 0
3FO
CUS
BA
LAN
CE S
CALE
The Board has separate and independent access to SeniorManagement and the Company Secretary at all times. The Company Secretary attends to corporate secretarialadministration matters and attends all Board meetings. TheBoard also has access to independent professional advicewhere appropriate.
Likewise, the AC must also meet the external and internalauditors separately at least once a year, without the presenceof the CEO and Senior Management members, in order to haveunfettered access to information that it may require.
(B) REMUNERATION MATTERS
Procedures for Developing Remuneration PoliciesPrinciple 7: There should be a formal and transparentprocedure for fixing the remuneration packages of individualdirectors. No director should be involved in deciding his ownremuneration.
Level and Mix of Remuneration Principle 8: The level of remuneration should be appropriate toattract, retain and motivate the directors needed to run thecompany successfully but companies should avoid paying morefor this purpose. A proportion of the remuneration, especiallythat of executive directors, should be linked to performance.
Disclosure on RemunerationPrinciple 9: Each company should provide clear disclosure ofits remuneration policy, level and mix of remuneration, and theprocedure for setting remuneration, in the company’s annualreport.
Our Policy and Practices:
We believe that a framework of remuneration for the Boardand key executives should not be taken in isolation. It shouldbe linked to the development of management bench strengthand key executives to ensure that there is a continualdevelopment of talent and renewal of strong and soundleadership for the continued success of the business and theCompany. We have in place an ERCC which serves the crucialrole of helping to ensure our businesses are able to recruit andretain the best talents to drive their business forward. Themembers of the ERCC are Mr Peter Seah Lim Huat, Mr HsuanOwyang, Sir Alan Cockshaw, Mr Lim Chin Beng and MrJackson Peter Tai.
All the members of the ERCC are independent ofManagement. While the Chairman of the ERCC is not regarded as independent within the context of the definition of “independence” in the Code, he is a non-executive directorindependent of Management with a clear separation of hisrole from Management in deliberations of the ERCC. Fromtime to time, we may co-opt an outside member into theERCC to provide a global perspective of talent managementand remuneration practices.
The ERCC oversees executive compensation and development in the Company, with the aim of building capable and committedmanagement teams, through competitive compensation,focused management and progressive policies which canattract, motivate and retain a pool of talented executives to meet the current and future growth of the Company.
Specifically, the ERCC will:• Approve the remuneration framework (including directors’
fees) for non-executive directors;• Establish compensation policies for key executives;• Approve salary reviews, bonus and incentives for key
executives;• Approve share incentives including stock options and share
ownership for executives;• Approve key appointments and review succession plans for
key positions; and• Oversee the development of key executives and younger
talented executives.
The ERCC conducts, on an annual basis, a succession planningreview of the CEO and selected key positions in the Company.Potential internal and external candidates for succession arereviewed for different time horizons of immediate, mediumterm and longer term needs.
The ERCC has access to expert professional advice on humanresource matters whenever there is a need to consultexternally. In its deliberations, the ERCC takes intoconsideration industry practices and norms in compensation.The CEO is not present during the discussions relating to hisown compensation and terms and conditions of service, andthe review of his performance. The CEO will be in attendancewhen the ERCC discusses policies and compensation of hissenior team and key staff, as well as major compensation andincentive policies such as share options, stock purchaseschemes, framework for bonus, staff salary and otherincentive schemes.
The President & CEO as executive director does not receivedirector’s fees. He is a lead member of Management. Hiscompensation consists of his salary, allowances, bonuses,options and performance share awards. The latter isconditional upon his meeting certain performance targets. The details of his compensation package are found in theAdditional Information section of the Annual Report(“Additional Information Section”).
Non-executive directors have remuneration packages whichconsist of a directors’ fee component, an attendance feecomponent and share options component pursuant to theCompany’s Share Option Plan. The directors’ fee policy isbased on a scale of fees divided into basic retainer fees asdirector and additional fees for attendance and serving onBoard committees. Details of the breakdown are found in theAdditional Information Section. Directors’ fees for non-executive directors are subject to the approval of shareholdersat the AGM.
CORPORATE GOVERNANCE
CL AR03 152-172 A/W_OK 17/03/2004 06:43 PM Page 156
157
Cap
itaLa
ndA
R 0
3FO
CUS
BA
LAN
CE S
CALE
The basis of allocation of the number of share options takesinto account a director’s additional responsibilities at Boardcommittees.
Rather than set out the names of the top five key executiveswho are not also directors of the Company, we have shown aGroup-wide cross-section of executives’ remuneration bynumber of employees from $100,000 upwards in bands of$250,000 in the Additional Information Section. This shouldgive a macro perspective of the remuneration pattern in theGroup, while maintaining confidentiality of staff remunerationmatters.
The Board has decided not to prepare a separateRemuneration Report as most of the information is found in the Additional Information Section.
(C) ACCOUNTABILITY AND AUDIT
AccountabilityPrinciple 10: The Board is accountable to the shareholderswhile the Management is accountable to the Board.
Our Policy and Practices:
We have always believed that we should conduct ourselves inways that deliver maximum sustainable value to ourshareholders. We promote best practices as a means to buildan excellent business for our shareholders. We areaccountable to shareholders for the Company’s performance.
Prompt fulfilment of statutory reporting requirements is butone way to maintain our shareholders’ confidence and trust inour capability and integrity.
As we sought to grow our business globally, and sought towiden our shareholder base internationally, we implementedquarterly reporting in the third quarter of 2001 before the Codemade it a requirement. In fact, we were the first listed propertygroup in Singapore to introduce quarterly reporting, todischarge our continuing obligation of prompt and thoroughdisclosures.
Audit CommitteePrinciple 11: The Board should establish an AC with writtenterms of reference which clearly set out its authority andduties.
Our Policy and Practices:
Our internal policy requires the AC to have at least threemembers, all of whom are non-executive and the majoritymust be independent.
The AC consists of three directors. Mr Richard Edward Hale,Chairman of the AC, is an independent director. The othermembers of the AC are Mr Sum Soon Lim, who is independentof Management, and Mr Lucien Wong Yuen Kuai, who isconsidered independent as mentioned under Principle 2 on
Page 154 of this Report. The members bring with theminvaluable managerial and professional expertise in thefinancial and legal domain. The AC has a set of Terms ofReference defining its scope of authority which includes reviewof the annual audit plan, the adequacy of the internal auditprocess, results of audit findings and Management’s response,the adequacy and effectiveness of internal controls, andInterested Person Transactions. The AC reviews quarterly, half-yearly and annual financial statements and the appointmentand re-appointment of auditors before recommending them tothe Board for approval. The AC also approves the compensationof the external auditors as well as considers the nature andextent of non-audit services and their potential impact on theindependence and objectivity of the external auditors.
The AC meets with the external and internal auditors, withoutthe presence of Management, at least once a year to discussthe reasonableness of the financial reporting process, systemof internal control, significant comments andrecommendations.
A total of four AC meetings were held during 2003.
Internal ControlsPrinciple 12: The Board should ensure that the Managementmaintains a sound system of internal controls to safeguard theshareholders’ investments and the company’s assets.
Internal Audit Principle 13: The company should establish an internal auditfunction that is independent of the activities it audits.
Our Policy and Practices:
We believe in the need to put in place a system of internalcontrols to safeguard shareholders’ interests and Group’sassets, and to manage risks. Apart from the AC, other Boardcommittees may be set up from time to time to addressspecific issues or risks.
The AC’s responsibilities in the Group’s internal controls arecomplemented by the work of the FBC, which reviews theGroup Finance Manual, and the RC which oversees variousaspects of controls and risk management of the Group. Theactivities of these committees are reported on pages 158 and159 of this Report. Based on the review of these committees,the Board, through the AC, is satisfied that there are adequateinternal controls in the Group.
The Group has its own Internal Audit Department (“CL IA”)which reports directly to the Chairman of the AC andadministratively to the Chief Financial Officer, who reports to the CEO. CL IA plans its internal audit schedules inconsultation with, but independently of, Management and itsplan is submitted to the AC for approval at the beginning ofeach year. The AC must also meet with CL IA at least once ayear without the presence of Management.
CL AR03 152-172 A/W_OK 17/03/2004 06:43 PM Page 157
158
Cap
itaLa
ndA
R 0
3FO
CUS
BA
LAN
CE S
CALE
CL IA is a corporate member of the Singapore branch of theInstitute of Internal Auditors Inc. (“IIA”), which has itsheadquarters in the USA. CL IA subscribes to, and is guided by,the Standards for the Professional Practice of Internal Auditing(“Standards”) developed by the IIA and has incorporated thesestandards into its audit practices.
The Standards set by the IIA cover requirements on: • Independence• Professional Proficiency• Scope of Work• Performance of Audit Work• Management of the Internal Auditing Department.
CL IA staff involved in Information Technology (“IT”) audits areCertified Information System Auditors and members of theInformation System Audit and Control Association (“ISACA”) inthe USA. The ISACA Information System Auditing Standardsprovide guidance on the standards and procedures to beapplied in IT audits.
To ensure that the internal audits are performed by competentprofessionals, CL IA recruits and employs qualified staff. Inorder that their technical knowledge remains current andrelevant, CL IA identifies and provides training anddevelopment opportunities to the staff.
(D) COMMUNICATION WITH SHAREHOLDERS
Principle 14: Companies should engage in regular, effectiveand fair communication with shareholders.
Greater Shareholder ParticipationPrinciple 15: Companies should encourage greatershareholder participation at AGMs, and allow shareholders theopportunity to communicate their views on various mattersaffecting the company.
Our Policy and Practices:
We believe in regular and timely communication withshareholders as part of our organisational development tobuild systems and procedures that will enable us to operateglobally.
CapitaLand has won the “Most Transparent Company Award(Property category)” given by the Securities InvestorsAssociation of Singapore for three consecutive years in 2001,2002 and 2003. This is besides coming out tops in corporategovernance polls carried out by regional financial magazines,FinanceAsia and Asiamoney, and in a study of 180 listed-property companies in the Asia-Pacific conducted by theNational University of Singapore.
The Company adopts the practice of regularly communicatingmajor developments in its business and operations to variousconstituencies, including the SGX-ST, shareholders, analysts,the media and its employees. In addition, it attends to queriesfrom the various constituencies. It also communicates on an
immediate basis as required under the SGX-ST Listing Manual,or as soon as possible where immediate disclosure is notpracticable. Our Investor Relations and Communicationsdepartments hold regular briefings and meetings for analystsand the media, respectively. The briefings generally coincidewith the release of the Group’s half-year and full-year results.During these results briefings, senior members ofCapitaLand’s Management review the Group’s most recentperformance and discuss the Company’s outlook. In theinterests of transparency and broad dissemination, thesebriefings are webcast live and are accessible to the public onthe Group’s website at www.capitaland.com. Recordings of thebriefings are then archived on the Company’s corporatewebsite.
In the past year, Senior Management has met with institutionalinvestors in Singapore, the USA, Europe, Hong Kong, Australiaand Japan. Management has held meetings with the mediaboth in Singapore and its overseas offices. In addition,CapitaLand pursues opportunities to keep retail shareholdersinformed as well.
We support the Code’s principle to encourage shareholderparticipation. All shareholders receive the summary financialreport and notice of the AGM. The notice of the AGM is alsoadvertised in the press and issued via MASNET. At the AGM,shareholders have the opportunity to communicate their viewsand discuss with directors and Management on mattersaffecting the Company. The respective Chairpersons of the AC,NC and ERCC, and the external auditors, endeavour, as far asreasonably practicable, to be present at the AGM. Voting inabsentia and by email may only be possible following carefulstudy to ensure that integrity of the information andauthentication of the identity of shareholders through the webare not compromised and following legislative changes beingput in place to recognise electronic voting.
OTHER BOARD COMMITTEES
Finance and Budget CommitteeThe FBC is chaired by Mr Hsuan Owyang and comprises MrLiew Mun Leong, Mr Jackson Peter Tai and Mr Lui ChongChee, the Chief Financial Officer.
During 2003, the FBC met three times to review the quarterlyfinancial results, forecasts and the annual financial plan of theGroup. It also reviewed and approved updates to theCapitaLand Group Finance Manual.
Corporate Disclosure CommitteeThe CDC is chaired by Mr Sum Soon Lim and comprises MrLiew Mun Leong and Mr Lucien Wong Yuen Kuai.
The CDC reviews corporate disclosure issues andannouncements made to the SGX-ST, and ensures thatCapitaLand adopts good corporate governance and pursuesbest practices in terms of transparency to shareholders andthe investing community. Though there were no formalmeetings for the CDC in 2003, the views and approvals of the
CORPORATE GOVERNANCE
CL AR03 152-172 A/W_OK 17/03/2004 06:43 PM Page 158
159
Cap
itaLa
ndA
R 0
3FO
CUS
BA
LAN
CE S
CALE
CDC were sought on various announcements and pressreleases issued by the Company.
Investment CommitteeThe IC is chaired by Mr Philip Yeo Liat Kok and comprises MrHsuan Owyang, Mr Liew Mun Leong, Mr Jackson Peter Tai andMr Lui Chong Chee.
Since 2000, the Board had approved the Delegation of Authorityto the various SBU Boards and raised the investment approvallimits. There were no formal meetings for the IC during theyear. Even so, the views of the IC and Board were activelysought by the various SBUs, and the approval of the ICobtained where appropriate.
Risk CommitteeThe RC was formed in September 2002 as part of CapitaLand’sefforts to strengthen its risk management processes andframework.
The RC comprises Mr Sum Soon Lim who is the Chairman, Mr Richard Edward Hale and Mr Lucien Wong Yuen Kuai.
The committee’s role and functions are to:• Review the adequacy of CapitaLand’s risk management
process;• Review and approve in broad terms, risk guidelines and
limits. These include country concentration limits and risk-adjusted country hurdle rates for the Group and the SBUs,which are reviewed annually; and
• Review CapitaLand’s risk portfolio and risk levels. In thisregard, the RC is assisted by the CapitaLand Corporate RiskAssessment Group, which is responsible for compiling theGroup Quarterly Risk Report. Included in the report is amonitoring of the utilization rates of approved country andtreasury limits of the Group.
RISK ASSESSMENT AND MANAGEMENT
The CapitaLand Group has evolved and put in place today acomprehensive risk management framework across the entireorganisation. Supervisory oversight is provided by the RC (seeparagraph above on role of RC), while the President & CEO andmembers of Senior Management are directly responsible formanaging the process. The President & CEO is assisted in thisfunction by the Risk Assessment Group (“RAG”).
The framework provides a structured context for the RC, thePresident & CEO and members of Senior Management to meeton a quarterly basis to review the mix and levels of riskspertaining to the Group’s portfolio of assets and liabilities. Toassist them in this function, a comprehensive portfolio riskreport measuring a whole spectrum of risks including propertymarket, interest rate and currency risks based on a Value-at-risk methodology is compiled and presented by the RAG.Usage of approved limits are also reviewed, significant issuesare identified and corrective actions are proposed as part ofthe meeting process.
At the individual project level, all investment proposals above astipulated value are now subject to an independent andcomprehensive risk evaluation by the RAG. In addition to anidentification and possible mitigation of all the risks related tothe proposed investment, acquisitions have to clear specificrisk-adjusted hurdle rates for the different SBUs andcountries. As a best practice, all approved and committedprojects are reviewed on a quarterly basis to assess theperformance of the investment against the projected cashflows at the proposal stage. If necessary, corrective actions toimprove the risk-return profile of the investments arediscussed and acted on.
Completing the risk management framework is the CL IA,which is responsible for providing an independent andobjective evaluation of the adequacy of the Group’s riskmanagement control and governance processes.
DEALINGS IN SECURITIES
In compliance with the Best Practices Guide, the Company hasissued guidelines to directors and employees in the Group.These guidelines prohibit dealings in the Company’s securitieswhile in possession of material unpublished price-sensitiveinformation and during the “close period” which is defined astwo weeks before and up to and including the date ofannouncement of results (quarterly, half-yearly and full-year).
In addition, directors and employees are also prohibited fromdealing in securities of other listed companies while they arein possession of unpublished price-sensitive information byvirtue of their directorship/employment in the Company or anyof its Group companies. They are also made aware that theoverarching insider trading laws are applicable at all times.
TRANSPARENCY, DISCLOSURE & DISSEMINATION OFINFORMATION
CapitaLand’s commitment to higher standards of transparency,disclosure and dissemination not only ensures compliance withrules and regulations applicable to public listed companies,but also reduces share price volatility, improves marketvaluation, increases liquidity, increases the Group’s credibilityand enhances overall shareholder value. Some of the proactivesteps undertaken by the Group are quarterly release of results,furnishing more details in its annual reports and webcasting.
STATEMENT OF COMPLIANCE
The Board of directors confirms that during the financial yearended 31 December 2003, the Company has complied with itspolicies and practices based on the SGX-ST Best PracticesGuide and the Code.
CL AR03 152-172 A/W_OK 17/03/2004 06:43 PM Page 159
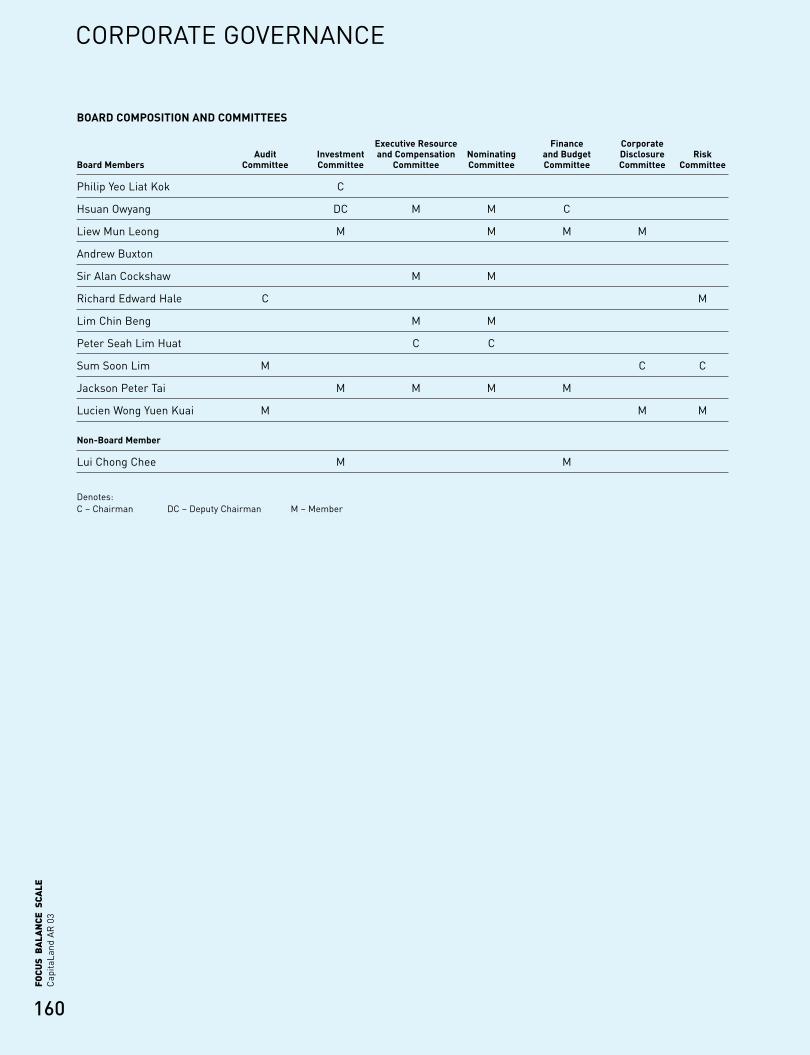
160
Cap
itaLa
ndA
R 0
3FO
CUS
BA
LAN
CE S
CALE
BOARD COMPOSITION AND COMMITTEES
Executive Resource Finance Corporate Audit Investment and Compensation Nominating and Budget Disclosure Risk
Board Members Committee Committee Committee Committee Committee Committee Committee
Philip Yeo Liat Kok C
Hsuan Owyang DC M M C
Liew Mun Leong M M M M
Andrew Buxton
Sir Alan Cockshaw M M
Richard Edward Hale C M
Lim Chin Beng M M
Peter Seah Lim Huat C C
Sum Soon Lim M C C
Jackson Peter Tai M M M M
Lucien Wong Yuen Kuai M M M
Non-Board Member
Lui Chong Chee M M
Denotes:C – Chairman DC – Deputy Chairman M – Member
CORPORATE GOVERNANCE
CL AR03 152-172 A/W_OK 17/03/2004 06:43 PM Page 160
161
Cap
itaLa
ndA
R 0
3FO
CUS
BA
LAN
CE S
CALE
ADDITIONALINFORMATION
CL AR03 152-172 A/W_OK 17/03/2004 06:43 PM Page 161
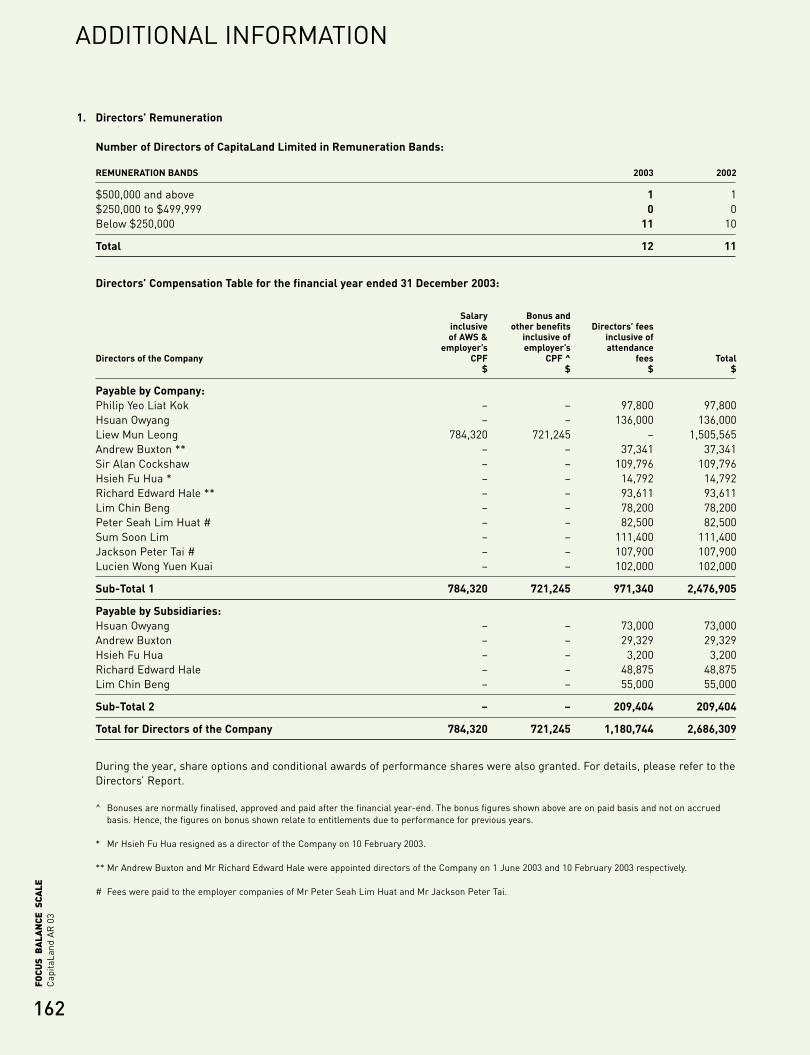
162
Cap
itaLa
ndA
R 0
3FO
CUS
BA
LAN
CE S
CALE
1. Directors’ Remuneration
Number of Directors of CapitaLand Limited in Remuneration Bands:
REMUNERATION BANDS 2003 2002
$500,000 and above 1 1$250,000 to $499,999 0 0Below $250,000 11 10
Total 12 11
Directors’ Compensation Table for the financial year ended 31 December 2003:
Salary Bonus andinclusive other benefits Directors’ feesof AWS & inclusive of inclusive of
employer’s employer’s attendance Directors of the Company CPF CPF ^ fees Total
$ $ $ $
Payable by Company:Philip Yeo Liat Kok – – 97,800 97,800Hsuan Owyang – – 136,000 136,000Liew Mun Leong 784,320 721,245 – 1,505,565Andrew Buxton ** – – 37,341 37,341Sir Alan Cockshaw – – 109,796 109,796Hsieh Fu Hua * – – 14,792 14,792Richard Edward Hale ** – – 93,611 93,611Lim Chin Beng – – 78,200 78,200Peter Seah Lim Huat # – – 82,500 82,500Sum Soon Lim – – 111,400 111,400Jackson Peter Tai # – – 107,900 107,900Lucien Wong Yuen Kuai – – 102,000 102,000
Sub-Total 1 784,320 721,245 971,340 2,476,905
Payable by Subsidiaries:Hsuan Owyang – – 73,000 73,000Andrew Buxton – – 29,329 29,329Hsieh Fu Hua – – 3,200 3,200Richard Edward Hale – – 48,875 48,875Lim Chin Beng – – 55,000 55,000
Sub-Total 2 – – 209,404 209,404
Total for Directors of the Company 784,320 721,245 1,180,744 2,686,309
During the year, share options and conditional awards of performance shares were also granted. For details, please refer to theDirectors’ Report.
^ Bonuses are normally finalised, approved and paid after the financial year-end. The bonus figures shown above are on paid basis and not on accruedbasis. Hence, the figures on bonus shown relate to entitlements due to performance for previous years.
* Mr Hsieh Fu Hua resigned as a director of the Company on 10 February 2003.
** Mr Andrew Buxton and Mr Richard Edward Hale were appointed directors of the Company on 1 June 2003 and 10 February 2003 respectively.
# Fees were paid to the employer companies of Mr Peter Seah Lim Huat and Mr Jackson Peter Tai.
ADDITIONAL INFORMATION
CL AR03 152-172 A/W_OK 17/03/2004 06:43 PM Page 162
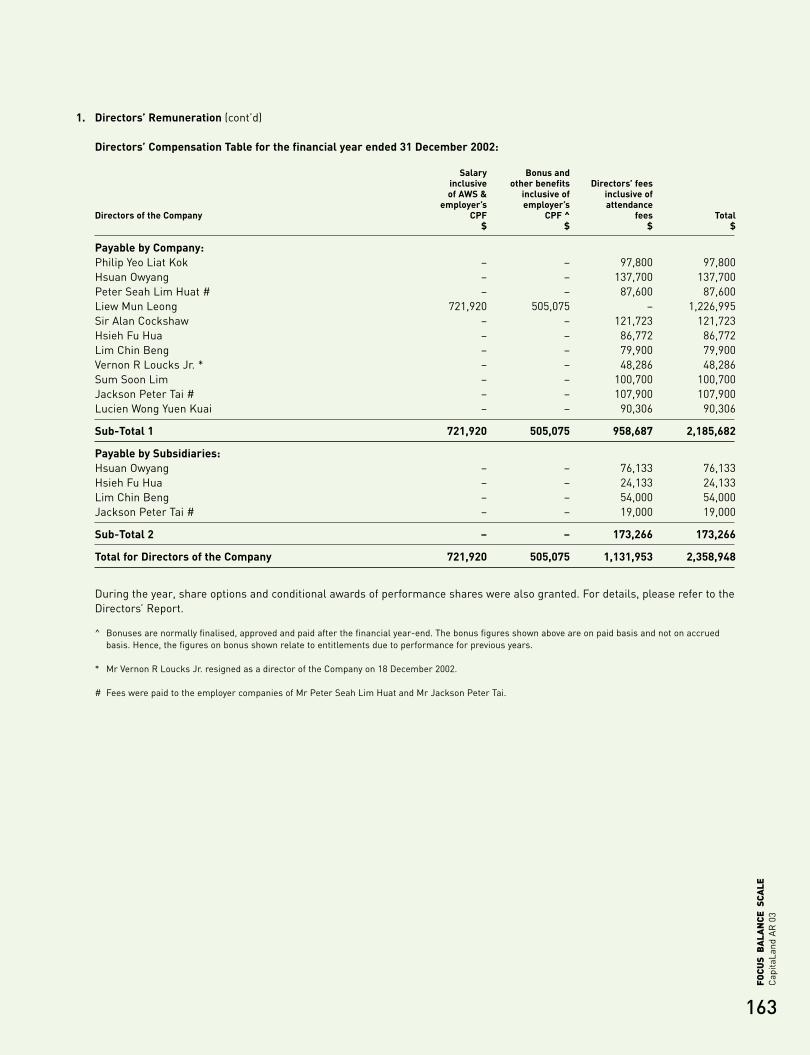
163
Cap
itaLa
ndA
R 0
3FO
CUS
BA
LAN
CE S
CALE
1. Directors’ Remuneration (cont’d)
Directors’ Compensation Table for the financial year ended 31 December 2002:
Salary Bonus andinclusive other benefits Directors’ feesof AWS & inclusive of inclusive of
employer’s employer’s attendance Directors of the Company CPF CPF ^ fees Total
$ $ $ $
Payable by Company:Philip Yeo Liat Kok – – 97,800 97,800Hsuan Owyang – – 137,700 137,700Peter Seah Lim Huat # – – 87,600 87,600Liew Mun Leong 721,920 505,075 – 1,226,995Sir Alan Cockshaw – – 121,723 121,723Hsieh Fu Hua – – 86,772 86,772Lim Chin Beng – – 79,900 79,900Vernon R Loucks Jr. * – – 48,286 48,286Sum Soon Lim – – 100,700 100,700Jackson Peter Tai # – – 107,900 107,900Lucien Wong Yuen Kuai – – 90,306 90,306
Sub-Total 1 721,920 505,075 958,687 2,185,682
Payable by Subsidiaries:Hsuan Owyang – – 76,133 76,133Hsieh Fu Hua – – 24,133 24,133Lim Chin Beng – – 54,000 54,000Jackson Peter Tai # – – 19,000 19,000
Sub-Total 2 – – 173,266 173,266
Total for Directors of the Company 721,920 505,075 1,131,953 2,358,948
During the year, share options and conditional awards of performance shares were also granted. For details, please refer to theDirectors’ Report.
^ Bonuses are normally finalised, approved and paid after the financial year-end. The bonus figures shown above are on paid basis and not on accruedbasis. Hence, the figures on bonus shown relate to entitlements due to performance for previous years.
* Mr Vernon R Loucks Jr. resigned as a director of the Company on 18 December 2002.
# Fees were paid to the employer companies of Mr Peter Seah Lim Huat and Mr Jackson Peter Tai.
CL AR03 152-172 A/W_OK 17/03/2004 06:43 PM Page 163

164
Cap
itaLa
ndA
R 0
3FO
CUS
BA
LAN
CE S
CALE
2. Executives’ RemunerationRemuneration Data (for employees earning $100,000 and above) for financial years ended 31 December 2003 and 2002:
2003 2002Total Number Total Dollar Total Number Total Dollar
Total Compensation Bands of Employees Value of Employees Value$ $
$100,000 to $249,999 291 39,017,199 249 34,560,092$250,000 to $499,999 32 10,837,383 33 11,186,762$500,000 to $749,999 9 5,225,629 9 5,756,449$750,000 to $999,999 3 2,495,917 – –$1,000,000 to $1,250,000 – – 2 2,420,724✞ $1,250,000 3 5,649,949 – –
Total 338 63,226,077 293 53,924,027
Note 1: The above executives’ remuneration data pertains only to Group’s employees in Singapore and those who are posted overseas. It does not includethe Group’s overseas subsidaries’ employees and their remuneration.
Note 2: Total compensation comprises salary, annual wage supplement, bonus and other benefits inclusive of employer’s CPF.
3. Directors’ Interests in Contracts entered with the GroupDuring the year, Mr Liew Mun Leong, the President and Chief Executive Officer who is also a director of the Company, bought a residential unit in Summit Residences (one of the Group’s projects in China) for RMB 1,370,686 (S$ equivalent of approximatelyS$296,000). The Audit Committee had reviewed the transaction and was satisfied that the terms of the transaction were fair andreasonable, and were not prejudicial to the interest of the Company and its minority shareholders. The Board had also approvedthe said sale.
In addition, the following professional fees were paid or payable to certain directors and/or to firms in which they are membersand/or have a substantial financial interest:
The Group The Company2003 2002 2003 2002
$’000 $’000 $’000 $’000
Lucien Wong Yuen Kuai:Paid or payable to Allen & Gledhill 1,493 3,203 58 518
Sir Alan Cockshaw:Paid or payable to Shawbridge Management Limited 117 111 17 17
Andrew Buxton:Paid or payable to Andrew Buxton 62 – – –
4. Significant Related Party TransactionsPlease refer to note 44 in the statutory accounts.
ADDITIONAL INFORMATION
CL AR03 pg164 A/W-ok 17/03/2004 06:50 PM Page 164
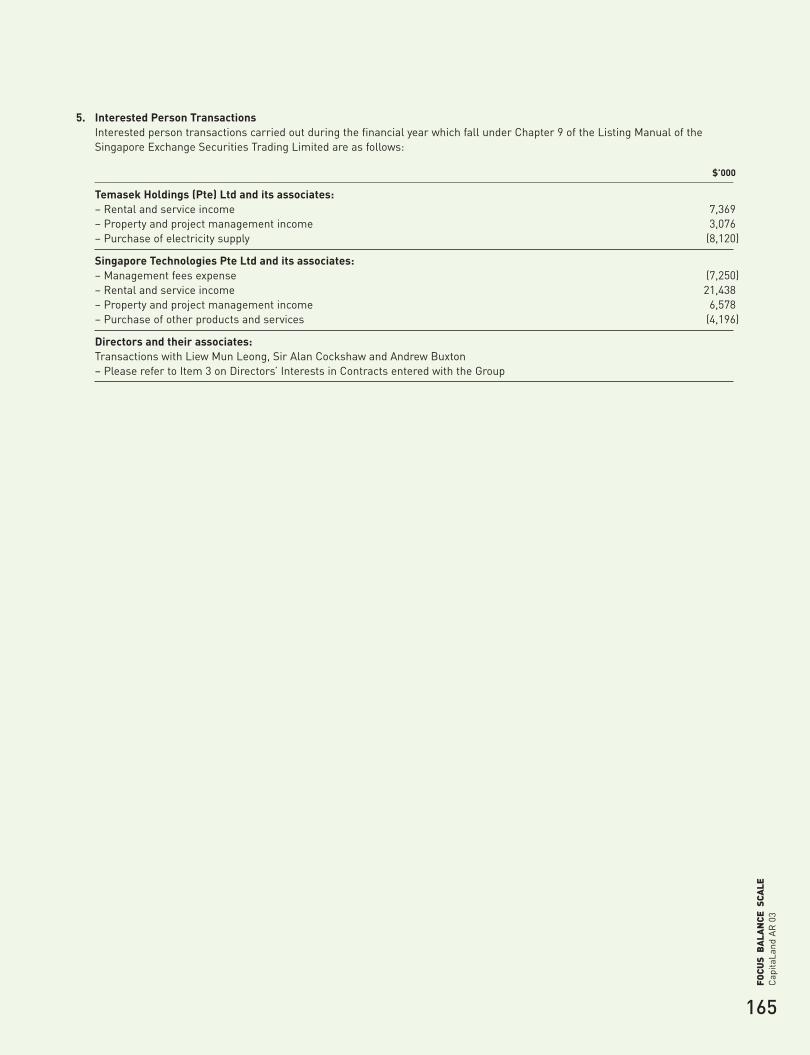
165
Cap
itaLa
ndA
R 0
3FO
CUS
BA
LAN
CE S
CALE
5. Interested Person TransactionsInterested person transactions carried out during the financial year which fall under Chapter 9 of the Listing Manual of theSingapore Exchange Securities Trading Limited are as follows:
$’000
Temasek Holdings (Pte) Ltd and its associates:– Rental and service income 7,369– Property and project management income 3,076– Purchase of electricity supply (8,120)
Singapore Technologies Pte Ltd and its associates:– Management fees expense (7,250)– Rental and service income 21,438– Property and project management income 6,578– Purchase of other products and services (4,196)
Directors and their associates:Transactions with Liew Mun Leong, Sir Alan Cockshaw and Andrew Buxton– Please refer to Item 3 on Directors’ Interests in Contracts entered with the Group
CL AR03 152-172 A/W_OK 17/03/2004 06:44 PM Page 165

166
Cap
itaLa
ndA
R 0
3FO
CUS
BA
LAN
CE S
CALE
Authorised Share CapitalS$4,000,000,000 (comprising 4,000,000,000 Ordinary Shares of S$1 each) andUS$172,500 (comprising 172,500 Redeemable Convertible Cumulative Preference Shares of US$1 each)
Issued and Fully Paid-Up CapitalS$2,517,349,898 (comprising 2,517,349,898 Ordinary Shares of S$1 each fully paid; voting rights: one vote per share)
Twenty Largest ShareholdersAs shown in the Register of Members and Depository Register
Name No. of Shares %
1 Singapore Technologies Pte Ltd 1,120,748,933 44.522 ST Property Investments Pte Ltd 328,344,838 13.043 DBS Nominees Pte Ltd 232,929,402 9.254 Raffles Nominees Pte Ltd 161,053,235 6.405 Citibank Nominees Singapore Pte Ltd 116,095,814 4.616 United Overseas Bank Nominees Pte Ltd 91,656,964 3.647 HSBC (Singapore) Nominees Pte Ltd 71,114,979 2.828 Oversea-Chinese Bank Nominees Pte Ltd 23,525,590 0.939 Lee Pineapple Company Pte Ltd 20,000,000 0.7910 Pei Hwa Foundation Limited 13,641,557 0.5411 DBS Vickers Securities (Singapore) Pte Ltd 12,268,153 0.4912 Morgan Stanley Asia (Singapore) Securities Pte Ltd 8,775,059 0.3513 DB Nominees (S) Pte Ltd 4,315,493 0.1714 UOB Kay Hian Pte Ltd 3,366,375 0.1315 OCBC Securities Private Ltd 2,600,952 0.1016 Phillip Securities Private Ltd 2,372,418 0.0917 Societe Generale Singapore Branch 2,369,000 0.0918 BNP Paribas Nominees Singapore Pte Ltd 2,202,750 0.0919 G K Goh Stockbrokers Pte Ltd 2,193,008 0.0920 ABN Amro Nominees Singapore Pte Ltd 1,823,750 0.07
Total 2,221,398,270 88.21
SHAREHOLDING STATISTICSas at 20 February 2004
CL AR03 152-172 A/W_p164,166-7 17/03/2004 06:52 PM Page 166
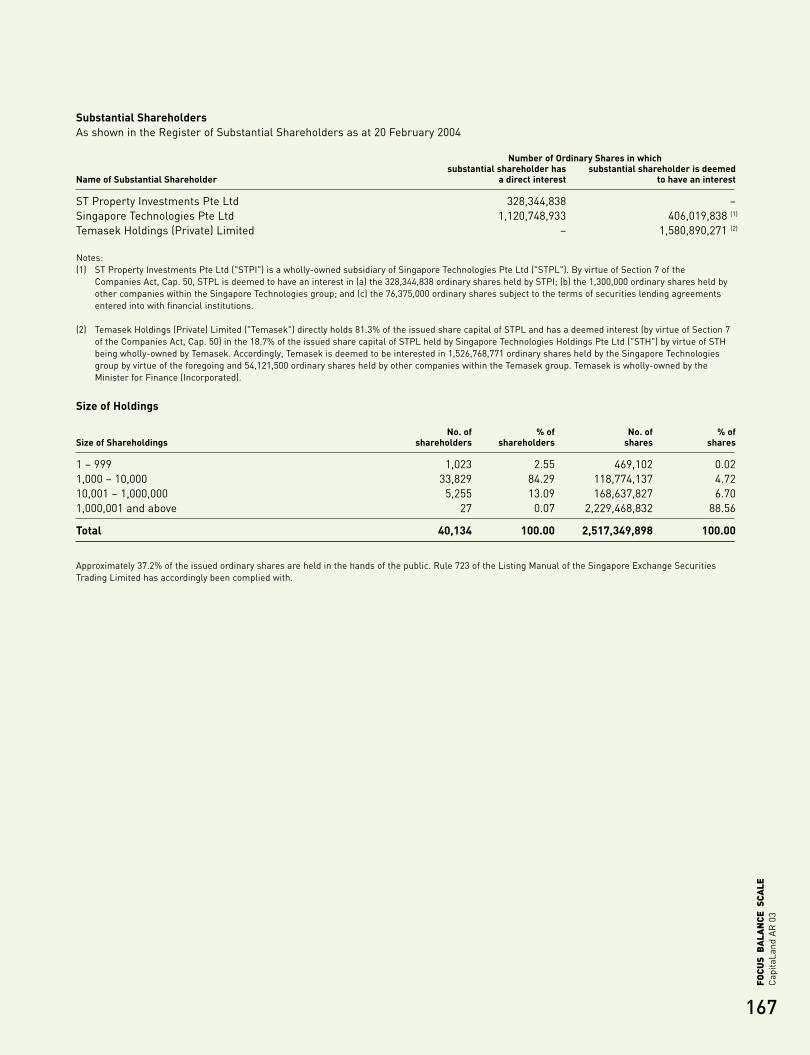
167
Cap
itaLa
ndA
R 0
3FO
CUS
BA
LAN
CE S
CALE
Substantial ShareholdersAs shown in the Register of Substantial Shareholders as at 20 February 2004
Number of Ordinary Shares in whichsubstantial shareholder has substantial shareholder is deemed
Name of Substantial Shareholder a direct interest to have an interest
ST Property Investments Pte Ltd 328,344,838 –Singapore Technologies Pte Ltd 1,120,748,933 406,019,838 (1)
Temasek Holdings (Private) Limited – 1,580,890,271 (2)
Notes:(1) ST Property Investments Pte Ltd ("STPI") is a wholly-owned subsidiary of Singapore Technologies Pte Ltd ("STPL"). By virtue of Section 7 of the
Companies Act, Cap. 50, STPL is deemed to have an interest in (a) the 328,344,838 ordinary shares held by STPI; (b) the 1,300,000 ordinary shares held byother companies within the Singapore Technologies group; and (c) the 76,375,000 ordinary shares subject to the terms of securities lending agreementsentered into with financial institutions.
(2) Temasek Holdings (Private) Limited ("Temasek") directly holds 81.3% of the issued share capital of STPL and has a deemed interest (by virtue of Section 7of the Companies Act, Cap. 50) in the 18.7% of the issued share capital of STPL held by Singapore Technologies Holdings Pte Ltd ("STH") by virtue of STHbeing wholly-owned by Temasek. Accordingly, Temasek is deemed to be interested in 1,526,768,771 ordinary shares held by the Singapore Technologiesgroup by virtue of the foregoing and 54,121,500 ordinary shares held by other companies within the Temasek group. Temasek is wholly-owned by theMinister for Finance (Incorporated).
Size of Holdings
No. of % of No. of % ofSize of Shareholdings shareholders shareholders shares shares
1 – 999 1,023 2.55 469,102 0.021,000 – 10,000 33,829 84.29 118,774,137 4.7210,001 – 1,000,000 5,255 13.09 168,637,827 6.701,000,001 and above 27 0.07 2,229,468,832 88.56
Total 40,134 100.00 2,517,349,898 100.00
Approximately 37.2% of the issued ordinary shares are held in the hands of the public. Rule 723 of the Listing Manual of the Singapore Exchange SecuritiesTrading Limited has accordingly been complied with.
CL AR03 152-172 A/W_p164,166-7 17/03/2004 06:52 PM Page 167

168
Cap
itaLa
ndA
R 0
3FO
CUS
BA
LAN
CE S
CALE
NOTICE IS HEREBY GIVEN that the Annual General Meeting of the Company will be held at the STI, 168 Robinson Road, Level 9,Capital Tower, Singapore 068912, on Monday, 12 April 2004 at 10.00 a.m. to transact the following business:
As Ordinary Business
1 To receive and adopt the Directors’ Report and Audited Accounts for the year ended 31 December 2003 and the Auditors’Report thereon.
2 To declare a first and final dividend of S$0.04 per share less Singapore income tax at 20% for the year ended 31 December2003.
3 To approve the sum of S$971,340 as Directors’ fees for the year ended 31 December 2003 (2002: S$958,687).
4 To re-elect the following Directors, each of whom will retire by rotation pursuant to Article 95 of the Articles of Association ofthe Company and who, being eligible, will offer themselves for re-election:(i) Sir Alan Cockshaw(ii) Mr Jackson Peter Tai(iii) Mr Lucien Wong Yuen Kuai
Mr Lucien Wong Yuen Kuai is an independent member of the Audit Committee.
5 To elect Mr Andrew Buxton, a Director, who will retire pursuant to Article 101 of the Articles of Association of the Company.
6 To re-appoint the following Directors, each of whom will retire and seek re-appointment under Section 153(6) of theCompanies Act, Cap. 50, to hold office from the date of this Annual General Meeting until the next Annual General Meeting:(i) Mr Hsuan Owyang(ii) Mr Lim Chin Beng
7 To re-appoint Messrs KPMG as Auditors of the Company and to authorise the Directors to fix their remuneration.
8 To transact such other ordinary business as may be transacted at an Annual General Meeting of the Company.
As Special Business
9 To consider and, if thought fit, to pass the following resolution which will be proposed as an Ordinary Resolution:
That pursuant to Section 153(6) of the Companies Act, Cap. 50, Dr Richard Hu Tsu Tau be and is hereby appointed as a Directorof the Company with effect from 13 April 2004 to hold such office until the next Annual General Meeting of the Company.
10 To consider and, if thought fit, to pass with or without modifications, the following resolutions which will be proposed asOrdinary Resolutions:
10A That authority be and is hereby given to the Directors of the Company to:
(a) (i) issue shares in the capital of the Company (“shares”) whether by way of rights, bonus or otherwise; and/or
(ii) make or grant offers, agreements or options (collectively, “Instruments”) that might or would require shares to beissued, including but not limited to the creation and issue of (as well as adjustments to) warrants, debentures or otherinstruments convertible into shares,
at any time and upon such terms and conditions and for such purposes and to such persons as the Directors may in theirabsolute discretion deem fit; and
(b) (notwithstanding the authority conferred by this Resolution may have ceased to be in force) issue shares in pursuance ofany Instrument made or granted by the Directors while this Resolution was in force,
NOTICE OF ANNUAL GENERAL MEETING
CL AR03 152-172 A/W_OK 17/03/2004 06:49 PM Page 168
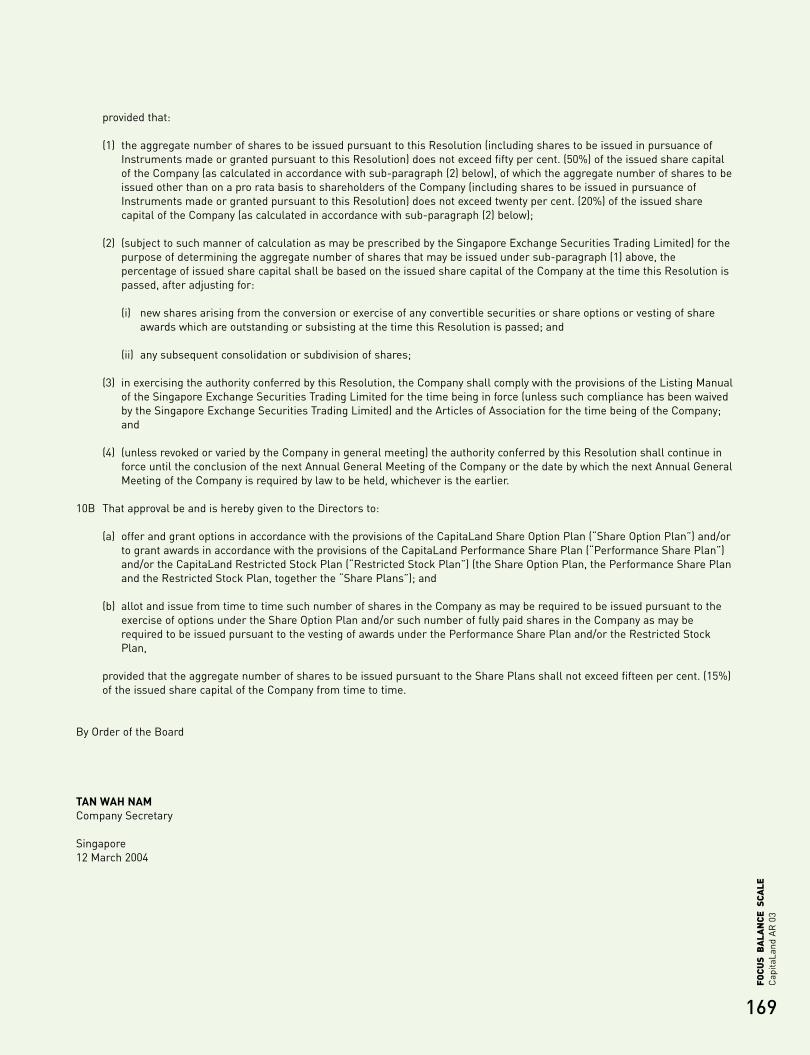
provided that:
(1) the aggregate number of shares to be issued pursuant to this Resolution (including shares to be issued in pursuance ofInstruments made or granted pursuant to this Resolution) does not exceed fifty per cent. (50%) of the issued share capitalof the Company (as calculated in accordance with sub-paragraph (2) below), of which the aggregate number of shares to beissued other than on a pro rata basis to shareholders of the Company (including shares to be issued in pursuance ofInstruments made or granted pursuant to this Resolution) does not exceed twenty per cent. (20%) of the issued sharecapital of the Company (as calculated in accordance with sub-paragraph (2) below);
(2) (subject to such manner of calculation as may be prescribed by the Singapore Exchange Securities Trading Limited) for thepurpose of determining the aggregate number of shares that may be issued under sub-paragraph (1) above, thepercentage of issued share capital shall be based on the issued share capital of the Company at the time this Resolution ispassed, after adjusting for:
(i) new shares arising from the conversion or exercise of any convertible securities or share options or vesting of shareawards which are outstanding or subsisting at the time this Resolution is passed; and
(ii) any subsequent consolidation or subdivision of shares;
(3) in exercising the authority conferred by this Resolution, the Company shall comply with the provisions of the Listing Manualof the Singapore Exchange Securities Trading Limited for the time being in force (unless such compliance has been waivedby the Singapore Exchange Securities Trading Limited) and the Articles of Association for the time being of the Company;and
(4) (unless revoked or varied by the Company in general meeting) the authority conferred by this Resolution shall continue inforce until the conclusion of the next Annual General Meeting of the Company or the date by which the next Annual GeneralMeeting of the Company is required by law to be held, whichever is the earlier.
10B That approval be and is hereby given to the Directors to:
(a) offer and grant options in accordance with the provisions of the CapitaLand Share Option Plan (“Share Option Plan”) and/orto grant awards in accordance with the provisions of the CapitaLand Performance Share Plan (“Performance Share Plan”)and/or the CapitaLand Restricted Stock Plan (“Restricted Stock Plan”) (the Share Option Plan, the Performance Share Planand the Restricted Stock Plan, together the “Share Plans”); and
(b) allot and issue from time to time such number of shares in the Company as may be required to be issued pursuant to theexercise of options under the Share Option Plan and/or such number of fully paid shares in the Company as may berequired to be issued pursuant to the vesting of awards under the Performance Share Plan and/or the Restricted StockPlan,
provided that the aggregate number of shares to be issued pursuant to the Share Plans shall not exceed fifteen per cent. (15%)of the issued share capital of the Company from time to time.
By Order of the Board
TAN WAH NAMCompany Secretary
Singapore 12 March 2004
169
Cap
itaLa
ndA
R 0
3FO
CUS
BA
LAN
CE S
CALE
CL AR03 152-172 A/W_OK 17/03/2004 06:49 PM Page 169
170
Cap
itaLa
ndA
R 0
3FO
CUS
BA
LAN
CE S
CALE
Notes:
A member entitled to attend and vote at the meeting may appoint not more than two proxies to attend and vote in his stead. Where amember appoints more than one proxy, he shall specify the proportion of his shareholdings to be represented by each proxy. A proxyneed not be a member of the Company. The instrument appointing a proxy must be deposited at the Registered Office of theCompany at 168 Robinson Road #30-01, Capital Tower, Singapore 068912 not less than 48 hours before the time appointed forholding the meeting.
Additional information relating to the Notice of Annual General Meeting:
Resolution 9 is to appoint Dr Richard Hu Tsu Tau as a Director of the Company with effect from 13 April 2004. Dr Hu is currentlyChairman, GIC Real Estate Pte Ltd, and Chairman, Mapletree Investments Pte Ltd. From 1985 to 2001, he was a Cabinet Ministerholding posts in the Trade and Industry, Health and Finance ministries. Prior to his ministerial appointment, Dr Hu held the posts ofManaging Director concurrently in the Monetary Authority of Singapore and the Government of Singapore Investment CorporationPrivate Limited from 1983 to 1984. Dr Hu joined the Shell Group of companies in 1960 and his last position in this global companywas as Chairman and Chief Executive of the Shell Group of companies in Singapore. The Board of Directors of the Company ispleased to recommend the appointment of Dr Hu, who brings with him a wealth of experience both in the Singapore Governmentand in a major global company and who, if appointed, will augment the independent non-executive component of the Board’smembership. Dr Hu has also expressed his willingness to act as a Director of the Company. As Dr Hu is over 70 years of age, hisproposed appointment is subject to shareholders’ approval pursuant to Section 153(6) of the Companies Act, Cap. 50. Consequentupon his appointment as a Director of the Company, Dr Hu will also be elected as non-executive Chairman of the Board of Directorsof the Company, while Mr Philip Yeo Liat Kok will relinquish his appointment as Director and Chairman of the Board, with effectfrom 13 April 2004.
Resolution 10A is to empower the Directors to issue shares in the Company and to make or grant instruments (such as warrants ordebentures) convertible into shares, and to issue shares in pursuance of such instruments, up to an amount not exceeding in totalfifty per cent. (50%) of the issued share capital of the Company with a sub-limit of twenty per cent. (20%) for issues other than on apro rata basis to shareholders. For the purpose of determining the aggregate number of shares that may be issued, the percentageof issued share capital will be calculated based on the issued share capital of the Company at the time that Resolution 10A ispassed, after adjusting for new shares arising from the conversion or exercise of any convertible securities or share options orvesting of share awards which are outstanding or subsisting at the time that Resolution 10A is passed, and any subsequentconsolidation or subdivision of shares.
Resolution 10B is to empower the Directors to offer and grant options and/or grant awards under the CapitaLand Share Option Plan,the CapitaLand Performance Share Plan and the CapitaLand Restricted Stock Plan, and to allot and issue shares pursuant to theexercise of such options and/or vesting of such awards, provided that the aggregate number of shares to be issued does not exceedfifteen per cent. (15%) of the issued share capital of the Company from time to time.
CL AR03 152-172 A/W_OK 17/03/2004 06:49 PM Page 170
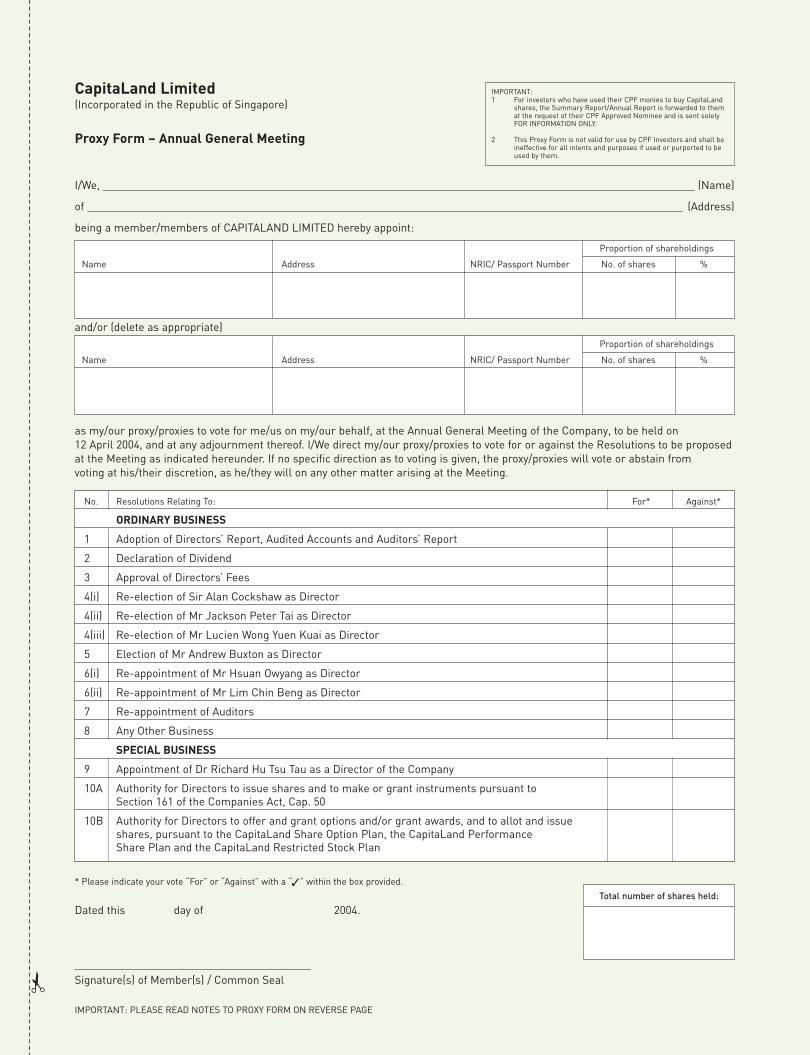
✃
as my/our proxy/proxies to vote for me/us on my/our behalf, at the Annual General Meeting of the Company, to be held on 12 April 2004, and at any adjournment thereof. I/We direct my/our proxy/proxies to vote for or against the Resolutions to be proposed at the Meeting as indicated hereunder. If no specific direction as to voting is given, the proxy/proxies will vote or abstain from voting at his/their discretion, as he/they will on any other matter arising at the Meeting.
* Please indicate your vote “For” or “Against” with a “ ” within the box provided.
Dated this day of 2004.
Signature(s) of Member(s) / Common Seal
IMPORTANT: PLEASE READ NOTES TO PROXY FORM ON REVERSE PAGE
IMPORTANT: 1 For investors who have used their CPF monies to buy CapitaLand
shares, the Summary Report/Annual Report is forwarded to themat the request of their CPF Approved Nominee and is sent solelyFOR INFORMATION ONLY.
2 This Proxy Form is not valid for use by CPF Investors and shall beineffective for all intents and purposes if used or purported to beused by them.
CapitaLand Limited(Incorporated in the Republic of Singapore)
Proxy Form – Annual General Meeting
Proportion of shareholdings
Name Address NRIC/ Passport Number No. of shares %
I/We, (Name)
of (Address)
being a member/members of CAPITALAND LIMITED hereby appoint:
and/or (delete as appropriate)
Total number of shares held:
Proportion of shareholdings
Name Address NRIC/ Passport Number No. of shares %
No. Resolutions Relating To: For* Against*
ORDINARY BUSINESS
1 Adoption of Directors’ Report, Audited Accounts and Auditors’ Report
2 Declaration of Dividend
3 Approval of Directors’ Fees
4(i) Re-election of Sir Alan Cockshaw as Director
4(ii) Re-election of Mr Jackson Peter Tai as Director
4(iii) Re-election of Mr Lucien Wong Yuen Kuai as Director
5 Election of Mr Andrew Buxton as Director
6(i) Re-appointment of Mr Hsuan Owyang as Director
6(ii) Re-appointment of Mr Lim Chin Beng as Director
7 Re-appointment of Auditors
8 Any Other Business
SPECIAL BUSINESS
9 Appointment of Dr Richard Hu Tsu Tau as a Director of the Company
10A Authority for Directors to issue shares and to make or grant instruments pursuant to Section 161 of the Companies Act, Cap. 50
10B Authority for Directors to offer and grant options and/or grant awards, and to allot and issue shares, pursuant to the CapitaLand Share Option Plan, the CapitaLand Performance Share Plan and the CapitaLand Restricted Stock Plan
✓
CL AR03 152-172 A/W_OK 17/03/2004 06:49 PM Page 171
Affix postagestamp
2nd fold here
1st fold here
3rd fold here & fold flap
The Company Secretary
CapitaLand Limited168 Robinson Road
#30-01 Capital TowerSingapore 068912
✁
Notes to Proxy Form:
1 A member entitled to attend and vote at the Meeting is entitled toappoint one or two proxies to attend and vote in his stead.
2 Where a member appoints more than one proxy, the appointments shallbe invalid unless he specifies the proportion of his holding (expressed asa percentage of the whole) to be represented by each proxy.
3 A proxy need not be a member of the Company.
4 A member should insert the total number of shares held. If the member has shares entered against his name in the Depository Register(as defined in Section 130A of the Companies Act, Cap. 50 of Singapore),he should insert that number of shares. If the member has sharesregistered in his name in the Register of Members of the Company, heshould insert that number of shares. If the member has shares enteredagainst his name in the Depository Register and registered in his namein the Register of Members, he should insert the aggregate number ofshares. If no number is inserted, the form of proxy will be deemed torelate to all the shares held by the member.
5 The instrument appointing a proxy or proxies must be deposited at the Company’s registered office at 168 Robinson Road #30-01, CapitalTower, Singapore 068912 not less than 48 hours before the time set forthe Meeting.
6 The instrument appointing a proxy or proxies must be under the hand of the appointor or of his attorney duly authorised in writing. Where theinstrument appointing a proxy or proxies is executed by a corporation, itmust be executed either under its common seal or under the hand of itsattorney or a duly authorised officer.
7 Where an instrument appointing a proxy is signed on behalf of theappointor by an attorney, the letter or power of attorney or a dulycertified copy thereof must (failing previous registration with theCompany) be lodged with the instrument of proxy, failing which theinstrument may be treated as invalid.
8 A corporation which is a member may authorise by resolution of itsdirectors or other governing body such person as it thinks fit to act as its representative at the Meeting, in accordance with Section 179 of theCompanies Act, Cap. 50 of Singapore.
GeneralThe Company shall be entitled to reject the instrument appointing aproxy or proxies which is incomplete, improperly completed, illegible or where the true intentions of the appointor are not ascertainable from the instructions of the appointor specified in the instrument appointing a proxy or proxies. In addition, in the case of shares entered in theDepository Register, the Company may reject any instrument appointinga proxy or proxies lodged if the member, being the appointor, is notshown to have shares entered against his name in the DepositoryRegister as at 48 hours before the time appointed for holding theMeeting, as certified by The Central Depository (Pte) Limited to the Company.
CL AR03 152-172 A/W_OK 17/03/2004 06:49 PM Page 172
PROFILE
CapitaLand is one of the largest listed property companies in Asia.Headquartered in Singapore, the multinational company’s core businessesin property, hospitality, property services and real estate financial servicesare focused in gateway cities in Asia, Australia and Europe. In thesecountries, CapitaLand is in partnership with reputable local players andhas established a management team that understands the market,business practices and socio-economic factors.
The company’s hospitality businesses, in hotels and serviced residences,span more than 60 cities around the world. CapitaLand also leverages onits significant real estate asset base and market knowledge to develop fee-based products and services in Singapore and the region.
The listed subsidiaries and associates of CapitaLand Limited includeRaffles Holdings, The Ascott Group, Australand Property Group (which is listed both in Singapore and Australia) and CapitaMall Trust.
1 Raffles Hotel Le Royal, Phnom Penh
2 Swissôtel Chicago3 Swissôtel The Stamford and
Raffles The Plaza, Singapore4 Swissôtel Métropole, Geneva5 Citadines Paris Louvre, Paris6 Somerset Salcedo, Manila
7 The Ascott Kuala Lumpur8 The Ascott Beijing9 The Loft, Singapore10 Balmain Shores, Sydney11 Regency Park, Sydney12 SunGlade, Singapore13 Canary Riverside, London14 Shinjuku Tower, Japan
15 Plaza Singapura, Singapore16 Tampines Mall, Singapore17 Technopark @ Chai Chee,
Singapore18 Caltex House, Singapore19 Springleaf Tower, Singapore20 Capital Tower, Singapore
CapitaLand Group’s properties on the front cover are:1
2
3
4
5
6
7
8
9
10
11
12
13
14
15
16
17
18
19
20 This Annual Report may contain forward-looking statements that involve risks and uncertainties. Actual future performance, outcomes and results may differ materially from those expressedin forward-looking statements as a result of a number of risks, uncertainties and assumptions. Representative examples of these factors include (without limitation) general industry andeconomic conditions, interest rate trends, cost of capital and capital availability, availability of real estate properties, competition from other companies and venues for the sale/distribution ofgoods and services, shifts in customer demands, customers and partners, changes in operating expenses, including employee wages, benefits and training, governmental and public policychanges and the continued availability of financing in the amounts and the terms necessary to support future business. You are cautioned not to place undue reliance on these forward-looking statements, which are based on current view of management on future events.
CapitaLand Limited168 Robinson Road#30-01 Capital TowerSingapore 068912Tel: (65) 6823 3200Fax: (65) 6820 [email protected]
CapitaLand Commercial Limited39 Robinson Road#18-01 Robinson PointSingapore 068911Tel: (65) 6536 1188Fax: (65) 6536 [email protected]
CapitaLand Financial Limited39 Robinson Road#18-01 Robinson PointSingapore 068911Tel: (65) 6536 1188Fax: (65) 6536 [email protected]
CapitaLand Residential Limited8 Shenton Way#21-01 Temasek TowerSingapore 068811Tel: (65) 6820 2188Marketing hotline: (65) 6826 6800Fax: (65) 6820 [email protected]
The Ascott Group Limited8 Shenton Way #13-01 Temasek TowerSingapore 068811Tel: (65) 6220 8222Fax: (65) 6227 2220www.the-ascott.comir&[email protected]
Raffles Holdings Limited2 Stamford Road#06-01 Raffles City Convention CentreSingapore 178882Tel: (65) 6339 8377Fax: (65) 6339 [email protected]
PREMAS International LimitedBlk 750 Oasis Chai Chee RoadTechnopark @ Chai Chee #01-01Singapore 469000Tel: (65) 6876 0088Fax: (65) 6538 [email protected]
AuditorsKPMG16 Raffles Quay#22-00 Hong Leong BuildingSingapore 048581Tel: (65) 6213 3388Fax: (65) 6225 6157(Engagement Partner since financial year ended 31 December 2001: Martha Tan Hui Keng)
RegistrarLim Associates (Pte) Ltd10 Collyer Quay#19-08 Ocean BuildingSingapore 049315Tel: (65) 6536 5355Fax: (65) 6536 1360
MAIN CONTACTSC
once
pt a
nd D
esig
n by
Equ
us
ww
w.e
quus
-des
ign.
com
� �
� �
����� ���� ���� � � ���� � ��� �� � �� ��� ����������� �� ��������� � ��� ������� �������������� �� ����� ��� �� ���!��" �� ������
#$���%���&���'���(���$�)�*��#'�#+�'���$)'����(���
&$�'������)������$�������
� � � � � � � �� � ������ �����SL174649 DL-MAC5 09.03.04 175#
HTS1P361C
CL AR03 cover A/W-OK 17/03/2004 05:55 PM Page 2

CapitaLand Limited168 Robinson Road #30-01 Capital TowerSingapore 068912
Tel: (65) 6823 3200
Fax: (65) 6820 2202
Web Site: www.capitaland.com
FOCUSBALANCESCALEAnnual Report 2003
FOC
US B
ALA
NC
E SCA
LE C
apitaLand Limited A
nnual Report 2003
CL AR03 cover A/W-OK 17/03/2004 05:54 PM Page 1
Related Documents