4642 Langmuir 1995,11, 4642-4652 Articles Foams and Concentrated Emulsions: Dynamics and “Phase” Behavior Ashok Bhakta and Eli Ruckenstein” Department of Chemical Engineering, State University of New York at Buffalo, Buffalo,New York 14260 Received March 1, 1995. In Final Form: August 4, 1995@ Drainage of the continuous phase plays an important role in the collapse of foams and concentrated liquid-liquid emulsions. A general model for the drainage in initially homogeneous (uniform volume fraction of each phase) foams and concentrated emulsionsis presented. Separation of the dispersed phase is accounted for by considering the collapse of films in the upper part of the system. Expressions for the movement ofthe two boundaries (emulsiodcontinuous phase and emulsioddispersedphase) are formulated as a function of the velocity of the continuous phase fluid. The model successfully predicts the trend of drainage lag times observed in initially homogeneous foams. Phase behavior based on a drainage equilibrium, which implies a balance between the opposing effects of gravity and the plateau border suction gradient, is investigated. There are three possibilities: separation of a single phase (continuous or dispersed), separation of both phases, and no phase separation. It is shown that the phase behavior depends on a single dimensionless group which is a measure of the relative magnitudes of the gravitational and capillaryforces. A generalized “phase” diagram is presented which can be used to determine the phase behavior. It is shown that separation of both phases occurs only if the column length exceeds a critical value. Introduction Concentrated emulsions are characterized by a high volume fraction (>0.74) of the dispersed phase. Their structure is very similar to that of foams in that the dispersed phase exists as polyhedral cells separated by thin films of continuous phase. Systems with dispersed phase volume fractions as high as 0.99 have been prepared and used in the synthesis of high molecular weight polymers and composites1 as well as membranes2 for separation processes. An important prerequisite for the usefulness of a concentrated emulsion in any process is that it be stable, i.e., under the conditions of operation, one or both phases must not separate out. A few experimental studies of the stability of oil-in-water (Om) and water-in-oil (WIO) emulsions have been carried o ~t.l,~-~ It has been reported3 that depending on the surfactant concentration, there exists an upper limit to the amount of dispersed phase that can be present in a stable concentrated emulsion. Attempts have been made to correlate the stability (volume of the bulk phases separating in a given time) with temperature and interfacial ten~ion.l,~ An important effect contributing to the collapse of a concentrated emulsion is the drainage of the continuous phase. Films drain into the surroundingplateau borders (PB) due to capillary suction, and the interstitial liquid drains out due to gravity-induced flow (syneresis) through an interconnected network of PB channels. This phe- * To whom correspondence should be addressed. @ Abstract published in Advance ACS Abstracts, November 1, (1) Ruckenstein, E.; Park, J. S. Polymer 1992, 33, 405. (2) Park, J. S.; Ruckenstein, E. J. Appl. Polym. Sci. 1989,38, 453. (3) Ruckenstein, E.; Ebert, E.; Platz, G. J. Colloidlnterface Sci. 1989, (4) Chen, H. H.; Ruckenstein, E. J. Colloid Interface Sci. 1990,138, (5) Solans, G.; Pons, R.; Zhu, S.; Davis, H. T.; Evans, D. F.; Nakamura, 1995. 133, 432. 473;1991,145,260. K.; Kuneida, H. Langmuir 1993, 9, 1479. O~43-7~63/95/2411-4642$09.00/0 nomenon has been studied extensively in foams.6-18 In standing foams, it is observed that drainage practically ceases after a sufficiently long time. Narsimhanll has proposed that this is a result of a “drainage equilibrium” which is established when the opposing forces due to gravity and the plateau border suction gradient balance each other. Experimental measurements6 of the volume fraction profiles in equilibrated foams seem to indicate that this indeed is the case. Once the drainage has ceased, other processes (primarily Ostwald ripening) become dominant, leading eventually to the collapse of the foam. In liquid-liquid emulsions, however, Ostwald ripening is significantly slower, so that such systems are likely to persist in a state of drainage equilibrium for a very long time. It is therefore important to understand clearly the conditions associated with this equilibrium. There are two main aspects which are of interest: (a) The time required for the equilibrium to be established and (b)The amount of each of the two phases that will separate out before the equilibrium is attained. To clearly understand this phenomenon, we need a model for the drainage of the continuous phase. (6) Kann, K. B. Colloid J. USSR (Engl. Transl.) 1979,714. (7) Koczo, K.; Racz, G. Colloids Surf. 1991, 56, 59. (8) Lalchev, Z.; Khristov, K.; Exerowa, D. Colloid Polym. Sci. 1979, 257. 1248. I -. . (9) Khristov, IC; Krugljakov, P.; Exerowa, D. ColloidPolym. Sci. 1979, (10) Germick, R. J.; Rehill, A. S.; Narsimhan, G. J. Food Eng. 1994, (11) Narsimhan, G. J. Food Eng. 1991, 14, 139. (12) Bhakta, A.; Khilar, K. C. Langmuir 1991, 7, 1827. (13) Ramani, M. V.; Kumar, R.; Gandhi, K. S. Chem. Eng. Sci. 1993, (14) Haas, P. A,; Johnson, H. F. Ind. Eng. Chem. Fundam. 1967,6, (15) Jacobi, W. H.; Woodcock, K. E.; Grove, C. S. Ind. Eng. Chem. (16) Miles, G. D.; Sheklovsky, L.; Ross, J. J. Phys. Chem. 1945,49, (17) Bhakta, A. R.; Ruckenstein, E. Langmuir 1995, 11, 1486. (18) Krotov, V. V. Colloid J. USSR 1981, 43,33. (Engl. Transl.) 257, 506. 23, 555. 48,455. 225. 1956,48,9046. 93. 0 1995 American Chemical Society

Welcome message from author
This document is posted to help you gain knowledge. Please leave a comment to let me know what you think about it! Share it to your friends and learn new things together.
Transcript

4642 Langmuir 1995,11, 4642-4652
Articles
Foams and Concentrated Emulsions: Dynamics and “Phase” Behavior
Ashok Bhakta and Eli Ruckenstein”
Department of Chemical Engineering, State University of New York at Buffalo, Buffalo, New York 14260
Received March 1, 1995. In Final Form: August 4, 1995@
Drainage of the continuous phase plays an important role in the collapse of foams and concentrated liquid-liquid emulsions. A general model for the drainage in initially homogeneous (uniform volume fraction of each phase) foams and concentrated emulsions is presented. Separation of the dispersed phase is accounted for by considering the collapse of films in the upper part of the system. Expressions for the movement ofthe two boundaries (emulsiodcontinuous phase and emulsioddispersed phase) are formulated as a function of the velocity of the continuous phase fluid. The model successfully predicts the trend of drainage lag times observed in initially homogeneous foams. Phase behavior based on a drainage equilibrium, which implies a balance between the opposing effects of gravity and the plateau border suction gradient, is investigated. There are three possibilities: separation of a single phase (continuous or dispersed), separation of both phases, and no phase separation. It is shown that the phase behavior depends on a single dimensionless group which is a measure of the relative magnitudes of the gravitational and capillary forces. A generalized “phase” diagram is presented which can be used to determine the phase behavior. It is shown that separation of both phases occurs only if the column length exceeds a critical value.
Introduction Concentrated emulsions are characterized by a high
volume fraction (>0.74) of the dispersed phase. Their structure is very similar to that of foams in that the dispersed phase exists as polyhedral cells separated by thin films of continuous phase. Systems with dispersed phase volume fractions as high as 0.99 have been prepared and used in the synthesis of high molecular weight polymers and composites1 as well as membranes2 for separation processes.
An important prerequisite for the usefulness of a concentrated emulsion in any process is that it be stable, i.e., under the conditions of operation, one or both phases must not separate out. A few experimental studies of the stability of oil-in-water ( O m ) and water-in-oil (WIO) emulsions have been carried o ~ t . l , ~ - ~ It has been reported3 that depending on the surfactant concentration, there exists an upper limit to the amount of dispersed phase that can be present in a stable concentrated emulsion. Attempts have been made to correlate the stability (volume of the bulk phases separating in a given time) with temperature and interfacial t en~ ion . l ,~
An important effect contributing to the collapse of a concentrated emulsion is the drainage of the continuous phase. Films drain into the surrounding plateau borders (PB) due to capillary suction, and the interstitial liquid drains out due to gravity-induced flow (syneresis) through an interconnected network of PB channels. This phe-
* To whom correspondence should be addressed. @ Abstract published in Advance A C S Abstracts, November 1,
(1) Ruckenstein, E.; Park, J . S. Polymer 1992, 33, 405. (2) Park, J. S.; Ruckenstein, E. J . Appl. Polym. Sci. 1989,38, 453. (3) Ruckenstein, E.; Ebert, E.; Platz, G. J . Colloidlnterface Sci. 1989,
(4) Chen, H. H.; Ruckenstein, E. J . Colloid Interface Sci. 1990,138,
(5) Solans, G.; Pons, R.; Zhu, S.; Davis, H. T.; Evans, D. F.; Nakamura,
1995.
133, 432.
473; 1991, 145,260.
K.; Kuneida, H. Langmuir 1993, 9, 1479.
O~43-7~63/95/2411-4642$09.00/0
nomenon has been studied extensively in foams.6-18 In standing foams, it is observed that drainage practically ceases after a sufficiently long time. Narsimhanll has proposed that this is a result of a “drainage equilibrium” which is established when the opposing forces due to gravity and the plateau border suction gradient balance each other. Experimental measurements6 of the volume fraction profiles in equilibrated foams seem to indicate that this indeed is the case. Once the drainage has ceased, other processes (primarily Ostwald ripening) become dominant, leading eventually to the collapse of the foam. In liquid-liquid emulsions, however, Ostwald ripening is significantly slower, so that such systems are likely to persist in a state of drainage equilibrium for a very long time. It is therefore important to understand clearly the conditions associated with this equilibrium. There are two main aspects which are of interest: (a) The time required for the equilibrium to be established and (b)The amount of each of the two phases that will separate out before the equilibrium is attained. To clearly understand this phenomenon, we need a model for the drainage of the continuous phase.
(6) Kann, K. B. Colloid J . USSR (Engl. Transl.) 1979, 714. (7) Koczo, K.; Racz, G. Colloids Surf. 1991, 56, 59. (8) Lalchev, Z.; Khristov, K.; Exerowa, D. Colloid Polym. Sci. 1979,
257. 1248. I -. .
(9) Khristov, IC; Krugljakov, P.; Exerowa, D. ColloidPolym. Sci. 1979,
(10) Germick, R. J . ; Rehill, A. S.; Narsimhan, G. J. Food Eng. 1994,
(11) Narsimhan, G. J . Food Eng. 1991, 14, 139. (12) Bhakta, A.; Khilar, K. C. Langmuir 1991, 7, 1827. (13) Ramani, M. V.; Kumar, R.; Gandhi, K. S. Chem. Eng. Sci. 1993,
(14) Haas, P. A,; Johnson, H. F. Ind. Eng. Chem. Fundam. 1967,6,
(15) Jacobi, W. H.; Woodcock, K. E.; Grove, C. S. Ind. Eng. Chem.
(16) Miles, G. D.; Sheklovsky, L.; Ross, J. J . Phys. Chem. 1945,49,
(17) Bhakta, A. R.; Ruckenstein, E. Langmuir 1995, 11, 1486. (18) Krotov, V. V. Colloid J . USSR 1981, 43, 33. (Engl. Transl.)
257, 506.
23, 555.
48, 455.
225.
1956,48,9046.
93.
0 1995 American Chemical Society

Foams and Concentrated Emulsions Langmuir, Vol. 11, No. 12, 1995 4643
Several models of foam drainage have been pro- posed.11-18 However, only two recent modelsl1J7 have accounted for the important effect of the plateau border suction which is responsible for establishment of the equilibrium. However, these models are applicable only to foams generated by bubbling. In such foams, the volume fractions of the two phases are not initially uniform (the foam is drier a t the top) and depend strongly on the conditions of foam generation. It should be mentioned that in the latter model,17 the unsteady nature of foam generation is taken into account. Concentrated liquid- liquid emulsions, however, are always prepared by vigor- ous mixing of the two phases and are expected to be more homogenous. In this paper, we consider the drainage in initially homogenous foams and concentrated liquid- liquid emulsions. In contrast to the available treatments, we account for the separation of the disperse phase.
More importantly, we study in detail the phenomenon of drainage equilibrium. P r i n ~ e n l ~ - ~ ~ has done a detailed theoretical study of equilibrated concentrated emulsions based on osmotic pressure considerations. He has sug- gested a pseudo-phase diagram on the basis of which he identifies conditionsz2 under which there is no separation of the continuous phase. In this paper, we analyze the drainage equilibrium as the limiting case of our unsteady state drainage model. We show that it is possible to determine on the basis of the initial conditions which of the two phases (if not both) separates out. We also show that there are conditions under which there is no phase separation, only a rearrangement of the continuous phase.
In the following discussion, we consider the case in which the dispersed phase is lighter, Le., the continuous phase flows downward. Extension of our treatment to the case when the continuous phase is lighter is trivial.
Model for Continuous Phase Drainage The main assumptions in our model are (1) The
concentrated emulsion is monodisperse. (2) The dispersed phase cells are identical pentagonal dodecahedra. It may be noted that a t higher volume fractions of the continuous phase, hence near the bottom of the foam when the continuous phase flows out, the dispersed phase droplets are not polyhedral. We assume, however, for the sake of simplicity that the droplets are polyhedral a t all volume fractions. (3) Collapse of the films occurs only at the top of the emulsion. (4) Most of the continuous phase liquid exists in the plateau border channels, and the effect of films on the drainage is negligible.
Since the drainage takes place mainly through the PB channels, we require the rate a t which the continuous phase flows through a single PB channel. A PB channel is formed at the junction of three contiguous films and has a cross section similar to that formed at the intersec- tion of three cylinders in contact. Since most of the continuous phase exists in the PBs, the cross-sectional area of a PB channel can be expressed in terms of the radius of curvature (rp) of its walls
ap = dr, 2
where 6 = 0.161. An expression for the average velocity ( u ) of liquid in a vertical PB channel has been derived for a triangular PB cross section and is given byz4
(19) Princen, H. M. J . Colloid Interface Sci. 1979, 71, 55. (20) Princen, H. M. Langmuir 1986,2, 519. (21) Princen, H. M.; Kiss, A. D. Langmuir 1987, 3, 36. (22) Princen, H. M. J . Colloid Interface Sci. 1990, 134, 188. (23) Leonard, R. A.; Lemlich, R. AIChE J. 1966, 11, 18. (24) Desai, D.; Kumar, R. Chem. Eng. Sci. 1982, 37, 1361.
In eq 2, z and g refer to the space coordinate and the gravitational acceleration and pc, p, andp to the density, viscosity, and pressure in the continuous phase. The factor cv is the velocity coefficient which accounts for the effect of finite surface viscosity &I. Desai and KumarZ4 have computed cv as a function of the inverse of the dimension- less surface viscosity (ys = (O.4387,u&)/ps). It may be noted that their treatment is valid only for foams since the viscosity of the dispersed phase was neglected. However, if the surfactant concentration is high enough, we can take ps - - and cv = 1. Equation 2 can then be used for liquid-liquid concentrated emulsions as well.
The hydrostatic pressure inside a droplet (pJ can be expressed as
(3)
wherep,,fis the pressure (assumed constant) in a droplet a t the top (z = 0) and p~ is the density of the disperse phase. Also, if (T is the interfacial tension between the two phases, we have
Pi = Pref + P D ~ Z
CJ p . - p = - r P
(4)
Combining eqs 2-4 yields
Let us denote p as
pc - p ~ . Equation 5 can then be written
The terms in the parentheses represent the driving forces due to gravity (pg) and the gradient of PB suction [a(a/ a.dl/r,))I. Note that these forces oppose each other when the latter is negative, i.e., when the emulsion is more concentrated a t the top.
Before we proceed with further details, some quantities need to be defined. Let z = the distance from the top of the emulsion (see Figure 1); np = the number of PB channels per droplet; 1 = the length of a PB channel; V = the volume of a bubble; R = the radius of a sphere of volume V; N = the number of droplets per unit volume; LO = the initial length of the emulsion column. For pentagonal dodecahedra, we have the following rela- t i o n ~ ~ ~ , ~ ~
1 = 0.816R, np = 10 (7)
The volumetric flow rate per unit area (QB) due to gravity drainage through the plateau borders is given by11825-27
Now, the volume of continuous phase liquid per unit cross section between z and z + dz is Nng,ldz. An
(25) Narsimhan, G.; Ruckenstein, E. Langmuir 1986,2, 230. (26) Narsimhan, G.; Ruckenstein, E. Langmuir 1986,2, 494. (27) Narsimhan, G.; Ruckenstein, E. In Foams: Theory, Measure-
ments, and Applications; Prud'homme, R. K., Khan, S. A,, Eds.; Marcel Dekker: New York, 1995; pp 99-185.

4644 Langmuir, Vol.
z=o
z-Lo (la) 1-0
11, No. 12, 1995
dispersed phase z=o - / -
z-z, I ‘
z=z,
(1b) I continuous phase
Figure 1. A schematic diagram of a draining concentrated emulsion.
unsteady state mass balance written over this element gives:
Note that in eqs 8 and 9, a p is the “average” cross-sectional area of a plateau border at a givenz. The use of an average is a necessary feature of macroscopic models in which balances are written over an element containing a large number of bubbles. All the variables can be expressed in terms of the continuous phase liquid fraction ( E )
1 - E E = Nnpapl, N = -
4n
Using eqs 7 and 10, eq 9 can be written as
Equation 11 is a second-order parabolic partial differential equation in E . To solve it we need the initial profile of E and two boundary conditions.
Boundary Conditions Given a concentrated emulsion with a certain initial
uniform continuous phase volume fraction ( E O ) , the fol- lowing scenarios are possible: (a) Only the continuous phase separates out a t the bottom. (b) Only the disperse phase separates out a t the top. (c) Both phases separate out. (d) There is no phase separation.
As we shall demonstrate later on, it is possible to determine at the outset which of the above situations arise. Let us first discuss the mechanism involved in the separation of the two phases and the boundary conditions to be used in each case.
Separation of the Continuous Phase. The continu- ous phase leaves the emulsion due to gravity-driven flow through the PB channels. It has been experimentally 0bserved~9~ that in homogeneous foams formed by mixing there exists a finite time interval after which the continu- ous phase first appears a t the bottom of the foam. It has also been noted6 that phase separation occurs only when E a t the bottom exceeds a certain minimum (Et,). (The exact value though has not been specified.) We postulate here that for a “monodisperse” concentrated emulsion this value corresponds to that for close-packed spheres, Le., Eb = 0.26. The reasoning behind this can be understood as follows: Consider an emulsion with a uniform initial continuous phase fraction of €0 Eb (say EO = 0.15). Thus, initially the bubbles a t the bottom will be polyhedral (see Figure 2a). As time passes, the PB channels a t the top
Bhakta and Ruckenstein
(2a) E = € , (2b) E > E ~ (2c) Phase Separation
Figure 2. Mechanism of continuous phase separation.
drain into those below, so that E decreases a t the top and increases at the bottom. Suppose, a t a given point in time, E at the bottom just exceeds 0.26. At this instant (see Figure 2b) the bubbles at the bottom will cease to be in contact and become spherical (implicit in this argument is the assumption that the droplet radius is much smaller than the capillary length (R << G)). However, due to buoyancy, these bubbles will rise and arrange themselves in a compact fashion ( E = 0.26) (see Figure 2c) causing the excess continuous phase to accumulate at the bottom as a separate phase. As drainage proceeds, this process continues and the interface rises, always maintaining E = 0.26 a t the bottom until a drainage equilibrium is established. Let z = 2 2 correspond to the bottom of the emulsion. Since there is no flow at the bottom as long as E I ~ = ~ ~ Eb and since ~l,,~ does not change once it attains the value Eb, the appropriate boundary condition a t the bottom for this case would be
where t b is the time when E at the bottom just becomes Eb. It may be noted that the use of this boundary condition implies that the dispersed phase droplets are not poly- hedral in the lower section of the column. Thus, we assume that eqs 1-11 which are strictly valid only for pentagonal dodecahedra are applicable a t all volume fractions.
Separation of the Dispersed Phase. While the continuous phase leaves the emulsion mainly due to drainage, any separation of the dispersed phase must necessarily involve breakage of the films separating adjacent droplets. The drainage from films is affected by the suction pressure in the adjacent PBs (ah,) and the disjoining pressure (n). The driving force for film drainage (A&) is given by
where n is positive if the two surfaces of the film repel each other and negative otherwise. Thus the film is in equilibrium when APF = 0, i.e., when ahp = n. We assume that equilibrium between the films and PBs is established much faster than between the PBs in different parts of the foam.18 In other words, we assume that a t any instant a film is always in equilibrium with the adjoining PBs (i.e., ah, = n).
Calculation of the Disjoining Pressure. In the absence of any short range repulsive forces, the disjoining pressure in the film is a result of two forces, viz., the van der Waals attractive forces and the repulsive double layer forces. The van der Waals force per unit area is given by
(14)
where A is the Hamaker constant and XF is the film thickness. The repulsive pressure (~DL) between inter-

Foams and Concentrated Emulsions
-750
Langmuir, Vol. 12, No. 12, 1995 4645
- 1
h
"E \ a
- 8 . 5 10
Figure 3. Disjoining pressure ( E ) versus film thickness (xF).
acting double layers a t moderate potentials is given byz3
KDL = 16nkT[y2A,2 + 2y4A,[A, +A:] + y6[2A,A3 + !3A:A, + 3A,6 + Az211 (15)
where
y = tanh - (2) 1
cosh( G) A, =
-K- XF tanh(G) 2
cosh3( 2) A, =
A, = A, -AI3 + 3A2 [ 1 - 4 K y X XF
A1(G)2
4 cosh2( 2) 4 coshz( G) tanh(G)] - (16d)
2 cosh'( G) and q8, n, K , k , and 2 refer to the surface potential, ionic strength (ions/vol), inverse Debye length, Boltzmann constant, and valency, respectively. The net disjoining pressure is then given by
(17) K = JGW + KDL
Figure 3 shows a plot of K versus X F . Clearly, there exists a value of X F at which n is maximum (rima). Thus if ah,, exceeds nmaX, thinning of the film will not be accompanied by an increase in n and the film will drain until it collapses. It is therefore reasonable to say19129 that there exists a critical PB radius (rpc) given by
(28) Oshima, H. and Kondo, T. J . Colloid Interface Sci. 1988, 122,
(29) Narsimhan, G. Colloids Surf. 1992, 62, 41. 591.
2 . 10 2 . 5 10 3 . 10
below which the surrounding films collapse. Thus, there exists a critical E (ec) below which collapse occurs. Since in a standing foam or concentrated emulsion E is always smaller a t the top, collapse by this mechanism will first take place in the upper part of the emulsion and a layer of disperse phase will accumulate a t the top. Such a separation of the dispersed phase at one end has been experimentally observed and monitored with time in studies of the ultracentrifugal stability of emulsions.30
Let z1 be the position of the upper boundary and let t, be the time at which E a t the top just equals E ~ . Thus, as in the case of continuous phase separation, we have
It may be noted that the above considerations are not valid when short range repulsive forces such as Born repulsion, hydration forces, etc. are present. It has been observed by Exerowa et al.31 in experiments with indi- vidual films that such collapse takes place when the surfactant concentration is not high. However, a t suf- ficiently high surfactant concentrations a transition to stable black films is observed and collapse does not occur.
Movement of the Boundaries
When one or both phases separate, the volume of the emulsion decreases and the boundaries (interfaces with the separated phases) move with time. It is then essential to know the positions of the two boundaries as a function of time. Which boundary moves depends on which component separates. When the continuous phase sepa- rates, the lower interface moves; when the disperse phase separates, the upper boundary moves; and when both phases separate, both boundaries move.
Case 1: Separation of the Continuous Phase. In this case, the upper boundary is fixed (21 = 0, dzlldt = 0). However, as the continuous phase separates out, the lower boundary moves up, i.e., 2 2 decreases. A conservation equation for the continuous phase can be written as
(30) Vold, R. D.; Mittal, K. L.; Hahn, A. U. In Surface and Colloid
(31) Exerowa, D.; Kolarov, T.; Khristov, K. Colloids Surf. 1987,22, Science; Matijevic, E., Ed.; 1978; Vol. 10, p 45.
171.

4646 Langmuir, Vol. 11, No. 12, 1995 Bhakta and Ruckenstein
i.e.
Using eq 11, eq 21 can be written as
and finally since uIZ=o = 0 we get
Case 2: Separation of the Disperse Phase. In this case, the lower boundary is fixed (ZZ = LO, dzddt = 0) and the upper boundary moves down, i.e., z1 increases. A conservation equation for the disperse phase can be written as
d L - + -L1"1 - E ) dz = 0 dt dt
Equation 24 can be simplified as above to give
d z l 3 -- dt 15(0.816)u'z=z~ =
(24)
Case 3: Separation of Both Phases. In this case, both boundaries move and we need expressions for dzlldt and dz jd t .
The conservation equation for the continuous phase can be written as
d d dLo - 2 2 ) + ZL- dz = 0
which can be rewritten in the form
(26)
= 0 (27) 1 dzl 3 [" dt - 15(0.816)ECu1Z=z~
While it appears that we have an additional equation arising from the conservation of the disperse phase, a closer examination indicates that the two conservation equations are not independent, since the conservation of the disperse phase simply gives us eq 27. We thus have two unknowns (dzlldt and dzddt) and just one equation. However, the lower boundary moves up only if some continuous phase leaves the emulsion at the bottom (i.e., uIz=z2 > 0). Similarly, the upper boundary moves down only if the continuous phase fluid a t the top moves down (u(z=zl > 0). Consequently, the movement of the upper boundary depends "explicitly" only on the conditions at z = z1 and that of the lower boundary depends only on the conditions a t z = 2 2 . There are two sets of terms in eq 27. The terms in the first pair of parentheses depend only on the conditions at z = 22, while those in the second set depend only on the conditions a t z = 21. It is therefore reasonable to say that these two sets have to be inde- pendently equal to 0. Thus, we have from eq 27
(29) hl 3
E , - - dt 1 5 ( 0 . 8 1 6 ~ i z = z ~ =
One may note that eqs 28 and 29 are identical to eqs 23 and 25, so that our relations are consistent with the extreme cases.
Initial Condition To solve eq 11, we need the initial distribution of E , i.e.,
E ( ~ = o . Now, we mentioned earlier, we consider emulsions produced by mixing in which EO is expected to be more or less uniform along the length of the column. Thus an appropriate initial distribution would be
~ = O ~ E = E ~ for O < z < L o (30)
where EO is a constant. However, if E , < EO < Eb the boundary conditions are
(31)
There is thus an instantaneous transition at the bound- aries so that eq 30 is satisfied at t = 0 and eq 31 is satisfied at t 2 0.
Solution Method
- 4z=zl - 0, ulz,z = 0
The boundaries were immobilized using the transfor- mation z - 6 where 6 = (z - zJ(z2 - 21). Thus the boundaries in 6 space are fixed at 6 = 0 and 6 = 1. For convenience, y = [(l - E ) / E ] ~ ~ was used as the dependent variable. Let K = [4d(36n,0.816)luZ, A0 = 3S(KR)2pg/ (15(0.816)20&~), and B = u/(pgKR). Equation 11 can then be rewritten in terms of y, t, and 6 as
and the boundary conditions become
< t,;
for t L t, (33a)
Cubic Hermite polynomials were used to interpolate y in 5 space. To solve the system, we require the value of y and its derivative (@/at) a t each break point. Thus, if we have M break points (i.e., M - 1 intervals in 6 space) we have 2M + 2 unknowns (M values of y, M values of @/at, Z Z , and 21). Using collocation methods, the inter- polated solution is forced to satisfy the differential equation at two points in each space interval. The points are chosen so as to ensure fourth-order accuracy in space. This gives us 2(M - 1) ordinary differential equations (ODES) in

Foams and Concentrated Emulsions Langmuir, Vol. 11, No. 12, 1995 4647
time. Two equations are obtained by differentiating the two boundary conditions (eq 33) in time and the remaining two from expressions for dzlldt and dzddt. The resulting system of 2M + 2 ODES was solved using Gear's backward difference formula. The IMSL routine MOLCH was used for the initial stages (when dzlldt and dzddt are 0) since it gives quicker convergence.
Drainage Equilibrium Drainage through a PB channel stops (u = 0) when the
opposing forces due to gravity and PB suction balance each other (see eq 6). When this occurs throughout the system, a drainage equilibrium is established and the volume of the continuous phase in the emulsion does not change with time. Thus, a t equilibrium we have '
u = 0 for a l l z (34)
A combination of eqs 6 and 34, results in
(35)
Using eq 10, eq 35 can be written in terms of E at equilibrium (ceq) as
Now let us define K eq 36 gives
[4n/(3dn,0.816)11'2. Integration of
(37)
where c is a constant of integration. Equation 37 can be rewritten as
Let z1= zle and z2 = 2ze a t equilibrium. The volume of the continuous phase per unit cross section at equilibrium is then given by
(39)
Substituting the expression for ceq from eq 38 into eq 39 and integrating we get
veq = &[tan-'( c - KpgRzle) U -
tan-'(c - KpgR22e)] (5 (40)
Now, since the distance moved by the lower boundary is equal to the loss of continuous phase per unit cross section, we have
Lo - 2 2 , = LOEO - veq (41)
tan-'(c - KpgR22e)] U (42)
Clearly, to accurately determine the conditions at equi- librium, we need to evaluate the constant of integration c, i.e., we require ceq at one of the boundaries. Thus, there are four possible scenarios for the state of the concentrated emulsion a t equilibrium:
Case a: The Equilibrated Emulsion Is in Contact with the Continuous Phase at the Bottom. In this case, we have Zle = 0 and ~ ~ ~ l ~ = ~ ~ ~ = Eb = 0.26. Thus the constant of integration is given by
(43)
and eq 40 becomes
Hence eq 42 leads to , -
Case b: The Equilibrated Emulsion Is in Contact with the Separated Disperse Phase at the Top. We now have = LO and E I ~ = ~ ~ ~ = E ~ , and the constant of integration is given by
Substituting the expression for c in eqs 42 and 40 we get
Case c: Both Phases Separate. In this case, we have ~ l ~ = ~ ~ ~ = cc and ~ l ~ = ~ ~ ~ = Eb. Thus from eq 37 we have
(49)
i.e. Also, we have

4648 Langmuir, Vol. 11, No. 12, 1995 Bhakta and Ruckenstein
Combining eqs 49 and 50, we have
Now, since the right-hand side of eq 51 is a constant for a given system, it is clear that when both phases separate, the final length (Lmax) of the equilibrated column is fixed and given by eq 51.
An important point to be noted is that when one or more phases separate, the length of the emulsion has to decrease, i.e.,
Thus, ifLo < L,,,, it is not possible to have an equilibrium with both phases separating. In other words, when LO < L,, only one phase will separate. Which phase separates is determined by the initial composition of the system. If during drainage, E at the bottom exceeds Eb before the E at the top falls below E , , the continuous phase separates and eqs 43-45 are valid. On the other hand, if cIZ=0 falls below ec first, collapse occurs a t the top and eqs 46-48 are valid. If, however, u becomes zero before either of the above occur, no phase separation takes place.
Effect of Initial Condition on Phase Separation On the basis of the initial state of a concentrated
emulsion, it is possible to determine at the outset which of the two phases separates out. As has been discussed earlier, if& < L,,,, only one phase will separate out. Two situations are possible in this case and we shall discuss each separately.
Case 1: Separation of the Continuous Phase. Let us define a critical volume:
A comparison with eq 44 indicates that V, is the volume of the continuous phase per unit cross section in an equilibrated concentrated emulsion when zze =LO. Thus, if E&, = V,, the continuous phase will redistribute itself until an equilibrium is established with E I , = , ~ = Eb. However, if E&O > V,, some continuous phase has to separate out before an equilibrium can be established. To understand the reasoning behind this, consider Figure 4a. The curve HAFB represents the equilibrium profile of E in a column of length L,,. Consider a column of length Lo < L,, with an initial profile represented by the horizontal line EFG. Thus
Lo = length(EG1; area(CDEG) = (54)
Also note that for this system, the volume of continuous phase per unit cross section in an equilibrated column of length LO is given by area(ABCD). Thus
V, = area(ABCD) (55)
It is clear from the figure that the part of the emulsion from E to F has an excess of continuous phase given by
0.20 I
. b
0.20 -
€
0.10 i I i
C D 0.10 D1 0.15
z(m)
Figure 4. A pseudo-phase diagram for continuous phase separation: (a) VI = VZ and (b) VI > VZ.
VI = area(AEF1, while the part of the emulsion from F to G has a deficiency of continuous phase given by VZ = area- (BFG). Thus
EAo - v, = VI - v, (56)
Now if VI = Vz, i.e., if V, = E,&,,, the amount of continuous phase that the upper part (EF) loses as it attains equilibrium is just equal to the amount the lower part needs. Thus, a t equilibrium, the E profile is given by curve AFB and the length of the column remains unchanged. On the other hand, if VI > Vz, i.e., if E,& > V, (see Figure 4b), the upper part must lose a greater amount of liquid than the lower part requires, i.e., the lower part will gain more continuous phase liquid than it can hold. As a result the excess separates out and the column length decreases. The final profile is now given by curve AlFB and the equilibrium length is given by length(D1C). One may note that length(DD1) = VI - Vz. The above arguments are similar to those used by PrincenZ2 to predict conditions under which the continuous phase separates out.
Case 2: Separation of the Dispersed Phase. As in the previous case, it is possible to define a critical volume for disperse phase separation:

Foams and Concentrated Emulsions Langmuir, Vol. 11, No. 12, 1995 4649 . -
V - L [ D - KpgR tan-1 id?)-
It may be noted that eq 57 is a special case of eq 48 with zle = 0. Consider Figure 5. The initial profile in this case is given by segment EFG. It is clear that VD = area- (ABCD). Thus, the excess continuous phase in the upper part is VI' = area(AEF) and the deficiency in the lower part is V i = area(BGF). Now, if VI' = V i we have E&O = VD and the continuous phase will simply redistribute so as to attain a final equilibrium profile given by curve AFB. However, if VI' < Vz', the lower part (FG) requires more continuous phase than can be provided by the upper part (EF), so that E at the top falls below E , and the disperse phase separates out. This causes the length of the emulsion to decrease and the final profile is given by curve AFB 1. In this case, the change in length is given by length- (CC1).
The discussion in the above sections can be summarized as follows: when LO < L,,
Loco < VD - separation of the disperse phase
E & ~ 7 Vc - separation of the continuous phase
If VD < E&O < V,, equilibrium is established before E at either end can reach E , or Eb and no phase separation takes place.
Separation of Both Phases. As mentioned earlier, when both phases separate, the length of the column at equilibrium is k e d and given by L,,,. Thus, separation of both phases can occur only if Lo > Lm,, However, LO > L,, does not necessarily imply that both phases separate. Using a reasoning similar to that used above, it is possible to determine the conditions under which both phases separate.
The volume of continuous phase per unit cross section in an emulsion in equilibrium with two phases (Vceq) is given by
The volume per unit cross section of the disperse phase ( V D ~ ~ ) in this situation is given by:
i.e.
(59)
Clearly, Vceq and VDeq are fixed for given R , 0, and p. Thus, if the volumes per unit cross section of the two phases in the initial emulsion exceed Vceq and V D ~ ~ , i.e., if E&O > Vceq and (1 - EOILO > V D ~ ~ both phases separate out. If any one of these conditions is not satisfied, only one phase will
0.04 1
8 ,
D , c1 I /I c 0.05 0.10
2"
0.00 0.00
Figure 5. A pseudo-phase diagram for dispersed phase separation.
separate. The final length will then be less than L,,, and the situation is the same as that discussed earlier.
A Generalized "Phase" Diagram The condition for the separation of the continuous phase
can be written as
E&, > Vc for Lo < Lm, (61)
Using eq 53, eq 61 can be written as
tan-'( ,/?)I (63)
And using eq 58, eq 62 can be written as
(64)
Similarly, using eq 57, the condition for disperse phase separation can be written as
while for Lo > Lmm
tan-'( ,/?) + tan-'( 47)] (66)
Let us define a dimensionless number P = d(KpgRL0). Equations 63-66 can therefore be written as

4650 Langmuir, Vol. 11, No. 12, 1995
0.50
Bhakta and Ruckenstein
-
tan-'( ,/+)I (70)
It can be seen from eqs 67-70 that given an E O , the occurrence of phase separation is determined entirely by the value ofP. Figure 6 shows the right-hand sides of eqs 67-70 plotted versus P. The curves AI3 (eq 70) and BC (eq 69) show the lower limit of €0 below which the disperse phase separates, and curves Dl3 (eq 68) and BE (eq 67) represent the upper limit for EO beyond which the continuous phase separates. Point B corresponds to LO = Lm,. At this point there is no phase separation and at equilibrium E = Eb at the bottom and E = cc at the top. The region ABD corresponds to those initial conditions (LO > Lm,) for which both phases separate. Figure 6 is also useful in understanding the effect of the initial column height (LO) and bubble radius ( R ) on the stability of a concentrated emulsion. The influence of these two parameters is determined entirely by their effect on P. For a given pair of fluids we have P = (l/L&). Consider an emulsion with €0 = 0.025. Now if its length and bubble size are such that the initial condition is represented by H i t is unstable. However, if its length andor bubble size are decreased so that it is characterized by point G, it is stable and no phase separation will take place.
Simulation Results To demonstrate the results of our model, we carried out
simulations for a typical oil-in-water concentrated emul- sion. The following values for the physical parameters were used: u = 20 mN/m, p~ = 0.7 g/cm3, pc = 1 g/cm3, p = 1 cP, R = 0.2 mm, LO = 10 cm, Hamaker constant (A) = 0.41 x J, ionic strength (I) = 0.01 M, and surface potential (q,) = 10 mV. For these conditions we get z,, = 615.95 N/m2 and cc = 0.00826. In this case, P = 0.19045 and L,, = 17.65 cm. Since LO < L,, only one phase separates if a t all. From the phase diagram, it is clear that for EO > 0.0746, the continuous phase separates; for c0 < 0.0157, the disperse phase separates and for 0.0746 < €0 G 0.0157 there is no phase separation. Figure 7 shows the evolution of6 with time for EO = 0.125. The continuous curve represents the equilibrium E profile in this system. The other curves represent the profiles at t = 0, t = 108, t = 890, and t = 4050 s. Note that for t = 890 and t = 4050 s the length of the column decreases indicating that the continuous phase separates out. Figure 8 shows the fraction of continuous phase separated [(LO - Z Z ) / ( E & O ) ~ as a function of time for this system. Figure 9 shows the evolution of E for €0 = 0.01. In this case, the interface with zlt=O = 0 moves indicating that the disperse phase separates out. Figure 10 shows the fractional amount of disperse phase zl/[(l - ~ 0 ) L o l separated versus time for this system. Figure 11 shows the evolution of E for E O = 0.05. It is clear that the positions of the two interfaces
\ \ t
I 0.2 continuous phase separation
separatlon of both phases
E o
I \
1
disperse phase separation I
0.05 0.10 0.15 0.20 0.0 0.00
P
Figure 6. A generalized phase diagram (Eb = 0.26 and cc = 0.00826.
0.20
E
0.10
Equilibrium 0 t=O I - + t-108 s ; + { g + I * tP8W s
~ nt=4050s
F
d + + I
i
I I
0.10 0.00 '
Figure 7. Evolution ofthe E profile when the continuous phase separates. System parameters: p = 1 cP, p e = 1 g/cm3, p~ = 0.7 g/cm3, R = 0.2 mm,A = 0.41 x J,Lo = 10 cm,Z= 0.01 M, u = 20 mN/m, V s = 10 mV, and EO = 0.125.
0.00 0.02 0.04 0.06 0.08 z (m)
0.20 I / i l I
i
I 0.0 2000.0 4000.0 6000.0 8000.0
t (SeCS)
0.00 ' ' Figure 8. Fractional amount of continuous phase drained with time for the system of Figure 7.
do not change with time. There is merely a redistribution of the continuous phase before equilibrium is established, no phase separation.
Figure 12 shows the evolution of the E profiles for LO = 22.5 cm and eo = 0.09, The phase diagram indicates that
Foams and Concentrated Emulsions
0.00
Langmuir, Vol. 11, No. 12, 1995 4651
I 20000.0
' 0.0 5000.0 10000.0 15000.0
0.020
- Equilibrium x t.0 0 t-2000 s 0 1-15000 S
t320GQO s
0.005 0.02 0.04 0.06 0.08 0.10
z (m)
Figure 9. Evolution of the E profile when the,dispersed phase separates (LO = 10 cm and EO = 0.01). "he other parameters are as in Figure 7.
0.40
0.30
- w
6. 0.20 s > -
0.10
0.20
0.15
E
0.10
0.05
0.00
- Equilibrium * t-0 0 t-109 s 0 t-1090 s t.10000 8
0.02 0.04 0.06 0.08 0.10 z(m)
Figure 11. Evolution of the E profile when there is no phase separation (LO = 10 cm and EO = 0.05). "he other parameters are as in Figure 7.
both phases separate out. Indeed, Figure 12 shows that both interfaces move. Figures 13 and 14 show the fractional amount of the two phases separating with time. Please note that all calculations in this paper have been carried out for 25 "C.
- Equiilbrium " t-0 0 t-399 s
* 1122525 8 0.20 0 1-3090 S L
E
1 0.00 0.05 0.10 0.15 0.20
0.00 ' 2"
Figure 12. Evolution of the E profile when both phases separate (LO = 22.5 cm and EO = 0.09). The other parameters are as in Figure 7.
0.80
0.60
3 0.40 \ - N" J -
0.20
0.00 i
I 10ooo.o 20000.0 3OOoo.O 4OMXJ.O
t(s)
Figure 13. Fractional amount of continuous phase drained with time for the system of Figure 12.
0.10
0.08
y 0.06
J rl I - \ < 0.04
0.02
U.UU. 0.0 1ouuu.u ".U 4vvuu.u
W
Figure 14: Fractional amount of dispersed phase separated with time for the svstem of Firmre 12.
Comparison with Experiment Experimental data on the unsteady drainage of liquid-
liquid concentrated emulsions are not available. All the data available in the literature deal with foams. In many
by bubbling. Systems of this type have been treated in an earlier pub1ication.l' Kann6 has presented some drainage data on homogeneous foams. However, two
4652 Langmuir, Vol. 11, No. 12, 1995
250.0
Bhakta and Ruckenstein
-
0.8 , I
i /
O2 t
0.8
o,6
- w s -
1 ’ 0 . 4 N
9 - 0.2
- ~ , = 4 . 5 cm ............ ~ , = 5 cm - - - - ~ , . 7 . 5 cm ---Lo=10 cm
~ ~ ~ - 1 6 cm + - L ~ - Z ~ cm -L0=35 cm
-
- 1 ................................................... ..................... ................
1
2000.0 0.0 500.0 1000.0 1500.0 0.0
Figure 16. Effect of the initial length (LO) on the foam drainage (€0 = 1/70).
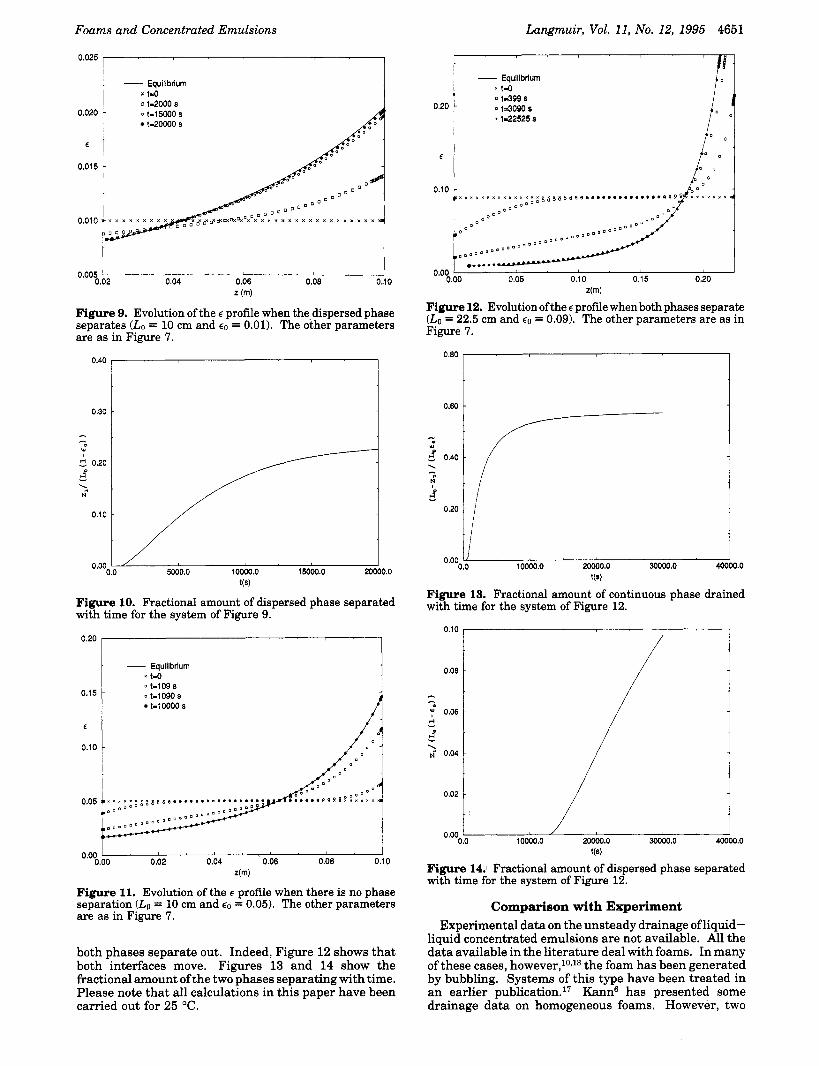
important parameters required by our model, viz., the surface tension and bubble size, are missing. It is also not clear whether the bubble size was maintained the same in all cases. Therefore, we can at best attempt to check if our model qualitatively predicts the experimental trends. There are two main results in that paper: (a) For a given EO the lag time for drainage, i.e., the time required for the first drop ofliquid to appear at the bottom decreases as the initial foam height (LO) increases (Figure 2 in ref 6). (b) For a given height, the lag time increases as the co decreases (Figure 4 in ref 6).
Simulations were carried out with the following values of the parameters: R = 0.5 mm, a = 10 mN/m, p = 1 cP, I = 0.01 M, A = 0.41 x J, vB = 10 mV, and p = 1 g/cm3.
Figure 15 shows the simulated drainage curves [(LO - Z Z ) / ( E & O ) ~ for LO = 10 cm and three values of E O . Clearly, the lag time increases as EO decreases. Figure 16 shows the effect of the initial foam height (Lo) on the drainage curves for EO = 1/70. Figure 17 shows a plot of lag time ( 7 ) versus LO for this system. One can see that the lag time decreases with an increase in Lo for smaller heights but remains unchanged with height for larger heights. Figure 17 is very similar to Figure 3 in ref 6. An explanation for this trend in lag times can be given as follows:
500.0
i 450.0 1
350.0 t 1 300.0 1 \
The lag time is essentially the time required for E I ~ = L ~ to become equal to Et , . If EO is constant, the amount of liquid that the lower portion of the foam must receive for E to become Eb is fixed. The time lag is therefore determined by the flow rate of liquid into the bottom PBs. The flow rate is initially the same throughout the column (since E = c0 throughout the foam). However, since there is no input of liquid at the top, the plateau borders at the top contract thereby decreasing the flow into the PBs below them and so on. For longer foams, the effect of the contraction at the top takes a longer time to reach the bottom. Thus, beyond a certain height, E at the bottom becomes equal to Eb before the influence of the upper boundary becomes significant, so that the flow rate in the lower portion is essentially independent of the foam height and the lag time remains more or less constant. The sharp rise in lag times is simply due to the fact that as we decrease Lo we are approaching the point a t which no phase separation takes place (i.e., the lag time is infinite).
When Lo is fixed (Figure E), as EO decreases, the amount of liquid required by the lower part increases and the flow rate decreases resulting in an increase in lag time.
Conclusion
A general theoretical treatment of drainage in homo- geneous foams and concentrated emulsions is presented which accounts for the separation of both phases during drainage. Our model successfully predicts the trend of lag times observed in the drainage of homogeneous foams.
On the basis of certain properties of the system such as the bubble radius (R) , column height (LO), interfacial tension (a), and density difference (p ) , it is possible to determine whether phase separation will take place. It is also possible to determine which of the two phases (if not both) will separate out before equilibrium is established. Two-phase separation is possible only if the column length exceeds a certain value, which for a given pair of fluids depends only on the bubble radius (R). A generalized “phase” diagram is presented which makes it possible to determine the phase behavior of a concentrated emulsion on the basis of the value of a single dimensionless number ( P = a/(pgKRLo)). LA950162M
Related Documents