EXPLORING DIGITAL ROI FOR FMCG BRANDS The advertising community has two long-standing demands of digital marketing: 1. Prove that the online channel can build brands 2. Prove that it can drive offline sales

FMCG-Econometrics-Whitepaper-Microsoft-Advertising-Intl.pdf
Nov 28, 2015
Eco
Welcome message from author
This document is posted to help you gain knowledge. Please leave a comment to let me know what you think about it! Share it to your friends and learn new things together.
Transcript

EXPLORING DIGITAL ROI FOR FMCG BRANDSThe advertising community has two long-standing demands of digital marketing:
1. Prove that the online channel can build brands
2. Prove that it can drive offline sales

In the absence of a proven link between digital campaigns and offline sales, FMCG marketers have been reluctant to shift marketing budgets to digital.According to Nielsen Ad Dynamix, in the UK, online display currently receives approximately 3% of FMCG brands’ media allocation, TV gets approximately 60%, Print 23%, Outdoor 6%, Cinema 3%, and Radio 3%*. The current economic climate has made the need to focus on ROI ever more pressing, with a surge of activity and energy going into price promotions wherever possible.
Microsoft Advertising, in partnership with econometric experts BrandScience, looked carefully at how the case for digital driving offline sales can best be made. Our approach is to harness the results that come from Econometric Modelling, a technique used for over 25 years by FMCG businesses. Econometric Modelling provides a credible, cross-media view of marketing, reflecting today’s media landscape. Our study was a meta analysis of all the FMCG models of sales built by BrandScience, which included quantification of the sales effect of all of the media channels used to a significant degree by FMCG brands.
Where sample sizes permit, we have explored the digital ROI by FMCG sub-category (Impulse, Food and Drink, Health and Beauty and Household) and by digital platform (Standard online display media, Rich media, Pre-Roll Video, Mobile and Social).
Whilst there have been many thousands of branding studies undertaken to prove that the online channel can build brands, less attention has been paid in proving that it can also drive offline sales.
*Source: Nielsen Ad Dynamix April 2012
EXPLORING DIGITAL ROIFOR FMCG BRANDS;THE MISSING LINK
02
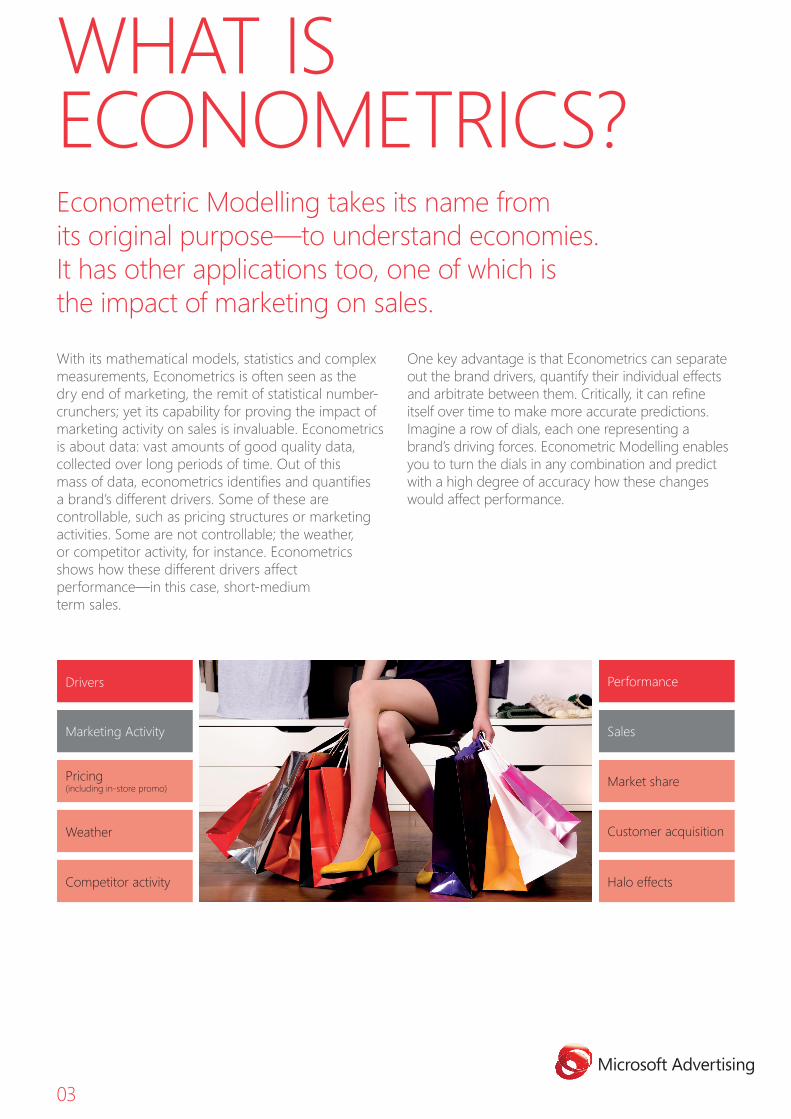
With its mathematical models, statistics and complex measurements, Econometrics is often seen as the dry end of marketing, the remit of statistical number-crunchers; yet its capability for proving the impact of marketing activity on sales is invaluable. Econometrics is about data: vast amounts of good quality data, collected over long periods of time. Out of this mass of data, econometrics identifies and quantifies a brand’s different drivers. Some of these are controllable, such as pricing structures or marketing activities. Some are not controllable; the weather, or competitor activity, for instance. Econometrics shows how these different drivers affect performance—in this case, short-medium term sales.
One key advantage is that Econometrics can separate out the brand drivers, quantify their individual effects and arbitrate between them. Critically, it can refine itself over time to make more accurate predictions. Imagine a row of dials, each one representing a brand’s driving forces. Econometric Modelling enables you to turn the dials in any combination and predict with a high degree of accuracy how these changes would affect performance.
WHAT IS ECONOMETRICS?Econometric Modelling takes its name from its original purpose—to understand economies. It has other applications too, one of which is the impact of marketing on sales.
Drivers Performance
Marketing Activity Sales
Market share
Customer acquisition
Halo effects
Pricing (including in-store promo)
Weather
Competitor activity
03
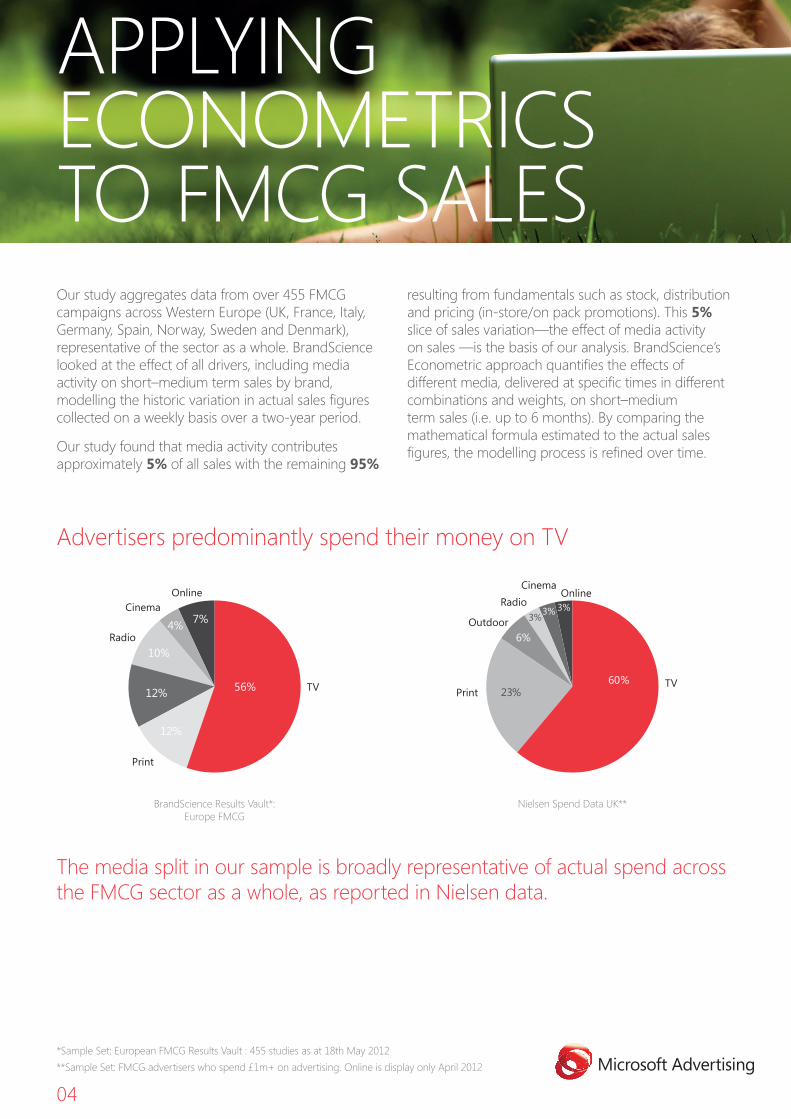
Our study aggregates data from over 455 FMCG campaigns across Western Europe (UK, France, Italy, Germany, Spain, Norway, Sweden and Denmark), representative of the sector as a whole. BrandScience looked at the effect of all drivers, including media activity on short–medium term sales by brand, modelling the historic variation in actual sales figures collected on a weekly basis over a two-year period.
Our study found that media activity contributes approximately 5% of all sales with the remaining 95%
resulting from fundamentals such as stock, distribution and pricing (in-store/on pack promotions). This 5% slice of sales variation—the effect of media activity on sales —is the basis of our analysis. BrandScience’s Econometric approach quantifies the effects of different media, delivered at specific times in different combinations and weights, on short–medium term sales (i.e. up to 6 months). By comparing the mathematical formula estimated to the actual sales figures, the modelling process is refined over time.
Advertisers predominantly spend their money on TV
*Sample Set: European FMCG Results Vault : 455 studies as at 18th May 2012**Sample Set: FMCG advertisers who spend £1m+ on advertising. Online is display only April 2012
Nielsen Spend Data UK**
60%23%
6%
3%3% 3%
TVPrint
Outdoor
BrandScience Results Vault*: Europe FMCG
56%
12%
12%
10%
4% 7%
TV
Radio
CinemaOnline
The media split in our sample is broadly representative of actual spend across the FMCG sector as a whole, as reported in Nielsen data.
APPLYING ECONOMETRICS TO FMCG SALES
RadioCinema
Online
04
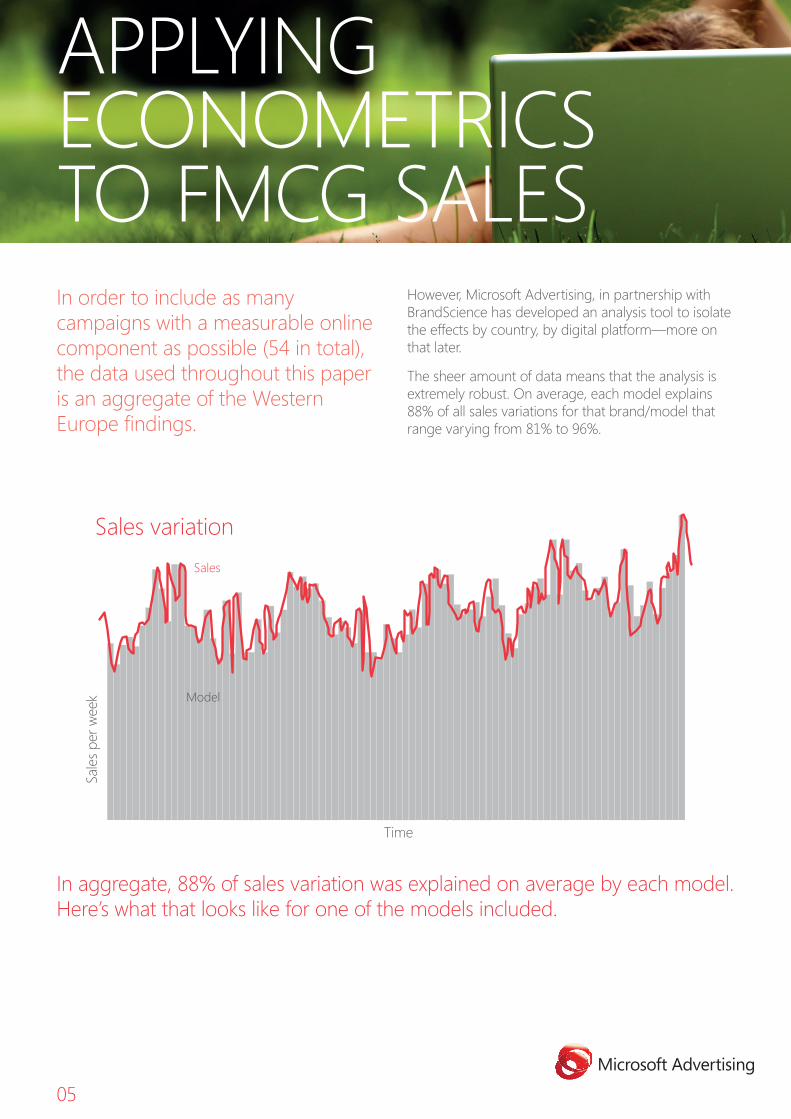
In order to include as many campaigns with a measurable online component as possible (54 in total), the data used throughout this paper is an aggregate of the Western Europe findings.
However, Microsoft Advertising, in partnership with BrandScience has developed an analysis tool to isolate the effects by country, by digital platform—more on that later.
The sheer amount of data means that the analysis is extremely robust. On average, each model explains 88% of all sales variations for that brand/model that range varying from 81% to 96%.
APPLYING ECONOMETRICS TO FMCG SALES
In aggregate, 88% of sales variation was explained on average by each model. Here’s what that looks like for one of the models included.
Sales
Model
Sale
s per
wee
k
Time
Sales variation
05

Revenue gained through
marketing activity
Cost of marketing
activityRROI=–
The ROI of individual media for short–medium term FMCG sales
The overall conclusion of our study is that online is the second most efficient medium for driving short–medium term sales in the FMCG sector, as recorded in actual sales data, behind cinema1. Online returns €1.43 in actual recorded sales value for every €1 invested. We have taken into account the average production costs by media2. Despite this, overall, only 3% of FMCG ad budgets are spent online.
How do we calculate the revenue return on investment (RROI)?
The Econometric Model enables us to split out revenue gained directly through marketing activity (as opposed to overall revenue); we can divide that by the amount spent on the marketing activity to provide a clear picture of the revenue gained through marketing activity… or the RROI.
ONLINE DELIVERSTHE SECOND GREATEST ROI FOR SHORT–MEDIUM TERM SALES
1European FMCG Results Vault: 54 Studies as of 18th May 2012 2WARC average media spend figures
Cinema€2.64
Online€1.43
Outdoor€1.40
Radio€1.39
Print€1.32
TV€1.26
Average ROI
% media
mix9% 8%8% 6% 11% 59%
Based on meta-analysis of econometric studies by BrandScience – 54 cases who are FMCG and use online, 18th May 2012
Online is the second most efficient medium in terms of RROI FMCG cases that used online within the media mix
06
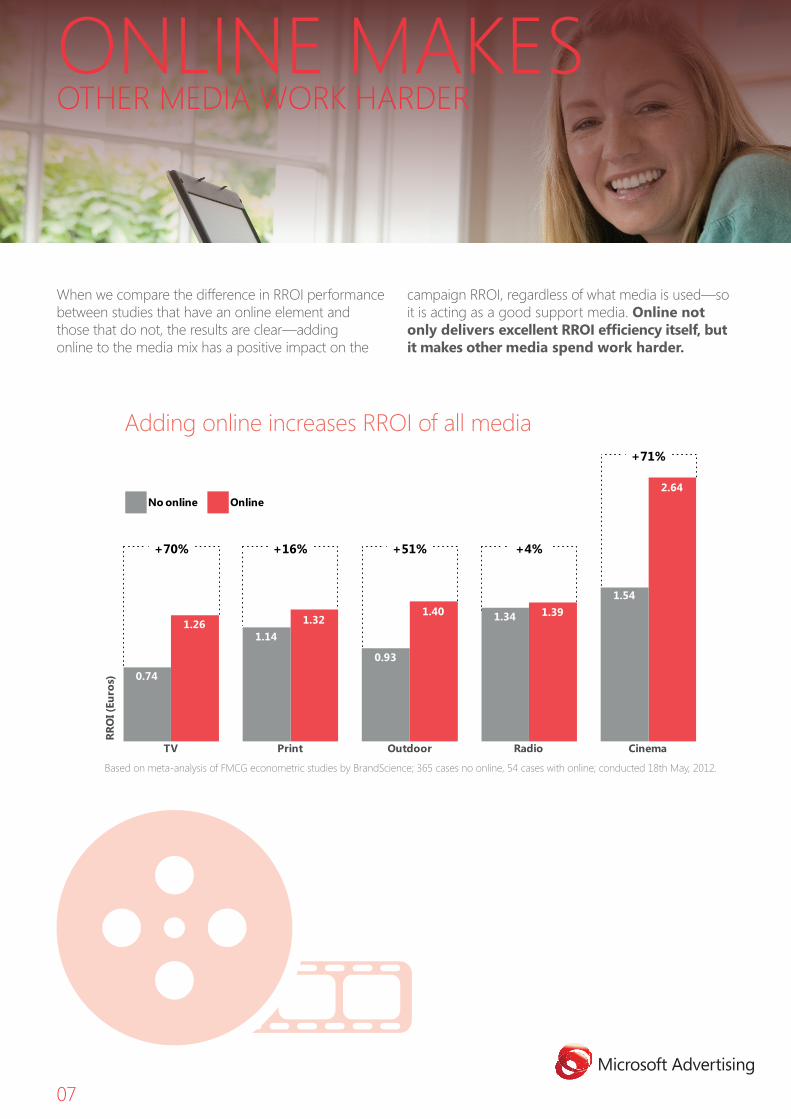
+70% +4%+16% +51%
+71%
No online Online
RRO
I (Eu
ros)
TV Print Outdoor Radio Cinema
2.64
1.541.391.341.40
0.93
1.321.14
1.26
0.74
ONLINE MAKESOTHER MEDIA WORK HARDER
When we compare the difference in RROI performance between studies that have an online element and those that do not, the results are clear—adding online to the media mix has a positive impact on the
campaign RROI, regardless of what media is used—so it is acting as a good support media. Online not only delivers excellent RROI efficiency itself, but it makes other media spend work harder.
Adding online increases RROI of all media
Based on meta-analysis of FMCG econometric studies by BrandScience; 365 cases no online, 54 cases with online; conducted 18th May, 2012.
07
0
20
40
60
80
100
120
140
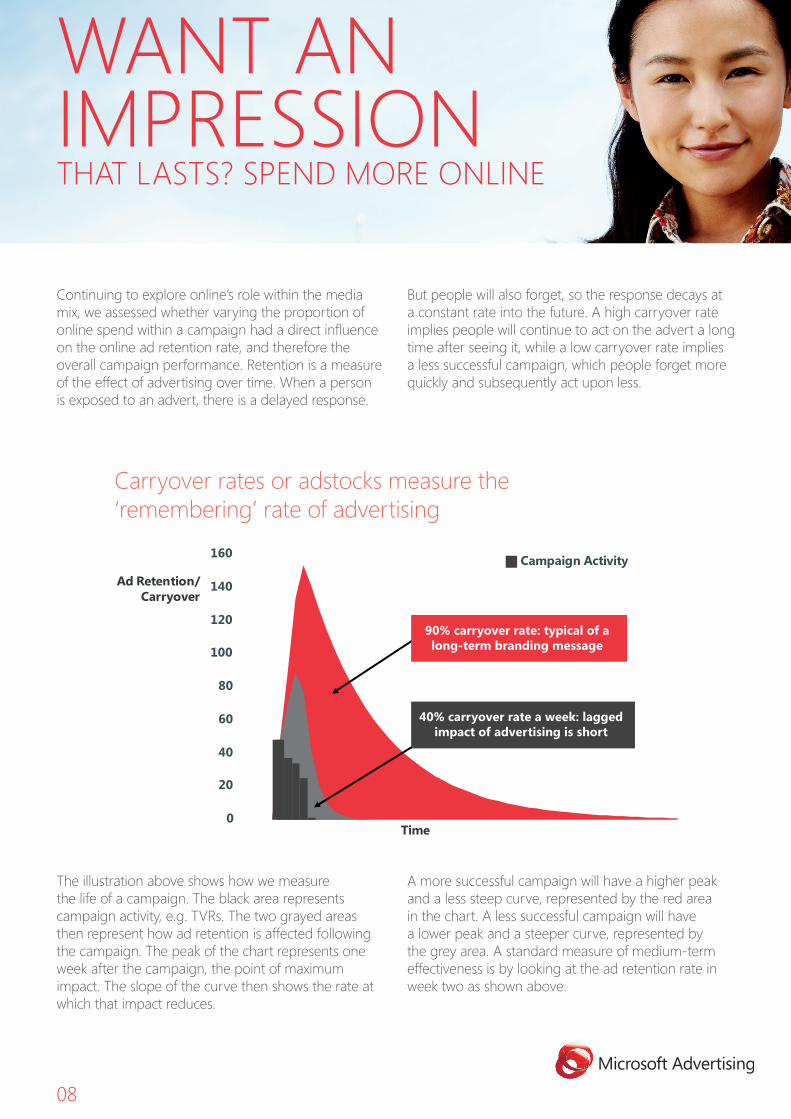
160 Campaign Activity
Time
Ad Retention/Carryover
90% carryover rate: typical of along-term branding message
40% carryover rate a week: laggedimpact of advertising is short
WANT AN IMPRESSIONTHAT LASTS? SPEND MORE ONLINE
Continuing to explore online’s role within the media mix, we assessed whether varying the proportion of online spend within a campaign had a direct influence on the online ad retention rate, and therefore the overall campaign performance. Retention is a measure of the effect of advertising over time. When a person is exposed to an advert, there is a delayed response.
But people will also forget, so the response decays at a constant rate into the future. A high carryover rate implies people will continue to act on the advert a long time after seeing it, while a low carryover rate implies a less successful campaign, which people forget more quickly and subsequently act upon less.
The illustration above shows how we measure the life of a campaign. The black area represents campaign activity, e.g. TVRs. The two grayed areas then represent how ad retention is affected following the campaign. The peak of the chart represents one week after the campaign, the point of maximum impact. The slope of the curve then shows the rate at which that impact reduces.
A more successful campaign will have a higher peak and a less steep curve, represented by the red area in the chart. A less successful campaign will have a lower peak and a steeper curve, represented by the grey area. A standard measure of medium-term effectiveness is by looking at the ad retention rate in week two as shown above.
Carryover rates or adstocks measure the ‘remembering’ rate of advertising
08
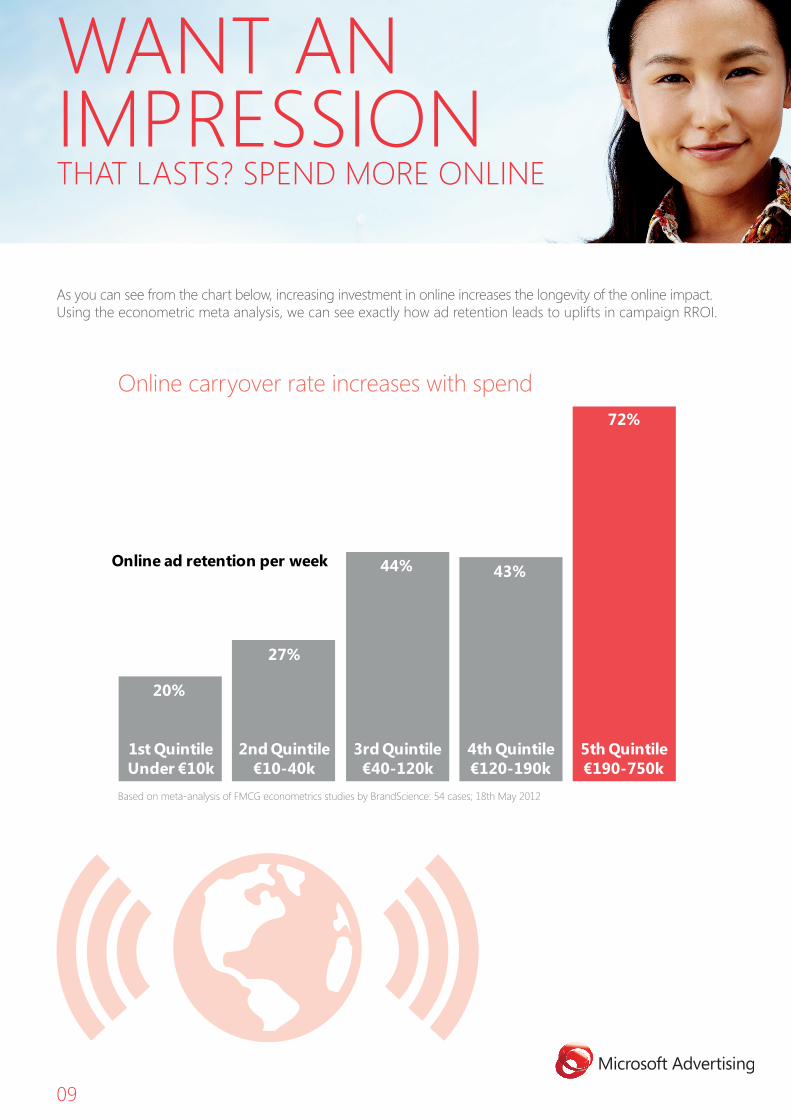
1st QuintileUnder €10k
2nd Quintile€10-40k
3rd Quintile€40-120k
4th Quintile€120-190k
5th Quintile€190-750k
27%
20%
44% 43%
72%
Online ad retention per week
As you can see from the chart below, increasing investment in online increases the longevity of the online impact. Using the econometric meta analysis, we can see exactly how ad retention leads to uplifts in campaign RROI.
Online carryover rate increases with spend
WANT AN IMPRESSIONTHAT LASTS? SPEND MORE ONLINE
Based on meta-analysis of FMCG econometrics studies by BrandScience: 54 cases; 18th May 2012
09
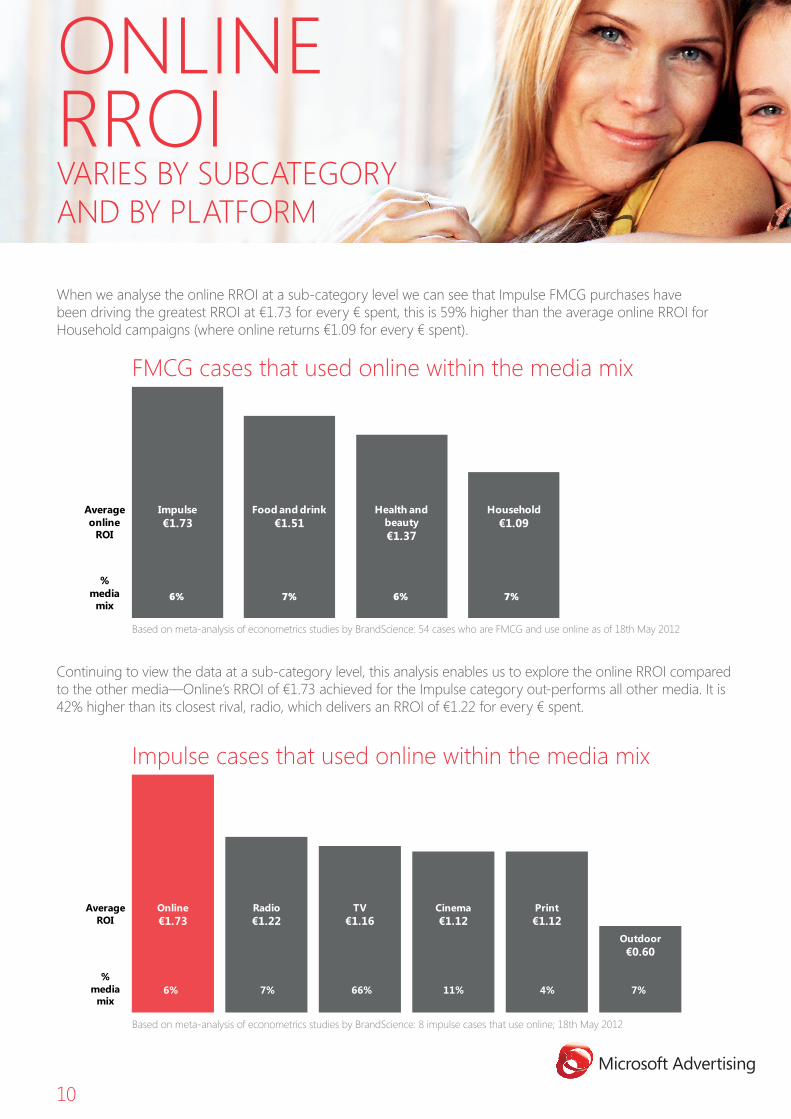
ONLINE RROI VARIES BY SUBCATEGORY AND BY PLATFORM
When we analyse the online RROI at a sub-category level we can see that Impulse FMCG purchases have been driving the greatest RROI at €1.73 for every € spent, this is 59% higher than the average online RROI for Household campaigns (where online returns €1.09 for every € spent).
Continuing to view the data at a sub-category level, this analysis enables us to explore the online RROI compared to the other media—Online’s RROI of €1.73 achieved for the Impulse category out-performs all other media. It is 42% higher than its closest rival, radio, which delivers an RROI of €1.22 for every € spent.
Average ROI
% media
mix
Online€1.73
Radio€1.22
Cinema€1.12
TV€1.16
6% 7% 66% 11% 4% 7%
Print€1.12
Outdoor€0.60
Based on meta-analysis of econometrics studies by BrandScience: 8 impulse cases that use online; 18th May 2012
Based on meta-analysis of econometrics studies by BrandScience: 54 cases who are FMCG and use online as of 18th May 2012
Average online
ROI
% media
mix
Impulse€1.73
Food and drink€1.51
Household€1.09
Health and beauty€1.37
7% 7%6% 6%
FMCG cases that used online within the media mix
Impulse cases that used online within the media mix
10
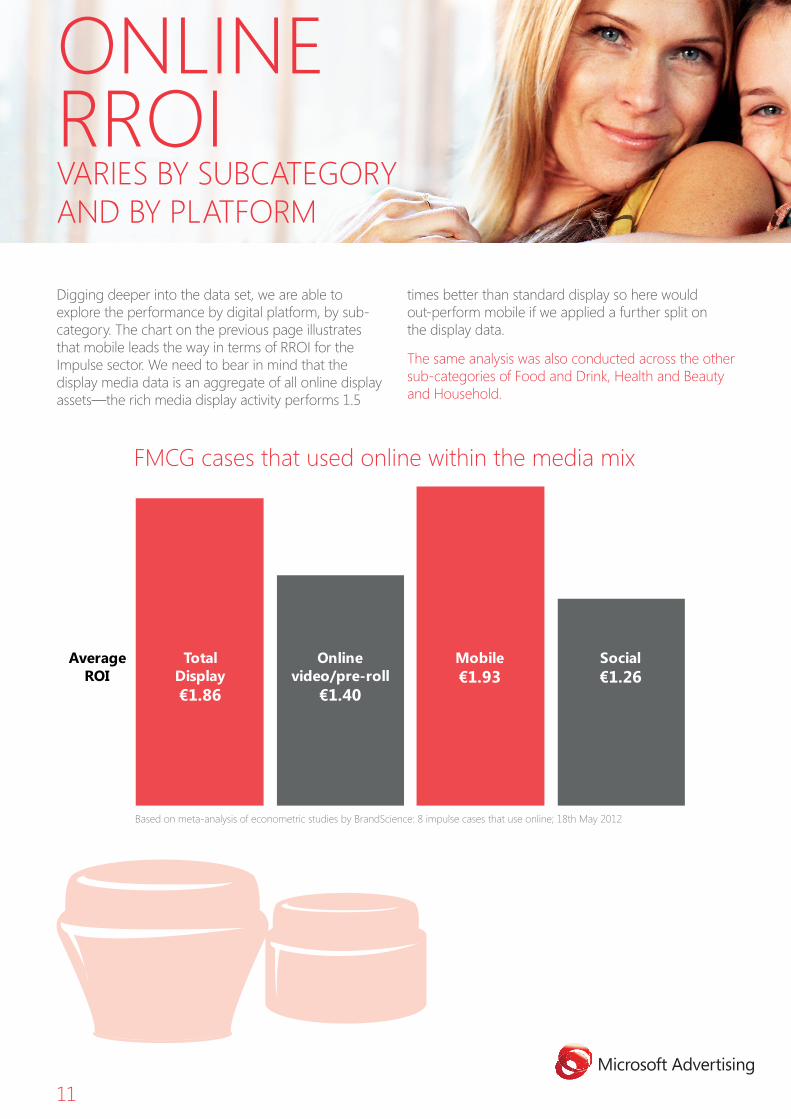
Digging deeper into the data set, we are able to explore the performance by digital platform, by sub-category. The chart on the previous page illustrates that mobile leads the way in terms of RROI for the Impulse sector. We need to bear in mind that the display media data is an aggregate of all online display assets—the rich media display activity performs 1.5
times better than standard display so here would out-perform mobile if we applied a further split on the display data.
The same analysis was also conducted across the other sub-categories of Food and Drink, Health and Beauty and Household.
Average ROI
Total Display€1.86
Online video/pre-roll
€1.40
Social€1.26
Mobile€1.93
Based on meta-analysis of econometric studies by BrandScience: 8 impulse cases that use online; 18th May 2012
ONLINE RROI VARIES BY SUBCATEGORY AND BY PLATFORM
FMCG cases that used online within the media mix
11
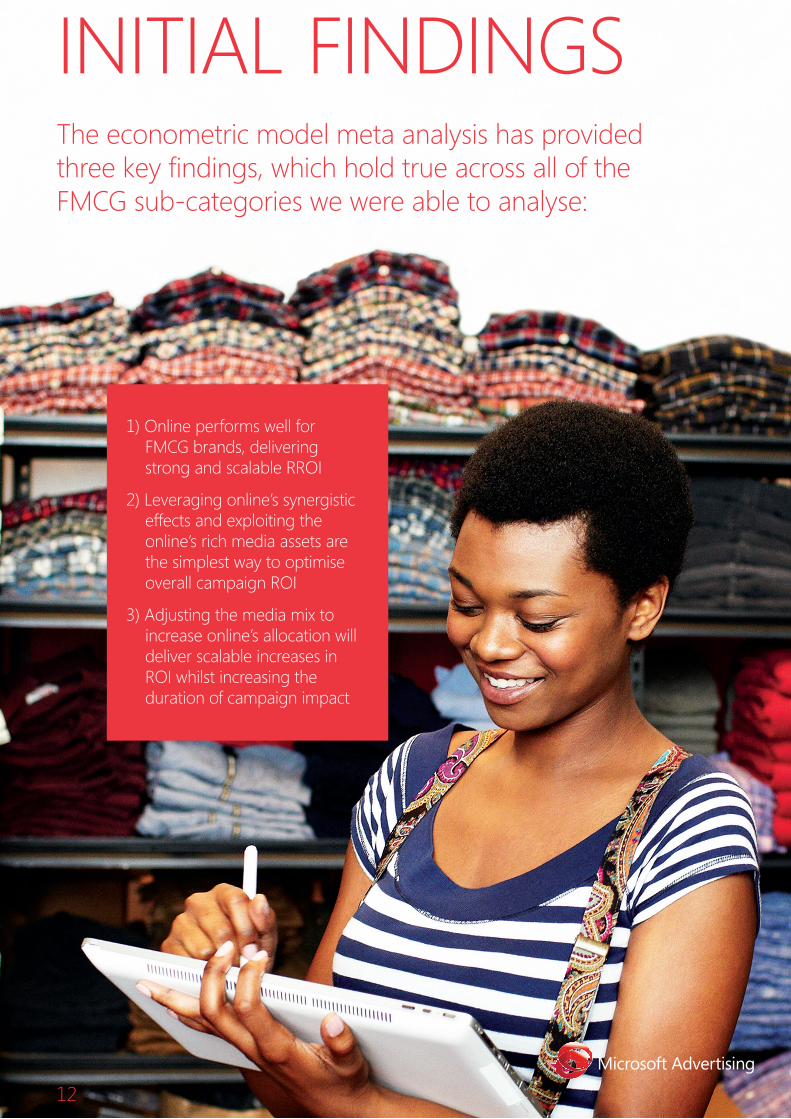
INITIAL FINDINGSThe econometric model meta analysis has provided three key findings, which hold true across all of the FMCG sub-categories we were able to analyse:
1) Online performs well for FMCG brands, delivering strong and scalable RROI
2) Leveraging online’s synergistic effects and exploiting the online’s rich media assets are the simplest way to optimise overall campaign ROI
3) Adjusting the media mix to increase online’s allocation will deliver scalable increases in ROI whilst increasing the duration of campaign impact
12
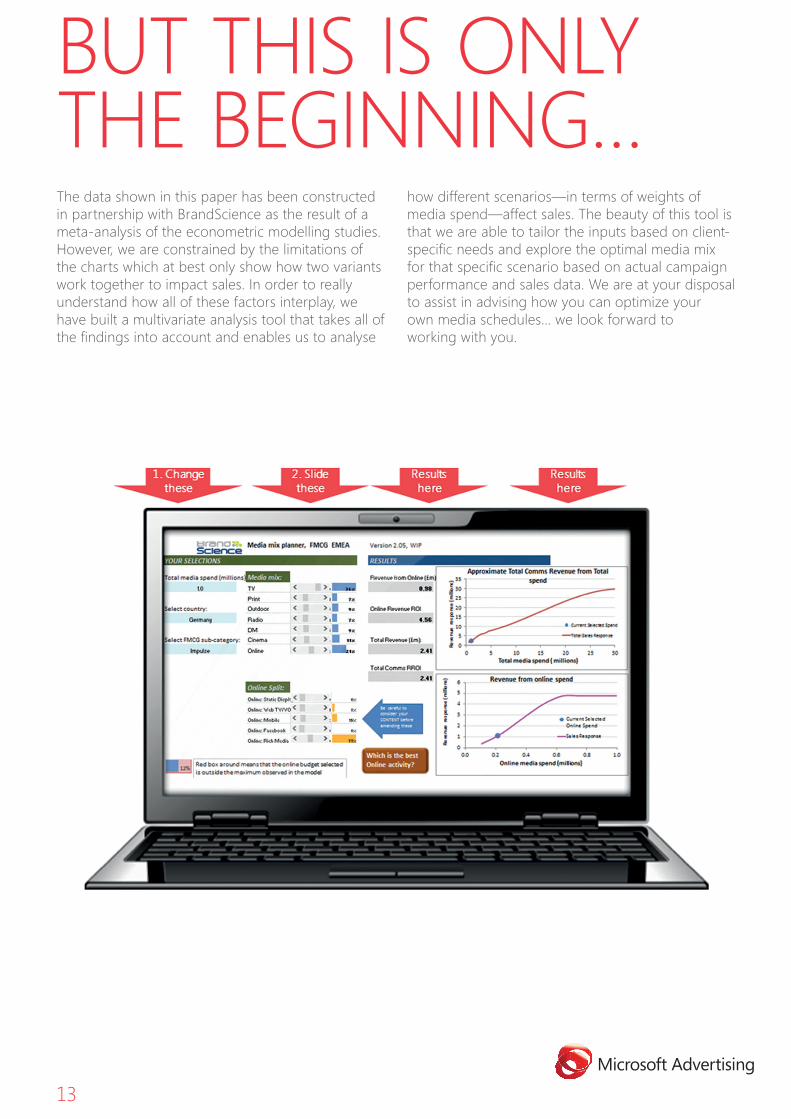
BUT THIS IS ONLY THE BEGINNING…The data shown in this paper has been constructed in partnership with BrandScience as the result of a meta-analysis of the econometric modelling studies. However, we are constrained by the limitations of the charts which at best only show how two variants work together to impact sales. In order to really understand how all of these factors interplay, we have built a multivariate analysis tool that takes all of the findings into account and enables us to analyse
how different scenarios—in terms of weights of media spend—affect sales. The beauty of this tool is that we are able to tailor the inputs based on client-specific needs and explore the optimal media mix for that specific scenario based on actual campaign performance and sales data. We are at your disposal to assist in advising how you can optimize your own media schedules… we look forward to working with you.
13

ABOUT MICROSOFT ADVERTISING GLOBAL INSIGHTS
While many tech and media companies conduct market research that describes what consumers are doing, the Microsoft Advertising Global Insights team believes innovation stems from getting at the why. As a result, we go beyond behavior to focus on why consumers do what they do—whether that’s choosing one brand over another, or exhibiting a preference for a specific platform. Our goal is to create more robust, insights-driven narratives that put a human face on our audience, making it easier for customers to tell creative, relevant and connected stories across platforms.
Natasha Hritzuk Senior Director of Global Insights
New York, NY
Anita Caras Head of Global Agency and Accounts Insights
London, England
©2012 Microsoft Corporation. All rights reserved. This document is provided “as-is.” Information and views expressed in this document, including URL and other Internet Web site references, may change without notice. You bear the risk of using it.
Some examples are for illustration only and are fictitious. No real association is intended or inferred.
This document does not provide you with any legal rights to any intellectual property in any Microsoft product. You may copy and use this document for your internal, reference purposes.
14
Related Documents