7 - 1 CHAPTER 7 Stocks and Their Valuation Features of common stock Determining common stock values Efficient markets Preferred stock

Welcome message from author
This document is posted to help you gain knowledge. Please leave a comment to let me know what you think about it! Share it to your friends and learn new things together.
Transcript

7 - 1
CHAPTER 7Stocks and Their Valuation
Features of common stockDetermining common stock
valuesEfficient marketsPreferred stock

7 - 2
Common Stocks represent ownership. Ownership implies control. Stockholders elect board of directors. Directors hire management. Since managers are “agents” of
shareholders, their goal should be: Maximizing stock price.
The management of publicly owned firms can be removed by the stockholders if the management team is not effective.
Legal Rights and Privileges of Common Stockholders: Control of The Firm

7 - 3
The Preemptive Right
It is the right to purchase any additional shares sold by the firm.
The preemptive right enables current stockholders to maintain control and prevents a transfer of wealth from current stockholders to new stockholders.
İf there was no such right, the management of a corporation could issue a large number of additional shares at a low price and purchase these shares itself.
By this way management could seize control of a corporation and steal value from the current stockholders.
7 - 4
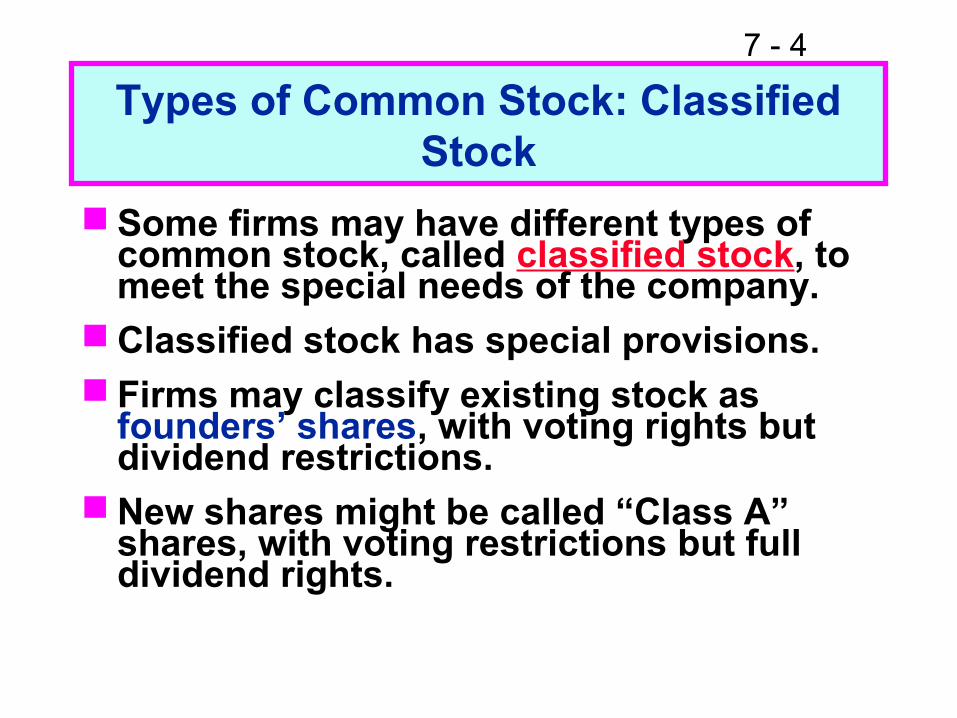
Types of Common Stock: Classified Stock
Some firms may have different types of common stock, called classified stock, to meet the special needs of the company.
Classified stock has special provisions. Firms may classify existing stock as
founders’ shares, with voting rights but dividend restrictions.
New shares might be called “Class A” shares, with voting restrictions but full dividend rights.

7 - 5
The dividends of tracking stock are tied to a particular division, rather than the company as a whole.Investors can separately value the
divisions.It is easier to compensate division
managers with the tracking stock. But tracking stock usually has no
voting rights, and the financial disclosure for the division is not as regulated as for the company.
Types of Common Stock: Tracking Stock

7 - 6
The Market for Common Stock
Small companies are owned by only a few people. Such firms are called privately owned, or closely held, corporations.
If common stocks of a closely held corporation is offered to the public for the first time, such an offer is called initial public offering (IPO).
Whenever additional shares sold to the public by publicly owned corporations, such an issue is called seasoned offer.

7 - 7
Common Stock Valuation
A common stock entitles its owner to dividends, but only if the company has net income, and only if management choses to pay dividends rather than retaining net income and reinvesting.
Common stocks can be sold at some future date, hopefully at a price greater than the purchase price. If the stock is actually sold at a price above its purchase price, the investor will receive a capital gain.

7 - 8
Common Stock Valuation
Common stocks provide an expected future cash flow stream, and a stock’s value is the present value of the expected future cash flow stream.
The expected cash flows consist of two elements: 1) the dividends expected in each year 2) the price investors expect to receive when they sell the stock.
7 - 9
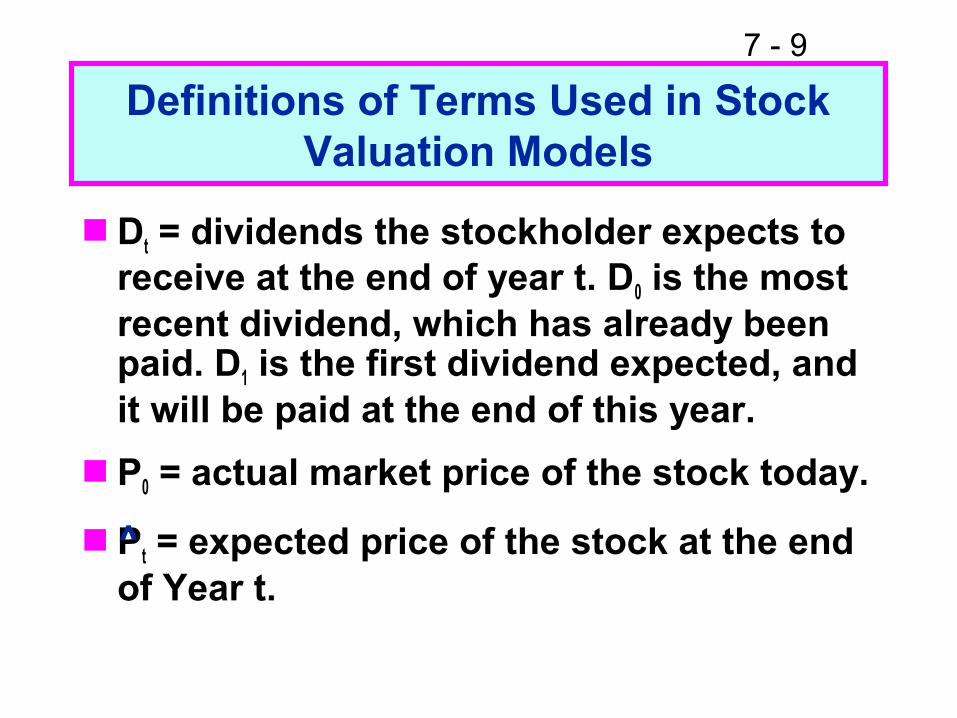
Definitions of Terms Used in Stock Valuation Models
Dt = dividends the stockholder expects to receive at the end of year t. D0 is the most recent dividend, which has already been paid. D1 is the first dividend expected, and it will be paid at the end of this year.
P0 = actual market price of the stock today.
Pt = expected price of the stock at the end of Year t.^

7 - 10
Definitions of Terms Used in Stock Valuation Models
D1 / P0 = expected dividend yield during the coming year.
(P1 - P0) / P0 = expected capital gains yield during the coming year.
g = expected growth rate in dividends. If dividends are expected to grow at a constant rate, g is also equal to the expected rate of growth in earnings and in the stock’s price.
^

7 - 11
Definitions of Terms Used in Stock Valuation Models
rs = required rate of return on the stock.
rs = expected rate of return that an investor who buys the stock expects to receive in the future.
rs = actual, or realized, rate of return.
^
-

7 - 12
( ) ( ) ( ) ( ) ∞∞
+++
++
++
+=
ssss r
D
r
D
r
D
r
DP
1. . .
111ˆ
33
22
11
0
Stock Value = PV of Dividends

7 - 13
Constant Growth Stock
In many cases the stream of dividends is expected to grow at a constant rate, g.
If this is the case, above equation transforms to following equation:
( )gr
D
gr
gDP
ss −=
−+= 10
0
1ˆ

7 - 14
Constant Growth Model, or Gordon Model
Above equation is called constant growth model, or the Gordon Model.
A necessary condition for the validity of the equation is that rs be greater than g.

7 - 15
For a constant growth stock,
( )( )
( ) tt gDD
gDD
gDD
+=
+=
+=
1
1
1
0
202
101
( )gr
D
gr
gDP
ss −=
−+= 10
0
1ˆ
If g is constant, then:

7 - 16
( )D D gtt= +0 1
( ) tt
tr
DPVD
+=
1
P PVDt0 = ∑
$
0.25
Years (t)0

7 - 17
What happens if g > rs?
If rs< g, get negative stock price, which is nonsense.
We can’t use model unless (1) g < rs and (2) g is expected to be constant forever. Because g must be a long-term growth rate, it cannot be > rs.
.r requires ˆs
10 g
gr
DP
s
>−
=

7 - 18
D0 was $2.00 and g is a constant 6%. Find the expected dividends for the
next 3 years, and their PVs. rs = 13%.
0 1
2.2472
2
2.3820
3g=6% 4
1.87611.75991.6508
D0=2.0013%
2.12

7 - 19
What’s the stock’s market value? D0 = 2.00, rs = 13%, g = 6%.
Constant growth model:
( )gr
D
gr
gDP
ss −=
−+= 10
0
1ˆ
= = = $30.29.0.13 - 0.06
$2.12 $2.12
0.07
7 - 20
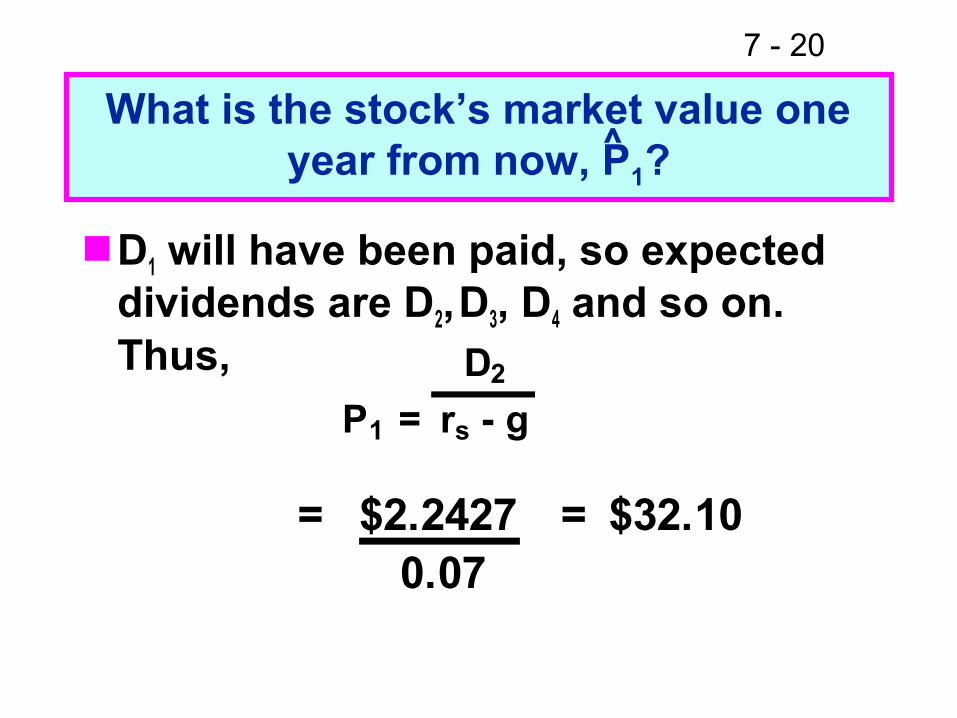
What is the stock’s market value one year from now, P1?
D1 will have been paid, so expected dividends are D2, D3, D4 and so on. Thus,
^
D2
P1 = rs - g
= $2.2427 = $32.100.07

7 - 21
Find the expected dividend yield and capital gains yield during the first year.
Dividend yield = = = 7.0%.$2.12
$30.29
D1
P0
CG Yield = =P1 - P0
^
P0
$32.10 - $30.29
$30.29
= 6.0%.
7 - 22
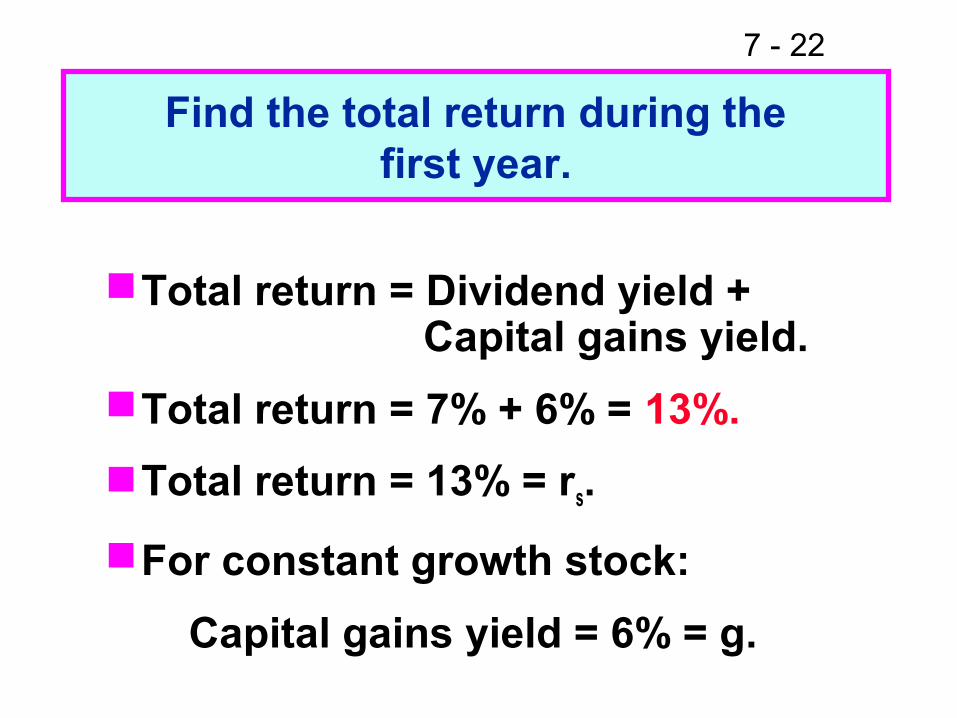
Find the total return during thefirst year.
Total return = Dividend yield + Capital gains yield.
Total return = 7% + 6% = 13%.
Total return = 13% = rs.
For constant growth stock:
Capital gains yield = 6% = g.

7 - 23
Rearrange model to rate of return form:
.r to ˆ0
1s
10 g
P
D
gr
DP
s
+=−
=∧
Then, rs = $2.12/$30.29 + 0.06= 0.07 + 0.06 = 13%.
^

7 - 24
For a constant growth stock, the following conditions must hold:
The dividend is expected to grow forever at a constant rate, g.
The stock price is expected to grow at this same rate.
The expected dividend yield is constant.
The expected capital gains yield is also constant, and it is equal to g.
The expected total rate of return, rs, is equal to the expected dividend yield plus the expected growth rate: rs = dividend yield + g.
^
^
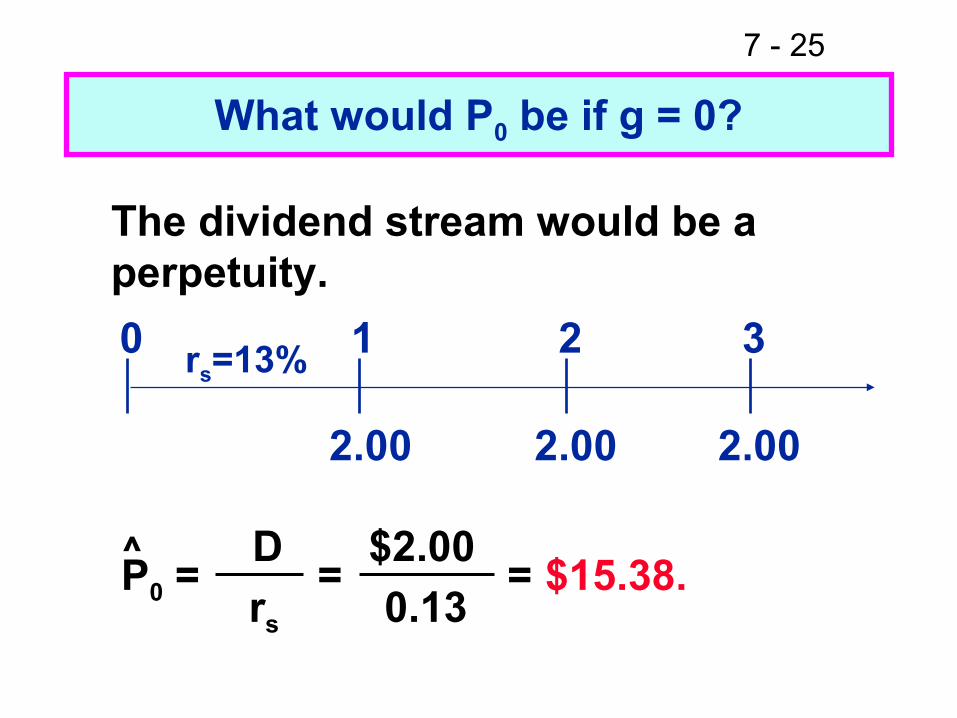
7 - 25
What would P0 be if g = 0?
The dividend stream would be a perpetuity.
2.00 2.002.00
0 1 2 3rs=13%
P0 = = = $15.38. D
rs
$2.00
0.13^

7 - 26
If we have supernormal growth of 30% for 3 years, then a long-run
constant g = 6%, what is P0? rs isstill 13%.
Can no longer use constant growth model.
However, growth becomes constant after 3 years.
^
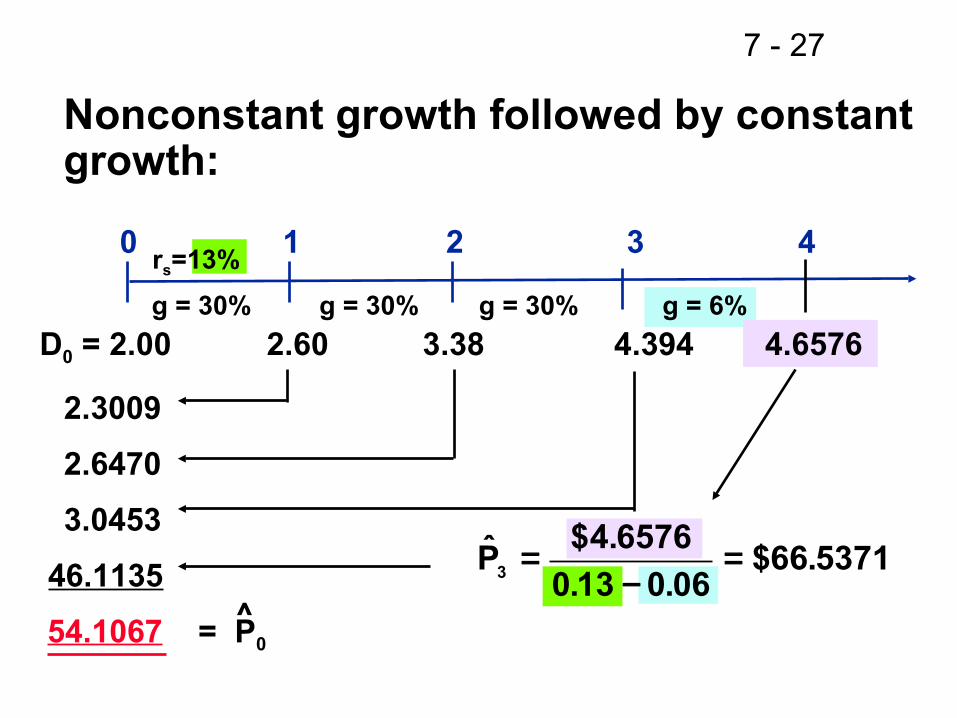
7 - 27
Nonconstant growth followed by constantgrowth:
0
2.3009
2.6470
3.0453
46.1135
1 2 3 4rs=13%
54.1067 = P0
g = 30% g = 30% g = 30% g = 6%
D0 = 2.00 2.60 3.38 4.394 4.6576
^
5371.66$06.013.0
6576.4$P̂3 =
−=

7 - 28
What is the expected dividend yield and capital gains yield at t = 0? At t = 3?
Dividend yield = = = 4.8%.$2.60
$54.11
D1
P0
CG Yield = 13.0% - 4.8% = 8.2%.
At t = 0:
(More…)
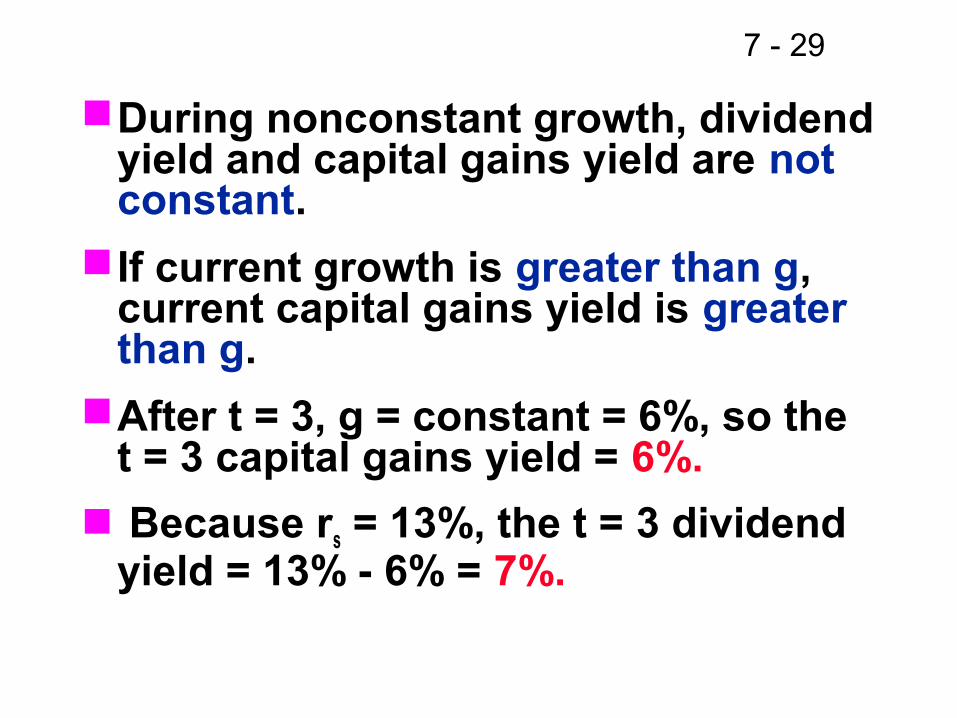
7 - 29
During nonconstant growth, dividend yield and capital gains yield are not constant.
If current growth is greater than g, current capital gains yield is greater than g.
After t = 3, g = constant = 6%, so the t = 3 capital gains yield = 6%.
Because rs = 13%, the t = 3 dividend yield = 13% - 6% = 7%.
7 - 30
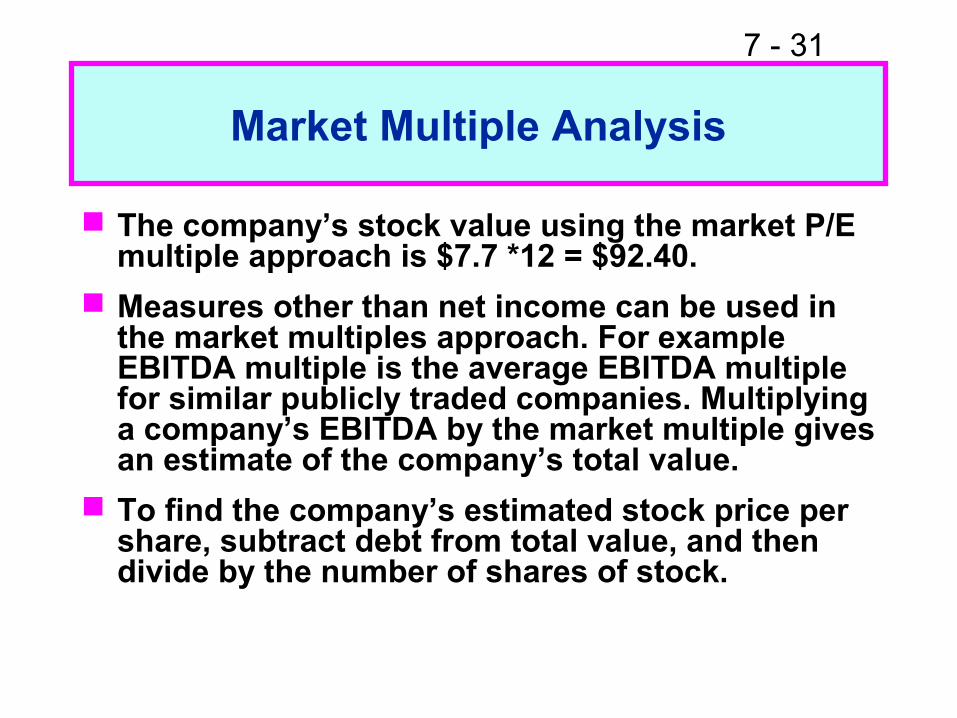
Market Multiple Analysis
Another method of stock valuation is market multiple analysis, which applies a market-determined multiple to net income, earnings per share, sales or book value.
Example:Estimate the average P/E ratio of comparable
firms. This is the P/E multiple.Multiply this average P/E ratio by the expected
earnings of the company to estimate its stock price.
Suppose that a company’s forecasted earnings per share is $7.70. The average price per share to earnings per share (P/E) ratio for similar firms is 12.
7 - 31
Market Multiple Analysis
The company’s stock value using the market P/E multiple approach is $7.7 *12 = $92.40.
Measures other than net income can be used in the market multiples approach. For example EBITDA multiple is the average EBITDA multiple for similar publicly traded companies. Multiplying a company’s EBITDA by the market multiple gives an estimate of the company’s total value.
To find the company’s estimated stock price per share, subtract debt from total value, and then divide by the number of shares of stock.

7 - 32
In some businesses such as cable TV and cellular telehone, an important element in the valuation process is the number of customers a company has.
For example, telephone companies have been paying about $2,000 per customer when acquiring cellular operators in U.S.
Some internet companies have been valued by the number of hits on the site.
Market Multiple Analysis

7 - 33
Stock market equilibrium
Recall that ri, the required rate of return on Stock i, can be found using Security Market Line (SML) equation as you have seen in Chapter 4:
ri = rRF + (RPM)bi.
If rRF is 8%, the RPM is 4%, and Stock i has a beta of 2, then the marginal investor will require the return of 16% on Stock i:
ri = 8% + (4%)2.0 = 16%.

7 - 34
Stock market equilibrium
The marginal investor will want to buy Stock i if its expected rate of return is more than 16%, will want to sell it if the expected rate of return is less than 16%, and will be indifferent if the expected rate of return is 16%.
Now suppose the investor’s portfolio contains Stock i, and he or she analyzes the stock’s prospects and concludes that its earnings, dividends, and price can be expected to grow at a constant rate of 5% per year. The last dividend was D0 = $2.8571, so the next expected dividend is
D1 = $2.8571(1.05) = $3.

7 - 35
Stock market equilibrium
Our marginal investor observes that the present price of the stock, P0, is $30. Should he or she purchase more of Stock i, sell the stock, or maintain the present position? The investor can calculate Stock i’s expected rate of return as follows:
ri = D1/P0 +g = 3/30 + 5% = 15%.
Because the expected rate of return is less than the required return, this marginal investor would want to sell the stock, as would most other holders. Thus, the price would decline, and this decline would continue until the price reached $27.27, at which price the stock would be in equilibrium:
^

7 - 36
Stock market equilibrium
ri = $3/$27.27 + 5% = 11% + 5% = 16% = r.
If the stock initially sold for less than $27.27, say, at $25, events would have been reversed. Investors would have wanted to buy the stock because its expected rate of return would have exceeded its required rate of return, and buy orders would have driven the stock’s price up to $27.27.
In summary, a stock’s expected rate of return must equal its required rate of return: ri = ri.
The actual market price of the stock must be equal to its intrinsic value: P0 = P0.
^
^
^

7 - 37
Why are stock prices volatile?
grD
0P
s1−=
rs = rRF + (RPM)bi could change. Inflation expectations Risk aversion Company risk
g could change.
^

7 - 38
Stock value vs. changes in rs and g
D1 = $2, rs = 10%, and g = 5%:P0 = D1 / (rs-g) = $2 / (0.10 - 0.05) = $40.
What if rs or g change?g g g
rs 4% 5% 6%9% 40.00 50.00 66.67
10% 33.33 40.00 50.0011% 28.57 33.33 40.00
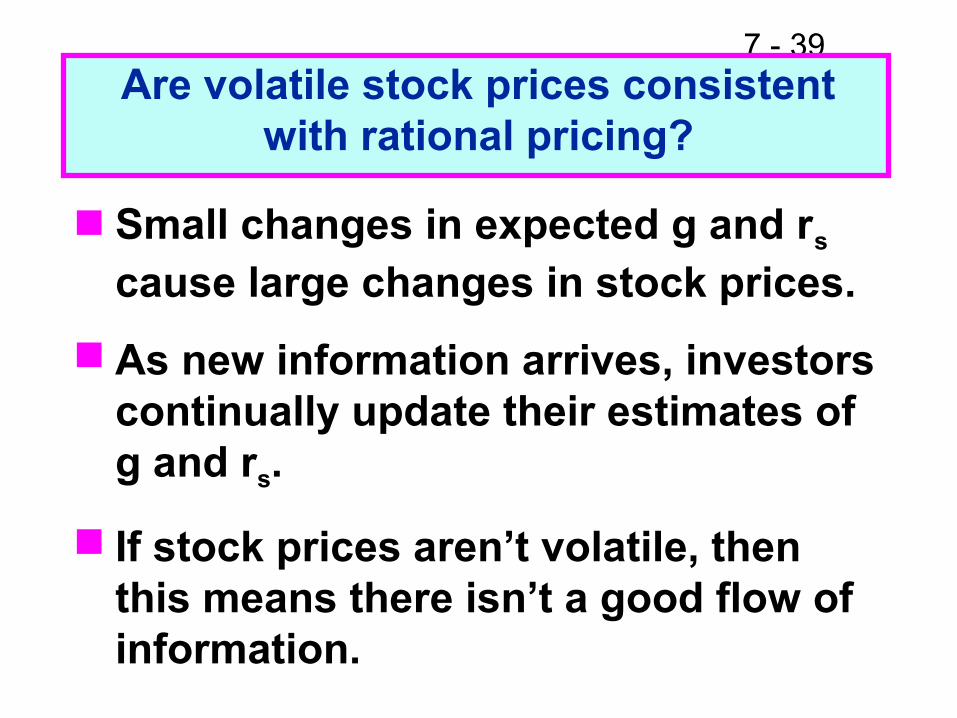
7 - 39Are volatile stock prices consistent
with rational pricing?
Small changes in expected g and rs cause large changes in stock prices.
As new information arrives, investors continually update their estimates of g and rs.
If stock prices aren’t volatile, then this means there isn’t a good flow of information.

7 - 40
What’s the Efficient MarketHypothesis (EMH)?
Securities are normally in equilibrium and are “fairly priced.” One cannot “beat the market” except through good luck or inside information.
(More…)

7 - 41
1. Weak-form EMH: states that all information contained in past price movements is fully reflected in current market prices.
Therefore, investors can’t profit by looking at past trends. A recent decline is no reason to think stocks will go up (or down) in the future. Evidence supports weak-form EMH, but “technical analysis” is still used.

7 - 42
2. Semistrong-form EMH: states that all publicly available information is reflected in current stock prices immediately, so it doesn’t pay to evaluate annual reports looking for undervalued stocks. Largely true.

7 - 43
3. Strong-form EMH: states thatall information, even inside information, is embedded in stock prices. Not true, insiders can gain by trading on the basis of insider information, but that’s illegal.

7 - 44
Markets are generally efficient because:
1. 100,000 or so trained analysts--MBAs, CFAs, and PhDs--work for firms like Fidelity, Merrill Lynch, Morgan Stanley, and Prudential.
2. These analysts have similar access to data and huge amounts of funds to invest.
3. Thus, news is reflected in P0 almost instantaneously.

7 - 45
Preferred Stock
Hybrid security.Similar to bonds in that preferred
stockholders receive a fixed dividend which must be paid before dividends can be paid on common stock.
However, unlike bonds, preferred stock dividends can be omitted without fear of pushing the firm into bankruptcy.
7 - 46
What’s the expected return on preferred stock with Vps = $50 and
annual dividend = $5?
%.0.1010.050$
5$
5$50$
===
==
∧
∧
ps
ps
ps
r
rV

7 - 47
Effective Rate of Return for Preferred Stock Dividends
Most preferred stocks pay dividends quarterly. If the firm in the above example paid $1.25 preferred dividends at the end of each quarter, we could find the effective rate of return on its preferred stock as follows:
EFF% = EAR = (1 + rNom/m)m – 1
= (1 + 0,10/4)4 – 1 = 10.38%.
Related Documents