Chapter 16 - Chapter 16 - Planning the Planning the Firm’s Financing Mix Firm’s Financing Mix 2005, Pearson Prentice Hal

Welcome message from author
This document is posted to help you gain knowledge. Please leave a comment to let me know what you think about it! Share it to your friends and learn new things together.
Transcript

Chapter 16 -Chapter 16 - Planning the Firm’s Planning the Firm’s Financing MixFinancing Mix
2005, Pearson Prentice Hall
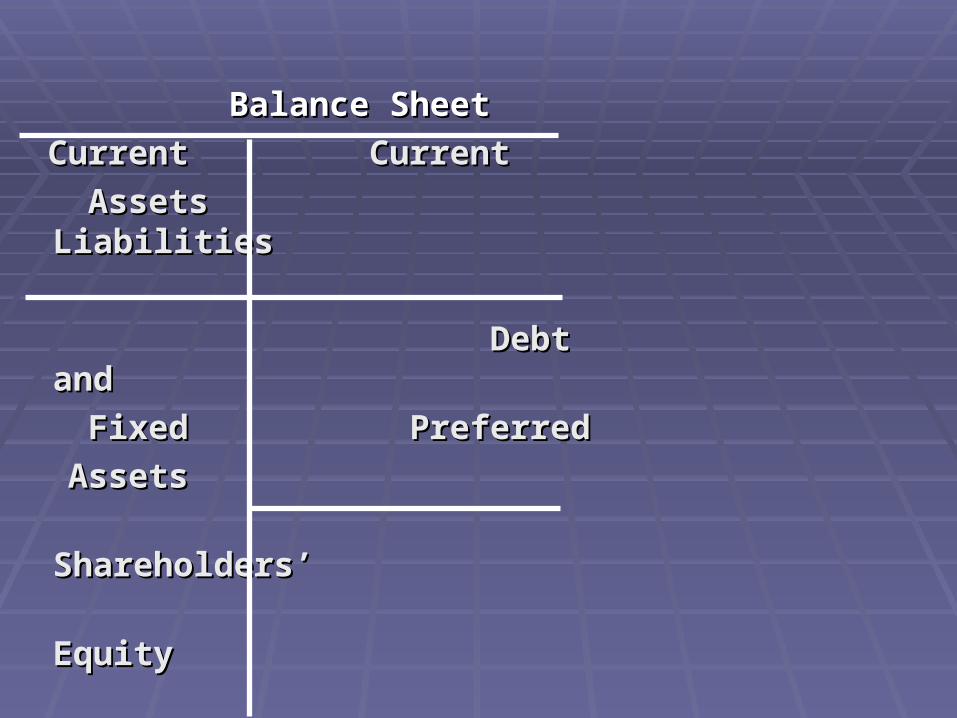
Balance SheetBalance Sheet
Current Current Current Current
Assets LiabilitiesAssets Liabilities
Debt and Debt and
Fixed PreferredFixed Preferred
AssetsAssets
Shareholders’Shareholders’
EquityEquity

Balance SheetBalance Sheet
Current Current Current Current
Assets LiabilitiesAssets Liabilities
Debt and Debt and
Fixed PreferredFixed Preferred
AssetsAssets
Shareholders’Shareholders’
EquityEquity
Balance SheetBalance Sheet
Current Current CurrentCurrent
AssetsAssets LiabilitiesLiabilities
Debt andDebt and
FixedFixed PreferredPreferred
AssetsAssets
Shareholders’Shareholders’
EquityEquity
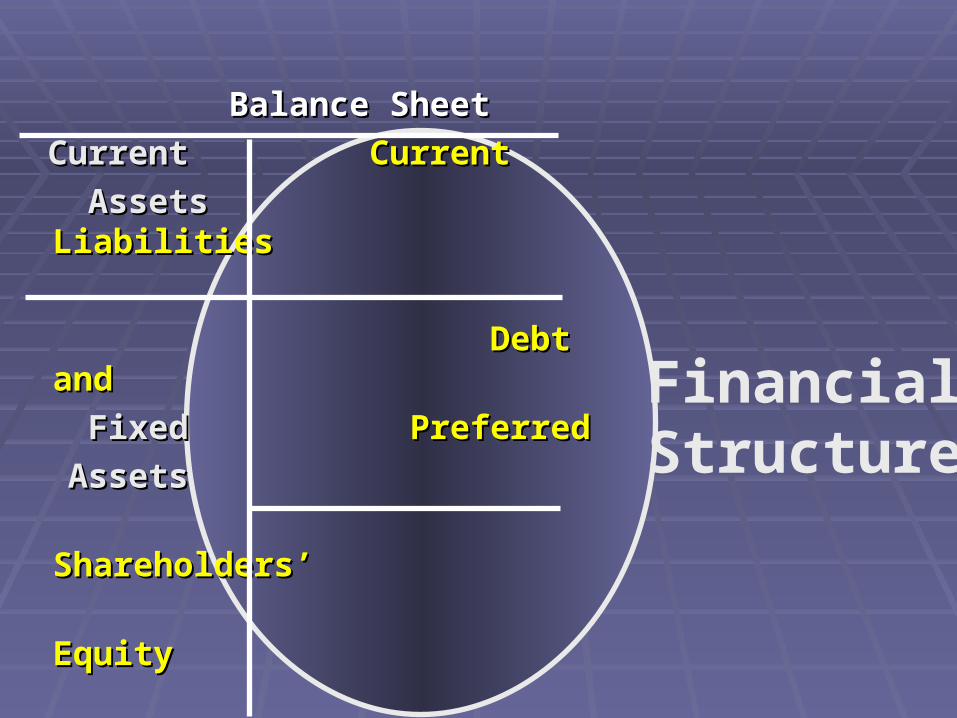
FinancialStructure

Balance SheetBalance Sheet
Current Current Current Current
Assets LiabilitiesAssets Liabilities
Debt and Debt and
Fixed PreferredFixed Preferred
AssetsAssets
Shareholders’Shareholders’
EquityEquity
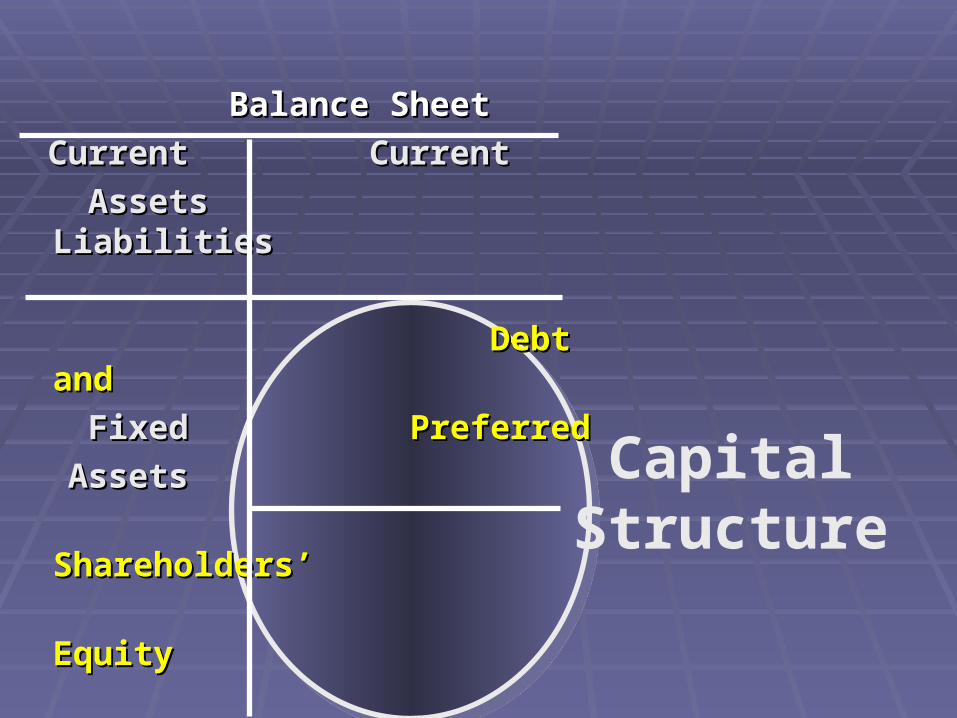
Balance SheetBalance Sheet
Current Current Current Current
Assets LiabilitiesAssets Liabilities
DebtDebt andand
Fixed Fixed PreferredPreferred
AssetsAssets
Shareholders’Shareholders’
EquityEquity
CapitalStructure
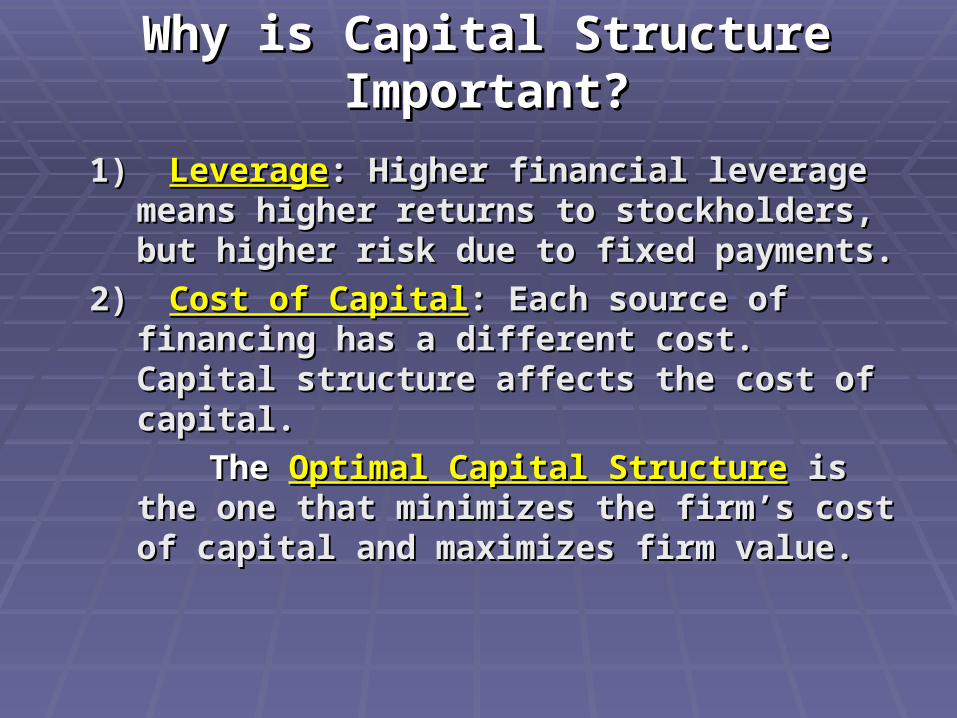
Why is Capital Structure Important?Why is Capital Structure Important?
1) 1) LeverageLeverage: Higher financial leverage : Higher financial leverage means higher returns to stockholders, means higher returns to stockholders, but higher risk due to fixed payments.but higher risk due to fixed payments.
2) 2) Cost of CapitalCost of Capital: Each source of : Each source of financing has a different cost. Capital financing has a different cost. Capital structure affects the cost of capital.structure affects the cost of capital.
TheThe Optimal Capital StructureOptimal Capital Structure is the is the one that minimizes the firm’s cost of one that minimizes the firm’s cost of capital and maximizes firm value.capital and maximizes firm value.
What is the Optimal Capital What is the Optimal Capital Structure?Structure?
In a “perfect world” environment with In a “perfect world” environment with no taxes, no transaction costs and no taxes, no transaction costs and perfectly efficient financial markets, perfectly efficient financial markets, capital structure does not matter.capital structure does not matter.
This is known as the This is known as the Independence Independence hypothesishypothesis: : firm value is independent of firm value is independent of capital structurecapital structure..
Independence HypothesisIndependence Hypothesis
Firm value does not depend on Firm value does not depend on capital structure.capital structure.
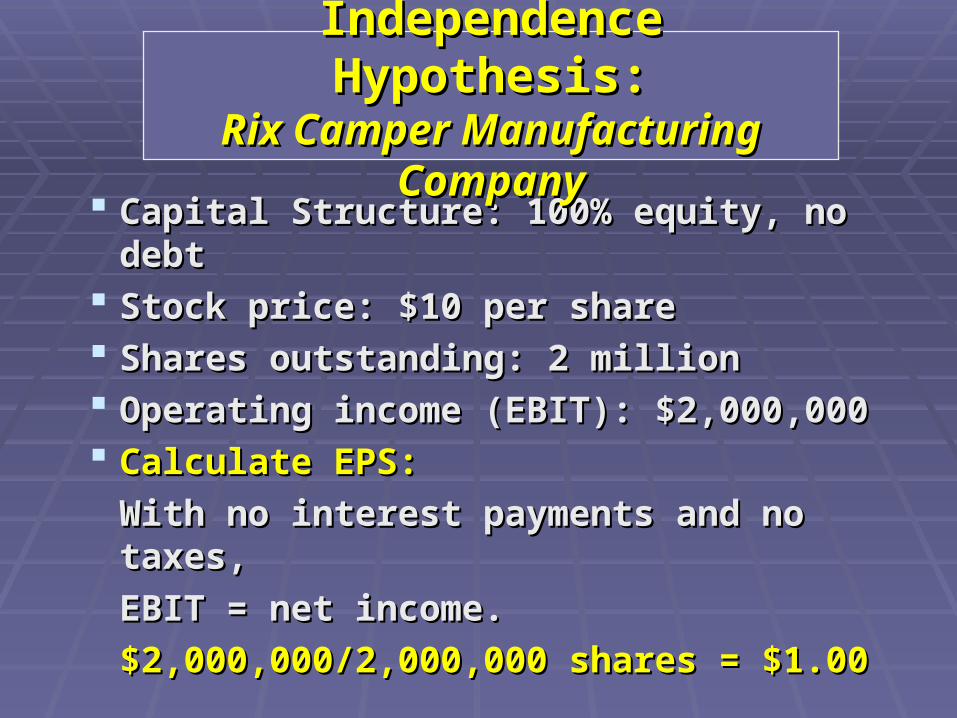
Capital Structure: 100% equity, no debtCapital Structure: 100% equity, no debt Stock price: $10 per shareStock price: $10 per share Shares outstanding: 2 millionShares outstanding: 2 million Operating income (EBIT): $2,000,000Operating income (EBIT): $2,000,000 Calculate EPS:Calculate EPS:
With no interest payments and no taxes, With no interest payments and no taxes,
EBIT = net income.EBIT = net income.
$2,000,000/2,000,000 shares = $1.00$2,000,000/2,000,000 shares = $1.00
Independence Hypothesis:Independence Hypothesis:Rix Camper Manufacturing CompanyRix Camper Manufacturing Company
Capital Structure: 100% equity, no debtCapital Structure: 100% equity, no debt Stock price: $10 per shareStock price: $10 per share Shares outstanding: 2 millionShares outstanding: 2 million Operating income (EBIT): $2,000,000Operating income (EBIT): $2,000,000
Independence Hypothesis:Independence Hypothesis:Rix Camper Manufacturing CompanyRix Camper Manufacturing Company

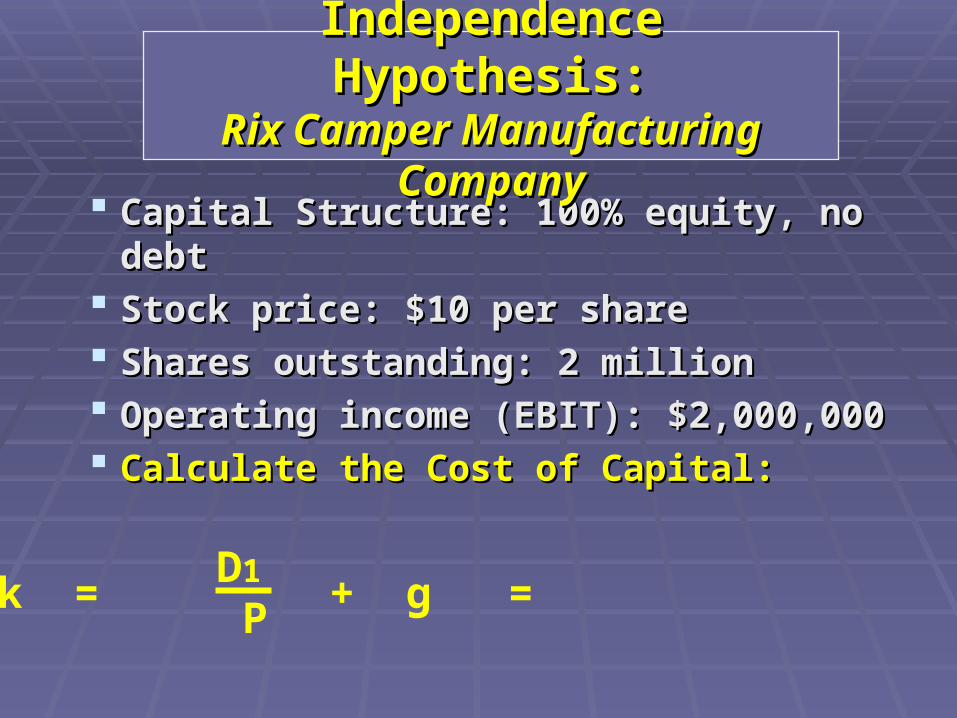
Capital Structure: 100% equity, no debtCapital Structure: 100% equity, no debt Stock price: $10 per shareStock price: $10 per share Shares outstanding: 2 millionShares outstanding: 2 million Operating income (EBIT): $2,000,000Operating income (EBIT): $2,000,000 Calculate the Cost of Capital:Calculate the Cost of Capital:
Independence Hypothesis:Independence Hypothesis:Rix Camper Manufacturing CompanyRix Camper Manufacturing Company
k = + g =D1
P
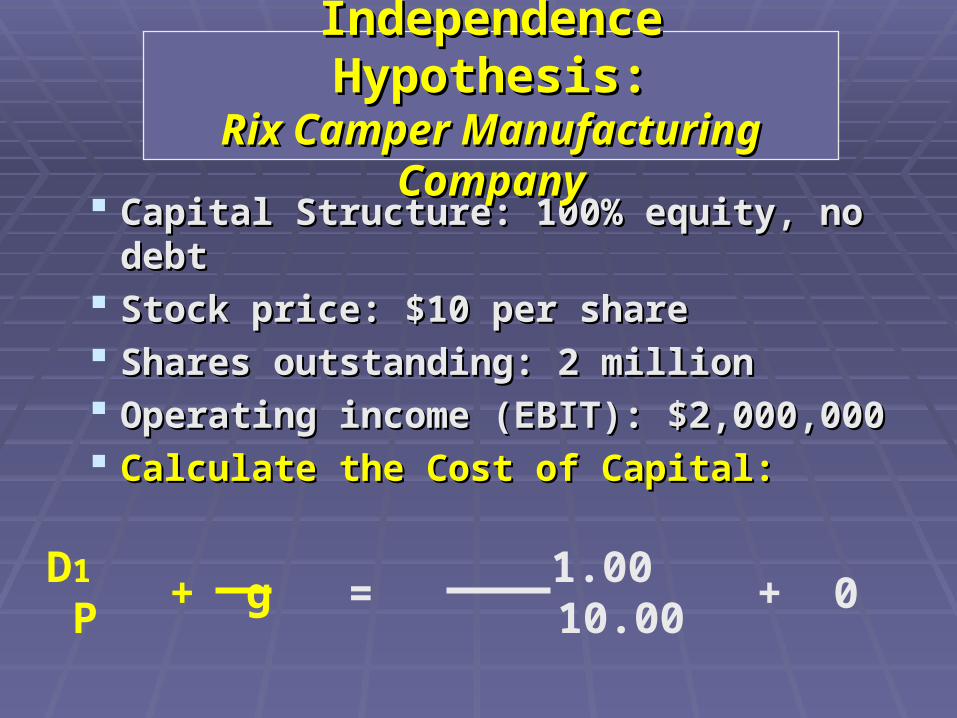
Capital Structure: 100% equity, no debtCapital Structure: 100% equity, no debt Stock price: $10 per shareStock price: $10 per share Shares outstanding: 2 millionShares outstanding: 2 million Operating income (EBIT): $2,000,000Operating income (EBIT): $2,000,000 Calculate the Cost of Capital:Calculate the Cost of Capital:
Independence Hypothesis:Independence Hypothesis:Rix Camper Manufacturing CompanyRix Camper Manufacturing Company
k = + g = + 0 =D1 1.00 P 10.00
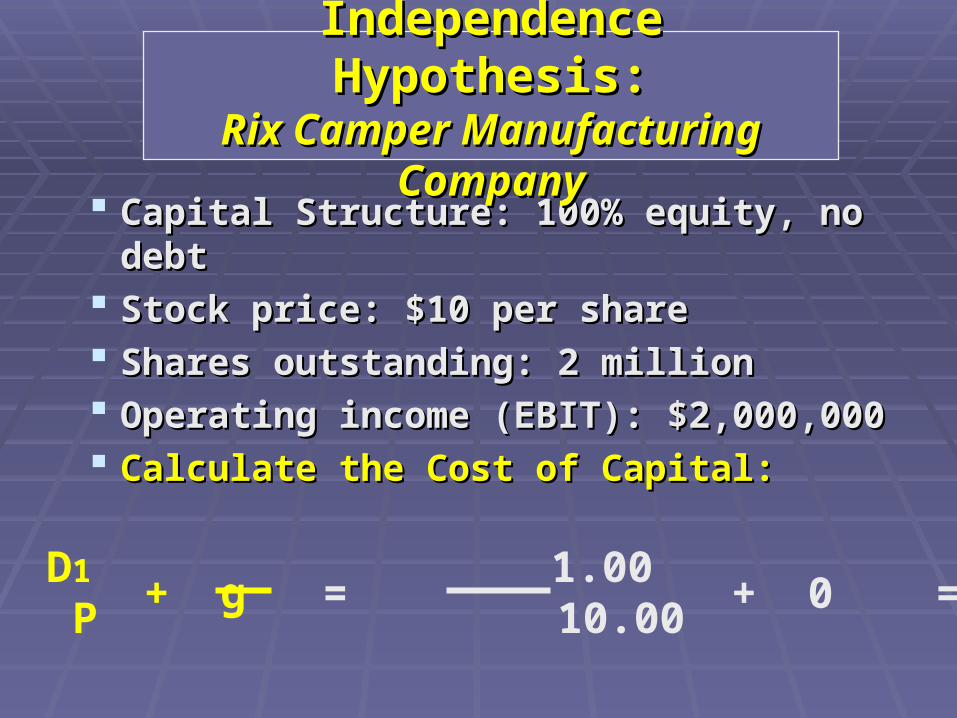
Capital Structure: 100% equity, no debtCapital Structure: 100% equity, no debt Stock price: $10 per shareStock price: $10 per share Shares outstanding: 2 millionShares outstanding: 2 million Operating income (EBIT): $2,000,000Operating income (EBIT): $2,000,000 Calculate the Cost of Capital:Calculate the Cost of Capital:
Independence Hypothesis:Independence Hypothesis:Rix Camper Manufacturing CompanyRix Camper Manufacturing Company
k = + g = + 0 = 10%D1 1.00 P 10.00
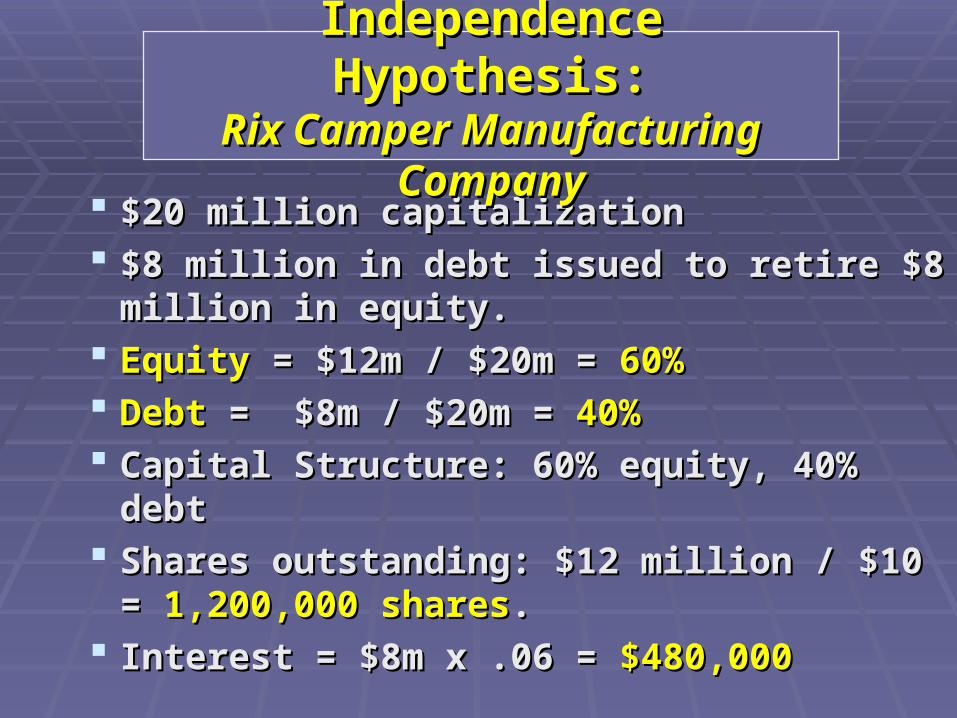
$20 million capitalization$20 million capitalization $8 million in debt issued to retire $8 million in $8 million in debt issued to retire $8 million in
equity.equity. EquityEquity = $12m / $20m = = $12m / $20m = 60%60% Debt Debt = $8m / $20m = = $8m / $20m = 40%40% Capital Structure: 60% equity, 40% debtCapital Structure: 60% equity, 40% debt Shares outstanding: $12 million / $10 = Shares outstanding: $12 million / $10 =
1,200,000 shares1,200,000 shares.. Interest = $8m x .06 = Interest = $8m x .06 = $480,000$480,000
Independence Hypothesis:Independence Hypothesis:Rix Camper Manufacturing CompanyRix Camper Manufacturing Company

Capital Structure: 60% equity, 40% debtCapital Structure: 60% equity, 40% debt Stock price: $10 per shareStock price: $10 per share Shares outstanding: 1.2 millionShares outstanding: 1.2 million Net income: $2,000,000 - $480,000 = $1,520,000Net income: $2,000,000 - $480,000 = $1,520,000 Calculate EPS:Calculate EPS:
$1,520,000/1,200,000 shares = $1.267$1,520,000/1,200,000 shares = $1.267
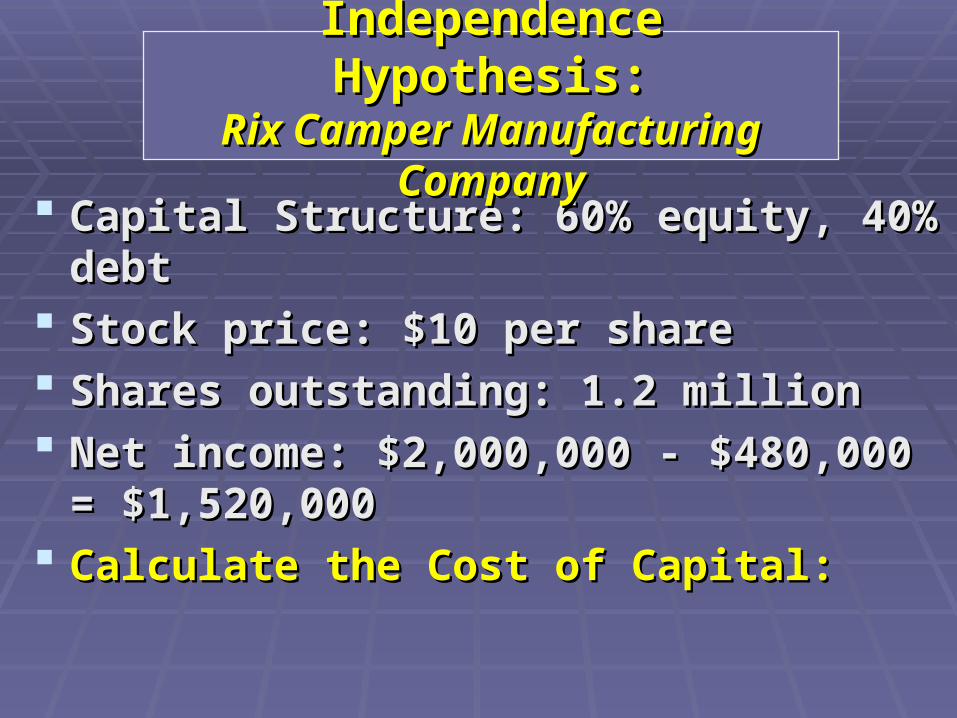
Independence Hypothesis:Independence Hypothesis:Rix Camper Manufacturing CompanyRix Camper Manufacturing Company

Capital Structure: 60% equity, 40% debtCapital Structure: 60% equity, 40% debt Stock price: $10 per shareStock price: $10 per share Shares outstanding: 1.2 millionShares outstanding: 1.2 million Net income: $2,000,000 - $480,000 = $1,520,000Net income: $2,000,000 - $480,000 = $1,520,000
Independence Hypothesis:Independence Hypothesis:Rix Camper Manufacturing CompanyRix Camper Manufacturing Company

Capital Structure: 60% equity, 40% debtCapital Structure: 60% equity, 40% debt Stock price: $10 per shareStock price: $10 per share Shares outstanding: 1.2 millionShares outstanding: 1.2 million Net income: $2,000,000 - $480,000 = $1,520,000Net income: $2,000,000 - $480,000 = $1,520,000 Calculate the Cost of Equity:Calculate the Cost of Equity:
Independence Hypothesis:Independence Hypothesis:Rix Camper Manufacturing CompanyRix Camper Manufacturing Company
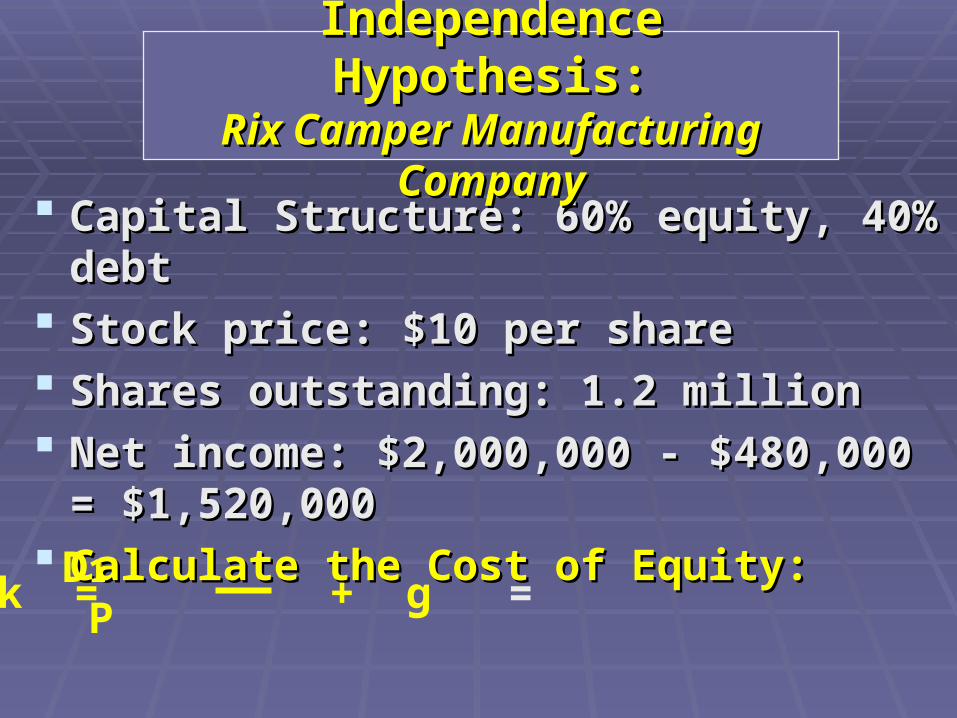
Capital Structure: 60% equity, 40% debtCapital Structure: 60% equity, 40% debt Stock price: $10 per shareStock price: $10 per share Shares outstanding: 1.2 millionShares outstanding: 1.2 million Net income: $2,000,000 - $480,000 = $1,520,000Net income: $2,000,000 - $480,000 = $1,520,000 Calculate the Cost of Equity:Calculate the Cost of Equity:
Independence Hypothesis:Independence Hypothesis:Rix Camper Manufacturing CompanyRix Camper Manufacturing Company
k = + g =D1 P
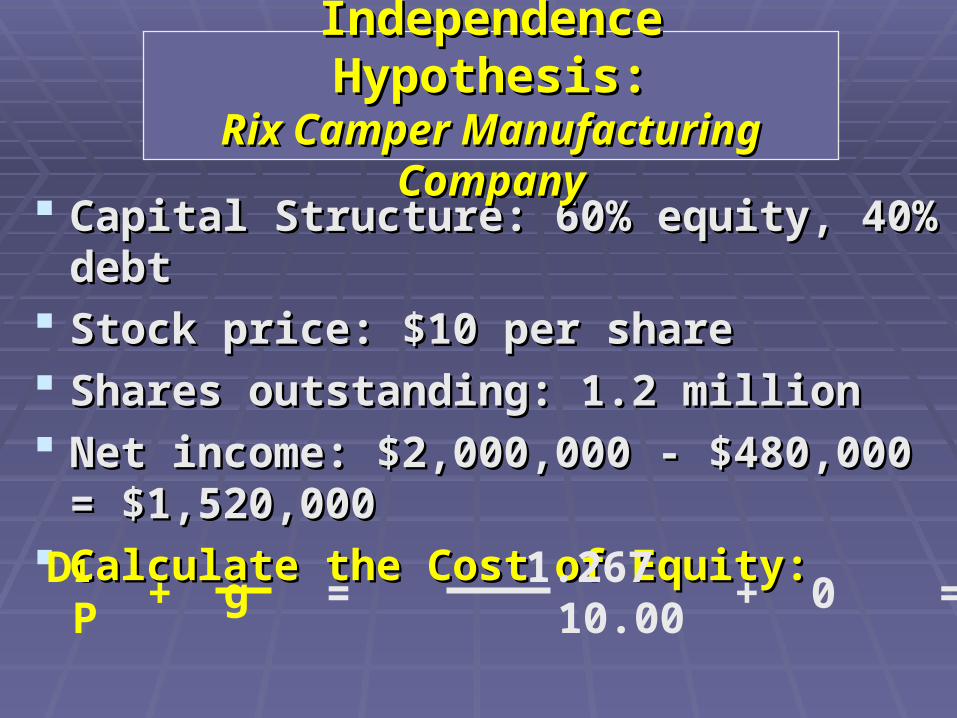
Capital Structure: 60% equity, 40% debtCapital Structure: 60% equity, 40% debt Stock price: $10 per shareStock price: $10 per share Shares outstanding: 1.2 millionShares outstanding: 1.2 million Net income: $2,000,000 - $480,000 = $1,520,000Net income: $2,000,000 - $480,000 = $1,520,000 Calculate the Cost of Equity:Calculate the Cost of Equity:
Independence Hypothesis:Independence Hypothesis:Rix Camper Manufacturing CompanyRix Camper Manufacturing Company
k = + g = + 0 = D1 1.267 P 10.00
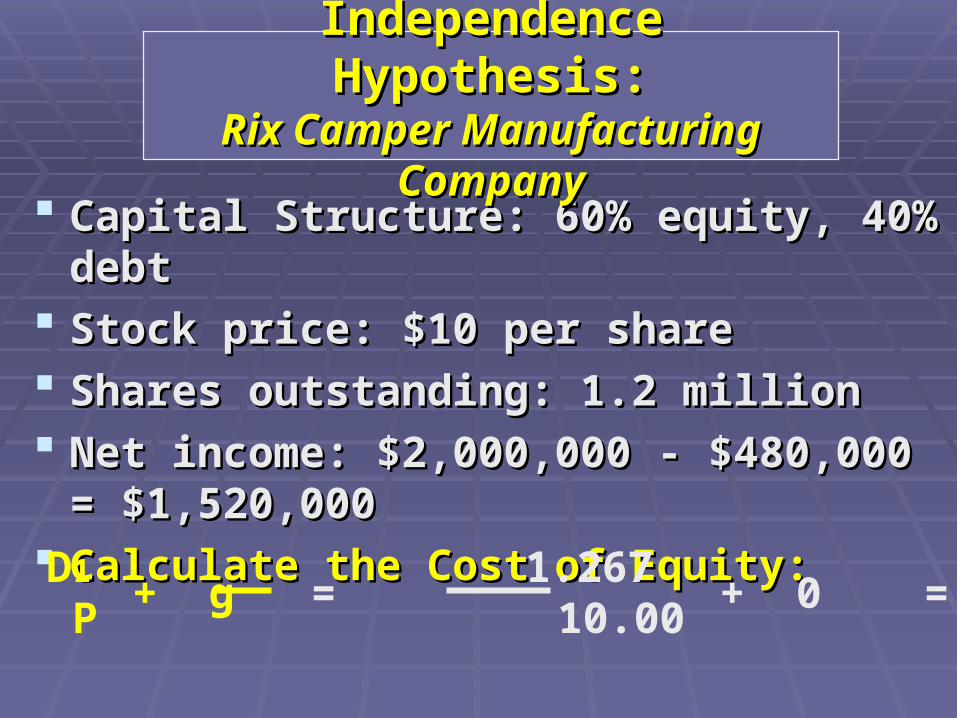
Capital Structure: 60% equity, 40% debtCapital Structure: 60% equity, 40% debt Stock price: $10 per shareStock price: $10 per share Shares outstanding: 1.2 millionShares outstanding: 1.2 million Net income: $2,000,000 - $480,000 = $1,520,000Net income: $2,000,000 - $480,000 = $1,520,000 Calculate the Cost of Equity:Calculate the Cost of Equity:
Independence Hypothesis:Independence Hypothesis:Rix Camper Manufacturing CompanyRix Camper Manufacturing Company
k = + g = + 0 = 12.67%D1 1.267 P 10.00
Capital Structure: 60% equity, 40% debtCapital Structure: 60% equity, 40% debt Stock price: $10 per shareStock price: $10 per share Shares outstanding: 1.2 millionShares outstanding: 1.2 million Net income: $2,000,000 - $480,000 = $1,520,000Net income: $2,000,000 - $480,000 = $1,520,000
Independence Hypothesis:Independence Hypothesis:Rix Camper Manufacturing CompanyRix Camper Manufacturing Company
Capital Structure: 60% equity, 40% debtCapital Structure: 60% equity, 40% debt Stock price: $10 per shareStock price: $10 per share Shares outstanding: 1.2 millionShares outstanding: 1.2 million Net income: $2,000,000 - $480,000 = $1,520,000Net income: $2,000,000 - $480,000 = $1,520,000 Calculate the Cost of Capital:Calculate the Cost of Capital:
Independence Hypothesis:Independence Hypothesis:Rix Camper Manufacturing CompanyRix Camper Manufacturing Company

Capital Structure: 60% equity, 40% debtCapital Structure: 60% equity, 40% debt Stock price: $10 per shareStock price: $10 per share Shares outstanding: 1.2 millionShares outstanding: 1.2 million Net income: $2,000,000 - $480,000 = $1,520,000Net income: $2,000,000 - $480,000 = $1,520,000 Calculate the Cost of Capital:Calculate the Cost of Capital:
.6 (12.67%).6 (12.67%)
Independence Hypothesis:Independence Hypothesis:Rix Camper Manufacturing CompanyRix Camper Manufacturing Company

Capital Structure: 60% equity, 40% debtCapital Structure: 60% equity, 40% debt Stock price: $10 per shareStock price: $10 per share Shares outstanding: 1.2 millionShares outstanding: 1.2 million Net income: $2,000,000 - $480,000 = $1,520,000Net income: $2,000,000 - $480,000 = $1,520,000 Calculate the Cost of Capital:Calculate the Cost of Capital:
.6 (12.67%) +.6 (12.67%) +
Independence Hypothesis:Independence Hypothesis:Rix Camper Manufacturing CompanyRix Camper Manufacturing Company
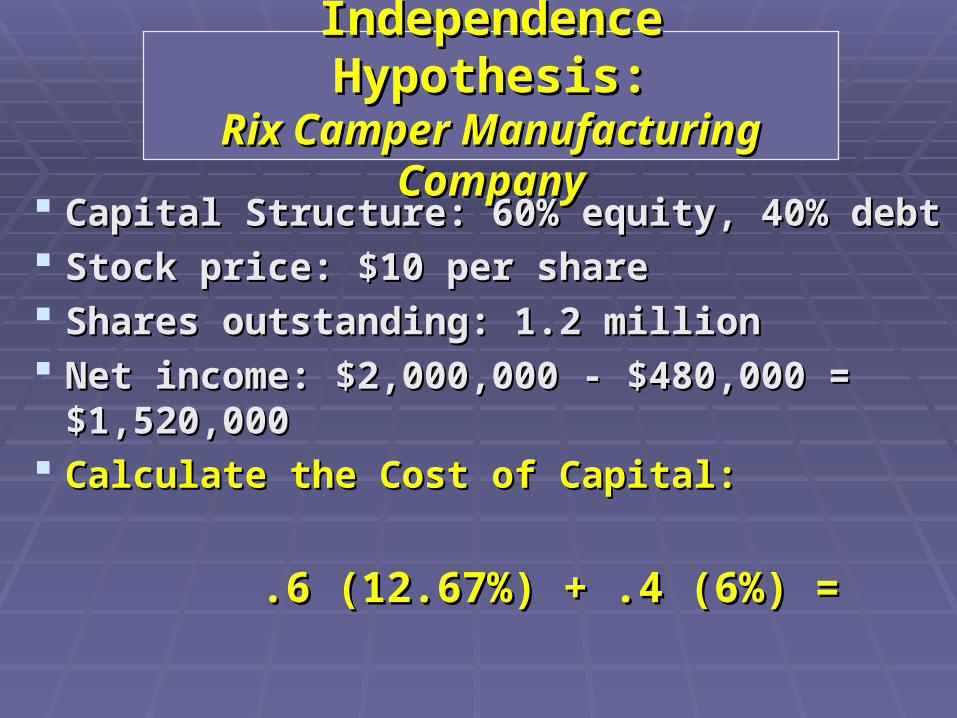
Capital Structure: 60% equity, 40% debtCapital Structure: 60% equity, 40% debt Stock price: $10 per shareStock price: $10 per share Shares outstanding: 1.2 millionShares outstanding: 1.2 million Net income: $2,000,000 - $480,000 = $1,520,000Net income: $2,000,000 - $480,000 = $1,520,000 Calculate the Cost of Capital:Calculate the Cost of Capital:
.6 (12.67%) + .4 (6%) =.6 (12.67%) + .4 (6%) =
Independence Hypothesis:Independence Hypothesis:Rix Camper Manufacturing CompanyRix Camper Manufacturing Company

Capital Structure: 60% equity, 40% debtCapital Structure: 60% equity, 40% debt Stock price: $10 per shareStock price: $10 per share Shares outstanding: 1.2 millionShares outstanding: 1.2 million Net income: $2,000,000 - $480,000 = $1,520,000Net income: $2,000,000 - $480,000 = $1,520,000 Calculate the Cost of Capital:Calculate the Cost of Capital:
.6 (12.67%) + .4 (6%) = 10%.6 (12.67%) + .4 (6%) = 10%
Independence Hypothesis:Independence Hypothesis:Rix Camper Manufacturing CompanyRix Camper Manufacturing Company
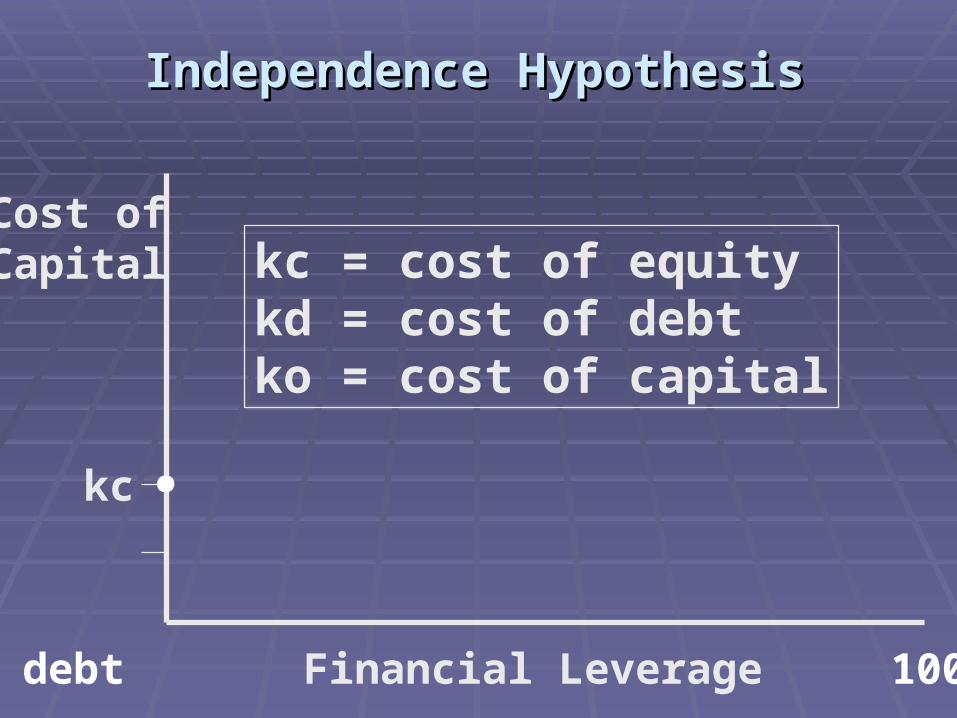
Cost ofCapital
kc
0% debt Financial Leverage 100% debt
.
kc = cost of equitykd = cost of debtko = cost of capital
Independence HypothesisIndependence Hypothesis

.
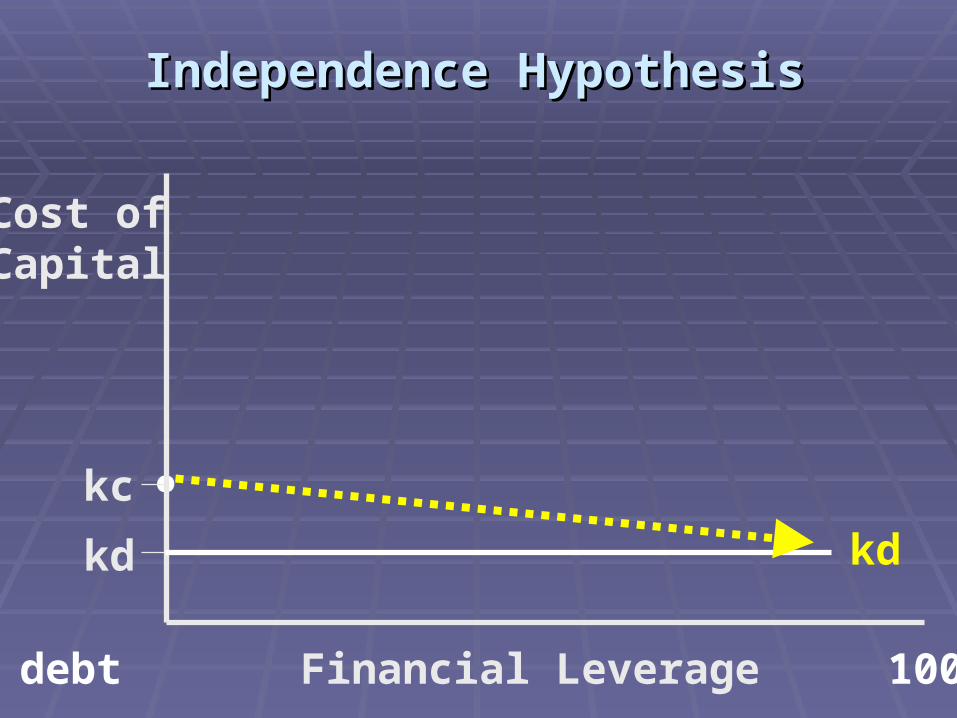
Independence HypothesisIndependence Hypothesis
Cost ofCapital
kc
kd kd
0% debt Financial Leverage 100% debt
.
Independence HypothesisIndependence Hypothesis
Cost ofCapital
kc
kd kd
0% debt Financial Leverage 100% debt
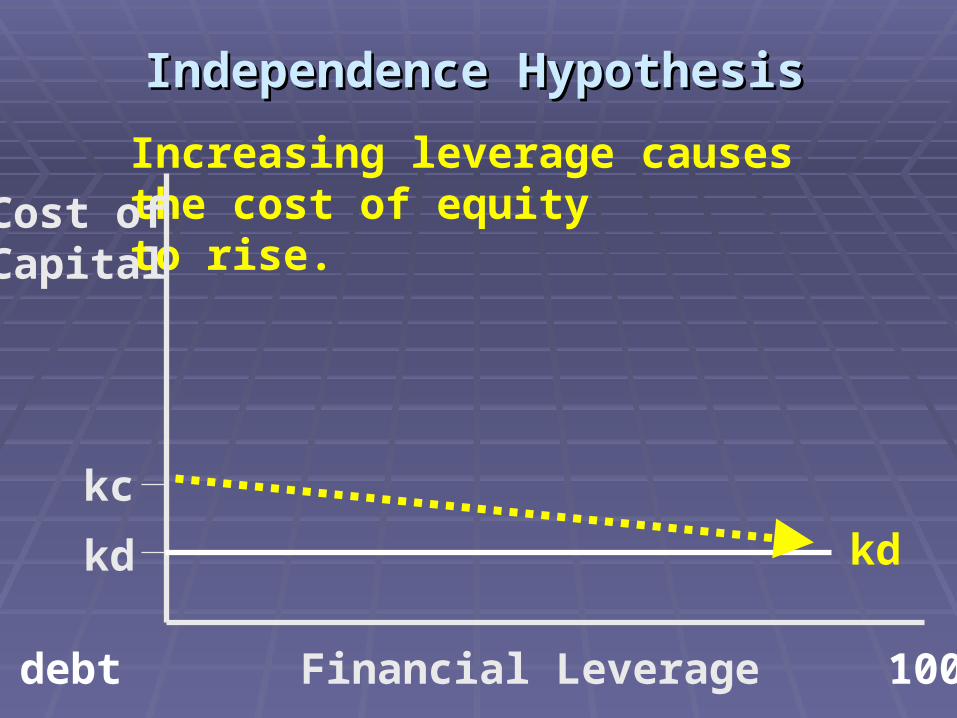
Increasing leverage causesthe cost of equityto rise.
Independence HypothesisIndependence Hypothesis
Cost ofCapital
kc
kd kd
0% debt Financial Leverage 100% debt
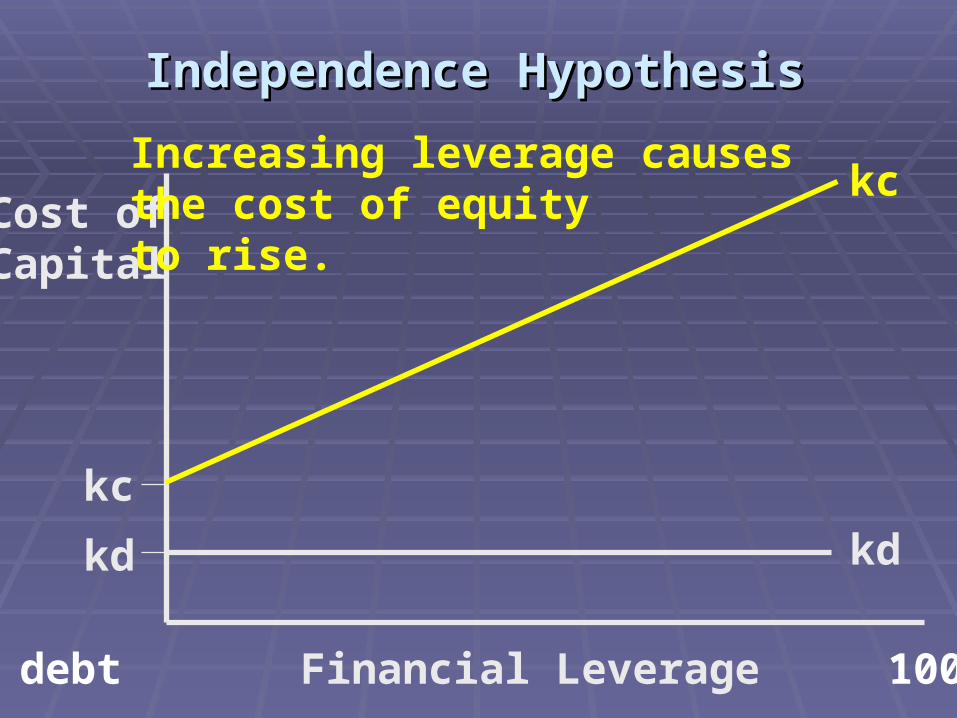
Independence HypothesisIndependence Hypothesis
Cost ofCapital
kc
kd
kc
kd
Increasing leverage causesthe cost of equityto rise.
0% debt Financial Leverage 100% debt

Independence HypothesisIndependence Hypothesis
Cost ofCapital
kc
kd
kc
kd
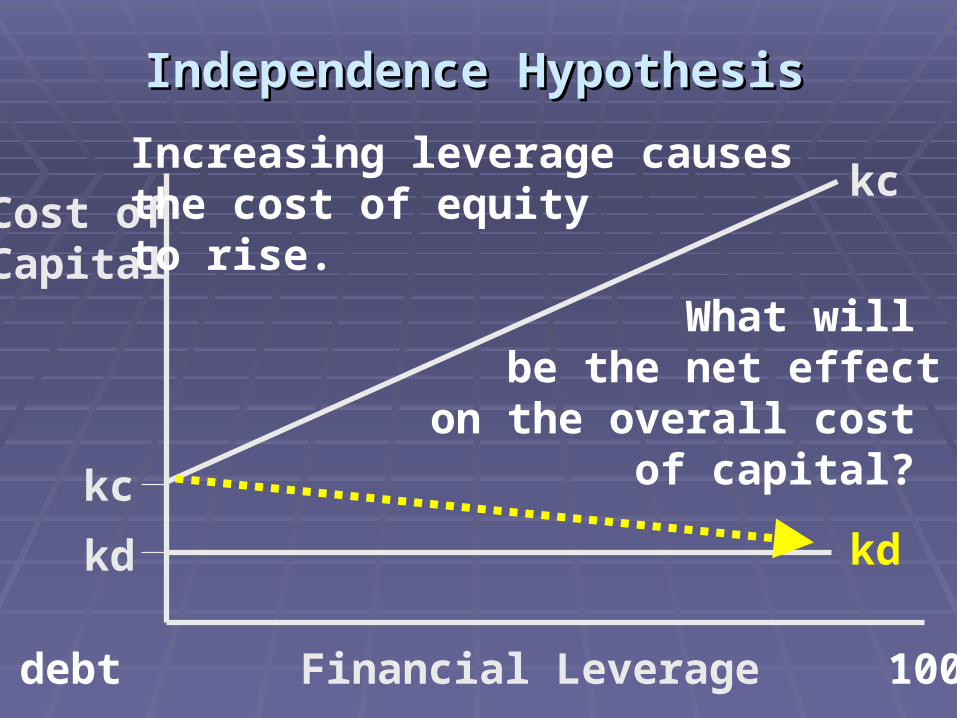
Increasing leverage causesthe cost of equityto rise.
What will be the net effect
on the overall cost of capital?
0% debt Financial Leverage 100% debt
Independence HypothesisIndependence Hypothesis
Cost ofCapital
kc
kd
kc
kd
Increasing leverage causesthe cost of equityto rise.
What will be the net effect
on the overall cost of capital?
0% debt Financial Leverage 100% debt

kc
kd
Independence HypothesisIndependence Hypothesis
Cost ofCapital
kc
ko
kd
0% debt Financial Leverage 100% debt

If we have perfect capital markets, If we have perfect capital markets, capital structure is capital structure is irrelevantirrelevant. .
In other words, changes in capital In other words, changes in capital structure do not affect structure do not affect firm valuefirm value..
Independence HypothesisIndependence Hypothesis
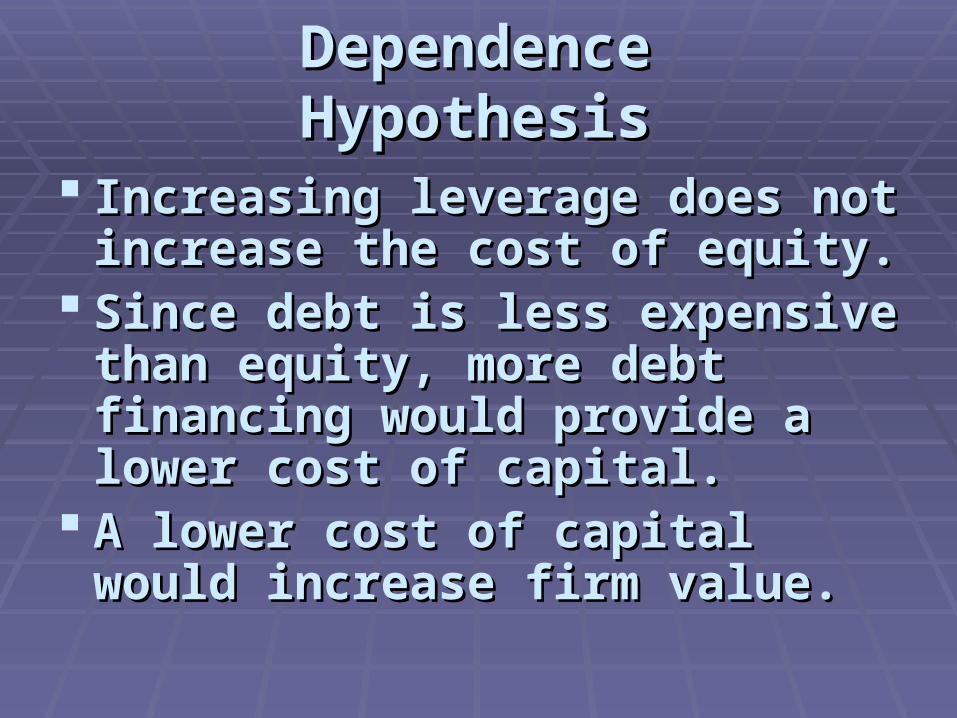
Dependence HypothesisDependence Hypothesis
Increasing leverage does not increase Increasing leverage does not increase the cost of equity.the cost of equity.
Since debt is less expensive than equity, Since debt is less expensive than equity, more debt financing would provide a more debt financing would provide a lower cost of capital. lower cost of capital.
A lower cost of capital would increase A lower cost of capital would increase firm value.firm value.
Dependence HypothesisDependence Hypothesis
Cost ofCapital
kc
kd
Financial Leverage
kc
kd
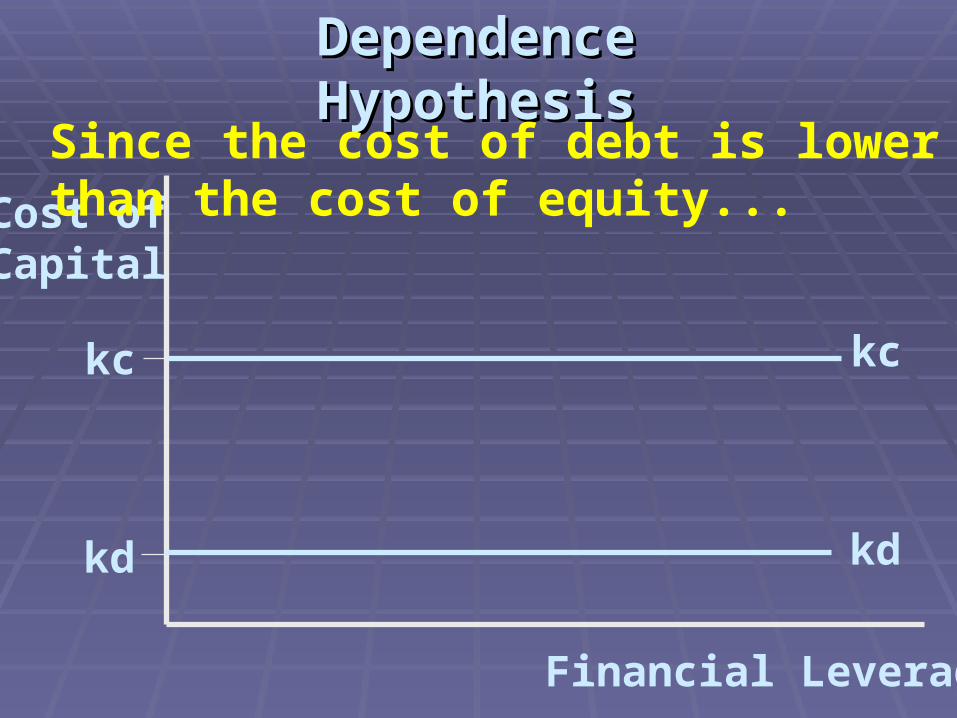
Since the cost of debt is lowerthan the cost of equity...

Dependence HypothesisDependence HypothesisSince the cost of debt is lowerthan the cost of equity…increasing leverage reduces thecost of capital.
Cost ofCapital
kc
kd
Financial Leverage
kc
kdko

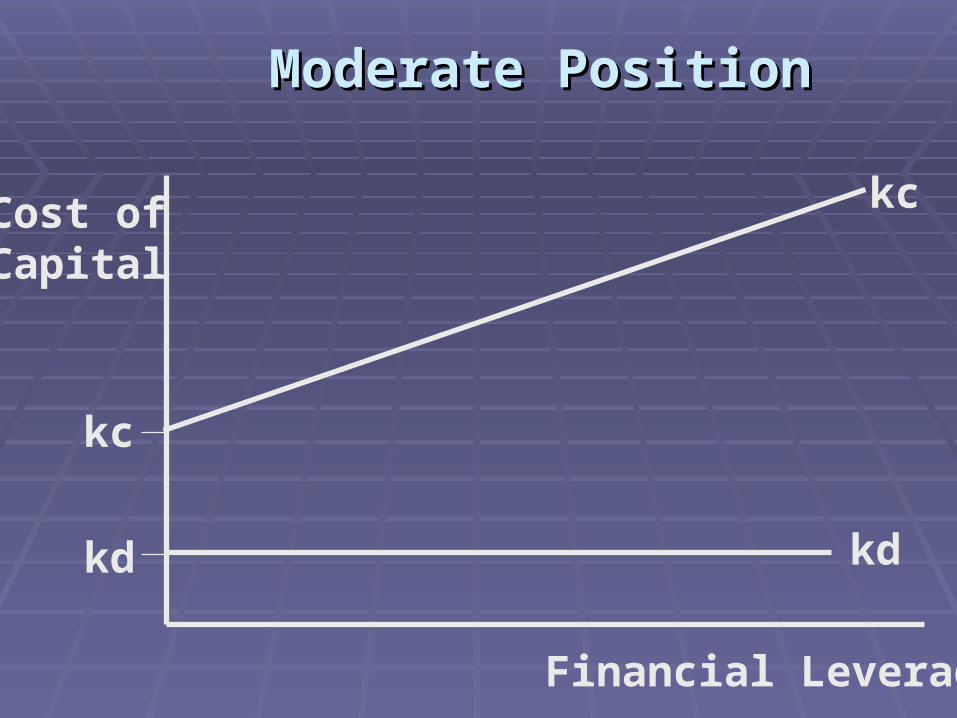
Moderate PositionModerate Position
The previous hypothesis examines The previous hypothesis examines capital structure in a “perfect capital structure in a “perfect market.”market.”
The moderate position examines The moderate position examines capital structure under more capital structure under more realistic conditions.realistic conditions.
For example, what happens if we For example, what happens if we include include corporate taxescorporate taxes??

unleveredunlevered leveredlevered
EBITEBIT 2,000,0002,000,000 2,000,000 2,000,000
- interest expense- interest expense 0 0 (480,000)(480,000)
EBTEBT 2,000,0002,000,000 1,520,000 1,520,000
- taxes (50%)- taxes (50%) (1,000,000)(1,000,000) (760,000)(760,000)
Earnings availableEarnings available
to stockholdersto stockholders 1,000,000 1,000,000 760,000 760,000
Payments to allPayments to all
securityholderssecurityholders 1,000,000 1,240,000 1,000,000 1,240,000
Rix Camper example:Rix Camper example:Tax effects of financing with debtTax effects of financing with debt
Moderate PositionModerate Position
Cost ofCapital
kc
kd
Financial Leverage
kc
kd

Moderate PositionModerate Position
Cost ofCapital
kc
kd
Financial Leverage
kc
kd
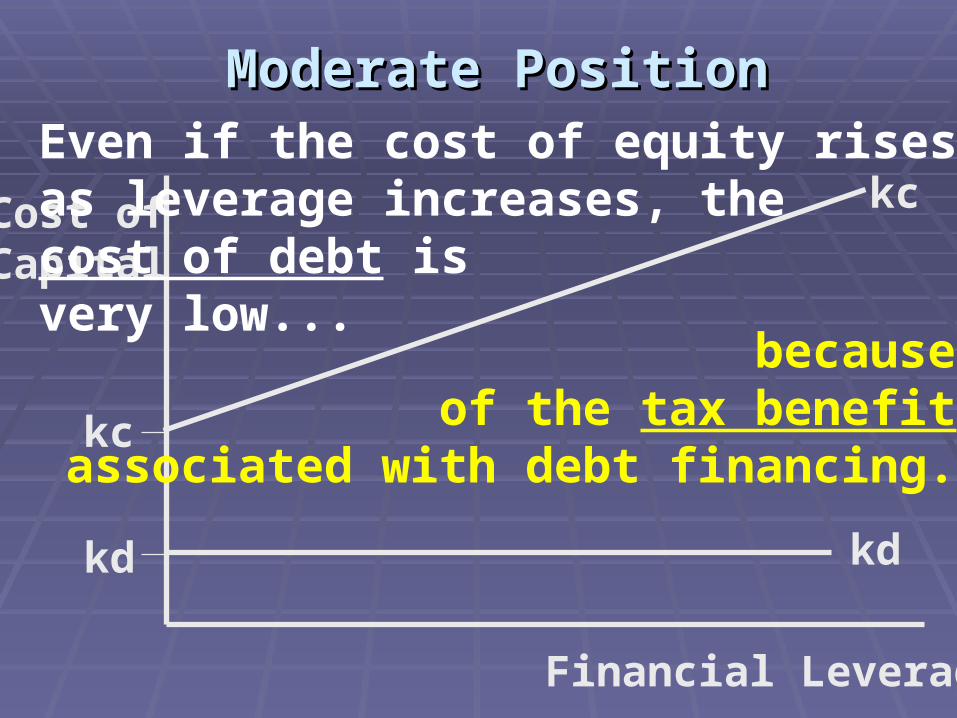
Even if the cost of equity risesas leverage increases, the cost of debt is very low...
Moderate PositionModerate Position
Cost ofCapital
kc
kd
Financial Leverage
kc
kd
becauseof the tax benefit
associated with debt financing.
Even if the cost of equity risesas leverage increases, the cost of debt is very low...

Moderate PositionModerate Position
Cost ofCapital
kc
kd
Financial Leverage
kc
kd
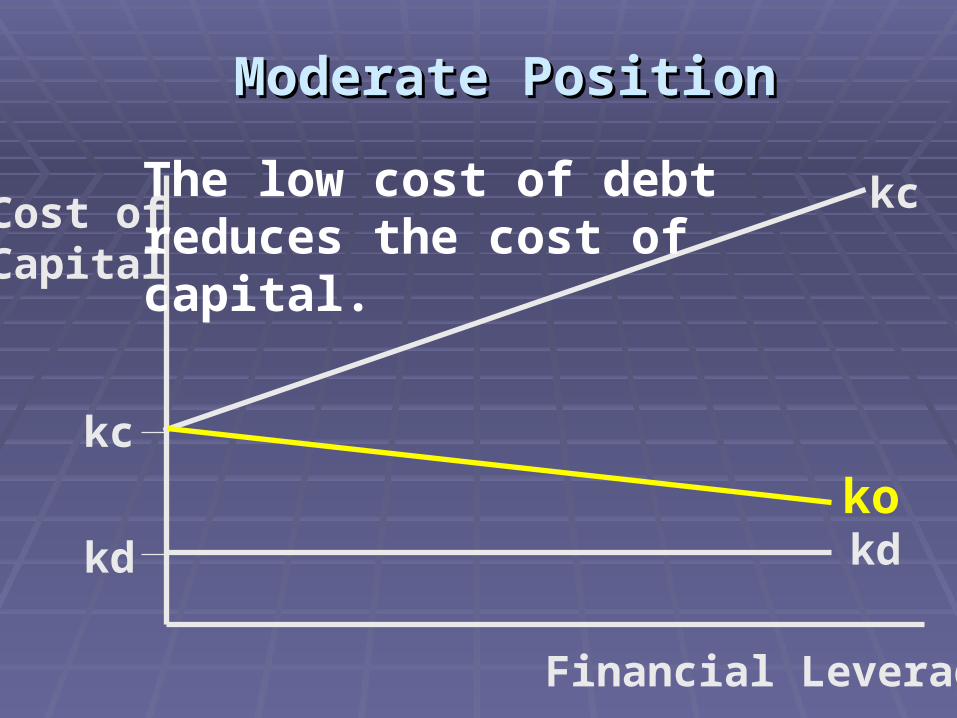
The low cost of debt reduces the cost of capital.
Moderate PositionModerate Position
Cost ofCapital
kc
kd
Financial Leverage
kc
kd
The low cost of debt reduces the cost of capital.
ko

Moderate PositionModerate Position
So, what does the tax benefit of debt So, what does the tax benefit of debt financing mean for the value of the firm?financing mean for the value of the firm?
The more debt financing used, the greater The more debt financing used, the greater the the tax benefittax benefit, and the greater the , and the greater the value of value of the firmthe firm..
So, this would mean that all firms should be So, this would mean that all firms should be financed with financed with 100% debt100% debt, right?, right?
Why are firms Why are firms notnot financed with 100% debt? financed with 100% debt?
Why is 100% Debt Not Optimal?Why is 100% Debt Not Optimal?
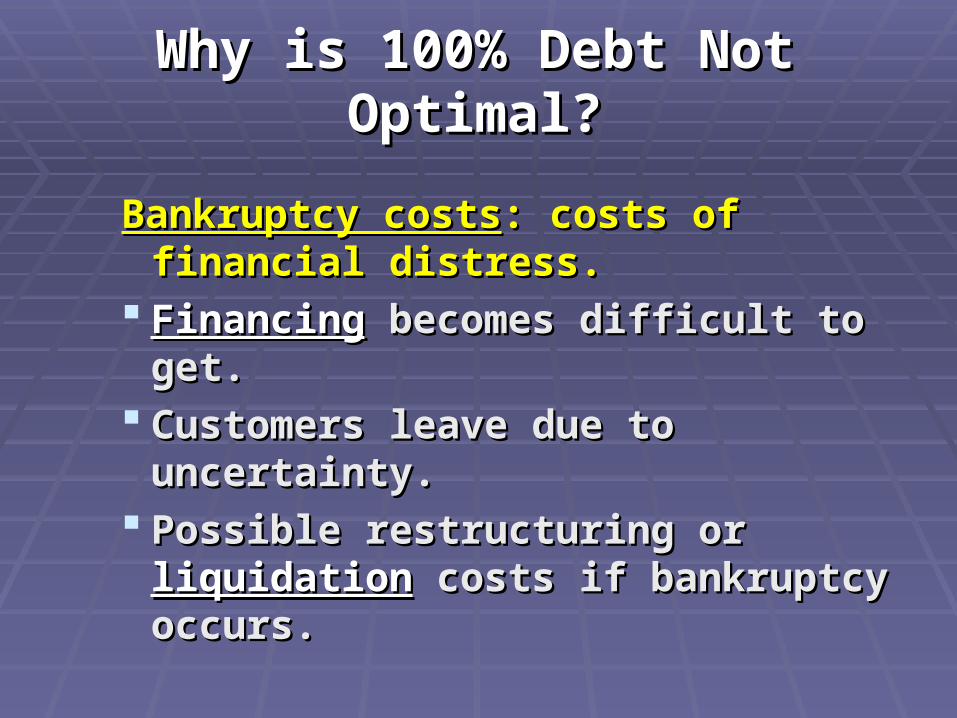
Bankruptcy costsBankruptcy costs: costs of financial : costs of financial distress.distress.
FinancingFinancing becomes difficult to get. becomes difficult to get. Customers leave due to uncertainty.Customers leave due to uncertainty. Possible restructuring or Possible restructuring or
liquidationliquidation costs if bankruptcy costs if bankruptcy occurs.occurs.
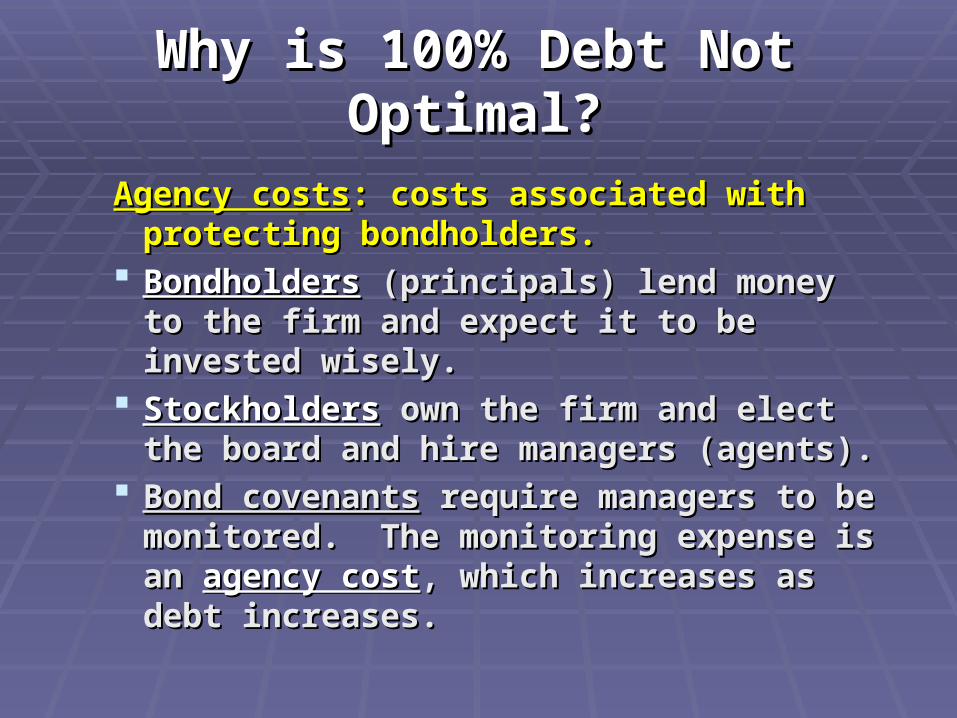
Agency costsAgency costs: costs associated with protecting : costs associated with protecting bondholders.bondholders.
BondholdersBondholders (principals) lend money to the (principals) lend money to the firm and expect it to be invested wisely.firm and expect it to be invested wisely.
StockholdersStockholders own the firm and elect the own the firm and elect the board and hire managers (agents).board and hire managers (agents).
Bond covenantsBond covenants require managers to be require managers to be monitored. The monitoring expense is an monitored. The monitoring expense is an agency costagency cost, which increases as debt , which increases as debt increases.increases.
Why is 100% Debt Not Optimal?Why is 100% Debt Not Optimal?
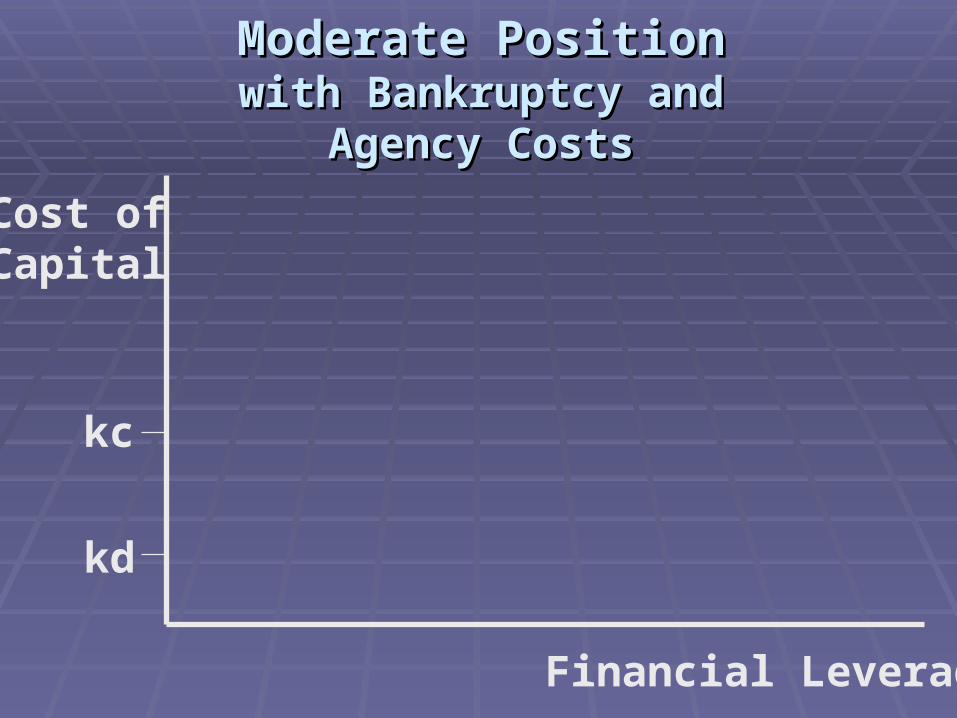
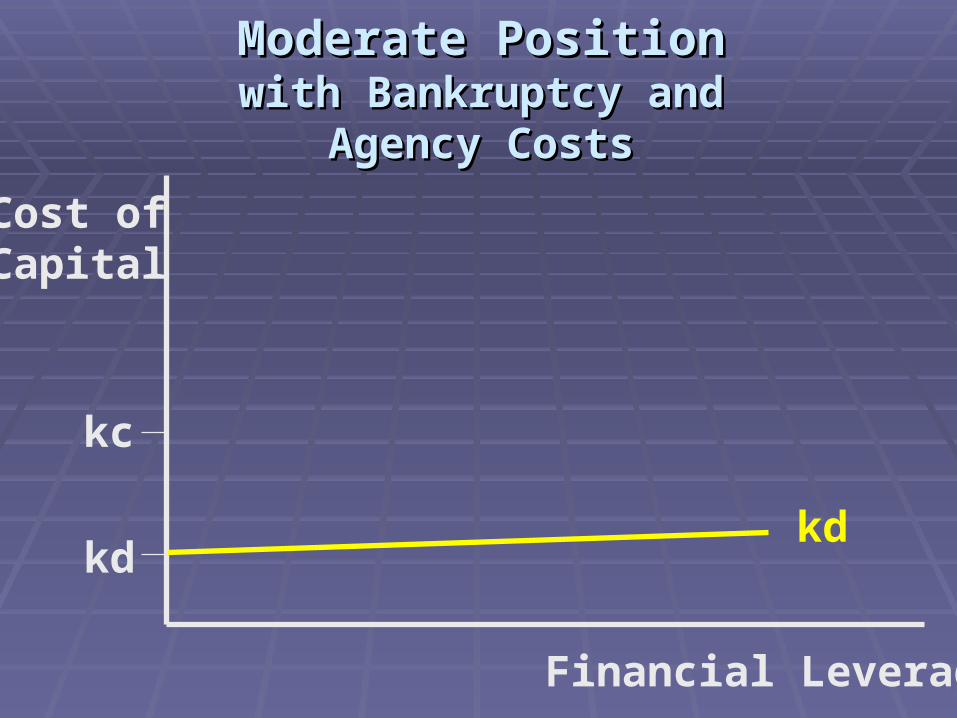
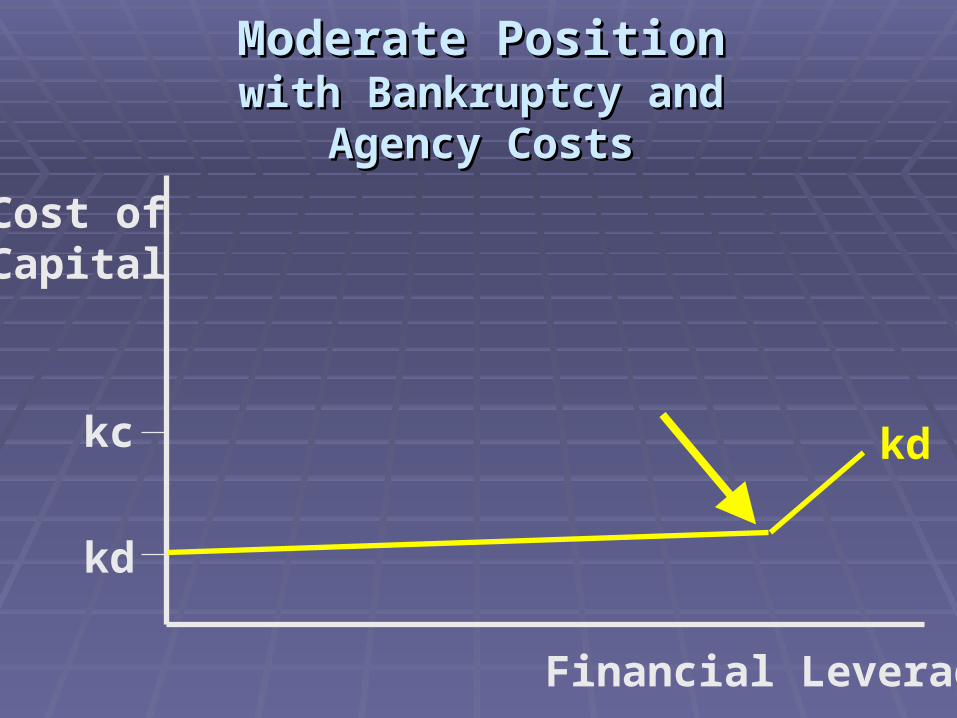
Moderate PositionModerate Positionwith Bankruptcy and Agency Costswith Bankruptcy and Agency Costs
Cost ofCapital
Financial Leverage
kc
kd
Cost ofCapital
Financial Leverage
kc
kdkd
Moderate PositionModerate Positionwith Bankruptcy and Agency Costswith Bankruptcy and Agency Costs
Cost ofCapital
Financial Leverage
kc
kd
kd
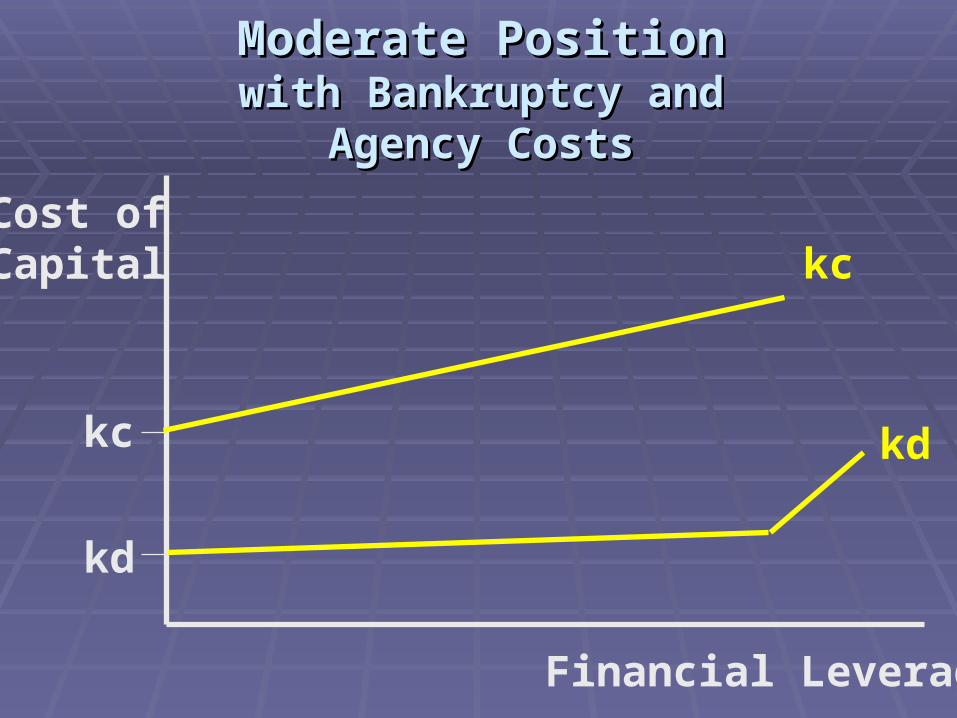
Moderate PositionModerate Positionwith Bankruptcy and Agency Costswith Bankruptcy and Agency Costs
Cost ofCapital
Financial Leverage
kc
kd
kc
kd
Moderate PositionModerate Positionwith Bankruptcy and Agency Costswith Bankruptcy and Agency Costs

Cost ofCapital
Financial Leverage
kc
kd
kc
kd
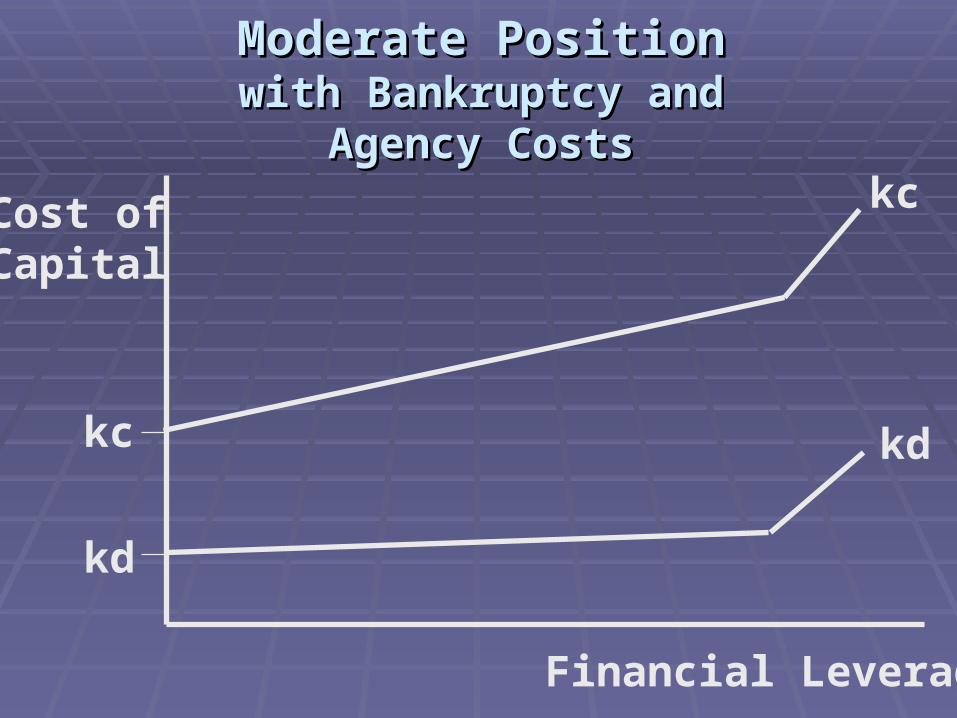
Moderate PositionModerate Positionwith Bankruptcy and Agency Costswith Bankruptcy and Agency Costs

Cost ofCapital
Financial Leverage
kc
kd
kc
kd
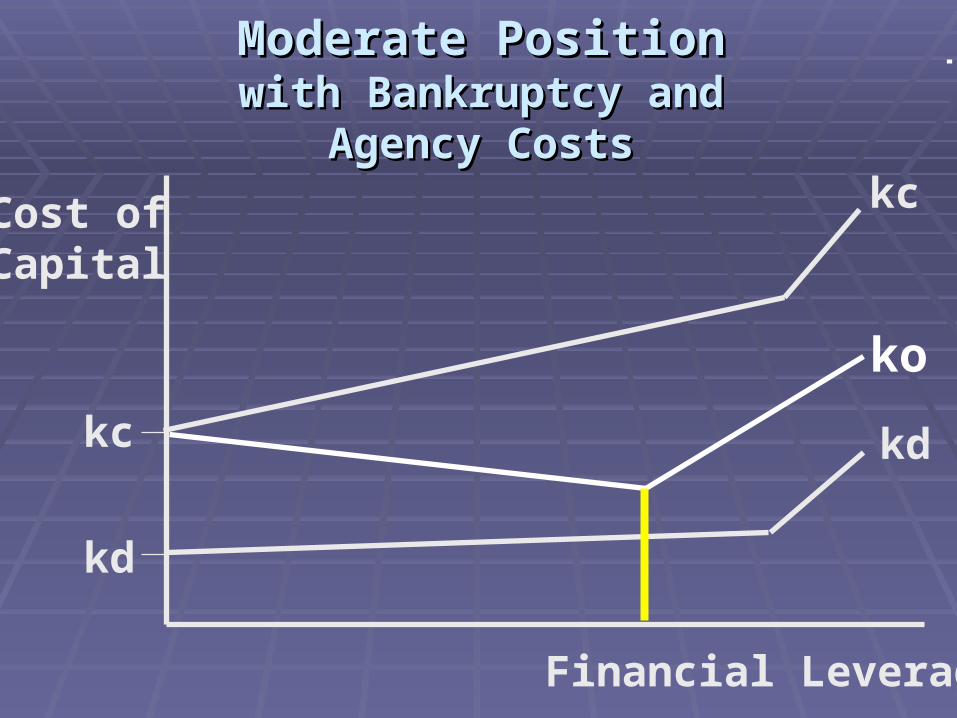
If a firm borrows too much, thecosts of debt and equity will spike upward, due to bankruptcy costsand agency costs.
Moderate PositionModerate Positionwith Bankruptcy and Agency Costswith Bankruptcy and Agency Costs
Cost ofCapital
Financial Leverage
kc
kd
kc
kd
Moderate PositionModerate Positionwith Bankruptcy and Agency Costswith Bankruptcy and Agency Costs
Cost ofCapital
Financial Leverage
kc
kd
kc
kdko
Moderate PositionModerate Positionwith Bankruptcy and Agency Costswith Bankruptcy and Agency Costs

Cost ofCapital
Financial Leverage
kc
kd
kc
kd
ko
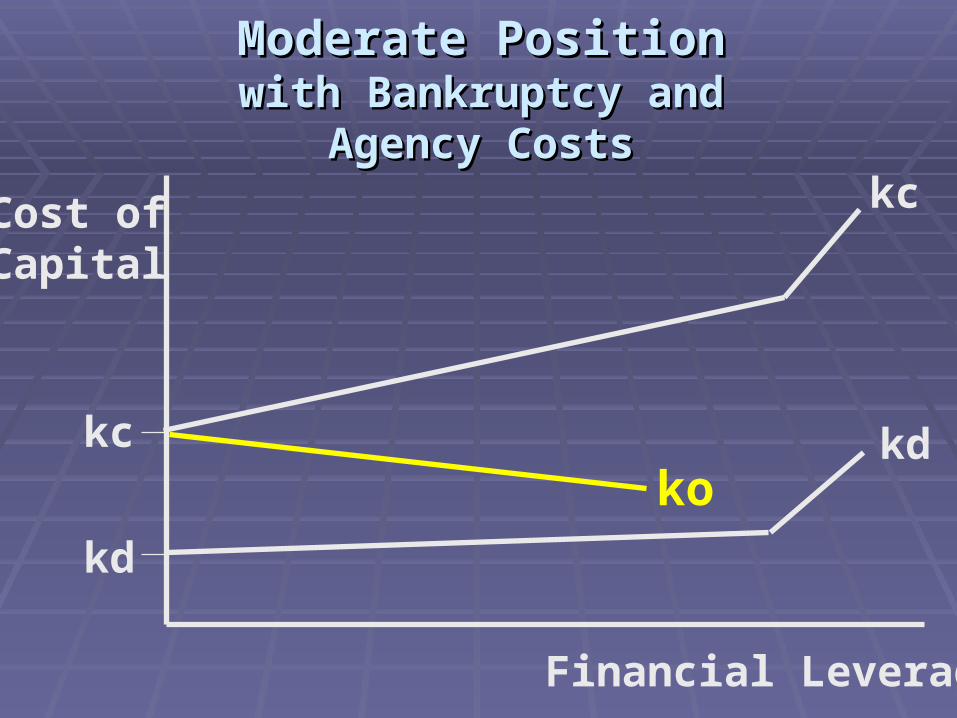
Moderate PositionModerate Positionwith Bankruptcy and Agency Costswith Bankruptcy and Agency Costs
Cost ofCapital
Financial Leverage
kc
kd
kc
kd
ko
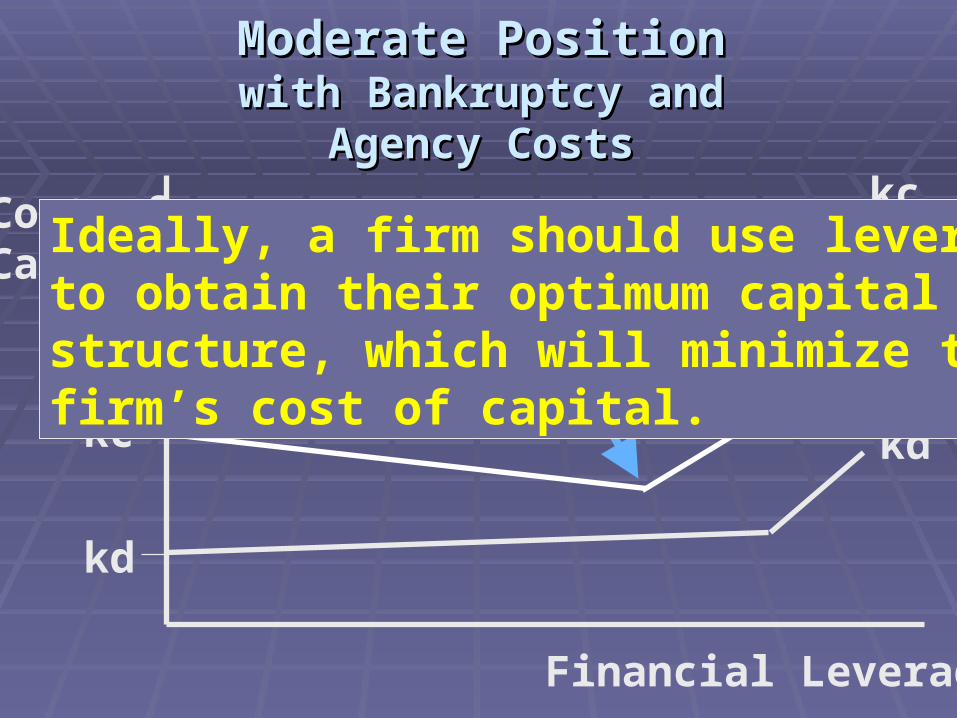
Ideally, a firm should use leverageto obtain their optimum capital structure, which will minimize thefirm’s cost of capital.
Moderate PositionModerate Positionwith Bankruptcy and Agency Costswith Bankruptcy and Agency Costs
Cost ofCapital
Financial Leverage
kc
kd
kc
kd
ko
Moderate PositionModerate Positionwith Bankruptcy and Agency Costswith Bankruptcy and Agency Costs
Capital Structure ManagementCapital Structure Management
EBIT-EPS AnalysisEBIT-EPS Analysis - Used to help - Used to help determine whether it would be better determine whether it would be better to finance a project with debt or to finance a project with debt or equity.equity.

Capital Structure ManagementCapital Structure Management
EBIT-EPS AnalysisEBIT-EPS Analysis - Used to help - Used to help determine whether it would be better determine whether it would be better to finance a project with debt or to finance a project with debt or equity.equity.
EPS = (EBIT - I)(1 - t) - P S
Capital Structure ManagementCapital Structure Management
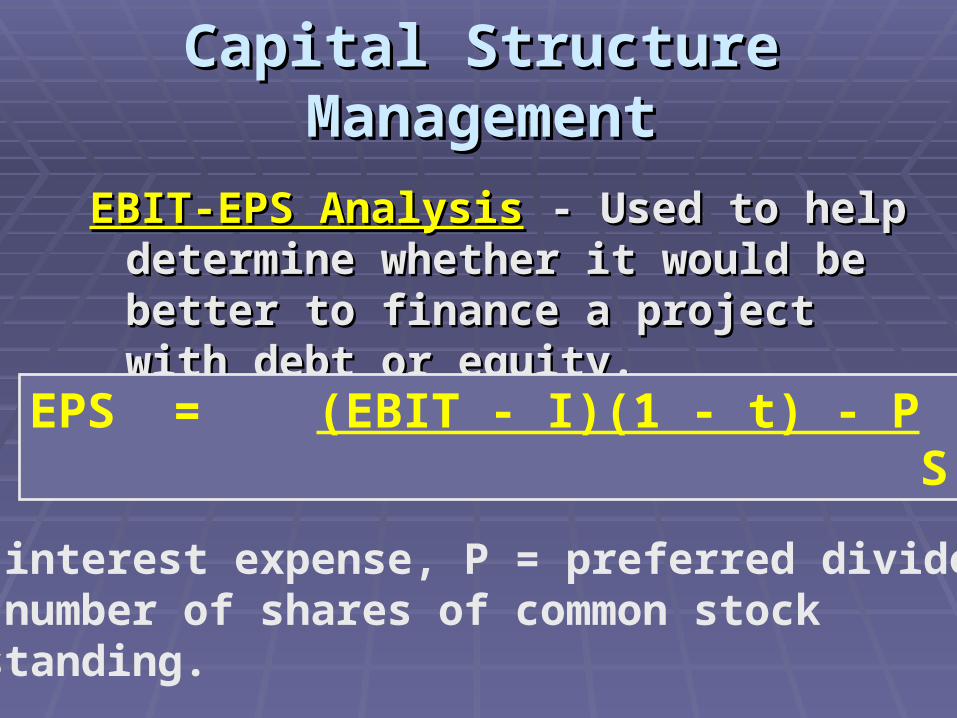
EBIT-EPS AnalysisEBIT-EPS Analysis - Used to help determine - Used to help determine whether it would be better to finance a whether it would be better to finance a project with debt or equity.project with debt or equity.
EPS = (EBIT - I)(1 - t) - P S
I = interest expense, P = preferred dividends,S = number of shares of common stock outstanding.
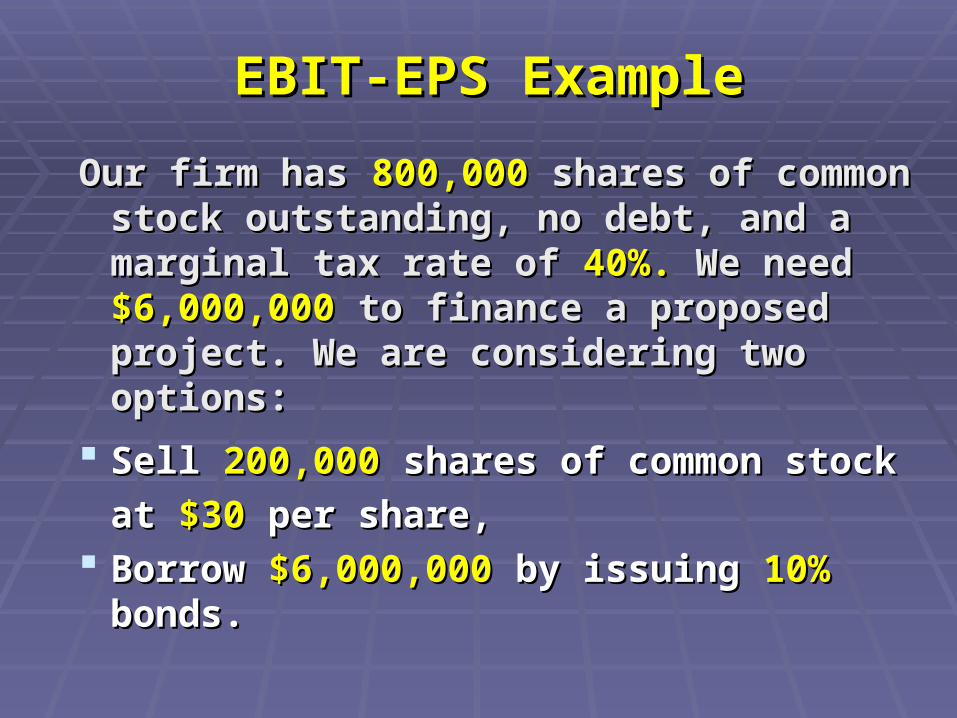
EBIT-EPS ExampleEBIT-EPS Example
Our firm has Our firm has 800,000800,000 shares of common stock shares of common stock outstanding, no debt, and a marginal tax rate outstanding, no debt, and a marginal tax rate of of 40%.40%. We need We need $6,000,000$6,000,000 to finance a to finance a proposed project. We are considering two proposed project. We are considering two options:options:
Sell Sell 200,000200,000 shares of common stock at shares of common stock at $30$30
per share,per share, Borrow Borrow $6,000,000$6,000,000 by issuing by issuing 10%10% bonds. bonds.

If we expect EBIT to be $2,000,000:If we expect EBIT to be $2,000,000:
Financing Financing stock stock debt debt EBITEBIT 2,000,0002,000,000 2,000,0002,000,000- interest- interest 0 0 (600,000)(600,000)EBTEBT 2,000,0002,000,000 1,400,0001,400,000- taxes (40%)- taxes (40%) (800,000) (800,000) (560,000)(560,000)EATEAT 1,200,0001,200,000 840,000 840,000# shares outst.# shares outst. 1,000,0001,000,000 800,000 800,000EPSEPS $1.20 $1.20 $1.05 $1.05

Financing Financing stock stock debt debt EBITEBIT 4,000,0004,000,000 4,000,0004,000,000- interest- interest 0 0 (600,000)(600,000)EBTEBT 4,000,0004,000,000 3,400,0003,400,000- taxes (40%)- taxes (40%) (1,600,000)(1,600,000)
(1,360,000)(1,360,000)EATEAT 2,400,0002,400,000 2,040,000 2,040,000# shares outst.# shares outst. 1,000,0001,000,000 800,000 800,000EPSEPS $2.40 $2.40 $2.55 $2.55
If we expect EBIT to be $4,000,000:If we expect EBIT to be $4,000,000:
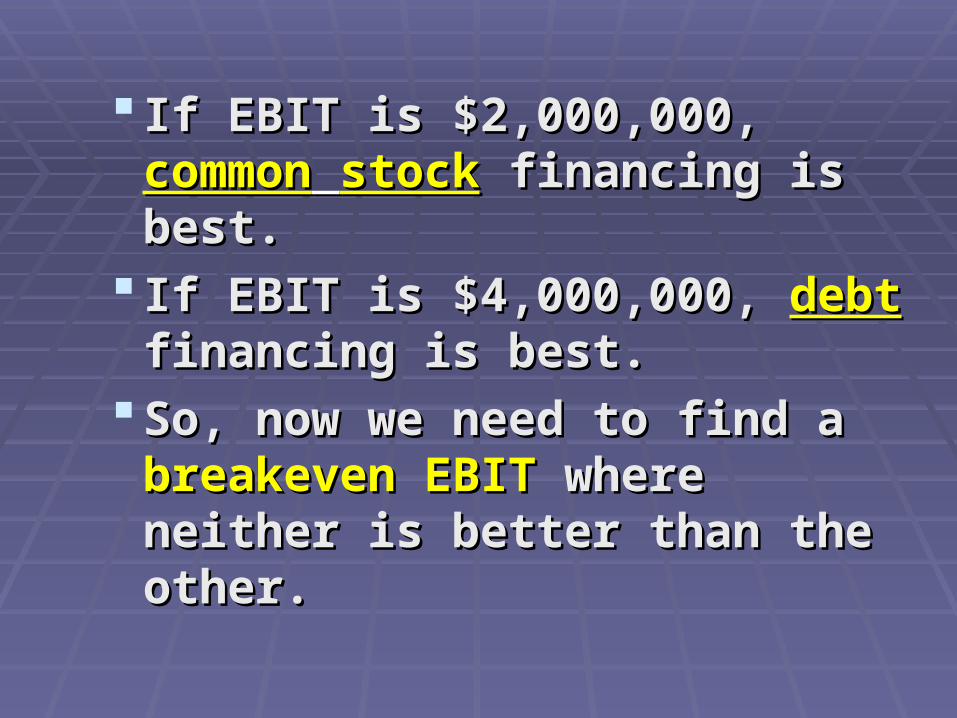
If EBIT is $2,000,000, If EBIT is $2,000,000, commoncommon stockstock financing is best. financing is best.
If EBIT is $4,000,000, If EBIT is $4,000,000, debtdebt financing is best.financing is best.
So, now we need to find a So, now we need to find a breakevenbreakeven EBITEBIT where neither is where neither is better than the other.better than the other.
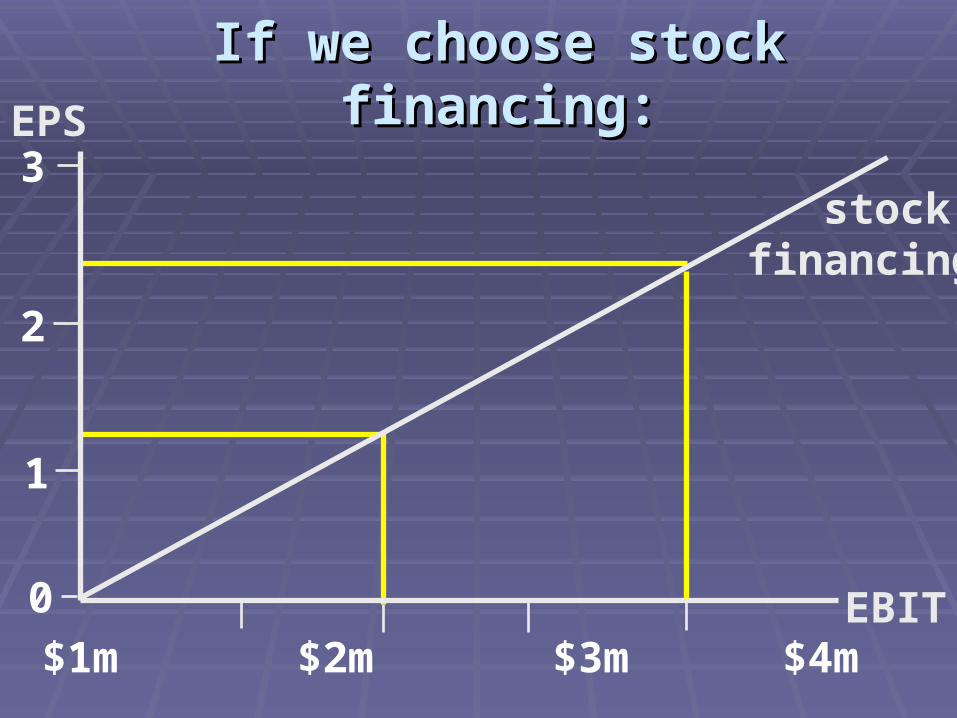
If we choose stock financing:If we choose stock financing:EPS
EBIT$1m $2m $3m $4m
stock financing
0
3
2
1
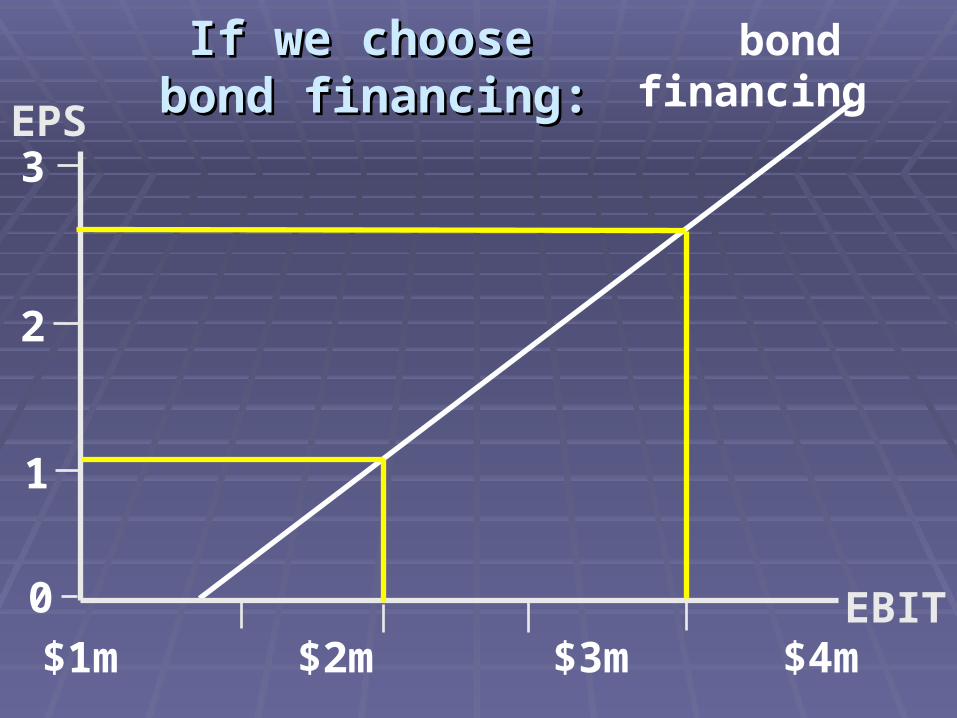
If we choose If we choose bond financing:bond financing:
EPS
EBIT$1m $2m $3m $4m
bond financing
0
3
2
1

Breakeven EBITBreakeven EBIT
EPS
EBIT$1m $2m $3m $4m
bond financing
stock financing
0
3
2
1
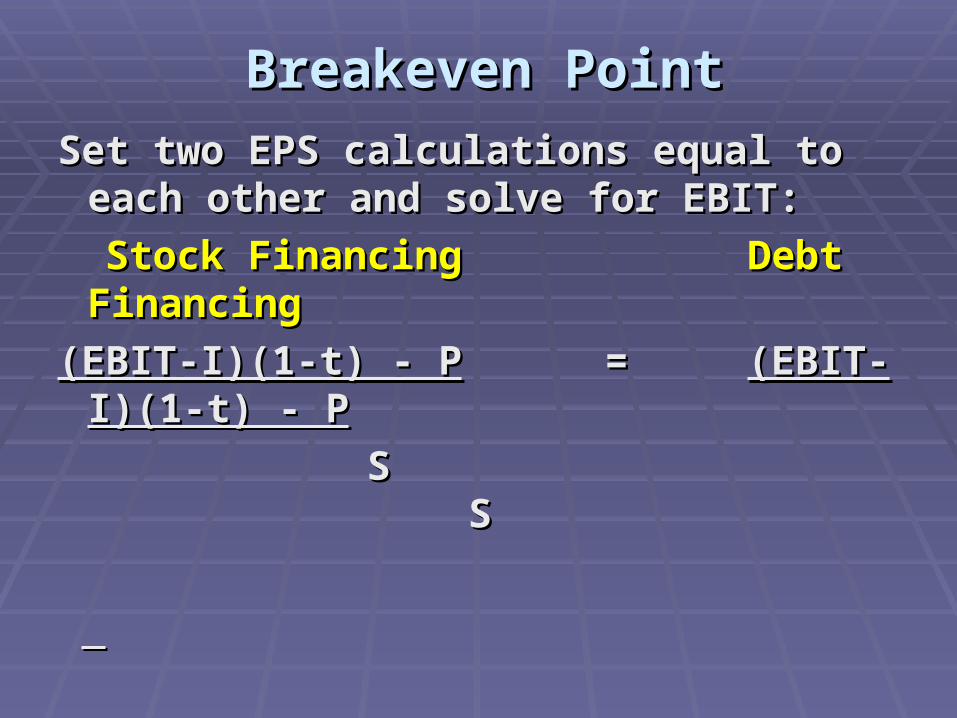
Breakeven PointBreakeven Point
Set two EPS calculations equal to each Set two EPS calculations equal to each other and solve for EBIT:other and solve for EBIT:
Stock Financing Debt FinancingStock Financing Debt Financing
(EBIT-I)(1-t) - P(EBIT-I)(1-t) - P = = (EBIT-I)(1-t) - P(EBIT-I)(1-t) - P
S SS S
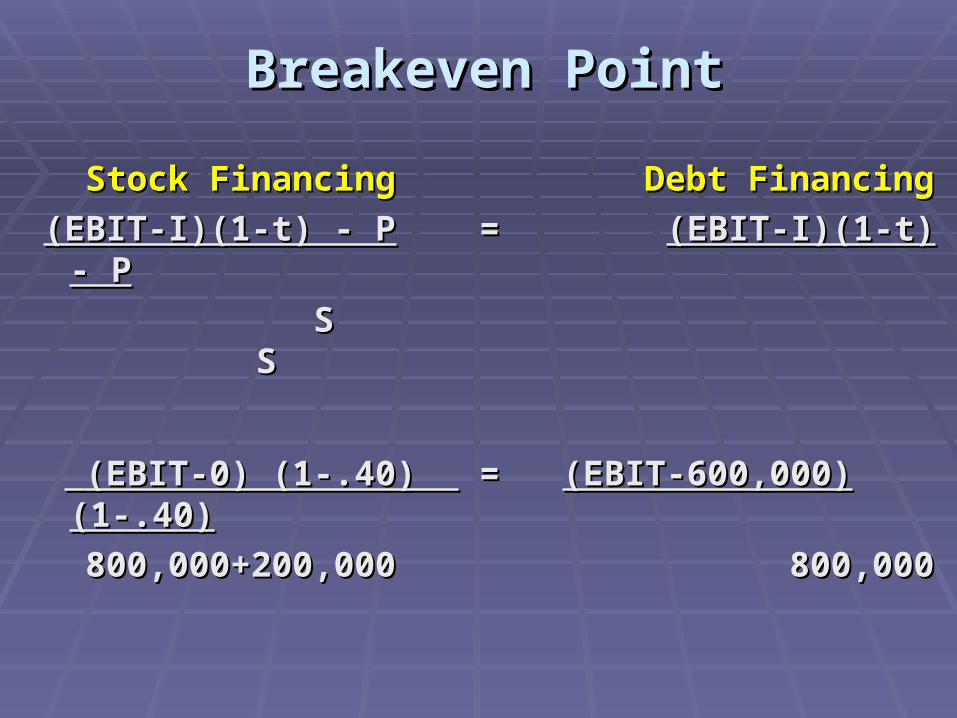
Breakeven PointBreakeven Point
Stock Financing Debt FinancingStock Financing Debt Financing
(EBIT-I)(1-t) - P(EBIT-I)(1-t) - P = = (EBIT-I)(1-t) - P(EBIT-I)(1-t) - P
S SS S
(EBIT-0) (1-.40) (EBIT-0) (1-.40) = = (EBIT-600,000)(1-.40)(EBIT-600,000)(1-.40)
800,000+200,000 800,000800,000+200,000 800,000
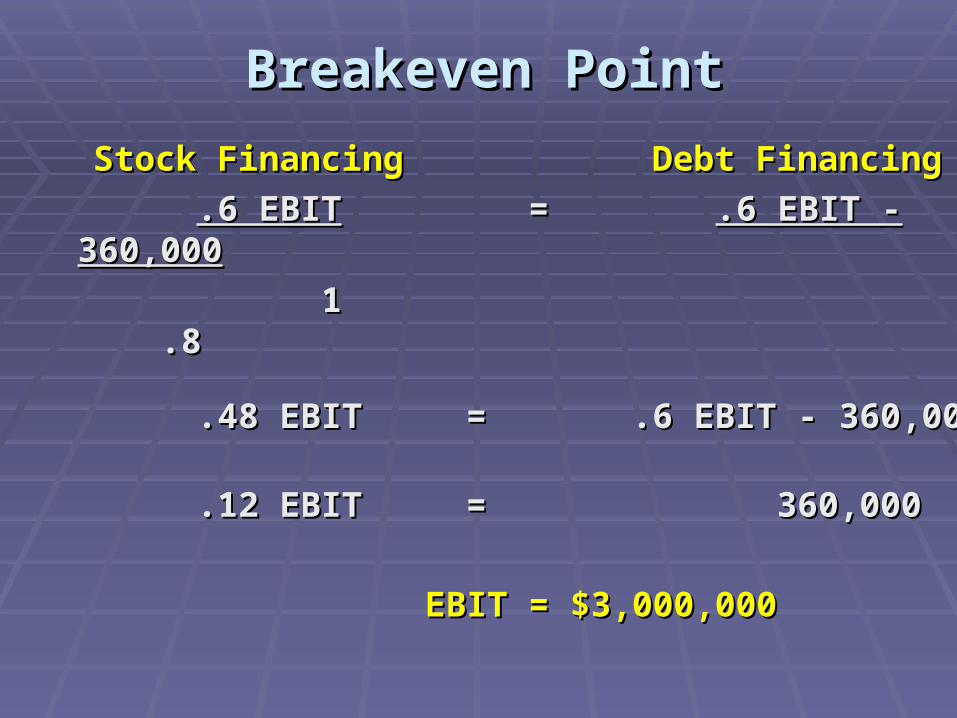
Breakeven PointBreakeven Point
Stock Financing Debt Financing Stock Financing Debt Financing
.6 EBIT.6 EBIT = = .6 EBIT - 360,000.6 EBIT - 360,000
1 .81 .8
.48 EBIT = .6 EBIT - 360,000.48 EBIT = .6 EBIT - 360,000
.12 EBIT = 360,000.12 EBIT = 360,000
EBIT = $3,000,000EBIT = $3,000,000

Breakeven EBITBreakeven EBIT
EPS
EBIT$1m $2m $3m $4m
bond financing
stock financing
0
3
2
1
For EBIT up to $3 million,stock financing is best.

Breakeven EBITBreakeven EBIT
EPS
EBIT$1m $2m $3m $4m
bond financing
stock financing
0
3
2
1
For EBIT up to $3 million,stock financing is best.
For EBIT greaterthan $3 million, debt financing
is best.
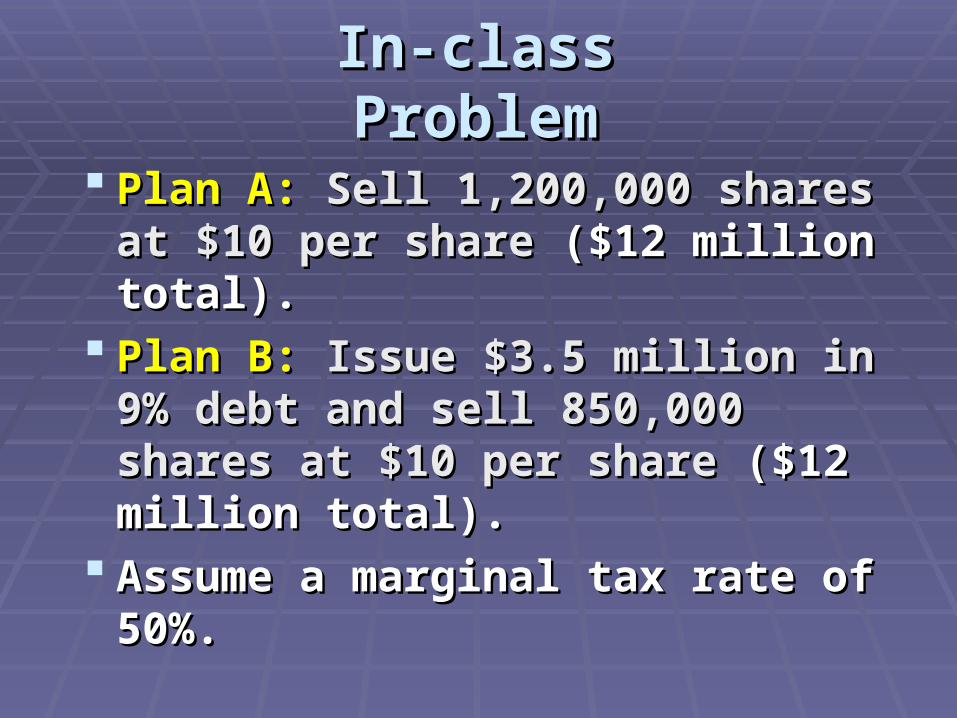
In-class ProblemIn-class Problem
Plan A:Plan A: Sell 1,200,000 shares at $10 Sell 1,200,000 shares at $10 per share per share ($12 million total).($12 million total).
Plan B:Plan B: Issue $3.5 million in 9% debt Issue $3.5 million in 9% debt and sell 850,000 shares at $10 per and sell 850,000 shares at $10 per share share ($12 million total).($12 million total).
Assume a marginal tax rate of 50%.Assume a marginal tax rate of 50%.

Breakeven EBITBreakeven EBIT
Stock Financing Levered FinancingStock Financing Levered Financing
(EBIT-I) (1-t) - P(EBIT-I) (1-t) - P = = (EBIT-I) (1-t) - P(EBIT-I) (1-t) - P
S SS S
EBIT-0 (1-.50) EBIT-0 (1-.50) = = (EBIT-315,000)(1-.50)(EBIT-315,000)(1-.50)
1,200,000 850,0001,200,000 850,000
EBIT = $1,080,000EBIT = $1,080,000

Analytical Income StatementAnalytical Income Statement
Stock Stock LeveredLevered
EBITEBIT 1,080,0001,080,000 1,080,0001,080,000
II 0 0 (315,000)(315,000)
EBTEBT 1,080,0001,080,000 765,000 765,000
TaxTax (540,000) (540,000) (382,500)(382,500)
NINI 540,000540,000 382,500 382,500
SharesShares 1,200,0001,200,000 850,000 850,000
EPSEPS .45.45 .45.45
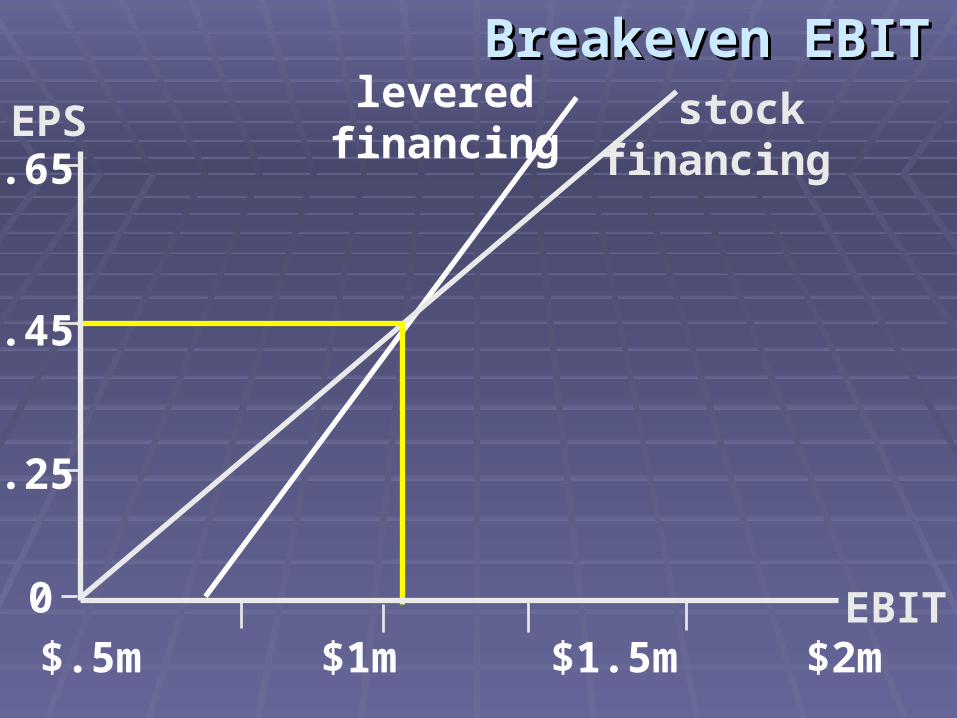
levered financing
stock financing
EPS
EBIT$.5m $1m $1.5m $2m
0
.65
.45
.25
Breakeven EBITBreakeven EBIT

For EBIT up to $1.08 m,
stock financing is
best.
levered financing
stock financing
EPS
EBIT$.5m $1m $1.5m $2m
0
.65
.45
.25
Breakeven EBITBreakeven EBIT
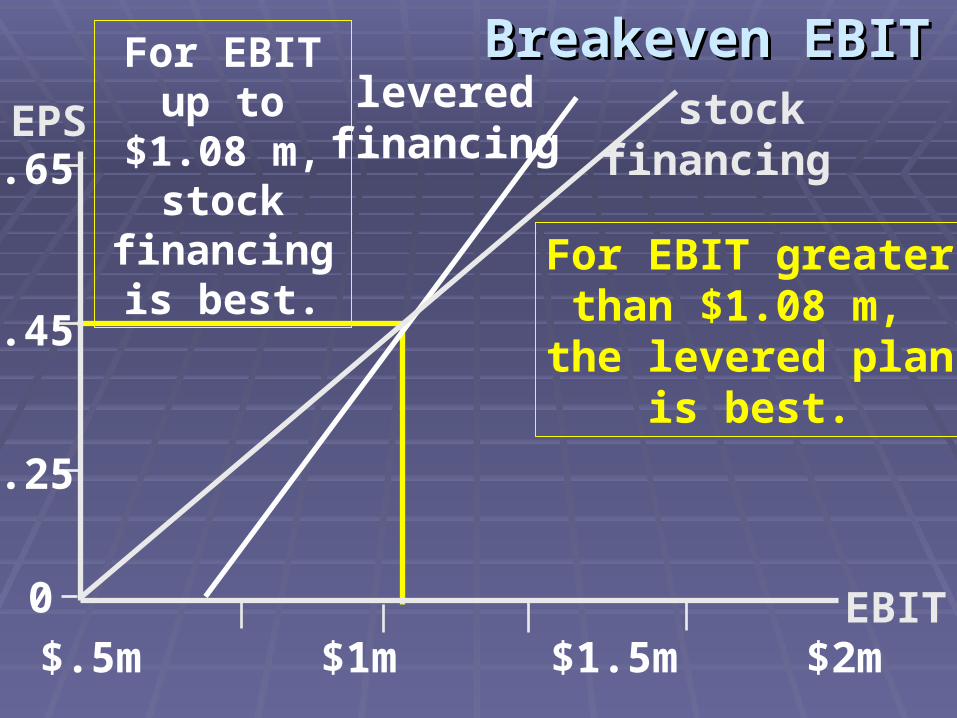
Breakeven EBITBreakeven EBITFor EBIT up to $1.08 m,
stock financing is
best. For EBIT greaterthan $1.08 m,
the levered planis best.
levered financing
stock financing
EPS
EBIT$.5m $1m $1.5m $2m
0
.65
.45
.25
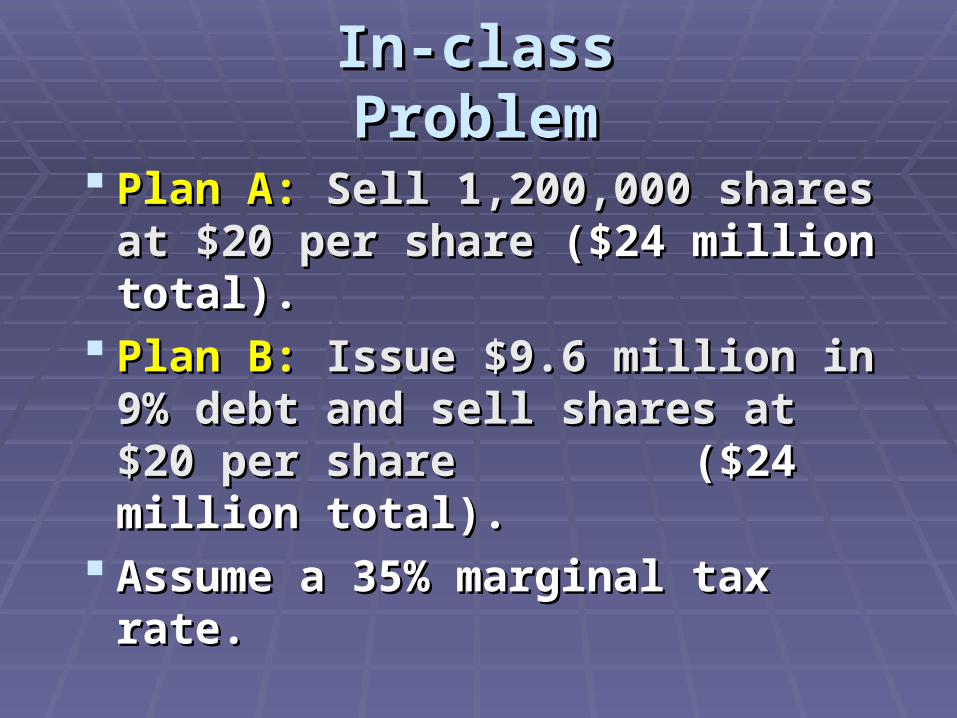
In-class ProblemIn-class Problem
Plan A:Plan A: Sell 1,200,000 shares at $20 Sell 1,200,000 shares at $20 per share per share ($24 million total).($24 million total).
Plan B:Plan B: Issue $9.6 million in 9% debt Issue $9.6 million in 9% debt and sell shares at $20 per share and sell shares at $20 per share ($24 million total).($24 million total).
Assume a 35% marginal tax rate.Assume a 35% marginal tax rate.
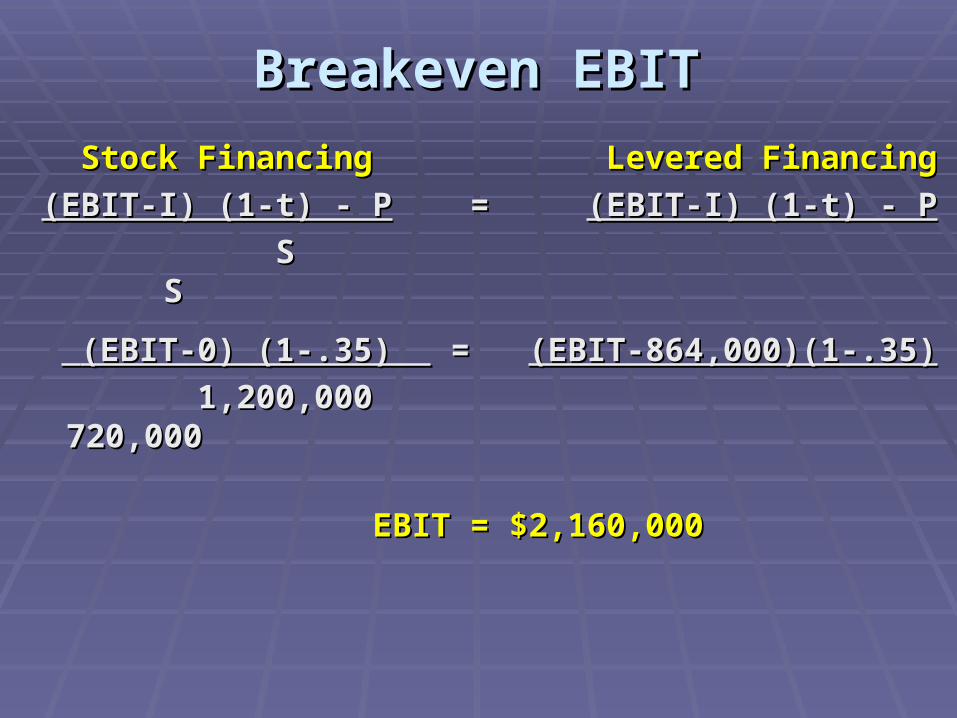
Breakeven EBITBreakeven EBIT
Stock Financing Levered FinancingStock Financing Levered Financing
(EBIT-I) (1-t) - P(EBIT-I) (1-t) - P = = (EBIT-I) (1-t) - P(EBIT-I) (1-t) - P
S SS S
(EBIT-0) (1-.35) (EBIT-0) (1-.35) = = (EBIT-864,000)(1-.35)(EBIT-864,000)(1-.35)
1,200,000 720,0001,200,000 720,000
EBIT = $2,160,000EBIT = $2,160,000
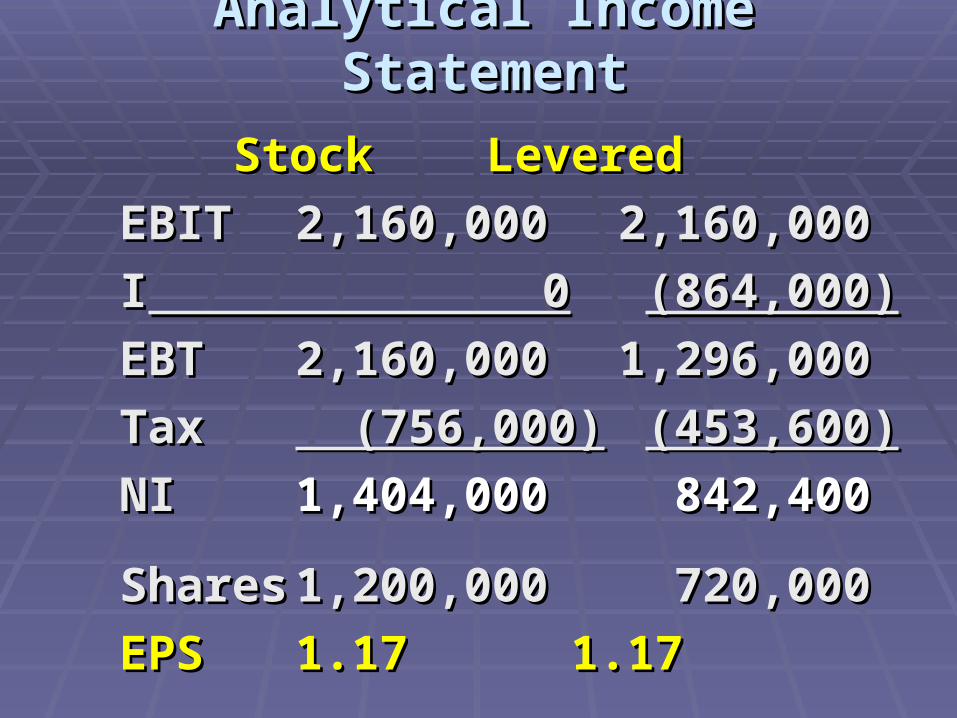
Analytical Income StatementAnalytical Income Statement
Stock Stock Levered Levered
EBITEBIT 2,160,0002,160,000 2,160,0002,160,000
II 0 0 (864,000)(864,000)
EBTEBT 2,160,0002,160,000 1,296,0001,296,000
TaxTax (756,000) (756,000) (453,600)(453,600)
NINI 1,404,0001,404,000 842,400 842,400
SharesShares 1,200,0001,200,000 720,000 720,000
EPSEPS 1.171.17 1.17 1.17

Breakeven EBITBreakeven EBITlevered
financingstock
financingEPS
EBIT$1m $2m $3m $4m
0
1.5
1.17
.5

Breakeven EBITBreakeven EBITlevered
financingstock
financingEPS
EBIT$1m $2m $3m $4m
0
1.5
1.17
.5
For EBIT up to $2.16 m,
stock financing is
best.

Breakeven EBITBreakeven EBITlevered
financingstock
financingEPS
EBIT$1m $2m $3m $4m
0
1.5
1.17
.5
For EBIT greaterthan $2.16 m,
the levered planis best.
For EBIT up to $2.16 m,
stock financing
is best.
Related Documents