A Comparative Study of Software used for LVEF Quantification in Myocardial Perfusion Imaging FM Lavender, RT Meades, A Al-Nahhas, KS Nijran Imperial College Healthcare NHS Trust, London, UK

FM Lavender, RT Meades, A Al-Nahhas, KS Nijran Imperial College Healthcare NHS Trust, London, UK.
Dec 29, 2015
Welcome message from author
This document is posted to help you gain knowledge. Please leave a comment to let me know what you think about it! Share it to your friends and learn new things together.
Transcript
A Comparative Study of Software used for LVEF Quantification in Myocardial Perfusion Imaging
FM Lavender, RT Meades, A Al-Nahhas, KS Nijran
Imperial College Healthcare NHS Trust, London, UK

Quantitation software: uses thresholding, binarization, and clusterification to estimate position of myocardial surfaces.
Left ventricular ejection fraction :LVEF = (EDV-ESV )x100%
EDV The LVEF provides quantitative functional information about
the heart. Comparison of the LVEF at rest/stress gives a measure of
the level of reversible ischaemia. Comparison of the LVEF between successive scans gives an
indication of the level of deterioration or response to treatment.
A Comparative Study of Software used for LVEF Quantification in Myocardial Perfusion Imaging

The aims of this study were to compare the effects of:
1. Quantitation software : 101 patientsQuantitative Gated SPECT vs 4DMSPECT
2. Pre-reconstruction filtering : 32 patientsButterworth filter of varying order and cut-off frequency
on LVEF quantification.
Aims

101 patients
Acquisition method: Siemens ECAM dual-head gamma camera SPECT acquisition: 32 projections,
30second/projection. 400-750MBq Tc99m Tetrofosmin 64x64 matrix, 6.59mm pixel size ECG gated into 8 time bins
Quantitation software
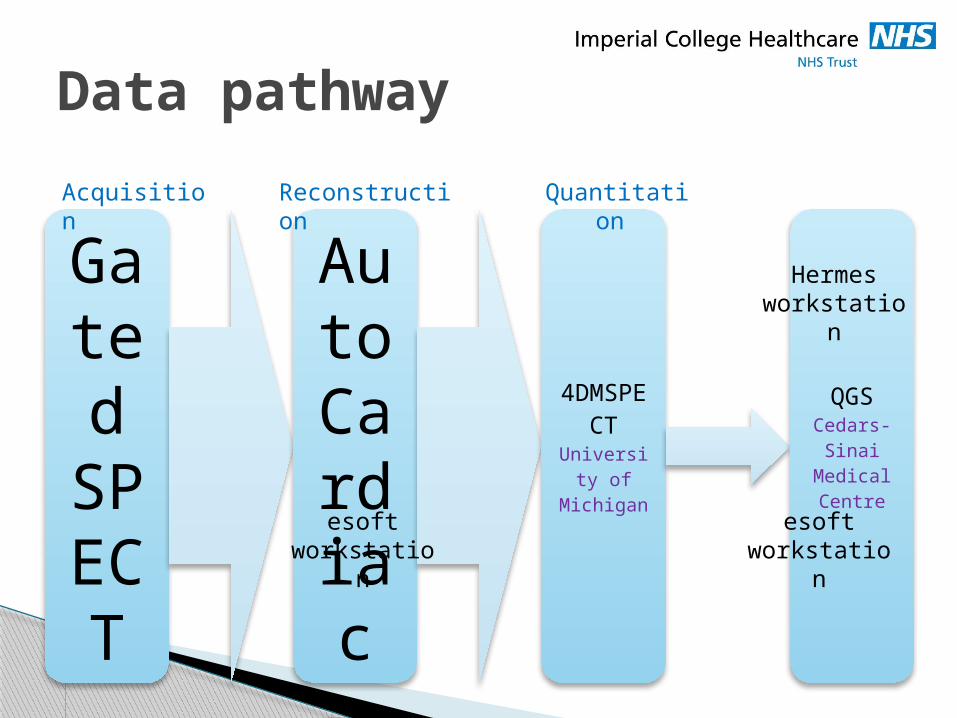
Gated SPECT
AutoCardiac
4DMSPECT
University of
Michigan
QGSCedars-
Sinai Medical Centre
Data pathway
Reconstruction Quantitation Acquisition
Hermes workstation
esoft workstation
esoft workstation
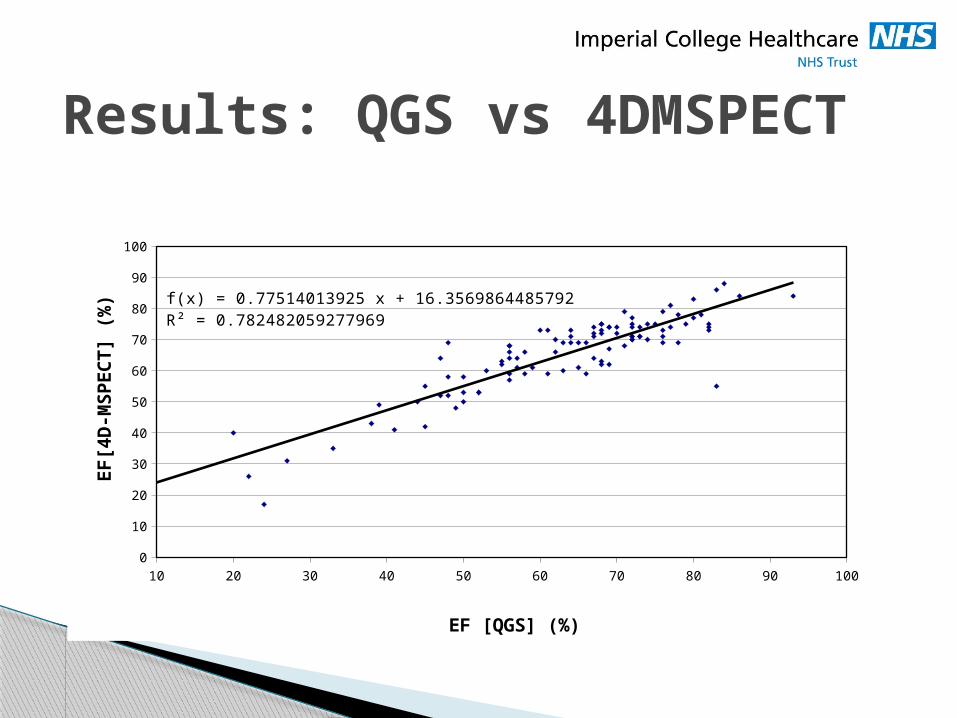
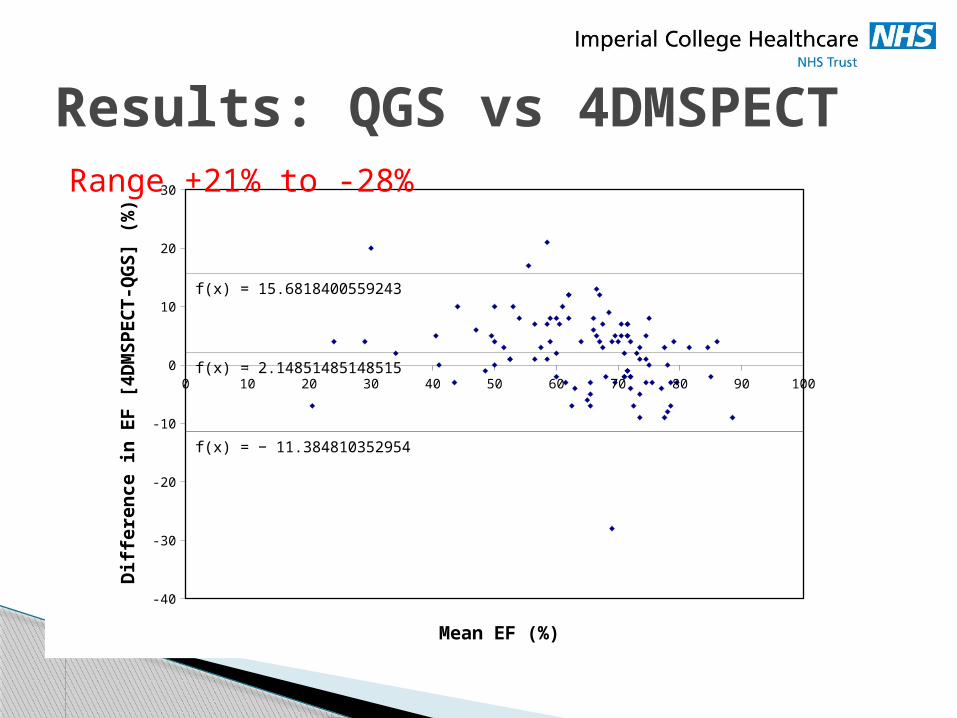
Results: QGS vs 4DMSPECT
10 20 30 40 50 60 70 80 90 1000
10
20
30
40
50
60
70
80
90
100
f(x) = 0.77514013925 x + 16.3569864485792R² = 0.782482059277969
EF [QGS] (%)
EF
[4D
-MS
PE
CT
] (%
)
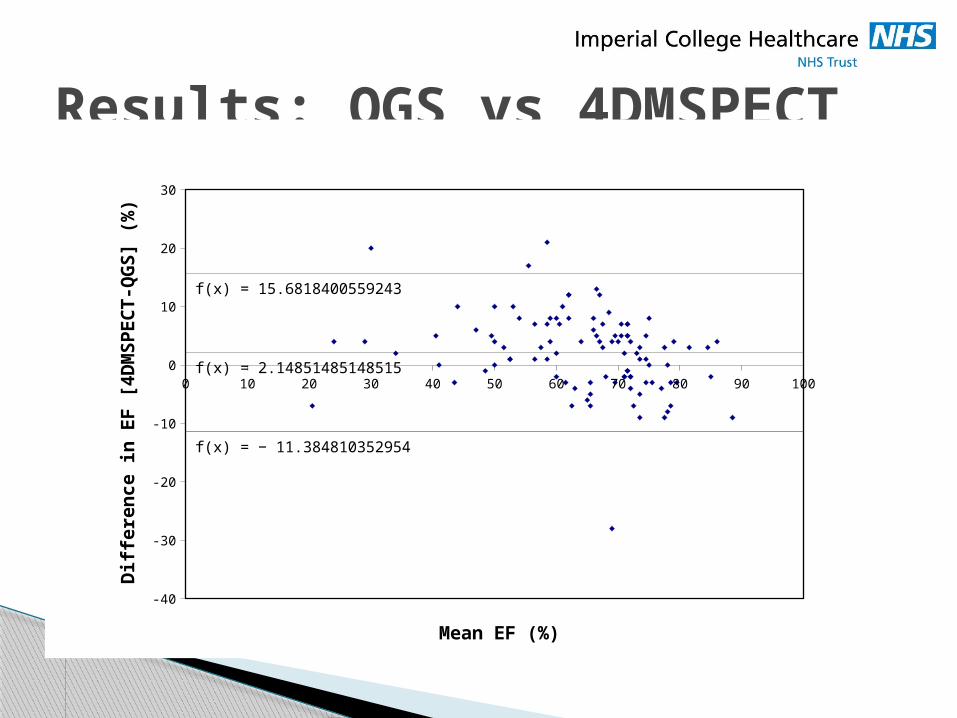
Results: QGS vs 4DMSPECT
0 10 20 30 40 50 60 70 80 90 100
-40
-30
-20
-10
0
10
20
30
f(x) = 2.14851485148515
f(x) = − 11.384810352954
f(x) = 15.6818400559243
Mean EF (%)
Dif
fere
nc
e in
EF
[4
DM
SP
EC
T-Q
GS
] (%
)
0 10 20 30 40 50 60 70 80 90 100
-40
-30
-20
-10
0
10
20
30
f(x) = 2.14851485148515
f(x) = − 11.384810352954
f(x) = 15.6818400559243
Mean EF (%)
Dif
fere
nc
e in
EF
[4
DM
SP
EC
T-Q
GS
] (%
)
Range +21% to -28%
Results: QGS vs 4DMSPECT

Factors affecting quantitation: Heart size
ESV≤30ml [1], 53 patients ESV>30ml, 48 patients
50 55 60 65 70 75 80 85 90 95 100
0
10
20
30
40
50
60
70
80
90
100
f(x) = 0.424530160654744 x + 41.9051682327978R² = 0.252662376020306
EF [QGS] (%)
EF
[4
DM
SP
EC
T]
(%)
10 20 30 40 50 60 70 80 900
10
20
30
40
50
60
70
80
90
f(x) = 0.915562989780487 x + 9.18942761559965R² = 0.77837318232447
EF [QGS] (%)
EF
[4
DM
SP
EC
T]
(%)
[1] Hambye et al. Eur J Nucl Med Mol Imaging. 2004; 31(12):1606-13
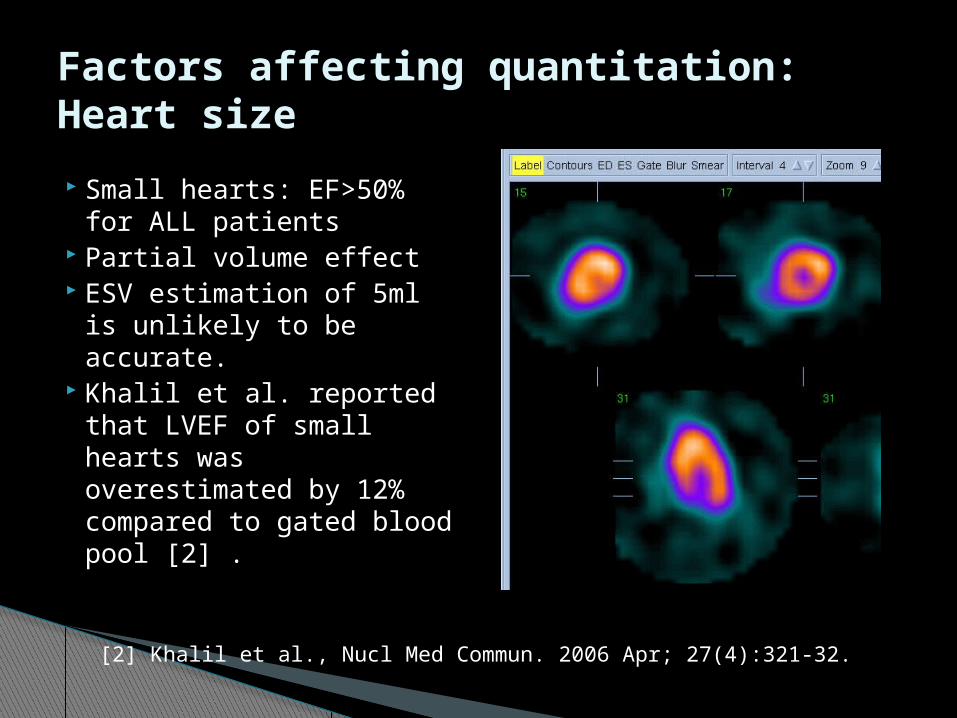
Small hearts: EF>50% for ALL patients
Partial volume effect ESV estimation of 5ml is
unlikely to be accurate. Khalil et al. reported that
LVEF of small hearts was overestimated by 12% compared to gated blood pool [2] .
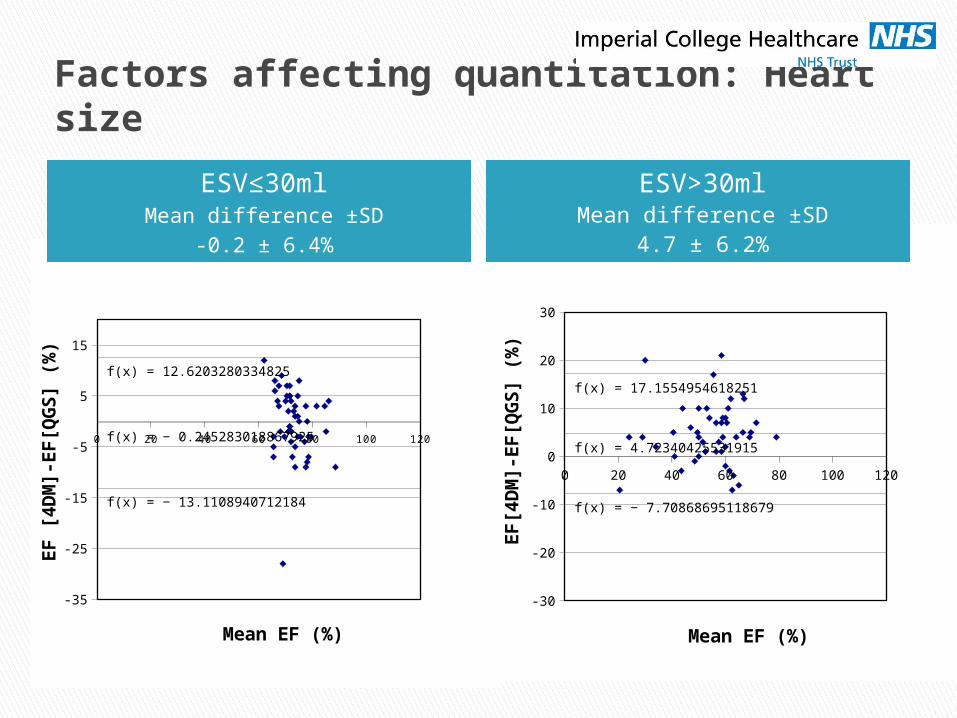
Factors affecting quantitation: Heart size
[2] Khalil et al., Nucl Med Commun. 2006 Apr; 27(4):321-32.
0 20 40 60 80 100 120
-35
-25
-15
-5
5
15
f(x) = − 13.1108940712184
f(x) = 12.6203280334825
f(x) = − 0.245283018867925
Mean EF (%)
EF
[4
DM
]-E
F[Q
GS
] (%
)
Factors affecting quantitation: Heart size
ESV≤30mlMean difference ±SD
-0.2 ± 6.4%
0 20 40 60 80 100 120
-30
-20
-10
0
10
20
30
f(x) = − 7.70868695118679
f(x) = 17.1554954618251
f(x) = 4.72340425531915
Mean EF (%)
EF
[4D
M]-
EF
[QG
S]
(%)
ESV>30mlMean difference ±SD
4.7 ± 6.2%

Manual correction necessary in 5% QGS and 4% 4DMSPECT
Factors affecting quantitation: Manual correction

•High uptake of tracer in the gut
QGS
5/101
•High uptake of tracer in the gut•Inaccurate valve plane positioning [3]
4DMSPECT
4/101
Factors affecting quantitation: Manual correction
Surface that intersects most basal myocardial points
Surface perpendicular to the long axis of heart
[3] Nakajima et al. J Nucl Med. 2001 Oct;42(10):1571-8

Results: QGS vs 4DMSPECT
0 10 20 30 40 50 60 70 80 90 100
-40
-30
-20
-10
0
10
20
30
f(x) = 2.14851485148516
f(x) = − 11.384810352954
f(x) = 15.6818400559243
Mean EF (%)
Dif
fere
nc
e in
EF
[4
DM
SP
EC
T-Q
GS
] (%
)
Large perfusion defects
Manual contour correction to exclude activity in the gut

The effect of perfusion defects on LVEF is controversial.
Vanhove 2002: gated blood pool imaging Concluded that the accuracy of QGS was dependent
on the severity but not the extent of perfusion defects [4].
Valejo 2000: MRI Perfusion defects led to an increase in overestimation
of EF by QGS [5].
Factors affecting quantitation: Perfusion defects
[4] Vanhove et al. Eur J Nucl Med Mol Imag 2002 Jun;29(6):735-41[5] Valejo et al. J Nucl Med. 2000 May;41(5):874-82

(a) (b) (c) (d)
Filtering
Short axis and vertical long axis slices from a patient exhibiting high tracer uptake in the gut. Order 5 Butterworth filter at cut-off frequencies of (a, b) 0.5cycles/cm, (c) 0.6cycles/cm, (d) 0.7cycles/cm.
0.5cycles/cm
0.6cyc/cm 0.7cyc/cm

Van Laere comments that, “Recommended choices for a SPECT filter in the scarce literature on this subject are almost as numerous as the number of authors.” [6]
As the cut-off frequency is increased, larger volumes and smaller LVEFs were estimated using QGS [7].
The volumes and LVEF reported to plateau above 0.50cyc/cm [8].
[6] Van Laere et al. Comput Med Imaging Graph. 2001 Mar-Apr;25(2):127-33. Review.
[7] Kakhki et al. Clin Nucl Med. 2007 May;32(5):404-6.
[8] Nakajima et al. Eur J Nucl Med. 2000 Sep;27(9):1372-9.
Filtering: Published literature
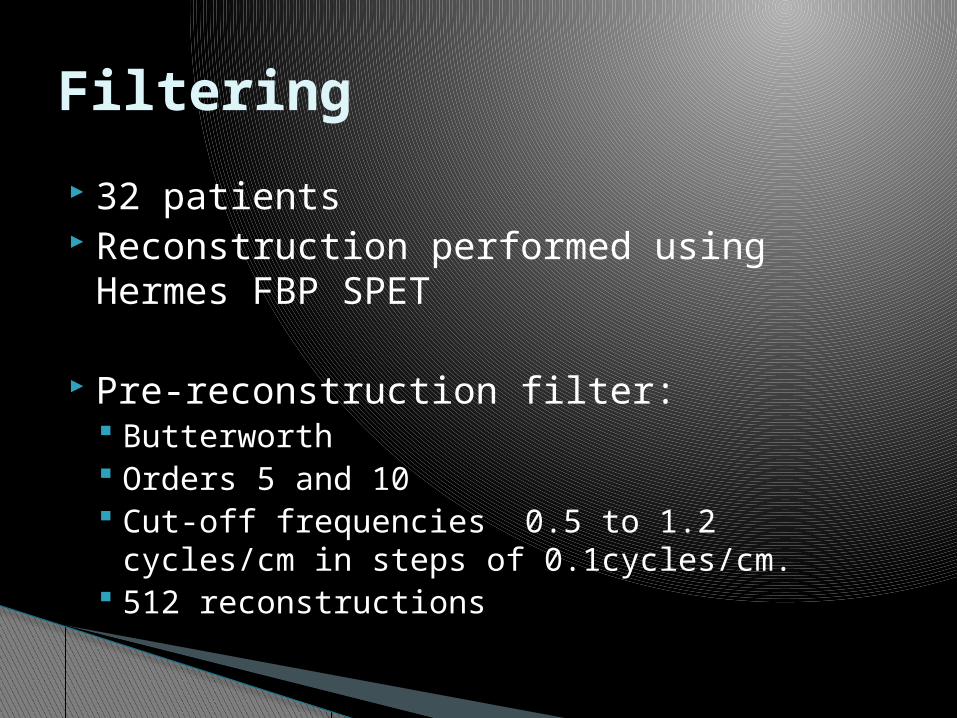
32 patients Reconstruction performed using Hermes
FBP SPET
Pre-reconstruction filter: Butterworth Orders 5 and 10 Cut-off frequencies 0.5 to 1.2 cycles/cm in
steps of 0.1cycles/cm. 512 reconstructions
Filtering

0.4 0.5 0.6 0.7 0.8 0.9 1 1.1 1.2 1.3
-10
0
10
20
30
40
50
Order 5
cut-off frequency (cycles/cm)
% d
iffer
ence
in E
F
Filtering: Results
No obvious plateau
Effect of cut-off frequency on EF is very patient specific

0.4 0.5 0.6 0.7 0.8 0.9 1 1.1 1.2 1.3-10
0
10
20
30
40
50Order 5
cut-off frequency (cycles/cm)
% d
iffer
ence
in E
F
Filtering: Results
At cut-off frequency of 0.5cyc/cm, maximum difference index was 42%.
At cut-off frequencies ≤ 0.8cyc/cm, the EF was overestimated compared to higher cut-off frequencies in 26/30 patients.
Difference index=
For z=0.5 to 1.2cyc/cm

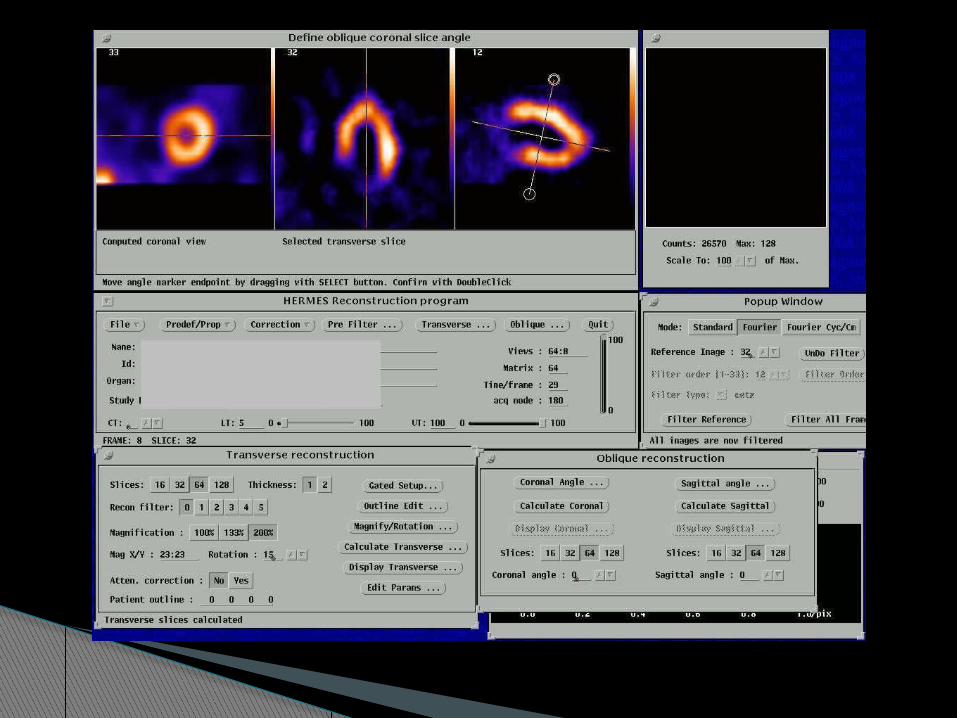
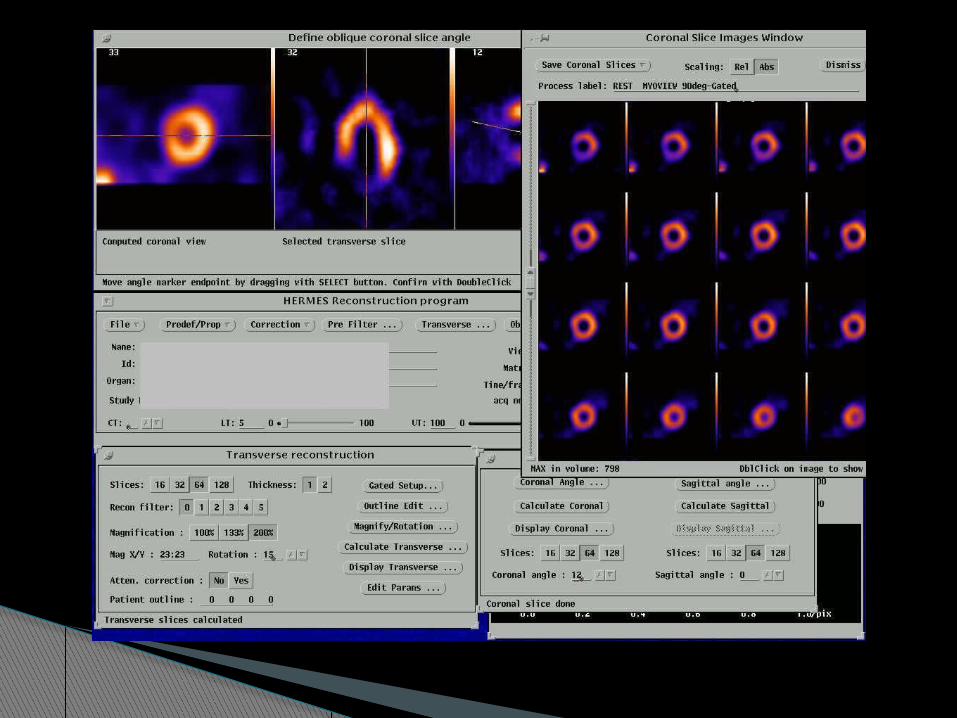
Why do we get large variations? Reconstruction process is not fully
automated. Image is filtered, then axes have to be re-
aligned for each reconstruction.
Filtering: intraoperator reproducibility of reconstruction
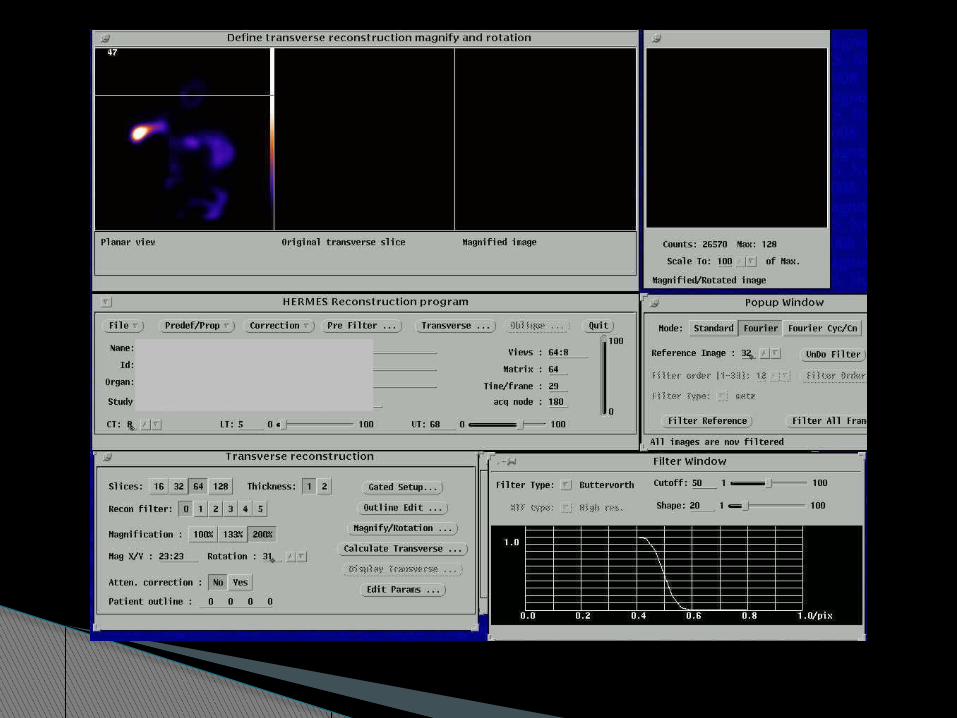
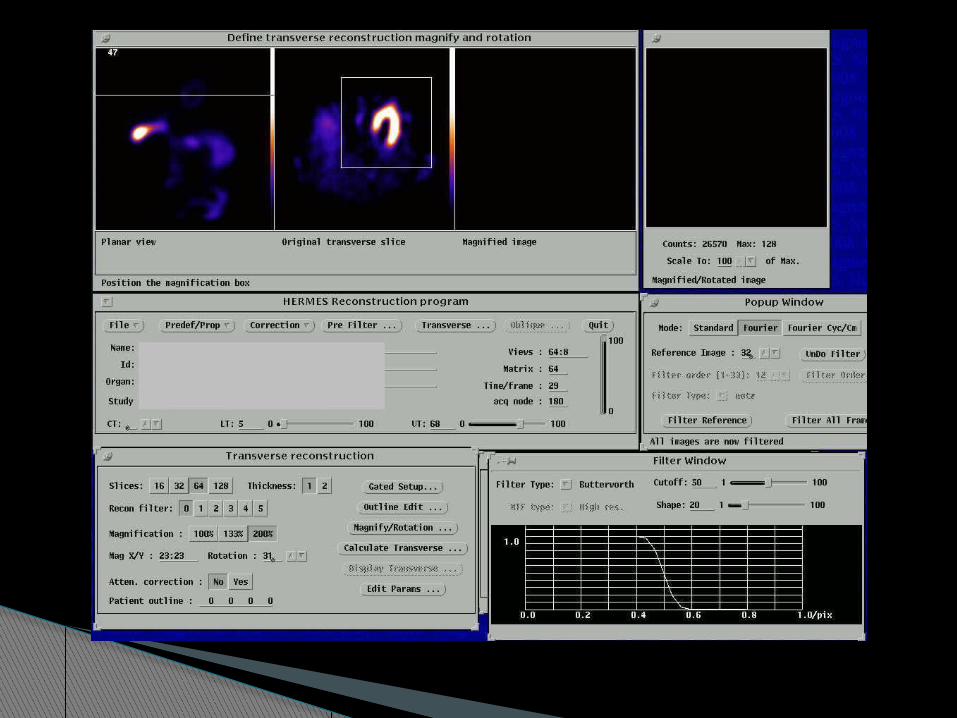

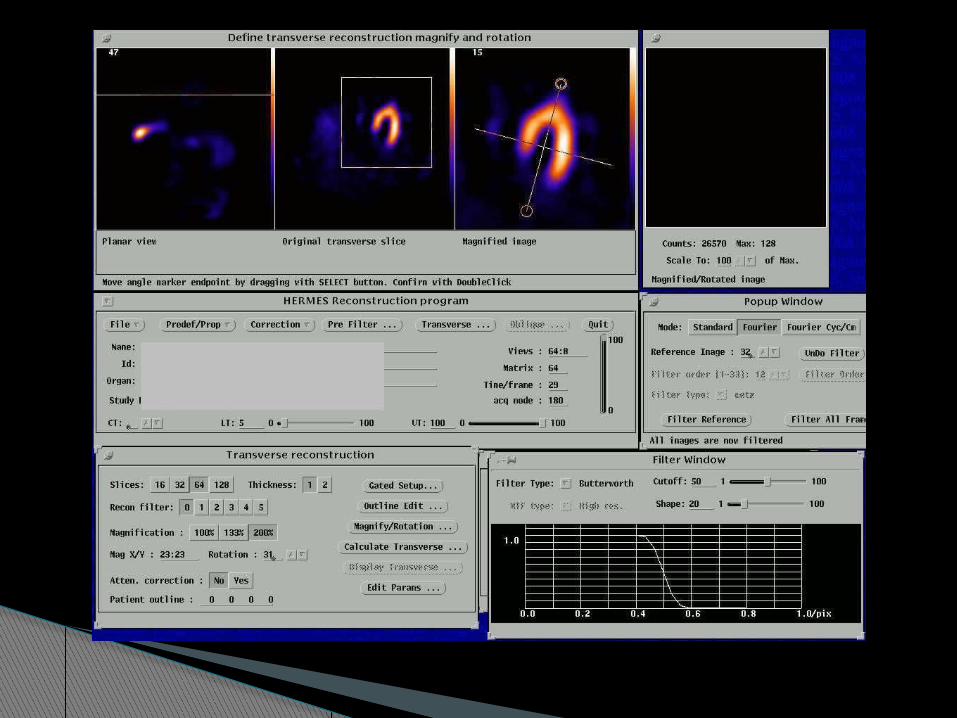
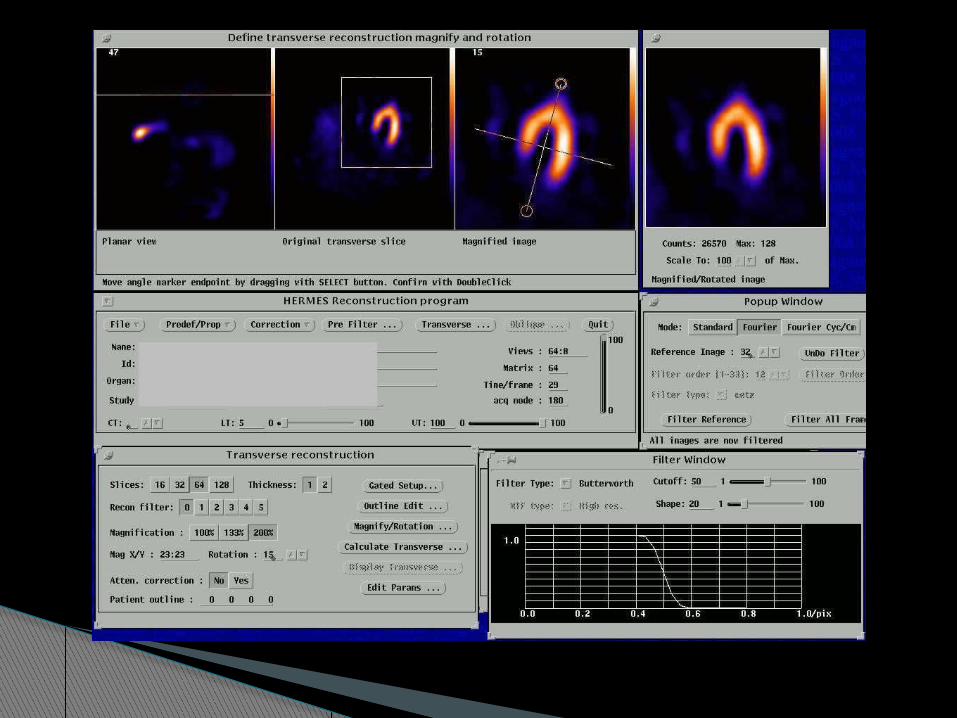


Method: Repeated filtering for first ten patients
(320 reconstructions)
Results: Average difference between initial and repeated
results was <0.1% for both orders Therefore manual axes alignment does not
significantly affect LVEF estimation.
Filtering: intraoperator reproducibility of reconstruction

4DMSPECT and QGS estimate significantly different EFs (range 21% to -28%) and should not be used interchangeably.
The agreement between the packages is worse for small hearts (ESV≤30ml) and may also be affected by severe perfusion defects and manual contour correction.
LVEF is dependent on the cut-off frequency used during pre-reconstruction filtering but the dependency is very patient specific.
Changing the cut-off frequency by as little as 0.1cyc/cm sometimes resulted in changes to the EF of >10 absolute EF percentage points.
Conclusion

Thank you


Related Documents