FLY ME TO THE MOON: THE APPLICATION OF KALMAN FILTER TO TRACKING DATA Jane Tang, Andrew Grenville, Maru/Matchbox Karen Buros, Radius Global Market Research

Welcome message from author
This document is posted to help you gain knowledge. Please leave a comment to let me know what you think about it! Share it to your friends and learn new things together.
Transcript

FLY ME TO THE MOON: THE APPLICATION OF KALMAN FILTER TO TRACKING DATA
Jane Tang, Andrew Grenville, Maru/MatchboxKaren Buros, Radius Global Market Research

Going To The Moon
2https://www.youtube.com/watch?v=aNzGCMRnvXQ/
http://ieeecss.org/CSM/library/2010/june10/11-HistoricalPerspectives.pdf
Presenter
Presentation Notes
“In the 1960s, the Kalman filter was applied to navigation for the Apollo Project, which required estimates of thetrajectories of manned spacecraft going to the Moon and back. “ “The navigation and guidance system developed at MIT included an onboard inertial navigator for measuring accelerations during thrusting periods as well as an onboard optical space sextant for measuring angles between stars and points on the Earth and Moon.” “The EKF was used at ARC and MIT in ground-based simulations to determine the required accuracies of the Apollo space sextant and inertial navigator and to design observation schedules for using the onboard space sextant to satisfy mission navigation requirements without overtaxing the three-man crew.” Difficult to get accurate measurements of the trajectory with the sextant, and relatively longer period in between observations (manual operation, the moon is a constantly moving target @1km/second). KF is never the less able to provide accurate estimate of the trajectory even with unusually large initial trajectory estimation errors. And this is all before we had computer microprocessors. The Kalman filter has numerous applications in technology today, well beyond the navigation systems. the Kalman filter is a widely applied concept in time series analysis used in fields such as signal processing and econometrics. Relevancy to our paper: This is essentially an estimation problem. NASA needed to know the exact trajectory as the spacecraft approach the moon/earth, ideally ahead of the time so corrective maneuvers can be made. Earlier approach was to treat this as estimation of the statistical properties of the random process involved, and was based in the frequency domain. Kalman’s contribution is to reformulate this in time domain, and using existing tools. And it worked. KF provided accurate estimate even in the event of large errors. Tracking a brand in the mind of consumers is similar to tracking the movement of spacecrafts. Both follows a “smooth” trajectatory, but we only get to observe it periodically. And our observation is subject to large random measurement errors. So the key is to optimally separate the signal from the noise.

Video Stablization
3https://www.youtube.com/watch?v=GGNL1LlBSdw
Presenter
Presentation Notes
Kalman Filter allows the video creator to smooth away the jerkiness. The viewers can then focus on the main subject, away from random distractions. This works well for both viewing the movement, and for looking at a still frame picture.

Dynamic Factor Analysis
4
Real-time Brand Health Indexing: Synthesize and Smooth Data from Multi-Indicator Multi-Brand Trackers. Rex Du & Xueming Luo (2013 ART Forum)Improving the Performance of Tracking Studies. Rex Du & Wagner A. Kamakura (2015 ART Forum)
Presenter
Presentation Notes
Kalman Filter has been used in market research field in Dynamic Factor Analysis. The example here shows KF is used to smooth away noise in brand equity data, and accurately depict shocks to the system. It’s a neat idea, but the math is rather complicated.

Kalman Filter For Dummies
5http://bilgin.esme.org/BitsBytes/KalmanFilterforDummies.aspx
http://www.cs.unc.edu/~tracker/media/pdf/SIGGRAPH2001_CoursePack_08.pdf
State Equation
Measurement Equation
Simplifies to simple
random walk
Presenter
Presentation Notes
KF states that the current estimate of X is the weighted average of the new measurement and the last estimate, with the weights determined by the Kalman gain K. This can be accomplished by taking two sets of updates simultaneously, time update and the measurement update. In the Apollo mission , the current trajectory of the ship is determined by: A function of ship’s last position – modified by a transformation matrix of A Controlling input, e.g. how far it has travelled, determined by speed (uk) and a transformation matrix B w is random normal noise with standard deviation of Q The measurement system is determined by: The measurement from the navigation system is based on the current position of the ship, modified by a transformation matrix H. v is random normal noise with standard deviation of R Simplifications – simple random walk: We are looking at one measure, x is one-dimensional. No covariance. No known physical/deterministic process that’s influencing the measures, i.e. no controlling input, u=0, B=0. In a stable environment, x is a constant, so A=1 x is measured directly via z, so H=1 w is normal random noise. We expect the measurment to be fairly stable, so we expect a small variance only, so Q should be set to something small. v is normal random noise with standard deviation of R.

1 2 3 4 5 6 7 8 9 10
0.39 0.5 0.48 0.29 0.25 0.32 0.34 0.48 0.41 0.45
x0=0 0.35 0.42 0.44 0.40 0.37 0.36 0.36 0.38 0.38
p0=1P+Q=
0.091+0.001=0.092
0.05 0.03 0.03 0.02 0.02 0.02 0.02 0.01
p0/(p0+R)=1/(1+0.1)
=0.910.48 0.33 0.25 0.21 0.18 0.16 0.14 0.13 0.13
x0+K(z1-x0)=0+0.91*(0.39-0)
=0.350.42 0.44 0.40 0.37 0.36 0.36 0.38 0.38 0.39
(1-K)*p0 =(1-0.91)*1
=0.0910.05 0.03 0.03 0.02 0.02 0.02 0.01 0.01 0.01
x Estimated
P
TIME
Observed
Measurement Update
Time Updatex
P
K Kalman Gain
An Example
6
Starting points: X0=0, P0=1. Variance Assumptions: R=0.1 - random measurement error, Q=0.001 - variance of shock to the state
Presenter
Presentation Notes
X0 is the starting point for the metric of interest. P0 indicates the amount of weight being placed on the first observation (relative to the R). R captures variance of random measurement error; Q captures variance of shocks to the state.

Starting Point & Variance Assumptions
7
A new starting points: X0=0.4, P0=0.8, Variance Assumptions: R=0.5, Q=0.001
1 2 3 4 5 6 7 8 9 10
0.39 0.5 0.48 0.29 0.25 0.32 0.34 0.48 0.41 0.45
0.23 0.20 0.18 0.17 0.16 0.15 0.15 0.14 0.14 0.000.40 0.42 0.43 0.41 0.38 0.37 0.37 0.38 0.39 0.40
TIME
Observed
K Kalman Gain
Estimated
Presenter
Presentation Notes
The final KF smooth estimate is not sensitive to the starting point. The KF process allows you smooth away the jerkiness in the data. How much smoothing can be controlled by the relative magnitude of R and Q. If Q=0, then all the noise is from the measurement only which is a fairly stringent assumption. Typically this is set to a small non-zero value as we are dealing with a stable system. R typically is very conservative. Better/finely tuned variance assumption can improve performance of KF. If we treat all 10 observations as from sampling perspective (i.e. a proper random process from identifical distribution), that is the order does not matter, the overall mean is the best estimate. However, if we recast the problem in the time domain, then the order of the observations does matter.

1 2 3 4 5 6 7 8 9 10
0.25 0.29 0.32 0.34 0.39 0.41 0.45 0.48 0.48 0.5
0.50 0.38 0.32 0.30 0.28 0.28 0.27 0.27 0.27 0.000.23 0.26 0.28 0.30 0.33 0.35 0.38 0.41 0.43 0.45
TIME
Observed
K Kalman Gain
Estimated
KF vs. Mean
8
Starting points: X0=0, P0=1. Variance Assumption: R=0.1, Q=0.01
Presenter
Presentation Notes
Here I artificially rearranged the data so our observations are monotonically increasing and a higher system variance (i.e. less smoothing). The overall mean does not change, but the KF process does.

Implementing Kalman Filter
9
• Illustrate use in three contexts…. Long-term tracking
Social Media
Small samples

The Truth: I Dread Tracking Data
10
We have large, long-term (6+ years) tracking programs, carefully controlled wave-to-wave, with trend lines like these. How clear is the story?
Continuing to gain ground?
Likelihood to Recommend
Competitor 1
Competitor 2
Competitor 3
Competitor 4
Competitor 5
Competitor 6
Yr 1A Yr 1B Yr 2A Yr 2B Yr 3A Yr 3B Yr 4A Yr 4B Yr 5A Yr 5B Yr 6A Yr 6B Yr 7A
Favorite
Competitor 1
Competitor 2
Competitor 3
Competitor 4
Competitor 5
Competitor 6
Stabilizing?
Losing steam?

Can the Kalman Filter Clarify the Story?
11
First, let’s standardize the results to thebaseline measurement
Then we can apply the Kalman Filter
80
90
100
110
120
130
140
150
160
Kalman Estimate Likely to Recommend: Ratio to Baseline
Competitor 1
Competitor 2
Competitor 3
Competitor 4
Competitor 5
Competitor 6
80
90
100
110
120
130
140
150
160
Observed Likely to Recommend: Ratio to Baseline
Competitor 1
Competitor 2
Competitor 3
Competitor 4
Competitor 5
Competitor 6
What’s happening here?

A More Detailed The Effect of the Filter
12
Kalman Filter for Competitors 2 and 3 – Softening the extremes
80
90
100
110
120
130
140
150
160
Likelihood to Recommend: Competitors 2 and 3
Observed 2
Estimated 2
Observed 3
Estimated 3

Taking a Look at Favorite Brand…
13
We standardize the results to the baselinemeasurement
Then apply the Kalman Filter
40
60
80
100
120
140
160
180
Year1.1
Year1.2
Year2.1
Year2.2 Year3.1
Year3.2
Year4.1
Year4.2
Year5.1
Year5.2
Year6.1
Year6.2
Year7.1
Observed Favorite: Ratio to Baseline
Competitor 1
Competitor 2
Competitor 3
Competitor 4
Competitor 5
Competitor 6
40
60
80
100
120
140
160
180
Kalman Estimate Favorite: Ratio to Baseline
Competitor 1
Competitor 2
Competitor 3
Competitor 4
Competitor 5
Competitor 6
Competitor 4 Suffers

A More Detailed Look at Competitors 4 and 5
14
Again, softening the extremes
40
60
80
100
120
140
160
180
Favorite: Competitors 4 and 5
Observed 4
Estimated 4
Observed 5
Estimated 5
Kalman provides a way to simultaneously account for ‘time’ (as an alternative to ‘three month rolling average’) and measurement error.

Can We Apply This Approach to Social Media Data?
15
Social positive sentiment over the trackingperiod
Application of the Kalman Filter smooths thetrend lines a bit. Greater variation across time islikely due to changing social media audiencecreating the ‘sentiment’ values.
0.40
0.45
0.50
0.55
0.60
0.65
0.70
Social Media: Positive Sentiment
Competitor 1
Competitor 2
Competitor 3
Competitor 4
Competitor 5
Competitor 6
0.40
0.45
0.50
0.55
0.60
0.65
0.70
Kalman Estimate: Positive Sentiment
Competitor 1
Competitor 2
Competitor 3
Competitor 4
Competitor 5
Competitor 6

Can We Apply This Approach to Social Media Data?
16
“Passion” shows marked peaks and valleys in thesocial media data
Kalman Filter smooths the peaks and valleysparticularly for competitors 1,4 and 6 whilemaintaining the overall ‘story’.
0.4
10.4
20.4
30.4
40.4
50.4
60.4
70.4
80.4
Social Media: Passion
Competitor 1
Competitor 2
Competitor 3
Competitor 4
Competitor 5
Competitor 6
0.4
10.4
20.4
30.4
40.4
50.4
60.4
70.4
80.4
Social Media: Kalman Filter Passion
Competitor 1
Competitor 2
Competitor 3
Competitor 4
Competitor 5
Competitor 6

Does Kalman Smoothing Enhance the Comparison of Tracking Data to Social Media Data?
17
It is difficult to discern a relationship between the alternative sets of data
Kalman Smoothing of both Tracking and Social Media data
0
10
20
30
40
50
60
70
Tracking and Social Media Measures Competitor 3
Likely to Recommend (Tracking)
Favorite (Tracking)
Positive Sentiment (Social Media)
Passion (Social Media)
Presenter
Presentation Notes
This raises an important question: how to reconcile survey tracking data with social media tracking data? KF alone won't solve this puzzle.

CRSI & The 2010 Vancouver Olympics
18
• Tracked weekly from 2008 to 2011, genpop Canadian• n=100 per brand per week (total Canada) • 8 sponsorship categories, including Olympics• 7 International sponsors, 7 national sponsors, along with 35
direct competitors, and 173 other brands in their related industries.
Presenter
Presentation Notes
The Olympics was held in the Feb 2010.

Applying KF
19
Royal Bank, Olympic Sponsorship Awareness, Jan 2008 to Jun 2011
Presenter
Presentation Notes
We applied KF to this series of data, assuming we have one big stable process across 4 years. I put in the breaks to help distinguish the calendar year – the observations are continuous on a weekly basis. KF is much more stable than either the original weekly observation and the 4-week RA. But it is slower to pick up the gains at the onset of the games, and slower to drop off as well.

Before (2008) /During (2010) /After (2011)
20
Royal Bank, Olympic Sponsorship Awareness, Jan-Jun 2008 (pre), Jan-Jun 2010 (during), and Jan-Jun 2011 (post)
Presenter
Presentation Notes
There was enough activitiy in 2009 that I didn’t want to use that as the “before” period measure. The first half of 2008, 2010 and 2011 were used to assess each of the before/during/after period. Each of the before/during/after period received its own KF smoothing. The main difference between here and the previous slide is how quickly the new information in the period is allowed to come into the results, i.e. higher Kalman gain for the new observation at the start of each period, and we pick up the changes much more quickly.

Olympic Sponsorship
21
Royal Bank vs. TD Bank: Jan-Jun 2008 (pre), Jan-Jun 2010 (during), and Jan-Jun 2011 (post)
Presenter
Presentation Notes
Awareness of Olympic Sponsorship picks up for RBC (a national sponsor) during the height of the game, and levels off a year later. As expected, erroneous mentions for the main competition (TD bank, not an Olympic sponsor) are much lower, nd drops off during the games but recovers a year later.

Sponsorship of Environmental Organizations
22
Royal Bank vs. TD Bank: Jan-Jun 2008 (pre), Jan-Jun 2010 (during), and Jan-Jun 2011 (post)
Presenter
Presentation Notes
What’s unexpected is the spill-over effect of Olympic to other Sponsorship areas. While TD bank is traditionally strong in the area of sponsorship of environmental organizations, during the Olympics, that’s being overshadowed by the sheer magnitude of the Olympic halo. We see this across all of the 7 sponsorship categories outside of Olympics (some stronger and some weaker), from Amateur/professional sports to Arts/Cultural/Environment to local community/education initiatives.

Sponsorship of Professional Sports
23
Coca-Cola vs. Pepsi: Jan-Jun 2008 (pre), Jan-Jun 2010 (during), and Jan-Jun 2011 (post)
Presenter
Presentation Notes
Even though these effects are generally short lived (disappears after a year), given the Olympics come around once every 2 years, there are implications for sponsorship activities, especially the big international sponsors and their direct competitions.
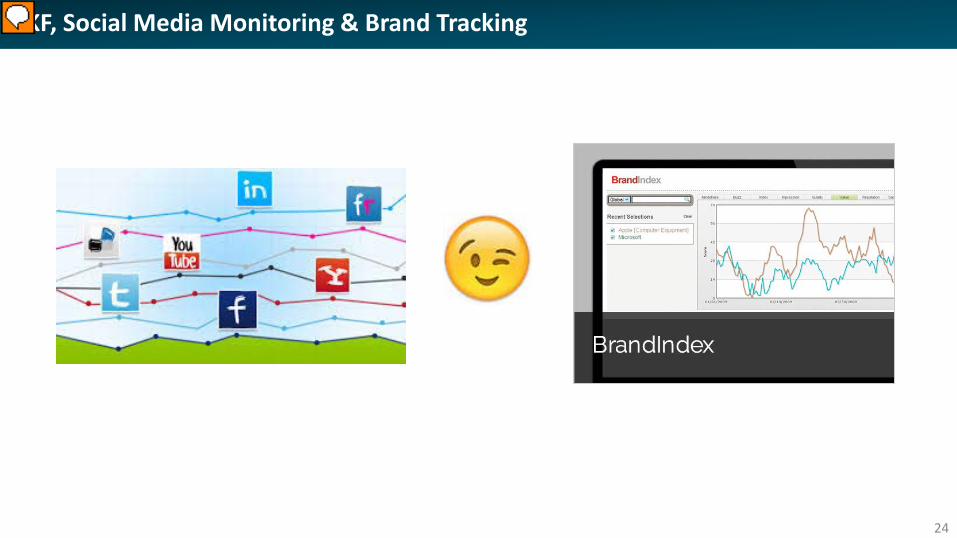
KF, Social Media Monitoring & Brand Tracking
24
Presenter
Presentation Notes
How to reconcile survey tracking data with social media tracking data? KF alone won't solve this puzzle. Even though the social media data doesn’t correlate with brand tracking data, SM can offer clues as to when the brand and the category is facing potential upheaval. KF allows you to incorporate prior information about both the inherent stability of the process, as well as the trustworthiness of the measurement into the calculating, through the use of the Q and R parameters. Q and R need not stay constant throughout the tracking period. When social media monitoring indicating potential upsets to the stable environment, Q & R can be adjusted to bring onboard the new data quickly. Instead of Social media monitoring competiting with brand tracking, we can use Social media monitoring to help inform brand tracking.

Tracking Is Dead!
25
http://www.greenbookblog.org/2015/12/18/ray-poynters-predictions-for-2016/

A Glimpse Of The Futre?
26
Horst Feldhaeuser, Sharing a Coke & a Smile – Why we need to evolve research tracking, Festival of NewMRhttp://newmr.org/play-again/festival-of-newmr-apac-tuesday/
Presenter
Presentation Notes
Coco-colar’s updated global tracker – is this the new future? Timely/automatical data collection and reporting, shorter/modular questionnaire, integrated system, customized alerts & notifications on key metrics. Can KF help? The change to the sample/study design implies more frequent data points (with each data points potentially having smaller sample size) – KF can help smooth out the noise to optimize the alerts and incorporate information from other tracking data.

The Future of Brand Tracking - Ideas?
27
• Agile Study/Project Management
• Agile Sample Deployment:
• Fixed Interval/Fixed Sample size vs. Realtime/Flexible fielding
• Agile Question modules/Mobile
• Incorporting other data stream
• Agile Reporting
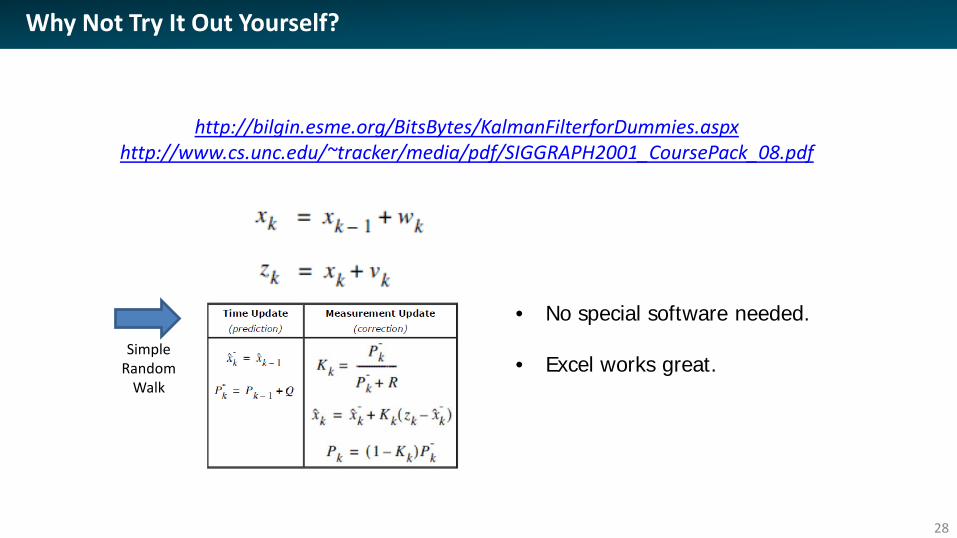
Why Not Try It Out Yourself?
28
http://bilgin.esme.org/BitsBytes/KalmanFilterforDummies.aspxhttp://www.cs.unc.edu/~tracker/media/pdf/SIGGRAPH2001_CoursePack_08.pdf
• No special software needed.
• Excel works great.Simple
Random Walk

Related Documents