Flux-Based vs. Topology-Based Similarity of Metabolic Genes Oleg Rokhlenko 1 , Tomer Shlomi 2, , Roded Sharan 2, , Eytan Ruppin 2 , and Ron Y. Pinter 1 1 Dept. of Computer Science, Technion–IIT, Haifa 32000, Israel {olegro, pinter}@cs.technion.ac.il 2 School of Computer Science, Tel-Aviv University, Tel-Aviv 69978, Israel {shlomito, roded, ruppin}@tau.ac.il Abstract. We present an effectively computable measure of functional gene similarity that is based on metabolic gene activity across a vari- ety of growth media. We applied this measure to 750 genes comprising the metabolic network of the budding yeast. Comparing the in silico computed functional similarities to those obtained by using experimen- tal expression data, we show that our computational method captures similarities beyond those that are obtained by the topological analysis of metabolic networks, thus revealing—at least in part—dynamic character- istics of gene function. We also suggest that network centrality partially explains functional centrality (i.e. the number of functionally highly sim- ilar genes) by reporting a significant correlation between the two. Finally, we find that functional similarities between topologically distant genes occur between genes with different GO annotations. 1 Introduction The study of biological networks has attracted considerable attention in recent years, including the construction of mathematical models to elucidate both cell activity as well as genes’ function and expression. Much of the work to date has attempted to establish measures for the similarity (or distance) between genes that are based on the topological properties of metabolic networks. Even though recent analyses have provided valuable insights regarding this issue [1,2], topo- logical characteristics alone (as devised by e.g. Kharchenko et al. [3], Chen and Vitkup [4]) offer only a static description of the properties of interest. On the other hand, accurate prediction of dynamic cell activity using kinetic models requires detailed information on the rates of enzyme activity which is rarely available; moreover, such analysis is usually limited to small-scale networks. Fortunately, for metabolic networks, the use of stochiometry and other sources of information provides an added value over the topology of the underlying struc- ture. Specifically, constraint-based stochiometric models have emerged as a key Supported in part by the Tauber Fund. Supported by an Alon Fellowship. P. B¨ ucher and B.M.E. Moret (Eds.): WABI 2006, LNBI 4175, pp. 274–285, 2006. c Springer-Verlag Berlin Heidelberg 2006

Welcome message from author
This document is posted to help you gain knowledge. Please leave a comment to let me know what you think about it! Share it to your friends and learn new things together.
Transcript

Flux-Based vs. Topology-Based Similarity
of Metabolic Genes
Oleg Rokhlenko1, Tomer Shlomi2,�, Roded Sharan2,��,Eytan Ruppin2, and Ron Y. Pinter1
1 Dept. of Computer Science, Technion–IIT, Haifa 32000, Israel{olegro, pinter}@cs.technion.ac.il
2 School of Computer Science, Tel-Aviv University, Tel-Aviv 69978, Israel{shlomito, roded, ruppin}@tau.ac.il
Abstract. We present an effectively computable measure of functionalgene similarity that is based on metabolic gene activity across a vari-ety of growth media. We applied this measure to 750 genes comprisingthe metabolic network of the budding yeast. Comparing the in silicocomputed functional similarities to those obtained by using experimen-tal expression data, we show that our computational method capturessimilarities beyond those that are obtained by the topological analysis ofmetabolic networks, thus revealing—at least in part—dynamic character-istics of gene function. We also suggest that network centrality partiallyexplains functional centrality (i.e. the number of functionally highly sim-ilar genes) by reporting a significant correlation between the two. Finally,we find that functional similarities between topologically distant genesoccur between genes with different GO annotations.
1 Introduction
The study of biological networks has attracted considerable attention in recentyears, including the construction of mathematical models to elucidate both cellactivity as well as genes’ function and expression. Much of the work to date hasattempted to establish measures for the similarity (or distance) between genesthat are based on the topological properties of metabolic networks. Even thoughrecent analyses have provided valuable insights regarding this issue [1,2], topo-logical characteristics alone (as devised by e.g. Kharchenko et al. [3], Chen andVitkup [4]) offer only a static description of the properties of interest. On theother hand, accurate prediction of dynamic cell activity using kinetic modelsrequires detailed information on the rates of enzyme activity which is rarelyavailable; moreover, such analysis is usually limited to small-scale networks.
Fortunately, for metabolic networks, the use of stochiometry and other sourcesof information provides an added value over the topology of the underlying struc-ture. Specifically, constraint-based stochiometric models have emerged as a key
� Supported in part by the Tauber Fund.�� Supported by an Alon Fellowship.
P. Bucher and B.M.E. Moret (Eds.): WABI 2006, LNBI 4175, pp. 274–285, 2006.c© Springer-Verlag Berlin Heidelberg 2006
Flux-Based vs. Topology-Based Similarity of Metabolic Genes 275
method for studying such networks permitting large-scale analysis thereof. Theyuse genome-scale networks to predict steady-state metabolic activity, regardlessof specific enzyme kinetics. In these models, stoichiometric, thermodynamic, fluxcapacity and possibly other constraints affect the space of possible flux distrib-utions attainable by a metabolic network.
In this paper we devise an effectively computable functional similarity measurebetween genes that is based on their metabolic activity. Such a measure wouldallow us to perform large scale in silico experiments and predict functional rela-tions that can then be validated by experimental methods. Specifically, we sug-gest a method for determining similarities in gene activities that is based on FluxBalance Analysis (FBA). We first suggest a knockout-based measure but find itto be only moderately correlated with experimental data (of gene co-expression,see below). We then employ a measure of metabolic genes co-activity (MGCA),which tells how similar gene functions are in terms of the correlation betweentheir corresponding flux activity vectors across a large variety of growth media.This latter measure, already used in a more limited scope by [5], is significantlybetter than the former measure in terms of correlation with experimental data.
Our evaluation of the suggested measures is based on testing their correlationswith experimental data on similarity in gene expression, to assess their veracity.The basic relation between metabolic fluxes and gene expression was alreadystudied and established previously both computationally (showing only a mod-erate correlation) as well as experimentally. Recall that the metabolic state ofan organism is controlled via transcriptional regulation which adjusts gene ex-pression levels according to metabolic demands [6]. Previous studies have shownthat the expression patterns of enzyme coding genes are correlated with the fluxpatterns predicted by FBA: Schuster et al. [7,8] and Famili et al. [5] have shownthat genes, associated with fluxes which are predicted to change together whenshifting from one medium to another (e.g. in diauxic shift), are co-expressed un-der these conditions; Reed and Palsson [9] have shown that the genes associatedwith fluxes that are correlated within the solution space also exhibit moderatelevels of correlation in their expression. Recently, Bilu et al. [10] proposed a moredirect relation between expression and flux where the range of possible optimalflux values for a given reaction reflects evolutionary constraints on the expressionlevels of its associated enzymes; specifically, they have shown that the regula-tion of reactions which have an optimal fixed value is under strong selection tomaintain their flux at the precise levels needed, while the regulation of reactionswhich may have a broad range of optimal values is under weaker selection.
In this work we extend upon these previous studies to look into ways of build-ing upon the reported correlation between fluxes and expression, to constructefficient measures of functional similarity among metabolic genes. To this end,in contrast with the previous studies, we examine the relation between fluxesand expression while concomitantly controlling for correlations caused solely bythe network’s topology.
Our comparison focuses on 750 metabolic genes of the yeast Saccharomycescerevisiae. We find the correlation between MGCA and co-expression to be

276 O. Rokhlenko et al.
statistically significant. Furthermore, it remains so even after cancelling theeffect of the underlying (static) network topology. These results support thenotion that our measure indeed captures the true functional similarity betweenmetabolic genes.
2 Preliminaries—Modeling Metabolism and Flux BalanceAnalysis
Flux Balance Analysis (FBA) [11,12] is a particular constraint-based methodwhich assumes that the network is regulated to maximize or minimize a certaincellular function, which is usually taken to be the organism’s growth rate. FBAhas been demonstrated to be a very useful technique for the analysis of metaboliccapabilities of cellular systems [13,14]. It involves carrying out a steady stateanalysis, using the stoichiometric matrix (as defined below) for the system inquestion. The system is assumed to be optimized with respect to functions suchas maximization of biomass production or minimization of nutrient utilization;it is solved accordingly to obtain a steady state flux distribution, which is thenused to interpret the metabolic capabilities of the system.
In FBA, the constraints imposed by stoichiometry in a chemical network atsteady state are analogous to Kirchoff’s Second Law for the flow of currents inelectric circuits [15], namely—for each of the M metabolites in a network the netsum of all production and consumption fluxes, weighted by their stoichiometriccoefficients, is zero:
N∑
j=1
Sijvj = 0, i = 1, . . . , M (1)
Here, Sij is the element of the stoichiometric matrix S corresponding to thestoichiometric coefficient of metabolite i in reaction j. The flux vj is the rateof reaction j at steady state, and is the j-th component of an N -dimensionalflux vector v, where N is the total number of fluxes. In addition to internalfluxes, which are associated with chemical reactions, v includes exchange fluxesthat account for metabolite transport through the membrane. The steady-stateapproximation is generally valid because of the fast equilibration of metaboliteconcentrations (seconds) with respect to the time scale of genetic regulation(minutes) [16].
Additional constraints, including those pertaining to the availability of nutri-ents or to the maximal fluxes that can be supported by enzymatic pathways,can be introduced as the following inequalities:
αj ≤ vj ≤ βj (2)
For example, for a substrate uptake flux vj , one can set αj and βj to be equalto the corresponding measured or imposed values. Eq. 2 can also be used todistinguish reversible and irreversible reactions, where αj = 0 for the latter.

Flux-Based vs. Topology-Based Similarity of Metabolic Genes 277
All flux vectors that satisfy the constraints mentioned above define a feasiblespace, Φ. For an underdetermined system, as is typically the case in FBA mod-els of cellular metabolic networks [13], Φ is a convex set in the N -dimensionalspace of fluxes [17]. Due to the linear nature of Φ, it is possible to use linearprogramming [18] to characterize the points in Φ that maximize or minimizea given linear objective function. A natural choice for an objective function inmetabolic models of prokaryotes and simple eukaryotes is biomass production[13,14], as it is reasonable to hypothesize that unicellular organisms have evolvedtowards maximal growth performance. This process is formalized by introducinga growth flux that transforms a linear combination of fundamental metabolicprecursors into biomass.
The maximization of biomass production is implemented by defining an ad-ditional flux vgro associated with cell growth. For this flux, the stoichiometricfactors of the reactants are the experimentally known proportions ci of metabo-lite precursors Xi contributing to biomass production [13]:
c1X1 + c2X2 + . . . + cMXMvgro→ Biomass (3)
The search for the flux vector maximizing vgro under the constraints of Eqs.1 and 2 is solved using the Simplex algorithm.
The theoretical basis of FBA is supported by several experiments. These in-clude empirical validation of growth yield and flux predictions [13,14], measure-ments of uptake rates around the optimum under various conditions [19], andresults from large-scale gene deletion experiments [20].
For the stoichiometric analysis of the metabolic network of S. cerevisiae, wehave used the reconstruction by Duarte, Herrgard, and Palsson [21]. The nodes ofthis network correspond to metabolic genes, and the edges correspond to the con-nections established by metabolic reactions. Two metabolic genes are connectedif the corresponding enzymes share a common metabolite among their substratesor products. The list of metabolic reactions, and the 1060 (metabolites) by 1149(fluxes) stoichiometric matrix (available at http://gcrg.ucsd.edu) were com-piled using data from public databases and the literature. The 1149 reactions areassociated with 750 genes. As in previous FBA formulations, we use inequalities(Eq. 2) to limit nutrient uptake and to implement reactions’ irreversibility. In ad-dition to the 1149 internal reactions, we added to the model 116 uptake/excretionreactions, for each of the metabolites listed as “extracellular” in the basic model.
3 Similarity Measures for Metabolic Genes
In the context of the aforementioned motivation, we suggest two techniques forobtaining the distance between metabolic genes: a knockout-functional (KF)scheme and a growth-functional (GF) scheme. The biological plausibility of theobtained distance measures is validated by correlating them with the correspond-ing similarity measure obtained by expression data.
278 O. Rokhlenko et al.
3.1 Knockout-Functional Scheme
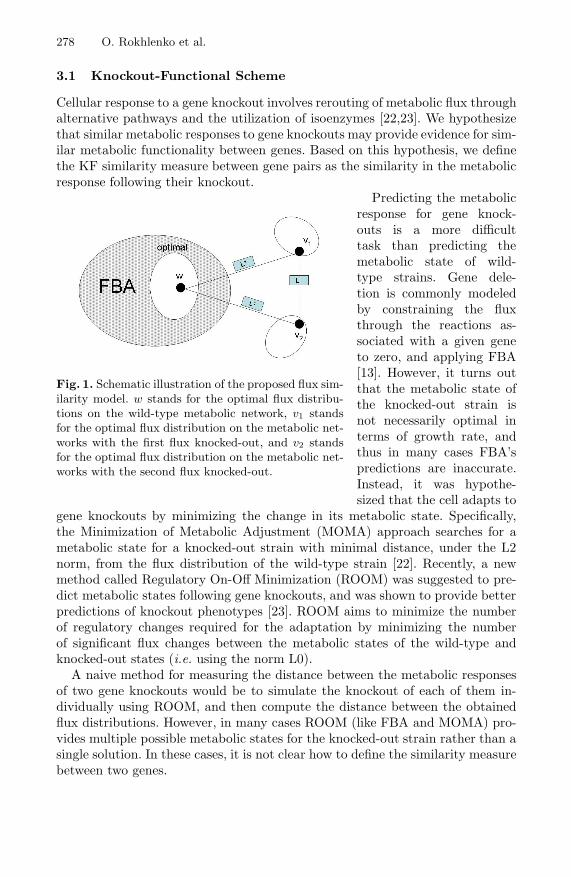
Cellular response to a gene knockout involves rerouting of metabolic flux throughalternative pathways and the utilization of isoenzymes [22,23]. We hypothesizethat similar metabolic responses to gene knockouts may provide evidence for sim-ilar metabolic functionality between genes. Based on this hypothesis, we definethe KF similarity measure between gene pairs as the similarity in the metabolicresponse following their knockout.
Fig. 1. Schematic illustration of the proposed flux sim-ilarity model. w stands for the optimal flux distribu-tions on the wild-type metabolic network, v1 standsfor the optimal flux distribution on the metabolic net-works with the first flux knocked-out, and v2 standsfor the optimal flux distribution on the metabolic net-works with the second flux knocked-out.
Predicting the metabolicresponse for gene knock-outs is a more difficulttask than predicting themetabolic state of wild-type strains. Gene dele-tion is commonly modeledby constraining the fluxthrough the reactions as-sociated with a given geneto zero, and applying FBA[13]. However, it turns outthat the metabolic state ofthe knocked-out strain isnot necessarily optimal interms of growth rate, andthus in many cases FBA’spredictions are inaccurate.Instead, it was hypothe-sized that the cell adapts to
gene knockouts by minimizing the change in its metabolic state. Specifically,the Minimization of Metabolic Adjustment (MOMA) approach searches for ametabolic state for a knocked-out strain with minimal distance, under the L2norm, from the flux distribution of the wild-type strain [22]. Recently, a newmethod called Regulatory On-Off Minimization (ROOM) was suggested to pre-dict metabolic states following gene knockouts, and was shown to provide betterpredictions of knockout phenotypes [23]. ROOM aims to minimize the numberof regulatory changes required for the adaptation by minimizing the numberof significant flux changes between the metabolic states of the wild-type andknocked-out states (i.e. using the norm L0).
A naive method for measuring the distance between the metabolic responsesof two gene knockouts would be to simulate the knockout of each of them in-dividually using ROOM, and then compute the distance between the obtainedflux distributions. However, in many cases ROOM (like FBA and MOMA) pro-vides multiple possible metabolic states for the knocked-out strain rather than asingle solution. In these cases, it is not clear how to define the similarity measurebetween two genes.

Flux-Based vs. Topology-Based Similarity of Metabolic Genes 279
To overcome this problem we define the KF similarity measure as the mini-mal distance between the optimal ROOM solutions for the two genes1. This isachieved by formulating a single optimization problem to find two ROOM so-lutions with minimal distance between them. The schematic illustration of ourmodel is presented in Figure 1.
Notably this formulation depends on the choice of a wild-type and thus werepeat our analysis for several different wild-types. Furthermore, since ROOMrequires Mixed Integer Linear Programming (MILP) optimization which is NP-hard, we use a relaxed version of ROOM and, in addition, we use the L1 norminstead of L0. The use of the L1 norm is similar to a variant of ROOM, calledROOM-LP, that was shown to provide similar predictions to ROOM [23]. TheL1 norm was also used by Kuepfer et. al. [24] for a similar purpose of knockoutprediction. The distance between the two flux distributions of the knocked-outstrains is also minimized using the L1 norm.
The optimization problem is formulated as a LP problem as follows:
min ‖v1 − v2‖L1
s.t.S · v1 = 0; vmin ≤ v1 ≤ vmax; v1[ko1] = 0, ko1 ∈ A1;S · v2 = 0; vmin ≤ v2 ≤ vmax; v2[ko2] = 0, ko2 ∈ A2;‖w − v1‖L1 = l1; ‖w − v2‖L1 = l2;
where w is the wild-type flux distribution, A1 and A2 are sets of reactions as-sociated with the deleted genes, and li (i = 1, 2) are the optimal solutions of asingle optimization problem:
min ‖v − w‖L1
s.t.S · v = 0; vmin ≤ v ≤ vmax; vko1 = 0, ko1 ∈ A;
Solving the above optimization problem we receive a measure of similaritybetween fluxes.
3.2 Growth-Functional Scheme
We hypothesize that the regulation of reactions that are active (different thanzero) together across certain media and passive (equal to zero) together acrossothers should be similar. In order to evaluate our hypothesis, we follow andextend the approach of [10], computing genes’ activities across 100 randomlygenerated growth media.
To pursue this possibility we used flux variability analysis [9,25]: for eachreaction we computed the maximal and minimal flux values attainable in thespace of optimal flux distributions for growth conditions simulating 100 different
1 We use the distance notion instead of the similarity one both in the KF and GFschemes for sake of clarity and for being consistent with commonly used networktopology distances.
280 O. Rokhlenko et al.
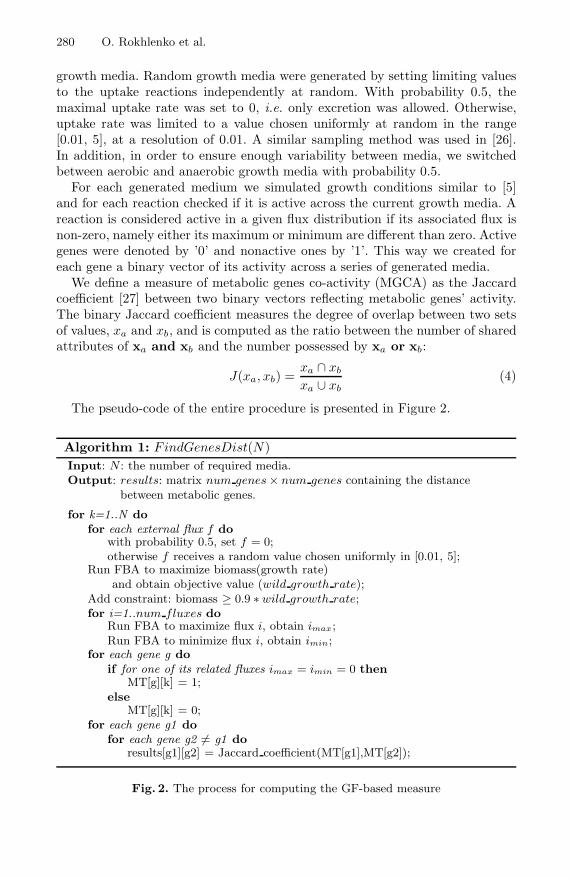
growth media. Random growth media were generated by setting limiting valuesto the uptake reactions independently at random. With probability 0.5, themaximal uptake rate was set to 0, i.e. only excretion was allowed. Otherwise,uptake rate was limited to a value chosen uniformly at random in the range[0.01, 5], at a resolution of 0.01. A similar sampling method was used in [26].In addition, in order to ensure enough variability between media, we switchedbetween aerobic and anaerobic growth media with probability 0.5.
For each generated medium we simulated growth conditions similar to [5]and for each reaction checked if it is active across the current growth media. Areaction is considered active in a given flux distribution if its associated flux isnon-zero, namely either its maximum or minimum are different than zero. Activegenes were denoted by ’0’ and nonactive ones by ’1’. This way we created foreach gene a binary vector of its activity across a series of generated media.
We define a measure of metabolic genes co-activity (MGCA) as the Jaccardcoefficient [27] between two binary vectors reflecting metabolic genes’ activity.The binary Jaccard coefficient measures the degree of overlap between two setsof values, xa and xb, and is computed as the ratio between the number of sharedattributes of xa and xb and the number possessed by xa or xb:
J(xa, xb) =xa ∩ xb
xa ∪ xb(4)
The pseudo-code of the entire procedure is presented in Figure 2.
Algorithm 1: FindGenesDist(N)Input: N : the number of required media.Output: results: matrix num genes × num genes containing the distance
between metabolic genes.
for k=1..N dofor each external flux f do
with probability 0.5, set f = 0;otherwise f receives a random value chosen uniformly in [0.01, 5];
Run FBA to maximize biomass(growth rate)and obtain objective value (wild growth rate);
Add constraint: biomass ≥ 0.9 ∗ wild growth rate;for i=1..num fluxes do
Run FBA to maximize flux i, obtain imax;Run FBA to minimize flux i, obtain imin;
for each gene g doif for one of its related fluxes imax = imin = 0 then
MT[g][k] = 1;else
MT[g][k] = 0;for each gene g1 do
for each gene g2 �= g1 doresults[g1][g2] = Jaccard coefficient(MT[g1],MT[g2]);
Fig. 2. The process for computing the GF-based measure
Flux-Based vs. Topology-Based Similarity of Metabolic Genes 281
4 Results
Recall that the metabolic state of an organism is controlled by transcriptionalregulation which adjusts gene expression levels according to metabolic demands[6]. Thus the experimental pairwise correlations serve as the true benchmark rodto which we compare the computational measures we compute to find out whichis the best, i.e. closest to reality.
The first computational similarity measure proposed [3] was based on topologi-cal properties of the metabolic network . We start by repeating these experimentsand then show how our measure can go beyond topological measures.
The obtained metabolic network is used to calculate network distance betweengenes. We define a pair of directly connected metabolic genes as separated bydistance 1, and the network distance between genes X and Y is the length ofthe shortest path from X to Y in the metabolic network. While any metabolitecan be used to establish connections between metabolic genes, the relationshipsestablished by the common metabolites and cofactors—such as ATP, water orhydrogen—are not likely to connect genes with similar metabolic functions.
In compiling a metabolic network, we consider a subset of metabolites whichexcludes the most highly connected metabolic species. An exclusion thresholdwas determined based on the connectivity of the resulting network. A total of the10 most highly connected metabolites (ATP, ADP, AMP, CO2, H, H2O, NADP,NADPH, phosphate and diphosphate), which compose 1% of all metabolites,and their mitochondrial and external analogs were excluded. We also tried toexclude up to the top 3% of all metabolites, however we found out that thegeneral trends described in this paper are not sensitive to the precise choice ofthe excluded set of metabolites.
We compared the correlation between the gene functional similarity measureand their expression similarity. To this end, we used Rosetta’s “compendium”dataset [28] which measures expression profiles of over 6200 S. cerevisae ORFsacross 287 deletion strains and 13 chemical conditions. In addition, the datasetcontains 63 negative control measurements comparing two independent culturesof the same strain. These were used to establish individual error models for eachORF, providing not only the raw intensity and the ratio measurement values foreach experimental data point, but also a p-value evaluating the significance ofchange in expression level. The expression similarity measure between ORFs Xand Y was computed according to 1− Spearman rank(px, py) where px and py
are expression profile vectors of X and Y , respectively, and the Spearman rankwas calculated as in [29].
As in [3], we observed that the expression distance increases monotonicallywith network distance (R2 = 0.78, p-value = 1.2 · 10−8), demonstrating thatgenes closer to each other in the metabolic network tend to have, on average,higher level of coexpression.
Measuring the correlation between the KF-based distance and those based onthe expression data we observed (see Figure 3) a moderate correlation (R2=0.36in the negatively correlated expressed profiles with a p-value of 8.6 · 10−2 , andR2 = 0.45 in the positively ones with a p-value of ≤ 4.6 · 10−2 ). Note that the

282 O. Rokhlenko et al.
(a) (b)
Fig. 3. Correlation between expression levels and genes activities under the KF mea-sure. (a) Negatively expressed pairs. (b) Positively expressed pairs.
(a) (b)
Fig. 4. Correlation between expression levels and genes’ activities under the GF mea-sure. (a) Negatively expressed pairs. (b) Positively expressed pairs.
obtained correlation is robust to the initial wild-type metabolic state, as similarcorrelation levels were observed when starting from different wild-types.
As for the GF-based measure, we observe (see Figure 4) that it exhibits asignificant correlation with the expression similarity (R2 = 0.78 in the negativelycorrelated expressed profiles with a p-value of 5.15 · 10−8, and R2 = 0.94 in thepositively ones with p-value ≤ 1 · 10−20).
Finally, we observe a significant enhancement of the GF-based measure overthe static (topological) metabolic distance indicating that this static distancecan explain only partially the demand for common regulation. We use a partialcorrelation method that describes the relationship between two variables whilsteliminating the effects of another variable on this relationship, namely networkdistance in our case. Our results show significant partial correlation (R2=0.65,

Flux-Based vs. Topology-Based Similarity of Metabolic Genes 283
with a p-value of 3.8 · 10−6) between expression levels and our MGCA measuregiven a metabolic network distance. This higher correlation for our measuresupports the fact that the FBA model captures the dynamic metabolic activityof the cell, and that the regulation system indeed works to maximize the growthrate. Moreover, the results stay significant with every thresholds for excluding“currency metabolites” from the metabolic network in the range from 1% to 3%.
In order to evaluate the difference between the MGCA measure and themetabolic network distance measure we analyzed two sets of pairs of genes:one containing pairs of genes that are close under the network distance and dis-tant under the MGCA measure, and vice versa. We observed that the first setis significantly enriched with the GO term protein biosynthesis (GO:006412)—25 annotated genes out of 104 resulting in a p-value ≤ 0.001, as well as withthe GO term nucleobase, nucleoside, nucleotide and nucleic acid metabolism(GO:006139)—40 annotated genes out of 104 also resulting in a p-value ≤ 0.001.An engrossing result was that the complementary set (genes that are close un-der the MGCA measure but are distant under the network topology measure)showed no significant enrichment, possibly testifying that such functional simi-larities occur across a broad and homogeneous span of functional annotations.
Fig. 5. The correlation between functional centralityand network centrality
Functional enrichmentswere computed based onthe GO-SLIM process an-notations [30] for genes.Yeast GO-SLIM annota-tions were obtained fromSGD [31]. For a given setS and a given term t,the functional enrichmentscore was computed as fol-lows: suppose S has n(t)genes that are annotatedwith term t (or with amore specific term). Letp(t) be the hypergeomet-ric probability for observ-ing n(t) or more proteinsannotated with the term tin a protein subset of size
|S|. Having found a term t0 with minimal probability p(t0), the score was set tothe p-value of the enrichment under term t0, computed by comparing p(t0) withthe analogous probabilities for 10,000 random sets of proteins of size |S|.
In addition we looked at the correlation between the network degree of eachgene and its functional degree, i.e. the number of functionally highly similar(Jaccard coefficient ≤ 0.3) genes (see Figure 5). As we received a significantcorrelation of R2 = 0.4 with a p-value ≤ 0.001, it seems that network centralityexplains (at least in part) functional centrality. Namely, the more alternative
284 O. Rokhlenko et al.
pathways go through a given gene, the more functionally significant it is. We alsoobserved that the correlation is robust to the functionally similarity thresholdin the range form 0.01 to 0.3.
5 Conclusions
This paper is the first to show that functional flux-based similarity measures be-tween genes can go beyond previous computational measures based onnetwork topology. We applied two schemes to compute this distance: the knockout-functional (KF) scheme and the growth-functional (GF) scheme. While the for-mer shows a fairly moderate correlation with the experimental results, the lat-ter provides a strong, statistically-significant measure. One possible explana-tion of this behavior may be that the GF studies probe the natural wild typeacross a variety of media, whereas the KF method does it in less natural strainsand in a sole media. The other reason is the more cumbersome computationalmethod used in the KF case, which is likely to add significant noise to the resultsobtained.
References
1. Jeong, H., Tombor, B., Albert, R., Oltavi, Z., Barabasi, A.: The large-scale orga-nization of metabolic networks. Nature 407 (2000) 651–654
2. Ravasz, E., Somera, A., Mongru, D., Oltvai, Z., Barabasi, A.: Hierarchical organi-zation of modularity in metabolic networks. Science 297 (2002) 1551–1555
3. Kharchenko, P., Church, G.M., Vitkup, D.: Expression dynamics of a cellularmetabolic network. Molecular Systems Biology 1 (2005) E1–E6
4. Chen, L., Vitkup, D.: Predicting genes for orphan metabolic activities using phy-logenetic profiles. Genome Biol. 7 (2006) R17
5. Famili, I., Forster, J., Nielsen, J., Palsson, B.Ø.: Saccharomyces cerevisiae phe-notypes can be predicted by using constraint-based analysis of a genome-scalereconstructed metabolic network. Proc Natl Acad Sci U S A 100 (2003) 13134–13139
6. Zaslaver, A., Mayo, A., Rosenberg, R., Bashkin, P., Sberro, H., et al: Just-in-timetranscription program in metabolic pathways. Nat Genet 36 (2004) 486–491
7. Schuster, S., Dandekar, T., Fell, D.: Detection of elementary flux modes in bio-chemical networks: a promising tool for pathway analysis and metabolic engineer-ing. Trends Biotechnol 17 (1999) 53–60
8. Schuster, S., Klamt, S., Weckwerth, W., Moldenhauer, F., Pfeiffer, T.: Use of net-work analysis of metabolic systems in bioengineering. Bioprocess and BiosystemsEngineering 24 (2002) 363–372
9. Reed, J., Palsson, B.: Genome-scale in silico models of e. coli have multiple equiv-alent phenotypic states: assessment of correlated reaction subsets that comprisenetwork states. Genome Res 14 (2004) 1797–1805
10. Bilu, Y., Shlomi, T., Barkai, N., Ruppin, E.: Conservation of expression and se-quence of metabolic genes is reflected by activity across metabolic states. PLoSComp. Bio. (in press) (2006)
Flux-Based vs. Topology-Based Similarity of Metabolic Genes 285
11. Fell, D., Small, J.: Fat synthesis in adipose tissue. An examination of stoichiometricconstraints. Biochem J 238 (1986) 781–786
12. Kauffman, K., Prakash, P., Edwards, J.: Advances in flux balance analysis. CurrOpin Biotechnol 14 (2003) 491–496
13. Price, N.D., Reed, J.L., Palsson, B.Ø.: Genome-scale Models of Microbial Cells:Evaluating the consequences of constraints. Nature Reviews Microbiology 2 (2004)886–897
14. Varma, A., Palsson, B.: Metabolic capabilities of Escherichia coli: II. Optimalgrowth patterns. J. Theor. Biol. 165 (1993) 503–522
15. Schilling, C.H., Edwards, J.S., Palsson, B.: Toward metabolic phenomics: analysisof genomic data using flux balances. Biotechnol. Prog 15 (1999) 288–295
16. Fell, D.: Understanding the Control of Metabolism. Portland Press, London (1996)17. Schilling, C.H., Edwards, J.S., Letscher, D., Palsson, B.Ø.: Combining pathway
analysis with flux balance analysis for the comprehensive study of metabolic sys-tems. Biotechnol. Bioeng. 71 (2000) 286–306
18. Vanderbei, R.J.: Linear Programming: Foundations and Extensions. Kluwer Aca-demic Publishers, Boston (1996)
19. Edwards, J., Ibarra, R., Palsson, B.: In silico predictions of Escherichia colimetabolic capabilities are consistent with experimental data. Nat Biotechnol 19(2001) 125–130
20. Badarinarayana, V., Estep, P.W., Shendure, J., Edwards, J., Tavazoie, S., Lam, F.,Church, G.M.: Selection analyses of insertional mutants using subgenic-resolutionarrays. Nat. Biotechnol. 19 (2001) 1060–1065
21. Duarte, N., Herrgard, M., Palsson, B.Ø.: Reconstruction and validation of Sac-charomyces cerevisiae iND750, a fully compartmentalized genome-scale metabolicmodel. Genome Res 14 (2004) 1298–1309
22. Segre, D., Vitkup, D., Church, G.: Analysis of optimality in natural and perturbedmetabolic networks. Proc. Natl. Acad. Sci. U. S. A. 99 (2002) 15112–15117
23. Shlomi, T., Berkman, O., Ruppin, E.: Regulatory on/off minimization of metabolicflux changes after genetic perturbations. Proc. Natl. Acad. Sci. U. S. A. 102 (2005)7695–7700
24. Kuepfer, L., Sauer, U., Blank, L.M.: Metabolic functions of duplicate genes inSaccharomyces cerevisiae. Genome Res. 15 (2005) 1421–1430
25. Mahadevan, R., Schilling, C.: The effects of alternate optimal solutions inconstraint-based genome-scale metabolic models. Metab Eng 5 (2003) 264–276
26. Almaas, E., Oltvai, Z., Barabasi, A.: The activity reaction core and plasticity ofmetabolic networks. PLoS Comput Biol 1 (2005) e68
27. Salton, G., McGill, M.J.: Introduction to Modern Information Retrieval. McGraw-Hill, New-York (1983)
28. Hughes, T., et. al.: Flux analysis of underdetermined metabolic networks: the questfor the missing constraints. Cell 102 (2000) 109–126
29. Press, W.H., Teukolsky, S.A., Vetterling, W.T., Flannery, B.P.: Numerical Recipesin C++: the art of scientific computing. Cambridge University Press, Cambridge(2002)
30. Ashburner, M., et. al.: Gene Ontology: tool for the unification of biology. Nat.Genet. 25 (2000) 25–29
31. Issel-Tarver, L., et. al.: Saccharomyces Genome Database. Methods Enzymol 350(2002) 329–346
Related Documents