23356 23356.5 23357 23357.5 23358 23358.5 23359 23359.5 23360 .5 .6 .7 .8 .9 1 1.1 Relative Flux LMC 1.27 HF

Welcome message from author
This document is posted to help you gain knowledge. Please leave a comment to let me know what you think about it! Share it to your friends and learn new things together.
Transcript

23356 23356.5 23357 23357.5 23358 23358.5 23359 23359.5 23360.5
.6
.7
.8
.9
1
1.1R
elat
ive
Flu
x
LMC 1.27HF

23356 23357 23358 23359 23360 23361 23362 23363 23364
.4
.6
.8
1
Rel
ativ
e F
lux
ROA324
HF
CO

7 7.5 8 8.5 9 9.5
3
3.5
4
4.5
5 Field K & M GiantsLMC Giants
6 6.5 7 7.5 8
3
3.5
4
4.5
5

7 7.5 8 8.5 9
-1
-0.5
0
0.5
Timmes et al. (1995)
Alibes et al. (2001)

arX
iv:a
stro
-ph/
0305
303v
1 1
6 M
ay 2
003
Fluorine Abundances in the Large Magellanic Cloud and ω
Centauri: Evidence for Neutrino Nucleosynthesis?
Katia Cunha
Observatorio Nacional, Rua General Jose Cristino 77, 20921-400, Sao Cristovao, Rio de
Janeiro, Brazil; [email protected]
Verne V. Smith
Department of Physics, University of Texas El Paso, El Paso, TX 79968 USA;
David L. Lambert
Department of Astronomy, University of Texas at Austin, Austin, TX 78712, USA;
Kenneth H. Hinkle
National Optical Astronomy Observatory, P.O. Box 26732, Tucson, AZ 85726, USA;
Received ; accepted

– 2 –
ABSTRACT
The behavior of fluorine with metallicity has not yet been probed in any
stellar population. In this work, we present the first fluorine abundances
measured outside of the Milky Way from a sample of red giants in the Large
Magellanic Cloud (LMC), as well the Galactic globular cluster ω Centauri.
The fluorine abundances are derived from vibration-rotation transitions of HF
using infrared spectra obtained with the Phoenix spectrograph on the Gemini
South 8.1m telescope. It is found that the abundance ratio of F/O declines
as the oxygen abundance decreases. The values of F/O are especially low in
the two ω Cen giants; this very low value of F/O probably indicates that 19F
synthesis in asymptotic giant branch (AGB) stars is not the dominant source
of fluorine in stellar populations. The observed decline in F/O with lower O
abundances is in qualitative agreement with what is expected if 19F is produced
via H- and He-burning sequences in very massive stars, with this fluorine then
ejected in high mass-loss rate Wolf-Rayet winds. A quantitative comparison
of observations with this process awaits results from more detailed chemical
evolution models incorporating the yields from Wolf-Rayet winds. Perhaps of
more significance is the quantitative agreement between the Galactic and LMC
results with predictions from models in which 19F is produced from neutrino
nucleosynthesis during core collpase in supernovae of Type II. The very low
values of F/O in ω Cen are also in agreement with neutrino nucleosynthesis
models if the “peculiar” star formation history of ω Cen, with 2-4 distinct
episodes of star formation, is considered.
Subject headings: galaxies: individual (Large Magellanic Cloud)—Galaxy:
globular clusters: individual (ω Cen)—nucleosynthesis—stars: abundances

– 3 –
1. Introduction
Unlike its neighbors in the periodic table, the nucleosynthetic origins of fluorine have
remained somewhat obscure. This obscurity reflects a combination of theoretical and
observational unknowns. The one stable isotope of fluorine, 19F, is not easy to produce
in stars as it is readily destroyed by either proton or α captures during many phases
of stellar evolution. From an observational point-of-view, fluorine is difficult to detect
spectroscopically. The only atomic lines that might be studied are the ground-state lines of
F I, falling in the far ultraviolet (UV) near 950A. The molecule HF is readily detectable in
cool stars through vibration-rotation transitions that fall in the infrared near ∼2.3 µm. The
HF pure rotational transitions are in the observationally challenging sub-millimeter region
and are not easily exploited with current technology (Neufeld et al. 1997).
Attempts to account for fragmentary data on the abundance of fluorine in the Galaxy
have focussed mostly on three proposed sources: 1) neutrino-induced spallation of a proton
from 20Ne following the core-collapse phase of a massive-star supernova (Woosley & Haxton
1988) – this is referred to as the ν-process (Woosley et al. 1990), 2) synthesis during
He-burning thermal pulses on the asymptotic giant branch (AGB), as suggested by Jorissen,
Smith, & Lambert (1992), or 3) production of 19F in the cores of stars massive enough to be
Wolf-Rayet stars at the beginning of their He-burning phase (Meynet & Arnould 2000). The
relative importance of the three sources is undetermined theoretically and observationally.
Indeed, it is not known if the leading contributor of fluorine is among the listed trio. Clues
to the site of fluorine synthesis lie in the run of the fluorine abundance with metallicity in
the Galaxy, and the fluorine abundances in different stellar populations.
To date, the only fluorine abundances measured in stars other than the Sun were
provided by Jorissen et al. (1992), who analyzed a few Galactic K and M giants, and a
larger number of s-process enriched Galactic giants (spectral types MS, S, and N), but

– 4 –
all were stars of near-solar metallicity. It may be assumed that the fluorine abundance of
the K and M giants is unaffected by stellar evolution. To expand knowledge of fluorine
abundances, we present fluorine abundance measurements in two stellar systems other than
the Galaxy. We discuss red giants of the Large Magellanic Cloud (LMC), and two red giants
in the Galactic globular cluster ω Centauri. These red giants are significantly more metal
poor than the K and M giants analyzed by Jorissen et al. (1992) and provide information
for the first time on how the fluorine abundance varies as a function of metallicity.
2. Observations
Fluorine abundances are derived in this study from high-resolution IR spectra obtained
on the 8.1m Gemini South telescope with the NOAO Phoenix spectrometer (Hinkle et al.
1998). A discussion of the observations and data reduction has appeared already in Smith
et al. (2002) and details can be found there. Spectra pertinent to the present analysis
are single-order echelle spectra imaged on a 1024 x 1024 InSb Aladdin II array and were
obtained with an entrance slit defining the resolution, where R=λ/∆λ= 50,000 (∼ 4-pixels
for Phoenix on Gemini South). The data were reduced to one-dimensional spectra using
IRAF.
Spectra analyzed here were centered near a wavelength of 23400A and cover a 120A
window. The HF 1–0 R9 line is included along with CO first-overtone vibration-rotation
lines (Smith et al. 2002).

– 5 –
3. Analysis
3.1. Determining the Fluorine Abundances
The stars observed for the HF line include 9 red giant members of the LMC and 2
red giant members of the Galactic globular cluster ω Cen. All of the stars were analyzed
recently – see Smith et al. (2002) for the LMC giants, and Smith et al. (2000) for the ω
Cen stars. In both studies, a combination of photometry (mostly IR) and high-resolution
spectroscopy is used to derive the stellar parameters necessary for an abundance analysis:
effective temperature (Teff), surface gravity (parameterized as log g), microturbulent
velocity (ξ), and stellar metallicity. The same analysis techniques are used in both the
LMC and ω Cen studies. We adopt the stellar parameters derived in the Smith et al. (2000,
2002) papers. In Table 1, we list the program stars, along with published values of Teff ,
log g, microturbulence, as well as Fe and O abundances. The Fe and O abundances in the
LMC giants are taken from Smith et al. (2002), with the uncertainties listed being the
standard deviations from the average of the 3 Fe I and 4 OH lines used in the abundance
determinations. The abundances of Fe and O for the ω Cen members and α Boo were taken
from Smith et al. (2000). In this paper we adopt the spectroscopic notations for presenting
abundances, with A(x)= log[N(x)/N(H)] + 12.0, and [x/y]= log[N(x)/N(y)]ProgramStar -
log[N(x)/N(y)]Standard.
Fluorine abundances listed in the last column of Table 1 are derived from spectrum
synthesis of the HF 1–0 R9 line. We used a recent version of the LTE synthesis code MOOG
(Sneden 1973). The model atmospheres employed in the abundance analyses are based on
two different versions of the atmosphere code MARCS (Gustafsson et al. 1975). The LMC
models were constructed with the SOSMARCS version (Plez, Brett, & Nordlund 1992;
Edvardsson et al. 1993; Asplund et al. 1997), while the ω Cen giants use an older version of
the original MARCS code. Cunha et al. (2002) compared synthetic spectra generated from

– 6 –
both SOSMARCS and MARCS models and found no significant differences (in fact, almost
unmeasurable differences) between the codes for temperatures in the range of the program
stars studied here.
In addition to the metal-poor giants from the LMC and ω Cen, the nearby red giant
α Boo was analyzed using the new IR spectral atlas from Hinkle, Wallace, & Livingston
(1995) . Although α Boo was included in the fluorine work by Jorissen et al. (1992), their
analysis was based on an earlier IR spectrum that did not have as high a S/N ratio as
the Hinkle et al. (1995) atlas. Stellar parameters for α Boo (Table 1) are from the recent
analyses of Smith et al. (2000, 2002).
Sample comparisons of real with synthetic spectra are shown in Figure 1 for star
LMC 1.27 and in Figure 2 for ROA 324 from ω Cen. These figures illustrate the quality
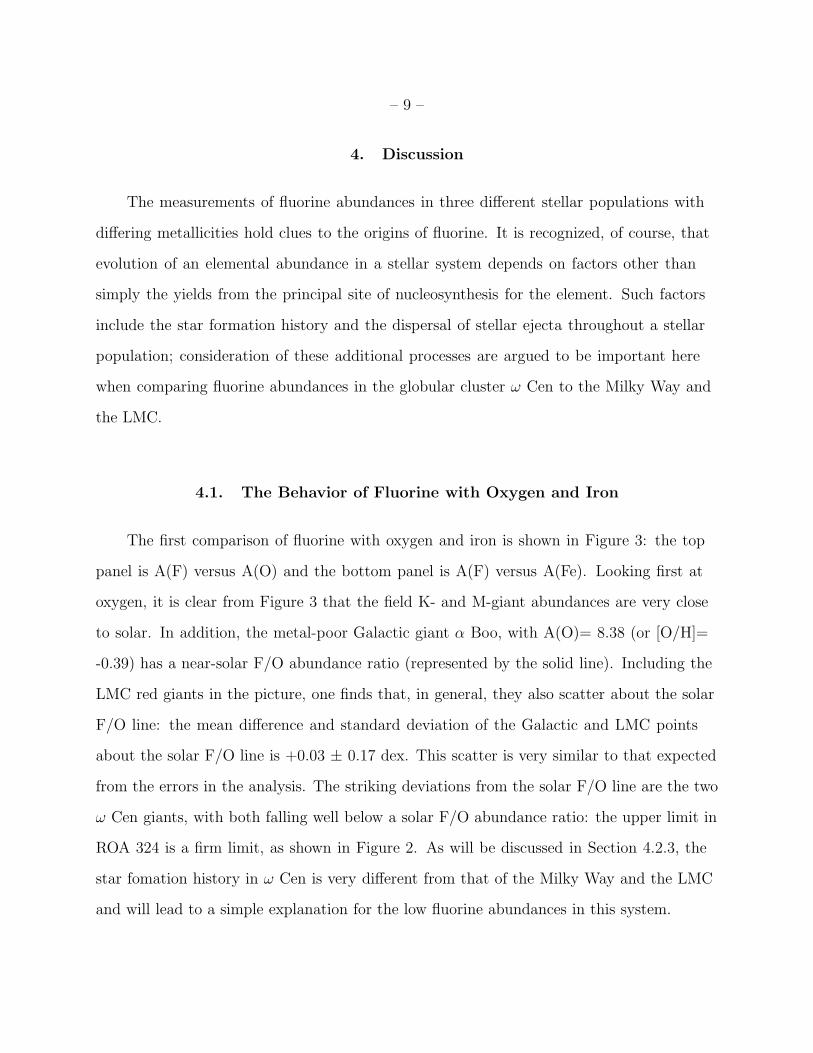
of the observed spectra and obtained fits. Note in the case of ROA 324 that HF is not
detected. The lowest abundance shown in the figure is A(F)=3.10 and we adopt this value
as a conservative upper limit to the fluorine abundance (the line-profile depths at this
abundance are just slightly greater than the noise level in the observed spectrum).
The sensitivity of the fluorine abundance to input stellar parameters was quantified by
individually varying Teff , surface gravity, and microturbulence to measure their separate
effects on the derived abundances. A baseline model with Teff= 3600K, log g= 0.50, and
ξ= 2.5 km s−1 was used. The following abundance differences were found for a R9 line
having the same strength as in LMC 2.1158: ∆Teff= +70K gives ∆A(F)= +0.14 dex, ∆(log
g)= +0.3 dex gives ∆A(F)= +0.02 dex, and ∆ξ= +0.5 km s−1 gives ∆A(F)= -0.03 dex.
These are typical stellar parameter uncertainties, and a quadrature sum of the abundance
changes yields a combined uncertainty of 0.15 dex in the derived 19F abundance due to the
estimated errors.

– 7 –
3.2. Reanalysis of the Older Fluorine Data
In order to establish the behavior of fluorine with metallicity and across stellar
populations, we add the only other available fluorine abundance measurements in the
Galactic disk: these are the non-s-process enriched K and M giants studied in Jorissen et
al. (1992). We do not include the s-process enriched AGB stars of spectral types MS, S, or
C because Jorissen et al. (1992) found that 19F is synthesized during He-burning thermal
pulses, and this freshly produced fluorine is mixed to the surfaces of these AGB stars. As
our primary motivation here is to follow the general chemical evolution of fluorine with
metallicity (using both Fe and O as metallicity indicators), inclusion of the self-polluted
19F-rich AGB stars will obscure any metallicity trend.
A re-analysis of the Jorissen et al. (1992) abundances for the M-giants was conducted,
as the original results were derived from model atmospheres computed by Johnson, Bernat,
& Krupp (1980). A comparison of models computed from the MARCS code and those of
Johnson et al. (1980) reveals that, in the outer line-forming layers, the latter are slightly
hotter (∼50K): this small difference has a small effect (∼ 0.1 dex) on the derived fluorine
abundances. The Jorissen et al. (1992) stellar parameters for these stars were taken from
the papers by Smith & Lambert (1985, 1986, 1990) and, as these were also based mostly
on the IR photometric-Teff scale, we adopt these same parameters, but use MARCS model
atmospheres to re-analyze the HF equivalent widths published by Jorissen et al. (1992).
Table 2 lists the K and M giants from Jorissen et al. (1992), along with their
parameters and our derived Fe, O, and F abundances. Not only were the fluorine
abundances recomputed with MARCS models, but also the iron and oxygen abundances
using the published equivalent widths of Fe I and OH lines from Smith & Lambert (1985;
1986; 1990). In these earlier studies, the Fe I gf-values were “astrophysical”, based upon
an analysis of the K giant α Tau. The new abundances are based upon gf-values from the

– 8 –
Kurucz & Bell (1995) linelist. The effect of different model atmospheres and gf-values is
small: the average differences, in the sense of (new-old) is A(Fe)=+0.06 and A(O)=-0.10.
The field K giants HR 5563 and HR6705 have fluorine abundances derived from the HF
1–0 R9 line, as in the LMC and ω Cen giants, while the cooler field M giants had the
R13, R14, R15, and R16 lines measured. The comparison between the K and M giant
19F abundances shows complete agreement, indicating that we have a homogeneous set
of fluorine abundances for some 23 red giants across three stellar populations - the solar
neighborhood, ω Cen, and the LMC.
3.3. The Solar Fluorine Abundance
Jorissen et al. (1992) pointed out that their sample of normal K- and M-giants with
near-solar metallicities gave an average 19F abundance somewhat larger than the solar
abundance. The average abundance as discussed in Jorissen et al. (1992) sample of giants
was A(F)= 4.69. The solar abundance is somewhat uncertain: Anders & Grevesse (1989)
quote a meteoritic abundance of A(F)= 4.48±0.06, and a solar photospheric abundances
(from HF lines of sunspots) of 4.56±0.30.
Our reanalysis of the Jorissen et al. data presented in Table 2 yields slightly different
abundances. Taking only those K and M giants with oxygen abundances in the range of
A(O)= 8.7 - 8.9 (with solar being 8.77, which is the value found using 1-d MARCS models
as discussed by Allende Prieto, Lambert & Asplund 2000), the average 19F abundance is
found to be 4.65±0.07: marginally closer to the solar values, but still larger. The 8 disk
giants have an average oxygen abundance of 8.78–within 0.01 dex of solar. In discussing
stellar fluorine abundances, we adopt A(F)= 4.55 as the value of 19F for the Sun, thus there
is still a small 0.10 dex offset between the solar value and the average of the near-solar
metallicity disk giants.
– 9 –
4. Discussion
The measurements of fluorine abundances in three different stellar populations with
differing metallicities hold clues to the origins of fluorine. It is recognized, of course, that
evolution of an elemental abundance in a stellar system depends on factors other than
simply the yields from the principal site of nucleosynthesis for the element. Such factors
include the star formation history and the dispersal of stellar ejecta throughout a stellar
population; consideration of these additional processes are argued to be important here
when comparing fluorine abundances in the globular cluster ω Cen to the Milky Way and
the LMC.
4.1. The Behavior of Fluorine with Oxygen and Iron
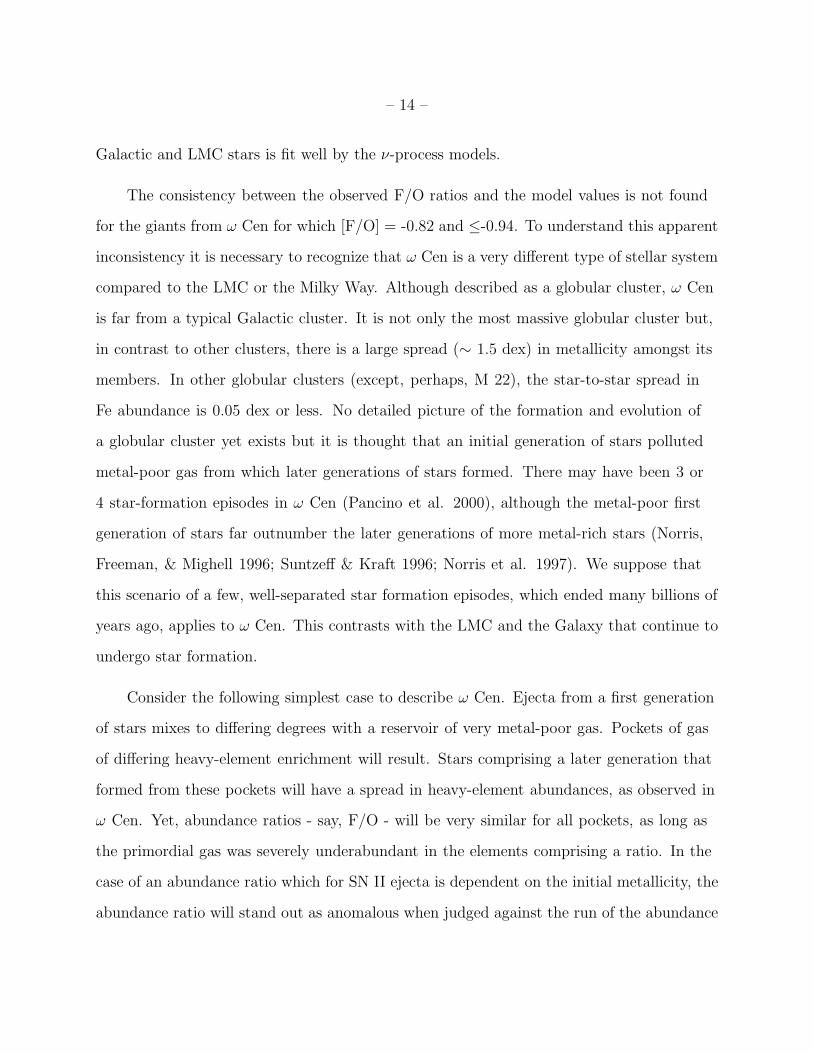
The first comparison of fluorine with oxygen and iron is shown in Figure 3: the top
panel is A(F) versus A(O) and the bottom panel is A(F) versus A(Fe). Looking first at
oxygen, it is clear from Figure 3 that the field K- and M-giant abundances are very close
to solar. In addition, the metal-poor Galactic giant α Boo, with A(O)= 8.38 (or [O/H]=
-0.39) has a near-solar F/O abundance ratio (represented by the solid line). Including the
LMC red giants in the picture, one finds that, in general, they also scatter about the solar
F/O line: the mean difference and standard deviation of the Galactic and LMC points
about the solar F/O line is +0.03 ± 0.17 dex. This scatter is very similar to that expected
from the errors in the analysis. The striking deviations from the solar F/O line are the two
ω Cen giants, with both falling well below a solar F/O abundance ratio: the upper limit in
ROA 324 is a firm limit, as shown in Figure 2. As will be discussed in Section 4.2.3, the
star fomation history in ω Cen is very different from that of the Milky Way and the LMC
and will lead to a simple explanation for the low fluorine abundances in this system.

– 10 –
The comparison between F and Fe in the bottom panel of Figure 3 shows more scatter
about a scaled solar line for the disk and LMC giants. In this case, the mean difference
and standard deviation is +0.02 ± 0.30 dex, almost twice as large as the scatter found
about the F/O line. Although one of the ω Cen giants has an F/Fe ratio close to solar, the
conservative upper limit for ROA 324 is still significantly subsolar in F/Fe.
Figure 4 shows the relation of [F/O] using oxygen as the metallicity indicator. The
use of oxygen removes supernovae of Type Ia as a contributing source, as iron can have SN
Ia’s as a dominant parent in some stellar populations; none of the possible sites put forth
as 19F sources involve these types of supernovae. Inspection of this figure reveals a gradual
decrease in the average [F/O] value when going from the near-solar metallicity Galactic
stars to the lower metallicity LMC giants and α Boo.
The continous lines plotted in Figure 4 are predictions from chemical evolution models
by Timmes et al. (1995) and Alibes, Labay & Canal (2001) for the behavior of [F/O] with
oxygen for the ν-process yields as given by Woosley & Weaver (1995). In both models,
the [F/O] values are slightly subsolar at solar metallicity by approximately -0.1 dex. As
pointed out by Alibes et al. (2001), 19F production is very sensitive to the neutrino fluxes
and spectra, so the yield is uncertain; a 0.1 dex offset from solar is probably not significant.
Timmes et al. (1995) show (in their Figure 10) the effects of factor 2 variations in the mass
of ejected fluorine, and we have used their mean curve. We note that quantitative chemical
evolution model results for F production during the Wolf-Rayet phase are not available in
the literature and thus are not discussed here.

– 11 –
4.2. The Pros and Cons of the Sites for the Chemical Evolution of Fluorine
As discussed in the Introduction, three main sites have been put forth as possible net
19F producers: 1) operation of a neutron source during He-burning thermal-pulses in AGB
stars, 2) mass loss from WR stars during their phase of He-burning, and, 3) the ν-process
in supernovae of Type II. In our discussion of the behavior of fluorine as a function of
metallicity, we use oxygen as the ’appropriate’ metallicity indicator.
4.2.1. AGB Stars
Jorissen et al. (1992) probed the conditions under which 19F could be produced as
a result of a combination of α-captures originating on 14N, a neutron source, and proton
captures, all occurring during thermal pulses in AGB stars. Although they could explain
the enhanced fluorine abundances observed in the s-process enriched and 12C-rich stars,
they did not make detailed predictions about the chemical evolution of 19F. Due to the
longer timescales of AGB evolution, Jorissen et al. (1992) did argue that fluorine would
likely follow the behavior of iron, which also has a long timescale component arising from
SN Ia’s, thus [F/Fe] would be ∼0. Examination of Figures 3 shows that the scatter about
the F/Fe line is almost twice as large as the scatter about the F/O line, as discussed
previously. This suggests that perhaps AGB stars are not the place to look for major
fluorine production. In this instance the ω Cen giants enter the picture as potentially crucial
points, due to the large s-process abundances found in many of the ω Cen members: a result
usually interpreted as showing an especially large degree of AGB enrichment contributing
to the chemical evolution within ω Cen. In such a picture, the ω Cen giants should exhibit
enhanced fluorine abundances, but show completely opposite behavior.

– 12 –
4.2.2. Wolf-Rayet Stars
In massive stars, 19F can be produced during the pre-explosive nucleosynthesis in
the helium shell from reaction sequences not involving neutrinos, but by a series of
thermonuclear reactions. The synthesis of 19F by these reactions consists of two modes, one
consisting of a CNO H-burning sequence and the other consisting of a set of He-burning
sequences. In the CNO H-burning sequence, a series of proton captures and β-decays,
initiated on 14N, leads to a finite abundance of 19F, with 19F(p,α)16O being the destructive
reaction. During He-burning, the sequences to produce 19F begin with an α-capture on 14N
and conclude with an α-capture on 15N (15N(α,γ)19F); this series of reactions also involves
neutron and proton captures, with the neutrons and protons supplied by 13C(α,n)16O and
14N(n,p)14C, respectively. The possible production of fluorine via these reactions in massive
stars was first investigated by Woosley & Weaver (1995), who concluded that the above
mentioned reactions could not reproduce the abundance of fluorine at solar metallicity.
More recently, however, Meynet & Arnould (2000) investigated the role that WR stars may
play in the chemical evolution of fluorine by adopting more modern reaction rates (NACRE
compilation) coupled with more extreme mass loss rates and conclude that production of
fluorine in WR-stars could explain the solar fluorine abundances.
The crucial point emphasized in the Meynet & Arnould (2000) study concerning the
chemical evolution of fluorine, is that any 19F produced either through the various proton
or α-capture reactions must be removed from the stellar interior to avoid destruction. In
order for massive stars to be significant contributors to net fluorine production, they must
undergo extensive mass loss; the requirement of large mass-loss rates needed to eject the
fluorine before its destruction is met by the WR stars. Meynet & Arnould point out that
WR mass loss is very metallicity dependent, and that the numbers of WR stars at low
metallicities are also very small. Thus they predict that fluorine yields from WR stars will

– 13 –
exhibit a strong dependance on metallicity, with a very small, to negligible yield at low
metallicity, and increasing 19F yields towards solar-like metallicities. Our results as shown
in Figure 4 with [F/O] plotted versus A(O) do show a decline in the fluorine to oxygen
abundance ratio as the oxygen abundance decreases, as would be expected qualitatively
from arguments about the low production of fluorine at low metallicities from WR stars.
At this time, it is not possible to compare quantitatively the observed abundances with
predictions from WR-wind models because there are no published model values of how the
abundance of fluorine varies with oxygen.
4.2.3. Massive Stars and the ν-Process
Perhaps at this time, the leading use for our data on fluorine is as a test of the proposal
that fluorine is primarily synthesised by the ν-proces in SN II. This is possible now because
predicted yields for 19F (and 16O, a reference element for SN II nucleosynthesis) for massive
stars of different initial metallicities were supplied by Woosley & Weaver (1995), while
Timmes et al. (1995), Goswami & Prantzos (2000), and Alibes, Labay, & Canal (2001) have
incorporated these yields into models of Galactic chemical evolution, producing predictions
of fluorine abundances as a function of the oxygen abundance.
The chemical evolution models, with ν-process produced 19F, predict that the [F/O]
declines fairly steadily as the oxygen abundance declines; this is illustrated in Figure 4
for two of the published studies (Timmes et al. 1995 and Alibes et al. 2001), with both
chemical models agreeing quite well. The rate of decrease of [F/O] with A(O) is similar to
the results for the Galactic and LMC stars, with an apparent small offset between model
and observed [F/O]. Recall that there still remains a small uncertainty in the local Galactic
fluorine abundance, which can be seen in Figure 4 as the offset of the solar point from
the mean of the local K and M giants. The slow decline in [F/O] with A(O) found in the
– 14 –
Galactic and LMC stars is fit well by the ν-process models.
The consistency between the observed F/O ratios and the model values is not found
for the giants from ω Cen for which [F/O] = -0.82 and ≤-0.94. To understand this apparent
inconsistency it is necessary to recognize that ω Cen is a very different type of stellar system
compared to the LMC or the Milky Way. Although described as a globular cluster, ω Cen
is far from a typical Galactic cluster. It is not only the most massive globular cluster but,
in contrast to other clusters, there is a large spread (∼ 1.5 dex) in metallicity amongst its
members. In other globular clusters (except, perhaps, M 22), the star-to-star spread in
Fe abundance is 0.05 dex or less. No detailed picture of the formation and evolution of
a globular cluster yet exists but it is thought that an initial generation of stars polluted
metal-poor gas from which later generations of stars formed. There may have been 3 or
4 star-formation episodes in ω Cen (Pancino et al. 2000), although the metal-poor first
generation of stars far outnumber the later generations of more metal-rich stars (Norris,
Freeman, & Mighell 1996; Suntzeff & Kraft 1996; Norris et al. 1997). We suppose that
this scenario of a few, well-separated star formation episodes, which ended many billions of
years ago, applies to ω Cen. This contrasts with the LMC and the Galaxy that continue to
undergo star formation.
Consider the following simplest case to describe ω Cen. Ejecta from a first generation
of stars mixes to differing degrees with a reservoir of very metal-poor gas. Pockets of gas
of differing heavy-element enrichment will result. Stars comprising a later generation that
formed from these pockets will have a spread in heavy-element abundances, as observed in
ω Cen. Yet, abundance ratios - say, F/O - will be very similar for all pockets, as long as
the primordial gas was severely underabundant in the elements comprising a ratio. In the
case of an abundance ratio which for SN II ejecta is dependent on the initial metallicity, the
abundance ratio will stand out as anomalous when judged against the run of the abundance

– 15 –
ratio versus metallicity established from stars that form from gas that has undergone many
episodes of star formation where the stellar ejecta become well-mixed with the interstellar
medium (as is probably the case for the Galactic and LMC stars). Abundance ratios
insensitive to the initial metallicity of SN II will appear normal, or nearly so, relative to
the Galactic standards. The most metal-poor stars in ω Cen have oxygen abundances near
A(O)∼ 7.3 (Smith et al. 2000). If supernovae of Type II with this initial abundance of
oxygen dominated the nucleosynthesis of fluorine via the ν-process, as predicted by our
simple picture, then the later generation of ω Cen stars would form from gas having [F/O]∼
-0.8 (using ν-process model predictions as illustrated in Figure 4). This is confirmed by the
abundance results for the observed ω Cen stars.
As noted above, our scenario predicts ‘anomalous’ abundance ratios for all ratios
that are dependent on the initial metallicity of the SN II. Copper is such an example.
Significantly, the [Cu/Fe] from ω Cen giants (Cunha et al. 2002) is constant over the [Fe/H]
range probed ([Fe/H] = -2 to -0.8) and falls below its corresponding values in Galactic halo
stars.
5. Conclusions
We present the first fluorine abundance measurements outside of the Milky Way, in the
LMC, and the first measurements in a globular cluster (ω Cen). It is found that the F/O
abundance ratios decline as metallicity (taken as the oxygen abundance) decreases. This
decline is moderate for the LMC (or α Boo) relative to the near-solar metallicity Galactic
disk stars, with the average value of [F/O] in the LMC being ∼ 0.2 dex lower at an oxygen
abundance that is about 0.5 dex lower. The values of [F/O] are much lower still in the two
ω Cen giants ([F/O]∼ -0.9) at a similar oxygen abundance as those in the LMC sample.

– 16 –
The very low values of [F/O] found in the two ω Cen stars suggest that AGB stars do
not play a dominant role in the global chemical evolution of fluorine in a stellar population.
Because of the large s-process elemental abundances found in the more metal-rich ω Cen
stars (as typified by the two ω Cen targets studied here), a relatively large AGB contribution
to the chemical evolution within ω Cen is inferred. If AGB stars have had such a large
impact on the chemical evolution, it would be expected that this would result in elevated
values of [F/O], instead of the very low values observed.
Both 19F production sites that involve massive stars, either via thermonuclear reactions
with the synthesized fluorine being ejected in the high dM/dt stellar winds of a WR star,
or from neutrino spallation off of 20Ne during core collapse in SN II, predict lower values of
[F/O] at lower oxygen abundances. With the results presented here, it is not possible to test
conclusively whether WR winds or the ν-process might dominate the chemical evolution of
19F. This test must await quantitative chemical evolution models incorporating the yields
from WR winds. In the meantime, it should be noted that the decline in [F/O] versus A(O)
observed in the Galactic and LMC stars agrees reasonably well with the chemical evolution
models using ν-process yields for 19F.
The very low values of [F/O] indicated for the ω Cen stars seem, at first glance, at
odds with the ν-process models. This apparent discrepancy is resolved when the very
different star formation history in ω Cen, when compared to the Milky Way and the LMC,
is considered.
We thank G. Meynet for helpful discussions. This work is supported in part by the
National Science Foundation through AST99-87374 (VVS) and NASA through NAG5-9213
(VVS). DLL acknowledges the support of the Robert A. Welch Foundation of Houston,
Texas.

– 17 –
REFERENCES
Allende Prieto, C., Lambert, D. L., & Asplund, M. 2000, ApJ, 573, L137
Anders, E., & Grevesse, N. 1989, Geochimica et Cosmochimica Acta, 53, 197
Asplund, M., Gustafsson, B., Kiselman, D., & Eriksson, K. 1997, A&A, 318, 521
Cunha, K., Smith, V.V., Suntzeff, N., B., Norris, J.E., Da Costa, G.,S., & Plez, B. 2002 AJ
124,379
Edvardsson, B., Andersen, J., Gustafsson, B., Lambert, D.L., Nissen, P.E. & Tomkin, J.
1993, A&A, 275, 101
Goswami, A., & Prantzos, N. 2000, A&A, 359, 191
Hill, V., Andrievsky, S., & Spite, M. 1995, A&A, 293, 347
Hinkle, K. H., Wallace, L., & Livingston, W. 1995, Infrared Atlas of the Arcturus Spectrum,
0.9 - 5.3 µm (San Francisco: Astronomical Society of the Pacific)
Hinkle, K. H., Cuberly, R., Gaughan, N., Heynssens, J., Joyce, R., Ridgway, S., Schmitt,
P., & Simmons, J. E. 1998, Proc. SPIE, 3354, 810
Jorissen, A., Smith, V.V., & Lambert, D.L., A&A, 261, 164
Kurucz, R.L., & Bell, B. 1995, CD-ROM 23
McWilliam, A. 1997, ARAA, 35, 503
Meynet, G., & Arnould, M. 2000, A&A, 355, 176
Neufeld, D. A., Zmuidzinas, J., Schilke, P., & Phillips, T. G. 1997, ApJ, 488, L141
Norris, J. E., Freeman, K. C., & Mighell, K. J. 1996, ApJ, 462, 241

– 18 –
Norris, J. E., Freeman, K. C., Mayor, M., & Seitzer, P. 1997, ApJ, 487, 187
Pancino, E., Ferraro, F.R., Bellazzini, M., Piotto, G., & Zocalli, M. 2000, ApJ, 534, L83
Plez, B., Brett, J.M., & Nordlund, A&A, 1992, A&A, 256, 551
Smith, V.V., & Lambert, D.L. 1985, ApJ, 294, 326
Smith, V.V., & Lambert, D.L. 1986, ApJ, 311, 843
Smith, V.V., & Lambert, D.L. 1990, ApJS, 72, 387
Smith, V.V., Suntzeff, N.B., Cunha, K., Gallino, R., Busso, M., Lambert, D.L., & Straniero,
O. 2000, AJ, 119, 1239
Smith, V.V., Hinkle, K.H., Cunha, K., Plez, B., Lambert, D.L., Pilachowski,C .A., Barbuy,
B., Melendez, J., Balachandran, S., Bessell, M.S., Geisler, D.P. , Hesser, J., Winge,
C. 2002, AJ, 124, 3241
Sneden, C. 1973, ApJ, 184, 839
Suntzeff, N. B., & Kraft, R. P. 1996, AJ, 111, 1913
Timmes, F.X., Woosley, S.E., & Weaver, T.A. 1995, ApJS, 98, 617
Woosley, S.E., Hartmann, D.H., Hoffman, R.D., Haxton, W.C., 1990, ApJ, 356, 272
This manuscript was prepared with the AAS LATEX macros v4.0.

– 19 –
Fig. 1.— Observed and synthetic spectra for the star LMC 1.27. The synthetic spectra were
calculated for A(F) = 3.83, 3.93 and 4.03.
Fig. 2.— Observed and synthetic spectra for the ω Centauri giant ROA324. Three fluorine
abundances of respectively 3.10, 3.4 and 3.98 are presented. An upper limit fluorine
abundance of A(F)= 3.10 was adopted for this star.
Fig. 3.— The top panel shows the logarithmic abundances of fluorine plotted versus oxygen.
The solar symbol is shown and the solid line illustrates a solar F/O abundance ratio. The
bottom panel is similar to the top, except fluorine is plotted versus iron. The A(F) versus
A(O) results show slightly less scatter about a solar F/O line than the A(F) versus A(Fe)
values about a solar F/Fe line. Note the very low F/O ratios in the ω Cen giants.
Fig. 4.— Fluorine to oxygen abundance ratios, shown as [F/O], versus A(O), with the
horizontal dashed line depicting a solar F/O ratio. The symbols for the various stellar
systems are the same as in Figure 3. The lines are predictions from chemical evolution
models in which the ν-process contributes to the synthesis of 19F: the dashed line is from
Timmes et al. (1995) and the solid line is from Alibes et al. (2001).

arX
iv:a
stro
-ph/
0305
303v
1 1
6 M
ay 2
003
– 1 –
Table 1. Program Star Parameters & Abundances
Star Teff(K) Log g ξ(km s−1) A(Fe)a A(16O)a A(19F)a,b
LMC 1.6 3760 +0.80 2.5 7.00±0.10 8.02±0.17 3.76
LMC 1.27 3550 +0.30 3.1 7.14±0.13 8.24±0.11 3.93
LMC 1.50 3550 +0.30 2.8 7.13±0.05 8.29±0.15 4.19
LMC 2.1158 3640 +0.40 2.5 7.16±0.06 8.11±0.15 3.62
LMC 2.3256 3680 +0.60 2.6 7.05±0.09 8.22±0.09 3.93
LMC 2.4525 3650 +0.50 3.0 7.05±0.10 8.29±0.13 4.01
LMC 2.5368 3650 +0.50 1.9 7.12±0.10 8.26±0.15 3.56
LMC NGC2203 AM1 3850 +0.60 3.3 6.83±0.11 8.31±0.13 4.06
LMC NGC2203 AM2 3700 +0.40 3.1 6.89±0.07 8.20±0.14 4.06
ω Cen ROA219 3900 +0.70 1.7 6.25±0.14 8.20c 3.16
ω Cen ROA324 4000 +0.70 1.9 6.55±0.20 8.28c ≤3.1
α Boo 4300 +1.70 1.6 6.78±0.11 8.39c 4.10
Note. — (a): A(X)= log[n(X)/n(H)] + 12. (b):19F abundances are derived from
synthesis of the HF(1–0) R9 line. We adopt the following parameters for this line:
λair= 23357.75A χ= 0.48 eV, gf= 1.11× 10⁻⁴, D0(HF)= 5.82 eV. (c): These oxygen
abundances are from the single [O I] 6300A line.

arX
iv:a
stro
-ph/
0305
303v
1 1
6 M
ay 2
003
– 1 –
Table 2. Stars Reanalyzed for Fluorine Abundances
Star Teff(K) Log g ξ(km s−1) A(Fe)a A(16O)a A(19F)a
HR 337 3800 +1.6 2.1 7.53±0.12 8.75±0.09 4.63±0.08
HR 4483 3450 +0.8 2.0 7.55±0.17 8.61±0.11 4.53±0.13
HR 5226 3650 +1.0 2.8 7.35±0.15 8.83±0.10 4.60±0.08
HR 5563 4150 +1.9 2.0 7.27±0.15 8.72±0.15 4.66
HR 6705 3980 +1.9 2.0 7.27±0.18 8.66±0.18 4.67
HR 8775 3600 +1.2 2.0 7.55±0.14 8.68±0.10 4.56±0.12
HD 96360 3550 +0.5 2.1 7.22±0.17 8.82±0.05 4.75±0.05
HD 189581 3500 +0.5 2.1 7.17±0.19 8.74±0.09 4.60±0.08
BD+06 2063 3550 +0.5 2.1 7.62±0.11 8.64±0.11 4.73±0.13
BD+16 3426 3450 +0.5 2.0 7.32±0.18 8.71±0.06 4.72±0.05
BD-13 4495 3600 +0.8 2.3 7.53±0.16 8.52±0.12 4.34±0.11
Note. — (a): A(X)= log[n(X)/n(H)] + 12. Adopted Solar abundances are
A(Fe)= 7.50, A(16O)= 8.77, A(19F)= 4.55.
Related Documents