Fluorescence Imaging of the Oxidative Desorption of a BODIPY-Alkyl-Thiol Monolayer Coated Au Bead Amanda Musgrove, † Arnold Kell, ‡,§ and Dan Bizzotto* ,† Department of Chemistry, AdVanced Materials and Process Engineering Laboratory (AMPEL), UniVersity of British Columbia, VancouVer, British Columbia, Canada, and Department of Chemistry, UniVersity of Western Ontario, Ontario, Canada ReceiVed January 23, 2008. ReVised Manuscript ReceiVed March 17, 2008 The reductive and oxidative desorption of a BODIPY labeled alkylthiol self-assembled monolayer (SAM) on Au was studied using electrochemical methods coupled with fluorescence microscopy and image analysis procedures to monitor the removal of the adsorbed layer. Two SAMs were formed using two lengths of the alkyl chain (C10 and C16). The BODIPY fluorescent moiety used is known to form dimers which through donor-acceptor energy transfer results in red-shifted fluorescence. Fluorescence from the monomer and dimer were used to study the nature of the desorbed molecules during cyclic step changes in potential. The reductive desorption was observed to occur over a small potential window (0.15 V) signified by an increase in capacitance and in fluorescence. Oxidative readsorption was also observed through a decrease in capacitance and a lack of total removal of the fluorescent layer. Removal by oxidative desorption occurred at positive potentials over a broad potential range near the oxidation of the bare Au. The resulting fluorescence showed that the desorbed molecules remained near the electrode surface and were not dispersed over the 20 s waiting time. The rate of change of the fluorescence for oxidative desorption was much slower than the reductive desorption. Comparing monomer and dimer fluorescence intensities indicated that the dimer was formed on the Au surface and desorbed as a dimer, rather than forming from desorbed monomers near the electrode surface. The dimer fluorescence can only be observed through energy transfer from the excited monomer suggesting that the monomers and dimers must be in close proximity in aggregates near the electrode. The fluorescence yield for longer alkyl chain was always lower presumably due to its decreased solubility in the interfacial region resulting in a more efficient fluorescence quenching. The oxidative desorption process results in a significantly etched or roughened electrode surface suggesting the coupling of thiol oxidative removal and Au oxide formation which results in the removal of Au from the electrode. Introduction Surfaces modified by molecular chemisorption represents a common approach for creating complex structures forming the basis for the creation of a wide variety of devices, in particular for biological molecules. An excellent review of this topic has been recently published. 1 Molecular chemisorption also creates surfaces that are used in light harvesting and solar energy conversion. 2 This application requires surfaces that are modified by chromophores that interact with photons and create charge separation (e.g., dye sensitized solar cell). The use of fluorophores attached to Au nanoparticles is also highlighted as a possible method for collecting photons and generating photocurrent due to electron transfer into the gold nanoparticle and subsequent movement of that built up charge. 3 In addition, fluorescence from molecules adsorbed onto metal films or metal nanoparticles has seen an increase in interest due to the apparent enhancement of fluorescence. 4–8 A recent review of chromophores adsorbed onto gold surfaces outlines their characterization and the possible applications for these modified surfaces. 9 Fluorescence from metal surfaces modified with molecules containing fluorescent moieties has been reported for chemisorbed peptides 10–12 and chemisorbed DNA. 13–16 Fluorescence intensity has also been used to monitor the effect of potential on the orientation of adsorbed molecules. 17–20 The modification/removal of alkylthiol layers in a systematic fashion can be accomplished * To whom correspondence should be addressed. E-mail: bizzotto@ chem.ubc.ca. † University of British Columbia. ‡ University of Western Ontario. § Current address: Steacie Institute for Molecular Sciences, NRC, 100 Sussex Drive, Ottawa, Ontario, Canada. (1) Love, J. C.; Estroff, L. A.; Kriebel, J. K.; Nuzzo, R. G.; Whitesides, G. M. Chem. ReV. 2005, 105, 1103–1169. (2) Kamat, P. V. J. Phys. Chem. C 2007, 111, 2834–2860. (3) Adams, D. M.; et al. J. Phys. Chem. B 2003, 107, 6668–6697. (4) Lakowicz, J. R.; Malicka, J.; Gryczynski, I.; Gryczynski, Z.; Geddes, C. D. J. Phys. D 2003, 36, R240–R249. (5) Geddes, C. D.; Aslan, K.; Gryczynski, I.; Malicka, J.; Lakowicz, J. R. ReV. Fluorescence 2004, 1, 365–401. (6) Gryczynski, I.; Malicka, J.; Gryczynski, Z.; Lakowicz, J. R. Anal. Biochem. 2004, 324, 170–182. (7) Lakowicz, J. R. Anal. Biochem. 2004, 324, 153–169. (8) Chen, Y.; Munechika, K.; Ginger, D. S. Nano Lett. 2007, 7, 690–696. (9) Kriegisch, V.; Lambert, C. Top. Curr. Chem. 2005, 258, 257–313. (10) Yasutomi, S.; Morita, T.; Imanishi, Y.; Kimura, S. Science 2004, 304, 1944–1947. (11) Yasutomi, S.; Morita, T.; Kimura, S. J. Am. Chem. Soc. 2005, 127, 14564– 14565. (12) Yanagisawa, K.; Morita, T.; Kimura, S. J. Am. Chem. Soc. 2004, 126, 12780–12781. (13) Lee, C.; Gong, P.; Harbers, G. M.; Grainger, D. W.; Castner, D. G.; Gamble, L. J. Anal. Chem. 2006, 78, 3316–3325. (14) Dubertret, B.; Calame, M.; Libchaber, A. J. Nat. Biotechnol. 2001, 19, 365–370. (15) Long, Y.; Sutherland, T. C.; Kraatz, H.; Lee, J. S. Chem. Comm. 2004, 2032–2033. (16) Tawa, K.; Yao, D.; Knoll, W. Biosens. Bioelectron. 2005, 21, 322–329. (17) Rant, U.; Arinaga, K.; Tornow, M.; Kim, Y. W.; Netz, R. R.; Fujita, S.; Yokoyama, N.; Abstreiter, G. Biophys. J. 2006, 90, 3666–3671. (18) Rant, U.; Arinaga, K.; Fujita, S.; Yokoyama, N.; Abstreiter, G.; Tornow, M. Nano Lett. 2004, 4, 2441–2445. (19) Rant, U.; Arinaga, K.; Fujita, S.; Yokoyama, N.; Abstreiter, G.; Tornow, M. Langmuir 2004, 20, 10086–10092. (20) Takeishi, S.; Rant, U.; Fujiwara, T.; Buchholz, K.; Usuki, T.; Arinaga, K.; Takemoto, K.; Yamaguchi, Y.; Tornow, M.; Fujita, S.; Abstreiter, G.; Yokoyama, N. J. Chem. Phys. 2004, 120, 5501–5504. (21) Widrig, C. A.; Chung, C.; Porter, M. D. J. Electroanal. Chem. 1991, 310, 335–359. (22) Qu, D.; Morin, M. J. Electroanal. Chem. 2001, 517, 45–53. (23) Yang, D. F.; Al-Maznai, H.; Morin, M. J. Phys. Chem. B 1997, 101, 1158–1166. 7881 Langmuir 2008, 24, 7881-7888 10.1021/la800233c CCC: $40.75 2008 American Chemical Society Published on Web 06/21/2008

Welcome message from author
This document is posted to help you gain knowledge. Please leave a comment to let me know what you think about it! Share it to your friends and learn new things together.
Transcript

Fluorescence Imaging of the Oxidative Desorption of aBODIPY-Alkyl-Thiol Monolayer Coated Au Bead
Amanda Musgrove,† Arnold Kell,‡,§ and Dan Bizzotto*,†
Department of Chemistry, AdVanced Materials and Process Engineering Laboratory (AMPEL), UniVersityof British Columbia, VancouVer, British Columbia, Canada, and Department of Chemistry, UniVersity of
Western Ontario, Ontario, Canada
ReceiVed January 23, 2008. ReVised Manuscript ReceiVed March 17, 2008
The reductive and oxidative desorption of a BODIPY labeled alkylthiol self-assembled monolayer (SAM) on Auwas studied using electrochemical methods coupled with fluorescence microscopy and image analysis procedures tomonitor the removal of the adsorbed layer. Two SAMs were formed using two lengths of the alkyl chain (C10 andC16). The BODIPY fluorescent moiety used is known to form dimers which through donor-acceptor energy transferresults in red-shifted fluorescence. Fluorescence from the monomer and dimer were used to study the nature of thedesorbed molecules during cyclic step changes in potential. The reductive desorption was observed to occur over asmall potential window (0.15 V) signified by an increase in capacitance and in fluorescence. Oxidative readsorptionwas also observed through a decrease in capacitance and a lack of total removal of the fluorescent layer. Removalby oxidative desorption occurred at positive potentials over a broad potential range near the oxidation of the bare Au.The resulting fluorescence showed that the desorbed molecules remained near the electrode surface and were notdispersed over the 20 s waiting time. The rate of change of the fluorescence for oxidative desorption was much slowerthan the reductive desorption. Comparing monomer and dimer fluorescence intensities indicated that the dimer wasformed on the Au surface and desorbed as a dimer, rather than forming from desorbed monomers near the electrodesurface. The dimer fluorescence can only be observed through energy transfer from the excited monomer suggestingthat the monomers and dimers must be in close proximity in aggregates near the electrode. The fluorescence yieldfor longer alkyl chain was always lower presumably due to its decreased solubility in the interfacial region resultingin a more efficient fluorescence quenching. The oxidative desorption process results in a significantly etched orroughened electrode surface suggesting the coupling of thiol oxidative removal and Au oxide formation which resultsin the removal of Au from the electrode.
Introduction
Surfaces modified by molecular chemisorption represents acommon approach for creating complex structures forming thebasis for the creation of a wide variety of devices, in particularfor biological molecules. An excellent review of this topic hasbeen recently published.1 Molecular chemisorption also createssurfaces that are used in light harvesting and solar energyconversion.2 This application requires surfaces that are modifiedby chromophores that interact with photons and create chargeseparation (e.g., dye sensitized solar cell). The use of fluorophoresattached to Au nanoparticles is also highlighted as a possiblemethod for collecting photons and generating photocurrent dueto electron transfer into the gold nanoparticle and subsequentmovement of that built up charge.3 In addition, fluorescencefrom molecules adsorbed onto metal films or metal nanoparticleshas seen an increase in interest due to the apparent enhancementof fluorescence.4–8 A recent review of chromophores adsorbed
onto gold surfaces outlines their characterization and the possibleapplications for these modified surfaces.9
Fluorescence from metal surfaces modified with moleculescontaining fluorescent moieties has been reported for chemisorbedpeptides10–12 and chemisorbed DNA.13–16 Fluorescence intensityhas also been used to monitor the effect of potential on theorientation of adsorbed molecules.17–20 The modification/removalof alkylthiol layers in a systematic fashion can be accomplished
* To whom correspondence should be addressed. E-mail: [email protected].
† University of British Columbia.‡ University of Western Ontario.§ Current address: Steacie Institute for Molecular Sciences, NRC, 100
Sussex Drive, Ottawa, Ontario, Canada.(1) Love, J. C.; Estroff, L. A.; Kriebel, J. K.; Nuzzo, R. G.; Whitesides, G. M.
Chem. ReV. 2005, 105, 1103–1169.(2) Kamat, P. V. J. Phys. Chem. C 2007, 111, 2834–2860.(3) Adams, D. M.; et al. J. Phys. Chem. B 2003, 107, 6668–6697.(4) Lakowicz, J. R.; Malicka, J.; Gryczynski, I.; Gryczynski, Z.; Geddes, C. D.
J. Phys. D 2003, 36, R240–R249.(5) Geddes, C. D.; Aslan, K.; Gryczynski, I.; Malicka, J.; Lakowicz, J. R. ReV.
Fluorescence 2004, 1, 365–401.(6) Gryczynski, I.; Malicka, J.; Gryczynski, Z.; Lakowicz, J. R. Anal. Biochem.
2004, 324, 170–182.
(7) Lakowicz, J. R. Anal. Biochem. 2004, 324, 153–169.(8) Chen, Y.; Munechika, K.; Ginger, D. S. Nano Lett. 2007, 7, 690–696.(9) Kriegisch, V.; Lambert, C. Top. Curr. Chem. 2005, 258, 257–313.(10) Yasutomi, S.; Morita, T.; Imanishi, Y.; Kimura, S. Science 2004, 304,
1944–1947.(11) Yasutomi, S.; Morita, T.; Kimura, S. J. Am. Chem. Soc. 2005, 127, 14564–
14565.(12) Yanagisawa, K.; Morita, T.; Kimura, S. J. Am. Chem. Soc. 2004, 126,
12780–12781.(13) Lee, C.; Gong, P.; Harbers, G. M.; Grainger, D. W.; Castner, D. G.;
Gamble, L. J. Anal. Chem. 2006, 78, 3316–3325.(14) Dubertret, B.; Calame, M.; Libchaber, A. J. Nat. Biotechnol. 2001, 19,
365–370.(15) Long, Y.; Sutherland, T. C.; Kraatz, H.; Lee, J. S. Chem. Comm. 2004,
2032–2033.(16) Tawa, K.; Yao, D.; Knoll, W. Biosens. Bioelectron. 2005, 21, 322–329.(17) Rant, U.; Arinaga, K.; Tornow, M.; Kim, Y. W.; Netz, R. R.; Fujita, S.;
Yokoyama, N.; Abstreiter, G. Biophys. J. 2006, 90, 3666–3671.(18) Rant, U.; Arinaga, K.; Fujita, S.; Yokoyama, N.; Abstreiter, G.; Tornow,
M. Nano Lett. 2004, 4, 2441–2445.(19) Rant, U.; Arinaga, K.; Fujita, S.; Yokoyama, N.; Abstreiter, G.; Tornow,
M. Langmuir 2004, 20, 10086–10092.(20) Takeishi, S.; Rant, U.; Fujiwara, T.; Buchholz, K.; Usuki, T.; Arinaga,
K.; Takemoto, K.; Yamaguchi, Y.; Tornow, M.; Fujita, S.; Abstreiter, G.;Yokoyama, N. J. Chem. Phys. 2004, 120, 5501–5504.
(21) Widrig, C. A.; Chung, C.; Porter, M. D. J. Electroanal. Chem. 1991, 310,335–359.
(22) Qu, D.; Morin, M. J. Electroanal. Chem. 2001, 517, 45–53.(23) Yang, D. F.; Al-Maznai, H.; Morin, M. J. Phys. Chem. B 1997, 101,
1158–1166.
7881Langmuir 2008, 24, 7881-7888
10.1021/la800233c CCC: $40.75 2008 American Chemical SocietyPublished on Web 06/21/2008

electrochemically by reduction or oxidation.21–27 This removalfacilitates the creation of complex heterogeneous surfacestructures and has been used recently as a method to releasebiomolecules from an electrode surface.20,28–30 Monitoring thisremoval process through electrochemical measurements andfluorescence microscopy will be the focus of this work. We usea BODIPY tagged alkyl thiol as the chemisorbed species andmonitor its potential dependent behavior on a gold surface. Theheterogeneous response of the interface toward potential revealsclues as to the nature of the chemisorbed layer and theelectrochemically desorbed molecules.
The BODIPY fluorophore is popular for use in biologicallabeling studies due to its high absorptivity, high quantum yieldand significant photostability as compared to fluorescein or otherpopular fluorophores. BODIPY containing molecules are alsoused in light gathering devices that create photocurrents whenilluminated.31 In addition, BODIPY fluorophores have beenstudied for their possible dimer formation and use in FRET orquenching experiments.32–35 BODIPY dimers are described inliterature32,35 and labeled DI and DII. Two BODIPY fluorophorescan be oriented cofacially, forming DI dimers which absorb ata blue-shifted wavelength (470 nm) and are nonfluorescent.33
The equilibrium between the DI aggregates and the monomerform of the molecule can result in significant quenching of themonomer fluorescence. DII dimers are formed from BODIPYmolecules oriented in a coplanar fashion. This ground-state dimerabsorbs at red-shifted wavelengths (λmax )550 nm, ε ) 26 000mol-1 dm3 cm-1) compared to the monomer (λmax )490 nm, ε) 100 000 mol-1 dm3 cm-1) and fluoresces at 650 nm. Energytransfer from the excited-state of the monomer to the DII dimercan occur through dipole-dipole or donor-acceptor type energytransfer. Therefore excitation of the monomer at 490 nm resultsin fluorescence measured at 520 nm (from the monomer) and at620 nm (from the DII dimer). For this work, the importantcharacteristics of BODIPY, taken from literature35 are (1)monomer fluorescence can be decreased by a shift in theequilibrium to ground-state dimers, (2) monomer fluorescencecan be quenched by energy transfer to the nonfluorescentaggregate DI (Ro) 58 Å), (3) monomer fluorescence is quenchedby energy transfer to a fluorescent aggregate DII (Ro ) 42 Å)which results in red-shifted emission. These BODIPY propertiesare useful in measurement of the physical properties of theelectrochemically desorbed organic layer as well as for probingthe role that surface morphology and electric potential may haveon the desorbed molecules.
The selective reductive desorption of a SAM layer formedusing BODIPY-C10-SH from a Au bead electrode has beenpreviously demonstrated by in situ fluorescence microscopy.36
The electrochemical removal of the SAM was studied using insitu fluorescence. When adsorbed, fluorescence is not observed.Fluorescence is observed only when the molecule is desorbedand separated far enough from the metal surface so that quenchingis less efficient. Using this property, the degree of desorptionwas found to be dependent upon the electrode potential and thesurface crystallinity of the particular part of the multicrystallineAu surface. These experiments measured only the monomeremission from the BODIPY fluorophore. The work describedhere will build on the previous study and demonstrate the useof fluorescence microscopy to investigate the electrochemicalremoval of SAM formed from BODIPY labeled alkyl-thiolmolecules by either oxidative or reductive desorption. Fluores-cence from both the monomer and dimer forms of the desorbedmolecules are measured from the same surface region. The dimerfluorescence measured results from energy transfer from theexcited monomer introducing a new method that can be used tofurther characterize the nature of the desorbed molecules. Wealso show a difference in the rate and reversibility of oxidativedesorption as compared to reductive desorption as observed bymeasuring fluorescence and capacitance simultaneously.
Experimental Section
Two alkyl thiols (C10 and C16) were modified to include afluorescent moiety through covalent attachment of a BODIPYfluorophore, synthesized using a procedure described previously.36
The SAM was prepared on a Au bead electrode (area 0.15 cm2) byimmersion for 20 min into a 3 mg/mL CH3 Cl solution for the C10
analogue and a 0.3 mg/mL solution for the C16 analogue. Theseshort immersion times are known to create disordered SAMs whichfor these fluorescent thiols will reduce the possibility of self-quenching. The modified bead was rinsed in MeOH/water and thensonicated in CHCl3 for 2 min to remove any physically adheredmolecules. This procedure was developed through repeated washingsteps coupled with fluorescence observation and measurement ofcapacitance resulting in a low fluorescence (indistinguishable frombackground) starting condition which is expected due to quenchingof fluorescence from a monolayer of chemisorbed fluorophore. Any‘hot spots’ were deemed to be physically adsorbed thiol and wereusually present on the surface in intense localized regions whosefluorescence intensity diminished with washing cycles until theydisappeared. Interestingly, the capacitance of the SAM did notincrease significantly during this procedure. This is an importantstep to ensure changes in the fluorescence measurements (andcapacitance) were only due to the changes in the chemisorbed layer.The intensity before desorption was the same as after removal ofthe monolayer which were both similar to the background measuredfrom a bare Au surface.
The modified Au bead was then used as the working electrodein a electrochemical cell which was specially created for use in aninverted fluorescence microscope. The electrolyte was 0.05 M KClO4
prepared with MilliQ water (18.3 MΩ) and deaerated with Ar priorand during the experiments. The solution was made basic throughthe addition of NaOH until pH 10. A SCE reference electrode anda gold coil counter electrode were used. The interfacial capacitancewas measured at one frequency (200 Hz). Typically, capacitance forsolid electrodes are measured at 25 Hz so as to minimize the problemof frequency dispersion,37 but with the use of potential steps, thefrequency was increased to allow for a stable signal after 1 s. Thefrequency was low enough to ensure the capacitance measured wasstill useful and comparable to previous work.
Reductive desorption measurements were performed using asimple potential step procedure. The electrode potential was heldat -0.4 V/SCE (Ebase) with images and capacitance recorded every5 s. After five images (25 s) the potential was made more negative(Estep). A fluorescence image was acquired along with a measure of
(24) Kawaguchi, T.; Yasuda, H.; Shimazu, K.; Porter, M. D. Langmuir 2000,16, 9830–9840.
(25) Loglio, F.; Schweizer, M.; Kolb, D. M. Langmuir 2003, 19, 830–834.(26) Yu, H.; Ye, S.; Zhang, H.; Uosaki, K.; Liu, Z. Langmuir 2000, 16, 6948–
6954.(27) Sato, Y.; Ye, S.; Haba, T.; Uosaki, K. Langmuir 1996, 12, 2726–2736.(28) Mali, P.; Bhattacharjee, N.; Searson, P. C. Nano Lett. 2006, 6, 1250–
1253.(29) Wang, J.; Rivas, G.; Jiang, M.; Zhang, X. Langmuir 1999, 15, 6541–
6545.(30) Huang, S.; Schopf, E.; Chen, Y. Nano Lett. 2007, 7, 3116–3121.(31) Imahori, H.; Norieda, H.; Yamada, H.; Nishimura, Y.; Yamazaki, I.;
Sakata, Y.; Fukuzumi, S. J. Am. Chem. Soc. 2001, 123, 100–110.(32) Mikhalyov, I.; Gretskaya, N.; Bergstroem, F.; Johansson, L. B.-. Phys.
Chem. Chem. Phys. 2002, 4, 5663–5670.(33) Tleugabulova, D.; Zhang, Z.; Brennan, J. D. J. Phys. Chem. B 2002, 106,
13133–13138.(34) Saki, N.; Dinc, T.; Akkaya, E. U. Tetrahedron 2006, 62, 2721–2725.(35) Bergstroem, F.; Mikhalyov, I.; Haeggloef, P.; Wortmann, R.; Ny, T.;
Johansson, L. B. A. J. Am. Chem. Soc. 2002, 124, 196–204.(36) Shepherd, J. L.; Kell, A.; Chung, E.; Sinclar, C. W.; Workentin, M. S.;
Bizzotto, D. J. Am. Chem. Soc. 2004, 126, 8329–8335. (37) Pajkossy, T. Solid State Ionics 1997, 94, 123–129.
7882 Langmuir, Vol. 24, No. 15, 2008 MusgroVe et al.
the capacitance. After 5 s, the potential was stepped back to Ebase.This cycle was then repeated with each step being sequentially morenegative in step potential (until-1.5 V/SCE in-50 mV increments).The oxidative desorption imaging measurements were performed inthe same manner, except that the Estep potential is stepped positivelyfrom 0.0 or 0.2 to 1.0 V/SCE in 50 mV increments.
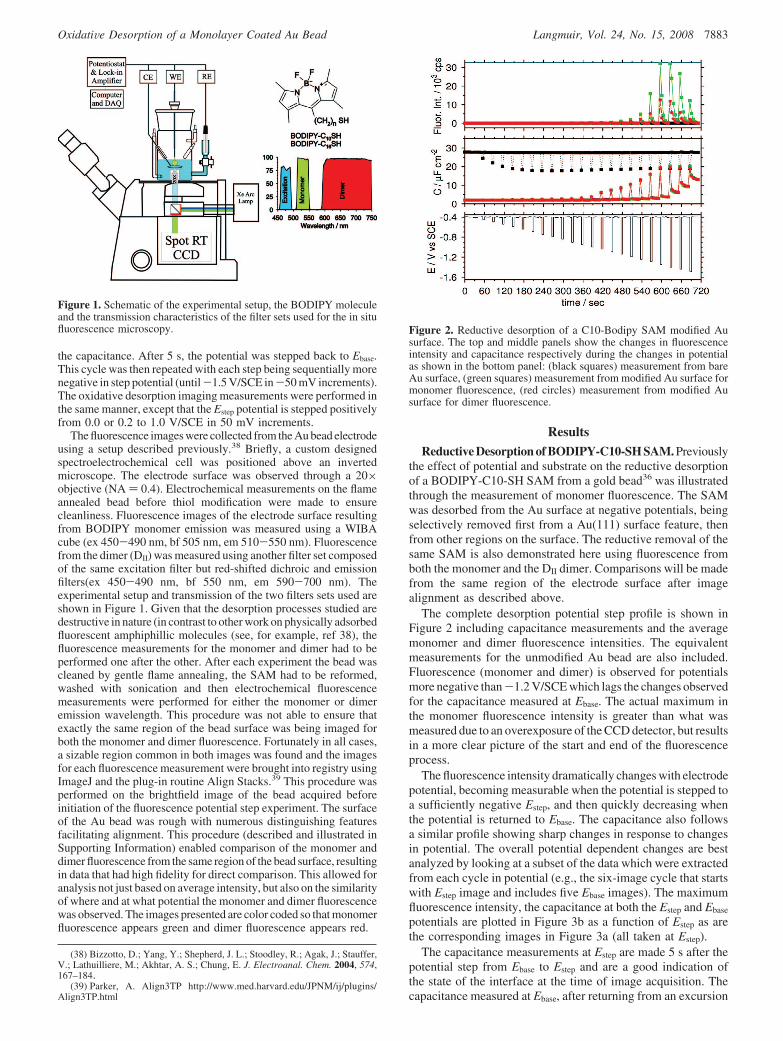
The fluorescence images were collected from the Au bead electrodeusing a setup described previously.38 Briefly, a custom designedspectroelectrochemical cell was positioned above an invertedmicroscope. The electrode surface was observed through a 20×objective (NA ) 0.4). Electrochemical measurements on the flameannealed bead before thiol modification were made to ensurecleanliness. Fluorescence images of the electrode surface resultingfrom BODIPY monomer emission was measured using a WIBAcube (ex 450-490 nm, bf 505 nm, em 510-550 nm). Fluorescencefrom the dimer (DII) was measured using another filter set composedof the same excitation filter but red-shifted dichroic and emissionfilters(ex 450-490 nm, bf 550 nm, em 590-700 nm). Theexperimental setup and transmission of the two filters sets used areshown in Figure 1. Given that the desorption processes studied aredestructive in nature (in contrast to other work on physically adsorbedfluorescent amphiphillic molecules (see, for example, ref 38), thefluorescence measurements for the monomer and dimer had to beperformed one after the other. After each experiment the bead wascleaned by gentle flame annealing, the SAM had to be reformed,washed with sonication and then electrochemical fluorescencemeasurements were performed for either the monomer or dimeremission wavelength. This procedure was not able to ensure thatexactly the same region of the bead surface was being imaged forboth the monomer and dimer fluorescence. Fortunately in all cases,a sizable region common in both images was found and the imagesfor each fluorescence measurement were brought into registry usingImageJ and the plug-in routine Align Stacks.39 This procedure wasperformed on the brightfield image of the bead acquired beforeinitiation of the fluorescence potential step experiment. The surfaceof the Au bead was rough with numerous distinguishing featuresfacilitating alignment. This procedure (described and illustrated inSupporting Information) enabled comparison of the monomer anddimer fluorescence from the same region of the bead surface, resultingin data that had high fidelity for direct comparison. This allowed foranalysis not just based on average intensity, but also on the similarityof where and at what potential the monomer and dimer fluorescencewas observed. The images presented are color coded so that monomerfluorescence appears green and dimer fluorescence appears red.
Results
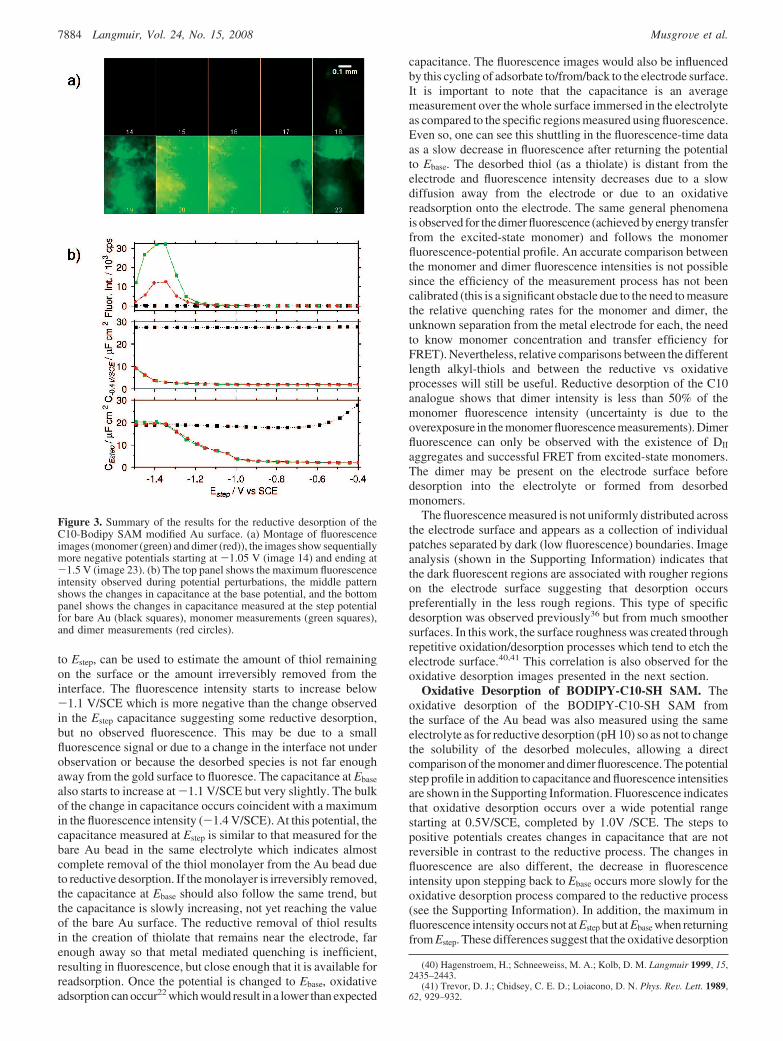
Reductive Desorption of BODIPY-C10-SH SAM. Previouslythe effect of potential and substrate on the reductive desorptionof a BODIPY-C10-SH SAM from a gold bead36 was illustratedthrough the measurement of monomer fluorescence. The SAMwas desorbed from the Au surface at negative potentials, beingselectively removed first from a Au(111) surface feature, thenfrom other regions on the surface. The reductive removal of thesame SAM is also demonstrated here using fluorescence fromboth the monomer and the DII dimer. Comparisons will be madefrom the same region of the electrode surface after imagealignment as described above.
The complete desorption potential step profile is shown inFigure 2 including capacitance measurements and the averagemonomer and dimer fluorescence intensities. The equivalentmeasurements for the unmodified Au bead are also included.Fluorescence (monomer and dimer) is observed for potentialsmore negative than-1.2 V/SCE which lags the changes observedfor the capacitance measured at Ebase. The actual maximum inthe monomer fluorescence intensity is greater than what wasmeasured due to an overexposure of the CCD detector, but resultsin a more clear picture of the start and end of the fluorescenceprocess.
The fluorescence intensity dramatically changes with electrodepotential, becoming measurable when the potential is stepped toa sufficiently negative Estep, and then quickly decreasing whenthe potential is returned to Ebase. The capacitance also followsa similar profile showing sharp changes in response to changesin potential. The overall potential dependent changes are bestanalyzed by looking at a subset of the data which were extractedfrom each cycle in potential (e.g., the six-image cycle that startswith Estep image and includes five Ebase images). The maximumfluorescence intensity, the capacitance at both the Estep and Ebase
potentials are plotted in Figure 3b as a function of Estep as arethe corresponding images in Figure 3a (all taken at Estep).
The capacitance measurements at Estep are made 5 s after thepotential step from Ebase to Estep and are a good indication ofthe state of the interface at the time of image acquisition. Thecapacitance measured at Ebase, after returning from an excursion
(38) Bizzotto, D.; Yang, Y.; Shepherd, J. L.; Stoodley, R.; Agak, J.; Stauffer,V.; Lathuilliere, M.; Akhtar, A. S.; Chung, E. J. Electroanal. Chem. 2004, 574,167–184.
(39) Parker, A. Align3TP http://www.med.harvard.edu/JPNM/ij/plugins/Align3TP.html
Figure 1. Schematic of the experimental setup, the BODIPY moleculeand the transmission characteristics of the filter sets used for the in situfluorescence microscopy. Figure 2. Reductive desorption of a C10-Bodipy SAM modified Au
surface. The top and middle panels show the changes in fluorescenceintensity and capacitance respectively during the changes in potentialas shown in the bottom panel: (black squares) measurement from bareAu surface, (green squares) measurement from modified Au surface formonomer fluorescence, (red circles) measurement from modified Ausurface for dimer fluorescence.
OxidatiVe Desorption of a Monolayer Coated Au Bead Langmuir, Vol. 24, No. 15, 2008 7883
to Estep, can be used to estimate the amount of thiol remainingon the surface or the amount irreversibly removed from theinterface. The fluorescence intensity starts to increase below-1.1 V/SCE which is more negative than the change observedin the Estep capacitance suggesting some reductive desorption,but no observed fluorescence. This may be due to a smallfluorescence signal or due to a change in the interface not underobservation or because the desorbed species is not far enoughaway from the gold surface to fluoresce. The capacitance at Ebase
also starts to increase at -1.1 V/SCE but very slightly. The bulkof the change in capacitance occurs coincident with a maximumin the fluorescence intensity (-1.4 V/SCE). At this potential, thecapacitance measured at Estep is similar to that measured for thebare Au bead in the same electrolyte which indicates almostcomplete removal of the thiol monolayer from the Au bead dueto reductive desorption. If the monolayer is irreversibly removed,the capacitance at Ebase should also follow the same trend, butthe capacitance is slowly increasing, not yet reaching the valueof the bare Au surface. The reductive removal of thiol resultsin the creation of thiolate that remains near the electrode, farenough away so that metal mediated quenching is inefficient,resulting in fluorescence, but close enough that it is available forreadsorption. Once the potential is changed to Ebase, oxidativeadsorption can occur22 which would result in a lower than expected
capacitance. The fluorescence images would also be influencedby this cycling of adsorbate to/from/back to the electrode surface.It is important to note that the capacitance is an averagemeasurement over the whole surface immersed in the electrolyteas compared to the specific regions measured using fluorescence.Even so, one can see this shuttling in the fluorescence-time dataas a slow decrease in fluorescence after returning the potentialto Ebase. The desorbed thiol (as a thiolate) is distant from theelectrode and fluorescence intensity decreases due to a slowdiffusion away from the electrode or due to an oxidativereadsorption onto the electrode. The same general phenomenais observed for the dimer fluorescence (achieved by energy transferfrom the excited-state monomer) and follows the monomerfluorescence-potential profile. An accurate comparison betweenthe monomer and dimer fluorescence intensities is not possiblesince the efficiency of the measurement process has not beencalibrated (this is a significant obstacle due to the need to measurethe relative quenching rates for the monomer and dimer, theunknown separation from the metal electrode for each, the needto know monomer concentration and transfer efficiency forFRET). Nevertheless, relative comparisons between the differentlength alkyl-thiols and between the reductive vs oxidativeprocesses will still be useful. Reductive desorption of the C10analogue shows that dimer intensity is less than 50% of themonomer fluorescence intensity (uncertainty is due to theoverexposure in the monomer fluorescence measurements). Dimerfluorescence can only be observed with the existence of DII
aggregates and successful FRET from excited-state monomers.The dimer may be present on the electrode surface beforedesorption into the electrolyte or formed from desorbedmonomers.
The fluorescence measured is not uniformly distributed acrossthe electrode surface and appears as a collection of individualpatches separated by dark (low fluorescence) boundaries. Imageanalysis (shown in the Supporting Information) indicates thatthe dark fluorescent regions are associated with rougher regionson the electrode surface suggesting that desorption occurspreferentially in the less rough regions. This type of specificdesorption was observed previously36 but from much smoothersurfaces. In this work, the surface roughness was created throughrepetitive oxidation/desorption processes which tend to etch theelectrode surface.40,41 This correlation is also observed for theoxidative desorption images presented in the next section.
Oxidative Desorption of BODIPY-C10-SH SAM. Theoxidative desorption of the BODIPY-C10-SH SAM fromthe surface of the Au bead was also measured using the sameelectrolyte as for reductive desorption (pH 10) so as not to changethe solubility of the desorbed molecules, allowing a directcomparison of the monomer and dimer fluorescence. The potentialstep profile in addition to capacitance and fluorescence intensitiesare shown in the Supporting Information. Fluorescence indicatesthat oxidative desorption occurs over a wide potential rangestarting at 0.5V/SCE, completed by 1.0V /SCE. The steps topositive potentials creates changes in capacitance that are notreversible in contrast to the reductive process. The changes influorescence are also different, the decrease in fluorescenceintensity upon stepping back to Ebase occurs more slowly for theoxidative desorption process compared to the reductive process(see the Supporting Information). In addition, the maximum influorescence intensity occurs not at Estep but at Ebase when returningfrom Estep. These differences suggest that the oxidative desorption
(40) Hagenstroem, H.; Schneeweiss, M. A.; Kolb, D. M. Langmuir 1999, 15,2435–2443.
(41) Trevor, D. J.; Chidsey, C. E. D.; Loiacono, D. N. Phys. ReV. Lett. 1989,62, 929–932.
Figure 3. Summary of the results for the reductive desorption of theC10-Bodipy SAM modified Au surface. (a) Montage of fluorescenceimages (monomer (green) and dimer (red)), the images show sequentiallymore negative potentials starting at -1.05 V (image 14) and ending at-1.5 V (image 23). (b) The top panel shows the maximum fluorescenceintensity observed during potential perturbations, the middle patternshows the changes in capacitance at the base potential, and the bottompanel shows the changes in capacitance measured at the step potentialfor bare Au (black squares), monomer measurements (green squares),and dimer measurements (red circles).
7884 Langmuir, Vol. 24, No. 15, 2008 MusgroVe et al.
process is slower than the reductive desorption, supported by thework of Morin.23 The desorbed molecules remain close to themetal, resulting in a fluorescence which becomes a maximumonly after 5 s or after the potential is stepped back to Ebase. Itis possible that given the oxidation process creates either acids23,42
or sulfates26 or RSO2 H,21 these desorbed species (anions) remainelectrostatically attracted to the positively charged metal surface,thereby decreasing their fluorescence efficiency at Estep. Steppingto Ebase changes the charge on the electrode surface and repelsthe desorbed molecules increasing the separation from the metalsurface resulting in larger fluorescence. This is also observedindirectly as significant changes in capacitance after the potentialstep to Estep, remaining relatively constant even after the potentialreturns to Ebase. In contrast to reductive desorption, readsorptiondoes not seem to occur when the layer is oxidatively removed.The ratio of dimer to monomer fluorescence (0.7) is greater thanwhat was measured for the reductive desorption (0.5) suggestingthat the formation/stability of the dimer is easier/larger with theoxidatively desorbed molecules (either acid or sulfate headgroup)than the thiolate produced from reductive desorption.
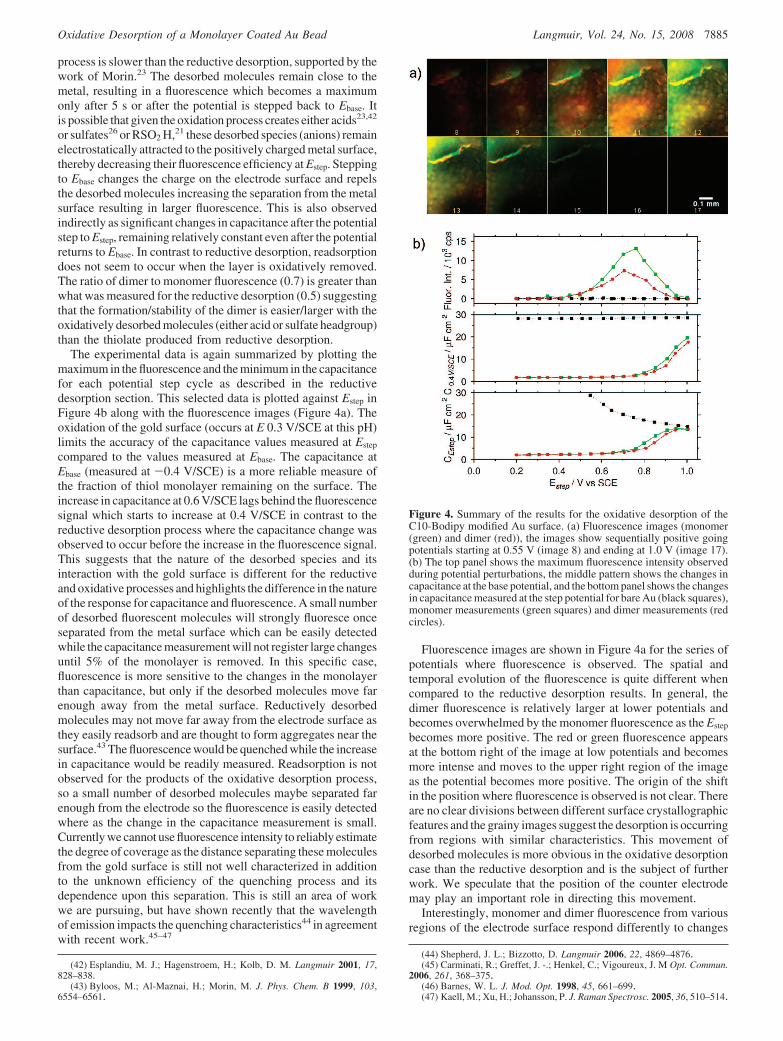
The experimental data is again summarized by plotting themaximum in the fluorescence and the minimum in the capacitancefor each potential step cycle as described in the reductivedesorption section. This selected data is plotted against Estep inFigure 4b along with the fluorescence images (Figure 4a). Theoxidation of the gold surface (occurs at E 0.3 V/SCE at this pH)limits the accuracy of the capacitance values measured at Estep
compared to the values measured at Ebase. The capacitance atEbase (measured at -0.4 V/SCE) is a more reliable measure ofthe fraction of thiol monolayer remaining on the surface. Theincrease in capacitance at 0.6 V/SCE lags behind the fluorescencesignal which starts to increase at 0.4 V/SCE in contrast to thereductive desorption process where the capacitance change wasobserved to occur before the increase in the fluorescence signal.This suggests that the nature of the desorbed species and itsinteraction with the gold surface is different for the reductiveand oxidative processes and highlights the difference in the natureof the response for capacitance and fluorescence. A small numberof desorbed fluorescent molecules will strongly fluoresce onceseparated from the metal surface which can be easily detectedwhile the capacitance measurement will not register large changesuntil 5% of the monolayer is removed. In this specific case,fluorescence is more sensitive to the changes in the monolayerthan capacitance, but only if the desorbed molecules move farenough away from the metal surface. Reductively desorbedmolecules may not move far away from the electrode surface asthey easily readsorb and are thought to form aggregates near thesurface.43 The fluorescence would be quenched while the increasein capacitance would be readily measured. Readsorption is notobserved for the products of the oxidative desorption process,so a small number of desorbed molecules maybe separated farenough from the electrode so the fluorescence is easily detectedwhere as the change in the capacitance measurement is small.Currently we cannot use fluorescence intensity to reliably estimatethe degree of coverage as the distance separating these moleculesfrom the gold surface is still not well characterized in additionto the unknown efficiency of the quenching process and itsdependence upon this separation. This is still an area of workwe are pursuing, but have shown recently that the wavelengthof emission impacts the quenching characteristics44 in agreementwith recent work.45–47
Fluorescence images are shown in Figure 4a for the series ofpotentials where fluorescence is observed. The spatial andtemporal evolution of the fluorescence is quite different whencompared to the reductive desorption results. In general, thedimer fluorescence is relatively larger at lower potentials andbecomes overwhelmed by the monomer fluorescence as the Estep
becomes more positive. The red or green fluorescence appearsat the bottom right of the image at low potentials and becomesmore intense and moves to the upper right region of the imageas the potential becomes more positive. The origin of the shiftin the position where fluorescence is observed is not clear. Thereare no clear divisions between different surface crystallographicfeatures and the grainy images suggest the desorption is occurringfrom regions with similar characteristics. This movement ofdesorbed molecules is more obvious in the oxidative desorptioncase than the reductive desorption and is the subject of furtherwork. We speculate that the position of the counter electrodemay play an important role in directing this movement.
Interestingly, monomer and dimer fluorescence from variousregions of the electrode surface respond differently to changes
(42) Esplandiu, M. J.; Hagenstroem, H.; Kolb, D. M. Langmuir 2001, 17,828–838.
(43) Byloos, M.; Al-Maznai, H.; Morin, M. J. Phys. Chem. B 1999, 103,6554–6561.
(44) Shepherd, J. L.; Bizzotto, D. Langmuir 2006, 22, 4869–4876.(45) Carminati, R.; Greffet, J. -.; Henkel, C.; Vigoureux, J. M Opt. Commun.
2006, 261, 368–375.(46) Barnes, W. L. J. Mod. Opt. 1998, 45, 661–699.(47) Kaell, M.; Xu, H.; Johansson, P. J. Raman Spectrosc. 2005, 36, 510–514.
Figure 4. Summary of the results for the oxidative desorption of theC10-Bodipy modified Au surface. (a) Fluorescence images (monomer(green) and dimer (red)), the images show sequentially positive goingpotentials starting at 0.55 V (image 8) and ending at 1.0 V (image 17).(b) The top panel shows the maximum fluorescence intensity observedduring potential perturbations, the middle pattern shows the changes incapacitance at the base potential, and the bottom panel shows the changesin capacitance measured at the step potential for bare Au (black squares),monomer measurements (green squares) and dimer measurements (redcircles).
OxidatiVe Desorption of a Monolayer Coated Au Bead Langmuir, Vol. 24, No. 15, 2008 7885
in potential. The monomer and dimer fluorescence intensitiesfrom three different regions of interest (ROI: 100 × 100 µm2)and from the full image are compared in Figure 5 quantifyingthe shift in fluorescence observed in the images. ROI1 has amaximum in monomer intensity at 0.7 V/SCE, while monomerfluorescence in ROI3 has a maximum at 0.8 V/SCE. The monomerdesorption and fluorescence moves as a function of potential. Incontrast, the potential of maximum dimer fluorescence does notshift as obviously but rather shows a widening of the potentialrange where dimer fluorescence is observed. This comparisonsuggests that the dimer fluorescence is constrained and does notfollow the monomer trend of shifting from the lower right to theupper left side of the surface/image. This is a subtle but definitedifference in the behavior of the desorbed molecules and suggeststhat the dimerization occurs on the gold surface and the dimersare not created from desorbed monomers.
Oxidative Desorption of BODIPY-C16-SH SAM. Thedesorption of the SAM created with the longer alkyl chain isexpected to differ from the C10 analogue resulting from adecreased solubility of the desorbed molecule near the electrodesurface. The capacitance and fluorescence intensity measuredduring the oxidative desorption of a longer alkyl chain BODIPYtagged thiol is shown in the Supporting Information. Thedesorption starts at potentials similar to what was observed forthe C10 analogue (0.4 V/SCE). Also similar is that the maximumin fluorescence occurs not at Estep but after the potential is switchedback to Ebase. The decrease in fluorescence occurs more slowlywhen the potential changes back to Estep, similar to what wasobserved for the C10 analogue, in contrast to the reductivedesorption results. A similar summary of data through selection
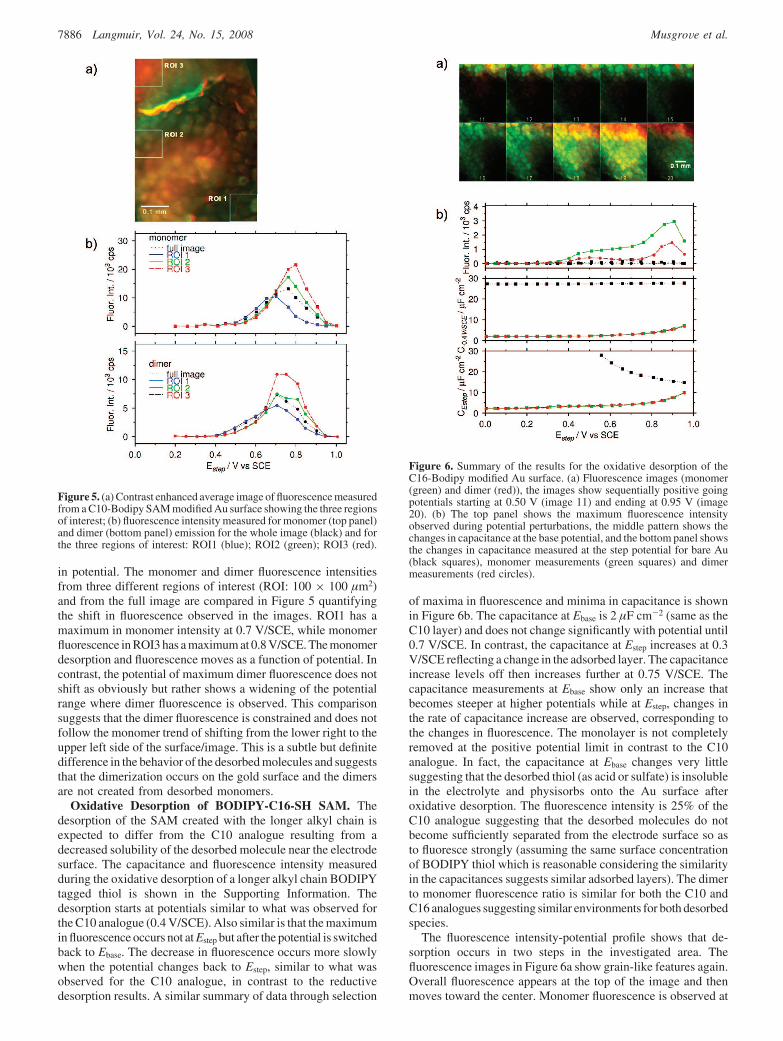
of maxima in fluorescence and minima in capacitance is shownin Figure 6b. The capacitance at Ebase is 2 µF cm-2 (same as theC10 layer) and does not change significantly with potential until0.7 V/SCE. In contrast, the capacitance at Estep increases at 0.3V/SCE reflecting a change in the adsorbed layer. The capacitanceincrease levels off then increases further at 0.75 V/SCE. Thecapacitance measurements at Ebase show only an increase thatbecomes steeper at higher potentials while at Estep, changes inthe rate of capacitance increase are observed, corresponding tothe changes in fluorescence. The monolayer is not completelyremoved at the positive potential limit in contrast to the C10analogue. In fact, the capacitance at Ebase changes very littlesuggesting that the desorbed thiol (as acid or sulfate) is insolublein the electrolyte and physisorbs onto the Au surface afteroxidative desorption. The fluorescence intensity is 25% of theC10 analogue suggesting that the desorbed molecules do notbecome sufficiently separated from the electrode surface so asto fluoresce strongly (assuming the same surface concentrationof BODIPY thiol which is reasonable considering the similarityin the capacitances suggests similar adsorbed layers). The dimerto monomer fluorescence ratio is similar for both the C10 andC16 analogues suggesting similar environments for both desorbedspecies.
The fluorescence intensity-potential profile shows that de-sorption occurs in two steps in the investigated area. Thefluorescence images in Figure 6a show grain-like features again.Overall fluorescence appears at the top of the image and thenmoves toward the center. Monomer fluorescence is observed at
Figure 5. (a) Contrast enhanced average image of fluorescence measuredfrom a C10-Bodipy SAM modified Au surface showing the three regionsof interest; (b) fluorescence intensity measured for monomer (top panel)and dimer (bottom panel) emission for the whole image (black) and forthe three regions of interest: ROI1 (blue); ROI2 (green); ROI3 (red).
Figure 6. Summary of the results for the oxidative desorption of theC16-Bodipy modified Au surface. (a) Fluorescence images (monomer(green) and dimer (red)), the images show sequentially positive goingpotentials starting at 0.50 V (image 11) and ending at 0.95 V (image20). (b) The top panel shows the maximum fluorescence intensityobserved during potential perturbations, the middle pattern shows thechanges in capacitance at the base potential, and the bottom panel showsthe changes in capacitance measured at the step potential for bare Au(black squares), monomer measurements (green squares) and dimermeasurements (red circles).
7886 Langmuir, Vol. 24, No. 15, 2008 MusgroVe et al.
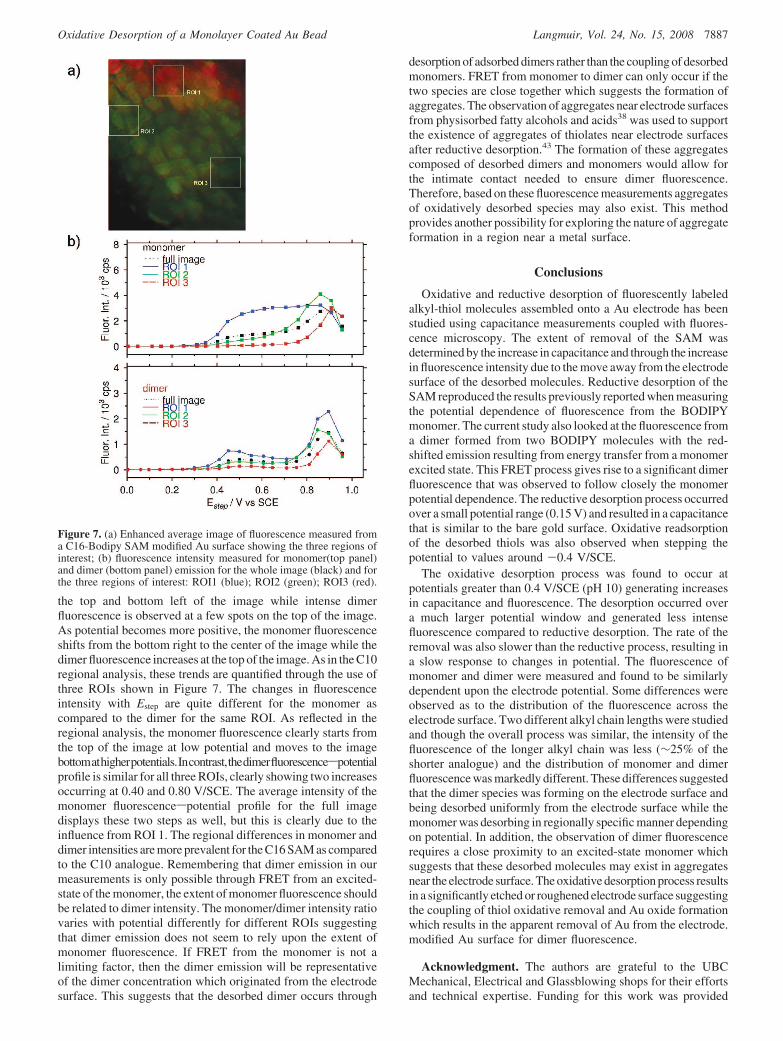
the top and bottom left of the image while intense dimerfluorescence is observed at a few spots on the top of the image.As potential becomes more positive, the monomer fluorescenceshifts from the bottom right to the center of the image while thedimer fluorescence increases at the top of the image. As in the C10regional analysis, these trends are quantified through the use ofthree ROIs shown in Figure 7. The changes in fluorescenceintensity with Estep are quite different for the monomer ascompared to the dimer for the same ROI. As reflected in theregional analysis, the monomer fluorescence clearly starts fromthe top of the image at low potential and moves to the imagebottomathigherpotentials.Incontrast,thedimerfluorescencespotentialprofile is similar for all three ROIs, clearly showing two increasesoccurring at 0.40 and 0.80 V/SCE. The average intensity of themonomer fluorescencespotential profile for the full imagedisplays these two steps as well, but this is clearly due to theinfluence from ROI 1. The regional differences in monomer anddimer intensities are more prevalent for the C16 SAM as comparedto the C10 analogue. Remembering that dimer emission in ourmeasurements is only possible through FRET from an excited-state of the monomer, the extent of monomer fluorescence shouldbe related to dimer intensity. The monomer/dimer intensity ratiovaries with potential differently for different ROIs suggestingthat dimer emission does not seem to rely upon the extent ofmonomer fluorescence. If FRET from the monomer is not alimiting factor, then the dimer emission will be representativeof the dimer concentration which originated from the electrodesurface. This suggests that the desorbed dimer occurs through
desorption of adsorbed dimers rather than the coupling of desorbedmonomers. FRET from monomer to dimer can only occur if thetwo species are close together which suggests the formation ofaggregates. The observation of aggregates near electrode surfacesfrom physisorbed fatty alcohols and acids38 was used to supportthe existence of aggregates of thiolates near electrode surfacesafter reductive desorption.43 The formation of these aggregatescomposed of desorbed dimers and monomers would allow forthe intimate contact needed to ensure dimer fluorescence.Therefore, based on these fluorescence measurements aggregatesof oxidatively desorbed species may also exist. This methodprovides another possibility for exploring the nature of aggregateformation in a region near a metal surface.
Conclusions
Oxidative and reductive desorption of fluorescently labeledalkyl-thiol molecules assembled onto a Au electrode has beenstudied using capacitance measurements coupled with fluores-cence microscopy. The extent of removal of the SAM wasdetermined by the increase in capacitance and through the increasein fluorescence intensity due to the move away from the electrodesurface of the desorbed molecules. Reductive desorption of theSAM reproduced the results previously reported when measuringthe potential dependence of fluorescence from the BODIPYmonomer. The current study also looked at the fluorescence froma dimer formed from two BODIPY molecules with the red-shifted emission resulting from energy transfer from a monomerexcited state. This FRET process gives rise to a significant dimerfluorescence that was observed to follow closely the monomerpotential dependence. The reductive desorption process occurredover a small potential range (0.15 V) and resulted in a capacitancethat is similar to the bare gold surface. Oxidative readsorptionof the desorbed thiols was also observed when stepping thepotential to values around -0.4 V/SCE.
The oxidative desorption process was found to occur atpotentials greater than 0.4 V/SCE (pH 10) generating increasesin capacitance and fluorescence. The desorption occurred overa much larger potential window and generated less intensefluorescence compared to reductive desorption. The rate of theremoval was also slower than the reductive process, resulting ina slow response to changes in potential. The fluorescence ofmonomer and dimer were measured and found to be similarlydependent upon the electrode potential. Some differences wereobserved as to the distribution of the fluorescence across theelectrode surface. Two different alkyl chain lengths were studiedand though the overall process was similar, the intensity of thefluorescence of the longer alkyl chain was less (∼25% of theshorter analogue) and the distribution of monomer and dimerfluorescence was markedly different. These differences suggestedthat the dimer species was forming on the electrode surface andbeing desorbed uniformly from the electrode surface while themonomer was desorbing in regionally specific manner dependingon potential. In addition, the observation of dimer fluorescencerequires a close proximity to an excited-state monomer whichsuggests that these desorbed molecules may exist in aggregatesnear the electrode surface. The oxidative desorption process resultsin a significantly etched or roughened electrode surface suggestingthe coupling of thiol oxidative removal and Au oxide formationwhich results in the apparent removal of Au from the electrode.modified Au surface for dimer fluorescence.
Acknowledgment. The authors are grateful to the UBCMechanical, Electrical and Glassblowing shops for their effortsand technical expertise. Funding for this work was provided
Figure 7. (a) Enhanced average image of fluorescence measured froma C16-Bodipy SAM modified Au surface showing the three regions ofinterest; (b) fluorescence intensity measured for monomer(top panel)and dimer (bottom panel) emission for the whole image (black) and forthe three regions of interest: ROI1 (blue); ROI2 (green); ROI3 (red).
OxidatiVe Desorption of a Monolayer Coated Au Bead Langmuir, Vol. 24, No. 15, 2008 7887

through an NSERC Discovery Grant. We are also grateful to M.Workentin for his support and critical comments.
Supporting Information Available: The complete fluorescenceintensity, capacitance and potential changes measured with time areshown for the oxidation desorption process for both C10-BODIPY andC16-BODIPY thiols (similar to Figure 2). The detailed image analysisand registration procedure is also described and illustrated. The correlation
of surface features measured using brightfield microscopy and theresulting fluorescence image is shown. The static images shown in Figures3, 4, and 6 are represented as movies facilitating the sensation of motionof the desorbed molecules across the surface as the potential becomesmore negative (reductive desorption) or positive (oxidative desorption).Thismaterial isavailablefreeofchargeviatheInternetathttp://pubs.acs.org.
LA800233C
7888 Langmuir, Vol. 24, No. 15, 2008 MusgroVe et al.
Related Documents