Biophysical Chemistry ELSEVIER Biophysical Chemistry 59 (1996) I 19- 13I Fluorescence emission and Thomas P. Burghardt anisotropy from rhodamine dimers *, James E. Lyke, Katalin Ajtai Depurtment of Biochemistry and Moleculur Biology, Muyo Foundation. Rochester. MN 55905, USA Received 18 April 1995; revised 5 September 199.5; accepted 6 September 1995 Abstract The absorption, fluorescence emission, and excitation fluorescence anisotropy spectra of a rhodamine dye in a water-glycerol solution at high concentration were investigated to determine spectroscopic properties of the ground state dimer. The combination of data from these spectra measured at several dye concentrations contained sufficient constraints on the model for dimer association to permit an estimate of: the association constant, the extinction coefficients, the relative fluorescence quantum yield, and the emission spectra of the monomeric and dimeric species. The rhodamine dimer is an efficient fluorescence emitter with fluorescence anisotropy equivalent to that of the pure monomeric species over the range of excitation wavelengths covering its two lowest energy transitions. Keywords: Rhodamine dimers; Fluorescence; Anisotropy; Lifetime; Quantum efficiency; Emission 1. Introduction Rhodamine dyes are used as fluorescent probes of proteins in biological applications for detecting pro- tein orientation because of their high time-zero ani- sotropy, photostability, and red emission making them ideal for use in a microscope. In muscle re- search, Borejdo et al. [l] observed time-resolved myosin cross-bridge rotation in active muscle fibers using fluctuations in polarized fluorescence from iodoacetamidotetramethylrhodamine (IATR) modify- ing the fast reacting thiol, SHl (Cys 707), of myosin. Later, the steady-state linear dichroism of fluores- cence from IATR on SHl in fibers indicated that * Corresponding author. Tel.: (507) 284 8120. Fax: (507) 284 9349. E-mail: [email protected]. cross-bridges in isometric contraction maintain a dif- ferent orientation than those in rigor [2,3]. These observations conform with the notion that cross- bridges rotate to generate force during contraction. The special sensitivity of IATR to cross-bridge rota- tion is due principally to its unique orientation on the cross-bridge [4,5]. We observed the stereospecificity of IATR for the SHl binding site on myosin by noting the differences in the efficiency between S- IATR and 6’-IATR for modification of SHl 161. At that time we also observed that the stoichiometry of the binding of S-IATR to SHl was two probes per SH 1 modification. The affinity of rhodamine monomers for self-as- sociation is well known so it is reasonable to suspect than an IATR dimer could modify myosin. Charac- teristic for IATR-labeled myosin is a high (nearly maximal) fluorescence anisotropy covering the main 0301.4622/96/$15.00 0 1996 Elsevier Science B.V. All rights reserved SSDI 0X01-4622(95)001 18-2

Welcome message from author
This document is posted to help you gain knowledge. Please leave a comment to let me know what you think about it! Share it to your friends and learn new things together.
Transcript
Biophysical Chemistry
ELSEVIER Biophysical Chemistry 59 (1996) I 19- 13 I
Fluorescence emission and
Thomas P. Burghardt
anisotropy from rhodamine dimers
*, James E. Lyke, Katalin Ajtai Depurtment of Biochemistry and Moleculur Biology, Muyo Foundation. Rochester. MN 55905, USA
Received 18 April 1995; revised 5 September 199.5; accepted 6 September 1995
Abstract
The absorption, fluorescence emission, and excitation fluorescence anisotropy spectra of a rhodamine dye in a water-glycerol solution at high concentration were investigated to determine spectroscopic properties of the ground state dimer. The combination of data from these spectra measured at several dye concentrations contained sufficient constraints on the model for dimer association to permit an estimate of: the association constant, the extinction coefficients, the relative fluorescence quantum yield, and the emission spectra of the monomeric and dimeric species. The rhodamine dimer is an efficient fluorescence emitter with fluorescence anisotropy equivalent to that of the pure monomeric species over the range of excitation wavelengths covering its two lowest energy transitions.
Keywords: Rhodamine dimers; Fluorescence; Anisotropy; Lifetime; Quantum efficiency; Emission
1. Introduction
Rhodamine dyes are used as fluorescent probes of proteins in biological applications for detecting pro- tein orientation because of their high time-zero ani- sotropy, photostability, and red emission making them ideal for use in a microscope. In muscle re- search, Borejdo et al. [l] observed time-resolved myosin cross-bridge rotation in active muscle fibers using fluctuations in polarized fluorescence from iodoacetamidotetramethylrhodamine (IATR) modify- ing the fast reacting thiol, SHl (Cys 707), of myosin. Later, the steady-state linear dichroism of fluores- cence from IATR on SHl in fibers indicated that
* Corresponding author. Tel.: (507) 284 8120. Fax: (507) 284 9349. E-mail: [email protected].
cross-bridges in isometric contraction maintain a dif- ferent orientation than those in rigor [2,3]. These observations conform with the notion that cross- bridges rotate to generate force during contraction. The special sensitivity of IATR to cross-bridge rota- tion is due principally to its unique orientation on the cross-bridge [4,5]. We observed the stereospecificity of IATR for the SHl binding site on myosin by noting the differences in the efficiency between S- IATR and 6’-IATR for modification of SHl 161. At that time we also observed that the stoichiometry of the binding of S-IATR to SHl was two probes per SH 1 modification.
The affinity of rhodamine monomers for self-as- sociation is well known so it is reasonable to suspect than an IATR dimer could modify myosin. Charac- teristic for IATR-labeled myosin is a high (nearly maximal) fluorescence anisotropy covering the main
0301.4622/96/$15.00 0 1996 Elsevier Science B.V. All rights reserved
SSDI 0X01-4622(95)001 18-2
120 T.P. Burghardt et al./ Biophysicul Chemistry 59 (1996) 119-131
visible absorption band, when the labeled protein is randomly oriented and immobilized in a viscus solu- tion. The high-anisotropy wavelength region includes the two visible transitions expected from a dimer such that, if a dimer is present, the transition dipoles are nearly parallel. Plane parallel or antiparallel, and stacked rhodamine monomers with single weakly coupled dipole oscillators is not a good model for the rhodamine monomer conformation in the dimer [7]. However, less symmetrical conformations with mul- tiple weakly coupled oscillators (T.P. Burghardt and K. Ajtai, 1995, unpublished results), or vibronically (strongly) coupled oscillators could account for these observations [7]. In either case the fluorescence ani- sotropy of the coupled dipole oscillators in a dimer depends on the separation and relative orientation of the monomers by the dipole-dipole interaction. We investigated the fluorescence anisotropy of a model rhodamine dimer system by measuring the fluores- cence emission and anisotropy of a rhodamine dye in solution where monomers and dimers are in equilib- rium. We report here on methods for separating absorption and emission signals of monomeric from dimeric dye and on findings concerning the absorp- tion, fluorescence emission, and fluorescence aniso- tropy of rhodamine dimers.
The formation of rhodamine dimers in solution begins at moderate concentrations of dye but the fraction of dimers to monomers is not near unity until ca. 3 mM dye concentration [8,9]. The observa- tion of the emission from a dimer in solution is difficult because of the high concentrations needed and because the dimer is in equilibrium with the monomer. The emission from a highly absorbing solution of dye molecules is detected free of imrer- filtering and self-absorption artifacts by using a very short path length capillary to contain the sample. The separation of monomer and dimer emission is man- aged by making a series of measurements in which we vary dye concentration and the excitation and emission wavelengths. A system of equations cou- pling the unknown monomer and dimer emission intensities or anisotropies describes the observed spectra. The unknowns are found with a least-squares protocol with inequality constraints.
We find that the rhodamine dimer emission is broader and red shifted relative to monomer emis- sion, and that the quantum yield of the dimer is
slightly larger than that of the monomer. The fluores- cence excitation anisotropy of the dimer is very nearly the same for the two lowest energy transitions in the dimer, as observed in rhodamine-labeled myosin, indicating that the planar, stacked rho- damine monomer conformation with two weakly coupled oscillators is not an appropriate model for the dimer. The observed dimer fluorescence anisotro- py also appears inconsistent with origination from a vibronically induced, electronically forbidden, transi- tion because the dimer’s radiative lifetime is too similar to that of the monomer’s electronically al- lowed transition, An alternative mechanism is pro- posed.
2. Materials and methods
2.1. Chemicals
Rhodamine 590 (R590) was from Exciton Inc. (Dayton, OH), spectrophotometric grade glycerol was from Aldrich (Milwaukee, WI), and spectroscopic grade ethanol (anhydrous alcohol) was from J.T. Baker (Phillipsburg, NJ).
2.2. Solutions
R590 was dissolved in a 40% glycerol-water mixture (volume-to-volume) at 0.4 mM, 0.2 mM, 0.1 mM, 0.01 mM, and 0.5 )(LM probe concentrations. The glycerol volume was measured by weight using the glycerol density of 1.261 g/ml. R590 was dis- solved in ethanol at 0.4 mM, 0.2 mM, 0.15 mM, 0.1 mM, 0.05 mM, and 0.5 PM concentrations. In one experiment R590 was dissolved in 90% glycerol- water mixture at 1.0 PM concentration.
2.3. Absorption spectroscopy
Absorption spectra were measured on a Cary 4 (Varian, Houston, TX) spectrophotometer using 0.02, 0.1, 0.2, or 1.0 cm path length cuvettes. Linearity of the Cary 4 is good to an optical density of ca. 3 without any special adaptation of the instrument. This was sufficient in all of our experiments. Ab- sorption experiments on R590 in 40% glycerol-water solution were performed at 0°C. Experiments on R590 in ethanol were performed at 22°C.
T.P. Burghardr et ul./Biophysicu/ Chemistry 59 (1996) 119-131 121
We calculate absorption dipole strengths, DO,m, for a transition from the ground state to excited state m, from the extinction coefficients using the formula
/ &dh
D O.m = 9.18 x 1O-3 ( P2/n)A (D2)
where p = (n* + 2)/3, n is the refractive the medium containing the probe, and the
(1)
index of limits of
integration are set by the width of the absorption band of interest.
2.4. Fluorescence spectroscopy
We measured fluorescence spectra on an SLM 8000 fluorescence machine (SLM Instruments, Rochester, NY) equipped with Glan-Thompson po- larizers. Emission intensity spectra were collected from 510 to 620 nm with a single grating monochro- mator without correction for the monochromator transmission or phototube response variability and with excitation wavelengths of 460, 480, 490, 500, and 510 nm. The slit widths were 2-4 nm on the excitation side and 4-8 nm on the emission side. Polarized emission, as a function of excitation wave- length, was detected at 519 + 10 nm, 551 + 5 nm, and 601 + 5 nm emission wavelengths using a com- bination of cut-off and interference filters. Again the slit widths were 2-4 nm on the excitation side. We corrected all fluorescence spectra for lamp intensity and excitation monochromator transmission varia- tions by dividing emission signals by the lamp inten- sity. The lamp intensity was detected with a 3 g/l solution of rhodamine B in ethylene glycol acting as a quantum counter. All fluorescence experiments on R590 in 40% glycerol-water solution were per- formed at 0°C. The fluorescence anisotropy experi- ment on 1.0 PM R590 in 90% glycerol was per- formed at - 15°C.
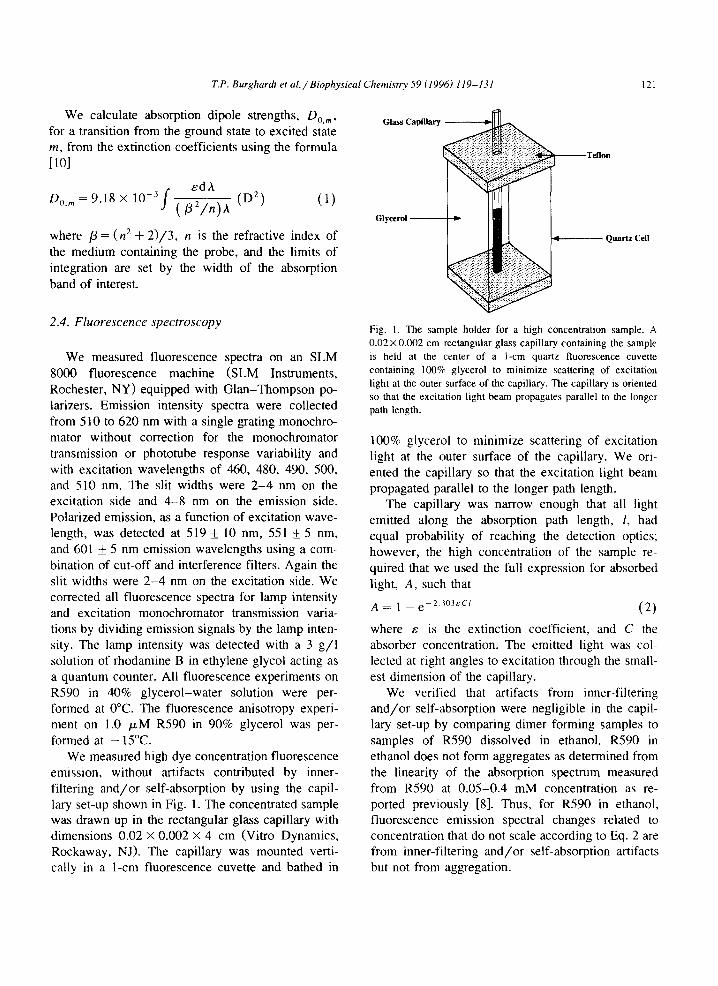
We measured high dye concentration fluorescence emission, without artifacts contributed by inner- filtering and/or self-absorption by using the capil- lary set-up shown in Fig. 1. The concentrated sample was drawn up in the rectangular glass capillary with dimensions 0.02 X 0.002 X 4 cm (Vitro Dynamics, Rockaway, NJ). The capillary was mounted verti- cally in a l-cm fluorescence cuvette and bathed in
Fig. I. The sample holder for a high concentration sample. A 0.02 X 0.002 cm rectangular glass capillary containing the sample is held at the center of a I-cm quartz fluorescence cuvette containing lOO?k glycerol to minimize scattering of excitation light at the outer surface of the capillary. The capillary is oriented so that the excitation light beam propagates parallel to the longer
path length.
100% glycerol to minimize scattering of excitation light at the outer surface of the capillary. We ori- ented the capillary so that the excitation light beam propagated parallel to the longer path length.
The capillary was narrow enough that all light emitted along the absorption path length, 1, had equal probability of reaching the detection optics; however, the high concentration of the sample re- quired that we used the full expression for absorbed light, A, such that A = 1 _ e-2 103ECI
(2)
where 6 is the extinction coefficient, and C the absorber concentration. The emitted light was col- lected at right angles to excitation through the small- est dimension of the capillary.
We verified that artifacts from inner-filtering and/or self-absorption were negligible in the capil- lary set-up by comparing dimer forming samples to samples of R590 dissolved in ethanol. R590 in ethanol does not form aggregates as determined from the linearity of the absorption spectrum measured from R590 at 0.05-0.4 mM concentration as re- ported previously [8]. Thus, for R590 in ethanol, fluorescence emission spectral changes related to concentration that do not scale according to Eq. 2 are from inner-filtering and/or self-absorption artifacts but not from aggregation.
122 T.P. Burghnrdt et al./Biophysicol Chemistry 59 (1996) 119-131
We calculated the overlap of absorption and emis- sion spectra from monomeric R590, J,, and dimer forming R590, Jo, to be able to compare observa- tions of inner-filtering and self-absorption between monomeric R590 and dimer forming R590 such that
J M(D) = lAM(D)( h)fM(D)( ‘jdh (3)
where A is the absorption and f is the fluorescence quantum spectrum normalized to unity on the wave- length scale. fM was measured from 0.5 PM R590 in ethanol in a l-cm cuvette where sample concentra- tion artifacts were negligible. fD was similarly mea- sured from 0.5 PM R590 in 40% glycerol where sample concentration artifacts and dimer formation were negligible. Comparing values of J for concen- trations 5 0.4 mM gives J, > J,. Consequently, for concentrations 5 0.4 mM, when monomeric R590 is not inner-filtering or self-absorbing, then the dimer forming R590 is not inner-filtering or self-ab- sorbing.
The emission observed from monomeric 0.4 mM R590 in the capillary scales with absorber concentra- tion according to IQ. 2 and has a normalized emis- sion spectrum identical to that from 0.5 PM R590 in ethanol. In the latter sample there are no associated inner-filtering or self-absorption artifacts indicating the same for the high concentration monomeric sam- ple and we conclude that our capillary system is free of these artifacts for the dimer forming samples when concentration is I 0.4 mM.
The fluorescence anisotropy, r, is defined by
r3 F,, - FL F,, + 2F,
where F,,( I ) is the fluorescence emission intensity for light polarized (1 (_L> to the excitation light polarization. Polarized fluorescence intensities were corrected for differences in the efficiencies of light detection as a function of polarization by determin- ing the factor g such that g = F,,/F, when F is
measured from a sample with zero anisotropy. Then F, observed from samples with unknown anisotropy is corrected by multiplication with g before forming the anisotropy. We chose 0.5 PM R590 in ethanol at 22°C as a suitable zero anisotropy sample.
3. Results and discussion
3.1. Choice of conditions
We looked for optimum conditions to study the fluorescence anisotropy of the R590 dimer. Ideally this called for high concentration of probe in a solvent that immobilized the molecules. We tried a glycerol-water mixture and found that glycerol sig- nificantly interfered with dimer formation when the mixture was greater than 40% glycerol. When we changed the temperature we found that temperatures lower than 0°C also interfered with dimer formation. The 40% glycerol-water mixture at 0°C is an opti- mum condition balancing dimer formation affinity and probe immobilization. The molecules are slowly tumbling under this condition so that the fluores- cence anisotropy of the immobilized dimer is not directly measured from this sample. We compen- sated for dye mobility by applying a standard model for probe tumbling to convert the observed spectra to the anisotropy of the immobilized dimer [l l].
3.2. Absorption measurements
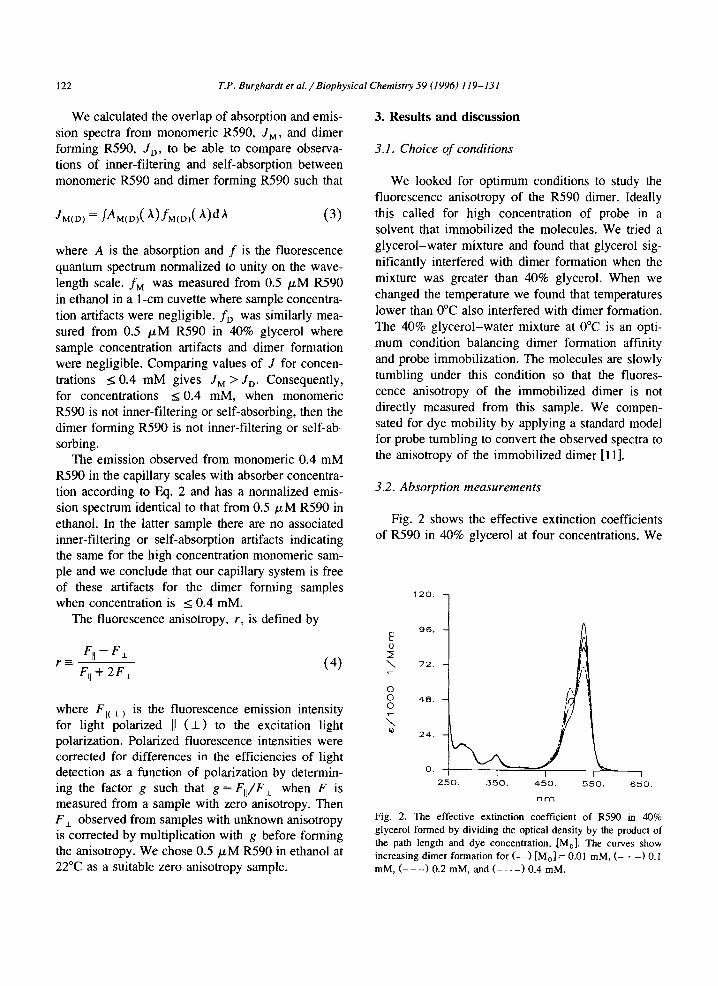
Fig. 2 shows the effective extinction coefficients of R590 in 40% glycerol at four concentrations. We
120. 7
96.
72.
24.
0.
250. 350. 450. 550. 650.
nm
Fig. 2. The effective extinction coefficient of RX@ in 40% glycerol formed by dividing the optical density by the product of the path length and dye concentration, [M,]. The curves show increasing dimer formation for (-_) [M,] = 0.01 mM, (- * -1 0.1 mM, (- - -) 0.2 mM, and (- - -10.4 mM.
T.P. Burghardt et al./Biophysical Chemistry 59 (1996) 119-131 123
modeled the interaction of the dye molecules as a bimolecular reaction such that
M+MsD (5) kl
where M is a monomer, D is a dimer, ki is a reaction rate, and C = k,/k, is the association constant. At equilibrium, the absorption of a dye solution with concentration [M,] is
A = E,[M]I + &,[D]I (6)
where &M(D) is the monomer (dimer) extinction co- efficient and 1 the path length. The concentrations at equilibrium are
[M] = v’[Dl/C
and
[D] = 1/8(x- {16[M,12)
where x = NM,] + l/C [12]. The unknowns in Eq. 6 are the linear coefficients Ed, cD, and the non-lin- ear quantity C (implicit in Eq. 6). We used Eq. 6 and a least-squares protocol on the spectra in Fig. 2 to find the best estimates of Ed and E,,, for a given C. The least-squares protocol included inequality con- straints such that F~ and &,, were 2 0. We found the best choice for C by minimizing the sum of the
X2 values from every wavelength in the spectrum while searching through a reasonable domain for C. The solution specifies C and the extinction coeffi- cients as a function of wavelength. In 40% glycerol at OT, we found that C = 1010 + 100 M-’ which is ca. half its value for R.590 in water at room tempera- ture. From C we calculated that at [M,] = 0.1 mM, [M] = 8.53 x lo--’ M, and [D] = 7.35 x 1O-6 M, and that at [M,] = 0.4 mM, [Ml = 2.62 X 10e4 M, and [D] = 6.92 X 10e5 M. These values are used in the interpretation of the fluorescence experiments described in Section 3.3.
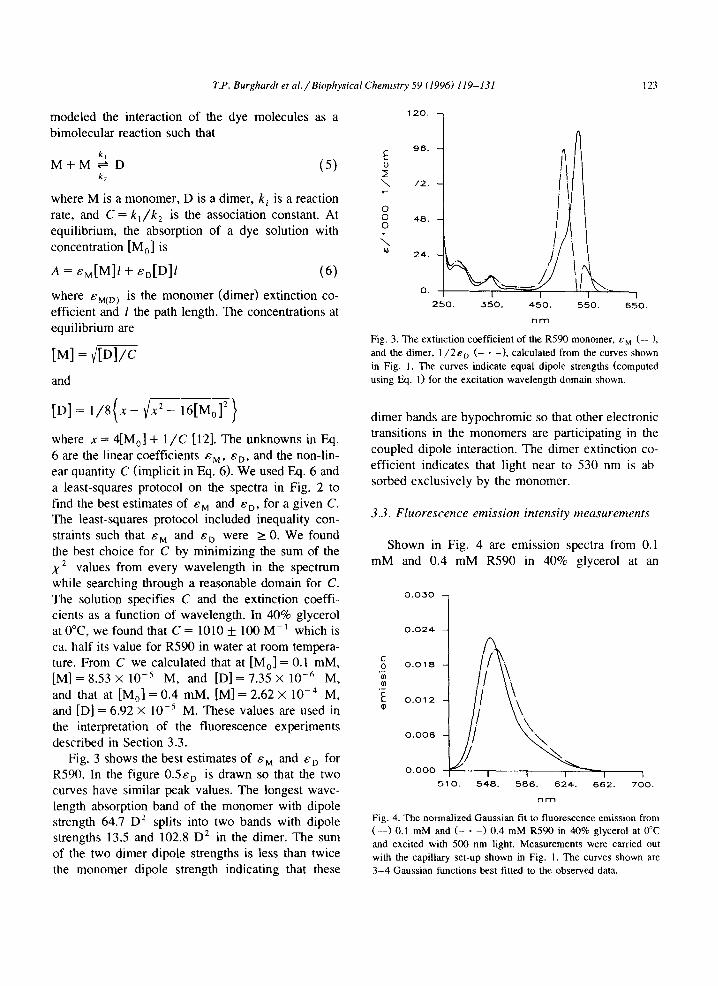
Fig. 3 shows the best estimates of By and Ed for R590. In the figure O.&T, is drawn so that the two curves have similar peak values. The longest wave- length absorption band of the monomer with dipole strength 64.7 D2 splits into two bands with dipole strengths 13.5 and 102.8 D* in the dimer. The sum of the two dimer dipole strengths is less than twice the monomer dipole strength indicating that these
24.
0.
250. 350. 450. 550. 650
“WI
Fig. 3. The extinction coefficient of the R590 monomer, Ed (-_), and the dimer, I ,/2&o (- * -1. calculated from the curves shown in Fig. 1. The curves indicate equal dipole strengths (computed using E.q. I) for the excitation wavelength domain shown.
dimer bands are hypochromic so that other electronic transitions in the monomers are participating in the coupled dipole interaction. The dimer extinction co- efficient indicates that light near to 530 nm is ab- sorbed exclusively by the monomer.
3.3. Fluorescence emission intensity measurements
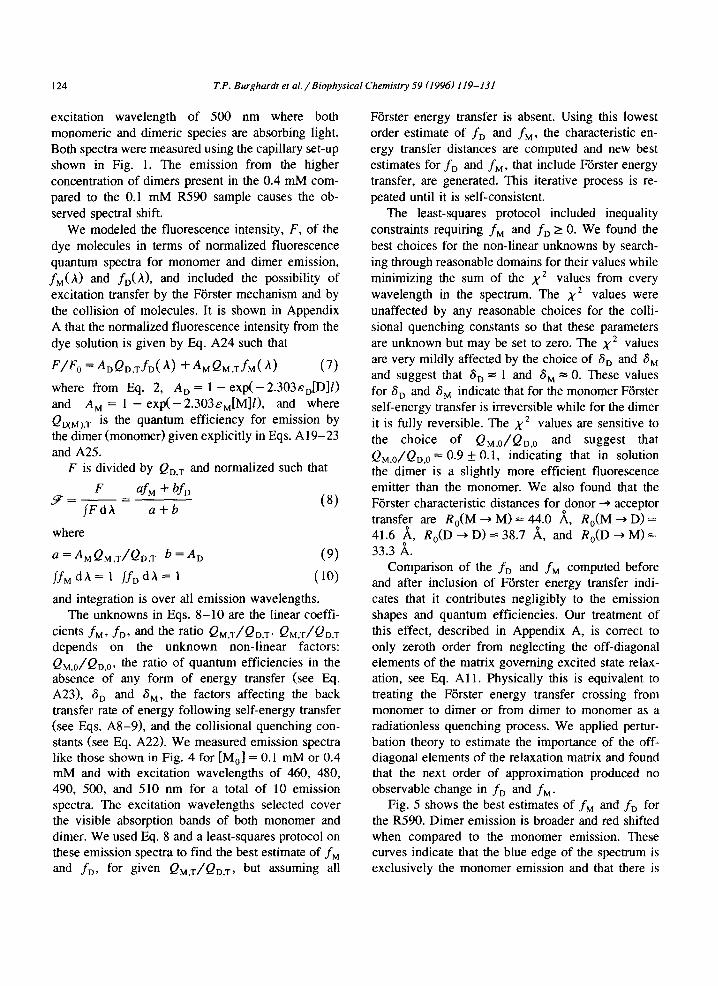
Shown in Fig. 4 are emission spectra from 0.1 mM and 0.4 mM R590 in 40% glycerol at an
0.030
1 0.024 4
C 0 0.018 -
.-
I .- i 0.012 -
I I 510. 546. 566. 624. 662. 700.
“WI
Fig. 4. The normalized Gaussian tit to fluorescence emission from (-_) 0.1 mM and (- * -) 0.4 mM R590 in 40% glycerol at 0°C and excited with 500 nm light. Measurements were carried out with the capillary set-up shown in Fig. I. The curves shown are 3-4 Gaussian functions best fitted to the observed data.
124 T.P. Burghardt et al./Biophysical Chemistry 59 (1996) 119-131
excitation wavelength of 500 nm where both monomeric and dimeric species are absorbing light. Both spectra were measured using the capillary set-up shown in Fig. 1. The emission from the higher concentration of dimers present in the 0.4 mM com- pared to the 0.1 mM R590 sample causes the ob- served spectral shift.
We modeled the fluorescence intensity, F, of the dye molecules in terms of normalized fluorescence quantum spectra for monomer and dimer emission, .&,(A> and &(A), and included the possibility of excitation transfer by the Fiirster mechanism and by the collision of molecules. It is shown in Appendix A that the normalized fluorescence intensity from the dye solution is given by Eq. A24 such that
F/F, =A,Q,,,f,V) +A,Q,,,fd@ (7) where from Eq. 2, A, = 1 - exp( - 2.303&,[D]l) and A, = 1 - exp(- 2.303&,[M]l), and where QwMJ,r is the quantum efficiency for emission by the dimer (monomer) given explicitly in Eqs. A19-23 and A25.
F is divided by Qn,r and normalized such that
F
F=lFdh=
afM + bfD a+b (8)
where
a = A, QM.-JQ~.~ b = AD (9) /f,dh=l jfndX=l ( 10) and integration is over all emission wavelengths.
The unknowns in Eqs. 8-10 are the linear coeffi- cients fMv fD, and he ratio QM,T/QD,T. QM,T/QD,T depends on the unknown non-linear factors: QM,o/QD,o~ the ratio of quantum efficiencies in the absence of any form of energy transfer (see Eq. A23), 6, and a,, the factors affecting the back transfer rate of energy following self-energy transfer (see Eqs. A8-9), and the collisional quenching con- stants (see Eq. A22). We measured emission spectra like those shown in Fig. 4 for [Ma] = 0.1 mM or 0.4 mM and with excitation wavelengths of 460, 480, 490, 500, and 510 nm for a total of 10 emission spectra. The excitation wavelengths selected cover the visible absorption bands of both monomer and dimer. We used Eq. 8 and a least-squares protocol on these emission spectra to find the best estimate of f, and f,, for given QM,r/Qn.r, but assuming all
Fiirster energy transfer is absent. Using this lowest order estimate of fD and fM, the characteristic en- ergy transfer distances are computed and new best estimates for fD and fM, that include Fijrster energy transfer, are generated. This iterative process is re- peated until it is self-consistent.
The least-squares protocol included inequality constraints requiring fM and f, r 0. We found the best choices for the non-linear unknowns by search- ing through reasonable domains for their values while minimizing the sum of the x2 values from every wavelength in the spectrum. The x2 values were unaffected by any reasonable choices for the colli- sional quenching constants so that these parameters are unknown but may be set to zero. The x2 values are very mildly affected by the choice of 6, and S, and suggest that 6, = 1 and S, = 0. These values for S, and S, indicate that for the monomer Fijrster self-energy transfer is irreversible while for the dimer it is fully reversible. The x2 values are sensitive to the choice of QM,JQnO and suggest that QM,O/Qn,O = 0.9 + 0.1, indicating that in solution the dimer is a slightly more efficient fluorescence emitter than the monomer. We also found that the Fijrster characteristic distances for $onor --) acceptor transfer are R&M + M) = 44.0 A, R,(M --j D) = 41.6 A, R,(D + D) = 38.7 A, and R,(D + M) = 33.3 A.
Comparison of the fD and f, computed before and after inclusion of Fijrster energy transfer indi- cates that it contributes negligibly to the emission shapes and quantum efficiencies. Our treatment of this effect, described in Appendix A, is correct to only zeroth order from neglecting the off-diagonal elements of the matrix governing excited state relax- ation, see Eq. Al 1. Physically this is equivalent to treating the Forster energy transfer crossing from monomer to dimer or from dimer to monomer as a radiationless quenching process. We applied pertur- bation theory to estimate the importance of the off- diagonal elements of the relaxation matrix and found that the next order of approximation produced no observable change in fD and fM .
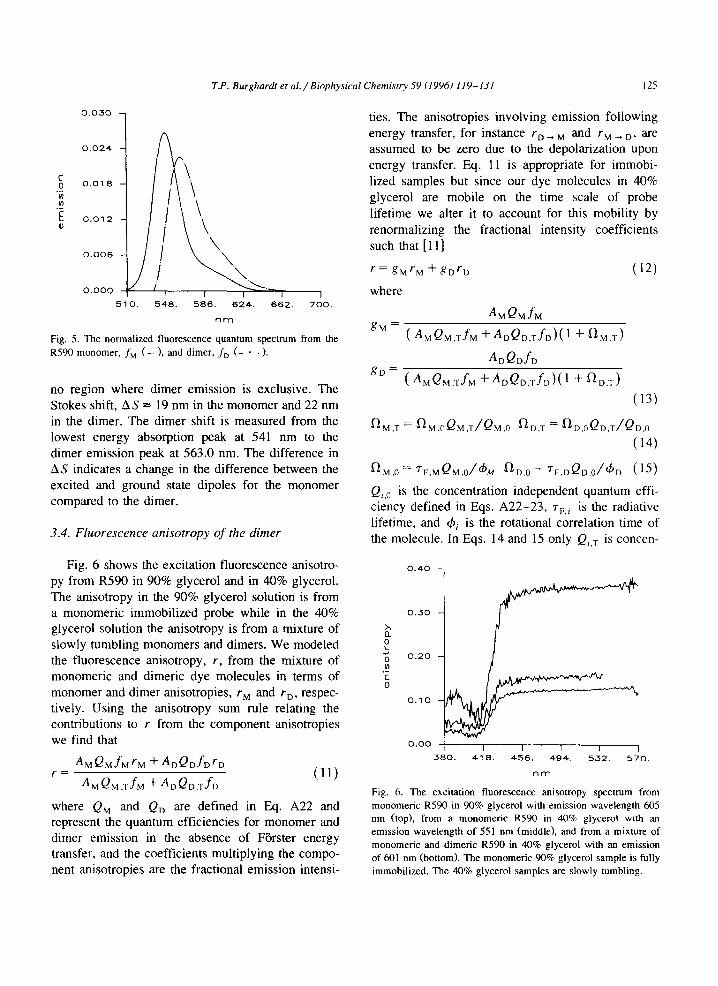
Fig. 5 shows the best estimates of f, and fD for the R590. Dimer emission is broader and red shifted when compared to the monomer emission. These curves indicate that the blue edge of the spectrum is exclusively the monomer emission and that there is
T.P. Burghardt et al./Biophysical Chemistry 59 (1996) 119-131 125
0.030
1
k ‘\ 0.018 ._
I \
.-
: O’OZ4 I 0.012 i’ i ’
I \\
0.006 i .\
0.000
/I I I I I 1
510. 548. 586. 624. 662. 700.
“Wl
Fig. 5. The normalized fluorescence quantum spectrum from the R590 monomer, fM (--_). and dimer, f. (- . -).
no region where dimer emission is exclusive. The Stokes shift, AS = 19 nm in the monomer and 22 nm in the dimer. The dimer shift is measured from the lowest energy absorption peak at 541 nm to the dimer emission peak at 563.0 nm. The difference in AS indicates a change in the difference between the excited and ground state dipoles for the monomer compared to the dimer.
3.4. Fluorescence anisotropy of the dimer
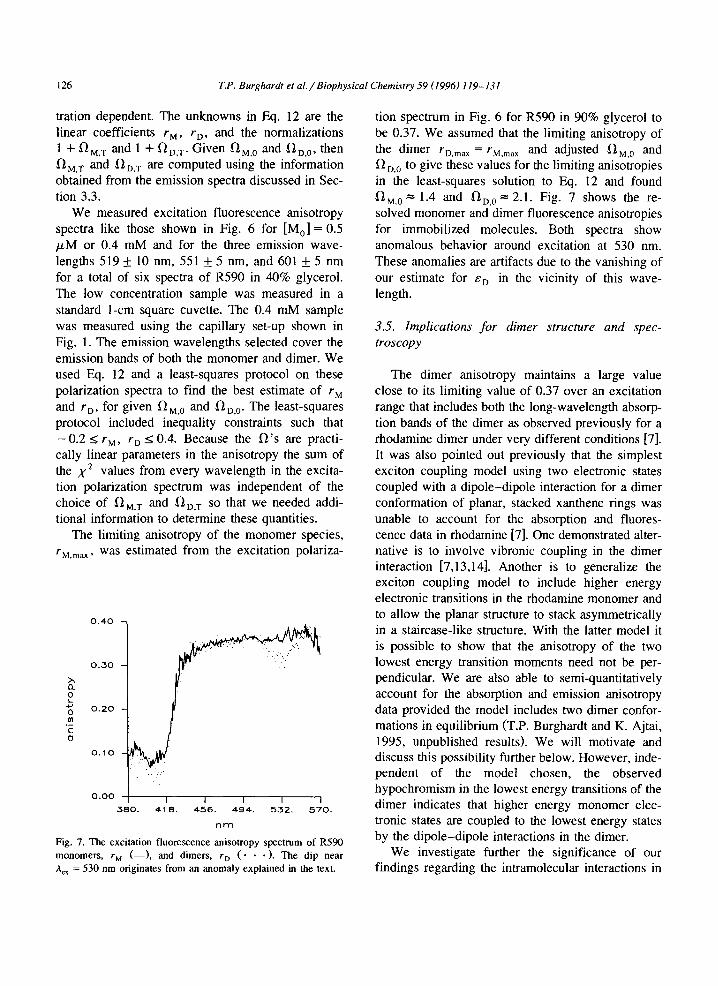
Fig. 6 shows the excitation fluorescence anisotro- py from R590 in 90% glycerol and in 40% glycerol. The anisotropy in the 90% glycerol solution is from a monomeric immobilized probe while in the 40% glycerol solution the anisotropy is from a mixture of slowly tumbling monomers and dimers. We modeled the fluorescence anisotropy, r, from the mixture of monomeric and dimeric dye molecules in terms of monomer and dimer anisotropies, rM and rD, respec- tively. Using the anisotropy sum rule relating the contributions to r from the component anisotropies we find that
AMQM~M~M fA,Q,f~r, r=
AMQM.T~M +A,Qwrf~ (11)
where QM and Q, are defined in Eq. A22 and represent the quantum efficiencies for monomer and dimer emission in the absence of Fiirster energy transfer, and the coefficients multiplying the compo- nent anisotropies are the fractional emission intensi-
ties. The anisotropies involving emission following energy transfer, for instance rD ~ M and rM j ,,, are assumed to be zero due to the depolarization upon energy transfer. Eq. 11 is appropriate for immobi- lized samples but since our dye molecules in 40% glycerol are mobile on the time scale of probe lifetime we alter it to account for this mobility by renormalizing the fractional intensity coefficients such that [ll]
‘=gMrM +KD’D (12)
where
AMQtVtfM gM = (AMQM,T~M +A~Q~,Tf~)(l +fi~,T)
ADQD~D
gD = ( A,Q,,,f, +A.Q,,Tf,)(l + ‘D.T)
(13)
R M,T = ~~M,oQM,T/&I.O ‘D,T = aD,OQ~,~/Q~.O
(14)
R M .O = ‘F.M Q~,o/b ‘D.0 = TF.DQD.o/~D (15)
Q,,, is the concentration independent quantum effi- ciency defined in Eqs. A22-23, TV,, is the radiative lifetime, and C$J; is the rotational correlation time of the molecule. In Eqs. 14 and 15 only Q,,T is concen-
2 2 ‘, 0.20 .I
6 0.10
0.00 1 I I I I I
380. 418. 456. 494. 532. 570.
Fig. 6. The excitation fluorescence anisotropy spectrum from monomeric R59Q in 90% glycerol with emission wavelength 605 nm (top), from a monomeric R590 in 40% glycerol with an emission wavelength of 551 nm (middle), and from a mixture of monomeric and dimeric R590 in 40% glycerol with an emission of 601 nm (bottom). The monomeric 90% glycerol sample is fully immobilized. The 40% glycerol samples are slowly tumbling.
126 T.P. Burghardt et al./Biophysical Chemistry 59 (1996) 119-131
tration dependent. The unknowns in Eq. 12 are the linear coefficients rM , r,,, and the normalizations
1 + &,r and 1 + fin,r. Given f12,,, and Rn,a, then n MT and 'D,T are computed using the information obtained from the emission spectra discussed in Sec- tion 3.3.
We measured excitation fluorescence anisotropy spectra like those shown in Fig. 6 for [Ma] = 0.5 PM or 0.4 mM and for the three emission wave- lengths 519 + 10 nm, 551 + 5 nm, and 601 & 5 nm for a total of six spectra of R590 in 40% glycerol. The low concentration sample was measured in a standard l-cm square cuvette. The 0.4 mM sample was measured using the capillary set-up shown in Fig. 1. The emission wavelengths selected cover the emission bands of both the monomer and dimer. We used Eq. 12 and a least-squares protocol on these polarization spectra to find the best estimate of rM and in, for given fiM,O and fl,,,a. The least-squares protocol included inequality constraints such that -0.2 I TM’ in I 0.4. Because the Q’s are practi- cally linear parameters in the anisotropy the sum of the x2 values from every wavelength in the excita- tion polarization spectrum was independent of the choice of fiR, T and fiu,r so that we needed addi- tional information to determine these quantities.
The limiting anisotropy of the monomer species, rM maxr was estimated from the excitation polariza-
0.00 , I I I I I 360. 418. 456. 494. 532. 570.
"t-l-l
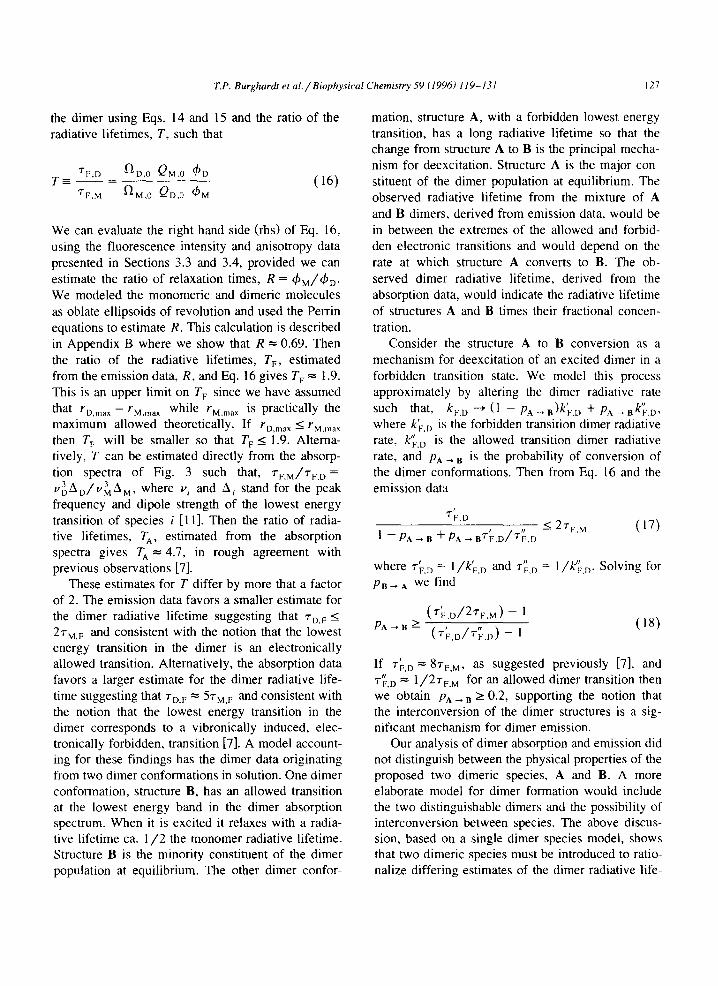
Fig. 7. The excitation fluorescence anisotropy spectrum of R590 monomers, rM (-_), and dimers, rD (a * * ). The dip near A,, = 530 nm originates from an anomaly explained in the text.
tion spectrum in Fig. 6 for R590 in 90% glycerol to be 0.37. We assumed that the limiting anisotropy of the dimer rn,,,% = T~,,,~~ and adjusted R, a and Q n,a to give these values for the limiting anisotropies in the least-squares solution to Eq. 12 and found 0 MO = 1.4 and finD,O= 2.1. Fig. 7 shows the re- solved monomer and dimer fluorescence anisotropies for immobilized molecules. Both spectra show anomalous behavior around excitation at 530 nm. These anomalies are artifacts due to the vanishing of our estimate for &n in the vicinity of this wave- length.
3.5. Implications for dimer structure and spec- troscopy
The dimer anisotropy maintains a large value close to its limiting value of 0.37 over an excitation range that includes both the long-wavelength absorp- tion bands of the dimer as observed previously for a rhodamine dimer under very different conditions [7]. It was also pointed out previously that the simplest exciton coupling model using two electronic states coupled with a dipole-dipole interaction for a dimer conformation of planar, stacked xanthene rings was unable to account for the absorption and fluores- cence data in rhodamine [7]. One demonstrated alter- native is to involve vibronic coupling in the dimer interaction [7,13,14]. Another is to generalize the exciton coupling model to include higher energy electronic transitions in the rhodamine monomer and to allow the planar structure to stack asymmetrically in a staircase-like structure. With the latter model it is possible to show that the anisotropy of the two lowest energy transition moments need not be per- pendicular. We are also able to semi-quantitatively account for the absorption and emission anisotropy data provided the model includes two dimer confor- mations in equilibrium (T.P. Burghardt and K. Ajtai, 1995, unpublished results). We will motivate and discuss this possibility further below. However, inde- pendent of the model chosen, the observed hypochromism in the lowest energy transitions of the dimer indicates that higher energy monomer elec- tronic states are coupled to the lowest energy states by the dipole-dipole interactions in the dimer.
We investigate further the significance of our findings regarding the intramolecular interactions in
T.P. Burghurdt et al./Biophysical Chemistry 59 (1996) 119-131 127
the dimer using Eqs. 14 and 15 and the ratio of the radiative lifetimes, T, such that
fi T-
7F.D D-0 QM.O 4~ _=---
7F.M R M.O QD.O 4~ ( 16)
We can evaluate the right hand side (rhs) of Eq. 16, using the fluorescence intensity and anisotropy data presented in Sections 3.3 and 3.4, provided we can estimate the ratio of relaxation times, R = +M/~D. We modeled the monomeric and dimeric molecules as oblate ellipsoids of revolution and used the Perrin equations to estimate R. This calculation is described in Appendix B where we show that R = 0.69. Then the ratio of the radiative lifetimes, TF, estimated from the emission data, R, and Eq. 16 gives TF = 1.9. This is an upper limit on TF since we have assumed that T-~,,,,_ = T~,,_~ while rM.max is practically the maximum allowed theoretically. If rD max I rM.max then TF will be smaller so that TF 5 i.9. Altema- tively. T can be estimated directly from the absorp- tion spectra of Fig. 3 such that, T~,~/T~,~ = vAAD/viAM, where vi and Ai stand for the peak frequency and dipole strength of the lowest energy transition of species i [l 11. Then the ratio of radia- tive lifetimes, TA, estimated from the absorption spectra gives TA = 4.7, in rough agreement with previous observations [7].
These estimates for T differ by more that a factor of 2. The emission data favors a smaller estimate for the dimer radiative lifetime suggesting that 7D.F 5
2TM.F and consistent with the notion that the lowest energy transition in the dimer is an electronically allowed transition. Alternatively, the absorption data favors a larger estimate for the dimer radiative life- time suggesting that T,,~ = 57M,F and consistent with the notion that the lowest energy transition in the dimer corresponds to a vibronically induced, elec- tronically forbidden, transition [7]. A model account- ing for these findings has the dimer data originating from two dimer conformations in solution. One dimer conformation, structure B, has an allowed transition at the lowest energy band in the dimer absorption spectrum. When it is excited it relaxes with a radia- tive lifetime ca. l/2 the monomer radiative lifetime. Structure B is the minority constituent of the dimer population at equilibrium. The other dimer confor-
mation, structure A, with a forbidden lowest energy transition, has a long radiative lifetime so that the change from structure A to B is the principal mecha- nism for deexcitation. Structure A is the major con- stituent of the dimer population at equilibrium. The observed radiative lifetime from the mixture of A and B dimers, derived from emission data, would be in between the extremes of the allowed and forbid- den electronic transitions and would depend on the rate at which structure A converts to B. The ob- served dimer radiative lifetime, derived from the absorption data, would indicate the radiative lifetime of structures A and B times their fractional concen- tration.
Consider the structure A to B conversion as a mechanism for deexcitation of an excited dimer in a forbidden transition state. We model this process approximately by altering the dimer radiative rate such that, ~F,D + (1 - p,$ -_) ,)k’, D + PA --t ~ki,~, where k; D is the forbidden transition dimer radiative rate, k$ n is the allowed transition dimer radiative rate, and pA ~ B is the probability of conversion of the dimer conformations. Then from Eq. 16 and the emission data
+.I,
~-PA-B +PA + Brk.D/T;,D s 2TF.M (17)
where r; D = 1 /kk D and r:. D = 1 /kt,,. Solving for
PB-A wk find ’
PA
If T/F,D = 87F,f,4> as suggested previously [7], and T;,D = l/27,,, for an allowed dimer transition then we obtain p A _ B 2 0.2, supporting the notion that the interconversion of the dimer structures is a sig- nificant mechanism for dimer emission.
Our analysis of dimer absorption and emission did not distinguish between the physical properties of the proposed two dimeric species, A and B. A more elaborate model for dimer formation would include the two distinguishable dimers and the possibility of interconversion between species. The above discus- sion, based on a single dimer species model, shows that two dimeric species must be introduced to ratio- nalize differing estimates of the dimer radiative life-
128 T.P. Burghardt et ul./Biophysical Chemistry 59 (1996) 119-131
time. The generalized model would necessarily agree with this observation and perhaps furnish an esti- mate, rather than an lower bound, for ~a ~ A.
4. Conclusions
The spectroscopic properties of the rhodamine dimer in solution were investigated under conditions where the monomer and dimer conformers were in equilibrium. Using methods we developed to sepa- rate the spectroscopic contributions of monomers and dimers we found that the dimer is fluorescent with a quantum efficiency about equal to the monomer. Polarized emission from the dimer indi- cates that the two lowest energy transitions have dipoles nearly parallel to the emission dipole. The radiative lifetime of the dimer, indicated by the fluorescence emission data, is near to that of the monomer and much shorter than that indicated by the dimer dipole strength. It appears that the dimer conformation consists of two forms in equilibrium. One form, the minor component, possesses an al- lowed electronic transition at the lowest transition energy. The second form, the major component, possesses an electronically forbidden transition at this energy but interconversion between the dimer conformers allows the second form to fluoresce effi- ciently.
Acknowledgements
We thank Ms. Jacqueline Lafky for help with drawing the figures. This work was supported the by National Institutes of Health Grant ROl AR 39288, the American Heart Association Grant-In-Aid 930 06610, and by the Mayo Foundation.
Appendix A. Energy transfer among monomers and dimers in solution
A solution of monomer and dimer fluorophores is in equilibrium. Relaxation from the excited state singlet is accomplished by fluorescence, collisional energy transfer, and FGrster energy transfer. This
process is modeled by the kinetic equations deduced from the reaction steps
(AlI
b-w MbfMa + M,+M;
kM9-M
M, + D, kDg” k,-,
M,+D,
(A21
(A31
kfi-, D,+D, + 2D,
k&-M M,+M, + 2M, (A4)
45-M Ma +%I --) M,+D,
k&-D D,+M, --) M,+M, (‘9 where subscript b(a) refers to the excited (ground) state, k, nCM) is the dimer (monomer) radiative decay rate, and ks,nCM) is the dimer (monomer) decay rate for processes other than radiative. Both k, and k, are independent of fluorophore concentration. We assume that the difference between the primed and unprimed species is that the back transfer rate can be different from the forward rate. The light emission from either species is equivalent so we substitute k DrhD= SDk,,,, and k,,,, = 6,k,,,, andthe primes are dropped. The rate equations for D, and M, are then
dD,/dt = - ynD, + k, -t nD,M, + k,’ D, (A6)
dM,/dt = - yMM, + k,, ,M,D, + k$M,
(A?
where
YD=~,,, +ks.n + (1 - %,)k,+.D, +k,+,M,
+k$+,D,+k;,,M, (A8)
YM = k F,M +kS,M+(l -6M)kM+MMa
+k rv,erPa+ktt,+MM,+kR+&a (A91
T.P. Burghardt et al./Biophysicul Chemistry 59 (1996) 119-131 129
Assuming D, and M, are constant, Eqs. A6-7 be- come first order and they are put in standard form with the substitutions D, =x, + p, and M, = x2 + p2 where
PI =Dak k,‘Y, + k,‘M,k, -t ,,
D+MM,~M+DD~- YMYD
P*=Mak k,‘Y, + k,‘D,k,, M
D-+M~~~M+DD~-YMYD (A101
Then dv/dt = Av where v = (x,,x,> and
I (A”)
Neglecting off-diagonal elements in A for the lowest order solution and for an initial condition caused by a delta function pulse of excitation light we find
Dr,(t) = Db(0) exP( - YD')
Mb(f) = WOh(- Y& (‘412) Energy transfer rates k, ~ D, k, ~ M, k, _ M, and
k M ~ D represent both collisional and Farster energy transfer processes. Below we consider only Farster transfer but it is a simple generalization of these arguments to include the possibility of collisional transfer. We reexpress the relaxation rates, yD and yM from Eqs. A&9, in terms of lifetimes and the distance between donor and acceptors in the FGrster energy transfer rates giving
Yo(t)=(l/TD) 1 + ? [RO(D+M)/Ri16 i i=l
+(I -6,) z [R,(D -*D)/R~ i= I i
(A’3)
YM(~) = (~/TM) 1-1 ? [Ro(M+D)/Ri16
i i= I
+(I -8,) z [R,(M-+M)/R~]~ i= I I
(A141 where
7D=‘/(ICF.D+ks,D+kg-tDDa+k~~MMa) (‘4’5)
TM = I/(k,,, + ks,M + 4$--t MMa + k& -+ DDa) (A16)
R, is the characteristic energy transfer distance for the indicated donor-acceptor pair, and Rj is the distance from the donor to the ith acceptor. R, depends implicitly on the concentrations of D, and M, through the donor quantum efficiency in the absence of acceptor [ 181.
We evaluate the quantum efficiency for dimer or monomer emission by considering the probability, p(t), that a dimer or monomer donor excited at t = 0 remains excited at time t given by [ 16,171
PD(MJ(~) =exP[ -(~/TD(M,)YD(M,] (A17)
The total quantum efficiency for dimer (monomer) emission, Qo(Mj,Tr is then
Q D(M),T = k wdrP~(~j F,D(M) / (‘4'8) 0
By ensemble averaging Qo(Mj,T over the acceptors with manipulations described by Fiirster [16] we obtain ’
Q D(M),T =QD(M,[~- 6D(M)
Xex+?&M,)@(~D(M,)] (Al9)
where
qD = l/ZJ;;([M]R;(D+M)
+/m[D]R;(D + D))
qM = 1/2J;;([D]R;(M + D)
+ ,/-[M]R;(M --) M))
Q QD=
D-0
' + k8 + DTD.ODa + k6 4 MTD.OMa
(A20)
(A21)
’ The root mean square (rms) distance traveled by a diffusing particle in time r, r =J(6Dr). The diffusion constant for rho- damme in water at 20°C. D,,,, = 4~ 10m6 cm’/s [I I]. Conver- sion to our conditions is accomplished with D= D,,,,(273/293~1.002/8.250) = 4.5 X IO-’ cm*/s where the first fraction is the ratio of absolute temperatures at 0 and 20°C and the second is the ratio of the viscosities of water at 20°C to that of 40% glycerol at 0°C [ 1 l,l5]. Then rhodamine diffuses 7- IO A during the 2-4 ns lifetime of the probe [61. The average distance between molecules in the highest concentration sample of 0.4 mM is ca. 200 A indicating that the dye molecules are statically distributed during the dye lifetime. Statically distributed acceptors is implicit in the method of acceptor averaging applied here to arrive at Eqs. Al9-A23.
130 T.P. Burghad et al./Biophysical Chemistry 59 (1996) 119-131
Q Qhl=
M ,O
1 +k~,M~M,oM,+k~,D~M,oD, ( A221
k QD(M),o =
F.D(M) k F,D(M)+ k&D(M)
l/T~(M~.O = kF,D(M) +k SD(M) @W [D] and [Ml are the equilibrium concentrations of the dimers and monomer, and the error function
G(q) = (2/fi)L’dxexp( -.x2)
Finally the observed normalized, steady-state fluo- rescence from a mixture of monomers and dimers, F/F,, in terms of normalized fluorescence quantum spectra for monomer and dimer emission, f,(h) and fn(A), is F/F, =A,Q,,,f,('+) +h~&,,f,(~) (fQ4)
where AD(*) is the light absorbed by the dimer (monomer) species.
Computation of F/F, for comparison with the observed signal is carried out using the characteristic transfer distance, R,, where
R, = 9.79 x 10’(~‘n-~QJ)“~ (A) (A25) and K2 is the orientation factor, n the index of refraction of the medium containing the dye, Q the quantum efficiency of the donor in the absence of the acceptor, and J the overlap integral. In all calculations we assume ~~ = 2/3 and n = 1.380 for the 40% glycerol-water solution at 0°C [15]. The radiative lifetime of the rhodamine monomer, rF,M = 8 ns for a dipole strength of 64.7 D2 at 530 nm, and . . the fluorescence lifetime 7M,o = 2 ns [6], gives a quantum efficiency of the isolated rhodamine monomer in solution of QM,o = 0.25. The unknowns in Eqs. A19-25 are the emission spectral shapes f, and fM, the dimer quantum efficiency QD,o, the factors SD and S, affecting the back transfer rate of energy following self-energy transfer, and the colli- sional quenching constants kg-t D~D,ODa, kg + MTD,oM~, G, + M7M.oMa. and k$ + D~M,oD~.
Appendix B. Rotational relaxation times of an oblate ellipsoid
An oblate ellipsoid approximates the shape of the R590 molecule. The major axis, a, measured from
the center of the xanthene to the end of one of the diethyl side groups is - 7 A, and the minor axis, b, giving the dimension perpeadicular to the plane of the xanthene ring, is = 3 A. It was suggested that the rhodamine dimer has stacked xanthene rings with a head-to-head conformation [9,19]. In this confor- mation the dimer has about the same major axis dimension as the monomer but double the minor axis dimension. The oblate ellipsoid has a volume V = 4n-a2b, so that the dimer volume is double that of the monomer.
The Perrin equations give the two rotational relax- ation rates of an oblate ellipsoid as a function of volume and the ratio of major to minor axis dimen- sions, p Ill]. The rotational relaxation times for motion of major axis, 4,, and the minor axis, +b, are
2aV
4, = [l/f, + l/f,] &= ovfn (Bl)
where f is the frictional coefficient given by
f, = 4(1 -p”) 4(1 -p”)
3(2 - Sp2) fb= 3p2[5(2-p2)-2]
032)
S=2(p2- 1)“2tan-i[(p2- l)“2] ( w p=a/b (B4) and (Y is a proportionality constant. The static fluo- rescence polarization detects the harmonic mean of the two relaxation times, +,,, such that
3 +il =
L2/+, + l/+bl
Using these equations with the dimensions indicated above for the monomer and dimer molecules we find that R = c#J~/c#I~ = 0.69.
References
[II
121
[31
J. Borejdo, S. Putnam and M.F. Morales, hoc. Nad. Acad. Sci. USA, 76 (1979) 6346-6350. J. Borejdo, 0. Assulin, T. Ando and S. Putnam, J. Mol. Biol., 158 (1982) 391-414. T.P. Burghardt, T. Ando and J. Borejdo, Proc. Natl. Acad. Sci. USA, 80 (1983) 7515-7519.
T.P. Burghard et aI./Biophysical Chemistry 59 (1996) 119-131 131
[4] T.P. Burghardt and K. Ajtai, Biochemistry, 33 (1994) 5376- [13] R.L. Fulton and M. Gouterman. J. Chem. Phys.. 35 (1961) 53x1. 1059-1071.
[5] K. Ajtai, D.J. Toft and T.P. Burghardt, Biochemistry, 33 (1994) 5382-5391.
[14] R.L. Fulton and M. Gouterman, J. Chem. Phys., 41 (1964) 2280-2286.
[6] K. Ajtai, P.J.K. Ilich, A. Ringler, S.S. Sedarous, D.J. Toft and T.P. Burghardt, Biochemistry, 31 (1992) 12431-12440.
[7] R.W. Chambers, T. Kijiwara and D.R. Keams, J. Phys. Chem., 78 (1974) 380-387.
[15] J.B. Segur, in C.S. Miner (Ed.), Glycerol, Physical Properties of Glycerol and its Solutions, Reinhold, New York. 1953, p. 322.
[8] J.E. Selwyn and J.J. Steinfeld, J. Phys. Chem., 76 (1972) 762-714.
[16] Th. Fiirster, 2. Naturforsch., 4a (1949) 321-327. [17] D.E. Koppel, P.J. Fleming and P. Strittmatter, Biochemistry,
18 (1979) 5450-5457. [9] I. L6pez Arbeloa and P. Ruiz Ojeda, Chem. Phys. Lett., 87
(I 982) 556-560. [IO] J.A. Schellman, Chem. Rev., 75 (1975) 323-331. [I I] C.R. Cantor and P.R. Schimmel, Biophysical Chemistry, Part
II, Freeman, New York, 1980, pp. 409-590. [12] S. Blobsky, Chem. Phys. Lett., 184 (1991) 229-234.
[18] Th. Fiirster, in D. Sinanoglu (Ed.), Modem Quantum Chem- istry, Decocalized Excitation and Excitation Transfer, Aca- demic Press, New York, 1965, pp. 93- 137.
[19] M.E. Gal, G.R. Kelly and T. Kurucsev. J. Chem. Sot. Faraday Trans. II, (1973) 3955402.
Related Documents