FLUID MIXING AND FLOW DISTRIBUTION IN THE REACTOR CIRCUIT (FLOMIX-R) F-P. Weiss 1 , U. Rohde 1 , R. Karlsson 2 , B. Hemström 2 , J. Lillington 3 , M. Scheuerer 4 , H. Tuomisto 5 , T. Toppila 5 , T. Dury 6 , M. Cvan 7 , P. Muhlbauer 8 , I. Toth 9 , J. Elter 10 , Y. Bezrukov 11 1) Forschungszentrum Rossendorf, Dresden (DE) 7) VUJE, Trnava (SK) 2) Vattenfall Utveckling AB, Alvkarleby (SE) 8) NRI, Rez (CZ) 3) Serco Assurance, Dorchester, Dorset (GB) 9) AEKI, Budapest (HU) 4) GRS, Garching (DE) 10) NPP Paks, Paks (HU) 5) Fortum Nuclear Services, Vantaa (Fin) 11) EDO Gidropress, Podolsk (RU) 6) PSI, Villigen (SL) Summary The project aims at describing the mixing phenomena relevant for both safety analysis, particularly in steam line break and boron dilution scenarios, and mixing phenomena of interest for economical operation and the structural integrity. Measurement data from a set of mixing experiments, gained by using advanced measurement techniques with enhanced resolution in time and space help to improve the basic understanding of turbulent mixing and to provide data for Computational Fluid Dynamics (CFD) code validation. Slug mixing tests simulating the start-up of the first main circulation pump are performed with two 1:5 scaled facilities: The Rossendorf coolant mixing model ROCOM and the VATTENFALL test facility, modelling a German Konvoi type and a Westinghouse type three-loop PWR, respectively. Additional data on slug mixing in a VVER-1000 type reactor gained at a 1:5 scaled metal mock-up at EDO Gidropress are provided. Experimental results on mixing of fluids with density differences obtained at ROCOM and the FORTUM PTS test facility are made available. Concerning mixing phenomena of interest for operational issues and thermal fatigue, flow distribution data available from commissioning tests (Sizewell-B for PWRs, Loviisa and Paks for VVERs) are used together with the data from the ROCOM facility as a basis for the flow distribution studies. The test matrix on flow distribution and steady state mixing performed at ROCOM comprises experiments with various combinations of running pumps and various mass flow rates in the working loops. Computational fluid dynamics calculations are accomplished for selected experiments with two different CFD codes (CFX-5, FLUENT). The applicability of various turbulence modelling techniques is studied for transient and steady state flow. Best practice guidelines (BPG) are referenced in all CFD work when choosing computational grid, time step, turbulence models, modelling of internal geometry, boundary conditions, numerical schemes and convergence criteria. The strategy of code validation based on the BPG and a matrix of CFD code validation calculations have been elaborated. The computational grid generation for the test facilities and first calculations on the benchmark tests have been performed. More detailed overview on FLOMIX-R is given on the web page www.fz- rossendorf.de/pls/robis/welcome.frame?p_info=797

Fluid Mixing and Flow Distribution in the Reactor Circuit
Nov 28, 2015
FLUID MIXING AND FLOW DISTRIBUTION IN THE REACTOR CIRCUIT
Welcome message from author
This document is posted to help you gain knowledge. Please leave a comment to let me know what you think about it! Share it to your friends and learn new things together.
Transcript
FLUID MIXING AND FLOW DISTRIBUTION IN THE REACTOR CIRCUIT (FLOMIX-R)
F-P. Weiss1, U. Rohde1, R. Karlsson2, B. Hemström2, J. Lillington3, M. Scheuerer4, H. Tuomisto5, T. Toppila5, T. Dury 6, M. Cvan7, P. Muhlbauer 8, I. Toth 9, J. Elter 10,
Y. Bezrukov11
1) Forschungszentrum Rossendorf, Dresden (DE) 7) VUJE, Trnava (SK) 2) Vattenfall Utveckling AB, Alvkarleby (SE) 8) NRI, Rez (CZ) 3) Serco Assurance, Dorchester, Dorset (GB) 9) AEKI, Budapest (HU) 4) GRS, Garching (DE) 10) NPP Paks, Paks (HU) 5) Fortum Nuclear Services, Vantaa (Fin) 11) EDO Gidropress, Podolsk (RU) 6) PSI, Villigen (SL)
Summary
The project aims at describing the mixing phenomena relevant for both safety analysis, particularly in steam line break and boron dilution scenarios, and mixing phenomena of interest for economical operation and the structural integrity. Measurement data from a set of mixing experiments, gained by using advanced measurement techniques with enhanced resolution in time and space help to improve the basic understanding of turbulent mixing and to provide data for Computational Fluid Dynamics (CFD) code validation. Slug mixing tests simulating the start-up of the first main circulation pump are performed with two 1:5 scaled facilities: The Rossendorf coolant mixing model ROCOM and the VATTENFALL test facility, modelling a German Konvoi type and a Westinghouse type three-loop PWR, respectively. Additional data on slug mixing in a VVER-1000 type reactor gained at a 1:5 scaled metal mock-up at EDO Gidropress are provided. Experimental results on mixing of fluids with density differences obtained at ROCOM and the FORTUM PTS test facility are made available.
Concerning mixing phenomena of interest for operational issues and thermal fatigue, flow distribution data available from commissioning tests (Sizewell-B for PWRs, Loviisa and Paks for VVERs) are used together with the data from the ROCOM facility as a basis for the flow distribution studies. The test matrix on flow distribution and steady state mixing performed at ROCOM comprises experiments with various combinations of running pumps and various mass flow rates in the working loops.
Computational fluid dynamics calculations are accomplished for selected experiments with two different CFD codes (CFX-5, FLUENT). The applicability of various turbulence modelling techniques is studied for transient and steady state flow. Best practice guidelines (BPG) are referenced in all CFD work when choosing computational grid, time step, turbulence models, modelling of internal geometry, boundary conditions, numerical schemes and convergence criteria. The strategy of code validation based on the BPG and a matrix of CFD code validation calculations have been elaborated. The computational grid generation for the test facilities and first calculations on the benchmark tests have been performed. More detailed overview on FLOMIX-R is given on the web page www.fz-rossendorf.de/pls/robis/welcome.frame?p_info=797
A. Introduction The FLOMIX-R project has been started in October 2001 with 36 months of project duration. The first objective of the project is to obtain complementary data on slug mixing to understand in sufficient detail, how the slug mixes before it enters the reactor core. Slug mixing is the most mitigative mechanism against serious reactivity accidents in local boron dilution transients. The second objective is to utilise data from steady state mixing experiments and the plant commissioning test data to determine the primary circuit flow distribution and the effect of thermal mixing phenomena in the context of the improvement of normal operation conditions and structural integrity assessment. The third objective is to use the experimental data to contribute to the validation of CFD codes for the analysis of turbulent mixing problems. Benchmark calculations for selected experiments are used to justify the application of turbulent mixing models, to reduce the influence of numerical diffusion and to decrease grid, time step and user effects in CFD analyses. Due to the large interest of research organisations and utilities from newly associated states (NAS), a NAS extension of the project integrating the research institutions VUJE Trnava, NRI Rez (Czech Republic), AEKI Budapest (Hungary) and the nuclear power plant NPP Paks (Hungary) as well as the research and design organisation EDO Gidropress (Russia) as an external expert organisation has been accomplished. The NAS extension of the project started in December 2002. The NAS partners will participate in CFD code validation on slug mixing tests by calculating additional cases putting special emphasis on mixing in VVER type reactors.
B. Work Programme The work on the project performed within five work packages. In WP 1, the key mixing and flow distribution phenomena relevant for both safety analysis, particularly in steam line break and boron dilution scenarios, and for economical operation and the structural integrity have been identified. Based on this analysis, test matrices for the experiments are elaborated, guidelines for the documentation of the measurement data and for performing validation calculations with CFD codes are provided.
In WP 2 on slug mixing tests, experiments on slug mixing at the ROCOM and Vattenfall test facilities are performed. The measurement data are made available to the project partners for CFD code validation purposes. Additional slug mixing tests at the VVER-1000 facility of EDO Gidropress are made available. Two experiments on density driven mixing (one from ROCOM, one from the Fortum PTS facility) are selected for benchmarking.
In WP 3 on flow distribution in the cold legs and pressure vessel of the primary circuit, commissioning test measurements performed at the Paks VVER-440 NPP are used for the estimation of thermal mixing of cooling loop flows in the downcomer and lower plenum of the pressure vessel. A series of quasi steady state mixing experiments are performed at the ROCOM test facility. (CFD) methods are used for the simulation of the flow field in the primary circuit of operating real scale reactor. Computed results are compared to available measurement data, and conclusions are drawn concerning the usability and modelling requirements of CFD methods for that kind of application.
Concerning WP 4 on validation of CFD codes, the strategy of code validation based on the BPG and a matrix of CFD code validation calculations is elaborated. CFD validation calculations on selected benchmark tests are performed. The CFD validation work is shared among the partners systematically due to a CFD validation matrix.
In WP5, conclusions on flow distribution and turbulent mixing in NPPs will be drawn and recommendations on CFD applications will be given.
C. Main Achievements
C1. Slug mixing tests The slug mixing test matrix contains 12 experiments at ROCOM and 4 experiments at the Vattenfall facility with simulation of the start-up of the first main coolant pump. For the pump start-up experiments the following boundary conditions were varied: • Length of the pump ramp • Final mass flow rate of the loop with the starting–up pump • Volume of the injected slug and initial position in the cold leg • Status of the unaffected loops • Geometry of the reactor pressure vessel
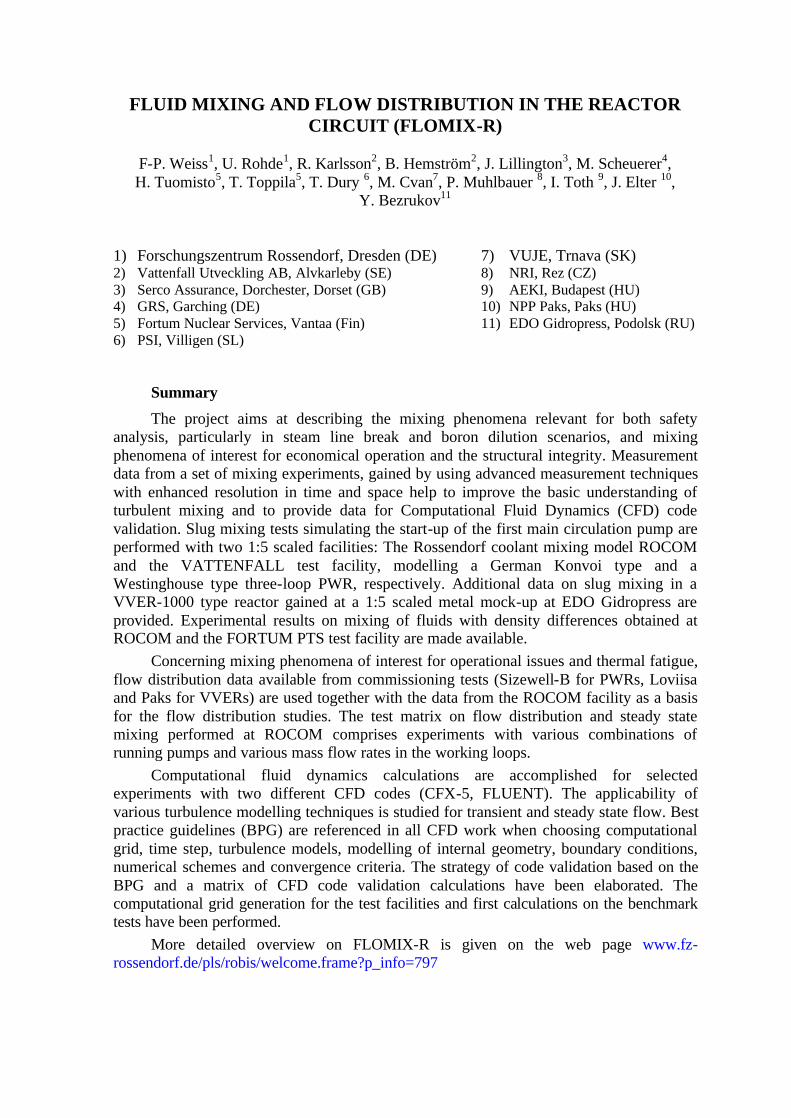
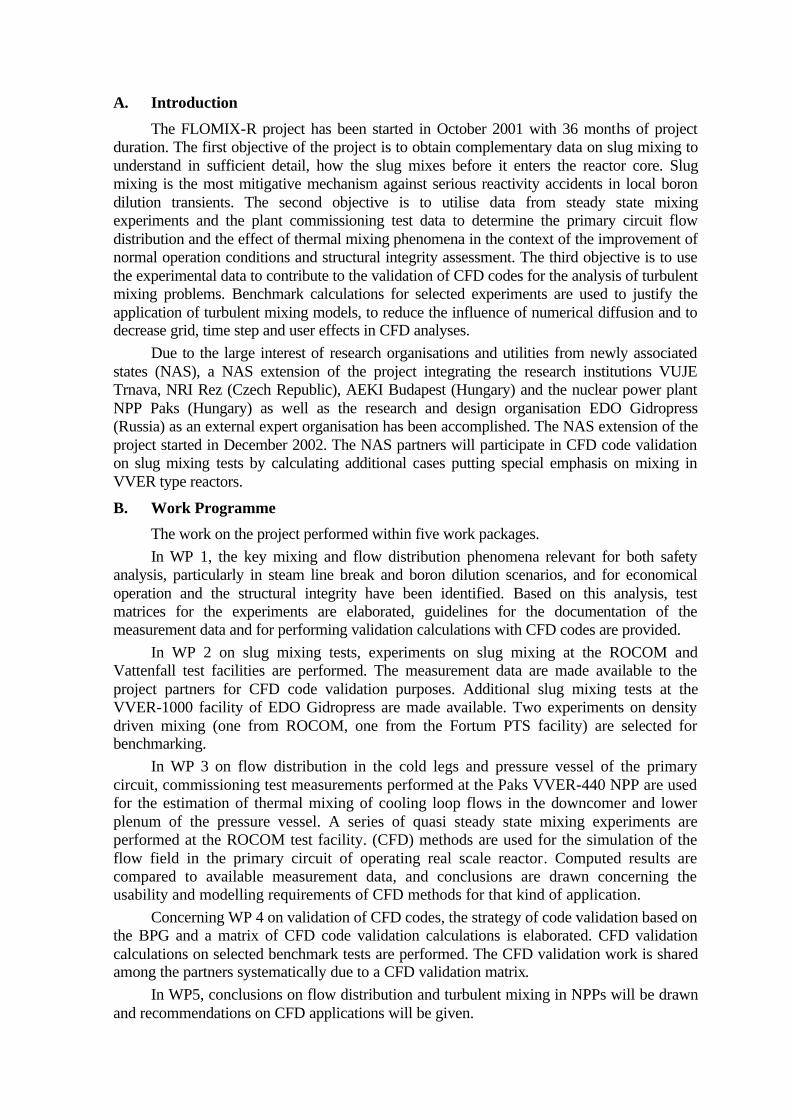
ROCOM (Rossendorf Coolant Mixing Model) is a test facility for the investigation of coolant mixing operated with water at room temperature [1]. The facility models a KONVOI type reactor with all important details for the coolant mixing in a linear scale of 1:5. ROCOM is a four-loop test facility with a RPV mock up made of transparent plexiglas (Fig. 1).
Individually controllable pumps in each loop give the possibility to perform tests in a wide range of flow conditions, from natural circulation to nominal flow rate including flow ramps (pump start up). The transparent material for the pressure vessel allows the measurement of velocity profiles in the downcomer by laser Doppler anemometry.
Both boron concentration and temperature fields are modelled by the concentration field of a tracer solution. The disturbance is created by computer controlled injection of salted water into the cold leg of one of the loops, while the test facility is operated with de-mineralised water. The test facility is equipped with wire-mesh sensors for the electrical conductivity measurement [2], which allow a high resolution determination of the transient tracer concentration in space and time. Four such sensors are installed in the reactor pressure vessel model with altogether about 1000 single measurement positions and a measuring frequency of up to 200 Hz. Additionally to mixing tests under highly turbulent conditions, where density differences of the mixed fluids can be neglected, a series of generic tests with low Froude numbers was performed. In these tests the density of the injected fluid slugs was increased in comparison with the ambient fluid by up to 10% adding glucose.
Fig. 1: RPV plexiglas model and view on the test facility ROCOM
The Vattenfall mixing test facility is a 1:5 scale model of a Westinghouse PWR [3]. The lower plenum and the lower 2/3 of the downcomer are made of plexiglas. Two idle loops are included in the model. The model is run with a maximum flow rate of 127 l/s and at temperatures between 20 and 50 oC. Components that can be important for mixing have been modelled, for example thermal shields, inlet pipe diffusers, structures in lower plenum, core support plates and core. The determination of the relative boron concentration is based on salt water tracering and conductivity measurement, too. Conductivity is measured to at 181 measurement positions close to the inlet to the core. A sampling frequency of 60 Hz has been used.
The test facility of EDO "Gidropress" [4] is a metal model of the Russian VVER-1000 reactor in a scale of 1:5. One loop with a loop seal and reactor coolant pump simulator is modeled. The other three loops are made short-circuit, and only the pressure loss of them is simulated. The core model has 151 fuel assembly (FA) simulators, which have the same pressure loss as the regular FA. Boron concentration change is modeled by a change in temperature (the deborated water slug is simulated by colder water). About 100 thermocouples are placed in the lower part of the downcomer and at the core inlet to study the mixing of flows. The Fortum PTS test facility [5] was a 1:2.56 scale model of the Loviisa VVER-440 reactor. The facility contained a half of the circumference of the reactor downcomer and included three cold legs and perforated plate in the lower plenum. The material of facility was transparent acryl. The middle one of the three cold legs consists of the section between RPV and RCP including the main gate valve and bottom safety injection point. Two other cold legs were built to model side loop flows only. The choice of the transparent material restricts the tests to atmospheric pressure and to a maximum temperature of around 75 °C. Minimum injection temperature was about 10 °C and the extra buoyancy effect was induced by salt addition to injection water. The high pressure injection (HPI) rate, side and main loop flows and density difference ratio between HPI and loop flow were varied. Most of the 62 thermocouples were installed to the downcomer to measure the temperature fluctuations on the vessel wall. The thermocouples were read once in two seconds. C2. Steady state mixing and flow distribution In commissioning test measurements performed at the Paks VVER-440 NPP, the main steam line valve of one steam generator was closed causing the heat-up of the corresponding loop. The asymmetric core outlet temperature distribution generated in this way was measured by the 210 thermocouples, located in the fuel assembly heads. Analysing the data from 12 experiments under different conditions, mixing matrices have been derived by linear regression analysis. These matrices describe the fraction of the perturbation of the coolant temperature in each primary circuit loop assigned to each fuel element. The commissioning measurement data of Paks NPP were made available and compared to the cooling loop flow mixing factors of Loviisa (Fig. 2).
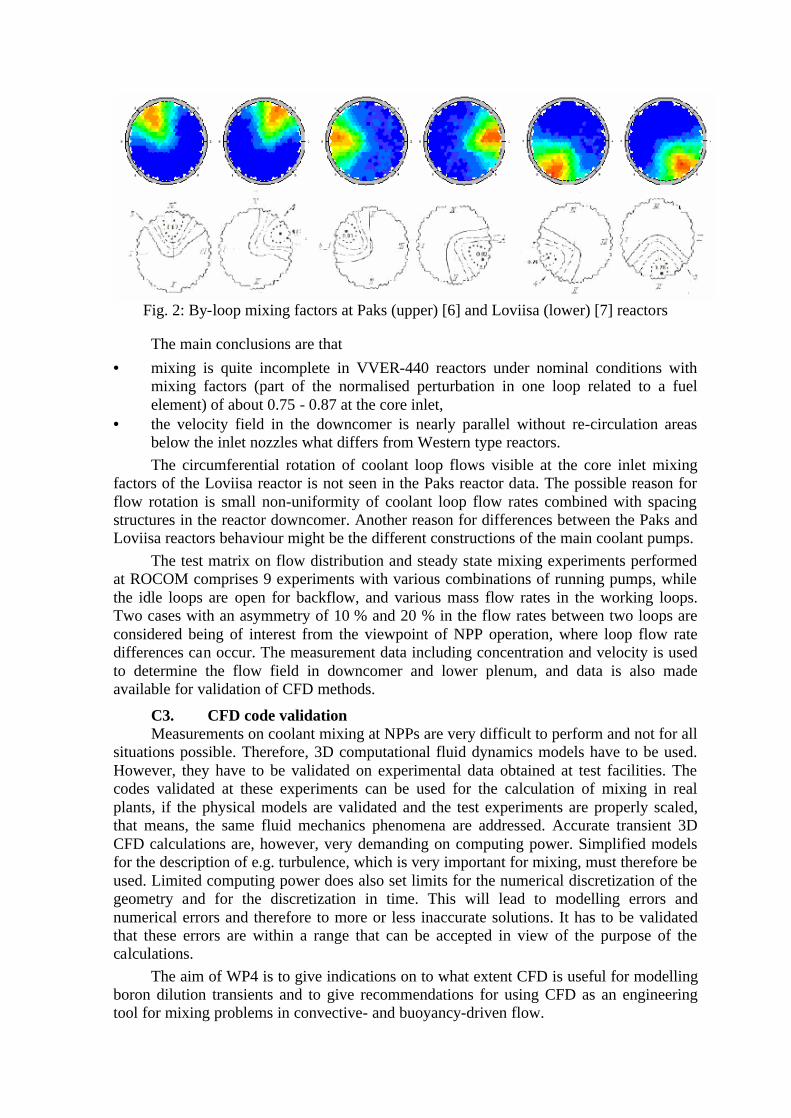
Fig. 2: By-loop mixing factors at Paks (upper) [6] and Loviisa (lower) [7] reactors
The main conclusions are that • mixing is quite incomplete in VVER-440 reactors under nominal conditions with
mixing factors (part of the normalised perturbation in one loop related to a fuel element) of about 0.75 - 0.87 at the core inlet,
• the velocity field in the downcomer is nearly parallel without re-circulation areas below the inlet nozzles what differs from Western type reactors.
The circumferential rotation of coolant loop flows visible at the core inlet mixing factors of the Loviisa reactor is not seen in the Paks reactor data. The possible reason for flow rotation is small non-uniformity of coolant loop flow rates combined with spacing structures in the reactor downcomer. Another reason for differences between the Paks and Loviisa reactors behaviour might be the different constructions of the main coolant pumps.
The test matrix on flow distribution and steady state mixing experiments performed at ROCOM comprises 9 experiments with various combinations of running pumps, while the idle loops are open for backflow, and various mass flow rates in the working loops. Two cases with an asymmetry of 10 % and 20 % in the flow rates between two loops are considered being of interest from the viewpoint of NPP operation, where loop flow rate differences can occur. The measurement data including concentration and velocity is used to determine the flow field in downcomer and lower plenum, and data is also made available for validation of CFD methods.
C3. CFD code validation Measurements on coolant mixing at NPPs are very difficult to perform and not for all
situations possible. Therefore, 3D computational fluid dynamics models have to be used. However, they have to be validated on experimental data obtained at test facilities. The codes validated at these experiments can be used for the calculation of mixing in real plants, if the physical models are validated and the test experiments are properly scaled, that means, the same fluid mechanics phenomena are addressed. Accurate transient 3D CFD calculations are, however, very demanding on computing power. Simplified models for the description of e.g. turbulence, which is very important for mixing, must therefore be used. Limited computing power does also set limits for the numerical discretization of the geometry and for the discretization in time. This will lead to modelling errors and numerical errors and therefore to more or less inaccurate solutions. It has to be validated that these errors are within a range that can be accepted in view of the purpose of the calculations.
The aim of WP4 is to give indications on to what extent CFD is useful for modelling boron dilution transients and to give recommendations for using CFD as an engineering tool for mixing problems in convective- and buoyancy-driven flow.
A number of slug mixing benchmark cases have been selected from each of the three test facilities described in Chapter C1. Two benchmark cases for slug mixing have been chosen for the ROCOM model, one for the VATTENFALL model and one for the FORTUM model. Additionally, a slug mixing case from the ROCOM tests where the mixing is buoyancy driven will be calculated. In this case the density difference is 10% and the flow rate is 5% of the nominal flow rate.
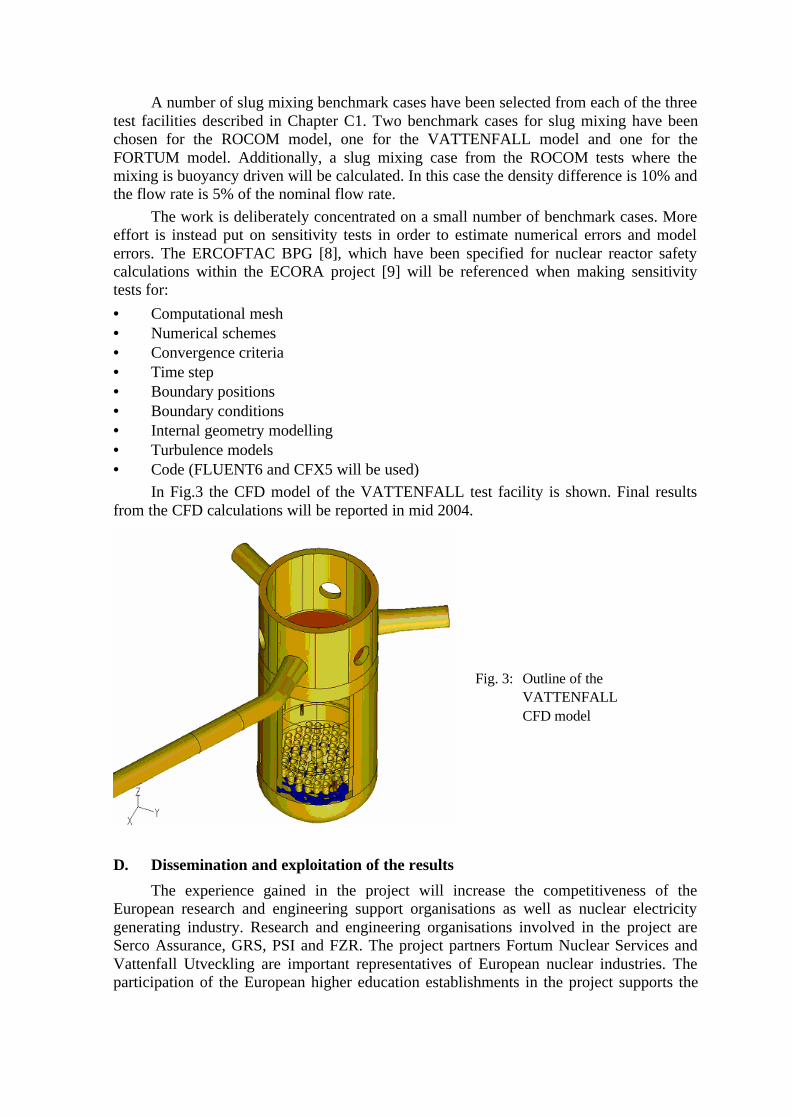
The work is deliberately concentrated on a small number of benchmark cases. More effort is instead put on sensitivity tests in order to estimate numerical errors and model errors. The ERCOFTAC BPG [8], which have been specified for nuclear reactor safety calculations within the ECORA project [9] will be referenced when making sensitivity tests for: • Computational mesh • Numerical schemes • Convergence criteria • Time step • Boundary positions • Boundary conditions • Internal geometry modelling • Turbulence models • Code (FLUENT6 and CFX5 will be used) In Fig.3 the CFD model of the VATTENFALL test facility is shown. Final results from the CFD calculations will be reported in mid 2004.
D. Dissemination and exploitation of the results The experience gained in the project will increase the competitiveness of the European research and engineering support organisations as well as nuclear electricity generating industry. Research and engineering organisations involved in the project are Serco Assurance, GRS, PSI and FZR. The project partners Fortum Nuclear Services and Vattenfall Utveckling are important representatives of European nuclear industries. The participation of the European higher education establishments in the project supports the
Fig. 3: Outline of the VATTENFALL CFD model
education of nuclear experts. A number of students and PhD students (e.g. TU Munich, TU Dresden, TU Prag, Moscow Engineering Physics Institute) are involved into the work. The NAS extension of the project is focused to VVER type reactors and performed by partners from VVER operating countries, newly associated to the EU. It will help to harmonise safety assessment approaches and to reach comparable level of understanding the relevant phenomena. A VVER nuclear power plant (NPP Paks) as well as organisations providing technical support for NPPs and nuclear authorities (VUJE Trnava, NRI Rez, AEKI Budapest) are participating in FLOMIX-R The general designer of VVER type reactors, Engineering and Design Organisation “Gidropress”, is involved. Quality assurance practice for CFD is applied based on the ERCOFTAC BPG specified in the ECORA project for reactor safety analysis applications. Serco Assurance and Vattenfall experts are active in the ERCOFTAC. Most of the FLOMIX-R project partners are participating also in ECORA aimed at an assessment of CFD methods for reactor safety analyses. FLOMIX-R is contributing to the extension of the experimental data base on mixing and CFD applications to mixing problems. Recommendations on the use of CFD codes for turbulent mixing problems gained in FLOMIX-R will be fed back to the ECORA and ERCOFTAC BPG.
E. Conclusions A new quality of research in flow distribution and turbulent mixing inside the RPV
of nuclear reactors has been achieved in the FLOMIX-R project. Experimental data on slug mixing with enhanced resolution in space and time have been gained from various test facilities covering different geometrical and flow conditions. The basic understanding of momentum controlled mixing in highly turbulent flow and buoyancy driven mixing in the case of relevant density differences between the mixing fluids has been improved significantly. A higher level of quality assurance in CFD code validation has been achieved by consequently applying BPG.
References [1] Prasser, H.-M., G. Grunwald, T. Höhne, S. Kliem, U. Rohde, F.-P. Weiss: “Coolant mixing in a
pressurised water reactor: deboration transients, steam-line breaks, and emergency core cooling injection”, Nuclear Technology Vol. 143 (July 2003), pp. 37-56
[2] Prasser, H.-M., Böttger, A., Zschau, J.: “A New Electrode-Mesh Tomograph for Gas Liquid Flows,” Flow Measurement and Instrumentation, 9, 111-119 (1998).
[3] Alavyoon, F., Hemström, B., Andersson, N. G., Karlsson; R. I.: “Experimental and Computational Approach to Investigating Rapid Boron Dilution Transients in PWRs,” CSNI Specialist Meeting on Boron Dilution Reactivity Transients, State College, PA, USA, October 18-20, (1995).
[4] Logvinov S.A., Ulyanovsky V.N., Bezrukov Yu.A., Kozlov A.N.: “Mixing of coolant with different boron concentration at the VVER-1000 core inlet during RCP start-up”, Proceedings of “Annual Meeting on Nuclear Technology 2000”. Bonn 22-24 May 2000.
[5] Tuomisto, H.: “Thermal-hydraulics of the Loviisa reactor pressure vessel overcooling transients”, Imatran Voima Oy, Research report IVO-A-01/87, 1987.
[6] Elter, J.: “Experiment summary report: Experimental investigation of thermal mixing phenomena in a six loop VVER type reactor”, Paks NPP Ltd, Safety Assessment Group, 28.02.2002.
[7] Tsimbalov C. A., Kraiko A. V.: “Coolant temperature distribution at VVER-440 core inlet”, (English translation, original in Russian). 1982, Atomic Energie 52/5, 304-308
[8] ERCOFTAC Best Practice Guidelines, see http://imhefwww.epfl.ch/lmf/ERCOFTAC/ [9] Menter, F. et al.: CFD Best Practice Guidelines for CFD Code Validation for Reactor Safety
Applications, Deliverable D01 of the ECORA project, February 2002
Related Documents