ARTICLE Fluid inclusion characteristics and molybdenite Re-Os geochronology of the Qulong porphyry copper-molybdenum deposit, Tibet Yang Li 1 & David Selby 1 & Martin Feely 2 & Alessandra Costanzo 2 & Xian-Hua Li 3 Received: 18 December 2015 /Accepted: 30 March 2016 /Published online: 12 April 2016 # Springer-Verlag Berlin Heidelberg 2016 Abstract The Qulong porphyry copper and molybdenum de- posit is located at the southwest margin of the Lhasa Terrane and in the eastern region of the Gangdese magmatic belt. It represents China’s largest porphyry copper system, with ∼2200 million tonnes of ore comprising 0.5 % Cu and 0.03 % Mo. The mineralization is associated with Miocene granodiorite, monzogranite and quartz-diorite units, which intruded into Jurassic volcanic units in a post-collisional (Indian-Asian) tectonic setting. Field observations and core logging demonstrate the alteration and mineralization at Qulong are akin to typical porphyry copper systems in sub- duction settings, which comprise similar magmatic-hydrother- mal, potassic, propylitic and phyllic alteration assemblages. Molybdenite Re-Os geochronology confirms the relative timeframe defined by field observations and core logging and indicates that the bulk copper and molybdenum at Qulong were deposited within 350,000 years: between 16.10±0.06 [0.08] (without and with decay constant uncer- tainty) and 15.88 ± 0.06 [0.08] Ma. This duration for mineral- ization is in direct contrast to a long-lived intrusive episode associated with mineralization based on previous zircon U-Pb data. Our fluid inclusion study indicates that the ore-forming fluid was oxidized and contained Na, K, Ca, Fe, Cu, Mo, Cl and S. The magmatic-hydrothermal transition occurred at ∼425 °C under lithostatic pressure, while potassic, propylitic and phyllic alteration occurred at hydrostatic pressure with temperature progressively decreasing from 425 to 280 °C. The fluid inclusion data presented here suggests that there has been ∼2.3 km of erosion at Qulong after its formation, and this erosion may be related to regional uplift of the Lhasa Terrane. Keywords Fluid inclusion . Molybdenite Re-Os . Qulong . Porphyry deposit . Tibet Introduction The majority of porphyry copper deposits are situated within magmatic arcs and are genetically related to subduction pro- cesses, e.g., Central Chile (Cooke et al. 2005), but porphyry copper deposits are also associated with post-collisonal tec- tonic settings, e.g., the Gangdese Porphyry Copper Belt (GPCB), China (Yang et al. 2009; Hou et al. 2015) and Papua New Guinea-Irian Jaya (Cooke et al. 2005; Richards 2013). In both subduction-related and post-collisional tectonic settings, porphyry copper deposits share a genetic association with magmatism and possess similar mineralization styles and alteration types (Richards 2009; Hou et al. 2015). Metals in porphyry copper deposits are considered to be deposited through the dynamic evolution of a magmatic- hydrothermal fluid that undergoes depressurization, cooling, chemical reactions with wall rocks (mainly the ore-hosting granite), and mixing with non-magmatic fluids (Seedorff et al. 2005; Richards 2011; Cooke et al. 2014). As a result, porphyry systems are characterized by extensive vein Editorial handling: R. Hu * Yang Li [email protected]; [email protected] 1 Department of Earth Sciences, Durham University, DH1 3LE Durham, UK 2 Earth and Ocean Sciences, National University of Ireland, Galway, Ireland 3 State Key Laboratory of Lithospheric Evolution, Institute of Geology and Geophysics, Chinese Academy of Sciences, Beijing 10029, China Miner Deposita (2017) 52:137–158 DOI 10.1007/s00126-016-0654-z

Welcome message from author
This document is posted to help you gain knowledge. Please leave a comment to let me know what you think about it! Share it to your friends and learn new things together.
Transcript

ARTICLE
Fluid inclusion characteristics and molybdenite Re-Osgeochronology of the Qulong porphyry copper-molybdenumdeposit, Tibet
Yang Li1 & David Selby1 & Martin Feely2 & Alessandra Costanzo2 & Xian-Hua Li3
Received: 18 December 2015 /Accepted: 30 March 2016 /Published online: 12 April 2016# Springer-Verlag Berlin Heidelberg 2016
Abstract The Qulong porphyry copper and molybdenum de-posit is located at the southwest margin of the Lhasa Terraneand in the eastern region of the Gangdese magmatic belt. Itrepresents China’s largest porphyry copper system, with∼2200 million tonnes of ore comprising 0.5 % Cu and0.03 % Mo. The mineralization is associated with Miocenegranodiorite, monzogranite and quartz-diorite units, whichintruded into Jurassic volcanic units in a post-collisional(Indian-Asian) tectonic setting. Field observations and corelogging demonstrate the alteration and mineralization atQulong are akin to typical porphyry copper systems in sub-duction settings, which comprise similar magmatic-hydrother-mal, potassic, propylitic and phyllic alteration assemblages.Molybdenite Re-Os geochronology confirms the relativetimeframe defined by field observations and core loggingand indicates that the bulk copper and molybdenum atQulong were deposited within 350,000 years: between16.10±0.06 [0.08] (without and with decay constant uncer-tainty) and 15.88±0.06 [0.08] Ma. This duration for mineral-ization is in direct contrast to a long-lived intrusive episodeassociated with mineralization based on previous zircon U-Pb
data. Our fluid inclusion study indicates that the ore-formingfluid was oxidized and contained Na, K, Ca, Fe, Cu, Mo, Cland S. The magmatic-hydrothermal transition occurred at∼425 °C under lithostatic pressure, while potassic, propyliticand phyllic alteration occurred at hydrostatic pressure withtemperature progressively decreasing from 425 to 280 °C.The fluid inclusion data presented here suggests that therehas been ∼2.3 km of erosion at Qulong after its formation,and this erosion may be related to regional uplift of theLhasa Terrane.
Keywords Fluid inclusion .Molybdenite Re-Os . Qulong .
Porphyry deposit . Tibet
Introduction
The majority of porphyry copper deposits are situated withinmagmatic arcs and are genetically related to subduction pro-cesses, e.g., Central Chile (Cooke et al. 2005), but porphyrycopper deposits are also associated with post-collisonal tec-tonic settings, e.g., the Gangdese Porphyry Copper Belt(GPCB), China (Yang et al. 2009; Hou et al. 2015) andPapua New Guinea-Irian Jaya (Cooke et al. 2005; Richards2013). In both subduction-related and post-collisional tectonicsettings, porphyry copper deposits share a genetic associationwith magmatism and possess similar mineralization styles andalteration types (Richards 2009; Hou et al. 2015).
Metals in porphyry copper deposits are considered to bedeposited through the dynamic evolution of a magmatic-hydrothermal fluid that undergoes depressurization, cooling,chemical reactions with wall rocks (mainly the ore-hostinggranite), and mixing with non-magmatic fluids (Seedorffet al. 2005; Richards 2011; Cooke et al. 2014). As a result,porphyry systems are characterized by extensive vein
Editorial handling: R. Hu
* Yang [email protected]; [email protected]
1 Department of Earth Sciences, Durham University, DH13LE Durham, UK
2 Earth and Ocean Sciences, National University of Ireland,Galway, Ireland
3 State Key Laboratory of Lithospheric Evolution, Institute of Geologyand Geophysics, Chinese Academy of Sciences, Beijing 10029,China
Miner Deposita (2017) 52:137–158DOI 10.1007/s00126-016-0654-z

formation associated with mineralization and alteration.Generally, hydrothermal alteration results in potassic,propylitic, sericitic (phyllic) and argillic assemblages, whichare documented to occur as concentric alteration halos aroundthe ore progenitor intrusions (Seedorff et al. 2005; Sillitoe2010). Fluid trapped by quartz and other host minerals duringalteration and mineralization processes has a wide range ofcompositions and is the only record of the ore-forming fluid(Bodnar et al. 2014). As such, fluid inclusions provide funda-mental information on the physical and chemical nature ofore-forming fluids. This is critical for understanding the natureand transportation-deposition mechanisms of ore-formingfluids in porphyry copper deposits (Wilkinson 2001; Bodnaret al. 2014).
Additional fundamental questions regarding porphyry de-posits include the time required to form these giant depositsand whether the metals accumulate in a single pulse or overseveral pulses (Chiaradia et al. 2014). The current methodsused to constrain time scales of porphyry systems include:(1) Ti in quartz diffusion and thermal numerical modelling(Cathles et al. 1997; Weis et al. 2012; Mercer et al. 2015),(2) calculation from metal concentration and fluid flow inactive hydrothermal systems (Simmons and Brown 2006,2007), and (3) direct radiogenic dating (Sillitoe andMortensen 2010; Von Quadt et al. 2011; Zimmerman et al.2014; Spencer et al. 2015). The reported time scales of fossilporphyry deposits range from <0.1 to >4 m.y. The longerdurations may reflect multiple magmatic-hydrothermal pulsesor inaccurate dating approaches (e.g. lower precision dating).The development of high-precision geochronology, especiallymolybdenite Re-Os in recent years, has permitted direct datingof the ore-forming events associated with porphyry coppersystems with precision better than tens of thousands years(Zimmerman et al. 2014; Spencer et al. 2015). Asmolybdeniteis widely distributed in porphyry Cu deposits, Re-Os molyb-denite dating is currently the best technique to constrain theore formation duration of porphyry copper deposits.
Although extensive fluid inclusion research has been con-ducted to understand ore-forming processes for subduction-related porphyry deposits (Bodnar et al. 2014)and referencestherein), much less attention has been paid to post-collisionalporphyry deposits (Hou et al. 2009). The world class Qulongporphyry deposit, Tibet, is an excellent example of a porphyrysystem formed in a post-collisional tectonic setting (Hou et al.2015). Qulong was discovered in 1994 with significant explo-ration success commenced from 2002 (Zheng et al. 2004).This period of exploration uncovered a deposit with ≥2200million tonnes ore. The average metal grade at Qulong depositis 0.5 % for Cu and 0.03 % for Mo, making it the largestcopper-bearing porphyry system in China and among theworld’s largest (top 25) porphyry copper deposits (Cookeet al. 2005; Yang et al. 2009; Qin et al. 2014). Therefore, tounderstand both the P-T-V-X conditions of Qulong, and the
porphyry systems associated with post-collisional tectonic set-tings, we present fluid inclusion petrography data coupledwith microthermometry and laser Raman microspectroscopydata. We also present molybdenite Re-Os geochronology toconstrain the timescale of the mineralization event. In addi-tion, zircon U-Pb geochronology and oxygen isotope dataallow us to constrain the origin of the syn-ore aplite and thenature of the ore-forming fluids.
Geological setting
Regional geology
The Gangdese porphyry copper belt is 50 km wide and∼400 km long and is situated at the southwest margin of theLhasa Terrane, southern Tibet (Fig. 1) (Hou et al. 2009). TheLhasa Terrane records a protracted geologic history with aPrecambrian crystalline basement underlying Paleozoic toMesozoic marine strata and arc type volcanic rocks, togetherwith Mesozoic and Cenozoic intrusions (Zhang et al. 2014).The Lhasa Terrane rifted from Gondwana during the TriassicorMiddle-Late Jurassic and moved northward across the Neo-Tethyan Ocean before collision with Eurasia along theBangonghu-Nujiang suture during the Cretaceous (Zhu et al.2011a, b; Zhang et al. 2014). The continental collision of Indiaand Asia along the Indus-Yarlung Zangbo suture started at∼55 Ma (Rowley 1996), with underthrusting of the Indianplate beginning at ∼35 Ma (Ali and Aitchison 2008; Wanget al. 2014a). Continued collision of the Indian and Asianplates resulted in the breakoff of the denser Indian plate be-neath the Asian plate from west to east of Tibet at ∼25 and∼15 Ma, respectively (Aitchison et al. 2007; Van Hinsbergenet al. 2012). Directly related to slab breakoff was magmageneration which resulted in Oligo-Miocene magmatic rocksfocused along the Gangdese belt (Hou et al. 2009; VanHinsbergen et al. 2012; Wang et al. 2014a). The Oligo-Miocene magmatism is consistent spatially linked with N-Strending normal faults formed during E-W extention of theLhasa Terrane (Hou et al. 2009; Wang et al. 2014a, b).Porphyry copper mineralization is commonly strictly associ-ated with the Oligo-Miocene intrusions in the east segment ofthe Gangdese porphyry copper belt (Wang et al. 2015), ofwhich the Qulong deposit is not only largest in this belt, butalso in China (Zheng et al. 2004; Qin et al. 2014).
Magmatic rocks
The main igneous units present at Qulong include Jurassicvolcanic rocks and dacite-rhyolite intrusions, a pre-oreMiocene granite pluton, ore-related Miocene porphyries andaplite intrusions, and a post-ore quartz diorite. Features ofthese units are summarized in Table 1 and presented below.
138 Miner Deposita (2017) 52:137–158

Jurassic Yeba Formation and dacite-rhyolite porphyry
The Jurassic Yeba Formation is the most extensive unit in theQulong district (Fig. 2a) and is comprised of basaltic and felsiclavas. The age of the formation is constrained by a zircon LA-ICP-MS age of 166.0±1.8 Ma in the felsic volcanoclasticrocks (Zhao et al. 2015). The Yeba Formation sequence isintruded by dacite-rhyolite and rhyolite porphyry stocks.These porphyry stocks are composed of quartz (20–25 vol%) and feldspar (8–10 vol%) as phenocrysts, with aquartz, K-feldspar and biotite as groundmass. Zircon grainsfrom the rhyolite porphyry yielded a LA-ICP-MSU-Pb age of160.7±2.0 Ma (Zhao et al. 2015). Volcanic rocks from theYeba Formation and the porphyry stocks show geochemicalcharacteristics indicative of an arc affinity, suggesting an ori-gin related toMesozoic Neo-TethyanOcean subduction (Yanget al. 2008b).
Rongmucuola pluton
The Jurassic Yeba Formation and dacite-rhyolite porphyryunits are intruded by the ∼8 km2 Rongmucuola pluton(Fig. 2a, b). At its contact with the Rongmucuola pluton, theYeba Formation exhibits intensive metamorphism as repre-sented by pervasive hornfels (Yang et al. 2009). From east towest, the composition of the Rongmucuola pluton ranges fromgranodiorite to monzogranite (Fig. 3a) and has a variable grains ize (medium to coarse) and ranges from beinghypidiomorphic-granular to weakly porphyritic (Yang et al.2009; Zhao et al. 2015). Mafic enclaves are quite common
in the eastern portion of the pluton, but are rare in the west(Zhao et al. 2015). Despite the small compositional and tex-tural variations, the entire pluton possesses a similar mineral-ogy and crystallization age (17.6±0.3 and 17.4±0.4 Ma; zir-con LA-ICP-MS U-Pb) (Zhao et al. 2015). The bulk of theCu-Mo mineralization is hosted in the western part of thepluton that comprises coarse-grained (5–10 mm) plagioclase(30–40 vol%), K-feldspar (20–30 vol%) and medium-grained(2–5 mm) quartz (15–20 vol%) and biotite (10–15 vol%) andaccessory minerals such as apatite, magnetite, zircon and ru-tile; no titanite has been documented. The pluton is character-ized by a porphyritic texture throughout a progressive increasein alteration intensity from the surface to ∼2000 m depth (pre-dominantly silicification and potassic alteration) and exhibitsa colour change from dark grey to grey.
P porphyry (monzogranite)
The western part of the Rongmucuola pluton is intruded by theP porphyry (Fig. 2a, b), which is considered to be the ore-forming porphyry (Yang et al. 2009; Hu et al. 2015; Zhaoet al. 2015). The P porphyry has an exposure surface of0.5 km2 and an unknown vertical extent. The P porphyry com-prises coarse-grained (3–8 mm) plagioclase (10–20 vol%),quartz (5–15 vol%) and K-feldspar (∼5 vol%) as phenocrysts,with a groundmass dominated by quartz and feldspar (Fig. 3b).The porphyry shows extensive alteration and mineralization.The feldspar phenocrysts possess distinctive embayed shapes,with the groundmass displaying different degrees of hypogeneargillization as a result of either the complete or partial
88 o 90 o 92 o 94 o 96 o 98 o 100 o
34 o
32 o
30 o
28 o
20 KmN
88 o89 o 90 o 91 o 92 o
30 o30 o
Lhasa terrane
AKMS
JS
GLS
BNS
IYS
Animaqing-Kunlun-Muzitage suture
Jinsha suture
Garze-Litang suture
Bangonghu-Nujiang suture
Indus-Yarlung Zangbo suture
IYS
IYS
Arc granitoids
Collisional granitoids
Oligocene granites
Porphyry Cu-Mo deposits
Pb-Zn-Cu deposits
Suture
Thrust
Great counter ThrustRenbu-Zedong Thrust
Miocene porphyry intrusion
LhasaCHINA
Lhasa
AKMS
JS
GLS
BNS
IYS
Kunlun-QaidarnSongpan-garze-Hoh Xil TerraneQiangtang Terrane
Lhasa Terrane
Tethyan Himalayan sequence
Qulong
Lhasa
Jiama
Bangpu
NanmuLakang’eTinggong
Bairong
Luobadui
Tethyan Himalayan sequenceXigaze forearc basin
Chongjiang
Fig. 1 Tectonic setting and geological map of the Gangdese Porphyry Copper Belt. Modified from Yang et al. (2009)
Miner Deposita (2017) 52:137–158 139

Tab
le1
Geologicalsum
maryforallm
agmaticunits
intheQulongdepositincluding
publishedages
Units
Distribution
Com
positio
nAlteratio
nandmineralization
Age
(mineral,m
ethodanddata)
YebaFormation
E-W
directionin
SouthGangdesebelt.
Andesiticcrystaltuff,ignimbrite,and
dacite;
laminated
slate,with
interbeddedsandstone
andlim
estone;andesiticlava
andvolcanoclasticrocks.
Weakpropyliticalteration,no
mineralizationexcept
pyriteveins.
Zircon,LA-ICPM
SU-Pb,166.0±1.8
Ma(Zhaoetal.2015).
Jurassicintrusions
Mid-w
estern
Qulong
Dacite-rhyolite
andrhyoliteporphyry.
Quartz(20–25
vol%
)andfeldspar
(8–10vol%
)as
phenocrysts,with
quartzandK-feldsparand
biotite
asgroundmass.
Propyliticandphyllic
alteratio
nswith
abundant
fracture
controlled
pyriteveins.
Zircon,SH
RIM
PU-Pb,182.3±1.5
Ma(Yangetal.2009);
Zircon,LA-ICPMSU-Pb,
160.7±2.0Ma(Zhaoetal.2015).
Rongm
ucuola
pluton
Eastp
arto
fQulong
Medium-coarse,hypidiom
orphic-granulargranodiorite.
Coarse-grained(5–10mm)plagioclase(30–40
vol%
),K-feldspar(20–30
vol%
),andmedium
grained
(2–5
mm)quartz(15–20
vol%
)andbiotite
(10–15
vol%
),accessorymineralsincludeapatite,m
agnetite,zircon,rutile.
Weakpropyliticalteration,
generally
barren.
Zircon,LA-ICPMSU-Pb,
17.6±0.3Ma(Zhaoetal.2015).
CentralQulong
Weaklyporphyritic
monzogranite.
Coarse-grained(5–10mm)plagioclase(30–40
vol%
),K-feldspar(20–30
vol%
),andmedium
grained(2–5
mm)
quartz(15–20
vol%
)andbiotite
(10–15
vol%
),accessorymineralsincludeapatite,m
agnetite,zircon,rutile.
Intensivepotassic,propyliticand
phyllic
alteratio
nandhoststhe
majority
oftheCu-Moin
Qulong.
Zircon,LA-ICPMSU-Pb,
17.4±0.4Ma(Zhaoetal.2015).
Pporphyry
CentralQulong
Coarse-grainedmonzogranite.
Coarse-grained(3–8
mm)plagioclase(10–20
vol%
),quartz(5–1
vol%
)andK-feldspar(∼5vol%
)as
phenocrysts,thegroundmassisdominated
byquartzandfeldspar.
Intensivepotassic,propyliticand
phyllic
alteratio
nandhasbeen
presum
edas
theore-genitorporphyry.
Zircon,LA-ICPMSU-Pb,
16.2±0.3Ma(Zhaoetal.2015).
Xporphyry
CentralQulonganddrill
cores
Coarse-grainedbiotite
monzogranite.
Mineralogysimilaras
Pporphyry
butcontainsmorequartz.
Intensivepotassic,w
eakpropylitic
andphyllic
alteratio
n,weakmineralized.Zircon,LA-ICPMSU-Pb,
15.9±0.3Ma(Zhaoetal.2015).
Aplite
CentralQulonganddrill
cores
Fine-grained
aplite
Intergrowthsof
fine-grained
(∼1mm)anhedral
alkalifeldspar
andquartz.
Intensivepotassic,w
eakpropylitic
andphyllic
alteratio
n,generally
notm
ineralized.
Nodatareported
Quartzdiorite
dike
Mainlyin
drill
cores
Quartzdiorite
dike
Coarsephenocrysts(∼0.5–1cm
)of
plagioclase
(∼5%),quartz(5
%)andhornblende
(3%)with
amatrixcompriseplagioclaseandhornblende
aswellasquartzandbiotite.
Weakphyllic
alteratio
n,post-
mineralizationthus
barren.
Zircon,LA-ICPMSU-Pb,
15.3±0.3Ma(Zhaoetal.2015).
140 Miner Deposita (2017) 52:137–158

destruction of feldspar. Characteristic to the P porphyry is itsquartz phenocrysts which occur as clusters of two or three andforms amalgamated Bphenocrysts^ (Fig. 3b). These quartz phe-nocrysts often show resorbed crystal margins and embaymenttextures (Fig. 3b) which indicate intense silicification (Changand Meinert 2004; Yang et al. 2009; Qin et al. 2014). ZirconLA-ICPMS U-Pb analysis yielded a 16.2±0.3 Ma emplace-ment age for the P porphyry (Zhao et al. 2015).
X porphyry (monzogranite)
In the western portion of the Rongmucuola pluton, the Xporphyry occurs with a surface outcrop of ∼0.04 km2; it isalso present as irregular dikes in drill cores. The thickness of
X porphyry dikes in drill cores varies from several to tens ofcentimeters (Zhao et al. 2015) (Fig. 2b). The X porphyry hassimilar composition to the P porphyry except for a greaterabundance of biotite phenocrysts. The X porphyry possessesunidirectional solidification textures (UST), intensive potassicalteration and weak propylitic alteration, but in general, it ispoorly mineralized (Yang et al. 2009). No direct cross-cuttingrelationships between the P and X porphyry have been docu-mented previously or observed in this study. However, previ-ous studies assume it post-dates the P porphyry because it cutsbarren potassic stage quartz veins in the Rongmucuola pluton(Yang et al. 2009; Zhao et al. 2015). The reported zircon LA-ICP-MS U-Pb age is identical, within uncertainty, to that ofthe P porphyry (15.9±0.3 Ma) (Zhao et al. 2015).
Cu-Mo orebody
Dacite-rhyolite porphyry
Rongmucuola pluton
P porphyry
X porphyry
Quartz diorite
Breccias
Cross section
Quaternary
A A’
Yeba Formation
5500
5300
5100
4900
4700
4500
4300
29o38'N
29o37'N
91o34'E 91o35'E 91o36'E 91o37'E 91o38'E
A A'
AA'
)m(
noitavelE
Drillhole500 m
1000 mN
b
a
Fig. 2 Geological map (a) of the Qulong Cu-Mo porphyry deposit with cross-sections (b). Simplified and revised from Zhao et al. (2015)
Miner Deposita (2017) 52:137–158 141
Aplite
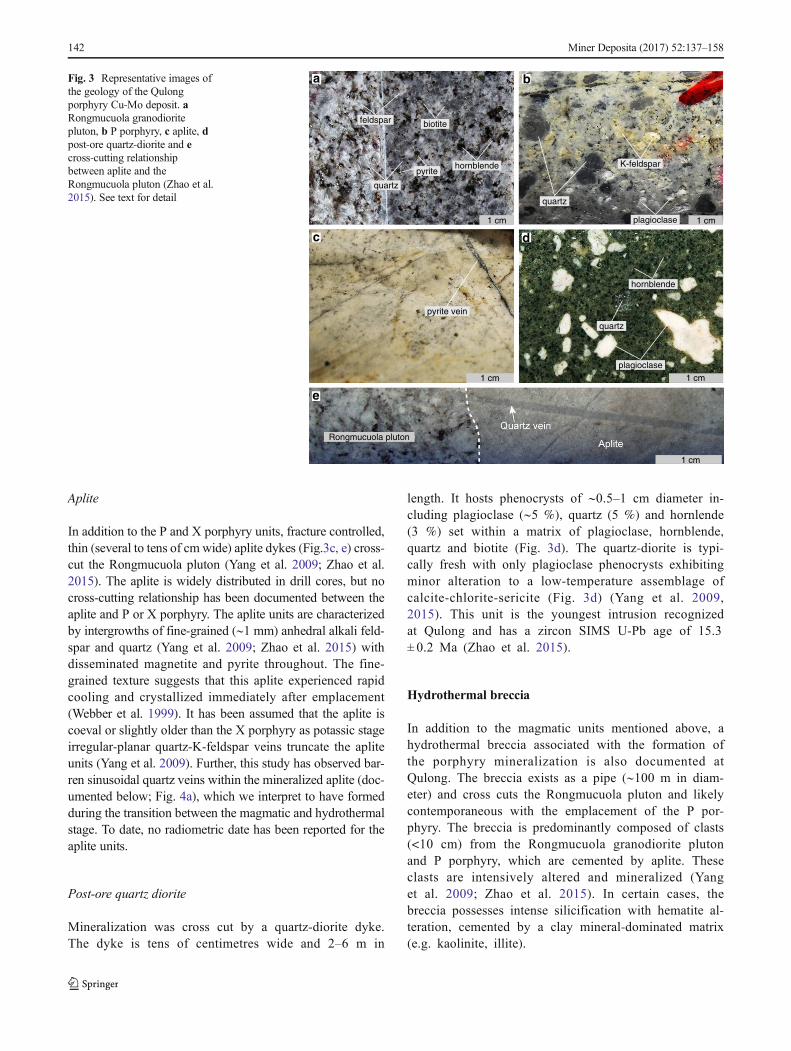
In addition to the P and X porphyry units, fracture controlled,thin (several to tens of cm wide) aplite dykes (Fig.3c, e) cross-cut the Rongmucuola pluton (Yang et al. 2009; Zhao et al.2015). The aplite is widely distributed in drill cores, but nocross-cutting relationship has been documented between theaplite and P or X porphyry. The aplite units are characterizedby intergrowths of fine-grained (∼1 mm) anhedral alkali feld-spar and quartz (Yang et al. 2009; Zhao et al. 2015) withdisseminated magnetite and pyrite throughout. The fine-grained texture suggests that this aplite experienced rapidcooling and crystallized immediately after emplacement(Webber et al. 1999). It has been assumed that the aplite iscoeval or slightly older than the X porphyry as potassic stageirregular-planar quartz-K-feldspar veins truncate the apliteunits (Yang et al. 2009). Further, this study has observed bar-ren sinusoidal quartz veins within the mineralized aplite (doc-umented below; Fig. 4a), which we interpret to have formedduring the transition between the magmatic and hydrothermalstage. To date, no radiometric date has been reported for theaplite units.
Post-ore quartz diorite
Mineralization was cross cut by a quartz-diorite dyke.The dyke is tens of centimetres wide and 2–6 m in
length. It hosts phenocrysts of ∼0.5–1 cm diameter in-cluding plagioclase (∼5 %), quartz (5 %) and hornlende(3 %) set within a matrix of plagioclase, hornblende,quartz and biotite (Fig. 3d). The quartz-diorite is typi-cally fresh with only plagioclase phenocrysts exhibitingminor alteration to a low-temperature assemblage ofcalcite-chlorite-sericite (Fig. 3d) (Yang et al. 2009,2015). This unit is the youngest intrusion recognizedat Qulong and has a zircon SIMS U-Pb age of 15.3± 0.2 Ma (Zhao et al. 2015).
Hydrothermal breccia
In addition to the magmatic units mentioned above, ahydrothermal breccia associated with the formation ofthe porphyry mineralization is also documented atQulong. The breccia exists as a pipe (∼100 m in diam-eter) and cross cuts the Rongmucuola pluton and likelycontemporaneous with the emplacement of the P por-phyry. The breccia is predominantly composed of clasts(<10 cm) from the Rongmucuola granodiorite plutonand P porphyry, which are cemented by aplite. Theseclasts are intensively altered and mineralized (Yanget al. 2009; Zhao et al. 2015). In certain cases, thebreccia possesses intense silicification with hematite al-teration, cemented by a clay mineral-dominated matrix(e.g. kaolinite, illite).
K-feldspar
quartz
plagioclase1 cm 1 cm
1 cm 1 cm
feldspar
quartz
hornblendepyrite
biotite
pyrite vein
plagioclase
quartz
hornblende
Rongmucuola pluton
1 cm
a b
c d
e
Fig. 3 Representative images ofthe geology of the Qulongporphyry Cu-Mo deposit. aRongmucuola granodioritepluton, b P porphyry, c aplite, dpost-ore quartz-diorite and ecross-cutting relationshipbetween aplite and theRongmucuola pluton (Zhao et al.2015). See text for detail
142 Miner Deposita (2017) 52:137–158

Hydrothermal alteration phases
Akin to porphyry copper deposits worldwide, Qulong has aclearly zoned mineralization and alteration pattern. The rela-tive chronology of the alteration assemblage at Qulong is: (a)veinlets associated with the magmatic-hydrothermal transitionstage, (b) potassic (K-feldspar, biotite) alteration stage, (c)propylitic alteration (chloritization) assemblages and (d)phyllic alteration (sericite) phases. The alteration andmineralization phases at Qulong have been described byYang et al. (2009) and Qin et al. (2014). Here, we summarizethese findings together with the observations of this study.
Magmatic-hydrothermal transition stage quartz veins
This study reports the first record of ∼0.5 cm wide sinusoidalquartz veins at Qulong hosted within the aplite dyke (Fig. 4a).The veins bear K-feldspar rims (∼1 mm wide) at both sidesand have localized clusters of fine-grained (<0.3 mm) pyritegrains. These barren veins represent silica-saturated melts/
fluid formed at the magmatic-hydrothermal transition stagebefore potassic alteration. This process is also represented byunidirectional solidification textures (UST) hosted by the Xporphyry (Yang et al. 2008a). The sinusoidal quartz veins andUST are taken to represent the magmatic-hydrothermal tran-sition stage at Qulong.
Potassic alteration
Potassic stage alteration assemblages at Qulong include thebarren biotite and quartz veins (generally 2 mm wide)(Fig. 4b), chalcopyrite and molybdenite-bearing quartz veinswith K-feldspar halos and chalcopyrite-molybdenite-bearingquartz veins with biotite-feldspar-quartz assemblages(Fig. 4c–f). Potassic alteration phases are concentrated aroundthe P porphyry and predominantly hosted by theRongmucuola pluton and P porphyry and also occur in theYeba Formation and X porphyry. Cu-Mo-bearing veins withK-feldspar halos are the main ore-bearing potassic alterationassemblages at Qulong. These veins generally have a width of
K-feldspar
mol
ybde
nite
chalcopyrite
biotite
chalcopyrite
molybdenite
molybdenite
chalcopyrite
pyrite
chlorite
K-feldspar
quartz
chlorite molybdenite
chalcopyriteanhydrite
biotite-K-feldspar vein
quartz vein
chalcopyrite
pyrite
biotite
quartzquartz
quartz
aplite
molybdenite
K-feldspar
d
2 cm
g
4 cm
K-feldspar
h
2 cm
quartz
i
1 cm
molybdenite
K-feldspar
chalcopyrite
biotite
j
2 cm
b
2 cm
a
1 cmquartz vein
aplite
k
2 cm
molybdenite
anhydrite
pyrite
quartz l
2 cm
chalcopyrite
molybdenite
clay minerals
2 cm
c
fe
2 cm
molybdenite
quartz
chalcopyrite
K-feldspar
biotite
2 cm
K-feldspar
Fig. 4 Photos showing alterationand mineralization characteristicsof the Qulong porphyry Cu-Modeposit. a Earliest A vein, b earlybarren quartz vein and biotitevein, c molybdenite vein hostedby aplite, d main stage Cu-Moveins with K-feldspar and biotitehalos, e, f, g Cu-Momineralization with K-feldsparhalos from the potassic-propyliticalteration stage, h, i Mo-Cu veinsfrom the propylitic alterationstage, j anhydrite veins with Cu-Mo halos from the phyllicalteration stage, k pyrite-anhydrite vein from the phyllicalteration stage, l Argillicalteration sample. See text fordetail
Miner Deposita (2017) 52:137–158 143

0.5–3 cm (Fig. 4d, e). The nature of potassic alteration ischaracterized by selective replacement of plagioclase to K-feldspar and tends to be more extensive near the P porphyrywhere almost all plagioclase grains were replaced by sericite,kaolinite and illite. Veinlets containing biotite have been di-vided into three types: (1) vein fillings comprising coarse-grained biotite grains (0.1–0.4 mm), (2) yellow-browncoloured biotite alteration halos (generally<0.1 mm in width)along irregular quartz or quartz-anhydrite veins and (3) prima-ry biotite grains replaced by secondary biotite in theRongmucuola pluton (Yang et al. 2009). Potassic alterationis the main mineralization stage at Qulong and directly con-trols bulk Cu-Mo mineralization. A progressive increase inintensity of potassic alteration was documented in theRongmucuola pluton from shallow to depth.
Propylitic alteration
Propylitic alteration is extensively developed at Qulong inboth the Rongmucuola pluton and the Yeba Formation. Thepropylitic alteration is characterized by pervasive weakchloritization of the primary biotite and intensive replacementof plagioclase by epidote in the Rongmucuola pluton(Fig. 4g–i) and Yeba Formation, respectively. Propylitic alter-ation in the X porphyry is relatively weak. In theRongmucuola pluton, biotite, hornblende and plagioclasehave experienced different degrees of replacement bychlorite-dominated assemblages. In the Yeba Formation, epi-dote dominated (>60 vol%) alteration assemblages, withquartz, chlorite and K-feldspar, are found as irregular to planarveins (1–2 mm wide). Generally, sulfides (e.g. pyrite, chalco-pyrite) associated with propylitic alteration are less abundantthan in the potassic alteration stage (Yang et al. 2009).Anhydrite veins (pink, 1–3 mm in grain size and ∼0.5–2 cmwide) along with molybdenite mineralization (with minorchalcopyrite) fill in reopened potassic stage K-feldspar veins(Fig. 4j). It is thought that these sulfides (molybdenite+ chal-copyrite) belong to the propylitic alteration stage given thatthe K-feldspar assemblages in these veins are partially re-placed by late stage molybdenite and chlorite.
Phyllic and hypogene argillic alteration
Phyllic and hypogene argillic alteration phases are widely dis-tributed and overprint early stage alteration assemblages atQulong. Phyllic and argillic alteration phases are more intensein the P porphyry than that in the Rongmucuola pluton and theX porphyry. In most cases, the intensive phyllic and argillicalteration have overprinted all igneous textures in the P por-phyry. Similar to the potassic alteration, a progressive en-hancement of phyllic and argillic alterations has been docu-mented from shallow to depth in the Rongmucuola pluton.The main mineral phases of the phyllic and argillic alteration
assemblages are sericite, pyrite, anhydrite and clay minerals,and these are spatially associated with minor chalcopyrite andmolybdenite. These phases are generally fine-grained (0.5–3 mm) and difficult to recognize in hand specimen, but occa-sionally include coarse-grained (0.5–1 cm) pyrite and anhy-drite crystals (Fig. 4k, l).
Samples and methods
Samples
Representative quartz veins from the magmatic-hydrothermaltransition stage, potassic alteration, propylitic and phyllic al-teration stages were selected to study fluid inclusions, whichallow us to constrain the nature and evolution of the ore-forming fluid. All the samples were collected from drill coresat 10 to ∼600 m.
All the magmatic units at Qulong have been dated by pre-vious studies, except the ore-bearing aplite. One ore-bearingaplite sample (Fig. 3c) was selected to conduct secondary ionmass spectrometry (SIMS) zircon U-Pb geochronology. SIMSwas also utilized to determine the oxygen isotope compositionof the zircons in order to aid the understanding of the U-Pbdata, as well as the nature of ore-forming fluids.
Six molybdenite-bearing quartz veins utilized for fluid in-clusion analysis were also targeted for Re-Os dating to furtherconstrain the timing of sulfide mineralization. Samples wereselected from the aplite with a weak potassic alteration of K-feldspar (313–145; Fig. 4c), the potassic alteration stage (313–460, 001–640; Fig. 4d, e), the potassic-propylitic transition(1605–334, Fig. 4j) and the phyllic stage (1605–155; 1605–33, Fig. 4k).
Microthermometry and laser Raman spectroscopy
Microthermometric analysis of vein quartz hosted fluid inclu-sions in doubly polished wafers was carried out at theGeofluids Research Laboratory, National University ofIreland, Galway, using a Linkam THMSG600 heating andfreezing stage mounted on a Olympus transmitted light micro-scope. Synthetic fluid inclusion standards (pure CO2 and purewater) were used (Baumgartner et al. 2014) at −56.6, 0, 10.2and 374 °C to correct the accuracy of the stage.Measurementsbelow 31.1 °C, the critical point of CO2, are accurate to±0.2 °C, and measurements above this temperature are accu-rate to ±1 °C. The volumetric fraction of phases in fluid inclu-sions was estimated at room temperature by reference to thevolumetric chart of Roedder (1984). Bulk salinity was calcu-lated from the final ice melting temperature, or halite dissolu-tion temperature (Bodnar and Vityk 1994) for hypersalinefluid inclusions. Homogenization conditions and isochoresof individual fluid inclusion assemblages (FIAs) have been
144 Miner Deposita (2017) 52:137–158

calculated with HokieFlincs_H2O-NaCl program based onfluid inclusion volumetric data (P-V-T-X) (Steele-MacInniset al. 2012).
Solid and gas phases from selected fluid inclusions wereidentified using laser Raman spectroscopy (LRS) at theGeofluids Research Laboratory, National University ofIreland Galway. The LRS analysis was conducted on aHoriba Lab Ram II spectrometer equipped with a 600groove.mm−1 diffraction grating, confocal optics, a Peltier-cooled CCD detector (255 by 1024 pixel array at −67 °C)and anOlympus BX41microscope arranged in 180° backscat-ter geometry. Sample excitation was achieved using a Ventusdiode-pumped, continuous wavelength, 532 nm laser with amaximum power output of 50 mW. Raman analysis was car-ried out using a ×100 objective lens resulting in a laser spotsize of ∼2 μm. Excitation power at the sample typicallyranged between 10 and 20 mW.
CL imaging and EDS mineral identification methods
CL imaging and mineral inclusion identification were con-ducted with a Hitachi SU-70 FEG SEM at the G., J., Russellelectron microscopy facility at Durham University.Cathodoluminescence (CL) imaging was carried out at a 10-kV accelerating voltage with a beam current of 1.63 nA at16.8 mm working distance. Secondary electron images weretaken under the same accelerating voltage and working dis-tance but at a lower beam current (0.6 nA). Mineral inclusionswere identified by EDS with 15 kV accelerating voltage and0.93 nA beam current at 15 mm working distance.
SIMS zircon oxygen isotope and U-Pb dating analyticalmethod
Guided by CL images, zircon oxygen isotope analysis and U-Pb dating were carried out at the Institute of Geology andGeophysics, Chinese Academy of Sciences with CAMECAIMS-1280 SIMS and CAMECA IMS-1280HR SIMS, respec-tively. Sample preparation and instrument operationconditions are the same as in Li et al. (2009, 2010a,b) andare briefly summarized here. Zircon grains were mounted withzircon oxygen isotope standards (Penglai zircon and Qinghuzircon) (Li et al. 2010b, 2013) and zircon geochronology stan-dards (Plešovice and Qinghu zircon) (Sláma et al. 2008; Liet al. 2013) and then polished and coated with gold.
For O analysis, the Cs+ primary ion beam was acceleratedat 10 kV, with an intensity of ca. 2 nA and rastered over a10-μm area. The spot size (ellipse) was about 10×20 μm indiameter. The normal incidence electron flood gun was usedto compensate for sample charging during analysis with ho-mogeneous electron density over a 100-μm oval area. A 60-eV energy window was used together with a mass resolutionof ca. 2500. Oxygen isotopes were measured using multi-
collection mode on two off-axis Faraday cups. The intensityof 16O was typically 109 cps. The nuclear magnetic resonance(NMR) probe was used for magnetic field control with stabil-ity better than 3 ppm over 16 h onmass 17O. One analysis tookca. 5 min consisting of pre-sputtering (∼120 s), automaticbeam centering (∼60 s) and integration of oxygen isotopes(20 cycles×4 s, total 80 s). Uncertainties on individual anal-yses were usually better than 0.3–0.4 ‰ (2 SE). The instru-mental mass fractionation factor (IMF) was corrected usingPenglai zircon with a δ18O value of 5.3 ‰ (Li et al. 2010b).Measured 18O/16O ratios were normalized by using V-SMOWcompositions (18O/16O=0.0020052) and then corrected forthe IMF. An in-house zircon standard (Qinghu) was used toascertain the veracity of the IMF and 15 measurements ofQinghu zircon in this research yielded a weighted mean of5.49±0.37 ‰ (2 SD), which is consistent with the recom-mended value of 5.4±0.2 ‰ (Li et al. 2013).
During U-Pb analysis, zircon grains were sputtered by anO2
− primary ion beam with an intensity of ca. 8 nA and adiameter of 20 μm. An ellipsoidal spot approximately20×30 μm in size was created at the sample surface as theion beam was at an angle with the sample surface. U-Pb con-centration and isotopic compositions were calibrated againstthe Plešovice zircon standard (Sláma et al. 2008). Common Pbwas corrected using measured non-radiogenic 204Pb and anaverage present day crustal Pb compositions (Stacey andKramers 1975). Concordia plot and ages are calculated byIsoplot 3.0 (Ludwig 2003). The quality of the data wasassessed by analyzing the Qinghu zircon standard betweensamples. Five analyses of the Qinghu zircon standard duringthis study yielded a weighted average 206Pb/238U age of 160.1±4.6 Ma (95 % conf.), which is in good agreement with thereported reference value of 159.5±0.2 Ma (Li et al. 2013).
Molybdenite Re-Os dating method
Molybdenite (0.3–2 mm) bearing quartz veins were crushed inan agate pestle to 5 mesh and then hand-picked under a micro-scope to remove non-molybdenite-bearing phases. A knownamount of material was placed into a Savillex Teflon digestionvessel with 8 ml of 32 N HF (ROMIL Ltd. UpA high-purityHF) and left at room temperature for 24 h (Lawley and Selby2012). This digestion process was repeated until most of thequartz had been liberated. After this, the HF was removed byrinsing the material three times with MQ, followed by ethanolrinsing. The samples were then dried at 30 °C. Thematerial wasfurther purified by traditional heavy liquid floating technology,and the estimated purity was better than 95 %.
The Re-Os analytical protocol follows that documented bySelby and Creaser (2001). In brief, a known amount molyb-denite aliquant and spike solution (185Re plus isotopicallynormal Os) was loaded into a Carius tube with 15.5 N HCl(3 ml) and 16 N HNO3 (6 ml), sealed and digested at 220 °C
Miner Deposita (2017) 52:137–158 145

for ∼24 h. Osmium was isolated from the acid medium usingsolvent extraction (CHCl3) at room temperature and furtherpurified by micro-distillation method. The rhenium fractionwas separated by NaOH-acetone solvent extraction and stan-dard anion column chromatography. Rhenium and osmiumwere loaded on to Ni and Pt filaments, respectively. The iso-topic compositions were measured by negative thermal ioni-zation mass spectrometry (N-TIMS) (Creaser et al. 1991).Analyses were conducted on a Thermo Scientific TRITONmass spectrometer, with Re and Os isotopic compositionsmeasured using static Faraday collection mode. The Re andOs isotopic composition analytical uncertainties are propagat-ed with spike calibrations, sample and spike weighting uncer-tainty, reproducibility of Re and Os isotope standard values, aswell as blank abundances and isotopic compositions. Duringthe study, Re and Os blanks were 4 and 1 pg, respectively,with the 187Os/188Os of the blank being 0.25 ± 0.02. Themolybenite Re-Os model age is calculated using the equationt = ln (187Os/187Re + 1)/λ. All analytical uncertainties werepropagated with, and without, the 187Re decay constant uncer-tainty (Smoliar et al. 1996; Selby et al. 2007).
Fluid inclusion data
Classification strategy
The superimposition of multiple hydrothermal fluid pulses is acommon phenomenon in hydrothermal ore deposits and isparticularly common in porphyry copper systems (Seedorffet al. 2005; Rusk et al. 2008; Richards 2011). As a result ofthe superimposition of hydrothermal events, it is common tofind in one crystal fluid inclusions that were trapped duringdifferent stages of mineralization and record very differentphysical and chemical compositions (Audetat et al. 1998).As such, to avoid ambiguous results and to investigate theprimary ore-forming fluids nature, only primary andpseudosecondary fluid inclusions were analysed.
Fluid inclusions and fluid inclusion assemblages (FIAs)(Goldstein and Reynolds 1994) are abundant in quartz veinsfrom all alteration stages at Qulong and range in size from 1 to30 μm in diameter (Fig. 5). The majority of fluid inclusionsexamined in this study have a diameter between 6 and 15 μm.Primary fluid inclusions are defined when they are confined toa single growth zone (Fig. 5a). However, given the fact thatmost of the quartz grains are anhedral and lack clear growthzonation under transmitted light microscope, like many por-phyry copper deposits (Rusk et al. 2008), most fluid inclu-sions studied here are linearly distributed pseudosecondaryfluid inclusions trapped during the healing of micron-sizedintra-grain fractures/cracks (Fig. 5a–c). Secondary fluid inclu-sions (Fig. 5b), generally distributed along late stage fractures,
have an unknown origin in relation to the mineralization(Fig. 5a) and were avoided during this study.
Based on phases observed at room temperature, five types offluid inclusion assemblages have been defined. They are clas-sified as: LV0–25 (liquid-rich two-phase FIAs, Fig. 5f), LV25–60
(liquid–vapour two-phase FIAs, Fig. 5e), LV60–100 (vapour-richtwo-phase FIAs, Fig. 5d, i), LVH±OP (halite-bearing FIAs withor without opaque minerals, Fig. 5g, h) and LVOP (opaqueminerals bearing FIAs without halite presence, Fig. 5j, m)(L= liquid, V=vapour, subscript number=volume percentageof vapour in fluid inclusions, H±OP=presence of halite and/oropaque minerals, e.g. LV0–25 refers to two-phase fluid inclu-sions contain 0–25 vol% of vapour; LVOP refers to fluid inclu-sions that contain opaque minerals without observed halitecrystals). Halite in LVH±OP fluid inclusions was identified byits cubic shape and optical isotropy (Fig. 5g–j, l), with sylvitedistinguished from halite by its sub-cubic form and lower relief.Halite is the dominant salt crystal. Anhydrite is also present inLVH±OP and LVOP fluid inclusions and is identified by its trans-parent anisotropic prisms (Fig. 5k, l) with a diagnostic Ramansignal (Burke 2001). Hematite in LVH±OP and LVOP fluid in-clusions was easily recognized from its red colour, hexagonalshape and high reflection index (Fig. 5m). However, most ofthe opaque minerals in LVH±OP and LVOP fluid inclusions werenot identified due to their small size (<1 μm). In many cases, aFIA comprises more than one type of fluid inclusions. In suchcases, the classification is defined by the main type of fluidinclusion in that FIA (Goldstein and Reynolds 1994).
LV0–25 type fluid inclusions commonly display negativecrystal shapes (Fig. 5f), but also exhibit rounded to irregularshapes. These inclusions occur in trails, as scattered groupsand isolated individuals.
LV25–60 type fluid inclusions are dominated by negative crys-tal shapes and also exhibit rounded shapes (Fig. 5e), they occurin trails, as randomly distributed clusters and as isolated individ-uals, which are similar to the LV0–25 type fluid inclusions.
LV60–100 type fluid inclusions share similar distribution pat-terns as the LV0–25 and LV25–60 type fluid inclusions (Fig. 5d, i).However, the difference between this type and LV0–25 andLV25–60 inclusions is that LV60–100 homogenize to both thevapour (∼30 % of them) and liquid (∼70 % of them) phase.
LVH±OP type fluid inclusions host one or more halitedaughter minerals ±opaque minerals (Fig. 5g, h, l), with var-iable volume percentages of vapour. Halite is the most com-mon daughter mineral, but sylvite and anhydrite (Fig. 5k, l)are also observed. This type of fluid inclusion is either isolatedor occurs as randomly distributed clusters and often containssmall (∼1 μm) unidentified opaque daughter minerals(Fig. 5g, h, j, l).
LVOP type fluid inclusions host opaque minerals and anhy-drite, but no other identifiable daughter phases at room tem-perature (Fig. 5j, m). They contain 5–60 vol% vapour phases,with the majority containing 10–20 vol% vapour. These
146 Miner Deposita (2017) 52:137–158

inclusions are generally distributed as random clusters or asisolated individuals, but also spatially associated with halite-bearing fluid inclusions (Fig. 5j). These fluid inclusions aregenerally secondary or of an unknown origin, and are notfurther discussed. The distribution of the FIAs in the veinassemblages at Qulong are given in Table 4.
Microthermometry
The majority of fluid inclusions homogenize to liquid withsubsequent dissolution of halite when present, except forLV60–100 type fluid inclusions, which 30 % of them homoge-nize to the vapour phase. A few halite-bearing fluid inclusionsalso homogenize by halite dissolution. In most cases, the
opaque minerals do not dissolve despite heating to 450–500 °C for 2–3 h.
For the FIA bearing both LV25–60 and LV60–100 inclusionsfrom a quartz vein representing the magmatic-hydrothermaltransition stage (no. 1 in Fig. 4a), the inclusions homogenizeto liquid with Th of 340–360 °C and yield salinities of 2–6 wt% NaCl equiv. (n=18; Fig. 6a).
All inclusions Th and salinity data for quartz-bearingpotassic alteration selvages are shown in Fig. 6b. One pri-mary halite-bearing FIA (LVH±OP, no. 2 in Fig. 6b) yield Thof 419–436 °C and salinities of 50–52 wt% NaCl equiv.(n= 11). A pseudosecondary halite-bearing FIA (LVH±OP,no. 3) spatially associated with vapour-rich two-phase fluidinclusions (LV60–100) yield identical Th (388–405 °C). Thehalite-bearing fluid inclusions have salinities of 41–45 wt%
Fig. 5 Distribution and characteristic features of fluid inclusions atQulong. a Distribution of primary, pseudosecondary and originunknown fluid inclusions. b Secondary fluid inclusions withinlate-stage fracture and pseudosecondary fluid inclusions. c Lineardistributed pseudosecondary fluid inclusions, d Vapour-rich two-phaseFIA. e Liquid–vapour two-phase FIA. f Liquid-rich two-phase FIA. g
Halite-bearing FIA with/without opaque. h Halite-bearing FIAwith/without opaque. i Vapour-rich two-phase FIA. j Two-phase FIAspatially associated with halite-bearing fluid inclusions. k Anhydritebearing fluid inclusion. l Halite-bearing fluid inclusion with anhydriteand opaque minerals. m Opaque mineral and hematite-bearing fluidinclusions without halite
Miner Deposita (2017) 52:137–158 147

NaCl equiv (n= 8), with the vapour-rich two-phase fluidinclusions homogenizing to vapour possessing lower salin-ities (4–7 wt% NaCl equiv., n= 6). Two pseudosecondaryvapour-rich two-phase FIAs (nos. 4 and 5) yield similarsalinities (1–6 wt% NaCl equiv), but have different Th(385–400 and 360–370 °C; n= 12 and 13, respectively).Two liquid-vapour two-phase (LV60–100) pseudosecondaryFIAs (no. 6) yield similar Th (335–355 °C) and salinity (2–7 wt% NaCl equiv; n= 18).
All Th and salinity data for quartz veins bearing a propylitica l te ra t ion se lvage are shown in Fig . 6c . Threepseudosecondary liquid-vapour two-phase (LV25–60) FIAs (al-so include vapour-rich two-phase fluid inclusions, no. 7) yieldidentical Th (all homogenize to liquid) of 335–360 °C andsal in i t ies of 1–7 wt% NaCl equiv (n = 31) . Onepseudosecondary liquid-vapour two-phase FIA (no. 8) givessimilar salinity values (2–7 wt% NaCl equiv), but slightlylower Th (318–332 °C, n=9). A further FIA (no. 9) compris-ing pseudosecondary liquid-rich two-phase fluid inclusionsyield similar Th of 270–290 °C and show broadly similarsalinities of 2–11 wt% NaCl equiv (n=14).
The Th and salinity inclusion data for a quartz-bearingphyllic alteration selvage are shown in Fig. 6d. In general,salinities are similar between FIAs (nos. 10–12) and rangebetween 1 and 9 wt% NaCl equiv. In contrast, Th values varywithin the FIAs from 265 to 340 °C. One pseudosecondaryliquid-rich two-phase FIA (no. 12) yielded Th of 265–290 °Cand salinities of 1–8 wt% NaCl equiv (n = 13). Anotherpseudosecondary FIA (no. 11) yielded slightly higher Th(295–310 °C) and possesses similar salinities (3–9 wt%NaCl equiv. n=12). A slightly higher Th (325–340 °C) is
recorded by another pseudosecondary liquid-vapour two-phase FIA (no. 10), with salinities of 2–8 wt% NaCl equiv(n=13).
Zircon U-Pb, O isotopes and mineral inclusions
SIMS zircon U-Pb and oxygen isotope data of the aplite
The zircon U-Pb and oxygen isotope data of the aplite are sum-marized in Table 2 and illustrated in Figs. 8 and 9, respectively.All analytical spots were located on areas with clear CL zona-tion, while sieve textured grains and mineral inclusions richzones were avoided for potential Pb loss (Fig. 7). The U-Pbanalysis was conducted at the same position after oxygen iso-tope analysis. The 37U-Pb analyses plot on or near theWetherillconcordia curve between 140 and 185 Ma (Fig. 8a). These dataare divided into two groups based on their 206Pb/238U age dis-tribution (Fig. 8b). The first group consists of 206Pb/238U agevalues that vary from 140.7 to 156.3 Ma (n=4). The 206Pb/238Uage values from the second group (n=33) range from 165.2 to184.7Ma and show a bimodal distribution (Fig. 8c). No system-atic age variations were observed between the core and rim.
The zircon δ18O values range from 4.2 to 5.5‰ and show apositive skewed asymmetric distribution (Fig. 9). Notably, 18analyses yield an average of 4.85±0.23 ‰ (1 SD) which islower than the recommended mantle value (5.3 ± 0.3 ‰)(Valley et al. 2005), with the remaining 12 analyses withinthe mantle value (average=5.31±0.12 ‰, 1 SD). There isno trend in the δ18O values between the zircon core and rim.
200 250 300 350 400 4500
20
40
60
200 250 300 350 400 4500
20
40
60
200 250 300 350 400 4500
20
40
60
200 250 300 350 400 4500
20
40
60
Sal
inity
(w
t. %
NaC
l equ
iv.)
Sal
inity
(w
t. %
NaC
l equ
iv.)
Sal
inity
(w
t. %
NaC
l equ
i v.)
Sal
inity
(w
t. %
NaC
l equ
i v.)
Homogenization temperature (oC) Homogenization temperature (oC)
Homogenization temperature (oC) Homogenization temperature (oC)
N=10N=8
N=16N=24N=14
N=29N=9
N=4N=18N=27
N=19
age>16.11 Ma age~16.10 Ma
age~16.01 Ma age<15.93 Ma
1
32
456
98 7 12 11 10
3
M-H transition Potassic
Propylitic Phyllic
a
c d
bFig. 6 Th-salinity plots of fluidinclusions from the magmatic-hydrothermal transition stage (a),potassic stage (b), propylitic stage(c) and phyllic stage (d). The agesquoted in the figures are fromquartz-enclosed molybdeniteRe-Os dates obtained in this study(Table 3). Numbers in blueindicate the FIA numberdiscussed in the text
148 Miner Deposita (2017) 52:137–158

Further, there is also no correlation between the 206Pb/238Uage data and the δ18O values.
Zircon-hosted mineral inclusions
The zircon grains from the aplite are characterized by sievetextures and host abundant mineral inclusions that are pre-dominantly in the core of the grains (Fig. 10). In addition torutile and xenotime, feldspar, quartz and fluorapatite are also
frequently observed. Feldspar and quartz (15–40 μm) gener-ally coexist and cross cut the zircon grains.
Molybdenite Re-Os data
Re-Os data are reported at 2 sigma level uncertainty in Table 3and are graphically presented in Fig. 11. The Re-Os data un-certainties are presented with full propagation of the analytical
Table 2 Zircon SIMS U-Pb and oxygen isotope data for the aplite sample
No U Th Th/U f206207Pb/206Pb ±1σ 207Pb/235U ±1σ 206Pb/238U ±1σ rho t207/235 ±1σ t206/238 ±1σ δ18O ±2σ
ppm ppm % % % % Ma abs Ma abs ‰ abs
1 641 489 0.76 1.2 0.04044 3.59 0.15434 3.90 0.02768 1.52 0.39 145.7 5.3 176.0 2.6 5.5 0.25
2 972 1146 1.18 0.3 0.04799 1.48 0.18251 2.15 0.02758 1.56 0.72 170.2 3.4 175.4 2.7 5.1 0.21
3 3092 5055 1.63 0.5 0.04661 1.54 0.18681 2.17 0.02907 1.53 0.70 173.9 3.5 184.7 2.8 5.0 0.17
4 864 539 0.62 0.4 0.04813 1.75 0.18471 2.30 0.02783 1.50 0.65 172.1 3.7 177.0 2.6 4.8 0.22
5 1993 1466 0.74 0.0 0.04991 0.92 0.19948 1.76 0.02899 1.50 0.85 184.7 3.0 184.2 2.7 4.8 0.20
6 1738 1147 0.66 0.4 0.04831 1.36 0.18103 2.15 0.02718 1.66 0.77 168.9 3.3 172.8 2.8 5.3 0.18
7 2286 2007 0.88 0.2 0.04893 0.87 0.18634 1.74 0.02762 1.50 0.86 173.5 2.8 175.6 2.6 4.4 0.26
7 2011 1714 0.85 4.8 0.05215 3.73 0.21109 4.07 0.02936 1.65 0.40 194.5 7.2 186.5 3.0
8 1734 2581 1.49 0.1 0.04892 0.93 0.18085 1.92 0.02681 1.68 0.88 168.8 3.0 170.6 2.8 4.9 0.20
9 1669 2079 1.25 0.1 0.04841 0.87 0.18631 1.75 0.02791 1.52 0.87 173.5 2.8 177.5 2.7 4.6 0.34
10 1824 1686 0.92 0.4 0.04666 1.41 0.16695 2.14 0.02595 1.61 0.75 156.8 3.1 165.2 2.6 4.9 0.25
11 807 575 0.71 0.1 0.04879 1.27 0.19305 1.97 0.02869 1.51 0.76 179.2 3.2 182.4 2.7 5.0 0.25
12 1747 2539 1.45 0.6 0.04616 1.47 0.17562 2.10 0.02759 1.51 0.72 164.3 3.2 175.5 2.6 5.4 0.16
13 3508 5644 1.61 0.2 0.04930 0.94 0.19470 1.78 0.02864 1.51 0.85 180.6 2.9 182.0 2.7 4.8 0.18
13 1816 11,432 6.30 0.3 0.04850 1.06 0.18958 1.84 0.02835 1.50 0.82 176.3 3.0 180.2 2.7
14 316 268 0.85 0.2 0.04854 1.66 0.19106 2.24 0.02855 1.51 0.67 177.5 3.7 181.5 2.7 5.4 0.29
15 3303 6149 1.86 1.5 0.04953 3.02 0.16749 3.41 0.02453 1.59 0.46 157.2 5.0 156.2 2.4 4.4 0.20
16 2283 2911 1.28 0.2 0.04873 1.12 0.15766 5.27 0.02346 5.15 0.98 148.7 7.3 149.5 7.6 5.1 0.24
17 2294 2295 1.00 0.0 0.05001 0.78 0.19960 1.69 0.02895 1.50 0.89 184.8 2.9 183.9 2.7 5.0 0.14
18 1501 3228 2.15 0.2 0.04848 1.02 0.18169 1.81 0.02718 1.50 0.83 169.5 2.8 172.9 2.6 5.0 0.20
18 877 1016 1.16 0.2 0.04922 1.26 0.19208 2.02 0.02831 1.57 0.78 178.4 3.3 179.9 2.8
19 1485 3276 2.21 0.2 0.04812 1.14 0.18217 1.89 0.02746 1.50 0.80 169.9 3.0 174.6 2.6 5.3 0.21
20 1525 2750 1.80 0.1 0.04879 0.78 0.18309 1.92 0.02722 1.76 0.92 170.7 3.0 173.1 3.0 5.2 0.27
20 3278 6720 2.05 0.1 0.04981 0.87 0.18815 1.80 0.02739 1.58 0.88 175.1 2.9 174.2 2.7
21 690 687 1.00 0.3 0.04937 2.74 0.16706 3.93 0.02454 2.82 0.72 156.9 5.7 156.3 4.4 5.4 0.21
22 617 437 0.71 0.1 0.04896 1.31 0.18504 1.99 0.02741 1.50 0.75 172.4 3.2 174.3 2.6 5.3 0.21
23 1186 1213 1.02 1.0 0.04449 2.76 0.16270 3.15 0.02652 1.52 0.48 153.1 4.5 168.7 2.5 4.9 0.19
23 1467 1589 1.08 0.0 0.04977 0.81 0.19465 1.74 0.02837 1.53 0.88 180.6 2.9 180.3 2.7
24 1460 1373 0.94 0.1 0.04916 0.79 0.19130 1.70 0.02822 1.51 0.89 177.7 2.8 179.4 2.7 5.0 0.19
25 2846 2448 0.86 0.2 0.04846 1.49 0.19369 2.23 0.02899 1.66 0.74 179.8 3.7 184.2 3.0 4.9 0.25
26 1290 1724 1.34 0.5 0.04786 1.58 0.17403 2.20 0.02637 1.53 0.69 162.9 3.3 167.8 2.5 5.0 0.16
27 1593 1241 0.78 0.1 0.04852 1.50 0.18355 2.15 0.02744 1.54 0.72 171.1 3.4 174.5 2.7 5.0 0.20
27 2117 1235 0.58 0.0 0.05168 1.45 0.20405 2.59 0.02864 2.15 0.83 188.5 4.5 182.0 3.9
28 891 650 0.73 0.1 0.04939 0.95 0.19137 1.88 0.02810 1.62 0.86 177.8 3.1 178.7 2.9 4.2 0.25
29 334 245 0.73 0.4 0.05077 2.47 0.19109 2.93 0.02730 1.57 0.54 177.6 4.8 173.6 2.7 5.3 0.27
30 577 392 0.68 5.5 0.05429 23.90 0.16522 24.02 0.02207 2.35 0.10 155.3 35.2 140.7 3.3 5.3 0.21
30 599 433 0.72 0.4 0.04963 2.89 0.18113 3.51 0.02647 2.00 0.57 169.0 5.5 168.4 3.3
Miner Deposita (2017) 52:137–158 149

uncertainties without/with the 187Re decay constant uncertain-ty. Rhenium concentrations of the molybdenite samples varyfrom 64 to 324 ppm. As the purity of molybdenite samplesstudied here is better than 95 %, the recorded rhenium con-centration variations relate directly to the abundance in theanalysed molybdenite sample. No relationship between rheni-um concentration and age is observed. The Re-Os dates are inagreement with the relative chronology of the Qulong porphy-ry system: (a) magmatic-hydrothermal transition, (b) potassicalteration, (c) propylitic alteration and (d) phyllic alteration(Fig. 11). Sample 313–145 from the aplite which hosts thesinusoidal quartz veins has a Re-Os model age of 16.10±0.07 [0.08] Ma. Samples 313–460 and 001–640 with potas-sic selvages yield identical Re-Os dates of 16.11±0.06 [0.08]Ma and 16.10±0.07 [0.09] Ma, respectively. Sample 1605–334 with a propylitic selvage has a slightly younger date of16.01±0.06 [0.08] Ma. Two samples (1605–155 and 1605–
33) with phyllic selvages yield further younger dates of 15.93±0.06 [0.08] Ma and 15.88±0.06 [0.08] Ma, respectively. Asthese samples are not cogenetic and indicate a resolvabletimespan, no isochron or weighted average is presented.
Discussion
Geochronology of Qulong
A significant amount of geochronology data (U-Pb, Re-Os,Fig. 12) has been published in an attempt to constrain thetimeframe of the magmatism and mineralization at Qulong.Published zircon 206Pb/238U age data yield a weighted meanof 17.2±0.9Ma (LA-ICP-MS,N=243, 1 SD) (Hu et al. 2015;Zhao et al. 2015) and 16.5±1.1 Ma (SHRIMP, n=38, 1 SD)(Li and Rui 2004; Wang et al. 2006) for the Rongmucuola
30um U-Pb analysis spots and Pb/ Uages206 238 δ18O analysis spots and values170 Ma 4.5
176.0±2.6 Ma5.5±0.3 ‰ 175.4±2.7 Ma
5.1±0.2 ‰184.7±2.8 Ma
5.0±0.2 ‰177.0±2.6 Ma
4.8±0.2 ‰
184.2±2.7 Ma4.8±0.2 ‰
172.8±2.8 Ma5.3±0.2 ‰
175.6±2.6 Ma4.4±0.3 ‰
186.5±3.0 Ma
170.6±2.8 Ma4.9±0.2 ‰
177.5±2.7 Ma4.6±0.3 ‰
165.2±2.6 Ma4.9±0.3 ‰
182.4±2.7 Ma5.0±0.3 ‰
175.5±2.6 Ma5.4±0.2 ‰
182.0±2.7 Ma4.8±0.2 ‰
180.2±2.7 Ma
181.5±2.7 Ma5.4±0.3 ‰
156.2±2.4 Ma4.4±0.2 ‰
149.5±7.6 Ma5.1±0.2 ‰
183.9±2.7 Ma5.0±0.2 ‰
172.9±2.6 Ma5.0±0.2 179.9±2.8 Ma
174.6±2.6 Ma5.3±0.2 ‰
173.1±3.0 Ma5.2±0.3 ‰
174.2±2.7 Ma
156.3±4.4 Ma5.4±0.2 ‰ 174.3±2.6 Ma
5.3±0.2 ‰168.7±2.5 Ma
4.9±0.2 ‰180.3±2.7 Ma
179.4±2.7 Ma5.0±0.2 ‰
184.2±3.0 Ma4.9±0.3 ‰
167.8±2.5 Ma5.0±0.2 ‰ 174.5±2.7 Ma
5.0±0.2 ‰
182.0±3.9 Ma
178.7±2.9 Ma4.2±0.3 ‰
173.6±2.7 Ma5.3±0.3 ‰
168.4±3.3 Ma 140.7±3.3 Ma5.3±0.2 ‰
1 23 4
56
78
9 10 11 12
1314 15
16 17 18 19
20 21 22 23
2425 26 27
302928
Fig. 7 CL images of zircongrains from aplite sample, withSIMS locations, and U-Pb and Oisotope data. Blue numbersindicate the zircon grain numbernoted in the first column ofTable 2
150 Miner Deposita (2017) 52:137–158

pluton (Fig. 12). For the syn-ore P porphyry, zircon206Pb/238U age data yield a weighted mean of 16.3±0.5 Ma(LA-ICP-MS, n= 15, 1 SD) (Zhao et al. 2015) and 17.1± 1.0 Ma (SHRIMP, n=13, 1 SD) (Hou et al. 2004). Thezircon grains from the X porphyry have 206Pb/238U age datathat yield a weighted average of 15.9±0.5 Ma (LA-ICP-MS,
n=18, 1 SD) (Zhao et al. 2015). The post-ore diorite haszircon 206Pb/238U age data that yield a weighted mean of15.7±0.4 Ma (LA-ICP-MS; n=21, 1 SD) (Yang et al. 2015)and 15.3±0.3 Ma (SIMS; n=17, 1 SD) (Zhao et al. 2015).Published Re-Os molybdenite model ages via ICP-MS analy-sis constrain mineralization from 16.85 to 15.36 Ma and havelarge uncertainties (0.19–1.94 Ma) (Meng et al. 2003; Zhenget al. 2004; Li et al. 2005;Wang et al. 2006). The published U-Pb and Re-Os data set (Fig. 12) is suggestive of a prolongedmagmatic-hydrothermal evolution history at Qulong (>3 m.y,Fig. 12). However, the significance of these dates, in terms ofmagmatic-hydrothermal onset and demise, cannot be trulygiven before the systematic difference between the methods(SIMS, SHRIMP, LA-ICP-MS, ICP-MS) and laboratories hasbeen assessed (Von Quadt et al. 2011; Li et al. 2015;Schaltegger et al. 2015). In this case, the weighted mean ofthe 206Pb/238U age for all the zircon grains is certainly not agood estimation for the age of porphyry emplacement(Schoene 2014). Further, the standard deviations associatedwith the analysis also cannot be used to assess the magma
Num
ber
20
16
12
8
4
03.0 4.0 5.0 6.0
Relative probability
Mantle zircon δ18O5.3 ± 0.3 ‰
N=30
4.85 ± 0.23 ‰ 5.31 ± 0.12 ‰
δ18O (V-SMOW,‰)
Fig. 9 Histogram of aplite zircon SIMS oxygen isotope data, with mantlezircon values from Valley et al. (2005). See text for discussion
50 mµ
quartz feldspar fluorapatite
feldspar
feldspar
feldspar
xenotime
rutile
xenotime
MI rich
Fig. 10 Secondary electron image showing the type and distribution ofmineral inclusions in zircon grains from the aplite sample
data-point error ellipses are 2σ
206 238Pb/ U Age (Ma)
Num
ber
195
181.7 ± 1.4 MaN=15, MSWD=3. 3
172.9 ± 1.7 MaN=18, MSWD=6. 1
1851751651550
1
2
3
4
5
6
7
relative probability
0.019
0.021
0.023
0.025
0.027
0.029
0.031
0.033
0.04 0.08 0.12 0.16 0.20 0.24 0.28
140
160
180
200
Age
(Ma)
130
150
170
190
data plotted in Fig. 8C
N=37
206
238
Pb/
U
206 238Pb/ U
box heights are 2σ
a
b
c
Fig. 8 a Concordia plot of the aplite zircon SIMS U-Pb data, bweightedaverage 206Pb/238U age plot and c histogram showing a bimodaldistribution of the 206Pb/238U ages. Note the calculated weighted averagedata in Fig. 8c does not represent geological meaningful ages, butindicates the source of the magma. See text for discussion
Miner Deposita (2017) 52:137–158 151

evolution as there is no assessment for the variation whicheither reflects geological processes or analytical uncertainties.As such, estimating the timescale of magmatism and mineral-ization at Qulong based on these data is impossible and furtherhigh-precision geochronology study is needed (e.g., CA-ID-TIMS; (Chiaradia et al. 2013; Schoene 2014; Schalteggeret al. 2015)).
Given the observation that the aplite units intrude theMiocene Rongmucuola pluton (Fig. 3e) (Yang et al. 2009;Qin et al. 2014) and are truncated by quartz veins with potas-sic selvages (Yang et al. 2009), there should be no doubt that itis coeval or slightly younger than the syn-ore P porphyry.However, zircon SIMS 206Pb/238U age data from the apliteyield concordant Jurassic ages (Fig. 8, 172–182 Ma). Thesezircon grains show clear zonation in CL images (Fig. 7) with-out evidence of contamination from inherent cores, and nosystematic age variations between the core and the rim ofthe zircon grains. In addition, the concordia data sets argueagainst Pb loss; thus, we conclude that the Jurassic dates arenot an analytical manifestation or related to the disturbance ofthe U-Pb system, but in fact indicate there was no zircongrowth during the crystallization of the aplite (Bea et al.2007).
The aplite has been previously suggested to be a quenchproduct of the magma that also produced the P porphyry(Yang et al. 2009). If this is the case, zircons with Jurassiccores should also be observed in the P porphyry unless allthe old, inherited grains have been resorbed. As zircon is well
known for its resistance in most geological conditions, plusthe lack of Jurassic cores documented in zircon grains fromthe P porphyry (Hou et al. 2015), the aplite likely did notoriginate from the same magma as the P porphyry. A possiblescenario is the aplite represents rapid crystallization of a mag-ma derived principally from melting of the Jurassic igneousunits (e.g. the Yeba Formation) during the emplacement of theMiocene intrusions, e.g. during the emplacement of the Pporphyry, and no Miocene zircon growth during its crystalli-zation (Bea et al. 2007).
Although there is no direct constraint for the emplacementage of the aplite, its minimum crystallization age can be brack-eted by a Re-Os age from molybdenite from the aplite unit(16.11±0.06 [0.08] Ma; sample 313–145; this study). Thus,the aplite was formed before the main potassic alteration-mineralization stage, and likely contemporaneous with thefinal crystallization of the P porphyry, with the fluids of thesinusoidal quartz vein hosted by the aplite recording themagmatic-hydrothermal transition (Lindsay et al. 1995).
The sieve textures and quartz-feldspar inclusions (Fig. 10)in the zircon grains of the aplite suggest the aplite experiencedextensive interaction with hydrothermal fluids, e.g. the fluidassociated with the sinusoidal quartz vein. The low δ18Ovalues (4.2–5.0‰, Table 2 and Fig. 9) from the aplite hostedzircon grains suggest these zircon are either crystallized fromlow δ18O magma (Wang et al. 2011), or experienced alterationby low δ18O fluid (Valley 2003). However, subduction-relatedJurassic magmatic rocks in the Gangdese porphyry copperbelt have δ18O values of 5.5–7 ‰, so the low zircon δ18Ovalues may be best explained by low δ18O fluid alteration(Taylor 1968).
The Re-Os dates for molybdenite from quartz veins bearingpotassic, propylitic and phyllic selvages support the relativechronology of the hydrothermal evolution at Qulong (Fig. 11).Molybdenite in veins with potassic selvages yields identicalRe-Os dates of 16.11±0.06 [0.08] Ma and 16.10±0.07 [0.09]Ma, with a slightly younger date (although overlapping withinuncertainty) for the propylitic stage (16.01±0.06 [0.08] Ma),and further younger ages for the phyllic stage (15.93±0.06[0.08] Ma and 15.88±0.06 [0.08] Ma). To date, the Re-Osdates of this study provide the most robust timing constraintsfor the hydrothermal evolution at Qulong, suggesting a
Table 3 Molybdenite Re-Os dataSample # Wt (g) Re (ppm) ± 187Re (ppm) ± 187Os (ppb) ± Age ±a
313-460 0.014 143.32 1.08 90.08 0.39 24.17 0.09 16.11 0.06[0.08]313-145 0.021 64.44 1.94 40.50 0.15 10.86 0.03 16.10 0.07[0.09]001-640 0.010 104.16 1.32 65.47 0.33 17.56 0.08 16.10 0.07[0.09]1605-334 0.039 224.51 1.55 141.11 0.47 37.64 0.10 16.01 0.06[0.08]1605-155 0.018 221.57 1.18 139.26 0.54 36.97 0.12 15.93 0.06[0.08]1605-33 0.012 323.60 2.27 203.39 0.92 53.82 0.22 15.88 0.06[0.08]
a Data are presented with (bracketed value) and without 187 Re decay constant uncertainty (Smoliar et al. (1996);Selby et al. (2007).
15.8
15.9
16.0
16.1
16.2
Age
(M
a)
with decay constant uncertainty
without decay constant uncertainty
313-
145
313-
460
001-
640
1605
-334
1605
-155
1605
-33
potassic
phyllic
propylitic
Fig. 11 Molybdenite Re-Os dates obtained for quartz veins bearingpotassic, propylitic and phyllic selvages
152 Miner Deposita (2017) 52:137–158

maximum duration of 350 kyr, which is much less than theuncertainties of the U-Pb (SHRIMP/LA-ICP-MS) dates forthe P and X porphyry units, and the post-ore diorite.
A potential concern for an underestimation of the mineral-ization lifespan is that molybdenite may have formed entirelyduring the potassic phase, with some veins being overprintedby propylitic and phyllic alteration. However, no evidence ofoverprint/replacement of the molybdenite-bearing veins wasobserved in this study. Furthermore, the agreement of the rel-ative chronology shown by the alteration phases and the Re-Os molybdenite dates coupled with cessat ion ofmineralization/hydrothermal activity represented by the15.88 Ma phyllic assemblages in this study, and a 15.7±0.2 Ma hydrothermal biotite Ar-Ar age (Zhao et al. 2015)argue against a greater duration for hydrothermal activity.
Fluid compositions
The first ice-melting temperature for the majority of the two-phase aqueous fluid inclusions is ≤-23 °C, which indicates thepresence of other chemical species besides NaCl and KCl (e.g.Ca, Fe and Mg) (Sterner and Bodnar 1984; Rusk et al. 2008).As anhydrite has been recognized throughout most of thealteration and mineralization assemblages (Zheng et al.2004; Yang et al. 2009), and is present as daughter mineralsin fluid inclusions (Fig. 5k, l), the fluid should be Ca-rich andoxidized (Xiao et al. 2012). Hematite is also a commonopaque-trapped mineral in the fluid inclusions (Fig. 5m).Therefore, it is reasonable to assume that the fluid contains
Na, K, Ca, Fe, Cu and Mo, with the anions Cl and S. As all ofthe fluid inclusions have first ice-melting temperatures ≥-60 °C, Br and Li are considered as insignificant in regards tothe bulk composition of the hydrothermal fluids (Davis et al.1990). CO2 in LV25–60 fluid inclusions is identified by laserRaman, but liquid CO2 was not observed at room temperature,and clathrate formation was not recorded in this study, thusCO2 only occurs as a minor component (≤3.5 mol%) (Azbejet al. 2007).
The early K-feldspar halos show dissolution textures (e.g.sieve textures, Fig. 4d), with quartz phenocrysts in the P por-phyry exhibiting diagnostic resorbed shapes with embayments(Fig. 3b) (Yang et al. 2009; Qin et al. 2014). This suggests thatthe hydrothermal fluid potentially contains corrosive acid, e.g.hydrofluoric acid (McPhie et al. 2011). Zircon grains from theaplite host abundant fluorapatite inclusions, together with thesieve textures related to hydrothermal alteration as demon-strated by low δ18O values, are highly suggestive of the hy-pothesis that the hydrothermal fluid was fluorine rich. Similarquartz resorption textures have been recognized in Cu–Znskarn at the Empire Mine, Idaho, and are attributed to highfluorine activities during the alteration and mineralization pro-cesses (Chang and Meinert 2004). In addition, fluorine-richfluids have also been proposed to explain the formation ofamoeboid clasts in the Olympic Dam IOCG deposit(McPhie et al. 2011). However, no fluorite has been recog-nized at Qulong (Zheng et al. 2004). This may either reflect alow fluorine concentration in the fluid or fluorite mineralswere dissolved by later stage hydrothermal fluids.
11
13
15
17
19
21
23
box heights are 2σ
Age
(M
a)
LA-ICPMS
17.2±0.9 Ma
Molybdenite Re-Os
16.10±0.35 Ma
dash lines are 1SD of the data
LA-ICPMS16.3±0.5 Ma
LA-ICPMS15.9±0.5 Ma
LA-ICPMS
Rongmucuola pluton P porphyry X porphyry Post-ore diorite Mineralization
uncertainties reported here are at 1SD level
N=243
SHRIMP16.5±1.1 Ma
N=38
N=15
SHRIMP17.1±1.0 Ma
N=13N=18
15.7±0.4 Ma
N=21 SIMS15.3±0.3 Ma
N=17N=16
ID-ICPMS
Zircon dated by LA-ICPMS, SHRIMP or SIMS206 238Pb/ U ages
Molybdenite Re-Osdata in this study
Fig. 12 A compilation of all published zircon U-Pb (SIMS, LA-ICP-MS,SHRIMP, SIMS) and molybdenite Re-Os (ICP-MS) data of the Mioceneunits and mineralization at Qulong. Also shown are the Re-Os dates
obtained in this study. Our SIMS U-Pb zircons dates for the aplite arenot shown as they are all Jurassic. See text for data sources anddiscussion
Miner Deposita (2017) 52:137–158 153

Trapping conditions constraints and depth estimation
Determining the formation depth of a porphyry copper oredeposit is challenging, as such the depth of porphyry ore for-mation for many deposits is not precisely constrained(Seedorff et al. 2005; Rusk et al. 2008). Fluid inclusion stud-ies, however, are widely used to help model ore fluid-trappingpressures and to estimate the formation depths.
Without independent pressure and temperature estimates,the halite-bearing FIA from the potassic alteration stage thatare spatially associated with vapour-rich two-phase fluid in-clusions (Fig. 5i, no. 3 in Fig. 6b) provides the best estimationfor the conditions of ore formation at Qulong. This associationsuggests fluid boiling. Therefore, the homogenization temper-atures (388–405 °C with an average of 398 °C) and homoge-nization pressure (250–290 bar, average of 270 bar) (Steele-MacInnis et al. 2012) of this specific FIA equals the trappingtemperature and pressure, respectively. This trapping pressuresuggests a formation depth of 1 km at lithostatic pressure or2.7 km at hydrostatic pressure, given this sample has a currentdepth of 0.4 km, either 0.6 or 2.3 km erosion occurred follow-ing ore formation.
For the sinusoidal quartz vein that represents the magmatic-hydrothermal transition stage, the liquid-vapour two-phaseFIA (no. 1) yields Th of 350 °C. Typical ductile-brittle transi-tion in high level systems (e.g. porphyry copper deposits),which represents mechanical failure of a magma chamberand release of hydrothermal fluids occurs at temperatures<425 °C (Landtwing et al. 2005; Richards 2011). If we con-sider 425 °C as the uppermost trapping temperature for theFIA in the sinusoidal quartz vein, a ∼0.7 kbar trapping pres-sure is determined (Fig. 13a). This pressure equals to ∼2.7 kmdepth under lithostatic pressure and ∼7 km under hydrostaticpressure. The lithostatic pressure inferred depth is consistentwith the temporally later potassic alteration stage exhibitingboiling under hydrostatic pressure (no. 3, Fig. 13), this indi-cates that the sinusoidal vein was formed under lithostaticpressure.
Assuming trapping at hydrostatic conditions of 2.3–2.7 kmdepth for the rest of the FIAs, we present the best estimates forthe trapping temperatures of fluids associated with potassic,propylitic and phyllic stages (Table 4). For potassic stage sam-ples, the pseudosecondary halite-bearing FIA yields averagetrapping temperature of 425 °C (no. 2, Fig. 13b). Twopseudosecondary vapour-rich two-phase FIAs yield averagetrapping temperature of 390 and 380 °C (nos. 4 and 5,Fig. 13a). Two liquid-vapour two-phase pseudosecondaryFIAs yield average trapping temperature of 360 °C (no. 6,Fig. 13a).
Three pseudosecondary liquid-vapour two-phase FIAsfrom the propylitic alteration stage yield trapping temperaturesof 365 °C (no. 7, Fig. 13a), the pseudosecondary liquid-vapour two-phase FIA gives trapping temperature of 340 °C
(no. 8, Fig. 13a), two pseudosecondary liquid-rich two-phaseFIAs yield a trapping temperature of 290 °C (no. 9, Fig. 13a).For FIAs from the phyl l ic a l te ra t ion s tage , thepseudosecondary liquid-vapour two-phase fluid inclusions
1
0
)rabk(erusser
P
250 300 350
400
4500.5
1
etil ah+) 04( L
) 04(di uqi L
L(40)+V
Th(
L-V
)=T
m H
alite
40 wt. %NaCl equiv.
5 wt. %NaCl equiv.
1
)rabk(erusser
P
0.5
0
200 300 400 500Temperature (oC)
200 300 400 500Temperature (oC)
323
350 400 450
23
46
789
11
2.3-2.9 kmhydrostaticpressure
~2.7 kmlithostaticpressure
1
0
)rabk(erusser
P
0.5
200 300 400 500Temperature (oC)
2.3-2.9 kmhydrostaticpressure
~2.7 kmlithostaticpressure
>16.11 MaM-H transition
~16.10 MaPotassic
~16.01 MaPropylitic
<15.93 MaPhyllic
Potassic
5
phyllic
2.3-2.9 kmhydrostaticpressure
10 M-H transitionPotassic
PhyllicPropylitic
12
pressure releasechamber mechanical failure?
a
b
c
Fig. 13 Trapping pressure and temperature of hydrothermal fluids atQulong associated with the magmatic-hydrothermal transition, potassic,propylitic and phyllic alteration and mineralization stages: a Isochores fora 5 wt%NaCl equiv system and b 40 wt%NaCl equiv NaCl-H2O system(Samson et al. 2003). Hydrostatic and lithostatic pressures are calculatedbased on fluid and rock densities of 1 and 2.6 g/cm3, respectively.Numbers at coloured star symbol indicate the FIA number discussed inthe text. c Fluid pressure-temperature evolution of Qulong
154 Miner Deposita (2017) 52:137–158

yield a trapping temperature of 345 °C (nos. 10, Fig. 13a),while the pseudosecondary liquid-rich two-phase ones yielda trapping temperature of 310 and 285 °C (no. 11 and 12,Fig. 13a).
The fluid inclusion data presented here suggests the transi-tion between lithostatic and hydrostatic pressure occurred atthe initial stages of ore formation. The temperature at themagmatic-hydrothermal transition stage (425 °C) is signifi-cantly lower than that (573 °C) predicted by Yang et al.(2009). This may suggest meteoric water involvement duringthe crystallization of the aplite, as indicated by the low δ18Ovalues recorded in zircons within the aplite. During the min-eralization process, the fluid pressure remained broadly simi-lar, with temperatures decreasing from potassic to phyllicstages. The very steady fluid pressure at hydrostatic condi-tions during the mineralization process indicates that theQulong system experienced mechanical failure of the magmachamber before the mineralization processes, e.g. explosivepressure release marked by the breccia pipes (Fig. 2).
In addition, our data suggests a minimum ∼2.3 km of ero-sion since the formation of Qulong. This amount of erosion is,however, in contrast with current estimates that state there has
been no significant regional uplift or erosion in central Tibetsince the Miocene (Rowley and Currie 2006). Nevertheless,our fluid inclusion data, coupled with the absence of Miocenevolcanism at Qulong, which is commonly observed in por-phyry systems formed in extensional environments (Sillitoe2010), is indicative of appreciable erosion in the Qulong area.Further, the exposure of several other Miocene porphyry sys-tems near Qulong without Miocene volcanic units (e.g. Jiamaand Lakang’e; Fig. 1) may indicate that ∼2 km of erosion ismore widespread than previously considered.
Conclusion
Molybdenite Re-Os dating confirms that the bulk Cu and Momineralization at Qulong occurred between 16.10 ± 0.06[0.08]Ma and 15.88±0.06 [0.08]Ma (bracketed value is with187Re decay constant uncertainty). This timeframe is muchless than the uncertainties of published U-Pb and Re-Os data.Though the published geochronology data seems to suggest along-lived intrusive episode of the Miocene granodioritic tomonzonitic rocks at Qulong, it is impossible to use the
Table 4 Fluid inclusionassemblages (FIAs) and theirrespective microthermometricdata temperatures
FIA No. Characteristics Homogenized to ThomogenizationoC
Salinity
wt% NaClequiv
Ttrapping°C
Magmatic-hydrothermal transition
1 Liquid–vapour two-phase andvapour-rich two-phase fluidinclusions
Liquid 340–360 °C 2–6 wt% 425
Potassic alteration stage
2 Halite-bearing fluid inclusions Liquid 419–436 50–52 wt% 425
3 Halite-bearing fluid inclusionsand vapour-rich two-phasefluid inclusions
Halite dissolution
Vapour
388–405 41–45 wt%
4–7 wt%
398
4 Vapour-rich two-phasefluid inclusions
Liquid 385–400 1–6 wt% 390
5 Vapour-rich two-phasefluid inclusions
Liquid 360–370 1–6 wt% 380
6 Liquid–vapour two-phasefluid inclusions,
Liquid 335–355 2–7 wt% 360
Propylitic alteration stage
7 Liquid–vapour two-phasefluid inclusions
Liquid 335–360 1–7 wt% 365
8 Liquid–vapour two-phasefluid inclusions
Liquid 318–332 2–7 wt% 340
9 Liquid-rich two-phasefluid inclusions
Liquid 270–290 2–11 wt% 290
Phyllic alteration stage
10 Liquid–vapour two-phasefluid inclusions
Liquid 325–340 2–8 wt% 345
11 Liquid-rich two-phasefluid inclusions
Liquid 295–310 3–9 wt% 310
12 Liquid-rich two-phasefluid inclusions
Liquid 265–290 1–8 wt% 285
Miner Deposita (2017) 52:137–158 155

weighted mean and uncertainty to address the emplacementage and duration of magmatism until high-precision data isavailable (e.g. zircon CA-ID-TIMS).
The purely Jurassic-aged zircons in the syn-ore aplitepossessing a low-oxygen isotope composition (4.85 ± 0.23‰) and sieve textures and mineral inclusions (quartz, feldsparand fluorapatite) indicate that the aplite is a remelt of Jurassicrocks which crystallized rapidly during the emplacement ofthe P porphyry, with involvement of meteoric fluid.
The ore-forming fluid contains Na, K, Ca, Fe, Cu and Mo,along with Cl and S. Fluorine is also an essential componentas demonstrated by the presence of fluorapatite in zircongrains, as well as the dissolution textures of K-feldspar fromthe potassic stage and quartz phenocrysts in the P porphyry.Fluid inclusion study confirms the magmatic-hydrothermaltransition occurred at ∼425 °C under lithostatic pressure,while potassic, propylitic and phyllic alteration occurred athydrostatic pressure with temperature progressively decreas-ing from 425 to 280 °C. The fluid inclusion data presentedhere suggest the Qulong porphyry system was formed at apaleo depth of ∼2.7 km. This implies that ∼2.3 km of erosionhas occurred at Qulong after its formation, which may berelated with regional uplift in the Lhasa terrane.
Acknowledgments The authors thank You-Ye Zheng and Guang-WuJiang for access to Qulong. Jia Chang and Rui Wang assisted with thefieldwork.We would like to thank Jeremy Richards for his invaluable andconstructive suggestions in clarifying various aspects regarding data pre-sentation and interpretation. We appreciate Kate Horan, MassimoChiaradia, Jing-Jing Zhu, Bernd Lehmann and Rui-Zhong Hu for theirinsightful comments and editorial handling. YL received financial sup-port from Durham University, China Scholarship Council, Society ofEconomic Geologists, International Association of Geochemistry, andthe Geological Society of London. DS acknowledges the support of theTOTAL endowment fund.
References
Aitchison JC, Ali JR, Davis AM (2007) When and where did India andAsia collide? J Geophys Res 112:1–19. doi:10.1029/2006jb004706
Ali JR, Aitchison JC (2008) Gondwana to Asia: plate tectonics, paleoge-ography and the biological connectivity of the Indian sub-continentfrom the Middle Jurassic through latest Eocene (166–35 Ma). EarthSci Rev 88:145–166. doi:10.1016/j.earscirev.2008.01.007
Audetat A, Gunther D, Heinrich CA (1998) Formation of a magmatic-hydrothermal ore deposit: insights with LA-ICP-MS analysis of flu-id inclusions. Science 279:2091–2094. doi:10.1126/science.279.5359.2091
Azbej T, Severs MJ, Rusk BG, Bodnar RJ (2007) In situ quantitativeanalysis of individual H2O-CO2 fluid inclusions by laser Ramanspectroscopy. Chem Geol 237:255–263. doi:10.1016/j.chemgeo.2006.06.025
Baumgartner M, Bakker RJ, Doppler G (2014) Re-equilibration of natu-ral H2O-CO2-salt-rich fluid inclusions in quartz-Part 1: experimentsin pure water at constant pressures and differential pressures at 600oC. Contrib Mineral Petrol 168:1–14. doi:10.1007/s00410-014-1017-3
Bea F, Montero P, Gonzalez-Lodeiro F, Talavera C (2007) Zircon inher-itance reveals exceptionally fast crustal magma generation processesin central iberia during the cambro-ordovician. J Petrol 48:2327–2339. doi:10.1093/petrology/egm061
Bodnar RJ, Vityk MO (1994) Interpretation of microthermometric datafor H2O-NaCl fluid inclusions. In: De Vivo B, Frezzotti ML (eds)Fluid inclusions in minerals: Methods and applications. VirginiaTech, Blacksburg, pp 117–130
Bodnar RJ, Lecumberri-Sanchez P, Moncada D, Steele-MacInnis M(2014) 13.5—Fluid inclusions in hydrothermal ore deposits. In:Turekian HDHK (ed) Treatise on Geochemistry, Second Editionthedn. Elsevier, Oxford, pp 119–142
Burke EAJ (2001) Raman microspectrometry of fluid inclusions. Lithos55:139–158. doi:10.1016/S0024-4937(00)00043-8
Cathles LM, Erendi AHJ, Barrie T (1997) How long can a hydrothermalsystem be sustained by a single intrusive event? Econ Geol 92:766–771. doi:10.2113/gsecongeo.92.7-8.766
Chang ZS, Meinert LD (2004) The magmatic-hydrothermal transition—evidence from quartz phenocryst textures and endoskarn abundancein Cu-Zn skarns at the Empire Mine, Idaho, USA. Chem Geol 210:149–171. doi:10.1016/j.chemgeo.2004.06.018
Chiaradia M, Schaltegger U, Spikings R, Wotzlaw J-F, Ovtcharova M(2013) How accurately can we date the duration of magmatic-hydrothermal events in porphyry systems?—An invited paper.Econ Geol 108:565–584
Chiaradia M, Schaltegger U, Spikings R (2014) Time scales of mineralsystems—advances in understanding over the past decade. SocEcon Geol Spec p 37–58.
Cooke DR, Hollings P, Walsh JL (2005) Giant porphyry deposits: char-acteristics, distribution, and tectonic controls. Econ Geol 100:801–818. doi:10.2113/100.5.801
Cooke DR, Hollings P, Wilkinson JJ, Tosdal RM (2014) 13.14—Geochemistry of porphyry deposits. In: Turekian HDHK (ed)Treatise on Geochemistry, Second Editionth edn. Elsevier, Oxford,pp 357–381
Creaser RA, Papanastassiou DA, Wasserburg GJ (1991) Negative ther-mal ion mass-spectrometry of osmium, rhenium, and iridium.Geochim Cosmochim Acta 55:397–401. doi:10.1016/0016-7037(91)90427-7
Davis DW, Lowenstein TK, Spencer RJ (1990) Melting behavior of fluidinclusions in laboratory-grown halite crystals in the systems NaCl-H2O, NaCl-KCl-H2O, NaCl-MgCl2-H2O, and NaCl-CaCl2-H2O.Geochim Cosmochim Acta 54:591–601. doi:10.1016/0016-7037(90)90355-O
Goldstein RH, Reynolds TJ (1994) Systematics of fluid inclusions indiagenetic minerals. SEPM (Society for Sedimentary Geology),USA
Hou ZQ, Gao YF, Qu XM, Rui ZY, Mo XX (2004) Origin of adakiticintrusives generated during mid-Miocene east–west extension insouthern Tibet. Earth Planet Sci Lett 220:139–155. doi:10.1016/S0012-821x(04)00007-X
Hou ZQ, Yang ZM, Qu XM,Meng XJ, Li ZQ, Beaudoin G, Rui ZY, GaoYF, Zaw K (2009) The Miocene Gangdese porphyry copper beltgenerated during post-collisional extension in the Tibetan Orogen.Ore Geol Rev 36:25–51. doi:10.1016/j.oregeorev.2008.09.006
Hou ZQ, Yang ZM, Lu YJ, Kemp A, Zheng YC, Li QY, Tang JX, YangZS, Duan LF (2015) A genetic linkage between subduction- andcollision-related porphyry Cu deposits in continental collisionzones. Geology 43:247–250. doi:10.1130/G36362.1
Hu YB, Liu JQ, Ling MX, DingW, Liu Y, Zartman RE, Ma XF, Liu DY,ZhangCC, Sun SJ, Zhang LP,WuK, SunWD (2015) The formationof Qulong adakites and their relationship with porphyry copper de-posit: Geochemical constraints. Lithos 220:60–80. doi:10.1016/j.lithos.2014.12.025
Landtwing MR, Pettke T, Halter WE, Heinrich CA, Redmond PB,Einaudi MT, Kunze K (2005) Copper deposition during quartz
156 Miner Deposita (2017) 52:137–158

dissolution by cooling magmatic-hydrothermal fluids: the Binghamporphyry. Earth Planet Sci Lett 235:229–243. doi:10.1016/j.epsl.2005.02.046
Lawley CJM, Selby D (2012) Re-Os geochronology of quartz-enclosedultrafine molybdenite: implications for ore geochronology. EconGeol 107:1499–1505
Li GM, Rui ZY (2004) Diagenetic andmineralization ages for the porphyrycopper deposits in the Gangdise Metallogenic Belt, Southern Xizang.Geotecton Metallog 28:165–170 (In Chinese with English Abstract)
Li GM, Liu B, Qu WJ, Lin FC, Yu HQ, Feng CY (2005) The porphyry-skarn ore- forming system in Gangdese Metallogenic Belt, southernXizang: Evidence from molybdenite Re-Os age of porphyry- typecopper deposits and skarn- type copper polymetallic deposits.Geotecton Metallog 29:482–490 (In Chinese with English Abstract)
Li XH, Liu Y, Li QL, Guo CH, Chamberlain KR (2009) Precise determi-nation of Phanerozoic zircon Pb/Pb age by multicollector SIMSwithout external standardization. Geochem Geophys Geosyst 10:1–21. doi:10.1029/2009gc002400
Li XH, Li WX, Li QL, Wang XC, Liu Y, Yang YH (2010a) Petrogenesisand tectonic significance of the similar to 850MaGangbian alkalinecomplex in South China: evidence from in situ zircon U-Pb dating,Hf-O isotopes and whole-rock geochemistry. Lithos 114:1–15. doi:10.1016/j.lithos.2009.07.011
Li XH, LongWG, Li QL, Liu Y, Zheng YF, Yang YH, Chamberlain KR,Wan DF, Guo CH, Wang XC, Tao H (2010b) Penglai zirconmegacrysts: a potential new working reference material for micro-beam determination of Hf-O isotopes and U-Pb age. GeostandGeoanal Res 34:117–134. doi:10.1111/j.1751-908X.2010.00036.x
Li XH, Tang GQ, Gong B, Yang YH, Hou KJ, Hu ZC, Li QL, Liu Y, LiWX (2013) Qinghu zircon: a working reference for microbeamanalysis of U-Pb age and Hf and O isotopes. Chin Sci Bull 58:4647–4654. doi:10.1007/s11434-013-5932-x
Li XH, Liu XM, Liu YS, Su L, Sun WD, Huang HQ, Yi K (2015)Accuracy of LA-ICPMS zircon U-Pb age determination: an inter-laboratory comparison. Sci China Earth Sci 58:1722–1730. doi:10.1007/s11430-015-5110-x
Lindsay DD, Zentilli M, Rivera JRDL (1995) Evolution of an activeductile to brittle shear system controlling mineralization at thechuquicamata porphyry copper deposit, Northern Chile. Int GeolRev 37:945–958. doi:10.1080/00206819509465434
Ludwig KR (2003) User’s manual for Isoplot 3.00: a geochronologicaltoolkit for Microsoft Excel. Kenneth R. Ludwig.
McPhie J, Kamenetsky V, Allen S, Ehrig K, Agangi A, Bath A (2011)The fluorine link between a supergiant ore deposit and a silicic largeigneous province. Geology 39:1003–1006. doi:10.1130/G32205.1
Meng XJ, Hou ZQ, Gao YF, Huang W, Qu XM, Qu WJ (2003) Re-Osdating for molybdenite from Qulong porphyry copper deposit inGangdese metallogenic Belt, Xizangand its metallogenic signifi-cance. Geol Rev 49:660–666 (In Chinese with English Abstract)
Mercer CN, Reed MH, Mercer CM (2015) Time scales of porphyry cudeposit formation: insights from titanium diffusion in quartz. EconGeol 110:587–602
Qin KZ, Xia DX, Li GM, Xiao B, Duo J, Jiang GW, Zhao JX (2014)Qulong Porphyry-Skarn Cu-Mo Deposit, Tibet. Science Press,Beijing (In Chinese)
Richards JP (2009) Postsubduction porphyry Cu-Au and epithermal Audeposits: products of remelting of subduction-modified lithosphere.Geology 37:247–250. doi:10.1130/G25451a.1
Richards JP (2011)Magmatic to hydrothermal metal fluxes in convergentand collided margins. Ore Geol Rev 40:1–26. doi:10.1016/j.oregeorev.2011.05.006
Richards JP (2013) Giant ore deposits formed by optimal alignments andcombinations of geological processes. Nat Geosci 6:911–916. doi:10.1038/NGEO1920
Roedder E (1984) Fluid Inclusions. US Mineralogical Society ofAmerica, USA
Rowley DB (1996) Age of initiation of collision between India and Asia:a review of stratigraphic data. Earth Planet Sci Lett 145:1–13. doi:10.1016/S0012-821x(96)00201-4
Rowley DB, Currie BS (2006) Palaeo-altimetry of the late Eocene toMiocene Lunpola basin, central Tibet. Nature 439:677–681. doi:10.1038/nature04506
Rusk BG, Reed MH, Dilles JH (2008) Fluid inclusion evidence formagmatic-hydrothermal fluid evolution in the porphyry copper-molybdenum deposit at Butte, Montana. Econ Geol 103:307–334.doi:10.2113/gsecongeo.103.2.307
Samson I, Anderson A, Marshall D (2003) Fluid inclusions: analysis andinterpretation. Mineralogical Association of Canada, Canada
Schaltegger U, Schmitt AK, Horstwood MSA (2015) U-Th-Pb zircongeochronology by ID-TIMS, SIMS, and laser ablation ICP-MS:Recipes, interpretations, and opportunities. Chem Geol 402:89–110. doi:10.1016/j.chemgeo.2015.02.028
Schoene B (2014) 4.10 - U–Th–Pb Geochronology. In: Turekian HDHK(ed) Treatise on Geochemistry, Second Editionth edn. Elsevier,Oxford, pp 341–378
Seedorff E, Dilles J, Proffett J, Einaudi M, Zurcher L, Stavast W, JohnsonD, Barton M (2005) Porphyry deposits: characteristics and origin ofhypogene features. Econ Geol 29:251–298, 100th Anniversary
Selby D, Creaser RA (2001) Re-Os geochronology and systematics inmolybdenite from the Endako porphyry molybdenum deposit,British Columbia, Canada. Econ Geol Bull Soc Econ Geol 96:197–204. doi:10.2113/96.1.197
Selby D, Creaser RA, Stein HJ, Markey RJ, Hannah JL (2007)Assessment of the 187Re decay constant by cross calibration of Re-Os molybdenite and U-Pb zircon chronometers in magmatic oresystems. Geochim Cosmochim Acta 71:1999–2013. doi:10.1016/j.gca.2007.01.008
Sillitoe RH (2010) Porphyry copper systems. Econ Geol 105:3–41Sillitoe RH, Mortensen JK (2010) Longevity of porphyry copper forma-
tion at Quellaveco, Peru. Econ Geol 105:1157–1162. doi:10.2113/econgeo.105.6.1157
Simmons SF, Brown KL (2006) Gold in magmatic hydrothermal solu-tions and the rapid formation of a giant ore deposit. Science 314:288–291. doi:10.1126/science.1132866
Simmons SF, Brown KL (2007) The flux of gold and related metalsthrough a volcanic arc, Taupo Volcanic Zone, New Zealand.Geology 35:1099–1102. doi:10.1130/G24022a.1
Sláma J, Košler J, Condon DJ, Crowley JL, Gerdes A, Hanchar JM,Horstwood MS, Morris GA, Nasdala L, Norberg N (2008)Plešovice zircon—a new natural reference material for U–Pb andHf isotopic microanalysis. Chem Geol 249:1–35
Smoliar MI, Walker RJ, Morgan JW (1996) Re-Os ages of group IIA,IIIA, IVA, and IVB iron meteorites. Science 271:1099–1102. doi:10.1126/science.271.5252.1099
Spencer ET, Wilkinson JJ, Creaser RA, Seguel J (2015) The distributionand timing of molybdenite mineralization at the El Teniente Cu-MoPorphyry Deposit, Chile. Econ Geol 110:387–421. doi:10.2113/econgeo.110.2.387
Stacey J, Kramers J (1975) Approximation of terrestrial lead isotopeevolution by a two-stage model. Earth Planet Sci Lett 26:207–221
Steele-MacInnis M, Lecumberri-Sanchez P, Bodnar RJ (2012)HOKIEFLINCS_H2O-NaCl: a Microsoft Excel spreadsheet forinterpreting microthermometric data from fluid inclusions basedon the PVTX properties of H2O-NaCl. Comput Geosci 49:334–337. doi:10.1016/j.cageo.2012.01.022
Sterner SM, Bodnar RJ (1984) Synthetic fluid inclusions in natural quartzI. Compositional types synthesized and applications to experimentalgeochemistry. Geochim Cosmochim Acta 48:2659–2668
Taylor HP Jr (1968) The oxygen isotope geochemistry of igneous rocks.Contrib Mineral Petrol 19:1–71
Valley JW (2003) Oxygen isotopes in zircon. Zircon 53:343–385. doi:10.2113/0530343
Miner Deposita (2017) 52:137–158 157

Valley JW, Lackey JS, Cavosie AJ, Clechenko CC, Spicuzza MJ, BaseiMAS, Bindeman IN, Ferreira VP, Sial AN, King EM, Peck WH,Sinha AK, Wei CS (2005) 4.4 billion years of crustal maturation:oxygen isotope ratios of magmatic zircon. Contrib Mineral Petrol150:561–580. doi:10.1007/s0Landtwing0410-005-0025-8
Van Hinsbergen DJ, Lippert PC, Dupont-Nivet G, McQuarrie N,Doubrovine PV, Spakman W, Torsvik TH (2012) Greater IndiaBasin hypothesis and a two-stage Cenozoic collision betweenIndia and Asia. Proc Natl Acad Sci 109:7659–7664
Von Quadt A, Erni M, Martinek K, Moll M, Peytcheva I, Heinrich CA(2011) Zircon crystallization and the lifetimes of ore-forming mag-matic-hydrothermal systems. Geology 39:731–734
Wang LL, Mo XX, Li B, Dong GC, Zhao ZD (2006) Geochronology andgeochemistry of the ore-bearing porphyry in Qulong Cu (Mo) oredeposit, Tibet. Acta Petrol Sin 22:1001–1008 (In Chinese withEnglish Abstract)
Wang XC, Li ZX, Li XH, Li QL, Tang GQ, Zhang QR, Liu Y (2011)Nonglacial origin for low-δ18O Neoproterozoic magmas in theSouth China Block: evidence from new in-situ oxygen isotope anal-yses using SIMS. Geology 39:735–738
Wang R, Richards JP, Hou ZQ, Yang ZM (2014a) Extent of underthrust-ing of the Indian plate beneath Tibet controlled the distribution ofMiocene porphyry Cu-Mo±Au deposits. Mineral Deposita 49:165–173. doi:10.1007/s00126-013-0507-y
Wang R, Richards JP, Hou ZQ, Yang ZM, Gu ZB, DuFrane SA (2014b)Increasing magmatic oxidation state from paleocene to miocene inthe eastern Gangdese Belt, Tibet: implication for collision-relatedporphyry Cu-Mo ±Au mineralization. Econ Geol 109:1943–1965
Wang R, Richards JP, L-m Z, Z-q H, Stern RA, Creaser RA, Zhu J-j(2015) The role of Indian and Tibetan lithosphere in spatial distri-bution of Cenozoic magmatism and porphyry Cu–Mo deposits inthe Gangdese belt, southern Tibet. Earth Sci Rev 150:68–94. doi:10.1016/j.earscirev.2015.07.003
Webber KL, Simmons WB, Falster AU, Foord EE (1999) Cooling ratesand crystallization dynamics of shallow level pegmatite-aplite dikes,San Diego County, California. Am Mineral 84:708–717
Weis P, Driesner T, Heinrich CA (2012) Porphyry-copper ore shells format stable pressure-temperature fronts within dynamic fluid plumes.Science 338:1613–1616. doi:10.1126/science.1225009
Wilkinson JJ (2001) Fluid inclusions in hydrothermal ore deposits. Lithos55:229–272. doi:10.1016/S0024-4937(00)00047-5
Xiao B, Qin KZ, Li GM, Li JX, Xia DX, Chen L, Zhao JX (2012) Highlyoxidized magma and fluid evolution of Miocene Qulong giant
porphyry Cu-Mo deposit, southern Tibet, China. Resour Geol 62:4–18. doi:10.1111/j.1751-3928.2011.00177.x
Yang ZM, Hou ZQ, Li ZQ, Song YC, Xie YL (2008a) Direct record ofprimary fluid exsolved from magma: Evidence from unidirectionalsolidification texture (UST) in quartz found in Qulong porphyrycopper deposit, Tibet. Mineral Deposits 27:188–199 (In Chinesewith English Abstract)
Yang ZM, Hou ZQ, Xia DX, Song YC, Li Z (2008b) Relationship be-tween Western Porphyry and mineralization in Qulong copper de-posit of Tibet and its enlightenment to further exploration. MineralDeposits 27:28–36 (In Chinese with English Abstract)
Yang ZM, Hou ZQ, White NC, Chang ZS, Li ZQ, Song YC (2009)Geology of the post-collisional porphyry copper-molybdenum de-posit at Qulong, Tibet. Ore Geol Rev 36:133–159. doi:10.1016/j.oregeorev.2009.03.003
Yang ZM, Lu YJ, Hou ZQ, Chang ZS (2015) High-mg diorite fromQulong in southern Tibet: implications for the genesis of adakite-like intrusions and associated porphyry Cu deposits in collisionalorogens. J Petrol 56:227–253. doi:10.1093/petrology/egu076
Zhang ZM, Dong X, Santosh M, Zhao GC (2014) Metamorphism andtectonic evolution of the Lhasa terrane, Central Tibet. GondwanaRes 25:170–189. doi:10.1016/j.gr.2012.08.024
Zhao JX, Qin KZ, Xiao B, McInnes B, Li GM, Evans N, Cao MJ, Li JX(2015) Thermal history of the giant Qulong Cu–Mo deposit,Gangdese metallogenic belt, Tibet: constraints on magmatic–hydro-thermal evolution and exhumation. Gondwana Res. doi:10.1016/j.gr.2015.07.005
Zheng YY, Xue YX, Cheng LJ, Fan ZH, Gao SB (2004) Finding, char-acteristics and significances of Qulong superlarge porphyry copper(molybdenum) deposit, Tibet. Earth Sci Rev 29:103–108 (InChinese with English Abstract)
Zhu DC, Zhao ZD, Niu YL, Dilek Y, Mo XX (2011a) Lhasa terrane insouthern Tibet came from Australia. Geology 39:727–730. doi:10.1130/G31895.1
Zhu DC, Zhao ZD, Niu YL, Mo XX, Chung SL, Hou ZQ,Wang LQ,WuFY (2011b) The Lhasa Terrane: record of a microcontinent and itshistories of drift and growth. Earth Planet Sci Lett 301:241–255. doi:10.1016/j.epsl.2010.11.005
Zimmerman A, Stein HJ, Morgan JW, Markey RJ, Watanabe Y (2014)Re–Os geochronology of the El Salvador porphyry Cu–Mo deposit,Chile: tracking analytical improvements in accuracy and precisionover the past decade. GeochimCosmochimActa 131:13–32. doi:10.1016/j.gca.2014.01.016
158 Miner Deposita (2017) 52:137–158
Related Documents