N, P & K OUTLOOK Fluid Fertilizer Foundation Fresno, California December 7, 2011 Presenter: Jay Yost, Vice President Fertilizer

Welcome message from author
This document is posted to help you gain knowledge. Please leave a comment to let me know what you think about it! Share it to your friends and learn new things together.
Transcript
N, P & K
OUTLOOK Fluid Fertilizer Foundation
Fresno, California December 7, 2011
Presenter: Jay Yost, Vice President Fertilizer
0
2
4
6
8
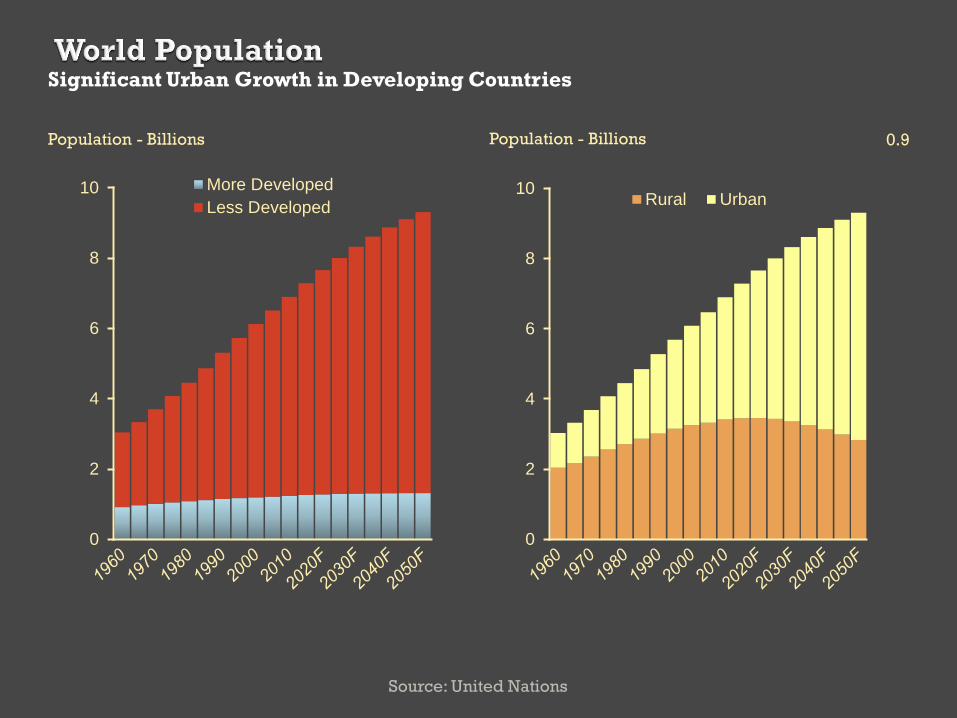
10 More Developed
Less Developed
Source: United Nations
Population - Billions 0.9
Significant Urban Growth in Developing Countries
0
2
4
6
8
10Rural Urban
Population - Billions
1.4
1.5
1.6
1.7
1.8
1.9
00 01 02 03 04 05 06 07 08 09 10E 11F
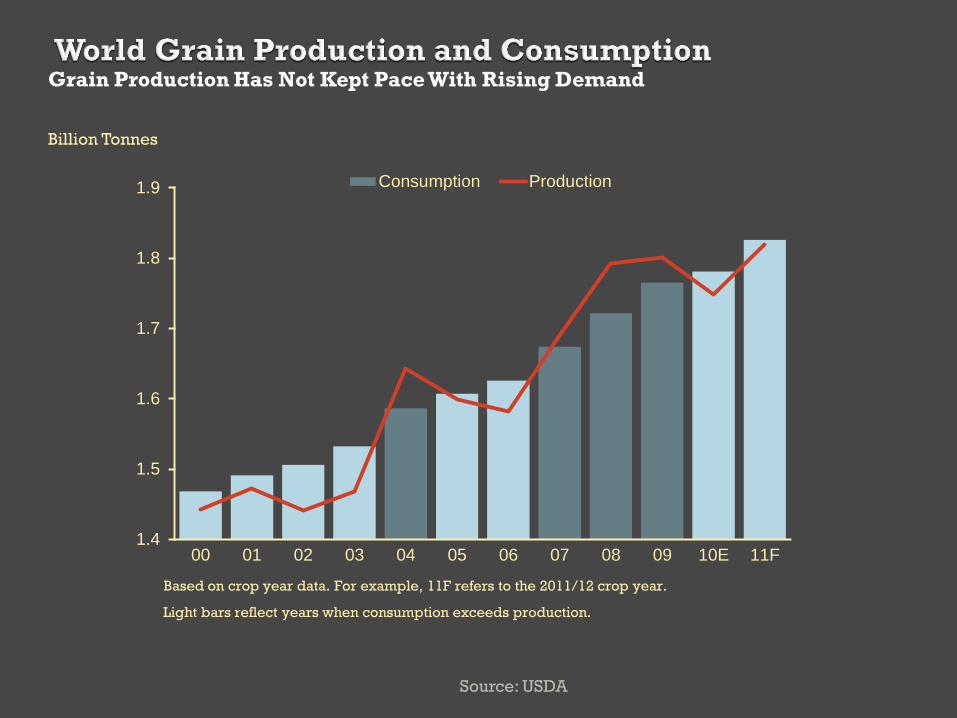
Consumption Production
Source: USDA
Billion Tonnes
Grain Production Has Not Kept Pace With Rising Demand
Based on crop year data. For example, 11F refers to the 2011/12 crop year.
Light bars reflect years when consumption exceeds production.
10
15
20
25
30
35
40
86 88 90 92 94 96 98 00 02 04 06 08 10E 12F
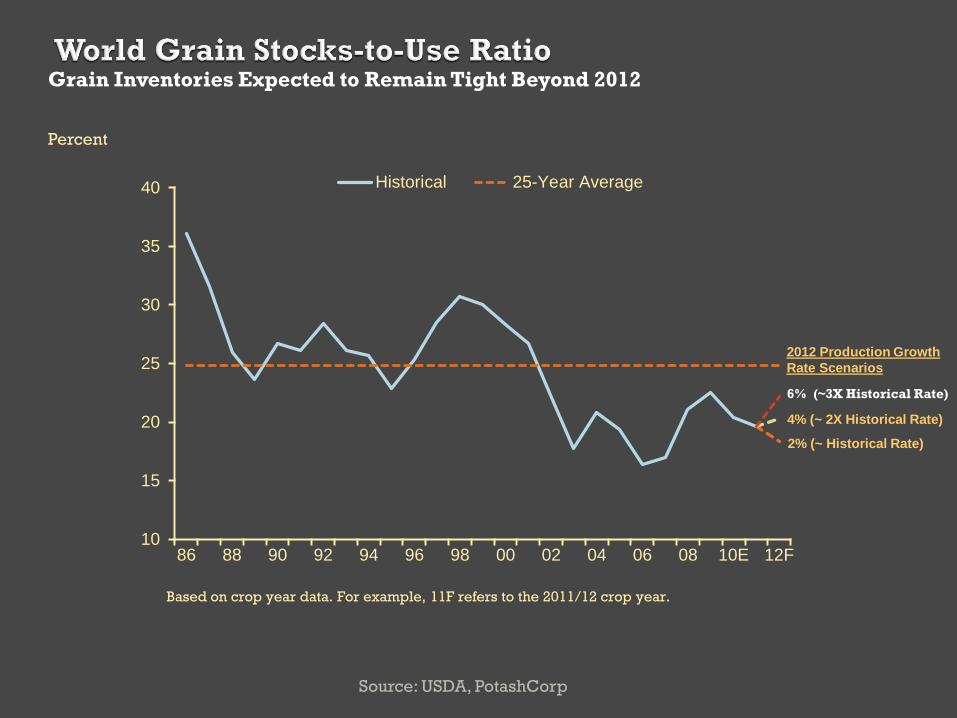
Historical 25-Year Average
Source: USDA, PotashCorp
Percent
Grain Inventories Expected to Remain Tight Beyond 2012
Based on crop year data. For example, 11F refers to the 2011/12 crop year.
4% (~ 2X Historical Rate)
6% (~3X Historical Rate)
2% (~ Historical Rate)
2012 Production Growth
Rate Scenarios

0
5
10
15
20
25
2001 2003 2005 2007 2009 2011F
Historical 10-Year Average
Billion Bushels Stocks-to-Use - Percent
Source: USDA
Corn Stocks Reduced to Historically Low Levels
8
9
10
11
12
13
14
2001 2003 2005 2007 2009 2011F
Production Consumption
2011F refers to the 2011/12 crop year
2
3
4
5
6
7
8
Jan-10 Jul-10 Jan-11 Jul-11
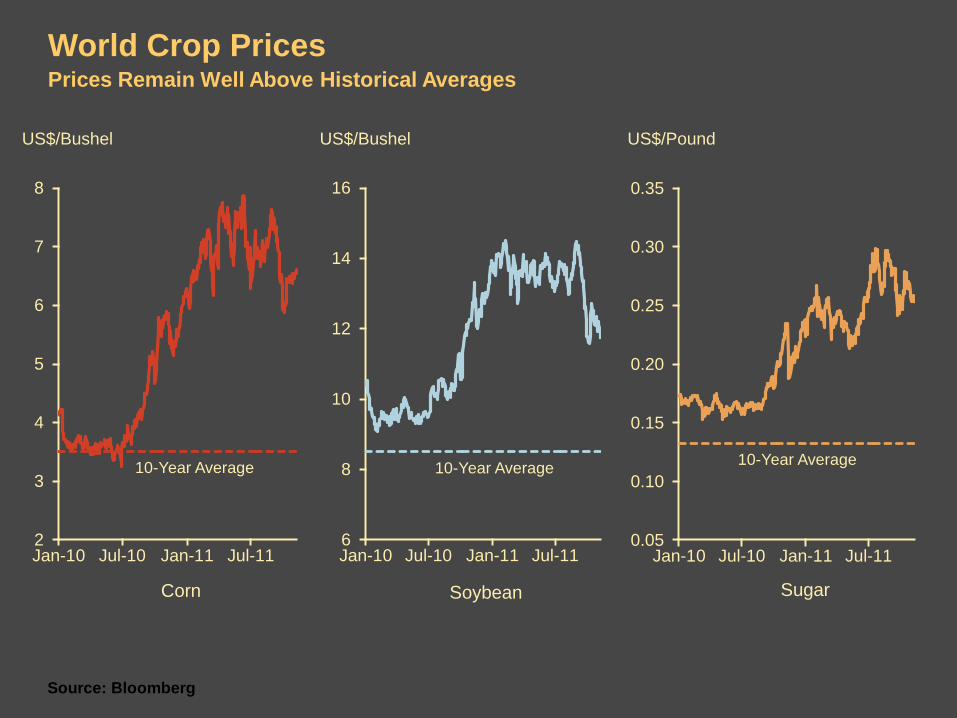
Source: Bloomberg
World Crop Prices Prices Remain Well Above Historical Averages
US$/Bushel US$/Pound
6
8
10
12
14
16
Jan-10 Jul-10 Jan-11 Jul-11
US$/Bushel
10-Year Average
Corn Soybean Sugar
10-Year Average
0.05
0.10
0.15
0.20
0.25
0.30
0.35
Jan-10 Jul-10 Jan-11 Jul-11
10-Year Average

Source: USDA, IPNI, PotashCorp
Percent
Expect Fertilizer Cost Percentage Will Remain Below Historical Levels
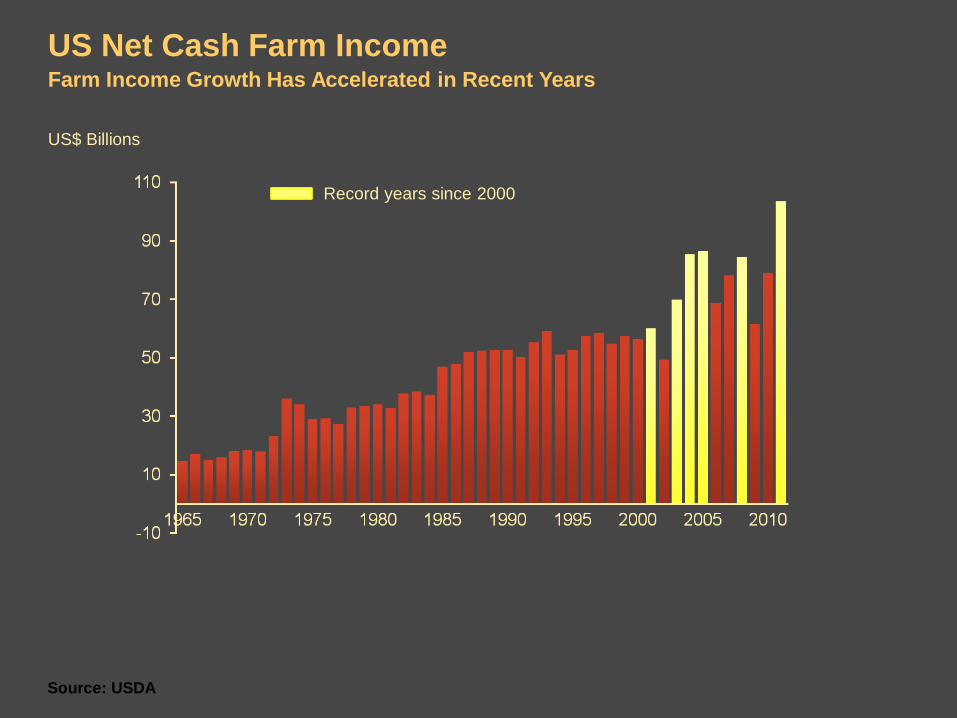
Source: USDA
US$ Billions
US Net Cash Farm Income Farm Income Growth Has Accelerated in Recent Years
Record years since 2000
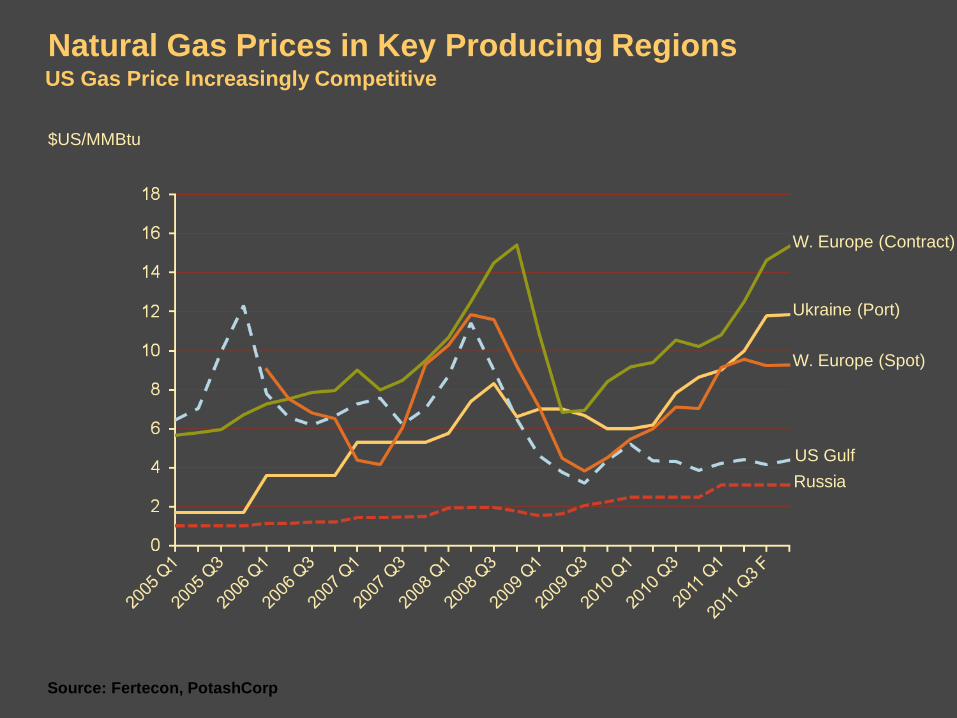
Source: Fertecon, PotashCorp
$US/MMBtu
Natural Gas Prices in Key Producing Regions US Gas Price Increasingly Competitive
W. Europe (Contract)
US Gulf
Ukraine (Port)
Russia
W. Europe (Spot)
Source: Brilliant Pioneer Consultants, PotashCorp
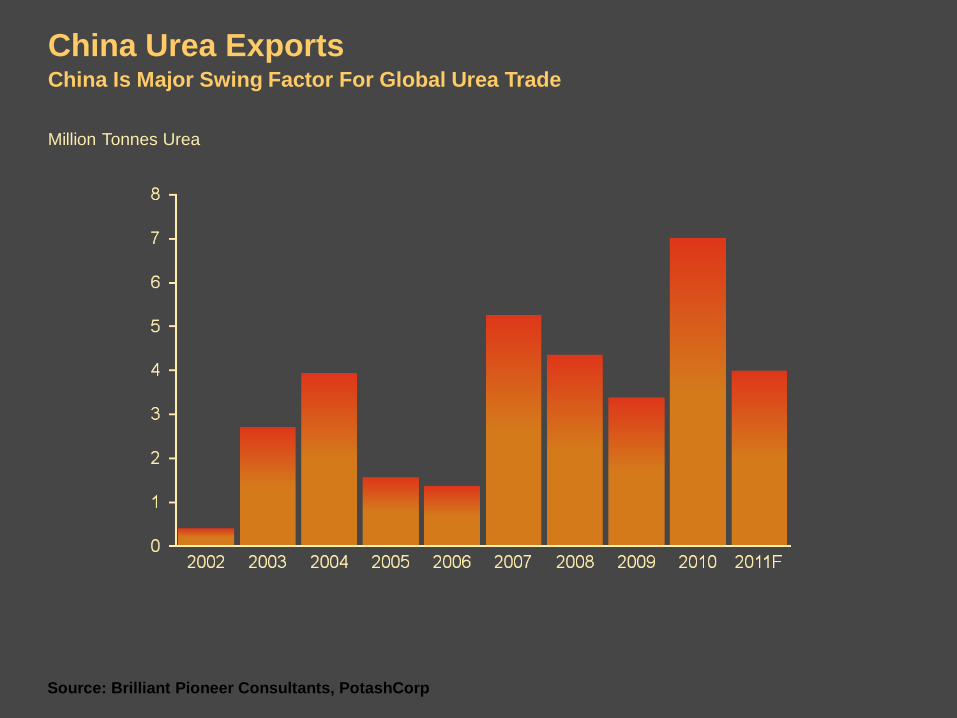
Million Tonnes Urea
China Urea Exports China Is Major Swing Factor For Global Urea Trade
Source: Fertecon, PotashCorp
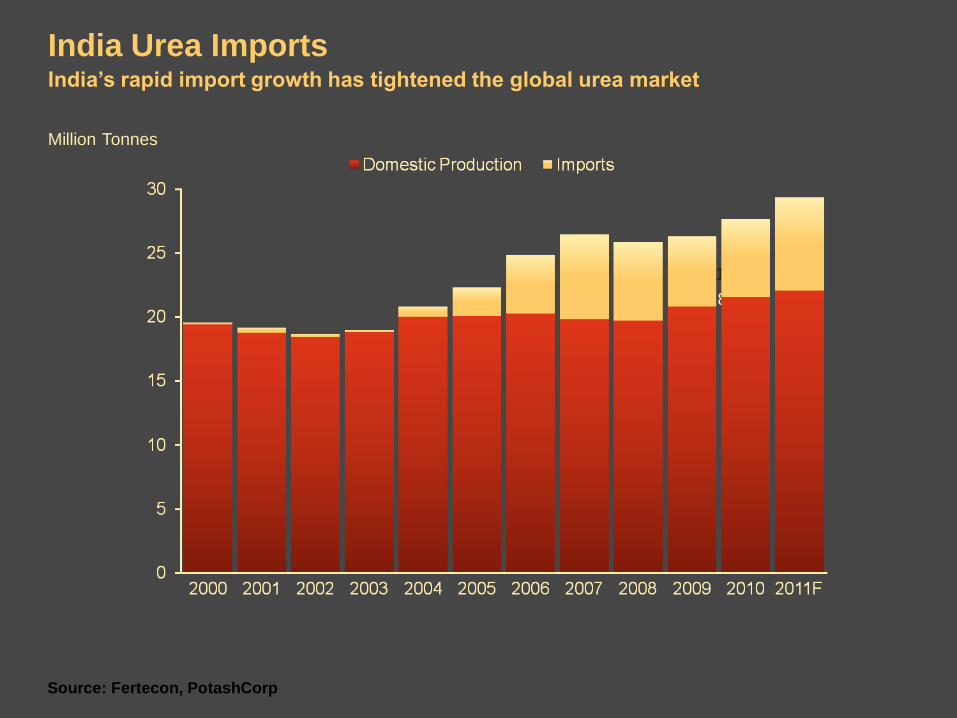
Million Tonnes
India Urea Imports India’s rapid import growth has tightened the global urea market
21.8
6.1

Source: Fertecon, PotashCorp
Million Tonnes
US Nitrogen Consumption US Nitrogen Demand Expected to Remain Strong in 2011
Ammonia Urea Total Nitrogen Solutions
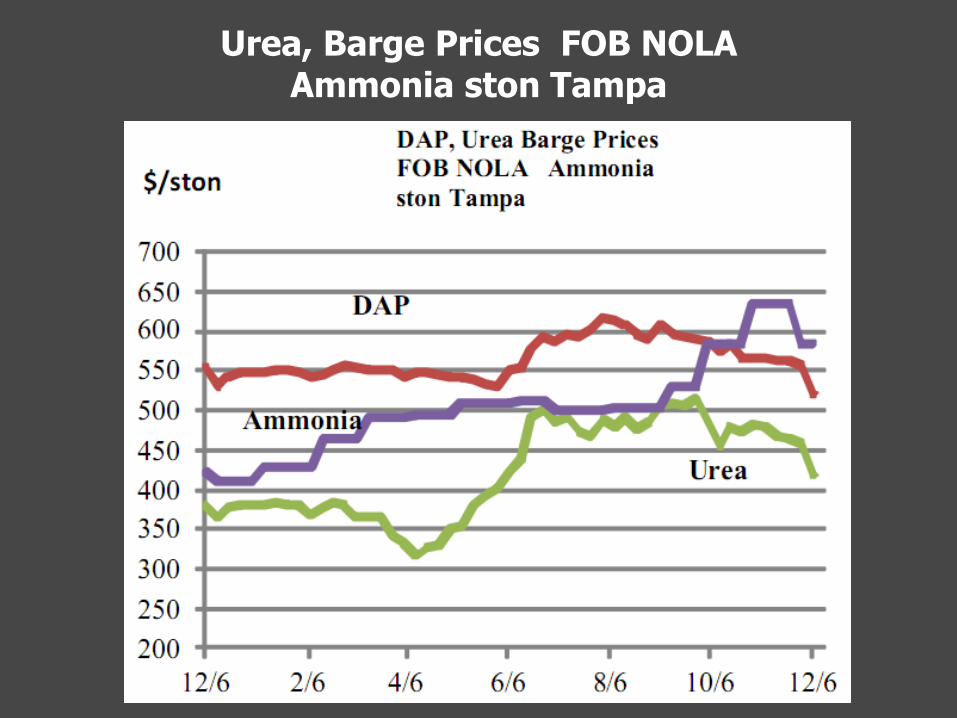
Urea, Barge Prices FOB NOLA Ammonia ston Tampa
Prices have pushed up due to
increased demand and limited supply
• Main Reason is Dramatic Increase in
Crop Commodity Prices
• Fill Large Dealer/Distributor Storage
Gas Costs - $3.75 + producers in
North America are in the drivers seat.
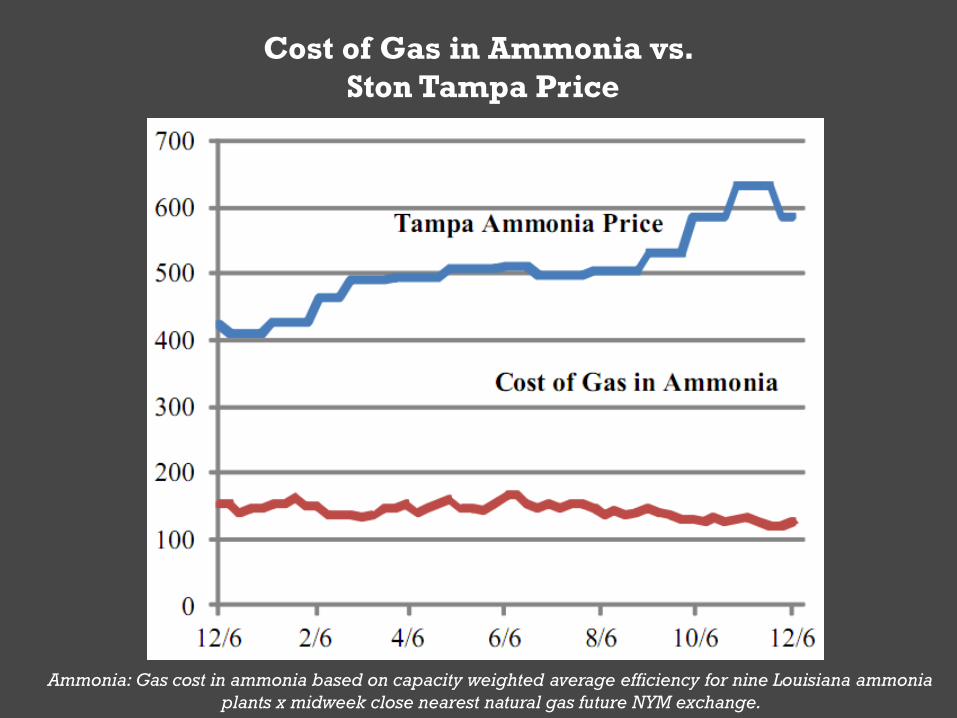
Cost of Gas in Ammonia vs.
Ston Tampa Price
Ammonia: Gas cost in ammonia based on capacity weighted average efficiency for nine Louisiana ammonia
plants x midweek close nearest natural gas future NYM exchange.
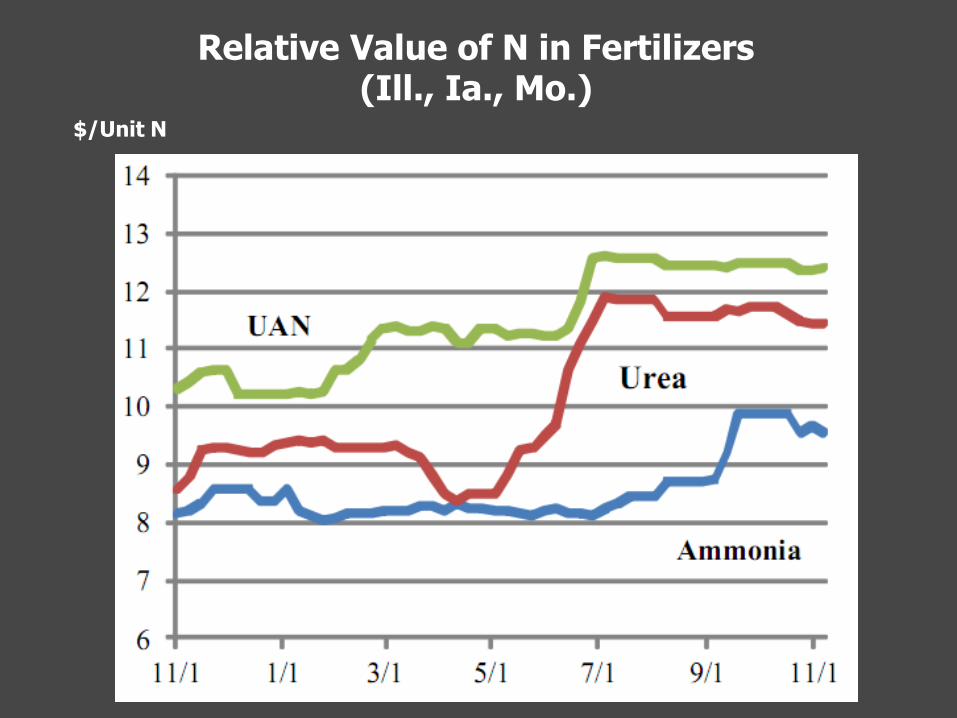
Relative Value of N in Fertilizers (Ill., Ia., Mo.)
$/Unit N
PCS to restart Geismar, LA plant –
1,135,000 tons of UAN 32% production
Coffeyville now looking at completing their
UAN 32% expansion at Coffeyville,
Kansas 350,000 – 400,000 additional per
year
Gas curtailment in Trinidad – 30%
• Production - 5,655 Mstpy
• Curtailment – 1,696 Mstpy
Phos Acid / 10-34-0 supply and issue • Limited production in the US
• No opportunities for imports
• Reduced production in the US
• Supplies are impacted in the short run

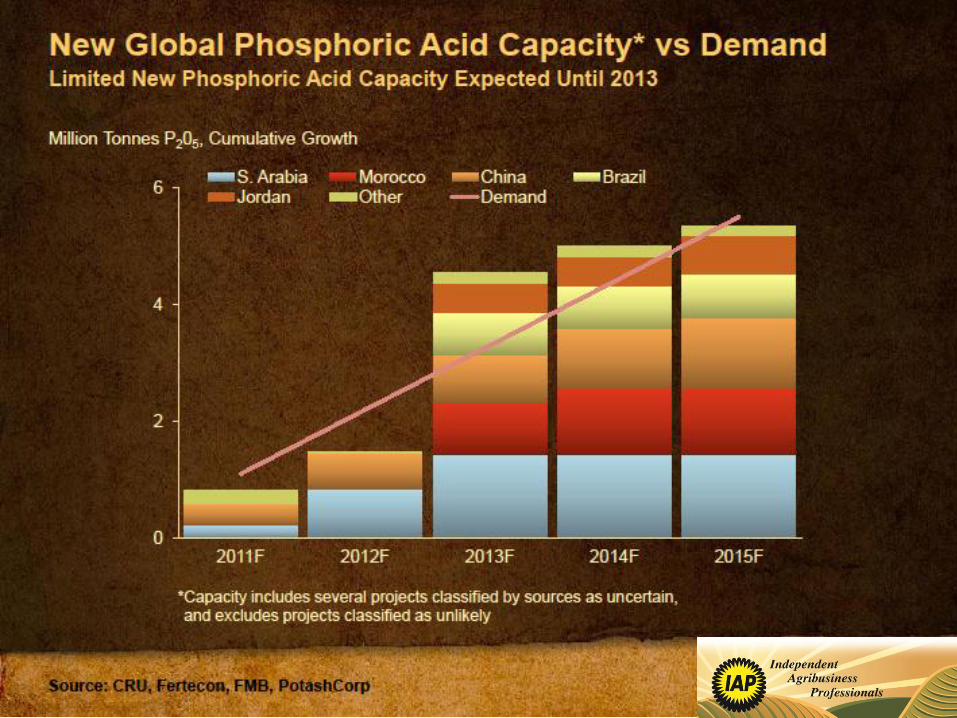
Source: CRU, Fertecon, FMB, PotashCorp
Million Tonnes P2O5 Operating Rate Percentage
Global Phosphoric Acid Production and Operating Rate Expect Relatively Tight Market in the Short Term
*Capacity includes several projects classified by sources as uncertain, and
excludes projects classified as unlikely
Forecast
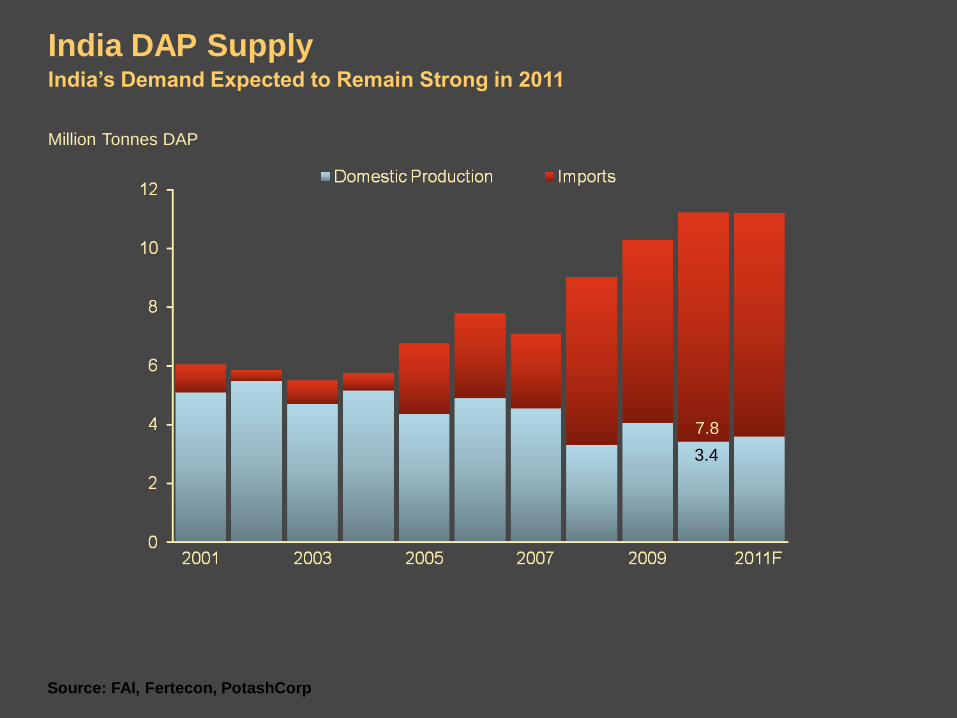
Million Tonnes DAP
India DAP Supply India’s Demand Expected to Remain Strong in 2011
Source: FAI, Fertecon, PotashCorp
7.8
3.4
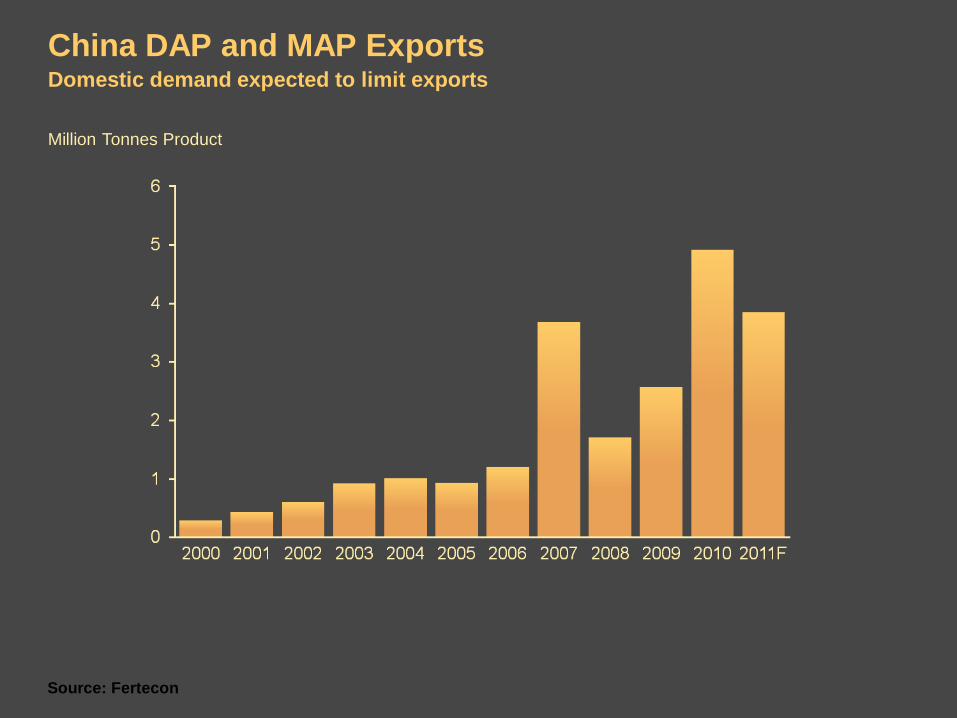
Source: Fertecon
Million Tonnes Product
China DAP and MAP Exports Domestic demand expected to limit exports
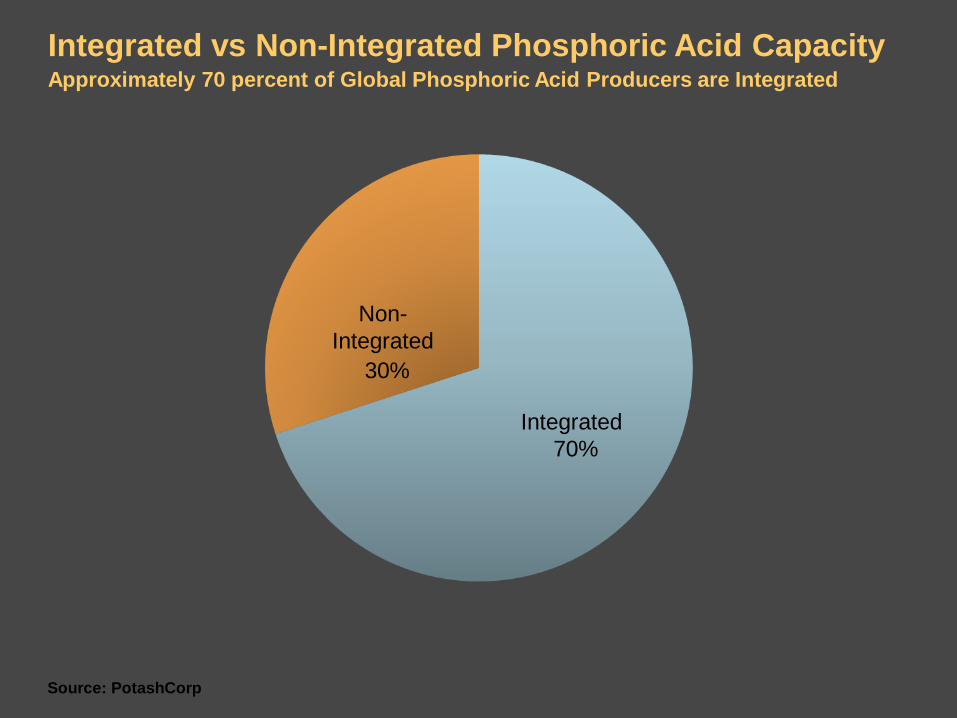
Source: PotashCorp
Integrated vs Non-Integrated Phosphoric Acid Capacity Approximately 70 percent of Global Phosphoric Acid Producers are Integrated
Integrated
70%
Non-
Integrated
30%
Source: Fertecon, PotashCorp
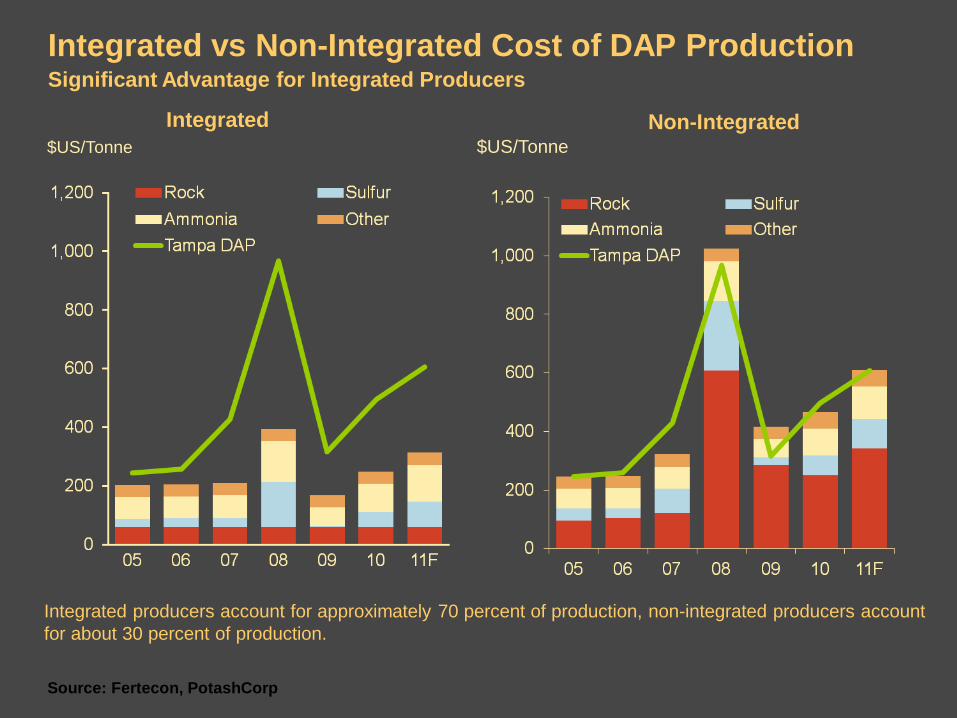
Integrated vs Non-Integrated Cost of DAP Production Significant Advantage for Integrated Producers
$US/Tonne $US/Tonne
Integrated Non-Integrated
Integrated producers account for approximately 70 percent of production, non-integrated producers account
for about 30 percent of production.
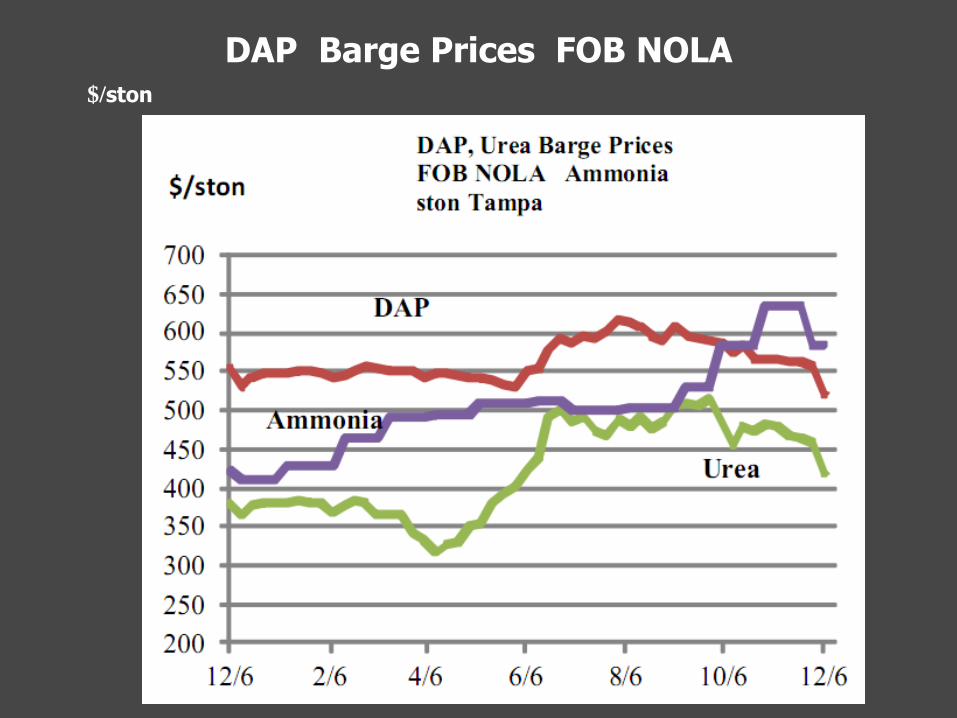
DAP Barge Prices FOB NOLA $/ston
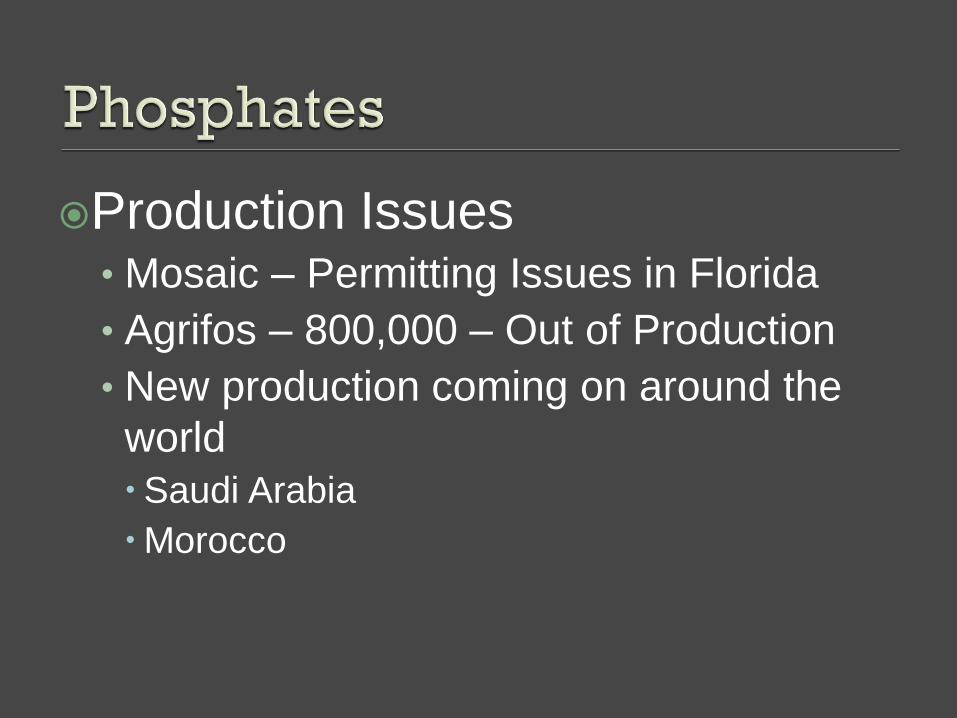
Production Issues • Mosaic – Permitting Issues in Florida
• Agrifos – 800,000 – Out of Production
• New production coming on around the
world
Saudi Arabia
Morocco
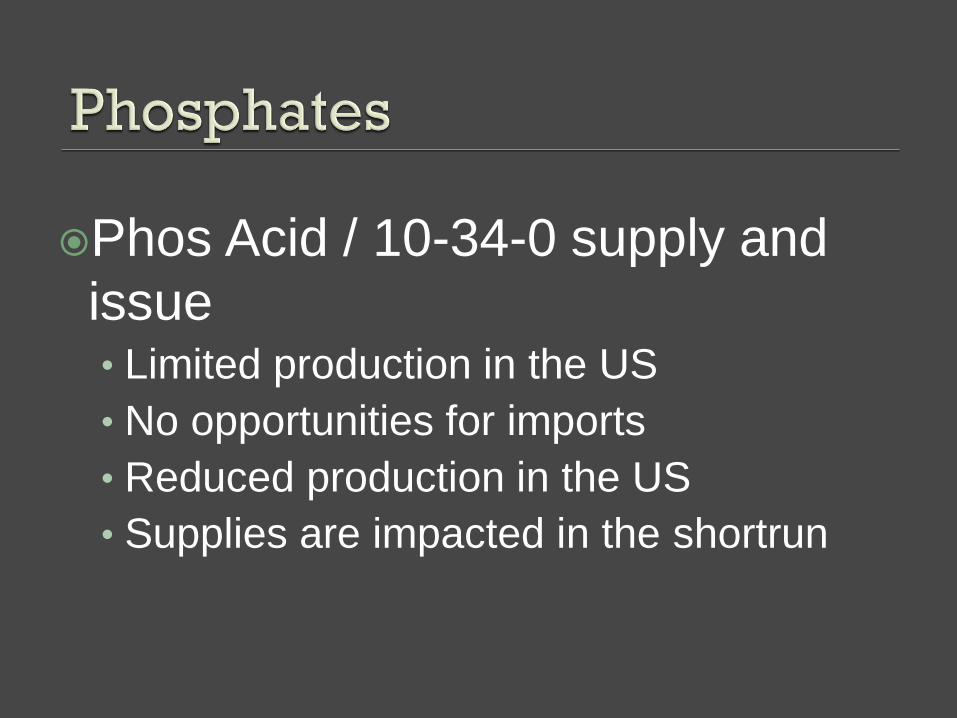
Phos Acid / 10-34-0 supply and
issue • Limited production in the US
• No opportunities for imports
• Reduced production in the US
• Supplies are impacted in the shortrun

Source: Fertecon, PotashCorp
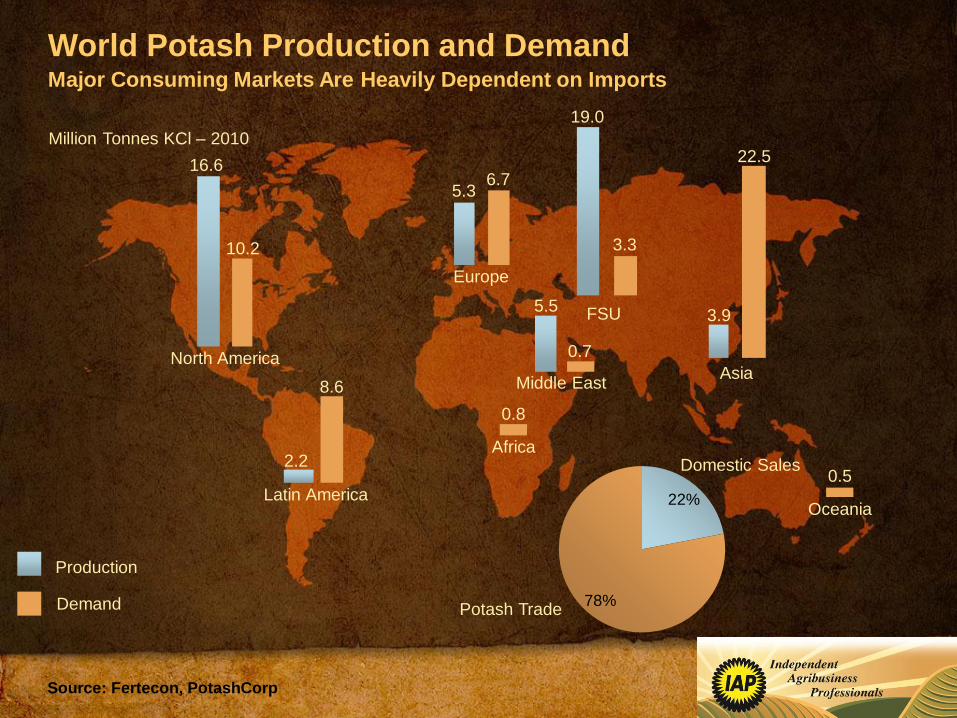
World Potash Production and Demand Major Consuming Markets Are Heavily Dependent on Imports
Production
Demand
North America
Europe
Latin America
FSU
Asia Middle East
Million Tonnes KCl – 2010
16.6
10.2
8.6
2.2
3.9 5.5
5.3
3.3
19.0
22.5
0.5
0.8
Africa
Oceania
0.7
6.7
22%
78%
Domestic Sales
Potash Trade
Source: Fertecon, PotashCorp
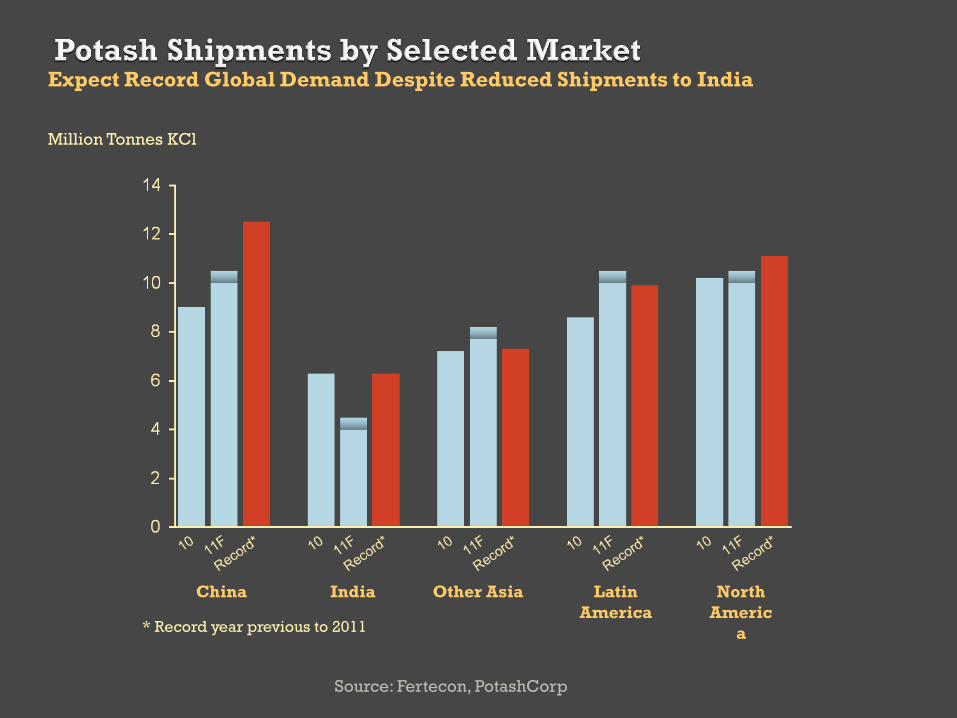
Million Tonnes KCl
Expect Record Global Demand Despite Reduced Shipments to India
China India Other Asia Latin
America
North
Americ
a * Record year previous to 2011
Million Tonnes KCl Million Tonnes KCl
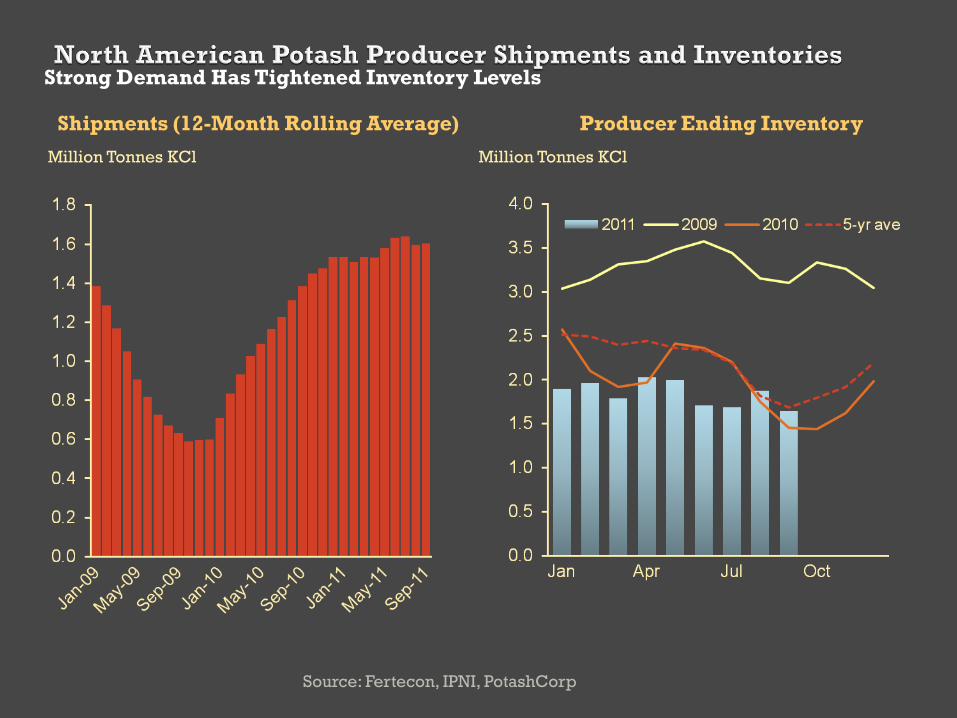
Source: Fertecon, IPNI, PotashCorp
Strong Demand Has Tightened Inventory Levels
Shipments (12-Month Rolling Average) Producer Ending Inventory
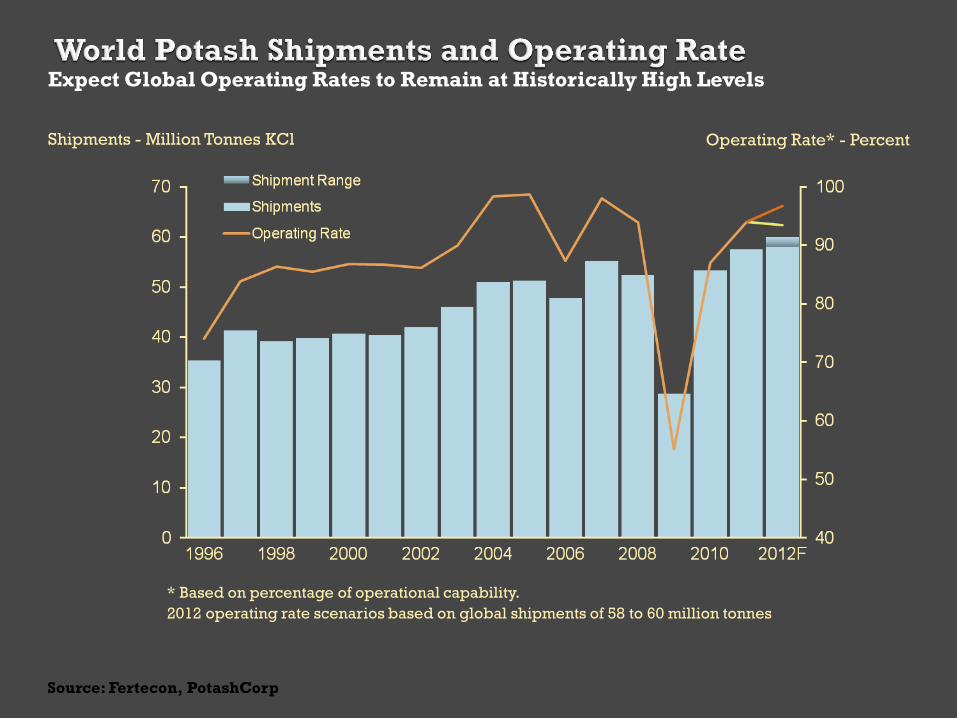
Shipments - Million Tonnes KCl
Operating Rate* - Percent
Expect Global Operating Rates to Remain at Historically High Levels
Source: Fertecon, PotashCorp
* Based on percentage of operational capability.
2012 operating rate scenarios based on global shipments of 58 to 60 million tonnes
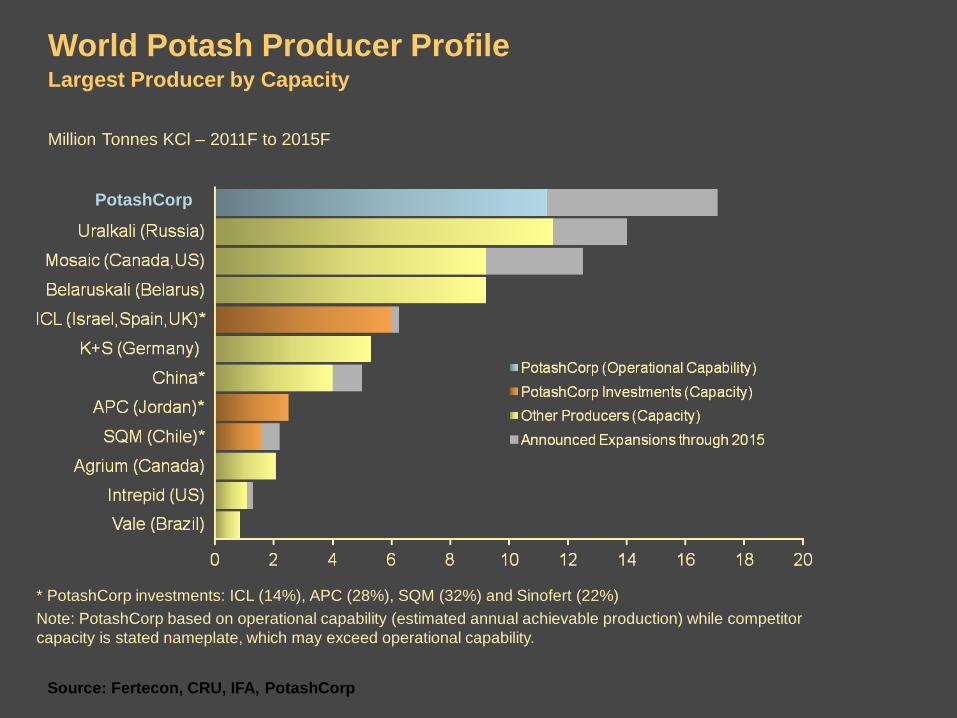
Source: Fertecon, CRU, IFA, PotashCorp
Million Tonnes KCl – 2011F to 2015F
World Potash Producer Profile Largest Producer by Capacity
PotashCorp
* PotashCorp investments: ICL (14%), APC (28%), SQM (32%) and Sinofert (22%)
Note: PotashCorp based on operational capability (estimated annual achievable production) while competitor
capacity is stated nameplate, which may exceed operational capability.

Source: AMEC, PotashCorp
CDN$ Billions
Estimated Greenfield Potash Capital Costs Greenfield Projects Require Significant Investment
* Based on 2mmt per-year conventional mine in Saskatchewan; costs could vary depending on conventional vs. solution mine,
depth of ore body, geographic location, and other factors.
** Dependent on geographic location, access and distance to port. Includes railcars, utility systems, port facilities, etc.
*** Based on publicly reported cost of recent purchases.
$0.0B-$1.0B
$0.6M-$1.2B
$4.7B-$6.3B
$4.1B
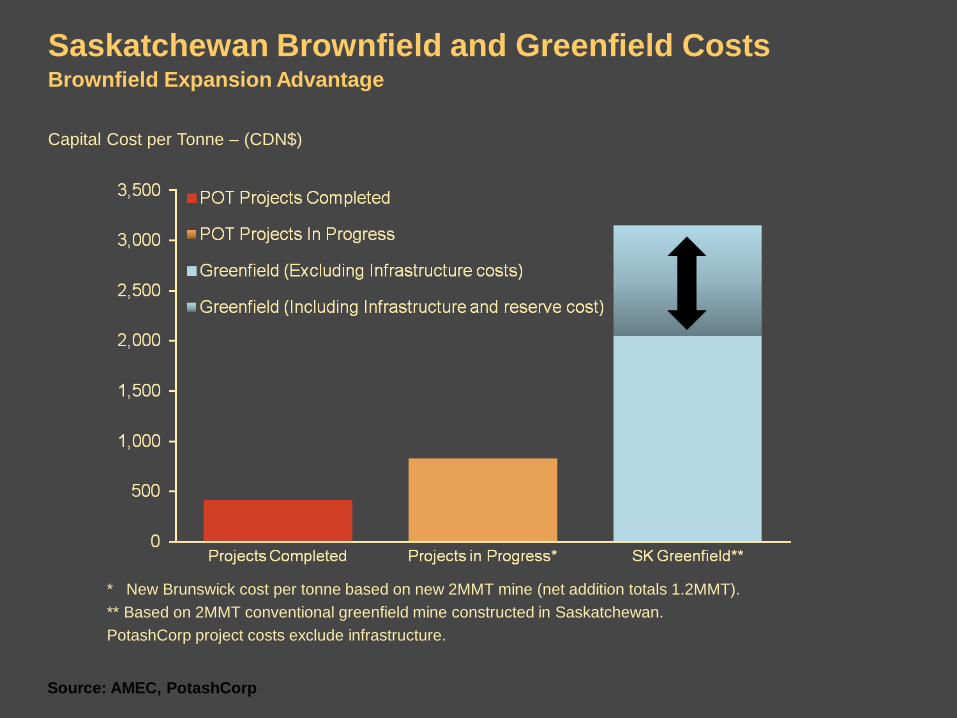
Source: AMEC, PotashCorp
Capital Cost per Tonne – (CDN$)
Saskatchewan Brownfield and Greenfield Costs
* New Brunswick cost per tonne based on new 2MMT mine (net addition totals 1.2MMT).
** Based on 2MMT conventional greenfield mine constructed in Saskatchewan.
PotashCorp project costs exclude infrastructure.
Brownfield Expansion Advantage
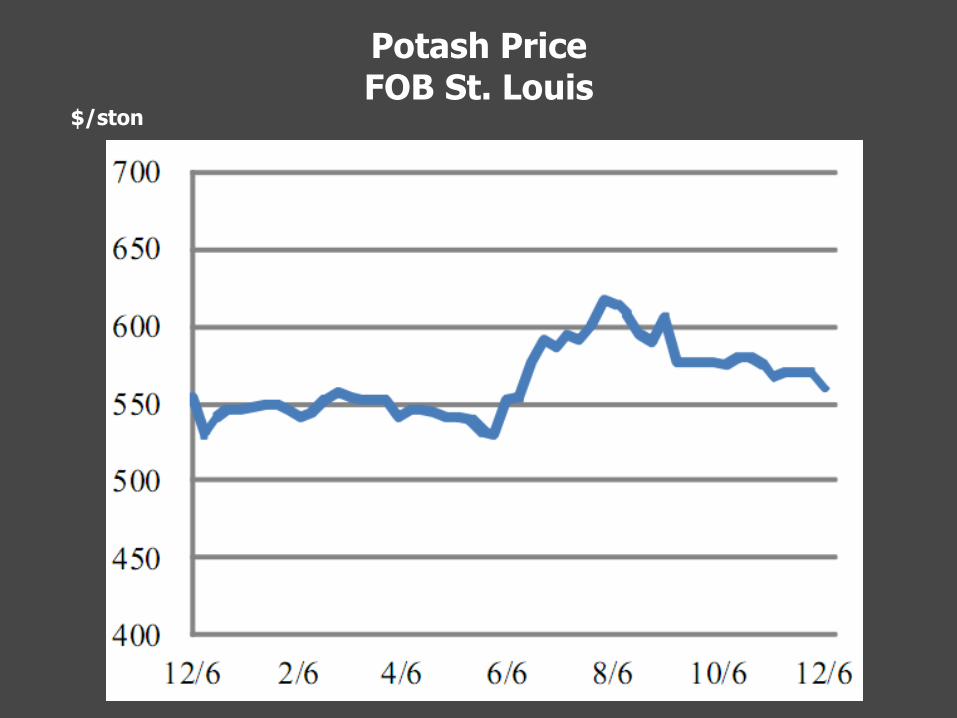
Potash Price FOB St. Louis
$/ston

Fall Supply Issues • Producers are tying in new production causing
outages at existing mines
Producers moving prices up because
they can
Time will tell if higher prices have an
appreciable affect on demand
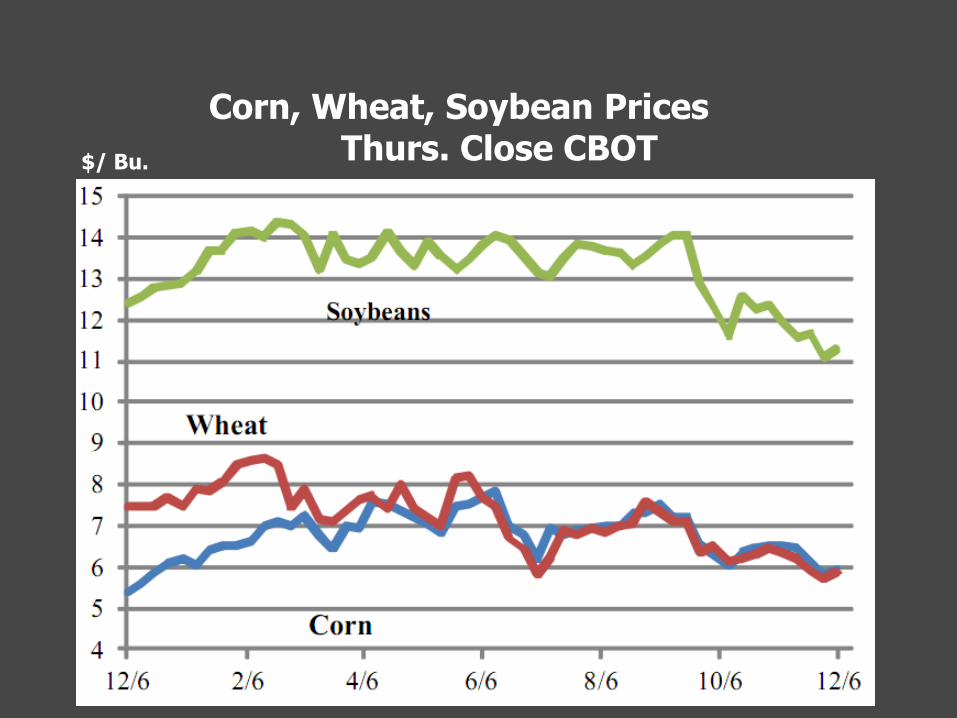
Corn, Wheat, Soybean Prices Thurs. Close CBOT $/ Bu.
Watch commodity prices – if
commodity prices fall fertilizer will
follow
Falling commodity prices will cause
buyers to be cautious and producers
to be concerned
Move from a demand driven market to
a supply driven market

Questions?
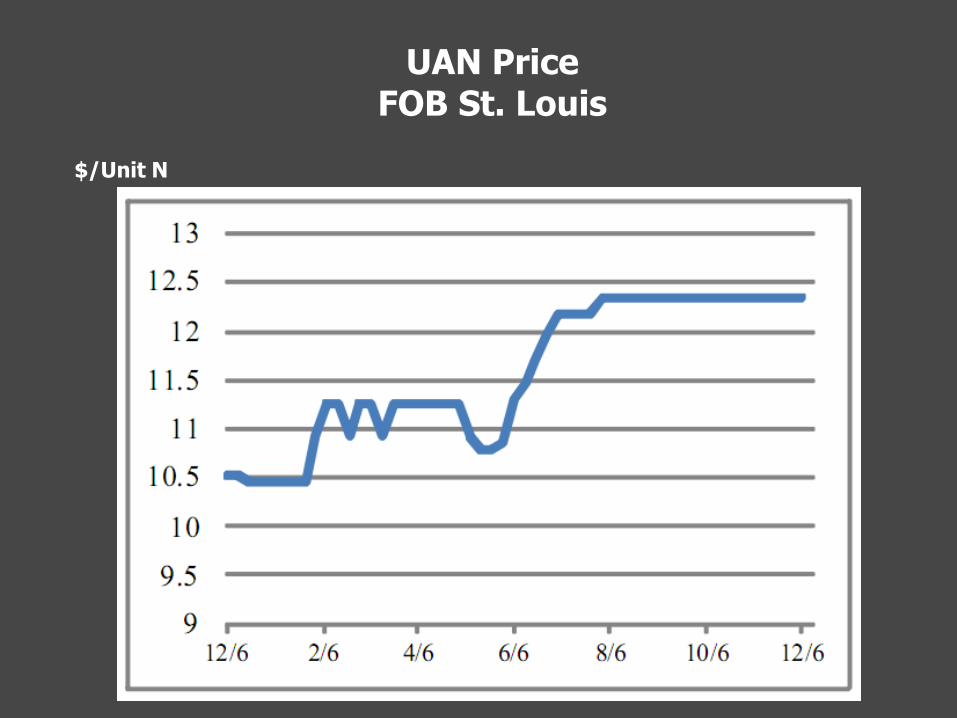
UAN Price FOB St. Louis
$/Unit N

Million Tonnes
Source: IFA, FAO, USDA, PotashCorp
Corn Is the Largest Potash Consumer
Grain and Oilseed
Production
Potash Use by Crop
All Other Crops
Cor
n
Soybeans
Wheat
Cotton
Fruits &
Vegetables
2010E refers to the 2010/11 crop
year
Million Tonnes
Source: IFA, FAO, USDA, PotashCorp
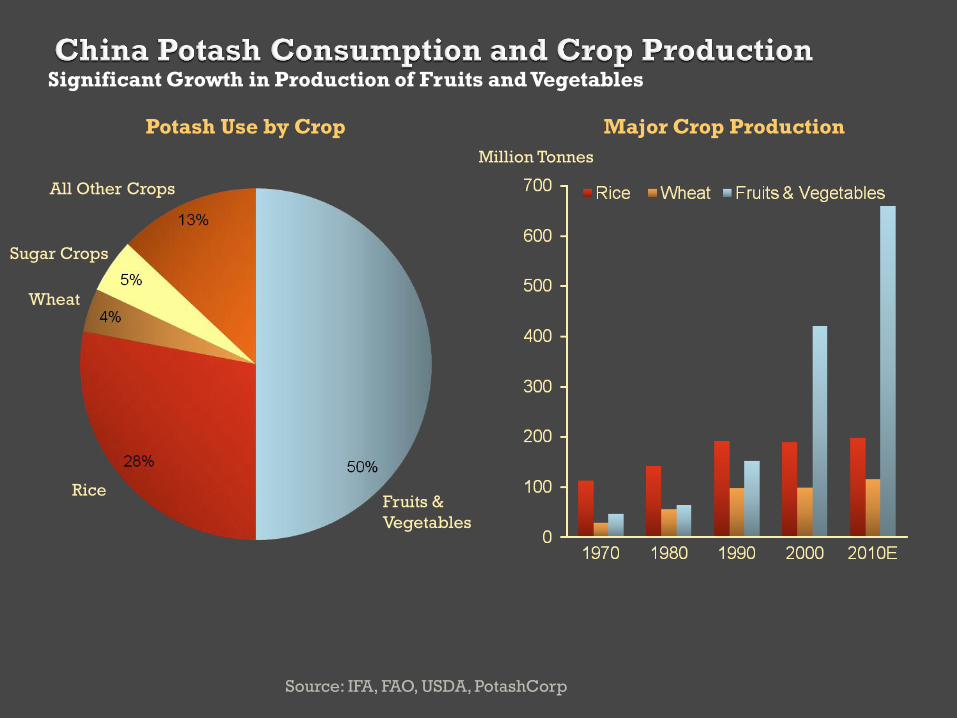
Significant Growth in Production of Fruits and Vegetables
Major Crop Production
All Other Crops
Sugar Crops
Wheat
Rice Fruits &
Vegetables
Potash Use by Crop
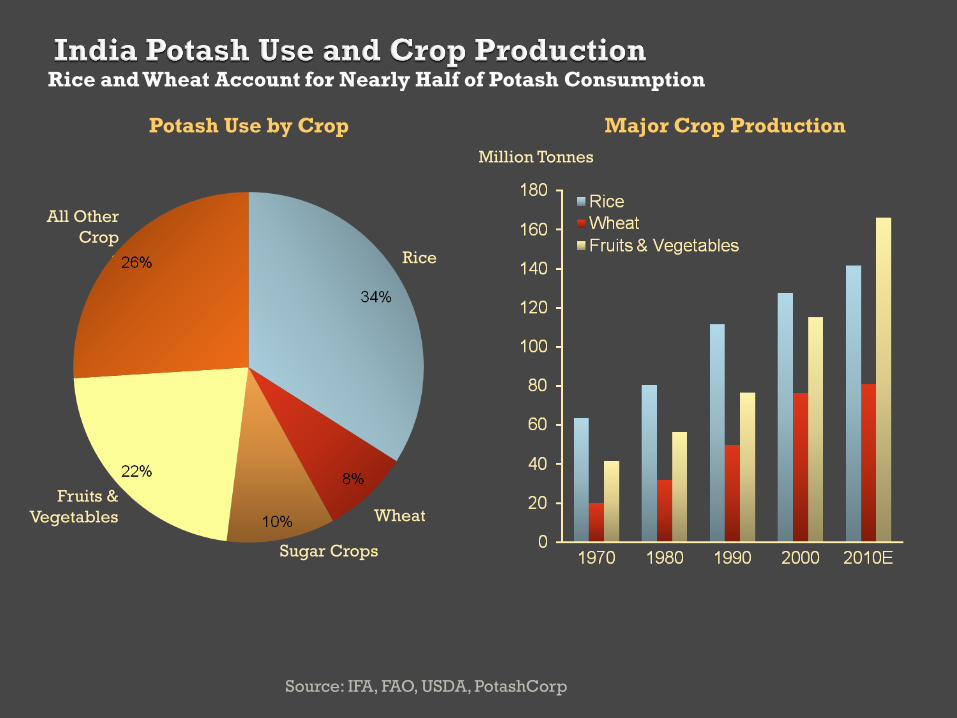
Million Tonnes
Source: IFA, FAO, USDA, PotashCorp
Rice and Wheat Account for Nearly Half of Potash Consumption
Potash Use by Crop Major Crop Production
All Other
Crop
s
Fruits &
Vegetables
Sugar Crops
Wheat
Rice
Related Documents