Fluid distributions inferred from P-wave velocity and reflection seismic amplitude anomalies beneath the Nyegga pockmark field of the mid-Norwegian margin Andreia Plaza-Faverola * , Stefan Bu ¨ nz, Ju ¨ rgen Mienert Department of Geology, University of Tromsø, Dramsveien 201, 9037 Tromsø, Norway article info Article history: Received 17 March 2009 Received in revised form 12 July 2009 Accepted 26 July 2009 Available online 6 August 2009 Keywords: P-waves Seismic velocity Seismic amplitude Fluid migration abstract Travel-time inversion of wide-angle ocean-bottom seismic (OBS) data results in detailed P-wave velocity models of the shallow sub-seabed beneath the Nyegga pockmark field. The area lies on the northern flank of the Storegga Slide on the mid-Norwegian margin. Velocity anomalies indicate two low P-wave velocity zones (LVZs) providing evidence for the presence of gas-rich fluids in the subsurface at Nyegga. Integrating the velocity results with 2D and 3D reflection seismic data demonstrates that LVZs coincide with zones of high-amplitude reflections that allow mapping the extent of the fluids in the subsurface. The upper fluid accumulation zone corresponds to a velocity inversion of w250 m/s and occurs at a depth of about 250 mbsf. The lateral extent is documented in two distinct areas. The westward area is up to 40 m thick where gas-rich fluids beneath a bottom-simulating reflection indicate that fluids may be trapped by gas hydrates. The eastward zone is up to 60 m thick and comprises a contourite deposit infilling a paleo-slide scar. On top, glacigenic debris flow deposits provide a locally effective seal for fluids. The second velocity inversion of w260 m/s extends laterally at about 450 mbsf with decreasing thickness in westward direction. Based on effective-medium theory the gas saturation of pore space in both layers is estimated to be between 0.5 and <1% assuming a homogeneous distribution of gas. Fluids probably originate from deeper strata approximately at the location of the top of the Helland-Hansen Arch. Fluids migrate into the second LVZ and are distributed laterally. Fluids migrate into shallower strata or are expelled at the seabed through the formation of vertical fluid migration features (VFMFs), so-called chimneys. The distribution of the chimneys is clearly linked to the two fluid accumulation zones in the subsurface. A conceptual model draws on the major controlling factors for fluid migrations at specific locations within Nyegga. Fluid migrations vary according to their actual position with respect to the prograding Plio–Pleistocene sedimentary wedge. Ó 2009 Elsevier Ltd. All rights reserved. 1. Introduction The flow of fluids through marine sediments is one of the most dominant and pervasive processes in continental margins (Berndt, 2005; Carson et al., 2003). These processes control the evolution of sedimentary basins and their seafloor environment, and have implications for hydrocarbon exploration and seabed ecosystems (Berndt, 2005). Many seep sites at the seafloor are associated with large but complex faunal communities that have received signifi- cant attention in recent years (e.g. Wheeler et al., 2007). However, there is a need for a better understanding of the driving mechanism of fluid flow in various geological settings, the accumulation of fluids in the subsurface and their focused flow through conduits and/or faults to the seabed. One of the main indicators of fluid flow on continental margins is the occurrence of pockmarks at the seabed (Hovland et al., 2002; Judd, 2003). Pockmarks have been described from many areas of active and passive continental margins (Hovland, 1982; Rise et al., 1999). They often connect to active chimneys or pipes in the subsurface that are vertical, cylindrical structures, which often pierce through more than 1000 m of sediments (Løseth et al., 2001). The chimneys show a transparent acoustic character that interrupts reflections. Up-bending reflections at the chimney outer limits may be the result of mechanical strata deformations due to Abbreviations: Area I, refers to the most distal area respect to the Storegga slide; Area II, refers to closest area respect to the Storegga slide; BGHSZ, Base gas-hydrate stability zone; CD, contourite deposits; GDF, glacigenic debris flow; GHSZ, gas- hydrate stability zone; HAZ 1, refers to the shallower high amplitude zone; HAZ 2, refers to the deeper high amplitude zone; HHA, Helland-Hansen Arch; INT, refers to Intra Naust T reflector; LVZ 1, refers to the shallower low velocity zone; LVZ 2, refers to the deeper low velocity zone; LVZ/HAZ 1, refers to the shallower level for fluid accumulation; LVZ/HAZ 2, refers to the deeper level for fluid accumulation; OBS, ocean-bottom seismometer; VFMF, vertical fluid migration feature. * Corresponding author. Tel.: þ47 77 64 65 37; fax: þ47 77 64 56 00. E-mail addresses: [email protected] (A. Plaza-Faverola), stefan.buenz@ uit.no (S. Bu ¨ nz), [email protected] (J. Mienert). Contents lists available at ScienceDirect Marine and Petroleum Geology journal homepage: www.elsevier.com/locate/marpetgeo 0264-8172/$ – see front matter Ó 2009 Elsevier Ltd. All rights reserved. doi:10.1016/j.marpetgeo.2009.07.007 Marine and Petroleum Geology 27 (2010) 46–60

Welcome message from author
This document is posted to help you gain knowledge. Please leave a comment to let me know what you think about it! Share it to your friends and learn new things together.
Transcript
lable at ScienceDirect
Marine and Petroleum Geology 27 (2010) 46–60
Contents lists avai
Marine and Petroleum Geology
journal homepage: www.elsevier .com/locate /marpetgeo
Fluid distributions inferred from P-wave velocity and reflection seismic amplitudeanomalies beneath the Nyegga pockmark field of the mid-Norwegian margin
Andreia Plaza-Faverola*, Stefan Bunz, Jurgen MienertDepartment of Geology, University of Tromsø, Dramsveien 201, 9037 Tromsø, Norway
a r t i c l e i n f o
Article history:Received 17 March 2009Received in revised form12 July 2009Accepted 26 July 2009Available online 6 August 2009
Keywords:P-wavesSeismic velocitySeismic amplitudeFluid migration
Abbreviations: Area I, refers to the most distal areaArea II, refers to closest area respect to the Storegga slstability zone; CD, contourite deposits; GDF, glacigehydrate stability zone; HAZ 1, refers to the shallowerrefers to the deeper high amplitude zone; HHA, HellanIntra Naust T reflector; LVZ 1, refers to the shallower loto the deeper low velocity zone; LVZ/HAZ 1, refers toaccumulation; LVZ/HAZ 2, refers to the deeper levelocean-bottom seismometer; VFMF, vertical fluid migr
* Corresponding author. Tel.: þ47 77 64 65 37; faxE-mail addresses: [email protected] (A. Pl
uit.no (S. Bunz), [email protected] (J. Mienert).
0264-8172/$ – see front matter � 2009 Elsevier Ltd.doi:10.1016/j.marpetgeo.2009.07.007
a b s t r a c t
Travel-time inversion of wide-angle ocean-bottom seismic (OBS) data results in detailed P-wave velocitymodels of the shallow sub-seabed beneath the Nyegga pockmark field. The area lies on the northernflank of the Storegga Slide on the mid-Norwegian margin. Velocity anomalies indicate two low P-wavevelocity zones (LVZs) providing evidence for the presence of gas-rich fluids in the subsurface at Nyegga.Integrating the velocity results with 2D and 3D reflection seismic data demonstrates that LVZs coincidewith zones of high-amplitude reflections that allow mapping the extent of the fluids in the subsurface.The upper fluid accumulation zone corresponds to a velocity inversion of w250 m/s and occurs ata depth of about 250 mbsf. The lateral extent is documented in two distinct areas. The westward area isup to 40 m thick where gas-rich fluids beneath a bottom-simulating reflection indicate that fluids may betrapped by gas hydrates. The eastward zone is up to 60 m thick and comprises a contourite depositinfilling a paleo-slide scar. On top, glacigenic debris flow deposits provide a locally effective seal forfluids. The second velocity inversion of w260 m/s extends laterally at about 450 mbsf with decreasingthickness in westward direction. Based on effective-medium theory the gas saturation of pore space inboth layers is estimated to be between 0.5 and <1% assuming a homogeneous distribution of gas. Fluidsprobably originate from deeper strata approximately at the location of the top of the Helland-HansenArch. Fluids migrate into the second LVZ and are distributed laterally. Fluids migrate into shallower strataor are expelled at the seabed through the formation of vertical fluid migration features (VFMFs), so-calledchimneys. The distribution of the chimneys is clearly linked to the two fluid accumulation zones in thesubsurface. A conceptual model draws on the major controlling factors for fluid migrations at specificlocations within Nyegga. Fluid migrations vary according to their actual position with respect to theprograding Plio–Pleistocene sedimentary wedge.
� 2009 Elsevier Ltd. All rights reserved.
1. Introduction
The flow of fluids through marine sediments is one of the mostdominant and pervasive processes in continental margins (Berndt,2005; Carson et al., 2003). These processes control the evolution ofsedimentary basins and their seafloor environment, and have
respect to the Storegga slide;ide; BGHSZ, Base gas-hydratenic debris flow; GHSZ, gas-high amplitude zone; HAZ 2,d-Hansen Arch; INT, refers tow velocity zone; LVZ 2, refersthe shallower level for fluid
for fluid accumulation; OBS,ation feature.
: þ47 77 64 56 00.aza-Faverola), stefan.buenz@
All rights reserved.
implications for hydrocarbon exploration and seabed ecosystems(Berndt, 2005). Many seep sites at the seafloor are associated withlarge but complex faunal communities that have received signifi-cant attention in recent years (e.g. Wheeler et al., 2007). However,there is a need for a better understanding of the driving mechanismof fluid flow in various geological settings, the accumulation offluids in the subsurface and their focused flow through conduitsand/or faults to the seabed.
One of the main indicators of fluid flow on continental marginsis the occurrence of pockmarks at the seabed (Hovland et al., 2002;Judd, 2003). Pockmarks have been described from many areas ofactive and passive continental margins (Hovland, 1982; Rise et al.,1999). They often connect to active chimneys or pipes in thesubsurface that are vertical, cylindrical structures, which oftenpierce through more than 1000 m of sediments (Løseth et al., 2001).The chimneys show a transparent acoustic character that interruptsreflections. Up-bending reflections at the chimney outer limitsmay be the result of mechanical strata deformations due to
A. Plaza-Faverola et al. / Marine and Petroleum Geology 27 (2010) 46–60 47
upward-migrating fluid within the chimney or may be due to highervelocity material inside the chimney (e.g. Westbrook et al., 2008b).
The fluid composition is often unknown but depends to a largedegree on source areas from which gases such as biogenic (shallowsource) and/or thermogenic methane (deep source) migrateupwards (Kelley et al., 1994; Rise et al., 1999; Solheim and Elverhoi,1993). Though large uncertainties do exists regarding theircomposition and the timing of fluid flow, pockmark and chimneyformations in continental margins allow for one common assump-tion that is, they mark focussed fluid-flow features indicative ofoverpressurised formations in the sub-seabed (Rise et al., 1999).
More than four hundred pockmarks exist at the seabed in theregion of Nyegga at the northern flank of the Storegga Slide on themid-Norwegian margin (Bunz et al., 2003; Hovland and Svensen,2006; Mazzini et al., 2006) (Fig. 1). They occur in water depthsbetween 500 and 1500 m along the north-eastern flank of theStoregga slide. The majority of pockmarks connect to chimneys thatpierce through glacigenic debris flows deposited during the lastglacial maximum (LGM), which argues for a postglacial activity ofvertical fluid flow (Bouriak et al., 2000; Bunz et al., 2003; Hustoftet al., 2007; Mienert et al., 2005b; Paull et al., 2008). Potentialsource areas of fluids and occurrence of overpressurised formationsfrom which fluids migrate are less known and consequently underdebate (Berndt, 2005; Hustoft et al., 2007; Mazzini et al., 2006).
The main objective of this study is to determine the lateraldistribution of fluids in the subsurface and its relationship tovertical fluid venting in Nyegga. A combined use of multi-compo-nent ocean-bottom seismometer (OBS), single channel reflectionseismic (SC) and 3D seismic data (3D) allows to constrain theoccurrence of low velocity zones (LVZs) and high amplitude zones(HAZs) in the upper 800 mbsf (meters below the seafloor). Inte-grating P-wave velocity models with 2D and 3D seismic strati-graphic interpretations allow us to assess the fluid and/or gas
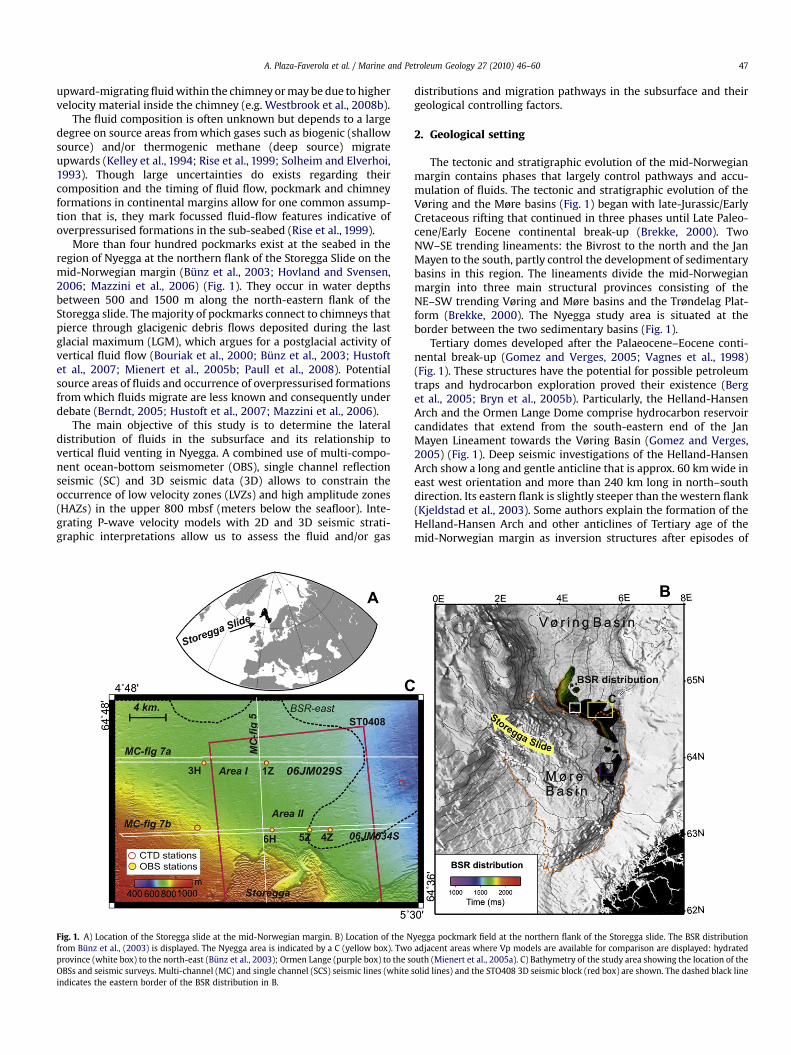
Fig. 1. A) Location of the Storegga slide at the mid-Norwegian margin. B) Location of the Nfrom Bunz et al., (2003) is displayed. The Nyegga area is indicated by a C (yellow box). Twoprovince (white box) to the north-east (Bunz et al., 2003); Ormen Lange (purple box) to the sOBSs and seismic surveys. Multi-channel (MC) and single channel (SCS) seismic lines (white sindicates the eastern border of the BSR distribution in B.
distributions and migration pathways in the subsurface and theirgeological controlling factors.
2. Geological setting
The tectonic and stratigraphic evolution of the mid-Norwegianmargin contains phases that largely control pathways and accu-mulation of fluids. The tectonic and stratigraphic evolution of theVøring and the Møre basins (Fig. 1) began with late-Jurassic/EarlyCretaceous rifting that continued in three phases until Late Paleo-cene/Early Eocene continental break-up (Brekke, 2000). TwoNW–SE trending lineaments: the Bivrost to the north and the JanMayen to the south, partly control the development of sedimentarybasins in this region. The lineaments divide the mid-Norwegianmargin into three main structural provinces consisting of theNE–SW trending Vøring and Møre basins and the Trøndelag Plat-form (Brekke, 2000). The Nyegga study area is situated at theborder between the two sedimentary basins (Fig. 1).
Tertiary domes developed after the Palaeocene–Eocene conti-nental break-up (Gomez and Verges, 2005; Vagnes et al., 1998)(Fig. 1). These structures have the potential for possible petroleumtraps and hydrocarbon exploration proved their existence (Berget al., 2005; Bryn et al., 2005b). Particularly, the Helland-HansenArch and the Ormen Lange Dome comprise hydrocarbon reservoircandidates that extend from the south-eastern end of the JanMayen Lineament towards the Vøring Basin (Gomez and Verges,2005) (Fig. 1). Deep seismic investigations of the Helland-HansenArch show a long and gentle anticline that is approx. 60 km wide ineast west orientation and more than 240 km long in north–southdirection. Its eastern flank is slightly steeper than the western flank(Kjeldstad et al., 2003). Some authors explain the formation of theHelland-Hansen Arch and other anticlines of Tertiary age of themid-Norwegian margin as inversion structures after episodes of
yegga pockmark field at the northern flank of the Storegga slide. The BSR distributionadjacent areas where Vp models are available for comparison are displayed: hydrated
outh (Mienert et al., 2005a). C) Bathymetry of the study area showing the location of theolid lines) and the STO408 3D seismic block (red box) are shown. The dashed black line
Table 1Locations, water depths (Wd) and water column velocities (Vwc) after relocation ofthe OBS stations.
Station Long Lat Wd (m) Vwc (m/s)
1Z 5.14985 64.73837 708 1474.53H 5.00638 64.73828 740 1473.44Z 5.29620 64.67122 706 1477.75Z 5.24945 64.67118 733 1477.96H 5.16242 64.67097 765 1477.3
A. Plaza-Faverola et al. / Marine and Petroleum Geology 27 (2010) 46–6048
a regional compression (Brekke, 2000; Dore and Lundin, 1996;Gomez and Verges, 2005). Other studies suggest that the steeperflanks towards the east are caused by differential sedimentcompaction due to prograding Pliocene–Early Pleistocene sedi-mentary wedges (Kjeldstad et al., 2003).
The Plio- and Pleistocene sedimentary wedge consists of glacialbut also, though to a lesser degree, interglacial sediments related tothe waxing and waning of Scandinavian ice sheets and ice streams.The wedge reaches a total sediment thickness of up to 1.75 km(Hjelstuen et al., 1999). As a result, variations in the thickness of therapidly deposited sediment affected the underlying Tertiary andMesozoic sediments causing differential compaction (Kjeldstadet al., 2003; Reemst et al., 1996). Moreover, several authors suggestthat this led to under-compaction and overpressure build up inmore porous interglacial sediments that played a major role in thedestabilisation of the Norwegian continental margin at Storegga(Bryn et al., 2005c; Leynaud et al., 2007; Solheim et al., 2005).
The upper Naust formation (Rise et al., 2006) comprises themost relevant sedimentary sequence for our investigation of fluidflow systems at Nyegga. It consists of five seismic units (frombottom to top: N, A, U, S, T) that represent mainly thick glacial andthinner intercalated interglacial sediment layers (Berg et al., 2005;Rise et al., 2005; Solheim et al., 2005). Interglacial sedimentspredominantly consist of contour current-controlled deposits thatdeveloped elongated mounds in mid-water depths along thecontinental slope. These contourite sediment drifts filled slide scarsof previously triggered submarine slides (Bryn et al., 2005c). Thethickness of the deposits in the slide scar does not exceed 200 m, i.e.the headwall height (w250 m) of the giant Storegga slide (Brynet al., 2005a; Solheim et al., 2005). Age controls of sediments arebased on samples from borings and sediment gravity corescomprising the time interval from 2.6 Ma (base Naust N), 0.2 Ma(base Naust T) to the Holocene (Bryn et al., 2005a; Mienert et al.,2005b; Solheim et al., 2005).
A bottom-simulating reflector (BSR) at the base of the gas-hydrate stability zone (BGHSZ) provides geophysical evidence forfree gas trapped beneath gas hydrates at the northern flank of theStoregga Slide (Bouriak et al., 2000; Bunz and Mienert, 2004; Bunzet al., 2003; Mienert et al., 2003). The BSR can be mapped over anarea of about 4000 km2 (Bunz et al., 2003) and marks a sharptransition of hydrate-bearing sediments between approx. 270–310 mbsf and free-gas accumulation beneath it (Bunz and Mienert,2004). The BSR shows as an envelope of enhanced reflectionterminations and exhibits only in few places as a reflection properwith reversed phase, when compared to the seafloor reflection(Bunz et al., 2003). The regional distribution of the BSR is a result ofboth the shoaling of the BGHSZ towards the continental shelf andglacigenic debris flow sediments that are less conducive for gas-hydrate growth (Bunz et al., 2003). The BSR only occurs withincontouritic and hemipelagic deposits of the Naust formation andnot within glacigenic debris flow deposits that become moreabundant on the upper continental slope. The northern flank of theStoregga Slide on the mid slope is thus one of the favourable placesfor a continuous accumulation of contouritic and hemipelagicsediments. Geophysically inferred gas-hydrate saturations in thesesediments suggest values of approx. 5% in the pore space of sedi-ments (Bunz and Mienert, 2004; Bunz et al., 2005).
The Nyegga pockmark field lies at the easternmost part of theBSR area and northward of the north-eastern corner of the StoreggaSlide. This area shows the highest density of seabed fluid-ventingstructures (Hovland and Svensen, 2006; Hovland et al., 2005) alongthe northern flank of the Storegga Slide (Bouriak et al., 2000; Bunzet al., 2003). Some of these pockmarks have a complex morphologyand an abundant faunal community associated with it (Hovlandand Svensen, 2006; Mazzini et al., 2006). Beneath the pockmarks
are chimneys that represent transparent cylindrical structures,which seem to connect to the top of the Kai formation (Berndt et al.,2003). Some of the chimney structures show pull-up reflectionstowards their outer part (Hustoft et al., 2007; Paull et al., 2008). Thepull-up might be a consequence of structural deformation duringthe blow-out process or due to velocity pull-up caused by thepresence of gas hydrates and/or carbonates inside the chimney wallstructure. Sampling at one of the pockmark sites succeeded inretrieving gas hydrates in near surface sediments indicating activefluid flow (Ivanov et al., 2007). However, geo-chemical measure-ments of sulphate gradients suggest that subsurface features arenot fluid flow conduits that are gas hydrate filled (Paull et al., 2008).Our geophysical study aims to add new knowledge to strata-controlled fluid distributions in the sub-seabed and its interactionwith vertical fluid-flow feature that pierce the seabed.
3. Seismic data and methods
3.1. Seismic data
During the summer of 2006, a multi-component seismic surveyconducted in the area of Nyegga on board RV Jan Mayen, Universityof Tromsø, acquired high-resolution single-channel-seismic (SCS),ocean-bottom seismometer (OBS), swath bathymetry and CTD data(Mienert et al., 2006). The study areas lie ~10 km and ~1–2 kmnorthward from the northern sidewall of the Storegga slide. WhileOBS data sets 1–3 connect on an E–W line crossing the top of theHelland-Hansen Arch, the OBS data sets 4–6 lie on an E–W line just2 km north of the northern Storegga sidewall (Fig. 1, Table 1). Of the6 OBS stations, we used data of hydrophone components of OBS 3and 6 (resulting models: 3H and 6H) and of vertical geophonecomponents of OBS 1, 4 and 5 (resulting models: 1Z, 4Z, 5Z) thatallowed to obtain robust 1D P-wave velocity models. Two CTDstations provided the average speed of sound in water (1476 m/s)from the sea surface to the seabed at 600 and 800 m, respectively.
The source for seismic data acquisition consisted of a seismicarray of two 45/105 cu. in (generator/injector) airguns witha dominant frequency of 80 Hz. Shots were fired on time with a shotinterval of 11 s that resulted in an average shot spacing of w22 m. ASEA-TRACK 320 antenna located on the airgun float provided shotpositions with accuracy of approx. 1 m. Multi-channel seismic(MCS) data were kindly made available by TGS-Nopec and 3Dseismic data (3D) by StatoilHydro to the NFR-PETROMAKS project(169514/S30).
3.2. Method
Processing of OBS data included basic band pass filtering andautomatic gain control to enhance deeper reflectors. Parametersettings applied are consistent with previous investigations west-ward (Bunz et al., 2005) and southward (Mienert et al., 2005a) ofthe Nyegga area. The SCS section 06JM29S and 06JM34S processingfollowed the same routine as for the OBS data. In a second stage, the
A. Plaza-Faverola et al. / Marine and Petroleum Geology 27 (2010) 46–60 49
processing went from F–K time migrated to depth converted SCSdata using the velocity models derived from the OBS data.
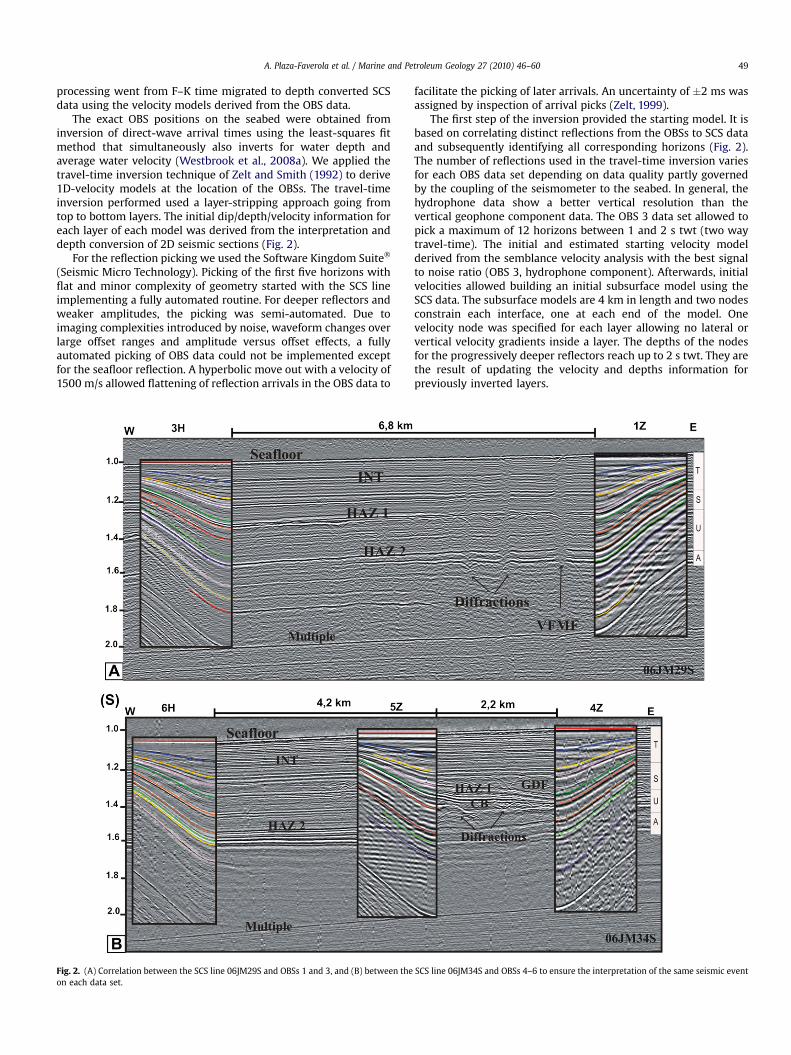
The exact OBS positions on the seabed were obtained frominversion of direct-wave arrival times using the least-squares fitmethod that simultaneously also inverts for water depth andaverage water velocity (Westbrook et al., 2008a). We applied thetravel-time inversion technique of Zelt and Smith (1992) to derive1D-velocity models at the location of the OBSs. The travel-timeinversion performed used a layer-stripping approach going fromtop to bottom layers. The initial dip/depth/velocity information foreach layer of each model was derived from the interpretation anddepth conversion of 2D seismic sections (Fig. 2).
For the reflection picking we used the Software Kingdom Suite�
(Seismic Micro Technology). Picking of the first five horizons withflat and minor complexity of geometry started with the SCS lineimplementing a fully automated routine. For deeper reflectors andweaker amplitudes, the picking was semi-automated. Due toimaging complexities introduced by noise, waveform changes overlarge offset ranges and amplitude versus offset effects, a fullyautomated picking of OBS data could not be implemented exceptfor the seafloor reflection. A hyperbolic move out with a velocity of1500 m/s allowed flattening of reflection arrivals in the OBS data to
Fig. 2. (A) Correlation between the SCS line 06JM29S and OBSs 1 and 3, and (B) between theon each data set.
facilitate the picking of later arrivals. An uncertainty of �2 ms wasassigned by inspection of arrival picks (Zelt, 1999).
The first step of the inversion provided the starting model. It isbased on correlating distinct reflections from the OBSs to SCS dataand subsequently identifying all corresponding horizons (Fig. 2).The number of reflections used in the travel-time inversion variesfor each OBS data set depending on data quality partly governedby the coupling of the seismometer to the seabed. In general, thehydrophone data show a better vertical resolution than thevertical geophone component data. The OBS 3 data set allowed topick a maximum of 12 horizons between 1 and 2 s twt (two waytravel-time). The initial and estimated starting velocity modelderived from the semblance velocity analysis with the best signalto noise ratio (OBS 3, hydrophone component). Afterwards, initialvelocities allowed building an initial subsurface model using theSCS data. The subsurface models are 4 km in length and two nodesconstrain each interface, one at each end of the model. Onevelocity node was specified for each layer allowing no lateral orvertical velocity gradients inside a layer. The depths of the nodesfor the progressively deeper reflectors reach up to 2 s twt. They arethe result of updating the velocity and depths information forpreviously inverted layers.
SCS line 06JM34S and OBSs 4–6 to ensure the interpretation of the same seismic event
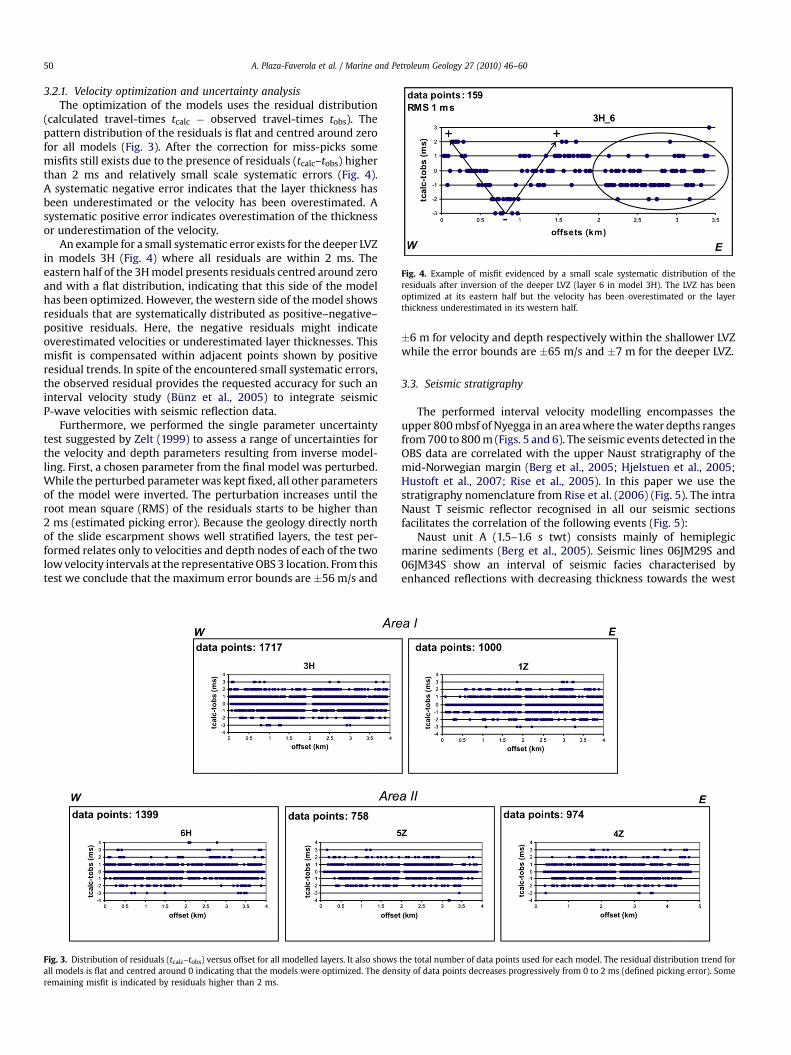
Fig. 4. Example of misfit evidenced by a small scale systematic distribution of theresiduals after inversion of the deeper LVZ (layer 6 in model 3H). The LVZ has beenoptimized at its eastern half but the velocity has been overestimated or the layerthickness underestimated in its western half.
A. Plaza-Faverola et al. / Marine and Petroleum Geology 27 (2010) 46–6050
3.2.1. Velocity optimization and uncertainty analysisThe optimization of the models uses the residual distribution
(calculated travel-times tcalc � observed travel-times tobs). Thepattern distribution of the residuals is flat and centred around zerofor all models (Fig. 3). After the correction for miss-picks somemisfits still exists due to the presence of residuals (tcalc–tobs) higherthan 2 ms and relatively small scale systematic errors (Fig. 4).A systematic negative error indicates that the layer thickness hasbeen underestimated or the velocity has been overestimated. Asystematic positive error indicates overestimation of the thicknessor underestimation of the velocity.
An example for a small systematic error exists for the deeper LVZin models 3H (Fig. 4) where all residuals are within 2 ms. Theeastern half of the 3H model presents residuals centred around zeroand with a flat distribution, indicating that this side of the modelhas been optimized. However, the western side of the model showsresiduals that are systematically distributed as positive–negative–positive residuals. Here, the negative residuals might indicateoverestimated velocities or underestimated layer thicknesses. Thismisfit is compensated within adjacent points shown by positiveresidual trends. In spite of the encountered small systematic errors,the observed residual provides the requested accuracy for such aninterval velocity study (Bunz et al., 2005) to integrate seismicP-wave velocities with seismic reflection data.
Furthermore, we performed the single parameter uncertaintytest suggested by Zelt (1999) to assess a range of uncertainties forthe velocity and depth parameters resulting from inverse model-ling. First, a chosen parameter from the final model was perturbed.While the perturbed parameter was kept fixed, all other parametersof the model were inverted. The perturbation increases until theroot mean square (RMS) of the residuals starts to be higher than2 ms (estimated picking error). Because the geology directly northof the slide escarpment shows well stratified layers, the test per-formed relates only to velocities and depth nodes of each of the twolow velocity intervals at the representative OBS 3 location. From thistest we conclude that the maximum error bounds are �56 m/s and
Fig. 3. Distribution of residuals (tcalc–tobs) versus offset for all modelled layers. It also showsall models is flat and centred around 0 indicating that the models were optimized. The densremaining misfit is indicated by residuals higher than 2 ms.
�6 m for velocity and depth respectively within the shallower LVZwhile the error bounds are �65 m/s and �7 m for the deeper LVZ.
3.3. Seismic stratigraphy
The performed interval velocity modelling encompasses theupper 800 mbsf of Nyegga in an area where the water depths rangesfrom 700 to 800 m (Figs. 5 and 6). The seismic events detected in theOBS data are correlated with the upper Naust stratigraphy of themid-Norwegian margin (Berg et al., 2005; Hjelstuen et al., 2005;Hustoft et al., 2007; Rise et al., 2005). In this paper we use thestratigraphy nomenclature from Rise et al. (2006) (Fig. 5). The intraNaust T seismic reflector recognised in all our seismic sectionsfacilitates the correlation of the following events (Fig. 5):
Naust unit A (1.5–1.6 s twt) consists mainly of hemiplegicmarine sediments (Berg et al., 2005). Seismic lines 06JM29S and06JM34S show an interval of seismic facies characterised byenhanced reflections with decreasing thickness towards the west
the total number of data points used for each model. The residual distribution trend fority of data points decreases progressively from 0 to 2 ms (defined picking error). Some
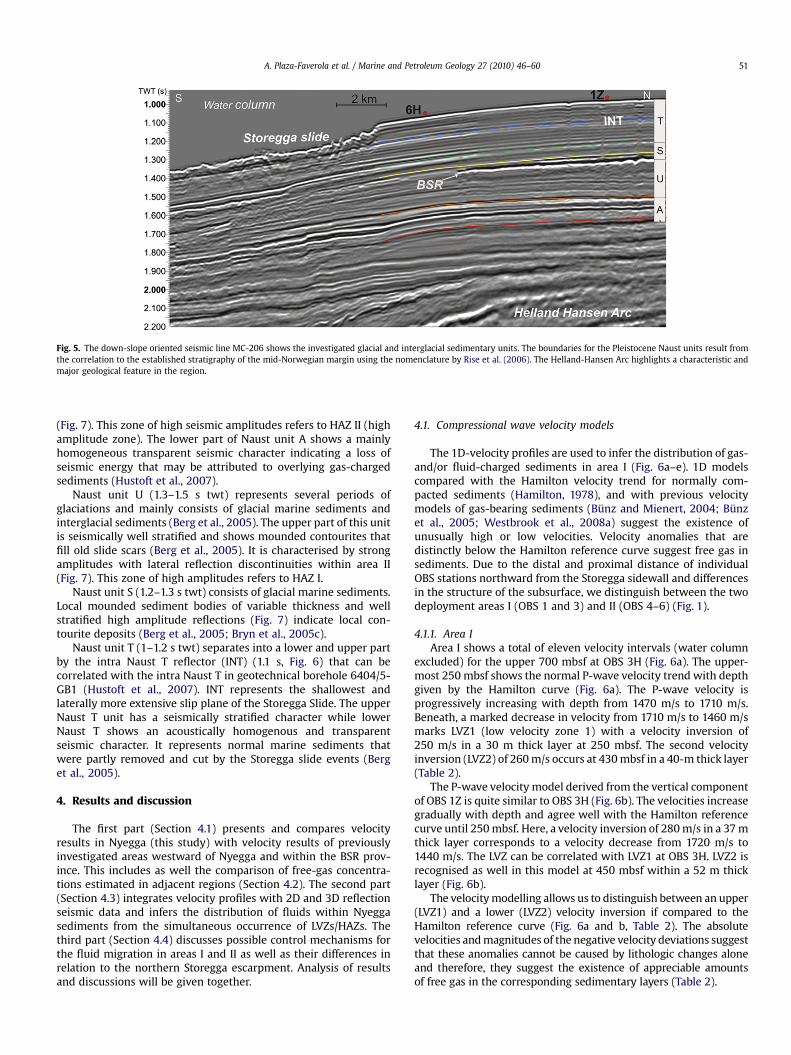
Fig. 5. The down-slope oriented seismic line MC-206 shows the investigated glacial and interglacial sedimentary units. The boundaries for the Pleistocene Naust units result fromthe correlation to the established stratigraphy of the mid-Norwegian margin using the nomenclature by Rise et al. (2006). The Helland-Hansen Arc highlights a characteristic andmajor geological feature in the region.
A. Plaza-Faverola et al. / Marine and Petroleum Geology 27 (2010) 46–60 51
(Fig. 7). This zone of high seismic amplitudes refers to HAZ II (highamplitude zone). The lower part of Naust unit A shows a mainlyhomogeneous transparent seismic character indicating a loss ofseismic energy that may be attributed to overlying gas-chargedsediments (Hustoft et al., 2007).
Naust unit U (1.3–1.5 s twt) represents several periods ofglaciations and mainly consists of glacial marine sediments andinterglacial sediments (Berg et al., 2005). The upper part of this unitis seismically well stratified and shows mounded contourites thatfill old slide scars (Berg et al., 2005). It is characterised by strongamplitudes with lateral reflection discontinuities within area II(Fig. 7). This zone of high amplitudes refers to HAZ I.
Naust unit S (1.2–1.3 s twt) consists of glacial marine sediments.Local mounded sediment bodies of variable thickness and wellstratified high amplitude reflections (Fig. 7) indicate local con-tourite deposits (Berg et al., 2005; Bryn et al., 2005c).
Naust unit T (1–1.2 s twt) separates into a lower and upper partby the intra Naust T reflector (INT) (1.1 s, Fig. 6) that can becorrelated with the intra Naust T in geotechnical borehole 6404/5-GB1 (Hustoft et al., 2007). INT represents the shallowest andlaterally more extensive slip plane of the Storegga Slide. The upperNaust T unit has a seismically stratified character while lowerNaust T shows an acoustically homogenous and transparentseismic character. It represents normal marine sediments thatwere partly removed and cut by the Storegga slide events (Berget al., 2005).
4. Results and discussion
The first part (Section 4.1) presents and compares velocityresults in Nyegga (this study) with velocity results of previouslyinvestigated areas westward of Nyegga and within the BSR prov-ince. This includes as well the comparison of free-gas concentra-tions estimated in adjacent regions (Section 4.2). The second part(Section 4.3) integrates velocity profiles with 2D and 3D reflectionseismic data and infers the distribution of fluids within Nyeggasediments from the simultaneous occurrence of LVZs/HAZs. Thethird part (Section 4.4) discusses possible control mechanisms forthe fluid migration in areas I and II as well as their differences inrelation to the northern Storegga escarpment. Analysis of resultsand discussions will be given together.
4.1. Compressional wave velocity models
The 1D-velocity profiles are used to infer the distribution of gas-and/or fluid-charged sediments in area I (Fig. 6a–e). 1D modelscompared with the Hamilton velocity trend for normally com-pacted sediments (Hamilton, 1978), and with previous velocitymodels of gas-bearing sediments (Bunz and Mienert, 2004; Bunzet al., 2005; Westbrook et al., 2008a) suggest the existence ofunusually high or low velocities. Velocity anomalies that aredistinctly below the Hamilton reference curve suggest free gas insediments. Due to the distal and proximal distance of individualOBS stations northward from the Storegga sidewall and differencesin the structure of the subsurface, we distinguish between the twodeployment areas I (OBS 1 and 3) and II (OBS 4–6) (Fig. 1).
4.1.1. Area IArea I shows a total of eleven velocity intervals (water column
excluded) for the upper 700 mbsf at OBS 3H (Fig. 6a). The upper-most 250 mbsf shows the normal P-wave velocity trend with depthgiven by the Hamilton curve (Fig. 6a). The P-wave velocity isprogressively increasing with depth from 1470 m/s to 1710 m/s.Beneath, a marked decrease in velocity from 1710 m/s to 1460 m/smarks LVZ1 (low velocity zone 1) with a velocity inversion of250 m/s in a 30 m thick layer at 250 mbsf. The second velocityinversion (LVZ2) of 260 m/s occurs at 430 mbsf in a 40-m thick layer(Table 2).
The P-wave velocity model derived from the vertical componentof OBS 1Z is quite similar to OBS 3H (Fig. 6b). The velocities increasegradually with depth and agree well with the Hamilton referencecurve until 250 mbsf. Here, a velocity inversion of 280 m/s in a 37 mthick layer corresponds to a velocity decrease from 1720 m/s to1440 m/s. The LVZ can be correlated with LVZ1 at OBS 3H. LVZ2 isrecognised as well in this model at 450 mbsf within a 52 m thicklayer (Fig. 6b).
The velocity modelling allows us to distinguish between an upper(LVZ1) and a lower (LVZ2) velocity inversion if compared to theHamilton reference curve (Fig. 6a and b, Table 2). The absolutevelocities and magnitudes of the negative velocity deviations suggestthat these anomalies cannot be caused by lithologic changes aloneand therefore, they suggest the existence of appreciable amountsof free gas in the corresponding sedimentary layers (Table 2).
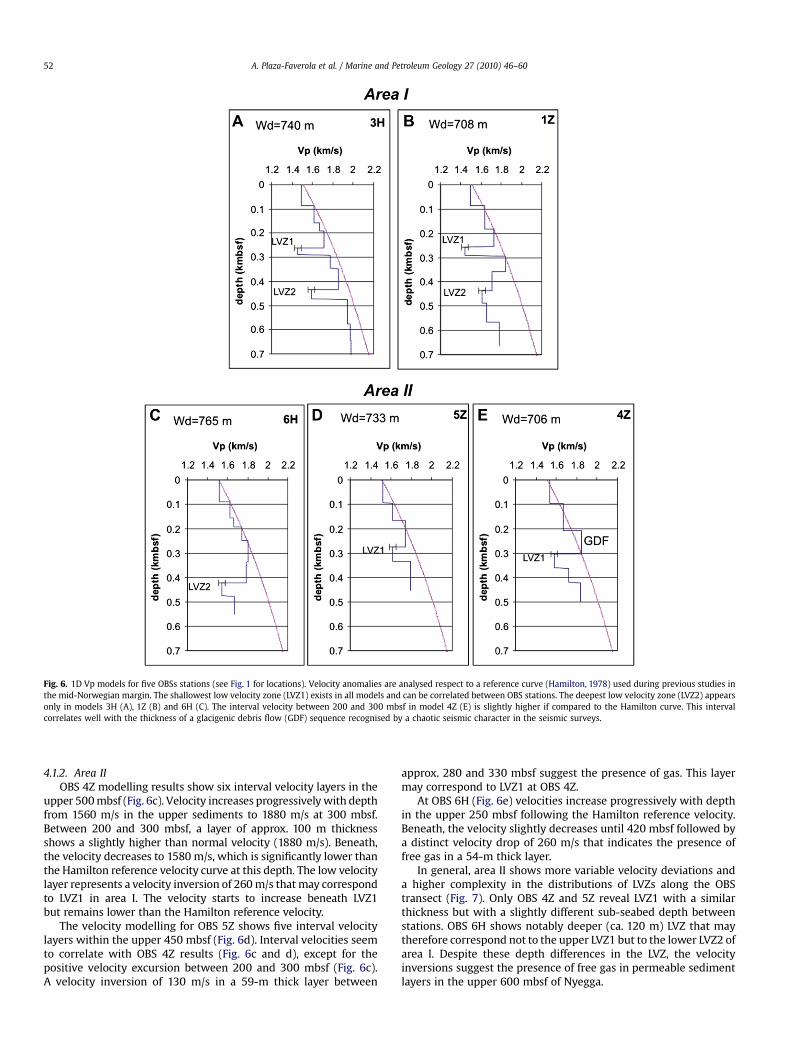
Fig. 6. 1D Vp models for five OBSs stations (see Fig. 1 for locations). Velocity anomalies are analysed respect to a reference curve (Hamilton, 1978) used during previous studies inthe mid-Norwegian margin. The shallowest low velocity zone (LVZ1) exists in all models and can be correlated between OBS stations. The deepest low velocity zone (LVZ2) appearsonly in models 3H (A), 1Z (B) and 6H (C). The interval velocity between 200 and 300 mbsf in model 4Z (E) is slightly higher if compared to the Hamilton curve. This intervalcorrelates well with the thickness of a glacigenic debris flow (GDF) sequence recognised by a chaotic seismic character in the seismic surveys.
A. Plaza-Faverola et al. / Marine and Petroleum Geology 27 (2010) 46–6052
4.1.2. Area IIOBS 4Z modelling results show six interval velocity layers in the
upper 500 mbsf (Fig. 6c). Velocity increases progressively with depthfrom 1560 m/s in the upper sediments to 1880 m/s at 300 mbsf.Between 200 and 300 mbsf, a layer of approx. 100 m thicknessshows a slightly higher than normal velocity (1880 m/s). Beneath,the velocity decreases to 1580 m/s, which is significantly lower thanthe Hamilton reference velocity curve at this depth. The low velocitylayer represents a velocity inversion of 260 m/s that may correspondto LVZ1 in area I. The velocity starts to increase beneath LVZ1but remains lower than the Hamilton reference velocity.
The velocity modelling for OBS 5Z shows five interval velocitylayers within the upper 450 mbsf (Fig. 6d). Interval velocities seemto correlate with OBS 4Z results (Fig. 6c and d), except for thepositive velocity excursion between 200 and 300 mbsf (Fig. 6c).A velocity inversion of 130 m/s in a 59-m thick layer between
approx. 280 and 330 mbsf suggest the presence of gas. This layermay correspond to LVZ1 at OBS 4Z.
At OBS 6H (Fig. 6e) velocities increase progressively with depthin the upper 250 mbsf following the Hamilton reference velocity.Beneath, the velocity slightly decreases until 420 mbsf followed bya distinct velocity drop of 260 m/s that indicates the presence offree gas in a 54-m thick layer.
In general, area II shows more variable velocity deviations anda higher complexity in the distributions of LVZs along the OBStransect (Fig. 7). Only OBS 4Z and 5Z reveal LVZ1 with a similarthickness but with a slightly different sub-seabed depth betweenstations. OBS 6H shows notably deeper (ca. 120 m) LVZ that maytherefore correspond not to the upper LVZ1 but to the lower LVZ2 ofarea I. Despite these depth differences in the LVZ, the velocityinversions suggest the presence of free gas in permeable sedimentlayers in the upper 600 mbsf of Nyegga.
A. Plaza-Faverola et al. / Marine and Petroleum Geology 27 (2010) 46–60 53
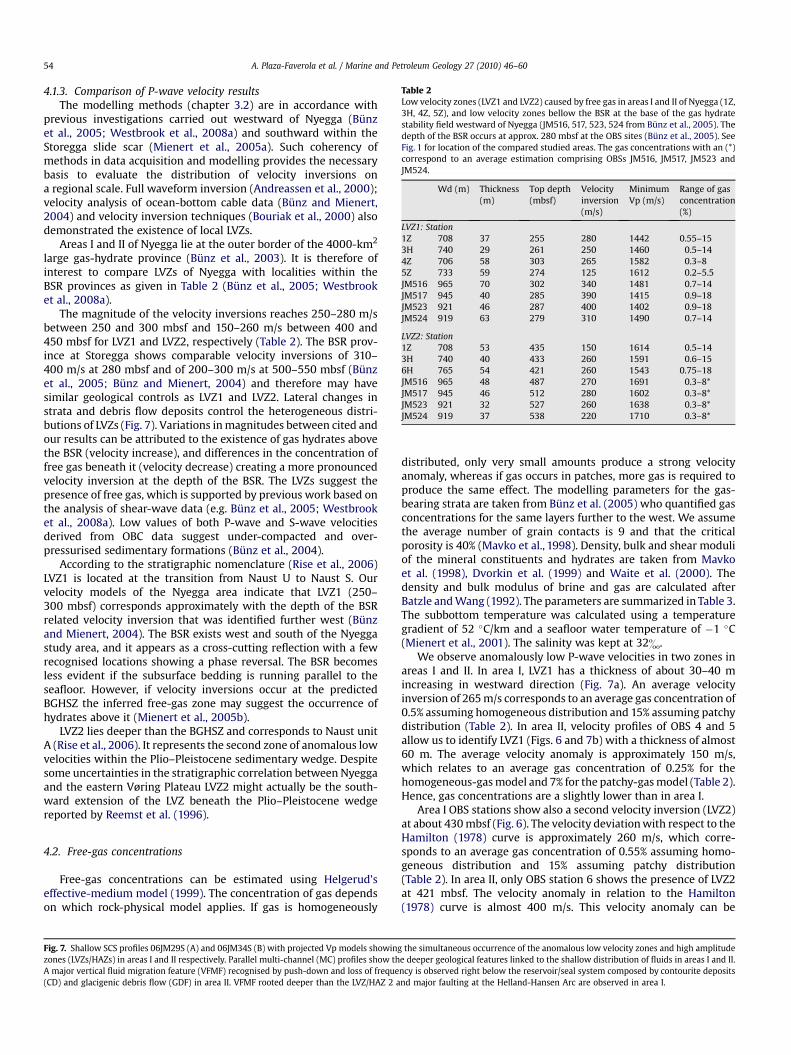
Table 2Low velocity zones (LVZ1 and LVZ2) caused by free gas in areas I and II of Nyegga (1Z,3H, 4Z, 5Z), and low velocity zones bellow the BSR at the base of the gas hydratestability field westward of Nyegga (JM516, 517, 523, 524 from Bunz et al., 2005). Thedepth of the BSR occurs at approx. 280 mbsf at the OBS sites (Bunz et al., 2005). SeeFig. 1 for location of the compared studied areas. The gas concentrations with an (*)correspond to an average estimation comprising OBSs JM516, JM517, JM523 andJM524.
Wd (m) Thickness(m)
Top depth(mbsf)
Velocityinversion(m/s)
MinimumVp (m/s)
Range of gasconcentration(%)
LVZ1: Station1Z 708 37 255 280 1442 0.55–153H 740 29 261 250 1460 0.5–144Z 706 58 303 265 1582 0.3–85Z 733 59 274 125 1612 0.2–5.5JM516 965 70 302 340 1481 0.7–14JM517 945 40 285 390 1415 0.9–18JM523 921 46 287 400 1402 0.9–18JM524 919 63 279 310 1490 0.7–14
LVZ2: Station1Z 708 53 435 150 1614 0.5–143H 740 40 433 260 1591 0.6–156H 765 54 421 260 1543 0.75–18JM516 965 48 487 270 1691 0.3–8*JM517 945 46 512 280 1602 0.3–8*JM523 921 32 527 260 1638 0.3–8*JM524 919 37 538 220 1710 0.3–8*
A. Plaza-Faverola et al. / Marine and Petroleum Geology 27 (2010) 46–6054
4.1.3. Comparison of P-wave velocity resultsThe modelling methods (chapter 3.2) are in accordance with
previous investigations carried out westward of Nyegga (Bunzet al., 2005; Westbrook et al., 2008a) and southward within theStoregga slide scar (Mienert et al., 2005a). Such coherency ofmethods in data acquisition and modelling provides the necessarybasis to evaluate the distribution of velocity inversions ona regional scale. Full waveform inversion (Andreassen et al., 2000);velocity analysis of ocean-bottom cable data (Bunz and Mienert,2004) and velocity inversion techniques (Bouriak et al., 2000) alsodemonstrated the existence of local LVZs.
Areas I and II of Nyegga lie at the outer border of the 4000-km2
large gas-hydrate province (Bunz et al., 2003). It is therefore ofinterest to compare LVZs of Nyegga with localities within theBSR provinces as given in Table 2 (Bunz et al., 2005; Westbrooket al., 2008a).
The magnitude of the velocity inversions reaches 250–280 m/sbetween 250 and 300 mbsf and 150–260 m/s between 400 and450 mbsf for LVZ1 and LVZ2, respectively (Table 2). The BSR prov-ince at Storegga shows comparable velocity inversions of 310–400 m/s at 280 mbsf and of 200–300 m/s at 500–550 mbsf (Bunzet al., 2005; Bunz and Mienert, 2004) and therefore may havesimilar geological controls as LVZ1 and LVZ2. Lateral changes instrata and debris flow deposits control the heterogeneous distri-butions of LVZs (Fig. 7). Variations in magnitudes between cited andour results can be attributed to the existence of gas hydrates abovethe BSR (velocity increase), and differences in the concentration offree gas beneath it (velocity decrease) creating a more pronouncedvelocity inversion at the depth of the BSR. The LVZs suggest thepresence of free gas, which is supported by previous work based onthe analysis of shear-wave data (e.g. Bunz et al., 2005; Westbrooket al., 2008a). Low values of both P-wave and S-wave velocitiesderived from OBC data suggest under-compacted and over-pressurised sedimentary formations (Bunz et al., 2004).
According to the stratigraphic nomenclature (Rise et al., 2006)LVZ1 is located at the transition from Naust U to Naust S. Ourvelocity models of the Nyegga area indicate that LVZ1 (250–300 mbsf) corresponds approximately with the depth of the BSRrelated velocity inversion that was identified further west (Bunzand Mienert, 2004). The BSR exists west and south of the Nyeggastudy area, and it appears as a cross-cutting reflection with a fewrecognised locations showing a phase reversal. The BSR becomesless evident if the subsurface bedding is running parallel to theseafloor. However, if velocity inversions occur at the predictedBGHSZ the inferred free-gas zone may suggest the occurrence ofhydrates above it (Mienert et al., 2005b).
LVZ2 lies deeper than the BGHSZ and corresponds to Naust unitA (Rise et al., 2006). It represents the second zone of anomalous lowvelocities within the Plio–Pleistocene sedimentary wedge. Despitesome uncertainties in the stratigraphic correlation between Nyeggaand the eastern Vøring Plateau LVZ2 might actually be the south-ward extension of the LVZ beneath the Plio–Pleistocene wedgereported by Reemst et al. (1996).
4.2. Free-gas concentrations
Free-gas concentrations can be estimated using Helgerud’seffective-medium model (1999). The concentration of gas dependson which rock-physical model applies. If gas is homogeneously
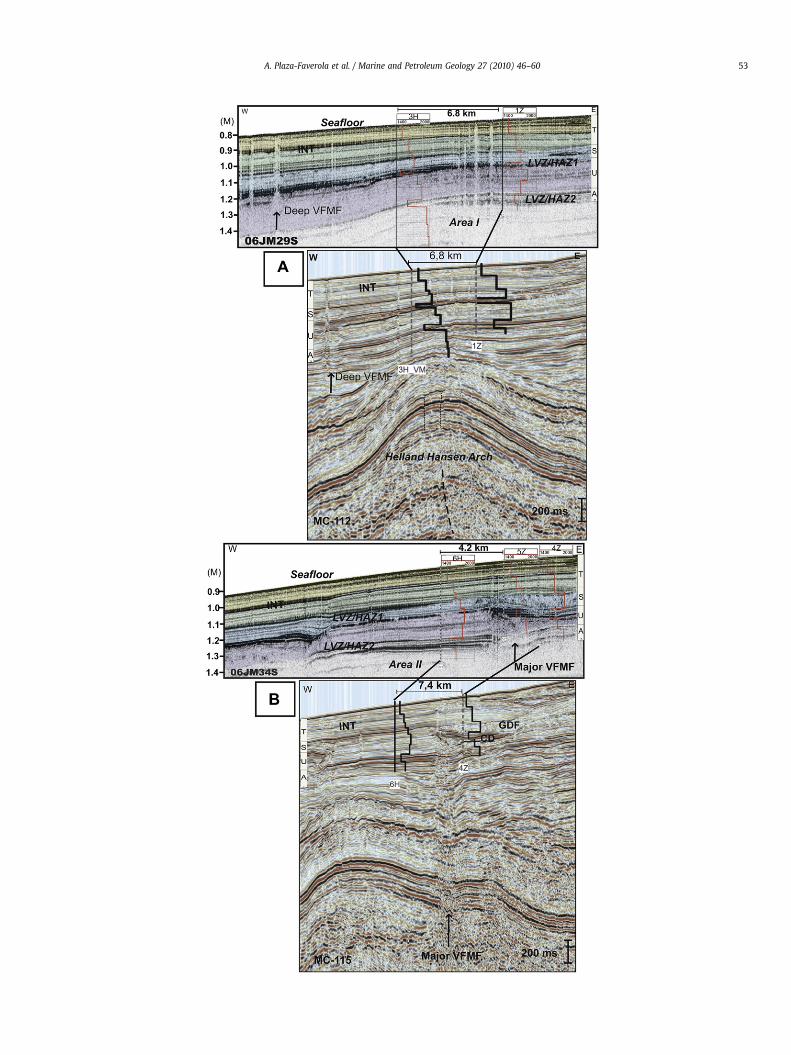
Fig. 7. Shallow SCS profiles 06JM29S (A) and 06JM34S (B) with projected Vp models showingzones (LVZs/HAZs) in areas I and II respectively. Parallel multi-channel (MC) profiles show thA major vertical fluid migration feature (VFMF) recognised by push-down and loss of freque(CD) and glacigenic debris flow (GDF) in area II. VFMF rooted deeper than the LVZ/HAZ 2 a
distributed, only very small amounts produce a strong velocityanomaly, whereas if gas occurs in patches, more gas is required toproduce the same effect. The modelling parameters for the gas-bearing strata are taken from Bunz et al. (2005) who quantified gasconcentrations for the same layers further to the west. We assumethe average number of grain contacts is 9 and that the criticalporosity is 40% (Mavko et al., 1998). Density, bulk and shear moduliof the mineral constituents and hydrates are taken from Mavkoet al. (1998), Dvorkin et al. (1999) and Waite et al. (2000). Thedensity and bulk modulus of brine and gas are calculated afterBatzle and Wang (1992). The parameters are summarized in Table 3.The subbottom temperature was calculated using a temperaturegradient of 52 �C/km and a seafloor water temperature of �1 �C(Mienert et al., 2001). The salinity was kept at 32&.
We observe anomalously low P-wave velocities in two zones inareas I and II. In area I, LVZ1 has a thickness of about 30–40 mincreasing in westward direction (Fig. 7a). An average velocityinversion of 265 m/s corresponds to an average gas concentration of0.5% assuming homogeneous distribution and 15% assuming patchydistribution (Table 2). In area II, velocity profiles of OBS 4 and 5allow us to identify LVZ1 (Figs. 6 and 7b) with a thickness of almost60 m. The average velocity anomaly is approximately 150 m/s,which relates to an average gas concentration of 0.25% for thehomogeneous-gas model and 7% for the patchy-gas model (Table 2).Hence, gas concentrations are a slightly lower than in area I.
Area I OBS stations show also a second velocity inversion (LVZ2)at about 430 mbsf (Fig. 6). The velocity deviation with respect to theHamilton (1978) curve is approximately 260 m/s, which corre-sponds to an average gas concentration of 0.55% assuming homo-geneous distribution and 15% assuming patchy distribution(Table 2). In area II, only OBS station 6 shows the presence of LVZ2at 421 mbsf. The velocity anomaly in relation to the Hamilton(1978) curve is almost 400 m/s. This velocity anomaly can be
the simultaneous occurrence of the anomalous low velocity zones and high amplitudee deeper geological features linked to the shallow distribution of fluids in areas I and II.ncy is observed right below the reservoir/seal system composed by contourite depositsnd major faulting at the Helland-Hansen Arc are observed in area I.
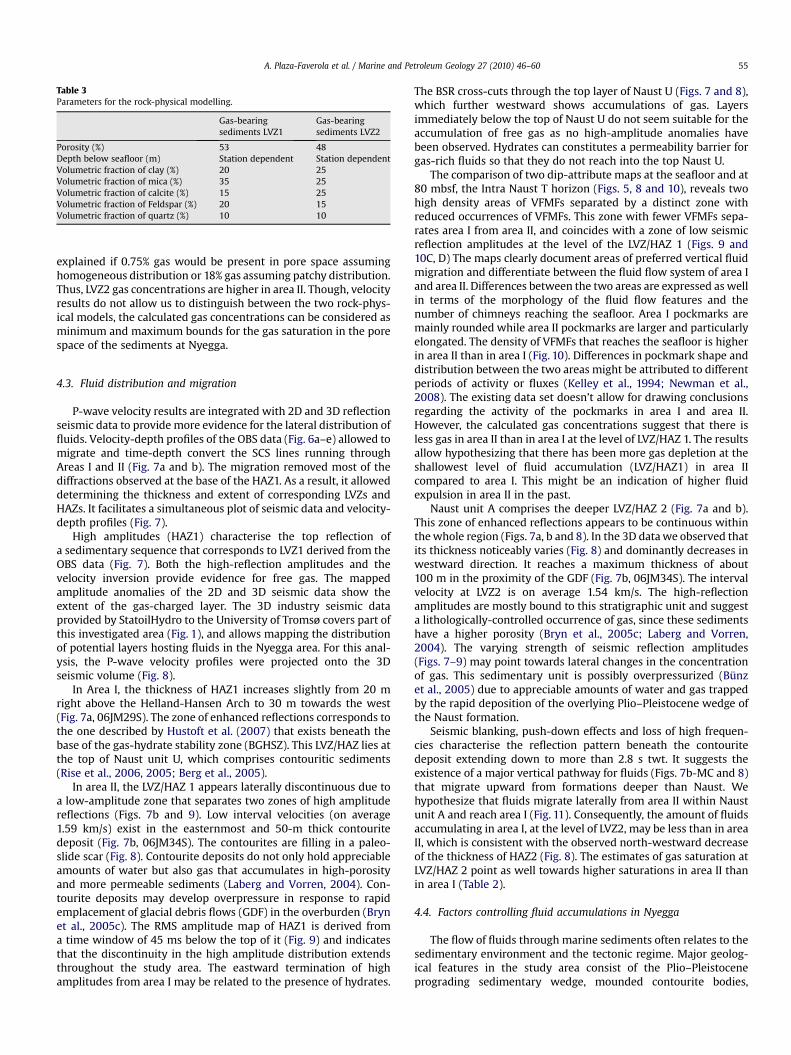
Table 3Parameters for the rock-physical modelling.
Gas-bearingsediments LVZ1
Gas-bearingsediments LVZ2
Porosity (%) 53 48Depth below seafloor (m) Station dependent Station dependentVolumetric fraction of clay (%) 20 25Volumetric fraction of mica (%) 35 25Volumetric fraction of calcite (%) 15 25Volumetric fraction of Feldspar (%) 20 15Volumetric fraction of quartz (%) 10 10
A. Plaza-Faverola et al. / Marine and Petroleum Geology 27 (2010) 46–60 55
explained if 0.75% gas would be present in pore space assuminghomogeneous distribution or 18% gas assuming patchy distribution.Thus, LVZ2 gas concentrations are higher in area II. Though, velocityresults do not allow us to distinguish between the two rock-phys-ical models, the calculated gas concentrations can be considered asminimum and maximum bounds for the gas saturation in the porespace of the sediments at Nyegga.
4.3. Fluid distribution and migration
P-wave velocity results are integrated with 2D and 3D reflectionseismic data to provide more evidence for the lateral distribution offluids. Velocity-depth profiles of the OBS data (Fig. 6a–e) allowed tomigrate and time-depth convert the SCS lines running throughAreas I and II (Fig. 7a and b). The migration removed most of thediffractions observed at the base of the HAZ1. As a result, it alloweddetermining the thickness and extent of corresponding LVZs andHAZs. It facilitates a simultaneous plot of seismic data and velocity-depth profiles (Fig. 7).
High amplitudes (HAZ1) characterise the top reflection ofa sedimentary sequence that corresponds to LVZ1 derived from theOBS data (Fig. 7). Both the high-reflection amplitudes and thevelocity inversion provide evidence for free gas. The mappedamplitude anomalies of the 2D and 3D seismic data show theextent of the gas-charged layer. The 3D industry seismic dataprovided by StatoilHydro to the University of Tromsø covers part ofthis investigated area (Fig. 1), and allows mapping the distributionof potential layers hosting fluids in the Nyegga area. For this anal-ysis, the P-wave velocity profiles were projected onto the 3Dseismic volume (Fig. 8).
In Area I, the thickness of HAZ1 increases slightly from 20 mright above the Helland-Hansen Arch to 30 m towards the west(Fig. 7a, 06JM29S). The zone of enhanced reflections corresponds tothe one described by Hustoft et al. (2007) that exists beneath thebase of the gas-hydrate stability zone (BGHSZ). This LVZ/HAZ lies atthe top of Naust unit U, which comprises contouritic sediments(Rise et al., 2006, 2005; Berg et al., 2005).
In area II, the LVZ/HAZ 1 appears laterally discontinuous due toa low-amplitude zone that separates two zones of high amplitudereflections (Figs. 7b and 9). Low interval velocities (on average1.59 km/s) exist in the easternmost and 50-m thick contouritedeposit (Fig. 7b, 06JM34S). The contourites are filling in a paleo-slide scar (Fig. 8). Contourite deposits do not only hold appreciableamounts of water but also gas that accumulates in high-porosityand more permeable sediments (Laberg and Vorren, 2004). Con-tourite deposits may develop overpressure in response to rapidemplacement of glacial debris flows (GDF) in the overburden (Brynet al., 2005c). The RMS amplitude map of HAZ1 is derived froma time window of 45 ms below the top of it (Fig. 9) and indicatesthat the discontinuity in the high amplitude distribution extendsthroughout the study area. The eastward termination of highamplitudes from area I may be related to the presence of hydrates.
The BSR cross-cuts through the top layer of Naust U (Figs. 7 and 8),which further westward shows accumulations of gas. Layersimmediately below the top of Naust U do not seem suitable for theaccumulation of free gas as no high-amplitude anomalies havebeen observed. Hydrates can constitutes a permeability barrier forgas-rich fluids so that they do not reach into the top Naust U.
The comparison of two dip-attribute maps at the seafloor and at80 mbsf, the Intra Naust T horizon (Figs. 5, 8 and 10), reveals twohigh density areas of VFMFs separated by a distinct zone withreduced occurrences of VFMFs. This zone with fewer VFMFs sepa-rates area I from area II, and coincides with a zone of low seismicreflection amplitudes at the level of the LVZ/HAZ 1 (Figs. 9 and10C, D) The maps clearly document areas of preferred vertical fluidmigration and differentiate between the fluid flow system of area Iand area II. Differences between the two areas are expressed as wellin terms of the morphology of the fluid flow features and thenumber of chimneys reaching the seafloor. Area I pockmarks aremainly rounded while area II pockmarks are larger and particularlyelongated. The density of VFMFs that reaches the seafloor is higherin area II than in area I (Fig. 10). Differences in pockmark shape anddistribution between the two areas might be attributed to differentperiods of activity or fluxes (Kelley et al., 1994; Newman et al.,2008). The existing data set doesn’t allow for drawing conclusionsregarding the activity of the pockmarks in area I and area II.However, the calculated gas concentrations suggest that there isless gas in area II than in area I at the level of LVZ/HAZ 1. The resultsallow hypothesizing that there has been more gas depletion at theshallowest level of fluid accumulation (LVZ/HAZ1) in area IIcompared to area I. This might be an indication of higher fluidexpulsion in area II in the past.
Naust unit A comprises the deeper LVZ/HAZ 2 (Fig. 7a and b).This zone of enhanced reflections appears to be continuous withinthe whole region (Figs. 7a, b and 8). In the 3D data we observed thatits thickness noticeably varies (Fig. 8) and dominantly decreases inwestward direction. It reaches a maximum thickness of about100 m in the proximity of the GDF (Fig. 7b, 06JM34S). The intervalvelocity at LVZ2 is on average 1.54 km/s. The high-reflectionamplitudes are mostly bound to this stratigraphic unit and suggesta lithologically-controlled occurrence of gas, since these sedimentshave a higher porosity (Bryn et al., 2005c; Laberg and Vorren,2004). The varying strength of seismic reflection amplitudes(Figs. 7–9) may point towards lateral changes in the concentrationof gas. This sedimentary unit is possibly overpressurized (Bunzet al., 2005) due to appreciable amounts of water and gas trappedby the rapid deposition of the overlying Plio–Pleistocene wedge ofthe Naust formation.
Seismic blanking, push-down effects and loss of high frequen-cies characterise the reflection pattern beneath the contouritedeposit extending down to more than 2.8 s twt. It suggests theexistence of a major vertical pathway for fluids (Figs. 7b-MC and 8)that migrate upward from formations deeper than Naust. Wehypothesize that fluids migrate laterally from area II within Naustunit A and reach area I (Fig. 11). Consequently, the amount of fluidsaccumulating in area I, at the level of LVZ2, may be less than in areaII, which is consistent with the observed north-westward decreaseof the thickness of HAZ2 (Fig. 8). The estimates of gas saturation atLVZ/HAZ 2 point as well towards higher saturations in area II thanin area I (Table 2).
4.4. Factors controlling fluid accumulations in Nyegga
The flow of fluids through marine sediments often relates to thesedimentary environment and the tectonic regime. Major geolog-ical features in the study area consist of the Plio–Pleistoceneprograding sedimentary wedge, mounded contourite bodies,
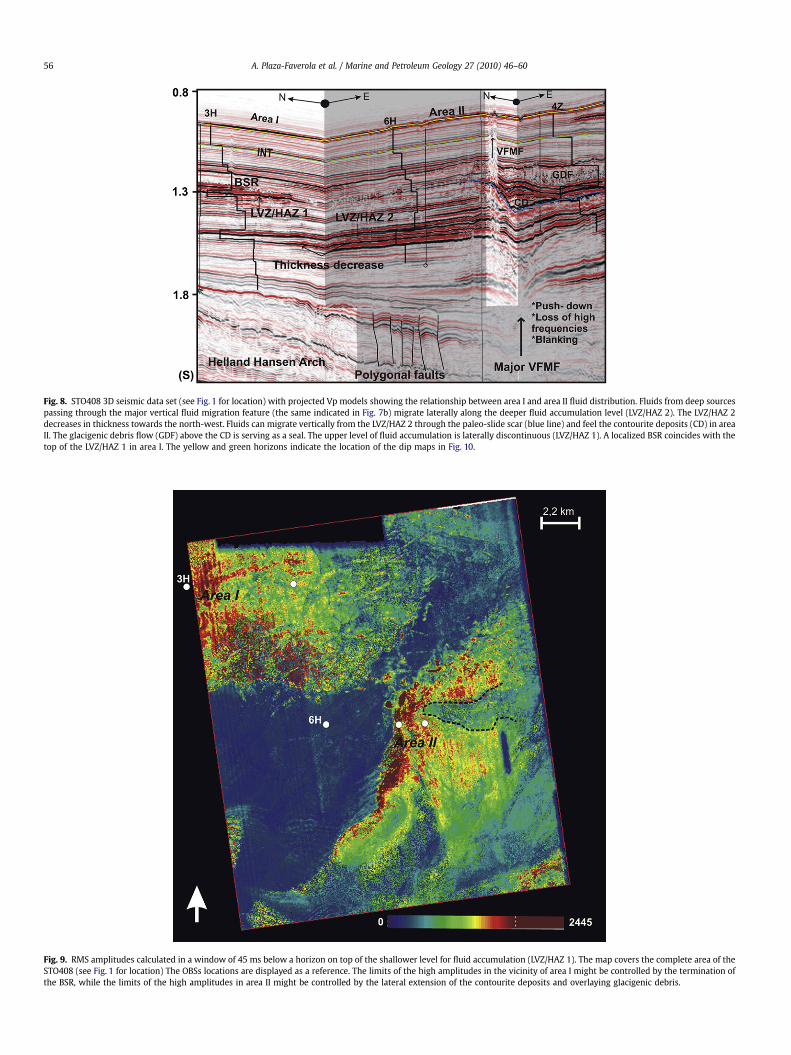
Fig. 8. STO408 3D seismic data set (see Fig. 1 for location) with projected Vp models showing the relationship between area I and area II fluid distribution. Fluids from deep sourcespassing through the major vertical fluid migration feature (the same indicated in Fig. 7b) migrate laterally along the deeper fluid accumulation level (LVZ/HAZ 2). The LVZ/HAZ 2decreases in thickness towards the north-west. Fluids can migrate vertically from the LVZ/HAZ 2 through the paleo-slide scar (blue line) and feel the contourite deposits (CD) in areaII. The glacigenic debris flow (GDF) above the CD is serving as a seal. The upper level of fluid accumulation is laterally discontinuous (LVZ/HAZ 1). A localized BSR coincides with thetop of the LVZ/HAZ 1 in area I. The yellow and green horizons indicate the location of the dip maps in Fig. 10.
Fig. 9. RMS amplitudes calculated in a window of 45 ms below a horizon on top of the shallower level for fluid accumulation (LVZ/HAZ 1). The map covers the complete area of theSTO408 (see Fig. 1 for location) The OBSs locations are displayed as a reference. The limits of the high amplitudes in the vicinity of area I might be controlled by the termination ofthe BSR, while the limits of the high amplitudes in area II might be controlled by the lateral extension of the contourite deposits and overlaying glacigenic debris.
A. Plaza-Faverola et al. / Marine and Petroleum Geology 27 (2010) 46–6056
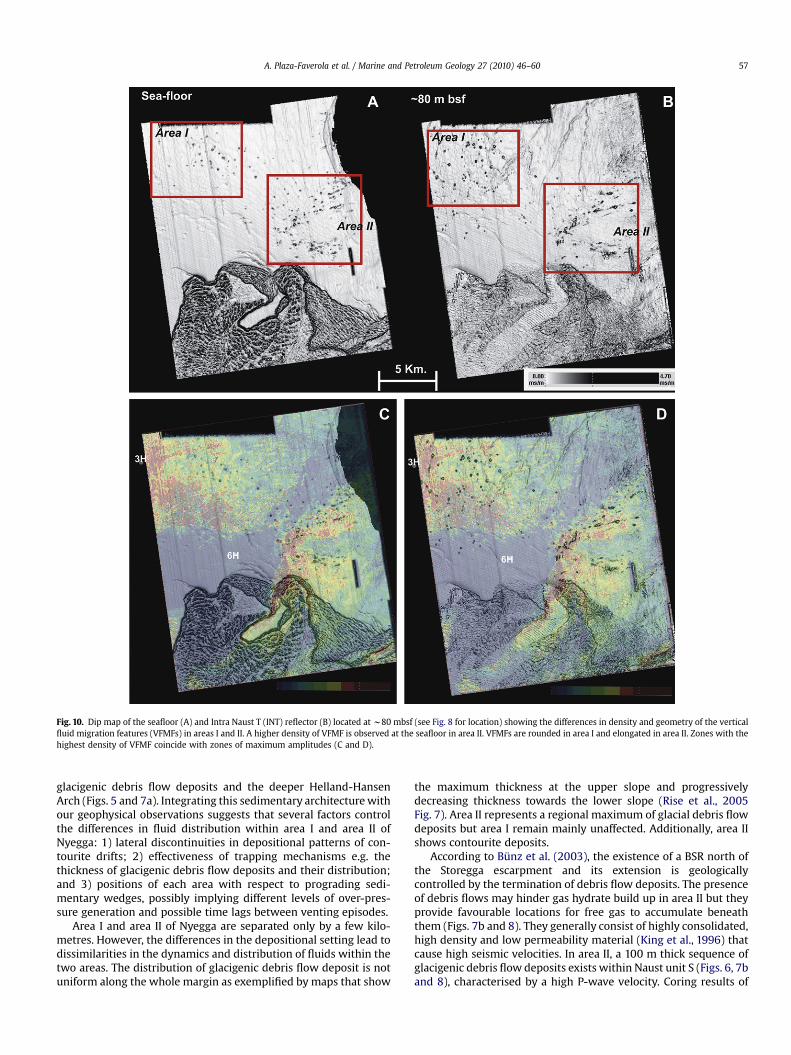
Fig. 10. Dip map of the seafloor (A) and Intra Naust T (INT) reflector (B) located at w80 mbsf (see Fig. 8 for location) showing the differences in density and geometry of the verticalfluid migration features (VFMFs) in areas I and II. A higher density of VFMF is observed at the seafloor in area II. VFMFs are rounded in area I and elongated in area II. Zones with thehighest density of VFMF coincide with zones of maximum amplitudes (C and D).
A. Plaza-Faverola et al. / Marine and Petroleum Geology 27 (2010) 46–60 57
glacigenic debris flow deposits and the deeper Helland-HansenArch (Figs. 5 and 7a). Integrating this sedimentary architecture withour geophysical observations suggests that several factors controlthe differences in fluid distribution within area I and area II ofNyegga: 1) lateral discontinuities in depositional patterns of con-tourite drifts; 2) effectiveness of trapping mechanisms e.g. thethickness of glacigenic debris flow deposits and their distribution;and 3) positions of each area with respect to prograding sedi-mentary wedges, possibly implying different levels of over-pres-sure generation and possible time lags between venting episodes.
Area I and area II of Nyegga are separated only by a few kilo-metres. However, the differences in the depositional setting lead todissimilarities in the dynamics and distribution of fluids within thetwo areas. The distribution of glacigenic debris flow deposit is notuniform along the whole margin as exemplified by maps that show
the maximum thickness at the upper slope and progressivelydecreasing thickness towards the lower slope (Rise et al., 2005Fig. 7). Area II represents a regional maximum of glacial debris flowdeposits but area I remain mainly unaffected. Additionally, area IIshows contourite deposits.
According to Bunz et al. (2003), the existence of a BSR north ofthe Storegga escarpment and its extension is geologicallycontrolled by the termination of debris flow deposits. The presenceof debris flows may hinder gas hydrate build up in area II but theyprovide favourable locations for free gas to accumulate beneaththem (Figs. 7b and 8). They generally consist of highly consolidated,high density and low permeability material (King et al., 1996) thatcause high seismic velocities. In area II, a 100 m thick sequence ofglacigenic debris flow deposits exists within Naust unit S (Figs. 6, 7band 8), characterised by a high P-wave velocity. Coring results of
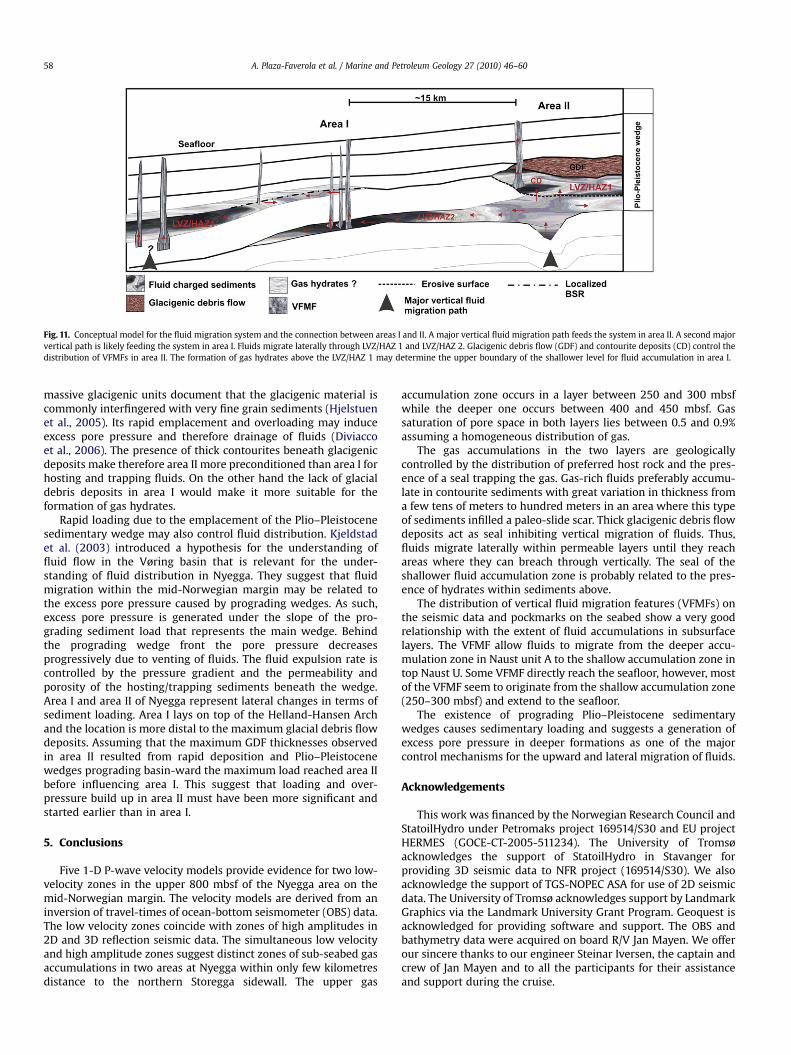
Fig. 11. Conceptual model for the fluid migration system and the connection between areas I and II. A major vertical fluid migration path feeds the system in area II. A second majorvertical path is likely feeding the system in area I. Fluids migrate laterally through LVZ/HAZ 1 and LVZ/HAZ 2. Glacigenic debris flow (GDF) and contourite deposits (CD) control thedistribution of VFMFs in area II. The formation of gas hydrates above the LVZ/HAZ 1 may determine the upper boundary of the shallower level for fluid accumulation in area I.
A. Plaza-Faverola et al. / Marine and Petroleum Geology 27 (2010) 46–6058
massive glacigenic units document that the glacigenic material iscommonly interfingered with very fine grain sediments (Hjelstuenet al., 2005). Its rapid emplacement and overloading may induceexcess pore pressure and therefore drainage of fluids (Diviaccoet al., 2006). The presence of thick contourites beneath glacigenicdeposits make therefore area II more preconditioned than area I forhosting and trapping fluids. On the other hand the lack of glacialdebris deposits in area I would make it more suitable for theformation of gas hydrates.
Rapid loading due to the emplacement of the Plio–Pleistocenesedimentary wedge may also control fluid distribution. Kjeldstadet al. (2003) introduced a hypothesis for the understanding offluid flow in the Vøring basin that is relevant for the under-standing of fluid distribution in Nyegga. They suggest that fluidmigration within the mid-Norwegian margin may be related tothe excess pore pressure caused by prograding wedges. As such,excess pore pressure is generated under the slope of the pro-grading sediment load that represents the main wedge. Behindthe prograding wedge front the pore pressure decreasesprogressively due to venting of fluids. The fluid expulsion rate iscontrolled by the pressure gradient and the permeability andporosity of the hosting/trapping sediments beneath the wedge.Area I and area II of Nyegga represent lateral changes in terms ofsediment loading. Area I lays on top of the Helland-Hansen Archand the location is more distal to the maximum glacial debris flowdeposits. Assuming that the maximum GDF thicknesses observedin area II resulted from rapid deposition and Plio–Pleistocenewedges prograding basin-ward the maximum load reached area IIbefore influencing area I. This suggest that loading and over-pressure build up in area II must have been more significant andstarted earlier than in area I.
5. Conclusions
Five 1-D P-wave velocity models provide evidence for two low-velocity zones in the upper 800 mbsf of the Nyegga area on themid-Norwegian margin. The velocity models are derived from aninversion of travel-times of ocean-bottom seismometer (OBS) data.The low velocity zones coincide with zones of high amplitudes in2D and 3D reflection seismic data. The simultaneous low velocityand high amplitude zones suggest distinct zones of sub-seabed gasaccumulations in two areas at Nyegga within only few kilometresdistance to the northern Storegga sidewall. The upper gas
accumulation zone occurs in a layer between 250 and 300 mbsfwhile the deeper one occurs between 400 and 450 mbsf. Gassaturation of pore space in both layers lies between 0.5 and 0.9%assuming a homogeneous distribution of gas.
The gas accumulations in the two layers are geologicallycontrolled by the distribution of preferred host rock and the pres-ence of a seal trapping the gas. Gas-rich fluids preferably accumu-late in contourite sediments with great variation in thickness froma few tens of meters to hundred meters in an area where this typeof sediments infilled a paleo-slide scar. Thick glacigenic debris flowdeposits act as seal inhibiting vertical migration of fluids. Thus,fluids migrate laterally within permeable layers until they reachareas where they can breach through vertically. The seal of theshallower fluid accumulation zone is probably related to the pres-ence of hydrates within sediments above.
The distribution of vertical fluid migration features (VFMFs) onthe seismic data and pockmarks on the seabed show a very goodrelationship with the extent of fluid accumulations in subsurfacelayers. The VFMF allow fluids to migrate from the deeper accu-mulation zone in Naust unit A to the shallow accumulation zone intop Naust U. Some VFMF directly reach the seafloor, however, mostof the VFMF seem to originate from the shallow accumulation zone(250–300 mbsf) and extend to the seafloor.
The existence of prograding Plio–Pleistocene sedimentarywedges causes sedimentary loading and suggests a generation ofexcess pore pressure in deeper formations as one of the majorcontrol mechanisms for the upward and lateral migration of fluids.
Acknowledgements
This work was financed by the Norwegian Research Council andStatoilHydro under Petromaks project 169514/S30 and EU projectHERMES (GOCE-CT-2005-511234). The University of Tromsøacknowledges the support of StatoilHydro in Stavanger forproviding 3D seismic data to NFR project (169514/S30). We alsoacknowledge the support of TGS-NOPEC ASA for use of 2D seismicdata. The University of Tromsø acknowledges support by LandmarkGraphics via the Landmark University Grant Program. Geoquest isacknowledged for providing software and support. The OBS andbathymetry data were acquired on board R/V Jan Mayen. We offerour sincere thanks to our engineer Steinar Iversen, the captain andcrew of Jan Mayen and to all the participants for their assistanceand support during the cruise.
A. Plaza-Faverola et al. / Marine and Petroleum Geology 27 (2010) 46–60 59
References
Andreassen, K., Mienert, J., Bryn, P. Singh, S.C., 2000. A double gas-hydrate relatedbottom simulating reflector at the Norwegian continental margin. GasHydrates: Challenges for the Future, vol. 912, pp. 126–135.
Batzle, M., Wang, Z.J., 1992. Seismic properties of pore fluids. Geophysics 57,1396–1408.
Berg, K., Solheim, A., Bryn, P., 2005. The Pleistocene to recent geological develop-ment of the Ormen Lange area. Marine and Petroleum Geology 22 (1–2), 45–56.
Berndt, C., 2005. Focused fluid flow in passive continental margins. PhilosophicalTransactions of the Royal Society A – Mathematical Physical and EngineeringSciences 363 (1837), 2855–2871.
Berndt, C., Bunz, S., Mienert, J., 2003. Polygonal fault systems on the mid-Norwegianmargin: a long-term source for fluid flow. Subsurface Sediment Mobilization216, 283–290.
Bouriak, S., Vanneste, M., Saoutkine, A., 2000. Inferred gas hydrates and clay diapirsnear the Storegga Slide on the southern edge of the Voring Plateau, offshoreNorway. Marine Geology 163 (1–4), 125–148.
Brekke, H., 2000. The Tectonic Evolution of the Norwegian Sea Continental Marginwith Emphasis on the Voring and More Basins, Dynamics of the NorwegianMargin. Geological Society Special Publication. Geological Society PublishingHouse, Bath, pp. 327–378.
Bryn, P., Berg, K., Forsberg, C.F., Solheim, A., Kvalstad, T.J., 2005a. Explaining theStoregga slide. Marine and Petroleum Geology 22 (1-2), 11–19.
Bryn, P., Berg, K., Lien, R., Solheim, A., 2005b. Submarine slides on the mid-Norwegian continental margin – a challenge to the oil industry. Onshore–Offshore Relationships on the North Atlantic Margin, vol. 12, pp. 255–263.
Bryn, P., Berg, K., Stoker, M.S., Haflidason, H., Solheim, A., 2005c. Contourites andtheir relevance for mass wasting along the mid-Norwegian Margin. Marine andPetroleum Geology 22 (1–2), 85–96.
Bunz, S., Mienert, J., Berndt, C., 2003. Geological controls on the Storegga gas-hydrate system of the mid-Norwegian continental margin. Earth and PlanetaryScience Letters 209 (3–4), 291–307.
Bunz, S., Mienert, J., Andreassen, K., 2004. Gas hydrates at the Storegga slide on themid-Norwegian margin. In: AAPG Headberg Conference: Gas Hydrates: EnergyResource Potential and Associated Geological Hazards.
Bunz, S., Mienert, J., Vanneste, M., Andreassen, K., 2005. Gas hydrates at theStoregga Slide: constraints from an analysis of multicomponent, wide-angleseismic data. Geophysics 70 (5), B19–B34.
Bunz, S., Mienert, J., 2004. Acoustic imaging of gas hydrate and free gas at theStoregga Slide. Journal of Geophysical Research – Solid Earth 109, B4.
Carson, B., Kastner, M., Bartlett, D., Jaeger, J., Jannasch, H., Weinstein, Y., 2003.Implications of carbon flux from the Cascadia accretionary prism: results fromlong-term, in situ measurements at ODP Site 892B. Marine Geology 198 (1–2),159–180.
Diviacco, P., Rebesco, M., Camerlenghi, A., 2006. Late Pliocene mega debris flowdeposit and related fluid escapes identified on the Antarctic Peninsula conti-nental margin by seismic reflection data analysis. Marine GeophysicalResearches 27 (2), 109–127.
Dore, A.G., Lundin, E.R., 1996. Cenozoic compressional structures on the NE Atlanticmargin: nature, origin and potential significance for hydrocarbon exploration.Petroleum Geoscience 2 (4), 299–311.
Dvorkin, J., Prasad, M., Sakai, A., Lavoie, D., 1999. Elasticity of marine sediments:rock physics modelling. Geophysical Research Letters 26, 1781–1784.
Gomez, M., Verges, J., 2005. Quantifying the contribution of tectonics vs. differentialcompaction in the development of domes along the Mid-Norwegian Atlanticmargin. Basin Research 17 (2), 289–310.
Hamilton, E.L., 1978. Sound velocity–density relations in sea-floor sediments androcks. The Journal of the Acoustical Society of America 63, 366.
Helgerud, M.B., Dvorkin, J., Nur, A., Sakai, A., Collett, T., 1999. Elastic-wave velocity inmarine sediments with gas hydrates: effective medium modeling. GeophysicalResearch Letters 26, 2021–2024.
Hjelstuen, B.O., Eldholm, O., Skogseid, J., 1999. Cenozoic evolution of the northernVoring margin. Geological Society of America Bulletin 111 (12), 1792–1807.
Hjelstuen, B.O., Sejrup, H.P., Haflidason, H., Nygard, A., Ceramicola, S., Bryn, P., 2005.Late Cenozoic glacial history and evolution of the Storegga Slide area andadjacent slide flank regions, Norwegian continental margin. Marine andPetroleum Geology 22 (1–2), 57–69.
Hovland, M., 1982. Pockmarks and the recent geology of the central section of theNorwegian trench. Marine Geology 47 (3–4), 283–301.
Hovland, M., Svensen, H., Forsberg, C.F., Johansen, H., Fichler, C., Fossa, J.H.,Jonsson, R., Rueslatten, H., 2005. Complex pockmarks with carbonate-ridgesoff mid-Norway: products of sediment degassing. Marine Geology 218 (1–4),191–206.
Hovland, M., Gardner, J.V., Judd, A.G., 2002. The significance of pockmarks tounderstanding fluid flow processes and geohazards. Geofluids 2 (2), 127–136.
Hovland, M., Svensen, H., 2006. Submarine pingoes: indicators of shallow gas hydratesin a pockmark at Nyegga, Norwegian Sea. Marine Geology 228 (1–4), 15–23.
Hustoft, S., Mienert, J., Bunz, S., Nouze, H., 2007. High-resolution 3D-seismic dataindicate focussed fluid migration pathways above polygonal fault systems ofthe mid-Norwegian margin. Marine Geology 245, 89–106.
Ivanov, M., Westbrook, G.K., Blinova, V., Kozlova, E., Mazzini, A., Nouze, H.,Minshull, T.A., 2007. First sampling of gas hydrate from the Vøring Plateau. EosTransactions AGU 88 (19), 209.
Judd, A.G., 2003. The global importance and context of methane escape from theseabed. Geo-Marine Letters 23 (3–4), 147–154.
Kelley, J.T., Dickson, S.M., Belknap, D.F., Barnhardt, W.A., Henderson, M., 1994. Giantsea-bed pockmarks – evidence for gas escape from Belfast Bay, Maine. Geology22 (1), 59–62.
King, E.L., Sejrup, H.P., Haflidason, H., Elverhoi, A., Aarseth, I., 1996. Quaternaryseismic stratigraphy of the North Sea Fan: glacially-fed gravity flow aprons,hemipelagic sediments, and large submarine slides. Marine Geology 130 (3–4),293–315.
Kjeldstad, A., Skogseid, J., Langtangen, H.P., Bjorlykke, K., Hoeg, K., 2003. Differ-ential loading by prograding sedimentary wedges on continental margins:an arch-forming mechanism. Journal of Geophysical Research – Solid Earth108, B1.
Laberg, J.S., Vorren, T.O., 2004. Weichselian and Holocene growth of the northernhigh-latitude Lofoten Contourite Drift on the continental slope of Norway.Sedimentary Geology 164 (1–2), 1–17.
Leynaud, D., Sultan, N., Mienert, J., 2007. The role of sedimentation rate andpermeability in the slope stability of the formerly glaciated Norwegian conti-nental margin: the Storegga slide model. Landslides 4, 297–309.
Løseth, H., Wensaas, L., Arntsen, B., Hanken, N., Basire, C., Graue, K., 2001. 1000 mlong gas blow-out pipes. In: 63rd European Association of Geoscientists andEngineers Conference and Exhibition, Amsterdam, p. 524.
Mavko, G., Mukerji, T., Dvorkin, J., 1998. The Rock Physics Handbook. CambridgeUniversity Press.
Mazzini, A., Svensen, H., Hovland, M., Planke, S., 2006. Comparison and implicationsfrom strikingly different authigenic carbonates in a Nyegga complex pockmark,G11, Norwegian Sea. Marine Geology 231 (1–4), 89–102.
Mienert, J., Bunz, S., Iversen, S., Hustoft, S., Thingnes, V., Perez-Garcia, C., Plaza, A.,Norman, F., Planke, S., Berndt, C., Huggins, R., Royal, R., Floystad, K., 2006.Quantification of Geological Processes that Govern Basin Scale Fluid Flow atNyegga (3D-P-Cable Seismic Test), Petromaks Project, University of Tromsoe,Cruise Report R/V Jan Mayen.
Mienert, J., Posewang, J., Lukas, D., 2001. Changes in the hydrate stability zone onthe Norwegian Margin and their consequences for methane and carbonreleases into the oceanosphere. In: Schafer, P., Ritzrau, W., Schluter, M.,Thiede, J. (Eds.), The Northern North Atlantic: a Changing Environment.Springer Press, pp. 259–280.
Mienert, J., Andreassen, K., Bunz, S., 2003. Gas hydrates and fluid escape features –gas hydrates at Storegga Slide. European Margin Sediment Dynamics: Side-ScanSonar and Seismic Images, pp. 107–110.
Mienert, J., Bunz, S., Guidard, S., Vanneste, M., Berndt, C., 2005a. Ocean bottomseismometer investigations in the Ormen Lange area offshore mid-Norwayprovide evidence for shallow gas layers in subsurface sediments. Marine andPetroleum Geology 22 (1–2), 287–297.
Mienert, J., Vanneste, M., Bunz, S., Andreassen, K., Haflidason, H., Sejrup, H.P., 2005b.Ocean warming and gas hydrate stability on the mid-Norwegian margin at theStoregga Slide. Marine and Petroleum Geology 22 (1–2), 233–244.
Newman, K.R., Cormier, M.H., Weissel, J.K., Driscoll, N.W., Kastner, M., Solomon, E.A.,Robertson, G., Hill, J.C., Singh, H., Camilli, R., Eustice, R., 2008. Active methaneventing observed at giant pockmarks along the US mid-Atlantic shelf break.Earth and Planetary Science Letters 267 (1–2), 341–352.
Paull, C.K., Ussler, W., Holbrook, W.S., Hill, T.M., Keaten, R., Mienert, J., Haflidason, H.,Johnson, J.E., Winters, W.J., Lorenson, T.D., 2008. Origin of pockmarks andchimney structures on the flanks of the Storegga Slide, offshore Norway. Geo-Marine Letters 28, 43–51.
Reemst, P., Skogseid, J., Larsen, B.T., 1996. Base Pliocene velocity inversion on theeastern Voring Margin – causes and implications. Global and Planetary Change12 (1–4), 201–211.
Rise, L., Saettem, J., Fanavoll, S., Thorsnes, T., Ottesen, D., Boe, R., 1999. Sea-bedpockmarks related to fluid migration from Mesozoic bedrock strata inthe Skagerrak offshore Norway. Marine and Petroleum Geology 16 (7),619–631.
Rise, L., Ottesen, D., Berg, K., Lundin, E., 2005. Large-scale development of the mid-Norwegian margin during the last 3 million years. Marine and PetroleumGeology 22 (1–2), 33–44.
Rise, L., Ottesen, D., Longva, O., Solheim, A., Andersen, A.S., Ayers, S., 2006. TheSklinnadjupet slide and its relation to the Elsterian glaciation on the mid-Norwegian margin. Marine and Petroleum Geology 23, 569–583.
Solheim, A., Elverhoi, A., 1993. Gas-related sea-floor craters in the Barents Sea. Geo-Marine Letters 13 (4), 235–243.
Solheim, A., Bryn, P., Sejrup, H.P., Mienert, J., Berg, K., 2005. Ormen Lange – anintegrated study for the safe development of a deep-water gas field within theStoregga Slide Complex, NE Atlantic continental margin; executive summary.Marine and Petroleum Geology 22 (1–2), 1–9.
Vagnes, E., Gabrielsen, R.H., Haremo, P., 1998. Late Cretaceous–Cenozoic intraplatecontractional deformation at the Norwegian continental shelf: timing, magni-tude and regional implications. Tectonophysics 300 (1–4), 29–46.
Waite, W.F., Helgerud, M.B., Nur, A., Pinkston, J.C., Stern, L.A., Kirby, S.H.,Durham, W.B., 2000. Laboratory measurements of compressional and shearwave speeds through methane hydrate. Annals of the New York Academy ofSciences 912, 1003–1010.
Wheeler, A.J., Beyer, A., Freiwald, A., de Haas, H., Huvenne, V.A.I., Kozachenko, M.,Olu-Le Roy, K., Opderbecke, J., 2007. Morphology and environment of cold-water coral carbonate mounds on the NW European margin. InternationalJournal of Earth Sciences 96 (1), 37–56.

A. Plaza-Faverola et al. / Marine and Petroleum Geology 27 (2010) 46–6060
Westbrook, G.K., Chand, S., Rossi, G., Long, C., Bunz, S., Camerlenghi, A., Carcione, J.M.,Dean, S., Foucher, J.-P., Flueh, E., Gei, D., Haacke, R.R., Madrussani, G., Mienert,Minshull, T.A., Nouze, H., Peacock, S., Reston, T.J., Vanneste, M., Zillmer, M.,2008a. Estimation of gas-hydrate concentration from multi-component seismicdata at sites on the continental margins of NW Svalbard and the Storegga regionof Norway. Marine and Petroleum Geology 25, 744–758.
Westbrook, G.K., Minshull, T.A., Nouze, H., Exley, R., Gailler, A., Jose, T., Ker, S.,Plaza, A., 2008b. High-resolution 3D seismic investigations of hydrate-bearing
fluid-escape chimneys in the Nyegga region of the Vøring plateau, Norway. In:Proceedings of the 6th International Conference on Gas Hydrates (ICGH 2008).6–10 July, Vancouver, British Columbia, Canada, 12 pp.
Zelt, C.A., 1999. Modelling strategies and model assessment for wide-angleseismic traveltime data. Geophysical Journal International 139 (1),183–204.
Zelt, C.A., Smith, R.B., 1992. Seismic traveltime inversion for 2-d crustal velocitystructure. Geophysical Journal International 108 (1), 16–34.
Related Documents