14 May 2014 Interim Report Q1 2014 1 Presentation of Interim Report Q1 2014

FLSmidth 1st Quarter Report 2014 Presentation
Jun 27, 2015
FLSmidth first quarter report for 2014 was released on 14 May 2014. Best viewed on a full screen mode, this Interim report for Q1 2014 informs the reader about the latest business and financial update from FLSmidth. It also gives a glimpse of the key highlights in the 1st Quarter as well as FLSmidth's growth strategies and new financial targets projected for the next quarter.
Welcome message from author
This document is posted to help you gain knowledge. Please leave a comment to let me know what you think about it! Share it to your friends and learn new things together.
Transcript

14 May 2014 Interim Report Q1 2014 1
Presentation of Interim Report Q1 2014

Presentation of FLSmidth’s Interim Report 1st quarter 2014
Copenhagen, 14 May 2014 @ 11am CET
Business update – Thomas Schulz, Group CEO
Financial update – Lars Vestergaard, Group CFO
Agenda
Agenda
14 May 2014 Interim Report Q1 2014 2
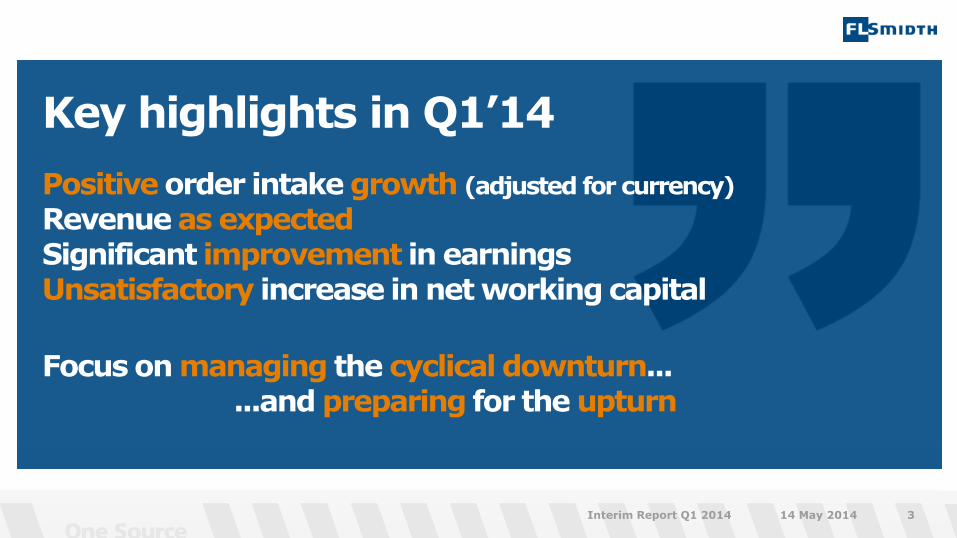
Key highlights in Q1’14
Positive order intake growth (adjusted for currency)
Revenue as expected Significant improvement in earnings Unsatisfactory increase in net working capital
Focus on managing the cyclical downturn... ...and preparing for the upturn
14 May 2014 Interim Report Q1 2014 3
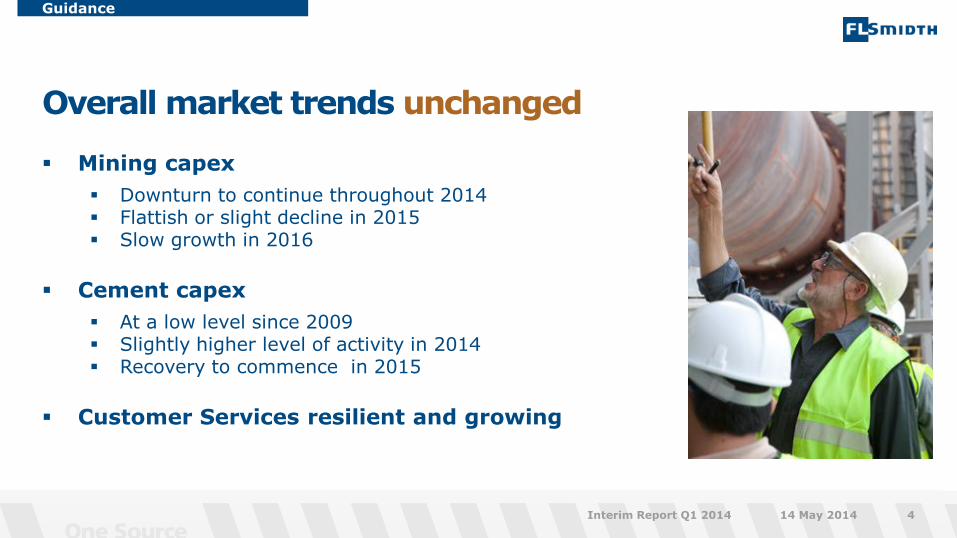
Mining capex
Downturn to continue throughout 2014 Flattish or slight decline in 2015 Slow growth in 2016
Cement capex
At a low level since 2009 Slightly higher level of activity in 2014 Recovery to commence in 2015
Customer Services resilient and growing
Overall market trends unchanged
Guidance
14 May 2014 Interim Report Q1 2014 4
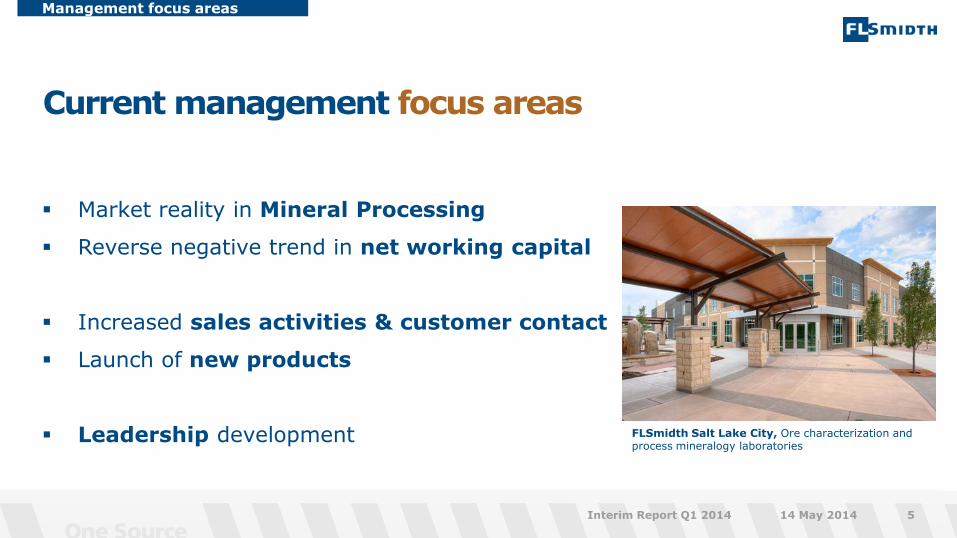
Market reality in Mineral Processing
Reverse negative trend in net working capital
Increased sales activities & customer contact
Launch of new products
Leadership development
Current management focus areas
Management focus areas
14 May 2014 Interim Report Q1 2014 5
FLSmidth Salt Lake City, Ore characterization and process mineralogy laboratories
New FLSmidth office established in Colombia
Mobilisation of O&M contract in Nigeria well under way
License agreement with Kobe Steel, Japan for construction of iron ore pellet process in India
FLSmidth recognised as a leading supplier to the Chilean Mining Industry
FLSmidth BulkExpert™ winner of the 2013 Mining Magazine Bulk Handling award
Operational highlights in Q1 2014
Operation highlights
14 May 2014 Interim Report Q1 2014 6
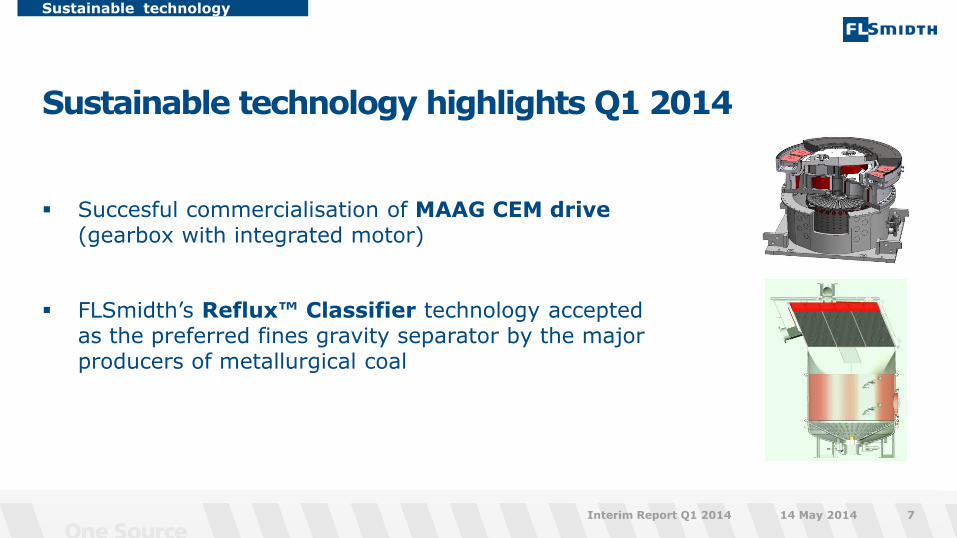
Succesful commercialisation of MAAG CEM drive (gearbox with integrated motor)
FLSmidth’s Reflux™ Classifier technology accepted as the preferred fines gravity separator by the major producers of metallurgical coal
Sustainable technology highlights Q1 2014
Sustainable technology
14 May 2014 Interim Report Q1 2014 7
Efficiency programme on track
Efficiency Programme
14 May 2014 Interim Report Q1 2014 8
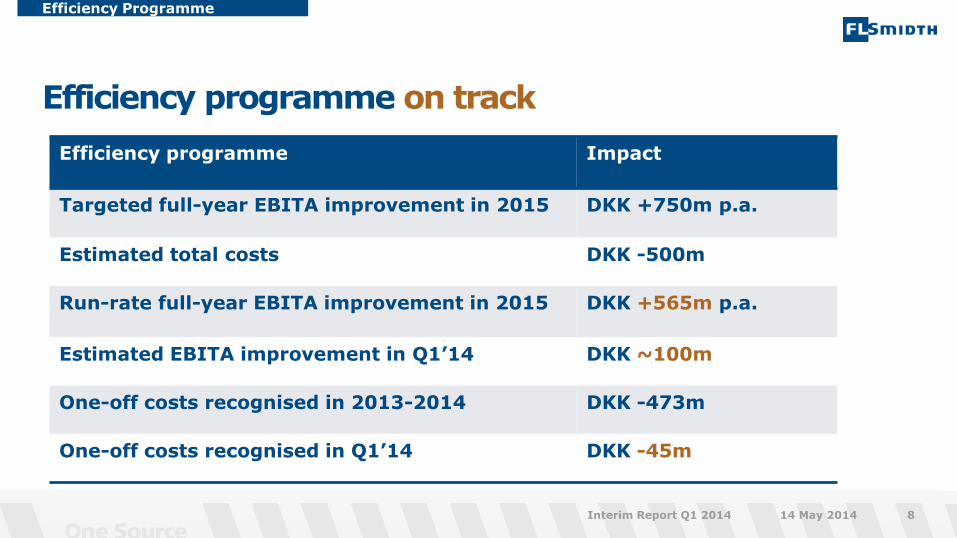
Efficiency programme Impact
Targeted full-year EBITA improvement in 2015 DKK +750m p.a.
Estimated total costs DKK -500m
Run-rate full-year EBITA improvement in 2015 DKK +565m p.a.
Estimated EBITA improvement in Q1’14 DKK ~100m
One-off costs recognised in 2013-2014 DKK -473m
One-off costs recognised in Q1’14 DKK -45m
Efficiency programme update DKK 750m efficiency improvement by 2015
Efficiency Programme
14 May 2014 Interim Report Q1 2014 9
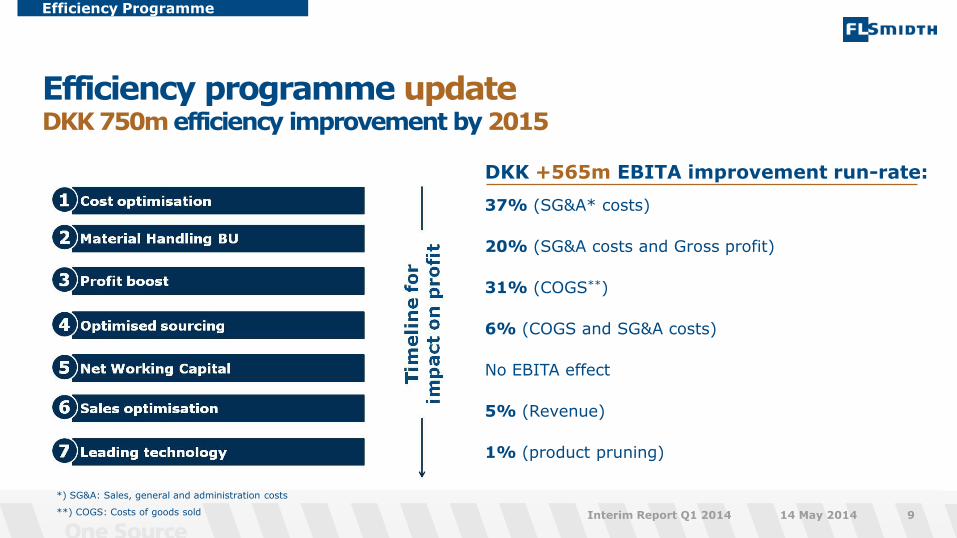
DKK +565m EBITA improvement run-rate:
37% (SG&A* costs)
20% (SG&A costs and Gross profit)
31% (COGS**)
6% (COGS and SG&A costs)
No EBITA effect
5% (Revenue)
1% (product pruning)
*) SG&A: Sales, general and administration costs
**) COGS: Costs of goods sold
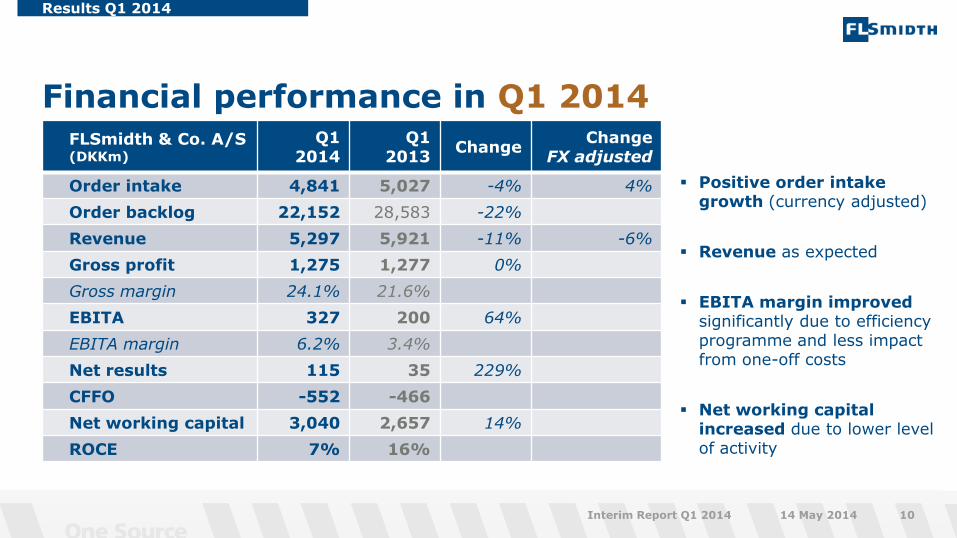
Positive order intake growth (currency adjusted)
Revenue as expected
EBITA margin improved significantly due to efficiency programme and less impact from one-off costs
Net working capital increased due to lower level of activity
Financial performance in Q1 2014
Results Q1 2014
14 May 2014 10 Interim Report Q1 2014
FLSmidth & Co. A/S (DKKm)
Q1 2014
Q1 2013
Change Change
FX adjusted
Order intake 4,841 5,027 -4% 4%
Order backlog 22,152 28,583 -22%
Revenue 5,297 5,921 -11% -6%
Gross profit 1,275 1,277 0%
Gross margin 24.1% 21.6%
EBITA 327 200 64%
EBITA margin 6.2% 3.4%
Net results 115 35 229%
CFFO -552 -466
Net working capital 3,040 2,657 14%
ROCE 7% 16%
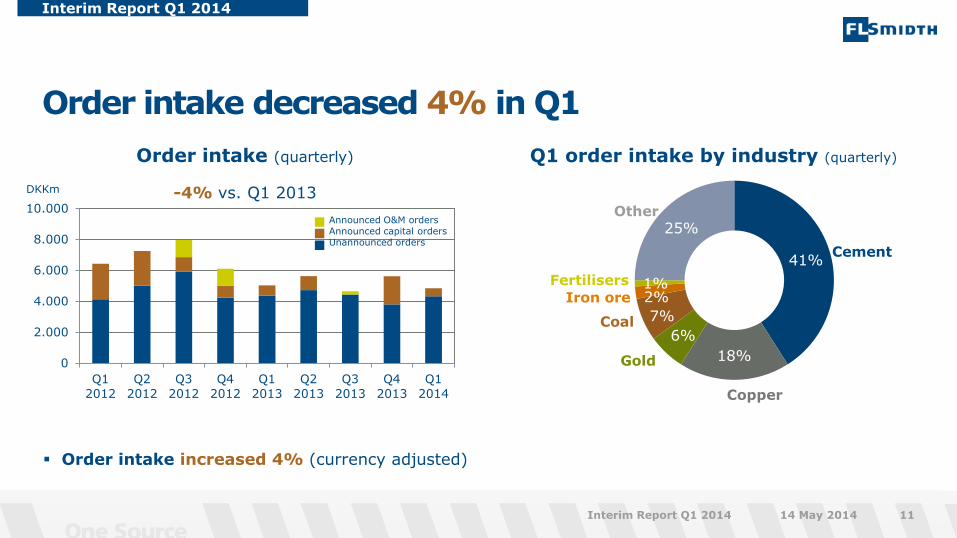
41%
18%
6%
7%
2% 1%
25%
Order intake decreased 4% in Q1
Interim Report Q1 2014
14 May 2014 Interim Report Q1 2014 11
Q1 order intake by industry (quarterly)
Cement
Coal
Iron ore
Other
Copper
Gold 0
2.000
4.000
6.000
8.000
10.000
Q1
2012
Q2
2012
Q3
2012
Q4
2012
Q1
2013
Q2
2013
Q3
2013
Q4
2013
Q1
2014
Order intake (quarterly)
-4% vs. Q1 2013 DKKm
Announced O&M orders Announced capital orders Unannounced orders
Order intake increased 4% (currency adjusted)
Fertilisers
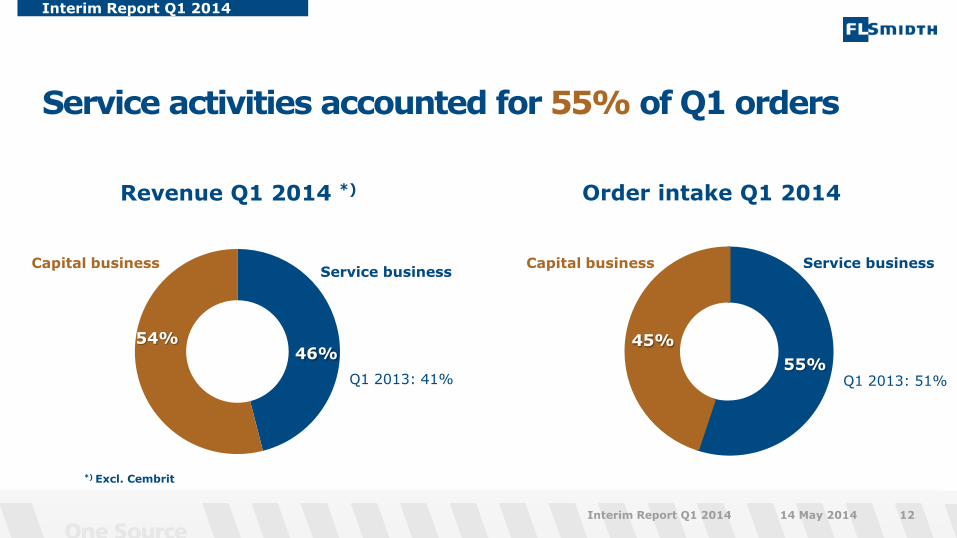
Service activities accounted for 55% of Q1 orders
Interim Report Q1 2014
Interim Report Q1 2014 12
Revenue Q1 2014 *)
14 May 2014
Order intake Q1 2014
46% 54%
Capital business
55%
45%
Service business Capital business Service business
Q1 2013: 41% Q1 2013: 51%
*) Excl. Cembrit
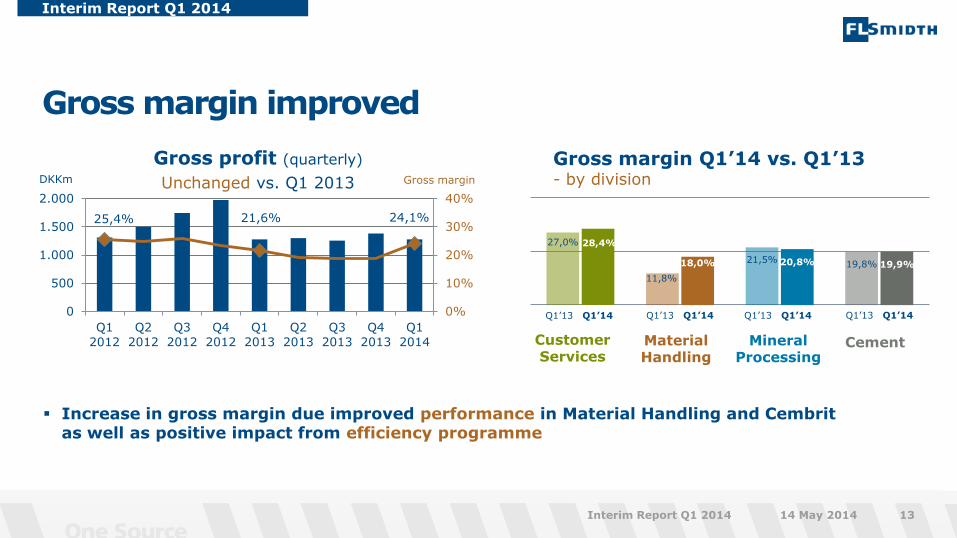
Gross margin improved
Interim Report Q1 2014
14 May 2014 Interim Report Q1 2014 13
Gross margin
25,4% 21,6% 24,1%
0%
10%
20%
30%
40%
0
500
1.000
1.500
2.000
Q1
2012
Q2
2012
Q3
2012
Q4
2012
Q1
2013
Q2
2013
Q3
2013
Q4
2013
Q1
2014
Gross profit (quarterly)
Unchanged vs. Q1 2013 DKKm
Increase in gross margin due improved performance in Material Handling and Cembrit as well as positive impact from efficiency programme
Gross margin Q1’14 vs. Q1’13 - by division
27,0%
11,8%
21,5% 19,8%
28,4%
18,0% 20,8% 19,9%
Customer Services
Material Handling
Mineral Processing
Cement
Q1’14 Q1’13 Q1’14 Q1’13 Q1’14 Q1’13 Q1’14 Q1’13
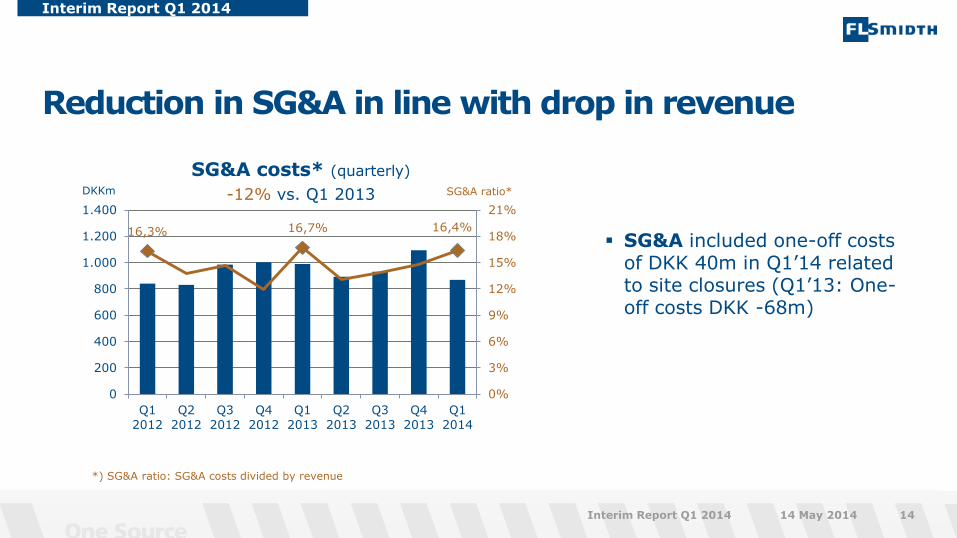
Reduction in SG&A in line with drop in revenue
Interim Report Q1 2014
14 May 2014 Interim Report Q1 2014 14
SG&A included one-off costs of DKK 40m in Q1’14 related to site closures (Q1’13: One-off costs DKK -68m)
SG&A ratio*
16,3% 16,7% 16,4%
0%
3%
6%
9%
12%
15%
18%
21%
0
200
400
600
800
1.000
1.200
1.400
Q1
2012
Q2
2012
Q3
2012
Q4
2012
Q1
2013
Q2
2013
Q3
2013
Q4
2013
Q1
2014
SG&A costs* (quarterly)
-12% vs. Q1 2013 DKKm
*) SG&A ratio: SG&A costs divided by revenue
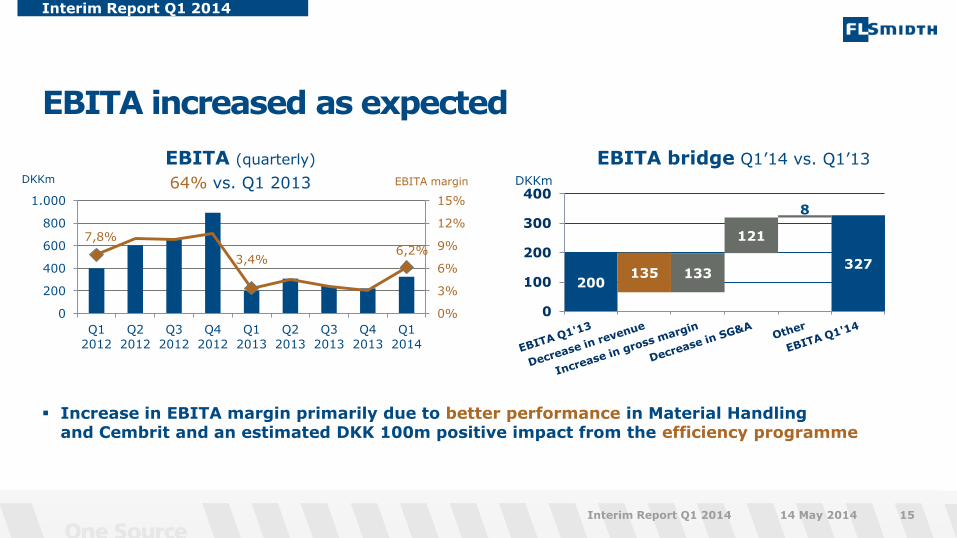
Increase in EBITA margin primarily due to better performance in Material Handling and Cembrit and an estimated DKK 100m positive impact from the efficiency programme
EBITA increased as expected
Interim Report Q1 2014
14 May 2014 Interim Report Q1 2014 15
EBITA margin
7,8%
3,4% 6,2%
0%
3%
6%
9%
12%
15%
0
200
400
600
800
1.000
Q1
2012
Q2
2012
Q3
2012
Q4
2012
Q1
2013
Q2
2013
Q3
2013
Q4
2013
Q1
2014
EBITA (quarterly)
64% vs. Q1 2013 DKKm DKKm
EBITA bridge Q1’14 vs. Q1’13
200
327 133
121
8
135
0
100
200
300
400

Increase in working capital expected to be reversed in 2014
Interim Report Q1 2014
14 May 2014 Interim Report Q1 2014 16
Net working capital
DKKm End Q1 2014 vs. End Q4 2013
Change in net working capital
DKKm
0
500
1.000
1.500
2.000
2.500
3.000
Q1 2012
Q2 2012
Q3 2012
Q4 2012
Q1 2013
Q2 2013
Q3 2013
Q4 2013
Q1 2014
2.382
3.040
606
536
171 154
47 112
-
1.000
2.000
3.000
4.000
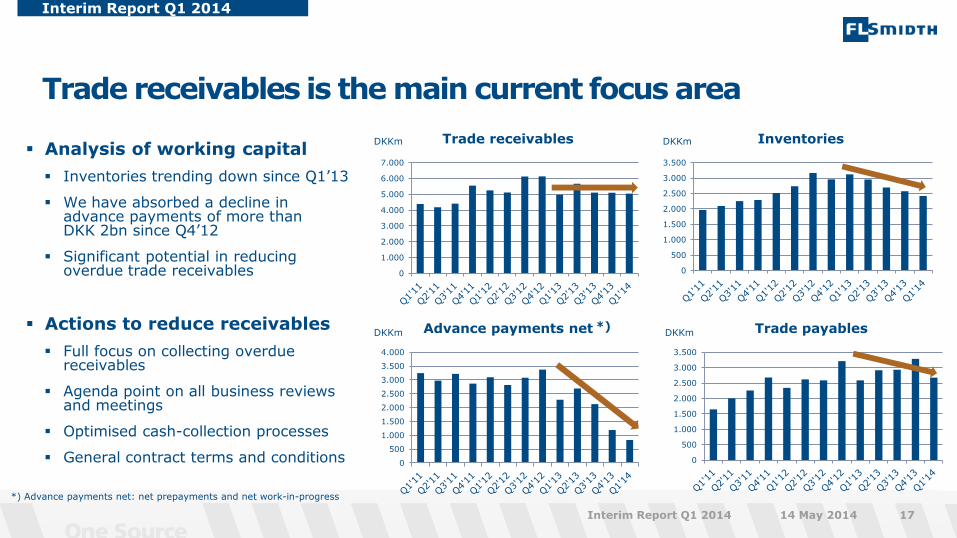
Trade receivables is the main current focus area
Interim Report Q1 2014
14 May 2014 Interim Report Q1 2014 17
Analysis of working capital
Inventories trending down since Q1’13
We have absorbed a decline in advance payments of more than DKK 2bn since Q4’12
Significant potential in reducing overdue trade receivables
Actions to reduce receivables
Full focus on collecting overdue receivables
Agenda point on all business reviews and meetings
Optimised cash-collection processes
General contract terms and conditions
0
500
1.000
1.500
2.000
2.500
3.000
3.500
Inventories
0
1.000
2.000
3.000
4.000
5.000
6.000
7.000
Trade receivables
0
500
1.000
1.500
2.000
2.500
3.000
3.500
4.000
Advance payments net *)
*) Advance payments net: net prepayments and net work-in-progress
0
500
1.000
1.500
2.000
2.500
3.000
3.500
Trade payables
DKKm DKKm
DKKm DKKm
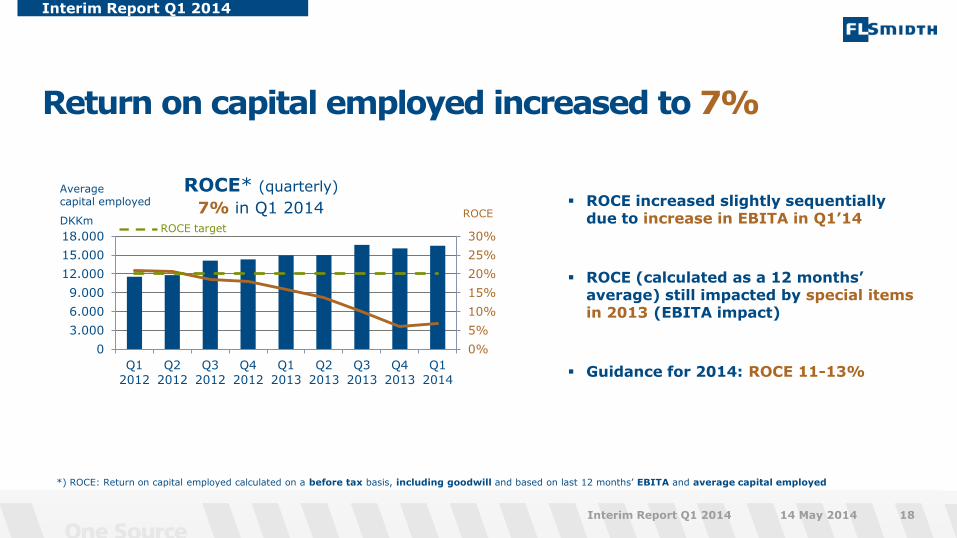
ROCE increased slightly sequentially due to increase in EBITA in Q1’14
ROCE (calculated as a 12 months’ average) still impacted by special items in 2013 (EBITA impact)
Guidance for 2014: ROCE 11-13%
Return on capital employed increased to 7%
Interim Report Q1 2014
14 May 2014 Interim Report Q1 2014 18
ROCE* (quarterly) Average capital employed
DKKm
0%
5%
10%
15%
20%
25%
30%
0
3.000
6.000
9.000
12.000
15.000
18.000
Q1
2012
Q2
2012
Q3
2012
Q4
2012
Q1
2013
Q2
2013
Q3
2013
Q4
2013
Q1
2014
ROCE
7% in Q1 2014
*) ROCE: Return on capital employed calculated on a before tax basis, including goodwill and based on last 12 months’ EBITA and average capital employed
ROCE target
Guidance
14 May 2014 Interim Report Q1 2014 19
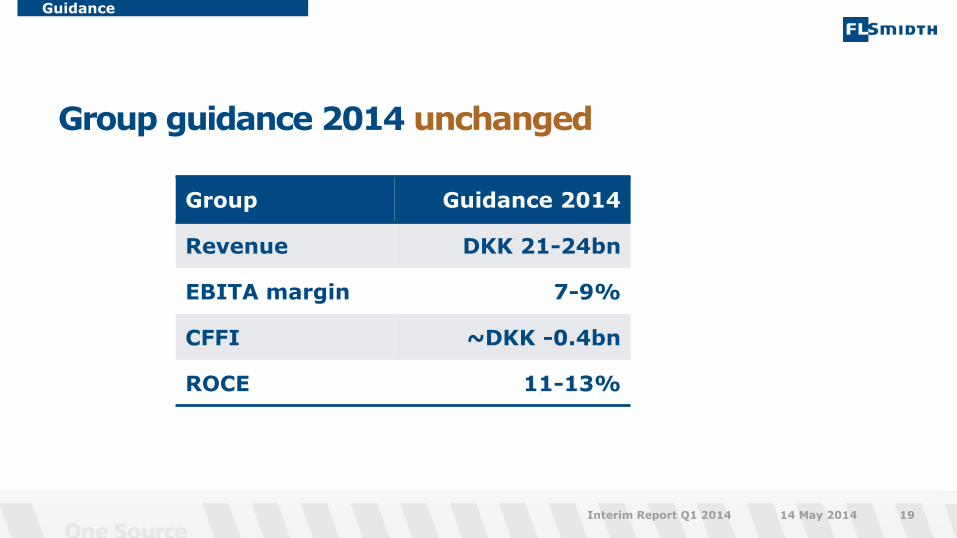
Group Guidance 2014
Revenue DKK 21-24bn
EBITA margin 7-9%
CFFI ~DKK -0.4bn
ROCE 11-13%
Group guidance 2014 unchanged
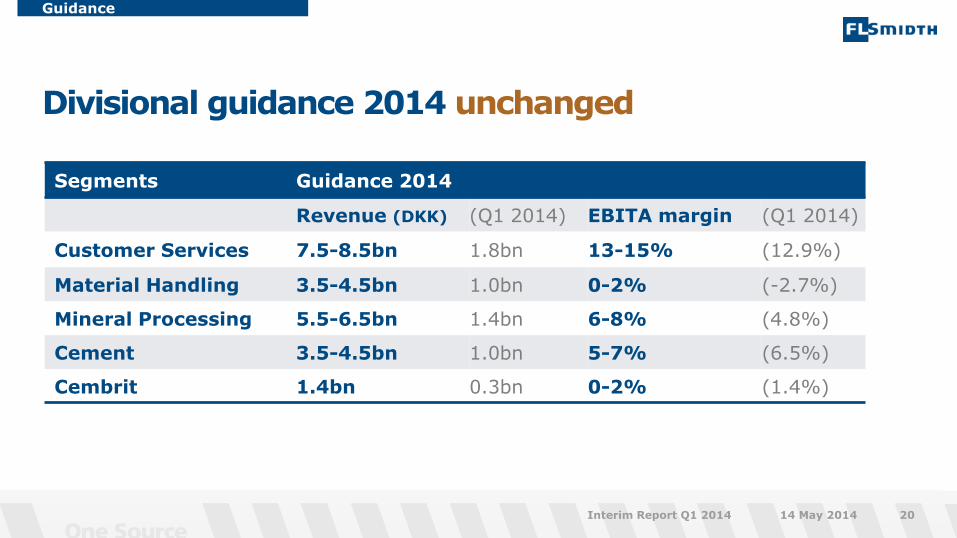
Divisional guidance 2014 unchanged
Guidance
14 May 2014 Interim Report Q1 2014 20
Segments Guidance 2014
Revenue (DKK) (Q1 2014) EBITA margin (Q1 2014)
Customer Services 7.5-8.5bn 1.8bn 13-15% (12.9%)
Material Handling 3.5-4.5bn 1.0bn 0-2% (-2.7%)
Mineral Processing 5.5-6.5bn 1.4bn 6-8% (4.8%)
Cement 3.5-4.5bn 1.0bn 5-7% (6.5%)
Cembrit 1.4bn 0.3bn 0-2% (1.4%)
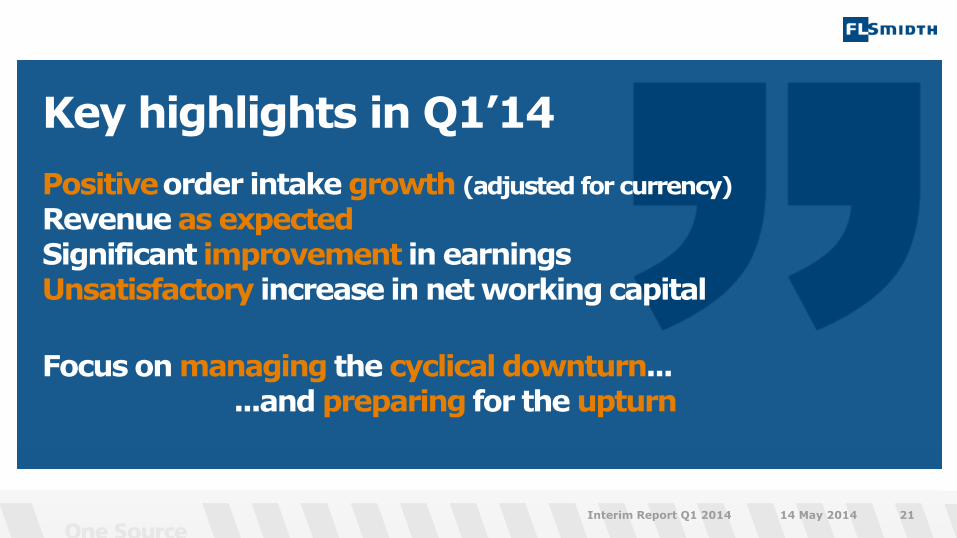
Key highlights in Q1’14
Positive order intake growth (adjusted for currency)
Revenue as expected Significant improvement in earnings Unsatisfactory increase in net working capital
Focus on managing the cyclical downturn... ...and preparing for the upturn
14 May 2014 Interim Report Q1 2014 21
Forward-looking statements
Annual Report 2013
14 May 2014 Interim Report Q1 2014 22
FLSmidth & Co. A/S’ financial reports, whether in the form of annual reports or interim reports, filed with the Danish Business Authority and/or announced via the company’s website and/or NASDAQ OMX Copenhagen, as well as any presentations based on such financial reports, and any other written information released, or oral statements made, to the public based on this interim report or in the future on behalf of FLSmidth & Co. A/S, may contain forward-looking statements. Words such as ‘believe’, ‘expect’, ‘may’, ‘will’, ‘plan’, ‘strategy’, ‘prospect’, ‘foresee’, ‘estimate’, ‘project’, ‘anticipate’, ‘can’, ‘intend’, ‘target’ and other words and terms of similar meaning in connection with any discussion of future operating or financial performance identify forward-looking statements. Examples of such forward-looking statements include, but are not limited to: • statements of plans, objectives or goals for future operations, including those related to FLSmidth & Co. A/S markets, products, product research and product
development • statements containing projections of or targets for revenues, profit (or loss), capital expenditures, dividends, capital structure or other net financial items • statements regarding future economic performance, future actions and outcome of contingencies such as legal proceedings and statements regarding the underlying
assumptions or relating to such statements • statements regarding potential merger & acquisition activities. These forward-looking statements are based on current plans, estimates and projections. By their very
nature, forward-looking statements involve inherent risks and uncertainties, both general and specific, which may be outside FLSmidth & Co. A/S’s influence, and which could materially affect such forward-looking statements.
FLSmidth & Co. A/S cautions that a number of important factors, including those described in this presentation, could cause actual results to differ materially from those contemplated in any forward-looking statements. Factors that may affect future results include, but are not limited to, global as well as local political and economic conditions, including interest rate and exchange rate fluctuations, delays or faults in project execution, fluctuations in raw material prices, delays in research and/or development of new products or service concepts, interruptions of supplies and production, unexpected breach or termination of contracts, market-driven price reductions for FLSmidth & Co. A/S’ products and/or services, introduction of competing products, reliance on information technology, FLSmidth & Co. A/S’ ability to successfully market current and new products, exposure to product liability and legal proceedings and investigations, changes in legislation or regulation and interpretation thereof, intellectual property protection, perceived or actual failure to adhere to ethical marketing practices, investments in and divestitures of domestic and foreign enterprises, unexpected growth in costs and expenses, failure to recruit and retain the right employees and failure to maintain a culture of compliance. Unless required by law FLSmidth & Co. A/S is under no duty and undertakes no obligation to update or revise any forward-looking statement after the distribution of this presentation.
Questions & Answers Next update: Interim Report on 13 August 2014 Follow us on Twitter and LinkedIn
14 May 2014 Interim Report Q1 2014 23
Appendices - backup slides
14 May 2014 Interim Report Q1 2014 24
Customer Services –double digit order intake growth (currency adjusted) order intake 5%, revenue -2%, EBITA margin +3.4 %-point
Material Handling –EBITA hit by Efficiency Programme one offs order intake -35%, revenue -1%, EBITA margin +4.7 %-point
Mineral Processing – impacted by mining capex downturn order intake -23%, revenue -30%, EBITA margin -1.7 %-point
Cement – two large orders in Q1 order intake 201%, revenue -5%, EBITA margin +4.7 %-point
Divisional developments in Q1’14 vs. Q1’13
Interim Report Q1 2014
14 May 2014 Interim Report Q1 2014 25
Customer Services
14 May 2014 Interim Report Q1 2014 26

Revenue increased 4% (currency adjusted)
Order intake increased 13% adjusted for currency
Customer Services
14 May 2014 Interim Report Q1 2014 27
0
1.000
2.000
3.000
4.000
Q1
2012
Q2
2012
Q3
2012
Q4
2012
Q1
2013
Q2
2013
Q3
2013
Q4
2013
Q1
2014
Order intake (quarterly)
5% vs. Q1 2013 DKKm
Announced O&M orders Announced capital orders Unannounced orders
Revenue (quarterly)
DKKm EBITA margin -2% vs. Q1 2013
0%
4%
8%
12%
16%
20%
0
500
1.000
1.500
2.000
2.500
Q1
2012
Q2
2012
Q3
2012
Q4
2012
Q1
2013
Q2
2013
Q3
2013
Q4
2013
Q1
2014
Customer Services
Customer Services
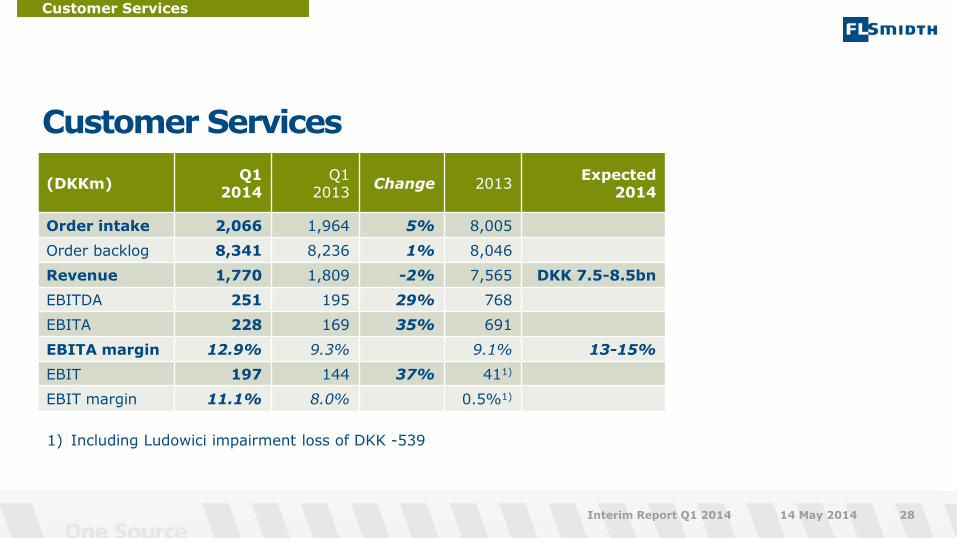
14 May 2014 Interim Report Q1 2014 28
(DKKm) Q1
2014 Q1
2013 Change
2013
Expected 2014
Order intake 2,066 1,964 5% 8,005
Order backlog 8,341 8,236 1% 8,046
Revenue 1,770 1,809 -2% 7,565 DKK 7.5-8.5bn
EBITDA 251 195 29% 768
EBITA 228 169 35% 691
EBITA margin 12.9% 9.3% 9.1% 13-15%
EBIT 197 144 37% 411)
EBIT margin 11.1% 8.0% 0.5%1)
1) Including Ludowici impairment loss of DKK -539
Material Handling
14 May 2014 Interim Report Q1 2014 29
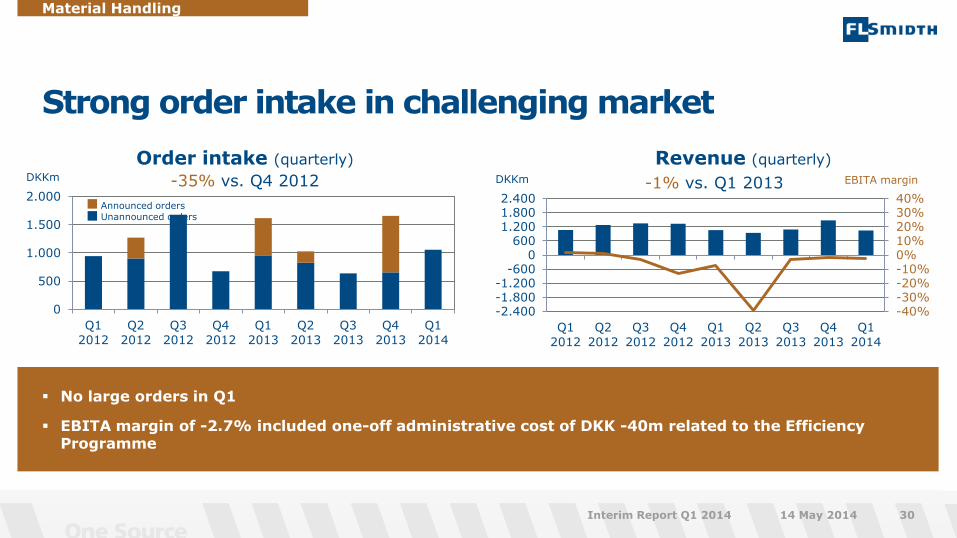
No large orders in Q1
EBITA margin of -2.7% included one-off administrative cost of DKK -40m related to the Efficiency Programme
Strong order intake in challenging market
Material Handling
14 May 2014 Interim Report Q1 2014 30
0
500
1.000
1.500
2.000
Q1
2012
Q2
2012
Q3
2012
Q4
2012
Q1
2013
Q2
2013
Q3
2013
Q4
2013
Q1
2014
Order intake (quarterly)
-35% vs. Q4 2012 DKKm
111111
Announced orders Unannounced orders
Revenue (quarterly)
DKKm EBITA margin -1% vs. Q1 2013
-40% -30% -20% -10% 0% 10% 20% 30% 40%
-2.400 -1.800 -1.200
-600 0
600 1.200 1.800 2.400
Q1
2012
Q2
2012
Q3
2012
Q4
2012
Q1
2013
Q2
2013
Q3
2013
Q4
2013
Q1
2014
Material Handling
Material Handling
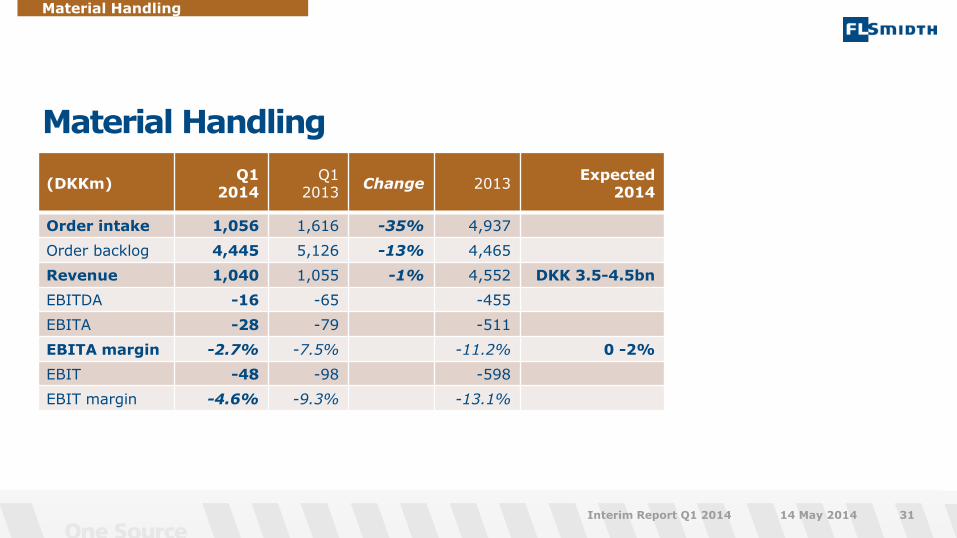
14 May 2014 Interim Report Q1 2014 31
(DKKm) Q1
2014 Q1
2013 Change
2013
Expected 2014
Order intake 1,056 1,616 -35% 4,937
Order backlog 4,445 5,126 -13% 4,465
Revenue 1,040 1,055 -1% 4,552 DKK 3.5-4.5bn
EBITDA -16 -65 -455
EBITA -28 -79 -511
EBITA margin -2.7% -7.5% -11.2% 0 -2%
EBIT -48 -98 -598
EBIT margin -4.6% -9.3% -13.1%
No new problematic projects identified
14 projects out of a total portfolio of 190 projects
in the Material Handling Business Unit are
currently regarded as risky (end of Q4 2013: 14 projects)
These projects accounted for DKK 356m or 8%
of the backlog at the end of Q4 (end of Q4 2013: DKK
481m or 11%)
The one-off costs of DKK 323m realised in Q2 2013 still expected to cover future losses related to the legacy projects
Status on legacy projects in Material Handling
Material Handling
14 May 2014 Interim Report Q1 2014 32
Mineral Processing
14 May 2014 Interim Report Q1 2014 33
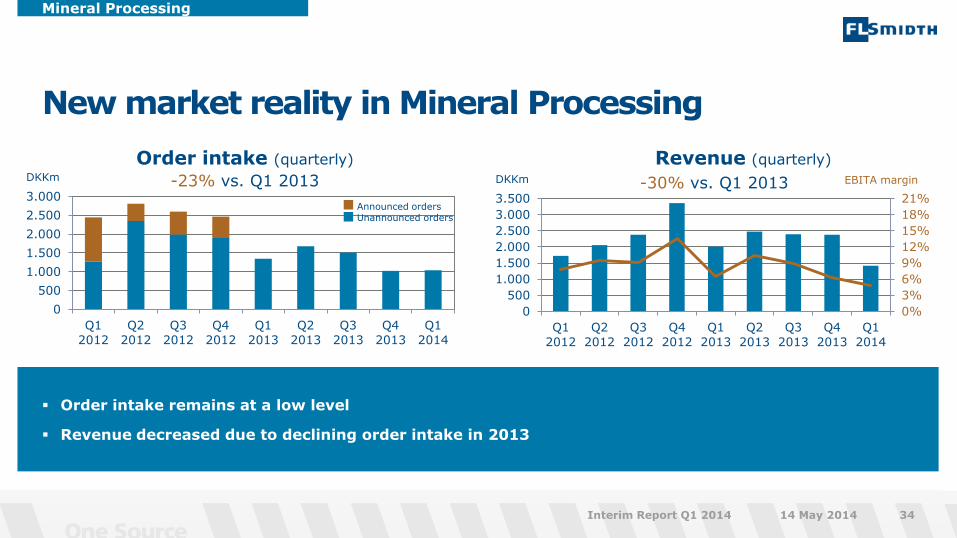
Order intake remains at a low level
Revenue decreased due to declining order intake in 2013
New market reality in Mineral Processing
Mineral Processing
14 May 2014 Interim Report Q1 2014 34
Revenue (quarterly)
DKKm EBITA margin -30% vs. Q1 2013
0%
3%
6%
9%
12%
15%
18%
21%
0
500
1.000
1.500
2.000
2.500
3.000
3.500
Q1
2012
Q2
2012
Q3
2012
Q4
2012
Q1
2013
Q2
2013
Q3
2013
Q4
2013
Q1
2014
0
500
1.000
1.500
2.000
2.500
3.000
Q1
2012
Q2
2012
Q3
2012
Q4
2012
Q1
2013
Q2
2013
Q3
2013
Q4
2013
Q1
2014
Order intake (quarterly)
-23% vs. Q1 2013 DKKm
Announced orders Unannounced orders

Mineral Processing
Mineral Processing
14 May 2014 Interim Report Q1 2014 35
(DKKm) Q1
2014 Q1
2013 Change
2013
Expected 2014
Order intake 1,041 1,345 -23% 5,559
Order backlog 4,635 9,057 -49% 4,993
Revenue 1,416 2,010 -30% 9,256 DKK 5.5-6.5bn
EBITDA 89 151 -41% 850
EBITA 68 130 -48% 757
EBITA margin 4.8% 6.5% 8.2% 6-8%
EBIT 38 88 -57% 2111)
EBIT margin 2.7% 4.4% 2.3%1)
1) Including Ludowici impairment loss of DKK -362
Cement
14 May 2014 Interim Report Q1 2014 36
0
500
1.000
1.500
2.000
2.500
Q1
2012
Q2
2012
Q3
2012
Q4
2012
Q1
2013
Q2
2013
Q3
2013
Q4
2013
Q1
2014
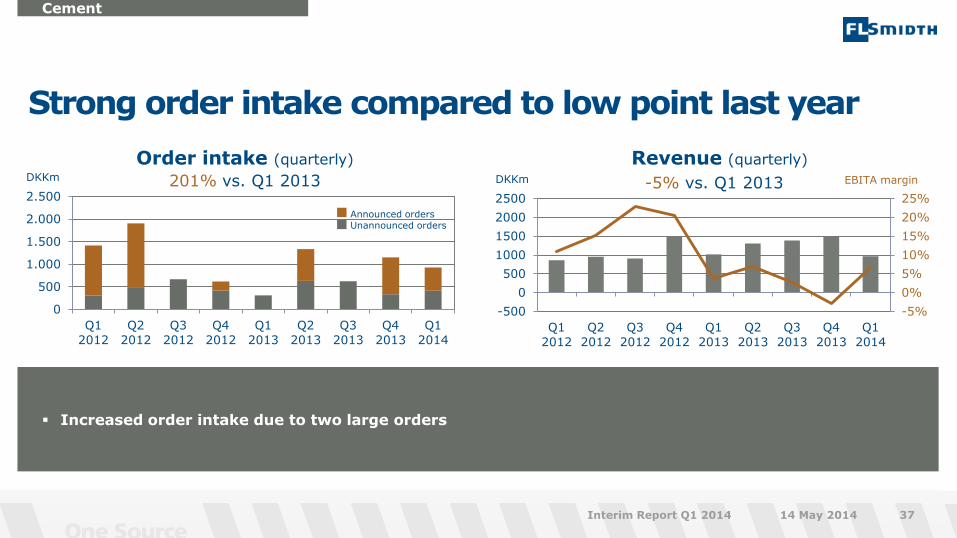
Increased order intake due to two large orders
Strong order intake compared to low point last year
Cement
14 May 2014 Interim Report Q1 2014 37
Revenue (quarterly)
DKKm EBITA margin -5% vs. Q1 2013
-5%
0%
5%
10%
15%
20%
25%
-500
0
500
1000
1500
2000
2500
Q1
2012
Q2
2012
Q3
2012
Q4
2012
Q1
2013
Q2
2013
Q3
2013
Q4
2013
Q1
2014
Order intake (quarterly)
201% vs. Q1 2013 DKKm
Announced orders Unannounced orders
Cement
Cement
14 May 2014 Interim Report Q1 2014 38
(DKKm) Q1
2014 Q1
2013 Change
2013
Expected 2014
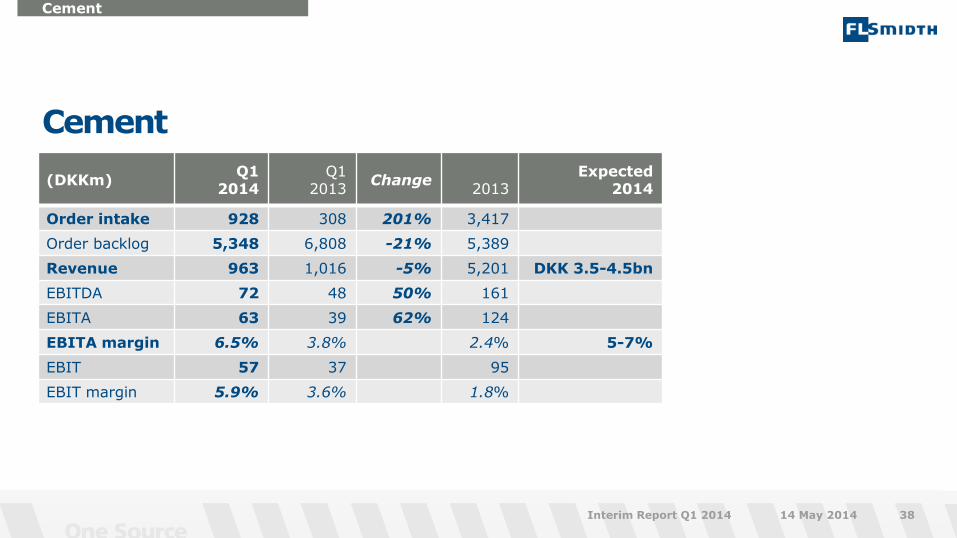
Order intake 928 308 201% 3,417
Order backlog 5,348 6,808 -21% 5,389
Revenue 963 1,016 -5% 5,201 DKK 3.5-4.5bn
EBITDA 72 48 50% 161
EBITA 63 39 62% 124
EBITA margin 6.5% 3.8% 2.4% 5-7%
EBIT 57 37 95
EBIT margin 5.9% 3.6% 1.8%
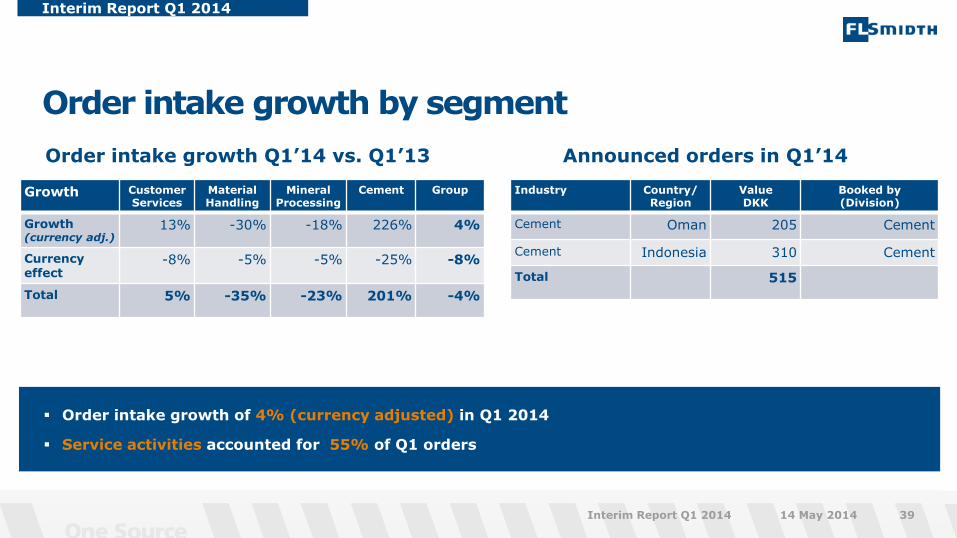
Order intake growth of 4% (currency adjusted) in Q1 2014
Service activities accounted for 55% of Q1 orders
Order intake growth by segment
Interim Report Q1 2014
14 May 2014 Interim Report Q1 2014 39
Growth Customer Services
Material Handling
Mineral Processing
Cement Group
Growth (currency adj.)
13% -30% -18% 226% 4%
Currency effect
-8% -5% -5% -25% -8%
Total 5% -35% -23% 201% -4%
Order intake growth Q1’14 vs. Q1’13
Industry Country/ Region
Value DKK
Booked by (Division)
Cement Oman 205 Cement
Cement Indonesia 310 Cement
Total 515
Announced orders in Q1’14

Revenue growth of -6% (currency adjusted) in Q1 2014
Service activities accounted for 46% of Q1 revenue
Expected backlog conversion to revenue: 52% in 2014, 31% in 2015 and 17% in 2016 and beyond. O&M* contracts accounted for DKK 5.2bn (23%) of the order backlog at the end of Q1
Revenue growth by segment
Interim Report Q1 2014
14 May 2014 Interim Report Q1 2014 40
Growth Customer Services
Material Handling
Mineral Processing
Cement Group
Growth (currency adj.)
4% 6% -24% -2% -6%
Currency effect
-6% -7% -6% -3% -5%
Total -2% -1% -30% -5% -11%
Revenue growth Q1’14 vs. Q1’13
*) Order backlog divided by last-twelve-months revenue
0
1.000
2.000
3.000
4.000
5.000
6.000
7.000
8.000
9.000
Q1
2012
Q2
2012
Q3
2012
Q4
2012
Q1
2013
Q2
2013
Q3
2013
Q4
2013
Q1
2014
Revenue (quarterly)
-12% vs. Q4 2012 DKKm
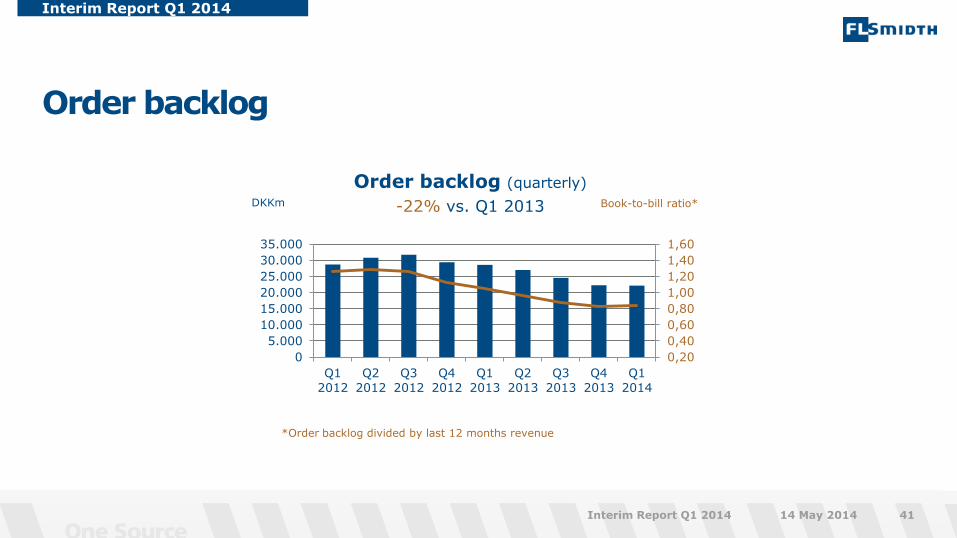
Order backlog
Interim Report Q1 2014
14 May 2014 Interim Report Q1 2014 41
0,20
0,40
0,60
0,80
1,00
1,20
1,40
1,60
0
5.000
10.000
15.000
20.000
25.000
30.000
35.000
Q1
2012
Q2
2012
Q3
2012
Q4
2012
Q1
2013
Q2
2013
Q3
2013
Q4
2013
Q1
2014
Order backlog (quarterly)
-22% vs. Q1 2013 DKKm Book-to-bill ratio*
*Order backlog divided by last 12 months revenue
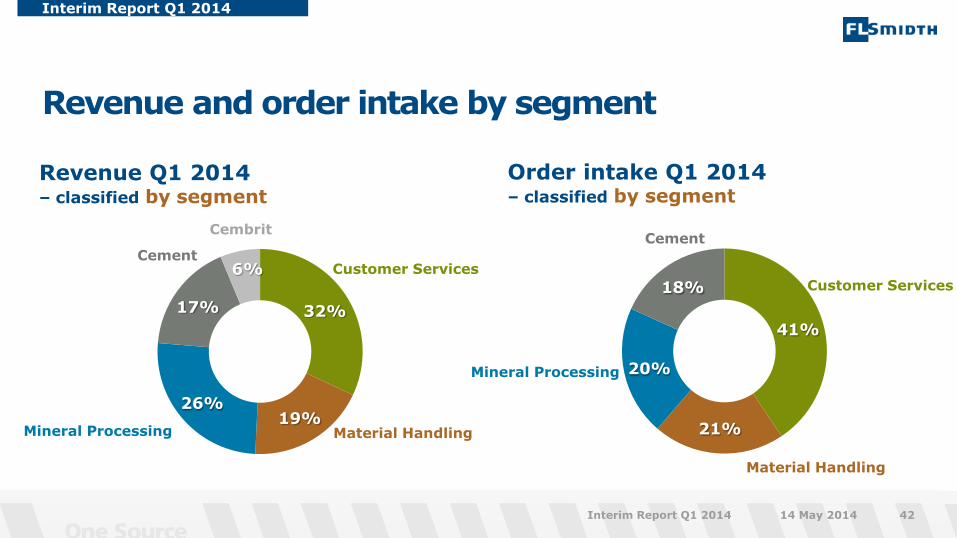
Revenue and order intake by segment
41%
21%
20%
18%
Interim Report Q1 2014
14 May 2014 Interim Report Q1 2014 42
Order intake Q1 2014 – classified by segment
Customer Services
Material Handling
Cement
32%
19% 26%
17%
6%
Material Handling
Mineral Processing
Revenue Q1 2014 – classified by segment
Customer Services Cement
Mineral Processing
Cembrit
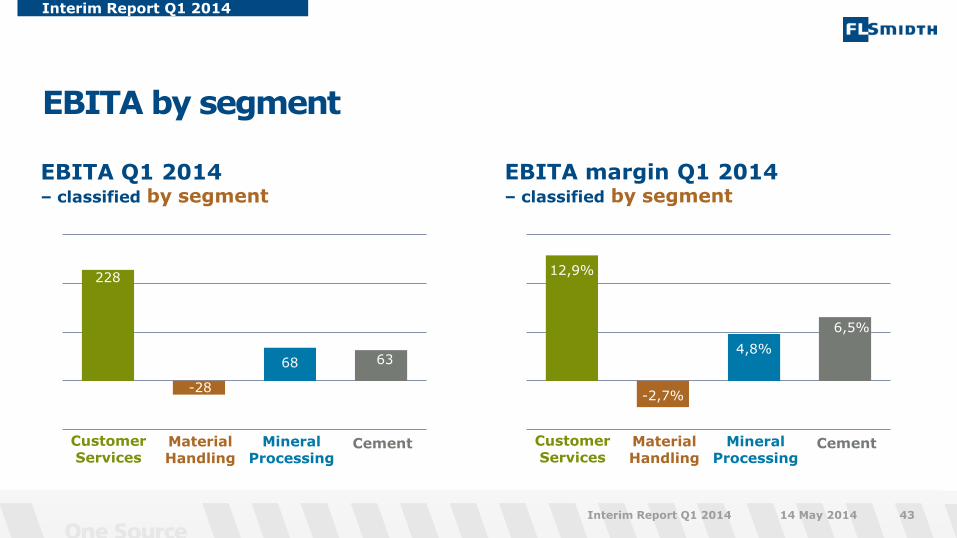
EBITA by segment
Interim Report Q1 2014
14 May 2014 Interim Report Q1 2014 43
EBITA Q1 2014 – classified by segment
228
-28
68 63
Customer Services
Material Handling
Mineral Processing
Cement
EBITA margin Q1 2014 – classified by segment
12,9%
-2,7%
4,8%
6,5%
Customer Services
Material Handling
Mineral Processing
Cement

Cash flow from investments (CFFI) reflects that acquisitions are currently on hold and that other investments are managed closely
CFFO impacted by increase in working capital
Interim Report Q1 2014
14 May 2014 Interim Report Q1 2014 44
CFFO (quarterly) DKKm
-800
-400
0
400
800
1.200
1.600
Q1
2012
Q2
2012
Q3
2012
Q4
2012
Q1
2013
Q2
2013
Q3
2013
Q4
2013
Q1
2014
CFFI (quarterly)
DKK -72m in Q1 2014 DKKm
-3.000
-2.400
-1.800
-1.200
-600
0
600
Q1
2012
Q2
2012
Q3
2012
Q4
2012
Q1
2013
Q2
2013
Q3
2013
Q4
2013
Q1
2014
DKK -552m in Q4 2013
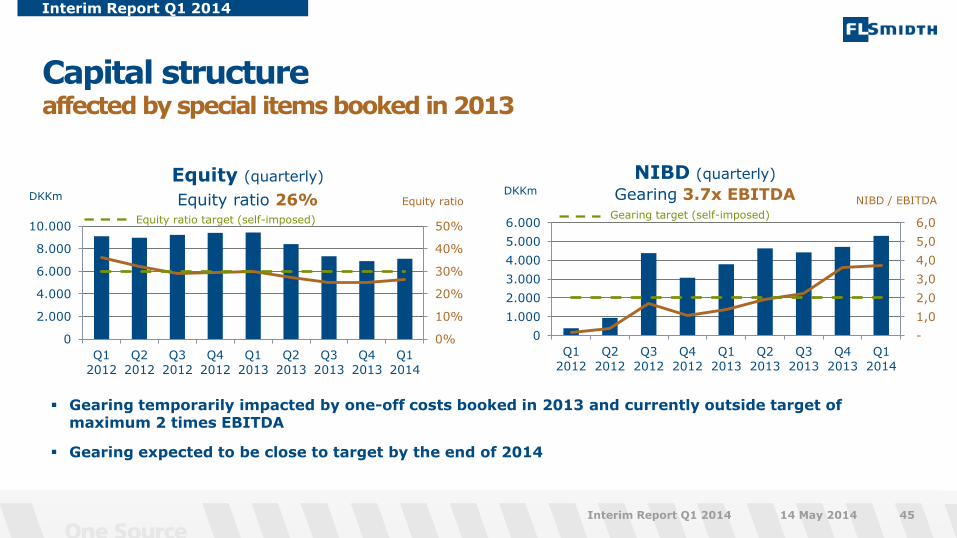
Capital structure affected by special items booked in 2013
Interim Report Q1 2014
14 May 2014 Interim Report Q1 2014 45
NIBD (quarterly) DKKm
-
1,0
2,0
3,0
4,0
5,0
6,0
0
1.000
2.000
3.000
4.000
5.000
6.000
Q1
2012
Q2
2012
Q3
2012
Q4
2012
Q1
2013
Q2
2013
Q3
2013
Q4
2013
Q1
2014
Gearing 3.7x EBITDA Gearing target (self-imposed)
0%
10%
20%
30%
40%
50%
0
2.000
4.000
6.000
8.000
10.000
Q1
2012
Q2
2012
Q3
2012
Q4
2012
Q1
2013
Q2
2013
Q3
2013
Q4
2013
Q1
2014
Equity (quarterly)
DKKm Equity ratio Equity ratio 26%
Equity ratio target (self-imposed)
Gearing temporarily impacted by one-off costs booked in 2013 and currently outside target of maximum 2 times EBITDA
Gearing expected to be close to target by the end of 2014
NIBD / EBITDA
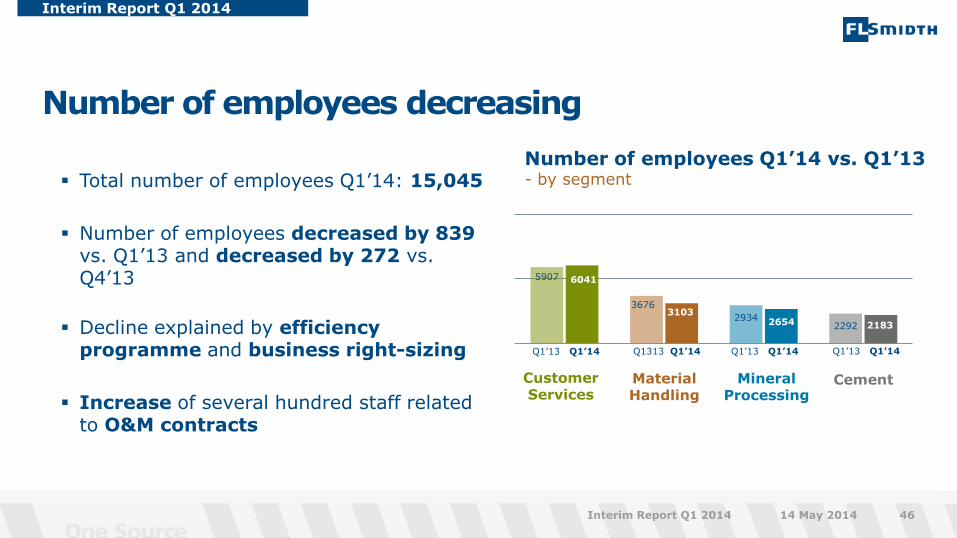
Number of employees decreasing
Interim Report Q1 2014
14 May 2014 Interim Report Q1 2014 46
Number of employees Q1’14 vs. Q1’13 - by segment
5907
3676
2934 2292
6041
3103 2654 2183
Customer Services
Material Handling
Mineral Processing
Cement
Q1’14 Q1’13
Total number of employees Q1’14: 15,045
Number of employees decreased by 839 vs. Q1’13 and decreased by 272 vs. Q4’13
Decline explained by efficiency programme and business right-sizing
Increase of several hundred staff related to O&M contracts
Q1’14 Q1313 Q1’14 Q1’13 Q1’14 Q1’13
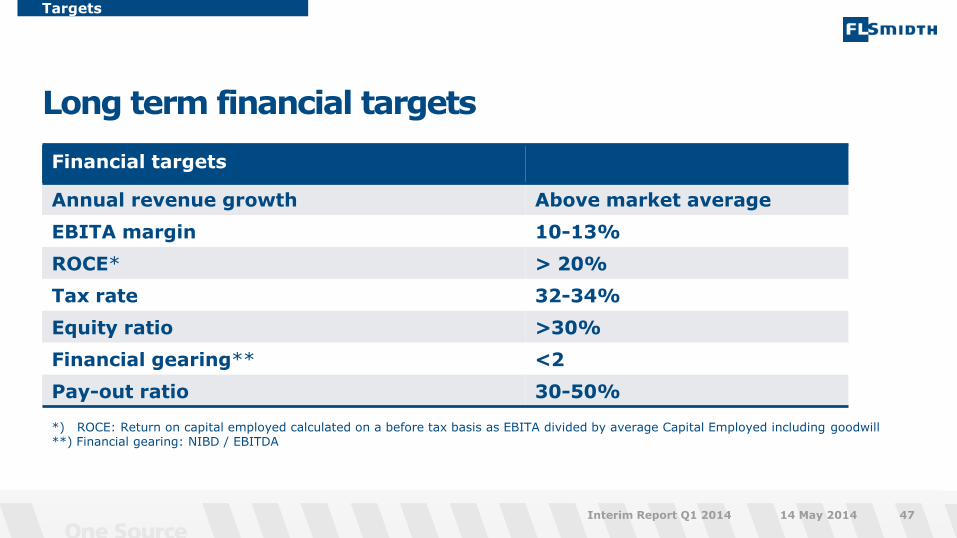
Long term financial targets
Targets
14 May 2014 Interim Report Q1 2014 47
Financial targets
Annual revenue growth Above market average
EBITA margin 10-13%
ROCE* > 20%
Tax rate 32-34%
Equity ratio >30%
Financial gearing** <2
Pay-out ratio 30-50%
*) ROCE: Return on capital employed calculated on a before tax basis as EBITA divided by average Capital Employed including goodwill **) Financial gearing: NIBD / EBITDA
Related Documents