Global Markets Strategy 06 November 2020 Flows & Liquidity Quant funds’ role in recent market gyrations Global Markets Strategy Global Quantitative & Derivatives Strategy Nikolaos Panigirtzoglou AC (44-20) 7134-7815 [email protected] Bloomberg JPMA FLOW <GO> J.P. Morgan Securities plc Mika Inkinen (44-20) 7742 6565 [email protected] J.P. Morgan Securities plc Nishant Poddar, CFA (91-22) 6157-3255 [email protected] J.P. Morgan India Private Limited Ekansh Agarwal (91-22) 6157 3723 [email protected] J.P. Morgan India Private Limited See page 22 for analyst certification and important disclosures. www.jpmorganmarkets.com Figure 1: 1-month implied US equity (VIX Index) and rate (MOVE Index) volatilities MOVE index is the yield curve weighted index of the normalized implied volatility on 1-month treasury options. VIX Index captures the expected volatility of the S&P500 Index. Last obs is 5th Nov 2020 Source: Bloomberg Finance L.P., J.P. Morgan. 20 25 30 35 40 45 30 35 40 45 50 55 60 65 70 Aug-20 Sep-20 Oct-20 Nov-20 MOVE Index VIX Index (RHS) Our analysis suggests that risk parity funds, CTAs and to some extent balanced mutual funds have likely acted to amplify swings in risk markets over the past few weeks. While this week’s rapid normalization of volatilities leaves little room for tactical risk parity funds to further amplify the rally from here, we believe that momentum traders such as CTAs have room to further amplify this month’s equity rally. The flow trajectory for Grayscale Bitcoin Trust steepened in recent weeks. What makes this flow trajectory even more impressive is its contrast with the equivalent flow trajectory for gold ETFs, which overall saw modest outflows since mid-October. This contrast lends support to the idea that some investors such as family offices that previously invested in gold ETFs, may be looking at bitcoin as an alternative to gold. Momentum traders have also amplified the recent bitcoin rally. The sharp spike in prices this week appears to have taken bitcoin close to overbought levels on our momentum signal framework, something that could potential trigger profit taking or mean reversion flows. One of the most striking features of this week’s market moves has been the sudden collapse in volatility post US election. This is shown in Figure 1 which depicts 1-month implied volatilities for US equities (VIX Index) and US rates (MOVE Index). Effectively all of the previous increase in volatilities in October was abruptly unwound this week in a day or two. Longer-dated 3-month implied volatilities have seen a similarly rapid swing as shown by Figure 2 which depicts 3-month implied volatilities across five asset classes including equities, rates, credit, currencies and commodities in both the US and outside the US (Figure 2). The mirror image of this week’s decline in implied volatilities has been a collapse of the volatility risk premium embedded in option markets from above average to below average (Figure 3). Click here to visit Flows & Liquidity Library on J.P. Morgan Markets.

Welcome message from author
This document is posted to help you gain knowledge. Please leave a comment to let me know what you think about it! Share it to your friends and learn new things together.
Transcript
Global Markets Strategy06 November 2020
Flows & LiquidityQuant funds’ role in recent market gyrations
Global Markets Strategy Global Quantitative & Derivatives Strategy
Nikolaos Panigirtzoglou AC
(44-20) 7134-7815
Bloomberg JPMA FLOW <GO>
J.P. Morgan Securities plc
Mika Inkinen
(44-20) 7742 6565
J.P. Morgan Securities plc
Nishant Poddar, CFA
(91-22) 6157-3255
J.P. Morgan India Private Limited
Ekansh Agarwal
(91-22) 6157 3723
J.P. Morgan India Private Limited
See page 22 for analyst certification and important disclosures.
www.jpmorganmarkets.com
Figure 1: 1-month implied US equity (VIX Index) and rate (MOVE Index) volatilitiesMOVE index is the yield curve weighted index of the normalized implied volatility on 1-month treasury options. VIX Index captures the expected volatility of the S&P500 Index. Last obs is 5th Nov 2020
Source: Bloomberg Finance L.P., J.P. Morgan.
20
25
30
35
40
45
30
35
40
45
50
55
60
65
70
Aug-20 Sep-20 Oct-20 Nov-20
MOVE Index
VIX Index (RHS)
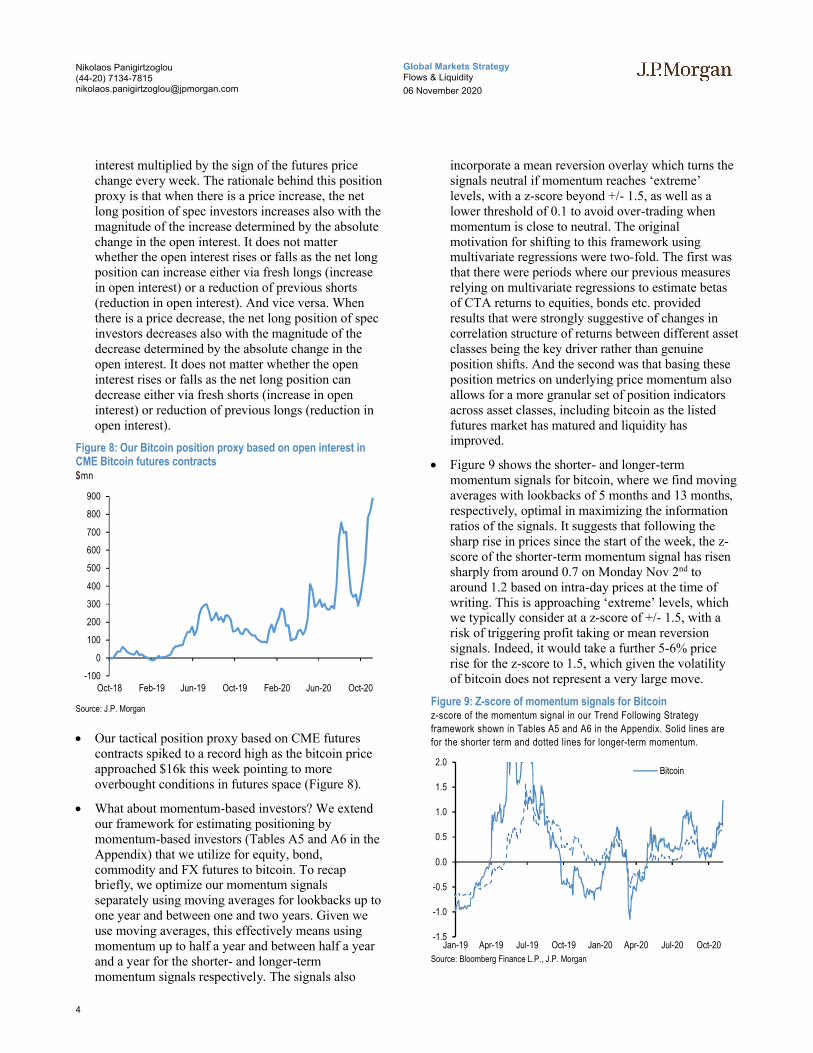
Our analysis suggests that risk parity funds, CTAs and to some extent balanced mutual funds have likely acted to amplify swings in risk markets over the past few weeks.
While this week’s rapid normalization of volatilities leaves little room for tactical risk parity funds to further amplify the rally from here, we believe that momentum traders such as CTAs have room to further amplify this month’s equity rally.
The flow trajectory for Grayscale Bitcoin Trust steepened in recent weeks.
What makes this flow trajectory even more impressive is its contrast with the equivalent flow trajectory for gold ETFs, which overall saw modest outflows since mid-October.
This contrast lends support to the idea that some investors such as family offices that previously invested in gold ETFs, may be looking at bitcoin as an alternative to gold.
Momentum traders have also amplified the recent bitcoin rally. The sharp spike in prices this week appears to have taken bitcoin close to overbought levels on our momentum signal framework, something that could potential trigger profit taking or mean reversion flows.
One of the most striking features of this week’s market moves has been the sudden collapse in volatility post US election. This is shown in Figure 1 which depicts 1-month implied volatilities for US equities (VIX Index) and US rates (MOVE Index). Effectively all of the previous increase in volatilities in October was abruptly unwound this week in a day or two.
Longer-dated 3-month implied volatilities have seen a similarly rapid swing as shown by Figure 2 which depicts 3-month implied volatilities across five asset classes including equities, rates, credit, currencies and commodities in both the US and outside the US (Figure 2). The mirror image of this week’s decline in implied volatilities has been a collapse of the volatility risk premium embedded in option markets from above average to below average (Figure 3).
Click here to visit Flows & Liquidity Library on J.P. Morgan Markets.

2
Global Markets StrategyFlows & Liquidity
06 November 2020
Nikolaos Panigirtzoglou(44-20) [email protected]
Figure 2: 3-month implied and 1-month realised vols across asset classesWeighted average of 14 vols across 5 asset classes. We apply a 20%
weight on each of the five asset classes. The 14 vols used are: V2X Index, VIX Index, VNKY Index, JPMVXYG7 Index, JPMVXYEM Index,
CL1 Comdty, HG1 Comdty, GC1 Comdty, C 1 Comdty, iTraxx, CDX.IG,
DX.HY, Euro 10y swap rate, US 10y swap rate. 3-month implied vols are used for the cross-asset implied vol metric. Realised vols are instead
calculated over 1-month (20 business day) rolling window.
Source: Bloomberg Finance L.P., J.P. Morgan
Figure 3: 3-month implied to 1-month realized vol ratio across asset classesBased on the cross-asset Implied and Realised vol metrics shown in Figure 1. These metrics are based on 3-month implied vols and 1-month
realized vols on 14 indices across 5 asset classes.
Source: Bloomberg Finance L.P., J.P. Morgan
This week’s sharp decline in volatilities across asset classes is shifting attention to vol targeting or vol control funds. This universe consists mostly of tactical risk parity funds, with around $150bn of AUM, and vol control funds (embedded in variable annuity products) with around $300bn of AUM (we exclude here strategic risk parity funds typically embedded within pension funds as they tend to target very long-dated volatilities). However, if one also looks at funds that tend to respond to changes in short-dated volatilities because of their VaR based
risk management frameworks, then the universe of both explicit and implicit vol targeters becomes much larger. For example balanced or 60:40 mutual funds that belong to this category of implicit vol targeters is a $1.5tr universe in the US and $6.5tr globally.
Indeed, when we look at the performance vs. benchmark of these two types of funds, i.e. risk parity funds and balanced mutual funds, what we find is excess underperformance during the October correction and excess outperformance during this week’s rally. This is shown in Figure 4 which, as risk parity fund benchmark, uses a 21:64:15 Equity:Bond:Commodity portfolio that is levered 1.5x to match the vol of our risk parity fund index. It also uses a 60:40 Equity:Bond portfolio as benchmark for balanced mutual funds. The excess underperformance vs. the respective benchmark during the October correction, for risk parity funds in particular, and the excess outperformance in November, are pointing to de-levering in October and re-levering in November. It is likely that the pressure on risk parity funds, which are stricter vol targeters than balanced mutual funds, to delever in October was not only induced by the rise in vol but also by the rise in bond-equity correlation as shown in Figure 5.
Figure 4: Difference in Risk Parity fund and US balanced mutual fund performance vs. benchmark
* Start of equity market sell-off.
** A 21:64:15 equity:bond:commodity benchmark levered by 1.5x to match the volatility of
our risk parity fund index, and a 60:40 equity:bond portfolio for US domiciled balanced
mutual funds.
Source: J.P. Morgan
Figure 5: Bond-equity correlation 3-month rolling correlation between daily returns of MSCI World Local vs.
GBI Global hedged into USD indices.
Source: Bloomberg Finance L.P., J.P. Morgan
10
12
14
16
18
20
22
24
Aug-20 Sep-20 Oct-20 Nov-20
Realised vol
Implied vol
0.90
1.00
1.10
1.20
1.30
1.40
1.50
1.60
Aug-20 Sep-20 Oct-20 Nov-20
Risk parity
funds
Balanced
mutual funds
Risk parity
funds
Balanced
mutual funds
12 Oct - 30 Oct -4.3% -4.6% -1.9% 0.0%
30 Oct - 5 Nov 4.6% 4.9% 1.5% 0.3%
Performance by investor type Performance vs. benchmark**
-100%
-80%
-60%
-40%
-20%
0%
20%
40%
08 10 12 14 16 18 20

3
Global Markets StrategyFlows & Liquidity
06 November 2020
Nikolaos Panigirtzoglou(44-20) [email protected]
What about momentum traders such as CTAs? It is likely that CTAs and other momentum traders have also exacerbated the swings in equity markets over the past few weeks. This is indeed shown in Figure 6by our momentum signals for the S&P500 and Eurostoxx50 indices which after seeing a sharp fall in the last two weeks of October, they rebounded steeply this week. Indeed, for the latter momentum reached extreme bearish territory, suggesting that profit taking or mean reversion signals may have contributed to the subsequent rally. Figure 6 also shows that these momentum signals are some way from overbought territory, typically associated with a z-score 1.5 stdevs or more in our framework, pointing to further room for momentum traders to amplify this month’s equity rally.
Figure 6: Z-scores of momentum signals for S&P 500 and Eurostoxx 50 equity indicesz-score of the momentum signal in our Trend Following Strategy framework shown in Tables A5 and A6 in the Appendix. Solid lines are
for the shorter term and dotted lines for longer-term momentum.
Source: Bloomberg Finance L.P, J.P. Morgan.
In all, our analysis suggests that risk parity funds, CTAs and to some extent balanced mutual funds have likely acted to amplify swings in risk markets over the past few weeks. While this week’s rapid normalization of volatilities leaves little room for tactical risk parity funds to further amplify the rally from here, we believe that momentum traders such as CTAs have room to further amplify this month’s equity rally.
Momentum traders have likely amplified the recent bitcoin rally. Bitcoin close to overbought levels
Corporate endorsements of bitcoin and in particular the endorsement by Paypal a couple of weeks ago appear to have propagated further demand for bitcoin. This is particularly evident in the Grayscale Bitcoin
Trust which saw a steepening of its cumulative flow trajectory in recent weeks. In our opinion, the ascend of Grayscale Bitcoin Trust suggests that bitcoin demand is not only driven by the younger cohorts of retail investors, i.e. millennials, but also institutional investors such as family offices and asset managers. These institutional investors appear to be the biggest investors in the Grayscale Bitcoin Trust perhaps reflecting their preference to invest in bitcoin in fund format.
What makes the October flow trajectory for the Grayscale Bitcoin Trust even more impressive is its contrast with the equivalent flow trajectory for gold ETFs, which overall saw modest outflows since mid-October (Figure 7). This contrast lends support to the idea that some investors that previously invested in gold ETFs such as family offices, may be looking at bitcoin as an alternative to gold. As we had highlighted in our previous F&L of October 23rd, the potential long-term upside for bitcoin is considerable if it competes more intensely with gold as an “alternative” currency given that the market cap of bitcoin would have to rise 10 times from here to match the total private sector investment in gold via ETFs or bars and coins.
Figure 7: Outstanding shares for Grayscale Bitcoin Trust and total known ETF holdings of GoldSh. outstanding (mn) for Grayscale Bitcoin Trust and Gold holdings in in
troy ounce mn. With reference to 1st Jan 2019.
Source: Bloomberg Finance L.P, J.P. Morgan.
What about our more tactical bitcoin position indicators which are more relevant for the near term? Bitcoin looks even more overbought on our CME futures position indicator shown in Figure 8. To infer positioning in bitcoin futures, we use our open interest position proxy methodology that we also apply to other futures contracts, where we look at the cumulative weekly absolute changes in the open
-4.0
-3.0
-2.0
-1.0
0.0
1.0
2.0
3.0
4.0
Jan-20 Apr-20 Jul-20 Oct-20
S&P 500 Eurostoxx 50
75
100
125
150
175
200
225
250
275
75
100
125
150
175
200
225
250
275
Jan-19 Apr-19 Jul-19 Oct-19 Jan-20 Apr-20 Jul-20 Oct-20
BTC
Gold (RHS)
4
Global Markets StrategyFlows & Liquidity
06 November 2020
Nikolaos Panigirtzoglou(44-20) [email protected]
interest multiplied by the sign of the futures price change every week. The rationale behind this position proxy is that when there is a price increase, the net long position of spec investors increases also with the magnitude of the increase determined by the absolute change in the open interest. It does not matter whether the open interest rises or falls as the net long position can increase either via fresh longs (increase in open interest) or a reduction of previous shorts (reduction in open interest). And vice versa. When there is a price decrease, the net long position of spec investors decreases also with the magnitude of the decrease determined by the absolute change in the open interest. It does not matter whether the open interest rises or falls as the net long position can decrease either via fresh shorts (increase in open interest) or reduction of previous longs (reduction in open interest).
Figure 8: Our Bitcoin position proxy based on open interest in CME Bitcoin futures contracts$mn
Source: J.P. Morgan
Our tactical position proxy based on CME futures contracts spiked to a record high as the bitcoin price approached $16k this week pointing to more overbought conditions in futures space (Figure 8).
What about momentum-based investors? We extend our framework for estimating positioning by momentum-based investors (Tables A5 and A6 in the Appendix) that we utilize for equity, bond, commodity and FX futures to bitcoin. To recap briefly, we optimize our momentum signals separately using moving averages for lookbacks up to one year and between one and two years. Given we use moving averages, this effectively means using momentum up to half a year and between half a year and a year for the shorter- and longer-term momentum signals respectively. The signals also
incorporate a mean reversion overlay which turns the signals neutral if momentum reaches ‘extreme’ levels, with a z-score beyond +/- 1.5, as well as a lower threshold of 0.1 to avoid over-trading when momentum is close to neutral. The original motivation for shifting to this framework using multivariate regressions were two-fold. The first was that there were periods where our previous measures relying on multivariate regressions to estimate betas of CTA returns to equities, bonds etc. provided results that were strongly suggestive of changes in correlation structure of returns between different asset classes being the key driver rather than genuine position shifts. And the second was that basing these position metrics on underlying price momentum also allows for a more granular set of position indicators across asset classes, including bitcoin as the listed futures market has matured and liquidity has improved.
Figure 9 shows the shorter- and longer-term momentum signals for bitcoin, where we find moving averages with lookbacks of 5 months and 13 months,respectively, optimal in maximizing the information ratios of the signals. It suggests that following the sharp rise in prices since the start of the week, the z-score of the shorter-term momentum signal has risen sharply from around 0.7 on Monday Nov 2nd to around 1.2 based on intra-day prices at the time of writing. This is approaching ‘extreme’ levels, which we typically consider at a z-score of +/- 1.5, with a risk of triggering profit taking or mean reversion signals. Indeed, it would take a further 5-6% price rise for the z-score to 1.5, which given the volatility of bitcoin does not represent a very large move.
Figure 9: Z-score of momentum signals for Bitcoinz-score of the momentum signal in our Trend Following Strategy
framework shown in Tables A5 and A6 in the Appendix. Solid lines are
for the shorter term and dotted lines for longer-term momentum.
Source: Bloomberg Finance L.P., J.P. Morgan
-100
0
100
200
300
400
500
600
700
800
900
Oct-18 Feb-19 Jun-19 Oct-19 Feb-20 Jun-20 Oct-20
-1.5
-1.0
-0.5
0.0
0.5
1.0
1.5
2.0
Jan-19 Apr-19 Jul-19 Oct-19 Jan-20 Apr-20 Jul-20 Oct-20
Bitcoin

5
Global Markets StrategyFlows & Liquidity
06 November 2020
Nikolaos Panigirtzoglou(44-20) [email protected]
In all, momentum traders have likely amplified the recent bitcoin rally. The sharp spike in prices this week appears to have taken bitcoin close to overbought levels on our momentum signal framework, something that could potential trigger profit taking or mean reversion flows.

6
Global Markets StrategyFlows & Liquidity
06 November 2020
Nikolaos Panigirtzoglou(44-20) [email protected]
Table A1: Weekly flow monitor
$bn, Includes Global Mutual Fund flows from EPFR and globally domiciled
ETF flows from Bloomberg. US Equities includes US Domiciled MFs from
ICI and ETF flows from Bloomberg.
Source: EPFR, Bloomberg, ICI, J.P. Morgan.
Chart A1: Fund flow indicator
Difference between flows into Equity and Bond funds: $bn per week.
Flow includes US domiciled Mutual Fund and globally domiciled ETF flows. We exclude China On-shore funds from our analysis. The thin blue
line shows the 4-week average of difference between Equity and Bond
fund flows. Dotted lines depict ±1 StDev of the blue line. The thick black line shows a smoothed version of the same series. The smoothing is done
using a Hodrick-Prescott filter with a Lambda parameter of 100.
Source: Bloomberg, ICI, J.P. Morgan.
Chart A2: Global equity & bond fund flows
$bn per year of Net Sales, i.e. includes net new sales + reinvested dividends for MF and ETFs. Flows are from ICI (worldwide data up to
Q2’20). Data since then are a combination of monthly and weekly data
from ICI, EPFR and ETF flows from Bloomberg.
Source: ICI, EPFR, EFAMA, Bloomberg J.P. Morgan.
Table A2: Equity and Bond issuance
$bn, Equity supply and corporate announcements are based on
announced deals, not completed. M&A is announced deal value and Buybacks are announced transactions. Y/Y change is change in YTD
announcements over the same period last year. More details on net bond
issuances in Chart A40.
Source: Bloomberg, Dealogic, Thomson Reuters, J.P. Morgan.
Table A3: Trading turnover monitor
Volumes are monthly and Turnover ratio is annualized (monthly trading volume annualised divided by the amount outstanding). UST Cash are
primary dealer transactions in all US government securities. UST futures
are from Bloomberg. JGBs are OTC volumes in all Japanese government securities. Bunds, Gold, Oil and Copper are futures. Gold includes Gold
ETFs. Min-Max chart is based on Turnover ratio. For Bunds and
Commodities, futures trading volumes are used while the outstanding amount is proxied by open interest. The diamond reflects the latest
turnover observation. The thin blue line marks the distance between the
min and max for the complete time series since Jan-2005 onwards. Y/Y
change is change in YTD notional volumes over the same period last year.
Source: Bloomberg, Federal Reserve, Trace, Japan Securities Dealer Association, WFE,
J.P. Morgan. * Data with one month lag.
MF & ETF Flows 4-Nov 4 wk avg 13 wk avg 2020 avg
All Equity 6.48 3.7 3.1 -3.4
All Bond -1.34 9.3 12.0 9.2
US Equity 0.16 -17.6 -15.8 -4.7
Intl. Equity 6.33 14.2 13.6 -1.15
Tax able Bonds -2.92 8.2 11.6 6.8
Municipal Bonds -0.67 1.0 1.7 2.0
-40
-30
-20
-10
10
20
30
40
50
60
70
07 08 09 10 11 12 13 14 15 16 17 18 19 20
0
Last observation: 4-Nov-20
595
455
-209
217 228
-15
85
619
478 403
102
629
400
10
-151
119100
-172
673
503
282
849
196
512
294
562
864
234
1024
311
-300
0
300
600
900
1200
06 07 08 09 10 11 12 13 14 15 16 17 18 19 20
Equity funds Bond funds
YTD
Equity Supply 6-Nov 4 wk avg 13 wk avg y/y chng
Global IPOs 1.0 7.5 8.9 60%
Secondary Offerings 5.1 8.6 12.7 73%
Corporate announcements
M&A - Global 45.1 87.0 90.5 -14%
- US Target 28.6 50.0 39.6 -33%
- Non-US Target 16.5 36.9 50.9 2%
Net bond issuance Sep-20 3 mth avg YTD avg y/y chng
USD 78 115 63 28%
Non-USD 25 9 33 4%
As of Oct-20 MIN MAX Turnover ratio Vol (tr) y/y chng
Equities
EM Equity* 1.3 $1.0 82%
DM Equity* 1.5 $7.6 38%
Govt Bonds
UST cash 9.5 $9.6 0%
UST futures 0.4 $5.4 -25%
JGBs* 21.1 ¥1,767 14%
Bund futures 0.9 €4.4 -4%
Credit
US HG 0.6 $0.4 10%
US HY 0.9 $0.1 17%
US Convertibles 1.7 $0.0 24%
Commodities
Gold 34.9 $0.9 19%
Oil 77.0 $1.1 -47%
Copper 1.8 $0.3 -27%
* Data w ith one month lag

7
Global Markets StrategyFlows & Liquidity
06 November 2020
Nikolaos Panigirtzoglou(44-20) [email protected]
ETF Flow Monitor (as of Nov 04th)Chart A3: Global Cross Asset ETF Flows
Cumulative flow into ETFs as a % of AUM
Source: J.P. Morgan. Bloomberg
Chart A4: Bond ETF Flows
Cumulative flow into bond ETFs as a % of AUM
Source: J.P. Morgan. Bloomberg
Chart A5: Global Equity ETF Flows
Cumulative flow into global equity ETFs as a % of AUM
Source: J.P. Morgan. Bloomberg
Note: We include ETFs with AUM > $200mn in all the flow monitor charts.
Chart A5 exclude China On-shore (A-share) ETFs from EM and in Japan we
subtract the BoJ buying of ETFs.
Chart A6: Equity Sectoral and Regional ETF Flows
Rolling 3-month and 12-month change in cumulative flows as a % of AUM.
Both sorted by 12-month change
Source: J.P. Morgan. Bloomberg.
-10%
0%
10%
20%
30%
40%
50%
60%
70%
Jan-17 Jul-17 Jan-18 Jul-18 Jan-19 Jul-19 Jan-20 Jul-20
Equity
Bonds
Commodity
-20%
-10%
0%
10%
20%
30%
40%
50%
60%
70%
80%
Jan-17 Jul-17 Jan-18 Jul-18 Jan-19 Jul-19 Jan-20 Jul-20
EM
Global HY
Global HG ex-EM
-50%
-40%
-30%
-20%
-10%
0%
10%
20%
30%
40%
50%
Jan-17 Jul-17 Jan-18 Jul-18 Jan-19 Jul-19 Jan-20 Jul-20
EM
US
Europe
Japan
-30%
-20%
-10%
0%
10%
20%
30%
Fina
ncia
l
Util
ities
Indu
stria
l
Con
s. S
tpl.
Con
s. D
isc.
Mat
eria
ls
Hea
lthca
re
Tech
nolo
gy
Ene
rgy
3M 12M
US Sectors
-65%
-50%
-35%
-20%
-5%
10%
25%
40%
Phi
lippi
nes
Tur
key
Mal
aysi
a
S. K
orea
Indi
a
Rus
sia
Indo
nesi
a
Chi
na
Bra
zil
S. A
fric
a
Taiw
an
3M 12M
EM Countries

8
Global Markets StrategyFlows & Liquidity
06 November 2020
Nikolaos Panigirtzoglou(44-20) [email protected]
ETF Short Interest Monitor (as of Oct 15)
Chart A7: Cross Asset ETF Short Interest
Short interest as a % of outstanding shares. Short interest is for US Domiciled ETFs and is available bi-monthly from Bloomberg. Short interest
is weighted by AUM
Source: J.P. Morgan. Bloomberg.
Chart A8: Bond ETF Short Interest
Short interest as a % of outstanding shares. Short interest is for US
Domiciled ETFs and is available bi-monthly from Bloomberg. Short interest
is weighted by AUM
Source: J.P. Morgan. Bloomberg.
Chart A9: Equity ETF Short Interest
Short interest as a % of outstanding shares. Short interest is for US
Domiciled ETFs and is available bi-monthly from Bloomberg. Short interest
is weighted by AUM
Source: J.P. Morgan, Bloomberg.
Chart A10a: Quantity-On-Loan on the SPY US ETF
On loan quantity as a % share of share outstanding. Last obs is for 4th Nov
2020.
Source: Datalend, J.P. Morgan
Chart A10b: S&P500 sector short interest
Short interest as a % of shares outstanding based on z-scores. A strategy
which overweight’s the S&P500 sectors with the highest short interest z-score (as % of shares o/s) vs. those with the lowest, produced an
information ratio of 0.7 with a success rate of 56% (see F&L, Jun 28, 2013
for more details)
Source: NYSE, J.P. Morgan.
0%
2%
4%
6%
8%
10%
12%
13 14 15 16 17 18 19 20
Equity Bonds Commodity
0%
5%
10%
15%
20%
25%
30%
35%
40%
13 14 15 16 17 18 19 20
Global HG
Global HY
0%
2%
4%
6%
8%
10%
12%
14%
13 14 15 16 17 18 19 20
US EM WE Japan
0
1
2
3
4
5
6
7
8
Jan-16 Jan-17 Jan-18 Jan-19 Jan-20
-3 -2 -1 0 1 2
Technology
Health Care
Materials
Staples
Utilities
Financials
Discretionary
Comm Srvc
Energy
Industrials
Overall S&P500
9/30/2020
10/15/2020

9
Global Markets StrategyFlows & Liquidity
06 November 2020
Nikolaos Panigirtzoglou(44-20) [email protected]
Chart A11: Option skew monitorSkew is the difference between the implied volatility of out-of-the-money
(OTM) call options and put options. A positive skew implies more demand
for calls than puts and a negative skew, higher demand for puts than calls. It can therefore be seen as an indicator of risk perception in that a highly
negative skew in equities is indicative of a bearish view. The chart shows z-
score of the skew, i.e. the skew minus a rolling 2-year avg skew divided by a rolling two-year standard deviation of the skew. A negative skew on iTraxx
Main means investors favor buying protection, i.e. a short risk position. A
positive skew for the Bund reflects a long duration view, also a short risk
position.
Source: Bloomberg, J.P. Morgan
Chart A12: Market health map
Trading signal for S&P500 and 10Y UST using Artificial Intelligence
Explanation of Market health map: Each of the five axes corresponds to a key indicator for markets. The position of the blue line on each axis shows how far the current observation is from the extremes at either end of the scale. The dotted line shows the same but at the beginning of 2012 for comparison. For
example, a reading at the centre for value would mean that risky assets are the most expensive they have ever been while a reading at the other end of the
axis would mean they are the cheapest they have ever been. Overall, the larger the blue area within the pentagon, the better for the risky markets. All variables are expressed as the percentile of the distribution that the observation falls into. I.e. a reading in the middle of the axis means that the observation
falls exactly at the median of all historical observations. Value: The slope of the risk-return tradeoff line calculated across USTs, US HG and HY corporate
bonds and US equities (see GMOS p. 6, Loeys et al, Jul 6 2011 for more details). Positions: Difference between net spec positions on US equities and intermediate sector UST. See Chart A18. Flow momentum: The difference between flows into equity funds (incl. ETFs) and flows into bond funds. Chart A1.
We then smooth this using a Hodrick-Prescott filter with a lambda parameter of 100. We then take the weekly change in this smoothed series as shown in
Chart A1. Economic momentum: The 2-month change in the global manufacturing PMI. (See REVISITING: Using the Global PMI as trading signal, Nikolaos
Panigirtzoglou, Jan 2012). Equity price momentum: The 6-month change in the S&P500 equity index.
Credit growthChart A13: Credit creation in the US, Japan and Euro areaRolling sum of 4 quarter credit creation as % of GDP. Credit creation includes both bank loans as well as net debt issuance by non-financial
corporations and households. Last obs. is for Q4’19.
Source: Fed, ECB, BoJ, Bloomberg and J.P. Morgan calculations.
Chart A14: Credit creation in EM
Rolling sum of 4 quarter credit creation as % of GDP. Credit creation includes both bank loans as well as net debt issuance by non-financial
corporations and households. Last obs. is for Q4’19.
Source: G4 Central banks FoF, BIS, ICI, Barcap, Bloomberg, IMF and J.P. Morgan
calculations.
-2 -1 0 1 2
iTraxx Main
Gold
Crude
EURUSD
German Bund
S&P500
03-Nov-2020
27-Oct-2020
PositionsInversed
Flows
Economic momentum
Equity price momentum
Value
1 Month 2 Month 3 Month 6 Month
S&P 500 Index Dow n Dow n Up Up
10Y UST Yield Up Up Up Up
-10%
-5%
0%
5%
10%
15%
20%
02 03 04 05 06 07 08 09 10 11 12 13 14 15 16 17 18 19
EuroArea
Japan
US
-5%
5%
15%
25%
35%
45%
01 03 05 07 09 11 13 15 17 19
EM ex China
China
G4

10
Global Markets StrategyFlows & Liquidity
06 November 2020
Nikolaos Panigirtzoglou(44-20) [email protected]
Spec position monitors
Chart A15: Weekly Spec Position MonitorNet spec positions are proxied by the number of long contracts minus the
number of short contracts using the speculative category of the Commitments of Traders reports (as reported by CFTC). To proxy for
speculative investors for equity futures positions we use Asset managers
(see Chart A16), whereas for other assets we use the legacy Non-Commercial category. This net position is then converted to a dollar amount
by multiplying by the contract size and then the corresponding futures price.
We then scale the net positions by open interest. The chart shows the z-score of these net positions. US rates is a duration-weighted composite of
the individual UST futures contracts excluding the Eurodollar contract. The
sample starts in Jun 2006 for all futures contracts apart from Brent which
starts in Jan-2011.
Source: Bloomberg, CFTC, J.P. Morgan
Chart A16: Positions in US equity futures by Asset managers and Leveraged funds
CFTC positions in US equity futures by Leveraged funds and Asset
managers (as a % of open interest). It is an aggregate of the S&P500, Dow
Jones, NASDAQ and their Mini futures contracts.
Source: CFTC, Bloomberg and J.P. Morgan
Chart A17: Spec position indicator on Risky vs. Safe currencies
Difference between net spec positions on risky & safe currenciesNet spec position is calculated in USD across 5 "risky" and 3 "safe"
currencies (safe currencies also include Gold). These positions are then
scaled by open interest and we take an average of "risky" and "safe" assets to create two series. The chart is then simply the difference between the
"risky" and "safe" series. The final series shown in the chart below is
demeaned using data since 2006. The risky currencies are: AUD, NZD,
CAD, RUB, MXN and BRL. The safe currencies are: JPY, CHF and Gold.
Source: CFTC, J.P. Morgan
Chart A18: Spec position indicator on US equity futures vs. intermediate sector UST futures
Difference between net spec positions on US equity futures vs. intermediate sector UST futuresThis indicator is derived by the difference between total CFTC positions in
US equity futures by Asset managers (Chart A16) scaled by open interest minus the non-commercial category spec position on intermediate sector
UST futures (i.e. all UST futures duration weighted ex ED and ex 2Y UST
futures) also scaled by open interest.
Source: CFTC, Bloomberg and J.P. Morgan
-3.5 -2.5 -1.5 -0.5 0.5 1.5 2.5
BrentUS T-Bonds
US Rates (ex. ED)VIX
RUBUS 2YRUS 5YR
USDCAD
US EquitiesAUDNZDMXNGBP
US 10YRBRL
NikkeiSilver
JPYIron Ore
3M EurodollarsGoldEURCornWTI
WheatCHF
Copper
20-Oct 20
27-Oct 20
Standard devations from mean weekly position
-10%
0%
10%
20%
30%
40%
12 13 14 15 16 17 18 19 20
Asset ManagersAsset Managers + Leveraged Funds
-0.8
-0.6
-0.4
-0.2
0.0
0.2
0.4
0.6
0.8
06 07 08 09 10 11 12 13 14 15 16 17 18 19 20
Last observation: 27-Oct-20
-30%
-20%
-10%
0%
10%
20%
30%
06 07 08 09 10 11 12 13 14 15 16 17 18 19 20
Last observation: 27-Oct-20

11
Global Markets StrategyFlows & Liquidity
06 November 2020
Nikolaos Panigirtzoglou(44-20) [email protected]
Mutual fund and hedge fund betas
Chart A19: 21-day rolling beta of 20 biggest active US bond mutual fund managers with respect to the US Agg bond index
The dotted line shows the average beta since 2013.
Source: Bloomberg, J.P. Morgan
Chart A21: Performance of various type of investors
The table depicts the performance of various types of investors in % as of
4th Nov 2020.
Source: Bloomberg, HFR, SG CTA Index, J.P. Morgan.
Chart A20: 21-day rolling beta of 20 biggest active Euro bond mutual fund managers with respect to the Euro Agg bond index
The dotted line shows the average beta since 2013.
Source: Bloomberg, J.P. Morgan.
Chart A22: Momentum signals for 10Y UST and 10Y Bunds
z-score of the momentum signal in our Trend Following Strategy framework
shown in Tables A5 and A6 in the Appendix. Solid lines are for the shorter
term and dotted lines for longer-term momentum.
Source: Bloomberg, J.P. Morgan.
0.20
0.30
0.40
0.50
0.60
0.70
0.80
0.90
Jan-18 Jul-18 Jan-19 Jul-19 Jan-20 Jul-20
Date 2015 2016 2017 2018 2019 2020
Investors
Equity L/S 1.4% 2.2% 11.8% -5.9% 12.8% 0.0%
Macro ex-CTAs -0.1% 3.4% 2.3% -1.3% 5.2% 4.9%
CTAs 0.0% -2.9% 2.5% -5.8% 9.2% -0.8%
Risk Pari ty Funds -5.1% 10.0% 13.5% -6.5% 18.6% -1.9%
Balanced MFs -0.5% 8.4% 14.0% -4.9% 20.1% 4.5%
Benchmark
MSCI AC World -2.4% 7.9% 24.0% -9.4% 26.6% 3.9%
Barclays Global Agg 1.0% 3.9% 3.0% 1.8% 8.2% 5.0%
60 Equity : 40 Bonds -0.4% 8.0% 16.1% -1.9% 22.2% 6.9%
S&P Ri skpari ty Vol 10 -4.1% 8.1% 8.0% -4.0% 19.0% 2.3%
-0.10
0.00
0.10
0.20
0.30
0.40
0.50
0.60
Jan-18 Jul-18 Jan-19 Jul-19 Jan-20 Jul-20
-1.5
-1.0
-0.5
0.0
0.5
1.0
1.5
2.0
2.5
Jul-18 Oct-18 Jan-19 Apr-19 Jul-19 Oct-19 Jan-20 Apr-20 Jul-20 Oct-20
10Y USTs 10y Bunds

12
Global Markets StrategyFlows & Liquidity
06 November 2020
Nikolaos Panigirtzoglou(44-20) [email protected]
Chart A23: Momentum signals for S&P 500
z-score of the momentum signal in our Trend Following Strategy framework
shown in Tables A5 and A6 in the Appendix. Solid lines are for the shorter
term and dotted lines for longer-term momentum.
Source: Bloomberg, J.P. Morgan.
Chart A24: Equity beta of US Balanced Mutual funds and Risk Parity funds
Rolling 21-day equity beta based on a bivariate regression of the daily
returns of our Balanced Mutual fund and Risk Parity fund return indices to
the daily returns of the S&P 500 and Barcap US Agg indices. Given that these funds invest in both equities and bonds we believe that the bivariate
regression will be more suitable for these funds. Our risk parity index
consists of 25 daily reporting Risk Parity funds. Our Balanced Mutual fund index includes the top 20 US-based active funds by assets and that have
existed since 2006. Our Balanced Mutual fund index has a total AUM of
$700bn which is around half of the total AUM of $1.5tr of US based Balanced funds which we believe to be a good proxy of the overall industry
It excludes tracker funds and funds with a low tracking error. Dotted lines
are average since 2015.
Source: Bloomberg, SG CTA Index, J.P. Morgan.
Chart A25: Equity beta of monthly reporting Equity Long/Short hedge funds
Proxied by the ratio of the monthly performance of HFRI Asset-Weighted Equity Hedge fund index divided by the monthly performance of MSCI AC
World index
Source: Bloomberg, HFR, J.P. Morgan
Chart A26: USD exposure of currency hedge funds
The net spec position in the USD as reported by the CFTC. Spec is the non-
commercial category from the CFTC.
Source: CFTC, Barclay, Datastream, Bloomberg J.P. Morgan
.
-6.0
-5.0
-4.0
-3.0
-2.0
-1.0
0.0
1.0
2.0
3.0
4.0
Jan-18 May-18 Sep-18 Jan-19 May-19 Sep-19 Jan-20 May-20 Sep-20
S&P 500
0.45
0.50
0.55
0.60
0.65
0.70
0.75
0.80
-0.4
-0.2
0.0
0.2
0.4
0.6
0.8
1.0
1.2
Jan-15 Jan-16 Jan-17 Jan-18 Jan-19 Jan-20
US Balanced MF (RHS)
Risk Parity Funds
Last Observation is: 04-Nov-20
0.0
0.1
0.2
0.3
0.4
0.5
0.6
0.7
0.8
0.9
Dec-18 Apr-19 Aug-19 Dec-19 Apr-20 Aug-20 -50
-40
-30
-20
-10
0
10
20
30
40
50
07 08 09 10 11 12 13 14 15 16 17 18 19 20
Net spec positions in the USD
Latest observation: 27-Oct-20

13
Global Markets StrategyFlows & Liquidity
06 November 2020
Nikolaos Panigirtzoglou(44-20) [email protected]
Corporate activity
Chart A27: G4 non-financial corporate capex and cash flow as % of GDP
% of GDP, G4 includes the US, the UK, the Euro area and Japan. Last
observation as of Q1 2020.
Source: ECB, BOJ, BOE, Federal Reserve flow of funds.
Chart A28: G4 non-financial corporate sector net debt and equity issuance
$tr per quarter, G4 includes the US, the UK, the Euro area and Japan. Last
observation as of Q1 2020.
Source: ECB, BOJ, BOE, Federal Reserve flow of funds.
Chart A29: Global M&A and LBO
$tr. YTD 2020 as of Nov 04. M&A and LBOs are announced.
Source: Dealogic, J.P. Morgan.
Chart A30: US and non-US share buyback
$bn, 2020 are as of May’20. Buybacks are announced.
Source: Bloomberg, Thomson Reuters, J.P. Morgan
7.5
8.0
8.5
9.0
9.5
10.0
10.5
11.0
11.5
12.0
12.5
95 97 99 01 03 05 07 09 11 13 15 17 19
G4 Capex
G4 Cash flow
-1.5
-1.0
-0.5
0.0
0.5
1.0
1.5
2.0
2.5
3.0
3.5
98 00 02 04 06 08 10 12 14 16 18
Tho
usan
ds
G4 net debt issuance
G4 net equity issuance
0.0
1.0
2.0
3.0
4.0
5.0
6.0
05 06 07 08 09 10 11 12 13 14 15 16 17 18 19 20
LBO M&A
YTD
0
200
400
600
800
1,000
1,200
1,400
05 07 09 11 13 15 17 19
Non- US buybacks US buybacks

14
Global Markets StrategyFlows & Liquidity
06 November 2020
Nikolaos Panigirtzoglou(44-20) [email protected]
Pension fund and insurance company flows
Chart A31: G4 pension funds and insurance companies equity and bond flows
Equity and bond buying in $bn per quarter. G4 includes the US, the UK,
Euro area and Japan. Last observation is Q1 2020
Source: ECB, BOJ, BOE, Federal Reserve flow of funds.
Chart A32: G4 pension funds and insurance companies equity and bond levels
Equity and bond as % of total assets per quarter. G4 includes the US, the
UK, Euro area and Japan. Last observation is Q1 2020.
Source: ECB, BOJ, BOE, Federal Reserve flow of funds
Chart A33: Pension fund deficits
US$bn. For US, funded status of the 100 largest corporate defined benefit pension plans, from Milliman. For UK, funded status of the defined benefit
schemes eligible for entry to the Pension Protection Fund, converted to US$
at today’s exchange rates. Last obs. is Sepl’20.
Source: Milliman, UK Pension Protection Fund, J.P. Morgan
Chart A34: G4 pension funds and insurance companies cash and alternatives levels
Cash and alternative investments as % of total assets per quarter. G4
includes the US, the UK, Euro area and Japan. Last observation is Q4 2019.
Source: ECB, BOJ, BOE, Federal Reserve flow of funds
-200
-150
-100
-50
0
50
100
150
200
250
300
350
400
450
Mar-99 Mar-02 Mar-05 Mar-08 Mar-11 Mar-14 Mar-17 Mar-20
Bonds
Equities
20%
25%
30%
35%
40%
45%
50%
55%
Mar-99 Mar-02 Mar-05 Mar-08 Mar-11 Mar-14 Mar-17 Mar-20
Bonds
Equities
-600
-500
-400
-300
-200
-100
0
100
200
300
10 11 12 13 14 15 16 17 18 19 20
UK
US (Milliman)
0%
5%
10%
15%
20%
25%
30%
Mar-99 Mar-02 Mar-05 Mar-08 Mar-11 Mar-14 Mar-17
Cash
Alternatives

15
Global Markets StrategyFlows & Liquidity
06 November 2020
Nikolaos Panigirtzoglou(44-20) [email protected]
Funding market monitorTable A4: Bank deposits and ECB reliance
Deposits are non-seasonally adjusted Euro area non-bank, non-government deposits as of August 2020. We take total deposits (item 2.2.3. in MFI balance sheets minus “deposits from other financial institutions”, which includes deposits from securitized vehicles and financial holding corporations among others.
We also subtract repos (item 2.2.3.4) from the total figures to give a cleaner picture of deposits outside interbank borrowing. ECB borrowing and Target 2
balances are latest available. ECB borrowing is gross borrowing from regular MROs and LTROs. The Chart shows the evolution of Target 2 balance for Spain and Italy along with government bond spreads. The shaded area denotes the period between May 2011 and Aug 2012 when convertibility risk premia were
elevated due to Greece exit fears.
Source: Bloomberg, ECB, National Central Banks, J.P. Morgan Source: Bloomberg, National Central Banks, J.P. Morgan
Chart A35: USD and Non-USD net bond issuances
Gross issuance minus redemptions in $bn per month. Non-USD issuance includes bonds issued in EUR, GBP and JPY. Non-USD bond issuance is
converted to USD at today’s exchange rate through the full historical period.
In this way net bond issuance fluctuations are unaffected by currency changes. Our bond issuance figures include only Non-Government bonds
issued globally, excluding short-term debt (maturity less than 1-year) and
self-funded issuance (where the issuing bank is the only book runner).Last
observation is Sep 2020.
Source: Dealogic, J.P. Morgan
Chart A36: Market value of negative yield bonds as a % of total outstanding in Bloomberg Barclays Global Agg Index
In %
Source: J.P. Morgan
€bn Target 2 bal. Target 6m chng ECB borrowing Depo 3m chng Depo 12m chng
Austria -48 -11 67 1.1% 7.5%
Belgium -64 -12 78 -0.1% 5.9%
Cyprus 9 1 2 0.1% -1.1%
Finland 67 3 20 2.6% 17.6%
France 20 129 195 1.5% 14.6%
Germany 1115 180 285 1.2% 4.8%
Greece -73 -36 39 2.8% 8.5%
Ireland 52 16 3 2.3% 13.6%
Italy -546 -55 367 3.1% 9.0%
Luxembourg 229 4 8 0.0% 5.7%
Netherlands 70 7 144 2.4% 9.1%
Portugal -82 -8 32 0.4% 7.8%
Spain -465 -57 261 0.4% 8.2%
0.5
1.0
1.5
2.0
2.5
3.0
3.5
4.0
4.5
5.0
5.5
6.0-1100
-1000
-900
-800
-700
-600
-500
-400
-300
-200
-100
0
100
11 12 13 14 15 16 17 18 19 20
Spanish and Italian Target2
10y Spanish and Italian
govt spread vs Bunds
-125-100-75-50-25
0255075
100125150175200225250275300
Jan-18 Jan-19 Jan-20
USD Issuances
NON-USD Issuances
10%
15%
20%
25%
30%
35%
Jan-16 Jan-17 Jan-18 Jan-19 Jan-20
% of bonds trading at negative yields (lhs)
Last observation : 05-Nov-20.

16
Global Markets StrategyFlows & Liquidity
06 November 2020
Nikolaos Panigirtzoglou(44-20) [email protected]
Italian stress market monitor
Chart A37: Open Interest for 10Y Italian Government Bond Futures
In thousands.
Source: J.P. Morgan.
Chart A38: Position proxy for 10Y Italian Government Bond Futures (IKA Comdty)
Number of contracts in thousands across all expiries. Cumulative weekly absolute change in open interest multiplied by the sign of the BTP futures
price change every week.
Source: Bloomberg, J.P. Morgan calculations
Chart A39: Position proxy for 10Y French Government Bond Futures (OATA Comdty)
Number of contracts in thousands across all expiries. Cumulative weekly
absolute change in open interest multiplied by the sign of the OAT futures
price change every week.
Source: Bloomberg, J.P. Morgan calculations.
Chart A40: Currency hedge fund EUR exposure
Net spec position in the EUR as reported by the CFTC. Spec is the non-
commercial category from the CFTC.
Source: Bloomberg, CFTC, J.P. Morgan calculations.
Chart A41: Quantity on loan for MIB and EuroStoxx 50 index stocks
Quantity on Loan as a % shares outstanding. The Quantity on Loan on
individual stock are weighted by their market cap.
Source: Datalend, J.P. Morgan.
Chart A42: Italy Target 2 balance
In €bns. Last observation is Sep'20
Source: ECB, Bloomberg, J.P. Morgan calculations
300
350
400
450
500
550
600
650
700
Jan-18 May-18 Sep-18 Jan-19 May-19 Sep-19 Jan-20 May-20 Sep-20
Last obs is :05-Nov-20
-200
-160
-120
-80
-40
0
40
80
120
160
Jun-16 Dec-16 Jun-17 Dec-17 Jun-18 Dec-18 Jun-19 Dec-19 Jun-20
Last Obs is :05-Nov-20
-200
-100
0
100
200
300
400
Jun-16 Dec-16 Jun-17 Dec-17 Jun-18 Dec-18 Jun-19 Dec-19 Jun-20
Last Obs is :05-Nov-20
-40
-30
-20
-10
0
10
20
30
40
07 08 09 10 11 12 13 14 15 16 17 18 19 20
Net spec positions in the EUR
Last obs is :27-Oct 20
0.0
2.0
4.0
6.0
8.0
Jan-18 May-18 Sep-18 Jan-19 May-19 Sep-19 Jan-20 May-20 Sep-20
MIB Index EuroStoxx 50
-600
-500
-400
-300
-200
-100
0
100
11 12 13 14 15 16 17 18 19 20

17
Global Markets StrategyFlows & Liquidity
06 November 2020
Nikolaos Panigirtzoglou(44-20) [email protected]
Japanese flows and positions
Chart A43: Tokyo Stock Exchange margin trading: total buys minus total sells
In bn of shares. Topix on right axis.
Source: Tokyo Stock Exchange, J.P. Morgan.
Chart A44: Domestic retail flows
In JPY tr. Retail flows are from Tokyo stock exchange.
Source: TSE, J.P. Morgan calculations.
Chart A45: Japanese equity buying by foreign investors. Japanese investors' buying of foreign bonds
$bn, 4 week moving average.
Source: Japan MoF, J.P. Morgan.
Chart A46: Overseas CFTC spec positions
CFTC spec positions are in $bn. For Nikkei we use CFTC positions in Nikkei
futures (USD & JPY) by Leveraged funds and Asset managers.
Source: Bloomberg, CFTC, J.P. Morgan calculations.
500
1000
1500
2000
2500
3000
3500
0.0
1.0
2.0
3.0
4.0
5.0
6.0
00 03 06 09 12 15 18
buys minus sells
Topix
Last observation: 6-Nov-20
-0.8
-0.6
-0.4
-0.2
0.0
0.2
0.4
12 13 14 15 16 17 18 19 20
Japanese retail flow (4 wk avg.)
Last observation: 27-Oct-20
-15
-10
-5
0
5
10
15
12 13 14 15 16 17 18 19 20
Foreign investors' buying of Japanese equities
Japanese investors' buying of foreign bonds
Last observation: 30-Oct-20
-4.0
-2.0
0.0
2.0
4.0
6.0
8.0
-20
-10
0
10
20
30
40
12 13 14 15 16 17 18 19 20
Nikkei Spec position
CFTC JPY/USD net spec positions
Last observation: 27-Oct-20

18
Global Markets StrategyFlows & Liquidity
06 November 2020
Nikolaos Panigirtzoglou(44-20) [email protected]
Commodity flows and positions
Chart A47: Gold spec positions
$bn. CFTC net long minus short position in futures for the Managed Money
category.
Source: CFTC, Bloomberg, J.P. Morgan.
Chart A48: Gold ETFs
Mn troy oz. Physical gold held by all gold ETFs globally.
Source: Bloomberg, J.P. Morgan.
Chart A49: Oil spec positions
Net spec positions divided by open interest. CFTC futures positions for WTI
and Brent are net long minus short for the Non-Commercial category.
Source: CFTC, Bloomberg, J.P. Morgan.
Chart A50: Energy ETF flows
Cumulative energy ETFs flow as a % of AUM. MLP refers to the Alerian
MLP ETF.
Source: CFTC, Bloomberg, J.P. Morgan
-20
-10
0
10
20
30
40
50
06 07 08 09 10 11 12 13 14 15 16 17 18 19 20
Last observation: 27-Oct-20
0
10
20
30
40
50
60
70
80
90
100
110
120
04 05 06 07 08 09 10 11 12 13 14 15 16 17 18 19 20
Last observation: 5-Nov-20
-15%
-10%
-5%
0%
5%
10%
15%
20%
25%
30%
35%
12 13 14 15 16 17 18 19 20
WTI Brent
Latest observation : 27-Oct-20
-10%
0%
10%
20%
30%
40%
50%
60%
70%
80%
90%
100%
110%
13 14 15 16 17 18 19
Energy ex MLP
MLP
Last observation: 4-Nov-20

19
Global Markets StrategyFlows & Liquidity
06 November 2020
Nikolaos Panigirtzoglou(44-20) [email protected]
Corporate FX hedging proxies
Chart A51: Average beta of Eurostoxx 50 companies and Eurostoxx Small-Cap to trade weighted EUR
Rolling 26 weeks average betas based on a bivariate regression of the
weekly returns of individual stocks in the Eurostoxx 50 index to the weekly
returns of the MSCI AC World and JPM EUR Nominal broad effective
exchange rate (NEER).
Source: Bloomberg, J.P. Morgan
Chart A52: Average beta of FTSE 100 companies to trade weighted GBP
Rolling 26 weeks average betas based on a bivariate regression of the
weekly returns of individual stocks in the FTSE 100 index to the weekly returns of the MSCI AC World and JPM GBP Nominal broad effective
exchange rate (NEER).
Source: Bloomberg, J.P. Morgan
Chart A53: Average beta of S&P500 companies to trade weighted US dollar
Rolling 26 weeks average betas based on a bivariate regression of the
weekly returns of stocks in the S&P500 index to the weekly returns of the MSCI AC World and JPM USD Nominal broad effective exchange rate
(NEER).
Source: Bloomberg, J.P. Morgan
Chart A54: Average beta of MSCI EM companies to the trade weighted EM currency index
Rolling 26 weeks average betas based on a bivariate regression of the
weekly returns of individual stocks in the MSCI EM index to the weekly
returns of the MSCI AC World and JPM EM Nominal broad effective
exchange rate (NEER).
Source: Bloomberg, J.P. Morgan.
-2.0
-1.6
-1.2
-0.8
-0.4
0.0
0.4
0.8
1.2
1.6
2.0
2.4
15 16 17 18 19 20
Eurostoxx 50 avg bivariate beta to EUR NEER
Eurostoxx Small-Cap avg bivariate beta to EUR NEER -1.4
-1.2
-1.0
-0.8
-0.6
-0.4
-0.2
0.0
0.2
0.4
0.6
15 16 17 18 19 20
FTSE 100 avg bivariate beta to GBP NEER
-1.4
-1.2
-1.0
-0.8
-0.6
-0.4
-0.2
0.0
0.2
0.4
0.6
15 16 17 18 19 20
S&P 500 avg bivariate beta to USD NEER
-2.0
-1.0
0.0
1.0
2.0
3.0
4.0
5.0
6.0
15 16 17 18 19 20
MSCI EM avg bivariate beta to EM Currency NEER

20
Global Markets StrategyFlows & Liquidity
06 November 2020
Nikolaos Panigirtzoglou(44-20) [email protected]
CTAs - Trend following investors’ momentum indicatorsTable A5: Simple return momentum trading rules across various commodities
Optimal lookback period of each momentum strategy combined with a mean
reversion indicator that turns signal neutral when momentum z-score more than 1.5 standard deviations above or below mean, and a filter that turns
neutral when the z-score is low (below 0.05 and above -0.05) to avoid
excessive trading. Lookbacks, current signals and z-scores are shown for shorter-term and longer-term momentum separately, along with
performance of a combined signal. Annualized return, volatility and
information ratio of the signal; current signal; and z-score of the current
return over the relevant lookback period; data from 1999 onward.
Source: Bloomberg, J.P. Morgan calculations
Table A6: Simple return momentum trading rules across international equity indices, bond futures and FX
Optimal lookback period of each momentum strategy combined with a mean
reversion indicator that turns signal neutral when momentum z-score more
than 1.5 standard deviations above or below mean, and a filter that turns neutral when the z-score is low (below 0.05 and above -0.05) to avoid
excessive trading. Lookbacks, current signals and z-scores are shown for
shorter-term and longer-term momentum separately, along with performance of a combined signal. Annualized return, volatility and
information ratio of the signal; current signal; and z-score of the current
return over the relevant lookback period; data from 1999 onward.
Source: Bloomberg and J.P. Morgan
Lookback
(moving
avg, days)
Annualized
return (%)Vol (%) IR
Current
signal
Time since
last change
(days)
Z-score
% Change
of return
index from
its moving
average
short 21 -1 3 -0.3 -1.9%
long 504 0 171 -1.9 -55.4%
short 105 -1 14 -0.5 -6.6%
long 504 -1 112 -1.2 -32.7%
short 105 -1 6 -0.1 -1.5%
long 462 -1 112 -1.0 -24.0%
short 63 -1 48 -0.2 -1.5%
long 483 -1 1 -1.4 -36.8%
short 63 -1 46 -0.6 -6.0%
long 504 -1 2 -1.4 -42.6%
short 147 -1 2 -0.3 -6.1%
long 294 -1 75 -0.8 -22.7%
short 21 1 0 0.8 2.2%
long 504 0 3 1.8 22.0%
short 10 1 0 1.2 4.1%
long 462 0 0 1.6 35.5%
short 42 1 0 0.3 2.1%
long 273 1 94 0.6 14.0%
short 105 0 0 0.0 -0.1%
long 273 0 0 0.0 0.3%
short 21 1 4 0.8 2.6%
long 378 1 20 0.4 5.9%
short 147 1 109 0.9 11.4%
long 399 1 92 0.6 14.8%
short 126 0 1 0.0 0.3%
long 357 -1 37 -0.2 -4.9%
short 42 1 19 0.4 3.1%
long 336 1 24 0.3 8.3%
short 126 1 44 1.1 13.5%
long 399 1 20 0.5 12.7%
short 168 1 35 1.0 11.4%
long 294 1 36 0.7 11.2%
short 147 1 8 1.4 16.3%
long 504 1 23 0.6 11.9%
short 63 1 6 1.2 9.5%
long 399 1 0 0.1 1.8%
short 42 1 18 1.2 6.4%
long 231 1 52 1.5 19.1%
short 168 1 70 1.0 14.4%
long 483 1 18 0.2 5.2%
short 63 1 27 0.6 5.7%
long 252 1 27 0.5 9.3%
short 63 -1 34 -0.9 -7.9%
long 315 -1 34 -0.4 -7.9%
Cocoa* 10 4.4 28.5 0.15 -1 6 -0.7 -2.4%
* For cocoa, uses only short-term momentum and a z-score threshold of 3 rather than 1.5 as for other contracts.
0.23
0.37
0.52
0.11
0.40
0.41
0.46
0.44
0.36
0.54
0.28
0.58
Sugar
Coffee 0.24
8.3
5.6 23.0
7.5
4.8
9.6
5.8
22.3
17.2
13.6
17.8
20.4
22.7
19.8
22.6
20.2
16.4
14.8
18.2
13.1
10.3
2.4
8.1
6.7
6.8
4.1
Zinc
Wheat
Kansas w heat
Corn
Soybeans
Cotton
Platinum
Aluminium
Copper
Lead
Nickel
0.3119.15.9Silv er
Palladium 16.5 20.6 0.80
Gold 4.2
0.54
10.7 0.39
Gasoil 11.7 19.9 0.59
Nat gas 18.7 34.8
0.20
Heat Oil 6.9 21.3 0.32
Unleaded gas 4.7 24.0
WTI
Brent
9.8 22.4 0.44
7.9 21.8 0.36
Lookback
(moving
avg, days)
Annualized
return (%)Vol (%) IR
Current
signal
Time
since last
change
(days)
Z-score
% Change
of return
index from
its moving
average
short 63 1 1 0.8 3.4%
long 357 1 17 1.4 14.8%
short 84 1 1 0.8 6.8%
long 462 0 2 2.0 38.8%
short 63 1 3 0.6 3.8%
long 420 1 116 0.7 11.5%
short 147 -1 15 -0.1 -0.9%
long 462 -1 141 -0.9 -10.3%
short 21 1 0 0.5 1.6%
long 357 -1 17 -0.2 -2.8%
short 42 1 3 1.0 5.3%
long 357 1 90 0.9 15.0%
short 252 1 123 0.6 0.6%
long 483 1 162 0.8 1.4%
short 252 1 64 0.7 1.6%
long 378 1 61 1.0 2.8%
short 42 -1 23 -0.1 -0.2%
long 504 1 12 1.4 6.0%
short 252 1 16 0.1 0.1%
long 441 0 0 0.0 0.0%
short 84 1 39 0.4 0.4%
long 483 1 164 0.5 1.0%
short 105 1 39 0.7 1.3%
long 462 1 168 1.0 3.3%
short 168 1 0 0.1 0.1%
long 273 -1 169 -0.1 -0.1%
short 105 -1 0 -0.1 -0.2%
long 504 1 62 1.0 4.2%
short 42 1 0 0.2 0.5%
long 273 1 98 0.7 4.5%
short 21 1 11 0.8 1.3%
long 399 1 74 0.4 3.1%
short 168 1 77 0.8 3.4%
long 294 1 28 0.4 2.5%
short 42 1 0 0.6 1.6%
long 378 1 91 0.7 6.1%
short 252 1 67 0.7 3.2%
long 504 1 3 0.4 2.4%6.4
0.49
0.29
0.30
0.62
0.13
3.1 6.4
6.3
7.3
7.7
CAD
1.8
2.1
4.8
0.8
MSCI EM
Euro
Yen
Sterling
AUD
10y Bund
10Y JGB
10Y Gilts
2Y USTs
5Y USTs
10Y USTs
2Y Schatz
5y Bobl
3.3 13.4 0.25
13.9 11.4 1.22
5.0 13.9 0.36
4.6 12.4 0.37
6.4 12.0 0.54
7.4 14.7 0.51
Eurostox x 50
FTSE 100
Nikkei
Nasdaq 100
S&P 500
0.383.81.5
0.833.22.7
1.0 2.2 0.45
0.400.80.3
1.7 1.8 0.94
0.88
0.682.81.9
2.2 3.5 0.62
0.8 1.0

21
Global Markets StrategyFlows & Liquidity
06 November 2020
Nikolaos Panigirtzoglou(44-20) [email protected]
Gauging the Economic NormalizationChart A55: COVID-19 Composite showing the individual components’ contributions YTD 2020
Source: J.P. Morgan.
Chart A56: Daily change in number of COVID-19 Deaths smoothed by HP filterNumber of deaths per day. HP filter uses lambda of 50. Last obs. is 5th Nov
2020.
Source: Worldometer, J.P. Morgan.
Chart A57: Average score of lockdown stringency Index across 147 countries as compiled by Oxford UniversityLast obs. is 5th Nov 2020
Source: Oxford University Research, J.P. Morgan
Chart A58: Google mobility data – Visits and length of stays at Residential areas minus Other areasOther areas include Workplace, Transit station, Parks, Grocery & Pharmacy
and Retail & Recreational places. Data is aggregated for 125 countries and are weighted based on their GDP. Baseline is defined as median volume
between 3rd Jan – 6th Feb. Last obs. is 01 Nov 2020.
Source: Google mobility data, J.P. Morgan
Chart A59: Apple mobility data – Volume of requests for directions for transit, driving and walking activity as compared to baselineData are aggregated for 63 countries and weighted based on their GDP.
Baseline is defined as volume on 13th Jan 2020. Last obs. is 04 Nov 2020.
Source: Apple mobility data, J.P. Morgan
0
2000
4000
6000
8000
10000
12000
Feb-20 Apr-20 Jun-20 Aug-20 Oct-20 0
20
40
60
80
100
Jan-20 Mar-20 May-20 Jul-20 Sep-20 Nov-20
-20
0
20
40
60
80
15-Feb 15-Apr 15-Jun 15-Aug 15-Oct
Global
0
20
40
60
80
100
120
140
160
180
15 Jan 15 Feb 15 Mar 15 Apr 15 May 15 Jun 15 Jul 15 Aug 15 Sep 15 Oct
Global
transit driving walking

22
Global Markets StrategyFlows & Liquidity
06 November 2020
Nikolaos Panigirtzoglou(44-20) [email protected]
Disclosures
Analyst Certification: The Research Analyst(s) denoted by an “AC” on the cover of this report certifies (or, where multiple Research Analysts are primarily responsible for this report, the Research Analyst denoted by an “AC” on the cover or within the document individually certifies, with respect to each security or issuer that the Research Analyst covers in this research) that: (1) all of the views expressed in this report accurately reflect the Research Analyst’s personal views about any and all of the subject securities or issuers; and (2) no part of any of the Research Analyst's compensation was, is, or will be directly or indirectly related to the specific recommendations or views expressed by the Research Analyst(s) in this report. For all Korea-based Research Analysts listed on the front cover, if applicable, they also certify, as per KOFIA requirements, that the Research Analyst’s analysis was made in good faith and that the views reflect the Research Analyst’s own opinion, without undue influence or intervention.
All authors named within this report are Research Analysts unless otherwise specified. In Europe, Sector Specialists (Sales and Trading) may be shown on this report as contacts but are not authors of the report or part of the Research Department.
Company-Specific Disclosures: Important disclosures, including price charts and credit opinion history tables, are available for compendium reports and all J.P. Morgan–covered companies by visiting https://www.jpmm.com/research/disclosures, calling 1-800-477-0406, or e-mailing [email protected] with your request. J.P. Morgan’s Strategy, Technical, and Quantitative Research teams may screen companies not covered by J.P. Morgan. For important disclosures for these companies, please call 1-800-477-0406 or e-mail [email protected].
Analysts' Compensation: The research analysts responsible for the preparation of this report receive compensation based upon various factors, including the quality and accuracy of research, client feedback, competitive factors, and overall firm revenues.
Other Disclosures
J.P. Morgan is a marketing name for investment banking businesses of JPMorgan Chase & Co. and its subsidiaries and affiliates worldwide.
Any long form nomenclature for references to China; Hong Kong; Taiwan; and Macau within this research material are Mainland China; Hong Kong SAR, China; Taiwan, China; and Macau SAR, China.
Options and Futures related research: If the information contained herein regards options- or futures-related research, such information is available only to persons who have received the proper options or futures risk disclosure documents. Please contact your J.P. Morgan Representative or visit https://www.theocc.com/components/docs/riskstoc.pdf for a copy of the Option Clearing Corporation's Characteristics and Risks of Standardized Options or http://www.finra.org/sites/default/files/Security_Futures_Risk_Disclosure_Statement_2018.pdf for a copy of the Security Futures Risk Disclosure Statement.
Changes to Interbank Offered Rates (IBORs) and other benchmark rates: Certain interest rate benchmarks are, or may in the future become, subject to ongoing international, national and other regulatory guidance, reform and proposals for reform. For more information, please consult: https://www.jpmorgan.com/global/disclosures/interbank_offered_rates
Private Bank Clients: Where you are receiving research as a client of the private banking businesses offered by JPMorgan Chase & Co. and its subsidiaries (“J.P. Morgan Private Bank”), research is provided to you by J.P. Morgan Private Bank and not by any other division of J.P. Morgan, including, but not limited to, the J.P. Morgan Corporate and Investment Bank and its Global Research division.
Legal entity responsible for the production and distribution of research: The legal entity identified below the name of the Reg AC Research Analyst who authored this material is the legal entity responsible for the production of this research. Where multiple Reg AC Research Analysts authored this material with different legal entities identified below their names, these legal entities are jointly responsible for the production of this research. Research Analysts from various J.P. Morgan affiliates may have contributed to the production of this material but may not be licensed to carry out regulated activities in your jurisdiction (and do not hold themselves out as being able to do so). Unless otherwise stated below, this material has been distributed by the legal entity responsible for production. If you have any queries, please contact the relevant Research Analyst in your jurisdiction or the entity in your jurisdiction that has distributed this research material.
Legal Entities Disclosures and Country-/Region-Specific Disclosures:Argentina: JPMorgan Chase Bank N.A Sucursal Buenos Aires is regulated by Banco Central de la República Argentina (“BCRA”-Central Bank of Argentina) and Comisión Nacional de Valores (“CNV”- Argentinian Securities Commission” - ALYC y AN Integral N°51). Australia: J.P. Morgan Securities Australia Limited (“JPMSAL”) (ABN 61 003 245 234/AFS Licence No: 238066) is regulated by the Australian Securities and Investments Commission and is a Market, Clearing and Settlement Participant of ASX Limited and CHI-X. This material is issued and distributed in Australia by or on behalf of JPMSAL only to "wholesale clients" (as defined in section 761G of the Corporations Act 2001). A list of all financial products covered can be found by visiting

23
Global Markets StrategyFlows & Liquidity
06 November 2020
Nikolaos Panigirtzoglou(44-20) [email protected]
https://www.jpmm.com/research/disclosures. J.P. Morgan seeks to cover companies of relevance to the domestic and international investor base across all Global Industry Classification Standard (GICS) sectors, as well as across a range of market capitalisation sizes. If applicable, in the course of conducting public side due diligence on the subject company(ies), the Research Analyst team may at times perform such diligence through corporate engagements such as site visits, discussions with company representatives, management presentations, etc. Research issued by JPMSAL has been prepared in accordance with J.P. Morgan Australia’s Research Independence Policy which can be found at the following link: J.P. Morgan Australia - Research Independence Policy. Brazil: Banco J.P. Morgan S.A. is regulated by the Comissao de Valores Mobiliarios (CVM) and by the Central Bank of Brazil. Ombudsman J.P. Morgan: 0800-7700847 / [email protected]. Canada: J.P. Morgan Securities Canada Inc. is a registered investment dealer, regulated by the Investment Industry Regulatory Organization of Canada and the Ontario Securities Commission and is the participating member on Canadian exchanges. This material is distributed in Canada by or on behalf of J.P.Morgan Securities Canada Inc. China: J.P. Morgan Securities (China) Company Limited has been approved by CSRC to conduct the securities investment consultancy business. Dubai: JPMorgan Chase Bank, N.A., Dubai Branch is regulated by the Dubai Financial Services Authority (DFSA) and its registered address is Dubai International Financial Centre - The Gate, West Wing, Level 3 and 9 PO Box 506551, Dubai, UAE. This material has been distributed to persons regarded as professional clients or market counterparties as defined under the DFSA rules. Germany: This material is distributed in Germany by J.P. Morgan Securities plc, Frankfurt Branch, which is regulated by the Bundesanstalt für Finanzdienstleistungsaufsich and also by J.P. Morgan AG (“JPM AG”), which is a member of the Frankfurt Stock Exchange, is authorised by the European Central Bank (“ECB”) and is regulated by the Federal Financial Supervisory Authority (BaFin), JPM AG is a company incorporated in the Federal Republic of Germany with a registered office at Taunustor 1, 60310 Frankfurt am Main, the Federal Republic of Germany. Hong Kong: J.P. Morgan Securities (Asia Pacific) Limited (CE number AAJ321) is regulated by the Hong Kong Monetary Authority and the Securities and Futures Commission in Hong Kong, and J.P. Morgan Broking (Hong Kong) Limited (CE number AAB027) is regulated by the Securities and Futures Commission in Hong Kong. JP Morgan Chase Bank, N.A., Hong Kong is organized under the laws of the United States with limited liability. India: J.P. Morgan India Private Limited (Corporate Identity Number - U67120MH1992FTC068724), having its registered office at J.P. Morgan Tower, Off. C.S.T. Road, Kalina, Santacruz - East, Mumbai –400098, is registered with the Securities and Exchange Board of India (SEBI) as a ‘Research Analyst’ having registration number INH000001873. J.P. Morgan India Private Limited is also registered with SEBI as a member of the National Stock Exchange of India Limited and the Bombay Stock Exchange Limited (SEBI Registration Number – INZ000239730) and as a Merchant Banker (SEBI Registration Number - MB/INM000002970). Telephone: 91-22-6157 3000, Facsimile: 91-22-6157 3990 and Website: www.jpmipl.com. For non-local research material, this material is not distributed in India by J.P. Morgan India Private Limited. Indonesia: PT J.P. Morgan Sekuritas Indonesia is a member of the Indonesia Stock Exchange and is regulated by the OJK a.k.a. BAPEPAM LK. Korea: This material is issued and distributed in Korea by or through J.P. Morgan Securities (Far East) Limited, Seoul Branch, which is a member of the Korea Exchange (KRX) and is regulated by the Financial Services Commission (FSC) and the Financial Supervisory Service (FSS). Japan: JPMorgan Securities Japan Co., Ltd. and JPMorgan Chase Bank, N.A., Tokyo Branch are regulated by the Financial Services Agency in Japan. Malaysia: This material is issued and distributed in Malaysia by JPMorgan Securities (Malaysia) Sdn Bhd (18146-X), which is a Participating Organization of Bursa Malaysia Berhad and holds a Capital Markets Services License issued by the Securities Commission in Malaysia. Mexico: J.P. Morgan Casa de Bolsa, S.A. de C.V.and J.P. Morgan Grupo Financiero are members of the Mexican Stock Exchange and are authorized to act as a broker dealer by the National Banking and Securities Exchange Commission. New Zealand: This material is issued and distributed by JPMSAL in New Zealand only to "wholesale clients" (as defined in the Financial Advisers Act 2008). JPMSAL is registered as a Financial Service Provider under the Financial Service providers (Registration and Dispute Resolution) Act of 2008. Pakistan: J. P. Morgan Pakistan Broking (Pvt.) Ltd is a member of the Karachi Stock Exchange and regulated by the Securities and Exchange Commission of Pakistan. Philippines: J.P. Morgan Securities Philippines Inc. is a Trading Participant of the Philippine Stock Exchange and a member of the Securities Clearing Corporation of the Philippines and the Securities Investor Protection Fund. It is regulated by the Securities and Exchange Commission. Russia: CB J.P. Morgan Bank International LLC is regulated by the Central Bank of Russia. Singapore: This material is issued and distributed in Singapore by or through J.P. Morgan Securities Singapore Private Limited (JPMSS) [MCI (P) 018/04/2020 and Co. Reg. No.: 199405335R], which is a member of the Singapore Exchange Securities Trading Limited, and/or JPMorgan Chase Bank, N.A., Singapore branch (JPMCB Singapore) [MCI (P) 052/09/2020], both of which are regulated by the Monetary Authority of Singapore. This material is issued and distributed in Singapore only to accredited investors, expert investors and institutional investors, as defined in Section 4A of the Securities and Futures Act, Cap. 289 (SFA). This material is not intended to be issued or distributed to any retail investors or any other investors that do not fall into the classes of “accredited investors,” “expert investors” or “institutional investors,” as defined under Section 4A of the SFA. Recipients of this material in Singapore are to contact JPMSS or JPMCB Singapore in respect of any matters arising from, or in connection with, the material. As at the date of this material, JPMSS is a designated market maker for certain structured warrants listed on the Singapore Exchange where the underlying securities may be the securities discussed in this material. Arising from its role as a designated market maker for such structured warrants, JPMSS may conduct hedging activities in respect of such underlying securities and hold or have an interest in such underlying securities as a result. The updated list of structured warrants for which JPMSS acts as designated market maker may be found on the website of the Singapore Exchange Limited: http://www.sgx.com. South Africa: J.P. Morgan Equities South Africa Proprietary Limited is a member of the Johannesburg Securities Exchange and is regulated by the Financial Services Board. Taiwan: J.P. Morgan Securities (Taiwan) Limited is a participant of the Taiwan Stock Exchange (company-type) and regulated by the Taiwan Securities and Futures Bureau. Material relating to equity securities is issued and distributed in Taiwan by J.P. Morgan Securities (Taiwan) Limited, subject to the license scope and the applicable laws and the regulations in Taiwan. According to Paragraph 2, Article 7-1 of Operational Regulations Governing Securities Firms Recommending Trades in Securities to Customers (as amended or

24
Global Markets StrategyFlows & Liquidity
06 November 2020
Nikolaos Panigirtzoglou(44-20) [email protected]
supplemented) and/or other applicable laws or regulations, please note that the recipient of this material is not permitted to engage in any activities in connection with the material that may give rise to conflicts of interests, unless otherwise disclosed in the “Important Disclosures” in this material. Thailand: This material is issued and distributed in Thailand by JPMorgan Securities (Thailand) Ltd., which is a member of the Stock Exchange of Thailand and is regulated by the Ministry of Finance and the Securities and Exchange Commission, and its registered address is 3rd Floor, 20 North Sathorn Road, Silom, Bangrak, Bangkok 10500. UK and European Economic Area (EEA): J.P. Morgan Securities plc (“JPMS plc”) is a member of the London Stock Exchange and is authorised by the Prudential Regulation Authority and regulated by the Financial Conduct Authority and the Prudential Regulation Authority. Registered in England & Wales No. 2711006. Registered Office 25 Bank Street, London, E14 5JP. Unless specified to the contrary, material is distributed in the UK and the EEA by JPMS plc. This material is directed in the UK only to: (a) persons having professional experience in matters relating to investments falling within article 19(5) of the Financial Services and Markets Act 2000 (Financial Promotion) (Order) 2005 (“the FPO”); (b) persons outlined in article 49 of the FPO (high net worth companies, unincorporated associations or partnerships, the trustees of high value trusts, etc.); or (c) any persons to whom this communication may otherwise lawfully be made; all such persons being referred to as "relevant persons". This material must not be acted on or relied on by persons who are not relevant persons. Any investment or investment activity to which this material relates is only available to relevant persons and will be engaged in only with relevant persons. Research issued by JPMS plc has been prepared in accordance with JPMS plc's policy for prevention and avoidance of conflicts of interest related to the production of Research which can be found at the following link: J.P. Morgan EMEA - Research Independence Policy. U.S.: J.P. Morgan Securities LLC (“JPMS”) is a member of the NYSE, FINRA, SIPC, and the NFA. JPMorgan Chase Bank, N.A. is a member of the FDIC. Material published by non-U.S. affiliates is distributed in the U.S. by JPMS who accepts responsibility for its content.
General: Additional information is available upon request. The information in this material has been obtained from sources believed to be reliable. While all reasonable care has been taken to ensure that the facts stated in this material are accurate and that the forecasts, opinions and expectations contained herein are fair and reasonable, JPMorgan Chase & Co. or its affiliates and/or subsidiaries (collectively J.P. Morgan) make no representations or warranties whatsoever to the completeness or accuracy of the material provided, except with respect to any disclosures relative to J.P. Morgan and the Research Analyst's involvement with the issuer that is the subject of the material. Accordingly, no reliance should be placed on the accuracy, fairness or completeness of the information contained in this material. Any data discrepancies in this material could be the result of different calculations and/or adjustments. J.P. Morgan accepts no liability whatsoever for any loss arising from any use of this material or its contents, and neither J.P. Morgan nor any of its respective directors, officers or employees, shall be in any way responsible for the contents hereof, apart from the liabilities and responsibilities that may be imposed on them by the relevant regulatory authority in the jurisdiction in question, or the regulatory regime thereunder. Opinions, forecasts or projections contained in this material represent J.P. Morgan's current opinions or judgment as of the date of the material only and are therefore subject to change without notice. Periodic updates may be provided on companies/industries based on company-specific developments or announcements, market conditions or any other publicly available information. There can be no assurance that future results or events will be consistent with any such opinions, forecasts or projections, which represent only one possible outcome. Furthermore, such opinions, forecasts or projections are subject to certain risks, uncertainties and assumptions that have not been verified, and future actual results or events could differ materially. The value of, or income from, any investments referred to in this material may fluctuate and/or be affected by changes in exchange rates. All pricing is indicative as of the close of market for the securities discussed, unless otherwise stated. Past performance is not indicative of future results. Accordingly, investors may receive back less than originally invested. This material is not intended as an offer or solicitation for the purchase or sale of any financial instrument. The opinions and recommendations herein do not take into account individual client circumstances, objectives, or needs and are not intended as recommendations of particular securities, financial instruments or strategies to particular clients. The recipients of this material must make their own independent decisions regarding any securities or financial instruments mentioned herein and should seek advice from such independent financial, legal, tax or other adviser as they deem necessary. J.P. Morgan may trade as a principal on the basis of the Research Analysts’ views and research, and it may also engage in transactions for its own account or for its clients’ accounts in a manner inconsistent with the views taken in this material, and J.P. Morgan is under no obligation to ensure that such other communication is brought to the attention of any recipient of this material. Others within J.P. Morgan, including Strategists, Sales staff and other Research Analysts, may take views that are inconsistent with those taken in this material. Employees of J.P. Morgan not involved in the preparation of this material may have investments in the securities (or derivatives of such securities) mentioned in this material and may trade them in ways different from those discussed in this material.
"Other Disclosures" last revised October 10, 2020.
Copyright 2020 JPMorgan Chase & Co. All rights reserved. This material or any portion hereof may not be reprinted, sold or redistributed without the written consent of J.P. Morgan. #$J&098$#*P
Completed 06 Nov 2020 06:55 PM GMT Disseminated 06 Nov 2020 06:57 PM GMT
Related Documents