FlowJo (Macintosh) FlowJo (Macintosh)............................................................................................................................................1 Manual for Macintosh ..............................................................................................................................1 Workspace Overview ..........................................................................................................................................2 Workspace Overview ..........................................................................................................................................4 Adding Samples ...................................................................................................................................................6 Groups ..................................................................................................................................................................7 Batch Analysis .....................................................................................................................................................9 Statistics ............................................................................................................................................................11 Summary of Drag and Drop Examples ..........................................................................................................12 Keyword Search and Replace .........................................................................................................................13 Graph Window ..................................................................................................................................................17 Bivariate displays ...................................................................................................................................18 Univariate displays ..........................................................................................................................18 Graph Types ......................................................................................................................................................19 Bivariate displays ...................................................................................................................................19 Univariate displays ..........................................................................................................................19 Gating .................................................................................................................................................................20 Autogating Tool .....................................................................................................................................20 Backgating .............................................................................................................................................22 PolyVariate Display .........................................................................................................................................24 Output ................................................................................................................................................................31 SciBook ..............................................................................................................................................................32 The Layout Editor .............................................................................................................................................34 Copying Graphs ...............................................................................................................................................35 Tables ................................................................................................................................................................36 Iteration (Batching)..........................................................................................................................................42 Iterating in the Layout Editor .................................................................................................................43 Changing the Iteration Value..........................................................................................................43 Table of Contents i

Welcome message from author
This document is posted to help you gain knowledge. Please leave a comment to let me know what you think about it! Share it to your friends and learn new things together.
Transcript
FlowJo (Macintosh)FlowJo (Macintosh)............................................................................................................................................1
Manual for Macintosh..............................................................................................................................1
Workspace Overview..........................................................................................................................................2
Workspace Overview..........................................................................................................................................4
Adding Samples...................................................................................................................................................6
Groups..................................................................................................................................................................7
Batch Analysis.....................................................................................................................................................9
Statistics............................................................................................................................................................11
Summary of Drag and Drop Examples..........................................................................................................12
Keyword Search and Replace.........................................................................................................................13
Graph Window..................................................................................................................................................17Bivariate displays...................................................................................................................................18
Univariate displays..........................................................................................................................18
Graph Types......................................................................................................................................................19Bivariate displays...................................................................................................................................19
Univariate displays..........................................................................................................................19
Gating.................................................................................................................................................................20Autogating Tool.....................................................................................................................................20Backgating.............................................................................................................................................22
PolyVariate Display.........................................................................................................................................24
Output................................................................................................................................................................31
SciBook..............................................................................................................................................................32
The Layout Editor.............................................................................................................................................34
Copying Graphs...............................................................................................................................................35
Tables................................................................................................................................................................36
Iteration (Batching)..........................................................................................................................................42Iterating in the Layout Editor.................................................................................................................43
Changing the Iteration Value..........................................................................................................43
Table of Contents
i

FlowJo (Macintosh)Formulas in Tables...........................................................................................................................................46
Insert Function.......................................................................................................................................49Text (String) functions:...................................................................................................................49
Printing..............................................................................................................................................................52
Movies................................................................................................................................................................53
Exporting...........................................................................................................................................................55Exporting Histogram Data and Kinetics Data.......................................................................................56
Platforms............................................................................................................................................................57Kinetics..................................................................................................................................................57
Cell Cycle Analysis.........................................................................................................................57
Derived Parameters..........................................................................................................................................59
Compensation Overview..................................................................................................................................60
Compensation Wizard......................................................................................................................................62
AutoCompensation Scripts.............................................................................................................................64
Calibrated Parameters: Overview...................................................................................................................68
Kinetics Overview.............................................................................................................................................69
Cell Cycle...........................................................................................................................................................73
Proliferation.......................................................................................................................................................75
Population Comparison - Overview................................................................................................................79Comparison Algorithms.........................................................................................................................79
FlowJo Population Comparison Platforms......................................................................................79
Multi-sample Population Comparison............................................................................................................81
Clustering...........................................................................................................................................................84A Highly Efficient Algorithm for Cluster Analysis...............................................................................84
Introduction.....................................................................................................................................84
MultiGraph Overlay.........................................................................................................................................87Graphical Display..................................................................................................................................87
Background Gating...........................................................................................................................................91
Table of Contents
ii

FlowJo (Macintosh)Display Transformation Overview..................................................................................................................93
Why change the display of your data?...................................................................................................93Display transformation....................................................................................................................94
FlowJo Menus....................................................................................................................................................96FlowJo Menu.........................................................................................................................................96
File Menu........................................................................................................................................97
Preferences.......................................................................................................................................................115Workspace Preferences........................................................................................................................115
Graph Preferences ........................................................................................................................117
Techniques......................................................................................................................................................127
Getting Help in FlowJo...................................................................................................................................128Offline Documentation........................................................................................................................128
Cancelling Batch Operations........................................................................................................................129
Option Key Techniques.................................................................................................................................130
Mac and Memory............................................................................................................................................131Macintosh System Requirements.........................................................................................................131
Macintosh Memory Requirements for FlowJo..............................................................................131
Table of Contents
iii

FlowJo (Macintosh)
Manual for Macintosh
FlowJo (Macintosh) 1
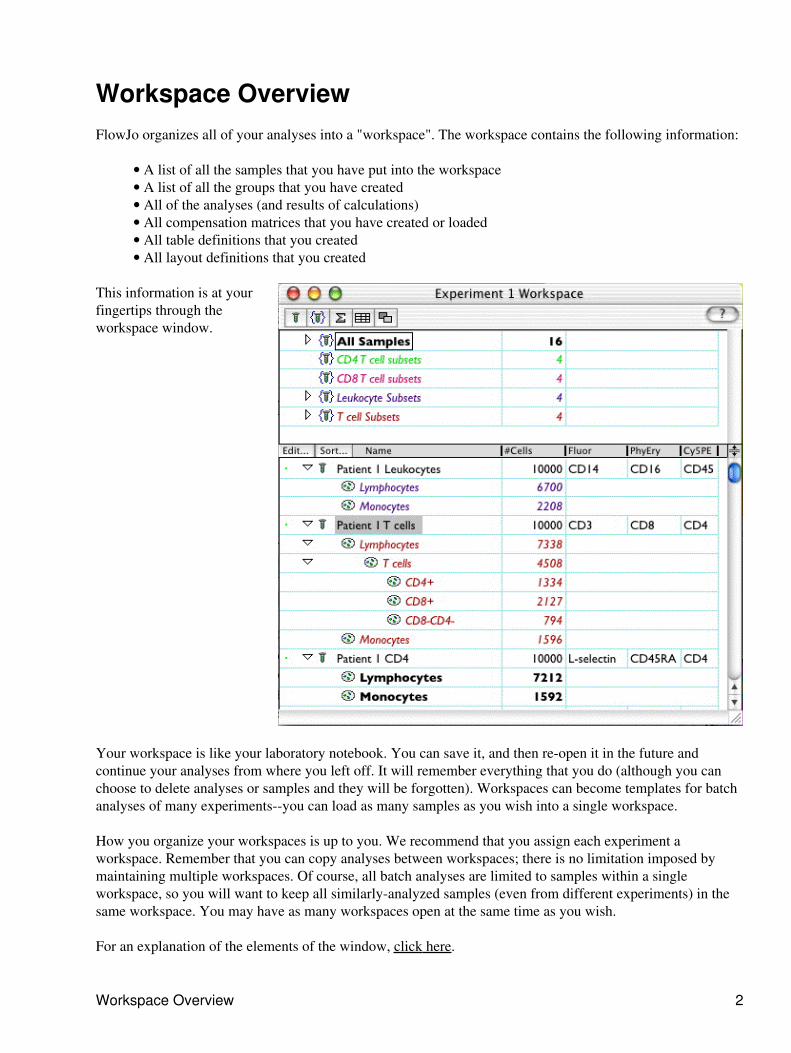
Workspace OverviewFlowJo organizes all of your analyses into a "workspace". The workspace contains the following information:
A list of all the samples that you have put into the workspace• A list of all the groups that you have created• All of the analyses (and results of calculations)• All compensation matrices that you have created or loaded• All table definitions that you created• All layout definitions that you created•
This information is at yourfingertips through theworkspace window.
Your workspace is like your laboratory notebook. You can save it, and then re-open it in the future andcontinue your analyses from where you left off. It will remember everything that you do (although you canchoose to delete analyses or samples and they will be forgotten). Workspaces can become templates for batchanalyses of many experiments--you can load as many samples as you wish into a single workspace.
How you organize your workspaces is up to you. We recommend that you assign each experiment aworkspace. Remember that you can copy analyses between workspaces; there is no limitation imposed bymaintaining multiple workspaces. Of course, all batch analyses are limited to samples within a singleworkspace, so you will want to keep all similarly-analyzed samples (even from different experiments) in thesame workspace. You may have as many workspaces open at the same time as you wish.
For an explanation of the elements of the window, click here.
Workspace Overview 2

Workspaces:
Table of Contents
Workspace Overview 3
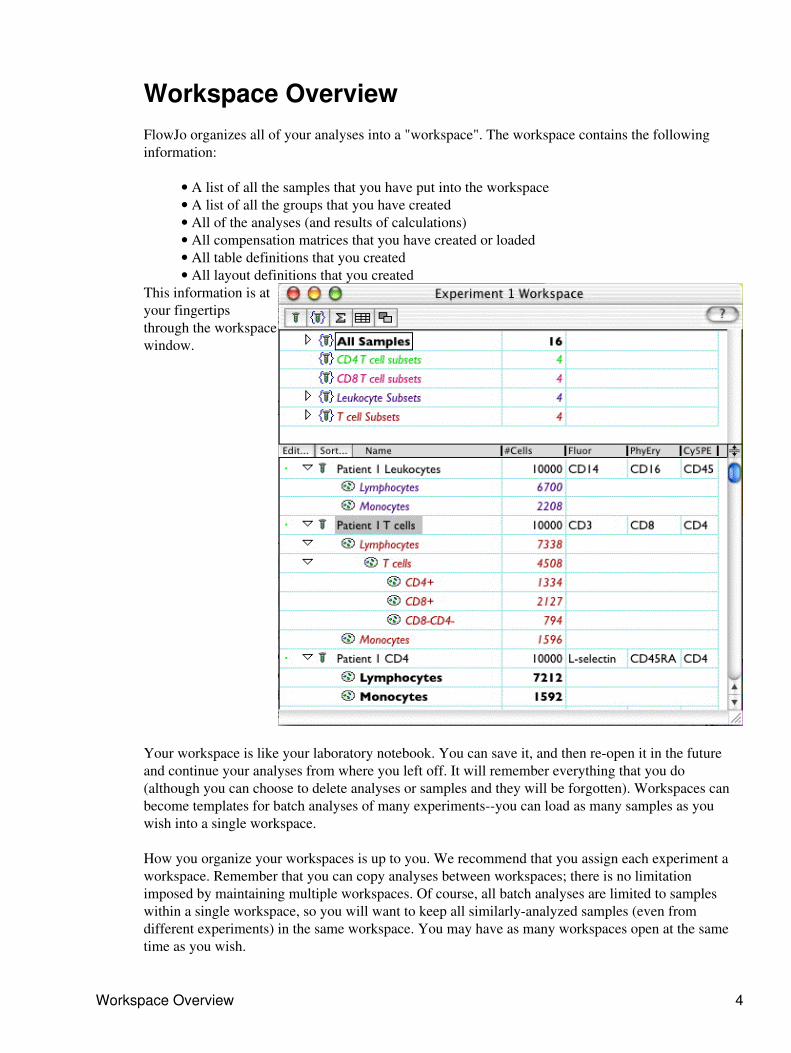
Workspace OverviewFlowJo organizes all of your analyses into a "workspace". The workspace contains the followinginformation:
A list of all the samples that you have put into the workspace• A list of all the groups that you have created• All of the analyses (and results of calculations)• All compensation matrices that you have created or loaded• All table definitions that you created• All layout definitions that you created•
This information is atyour fingertipsthrough the workspacewindow.
Your workspace is like your laboratory notebook. You can save it, and then re-open it in the futureand continue your analyses from where you left off. It will remember everything that you do(although you can choose to delete analyses or samples and they will be forgotten). Workspaces canbecome templates for batch analyses of many experiments--you can load as many samples as youwish into a single workspace.
How you organize your workspaces is up to you. We recommend that you assign each experiment aworkspace. Remember that you can copy analyses between workspaces; there is no limitationimposed by maintaining multiple workspaces. Of course, all batch analyses are limited to sampleswithin a single workspace, so you will want to keep all similarly-analyzed samples (even fromdifferent experiments) in the same workspace. You may have as many workspaces open at the sametime as you wish.
Workspace Overview 4

For an explanation of the elements of the window, click here.
Workspaces: an overview
•
Table of Contents
Workspace Overview 5
Adding SamplesTo analyze samples, you must first create a new workspace and then add the sample files to thisworkspace. Add samples by clicking on the Add Sample button in the workspace (leftmost function
button). You will be shown the standard Macintosh Open File dialog. You can add a single file by openingthat file directly. If FlowJo determines that this is an FCS file, it will read it in and add it to the currentgroup.
Alternatively, you may select a folder and click on the button Add all files in folder. FlowJo will thenlook at every file in the folder you specify. If it is an FCS file, it will be added to the workspace. Inaddition, FlowJo will create a new group that has the same name as the folder you selected; the filesyou just read in will be added to the folder. This way you can add an entire experiment at once!
Finally, if you select the button Add all files in all folders, FlowJo will look within the folder youselect and (1) add all FCS files in that folder; (2) search within each folder contained therein for FCSfiles and add them; and (3) continue this search as deep as possible (i.e., looking for data in folderswithin folders). Each time a data file is encountered, FlowJo will create a new group with the nameof the folder that the data file is in and put the data file in that group.
Note: You can also add sample files (or folders of sample files) by simply dragging and dropping thefiles from the finder to the workspace window.
Reading samples into workspaces
•
Adding Samples 6

GroupsGroups are the heart of all the powerful tools in FlowJo. A group is a collection of samples-and amechanism by which analyses can be applied uniformly to that collection of samples. Any givensample may belong to one or more groups. FlowJo lists the groups in the upper portion of theworkspace window.
There is a special case group: the "All Samples" group. It contains (by definition) all of the samplesknown to the workspace. The "All Samples" group can neither be renamed nor deleted.
Groups are created in one of two ways:
(1) When you read in a folder of data files, FlowJo creates a group with the name of the folder andautomatically adds the samples to the group; or
(2) You can create a new group by clicking on the New Group button under the Workspace menu.
When you create the group, you are given the option of adding samples to the group which fit a set ofcriteria-this is specified by the Group Definition dialog window. In addition, you can specify thatthese criteria should be checked anytime new samples are added to the workspace: if the new samplesmeet those criteria, they are added to the group (and group-based analyses are automaticallyperformed at once.)
You can add samples from the workspace to any group. Just click on the sample and drag it to thegroup. To remove a sample from a group, select the group, then select the sample and press the deletekey. If the current group is All Samples and you delete the sample, then you will be permanentlyremoving the sample from the workspace.
A group behaves in some ways as a "template sample" for its members. In other words, you can draggates or statistic nodes to a group exactly the same way as you would to another sample. The onlydifference is that these gates, after being added to the group, are then added to every samplebelonging to the group. This is one of the ways in which FlowJo performs batch analyses. For hints oncreating groups to efficiently use this feature, click here.
There is one unbreakable rule with regards to groups: Every sample belonging to a group mustcontain every analysis that has been applied to the group. Of course, if the group specifies analysesthat are not applicable to the sample, then this doesn't happen. (For example, if you have created agate based on compensated parameters, and a sample that is not compensated is added to the group,then those gates cannot be added to that sample. Once you compensate the sample, however, the gateswill be automatically added.)
If a sample belongs to multiple groups, then it will have all of the analyses from all of the groups towhich it belongs. Whenever you add a sample to a group (by dragging it into the group), that group'sanalyses are automatically applied to the sample.
Associated with group names is a color and text style. A gate that is attached to a sample through agroup operation appears in the same color and style as that group. Therefore, any gate within a samplethat has a group's color and style is guaranteed to be identical to the group's version of that gate.When you change a group's version of a gate (by dragging a new version of that gate onto the groupor if you have the Synchronize Group's Gates option checked), then all samples with the group's
Groups 7

version of the gate are likewise updated.
If you modify a sample's version of a group's gate (for instance, if you decide that a lymphocyte gatefor one sample should be slightly different and you move it), then that gate will now appear in theworkspace window in black and plain text (unlike the group's gates). This is how you can tell from thetext when a gate has been modified. However, if you checked the Synchronize Group's Gates optionwhen you created the group, any time you modify a gate on any sample, the group's gate isautomatically updated.
Note that modified gates will still behave in other ways like group gates: when you attach asubpopulation to a group's gate, it will be attached to the same gate in all samples, whether or not theyare identical to the group's version of the gate.
If you have modified a gate and decide later that it should be identical to the group's version, you canselect the gate and choose the Unify analyses option under the Workspace menu. Likewise, if youselect a gate within a group and choose this menu option, then all sample's versions of this gate aremade identical to the group's version.
How do you know what the group's version of a gate looks like? Simply open any sample which hasthe group's version of the gate (i.e. the node is displayed in the color and text style of the group). Ifyou change this sample's gate (move it), then you are only changing that sample's version. To changethe group's version, drag the node back onto the group after you have made the modification or if youchecked the Synchronize Group's Gates option when creating the group, the update happensautomatically.
If a sample belongs to multiple groups which all have an analysis of the same name, then the sample'sversion of the gate will be whichever one it got first.
Deleting nodes associated with groups have special consequences:
If you delete the node in the group itself, then it is removed from the group. You are thenasked if you want to remove the same nodes from all of the samples; if you choose not toremove them from the samples, they are left alone (but they are then owned by thesamples-i.e., drawn in black and plain text-since they no longer belong to a group).
♦
You cannot delete a sample's node which is identical to the group's node, since every samplemust have every analysis belonging to the groups that it is in.
♦
If you delete a node which is a modified version of the group's node, then FlowJo will replaceit with the original, group's version of the node.
♦
If you delete a sample from a group, then it is removed from the group but all analyses whichcame from the group are still applied to the sample (but they are now owned by the sample,not the group).
♦
If you delete a group, then all of the group's analyses nodes are assigned to the samples.♦ If you rename a sample's version of a group node, then a copy of that node is made with thenew name, and the sample will retain a node with the same name as the group's node.
♦
Groups
•
Table of Contents
Groups 8

Batch AnalysisThe real power of FlowJo as an analysis tool becomes immediately evident when you start to do"batch" analysis; i.e., the repeated application of a set of analyses (gates, statistics, graphical outputs)to a series of samples.
Application of analyses to other samples is very easy: simply click once on the analyses that you wishto duplicate, and while holding down the mouse button - drag them to the destination sample. You canselect a single gate (by clicking), or select several independent gates (by shift-clicking and draggingany of the selected gates). In addition, you can choose to take all the "children" subsets of the selectedgate (i.e., the entire analysis tree) by holding down the "option" key as you drag the selected node;you can also choose to take the "parent" gates by holding down the "control" key as you drag node.For a full explanation complete with examples of these operations click here.
You can also apply a set of analyses to all samples within a group simultaneously. Simply drag theanalyses trees onto the group. They are attached to the group itself, and then attached to each samplethat belongs to the group (assuming the analysis is valid for that sample). By using these kinds ofgroup analyses, you can assure that all samples are being analyzed identically. When you change agroup's version of an analysis (by dragging a new version of a gate onto the group), then all samplesbelonging to the group will be automatically updated with the new copy (with the exception of thosesamples which have "special" versions of such gates). These operations are fully explained in thepages on group analyses .
Another kind of batch analysis is the extraction of statistical information from a series of samples.This is accomplished through the table editor. Using the table editor, you specify what sorts ofstatistical information you wish to collect for each sample. Then you create the table for the currentgroup; FlowJo allows you to save the table to a file (which you can export into a spreadsheet), to theclipboard (so you can copy it directly into a spreadsheet), or print it out. In addition, FlowJo will savethe table AND open your favorite spreadsheet program AND copy the table into this program - allwith a single click! Table definitions are saved with the workspace so that you can use them again inthe future.
The final type of batch analysis is the extraction of graphical displays for a series of samples. For this,you use the layout editor. The layout editor allows you to arrange several graphs on a drawing board.This graphical layout is then applied to the series of samples in the current group; the result can besaved to a disk file (PICT format), copied into other applications (such as Canvas), or printed.
Template workspaces save all the analyses (gates and statistics), table definitions and layoutdefinitions while removing the samples. Because FlowJo saves all of this information in theworkspace, it is a simple matter to read new samples into the same workspace that has been saved as atemplate and then apply the same batch analyses to those samples.
A batch is composed of a series of tasks. The task is the unit of computation; that is the generation ofeach statistic or graph, sorting of a list etc. FlowJo can execute tasks asynchronously, meaning thatyou do not have to wait for all pending tasks to complete before interacting with the program. Youcan even initiate new tasks while others are being completed, so that the amount of time you have tospend waiting for the program is minimized. Because the tasks can also be sorted in such a way as toreduce the loading and unloading of files, the asynchronous processing can actually be faster thangiving all of the computing resources to handling pending computations.
Batch Analysis 9

The list of pending tasks is managed by the Task Manager, which displays a progress window whiletasks are being completed. The thermometer pane shows the percent completion, and the status flagsreport the current process and how many tasks are scheduled to complete it. Some tasks will scheduletheir own subtasks, so you are not guaranteed that the Items Remaining will steadily decrease. Youcan cancel operations that are in progress, or stop and restart them if you have other operations towhich you need to give immediate attention.
See Also: Groups , Layout Editor , Table Editor
Batch analysis
•
Table of Contents
Batch Analysis 10

StatisticsThere are several statistics that can be computed by FlowJo. Except for the Frequency of Parent,which is always displayed for each subpopulation once it has been gated, statistics must be added asseparate nodes in the workspace window. Each statistic node holds a single value (a single statistic); itis recomputed whenever a gate that affects that subset changes. The full list of statistics includes suchcomputations as median, mean, or frequency within a parent population.
Statistics can be added to populations in two ways: (1) by selecting one or more populations andclicking on the Statistic function button in the workspace window; this adds statistics to theselected populations, or (2) by viewing a population in a graph window and clicking on the Statisticbutton in that window. Both ways brings up the Statistics Dialog window.
Statistics are displayed in the workspace window whenever they are calculated. If a statistic node inthe workspace does not show its value, then you may request it to be computed. Select any nodewhich has that statistic as a descendant (i.e., the population to which it is attached, or any parent ofthat population), and select recalculate from the Workspace menu. All statistics can be hidden fromview by selecting Hide Statistics in the Workspace menu (show them by selecting Show Statistics inthe same menu.)
Statistics can be conveniently organized and exported by the table editor. Statistics nodes can bedragged to the table definition; when the table is computed, then all statistic nodes will be updated andcomputed.
In addition, you can drag statistics into the layout editor. This will create a text box containing thestatistic description and the value; it will be updated whenever the statistic is modified (i.e., it is"live").
Now you can build a table of statistics within the Layout editor. Click the Sigma button in the Layouteditor's tool palette. Drag a rectangle in the area where you want your statistical table to appear. Toconstruct the table, click here.
Statistics
•
Statistics 11

Summary of Drag and Drop ExamplesThis series of examples is based on a workspace in which there were several samples collected fromdifferent people. These samples were stained with CD4, CD8, and differentiation markers. The firstsample was analyzed in detail and gates were generated to define several T cell subsets.
A series of drag operations using different modifier keys will serve to show how drag and drop can beused to replicate analyses between samples. (This information applies equally to performingoperations on groups, but the resulting behavior may be somewhat different. This is discussed fully inthe help on groups).
You may go through each of the examples in sequence, or jump straight to a specific example:
Dragging a single node• Dragging a node with its children• Dragging a node with its parents• Dragging multiple nodes• Dragging multiple nodes with children and parents• Replacing existing nodes•
These examples are all based on copying analysis nodes from one sample to another. However, thesame options are available for dragging within a single sample, and for dragging to the table editor orthe layout editor.
Summary:
To select more than one analysis node, use the command key to select additional nodes. (Use shift keyif you want to select a range of nodes that are all siblings).
To take an entire analysis tree, click on the top-most node of the set of nodes you wish to take, anddrag with the option key down (select all children).
To take only a single analysis node with all the gates used to create it, select that node and drag withthe control key down (select all parents).
Thus, judicious use of selection and the modifier keys allows you to drop only the portion of theoriginal analysis tree that you want to move.
Dragging and dropping (copying) analysis nodes & trees
•
Summary of Drag and Drop Examples 12

Keyword Search and ReplaceKeyword Search and Replace is a tool that allows users to fix/change event annotations supplied byFCS files. This can be done in the graphical user interface or with the help of scripts. The changes aremade to the FlowJo Workspace and the FCS data is NOT ALTERED in this process.
Use the GUI below to change one string at a time. If you need more complicated jobs, skip to theScripts section further down.
The dialog constructs a Search and replace command when you choose elements from the menus.For example,
"When keyword $DATE contains 01/26/2006 replace keyword value with Thursday."
The Choose drop down menu offers a list of all the keywords in the Workspace.The Contains menu offers Equals, Contains, Starts with, Ends with.After Contains, type in the text you want to replace, or...Auto-Enter value: If you selected a keyword from the first list, this menu will display currentlyavailable values.Replace keyword value with – this menu has two options, Replace Search String and ReplaceKeyword Value with.
Replace Search String will run the job on parts of keyword values.Example: "When keyword "anyKeyword" contains A Replace search string with bwill turn “$CYT=FACSCAlibur” to “$CYT=FbCSCblibur”
Replace Keyword Value will run the job on whole keyword values.Example: "When keyword "anyKeyword" contains 8 Replace keyword value with bobwill turn “$P3S=CD8” to “$P3S=bob”
Scripts
Keyword Search and Replace 13

You can combine a series of operations like the above, and put them in a text file so FlowJo willbatch-search-and-replace. This section will discuss the syntax of this file with some examples.
There are 6 commands in the current implementation:
Search and replace1. Search and define2. Copy KW value3. Merge KW value4. Complex Join Operations5. Concatenate KW6.
1. Search and replace
For each job, the syntax should be:Search <{key, blank}> <{equals,contains,starts,ends}> <SValue> <{Replace search},{Replacekeyword}> <Rvalue>For each sample, see if the keyword <key> (or, if blank, any keyword) has a string <SValue>according to the search operator. If so, then replace either just the search string or the entire keywordvalue with <RValue>
Example:Search $P3S equals FITC Replace Keyword FluoresceinIf a sample keyword $P3S equals FITC (exactly), then the keyword value is replaced with"Fluorescein".Search contains 44 Replace search 45If any keyword contains the string "44", then the "44" is replaced with "45" irrespective ofwhere it occurs.
2. Search and define
Define <key1> <{equals,contains,starts,ends}> <Value1> <Key2> <Value2>For each sample, see if the keyword <key1> has a string <Value1> according to the searchoperator (as above). If so, then set the value of keyword <Key2> to be <Value2>
3. Copy Keyword Value
Copy <Key1> <Key2>For each sample, copy the value of keyword <key1> into the keyword <key2>
4. Merge KW ValueMerge <Key1> <Key2>For each sample, copy the value of keyword <key1> into the keyword <key2>, but only if thekeyword <key2> does not already have a value in it. (I.e., Copy if blank destination).
5. Complex Join Operations
This is a multiline command that begins with Join and ends with EndJoin. In between, ithas any number of Match criteria followed by any number of Define criteria. It looks for samples thatmatch certain criteria; for those samples, the defines are executed.
Table of Contents
Keyword Search and Replace 14

Format:JoinMatch <Key1> <Value11> <Value12> ... <Value1M> Match <Key2> <Value21> <Value22> ...<Value2M> ...Match <KeyN> <ValueN1> <ValueN2> ... <ValueNM> Define <DKey1> <DValue11><DValue12> ... <DValue1M> ...Define <DKeyJ> <DValueJ1> <DValueJ2> ... <DValueJM> EndJoin
For each sample, see if there is a matching set of keyword value pairs from the keywords{key1...KeyN} and value pairs as listed. If the Match Keywords all match the values from asingle column of values (for example, for a given sample, Key1 value is Value12, Key2 valueis Value22, ... KeyN value is ValueN2), the the Define commands are execute for column 2.Therefore, DKey1 is assigned DValue12, ... DKeyJ is assigned DValueJ2.
This function is essentially a "join" command for joining databases.The Match values are used to match a sample up with a set of criteria; then the Definecommands are executed for that criterion.
Example:JoinMatch $P3S CD4 CD8 CD12Match $P4S CD8 CD14 CD45Define Panel Stain1 Stain2 Stain3EndJoin
In this Join command, if a sample has $P3S of CD4 and $P4S of CD8, then the keyword Panel is setto "Stain1". If it has $P3S of CD8 and $P4S of CD14, then the keyword Panel is set to "Stain2", andso forth.
In Complex Join Operations, between Join and EndJoin, after the Match criteria, you can also specify
Conditional <keyx> <value1x> .... <valuemx> <CKey> <{contains, equals, starts, ends}><CValue>
amongst the Define commands.
This command will do the same as the Define, but ONLY for those samples which also have thekeyword <CKey> with the value <CValue> according to the operator criteria. This lets you edit thekeywords for a subset of the samples specified by the match criteria.
6. Concatenate KW
Concatenate <DKey> <{Skey, "text"}> <{Skey, "text"}> ...
Creates a concatenation of all of the values and puts it into DKey. Each value can be either a keyword(take the value of the keyword) or text (enclosed in double quotes).
Example:Concatenate DB_PatientVisit DB_SampleID ": " DB_TimePoint
Table of Contents
Keyword Search and Replace 15

When you construct your script, blank lines are ignored. Lines beginning with "//" are ignored (theycan be used as comment lines)
Save your script as a plain text file. Select the Load and Execute Changes button at the bottom ofthe Replace Keyword Values dialog above. Point to the file you just saved. FlowJo will read the fileand execute the commands, changing the Keyword values in the Workspace according to your script.
Keyword Search and Replace
•
Table of Contents
Keyword Search and Replace 16

Graph WindowThe Graph window is the window in which FlowJo displays graphical data: contour plots, histograms, dotplots, etc. From this window, you can draw gates to create subsets of the data and select a variety of differentrepresentations of the data. To create this window, double-click on any population node within the sample listin the workspace.
The graph window provides much information about the current subpopulation that it displays: cell counts andfrequencies (percentage of total sample), any statistics you have requested, and any gates that were computedon the current population. There are controls to navigate the gating tree, so you can automatically go to thegraph display that you used to create this subpopulation; you can also automatically display any gate that iscreated within this subpopulation.
You can select the default graph type for new samples through the Preferences dialog. You can change anyaspect of the graph by selecting the appropriate menu item under the Graph menu; you can also open theOptions disclosure triangle at the bottom of the graph window.
All graph windows have controls to switch between the next or previous sample in the workspace window list.(Yellow arrows, upper right.) When you click on one of these controls, the exact same graph for the nextsample which has the same subset is shown (this may mean that intervening samples, which don't have thesame gates, are skipped). These controls let you quickly cycle between different samples to compare thegraphs. If you hold down the option key while clicking on this control, then all open graph windows are
Graph Window 17

cycled to the next (or previous) sample. In this case, the command is applied individually to each window;thus, if different windows are pointing to different samples, then after cycling they will still point to differentsamples. You can also activate the next/previous command from the Graph menu at the top ofthe monitor.
Select a specific topic for more information:
Graph window• Drawing gates• Changing gates• Manually entering a gate•
The following types of graphs can be generated in the graph window:
Bivariate displays
Compare bivariate display types
Univariate displays
Probability contour plots• Pseudo-color density plots• Probability density plots• Dot plots•
Histograms• CDF (cumulative distributionfunction)
•
You may also wish to look at the pages on copying graphics to other programs and generatingpublication-quality graphs.
Graphs and Displays:
Table of Contents
Bivariate displays 18

Graph TypesThere are a number of different types of graphs which FlowJo can show you in a graph window.(Special graph types, such as Kinetics and Cell Cycle, can be displayed by launching the appropriateplatform).
Once you have a graph window open, you can easily switch between graph types either by selectingthe type (and/or options) from the "Graph" menu, or by opening the options disclosure triangle at thebottom of the graph window.
When you close a graph window, FlowJo remembers exactly what you displayed (axes, options, andgraph type); the next time you open that subset for display, FlowJo will show you that graph! (Theexception to this rule is if you open the graph window using the "Open Parent" (up-arrow) button in agraph window: this function opens the graph window as it looked when you created the gate for thatsubset.)
There are two univariate display types, and four bivariate displays. Each has several different optionsthat can result in a wide variety of different graphics. Some are more suitable for publication in print,and some are more suitable for generating presentation slides.
The following types of graphs can be generated in the graph window:
Bivariate displays
Compare bivariate display types
Univariate displays
Probability contour plots♦ Pseudo-color density plots♦ Gray scale density plots♦ Dot plots♦
Histograms♦ CDF (cumulative distributionfunction)
♦
You may also wish to look at the pages on copying graphics to other programs and generatingpublication-quality graphs.
Graphic displays
•
Graph Types 19

GatingNormal Gating is the most important aspect of analysis of complex data (like flow cytometric data)."Gating" refers to the process of selecting a subset of the collected events for further analysis. Youcan continue to gate subsets to generate further subsets, until you have a collection of only the cellsfor which you want a graphic display or statistic analyzed.
The process of gating simply creates a new population. When you collect a sample and import it intothe workspace, FlowJo creates a "node" to represent that set of events. When you set a gate to select asubset of the cells, FlowJo creates a new "node"--i.e., a new population. Any operation (graphicdisplay, statistic, gating) that can be performed on the sample can also be performed on a subset of thesample--they are all just populations!
FlowJo organizes this information as "tree"--much like a family tree. The sample is the eldestgeneration (ancestor). When you gate to create a subset, you generate a new node which can beconsidered a "child" of the sample. The sample is the parent of the new subset. A second subsetcreated on the sample would be another child of the sample; it is a "sibling" of the first subset. Youcan then gate on the data in a child to generate yet another generation ("grandchild")... Each newgeneration is indented another level in the workspace window.
Naming subpopulations is important. You cannot have siblings with the same names, lest confusionarise. In general, you should avoid using duplicate names of subpopulations within any given sample.Click here for more information on naming populations.
To create a subpopulation, you will draw any of several different kinds of gates on a graphic plot ofthe parent population. Once you have created the appropriate combination of gates and statistics on asample, you can easily copy the entire analysis at once to another sample, or to an entire set ofsamples.
Click on one of the following topics related to drawing and manipulating gates:
Drawing new gates♦ Editing existing gates♦ Manually entering gate boundaries♦ Creating Quadrant gates♦ Magnetic Gates♦ Copying gates♦ Graph Overview♦ Naming♦
Or, click here to go the overview on graph windows. Remember to enter page title and metatagsGating: Creating new subpopulations
•
Autogating Tool•
Gating 20

Click on the Autogate tool button on abivariate graph window to activate the autogate feature. When moving the mouse over the graph,FlowJo will automatically find subpopulations to gate. These are shown on the graph window andchange based on the position of the mouse. Simply click once to create a polygon gate when thepopulation of interest is circled.
The region that FlowJo finds will include the region that has at least as many cells as the point underthe mouse-move the mouse to a more densely populated area, and the gating region shrinks.
After you click down on the mouse, and before releasing the mouse button, you can fine-tune thegate-just move the mouse up or down to increase or decrease the size of the gate. Note in the figuresbelow, the goal is to identify the left population using the autogating tool. Note that in the first figure,the autogate tool starts to include the right population in the gate. To prevent this, the mouse wasclicked and the button held down when the gate was centered on the population of interest (middle).With the mouse button held down, the mouse can be moved up and down to change the size (not theshape) of the gate (bottom).
Table of Contents
Autogating Tool 21
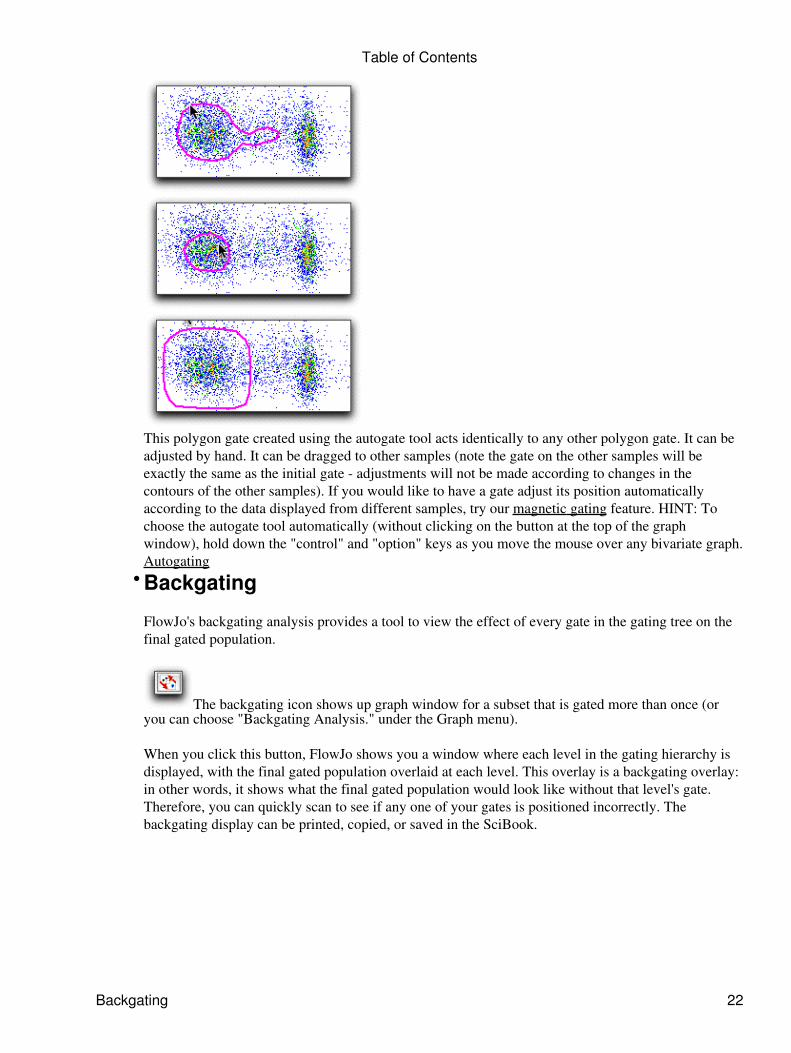
This polygon gate created using the autogate tool acts identically to any other polygon gate. It can beadjusted by hand. It can be dragged to other samples (note the gate on the other samples will beexactly the same as the initial gate - adjustments will not be made according to changes in thecontours of the other samples). If you would like to have a gate adjust its position automaticallyaccording to the data displayed from different samples, try our magnetic gating feature. HINT: Tochoose the autogate tool automatically (without clicking on the button at the top of the graphwindow), hold down the "control" and "option" keys as you move the mouse over any bivariate graph.Autogating
Backgating
FlowJo's backgating analysis provides a tool to view the effect of every gate in the gating tree on thefinal gated population.
The backgating icon shows up graph window for a subset that is gated more than once (oryou can choose "Backgating Analysis." under the Graph menu).
When you click this button, FlowJo shows you a window where each level in the gating hierarchy isdisplayed, with the final gated population overlaid at each level. This overlay is a backgating overlay:in other words, it shows what the final gated population would look like without that level's gate.Therefore, you can quickly scan to see if any one of your gates is positioned incorrectly. Thebackgating display can be printed, copied, or saved in the SciBook.
•
Table of Contents
Backgating 22
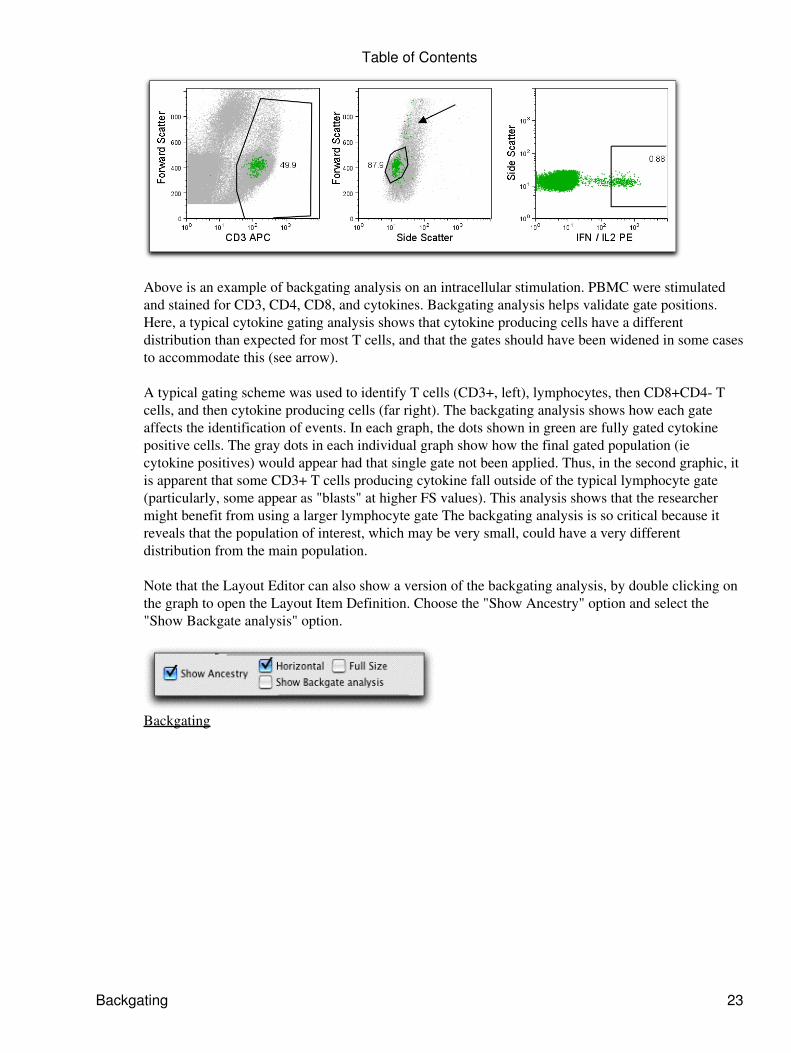
Above is an example of backgating analysis on an intracellular stimulation. PBMC were stimulatedand stained for CD3, CD4, CD8, and cytokines. Backgating analysis helps validate gate positions.Here, a typical cytokine gating analysis shows that cytokine producing cells have a differentdistribution than expected for most T cells, and that the gates should have been widened in some casesto accommodate this (see arrow).
A typical gating scheme was used to identify T cells (CD3+, left), lymphocytes, then CD8+CD4- Tcells, and then cytokine producing cells (far right). The backgating analysis shows how each gateaffects the identification of events. In each graph, the dots shown in green are fully gated cytokinepositive cells. The gray dots in each individual graph show how the final gated population (iecytokine positives) would appear had that single gate not been applied. Thus, in the second graphic, itis apparent that some CD3+ T cells producing cytokine fall outside of the typical lymphocyte gate(particularly, some appear as "blasts" at higher FS values). This analysis shows that the researchermight benefit from using a larger lymphocyte gate The backgating analysis is so critical because itreveals that the population of interest, which may be very small, could have a very differentdistribution from the main population.
Note that the Layout Editor can also show a version of the backgating analysis, by double clicking onthe graph to open the Layout Item Definition. Choose the "Show Ancestry" option and select the"Show Backgate analysis" option.
Backgating
Table of Contents
Backgating 23

PolyVariate DisplayThe Polyvariate Display function shows more than 2 parameters on a 2D graph. This allows the userto define complex populations of cells using one gate. Multiparameter populations have until nowrequired complex boolean gates or multiple, hierarchical gates.
The gates created using this tool work as any other gates in FlowJo. You can drag/drop them just thesame and the contents can be interrogated in Graph Windows or the Layout Editor.
You can launch the GUI from a Graph Window. Open a Graph Window, click Graph menu, andchoose PolyVariate Plot. The Polyvariate Plot tool changes the appearance of the original graph. Asyou make changes in the tool, observe the corresponding changes in the graph.
There are 5 controls in this GUI. They are explained below.
Add/Remove Parameters menu.1. X/Y Axis Range.2. Vector Controls.3. Pivot Range.4. Histogram Pivots.5.
The Vector Controls and Pivot Range are part of the PolyVariate circle. The PV circle is arepresentation of the graph space. The standard 2D plot has two axes at a 90 degree angle with the 0point in the lower left corner. The PV plot has the 0 point in the center. The vector angle determineswhich direction away from the 0 point the parameter will be scaled. The vector length from centercontrols the scaling of the parameter, where the 0 point is the minimum value and the rounded end isthe max value. The pivot range circle corresponds to the pivot points on the accompanyinghistograms, explained below.
PolyVariate Display 24
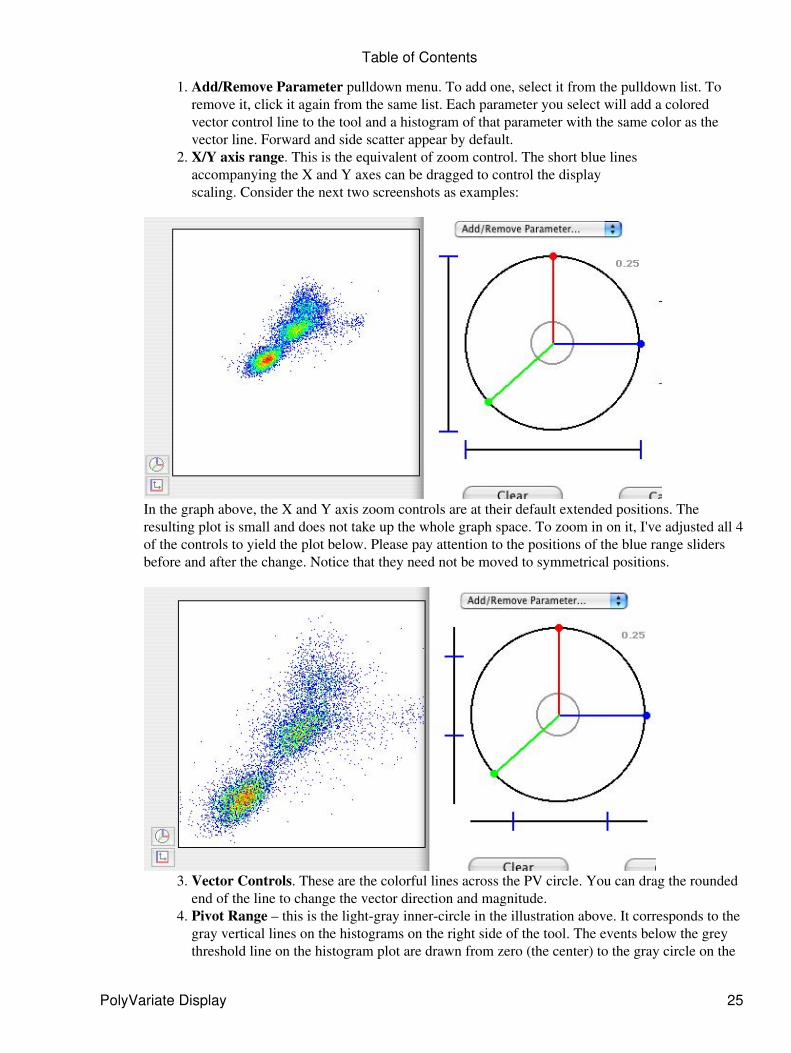
Add/Remove Parameter pulldown menu. To add one, select it from the pulldown list. Toremove it, click it again from the same list. Each parameter you select will add a coloredvector control line to the tool and a histogram of that parameter with the same color as thevector line. Forward and side scatter appear by default.
1.
X/Y axis range. This is the equivalent of zoom control. The short blue linesaccompanying the X and Y axes can be dragged to control the displayscaling. Consider the next two screenshots as examples:
2.
In the graph above, the X and Y axis zoom controls are at their default extended positions. Theresulting plot is small and does not take up the whole graph space. To zoom in on it, I've adjusted all 4of the controls to yield the plot below. Please pay attention to the positions of the blue range slidersbefore and after the change. Notice that they need not be moved to symmetrical positions.
Vector Controls. These are the colorful lines across the PV circle. You can drag the roundedend of the line to change the vector direction and magnitude.
3.
Pivot Range – this is the light-gray inner-circle in the illustration above. It corresponds to thegray vertical lines on the histograms on the right side of the tool. The events below the greythreshold line on the histogram plot are drawn from zero (the center) to the gray circle on the
4.
Table of Contents
PolyVariate Display 25

PolyVariate plot; the events above the gray histogram threshold line are drawn from the graycircle outward--in other words, the position of the line on the histogram plot is mapped to theposition of the gray circle along the vector. You can drag this circle to change its size.Consider the next few screenshots as examples:
•
In the graphic above, we're looking at a cluster of CD3+ lymphocytes (lower left) with default pivotsand adjusted X/Y axis ranges.
Above, we've adjusted the CD3 histogram pivot to accent only the brightest cells. The clusterbecomes bigger after adjusting the ranges, because the bright CD3 peak is stretched into the "outer"circle.
Table of Contents
PolyVariate Display 26

In the screenshot above, the gray pivot range circle was dragged outward to make the CD3 clustertighter.
Histogram Pivots. This control ties in with #4 to warp the parameter with the help of thePivot Range circle. The default value is 0.25 (first quarter of your scale - imagine the lengthof your parameter in pixels rather than lin/log scaling, and take ¼ of that value... that's how itworks)
5.
Example 1 - A 3 Parameter exercise (FSC, SSC, CD3)
First, open a graph window for a sample stained with CD3. Select Graph > PolyVariate Plot fromthe main menu , and add CD3 from the pulldown in the PV tool:
The resulting graph has Forward Scatter increasing from 0 point (ZP) to vertically up, Side Scatterfrom ZP to horizontally right and CD3 from ZP to diagonally right-and-up.
We know that CD3 is mostly expressed by cells with lower FSC and SSC values, so I'm inclined topoint the CD3 diagonally left-and-down from the ZP. After adjusting the X/Y ranges and thehistogram pivot points, the plot looks like the one below. The Forward and Side scatter pivot pointswere adjusted to approximately the upper value of the Lymphocyte cells (most of lymphocytes will befound to the LEFT of the FSC/SSC pivots. Most CD3 bright cells will be found to the RIGHT of theCD3 pivot):
Now let's draw some gates and find out what we have:
Table of Contents
PolyVariate Display 27

Draw two rectangular gates, one on the area controlled by the CD3 vector (CD3+), one on theForward/Side scatter area. Since the center is zero, this is also the CD3 negative area.
Drag the ungated population from the Workspace window into the Layout Editor. Drag in a secondcopy and change the X axis to CD3. The Y axes on these graphs are OrthSc. Drag the CD3+ gatedpopulation onto each graph. The top two graphs above are the result. Drag two more copies of theungated population into the Layout and adjust the X axis again on the second one.. Drop the CD3+gated population onto each.
The CD3+ gate, which also includes FSC/SSC parameters, is faster to make than two separate gateson FSC/SSC then CD3. The purity and recovery is within 3% of the standard gates.
Example 2 – A 5 parameter exercise (FSC, SSC, CD3, CD4, CD8)
Table of Contents
PolyVariate Display 28

Please note, I've already adjusted pivots/vectors above. The FSC/SSC axes are both pointing upvertically - in my tests including both of them and combining them works better than using either/or.
Let's inspect the gates as before, the ungated population in red, the subsets in blue:
The phenotypes are as clean as they can be - you can use conventional gating to comparepurity/recovery.
Example 3 - A 5 parameter exercise 2 (CD3 vs. CD4 AND CD8)
What if we wanted to create a single gate that encompasses the phenotype CD3+(CD4+ AND CD8+)?Set it up like this:
...and the gate contains...
Table of Contents
PolyVariate Display 29
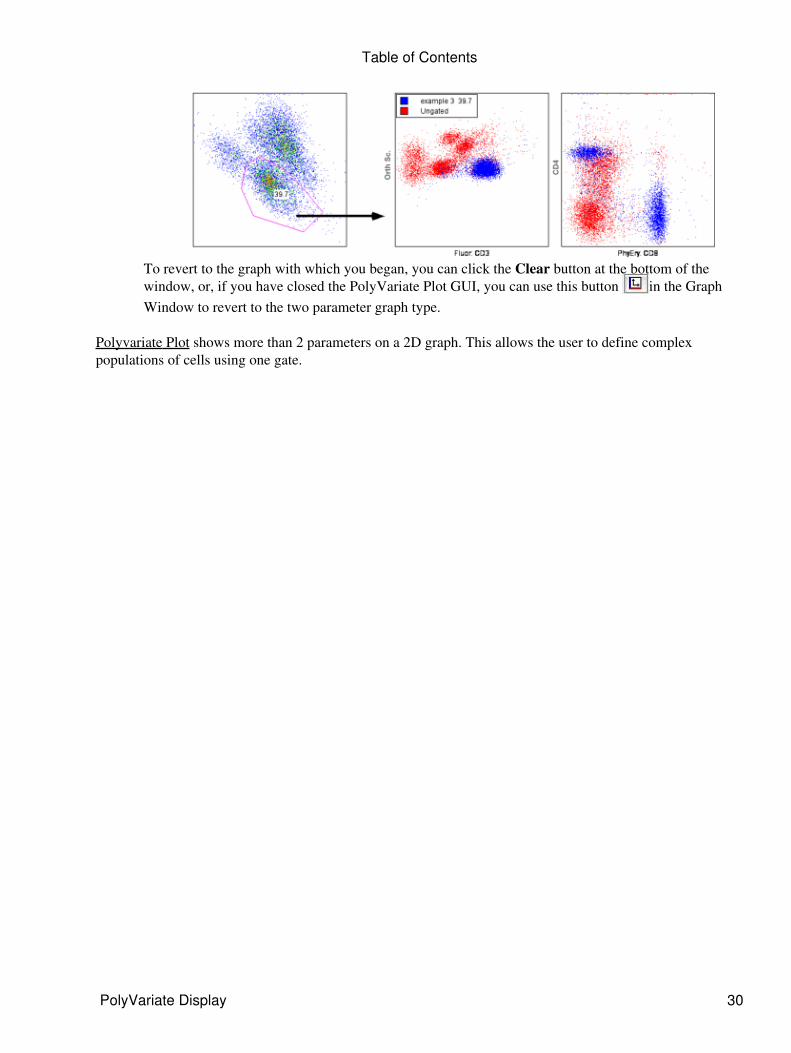
To revert to the graph with which you began, you can click the Clear button at the bottom of thewindow, or, if you have closed the PolyVariate Plot GUI, you can use this button in the GraphWindow to revert to the two parameter graph type.
Polyvariate Plot shows more than 2 parameters on a 2D graph. This allows the user to define complexpopulations of cells using one gate.
Table of Contents
PolyVariate Display 30

OutputFlowJo has a great number of output capabilities, encompassing graphics, statistics, or raw data. It supportsprinting from all the different views of data, as well as copying data through the clipboard or file system.FlowJo contains a special editor for the creation of Tables (statistical outputs) and Layouts (graphicaloutputs).
This section is divided into six parts, each discussing different aspects of generating output out of FlowJo.
A table is a text file containing one or more rows of data, that correspond to frequencies and other statisticsderived from a single sample. The table editor lets you construct the set of statistics, and then generates themfor every sample in the current group.
A layout is a graphical image, composed of individual elements that represent boxes, lines, text and graphs.Elements are created by dragging populations and statistics from the workspace into the canvas of the layouteditor.
Both tables and layouts can perform batch output generation using the current Group as the set of data filesfrom which to draw information. You should be familiar with the use of groups to use Tables and Layoutsefficiently.
Printing is supported in all sections of FlowJo. The print command has different behaviors depending on thetype of window. Specific behaviors include printing the workspace structure or single graph, as well as a setof graphs, layouts, and full report generation.
A novel feature of FlowJo is its ability to generate movies from flow data. Any graph window can add a thirddimension to the view by slicing views of the events by a third parameter. You can also view any graph as afunction of time or the event number during the sample collection.
You can also export raw data for analysis by other programs. You can export any gated population (or thewhole sample), as its own FCS file or as tab-delimited text. You can quickly generate small subset files,optionally reducing the event count or even the parameter list. You can use this function to reformat FCS datainto spreadsheet-friendly text.
Histograms (and Cell Cycle graphs and Kinetics graphs) can be exported as well. Here you will get twocolumns of "XY" data, where the first column is the channel number (or time for Kinetics), and the Y value isthe event count or processed statistic. By default, whenever you select Copy (or press control-C) whenviewing a histogram, cell cycle, or kinetics graph, FlowJo puts two distinct items into the clipboard: one is agraphic picture of the data (that you can paste into graphics applications); the other is a text representation ofthe data (that you can paste into a spreadsheet). Sometimes graphics applications will erroneously pick thetext item for pasting; if this happens to you, you can ask FlowJo not to export the text data from these graphs(via the Preferences dialog).
Finally, some notes on publication quality graphics out of FlowJo. Several nitty gritty details of dataformats are explained in order to support post-processing of FlowJo's output. Also included is the gallery ofFlowJo images, as examples of what kinds of output you can create.
Output:
Output 31
SciBook
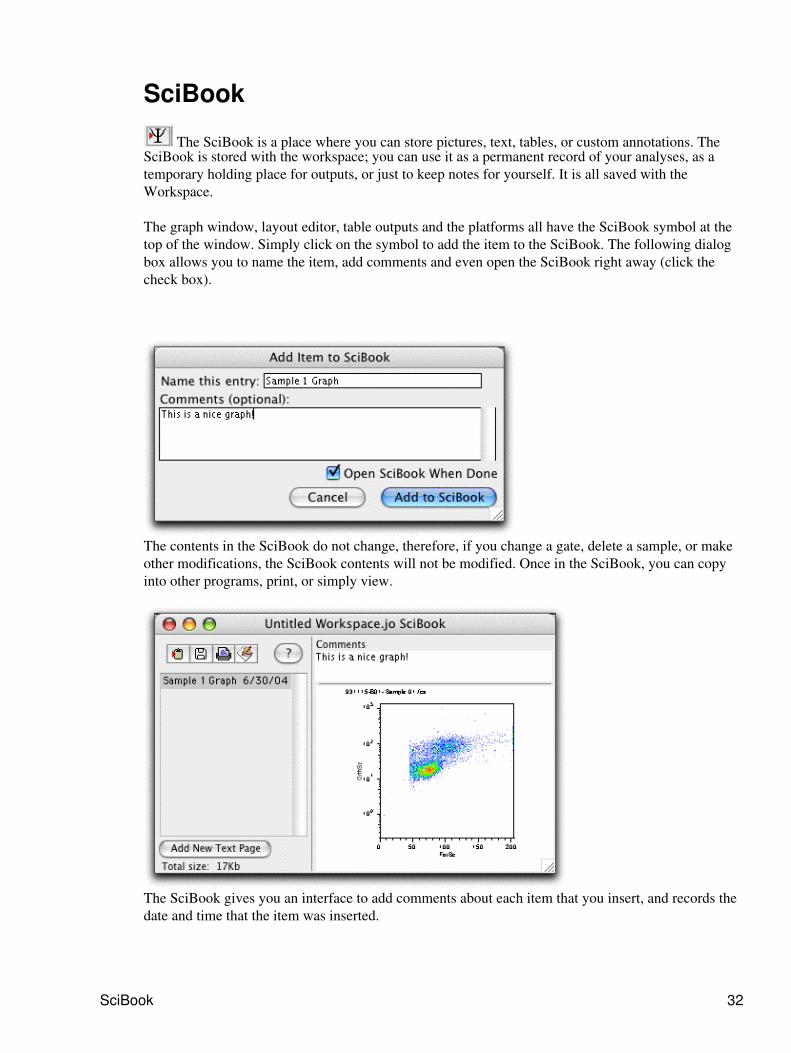
The SciBook is a place where you can store pictures, text, tables, or custom annotations. TheSciBook is stored with the workspace; you can use it as a permanent record of your analyses, as atemporary holding place for outputs, or just to keep notes for yourself. It is all saved with theWorkspace.
The graph window, layout editor, table outputs and the platforms all have the SciBook symbol at thetop of the window. Simply click on the symbol to add the item to the SciBook. The following dialogbox allows you to name the item, add comments and even open the SciBook right away (click thecheck box).
The contents in the SciBook do not change, therefore, if you change a gate, delete a sample, or makeother modifications, the SciBook contents will not be modified. Once in the SciBook, you can copyinto other programs, print, or simply view.
The SciBook gives you an interface to add comments about each item that you insert, and records thedate and time that the item was inserted.
SciBook 32
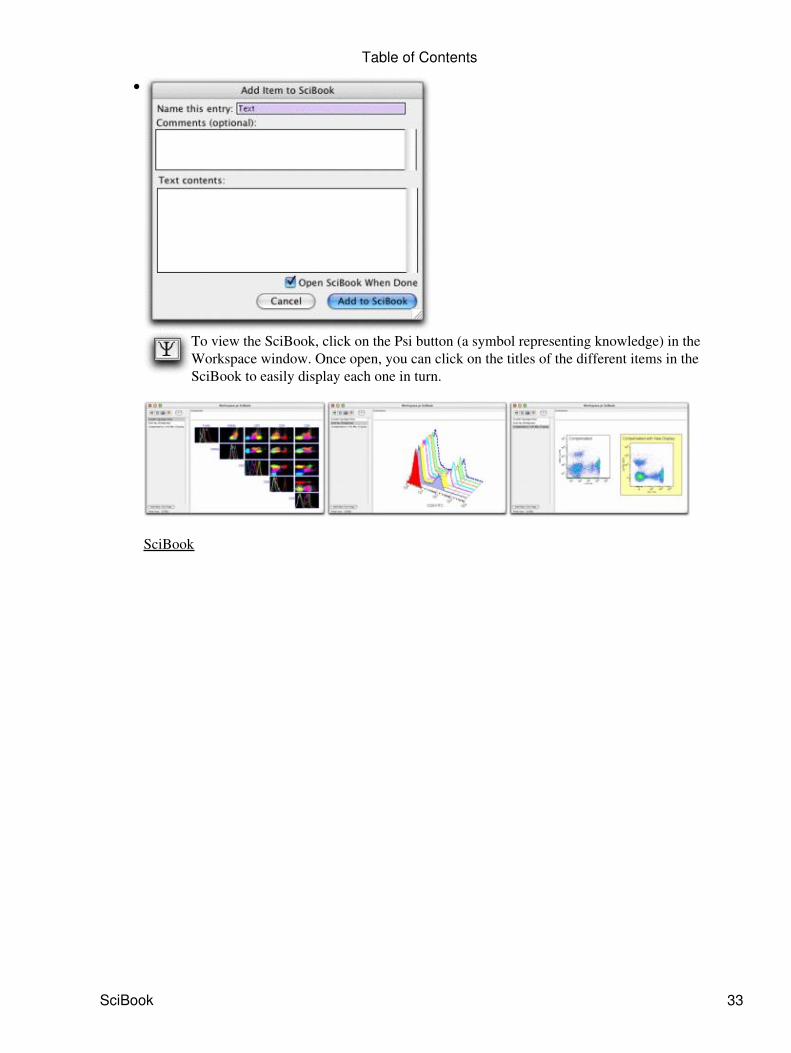
To view the SciBook, click on the Psi button (a symbol representing knowledge) in theWorkspace window. Once open, you can click on the titles of the different items in theSciBook to easily display each one in turn.
SciBook
•
Table of Contents
SciBook 33

The Layout EditorThe Layout Editor is a powerful tool in the creation of both analysis and publication graphics. It isdesigned to create data display layouts which can contain one or more graphical objects, such asgraphs, text and lines. It works like a page layout program, but the graphs are live and will be updatedto reflect any change in the data or gating. The page describing the Layout Editor controls explainsthe tool palette, commands and options associated with the editor. The page describing layoutelements also contains useful information about FlowJo's myriad presentation capabilities.
Using the Layout Editor, you can generate graphical reports that can do any of the following:
Show multiple different graphs from the same gated subset♦ Create a report mixing graphs from different subsets or samples♦ Overlay dot plots, histograms, or Kinetics analyses♦ Mix statistics, text items, tables, boxes, lines, and other items with your graphs♦ Generate a report for every sample in the workspace based on the layout of one sample and itsanalysis.
♦
Layouts are live, in that the graphic window is updated whenever any of the gates or statistics change(because you moved a gate, or change an analysis, etc.). You never have to worry about whether toupdate the reports or not; FlowJo will do so automatically!
The Layout Editor knows how to iterate or batch , that is, to create the same layout for many differentsamples based on the layout of one sample. It can iterate over every sample in a group, or via Panelswhere graphs from different samples are combined in a single layout.
Iterated layouts can be previewed as they will print or animated as frames in a Quicktime movie. TheLayout editor can save, print or export the layout as a graphic file, as well as save it in HTML forexport to the web.
Because a layout contains many different graphs and therefore can take a long time to generate,FlowJo supports placeholders to make the editor more responsive while creating the layouts.
An example can be studied in the FlowJo advanced tutorial.
See Also: Workspace, Table Editor, Groups
Layout Editor - Can be dragged (or copied)from one workspace to another.
•
The Layout Editor 34
Copying GraphsYou can copy and paste any graph into another Macintosh program. Simply select Copy from theEdit menu (or use command-C) when the graph window is foremost on your screen. Switch to theother application, and select Paste.
The graphic object is a grouped selection of multiple objects. Selecting Ungroup successively in theother program will ungroup these objects, which include: the axis titles, the axis notations, and thegraph itself. All text is in Palatino font, size 12 by default; however, you can easily change the defaultfont in the Preferences dialog on the Text tab . The format of the exported graphic depends on thetype of graph as well as a preference setting.
Histograms and CDF plots are always exported as vector art. You can ungroup these and change theline style or fill pattern for the histograms.
Note also that when you copy a histogram graph, two items are placed on the clipboard: the graphicrendition as well as a text rendition of the histogram data itself. Depending on the program into whichyou subsequently do a paste, the correct item will be inserted. For more information, see the Webpageabout exporting raw data.
This is also true when you copy a graph from the kinetics window: both the graphic rendition and thespreadsheet values are copied into the clipboard. If you paste into a spreadsheet, you will get twocolumns: one is time, the other is the computed value as a function of time. For more information, seethe section on the kinetics platform.
The other types of graphs are, by default, exported as a black & white bitmap (except for density andpseudo-color plots, which are 256-color bitmaps). Bitmaps are most quickly drawn by other programsand the representation is quite good. However, bitmaps cannot be resized without risking significantdistortion. If you want to export high-quality vector art for all graph types, select PICT or Quicktimeformat in the Preferences dialog on the Output tab . Now copied graphs (or layouts) will havehigh-quality line graphs that can be resized without loss of information. However, it may take thedrawing programs considerably longer to present them to you; especially for plots that are not contourplots. See the information on making publication quality graphics.
If you hold down the option key when you select Copy from the menu, then FlowJo will include withthe graphic any gates that are drawn on the current graph. (You can change the default behavior ofincluding gates or not through the preferences dialog).
Copying graphs to other programs (generating publication-quality graphics)
•
Copying Graphs 35

TablesA requirement of many experiments is the ability to generate tabular output for further analysis in aspreadsheet or statistics program. The table editor is the means by which you can generate a series ofstatistical calculations for all samples in a group. These statistics can be any of the statistics FlowJocalculates: medians, frequencies, etc. You can also use this tool to generate functions that will displaytheir output for every sample in a group. In order to generate a table, you will first have to generatethe statistics you wish to export on at least one sample.
From the workspace window, open the table editor. This can be done in one of two ways: either clickon the table editor function button in the workspace window, or select the Table Editor from the
Windows menu (command-T).
Use the Table Editor to create a new table definition. A table definition is not theoutput data itself. Instead it is the specification of what columns the table will
contain, when it is generated. You can have as many table definitions in the workspace as you wish. You can create new empty definitions, duplicate existing ones, or delete them using the button in thetop left corner of the window. Each different table definition in the table editor is a different template.
To add statistics to a table definition, simply click on them in the workspace window and drag them tothe definition pane on the right hand side of the table editor window. (You can use the control andoption keys to modify whether or not you want to take all the parents or children, respectively; formore information, see the pages about dragging and dropping nodes.)
Tables 36

When you drag a population node into the table editor, it assumes that you want the statistic that is setas your default in the Preferences on the Tables/Layouts tab. You can change the default choicethere or in the drop-down menu shown at the right, in the Table Editor.
Each statistic in the right panel of the table editor will correspond to a column in the output table; youcan change the order of these columns by clicking and dragging the statistics around. The table iscreated for those samples in the currently-selected group: remember to click on the appropriate groupin the workspace window before you create the table!
Only drag statistics from a single sample into the table editor. The table editor will automaticallycalculate these statistics for each sample in the group. When you apply or create a table, each row inthe table editor is applied to every sample in the current group--irrespective of which node youactually dragged into the table.
When you create a table, FlowJo will cycle through all of the samples in the currently-selected group.For each statistic node that you have dragged into the table definition, it searches for the same node ineach sample. If the node does not exist, then it leaves a blank for that entry. (For instance, if thestatistic you copied was the median FITC fluorescence of a Lymphocyte gate, and the Lymphocytegate does not exist in all samples, then those samples will have blank values for this statistic).Therefore, the statistics are only gathered for those samples which have the appropriate gates andstatistics already applied to them.
Keywords The table editor also supports including sample file keywords. A keyword is anyattribute listed in the text section of the FCS file. Above the list of columns is abutton with a
picture of a key on it. Press this button to bring up a dialog which will allow you to select thekeyword(s) to be included in the table. You can use shift- and command- clicking to selectionmultiple items from the list. Keywords are appended to the table definition. There is a list of standardkeywords, as defined by the FCS specification. Note that not all files will contain all keywords.
Functions The Functions tool will construct a function column in the output table. The GUIcanbe triggered from the Table Editor by clicking on the fx button. It allows users to create a
numerical, logical or programmatic relationship between existing Table Editor columns, much like aspreadsheet editor's “reference calculations”. For details on using the function tool, click here.
Define Column Attributes You can choose to have certain statistics highlighted in the output
Table of Contents
Tables 37

table. FlowJo will specially format data whose value or standard deviation meets criteria youchoose. For example, “I want to add a ratio of my CD4/CD8 values. If the ratio is >2, I want myvalues colored green. If the ratio is <2, I want my values colored red. “ For details on using theDefine Attributes tool, click here. You can also access this tool by Double-clicking on anycolumn definition (a row in the table definition window), or choose Special Formatting… fromthe Tables menu.
Table of Contents
Tables 38

Iteration Options Just like batching in the Layout Editor, you can select how you want the TableEditor to batch through the tubes in the current group. Tables > Iteration Options... in the mainmenu opens the Iteration Options Dialog. Double-clicking on the table name will also open this tool.
In generating a batch table report, each row of the table represents a unique instance of the iteratorvalues. So, if you interate by nth, if n = 1, you get one row for every sample in the group; if n = 2,you get one row for every other sample. If you iterate by a keyword value (for example, “SampleID”), you get one row for every unique value of this keyword in the current group.
The discriminator tells FJ how to select each statistic from the samples which share the currentiterator value. You can specify multiple discriminator keywords. A statistic is chosen for the firstsample tube which has the current iterator value, as well as a matching value for all discriminatorkeywords as did the sample that was dragged into the table definition to begin with.
The Table Editor has a new column, Tube ID. This shows the value of the discriminator for thesample that was dragged in to the table definition. Thus, if we iterate by nth, and n = 2, then if youdrag a statistic from the first (or third or fifth) sample into the table, it will show an ID of 1; if youdrag a statistic from the second (or fourth…) tube, it will show an ID of 2. If you choose keyword fordiscrimination, the keyword value is shown here.
Generating the Table. Once you have put all the desired statistics andkeywords into the table definition, click on the Table button in the top left
corner of the definition window. This will invoke the table generation process. FlowJo will cyclethrough all of the samples in the current group, and calculate all possible statistics and keywords thatare in the table definition. It will then create a new window containing a spreadsheet-like view of thestatistics. This table can be saved to the clipboard or a file, printed or exported to another application.Each of these operations is initiated via the buttons in the top left corner of the table window. Thespreadsheet application launched by the Save and launch application button (fourth from left) ischosen the first time you use this function and can be altered in the Layout pane of the Preferenceswindow.
Sorting the Table. Many times it is useful to view the table ordered by the value of a keyword orstatistic. To sort the table, double click on the header of the column by which you wish to sort. Bydefault, sorting the table will order the rows in descending order of the values in that column. If youwish to reverse the order, and view the table with the smallest value first, then double click thecolumn again to invert the row order.
Table of Contents
Tables 39

Transfer Table to the Layout Editor. Click this button and the existing table is copied to thecurrently openlayout in the Layout Editor. Click here for more information on editing the table
once it is in the Layout Editor.
Copying Part of a Table. Normally if you copy a table, the entire table will be copied to theclipboard, regardless of the current selection. If you wish to copy just a portion of the table, you canselect any number of cells, and hold down the option key while performing the copy (either via thebutton in that window or the Copy command in the Edit menu). If the option key is down, then onlythe selected cell contents will be put on the clipboard. If the selection is rectangular, then pasting theclipboard into a spreadsheet or word processor will result in output that looks the same as in did inFlowJo's table. If you have used the command key to select an odd shape or disjoint selection, thenthe resulting paste may not look the same as it did in FlowJo's table. The rule is that all cells that arein the same row in FlowJo's table will come out in the same row on the clipboard (i.e., will beseparated by tab characters), and cells that are on separate rows will end up on separate rows (i.e., willbe separated by carriage return characters), but gaps between either rows or columns will be omitted.
Creating Groups from the Table Selection. Sometimes it is useful to be able to use the resultsfrom the tables to refine analysis in the workspace. To facilitate this, the table window has a
button similar to the one in the workspace for Create Group operation. Clicking this button will createa group containing all of the samples which have one or more selected cells in the table. You don'tneed to select the sample name. Any cell in that row will be sufficient to include that sample in thenew group.
For example, we might be interested in producing graphical output of all of the samples whose CD45positive population is over 60% of total events. To accomplish this, you could generate a tablecontaining the statistic for CD45+, sort the table by this column, click the first cell, shift click the lastcell that has a frequency over 60%, and then click on the New Group button in order to create a groupof all samples with a selected cell. Then go back to the workspace window, and select the new group,limiting the view to only the desired samples. Now when you generated the desired layout, you willonly be looking at those samples that have the desired characteristics. (If this sounds overly complex,relax. It's easier to do than to explain.)
Resize Columns Click on this button to resize the table's columns to fit the text in the header.
Finally, you can choose to save the resulting table to a disk file, copy to theclipboard or print. Saving to a disk file is probably the best choice; you can then
import the data into a spreadsheet. Any spreadsheet should be able to import the data; specify that thefirst row of the table has the column headers.
Column Names. In the output file, the first line has a tab-delimited list of column names. Eachcolumn name is a concatenation of the full name of the population (including all "parents") and thestatistic name itself. For example, "Lymphocytes/CD4:Freq. of Parent" would be the name for thecolumn with the frequencies of CD4 cells within the Lymphocyte gate. These names can becomeunwieldy in length... you might want to keep your subset names as short as possible. In addition, youcan have FlowJo export abbreviated statistic names (in the example above, "Freq. of Parent" would bereplaced by "%P"). You can set this preference in the Preferences on the Tables/Layouts tab.
Replace Column Names. You can type in any name you wish to replace the statistic names in the
Table of Contents
Tables 40

generated table. In the Table Editor, type in the new names in the Column Name column. When youcreate a table, these names will be displayed instead of FlowJo's statistic name.
Drag and Drop, Copy and Paste You can drag a table or copy it from the Layout Editor in oneWorkspace into the Layout Editor of another.
Tables
•
Table of Contents
Tables 41

Iteration (Batching)One of the best things about computers is how they handle repetitive tasks. Show thecomputer how to do something once, and it will do it a million times without the slightestcomplaint.
In FlowJo's Layout Editor, you can create a layout based on graphs and statistics from one ofyour samples. With a single click, you can automatically produce the same layout for each ofyour samples, or any subset of samples that makes sense for your experiment.
The result of a batch report can be viewed in several different ways. Clicking the Batchbutton can create:
A new layout in the layout editor.◊ A preview window containing static tiles (data won't update if you change theoriginal analysis.)
◊
A web page containing the pictures for each layout group, or◊ A Quicktime movie.◊ Alternatively, it can print the report directly to your printer.◊
In every case, FlowJo will produce a series of frames, each one containing graphs andstatistics from one or more tubes.
Iteration (Batching) 42

In the simple case, each frame corresponds to one sample in a group. The batch report ismade by taking each sample, applying the named gates and statistics to that sample, plottingthe graphics in the format defined by the layout editor, and adding that frame to the report.This is useful in cases where the same information is desired for each tube.
Iterating in the Layout Editor
The first thing to be aware of is what is the currently active group in the Workspace window.This will be the selected item in the top half of the window. This is important to knowbecause the current group will determine the set of samples, from which the layout will beconstructed.
Next you should look at the popup menu in the layout. In most cases, you'll probably beiterating by sample, and the popup will appear like this:
There are a couple of terms that we use in this explanation that are important to get clear fromthe start. They are attribute and value. The keywords in an FCS file are organized inattribute-value pairs. The attribute is the name for the type of data recorded. The value is thedata recorded for a particular tube. For example, most files will contain, in their header, a$Date attribute, and a value containing the date on which that sample was collected. When wetalk about iteration attribute we mean the attribute of the chosen tubes whose value changes ineach page of the batch report that is generated.
Changing the Iteration Value
There are several ways to change the iteration value. You can use the popup menu in thelayout editor window to show the layout for any value in the current group. Alternately youcan use the yellow up and down arrows to move to the previous or next values. From thekeyboard, you can use the home, page up, page down and end keys to move to the first,previous, next and last iteration values respectively.
Setting the Iteration Attribute
Other times, reports are created where each frame contains data from more than one tube.Examples of multi-sample reports could be several tissues from a common animal, multipledoses of a common drug, or cross patient studies using blood collected over time. In casessuch as these, it is not enough to simply process successive tubes in a batch report. Moresophisticated organization is required. Click Layouts > Iteration Options... to set moreparameters for your batch operation:
Table of Contents
Iterating in the Layout Editor 43
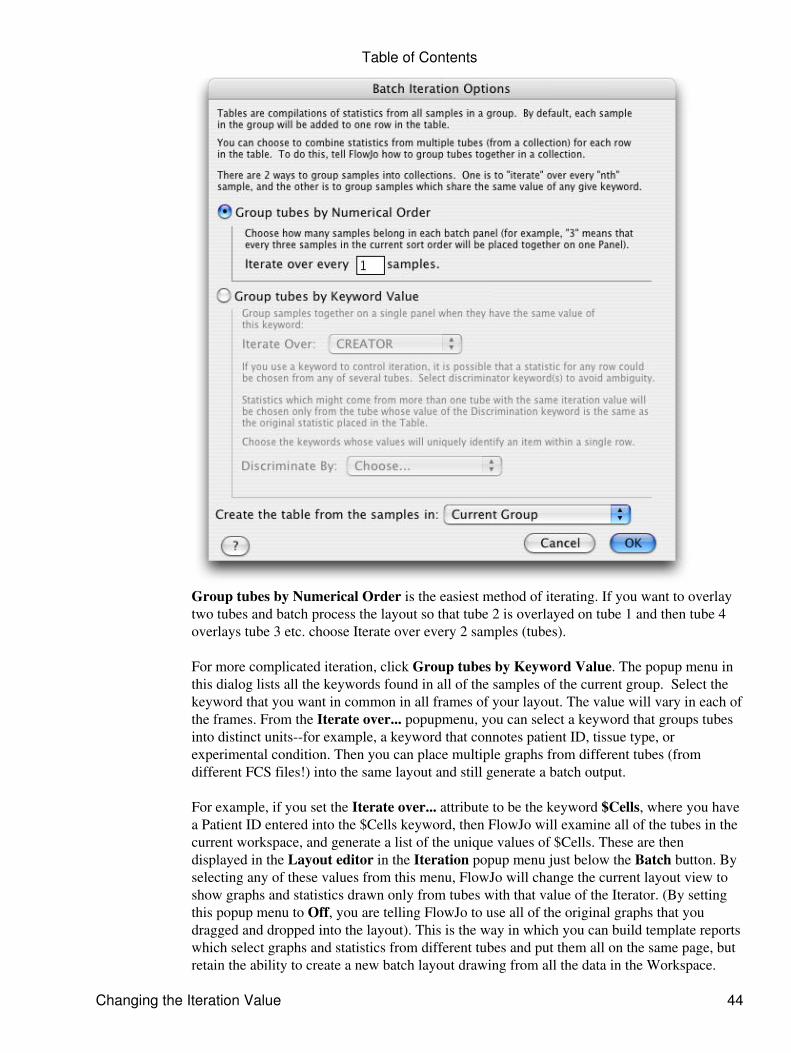
Group tubes by Numerical Order is the easiest method of iterating. If you want to overlaytwo tubes and batch process the layout so that tube 2 is overlayed on tube 1 and then tube 4overlays tube 3 etc. choose Iterate over every 2 samples (tubes).
For more complicated iteration, click Group tubes by Keyword Value. The popup menu inthis dialog lists all the keywords found in all of the samples of the current group. Select thekeyword that you want in common in all frames of your layout. The value will vary in each ofthe frames. From the Iterate over... popupmenu, you can select a keyword that groups tubesinto distinct units--for example, a keyword that connotes patient ID, tissue type, orexperimental condition. Then you can place multiple graphs from different tubes (fromdifferent FCS files!) into the same layout and still generate a batch output.
For example, if you set the Iterate over... attribute to be the keyword $Cells, where you havea Patient ID entered into the $Cells keyword, then FlowJo will examine all of the tubes in thecurrent workspace, and generate a list of the unique values of $Cells. These are thendisplayed in the Layout editor in the Iteration popup menu just below the Batch button. Byselecting any of these values from this menu, FlowJo will change the current layout view toshow graphs and statistics drawn only from tubes with that value of the Iterator. (By settingthis popup menu to Off, you are telling FlowJo to use all of the original graphs that youdragged and dropped into the layout). This is the way in which you can build template reportswhich select graphs and statistics from different tubes and put them all on the same page, butretain the ability to create a new batch layout drawing from all the data in the Workspace.
Table of Contents
Changing the Iteration Value 44

Multiple sample Iteration
The Iteration Options also provide the ability to specify one or more discriminator keywords.These fields provide the value that must stay constant, while the iteration attribute changesthrough each of its successive values. For example, if you have a ten mouse study, and foreach mouse you collect three different tissue types, then there would be thirty tubes in theexperiment. You want to produce a ten page report, showing the graphs and statistics for eachmouse, one per page. You've acquired the data such that the mouse identifier is stored in theFCS file's $SMNO (sample number) field, and the tissue type information is stored in the$CELLS field. Set the field $SMNO to be the iteration attribute, and the keyword $CELLS tobe the discriminator.
More than one discriminator can be defined if desired. By selecting additional keywords inthe popup menu, the string of discriminators will be extended. To start over, choose thesecond item in the menu, marked Select None. This empties the list.
The most common case is where the iteration attribute is the sample, by which we generallymean the tube that was run through the cytometer (as opposed to the sample taken from thesubject.)
When you click the Batch button you see the Make Batch Report box at the top of this page.The New layout and print Preview reports have placement controls. You can specify thenumber of rows or columns you want to generate, and whether the new items are arrayed leftto right or top to bottom.
Finally, there are three additional options provided at the bottom of this dialog. Iteration letsyou choose which group the batch process will iterate through. The option to Save TheseSettings with the Original Layout, if checked, will store all of the settings in the approvedlayout. In this way, it is straightforward to replicate this report many times in the future. Theoption Don't Show This Again (unless Option Key is down) gives you a means to simplifythe use of the program and avoid seeing the dialog in the future. If you are always producingthe same reports with the same characteristics, this is a way to prevent untrained users fromproducing the wrong kinds of reports. If this option is not checked, you can still avoid thedialog by holding down the option key when clicking the Batch button.
New user interface with Batching♦
Table of Contents
Changing the Iteration Value 45

Formulas in TablesIf you select the Function button in the Table Editor, you will see the following...
Here you can construct a formula the output of which will appear as a column in yourfinished table. The calculation will be applied to each population through which the TableEditor iterates when it builds the table. It allows users to create a numerical, logical orprogrammatic relationship between existing Table Editor columns, much like a spreadsheeteditor's “reference calculations”.The pre-requisites for this functionality are:– one or more columns in the Table Editor– a custom “column name” - this is used as an “alias” in creating the formulas.
You can include values appearing in other columns in your formula by including the columnname in your formula. The names of other columns in the table editor are listed in the InsertReference to Column drop-down box. Click on the column name you want to include inyour formula. The column name will be inserted in the formula window.
A table formula can be any operation on other columns in the table (only columns which donot depend on the current column can be chosen; i.e., you can’t have recursive relationships).
Column referencesA column reference has the format “<Column name>”, where “name” is a user-definedcolumn name. This appears in the last column of the Table Editor window. Before a formulacan use a table column, it must be assigned a custom name. It will then show up in the InsertReference list in the window above. You can type in any name you wish to label a table'scolumns or to replace the default statistic names in the generated table. In the Table Editor,type in the new names in the Column Name column. When you create a table, these nameswill be displayed instead of FlowJo's statistic name.
A column reference can also specify a specific row in the final spreadsheet. So a formula suchas:<column “MeanCD4”> * 2will generate a new column in the table whose values are always twice the value in the“MeanCD4” column. For each row in the output table, the formula computes the value of
Formulas in Tables 46

“MeanCD4” column in the current row, and multiplies by 2.
Square brackets allow you to specify a particular population, the formula:<column “MeanCD4”[1]> * 2will generate a column where all of the values are twice the first entry in the “MeanCD4”column. Let’s assume the first row in the output table is the control sample, then:<column “MeanCD4”> / <column “MeanCD4”[1]> * 100Gives an output value which is the percent of control sample (first in the table).
Row references can also be “relative” to the current row. Thus:<column “MeanCD4”> - <column “MeanCD4”[-1]>will generate an output column where each cell represents the difference between the currentand the previous row’s values for “MeanCD4”.<column “MeanCD4”> - <column “MeanCD4”[+1]>is the same, but references the subsequent row in the final table.
Table of Contents
Formulas in Tables 47
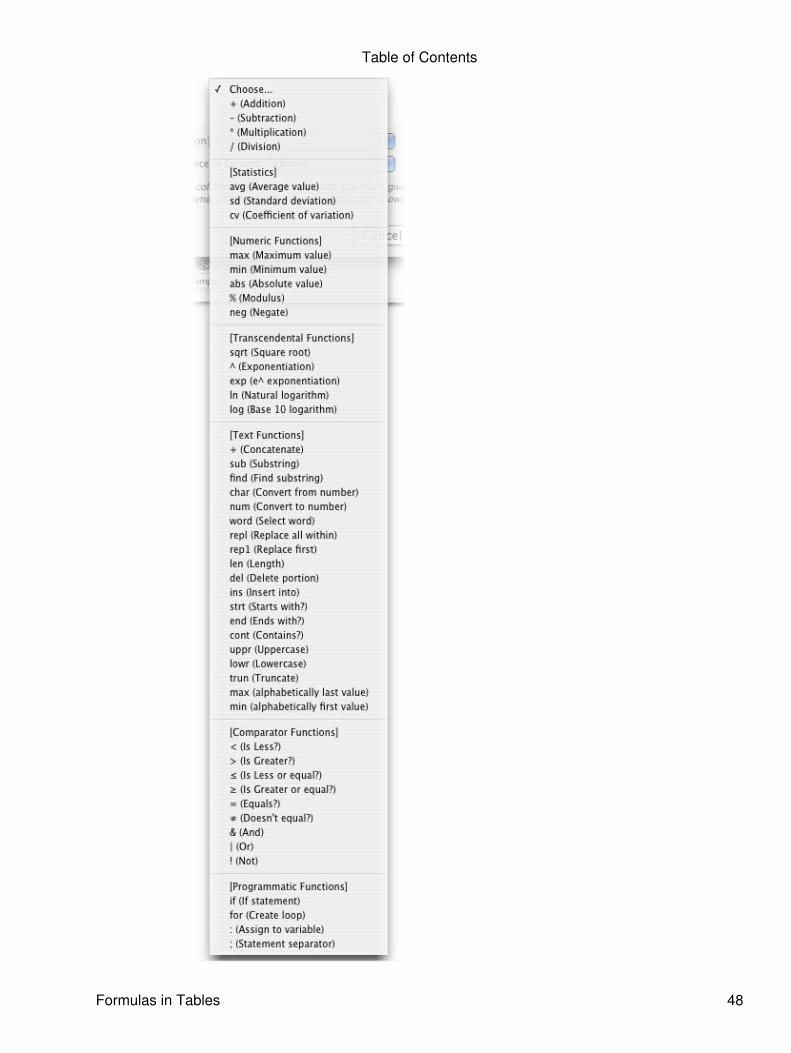
Table of Contents
Formulas in Tables 48

Insert Function
Select the Insert Function drop-down menu shown at the left, to add function notation toyour formula. There is a wide variety of functions that can be used in FlowJo Table Editorformulas. Some of these functions operate on numbers, and some on text. FlowJo isreasonably clever at converting strings to numbers and vice versa if needed, but there are twofunctions that do this explicitly just in case. char -> converts numbers in text form to arabicnumerals and num -> converts arabic numerals to their text form.
Simple math functions:+, -, /, * Are self-explanatory.% = modulus: e.g., 7 % 2 = 1.^ = exponentiation: 2 ^ 3 = 8.
Statistics functions:avg(x1, x2, …); sd(x1, x2, …); cv(x1, x2, …). These functions can have 2 or moreparameters. Each parameter can be a column reference, a constant, or an expression.Example: “avg( <column abc>, <column def>, <column last>)”.
Numeric functions:min(x1, x2, …); max(x1, x2, ….). These return the minimum or maximum value of the 2 ormore parameters.Abs(x): returns absolute value of x.%: ModulusNeg(x): returns the negative of x (or “-x”).
Transcendental functions:sqrt(x) is the square root of x.exp(x) is “e” raised to the power of x.Ln(x) is the base-e log of x.Log(x) is the base-10 log of x.
Text (String) functions:
Note that string constants must be specified in double quotes. Any text that is not in doublequotes is considered to be a variable or table column reference!+: concatenate. “Abc” + “def” = “Abcdef”
sub(x, a, b): substring of string x, starting at position a, of length b. sub(“abc”, 2, 1) = “b”
find(x, y): finds the first position of substring y in string x: find(“abce”, “c”) = 3.
Char(x): converts a number to a string: char(123) = “123”
Num(x): converts a string to a number: num(“123”) = 123
Word(x, a, b): selects word number a from string x, using b as a delimiter: word(“this isfun”, 2, “ “) returns “is”.
Repl(a, b, c): replace all instances of b in a with c: repl(“ababab”, “a”, “c”) returns “cbcbcb”.
Table of Contents
Insert Function 49

Rep1(a, b, c): replace the first instance of b in a with c: rep1(“ababab’, “a”, “c”) returns“cbabab”.
Len: returns the length of the string in number of characters
Del(a, b, c): delete from a starting at position b with length c: del(“abcd”, 2, 2) returns
Ins(a, b, c): insert b into a at position c. ins(“abcd”, “x”, 2) returns “axbcd”. “ad”.
Strt(a, b): returns 1 if a starts with b, otherwise 0. Strt(“abcd”, “ab”) = 1
End(a, b): returns 1 if a ends with b, otherwise 0.
Cont(a, b): returns 1 if a contains b
Uppr(a): returns the uppercase equivalent of a
Lowr(a): returns the lowercase equivalent of a
Trun(a, b): truncates a to a length of b characters. If b is less than zero, then delete the last“-b” characters from a. Trun(“abc”, -1) = “ab”.
Max(x1, x2, …); Min(x1, x2, …): return the alphabetically last or first of the parameters
Comparator functions:
All of these functions return a 1 if true or a 0 if false.<, >,≤, ≥, =, ≠
Thus, the expression “a < b” returns 1 if a is less than b, otherwise zero.
Boolean functions:
&: and: a & b: if both a and b are nonzero, then 1, otherwise 0|: or: a | b: if either a or b are nonzero, then 1, otherwise 0!: not: !A: if A = 0, then 1, otherwise 0
Programmatic functions:
If(a,b,c): If the expression a evaluates to nonzero, then return expression b, otherwiseexpression cFor(a, b, c, d, e): Evaluate a; then evaluate b: if b returns non zero, then evaluate expressiond (the main loop); then evaluate expression c; then go back to test expression b again todecide whether or not to loop. Finally, return expression e as the result. See below forexample. A for loop will quit after 1000 iterations unless a variable “MaxLoops” has beendefined with a different value (to prevent bad coded infinite loops)
Var(v, e): Set the variable v to have the value e.(semicolon): use a semi-colon to separate expressions; the right-most expression value is theresult. Thus: “3;4;5” returns a value of 5.
Table of Contents
Text (String) functions: 50
Example for loop: For(var(c,1); var(x, 0), x < 3, var(x, x+1), var(c, c*2), c)
This loop begins by evaluating the expression “var(c,1); var(x, 0)”; i.e., it defines twovariables, “c” and “x”, giving them values of 1 and 0 respectively.
It then evaluates the loop control expression, (“x < 3”), which returns a value of 1 (since 0 <3)—meaning the loop should be executed.
The end-of-loop expression “var(c, c*2)” is evaluated, which sets c to be twice the value of c,or 2.
The end of loop expression is evaluated “var(x, x+1)”, which sets the value of x to be x+1, orassigns it to be 1.
Then the loop control is evaluated again—and the looping continues until x is incremented to3, by which time c has a value of 4. Now the loop control expression tests false, and loopingis terminated.
Now the last expression is evaluated; “c”, which returns the value of 4. Thus, the output ofthis loop expression is 4.
Extra functions: The following functions are available but are not shown in the menu:
Rand(x, y): generates a random number between 0 and y with uniform distribution. (y can beomitted; Rand(x) is the same as Rand(x, 1)).Norm(x, y): Random number with a normal distribution, between 0 and y (Norm(x) is thesame as Norm(x,1)).Sin, Cos, Tan, asin, acos, atan, sinh, cosh, tanh: trig functions operating on (x).
Select the Create Formula button to add a new column to the Table Editor. When the TableEditor creates your table, you can have results appear in bold or in color if they exceed adesired threshold. For information on this, click here.
formulas
♦
Table of Contents
Text (String) functions: 51

PrintingTo print a single window, select the Print command from the File menu when that window isfrontmost. You will see the Print dialog offering choice of printer, number of copies and so on.In addition, you can preview the page to be printed, save it as a PDF file or fax it from the Printdialog.
For example. you can print the contents of the workspace window. Select Print from the Filemenu. The printout will have the entire portion of the sample and analysis half of the window(the lower portion). All currently visible samples, analyses, and statistics nodes will appear in theprintout.
For more complex printing, you should familiarize yourself with the workings of the LayoutEditor. This tool provides options for easily creating reports with graphs, overlaid histograms,statistics and any amount of annotation and elaboration you desire. The reports are created bytaking the first sample you set us as an example (tile) and batch processing through all thesamples you wish to summarize. The resulting report can be rendered in several formats: newlayout, print preview (tiled report), movie, or web report. In addition, you can print this reportdirectly.
Printing
•
Printing 52

MoviesAny graph you generate in FlowJo can be made into a movie using Apple's QuickTime technology.This feature provides an entirely new way to explore data. Making a movie is simple; the movie canbe viewed in FlowJo or saved to disk to view in other programs. To generate the movie, simply selectGraph > Make Movie... while viewing a graph you would like to see animated. FlowJo shows youthe following dialog window:
Here you can choose how the movie should be generated. There are several options available. Theprimary concern is to choose the control parameter, which is the third dimension that will be added tothe graph. If time is an existing parameter in your data, then it will be the default choice as the controlparameter. Otherwise, you can choose any other parameter you wish.
Movies 53
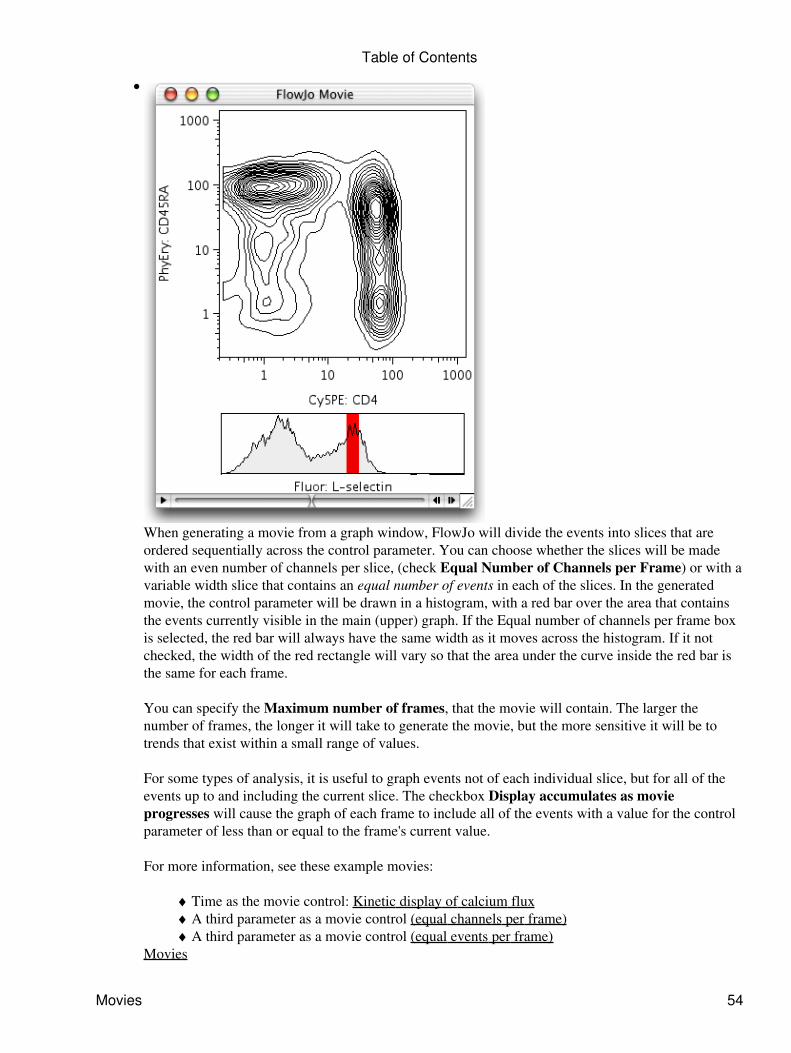
When generating a movie from a graph window, FlowJo will divide the events into slices that areordered sequentially across the control parameter. You can choose whether the slices will be madewith an even number of channels per slice, (check Equal Number of Channels per Frame) or with avariable width slice that contains an equal number of events in each of the slices. In the generatedmovie, the control parameter will be drawn in a histogram, with a red bar over the area that containsthe events currently visible in the main (upper) graph. If the Equal number of channels per frame boxis selected, the red bar will always have the same width as it moves across the histogram. If it notchecked, the width of the red rectangle will vary so that the area under the curve inside the red bar isthe same for each frame.
You can specify the Maximum number of frames, that the movie will contain. The larger thenumber of frames, the longer it will take to generate the movie, but the more sensitive it will be totrends that exist within a small range of values.
For some types of analysis, it is useful to graph events not of each individual slice, but for all of theevents up to and including the current slice. The checkbox Display accumulates as movieprogresses will cause the graph of each frame to include all of the events with a value for the controlparameter of less than or equal to the frame's current value.
For more information, see these example movies:
Time as the movie control: Kinetic display of calcium flux♦ A third parameter as a movie control (equal channels per frame)♦ A third parameter as a movie control (equal events per frame)♦
Movies
•
Table of Contents
Movies 54

ExportingWhen you are displaying a population, you can choose to export the data for that gate (by selectingExport from the Workspace menu). This allows you to create a new FCS file containing only the datayou want to include. Alternatively, you can create a text file that can be imported into a spreadsheetprogram. This spreadsheet file will contain the raw data from the sample (the event data), containingonly the parameters you wish to export and can have either the channel numbers or the convertedabsolute intensities.
The exported FCS files can then be read in by any other application that can read FCS files. As well,you can read it into FlowJo. This may be useful if you are working with very large data files and onlyneed to examine a small subset of the events: exporting them to a separate file and reading that inmakes the program operate much more efficiently.
You can export either the raw channel numbers, or the scaled fluorescence values. The latter are therelative fluorescence intensities for each cell, taking into account logarithmic amplification or lineargain settings.
Choosing "Export..." brings up one of two dialogs. If you selected populations from only a singlesample, then you will be presented with the first dialog below. This dialog allows you to export asubset of the parameters of the file (if you wish). On the other hand, if you selected populations ofmultiple samples (in other words, you shift-clicked nodes from more than one sample, or you chosethe Export command with group populations selected), then you will be presented with the seconddialog.
Exporting from a single sample:
Exporting 55

Exporting from multiple samples (or by selecting the group and choosing Export): all the features arethe same; the difference is that for all files created, every parameter will be exported to the output file.If you check the box labeled "Don't export uncompensated parameters", then FlowJo will exportevery parameter unless there is a compensated equivalent for that parameter. Thus, you can quicklyexport only compensated data.
In addition, you have the option of excluding uncompensated parameters (with a single sample export,you can select which parameters to export explicitly; hence, this option isn't shown above). When thisoption is selected, all parameters except those for which a compensated equivalent has been computedwill be exported. This is useful for generating new files of only compensated data, saving time onfuture analyses (since the data will not have to be recompensated every time it is used).
Exporting Histogram Data and Kinetics Data
You can also export gated histogram data (or processed kinetics data from the Kinetics Platform) to aspreadsheet. (This is the events per channel data that is displayed in a histogram graph). You mightwish to do this so that you can perform specialized analyses, such as DNA analysis (cell-cycle fitting),etc.
Exporting histogram data occurs automatically whenever you select "copy" when viewing a histogramgraph. When you copy a histogram graph, two different items are placed on the clipboard: the graphicrendition of the histogram, and the text corresponding to the columnar data. Other programs knowwhich of these you want! Thus, when you immediately follow the copy operation by pasting into adrawing package, you will see the graphic. If you paste into a spreadsheet, you will see the columnardata.
When you paste into a spreadsheet, two columns will be created. The first one has the channelnumbers for the histogram (at whatever resolution the data was collected); the second has the eventcounts for each channel. This is the raw, unsmoothed data. If a gate was applied to view the graph,then the exported data will reflect only the gated events.
Exporting raw (gated) data for analysis by other programs
•
Table of Contents
Exporting Histogram Data and Kinetics Data 56
PlatformsFlowJo has several analysis platforms that provide capabilities beyond the gating and statistics used for mostsimple data analysis. All analysis platforms are fully integrated into the FlowJo paradigm: i.e., they can beeasily applied to multiple samples (usually, by using Groups), they are easy to edit, and all operations aresaved with the Workspace for your permanent record.
Workspaces and Demo Data are provided for several of FlowJo's platforms so that you can try out thesefeatures yourself (Demo Data downloads page). In addition, we have several short application guides (TechNotes) that give step-by-step instructions for FlowJo platforms and features. (Tech Notes downloads page)
FlowJo has the following analysis platforms:
Kinetics
Kinetics analyses provide you a powerful tool for computing parameter statistics as a function of time andexporting the data or graphics, or statistics computed as a function of time. If you did not collect a timeparameter, FlowJo will add one for you. You can even use the Layout Editor to overlay time-series graphs tocompare different samples.
Cell Cycle Analysis
FlowJo gives you a sophisticated, yet easy-to-use interface to model DNA/Cell cycle data. You cansimultaneously compute several different standard models, with the ability to constrain different modelparameters with the click of a mouse.
Proliferation Studies
FlowJo models proliferation data obtained using cell tracking dyes such as CFSE. FlowJo presents a graphicaldisplay as well as information about each generation in the subset. The proliferation platform also providesinformation about the fraction of cells from the original population that have divided, and the number of timesthese cells have divided. In addition the FlowJo Proliferation Platform draws gates that separate eachgeneration.
Population Comparison
FlowJo can take two or more samples and analyze them to determine how different the distributions are.Comparisons can be univariate or multivariate, and you can rank multiple samples by their similarity tocontrols.
Calibration
Using this platform, you can calibrate any of your fluorescence parameters. The platform can use a calibratedbead set as a standard, a stained sample as a reference, or numbers that you enter to define the calibrationmanually. FlowJo creates a calibrated parameter and displays all graphs and statistics in calibrated units suchas absolute number of molecules per cell.
Platforms 57
Compensation
Sometimes your data is not properly compensated... sometimes, it is not possible to compensate your data onthe machine because of the complexity of the analysis. FlowJo's compensation platform makes compensatingdata much easier than compensation on the machine; you are always guaranteed a correctly-compensatedoutput!
Derived Parameters
Let FlowJo calculate a ratio of two parameters, add a time parameter (in case you want to do Kineticsanalyses), or convert between log and linear scaling.
Boolean Gates
You can combine data from existing subpopulations into a gate with your choice of Boolean properties: And,Or, And Not, Or Not.
Movies
An analysis platform unique to FlowJo: view your data dynamically. Use the Movie Platform to generategraphs as a function of time (kinetic analyses), or to generate a graph of one or two parameters as a functionof a third. This unique visualization lets you uncover subtle relationships in your data that would beimpossible to see otherwise.
Special Analysis Platforms:
Table of Contents
Cell Cycle Analysis 58

Derived ParametersFlowJo allows you to add new parameters to your data. These parameters are not actually added to theoriginal data files; they are simply descriptions of new parameters that are stored with the workspace.However, they behave in other regards like parameters that were collected: you can display them,calculated statistics on them, etc.
Because they are not stored with the data file, they will not appear if you open the same sample in adifferent workspace--you will have to add the derived parameters again in that workspace. Currently,there is no way to copy derived parameter definitions between workspaces.
There are four derived parameter types that you can create: time, ratio, log->linear, and linear->log.(Calibrated parameters are also derived parameters, but they are created using the CalibrationPlatform). To add a derived parameter, select the sample in the workspace, and then select the "Definenew..." menu item attached to the "Derived Parameters..." menu item, under the workspace menu.You will be presented with a dialog window that allows you to specify the parameters to define. Fromthis dialog window, you can also remove existing derived parameters. Click here to view the specialderived parameter menu items.
Adding a time parameter is useful for performing kinetics analyses. This is usually done when youhave a response that you wish to measure (for example, calcium flux experiments); however, youmight want to see how stable a sample was during collection, and simply display forward or sidescatter (or fluorescence!) vs. time during collection. Time can only be added if there is not already atime parameter with the sample. When you add a time parameter, FlowJo assumes that the event ratewas constant throughout collection, and distributes events evenly over time. If the start time and endtime for acquisition were recorded by the program collecting the data, then FlowJo knows the timeover which to distribute the events. Otherwise, FlowJo will ask you to enter how many seconds it tookto collect the sample.
You can add a ratio parameter: this is the ratio of any two collected parameters. This is commonlynecessary for calcium flux experiments, in which the ratio of Indo-1 fluorescence in two differentchannels is related to the calcium concentration. You can choose to create a ratio parameter witheither linear or logarithmic scaling.
You can create a calibrated parameter. Using the Calibration Platform you can convert the scaling ofany parameter (for instance, to absolute number of molecules per cell). While the calibration platformcreates a derived parameter automatically, you may wish to apply such a calibration to othersamples--do this by selecting the appropriate derived parameter. You can directly select a calibratedparameter (once the calibration standard exists) by selecting it under the derived parameter submenu.
Finally, you can convert any collected parameter between log and linear. FlowJo will automaticallyoptimize the scaling of the converted parameter to show the maximum number of events.
Creating derived parameters (time, ratios, log <-> linear conversion)
•
Derived Parameters 59

Compensation OverviewFlowJo gives you the ability to compensate your data. This may be necessary in cases where thecompensation was inappropriately set during sample collection (although if the sample wasover-compensated, then there is no recourse). Also, there may be cases where the instrument is notcapable of compensating between certain channels (for instance, to correct for the spillover betweenfluorescein and Cy5PE).
For a description of why compensation is necessary, the underlying concepts behind compensation,and some of the pitfalls of improper compensation, see the "Compensation: A perspective" by MarioRoederer (you need to be connected to a network to view this site). The remainder of thedocumentation below is NOT meant to teach you about compensation, simply how to use FlowJo toperform that function.
FlowJo computes the compensation matrix on control samples much the way you would manually setthe compensation. To do this, you will select gates on positive and negative populations for each ofthese stain, and tell FlowJo to calculate the compensation matrix based on these stains.
Thus, you must collect samples that are singly-stained (as well as unstained) for each of thefluorescences that require compensation. Ideally, you would use a stain that only labels a portion ofthe sample population, so that you have an unstained set of cells in each tube. It is important toremember that the negative population and positive population must share the same autofluorescencecharacteristics for compensation to be valid (i.e., don't use monocytes as a negative control for alymphocyte stain; if you are compensating a stain on fibroblasts, use an unstained fibroblast control).
Steps involved in compensation by FlowJo:
Define positive and negative gates for each fluorescence channel requiring compensation1. Open the compensation window; drag the positive and negative populations into theappropriate boxes or use the Compensation Wizard for extra flexibility.
2.
Compute and save the matrix3. Apply the matrix to the appropriate samples4.
If you need to generate another compensation matrix for other samples in the experiment, you can justrepeat steps 2 through 4 as needed. This is where the Compensation Wizard will save time and effort.
You may also view an example of the entire compensation process, as a tutorial.
Once you have defined a compensation matrix, it is saved with the workspace. You may subsequentlyapply that compensation matrix to other samples in the same workspace by selecting it from themenu. To use that matrix in other workspaces, save the matrix to a file ("Edit/Save Matrix") and loadthe matrix file into the new workspace ("Load matrix"). Note that a compensation matrix is generallyvalid only for samples collected during a single collection run! However, you can also edit the matrixusing the "Edit/Save Matrix" option.
Any sample that has been compensated is marked with a blue bar next to the sample name in theworkspace window. Compensated samples have new parameters added to their list: for eachfluorescence channel to be compensated, a new parameter is created. The parameter name isbracketed with "": e.g., when FITC and PE are compensated against each other, two new parametersnamed "" and "" will be created. Remember to select these new parameters in the graph or statisticswindows!
Compensation Overview 60
FlowJo can transform the display of compensated data so that populations no longer are displayedsquished against the axis. This transformation does not alter the data in any way, it simply changes thescale of the axis so that you can view negative numbers and therefore the entire population of cells asa whole cluster. Please visit the display transformation web pages for more information.
You may also click on the topics below to get more help on:
An example of Compensation♦ FlowJo's Compensation menus♦ The Compensation window♦ The compensation matrix file♦ Changing the compensation matrix manually♦ Display Transformation (for those pesky cells that get squished against the axis!)♦
Download a Compensation Workspace with Demo Data to try out this platform.
Download the Compensation Tech Note to print a short (four page) step-by-step guide.
Compensation
•
Table of Contents
Compensation Overview 61

Compensation WizardA new interface is available to help you create compensation matrices quickly and rigorously! Launchthe platform by selecting Platforms > Compensate Sample... > Wizard... If you select thecompensation tubes (or a Group of compensation tubes) in the Workspace, they will be automaticallyloaded into the Wizard. Let it guide you through the process!
There are a number of short cuts that you can take to speed the process—specifically, create a gate oneach compensation tube to identify lymphocytes or singlet beads; and, if necessary, create positiveand negative gates for compensation tubes with mixed populations.
Once you have isolated the populations that will form the controls of your matrix, create a group fromthem, or just select them in the workspace. Open the Wizard and they will be listed as below. You canalso open the Wizard and drag them in from the Workspace.
Click in the Use column to tell the Wizard which tubes will be used in the compensationmatrix. This is helpful if you wish to make multiple matrices from numerous tubes.
1.
For multiply stained samples, click on the disclosure triangle in the Color column to selectthe desired parameter.
2.
For tubes with multiple gates, click the names in the Positive or Negative column to selectthe desired gate from a drop-down list.
3.
Compensation Wizard 62

Click the Validation Graph disclosure triangle and you will see graphic information displayedin the right pane of the Wizard as you work. The tube selected on the left will contributegraphs to this display. You can use these graphs to confirm your choice of controls incomplex cases.
4.
To quickly view a population's original graph, click the name of the positive or negative control itself,and select Open Graphic from the menu that drops down.
The Validation graphs display a gating ancestry of the selected positive and negative controlpopulations. If you check the Show All Fluorescence Plots checkbox, the Wizard will also displaybivariate graphs of other parameter pairs.
Text in the Wizard will guide you through the process until you have the right setup to create acompensation matrix. Click the Create Matrix... button. Give it a name (like Matrix 1) and it willappear at the bottom of the Platforms > Compensate Sample... menu. Select tubes in the Workspaceto which you wish to apply the matrix, then select the matrix name in this menu.
Compensation Wizard Create compensation matrices quickly and rigorously.
•
Table of Contents
Compensation Wizard 63

AutoCompensation Scripts1. Introduction2. Setting up the workspace/template3. Using the template
1. Introduction -The purpose of this functionality is to reduce the amount of time spent on compensating similarexperiments. This document will teach you how to set up a set of compensation controls, it willinclude the FCS files and the template document for your testing/learning.
The AutoCompensation platform specifies several important instructions for FlowJo:
How to identify the appropriate compensation tubes for any given experimental sample1. Which parameters are to be compensated2. What gates are to be applied to the compensation tubes to define the positive and negativecontrols
3.
2. Setting up the Workspace/TemplateThere are some prerequisites that we must follow for this to be useful. Basically, we have to make aworkspace that can be saved as a template for future experiments. In our example, we will be using a4 color data set collected on a DiVa based machine.
Notice the side scatter may show up as linear unless you check the log scaling in your 32 bit fileconversions dialog in Preferences.
It will help if the compensation tubes had something not common with the experimental tubes. In thisexample, the single stain controls were named �[channel name] comp�.
The first step is to create groups � one group per compensation control. This way we can retain gatesfor the comp controls in the template. It is easier to make the groups if you have some keyword todifferentiate the samples. Do this during acquisition, and save time later.
The 4 color experiment, after setting up the gates, looks like the figure below. There is one sharedLymp gate (fsc, ssc) and the single stain tubes' lymph gates were gated on the individual controlchannels in histogram mode, to create the positive and negative gates for each control.
Four groups were then created, one for each control. I used the staining protocol definition to createthe groups.
AutoCompensation Scripts 64

For Example, for the Cy5PE group, the definition was:
When done with the grouping, the workspace's group pane will look like this:
Table of Contents
AutoCompensation Scripts 65
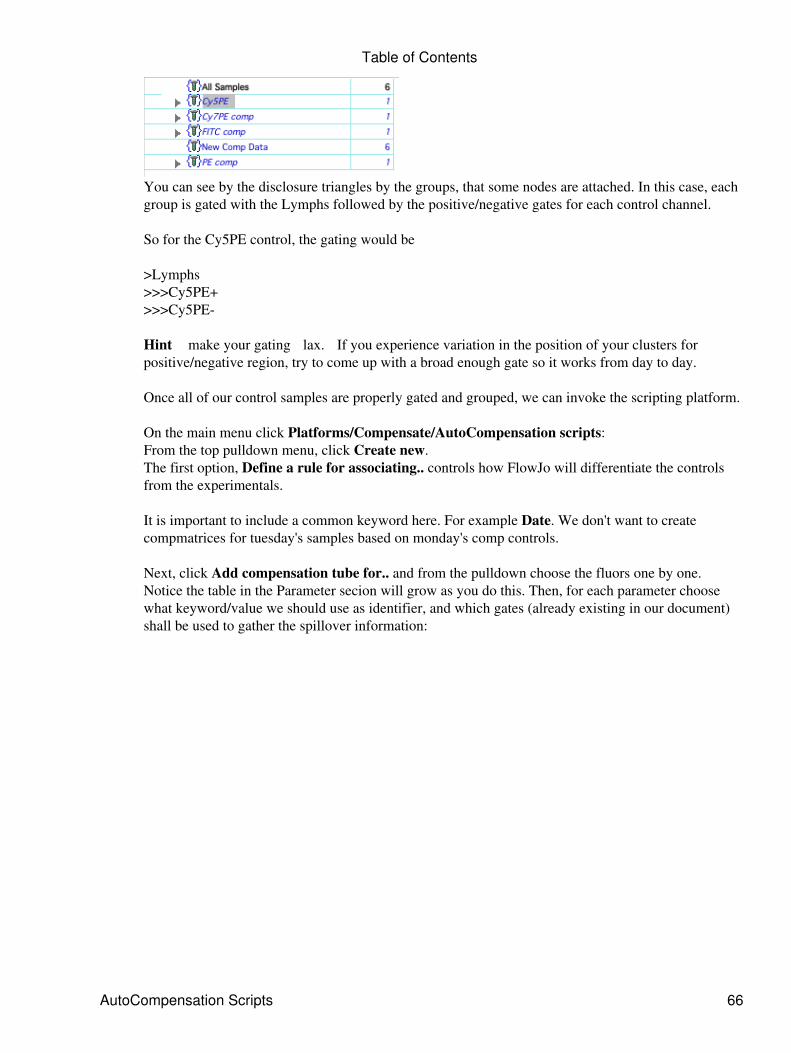
You can see by the disclosure triangles by the groups, that some nodes are attached. In this case, eachgroup is gated with the Lymphs followed by the positive/negative gates for each control channel.
So for the Cy5PE control, the gating would be
>Lymphs>>>Cy5PE+>>>Cy5PE-
Hint � make your gating �lax.� If you experience variation in the position of your clusters forpositive/negative region, try to come up with a broad enough gate so it works from day to day.
Once all of our control samples are properly gated and grouped, we can invoke the scripting platform.
On the main menu click Platforms/Compensate/AutoCompensation scripts:From the top pulldown menu, click Create new.The first option, Define a rule for associating.. controls how FlowJo will differentiate the controlsfrom the experimentals.
It is important to include a common keyword here. For example Date. We don't want to createcompmatrices for tuesday's samples based on monday's comp controls.
Next, click Add compensation tube for.. and from the pulldown choose the fluors one by one.Notice the table in the Parameter secion will grow as you do this. Then, for each parameter choosewhat keyword/value we should use as identifier, and which gates (already existing in our document)shall be used to gather the spillover information:
Table of Contents
AutoCompensation Scripts 66

Last step � from the Execute current... pulldown, choose which samples to compensate using thisscript. Finally, click Done. Now your .jo file is read to be saved as a template � do this from the Filemenu, Save as Template.
3. Using the template To use the template, open it, and add the attached FCS files. Notice how theyall end up in their proper groups and the purple compensation bar shows up? Your work is done.
AutoCompensation ScriptingFind compensation samples, gate them, create the compensation matrix,and apply the matrix to experimental tubes.
•
Table of Contents
AutoCompensation Scripts 67
Calibrated Parameters: OverviewFlowJo has a unique platform that allows you to calibrate any collected parameter. This gives you theability to express any parameter's values (graphical display, any statistical calculations) in the units ofyour choice. Most commonly, this is used to convert the scaling into absolute number of molecules(given a standard that converts between the fluorescence intensity collected on your instrument andabsolute numbers of fluorophores).
Once you have created a calibrated parameter, it is added to your sample as if it were just anotherparameter. You can apply the calibration standard to any other sample in your collection (and you canapply the calibration to an entire group, if you wish). You may have as many different calibrationstandards in a workspace as you want; in fact, you can even apply multiple calibration standards to thesame sample (a new parameter will be added for each calibration that you apply).
When you graph your data, select the calibrated parameter on the axis of choice--the scale values onthe axis are now drawn in your calibrated units! For example, if you calibrate to absolute number ofmolecules per cell, then you can display these numbers on the axis. In addition, any statistics youcalculate (medians, CVs, etc.) will be expressed in units of absolute molecules. Finally, you can evenenter a gate based on those units: you could, for example, specify a gate on all cells with more than5,000 molecules of an antigen.
There are two methods by which you can calibrate a parameter: manual or reference. Use the manualmode when you want to enter the exact conversion values yourself. Use the reference when you havecollected data on a standard which you can use to convert to your units (for example, a commercialbead set where each bead has a defined absolute intensity; or, a sample stained with an antibody thathas a known binding capacity to the cells). When you use a reference, FlowJo automatically finds allof the peaks in the fluorescence, and asks you to enter any or all of the calibration values for thosepeaks. FlowJo then performs a linear (or logarithmic) least squares regression to determine the bestcalibration value, and creates the calibrated parameter
A "Calibration standard" is FlowJo's internal representation of the conversion of fluorescence toabsolute units. Calibration standards are saved with the workspace, permanently. They are accessibleas Derived parameters; thus, if you want to apply a Calibration Standard to another sample (afterdefining it), select its name under the "Derived Parameters" menu item. For more information onderived parameters, click here.
When you select "Calibrate..." under the Workspace menu, you will be presented with the "DefineNew Calibration Standard" dialog window. It asks you to define which parameter you want tocalibrate, and then which method to use. To see how to use either method to create a new CalibrationStandard, click on this link.
In addition, you can see two examples of creating Calibration Standards. Both use reference samples;one uses a bead set, the other, the expression of CD4 on lymphocytes as a defined set point. Examinethese two series of pages to see how easy it is to calibrate your samples with FlowJo!
Download a Calibration Workspace with Demo Data to try out this platform.
Calibrated Parameters Quantitation of absolute molecules per cell.
•
Calibrated Parameters: Overview 68
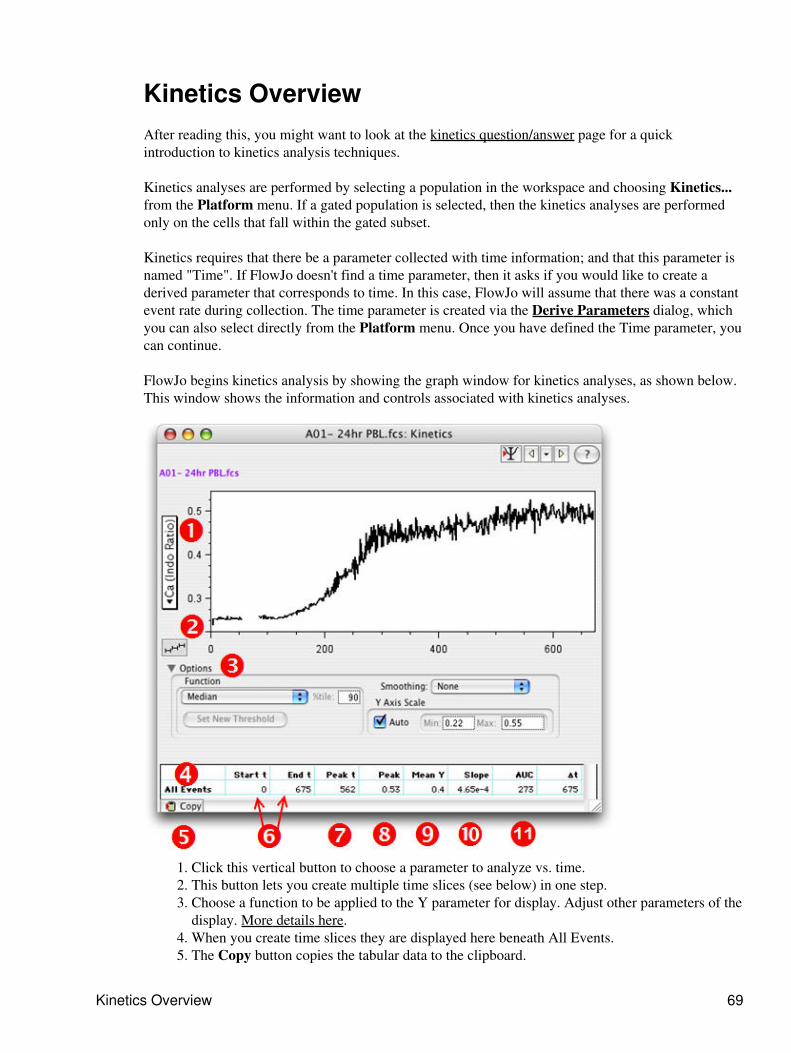
Kinetics OverviewAfter reading this, you might want to look at the kinetics question/answer page for a quickintroduction to kinetics analysis techniques.
Kinetics analyses are performed by selecting a population in the workspace and choosing Kinetics...from the Platform menu. If a gated population is selected, then the kinetics analyses are performedonly on the cells that fall within the gated subset.
Kinetics requires that there be a parameter collected with time information; and that this parameter isnamed "Time". If FlowJo doesn't find a time parameter, then it asks if you would like to create aderived parameter that corresponds to time. In this case, FlowJo will assume that there was a constantevent rate during collection. The time parameter is created via the Derive Parameters dialog, whichyou can also select directly from the Platform menu. Once you have defined the Time parameter, youcan continue.
FlowJo begins kinetics analysis by showing the graph window for kinetics analyses, as shown below.This window shows the information and controls associated with kinetics analyses.
Click this vertical button to choose a parameter to analyze vs. time.1. This button lets you create multiple time slices (see below) in one step.2. Choose a function to be applied to the Y parameter for display. Adjust other parameters of thedisplay. More details here.
3.
When you create time slices they are displayed here beneath All Events.4. The Copy button copies the tabular data to the clipboard.5.
Kinetics Overview 69

Start time and end time of each time slice.6. The time of peak value within each slice.7. The peak value itself.8. Average value over time slice.9. Linear least-squares within the timeslice.10. Area under the curve.11. The final column contains the elapsed time for each time slice, Delta T.12.
Since Time is always on the X-axis, you cannot change the X-axis. However, you may select anyparameter to be displayed on the Y axis. FlowJo, by default, will display a ratio parameter (if oneexists); otherwise, it will choose one of the collected parameters.
The value that is displayed in the line graph is a function of the Y parameter (the name of thisfunction is shown directly above the graph). In this case, the line graph is the 75th percentile offluorescence for the "Ca" parameter as a function of time. No smoothing has been applied ( aGaussian smoothing algorithm with a width of 3 seconds or a Moving Average smoothing isavailable.) And Auto-scaling is on. To change the function of the Y parameter that is displayed, usethe Kinetics Options window. Activate this window by opening the triangle beside the word Options(Number 3 in the graphic above.) Refer to the Options page to see what other kinds of functions youcan display.
Just below the graph is a table of statistics regarding the computed parameter. Each line in the table isa timeslice; by default, the first timeslice is All Events, with a begin and end time that covers theentire collection. The statistics computed for events within a time slice include the peak time andvalue and the slope of the line within a timeslice. The units for the peak value and the slope are thesame as the units shown on the Y axis - linear scaled units for the parameter being displayed. You cancopy this information directly to a spreadsheet or word processor: click on the Copy button just belowthe left edge of the table, and a copy of the table is placed on the Macintosh clipboard. If you switchto a spreadsheet application, select EDIT/PASTE and the table will be copied in to your spreadsheet.
To create a new timeslice, simply click and drag within the graph as you would to create a histogramgate. You will then be asked to name the timeslice; you may also fine-tune the start and end times inthe naming dialog window. Shown below is the result of analyzing the graph above: first, the eventswere smoothed (via the kinetics options); then, three timeslices were defined to cover the background,response, and resolution time periods. Note that the statistics below the graph reflect these newtimeslices, and pertain only to the events within the timeslices. If you wish to delete a timeslice, selectit by clicking on the darker horizontal line across the time slice, and press the delete key. (Useoption-delete to avoid the confirmation query).
Table of Contents
Kinetics Overview 70
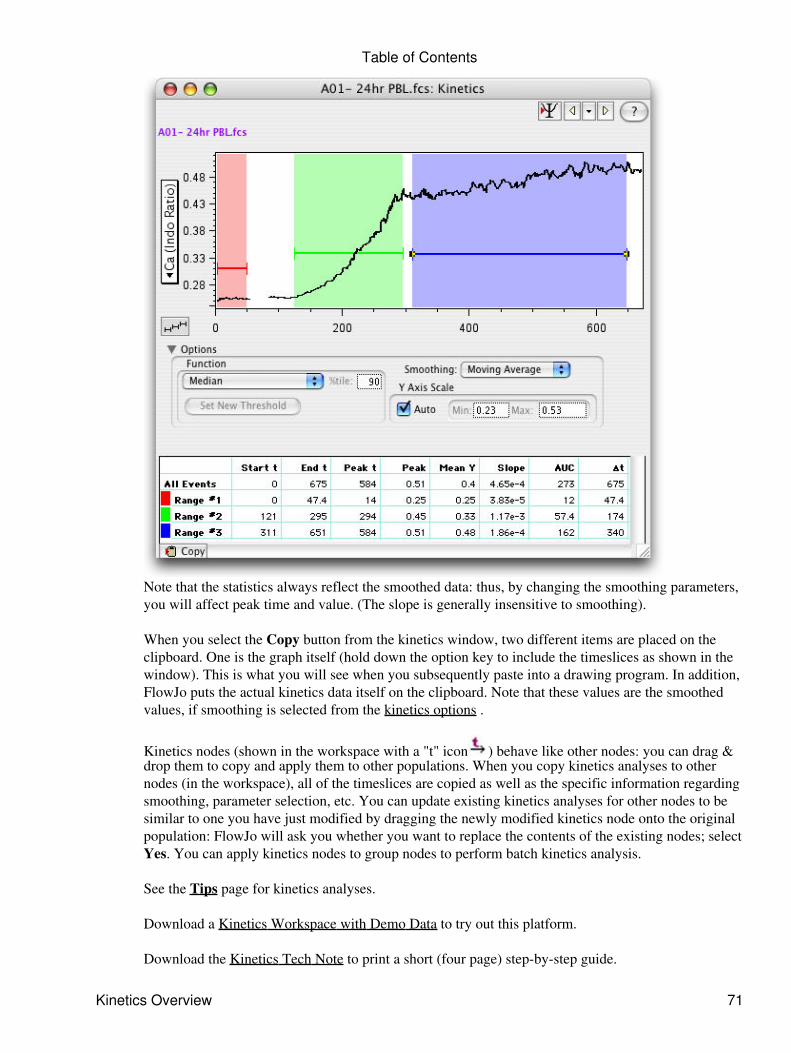
Note that the statistics always reflect the smoothed data: thus, by changing the smoothing parameters,you will affect peak time and value. (The slope is generally insensitive to smoothing).
When you select the Copy button from the kinetics window, two different items are placed on theclipboard. One is the graph itself (hold down the option key to include the timeslices as shown in thewindow). This is what you will see when you subsequently paste into a drawing program. In addition,FlowJo puts the actual kinetics data itself on the clipboard. Note that these values are the smoothedvalues, if smoothing is selected from the kinetics options .
Kinetics nodes (shown in the workspace with a "t" icon ) behave like other nodes: you can drag &drop them to copy and apply them to other populations. When you copy kinetics analyses to othernodes (in the workspace), all of the timeslices are copied as well as the specific information regardingsmoothing, parameter selection, etc. You can update existing kinetics analyses for other nodes to besimilar to one you have just modified by dragging the newly modified kinetics node onto the originalpopulation: FlowJo will ask you whether you want to replace the contents of the existing nodes; selectYes. You can apply kinetics nodes to group nodes to perform batch kinetics analysis.
See the Tips page for kinetics analyses.
Download a Kinetics Workspace with Demo Data to try out this platform.
Download the Kinetics Tech Note to print a short (four page) step-by-step guide.
Table of Contents
Kinetics Overview 71

Kinetics•
Table of Contents
Kinetics Overview 72

Cell CycleFlowJo provides a simple interface to performing fairly sophisticated DNA/Cell Cycle analysis. Tolaunch the Cell Cycle platform, select any sample or gated population (i.e., where you have gated outdebris or gated for a desired phenotype), and choose "Cell Cycle..." from the "Workspace" menu.FlowJo brings up a graph window that is specially designed for cell cycle analyses. You might wantto visit the page giving hints for Cell Cycle analysis with FlowJo.
FlowJo tries to determine which parameter contains the DNA quantitation information; if it choosesthe wrong one, select the correct one from the X-axis popup menu. Then click on the button"Add/Change Models" to begin your Cell Cycle analysis.
When you click on "Add/Change Models" button, FlowJo shows you the Cell Cycle SpecificationWindow. From this window, you can decide which of several models to compute for the data, and, ifnecessary, to constrain the fitting parameters by any number of criteria.
Once FlowJo has computed the model, it displays the fit along with statistical data in the Cell Cyclewindow, such as that shown below.
The statistics displayed in the table will depend on which models and options are computed, but allwill include basic statistics such as the fraction of cells in G1, S, and G2, the positions of the G1 andG2 peaks (and their widths), and the number of cells below G1 and above G2. In addition, the RMS
Cell Cycle 73

(root mean square) error of the fit is displayed in the first column. If you change the fitting criteria,you may wish to minimize this value as a way to optimize the fit. If FlowJo fails to fit the model(s) tothe data, then it will display "Invalid" in the RMS field. In this case, you will want to help FlowJo fitthe data by constraining different parameters. See the "hints" page for ideas on how to proceed.
If you click and drag within the graph window, you can create "ranges". Ranges are similar tohistogram gates, and can be used by the fitting criteria to constrain peak positions to within the range.In the example above, a range was defined around the G1 peak in order to help FlowJo determine theoptimal fit: in the Graph Specification Window, the fit was constrained such that the G1 peak must befound within the defined range.
Cell cycle analyses can be copied between subsets and between samples, and even to groups, just likeevery other analysis in FlowJo. In this fashion, you can compute Cell Cycle analyses on every samplein an experiment. In general, you will begin by analyzing a control sample, and use this controlsample to define ranges for G1 and G2. If you have unusual distributions, constraining the fit by theseranges will help FlowJo determine the proper distribution of cells. Once you have defined the rangesand the fit, drag the analysis to other samples (or the group).
You can drag Cell Cycle analyses to the Layout Editor to generate reports that contain the graphs, themodels, and the basic statistics (fraction of cells in G1, S, and G2). You can also copy the table ofstatistics to the clipboard by clicking on the button right above the table--and then paste into anyspreadsheet or word processor for further analysis.
To learn more about applying specific models, view the page on Cell Cycle Graph Specification. Youmay also wish to view the page on hints for performing Cell Cycle analyses.
Download a Cell Cycle Workspace with Demo Data to try out this platform.
Cell Cycle
•
Table of Contents
Cell Cycle 74

Proliferation
Using flow cytometry to track cell generations is now possible, thanks to the introduction of celltracking dyes. FlowJo presents a graphical display and a table of data on each generation in thesubset. This will provide you with information about how many cell divisions have occurred. Inaddition the FlowJo Proliferation Platform draws gates in order to separate each generation.
Start by clicking on the population to analyze and selecting Proliferation from the Platform menu.
This brings up the Proliferation Platform.
Proliferation 75

Select a parameter on the X-axis.
The default number of peaks is 8, although it is important that the chosen number of peaks exceedthe actual number of peaks in the data.
It is useful to initially calculate the model without constraints (adding constraints as necessary toobtain the best fit).
1) Calculate the model by clicking on the Calculate button.
Click a yellow arrow to cycle through samples.
Click the black triangle to select a sample.
Click the clipboard icon to copy table to clipboard.
The Division Index*, Proliferation Index*, and the %Divided* are explained below.
The better the model fit, the lower the Root Mean Square (RMS).
2) Create Gates...Gates dividing the generations can be created by clicking the Create Gates button.(Draws a gate halfway between each peak and adds them to the Workspace.)
3) Show Overlay: Select this button to open the Multigraph Overlay window showing eachgeneration's gate displayed on a bivariate plot with the parameters of your choice.
*Division Index is the average number of divisions that a cell (that was present in the startingpopulation) has undergone. For example, if half of the cells in the starting population divided and theaverage number of divisions was 4, the Division Index would be 2.
Table of Contents
Proliferation 76

*Proliferation Index is the average number of divisions that those cells which divided underwent.For example, if the average number of divisions for all the cells was 4, the Division Index would be 4.
*%Divided is the percentage of the cells of the original sample which divided (assuming that no cellsdied during the culture). For example, if half of the cells in the starting population have divided, the%Divided = 50%.
These statistics are related in the following way: Division Index = (Prolif. Index)(%Divided)
The Model Parameter Adjustments can be used to obtain a better fitting model.
As with all other platforms in FlowJo, the Proliferation Node can be applied to groups of samples bydragging.
Each generation can be analyzed separately (double click the generation number to open a graph).
Table of Contents
Proliferation 77

Select the Backgate icon to display a backgating analysis of the generation.
Proliferation Studies
•
Table of Contents
Proliferation 78

Population Comparison - OverviewComparing distributions of FACS data is an important goal in many applications. For example, todetermine whether two samples are statistically significantly different (control vs. test sample) inorder to detect a response, or to provide feedback regarding instrument stability by detecting whencollected data varies significantly over time.
Comparison Algorithms
FlowJo's comparison platforms support four different comparison algorithms. Two algorithms(Overton and SED) are used to calculate the percentage of positive cells found in the sample and notthe control). Two algorithms (K-S and Chi(T) / PB) are used to determine the statistical differencebetween samples.
The Overton cumulative histogram subtraction1 algorithm essentially subtracts histograms on achannel-by-channel basis to provide a percent of positive cells. This method does not provide anindication of the probability with which two distributions are different; nor does it provide confidenceintervals.
The Super-enhanced Dmax Subtraction (SED) is a new sophisticated algorithm by Bruce Bagwell tocompute %Positives when comparing histograms.
Several algorithms can be used to compare FACS data. The Kolmogorov-Smirnov (K-S) algorithm isa commonly used method to determine the confidence interval with which one can make the assertionthat two flow cytometric univariate histograms are different. Caution must be exercised with thisstatistic as it will erroneously report that two halves of the same population (every other cell makes upone of the halves while the cells in between make up the other half) are distinct.
A new comparison algorithm was recently developed for the comparison of distributions, calledProbability Binning (Chi(T) or PB)(3-5). The PB comparison is related to the Cox chi-square6
approach, but with modified binning such that it minimizes the maximal expected variance. Thisalgorithm has been shown to detect small differences between two populations and it does so in aquantitative way.
FlowJo Population Comparison Platforms
FlowJo contains two platforms that allow the direct comparison between different populations,Population Comparison (Uni- and Multivariate) and Multi-sample Comparison. The comparedpopulations can either be subsets of the same sample, or more commonly, equivalent populations indifferent samples.
Comparing Populations Using FlowJo
Method #Parameters Statistic Create
Gates? Compare
Univariate 1 K-S, Overton, PB, SEDSubtraction no Individual Populations
Multivariate 1 or more PB yes
Multi-sample
Population Comparison - Overview 79
Individual or aggregates ofPopulations
The Univariate Comparison platform compares single parameters using the Overton, SED, K-S, andChi(T) statistics.
The Multivariate Comparison platform compares a single test sample to a single control formultivariate data using the Chi(T) statistic.
The Multi-sample platform compares either univariate or multivariate data of single samples tocomposites of control samples using the Chi(T) statistic.
References:
1) Overton WR. Modified histogram subtraction technique for analysis of flow cytometry data.Cytometry. 1988 Nov;9(6):619-26.
3) Roederer M, Treister A, Moore W, Herzenberg LA. Probability binning comparison: A metric forquantitating univariate distribution differences. Cytometry. 2001 Sep 1;45(1):37-46.
4) Roederer M, Moore W, Treister A, Hardy RR, Herzenberg LA. Probability binning comparison: ametric for quantitating multivariate distribution differences. Cytometry. 2001 Sep 1;45(1):47-55.
5) Roederer M, Hardy RR. Frequency difference gating: A multivariate method for identifying subsetsthat differ between samples. Cytometry. 2001 Sep 1;45(1):56-64.
6) Cox C, Reeder JE, Robinson RD, Suppes SB, Wheeless LL. Comparison of frequency distributionsin flow cytometry. Cytometry. 1988 Jul;9(4):291-8.
Population Comparison
•
Table of Contents
FlowJo Population Comparison Platforms 80

Multi-sample Population ComparisonIn FlowJo, the Multi-sample Comparison platform is used to compare single or multiple parametersfrom a test sample to a composite of more than one control sample.
For example, in comparing multiple samples against each other, it is sometimes not possible (ormeaningful) to assign a single sample as the control, against which all others are to be compared. Insuch a case, the Multi-sample Comparison platform can concatenate all of the control samples inorder to use the average of all the control samples for comparison. This process mitigates the potentialartifact introduces by selection of a sample as control that is actually significantly different than theexpected control sample.
Determining the samples to be concatenated is best approached by an iterative process. One canconcatenate all the control samples and compute the distances of each control sample to the averageof all of them. Thus, those control samples which are outliers can be removed from the control set.Caution is warranted since reduction of the number of samples entered as controls can lead tosampling bias.
Start by selecting the Multi-sample Comparison Platform from the Platforms menu. Note that thisplatform does not associate with a particular population.
Drag two or more samples (or subsets of the same sample) to the right side of the platform into thePopulations and Statistics box.
Multi-sample Population Comparison 81
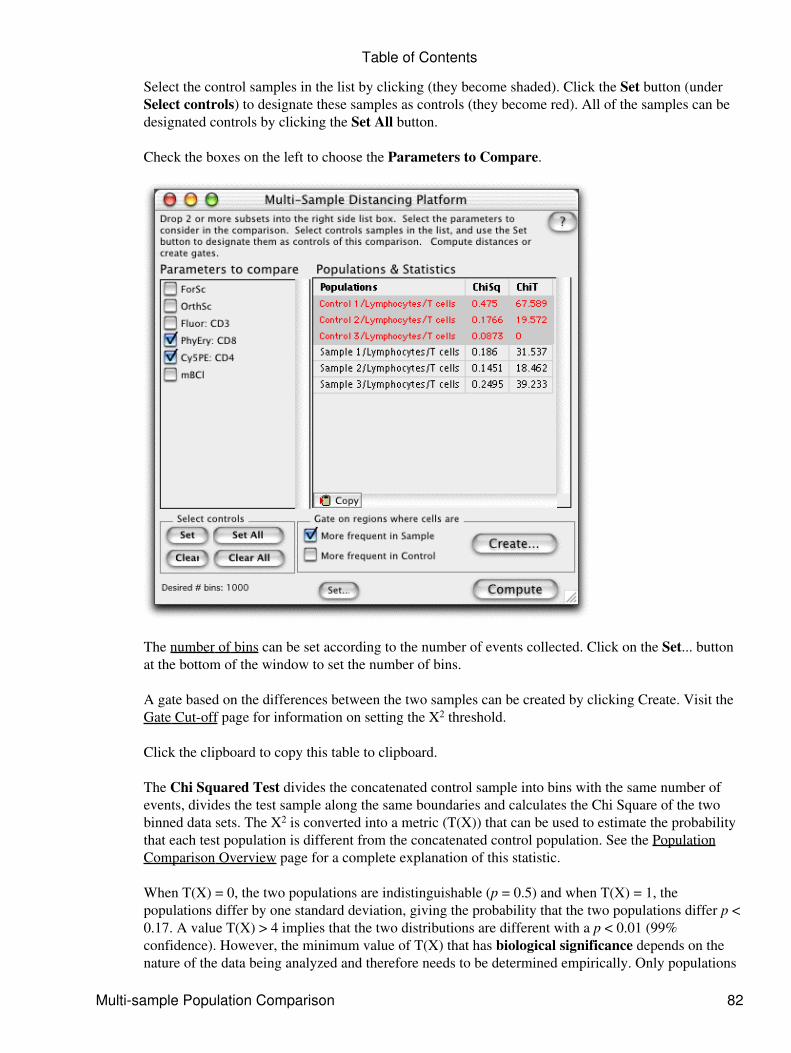
Select the control samples in the list by clicking (they become shaded). Click the Set button (underSelect controls) to designate these samples as controls (they become red). All of the samples can bedesignated controls by clicking the Set All button.
Check the boxes on the left to choose the Parameters to Compare.
The number of bins can be set according to the number of events collected. Click on the Set... buttonat the bottom of the window to set the number of bins.
A gate based on the differences between the two samples can be created by clicking Create. Visit theGate Cut-off page for information on setting the X2 threshold.
Click the clipboard to copy this table to clipboard.
The Chi Squared Test divides the concatenated control sample into bins with the same number ofevents, divides the test sample along the same boundaries and calculates the Chi Square of the twobinned data sets. The X2 is converted into a metric (T(X)) that can be used to estimate the probabilitythat each test population is different from the concatenated control population. See the PopulationComparison Overview page for a complete explanation of this statistic.
When T(X) = 0, the two populations are indistinguishable (p = 0.5) and when T(X) = 1, thepopulations differ by one standard deviation, giving the probability that the two populations differ p <0.17. A value T(X) > 4 implies that the two distributions are different with a p < 0.01 (99%confidence). However, the minimum value of T(X) that has biological significance depends on thenature of the data being analyzed and therefore needs to be determined empirically. Only populations
Table of Contents
Multi-sample Population Comparison 82

which have T(X) values larger than this empirical minimum can be considered to be different.
Several populations can be compared in order to determine the minimum T(X) value. Machinestability during the collection, as well as inherent variability in the FACS data are just two reasonswhy the comparison of a population to itself can give a T(X) > 0. You can compare the same samplecollected twice. Collecting one sample at the beginning and one sample end of the collection processbest determines the machine stability. Or compare several different samples that have been treatedwith the same stimulation.
The number of bins that the test and control sample are divided into should be maximized to mosteasily detect small differences between populations; however, the number of bins can become limitingfor this statistic (depending on the number of events collected and the number of parameterscompared). Therefore, a reasonable number of bins is roughly 10% of the event count - leading to aminimum of about 10 events per bin.
As the number of parameters being compared increases, then more events may need to be collected inorder to distinguish subtle variations in the populations. However, inclusion of parameters in thecomparison which Do Not vary between populations does not degrade the ability to distinguish thepopulations.
Note that the computations in the Multi-sample Population Comparison platform are memoryintensive. You may need to allocate more memory to FlowJo (more information on memoryrequirements).
Multiple Sample Comparison
•
Table of Contents
Multi-sample Population Comparison 83

Clustering
A Highly Efficient Algorithm for Cluster Analysis
Introduction
In flow cytometry, clustering can be used to automatically identify subsets of cells. Clustering is theprocess of automatically identifying subsets of events in a data collection with similar characteristic.Previously, no satisfactory clustering algorithm existed to handle immunophenotyping data becausemost cluster algorithms are computationally expensive, they don't take into account "domain-specific"knowledge, or that a given "distance" for one region of multidimensional space is more or lessimportant than the same "distance" in a different region.
The novel approach to clustering flow data implemented in FlowJo Version 4 was developed by Dr.Mario Roederer. For more information about this cluster algorithm, please contact us. Note that thisalgorithm is under development and is intended to be used as an exploratory tool. There is noguarantee that the subsets of cells identified by this algorithm necessarily correspond to meaningfulbiological subpopulations.
General Approach
Algorithmic operations that normally work on an event-by-event basis (such as distancing orsimilarity operations during cluster joining) can be significantly accelerated by working on a group ofcells at a time. In this cluster algorithm, similar events in the dataset are grouped together and thesegroups could then serve as a surrogate for individual cells. The Probability Binning Algorithm (ref.1-3) developed for the statistical comparison of samples of flow data (Population ComparisonPlatforms) laid the foundation for this approach. Probability Binning uses adaptive binning to groupevents together into "bins"; statistical operations are performed on the bins rather than on individualevents.
The algorithm functions in two primary stages. In the first stage, adaptive binning is used to divide theevents into hyperrectangular bins. This process is critical to the success of the algorithm: sufficientdivision must be done so as to ensure separation of distinct populations, but not so much as to obviatethe computation gain of collecting similar events into single bins. In the second stage, bins are joinedto create clusters. Clusters are joined only if they are immediately adjacent to each other and if joiningwould not significantly change the distribution of any parameter involved in the clustering. The use ofadjacency as a prerequisite for clustering shows that binning should not be so aggressive as to"orphan" events of the same cluster simply because an empty bin was created between them!
How do I cluster my data?
Click once to select the sample or subset you wish to cluster in the Workspace window. Under thePlatforms menu - choose Clustering. This will open the clustering platform (similar to the windowbelow).
Step 1 - Select which fluorescence or scatter parameters to use for clustering♦
Clustering 84

Step 2 - Select cluster parameters (try with the default options first)♦ Step 3 - Create the clusters♦ Step 4 - Join the clusters (if desired)♦ Step 5 - Create gates (click to select clusters first)♦
Generally, to begin with, you should create gates for the major populations. You can click on anycluster's name and rename it (once a gate has been created for that cluster); it will be renamed in theworkspace as well. In the table of clusters an asterisk (*) in the gated column means that that clusterhas been created and can be shown. Double click in the "show" column to show or hide thatpopulation (the asterisk in the show column indicates if the population is shown). You can select anysingle cluster and change it's color from the color box. You can resize the table vs. the graphs byclicking on the vertical bar between the two and dragging. The table shows approximate expression ofeach parameter for each cluster, ranging from "-" to "++++", where each step corresponds to 20% ofthe range of the parameter (i.e., the parameter is divided into 5 equal size parts; if the cluster is in thefirst part it is assigned a "-", if it's in the third pard (middle), it's given a "++", etc).
Table of Contents
Introduction 85

Note: Once clusters have been created, you can unselect any of the histogram parameters to removethem from the view, or select and unselected parameters to add them to the view. In other words,when you first cluster, the selected parameters control the clustering. Once clustering is done,however, you can view graphs for any combination of parameters (whether or not they were used inthe clustering).
Click here for a play-by-play of the clustering process.
View a detailed description of the clustering algorithm parameters.
1) Roederer M, Treister A, Moore W, Herzenberg LA. Probability binning comparison: A metric forquantitating univariate distribution differences. Cytometry. 2001 Sep 1;45(1):37-46.
2) Roederer M, Moore W, Treister A, Hardy RR, Herzenberg LA. Probability binning comparison: ametric for quantitating multivariate distribution differences. Cytometry. 2001 Sep 1;45(1):47-55.
3) Roederer M, Hardy RR. Frequency difference gating: A multivariate method for identifyingsubsets that differ between samples. Cytometry. 2001 Sep 1;45(1):56-64.
Clustering
•
Table of Contents
Introduction 86

MultiGraph OverlayFlowJo can display multiple subpopulations of a single sample overlayed on one for visualcomparison. Overlayed subpopulations are distinguished by color - the color of a subset allows easyassessment of its characteristics on multiple plots. In addition to being able to display previouslygated subsets of cells in overlay plots, you can start with an ungated sample and create gates directlyin the MultiGraph Overlay platform itself.
Click once in the Workspace window on the sample you wish to analyze. Choose MultiGraphOverlay from the Platform menu. This brings up a window similar to the one below.
Graphical Display
MultiGraph Overlay 87

From the Configure Graphs pulldown there are various choices (SEE graphic at right) for laying outgraph sets.
With one click you can open a variety of graph setups. For example, Fluorescence Y by Y(-Histograms) opens a group of graphs showing each possible combination of two Y axisfluorescence parameters but does not include a graph of their histograms overlaid. All Y by Y(+Histograms) displays a group of graphs showing all bivariate combinations of Y axis parametersplus a graph with all their histograms overlaid.
If you wish to customize the display you can:
-Add graphs (click the Add Graphs button)-Delete graphs (click on the graph and choose delete from the popup menu)-Change graph axes (click on the axis label)-Move graph to end or beginning (click on the graph and choose from popup menu)-Display a fraction of the events (change the percentage in the box at the top right)-Change the color of the selected subpopulation or of the background of all plots
Save the customized display by choosing Name and save this setup from the Configure graphspulldown menu. Saved setups will appear at the bottom of the Configure graphs pulldown menu.
Subpopulation names. The names of the gated subpopulations are displayed in the middle box of theMultiGraph Overlay window. These subpopulations can be sorted by clicking the Sort button (FlowJowill sort the subsets in a hierarchical manner with the subset containing the most events at the top ofthe list). In addition, you can highlight a selected subpopulation by checking the Highlight selectedbox.
Table of Contents
Graphical Display 88

Creating gates on a MultiGraph Overlay. Select a population from the list where you wish to createa gate (top center of the MultiGraph Overlay window). Click on a gating tool and create a gate in agraph window. The cells that fall in the gates subpopulation are displayed in color on all the graphs.Each subpopulation you create is displayed in the Workspace window under the sample name.
Overlaying previously gated subsets. You can also drag and drop a gated subpopulation node fromthe Workspace menu to the MultiGraph Overlay list. The cells that fall within this gate are now
Table of Contents
Graphical Display 89

displayed in a different color.
Overlay Graphs
•
Table of Contents
Graphical Display 90

Background GatingNearly every flow cytometric experiment requires the discrimination of cells that exhibit fluorescencesignal from those that do not. For many experiments, this is relatively straightforward, for example,when the signal is well-separated from negative cells. However, discrimination is not so easy whenthe signal is low, when the positive population does not separate well from the negative. In addition,in the multicolor world, sensitivity is often highly compromised by the post-compensation spread inautofluorescence distributions (see Compensation An Informal Perspective by Mario Roederer).
An accurate way to identify positive events is the use of an "FMO" control (Fluorescence MinusOne). This is a sample that has been stained with every reagent except for the one of interest; thedifference between the FMO control and the test sample identifies positive events. In multicolorexperiments, compensation-caused spreading in the distribution can be calibrated by using beadssingly labeled with each fluorochrome (akin to the process of assessing fluorescence spillover usingcompensation controls). In FlowJo, the Background Gating Platform uses the beads to compute anevent-by-event background for each parameter, providing a way to discriminate positive events fromthose that look positive because of compensation caused spreading.
Multicolor background gates are best for identifying positive events. The negative populations willalways contain a mixture of positive and negative events because of the inescapable overlap indistributions.
Procedure: In order to calculate the background, you need to compensate your data in FlowJo.Compensation begins by selecting the Platform > Compensate Sample... > Define Matrix menuitem. This opens the Compensation Definitions dialog box shown on the right. Click on the RecordBackground Gating Data button shown on the right with a red arrow. The calculation of backgroundworks best with single color compensation beads, but can be done with stained cells.
Background Gating 91
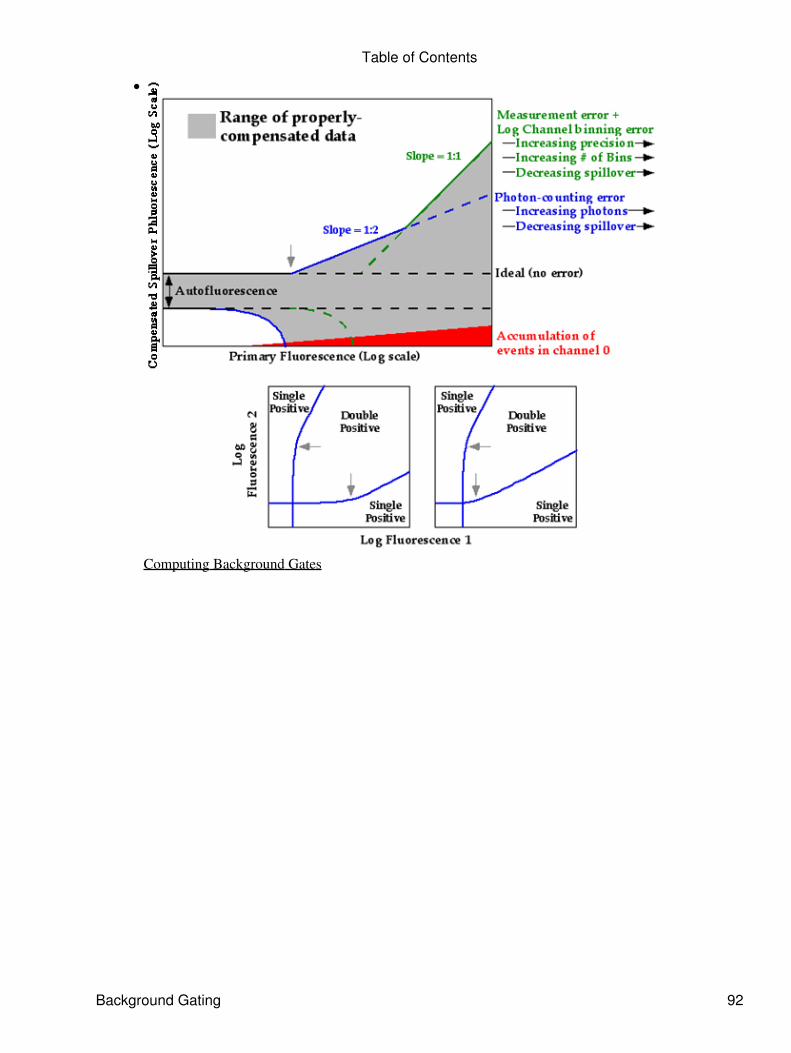
Computing Background Gates
•
Table of Contents
Background Gating 92

Display Transformation OverviewFlowJo offers a useful technique called Transformation for visualizing compensated data withoutproducing artifactual peaks or having cells squished against the axes.
Why change the display of your data?
When data is properly compensated, it is common that a large number of cells are displayed squishedagainst the axis. The cells become piled up in the first channel (against the axis) because thefluorescence parameters are displayed on a log scale where it is not possible to display "zero" ornegative values. The spreading of a population into negative compensated data values is the result ofstatistical error in measurement that is inherent in the data collected on flow cytometers. Even thoughthe measurement error is the same in uncompensated samples, the variation becomes obvious when acompensated population has a low mean and therefore appears in the low regions of the log scale.This is because log scales expand the view of data in the lower regions (first decade) and compressthe view of data in the upper regions (fourth decade). Click here for more details. FlowJo's displaytransformation displays your data on an altered scale that has a zero and a negative region. Note thatthe data is exactly the same, but FlowJo's display transform allows you to view the negativepopulations as nice symmetrical clusters instead of squished against the axis.
The four data plots in the figure below all show the same data. On the left two plots, the data isdisplayed using 5% contour plots with outliers; on the right, pseudocolor plots. All the plots show thedata properly compensated. The median PE fluorescence is shown as the horizontal line on each plot .The top plots are the normal display and there are a large number of cells against the x-axis. It isworth noting that the cells against the axis are much more obvious on the contour plot.
The plots at the bottom have the display transformation applied. The cells that were squished againstthe axis on the top plots are now off of the axis and are shown as clusters of cells and it is now clearthat the data is properly compensated. The B220 positive cell population spreads in both directions asthe fluorescein fluorescence increases.
Display Transformation Overview 93

Digital Linear Data can also be transformed to provide a more interpretable view instead of the"picket fences" that occur at the low end of 5+ decade log scales. Click here for more information.
Display transformation
Having FlowJo transform the display of your data is straightforward. After the data files have beencompensated using FlowJo, select a fully-stained sample (one with some signal in all fluorescenceparameters) and gate it to remove dead or unwanted cells. Select this gated population and thenchoose "Define Transformation..." from the Compensation menu. A custom transformation iscomputed based on the distribution of the data in the selected population, which results in a bettervisualization of your data. Click here for a more detailed description of this procedure.
NOTE: this enacts a change in display and not in your data. The compensated fluorescence values foreach cell are EXACTLY THE SAME as before the transformation. The display is changed, but NOTthe data. Statistics computed on a particular set of cells will be the same. The new display just makesit easier to identify correct population boundaries.
Table of Contents
Why change the display of your data? 94

Transformation Method
The display transformation process is based on a method developed by Dave Parks and Wayne Mooreat Stanford University using a generalization of the hyperbolic sine function. The display functionsapproach true log for high data values and approach true linear around zero. This provides smooth,near-linear display of low and negative data values.
Notes
The transformation can be used on any compensated data--but FlowJo needs to be the one tocompensate the data. Therefore, it can be done on any data where you collect the comp controls andcreate the compensation matrix, or, alternatively, on any data files which specify their own compmatrix (currently, only BD DiVa files do this correctly).
The transformation is applied to every sample that is compensated with that compensation matrixhenceforth. Therefore, if you have previously compensated data files in the workspace, thetransformation will not be applied to them--UNTIL you save & close the workspace and then re-openit (at that point, all compensated files will get the transformation).
If you change the definition of a transformation for any given matrix (by selecting a differentpopulation from the original one and applying Define Transformation to it), the new transformationwill automatically be applied to all samples that had the original transformation.
BiExponential Transformation Visualize compensated data without cells squished against the axis anddigital data without picket fences.
•
Table of Contents
Display transformation 95

FlowJo MenusThese are pictures of the main menus in FlowJo for Macintosh. Click on a menu item in the graphics to readabout each of the choices in the menu.
Some menu items change when you hold down the option key (click here for more tricks that use the optionkey.) You can select a menu in FlowJo and press the option key to see the changes in the menu items. Bothchoices are explained below using a slash... Menu Item/Menu plus Option Key
FlowJo Menu
About FlowJo
Contains information about the current version of the program and license protection (serial number ordongle).
Serial Number...
Dialog box showing your Hardware Address and providing a place to enter your serial number. There is alink to TreeStar web pages for registering your hardware address in order to obtain a serial number or toobtain a temporary trial serial number.
Start / Stop Monitoring Tasks
There are many operations involved in creating complex analyses. They are scheduled to take place in thebackground, and not tie up the computer while you want to work. These monitor windows show you if there iswork on the queue, and how much longer it will take. Use this menu item to show or hide the monitorwindows.
FlowJo Menus 96

Preferences...
Set a variety of default program behaviors. Brings up the Preferences dialog window.
Services...
General Macintosh services.
Hide FlowJo...
Hides FlowJo windows.
Hide Others...
Hides windows from other open programs.
Show All...
Shows windows from all open programs.
Quit FlowJo...
Quits the program.
File Menu
New Workspace
Opens a new, empty workspace.
Open/Recover Workspace...
Table of Contents
FlowJo Menu 97

Open an existing workspace. Use the Macintosh standard file open dialog to select a workspace that you havepreviously created. In the unlikely event the Workspace won't open, use the the option key to reveal theRecover Workspace command.
Open Recent
Select from a list of the last ten Workspace files you have saved.
Close/Close All Graphs
Close the current window. If you close the workspace window, FlowJo will confirm whether or not to saveany changes you have made. If you hold down the option key and a graph window is front-most, then FlowJowill close all open graph windows.
Save
Save the current workspace. If it has never been saved before, FlowJo will prompt you for a filename anddirectory location.
Save as...
Save the current workspace with a different file name.
Save as Template...
Saves a version of the current workspace with all of the samples removed, so that it is easy to repeat the sameanalysis simply by adding new samples to the preconfigured template.
Save as XML...
Saves a Workspace in XML format. This will reopen in FlowJo for Mac or PC. Layout information is lostwhen opening on PC. Must also be moved with the XML file.
Revert
Discard all of the changes you have made to this workspace since saving it and reopen the last-saved versionof the workspace.
Open/Recover Remote Workspace...
Enter the URL to download a Workspace file on another computer. Save the URL as a favorite. Option keylets you Recover a remote workspace that doesn't want to open.
Save As Remote...
Give the current Workspace a name and save it to the URL of another computer.
Page Setup...
Define the characteristics of printing you will do from FlowJo, page size, scale, orientation etc..
Table of Contents
File Menu 98

Print...
Print the current window. See the page on Printing.
Quit
Quit FlowJo. If necessary, FlowJo will ask you to save any changes to current workspaces.
Edit Menu
Undo Zoom
Returns Layout Editor to !00% scale size.
Cut
When editing text fields, or working in the layout editor, removes selected text or items and places them onthe clipboard.
Copy With/Without Gates
Copy (+ Ancestors)
Used to duplicate items in the layout editor, or to export graphs from a graph window. If the current graph is ahistogram, then a second item is also placed on the clipboard: the columnar histogram data in text mode,which you can paste into a spreadsheet. Also see the page on copying graphics to other programs. Gates ofsubpopulations are included by default, excluded if you press the Option key.
Pressing the Control key will include the graphs of the current population's ancestors. When you paste, all thegraphs are pasted. As above you will see Copy (+Ancestors) in the Edit menu.
Copy with gates (Cmd-Option-C)
This is a keyboard variation on the Copy command that also copies the selected population and its child gatesto the clipboard.
Table of Contents
File Menu 99
Copy Samples as Text
This is another variation on the Copy command that uses the clipboard to export a textual description of theselected populations and statistics. Useful for taking the sample list out to a word processor.
Paste
Used to duplicate items in the layout editor, to add text to a layout or when editing text fields. Inserts thecontents of the clipboard into the active selection.
Clear
Currently disabled, except when editing text fields.
Select All/ Equivalent Nodes
Select all items in the current window, for example, all samples in the workspace window, all gates in thegraph window, or all items in the layout view. With the Option key down, Select Equivalent Nodes selects alldata entries that occupy the same place in the gating hierarchy. This way you can quickly select, for example,all of the CD4 gates for all samples. The keyboard command for this type of selection is Option-Command-A.This may be a useful prelude to opening all of those graphs (select them all, then double click on one ofthem).
Select every....
Selects every other, third, fourth, fifth sample etc. based on the value chosen from the popup menu. This canbe useful with regular protocols where, for example, every fourth tube is stained with the same reagent. Beingable to select by interval is convenient for dragging several regularly spaced samples to a group.
Disable Tinting
You can choose to have new gates tinted by default in Preferences. Quickly remove the tint on a gate with thismenu item. Handy if third party software renders the gates opaque after printing or pasting.
Workspace menu
Table of Contents
File Menu 100
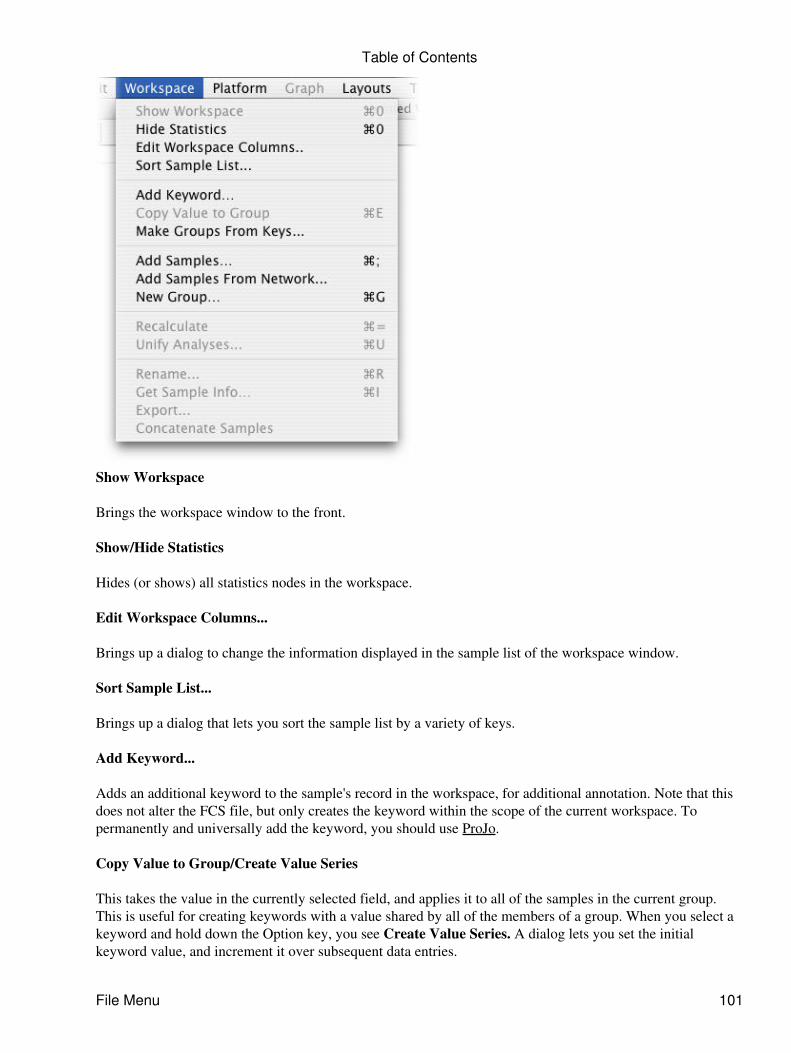
Show Workspace
Brings the workspace window to the front.
Show/Hide Statistics
Hides (or shows) all statistics nodes in the workspace.
Edit Workspace Columns...
Brings up a dialog to change the information displayed in the sample list of the workspace window.
Sort Sample List...
Brings up a dialog that lets you sort the sample list by a variety of keys.
Add Keyword...
Adds an additional keyword to the sample's record in the workspace, for additional annotation. Note that thisdoes not alter the FCS file, but only creates the keyword within the scope of the current workspace. Topermanently and universally add the keyword, you should use ProJo.
Copy Value to Group/Create Value Series
This takes the value in the currently selected field, and applies it to all of the samples in the current group.This is useful for creating keywords with a value shared by all of the members of a group. When you select akeyword and hold down the Option key, you see Create Value Series. A dialog lets you set the initialkeyword value, and increment it over subsequent data entries.
Table of Contents
File Menu 101

Make Groups From Keys... /Groups From All Values
Opens a dialog to choose a keyword as the basis for a new Workspace group. You can give the new group itsown color and text style here too. Option key lets you make a group or groups that share a single value of akeyword.
Add Samples / Add Samples Into Group
Add FCS files to the current workspace. Option key lets you select a group and import new samples to it.
Add Samples From Network
Enter a URL and import samples from elsewhere.
New Group... /Put into new Group
Create a new grouping of samples. Brings up the Group Definition dialog. If you first select some samplesyou want to group then hold down the Option key, Put into new Group creates a group of those samples. Thesame results from the keyboard command Option-command-G.
Recalculate / Clear & Recalculate
This command asks FlowJo to compute all statistics and frequencies for the populations that are selected. Inaddition, all descendants of selected populations will also be recalculated. Clear & Recalculate ForcesFlowJo to recompute all statistics for all populations, whether or not they have previously been computed.Keyboard equivalent is Option-command-=
Unify Analyses
If you have modified a gate and decide later that it should be identical to the group's version, you can selectthe gate and choose the Unify Analyses option. Likewise, if you select a group then choose a gated populationwithin it, you can use Unify Analyses to apply this GROUP version of the gate to any samples whose gateshave been changed. Learn more about groups.
Rename
Use this command to rename whatever item you have selected in the workspace.
Get Sample Info
Opens a dialog with all the keyword information, compensation matrix, parameters and stains from the .fcsfile for a selected sample.
Export...
Export the data from one or more samples and gates as .fcs files or chose to export channel or scale values asan ascii (text) file. Learn more about exporting raw data.
Concatenate Samples
Table of Contents
File Menu 102

Combines the data from multiple samples into a single sample and saves it to disk as a .fcs file with the nameof your choice.
Platform menu
Compensate sample...
Define or apply a compensation matrix. This menu item has a submenu of Compensation processes. If a groupis currently selected, then all samples in that group are compensated; if a sample is selected, only that sampleis compensated.
MultiGraph Overlay...
Click once in the Workspace window to select the sample you wish to view as a MultiGraph Overlay.Choose MultiGraph Overlay from the Platform menu. Drag and drop a gated subpopulation node from theWorkspace menu or draw a new gate within the MultiGraph itself. Each addition to the MultiGraph appears ina contrasting color. More details here.
Kinetics Platform
Launch the Kinetics Platform to perform time-dependent analyses.
Cell Cycle Platform
Launch the Cell Cycle Platform to perform DNA analyses.
Proliferation Platform
Launch the Proliferation platform used in conjunction with cellular markers to study the rate of cellreplication.
Population Comparison Platform...
Launch the Population Comparison platform to quantitate and graph the difference between two different
Table of Contents
File Menu 103
population distributions. The comparison utility has options for both univariate and multivariate comparisons.
Multi-sample Compare...
Perform a comparison between two or more different samples, ordering them based on an increasingdifference from one sample or a composite of control samples. Creates graphs and statistical displays.
Cluster...
Clustering is the process of automatically identifying within a data collection subsets of events with similarcharacteristics.
Derive Parameters...
Derive new computed parameters or copy the derived parameters from a sample to other samples. You canonly add derived parameters to a single sample; you can only copy derived parameters from a single samplethat has them defined. From this menu item you can also delete unwanted derived parameters.
Define Calibration...
Launches the Calibration platform that you can use to convert between the fluorescence intensity collected onyour instrument and absolute numbers of fluorophores.
Create Background Gate...
Boolean Gates...
Select a parent population, specify subpopulations upon which to apply And - Or - And not - Or not... thegated populations appear in the Workspace list.
Graph menu
Table of Contents
File Menu 104

Graph Type
A hierarchical menu, from which you can select one of the following six graph types to apply to the currentgraph. By holding down the option key you can change all open graphs to the new graph type.
The following are the types you can select:
...Contour Plot
Makes the current graph a probability contour plot. (Holding down Option while selecting this item causes allgraphs that are currently open into contour plots).
...Density Plot
Makes the current graph a density plot. (Holding down Option while selecting this item causes all graphs thatare currently open into density plot graphs).
...Zebra Plot
Makes the current graph a Zebra plot. (Holding down Option while selecting this item causes all graphs thatare currently open into zebra plot graphs).
...Pseudo-color Plot
Makes the current graph a pseudo-color plot. (Holding down Option while selecting this item causes allgraphs that are currently open into pseudo-color plot graphs).
Table of Contents
File Menu 105

...Dot Plot
Makes the current graph a dot plot. (Holding down Option while selecting this item causes all graphs that arecurrently open into dot plot graphs).
...Histogram
Makes the current graph a histogram of whatever parameter is on the X axis.
...CDF
Makes the current graph a CDF (cumulative display function) of whatever parameter is on the X axis. A CDFis the integral of a histogram.
Graph options
A hierarchical menu, from which you can select one of the following five options to apply to the currentgraph. By holding down the option key, the type will be changed for all graph windows that are currentlyopen.
The following options can be selected:
...Contour Levels...
For a contour plot, select the frequency of levels that are displayed. A submenu offers several probabilitysettings.
...Smooth
When selected, the appearance of the graph is smoothed. Effects only contour, density, and histogram plots,does not effect underlying data.
...Show Outliers
Draws dots for all events outside of the outermost contour in contour or density plots.
...High Resolution
When on, graph is calculated at higher resolution. Requires more compute time; affects only contour, density,pseudo-color, and histogram plots.
...Invert
Reverse the color of the current plot.
Transpose axes
Switch the X and Y axes of the current plot.
Open new window
Table of Contents
File Menu 106

Opens a copy of the currently selected graph or if none is selected, a copy of the most recently selected graph.
Show defining gate
When the graph of a subpopulation is selected, this opens a graph window showing the parent population,with the gate that created the subpopulation.
Backgate Analysis...
Displays a series of graphs showing the gating history of a subpopulation that has been gated more than once.The final subpopulation is highlighted in each graph.
PolyVariate Plot...
Opens the controls to create a graph with multiple parameters. By adjusting these controls, subpopulations canbe separated visually.
Manually enter gate...
Brings up a dialog allowing you to specify a new gate in terms of channels, absolute fluorescence, orpercentile within a distribution.
Show Histograms...
Display a histogram of every channel in the current sample for the events shown in the current plot. This is aMultiGraph Overlay, so you can gate on these graphs or drag subpopulations from the workspace to add tothese graphs. Each graph will display each subpopulation in a contrasting color.
Open other samples...
Opens the equivalent graph of the same population for every other sample in the current group. If thewindows are already open, then it changes the graph in that window to appear identical to the one you arelooking at. If you hold down the option key while selecting this item, FlowJo will not ask you to confirm theoperation.
Change other graphs...
Changes every other open graph to look like the one you are examining (i.e., FlowJo attempts to set the axesto the same channels, and the graph type and options identical to the current plot). If you hold down the optionkey while selecting this item, FlowJo will not ask you to confirm the operation.
Next Sample
Finds the next sample in the workspace sample list which has exactly the same gate as the current graph, anddisplays it in the current window. By holding down the option key, all open graphs will cycle in this waysimultaneously. Same as Right Arrow button in the Graph window.
Previous Sample
Finds the previous sample in the workspace sample list which has exactly the same gate as the current graph,and displays it in the current window. By holding down the option key, all open graphs will cycle in this way
Table of Contents
File Menu 107

simultaneously. Same as Left Arrow button in the Graph window.
Parent Population
When the graph of a subpopulation is selected, this opens a graph window showing the parent population,with the gate that created the subpopulation.
Child Population
Within a graph window with one or more gates, this command opens a graph of the currently selected gate. Ifmore than one gate is selected, the most recently selected is opened.
Shrink Gate
Decreases the area of a selected gate by small increments.
Expand Gate
Increases the area of a selected gate by small increments.
Make Movie...
Turn the current graph into a QuickTime movie, using either time or another parameter to control the displayof the current population. See the Movie platform for more information.
Copy Table...
Copies tabulated information from within Cell Cycle and Kinetics platform windows. The table is copied ontothe clipboard, from which it can be pasted into any spreadsheet or word processor application.
[Top]
Layouts menu
Table of Contents
File Menu 108

Layout Editor...
Opens the Layout editor.
Make Batch Layout
Takes the current graphic analysis in the Layout editor and reproduces it in the layout based upon each samplein the current group.
Iteration Options.
Brings up the dialog box allowing you to change the iteration variable, to support complex multi-samplereports. More information is available in the Layouts section.
Save Layout Settings/Save Settings as Default
Stores a copy of your layout's tiling settings so that future layouts made with this template will default to thesame settings. This command is only enabled for the Print Preview Window.With the Option key down, SaveSettings as Default takes the current layout settings and makes them the default used when new layouts arecreated.
Get Item Info.
Table of Contents
File Menu 109

Brings up the dialog to edit the attributes of any selected object in the layout. This may be line weights andcolors of an arrow or box, or the axes or smoothing algorithm in a graph.
Open Original Graph
With a graph selected in the Layout Editor window, this item opens a Graph window with the same datadisplayed.
Bring To Front
Operates on the selected object(s) in the layout. Causes it to be drawn on top of other items.
Move Up
Operates on the selected object(s) in the layout. Moves the selected items one step higher in the layer order.
Move Down
Operates on the selected object(s) in the layout. Moves the selected items one step lower in the layer order.
Send To Back
Operates on the selected object(s) in the layout. Moves the selected items to the back of the layer order,causing others to be drawn on top these.
Insert Picture...
Provides a dialog box for you to select a file in PICT format to be displayed in the current layout. Conversionof graphics formats GIF, TIFF, or JPEG requires either QuickTime, Clip2Gif or other plug-in translator.
Group
Multiple objects can be grouped so that they can repositioned, duplicated or deleted all at once. Select two ormore items and invoke the Group command and they can be handled as a single object.
Ungroup
Devides a group into individual items again.
Put into Grid / Ungrid
Grids are an advanced form of groups which also determine the positioning and size of objects. As a grid isresized, the spacing and sizing of the elements behaves consistently across all of the cells in the grid. More ongrids.
Get Grid Info...
Use Get Grid Info... to adjust the attributes of a grid. If a grid is currently selected, the Get Item Info...command will set the attributes of the contents of the selected cell.
Transpose Grid
Table of Contents
File Menu 110

The Transpose Grid command changes the number of rows to the number of columns and the number ofcolumns to the number of rows. So a 3 column by 2 row grid becomes a 2 column by 3 row grid. Items are notmoved among cells, but if the cell moves, the content moves with it. More at Grids.
Zoom In
Increases the magnification level, so that objects are drawn larger. More controls of the layout's magnificationare found in the bottom right corner of the Layout window.
Zoom Out
Decreases the magnification level, so that objects are drawn smaller. Magnification levels range from twicenormal size to one eighth of normal size. More controls of the layout's magnification are found in the bottomright corner of the layout window.
Align.
Invokes the custom alignment dialog, which will facilitate building publication quality layouts. TheAlignment commands are not enabled unless two or more items are currently selected in the layout. Manyalignment and distribution options are available, including the relationship of objects to a grid, and thealignment of the axes of multiple graphs.
Align Horizontal
This item shows the submenu which contains the commands for four different ways of aligning the horizontalcomponent of a set of layout options: by left edge, by right edge, by the center, or such that centers areequidistantly distributed between the leftmost and rightmost objects' current positions.
Align Vertical
Holds the submenu which contains four alignment commands governing the vertical component of a set oflayout options: by top edge, by bottom edge, by the vertical center, or such that centers are spaced evenly topto bottom.
[Top]
Table of Contents
File Menu 111
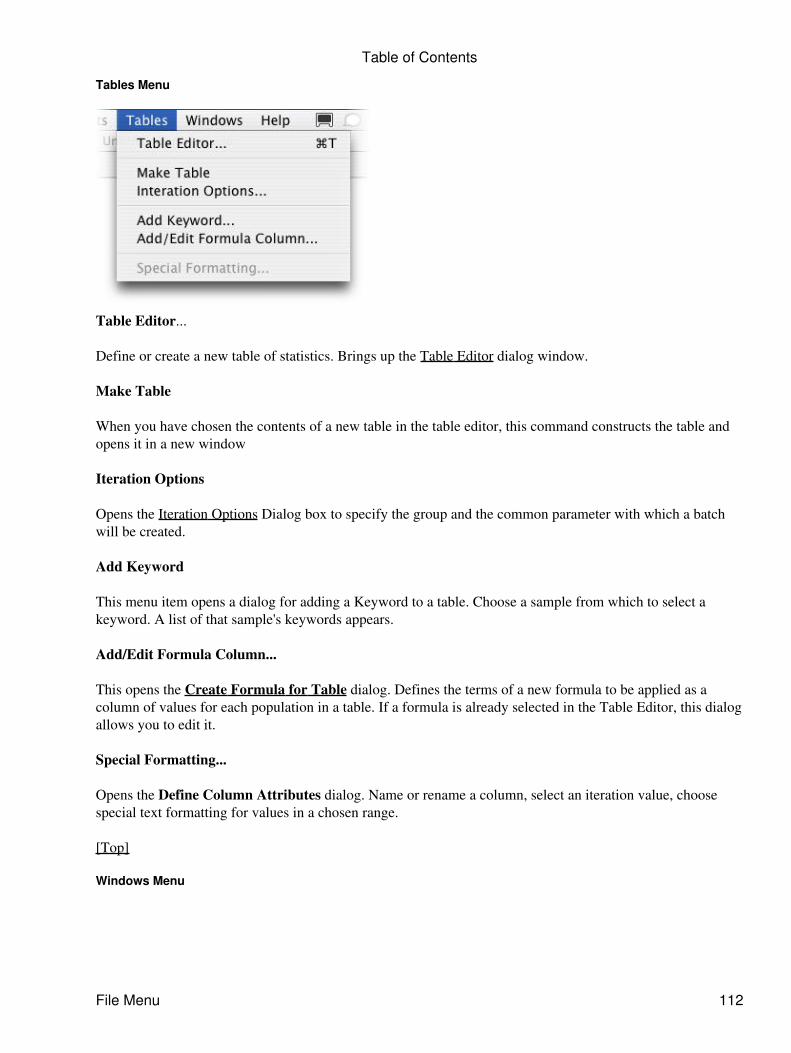
Tables Menu
Table Editor...
Define or create a new table of statistics. Brings up the Table Editor dialog window.
Make Table
When you have chosen the contents of a new table in the table editor, this command constructs the table andopens it in a new window
Iteration Options
Opens the Iteration Options Dialog box to specify the group and the common parameter with which a batchwill be created.
Add Keyword
This menu item opens a dialog for adding a Keyword to a table. Choose a sample from which to select akeyword. A list of that sample's keywords appears.
Add/Edit Formula Column...
This opens the Create Formula for Table dialog. Defines the terms of a new formula to be applied as acolumn of values for each population in a table. If a formula is already selected in the Table Editor, this dialogallows you to edit it.
Special Formatting...
Opens the Define Column Attributes dialog. Name or rename a column, select an iteration value, choosespecial text formatting for values in a chosen range.
[Top]
Windows Menu
Table of Contents
File Menu 112

Table Editor...
Define or create a new table of statistics. Brings up the Table Editor dialog window.
Layout Editor...
Define or create a new layout for graphics presentation. Brings up the Layout Editor dialog window
Other Items In the Windows Menu
The names of each of your documents and work windows are added to this menu, each time a new window iscreated. This can be used as a navigation tool, to be able to bring you back to a desired window, after it hasbeen covered or obscured by other windows.
Help Menu
FlowJo Reference Manual
Launches a web browser with the main help pages.
New Features in This Version
Launches a web browser with the list of new features.
FlowJo Tutorials
Launches a web browser with links to download our tutorials.
Check for New Version
Launches a web browser with a link to the latest version download.
Table of Contents
File Menu 113

Contact FlowJo Support
Launches a web browser with links to the Bug Report Form and our contact details.
Menus
Table of Contents
File Menu 114
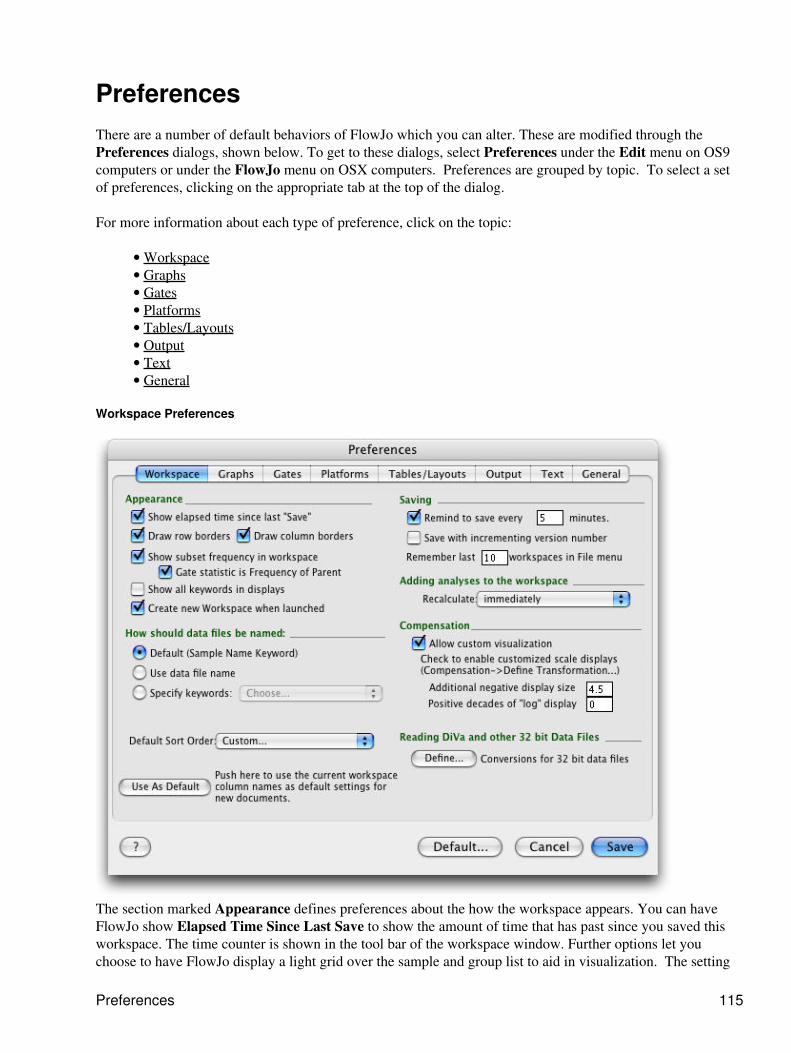
PreferencesThere are a number of default behaviors of FlowJo which you can alter. These are modified through thePreferences dialogs, shown below. To get to these dialogs, select Preferences under the Edit menu on OS9computers or under the FlowJo menu on OSX computers. Preferences are grouped by topic. To select a setof preferences, clicking on the appropriate tab at the top of the dialog.
For more information about each type of preference, click on the topic:
Workspace• Graphs• Gates• Platforms• Tables/Layouts• Output• Text• General•
Workspace Preferences
The section marked Appearance defines preferences about the how the workspace appears. You can haveFlowJo show Elapsed Time Since Last Save to show the amount of time that has past since you saved thisworkspace. The time counter is shown in the tool bar of the workspace window. Further options let youchoose to have FlowJo display a light grid over the sample and group list to aid in visualization. The setting
Preferences 115

Gate Statistic is Freq. of Parent allows you to specify that the percentage shown in the Statistic column ofthe workspace refers to the portion of the immediate parent population. Unchecked, the number will reflectthe portion of all cells in the sample tube. Create new Workspace when launched is checked by default.When FlowJo opens, it opens a new workspace window as well.
Just below, you can choose how FlowJo will display the data file names in the workspace window list. Whenyou choose to display the sample's file name from the Sample Name Keyword - FlowJo examines the FCSkeyword header information and uses the sample name keyword from the data file as the file name in theworkspace.
NOTE: Options chosen when acquiring your data can cause all the samples in the workspace to be namedidentically (i.e., each file name is missing the suffix .001, .002 etc.). To avoid this problem, choose the nextoption, Use Data File Name. This option displays the name as it is on the system disk (i.e. with the .001suffix) rather than using the internally-defined keyword.
An alternative file naming option is to Specify Keywords from the data file. For instance, displaying SampleID or Patient ID as the file name may aid in identifying your samples. Annotation such as Sample ID orPatient ID can be entered while acquiring your data or in FlowJo.
Define Sort Order lets you choose whether data will be sorted by sample name or acquisition date and time.If you want a different sort order, return to the workspace and select Sort... from the bar above the tubenames. There you can select multiple criteria from among the data stored in the fcs file, sorting first by$DATE then by $ETIM for example.
The final button in the section is to set the order and size of columns visible in the workspace. If you click onUse As Default, FlowJo records the columns & spacing that you have set in the current workspace, and usesthat for all new workspaces that you create.
The next option is to Remind to Save your work. By entering a non-zero value in the box, you instructFlowJo to remind you to save the workspace every few minutes. When this amount of time has elapsed,FlowJo puts up a dialog and lets you choose to save or not to save the workspace This dialog has a checkboxthat lets you specify to always use the same answer: if you check this box and click Yes, then FlowJo willautomatically save the workspace for you without interruption.
Save with Incrementing Version Number saves a new workspace every time FlowJo saves your work. Theworkspaces are named with incrementing version numbers (i.e., name.jo-1, name.jo-2 etc.) when the Alwaysuse the same answer box is checked upon the first save .
The popup menu for Adding Analyses to the Workspace controls how FlowJo causes recalculation of gates& statistics that are copied between subsets (or samples) to occur. Depending on how large your experimentis, it may become cumbersome to have FlowJo recalculate all populations affected by the action of dragging apopulation to a group or sample. This setting will permit you to postpone recalculation on some or all samplesto maintain the responsiveness of the program. The default behavior is to compute immediately (which maycause FlowJo to need to load the sample data). You can also choose to have the statistics computed onlywhen needed or only if sample loaded. The latter option will cause statistics to be computed only if thesample has already been read into memory (and still resides there). FlowJo will always compute the statisticsonce they are requested by the Table Editor or Layout Editor... this option is designed only to control thecalculation of statistics for display in the workspace window.
The next section relates to the Compensation Platform. Often, compensation causes data to be compressedonto the bottom or left axis in displays. This can be un-aesthetic... therefore you can choose to have FlowJo
Table of Contents
Workspace Preferences 116

transform data display to improve visualization of the data. The Allow custom visualization checkbox allowsyou to apply the custom transformation from the Compensation menu and to choose the default values for theAdditional Negative Display Size and the number of Positive Decades of "log" display.
The button at the bottom of this section, marked Define… goes to a separate dialog specifically for dealingwith the data generated by Becton Dickinson's digital Vantage (Diva) system. This 32 bit linear data does notfit the normal data standards used by other instruments, but FlowJo has special settings to read the DiVaacquisition files.
Top
Graph Preferences
The first section holds preferences that define how a graph window should look when you first open it.
The Graph type and other options are identical to those you can specify when you open the graph optionsdisclosure triangle on the graph itself. This will be the default graph type displayed whenever you open asample for the first time. To draw large dots, uncheck the High Resolution display option - these dots aretwice as large in each dimension, and will be easier to see on slides or publications.
Forward scatter on X by default when checked, specifies that FlowJo shows Side scatter vs. Forward scatterthe first time you open a sample's data, otherwise, it shows Forward vs. Side scatter.
The Graph Sets button opens a dialog where you can select parameters for the X and Y axes from the list ofavailable parameters in the workspace. FlowJo will open graphs showing the combinations of the parameters
Table of Contents
Graph Preferences 117

you chose that are available in a selected data sample. To open graphs displaying all available graphs of thechosen parameters, Contol-click a subpopulation.
Checking Use Scientific Notation for Log Axis labels will direct the program to draw axis labels as 100,101, 102, etc. If unchecked the labels would be drawn 1, 10, 100, etc.
Check Show uncompensated parameters in menus when you wish to have the option to display graphsusing either compensated or uncompensated data. Choose the uncompensated (without brackets) andcompensated (bracketed) parameters in the axes menu pulldown lists.
The Add event number parameter... option adds an additional parameter to the axes pulldown menus. Theevent number parameter allows you to display the cells on a plot in the order they were run through themachine. For instance, if you collect 10,000 events, and display the Event Number parameter on the X-axis,the first cell will be at the left edge of the graph and the 10,000th cell will be at the right edge of the graph.This is useful to display vs. another parameter such as scatter in order to determine if changes occurred duringcollection.
Next you can choose what will be included in the axis labels of Layout editor's graphs. Select parametername, stain name or both.
If you use Dot Plots (and in general, you shouldn't!), and you have more than 10,000 events in a file, you maywish to limit the number of dots drawn to speed up display or to keep it from "blacking out" completely. Thiscan either be an absolute number, or a percentage of the total number of events in the population. If you enter0 in this box, regardless of the radio buttons' settings, all of the events will be drawn.
If more than this percent of events is on the axis, FlowJo will open a warning dialog with an explanation orit will simply show a warning on the graph window. If you enter 100 in this box, the warnings will not bedisplayed.
Top
Gating Preferences
Table of Contents
Graph Preferences 118

The Gate Display section groups preferences together that determine the behavior of gates (line weight andgate color) and gated populations. Show gate frequencies on plots specifies that FlowJo should draw thefrequency (within the parent gated population) of any gate drawn on a graph. The frequency is drawn inpercent. The frequency is drawn on exported graphs whenever the gate is drawn, if this preference is selected.Show gate name on plots displays the gate name inside gate on the graph window. Position for annotationlets you choose where the identifying information for the gate will be displayed in relation to the gate itself.
Creating New Gates
When the Auto-select gating tool... option is checked, a polygon gate is started by simply clicking in thegraph window. If this option is unchecked, a gating tool must be chosen from the top of the graph windowbefore a gate will be drawn. Choose rectangle gate by default determines whether the polygon or rectangleis the default gating tool. Auto-set tinting for new gates if checked will draw the gates with a colored tint.Sometimes when exporting tinted gates, the color will become opaque and hide the data underneath the gate.Test with your presentation or graphics editing software. You can temporarily disable tinting for export orprinting by choosing Edit > Disable tinting from the main menu.
Display other parameters than in gating plot... The graph for the new population will either have the sameparameters as the graph on which you drew the gate; or, if the box is checked, FlowJo tries to intelligentlyselect a new pair of parameters to display. The Graph type to show is selected by the pop-up menu. Here youcan select that the new graph type is either (1) the same as the graph on which you drew the gate; (2) the sameas you specified in the Graphspreferences or (3) a blank graph. The latter is useful when you are workingwith enormous data files, where you would like to specify the graph before FlowJo takes the time to calculateit for you.
Table of Contents
Graph Preferences 119

Quad Gates
Show live quadrant statistics specifies that FlowJo should calculate quadrant statistics whenever thequadrant tool is selected. If unchecked, the statistics are not displayed in the graph window while you track aquadrant gate. Checking Always ask for Quadrant gate name prefix brings up a dialog every time youcreate a quad gate. This dialog asks for a prefix to attach to the quad gates - useful if you create multiple quadgates and want them to be listed together in the workspace window. Use Q#, where... puts Q1, Q2, Q3, asnames on successive gates. Include stain combination adds this information to the quad gate name. At leastone of these three boxes must be checked.
Finally, you can add a custom list of gate of Gate Names that you use frequently. If this list is defined, thegate name dialog will show a popup menu listing all of the names you have defined. You can either choose aname from this list or if you start typing the name of the population - FlowJo will automatically fill in the restof the name. This will facilitate more consistant naming conventions, and reduce redundant typing.
Top
Platform Preferences
Choosing Dragging to Layout... will cause a table of statistics pertinent to the analysis to be createdautomatically in the Layout Editor along with the usual graphic element.
Cell Cycle - here you can declare default preferences for Cell Cycle graphs. These parameters can be changedper graph by opening the Models disclosure triangle in the graph window. Statistics to Copy to Layouts is adrop-down list where you can check the names of statistics you wish to be present in a table when you drag
Table of Contents
Graph Preferences 120

the Cell Cycle icon from the Workspace into the Layout Editor. See the Dragging to Layout... item just above.
Cell Cycle and Proliferation these options, also available in the graph window, will be applied to the graphsof both platforms by default.
Proliferation - Statistics to Copy to Layouts is a drop-down list where you can check the names of statisticsyou wish to be present in a table when you drag the Proliferation icon from the Workspace into the LayoutEditor.
Backgating - These items control the appearance of the subpopulation in each of the parent graphs when youdisplay a backgate analysis graph group.
Top
Tables/Layouts Preferences
Within the Layout Editor section, you can choose the default format of batch layouts. The choices includeBatch Layout, Tiled Report, Web Report, QuickTime Movie or Print Directly. You can learn more about theoptions here.
Next you can choose how many panels (copies of your layout with new data) you want FlowJo to arrange oneach page during batching of the layout. This will control how the batched layout will look when it is printed.Just below that, tell FlowJo the number of columns in which to display your batch. Then choose defaultforeground and background colors for new graphs. If you chek the Use Placeholders box, you will see asimple outline with a diagonal x in place of the actual graphs in the layout.
Table of Contents
Graph Preferences 121

The check boxes in the section Use Layout Annotation determine which information is included in theannotation of a graph added to a layout. The title, sample name, population, path, frequency and count caneach be individually included in the annotation.
Options - Within the layout editor, double clicking on most items, or choosing the Get Info… command fromthe menu will edit that item's specific attributes. If multiple items are selected, then a Multiple item settingswindow comes up which contains all of the settings available. Setting the check box Get Info always usesMultiple Items Settings dialog will cause the larger dialog to be shown all the time. The checkbox DrawBorder determines whether a line is drawn around the text boxes by default.
Table Editor - contains only options specific to the Table Editor. Tables can optionally show summarystatistics as additional rows in the output tables. If this is checked, additional rows for mean and standarddeviation will be appended to the table. If the summary statistics are showing, values in the table will also behighlighted. If the value is greater than one standard deviation from the mean, it will be bold and italicized. Ifthe value is greater than two standard deviations from the mean, it is also turns red.
The option Short Stat Names causes an alternate set of statistic names to be used in the creation of tables. There is a tendency for the first row of tables, which contains the column headers describing the statistics, tobecome long and unwieldy. This setting will reduce that effect by substituting % for frequency, P for parent,and G for grandparent.
Helper Applications - The Layout Editor and Table Editor have buttons that will cause the currentscreen to be written to a file and then launched by a different program. For the table editor, you can pick aspreadsheet or statistics package as your Helper Application. For the layout editor, you can pick a graphicsor publication program. Use the Choose... buttons here to pick the applications you wish these buttons tolaunch. In response to the Help button in any of the FlowJo's windows, the program will direct the Finder tolaunch the web Browser you have chosen in your computer's preferences, and display the HTML referencemanual page specific for the context.
The Define Legend Palette button allows you to define the colors of the overlaid graphs in the Layout Editor.The first color by default is red and the next is blue etc. This can be changed to all black and gray scale if youdo not have a color printer.
Histogram Overlay Defaults Select the line style you prefer, thicker, thinner, dashed or dotted. Tinted areawithout a line is also available here. Choose whether overlaid histograms each will be expressed on a commonscale (checked) or each as a percentage of the maximum height of the graph (unchecked.) Finally check thelast box if you wish to view overlaid histograms in a three-dimensional stack.
Output Preferences
Table of Contents
Graph Preferences 122

Graph Options The first box allows you to make a gate's frequency label transparent. The next three boxescontrol what axis info is displayed by default.
HTML Output Here you you select what format you want FlowJo to use when it saves your layouts as Webpages. Photoshop and Quicktime native formats are also available here. If you want a standard text or graphicto appear at the head and/or foot of your Web page, use the Choose button to show FlowJo where the filesare. These files must contain the appropriate HTML tags to display properly. They may contain the logo orlink information that you want included in the pages you create.
Exporting Graphics Graphs are copied without gates showing by default. Check this box to include gateswhen copying. Option - clicking will reverse this choice on a per graph basis. The drop-down list here lets youchoose the file format of exported graphics.
Graphic Formats Options Check your preferences for PICT graphic properties. Vector objects withinexported graphs can be edited separately, allowing more control of the image after it leaves FlowJo. Drawingdots as filled boxes allow you to control their size in a vector graphic program. It is efficient to displayhistograms as polygons, but some programs will not display the polygons correctly. Uncheck this box if yourexported histograms are corrupted. Next you can choose the level of compression of exported graphics.Lossless compression gives the clearest display but the largest file size, Most compression gives the smallestfile size but the least fidelity to the orginal appearance of the graph. Check the Movies Back & forthLooping box to cause quicktime movies of your batched graphs to cycle back and forth rather than jumpingfrom the end to the beginning when they repeat.
Table of Contents
Graph Preferences 123

Text Preferences
The Text tab collects the controls for all of FlowJo. Choose the text placement from the list on the left, thenset the font, size, color and so forth on the right. Or, choose the settings for one area, then click the Set Allbutton to have the same attributes applied everywhere.
General Preferences
Table of Contents
Graph Preferences 124
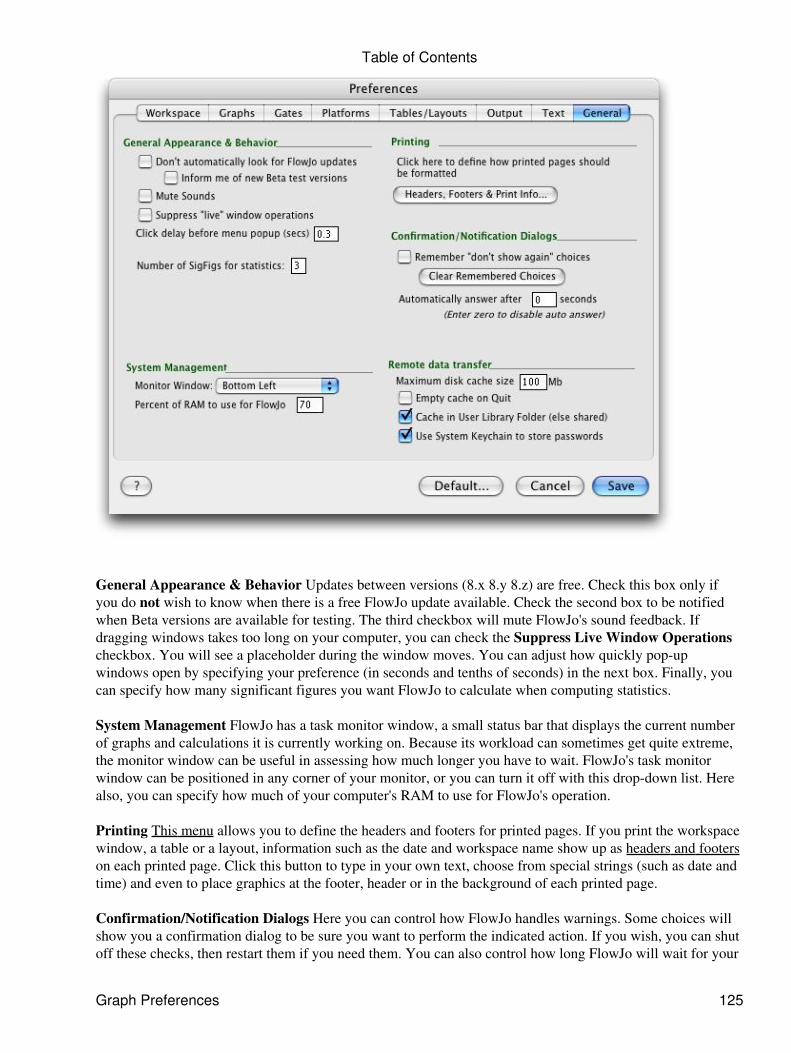
General Appearance & Behavior Updates between versions (8.x 8.y 8.z) are free. Check this box only ifyou do not wish to know when there is a free FlowJo update available. Check the second box to be notifiedwhen Beta versions are available for testing. The third checkbox will mute FlowJo's sound feedback. Ifdragging windows takes too long on your computer, you can check the Suppress Live Window Operationscheckbox. You will see a placeholder during the window moves. You can adjust how quickly pop-upwindows open by specifying your preference (in seconds and tenths of seconds) in the next box. Finally, youcan specify how many significant figures you want FlowJo to calculate when computing statistics.
System Management FlowJo has a task monitor window, a small status bar that displays the current numberof graphs and calculations it is currently working on. Because its workload can sometimes get quite extreme,the monitor window can be useful in assessing how much longer you have to wait. FlowJo's task monitorwindow can be positioned in any corner of your monitor, or you can turn it off with this drop-down list. Herealso, you can specify how much of your computer's RAM to use for FlowJo's operation.
Printing This menu allows you to define the headers and footers for printed pages. If you print the workspacewindow, a table or a layout, information such as the date and workspace name show up as headers and footerson each printed page. Click this button to type in your own text, choose from special strings (such as date andtime) and even to place graphics at the footer, header or in the background of each printed page.
Confirmation/Notification Dialogs Here you can control how FlowJo handles warnings. Some choices willshow you a confirmation dialog to be sure you want to perform the indicated action. If you wish, you can shutoff these checks, then restart them if you need them. You can also control how long FlowJo will wait for your
Table of Contents
Graph Preferences 125
response before taking the action you ordered. Enter zero and it will never take the action without yourconfirmation.
Remote Data Transfer The settings within this box are only used by a small number of sites that providecentralized data storage for their FCS files. For some sites, FlowJo retrieves data over the internet; in thesecases, you can select a maximum cache size that FlowJo uses to keep copies of the data on your Macintosh(and, if you desire, to have FlowJo delete the cache files when you quit). If files are stored remotely, FlowJocan use FTP or HTTP to download them to your Macintosh as they are needed. To speed up subsequentaccess to the same files, FlowJo maintains a cache on local hard drive. These settings will determine themaximum size of the cache, and whether the program should delete all of the files when it quits.
Preferences
Table of Contents
Graph Preferences 126

TechniquesThis section discusses different techniques you can use to analyze data more efficiently with FlowJo.
FlowJo gives you the most flexibility possible with exported graphics. You can easily ungroup any graphic,and change the font attributes, line styles, etc., to make any graph look exactly the way you want! The firstpage in this section gives you some additional hints on exporting graphs.
The greatest strength of FlowJo is its ability to represent batch analysis in a simple and flexible structure. Don't expect to find a macro language or scripting extensions. Our approach lies in the grouping structure,within the workspaces. Create your layout, and with a single button, produce a stack. The stack can be shownas a new layout, a tiles picture or a movie. There's even a section about how to cancel batch jobs once they'vebeen started
Drag-and-Drop is an important skill to learn if you are going to be a fluent user of this program. This sectiontalks about the semantics of what it means to drop gates or statistics onto populations. A few modifier keyscan save you all sorts of time.
Indeed, modifier keys, especially the option key are used heavily in FlowJo. Use option dragging to duplicategraphs in the layouts, or option-close to close all your windows at once. Try depressing the option key as youbrowse through menu items; you will find that many of the menus change to be a different command, givingyou quick access to even more powerful features.
Tips and Techniques:
Techniques 127

Getting Help in FlowJoFlowJo is littered with help buttons throughout the application. Clicking on one of these launches aweb browser to access our Web page describing that topic. Or, you can choose help from the Applemenu while running FlowJo to go directly to the general help page.
In addition, you can press the "help" key on your keyboard at any time. This will activate the helpbutton on the frontmost window (if one exists); otherwise, it will provide you with general help onFlowJo.
Using the web browser, FlowJo gives you "context-sensitive help"--i.e., taking you to helpinformation specifically regarding the operation you are currently performing.
If you are not connected to the internet, FlowJo can access help files installed on your hard drive.With the installation CD in your computer, browse to a folder called Documentation. Drag this folderinto the same folder on your hard drive as the FlowJo program. Now when you click on a help button,FlowJo will access the reference manual from your computer.
Offline Documentation
You can download the latest FlowJo's manual onto your hard drive for use when you are notconnected to the internet from this page.
Getting help
•
Getting Help in FlowJo 128

Cancelling Batch OperationsMany, but not all, of the operations that you request FlowJo to perform can be canceled while they arehappening. In general, when you cancel an operation, all further calculations cease. In the case ofcreating tables or layouts, this will stop any output from being generated. If you select manysubpopulations and accidentally double click on one of them (this directs FlowJo to open them all), itmay take some time for all of the graphs to be generated. If you cancel the operation, then FlowJo willstop opening graphs (but leave the windows up for the ones it has already opened).
To cancel an operation, you can either click on the Stop button in the progress bar window, or presscommand-period (i.e., press the command (or "Apple") key and period key simultaneously). IfFlowJo can cancel the operation, it will do so, although it may take a few seconds before this happens.(For instance, if FlowJo is in the middle of reading a file, you will have to wait until the file is fullyloaded before the cancel can occur). In any case, FlowJo will change the message in the progress baras soon as you attempt to cancel to let you know that it will cease its functions as soon as it can.
There are operations which cannot be canceled, in which case FlowJo will simply continuecomputing. Clicking on the "Stop" button or pressing cmd-period again will not help! If you wish tocancel an operation, you only need to press "Stop" or cmd-period once; if FlowJo can cancel, it will.
Canceling operations that FlowJo is performing
•
Cancelling Batch Operations 129
Option Key TechniquesThere are several cases where, if you hold down the option key while performing a command, FlowJowill modify what it is doing slightly. The following is a list of these modified functions. If you are notfamiliar with the use of FlowJo, there is no need to learn this list; come back to it once you havefamiliarized yourself with the operation of the program.
If you press or release the option key while viewing FlowJo menus, some of the items may change!This quickly lets you know what different operations are accessible from the menu while holdingdown the option key.
Using Next/Previous graph. If you hold down the option key while performing theseoperations, every open graph window is cycled to the next or previous sample.
•
Copying a graph. When you copy a graph from a graph window and hold down the optionkey, then FlowJo will also copy any gates (polygons, etc.) that are shown on the graph (thismay occur anyway depending on your preference settings).
•
Creating a new gate. When you are asked for the name of a new subpopulation (you justdrew a gate on a graph), you can hold down the option key while pressing "OK" or "Select".In either case, the graph window on which you just created the new gate will be closed. (Inthe case of "Select", a new window containing the subpopulation you created will now beopened).
•
Navigating the gating hierarchy. If you hold down the option key while clicking on the"Show parent" or "Show child" buttons in the graph window (the up and down arrows,respectively), then the current window is closed before the other one is opened.
•
Changing the graph characteristics. If you hold down the option key while changing thecharacteristics of the graph (i.e., dot plot, contour plot, density plot, or contour levels, orsmoothing, or outliers), then the same change will be applied to all open graph windows (forthat workspace). This is true either while selecting the menu command (from the "Graph"menu), or while clicking on the "Apply" button in the graph tools window.
•
Closing a plot. If you hold down the option key while clicking on the close box of a graph,then all of the open graph windows (for that workspace) will also be closed.
•
Creating a gate. If you hold down the option key while clicking in a two-dimensional graph,then you will create a rectangular gate rather than a polygon.
•
Showing/Hiding gating hierarchy. If you hold down the option key while clicking on adisclosure triangle in the workspace window (next to the node name), then the show or hidefunction will be applied to all "children" of that node (i.e., collapse/expand the entire tree).Alternatively, if you hold down the command key while clicking on a triangle, then the showor hide function is applied to all "siblings" (all other nodes at that level).
•
Opening or changing other graphs (under the Graph Menu). Holding down the option keykeeps FlowJo from confirming this option.
•
Duplicating draw objects in the Layout Editor. Holding down the option key whiledragging an objects will create a duplicate of the object in the new location.
•
Removing a layer from an overlay. Holding the option key while passing the cursor overthe legend of a multi-layer overlay shows the cursor as a trash can. Option-clicking a row inthe legend will remove that layer from the plot.
•
Using the option key
•
Technical information:
Option Key Techniques 130

Mac and MemoryMacintosh System Requirements
FlowJo is a native OSX application that takes advantage of multiprocessing. It runs in older operatingsystems, however, we recommend that if you cannot upgrade to OSX, then upgrade to the latest OS9version (OS9.2.2).
FlowJo operates more efficiently as the amount of memory increases; see the information below aboutmemory requirements. In OSX, memory is shared freely between programs, so the amount of RAMavailable to FlowJo depends only on the total amount of memory you have on your computer. In OS9,the amount of memory for each program is allocated before launching the program.
Macintosh Memory Requirements for FlowJo
The amount of memory that FlowJo requires is at least enough to hold an entire file being analyzed inmemory plus the amount of memory needed for its own functions. If FlowJo does not have enoughmemory to hold an entire file in memory, then it will not load the file (and you will see a notificationmessage alerting you to this fact). In addition, compensation requires that FlowJo allocate additionalmemory for the new compensation parameters. Again, FlowJo will alert you if you cannotcompensate a file because of insufficient memory.
FlowJo attempts to keep as many files in memory as possible for efficiency--this way, when youswitch between plots for different samples, you don't have to wait for it to re-read the file back in.However, if FlowJo needs more memory (either to read in a file or to create a new graph, or any otherfunction), then it will release one or more files from memory. Then, when you re-access one of thegraphs from that sample, FlowJo will automatically read the file back into memory. This wholeprocess is transparent to the user: you don't have to do anything, FlowJo does everythingautomatically. However, you may find that occasionally you have to wait for FlowJo to reload a file,even if a graph of its data is shown on the screen.
The formula below will tell you how much memory to allocate for FlowJo. You should, in general,allocate as much memory as you can so that FlowJo can operate as efficiently as possible. Todetermine how much you can allocate, go to the Finder, and select "About this Macintosh" under theapple menu. When no applications are running, this dialog will tell you how much free memory youhave; this is the maximum you can give FlowJo.
However, you should, in general, reserve memory for other applications to run simultaneously withFlowJo. If possible, you should reserve room for Netscape to run (so that you can access the helppages directly from FlowJo). In addition, if you will be copying graphs to a drawing program (likeCanvas), you should save enough memory for that program as well. If you don't have enough physicalRAM, turn on Virtual Memory–FlowJo works just fine with virtual memory on. (Virtual memory isturned on via the Macintosh Control Panel "Memory").
To change the memory allocation for FlowJo, select the application file in the Finder window whenFlowJo is not running. Select "Get Info" from the "File" menu, and change the value in the boxlabeled "Preferred Size".
To figure out the minimum amount of memory to allocate to FlowJo, use this formula:
Mac and Memory 131

Memory = 3,000,000 + 2 * (# events) * [ (total parameters) + 1 + (# gates / 8) ]
(# events) = total number of events in the file
(total parameters) = # of parameters in the file (if you are going to compensate, add thenumber of compensated parameters to the number of collected parameters; also add thenumber of derived parameters)
(# gates) = total number of different gates applied to the sample. Each gate is counted once, atany level. (In the workspace, each gate shows up as a distinct population node). Round thevalue (# gates/8) down to the nearest integer.
For instance, let's assume that you have a file with 100,000 events. There are 6 parameters in the file,and you applied a compensation matrix that created 3 more. You have applied a total of 13 differentgates to the sample (including both histogram and polygon gates). Thus, you will need to reserve forFlowJo:
3,000,000 + 2 * (100,000) * [ (6 + 3) + 1 + (13 / 8) ] =
3,000,000 + 2 * (100,000) * [11] =
5,200,000 bytes, or 5.2 MBytes.
Launching FlowJo with this much memory will allow you to fully analyze this file. Note that if youstart making many more gates, then the memory requirements will increase! (In this example, youneed 100,000 bytes for every 8 additional gates).
Macintosh system requirements
•
Table of Contents
Macintosh Memory Requirements for FlowJo 132
Related Documents