January 2013 (Revised June 2013) Report No. 13-03 Florida’s Nursing Education Programs Continued to Expand in 2012 with Increases in Program Capacity, Student Enrollment, and Graduates at a glance To address the nursing shortage in Florida, the 2009 Legislature modified how the Board of Nursing oversees nursing education programs. The intent of the modifications was to increase the number of nursing programs and qualified nurses in Florida. Since the legislation took effect in July 2009, the Board of Nursing has approved 172 new nursing education programs, which has increased the total number of programs by 104%; the number of nursing student seats has increased by 79%; enrollment in nursing programs has increased by 52%, with the greatest increase occurring in nursing bridge programs; nursing program retention rates have gradually increased; the number of students graduating from nursing programs has increased by 28%; of the nursing programs created since 2009 that had graduates who took the licensure exam, approximately two-thirds had exam passage rates that met or exceeded the national average for the 2012 calendar year; and 72% of practical nursing program graduates that received their initial license in 2010 are employed in a nursing-related field. However, not enough time has elapsed to fully evaluate the effects of the new law on employment outcomes of the associate and bachelor’s degrees program graduates. Scope _________________ The Legislature directed OPPAGA to annually review the Board of Nursing’s administration of the program approval and accountability processes for nursing programs. 1 This third in a series of five annual reports addresses how nursing programs’ capacity, enrollment, and student outcomes changed since the 2009 law took effect. 2 Due to the recent implementation of Ch. 2009-168, Laws of Florida, and Ch. 2010-37, Laws of Florida, insufficient time has elapsed to evaluate the effectiveness of the new approval process in producing quality nursing programs and maintaining the quality of nursing graduates in the associate and bachelor degree programs. However, this report provides information on the percentage of practical nursing program graduates who passed their licensure exams in 2012. OPPAGA will issue subsequent reports on the program approval process and outcomes annually through 2015. Background _____________ To ensure quality nursing practice, Ch. 464, Florida Statutes, establishes the Florida Board of Nursing and grants the board authority to adopt 1 Chapter 2010-37, Laws of Florida. 2 The prior OPPAGA reports are Board of Nursing Addressed Statutory Changes; Nursing Program Capacity Expanded in 2009-10, OPPAGA Report No. 11-06, January 2011, and Florida’s Nursing Education Programs Continued to Expand in 2011 with Significant Increases in Student Enrollment and Graduates, OPPAGA Report No. 12-04, January 2012.

Welcome message from author
This document is posted to help you gain knowledge. Please leave a comment to let me know what you think about it! Share it to your friends and learn new things together.
Transcript
January 2013 (Revised June 2013) Report No. 13-03
Florida’s Nursing Education Programs Continued to Expand in 2012 with Increases in Program Capacity, Student Enrollment, and Graduatesat a glance To address the nursing shortage in Florida, the 2009 Legislature modified how the Board of Nursing oversees nursing education programs. The intent of the modifications was to increase the number of nursing programs and qualified nurses in Florida. Since the legislation took effect in July 2009,
the Board of Nursing has approved 172 new nursing education programs, which has increased the total number of programs by 104%;
the number of nursing student seats has increased by 79%;
enrollment in nursing programs has increased by 52%, with the greatest increase occurring in nursing bridge programs;
nursing program retention rates have gradually increased;
the number of students graduating from nursing programs has increased by 28%;
of the nursing programs created since 2009 that had graduates who took the licensure exam, approximately two-thirds had exam passage rates that met or exceeded the national average for the 2012 calendar year; and
72% of practical nursing program graduates that received their initial license in 2010 are employed in a nursing-related field.
However, not enough time has elapsed to fully evaluate the effects of the new law on employment outcomes of the associate and bachelor’s degrees program graduates.
Scope _________________ The Legislature directed OPPAGA to annually review the Board of Nursing’s administration of the program approval and accountability processes for nursing programs.1 This third in a series of five annual reports addresses how nursing programs’ capacity, enrollment, and student outcomes changed since the 2009 law took effect.2
Due to the recent implementation of Ch. 2009-168, Laws of Florida, and Ch. 2010-37, Laws of Florida, insufficient time has elapsed to evaluate the effectiveness of the new approval process in producing quality nursing programs and maintaining the quality of nursing graduates in the associate and bachelor degree programs. However, this report provides information on the percentage of practical nursing program graduates who passed their licensure exams in 2012. OPPAGA will issue subsequent reports on the program approval process and outcomes annually through 2015.
Background_____________ To ensure quality nursing practice, Ch. 464, Florida Statutes, establishes the Florida Board of Nursing and grants the board authority to adopt 1 Chapter 2010-37, Laws of Florida. 2 The prior OPPAGA reports are Board of Nursing Addressed
Statutory Changes; Nursing Program Capacity Expanded in 2009-10, OPPAGA Report No. 11-06, January 2011, and Florida’s Nursing Education Programs Continued to Expand in 2011 with Significant Increases in Student Enrollment and Graduates, OPPAGA Report No. 12-04, January 2012.

OPPAGA Report Report No. 13-03
2
rules, discipline nurses who violate regulations, and approve and monitor nursing education programs.3 In 2009, the Legislature modified the process for approving new nursing education programs by removing rulemaking authority from the Board of Nursing and specifying the nursing education program approval process in statute.4 Our 2010 report identified several issues with the board’s implementation of the 2009 law and made recommendations to the Legislature and the Board of Nursing.5 The 2010 Legislature modified statutes to address issues consistent with those raised in our report and by stakeholders.6 Our 2011 report determined that the board has implemented the revised processes and addressed other issues identified.7
As shown in Exhibit 1, 281 nursing education programs in Florida had students enrolled 3 New programs submit an application, fees, and supporting
documents to the board office, which then reviews the application for any errors or deficiencies. Upon the receipt of a complete application, board staff places the program’s application on the Board of Nursing’s agenda for approval. The board monitors approved nursing programs by reviewing their students’ scores on the National Council Licensure Examination (NCLEX).
4 Chapter 2009-168, Laws of Florida. 5 Since Implementing Statutory Changes, the State Board
of Nursing Has Approved More Nursing Programs; the Legislature Should Address Implementation Issues, OPPAGA Report No. 10-14, January 2010.
6 Chapter 2010-37, Laws of Florida. 7 Board of Nursing Addressed Statutory Changes; Nursing Program
Capacity Expanded in 2009-10, OPPAGA Report No. 11-06, January 2011.
during the 2012 academic year.8, 9 These included 132 programs that offered a licensed practical nursing certificate, 120 programs that offered an associate degree in nursing, and 29 programs that offered a bachelor’s degree in nursing. Many of these programs offered both a generic curriculum (also called a track) for students with no medical experience and a bridge curriculum, which is an expedited program for students with nursing licenses or previous medical experience.10
These nursing programs are offered by public school districts, Florida colleges, state universities, private institutions licensed by the Commission for Independent Education, and private institutions that are members of the Independent Colleges and Universities of Florida. In addition, state law authorizes Pensacola Christian College to offer a bachelor of science in nursing degree.11, 12
8 Two institutions in other states offer two of Florida’s nursing
education programs. Indiana State University and Western Governors University have distance learning nursing programs that award a bachelor of science in nursing degree. At Indiana State University students must have a practical nursing certificate to be admitted. These programs are not included in this total.
9 In addition, 47 programs were approved by the Board of Nursing but did not have students enrolled during 2011-12.
10 Section 464.019, F.S., does not differentiate between bridge and generic curriculum tracks. In addition, the Florida Board of Nursing does not make a distinction between generic, bridge, or accelerated tracks.
11 Section 1005.06 (1) (e), F.S. 12 Nursing education programs in Florida that hold specialized nursing
accreditation by the National League for Nursing Accrediting Commission (NLNAC) or by the Collegiate Commission on Nursing Education (CCNE) are not regulated by the Florida Board of Nursing.
Exhibit 1 During 2011-12, 281 Nursing Education Programs in Florida Had Students Enrolled1
1 The total includes all curriculum tracks for programs, including 66 programs with multiple tracks. 2 Seven licensed practical nurse programs have both a generic and a bridge curriculum track and six have a bridge-only track. 3 Forty-nine associate degree programs have both a generic and a bridge curriculum track and eleven have a bridge-only track. 4 Ten bachelor’s degree programs have both a generic curriculum track and a second degree curriculum track and two programs only have a
second degree track. In addition, Indiana State University and Western Governors University are not included in these totals, but have distance bachelor’s degree programs that admit Florida students.
Source: OPPAGA survey and analysis.
Licensed Practical Nurse (LPN)132 Total Programs Offered2
• Offered 126 Generic Tracks• Offered 13 Bridge Tracks
Associate Degree in Nursing (RN)120 Total Programs Offered3
• Offered 109 Generic Tracks• Offered 60 Bridge Tracks
Bachelor of Science in Nursing (BSN)29 Total Programs Offered4
• Offered 27 Generic Tracks• Offered 12 2nd Degree Tracks

Report No. 13-03 OPPAGA Report
3
Findings _______________ How many new nursing programs did the board approve and how is the board monitoring programs? The 2009 law changed how nursing education programs are approved and monitored by the Board of Nursing. Since the law took effect, the number of new nursing programs has increased significantly. In addition, the 2009 law specified the criteria the board should follow for placing nursing programs on probationary status.
Overall, the number of new nursing programs has increased by 104% since the 2009 law went into effect. Of the 330 nursing programs statewide, 172 were approved since the statutory changes took effect in July 2009 (a 104% increase).13 As shown in Exhibit 2, the number of approved programs has steadily increased from year to year since the law took effect.14 During calendar year 2012, the board considered and approved 61 applications for new nursing programs offered by private institutions licensed by the Commission for Independent Education.15
Exhibit 2 Since the 2009 Law Went Into Effect, the Number of Nursing Programs Approved has Increased Each Year
Source: OPPAGA analysis of Florida Board of Nursing data.
13 Six programs closed in 2012, which reduced the total number of
programs to 330. 14 Prior to the law taking effect, 17 of 18 nursing program applications
were approved from January 2008 through June 2009. 15 This is an unduplicated count of program applications and board
approvals from January through December 2012. Programs may waive the committee’s review of their application or their applications may be denied. In 2012, one program was denied initially, but the program reapplied and has since been approved.
As shown in Exhibit 3, 57% of the 61 new programs approved in 2012 award associate degrees and 39% award practical nursing certificates. The remaining two programs (3%) award bachelor’s degrees.
Exhibit 3 Most of the Nursing Programs Approved in 2012 Offer Associate Degrees1
1 Percentages do not add exactly to 100% due to rounding.
Source: OPPAGA analysis of Florida Board of Nursing data.
The board placed 11 nursing programs (3%) on probation in 2012. The 2009 law requires nursing programs to have a minimum average graduate licensure exam passage rate and to submit an annual report. If a program’s average falls below 10% of the national average for two consecutive calendar years, it is placed on probation, must submit a corrective action plan, and must increase its average passage rate within two years.16 During 2012, 11 of the 330 nursing programs statewide were placed on probation (3%) because their average graduate licensure exam passage rate was below the required rate for two consecutive years.17 Also in 2012, 22 programs failed to submit their annual report by the required date and the Board of Nursing has requested that they appear at the February 2013 meeting.
16 Section 464.019, F.S., specifies that the first calendar year of scores
the board could use was 2010. As a result, 2012 was the first year the board could place programs on probation using the criteria in law, based on calendar years 2010 and 2011.
17 Eight practical nursing and three associate degree in nursing programs were placed on probation. Two (1 practical nursing and 1 associate degree in nursing) of these 11 programs closed in 2012.
Approved20
Approved41
Approved50
Approved61
Not Approved
1
4
4
July - December 2009 (6 months)
January -December 2010
January -December 2011
January -December 2012
Not Approved
Not Approved
Associate Degree
57%
Bachelor's Degree
Practical Nursing
39%
3%

OPPAGA Report Report No. 13-03
4
How have nursing programs’ capacity, enrollment, and student outcomes changed since the 2009 law took effect? Legislative changes to nursing program accountability processes were intended to increase the number and quality of nursing graduates in Florida by expanding the capacity of existing programs and creating new programs.
Capacity and enrollment in nursing education programs have continued to increase. Nursing programs have continued to increase their capacity for new students and have admitted more students (approved applications) in 2011-12 than in 2010-11, 2009-10, and 2008-09. As shown in Exhibit 4, the number of new seats available for qualified students increased from
16,427 to 29,465 from 2008-09 to 2011-12 for an overall increase of 79% since the law was enacted. In addition, a higher percentage of students whose applications were approved actually enrolled in nursing programs during the 2011-12 academic year compared to previous years. (See Appendix A for additional details on capacity and enrollment trends.)
These capacity increases are the result of approving new programs and expanding existing programs. The revised law allows existing programs to increase capacity without board approval. During 2011-12, 60 of the 200 (30%) existing programs expanded the number of seats available to new students; this increased the number of seats available in nursing programs by 20% from 2010-11 to 2011-12. (See Exhibit 4.)
Exhibit 4 Capacity of Nursing Programs Continue to Expand Under the New Law
Capacity Measure 2008-091 2009-10 2010-11 2011-12
Percentage Change
2010-11 to 2011-12
2008-09 to 2011-12
New Seats 16,427 20,042 24,607 29,465 20% 79%
Applications Received 47,134 70,595 66,307 70,607 6% 50%
Qualified Applicants 30,780 41,415 40,725 42,855 5% 39%
Students Admitted 17,359 19,839 23,181 26,860 16% 55%
Students Admitted Who Enrolled 15,711 18,421 21,566 24,183 12% 54% 1 The 2008-09 data is prior to the law taking effect.
Note: This data does not include the practical nursing (bridge curriculum) programs.
Source: OPPAGA survey of nursing education programs.
Total student enrollment has also continued to increase. As shown by Exhibit 5, overall, student enrollment in nursing programs grew by 52% from 2008-09 to 2011-12.18 Enrollment increased in almost all types of curriculum during this period, with the largest percentage increases in nursing bridge curriculum programs. In
18 When comparing the two most recent academic years (2010-11 to
2011-12), student enrollment in all types of nursing programs increased by 11% (from 32,619 to 36,052).
addition, the associate degree in nursing (generic curriculum) programs experienced a 54% increase in enrollment due to the addition of 23 new programs and the expansion of 45 existing programs. Enrollment in bachelor’s in nursing (second degree) programs decreased slightly (11%).

Report No. 13-03 OPPAGA Report
5
Exhibit 5 Student Enrollment Continues to Increase Across Most Types of Nursing Programs
Curriculum Type
Enrollment Percentage Change
2008-091 2009-10 2010-11 2011-12 2010-11 to 2011-12
2008-09 to 2011-12
Practical Nursing (LPN) – Generic 6,544 7,730 9,111 9,567 5% 46%
Practical Nursing (LPN) – Bridge 41 46 231 164 -29% 300%2
Associate Degree in Nursing – Generic 9,825 10,676 13,876 15,118 9% 54%
Associate Degree in Nursing – Bridge 1,935 2,212 3,404 4,371 28% 126%
Bachelor's Degree in Nursing – Generic 4,081 4,342 4,854 5,600 15% 37%
Bachelor's Degree in Nursing – 2nd Degree 1,142 1,225 1,012 1,011 -0.1% -11%
Total 23,568 26,231 32,488 35,831 10% 52% 1 The 2008-09 data is prior to the law taking effect. 2 Since the law took effect, practical nursing (bridge curriculum) programs have grown from 7 to 13 programs, which accounts for the large
percentage increase in graduates from 2008-09 to 2011-12.
Source: OPPAGA survey of nursing education programs.
The total percentage of students retained in nursing programs has gradually increased. Retention rates provide information on whether students persist in or complete their educational program a year later. We assessed retention in each type of nursing program using the cohort of students who entered the programs in 2008, 2009, 2010, and 2011. To calculate retention, we added the number of graduates and the number of students still enrolled and divided by the number of newly enrolled students for each cohort.19 19 Nursing programs admit students throughout the year, with several
programs admitting students multiple times per year. We requested each nursing program to select a cohort of students for 2008, 2009, 2010, and 2011 and report to us the outcomes of these students over a one-year period.
The resulting retention rates varied slightly among program types and curriculum tracks, with an overall increase from 2010-11 to 2011-12 of 2% (from 84% to 86%). For example, as shown in Exhibit 6, bachelor’s degree programs (generic curriculum) had significantly higher one-year retention rates (94%) than both the practical nursing (79%) and associate degree (generic curriculum) (85%) programs. These differences are due to varying admissions criteria and program lengths. Appendix A, Exhibit A-3 provides additional details on the retention rates for nursing programs.
Exhibit 6 The Total Percentage of Students Retained in Nursing Programs Slightly Increased in 2012
Note: This data includes graduates and students enrolled and does not include the practical nursing (bridge curriculum) programs.
Source: OPPAGA survey of nursing education programs.
80%
85%83%
92%
87%84%
79%
85%89%
94% 93%
86%
Practical NursingGeneric
Associate DegreeGeneric
Associate DegreeBridge
Bachelor's DegreeGeneric
Bachelor's 2ndDegree
Total
2011 2012
Total
OPPAGA Report Report No. 13-03
6
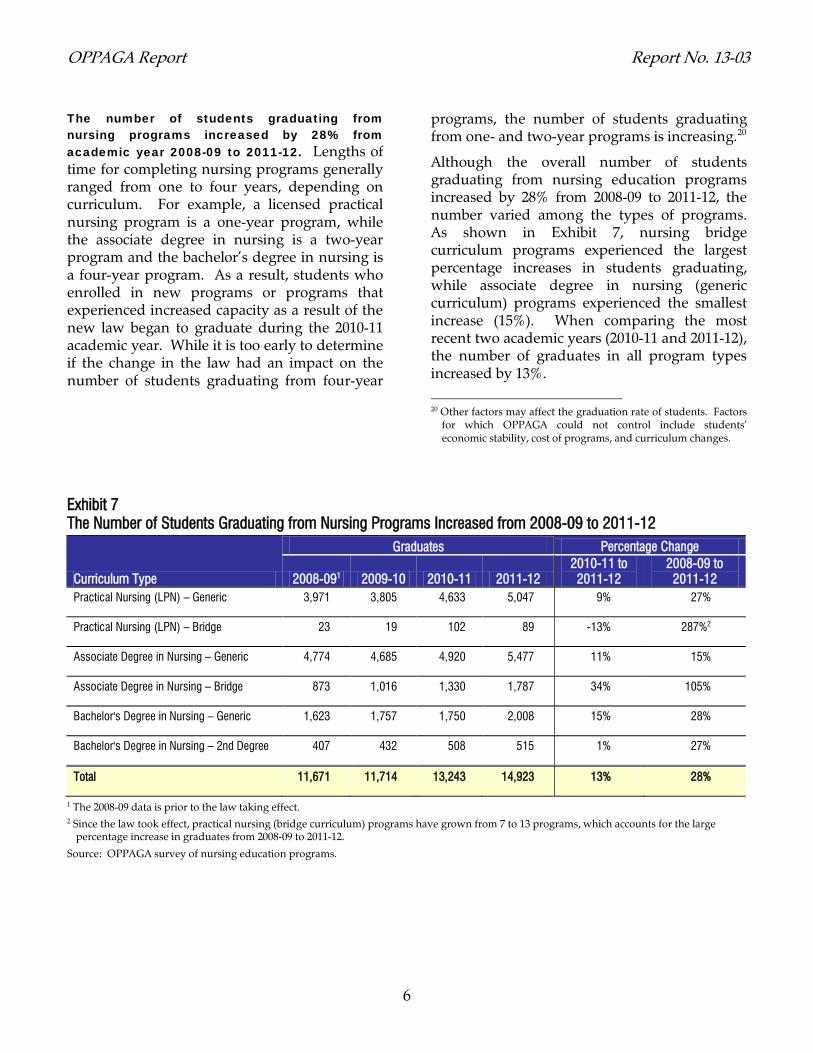
The number of students graduating from nursing programs increased by 28% from academic year 2008-09 to 2011-12. Lengths of time for completing nursing programs generally ranged from one to four years, depending on curriculum. For example, a licensed practical nursing program is a one-year program, while the associate degree in nursing is a two-year program and the bachelor’s degree in nursing is a four-year program. As a result, students who enrolled in new programs or programs that experienced increased capacity as a result of the new law began to graduate during the 2010-11 academic year. While it is too early to determine if the change in the law had an impact on the number of students graduating from four-year
programs, the number of students graduating from one- and two-year programs is increasing.20
Although the overall number of students graduating from nursing education programs increased by 28% from 2008-09 to 2011-12, the number varied among the types of programs. As shown in Exhibit 7, nursing bridge curriculum programs experienced the largest percentage increases in students graduating, while associate degree in nursing (generic curriculum) programs experienced the smallest increase (15%). When comparing the most recent two academic years (2010-11 and 2011-12), the number of graduates in all program types increased by 13%.
20 Other factors may affect the graduation rate of students. Factors
for which OPPAGA could not control include students’ economic stability, cost of programs, and curriculum changes.
Exhibit 7 The Number of Students Graduating from Nursing Programs Increased from 2008-09 to 2011-12
Curriculum Type
Graduates Percentage Change
2008-091 2009-10 2010-11 2011-12 2010-11 to 2011-12
2008-09 to 2011-12
Practical Nursing (LPN) – Generic 3,971 3,805 4,633 5,047 9% 27%
Practical Nursing (LPN) – Bridge 23 19 102 89 -13% 287%2
Associate Degree in Nursing – Generic 4,774 4,685 4,920 5,477 11% 15%
Associate Degree in Nursing – Bridge 873 1,016 1,330 1,787 34% 105%
Bachelor's Degree in Nursing – Generic 1,623 1,757 1,750 2,008 15% 28%
Bachelor's Degree in Nursing – 2nd Degree 407 432 508 515 1% 27%
Total 11,671 11,714 13,243 14,923 13% 28%
1 The 2008-09 data is prior to the law taking effect. 2 Since the law took effect, practical nursing (bridge curriculum) programs have grown from 7 to 13 programs, which accounts for the large
percentage increase in graduates from 2008-09 to 2011-12.
Source: OPPAGA survey of nursing education programs.
Report No. 13-03 OPPAGA Report
7
Of the nursing programs created since 2009 that had graduates who took the licensure exam, approximately two-thirds had exam passage rates that met or exceeded the national average for the 2012 calendar year. Sixty-five of the 172 nursing programs approved since the statutory changes took effect in July 2009 had graduates who took the State Board of Nursing Licensing Examination in calendar year 2012. Two-thirds (43) of these programs had exam passage rates that met or exceeded the national average for their program type.21 However, the remaining (22) programs were at least 10 percentage points lower than the national average for the 2012 calendar year.22, 23 If these programs continue this trend for another consecutive calendar year, they could be placed on probation.24
The overall licensure exam passage rate in Florida for associate degree in nursing programs was 83%, the passage rate for licensed practical nursing programs was 77%, and the passage rate for bachelor’s degree in nursing programs was 94%. Even though the passage rates for the associate degree in nursing and licensed practical nursing programs declined in 2012, the overall number of students who passed the exam increased during the same period. Appendix B lists the passage rates for each nursing program in Florida.
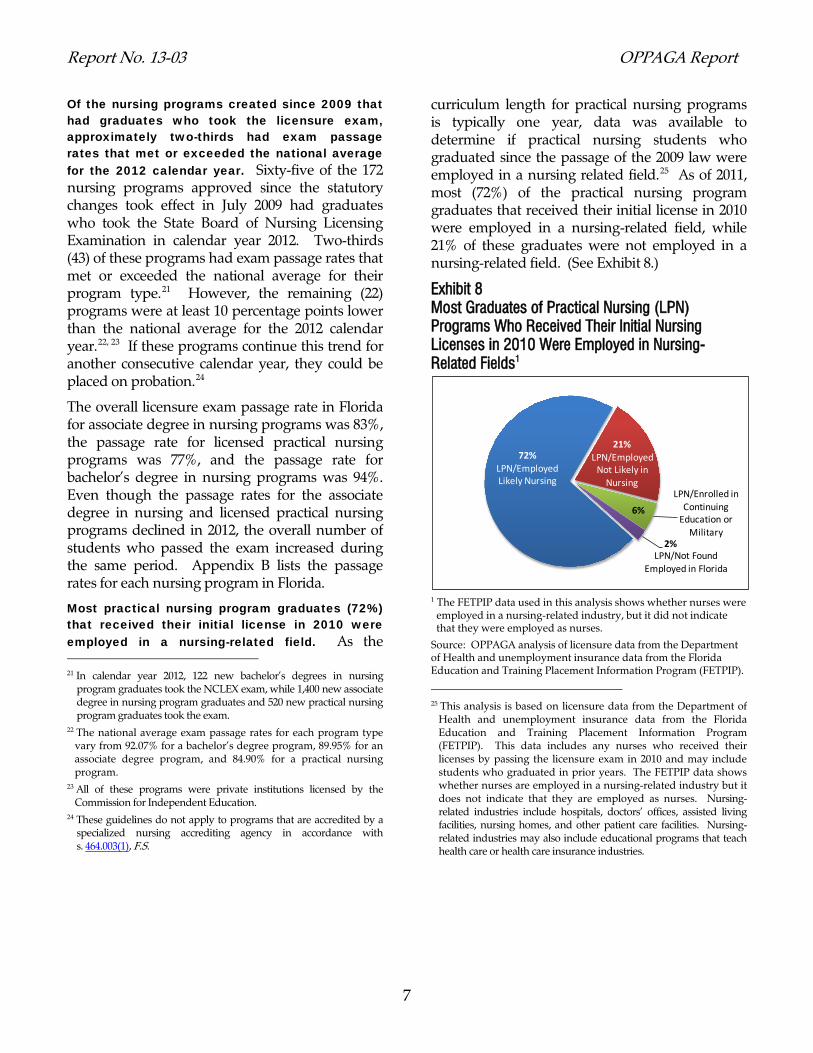
Most practical nursing program graduates (72%) that received their initial license in 2010 were employed in a nursing-related field. As the 21 In calendar year 2012, 122 new bachelor’s degrees in nursing
program graduates took the NCLEX exam, while 1,400 new associate degree in nursing program graduates and 520 new practical nursing program graduates took the exam.
22 The national average exam passage rates for each program type vary from 92.07% for a bachelor’s degree program, 89.95% for an associate degree program, and 84.90% for a practical nursing program.
23 All of these programs were private institutions licensed by the Commission for Independent Education.
24 These guidelines do not apply to programs that are accredited by a specialized nursing accrediting agency in accordance with s. 464.003(1), F.S.
curriculum length for practical nursing programs is typically one year, data was available to determine if practical nursing students who graduated since the passage of the 2009 law were employed in a nursing related field.25 As of 2011, most (72%) of the practical nursing program graduates that received their initial license in 2010 were employed in a nursing-related field, while 21% of these graduates were not employed in a nursing-related field. (See Exhibit 8.)
Exhibit 8 Most Graduates of Practical Nursing (LPN) Programs Who Received Their Initial Nursing Licenses in 2010 Were Employed in Nursing-Related Fields1
1 The FETPIP data used in this analysis shows whether nurses were
employed in a nursing-related industry, but it did not indicate that they were employed as nurses.
Source: OPPAGA analysis of licensure data from the Department of Health and unemployment insurance data from the Florida Education and Training Placement Information Program (FETPIP).
25 This analysis is based on licensure data from the Department of
Health and unemployment insurance data from the Florida Education and Training Placement Information Program (FETPIP). This data includes any nurses who received their licenses by passing the licensure exam in 2010 and may include students who graduated in prior years. The FETPIP data shows whether nurses are employed in a nursing-related industry but it does not indicate that they are employed as nurses. Nursing-related industries include hospitals, doctors’ offices, assisted living facilities, nursing homes, and other patient care facilities. Nursing-related industries may also include educational programs that teach health care or health care insurance industries.
6%
2%
21%LPN/Employed
Not Likely in Nursing
72%LPN/EmployedLikely Nursing
LPN/Not Found Employed in Florida
LPN/Enrolled in Continuing
Education or Military

OPPAGA Report Report No. 13-03
8
Data is not yet available to fully evaluate employment outcomes for nursing program graduates from associate and bachelor degree programs affected by the 2009 law changes. The most recent data available for evaluating student employment outcomes is for 2010, which does not allow enough time to evaluate the outcomes of graduates of associate and bachelor’s degree programs since the new law took effect. This information is provided as a baseline comparison for future reports. The 2010 data showed that most individuals who graduated from a Florida nursing program and received a license to practice nursing were employed in nursing-related fields in Florida.26 For example, 88% of 2007 licensees, 88% 26 To determine how many graduates were employed in nursing
fields in Florida, we obtained data on individuals who were
of 2008 licensees, 86% of 2009 licensees, and 83% of 2010 licensees were employed in a health care-related field in Florida.27 (See Exhibit 9.)
approved for a nursing license (practical nursing or professional nursing) in 2007, 2008, 2009, and 2010 and selected those individuals who reported graduating from a Florida nursing school. In 2007, 7,403 nursing program graduates received nursing licenses. In 2008, the number of graduates receiving licenses was 8,806, in 2009, the number receiving licenses was 9,441, and in 2010, the number receiving licenses was 10,000. We matched these individuals to the Florida Education and Training Placement Information Program (FETPIP) unemployment insurance database to determine if they were employed in Florida and where they were employed. The 2007, 2008, 2009, and 2010 calendar years were the most recent years available for this analysis, as the unemployment insurance database runs a year behind.
27 In 2010, all of the licensees identified as enrolled in continuing education or in the military were enrolled in continuing education.
Exhibit 9 Most Graduates of Florida Nursing Programs Who Received Nursing Licenses in 2007, 2008, 2009, and 2010 Were Employed in Nursing-Related Fields1
1 Percentages do not add exactly to 100% due to rounding.
Source: OPPAGA analysis of licensure data from the Department of Health and unemployment insurance data from the Florida Education and Training Placement Information Program (FETPIP).
88% 88% 86% 83%
10% 10% 10% 11%
1% 4%2% 2% 2% 1%
2007 (N=7,403) 2008 (N=8,806) 2009 (N=9,441) 2010 (N=10,000)
Not Found Employed in Florida
Enrolled in Continuing Education or Military
Employed -Not Likely in Nursing
Employed -Likely Nursing
<1%<1%

Report No. 13-03 OPPAGA Report
9
Appendix A
Capacity, Enrollment, Retention, and Graduates of Florida Nursing Education Programs
Capacity of Nursing Programs Exhibit A-1 shows for each year from 2008-09 through 2011-12, the number of new seats, applications received, qualified applicants, students admitted, and students admitted who enrolled in a nursing program. Also shown are the percentage increases or decreases from 2008-09 to each year and from each year to the next. The number of new seats available for qualified students increased overall by 79% since the law was enacted.
Exhibit A-1 Capacity of Nursing Programs Continue to Expand Under the New Law
Capacity Measure
2008-09 (Prior to Law Taking Effect) 2009-10 2010-11 2011-12
Percentage Increase/Decrease 2008-09 to 2009-10
2009-10 to 2010-11
2010-11 to 2011-12
2008-09 to 2011-12
New Seats 16,427 20,042 24,607 29,465 22% 23% 20% 79%
Applications Received 47,134 70,595 66,307 70,607 50% -6% 6% 50%
Qualified Applicants 30,780 41,415 40,725 42,855 35% -2% 5% 39%
Students Admitted 17,359 19,839 23,181 26,860 14% 17% 16% 55%
Students Admitted Who Enrolled 15,711 18,421 21,566 24,183 17% 17% 12% 54%
Source: OPPAGA survey of nursing education programs.

OPPAGA Report Report No. 13-03
10
Nursing Program Student Enrollment Exhibit A-2 shows for each year from 2008-09 through 2011-12, the number of students enrolled in each type of nursing program. Also shown are the percentage increases or decreases from 2008-09 to each year and from each year to the next. Overall, student enrollment in nursing programs grew by 52% from 2008-09 to 2011-12.
Exhibit A-2 Student Enrollment Continues to Increase Across All Types of Nursing Programs
Curriculum Type
Enrollment Percentage Increase/Decrease 2008-09
(Prior to Law Taking Effect) 2009-10 2010-11 2011-12
2008-09 to 2009-10
2009-10 to 2010-11
2010-11 to 2011-12
2008-09 to 2011-12
Practical Nursing (LPN) – Generic 6,544 7,730 9,111 9,567 18% 18% 5% 46%
Practical Nursing (LPN) – Bridge 41 46 231 164 12% 402% -29% 300%
Associate Degree in Nursing – Generic 9,825 10,676 13,876 15,118 9% 30% 9% 54%
Associate Degree in Nursing – Bridge 1,935 2,212 3,404 4,371 14% 54% 28% 126%
Bachelor's Degree in Nursing – Generic 4,081 4,342 4,854 5,600 6% 12% 15% 37%
Bachelor's Degree in Nursing – 2nd Degree 1,142 1,225 1,012 1,011 7% -17% -0.1% -11%
Total 23,568 26,231 32,488 35,831 11% 24% 10% 52%
Source: OPPAGA survey of nursing education programs.

Report No. 13-03 OPPAGA Report
11
Nursing Program Student Retention Exhibit A-3 shows the number of new students enrolled in each type of nursing program who entered the programs in 2010 and 2011, and the percentage of students retained. Retention rates provide information on whether students persist in or complete their educational program a year later. We assessed retention in each type of nursing program using the cohort of students who entered the programs in 2010 and 2011. To calculate retention, we added the number of graduates and the number of students still enrolled and divided by the number of newly enrolled students for each cohort.1 Overall, the retention rate for students who entered in 2011 was slightly higher than the rates for those who entered in 2010.
Exhibit A-3 The Percentage of Students Retained in Nursing Programs Slightly Increased in 2012
Curriculum Type
Students Entering in 2010 (Status as of 2011)
Students Entering in 2011 (Status as of 2012)
Total New Students Enrolled Percentage Retained
Total New Students Enrolled Percentage Retained
Practical Nursing (LPN) – Generic 3,099 80% 2,519 79%
Associate Degree in Nursing – Generic 4,605 85% 4,472 85%
Associate Degree in Nursing – Bridge 1,217 83% 1,421 89%
Bachelor's Degree in Nursing – Generic 1,478 92% 2,023 94%
Bachelor's Degree in Nursing – 2nd Degree 538 87% 397 93%
Total 10,937 84% 10,832 86%
1 Nursing programs admit students throughout the year, with several programs admitting students multiple times per year. We requested each nursing program to select a cohort of students for 2008, 2009, 2010, and 2011 and report to us the outcomes of these students over a one-year period.
Source: OPPAGA survey of nursing education programs.
OPPAGA Report Report No. 13-03
12
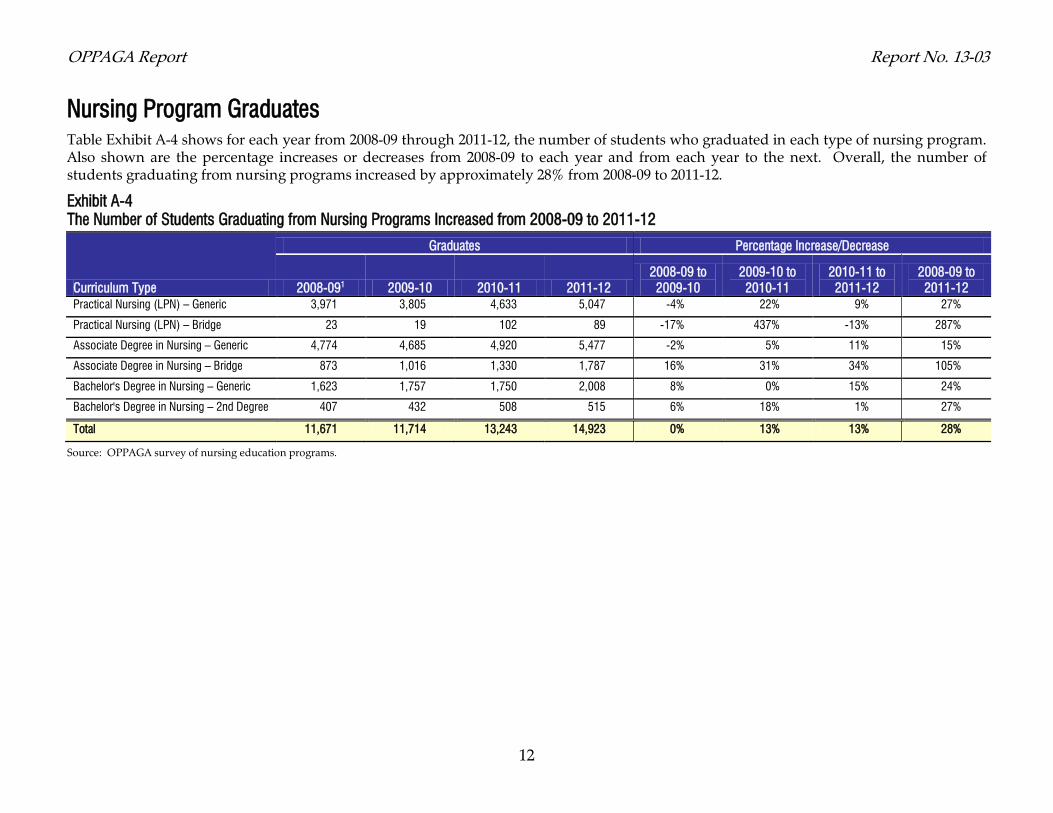
Nursing Program Graduates Table Exhibit A-4 shows for each year from 2008-09 through 2011-12, the number of students who graduated in each type of nursing program. Also shown are the percentage increases or decreases from 2008-09 to each year and from each year to the next. Overall, the number of students graduating from nursing programs increased by approximately 28% from 2008-09 to 2011-12.
Exhibit A-4 The Number of Students Graduating from Nursing Programs Increased from 2008-09 to 2011-12
Curriculum Type
Graduates Percentage Increase/Decrease
2008-091 2009-10 2010-11 2011-12 2008-09 to 2009-10
2009-10 to 2010-11
2010-11 to 2011-12
2008-09 to 2011-12
Practical Nursing (LPN) – Generic 3,971 3,805 4,633 5,047 -4% 22% 9% 27%
Practical Nursing (LPN) – Bridge 23 19 102 89 -17% 437% -13% 287%
Associate Degree in Nursing – Generic 4,774 4,685 4,920 5,477 -2% 5% 11% 15%
Associate Degree in Nursing – Bridge 873 1,016 1,330 1,787 16% 31% 34% 105%
Bachelor's Degree in Nursing – Generic 1,623 1,757 1,750 2,008 8% 0% 15% 24%
Bachelor's Degree in Nursing – 2nd Degree 407 432 508 515 6% 18% 1% 27%
Total 11,671 11,714 13,243 14,923 0% 13% 13% 28%
Source: OPPAGA survey of nursing education programs.

Report No. 13-03 OPPAGA Report
13
Appendix B
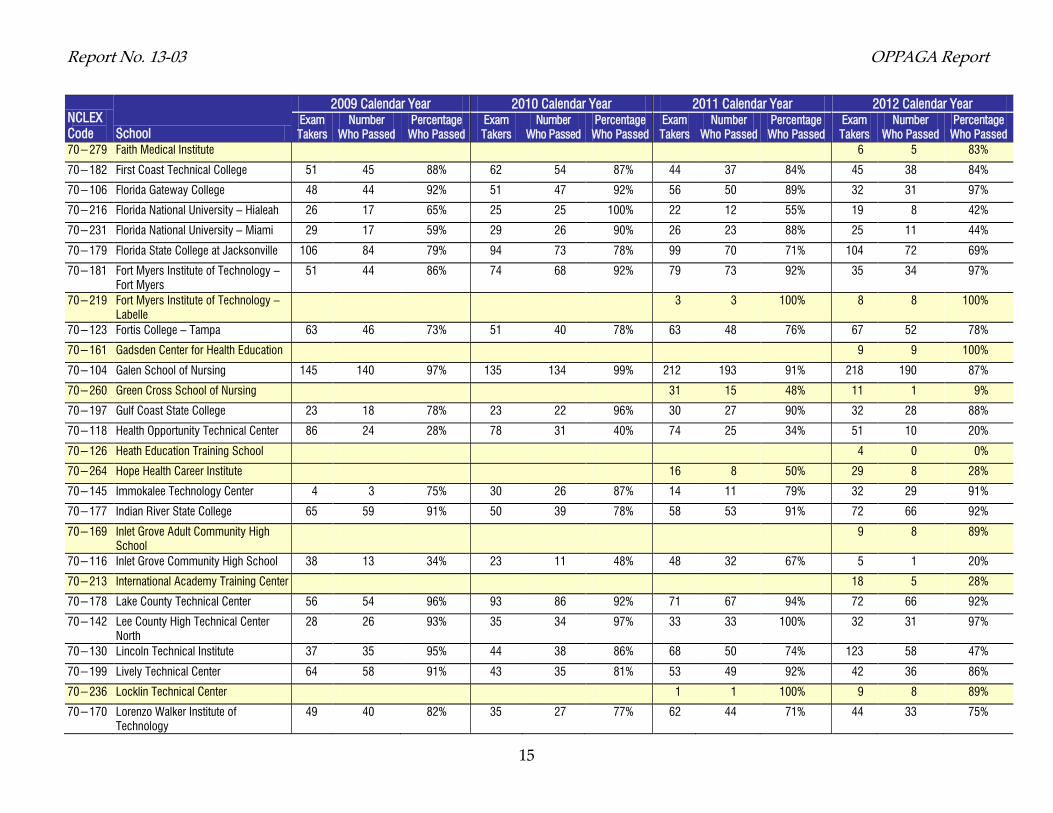
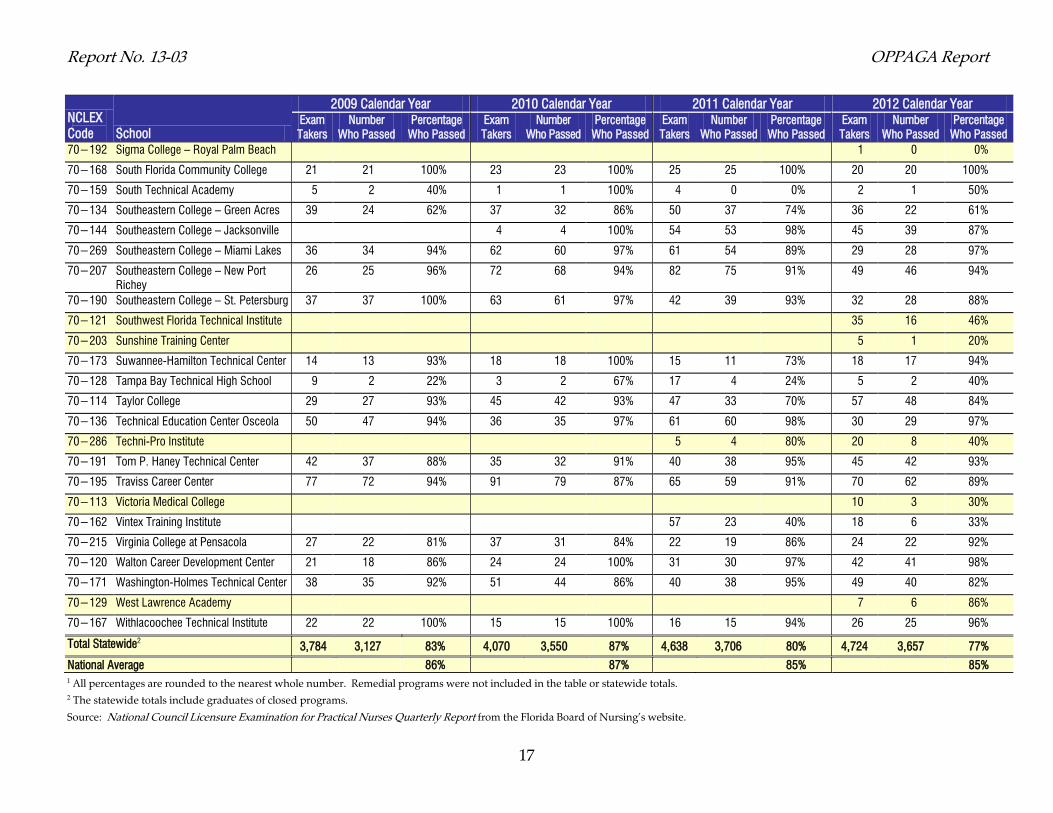
Licensed Practical Nurse Program Graduate Exam Scores Exhibit B-1 shows for each institution the passage rates for licensed practical nurse program graduates who took the National Council of State Boards of Nursing Licensure Examination (NCLEX) during calendar years 2009, 2010, 2011, and 2012.28, 29 The percentage of exam takers who passed the exam declined from 2011 to 2012 (80% and 77%, respectively). Programs approved since the 2009 law are highlighted in yellow.
Exhibit B-1 Passage Rates for Licensed Practical Nurse Program Graduates1
NCLEX Code School
2009 Calendar Year 2010 Calendar Year 2011 Calendar Year 2012 Calendar Year Exam Takers
Number Who Passed
Percentage Who Passed
Exam Takers
Number Who Passed
Percentage Who Passed
Exam Takers
Number Who Passed
Percentage Who Passed
Exam Takers
Number Who Passed
Percentage Who Passed
70−201 Academy for Nursing & Health Occupations
155 119 77% 116 97 84% 149 116 78% 114 92 81%
70−138 American Medical Academy 6 5 83%
70−117 Azure College 20 4 20%
70−107 Bradford-Union Area Vocational Technical Center
19 17 89% 13 12 92% 17 16 94% 15 15 100%
70−172 Brevard Community College 37 30 81% 26 20 77% 38 26 68% 32 28 88%
70−133 Brewster Technical Center 12 11 92% 3 2 67% 17 15 88% 15 13 87%
70−186 Broward Atlantic Technical Center 171 147 86% 141 126 89% 89 85 96% 88 84 95%
70−210 Broward Blanche Ely High School 18 13 72% 14 14 100% 9 8 89% 18 17 94%
70−202 Broward McFatter Technical Center 116 104 90% 130 119 92% 126 105 83% 122 105 86%
70−205 Broward Sheridan Technical Center 129 115 89% 119 109 92% 104 91 88% 101 83 82%
70−127 Cambridge Institute of Allied Health and Technology – Altamonte Springs
85% 16 6 38% 12 7 58%
70−227 Cambridge Institute of Allied Health and Technology – Delray Beach
3 1 33%
70−135 Capscare Academy for Heathcare Education
13 4 31%
70−277 Caregiver Education 6 5 83% 30 10 33% 32 11 34%
28 This includes both licensed practical nurse (generic program) students as well as licensed practical nurse (bridge program) students. 29 This data includes only first-time test takers.

OPPAGA Report Report No. 13-03
14
NCLEX Code School
2009 Calendar Year 2010 Calendar Year 2011 Calendar Year 2012 Calendar Year Exam Takers
Number Who Passed
Percentage Who Passed
Exam Takers
Number Who Passed
Percentage Who Passed
Exam Takers
Number Who Passed
Percentage Who Passed
Exam Takers
Number Who Passed
Percentage Who Passed
70−272 Carleen Home Health School 24 19 79% 15 5 33%
70−288 Casel Healthcare Training Center 41 24 59%
70−132 Center for Allied Health & Nursing Education – Jacksonville
47 41 87%
70−155 Center for Allied Health & Nursing Education – Tampa
41 41 100% 78 76 97% 110 100 91%
70−131 Centura Institute 1 1 100% 21 17 81% 42 20 48% 50 30 60%
70−166 Charlotte Technical Center 48 40 83% 64 56 88% 48 44 92% 39 29 74%
70−100 Chipola College 12 12 100% 10 8 80% 11 11 100% 8 8 100%
70−105 Choice Technical Center 42 41 98% 42 38 90% 36 35 97% 41 40 98%
70−237 Christian International School of Healthcare Professions
9 9 100%
70−102 College of Central Florida 28 28 100% 29 28 97% 27 27 100% 28 26 93%
70−282 Community Educational School – Indian River County
13 13 100% 8 8 100% 7 6 86% 7 7 100%
70−125 Concorde Career Institute 45 39 87% 48 39 81% 53 45 85% 41 37 90%
70−221 Coral Ridge Training School 12 4 33% 24 13 54% 47 10 21% 20 2 10%
70−268 Dade County – Homestead Senior High
15 15 100% 10 10 100% 14 13 93% 11 8 73%
70−153 Dade County – Lindsey Hopkins Technical Center
46 39 85% 57 56 98% 71 63 89% 62 52 84%
70−254 Dade County – Miami Lakes Technical Center
97 89 92% 111 91 82% 124 102 82% 116 87 75%
70−248 Dade County – Robert Morgan Technical Center
90 69 77% 78 60 77% 120 105 88% 109 100 92%
70−148 Dade Medical College – Hialeah 31 18 58%
70−270 Dade Medical College – Hollywood 5 3 60%
70−284 Dade Medical College – Homestead 8 4 50%
70−274 Dade Medical College – Miami 4 1 25%
70−185 Daytona State College 71 61 86% 63 61 97% 65 64 98% 86 81 94%
70−163 DeSoto County School of Practical Nursing
12 12 100% 11 10 91% 11 6 55% 10 8 80%
70−110 Dr. Earl Lennard High School – Ruskin 4 0 0% 1 0 0%
70−154 Erwin Vocational Technical Center 147 118 80% 156 143 92% 137 117 85% 155 143 92%
Report No. 13-03 OPPAGA Report
15
NCLEX Code School
2009 Calendar Year 2010 Calendar Year 2011 Calendar Year 2012 Calendar Year Exam Takers
Number Who Passed
Percentage Who Passed
Exam Takers
Number Who Passed
Percentage Who Passed
Exam Takers
Number Who Passed
Percentage Who Passed
Exam Takers
Number Who Passed
Percentage Who Passed
70−279 Faith Medical Institute 6 5 83%
70−182 First Coast Technical College 51 45 88% 62 54 87% 44 37 84% 45 38 84%
70−106 Florida Gateway College 48 44 92% 51 47 92% 56 50 89% 32 31 97%
70−216 Florida National University – Hialeah 26 17 65% 25 25 100% 22 12 55% 19 8 42%
70−231 Florida National University – Miami 29 17 59% 29 26 90% 26 23 88% 25 11 44%
70−179 Florida State College at Jacksonville 106 84 79% 94 73 78% 99 70 71% 104 72 69%
70−181 Fort Myers Institute of Technology – Fort Myers
51 44 86% 74 68 92% 79 73 92% 35 34 97%
70−219 Fort Myers Institute of Technology – Labelle
3 3 100% 8 8 100%
70−123 Fortis College – Tampa 63 46 73% 51 40 78% 63 48 76% 67 52 78%
70−161 Gadsden Center for Health Education 9 9 100%
70−104 Galen School of Nursing 145 140 97% 135 134 99% 212 193 91% 218 190 87%
70−260 Green Cross School of Nursing 31 15 48% 11 1 9%
70−197 Gulf Coast State College 23 18 78% 23 22 96% 30 27 90% 32 28 88%
70−118 Health Opportunity Technical Center 86 24 28% 78 31 40% 74 25 34% 51 10 20%
70−126 Heath Education Training School 4 0 0%
70−264 Hope Health Career Institute 16 8 50% 29 8 28%
70−145 Immokalee Technology Center 4 3 75% 30 26 87% 14 11 79% 32 29 91%
70−177 Indian River State College 65 59 91% 50 39 78% 58 53 91% 72 66 92%
70−169 Inlet Grove Adult Community High School
9 8 89%
70−116 Inlet Grove Community High School 38 13 34% 23 11 48% 48 32 67% 5 1 20%
70−213 International Academy Training Center 18 5 28%
70−178 Lake County Technical Center 56 54 96% 93 86 92% 71 67 94% 72 66 92%
70−142 Lee County High Technical Center North
28 26 93% 35 34 97% 33 33 100% 32 31 97%
70−130 Lincoln Technical Institute 37 35 95% 44 38 86% 68 50 74% 123 58 47%
70−199 Lively Technical Center 64 58 91% 43 35 81% 53 49 92% 42 36 86%
70−236 Locklin Technical Center 1 1 100% 9 8 89%
70−170 Lorenzo Walker Institute of Technology
49 40 82% 35 27 77% 62 44 71% 44 33 75%

OPPAGA Report Report No. 13-03
16
NCLEX Code School
2009 Calendar Year 2010 Calendar Year 2011 Calendar Year 2012 Calendar Year Exam Takers
Number Who Passed
Percentage Who Passed
Exam Takers
Number Who Passed
Percentage Who Passed
Exam Takers
Number Who Passed
Percentage Who Passed
Exam Takers
Number Who Passed
Percentage Who Passed
70−183 Manatee Technical Institute 76 67 88% 95 81 85% 75 69 92% 63 58 92%
70−139 Medical Prep Institute of Tampa Bay 50 24 48%
70−239 Med-Life Institute – Naples 2 0 0%
70−238 Med-Life Institute – Pompano Beach 13 2 15%
70−124 Medtech Institute 4 1 25%
70−115 Medvance Institute – Miami 35 31 89% 32 30 94% 33 25 76% 27 23 85%
70−111 MedVance Institute – Palm Springs 20 16 80% 25 19 76% 38 19 50% 39 24 62%
70−109 MedVance Institute – Stuart 37 31 84% 44 34 77% 40 26 65% 75 58 77%
70−160 Mercy Hospital School of Practical Nursing
59 50 85% 74 66 89% 68 52 76% 65 56 86%
70−140 Miami Dade College 33 33 100% 80 68 85% 5 4 80% 84 51 61%
70−189 North Florida Community College 17 15 88% 18 18 100% 24 20 83% 23 19 83%
70−187 Orlando Tech 62 56 90% 64 57 89% 64 57 89% 60 49 82%
70−180 Palm Beach County Schools 3 1 33% 2 1 50% 9 0 0% 1 0 0%
70−150 Palm Beach State College 19 18 95% 51 50 98% 35 34 97% 44 41 93%
70−228 Palm Beach Vocational Institute 44 12 27%
70−164 Pasco Hernando Community College 80 76 95% 94 89 95% 95 86 91% 81 78 96%
70−157 Pensacola State College 29 26 90% 36 33 92% 27 26 96% 39 34 87%
70−194 Pinellas Technical Education Center – Clearwater
60 52 87% 73 59 81% 125 107 86% 98 92 94%
70−151 Pinellas Technical Education Center – St. Petersburg
99 67 68% 126 116 92% 86 80 93% 72 64 89%
70−119 Rasmussen College – New Port Richey
15 15 100% 29 27 93% 45 43 96% 31 23 74%
70−232 Rasmussen College – Tampa 1 0 0%
70−108 Ridge Career Center 29 29 100% 41 39 95% 58 55 95% 29 29 100%
70−290 Rose Training Institute 17 7 41% 9 4 44% 37 12 32% 15 5 33%
70−249 SABER, Inc. 62 48 77% 46 34 74% 114 62 54% 99 56 57%
70−196 Santa Fe College 11 11 100% 23 23 100% 22 22 100% 20 19 95%
70−193 Sarasota County Technical Institute 60 54 90% 76 73 96% 62 58 94% 58 54 93%
70−175 Seminole State College 40 38 95% 43 41 95% 33 31 94% 32 31 97%
70−112 Sigma College – Oakland Park 116 41 35% 34 16 47% 111 25 23% 82 24 29%
Report No. 13-03 OPPAGA Report
17
NCLEX Code School
2009 Calendar Year 2010 Calendar Year 2011 Calendar Year 2012 Calendar Year Exam Takers
Number Who Passed
Percentage Who Passed
Exam Takers
Number Who Passed
Percentage Who Passed
Exam Takers
Number Who Passed
Percentage Who Passed
Exam Takers
Number Who Passed
Percentage Who Passed
70−192 Sigma College – Royal Palm Beach 1 0 0%
70−168 South Florida Community College 21 21 100% 23 23 100% 25 25 100% 20 20 100%
70−159 South Technical Academy 5 2 40% 1 1 100% 4 0 0% 2 1 50%
70−134 Southeastern College – Green Acres 39 24 62% 37 32 86% 50 37 74% 36 22 61%
70−144 Southeastern College – Jacksonville 4 4 100% 54 53 98% 45 39 87%
70−269 Southeastern College – Miami Lakes 36 34 94% 62 60 97% 61 54 89% 29 28 97%
70−207 Southeastern College – New Port Richey
26 25 96% 72 68 94% 82 75 91% 49 46 94%
70−190 Southeastern College – St. Petersburg 37 37 100% 63 61 97% 42 39 93% 32 28 88%
70−121 Southwest Florida Technical Institute 35 16 46%
70−203 Sunshine Training Center 5 1 20%
70−173 Suwannee-Hamilton Technical Center 14 13 93% 18 18 100% 15 11 73% 18 17 94%
70−128 Tampa Bay Technical High School 9 2 22% 3 2 67% 17 4 24% 5 2 40%
70−114 Taylor College 29 27 93% 45 42 93% 47 33 70% 57 48 84%
70−136 Technical Education Center Osceola 50 47 94% 36 35 97% 61 60 98% 30 29 97%
70−286 Techni-Pro Institute 5 4 80% 20 8 40%
70−191 Tom P. Haney Technical Center 42 37 88% 35 32 91% 40 38 95% 45 42 93%
70−195 Traviss Career Center 77 72 94% 91 79 87% 65 59 91% 70 62 89%
70−113 Victoria Medical College 10 3 30%
70−162 Vintex Training Institute 57 23 40% 18 6 33%
70−215 Virginia College at Pensacola 27 22 81% 37 31 84% 22 19 86% 24 22 92%
70−120 Walton Career Development Center 21 18 86% 24 24 100% 31 30 97% 42 41 98%
70−171 Washington-Holmes Technical Center 38 35 92% 51 44 86% 40 38 95% 49 40 82%
70−129 West Lawrence Academy 7 6 86%
70−167 Withlacoochee Technical Institute 22 22 100% 15 15 100% 16 15 94% 26 25 96%
Total Statewide2 3,784 3,127 83% 4,070 3,550 87% 4,638 3,706 80% 4,724 3,657 77%
National Average 86% 87% 85% 85% 1 All percentages are rounded to the nearest whole number. Remedial programs were not included in the table or statewide totals. 2 The statewide totals include graduates of closed programs.
Source: National Council Licensure Examination for Practical Nurses Quarterly Report from the Florida Board of Nursing’s website.
OPPAGA Report Report No. 13-03
18
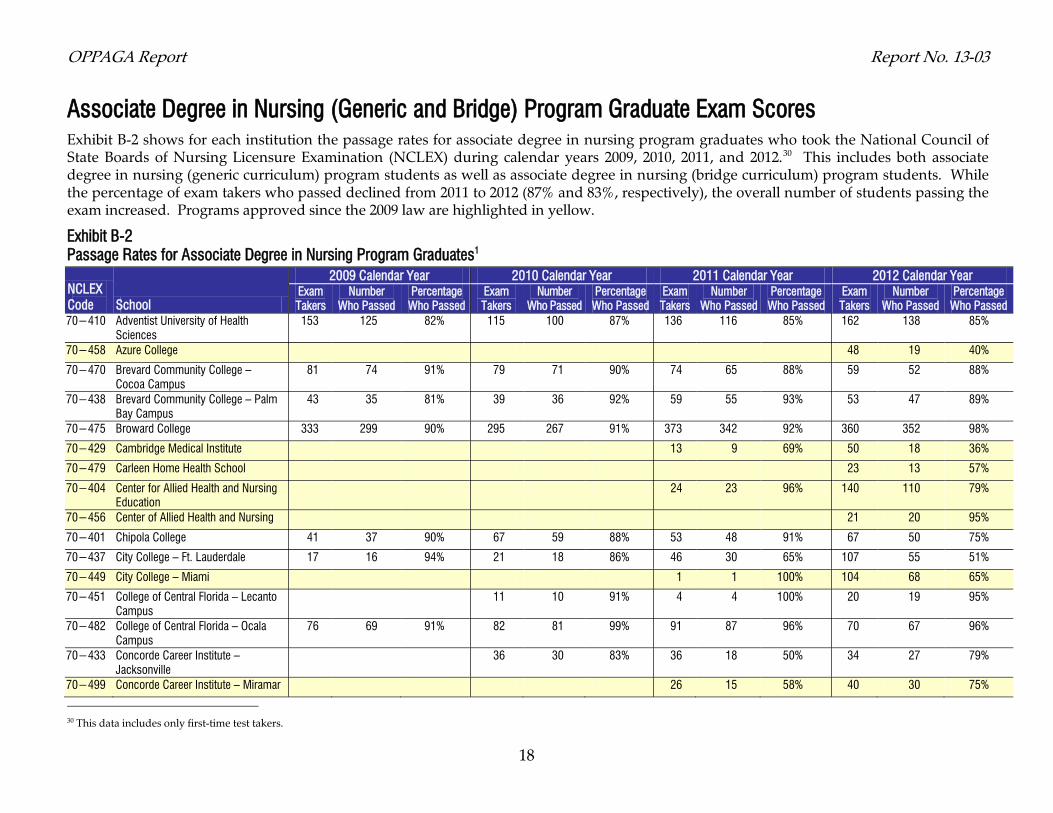
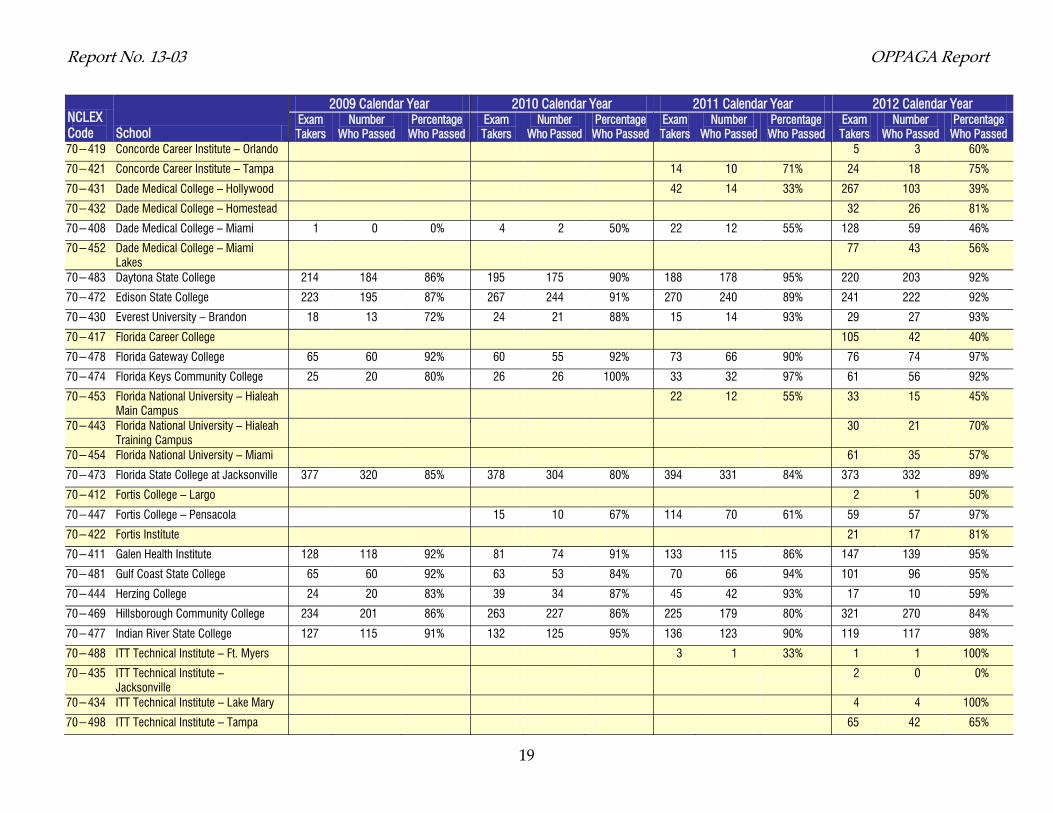
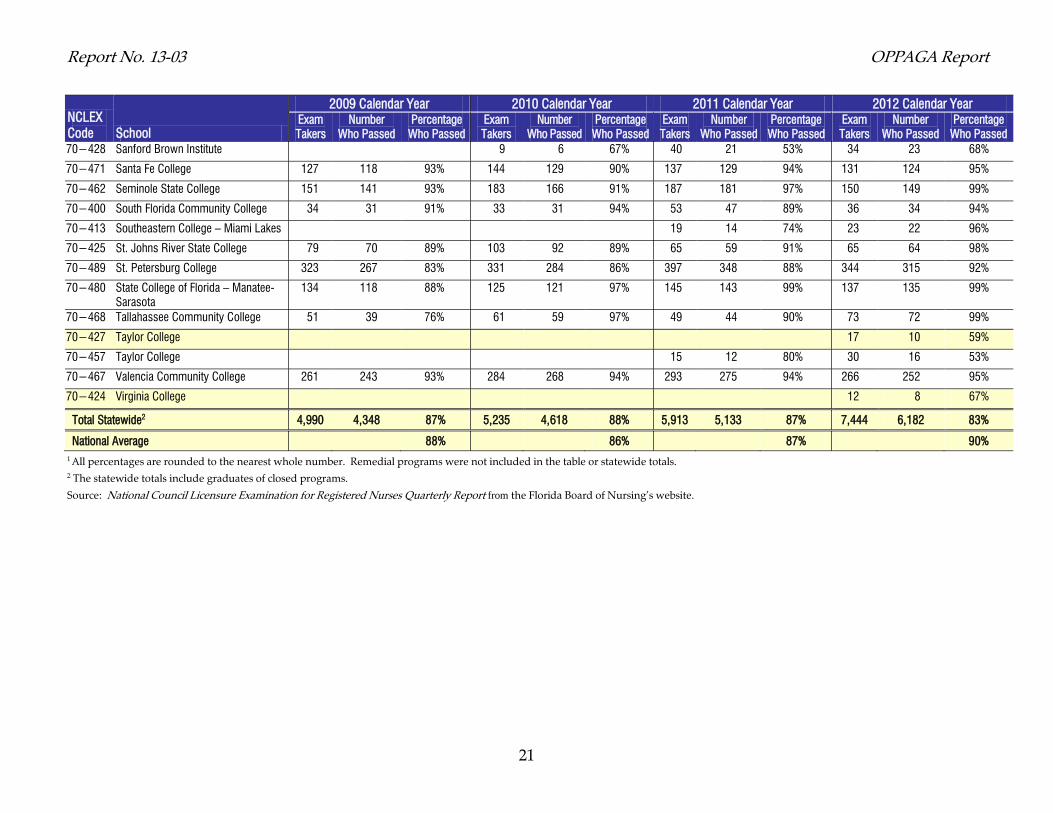
Associate Degree in Nursing (Generic and Bridge) Program Graduate Exam Scores Exhibit B-2 shows for each institution the passage rates for associate degree in nursing program graduates who took the National Council of State Boards of Nursing Licensure Examination (NCLEX) during calendar years 2009, 2010, 2011, and 2012.30 This includes both associate degree in nursing (generic curriculum) program students as well as associate degree in nursing (bridge curriculum) program students. While the percentage of exam takers who passed declined from 2011 to 2012 (87% and 83%, respectively), the overall number of students passing the exam increased. Programs approved since the 2009 law are highlighted in yellow.
Exhibit B-2 Passage Rates for Associate Degree in Nursing Program Graduates1
NCLEX Code School
2009 Calendar Year 2010 Calendar Year 2011 Calendar Year 2012 Calendar Year Exam Takers
Number Who Passed
Percentage Who Passed
Exam Takers
Number Who Passed
Percentage Who Passed
Exam Takers
Number Who Passed
Percentage Who Passed
Exam Takers
Number Who Passed
Percentage Who Passed
70−410 Adventist University of Health Sciences
153 125 82% 115 100 87% 136 116 85% 162 138 85%
70−458 Azure College 48 19 40%
70−470 Brevard Community College – Cocoa Campus
81 74 91% 79 71 90% 74 65 88% 59 52 88%
70−438 Brevard Community College – Palm Bay Campus
43 35 81% 39 36 92% 59 55 93% 53 47 89%
70−475 Broward College 333 299 90% 295 267 91% 373 342 92% 360 352 98%
70−429 Cambridge Medical Institute 13 9 69% 50 18 36%
70−479 Carleen Home Health School 23 13 57%
70−404 Center for Allied Health and Nursing Education
24 23 96% 140 110 79%
70−456 Center of Allied Health and Nursing 21 20 95%
70−401 Chipola College 41 37 90% 67 59 88% 53 48 91% 67 50 75%
70−437 City College – Ft. Lauderdale 17 16 94% 21 18 86% 46 30 65% 107 55 51%
70−449 City College – Miami 1 1 100% 104 68 65%
70−451 College of Central Florida – Lecanto Campus
11 10 91% 4 4 100% 20 19 95%
70−482 College of Central Florida – Ocala Campus
76 69 91% 82 81 99% 91 87 96% 70 67 96%
70−433 Concorde Career Institute – Jacksonville
36 30 83% 36 18 50% 34 27 79%
70−499 Concorde Career Institute – Miramar 26 15 58% 40 30 75%
30 This data includes only first-time test takers.
Report No. 13-03 OPPAGA Report
19
NCLEX Code School
2009 Calendar Year 2010 Calendar Year 2011 Calendar Year 2012 Calendar Year Exam Takers
Number Who Passed
Percentage Who Passed
Exam Takers
Number Who Passed
Percentage Who Passed
Exam Takers
Number Who Passed
Percentage Who Passed
Exam Takers
Number Who Passed
Percentage Who Passed
70−419 Concorde Career Institute – Orlando 5 3 60%
70−421 Concorde Career Institute – Tampa 14 10 71% 24 18 75%
70−431 Dade Medical College – Hollywood 42 14 33% 267 103 39%
70−432 Dade Medical College – Homestead 32 26 81%
70−408 Dade Medical College – Miami 1 0 0% 4 2 50% 22 12 55% 128 59 46%
70−452 Dade Medical College – Miami Lakes
77 43 56%
70−483 Daytona State College 214 184 86% 195 175 90% 188 178 95% 220 203 92%
70−472 Edison State College 223 195 87% 267 244 91% 270 240 89% 241 222 92%
70−430 Everest University – Brandon 18 13 72% 24 21 88% 15 14 93% 29 27 93%
70−417 Florida Career College 105 42 40%
70−478 Florida Gateway College 65 60 92% 60 55 92% 73 66 90% 76 74 97%
70−474 Florida Keys Community College 25 20 80% 26 26 100% 33 32 97% 61 56 92%
70−453 Florida National University – Hialeah Main Campus
22 12 55% 33 15 45%
70−443 Florida National University – Hialeah Training Campus
30 21 70%
70−454 Florida National University – Miami 61 35 57%
70−473 Florida State College at Jacksonville 377 320 85% 378 304 80% 394 331 84% 373 332 89%
70−412 Fortis College – Largo 2 1 50%
70−447 Fortis College – Pensacola 15 10 67% 114 70 61% 59 57 97%
70−422 Fortis Institute 21 17 81%
70−411 Galen Health Institute 128 118 92% 81 74 91% 133 115 86% 147 139 95%
70−481 Gulf Coast State College 65 60 92% 63 53 84% 70 66 94% 101 96 95%
70−444 Herzing College 24 20 83% 39 34 87% 45 42 93% 17 10 59%
70−469 Hillsborough Community College 234 201 86% 263 227 86% 225 179 80% 321 270 84%
70−477 Indian River State College 127 115 91% 132 125 95% 136 123 90% 119 117 98%
70−488 ITT Technical Institute – Ft. Myers 3 1 33% 1 1 100%
70−435 ITT Technical Institute – Jacksonville
2 0 0%
70−434 ITT Technical Institute – Lake Mary 4 4 100%
70−498 ITT Technical Institute – Tampa 65 42 65%

OPPAGA Report Report No. 13-03
20
NCLEX Code School
2009 Calendar Year 2010 Calendar Year 2011 Calendar Year 2012 Calendar Year Exam Takers
Number Who Passed
Percentage Who Passed
Exam Takers
Number Who Passed
Percentage Who Passed
Exam Takers
Number Who Passed
Percentage Who Passed
Exam Takers
Number Who Passed
Percentage Who Passed
70−441 Kaplan University 22 7 32% 22 11 50% 1 1 100%
70−423 Keiser University – Ft. Lauderdale 44 34 77% 30 26 87% 33 26 79% 57 53 93%
70−490 Keiser University – Jacksonville 41 25 61% 38 31 82% 28 22 79% 43 38 88%
70−407 Keiser University – Kendall 43 37 86% 48 45 94% 33 28 85% 39 38 97%
70−403 Keiser University – Lakeland 39 26 67% 39 23 59% 33 27 82% 54 49 91%
70−415 Keiser University – Melbourne 57 48 84% 76 59 78% 55 47 85% 54 49 91%
70−455 Keiser University – Orlando 36 34 94% 36 32 89% 34 31 91%
70−420 Keiser University – Sarasota 36 29 81% 37 34 92% 45 43 96% 36 35 97%
70−426 Keiser University – Tallahassee 16 12 75% 18 17 94% 18 15 83% 11 10 91%
70−418 Keiser University – Tampa 9 8 89% 40 35 88%
70−406 Keiser University – West Palm Beach
37 23 62% 31 25 81% 47 35 74% 50 43 86%
70−405 Lake-Sumter Community College 76 72 95% 82 70 85% 70 68 97% 86 80 93%
70−409 Mercy Hospital College of Nursing – Miami
17 13 76% 35 30 86% 34 32 94%
70−484 Miami Dade College 559 487 87% 597 511 86% 515 434 84% 539 454 84%
70−416 North Florida Community College 18 12 67% 18 16 89% 23 19 83% 21 21 100%
70−450 Northwest Florida State College 44 44 100% 43 42 98% 55 55 100% 48 48 100%
70−492 Palm Beach State College – Belle Glade
12 10 83% 16 13 81% 13 13 100% 11 8 73%
70−486 Palm Beach State College – Lake Worth
178 154 87% 171 153 89% 143 138 97% 154 145 94%
70−464 Pasco Hernando Community College
150 122 81% 159 139 87% 161 138 86% 151 129 85%
70−487 Pensacola State College – Warrington Campus
192 168 88% 137 123 90% 218 178 82% 302 220 73%
70−476 Polk State College 182 170 93% 151 145 96% 142 139 98% 147 143 97%
70−414 Professional Training Center 20 10 50%
70−436 Rasmussen College – Ft. Myers Campus
34 26 76%
70−491 Rasmussen College – New Port Richey
55 46 84%
70−495 Rasmussen College – Ocala Campus
14 12 86% 19 14 74% 44 36 82% 93 75 81%
70−493 SABER, Inc. 33 21 64%
Report No. 13-03 OPPAGA Report
21
NCLEX Code School
2009 Calendar Year 2010 Calendar Year 2011 Calendar Year 2012 Calendar Year Exam Takers
Number Who Passed
Percentage Who Passed
Exam Takers
Number Who Passed
Percentage Who Passed
Exam Takers
Number Who Passed
Percentage Who Passed
Exam Takers
Number Who Passed
Percentage Who Passed
70−428 Sanford Brown Institute 9 6 67% 40 21 53% 34 23 68%
70−471 Santa Fe College 127 118 93% 144 129 90% 137 129 94% 131 124 95%
70−462 Seminole State College 151 141 93% 183 166 91% 187 181 97% 150 149 99%
70−400 South Florida Community College 34 31 91% 33 31 94% 53 47 89% 36 34 94%
70−413 Southeastern College – Miami Lakes 19 14 74% 23 22 96%
70−425 St. Johns River State College 79 70 89% 103 92 89% 65 59 91% 65 64 98%
70−489 St. Petersburg College 323 267 83% 331 284 86% 397 348 88% 344 315 92%
70−480 State College of Florida – Manatee-Sarasota
134 118 88% 125 121 97% 145 143 99% 137 135 99%
70−468 Tallahassee Community College 51 39 76% 61 59 97% 49 44 90% 73 72 99%
70−427 Taylor College 17 10 59%
70−457 Taylor College 15 12 80% 30 16 53%
70−467 Valencia Community College 261 243 93% 284 268 94% 293 275 94% 266 252 95%
70−424 Virginia College 12 8 67%
Total Statewide2 4,990 4,348 87% 5,235 4,618 88% 5,913 5,133 87% 7,444 6,182 83%
National Average
88%
86%
87%
90% 1 All percentages are rounded to the nearest whole number. Remedial programs were not included in the table or statewide totals. 2 The statewide totals include graduates of closed programs.
Source: National Council Licensure Examination for Registered Nurses Quarterly Report from the Florida Board of Nursing’s website.
OPPAGA Report Report No. 13-03
22
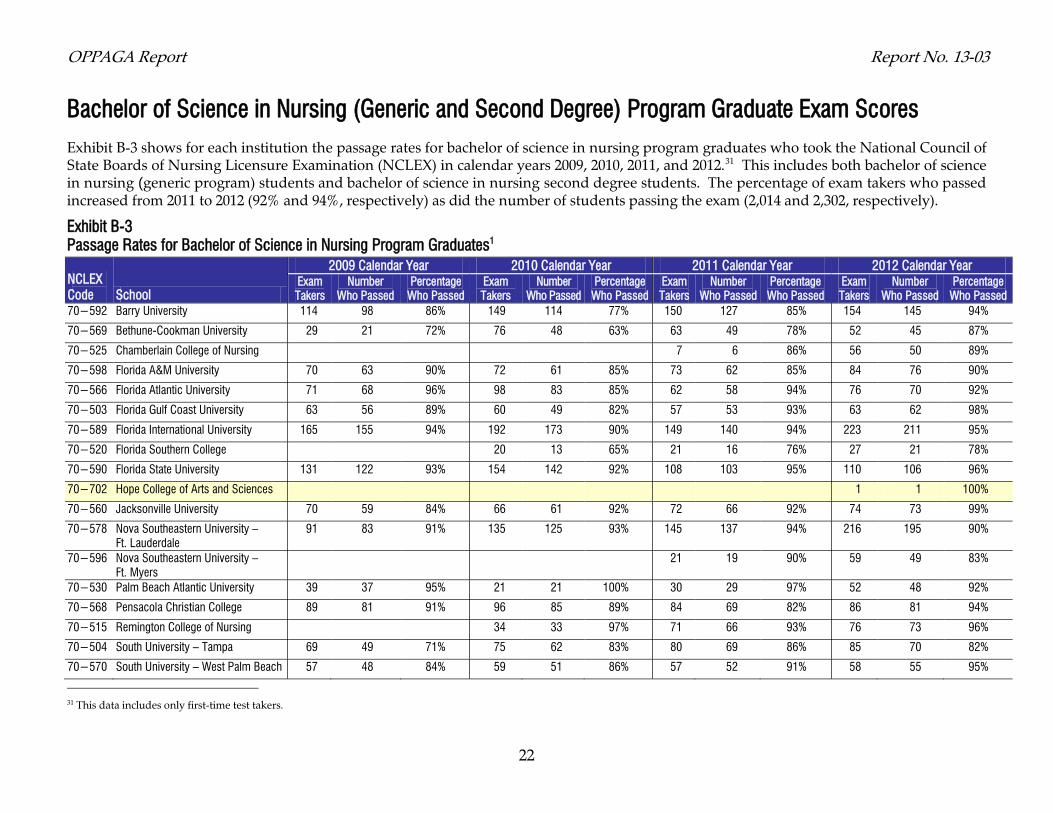
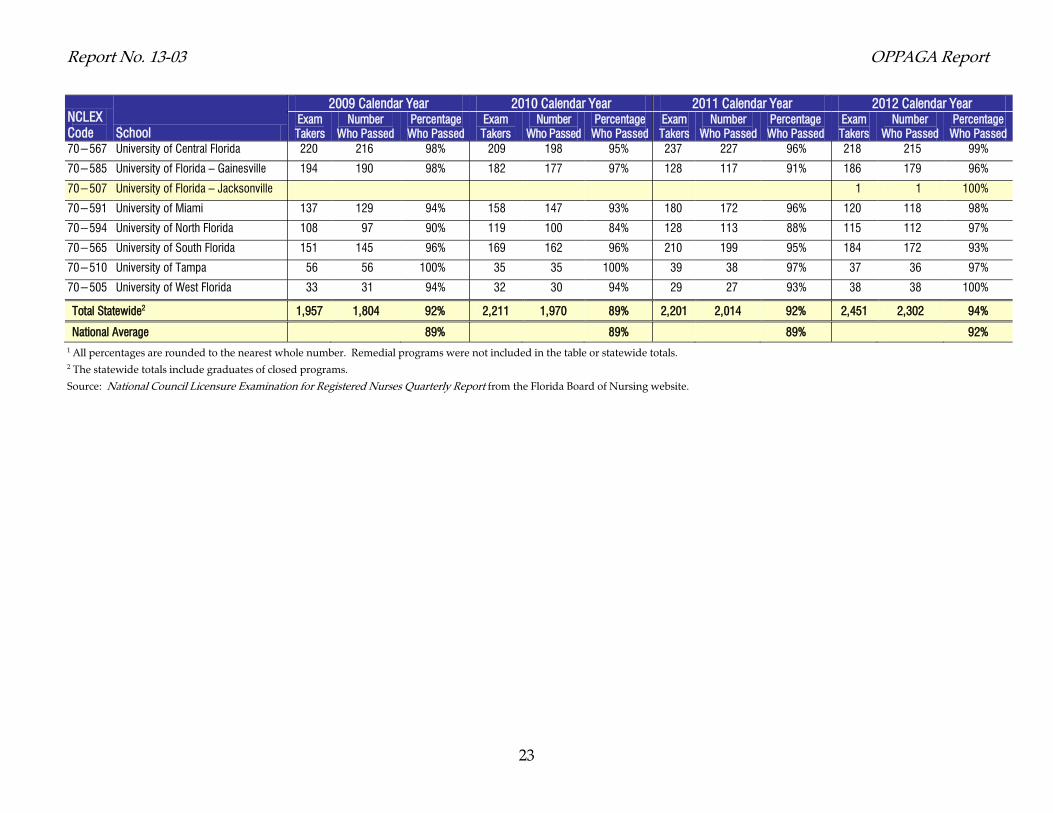
Bachelor of Science in Nursing (Generic and Second Degree) Program Graduate Exam Scores Exhibit B-3 shows for each institution the passage rates for bachelor of science in nursing program graduates who took the National Council of State Boards of Nursing Licensure Examination (NCLEX) in calendar years 2009, 2010, 2011, and 2012.31 This includes both bachelor of science in nursing (generic program) students and bachelor of science in nursing second degree students. The percentage of exam takers who passed increased from 2011 to 2012 (92% and 94%, respectively) as did the number of students passing the exam (2,014 and 2,302, respectively).
Exhibit B-3 Passage Rates for Bachelor of Science in Nursing Program Graduates1
NCLEX Code School
2009 Calendar Year 2010 Calendar Year 2011 Calendar Year 2012 Calendar Year Exam Takers
Number Who Passed
Percentage Who Passed
Exam Takers
Number Who Passed
Percentage Who Passed
Exam Takers
Number Who Passed
Percentage Who Passed
Exam Takers
Number Who Passed
Percentage Who Passed
70−592 Barry University 114 98 86% 149 114 77% 150 127 85% 154 145 94%
70−569 Bethune-Cookman University 29 21 72% 76 48 63% 63 49 78% 52 45 87%
70−525 Chamberlain College of Nursing 7 6 86% 56 50 89%
70−598 Florida A&M University 70 63 90% 72 61 85% 73 62 85% 84 76 90%
70−566 Florida Atlantic University 71 68 96% 98 83 85% 62 58 94% 76 70 92%
70−503 Florida Gulf Coast University 63 56 89% 60 49 82% 57 53 93% 63 62 98%
70−589 Florida International University 165 155 94% 192 173 90% 149 140 94% 223 211 95%
70−520 Florida Southern College 20 13 65% 21 16 76% 27 21 78%
70−590 Florida State University 131 122 93% 154 142 92% 108 103 95% 110 106 96%
70−702 Hope College of Arts and Sciences 1 1 100%
70−560 Jacksonville University 70 59 84% 66 61 92% 72 66 92% 74 73 99%
70−578 Nova Southeastern University – Ft. Lauderdale
91 83 91% 135 125 93% 145 137 94% 216 195 90%
70−596 Nova Southeastern University – Ft. Myers
21 19 90% 59 49 83%
70−530 Palm Beach Atlantic University 39 37 95% 21 21 100% 30 29 97% 52 48 92%
70−568 Pensacola Christian College 89 81 91% 96 85 89% 84 69 82% 86 81 94%
70−515 Remington College of Nursing 34 33 97% 71 66 93% 76 73 96%
70−504 South University – Tampa 69 49 71% 75 62 83% 80 69 86% 85 70 82%
70−570 South University – West Palm Beach 57 48 84% 59 51 86% 57 52 91% 58 55 95%
31 This data includes only first-time test takers.
Report No. 13-03 OPPAGA Report
23
NCLEX Code School
2009 Calendar Year 2010 Calendar Year 2011 Calendar Year 2012 Calendar Year Exam Takers
Number Who Passed
Percentage Who Passed
Exam Takers
Number Who Passed
Percentage Who Passed
Exam Takers
Number Who Passed
Percentage Who Passed
Exam Takers
Number Who Passed
Percentage Who Passed
70−567 University of Central Florida 220 216 98% 209 198 95% 237 227 96% 218 215 99%
70−585 University of Florida – Gainesville 194 190 98% 182 177 97% 128 117 91% 186 179 96%
70−507 University of Florida – Jacksonville 1 1 100%
70−591 University of Miami 137 129 94% 158 147 93% 180 172 96% 120 118 98%
70−594 University of North Florida 108 97 90% 119 100 84% 128 113 88% 115 112 97%
70−565 University of South Florida 151 145 96% 169 162 96% 210 199 95% 184 172 93%
70−510 University of Tampa 56 56 100% 35 35 100% 39 38 97% 37 36 97%
70−505 University of West Florida 33 31 94% 32 30 94% 29 27 93% 38 38 100%
Total Statewide2 1,957 1,804 92% 2,211 1,970 89% 2,201 2,014 92% 2,451 2,302 94%
National Average
89%
89%
89%
92% 1 All percentages are rounded to the nearest whole number. Remedial programs were not included in the table or statewide totals. 2 The statewide totals include graduates of closed programs.
Source: National Council Licensure Examination for Registered Nurses Quarterly Report from the Florida Board of Nursing website.
The Florida Legislature
Office of Program Policy Analysis and Government Accountability
OPPAGA provides performance and accountability information about Florida government in several ways.
Reports deliver program evaluation and policy analysis to assist the Legislature in overseeing government operations, developing policy choices, and making Florida government more efficient and effective.
PolicyCasts, short narrated slide presentations, provide bottom-line briefings of findings and recommendations for select reports.
Government Program Summaries (GPS), an online encyclopedia, www.oppaga.state.fl.us/government, provides descriptive, evaluative, and performance information on more than 200 Florida state government programs.
PolicyNotes, an electronic newsletter, delivers brief announcements of research reports, conferences, and other resources of interest for Florida's policy research and program evaluation community.
Visit OPPAGA’s website at www.oppaga.state.fl.us
OPPAGA supports the Florida Legislature by providing data, evaluative research, and objective analyses that assist legislative budget and policy deliberations. This project was conducted in accordance with applicable evaluation standards. Copies of this report in print or alternate accessible format may be obtained by telephone (850/488-0021), by FAX (850/487-3804), in person, or by mail (OPPAGA Report Production, Claude Pepper Building, Room 312, 111 W. Madison St., Tallahassee, FL 32399-1475). Cover photo by Mark Foley. OPPAGA website: www.oppaga.state.fl.us
Project supervised by Emily Sikes (850/717-0531)
Project conducted by Heather Orender Turner (850/717-0533), Brian Underhill, and William Howard
David Summers (850/717-0555), Staff Director, Education Policy Area
R. Philip Twogood, Coordinator
Related Documents