Florida By Meagan Batdorff Introduction This chapter compares district and charter school revenues statewide, and for Miami-Dade County and Broward County, for fiscal year 2011 (FY11). i Comparisons are made to previous research for FY03 and FY07, based on the same methodology. Funding disparities between districts and charter schools for the same geographic area are explored. The per pupil funding values in the analysis are weighted to compare district and charter schools as though they served the same proportions of urban and suburban students (see Methodology for details). Additional research and insights not included in this chapter appear in the monograph at the beginning of this report. The monograph also includes a state- by-state Return on Investment (ROI) analysis, which combines the analysis of revenues with student performance data. Highlights of the FY11 Analysis Statewide, Florida’s 430 charter schools included in this analysis received 20.7 percent less funding than district schools; $10,154 vs. $8,047 per pupil. Florida’s charter schools received $8,047 per pupil, but district schools would have received an estimated $10,177 to educate the same students – a difference of $2,129 or 20.9 percent. The weighted district per pupil therefore increases the funding disparity by $22 from the unweighted statewide difference above. Broward’s 67 charter schools in this report received 20.2 percent less funding than district schools: $10,175 vs. $8,121 per pupil, a difference of $2,054 per pupil. Miami-Dade’s 91 charter schools received 25.3 percent less funding than district schools: $10,641 vs. $7,953 per pupil, a difference of $2,688 per pupil. Charter schools in Florida educate 8.1 percent of total public school enrollment but receive only 6.6 percent of total revenues (Figures 2 & 3). Magnitude of Disparity: If all Florida school districts received the same level of per pupil funding as charter schools, districts would have received over $5 billion less in total revenues ($5,021,945,471). Figures 1 & 2 {Insert Figures 1 & 2} District $10,154 Charter $8,047 Disparity ($2,107) $0 $2,000 $4,000 $6,000 $8,000 $10,000 $12,000 Per Pupil Revenue FY11 Total Statewide Revenue & Disparity FL [CELLRANGE] [VALUE] [CELLRANGE] [VALUE] 0 1,000,000 2,000,000 3,000,000 District Charter Enrollment FY11 Total Statewide Enrollment FL GRADE FY2003 FY2007 FY2011 C F D Grade based on % of Weighted Funding Disparity FL

Welcome message from author
This document is posted to help you gain knowledge. Please leave a comment to let me know what you think about it! Share it to your friends and learn new things together.
Transcript
Florida
By Meagan Batdorff
Introduction
This chapter compares district and charter school revenues statewide, and for Miami-Dade County and Broward County, for fiscal year 2011 (FY11).i Comparisons are made to previous research for FY03 and FY07, based on the same methodology. Funding disparities between districts and charter schools for the same geographic area are explored. The per pupil funding values in the analysis are weighted to compare district and charter schools as though they served the same proportions of urban and suburban students (see Methodology for details). Additional research and insights not included in this chapter appear in the monograph at the beginning of this report. The monograph also includes a state-by-state Return on Investment (ROI) analysis, which combines the analysis of revenues with student performance data. Highlights of the FY11 Analysis
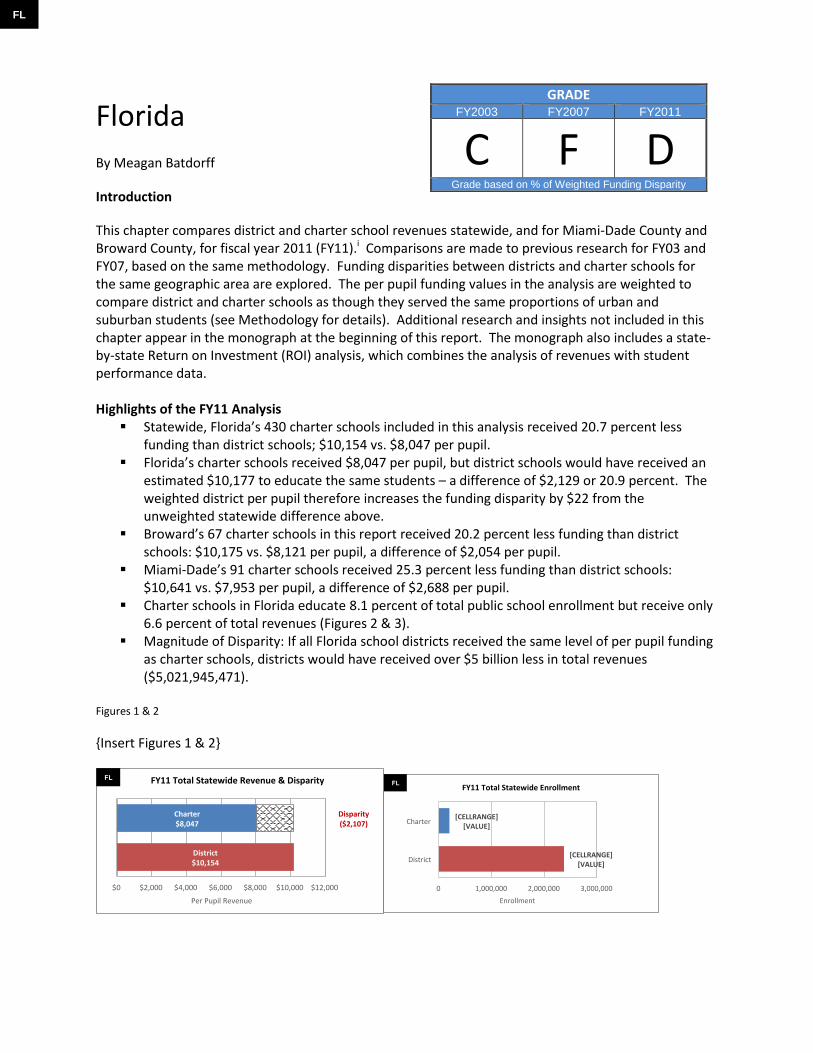
Statewide, Florida’s 430 charter schools included in this analysis received 20.7 percent less funding than district schools; $10,154 vs. $8,047 per pupil.
Florida’s charter schools received $8,047 per pupil, but district schools would have received an estimated $10,177 to educate the same students – a difference of $2,129 or 20.9 percent. The weighted district per pupil therefore increases the funding disparity by $22 from the unweighted statewide difference above.
Broward’s 67 charter schools in this report received 20.2 percent less funding than district schools: $10,175 vs. $8,121 per pupil, a difference of $2,054 per pupil.
Miami-Dade’s 91 charter schools received 25.3 percent less funding than district schools: $10,641 vs. $7,953 per pupil, a difference of $2,688 per pupil.
Charter schools in Florida educate 8.1 percent of total public school enrollment but receive only 6.6 percent of total revenues (Figures 2 & 3).
Magnitude of Disparity: If all Florida school districts received the same level of per pupil funding as charter schools, districts would have received over $5 billion less in total revenues ($5,021,945,471).
Figures 1 & 2
{Insert Figures 1 & 2}
District$10,154
Charter$8,047
Disparity($2,107)
$0 $2,000 $4,000 $6,000 $8,000 $10,000 $12,000
PerPupilRevenue
FY11TotalStatewideRevenue&DisparityFL
[CELLRANGE][VALUE]
[CELLRANGE][VALUE]
0 1,000,000 2,000,000 3,000,000
District
Charter
Enrollment
FY11TotalStatewideEnrollmentFL
GRADE FY2003 FY2007 FY2011
C F D Grade based on % of Weighted Funding Disparity
FL
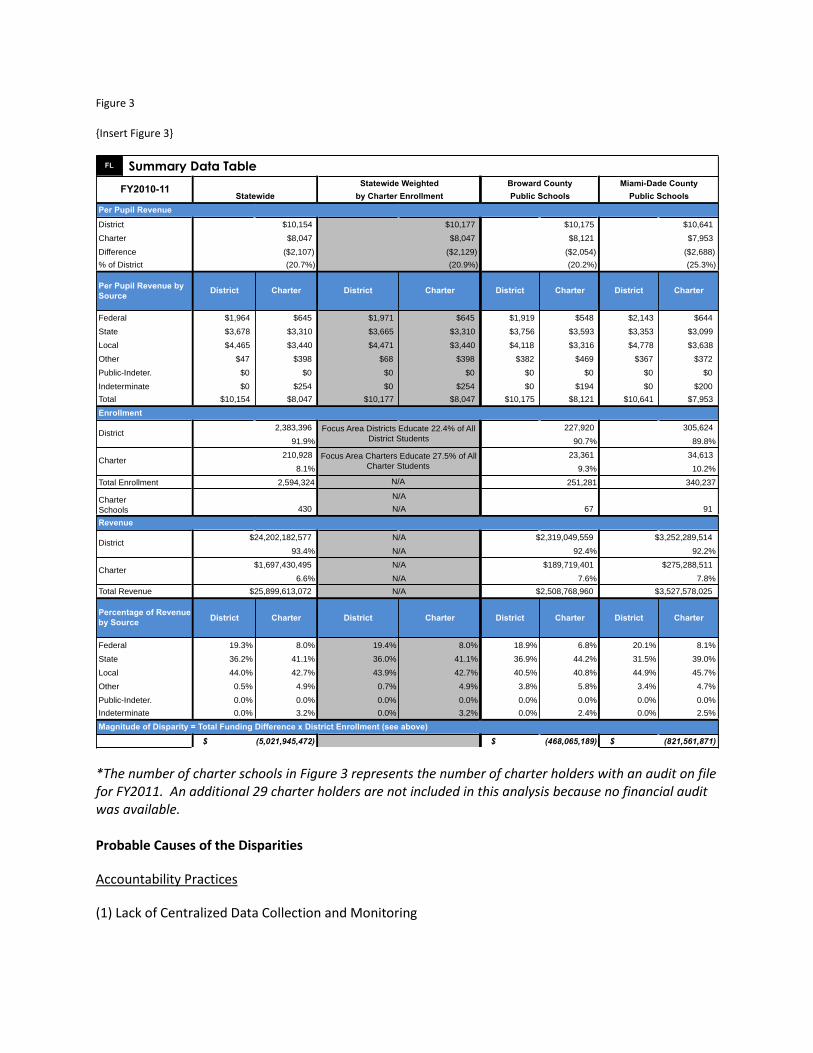
Figure 3
{Insert Figure 3}
*The number of charter schools in Figure 3 represents the number of charter holders with an audit on file for FY2011. An additional 29 charter holders are not included in this analysis because no financial audit was available. Probable Causes of the Disparities
Accountability Practices
(1) Lack of Centralized Data Collection and Monitoring
FL
Per Pupil Revenue
$10,154 $10,177 $10,175 $10,641
$8,047 $8,047 $8,121 $7,953
($2,107) ($2,129) ($2,054) ($2,688)
(20.7%) (20.9%) (20.2%) (25.3%)
District Charter District Charter District Charter District Charter
Federal $1,964 $645 $1,971 $645 $1,919 $548 $2,143 $644
State $3,678 $3,310 $3,665 $3,310 $3,756 $3,593 $3,353 $3,099
Local $4,465 $3,440 $4,471 $3,440 $4,118 $3,316 $4,778 $3,638
Other $47 $398 $68 $398 $382 $469 $367 $372
Public-Indeter. $0 $0 $0 $0 $0 $0 $0 $0
Indeterminate $0 $254 $0 $254 $0 $194 $0 $200
Total $10,154 $8,047 $10,177 $8,047 $10,175 $8,121 $10,641 $7,953
Enrollment
Total Enrollment 2,594,324 251,281 340,237
Revenue
District Charter District Charter District Charter District Charter
19.3% 8.0% 19.4% 8.0% 18.9% 6.8% 20.1% 8.1%
36.2% 41.1% 36.0% 41.1% 36.9% 44.2% 31.5% 39.0%
44.0% 42.7% 43.9% 42.7% 40.5% 40.8% 44.9% 45.7%
0.5% 4.9% 0.7% 4.9% 3.8% 5.8% 3.4% 4.7%
0.0% 0.0% 0.0% 0.0% 0.0% 0.0% 0.0% 0.0%
0.0% 3.2% 0.0% 3.2% 0.0% 2.4% 0.0% 2.5%
Magnitude of Disparity = Total Funding Difference x District Enrollment (see above)
Summary Data Table
District
Charter
Schools
Per Pupil Revenue by
Source
District
Charter
Charter
Total Revenue
Percentage of Revenue
by Source
% of District
FY2010-11
Federal
State
Local
Other
Public-Indeter.
Indeterminate
$25,899,613,072 N/A $2,508,768,960 $3,527,578,025
District
Charter
Difference
(5,021,945,472)$ (468,065,189)$ (821,561,871)$
93.4% N/A 92.4% 92.2%
6.6% N/A 7.6% 7.8%
$1,697,430,495 N/A $189,719,401 $275,288,511
N/A
N/A
2,383,396
91.9%
210,928 23,361
8.1% 9.3%
67
Focus Area Charters Educate 27.5% of All
Charter Students
Focus Area Districts Educate 22.4% of All
District Students
$3,252,289,514$24,202,182,577
Public Schools
Broward County Miami-Dade County
Public Schools
Statewide Weighted
N/A
Statewide
305,624
89.8%
34,613
10.2%
91
N/A
227,920
$2,319,049,559
430
90.7%
by Charter Enrollment
The absence of a centralized data collection and monitoring system for charter school funding fuels a system of poor accountability and leads to abuses, misuses, misinterpretations, and a general “falling short” of what the law intends.
Disparities by Design
(1) Local Revenue Access
Beyond FEFP required effort, statute does not require school districts to pass-on additional revenues from local millage levies and optional sales tax receipts. Florida statute states that local school districts may include charter schools in additional levies at the district’s discretion, which results in charter schools rarely being includedii. Statewide, charter schools received $1,025 per pupil less than districts in Local revenues. The disparity in Local revenues is also likely understated given the process we use to estimate what portion of FEFP revenues are from Local sources versus State sources.
(2) Federal Revenue Access
With the exception of the charter schools chartered under the Lake Wales Charter Schools Association in Polk County, Florida, charter schools in Florida do not have district status (LEA status) for funding purposes. Florida charter schools are therefore reliant on the district for fair dispersal of Federal funding and or program funds. Our data shows that charter schools with LEA status are more likely to generate higher levels of Federal funding per pupil than charters without LEA status for funding purposes.
Many Florida districts provide services in lieu of Federal funding. Florida statutes (and Federal law) states that all charter schools “…shall receive all Federal funding for which the school is otherwise eligible”. Because many districts provide services rather than funding, it is difficult to assess whether charter schools are receiving their fair share of Federal funds and or services. Statewide charter schools received $1,319 per pupil less in Federal funds than district schools. The difference is greater in the two focus districts: Broward district students received $1,371 more than charter schools per pupil and Miami-Dade district students received $1,499 more in Federal funding than charter school students.
(3) Facilities Revenue Access
Qualifying charter schools in Florida receive a per pupil facilities amount. This amount has historically been much less than traditional districts can generate per pupil from combined sources for facilities. A recent report found that charter school capital revenues were just 31 percent of what districts receive.iii However, in the past few years the Florida legislature has increased the facilities funding amount. Charter schools do not, however, have statutory access to Local property tax and sale tax option revenues for capital.
Figures 4 & 5
{Insert Figs 4 & 5}
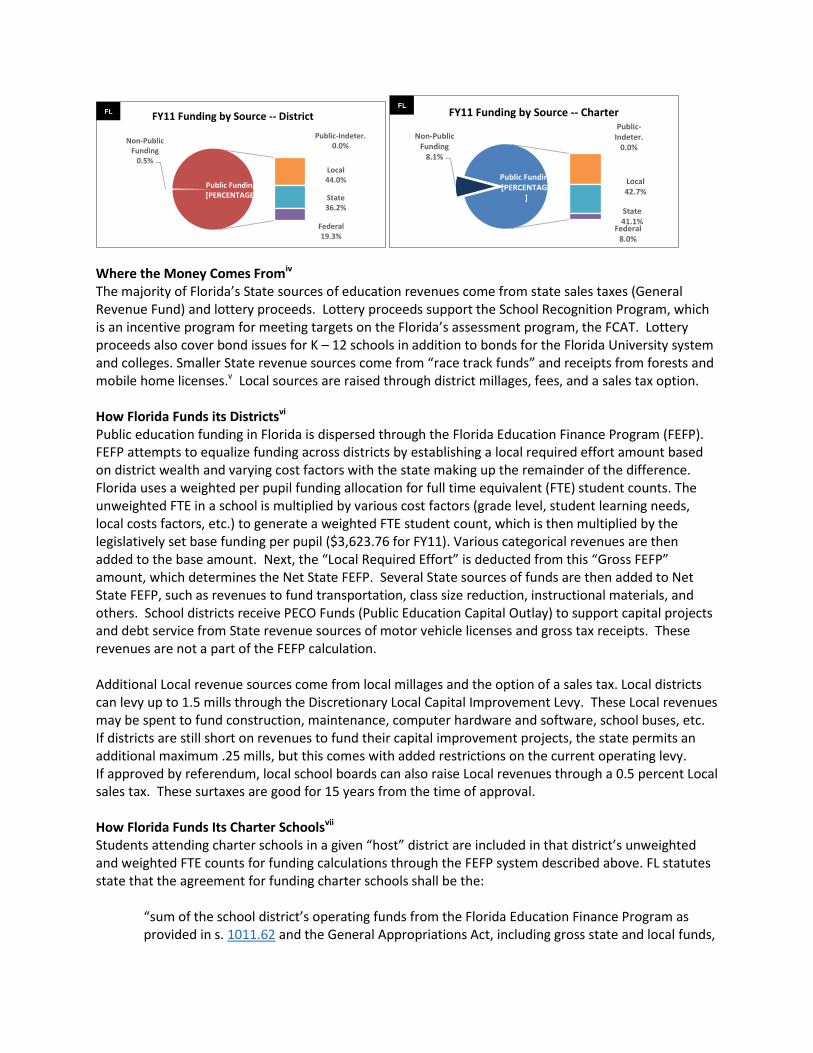
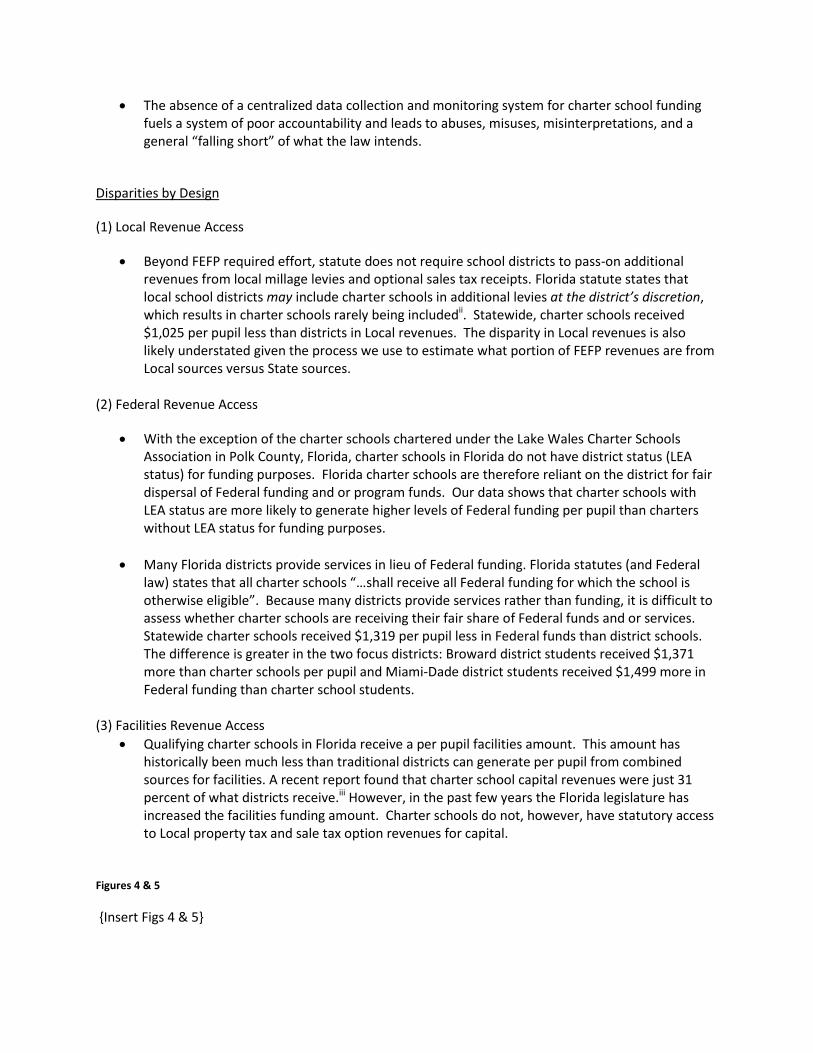
Where the Money Comes Fromiv The majority of Florida’s State sources of education revenues come from state sales taxes (General Revenue Fund) and lottery proceeds. Lottery proceeds support the School Recognition Program, which is an incentive program for meeting targets on the Florida’s assessment program, the FCAT. Lottery proceeds also cover bond issues for K – 12 schools in addition to bonds for the Florida University system and colleges. Smaller State revenue sources come from “race track funds” and receipts from forests and mobile home licenses.v Local sources are raised through district millages, fees, and a sales tax option. How Florida Funds its Districtsvi Public education funding in Florida is dispersed through the Florida Education Finance Program (FEFP). FEFP attempts to equalize funding across districts by establishing a local required effort amount based on district wealth and varying cost factors with the state making up the remainder of the difference. Florida uses a weighted per pupil funding allocation for full time equivalent (FTE) student counts. The unweighted FTE in a school is multiplied by various cost factors (grade level, student learning needs, local costs factors, etc.) to generate a weighted FTE student count, which is then multiplied by the legislatively set base funding per pupil ($3,623.76 for FY11). Various categorical revenues are then added to the base amount. Next, the “Local Required Effort” is deducted from this “Gross FEFP” amount, which determines the Net State FEFP. Several State sources of funds are then added to Net State FEFP, such as revenues to fund transportation, class size reduction, instructional materials, and others. School districts receive PECO Funds (Public Education Capital Outlay) to support capital projects and debt service from State revenue sources of motor vehicle licenses and gross tax receipts. These revenues are not a part of the FEFP calculation. Additional Local revenue sources come from local millages and the option of a sales tax. Local districts can levy up to 1.5 mills through the Discretionary Local Capital Improvement Levy. These Local revenues may be spent to fund construction, maintenance, computer hardware and software, school buses, etc. If districts are still short on revenues to fund their capital improvement projects, the state permits an additional maximum .25 mills, but this comes with added restrictions on the current operating levy. If approved by referendum, local school boards can also raise Local revenues through a 0.5 percent Local sales tax. These surtaxes are good for 15 years from the time of approval. How Florida Funds Its Charter Schoolsvii Students attending charter schools in a given “host” district are included in that district’s unweighted and weighted FTE counts for funding calculations through the FEFP system described above. FL statutes state that the agreement for funding charter schools shall be the:
“sum of the school district’s operating funds from the Florida Education Finance Program as provided in s. 1011.62 and the General Appropriations Act, including gross state and local funds,
Non-PublicFunding0.5%
Public-Indeter.0.0%
Local44.0%
State36.2%
Federal19.3%
PublicFunding[PERCENTAGE]
FY11FundingbySource--DistrictFL
Non-PublicFunding8.1%
Public-Indeter.0.0%
Local42.7%
State41.1%
Federal8.0%
PublicFunding[PERCENTAGE
]
FY11FundingbySource--CharterFL
discretionary lottery funds, and funds from the school district’s current operating discretionary millage levy; divided by total funded weighted full-time equivalent students in the school district; multiplied by the weighted full-time equivalent students for the charter school.”
Charter schools are also eligible for their proportionate share of categorical funds, including transportation. Statute also states that: “If the district school board is providing programs or services to students funded by federal funds, any eligible students enrolled in charter schools in the school district shall be provided federal funds for the same level of service provided students in the schools operated by the district school board.” The battle for fair dispersal of Federal funding hinges on this section of the law for Florida charters. Many school districts still provide services in lieu of Federal funding whereas the law mandates school districts provide “funds” for the same level of services provided. Florida charter schools receive all State, Local, and Federal funding through district pass-throughs. With the exception of a maximum 5 percent administrative fee that districts can withhold, charter schools should receive equal funding for similar students served, according to state statute. Charter schools do not, however, have access to additional local millage and sale tax option revenues. Funding for Public School Facilities Florida school districts receive State facilities funds through the Public Education Capital Outlay (PECO) and Debt Service Trust Fund. However, for FY11, traditional school districts did not receive state funds through PECO, but charter schools received around $55 million.viii Local school districts also generate facilities money through bond millages, sales surtaxes, impact fees and up to 1.5 discretionary Mills. The Florida legislature annually calculates an amount of funds to be set aside for charter school capital outlay. Charter schools that received capital outlay funds during FY11 averaged $325 per pupil. Charter schools must meet eligibility criteria to apply for these funds, including sound fiscal and academic performance. Funds are awarded based on the number of students enrolled on a graduated rate with a lower pay-out for elementary schools and higher rates for high schools. Charters that meet the following criteria can applyix:
Have been in operation for three or more years;
New charter schools that were developed as “feeder” schools serving students from an existing charter school; or
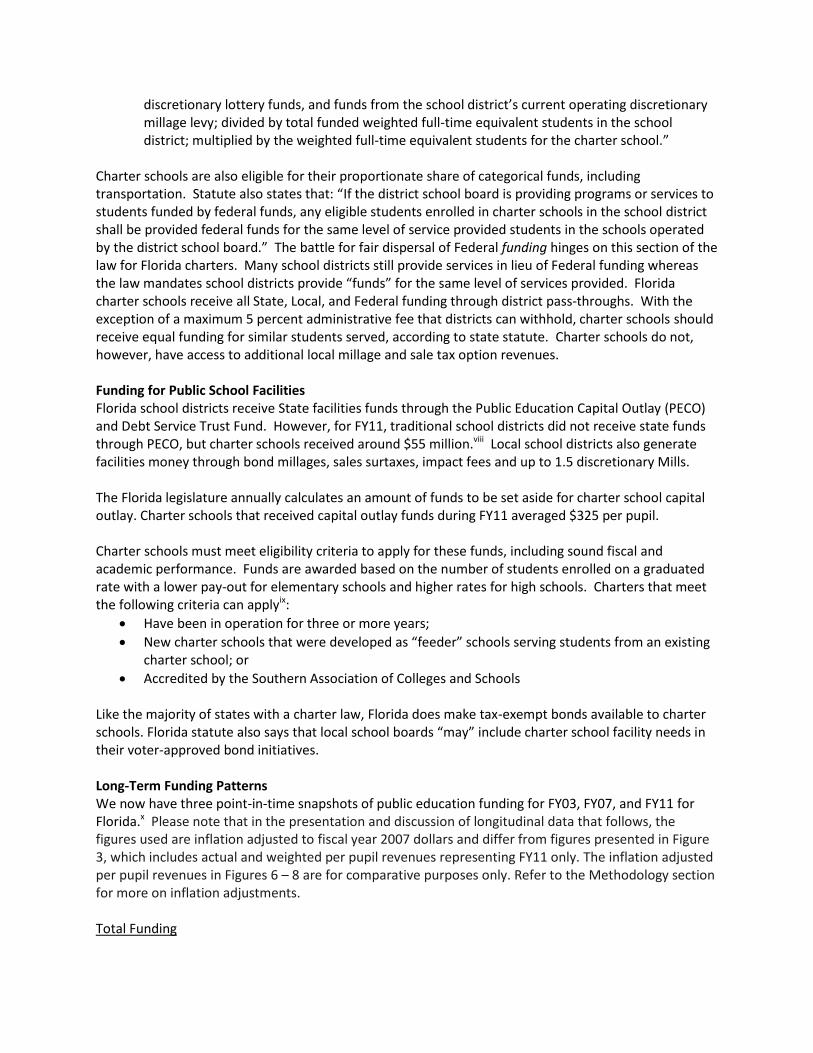
Accredited by the Southern Association of Colleges and Schools Like the majority of states with a charter law, Florida does make tax-exempt bonds available to charter schools. Florida statute also says that local school boards “may” include charter school facility needs in their voter-approved bond initiatives. Long-Term Funding Patterns We now have three point-in-time snapshots of public education funding for FY03, FY07, and FY11 for Florida.x Please note that in the presentation and discussion of longitudinal data that follows, the figures used are inflation adjusted to fiscal year 2007 dollars and differ from figures presented in Figure 3, which includes actual and weighted per pupil revenues representing FY11 only. The inflation adjusted per pupil revenues in Figures 6 – 8 are for comparative purposes only. Refer to the Methodology section for more on inflation adjustments. Total Funding
Florida reflects a common national trend we see amongst states with three fiscal years of point-in-time snapshot data, where funding increases were highest between FY03 and FY07 and then funding levels drop after the nationwide economic recession. When all revenue sources are combined, funding for Florida’s districts increased modestly by 5.6 percent between FY03 and FY11, rising from $8,849 to $9,342 per pupil. Statewide, funding for Florida’s charter schools, however, decreased by a near equal rate of 5.5 percent, falling from $7,838 in FY03 to $7,404 in FY11, a decrease of $434 per pupil. Florida’s two focus districts received slightly higher funding increases between FY03 and FY11, with Miami-Dade schools receiving 8.7 percent more or $783 per pupil and likewise, Broward district schools saw an increase of 8.0 percent in total per pupil funding with an increase from $8,666 in FY03 to $9,631 in FY11. Over this same timespan, charter schools in Miami-Dade saw funding increases of $12 per pupil or 0.2 percent and Broward charters received 5.4% more in funding or $384 per pupil. Figure 6
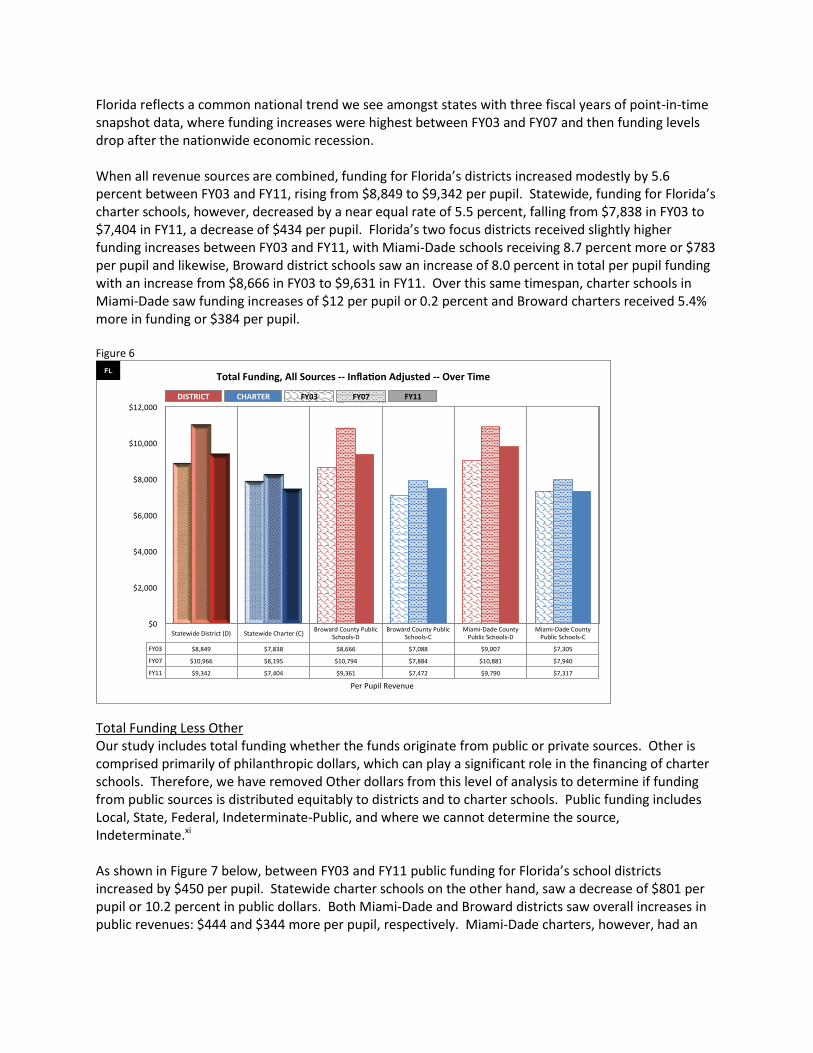
Total Funding Less Other Our study includes total funding whether the funds originate from public or private sources. Other is comprised primarily of philanthropic dollars, which can play a significant role in the financing of charter schools. Therefore, we have removed Other dollars from this level of analysis to determine if funding from public sources is distributed equitably to districts and to charter schools. Public funding includes Local, State, Federal, Indeterminate-Public, and where we cannot determine the source, Indeterminate.xi As shown in Figure 7 below, between FY03 and FY11 public funding for Florida’s school districts increased by $450 per pupil. Statewide charter schools on the other hand, saw a decrease of $801 per pupil or 10.2 percent in public dollars. Both Miami-Dade and Broward districts saw overall increases in public revenues: $444 and $344 more per pupil, respectively. Miami-Dade charters, however, had an
StatewideDistrict(D) StatewideCharter(C)BrowardCountyPublic
Schools-DBrowardCountyPublic
Schools-CMiami-DadeCountyPublicSchools-D
Miami-DadeCountyPublicSchools-C
FY03 $8,849 $7,838 $8,666 $7,088 $9,007 $7,305
FY07 $10,966 $8,195 $10,794 $7,884 $10,881 $7,940
FY11 $9,342 $7,404 $9,361 $7,472 $9,790 $7,317
$0
$2,000
$4,000
$6,000
$8,000
$10,000
$12,000
PerPupilRevenue
TotalFunding,AllSources--Infla onAdjusted--OverTimeFL
FY03 FY07 FY11DISTRICT CHARTER
overall decrease in public revenues of $330 per pupil and Broward charter school public revenues fell by $48 per pupil.
Figure 7
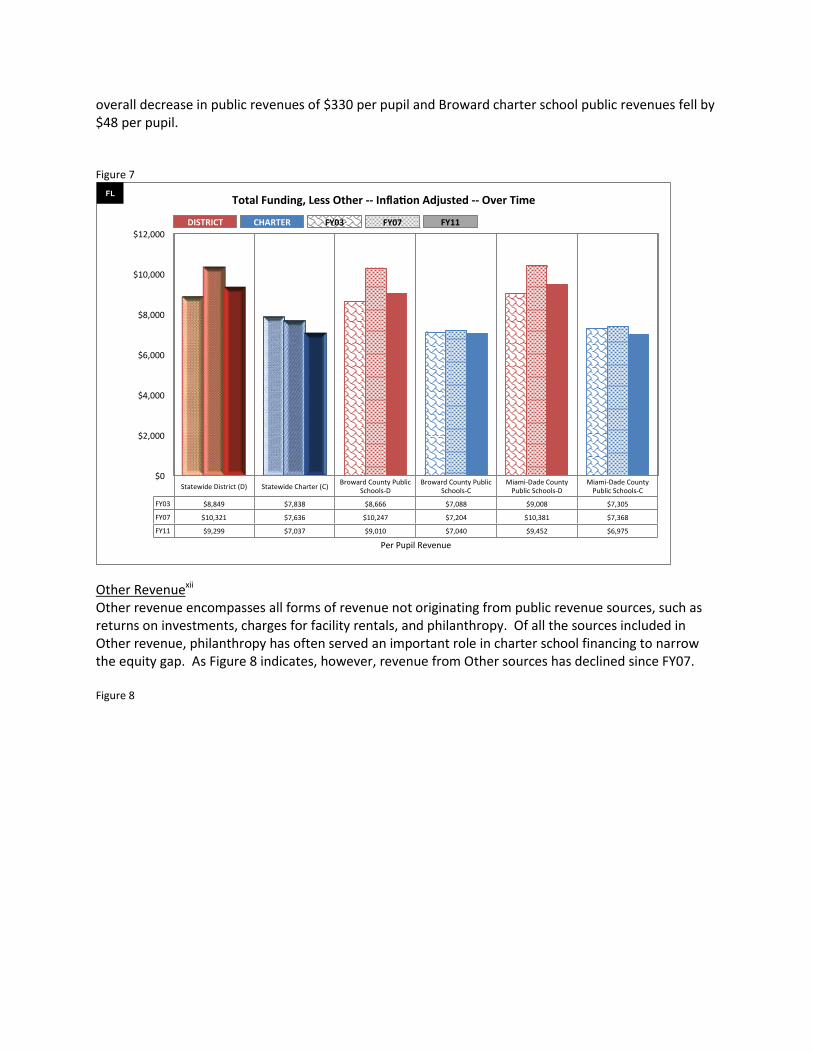
Other Revenuexii Other revenue encompasses all forms of revenue not originating from public revenue sources, such as returns on investments, charges for facility rentals, and philanthropy. Of all the sources included in Other revenue, philanthropy has often served an important role in charter school financing to narrow the equity gap. As Figure 8 indicates, however, revenue from Other sources has declined since FY07. Figure 8
StatewideDistrict(D) StatewideCharter(C)BrowardCountyPublic
Schools-DBrowardCountyPublic
Schools-CMiami-DadeCountyPublicSchools-D
Miami-DadeCountyPublicSchools-C
FY03 $8,849 $7,838 $8,666 $7,088 $9,008 $7,305
FY07 $10,321 $7,636 $10,247 $7,204 $10,381 $7,368
FY11 $9,299 $7,037 $9,010 $7,040 $9,452 $6,975
$0
$2,000
$4,000
$6,000
$8,000
$10,000
$12,000
PerPupilRevenue
TotalFunding,LessOther--Infla onAdjusted--OverTimeFL
FY03 FY07 FY11DISTRICT CHARTER
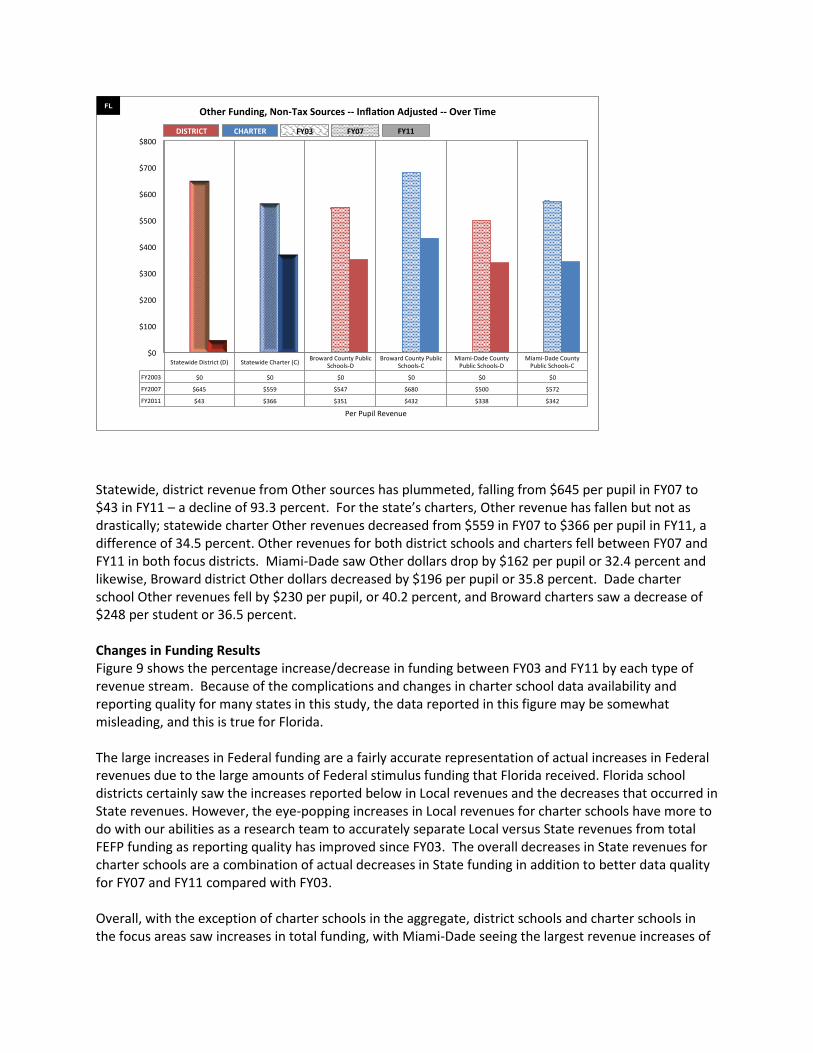
Statewide, district revenue from Other sources has plummeted, falling from $645 per pupil in FY07 to $43 in FY11 – a decline of 93.3 percent. For the state’s charters, Other revenue has fallen but not as drastically; statewide charter Other revenues decreased from $559 in FY07 to $366 per pupil in FY11, a difference of 34.5 percent. Other revenues for both district schools and charters fell between FY07 and FY11 in both focus districts. Miami-Dade saw Other dollars drop by $162 per pupil or 32.4 percent and likewise, Broward district Other dollars decreased by $196 per pupil or 35.8 percent. Dade charter school Other revenues fell by $230 per pupil, or 40.2 percent, and Broward charters saw a decrease of $248 per student or 36.5 percent. Changes in Funding Results Figure 9 shows the percentage increase/decrease in funding between FY03 and FY11 by each type of revenue stream. Because of the complications and changes in charter school data availability and reporting quality for many states in this study, the data reported in this figure may be somewhat misleading, and this is true for Florida. The large increases in Federal funding are a fairly accurate representation of actual increases in Federal revenues due to the large amounts of Federal stimulus funding that Florida received. Florida school districts certainly saw the increases reported below in Local revenues and the decreases that occurred in State revenues. However, the eye-popping increases in Local revenues for charter schools have more to do with our abilities as a research team to accurately separate Local versus State revenues from total FEFP funding as reporting quality has improved since FY03. The overall decreases in State revenues for charter schools are a combination of actual decreases in State funding in addition to better data quality for FY07 and FY11 compared with FY03. Overall, with the exception of charter schools in the aggregate, district schools and charter schools in the focus areas saw increases in total funding, with Miami-Dade seeing the largest revenue increases of
StatewideDistrict(D) StatewideCharter(C)BrowardCountyPublic
Schools-DBrowardCountyPublic
Schools-CMiami-DadeCountyPublicSchools-D
Miami-DadeCountyPublicSchools-C
FY2003 $0 $0 $0 $0 $0 $0
FY2007 $645 $559 $547 $680 $500 $572
FY2011 $43 $366 $351 $432 $338 $342
$0
$100
$200
$300
$400
$500
$600
$700
$800
PerPupilRevenue
OtherFunding,Non-TaxSources--Infla onAdjusted--OverTimeFL
FY03 FY07 FY11DISTRICT CHARTER
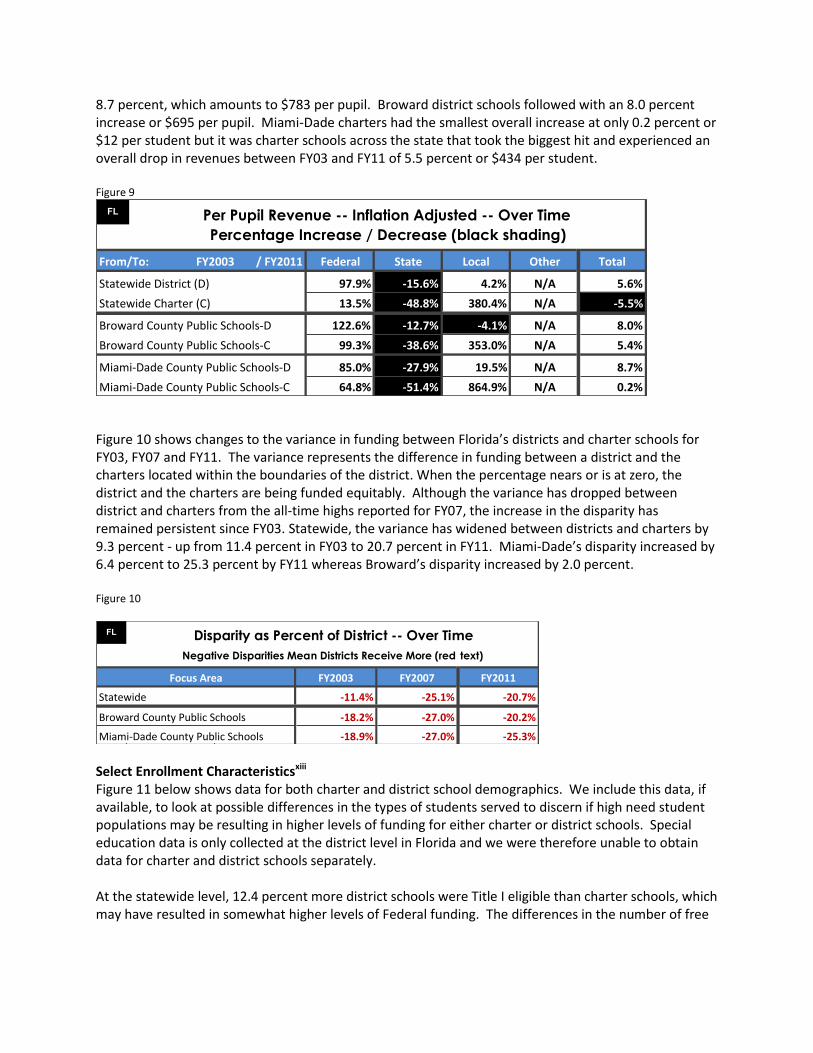
8.7 percent, which amounts to $783 per pupil. Broward district schools followed with an 8.0 percent increase or $695 per pupil. Miami-Dade charters had the smallest overall increase at only 0.2 percent or $12 per student but it was charter schools across the state that took the biggest hit and experienced an overall drop in revenues between FY03 and FY11 of 5.5 percent or $434 per student. Figure 9
Figure 10 shows changes to the variance in funding between Florida’s districts and charter schools for FY03, FY07 and FY11. The variance represents the difference in funding between a district and the charters located within the boundaries of the district. When the percentage nears or is at zero, the district and the charters are being funded equitably. Although the variance has dropped between district and charters from the all-time highs reported for FY07, the increase in the disparity has remained persistent since FY03. Statewide, the variance has widened between districts and charters by 9.3 percent - up from 11.4 percent in FY03 to 20.7 percent in FY11. Miami-Dade’s disparity increased by 6.4 percent to 25.3 percent by FY11 whereas Broward’s disparity increased by 2.0 percent. Figure 10
Select Enrollment Characteristicsxiii Figure 11 below shows data for both charter and district school demographics. We include this data, if available, to look at possible differences in the types of students served to discern if high need student populations may be resulting in higher levels of funding for either charter or district schools. Special education data is only collected at the district level in Florida and we were therefore unable to obtain data for charter and district schools separately. At the statewide level, 12.4 percent more district schools were Title I eligible than charter schools, which may have resulted in somewhat higher levels of Federal funding. The differences in the number of free
FL
From/To: FY2003 /FY2011 Federal State Local Other Total
StatewideDistrict(D) 97.9% -15.6% 4.2% N/A 5.6%
StatewideCharter(C) 13.5% -48.8% 380.4% N/A -5.5%
BrowardCountyPublicSchools-D 122.6% -12.7% -4.1% N/A 8.0%
BrowardCountyPublicSchools-C 99.3% -38.6% 353.0% N/A 5.4%
Miami-DadeCountyPublicSchools-D 85.0% -27.9% 19.5% N/A 8.7%
Miami-DadeCountyPublicSchools-C 64.8% -51.4% 864.9% N/A 0.2%
Per Pupil Revenue -- Inflation Adjusted -- Over Time
Percentage Increase / Decrease (black shading)
FL
FY2003 FY2007 FY2011
Statewide -11.4% -25.1% -20.7%
BrowardCountyPublicSchools -18.2% -27.0% -20.2%
Miami-DadeCountyPublicSchools -18.9% -27.0% -25.3%
Negative Disparities Mean Districts Receive More (red text)
Disparity as Percent of District -- Over Time
FocusArea
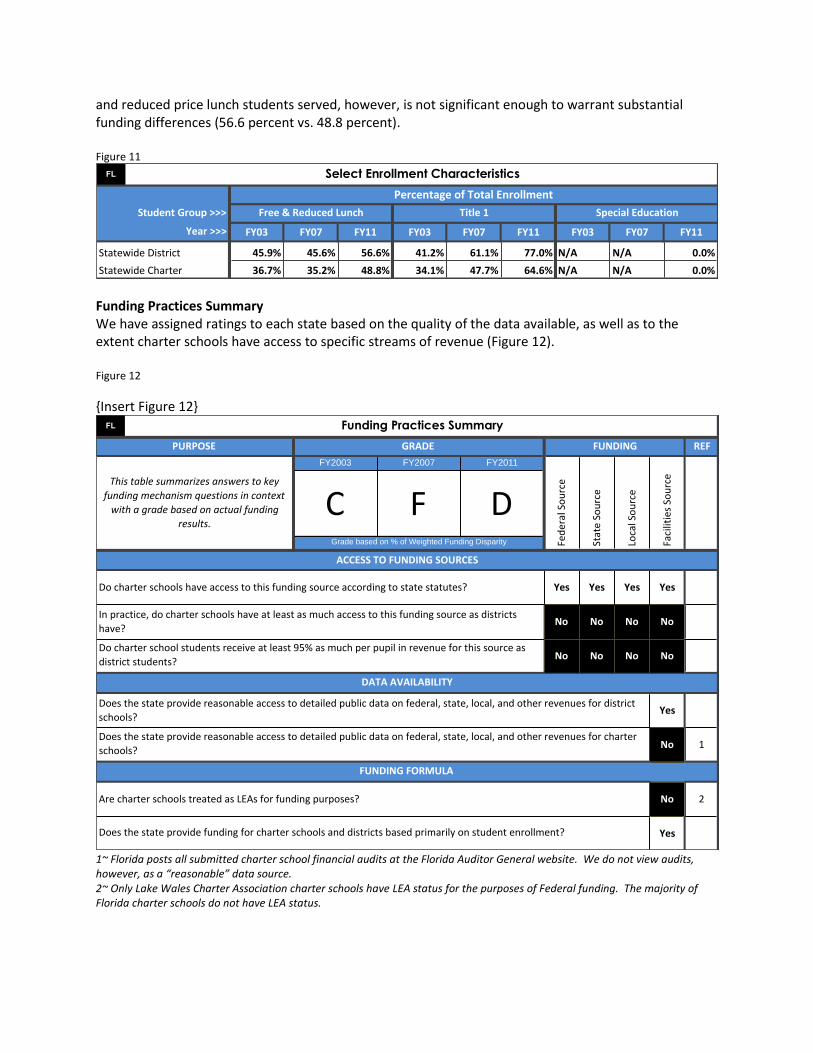
and reduced price lunch students served, however, is not significant enough to warrant substantial funding differences (56.6 percent vs. 48.8 percent). Figure 11
Funding Practices Summary We have assigned ratings to each state based on the quality of the data available, as well as to the extent charter schools have access to specific streams of revenue (Figure 12). Figure 12
{Insert Figure 12}
1~ Florida posts all submitted charter school financial audits at the Florida Auditor General website. We do not view audits, however, as a “reasonable” data source. 2~ Only Lake Wales Charter Association charter schools have LEA status for the purposes of Federal funding. The majority of Florida charter schools do not have LEA status.
FL
FY03 FY07 FY11 FY03 FY07 FY11 FY03 FY07 FY11
StatewideDistrict 45.9% 45.6% 56.6% 41.2% 61.1% 77.0% N/A N/A 0.0%
StatewideCharter 36.7% 35.2% 48.8% 34.1% 47.7% 64.6% N/A N/A 0.0%
StudentGroup>>>
Year>>>
Select Enrollment Characteristics
PercentageofTotalEnrollment
Free&ReducedLunch Title1 SpecialEducation
FL
REF
FY2003 FY2007 FY2011
C F D
Yes Yes Yes Yes
No No No No
No No No No
Yes
No 1
No 2
Yes
Thistablesummarizesanswerstokey
fundingmechanismquestionsincontext
withagradebasedonactualfunding
results.
Funding Practices Summary
PURPOSE
ACCESSTOFUNDINGSOURCES
Grade based on % of Weighted Funding Disparity
DATAAVAILABILITY
Doesthestateprovidereasonableaccesstodetailedpublicdataonfederal,state,local,andotherrevenuesfordistrict
schools?
Doesthestateprovidereasonableaccesstodetailedpublicdataonfederal,state,local,andotherrevenuesforcharter
schools?
FUNDINGFORMULA
ArecharterschoolstreatedasLEAsforfundingpurposes?
Doesthestateprovidefundingforcharterschoolsanddistrictsbasedprimarilyonstudentenrollment?
GRADE FUNDING
FederalSource
StateSource
LocalSource
FacilitiesSource
Docharterschoolshaveaccesstothisfundingsourceaccordingtostatestatutes?
Inpractice,docharterschoolshaveatleastasmuchaccesstothisfundingsourceasdistricts
have?
Docharterschoolstudentsreceiveatleast95%asmuchperpupilinrevenueforthissourceas
districtstudents?
Endnotes
i Several sources were used to compile the revenue analyzed for Florida’s districts and charters. The Florida Department of
Education provided data from the 2010-11 District Annual Financial Reports. These reports include but do not identify all revenues passed on to charter schools. The report provides data based on fund type and sources of revenue. For consistency across all states, we categorize all non-tax revenue sources under Other, and therefore we moved non-tax revenues that the state of Florida considers Local to Other. Financial data for all Florida charters originate from the annual financial audits for FY2010-11. The Florida Auditor General’s office posts all received Florida audits online. The charter school revenue analysis is based on a total of 430 charter campuses with annual financial audits on file. There were seven charter schools that were operational in FY 2010-11 but had no audit on file, and eight charter schools closed during FY 11 and filed no audit. An additional 14 charter schools were removed from the analysis because the schools’ student populations were 50% or more Pre-K and we could not identify all of the revenues associated with those Pre-K students to deduct those revenues from totals. We used the following methodology to deduct charter school “pass-through” revenues from district revenue totals:
All revenues for each charter school were entered into a database by district. Revenues were entered by source: Federal, State, Local, Other and where we could not determine the source, Indeterminate. We included a new category for FY11 called Indeterminate-Public where we could identify the revenue as public funding but could not identify whether that funding originated at the local, state or federal levels.
Approximately 75% of audits provided enough detail by source that we could identify revenues from Federal sources. However, the remaining 25% do not. We approximated an amount of federal revenues for the charter schools that identified no federal revenues. We totaled the federal revenues received by charter schools in each district and then used the percentage of total revenues received by charter schools for a given district that were federal to approximate a federal revenue amount for a charter school with no federal revenue detail. Therefore, federal revenue amounts for charter schools may be slightly over or underestimated.
Depending on the location and standard accounting procedures in a given district, charter school audits vary widely in the level of detail provided to identify revenues from state and local sources. The majority of audits provide a lump-sum total that combines state and local revenues that make-up “FEFP” – the “Florida Education Finance Program.” In order to estimate an amount of local versus state revenues that comprise the total FEFP amount, we developed a database to identify every district’s percentage of local funding from total FEFP funding. This came from the state’s Final FEFP Calculations. This percentage was then applied to every charter school’s FEFP total to approximate an amount that is “local” versus “state” revenues. This is an imperfect method, and we know from past analyses that this likely over-estimates actual “local” revenues.
Totals for each tax source of revenues were then deducted from state district revenue totals by source and the focus district revenue totals by source. ii “How Charter School Funding Compares.” Florida TaxWatch Center for Educational Performance and Accountability. February
2012. iii Ibid.
iv Florida House of Representatives. Florida Education Finance Program (FEFP) Fact Sheet, 2010-2011.
v Gibson, Robin. Memorandum. “RE: Funding Requirements for Florida Public Charter Schools.” January 7, 2013.
vi “Florida Education Finance Program (FEFP) Education Fact Sheet 2010-11”. Florida House of Representatives.
vii Florida State Statutes, Title XLVIII, 1002.33 Charter Schools.
viii Rehill, John. “Florida Stuffs School Districts Sending all $55 Million in PECO Funds to Charter Schools.” The Bradenton Times.
July 28, 2011. ix Florida Consortium of Public Charter Schools. “Florida Charter School Capital Outlay Program”.
http://floridacharterschools.org/schools/law_and_compliance/ x Data for FY03 compiled by the authors for the Thomas B. Fordham Institute report, Charter School Funding: Inequity’s Next
Frontier, 2005. Data for FY07 compiled by the authors for the Ball State University Report, Charter School Funding: Inequity Persists, 2010. xi For FY03, it is highly likely that there are Other revenues included in Indeterminate funding.
xii “Other” revenue data for FL was not available in FY 2003.
xiii National Center for Educational Statistics (NCES). Common Core of Data, Table Generator, FY11:
http://nces.ed.gov/ccd/elsi/. NCES had no Title I or F&RPL data entered for 46 schools or 9.1% of charter schools. These schools were omitted from the tally. Additionally, NCES did not have any reported data for 257 district schools, which were removed from the tally.
Related Documents