Florida GIS Coordination On-Line Survey Preliminary Results Martin Roche, GISP, CEcD GeoPlanning Services Orlando, FL (407) 608-4186 www.GeoPlanningServices.com

Florida GIS Coordination On-Line Survey Preliminary Results Martin Roche, GISP, CEcD GeoPlanning Services Orlando, FL (407) 608-4186 .
Dec 19, 2015
Welcome message from author
This document is posted to help you gain knowledge. Please leave a comment to let me know what you think about it! Share it to your friends and learn new things together.
Transcript

Florida GIS CoordinationOn-Line Survey
Preliminary Results
Martin Roche, GISP, CEcDGeoPlanning Services
Orlando, FL(407) 608-4186
www.GeoPlanningServices.com

Survey Respondents181 Total
City15%
County26%
State21%
Federal1%
Re-gional
6%
Pri-vate
Firms18%
Utility8%
Other6%
CityCountyStateFederalRegionalPrivate FirmsUtilityOther
• Other includes: School Districts, Universities, Not-For-Profit, Professional or Trade Association

Titles of Respondents
CIO (2)1%
Director (27)15%
Manager (52)29%
Analyst/Tech (69)
38%
User (19)10%
Other (12)7%
CIO (2)Director (27)Manager (52)Analyst/Tech (69)User (19)Other (12)
• Other includes: GIS Coordinator, Planner, Surveyor, Geographer, Engineer, Information Technologist, Forester

Business Drivers for GIS
• A “business driver” is a major program area, need, or challenge that GIS technology and geospatial data can help support or address.
Responses
Business Driver Percent
Count
Land Use Planning 50.7% 76Infrastructure Asset Management or Maintenance 46.7% 70Public Safety [law enforcement, crime analysis, emergency response, fire, E-911] 46.0% 69
Engineering Modeling or Analysis 46.0% 69Transportation Planning 42.7% 64Land Development or Other Permit Review and Tracking 40.7% 61Natural Resource Planning or Management 40.7% 61Environmental Assessment and Regulatory Management 40.0% 60Parks and Recreation 38.7% 58Transportation Management 30.0% 45
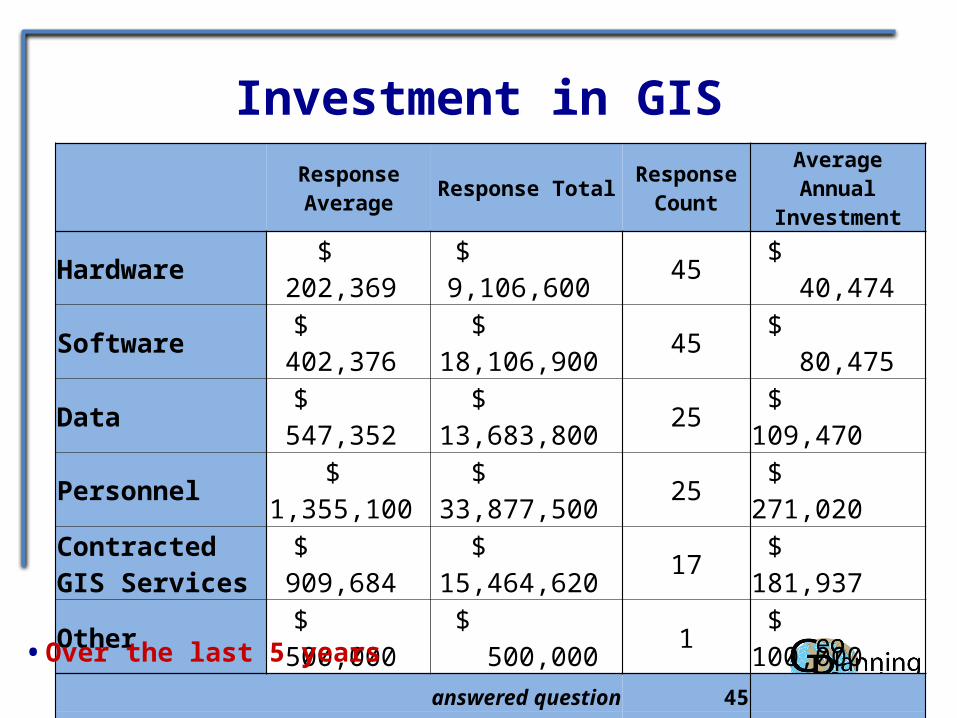
Investment in GIS
Response Average Response Total Response
Count
Average Annual
Investment
Hardware $ 202,369 $ 9,106,600 45 $ 40,474
Software $ 402,376 $ 18,106,900 45 $ 80,475
Data $ 547,352 $ 13,683,800 25 $ 109,470
Personnel $ 1,355,100 $ 33,877,500 25 $ 271,020
Contracted GIS Services $ 909,684 $
15,464,620 17 $ 181,937
Other $ 500,000 $ 500,000 1 $ 100,000
answered question 45 skipped question 134
• Over the last 5 years

Investment in GIS
Response
CountAnnual
InvestmentIf average applied to
each organization
Hardware ($) 45 $ 40,474 $ 5,706,803
Software ($) 45 $ 80,475 $ 11,346,991
Data ($) 25 $ 109,470 $ 15,435,326
Personnel ($) 25 $ 271,020 $ 38,213,820
Contracted GIS Services ($) 17 $ 181,937 $ 25,653,076
Other ($) 1 $ 100,000 $ 14,100,000
$ 110,456,015
• 141 Organizations responded to the survey

Investment in GIS
• Government entities in FL spend approximately
$110,000,000 per year
on GIS hardware, software, personnel, data, and contracted GIS services!
• Based on 141 organizations responding. This number is likely much larger when all levels of government are considered.

Desktop GIS Licenses Licenses Cost
Number RespondingPer
Organization Expenditure RespondingPer
Organization
Autodesk 1,011 46 22.0 $ 870,000 32 $ 16,731
Bentley Systems 467 16 29.2 $ 100,000 8 $ 5,882
ERDAS 249 26 9.6 $ 142,500 13 $ 4,914
ESRI 3,396 104 32.7 $ 4,260,000 75 $ 34,776
IDRISI
9 8 1.1 $ 2,500 1 $ 313
Intergraph 109 11 9.9 $ 57,500 5 $ 5,227
MapInfo 202 14 14.4 $ 145,000 8 $ 9,063
Smallworld 151 7 21.6 $ 162,500 2 $ 23,214
• Only Government responses included in table.

Organizations Desktop GIS Software
AutodeskBentley Systems
ERDASESRI
IDRISIIntergraph
MapInfoSmallworld
0 20 40 60 80 100 120 140 160

Server GIS Licenses
Yes Cost RespondedArcGIS Server 105 $ 1,022,500 52
MapServer 3 $ 7,500 1
GeoServer 3 $ 5,000 2
Manifold System 3 $ 2,500 1
Other? 10 $ 65,000 6
TOTAL 124 $1,102,500 62
• Only Government responses included in table.

GIS Benefits
Answer Options Yes NoNot
Applicable
Count
Improved Decision Making 111 0 1 112Improved Timeliness and Quality of Data and Services 109 3 2 114Improved Staff Productivity/Labor Cost Savings 104 4 3 111Reduction in Duplication and Redundancy 91 12 4 107Catalyst for Partnerships and Information Sharing 84 7 15 106More Effective Management/Allocation of Field Services 84 12 12 108Reduced Costs from Asset Management 74 13 19 106Protection/Enhancement of Natural Resources 76 8 27 111Support for Economic Development Initiatives 67 9 28 104Savings of Life and Property 66 15 25 106Code Compliance/Improved Voluntary Compliance 65 12 28 105Legal Compliance/Protection Against Expensive Legal Claims 65 12 29 106Avoidance of New Costs 60 20 22 102Savings in Capital Project Design and Construction 60 15 29 104Reduced Costs Through Joint Funding 56 19 25 100Increase in Revenue [improved collection of taxes] 52 20 29 101Protection from Catastrophic Records Loss 39 24 40 103
answered question 114
skipped question 67

Value of GIS to Organizations Average Total Count
Staff Productivity and Labor Cost Savings $ 961,100 $ 9,611,000 10
Revenue Increases [improved collection of taxes, fees, fines, insurance claims, etc.]
$ 2,500,000 $ 15,000,000 6
Reduction in Duplication and Redundancy $ 542,929 $ 3,800,500 7
Asset Management $ 1,030,000 $ 5,150,000 5
Support for Economic and Business Development Initiatives $ 45,167 $ 271,000 6
Avoidance of New Costs $ 1,050,000 $ 3,150,000 3
Savings in Capital Project Design $ 1,840,000 $ 9,200,000 5
Savings in Infrastructure Maintenance and Design $ 801,667 $ 4,810,000 6
More Effective Management/Allocation of Field Services $ 450,000 $ 2,250,000 5
Reduced Costs Through Joint Funding $ 301,333 $ 1,808,000 6
answered question 10
skipped question 171
• Benefits identified over the last 5 years.

Total Potential Benefit to State
Response Average
Response Count
Identified as Benefit
of GIS
Potential Benefit to
StateStaff Productivity and Labor Cost Savings ($) $ 961,100 10 105 $ 100,915,500
Revenue Increases [improved collection of taxes, fess, fines, insurance claims, etc.] ($) $ 2,500,000 6 53 $ 132,500,000 Reduction in Duplication and Redundancy ($) $ 542,929 7 92 $ 49,949,429
Asset Management ($) $ 1,030,000 5 75 $ 77,250,000
Support for Economic and Business Development Initiatives ($) $ 45,167 6 68 $ 3,071,333
Avoidance of New Costs ($) $ 1,050,000 3 61 $ 64,050,000
Savings in Capital Project Design ($) $ 1,840,000 5 60 $ 110,400,000
Savings in Infrastructure Maintenance and Design ($) $ 801,667 6 6 $ 4,810,000
More Effective Management/Allocation of Field Services ($) $ 450,000 5 85 $ 38,250,000
Reduced Costs Through Joint Funding ($) $ 301,333 6 57 $ 17,176,000 TOTAL $ 598,372,262

Benefits from GIS
• Government entities in FL benefit approximately
$598,000,000
from their investment inGIS hardware, software, personnel, data, and
contracted GIS services!
• The approximate net benefit per year is $9 million.

GIS Benefits
Answer Options Yes NoNot
Applicable
Count
Improved Decision Making 111 0 1 112Improved Timeliness and Quality of Data and Services 109 3 2 114Improved Staff Productivity/Labor Cost Savings 104 4 3 111Reduction in Duplication and Redundancy 91 12 4 107Catalyst for Partnerships and Information Sharing 84 7 15 106More Effective Management/Allocation of Field Services 84 12 12 108Reduced Costs from Asset Management 74 13 19 106Protection/Enhancement of Natural Resources 76 8 27 111Support for Economic Development Initiatives 67 9 28 104Savings of Life and Property 66 15 25 106Code Compliance/Improved Voluntary Compliance 65 12 28 105Legal Compliance/Protection Against Expensive Legal Claims 65 12 29 106Avoidance of New Costs 60 20 22 102Savings in Capital Project Design and Construction 60 15 29 104Reduced Costs Through Joint Funding 56 19 25 100Increase in Revenue [improved collection of taxes] 52 20 29 101Protection from Catastrophic Records Loss 39 24 40 103
answered question 114
skipped question 67

What Should a GIS Coordination Effort Do?
Answer Options Yes Pct No
Facilitate data exchange and provide documentation 101 95.28% 5Facilitate multi-agency data acquisition projects 98 93.33% 7
Work with the GIS community to develop best practices and guidelines98 93.33% 7
Provide access to federal and state grant opportunities 94 92.16% 8Advocate funding for GIS technology and data investments 95 91.35% 9Develop websites designed to promote and facilitate GIS program coordination, GIS data discovery, and data exchange 92 89.32% 11
Work with the GIS community and NSGIC to facilitate the development of common standards in support of product generation and data exchange
92 89.32% 11
Coordinate technical and policy issues between agencies and organizations88 88.00% 12
Aggregate data into seamless statewide layers 90 87.38% 13Coordinate bulk purchasing of training, software, and data 89 87.25% 13
Facilitate a program of data stewardship designed to maintain and update the state’s GIS data holdings
90 86.54% 14Develop a contract vehicle for GIS services 73 74.49% 25Purchasing and Procurement 63 64.95% 34
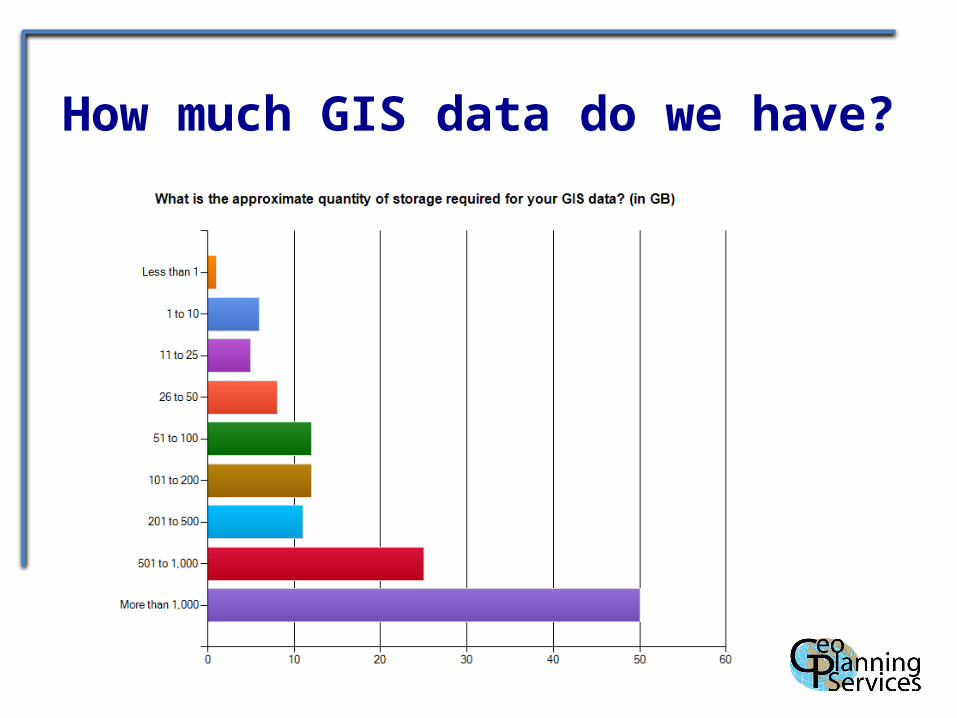
How much GIS data do we have?
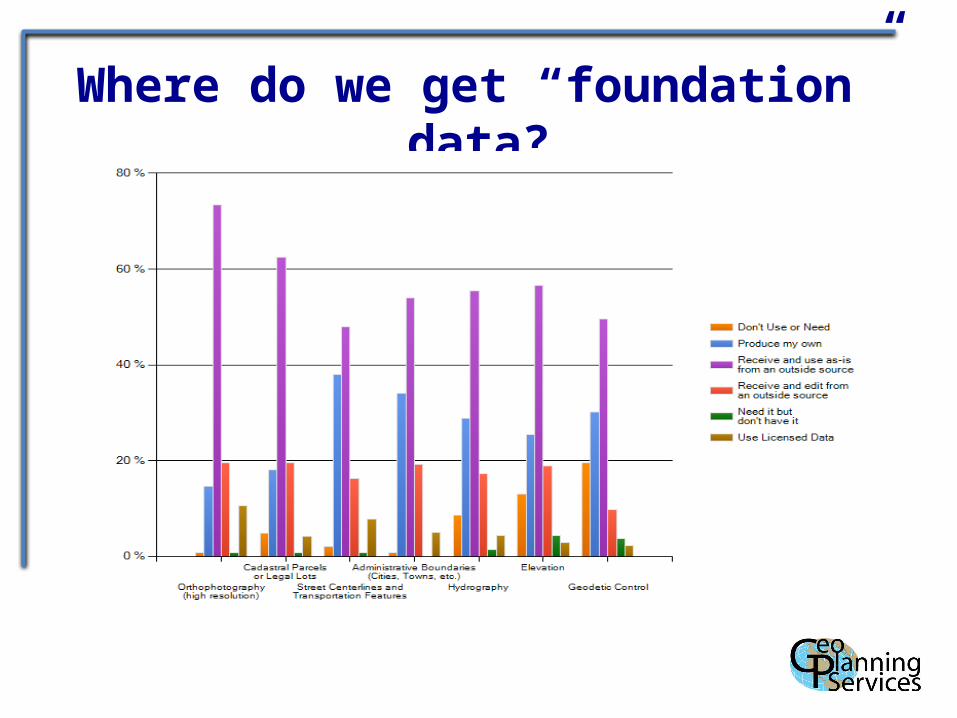
Where do we get “foundation” data?

Who provides map services?
• Do you provide map services?
70
39
YesNo

How can I get data?
• Do you have on-line data download enabled?
45
62 YesNo

Want to add your information?
• www.surveymonkey.com/s/FL-GIS-Coordination-Survey
Related Documents