Florida Alternate Assessment Technical Report 2007-2008 Prepared by Measured Progress for the Florida Department of Education

Welcome message from author
This document is posted to help you gain knowledge. Please leave a comment to let me know what you think about it! Share it to your friends and learn new things together.
Transcript
Florida Alternate Assessment
Technical Report 2007-2008
Prepared by Measured Progress for the Florida Department of Education

TABLE OF CONTENTS SECTION I: OVERVIEW, BACKGROUND, AND KEY COMPONENTS OF THE VALIDITY EVALUATION1
CHAPTER 1. VALIDITY STATEMENT..............................................................................................................................1 CHAPTER 2. OVERVIEW OF THE FLORIDA ALTERNATE ASSESSMENT ...........................................................................3
2.1 Florida’s Assessment Context.......................................................................................................................4 2.1.1 Core Beliefs............................................................................................................................................................... 5 2.1.2 Stakeholders .............................................................................................................................................................. 5
2.2 Purpose of the Florida Alternate Assessment ...............................................................................................6 2.3 Uses of the Florida Alternate Assessment.....................................................................................................6 2.4 Florida Alternate Assessment Participation .................................................................................................7 2.5 Florida Alternate Assessment Content..........................................................................................................8
2.5.1 Standards Review Institute, July 2005 ...................................................................................................................... 8 2.5.2 Reading and Language Arts Access Points ............................................................................................................... 9 2.5.3 English Language Arts Content ................................................................................................................................ 9 2.5.4 Mathematics Content .............................................................................................................................................. 10 2.5.5 Science Content....................................................................................................................................................... 10
2.6 Florida Alternate Assessment Alignment and Linkages..............................................................................10
SECTION II: TEST DEVELOPMENT, ADMINISTRATION, SCORING, AND REPORTING ...........................11
CHAPTER 3. TEST DEVELOPMENT ..............................................................................................................................11 3.1 Item-Design of the Florida Alternate Assessment.......................................................................................12 3.2 Item Components ........................................................................................................................................15 3.3 Florida Alternate Assessment Field Test: Blueprints .................................................................................15 3.4 Florida Alternate Assessment Field Test: Item Development .....................................................................24 3.5 Florida Alternate Assessment Field Test: Bias and Sensitivity Review ......................................................25 3.6 Florida Alternate Assessment Field Test: Content Review.........................................................................26 3.7 Florida Alternate Assessment Field Test: Administration ..........................................................................27 3.8 Florida Alternate Assessment Field Test: Statistics....................................................................................28 3.9 Florida Alternate Assessment Field Test: Survey Results...........................................................................29 3.10 Florida Alternate Assessment: Revisions Based on Field Test Results.......................................................30
CHAPTER 4. TRAINING AND ADMINISTRATION ...........................................................................................................33 4.1 Administrator Training ...............................................................................................................................33
4.1.1 Professional Development....................................................................................................................................... 33 4.1.2 Administration Manual ........................................................................................................................................... 33 4.1.3 Training DVD ......................................................................................................................................................... 34
4.2 Operational Test Administration ................................................................................................................35 4.2.1 Operational Test Survey Results ............................................................................................................................. 36
CHAPTER 5. SCORING .................................................................................................................................................39 5.1 Decision Rules for Scoring .........................................................................................................................39 5.2 Scoring Rubric ............................................................................................................................................41 5.3 Scoring Process ..........................................................................................................................................43
5.3.1 Handling of Incoming Forms .................................................................................................................................. 43 CHAPTER 6. SCANNING...............................................................................................................................................45
6.1 Data Security ..............................................................................................................................................49 6.2 Electronic Records......................................................................................................................................49 6.3 Physical Records ........................................................................................................................................50 6.4 Data Disposal .............................................................................................................................................50 6.5 Secure Test Material Distribution & Return...............................................................................................51
CHAPTER 7. REPORTING .............................................................................................................................................53 7.1 Report Shells...............................................................................................................................................53 7.2 Decision Rules for Reporting......................................................................................................................54
SECTION III—TECHNICAL CHARACTERISTICS OF THE FLORIDA ALTERNATE ASSESSMENT.........55
CHAPTER 8. TECHNICAL CHARACTERISTICS OF THE FLORIDA ALTERNATE ASSESSMENT ..........................................55 8.1 Performance Standards and Student Results ..............................................................................................55 8.2 Item Statistics..............................................................................................................................................62
8.2.1 Difficulty Indices .................................................................................................................................................... 63 8.2.2 Item Discrimination ................................................................................................................................................ 64 8.2.3 Summary of Item Analysis Results ......................................................................................................................... 65
8.3 Differential Item Functioning .....................................................................................................................66 CHAPTER 9. RELIABILITY ...........................................................................................................................................73
i
9.1 Reliability of Performance Level Categorization........................................................................................79 9.1.1 Computing Accuracy and Consistency ................................................................................................................... 80 9.1.2 Accuracy and Consistency Results.......................................................................................................................... 82
SECTION IV: THE VALIDITY EVALUATION .........................................................................................................85
CHAPTER 10. REVISITING THE VALIDITY EVALUATION QUESTIONS ........................................................................85
REFERENCES .................................................................................................................................................................87
APPENDICES...................................................................................................................................................................91
APPENDIX A–FLORIDA STAKEHOLDER LISTS ..............................................................................................................93 APPENDIX B–SAMPLE ITEM: FIELD TEST FORMAT ....................................................................................................105 APPENDIX C–SURVEYS AND RESULTS ........................................................................................................................113 APPENDIX D–SAMPLE ITEM: OPERATIONAL TEST FORMAT.......................................................................................129 APPENDIX E–REPORT SHELLS ....................................................................................................................................133 APPENDIX F–PARENT AND TEACHER BROCHURES .....................................................................................................147 APPENDIX G–ITEM SPECIFICATIONS DOCUMENT........................................................................................................155 APPENDIX H–RAW SCORE CUMULATIVE DISTRIBUTIONS ..........................................................................................181 APPENDIX I–ITEM ANALYSIS RESULTS.......................................................................................................................193 APPENDIX J–DECISION ACCURACY AND CONSISTENCY .............................................................................................227
ii
SECTION I: OVERVIEW, BACKGROUND, AND KEY COMPONENTS OF THE VALIDITY
EVALUATION Chapter 1. VALIDITY STATEMENT
This report describes several technical aspects of the Florida Alternate Assessment in an
effort to contribute to the accumulation of validity evidence to support Florida Alternate Assessment
score interpretations. Because it is the interpretations of test scores that are evaluated for validity, not
the test itself, this report presents documentation to substantiate intended interpretations (AERA,
1999). Each of the sections in this report contributes important information to the validity argument
by addressing one or more of the following aspects of the Florida Alternate Assessment: test
development, test alignment, test administration, scoring, reliability, achievement levels and
reporting. The report further outlines future plans of the Florida Department of Education (FLDOE)
to investigate other technical validity and reliability aspects of the assessment system.
The Florida Alternate Assessment outlined in this report is based on, and aligned to, the
Sunshine State Standards Access Points in reading, writing and mathematics. The science
assessments are aligned to the Sunshine State Standards due to the fact that at the time of
development the Access Points for science had not yet been created. Intended inferences from the
Florida Alternate Assessment results are about student achievement on Florida‘s reading, writing,
mathematics and science content standards and these alternate achievement inferences are meant to
be useful for program and instructional improvement and as a component of school accountability.
The Standards for Educational and Psychological Testing (1999) provides a framework for
describing sources of evidence that should be considered when constructing a validity argument.
These sources include evidence based on the following five general areas: test content, response
processes, internal structure, relationship to other variables, and consequences of testing. Although
Chapter 1—Validity Statement 1 2007–08 Florida Alt Technical Report
each of these sources may speak to a different aspect of validity, they are not distinct types of
validity. Instead, each contributes to a body of evidence about the comprehensive validity of score
interpretations.
Chapter 1—Validity Statement 2 2007–08 Florida Alt Technical Report
Chapter 2. OVERVIEW OF THE FLORIDA ALTERNATE ASSESSMENT
The Individuals with Disabilities Education Act (IDEA) requires that students with
disabilities be included in each state‘s system of accountability and that students with disabilities
have access to the general curriculum. The No Child Left Behind Act (NCLB) also speaks to the
inclusion of all students in a state‘s accountability system by requiring states to report student
achievement for all students as well as for specific groups of students (e.g., students with disabilities,
students for whom English is a second language) on a disaggregated basis. These federal laws reflect
an ongoing concern about equity. All students should be academically challenged and taught to high
standards. The involvement of all students in the educational accountability system provides a means
of measuring progress toward that goal.
To provide an option for participation of all students in the state‘s accountability system,
including those for whom participation in the general statewide assessment (the Florida
Comprehensive Assessment Test [FCAT]) is not appropriate, even with accommodations, Florida
has developed the Florida Alternate Assessment. The alternate assessment design for Florida is
based on the Sunshine State Standards Access Points for Students with Significant Cognitive
Disabilities in Language Arts (Reading and Writing), Mathematics, and Science. Access Points
represent the essence of the Sunshine State Standards with reduced levels of complexity:
Participatory, Supported, and Independent, with the Participatory Level being the least complex. The
Florida Alternate Assessment was developed to allow students an opportunity to progress through all
three levels of complexity per item. This tiered process provides students the opportunity to work to
their potential for each item in each content area. This is critical as educators seek to provide access
to the general education curriculum and foster higher expectations for the wide diversity of students
with significant cognitive disabilities. It is expected that only students with the most significant
cognitive disabilities who are eligible under IDEA will participate in the Florida Alternate
Assessment.
Chapter 2—Overview of the FLALT Assessment 3 2007–08 Florida Alt Technical Report
2.1 Florida’s Assessment Context
Florida‘s focus on educational accountability began in 1991 with the school improvement
and accountability legislation. The intent of this legislation was to ensure higher levels of
achievement for all students and more accountability for schools. In 1996, the Sunshine State
Standards were adopted by the State Board of Education and the Florida Comprehensive Assessment
Test (FCAT) was authorized by the legislature. During this same time period, efforts were made to
build capacity within school districts to develop and implement local alternate assessment tools for
students who could not participate in FCAT. In 1999, the legislature passed the A+ Plan for
Education which increased standards and accountability for students, schools, and educators. The
assessment system included reading and math in grades 3 through 10, writing in grades 4, 8 and 10,
science in grades 5, 8, and 11, and the development of a system for calculating individual academic
growth over a year‘s time. Florida‘s school grading system was implemented in 1999.
In 2005, Florida began the process of revising the Sunshine State Standards. As a part of this
revision, access points for students with significant cognitive disabilities were developed. These
access points represent the core intent of the standards with reduced levels of complexity. In
alignment with this activity, in 2007, Florida began design and development of a statewide alternate
assessment based on alternate achievement standards. The intent was to replace the system of local
assessments and state reporting aligned to previous standards with a new statewide assessment
aligned to the newly adopted access points.
Currently, Florida provides two statewide assessments, the general assessment (FCAT) and
an alternate assessment based on alternate achievement standards (Florida Alternate Assessment).
Reading and mathematics are assessed in grades 3 through 10. Writing assessments are provided for
grades 4, 8, and 10 and science assessments occur in grades 5, 8, and 11.
Chapter 2—Overview of the FLALT Assessment 4 2007–08 Florida Alt Technical Report
2.1.1 Core Beliefs
The mission of the Florida Department of Education is to lead and support schools and
communities in ensuring that all students achieve at the high levels needed to lead fulfilling and
productive lives, to compete in academic and employment settings, and to contribute to society. The
core beliefs that are held are that:
° all students can learn,
° all students should have access to general curriculum,
° all students should be challenged, and
° all students should have opportunities to demonstrate what they know and can do
2.1.2 Stakeholders
There have been many stakeholders involved with the development and implementation of
the Florida Alternate Assessment. An advisory committee, representing the perspectives of teachers,
and administrators, provided input during the development of the assessment. In addition, teacher
work groups were formed at several points in the development process. Starting in July 2005 the
Access Point work was accomplished by staff from Accountability and Assessment for Students
with Disabilities Project (PAEC) and the Accommodations and Modifications for Students with
Disabilities Project (FSU); in addition teachers and university personnel with special education and
content expertise were involved in the process. A bias and sensitivity work group, composed of
general and special education teachers and specialists, was formed. These educators reviewed the
initial passages for the reading assessments prior to the writing of items and reviewed a sampling of
science items. Another group of teachers worked to review all of the items for content, alignment to
the Access Points and appropriateness for the population of students being assessed. Another group
of special education teachers participated in the field testing, providing valuable feedback about the
test design. (Stakeholder lists can be found in Appendix A.)
Chapter 2—Overview of the FLALT Assessment 5 2007–08 Florida Alt Technical Report
2.2 Purpose of the Florida Alternate Assessment
Consistent with the state‘s general assessment (FCAT), the purposes of the Florida Alternate
Assessment are as follows: (1) assess the annual learning gains of each student toward achieving the
Sunshine State Standards appropriate for the student‘s grade level; (2) provide data for making
decisions regarding school accountability and recognition; (3) assess how well educational goals and
curricular standards are met at the school, district, and state levels; (4) provide information to aid in
the evaluation and development of educational programs and policies; and (5) provide information
on the performance of Florida students compared with that of other students across the United States.
2.3 Uses of the Florida Alternate Assessment
Florida Alternate Assessment results are provided at the student, school, district, and state
levels. Interpretative brochures for parents and teachers are sent to schools with the Florida Alternate
Assessment Student Score Reports. Educators, parents, and students are encouraged to use the
reported scores to inform instruction and chart student progress in meeting the Access Points.
Results of the Florida Alternate Assessment show educators how students with significant
cognitive disabilities are progressing toward learning the knowledge and skills contained in the
Sunshine State Standards Access Points. They can be used to assist IEP teams in developing annual
goals and objectives. The IEP team should examine the results in conjunction with other
informationœsuch as progress reports, report cards, and parent and teacher observationsœto see what
additional instruction is needed and in what areas.
The results can also be used to improve instructional planning. For example, a student
exhibiting skills within the participatory level of complexity at an advanced performance level may
be ready for work that is more difficult and will most likely be instructed on a combination of
Access Points at both the participatory and supported levels. Students‘ scores may also indicate a
Chapter 2—Overview of the FLALT Assessment 6 2007–08 Florida Alt Technical Report
need to have the curriculum adjusted or for students to be provided with additional supports and
learning opportunities.
2.4 Florida Alternate Assessment Participation
The Florida Alternate Assessment is an alternate achievement standards-based assessment
designed specifically for students with significant cognitive disabilities. There are three assessment
options; participating in the FCAT, participating in the FCAT with accommodations or participating
in the Florida Alternate Assessment. Students who meet the criteria to participate in the Florida
Alternate Assessment are unable to participate in the FCAT even with accommodations and are
working on alternate content standards that are measured against alternate achievement standards.
Individual Educational Plan (IEP) teams are responsible for determining whether students with
disabilities will participate in alternate assessment. The IEP team should consider the student‘s
present level of educational performance in reference to the Sunshine State Standards. In order to
facilitate informed and equitable decision making, IEP teams should answer each of the following
questions when determining whether or not a student should participate in the Florida Alternate
Assessment:
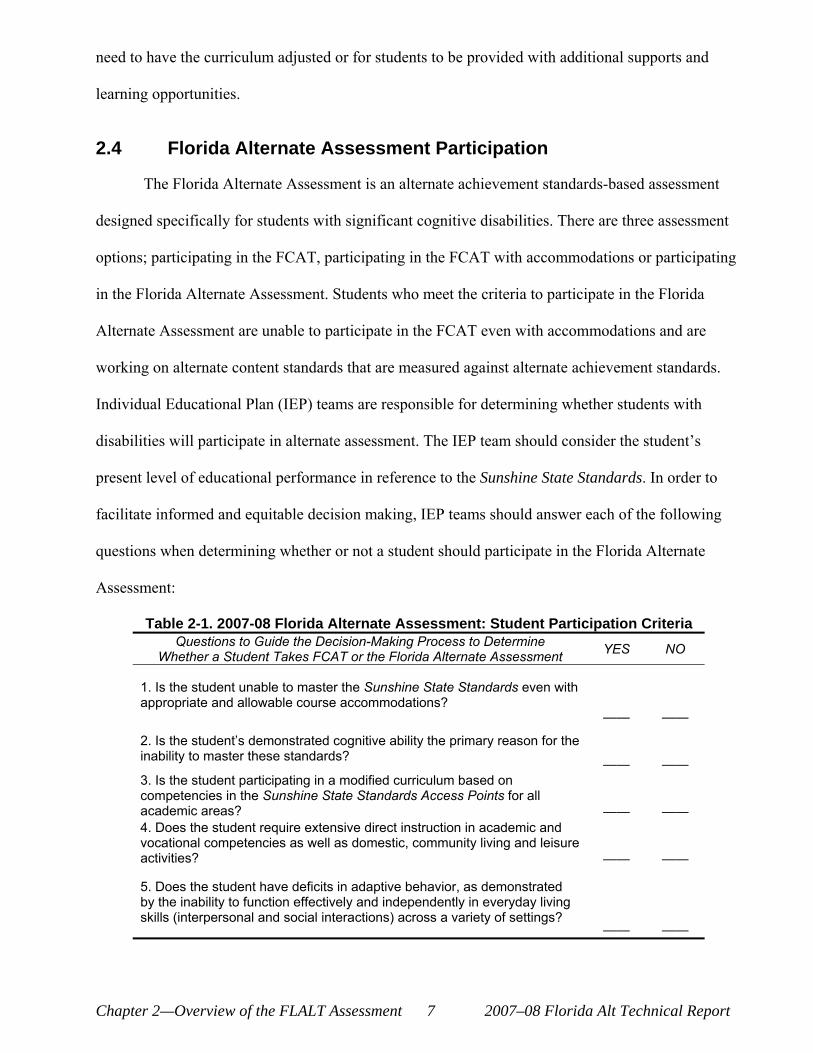
Table 2-1. 2007-08 Florida Alternate Assessment: Student Participation Criteria Questions to Guide the Decision-Making Process to Determine YES NOWhether a Student Takes FCAT or the Florida Alternate Assessment
1. Is the student unable to master the Sunshine State Standards even with appropriate and allowable course accommodations?
–– ––
2. Is the student‘s demonstrated cognitive ability the primary reason for the inability to master these standards? –– –– 3. Is the student participating in a modified curriculum based on competencies in the Sunshine State Standards Access Points for all academic areas? –– –– 4. Does the student require extensive direct instruction in academic and vocational competencies as well as domestic, community living and leisure activities? –– ––
5. Does the student have deficits in adaptive behavior, as demonstrated by the inability to function effectively and independently in everyday living skills (interpersonal and social interactions) across a variety of settings?
–– ––
Chapter 2—Overview of the FLALT Assessment 7 2007–08 Florida Alt Technical Report
If the IEP team determines that all five of the questions accurately characterize a student‘s
current educational situation, then the Florida Alternate Assessment should be used to provide a
meaningful evaluation of the student‘s current academic achievement. If —yes“ is not indicated in all
five areas, then the student should participate in the Florida Comprehensive Assessment Test
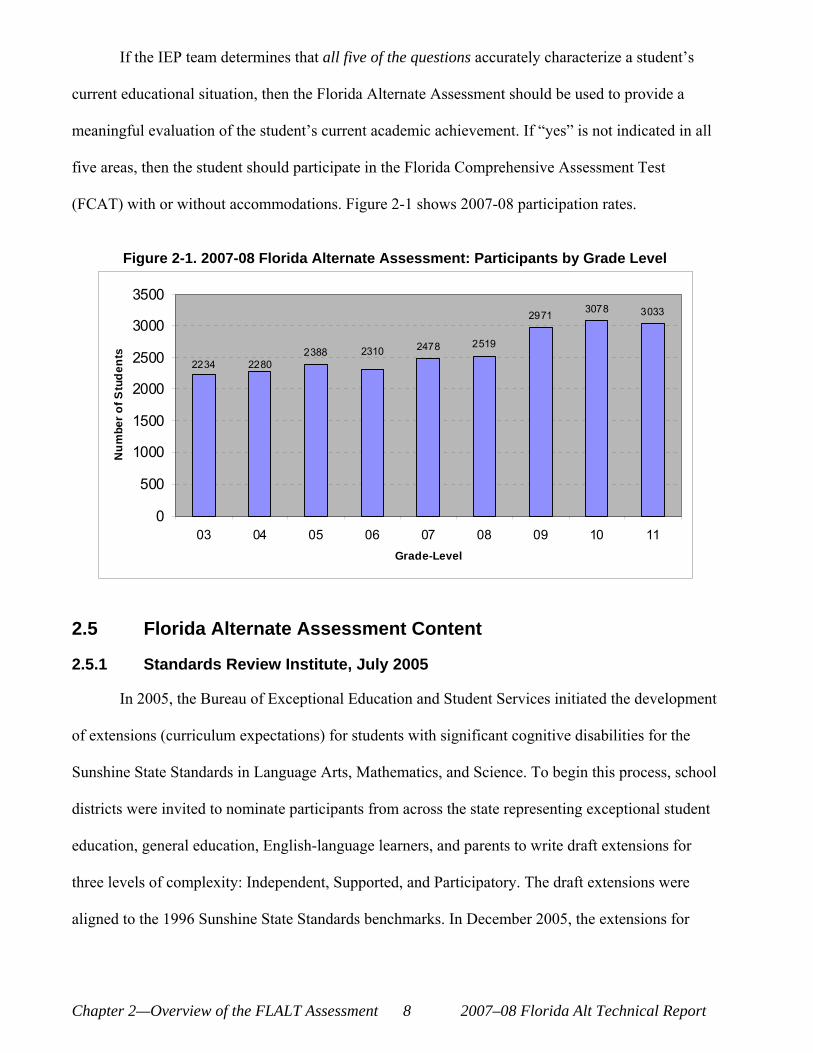
(FCAT) with or without accommodations. Figure 2-1 shows 2007-08 participation rates.
Figure 2-1. 2007-08 Florida Alternate Assessment: Participants by Grade Level
2388 2478 2519
2971 3078 3033
2280 2310
2234
0
500
1000
1500
2000
2500
3000
3500
03 04 05 06 07 08 09 10 11 Grade-Level
Num
ber o
f Stu
dent
s
2.5 Florida Alternate Assessment Content
2.5.1 Standards Review Institute, July 2005
In 2005, the Bureau of Exceptional Education and Student Services initiated the development
of extensions (curriculum expectations) for students with significant cognitive disabilities for the
Sunshine State Standards in Language Arts, Mathematics, and Science. To begin this process, school
districts were invited to nominate participants from across the state representing exceptional student
education, general education, English-language learners, and parents to write draft extensions for
three levels of complexity: Independent, Supported, and Participatory. The draft extensions were
aligned to the 1996 Sunshine State Standards benchmarks. In December 2005, the extensions for
Chapter 2—Overview of the FLALT Assessment 8 2007–08 Florida Alt Technical Report
Language Arts and Mathematics were posted for public review in an online survey. A total of 164
responded to the language arts survey and 42 responded to the mathematics survey.
2.5.2 Reading and Language Arts Access Points
Beginning in January 2006, staff from the Accountability and Assessment for Students with
Disabilities Project (PAEC) and the Accommodations and Modifications for Students with
Disabilities Project (FSU) worked together to align the draft extensions to the revised benchmarks of
the Sunshine State Standards for Language Arts. Throughout the process, teachers and university
personnel with expertise in language arts and those with expertise in curriculum for students with
disabilities were consulted, although no formal writing team was established. The extensions were
renamed —access points.“ In April 2006, the access points were included in an online survey with the
revisions to the Reading and Language Arts Sunshine State Standards. Access points were aligned
with further revisions to the general education standards. The final draft was adopted by the State
Board of Education on January 25, 2007.
Students in the Florida Alternate Assessment are assessed utilizing the Access Points from
the Sunshine State Standards in the areas of reading, writing, and mathematics. Access Points
represent the essence of the Sunshine State Standards benchmarks at reduced levels of complexity.
Science Access Points were not written in time for the science field test or 2007-08 operational test.
Instead, the Sunshine State Standards were expanded by the science developer for these
administrations. Future administrations of the Florida Alternate Assessment in science will be based
on Access Points.
2.5.3 English Language Arts Content
For English Language Arts, three reading strands are assessed: Reading Process, Literary
Analysis, and, at the higher grades, Information and Media Literacy. Two writing strands are
assessed: Writing Process and Writing Application.
Chapter 2—Overview of the FLALT Assessment 9 2007–08 Florida Alt Technical Report
2.5.4 Mathematics Content
Mathematics content is broken into Big Ideas and Supporting Ideas for grades 3 through 8.
There are three Big Ideas at each grade level and four Supporting Ideas that cover Algebra,
Geometry and Measurement, Number and Operations, and Data Analysis. In grades 9 and 10,
content is structured in terms of six Secondary Bodies of Knowledge: Algebra, Discrete
Mathematics, Geometry, Probability, Statistics, and Financial Literacy.
2.5.5 Science Content
The science content assessed for the 2007-08 Florida Alternate Assessment included three
major content areas–Physical and Chemical Sciences, Earth and Space Sciences, and Life and
Environmental Sciences–and the process of Scientific Thinking.
2.6 Florida Alternate Assessment Alignment and Linkages
The Florida Department of Education has contracted with Claudia Flowers and Shawnee
Wakeman from the University of North Carolina at Charlotte to conduct an alignment study of the
Florida Alternate Assessment and Sunshine State Standards Access Points. The criteria used for the
alignment study were developed by the National Alternate Assessment Center (NAAC). The
alignment methodology utilizes eight alignment criteria such as, the academic nature of the content,
the fidelity of the content to the original grade level standards and the accessibility of the
assessment. The full Florida Alternate Assessment Alignment Report is available through the Florida
Department of Education.
Chapter 2—Overview of the FLALT Assessment 10 2007–08 Florida Alt Technical Report
SECTION II: TEST DEVELOPMENT, ADMINISTRATION, SCORING, AND
REPORTING Chapter 3. TEST DEVELOPMENT
In April of 2007 the Florida Department of Education entered into a development contract
with Measured Progress. The new Florida Alternate Assessment was developed in response to a
Request for Proposal (RFP) disseminated by the Florida Department of Education requesting a new
design for their alternate assessment that would be based on their newly developed Sunshine State
Standards with Access Points. The department wanted a new assessment that would include multiple
item types and assessment levels within a primarily performance task type of assessment. This new
design further needed to allow students a tiered entry into the assessment for students working at the
varying levels of complexity.
Prior to starting the development process a Test Designs, Blueprints and Item Specifications
for Reading, Writing, Mathematics and Science document was developed and was presented to the
Florida Department of Education and Florida Alternate Assessment Advisory in April of 2007 at an
Alternate Assessment Advisory meeting. The initial design that was presented at this meeting did not
include the scaffolding at the Participatory level that is outlined in the design section that follows.
This change in the initial design came about as a result of the concerns that the advisory members
had for the students working within the lowest level of complexity. They felt that an item presented
only one time with a possibility of being either right or wrong did not give these students the
opportunity to show what they know and are able to do. The advisory members were also presented
with the blueprints and asked for their input. A few changes were made as an outcome of their input,
for example, in reading the concept of Comparing and Contrasting was removed from grade 3 and in
mathematics for grades 9 and 10 Financial Literacy was added to the assessment blueprint. The
Chapter 3—Test Development 11 2007–08 Florida Alt Technical Report
document was finalized and the development that occurred after this point referenced this document
for design, blueprints, and item specifications. The discussion on the design and blueprints below is
based upon this final document and reflect the changes that the advisory committee recommended.
This final design was then presented at the Florida Special Education Institute in July of 2007
in front of approximately 500 educators. The design was well received and no further adjustments
were made to the overall design at that point in time.
3.1 Item-Design of the Florida Alternate Assessment
Designed specifically for students with significant cognitive disabilities, the Florida Alternate
Assessment is a performance-based test that is aligned with the Sunshine State Standards Access
Points for Language Arts (Reading and Writing) and Mathematics. Science items are based on a
balance of the content area of the current Sunshine State Standards and Strand B, Standard 4 of the
Sunshine State Standards for Special Diploma. The assessment measures student performance based
on alternate achievement standards.
The Sunshine State Standards with Access Points consist of the general education strands,
standards and benchmarks, beneath which three levels of skills are linked. These three skill levels
are the Access Points and are referred to as levels of complexity. The three levels of complexity are
participatory, supported, and independent, with the participatory level representing the least complex
skill set and the independent level the most complex. Items were written to address all three levels of
complexity/access points.
Students receive a final score for an item set based on the level at which they answer
correctly. A student starts at the participatory level of complexity within an item set. A student
completing the participatory level item accurately, without assistance, moves on to the supported
level item. If the student is able to complete the supported item, the student is administered the
independent level item. In other words, a student moves up through the Access Point skills as long as
Chapter 3—Test Development 12 2007–08 Florida Alt Technical Report
he or she is able to respond accurately and independently and receives a score consistent with the
highest correct response.
Scaffolding is given only at the participatory level, to a student who is unable to complete a
participatory level item accurately and independently and receives a score consistent with highest
correct response. The student is presented the item again with one distracter removed. If the student
is able to accurately respond he/she is given a score of 2. If the student is unable to accurately
respond, he/she is presented the item again with another distracter removed (leaving only the correct
answer) and the student is asked to actively engage with the correct answer and a score of 1 is
recorded. At any point within the participatory level item, if the student will not engage or actively
refuses, the student scores 0 points.
In summary, Florida Alternate Assessment grade-content tests can be thought of as 16-item
tests if the Participatory, Supported, and Independent items are considered in sets. The scoring rubric
does just that, and treats each set as a polytomous item with six possible item scores: 0, 1, 2, 3, 6, 9.
The maximum possible total raw score is 144.
A visual depiction of this process is provided on the next page.
Chapter 3—Test Development 13 2007–08 Florida Alt Technical Report
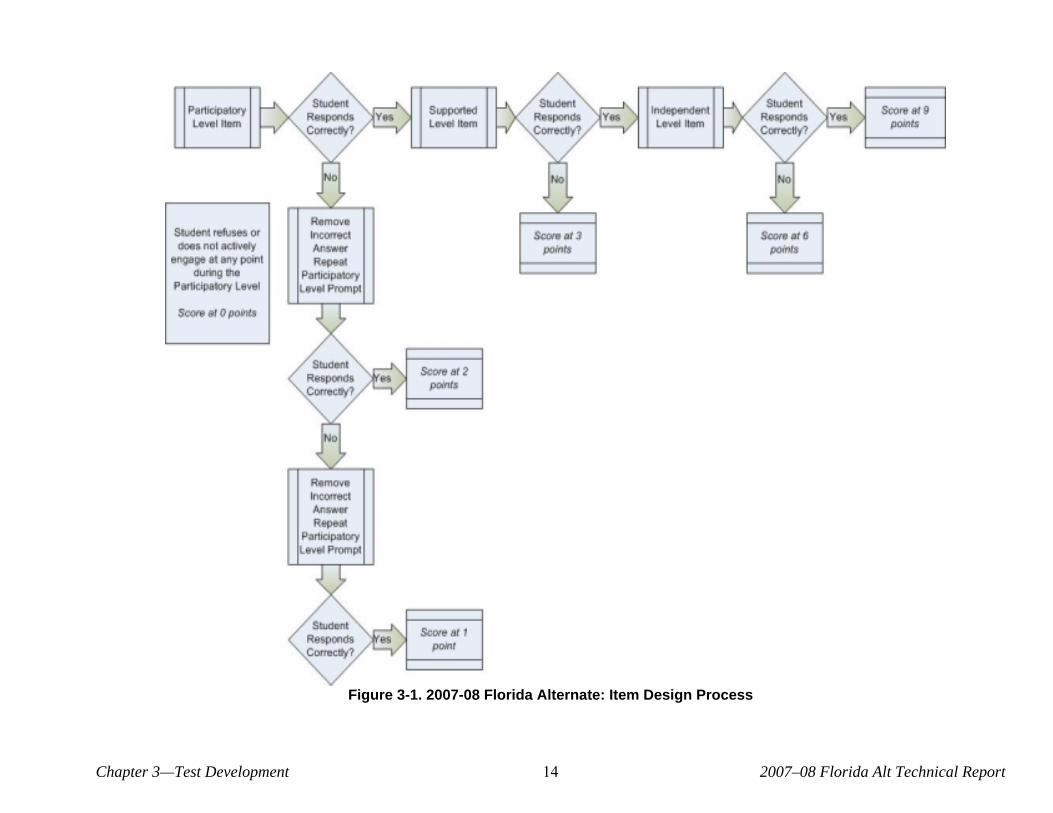
Figure 3-1. 2007-08 Florida Alternate: Item Design Process
Chapter 3—Test Development 14 2007–08 Florida Alt Technical Report
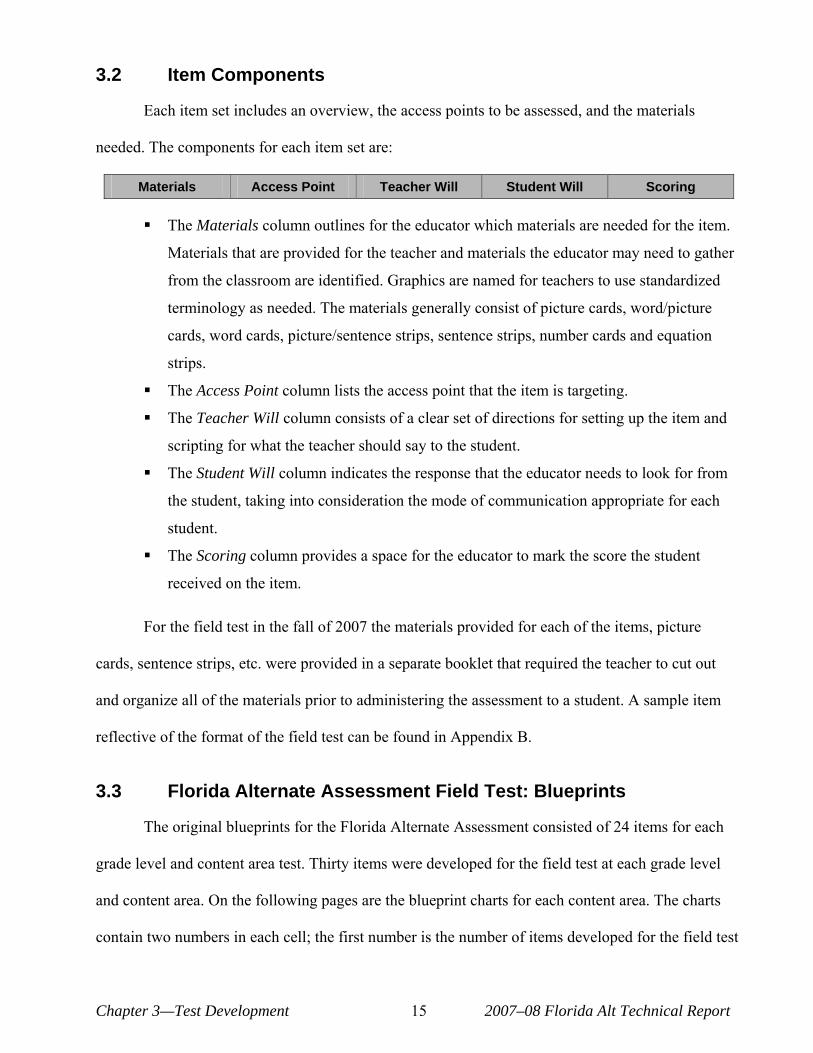
3.2 Item Components
Each item set includes an overview, the access points to be assessed, and the materials
needed. The components for each item set are:
Materials Access Point Teacher Will Student Will Scoring
° The Materials column outlines for the educator which materials are needed for the item.
Materials that are provided for the teacher and materials the educator may need to gather
from the classroom are identified. Graphics are named for teachers to use standardized
terminology as needed. The materials generally consist of picture cards, word/picture
cards, word cards, picture/sentence strips, sentence strips, number cards and equation
strips.
° The Access Point column lists the access point that the item is targeting.
° The Teacher Will column consists of a clear set of directions for setting up the item and
scripting for what the teacher should say to the student.
° The Student Will column indicates the response that the educator needs to look for from
the student, taking into consideration the mode of communication appropriate for each
student.
° The Scoring column provides a space for the educator to mark the score the student
received on the item.
For the field test in the fall of 2007 the materials provided for each of the items, picture
cards, sentence strips, etc. were provided in a separate booklet that required the teacher to cut out
and organize all of the materials prior to administering the assessment to a student. A sample item
reflective of the format of the field test can be found in Appendix B.
3.3 Florida Alternate Assessment Field Test: Blueprints
The original blueprints for the Florida Alternate Assessment consisted of 24 items for each
grade level and content area test. Thirty items were developed for the field test at each grade level
and content area. On the following pages are the blueprint charts for each content area. The charts
contain two numbers in each cell; the first number is the number of items developed for the field test
Chapter 3—Test Development 15 2007–08 Florida Alt Technical Report
administration and the second number is the number of items that was utilized for the 2008
operational assessment. This second number in each cell reflects the final blueprint. Note that the
final blueprint consists of 16 items per grade level and content area. The overall reduction in items
from a test design of 24 items to a test design of 16 items in most cases reduced the number of items
at the standard level from 6 items to 4 items. This change in the number of items for the operational
assessment is discussed in section 3.10.
Chapter 3—Test Development 16 2007–08 Florida Alt Technical Report
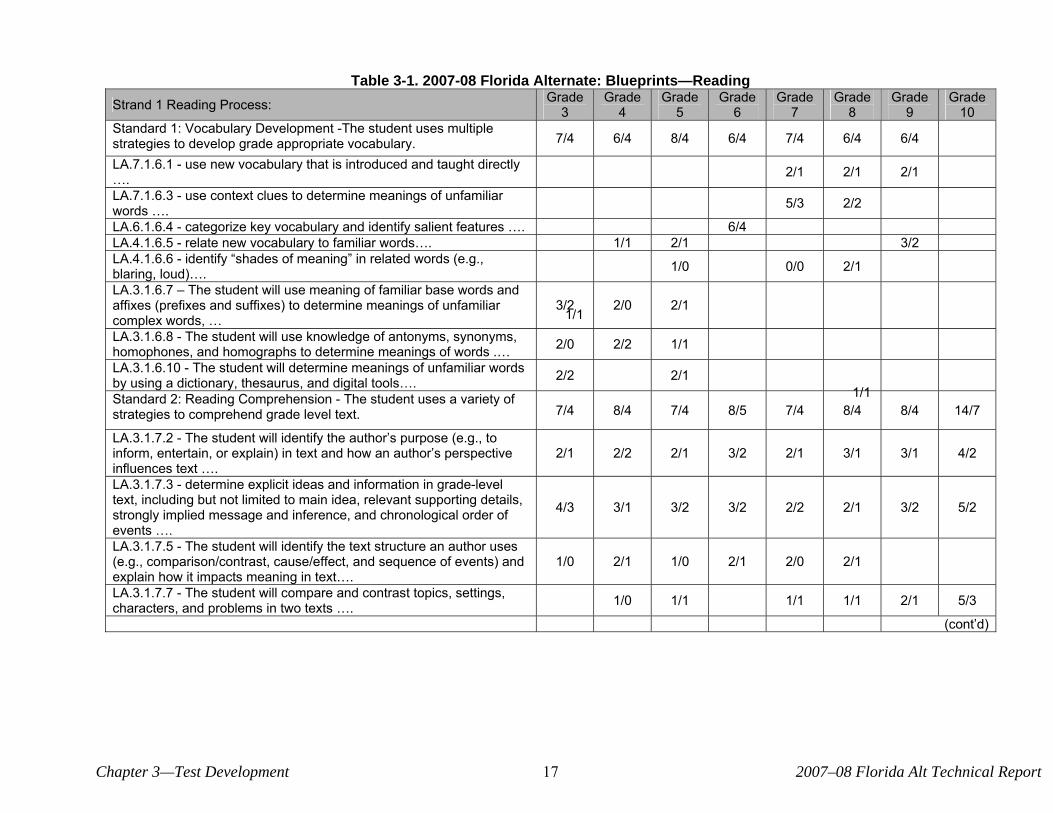
Table 3-1. 2007-08 Florida Alternate: Blueprints—Reading Strand 1 Reading Process: Grade
3 Grade
4 Grade
5 Grade
6 Grade
7 Grade
8 Grade
9 Grade
10 Standard 1: Vocabulary Development -The student uses multiple strategies to develop grade appropriate vocabulary. 7/4 6/4 8/4 6/4 7/4 6/4 6/4
LA.7.1.6.1 - use new vocabulary that is introduced and taught directly …. 2/1 2/1 2/1
LA.7.1.6.3 - use context clues to determine meanings of unfamiliar words …. 5/3 2/2
LA.6.1.6.4 - categorize key vocabulary and identify salient features …. 6/4 LA.4.1.6.5 - relate new vocabulary to familiar words…. 1/1 2/1 3/2 LA.4.1.6.6 - identify —shades of meaning“ in related words (e.g., blaring, loud)….
1/1
1/0 0/0 2/1
LA.3.1.6.7 œ The student will use meaning of familiar base words and affixes (prefixes and suffixes) to determine meanings of unfamiliar complex words, …
3/2 2/0 2/1
LA.3.1.6.8 - The student will use knowledge of antonyms, synonyms, homophones, and homographs to determine meanings of words .… 2/0 2/2 1/1
1/1
LA.3.1.6.10 - The student will determine meanings of unfamiliar words by using a dictionary, thesaurus, and digital tools…. 2/2 2/1
Standard 2: Reading Comprehension - The student uses a variety of strategies to comprehend grade level text. 7/4 8/4 7/4 8/5 7/4 8/4 8/4 14/7
LA.3.1.7.2 - The student will identify the author‘s purpose (e.g., to inform, entertain, or explain) in text and how an author‘s perspective influences text ….
2/1 2/2 2/1 3/2 2/1 3/1 3/1 4/2
LA.3.1.7.3 - determine explicit ideas and information in grade-level text, including but not limited to main idea, relevant supporting details, strongly implied message and inference, and chronological order of events ….
4/3 3/1 3/2 3/2 2/2 2/1 3/2 5/2
LA.3.1.7.5 - The student will identify the text structure an author uses (e.g., comparison/contrast, cause/effect, and sequence of events) and explain how it impacts meaning in text….
1/0 2/1 1/0 2/1 2/0 2/1
LA.3.1.7.7 - The student will compare and contrast topics, settings, characters, and problems in two texts …. 1/0 1/1 1/1 1/1 2/1 5/3
(cont‘d)
Chapter 3—Test Development 17 2007–08 Florida Alt Technical Report
Strand 2 Literary Analysis: Grade 3
Grade 4
Grade 5
Grade 6
Grade 7
Grade 8
Grade 9
Grade 10
Standard 1: Fiction œ The student identifies, analyzes, and applies knowledge of the elements of a variety of fiction and literary texts to develop a thoughtful response to a literary selection.
8/4 8/4 7/4 8/4 8/4 8/3 10/4 7/3
LA.4.2.1.2 - identify and explain the elements of plot structure, including exposition, setting, character development, problem/resolution, and theme in a variety of fiction;
2/2 4/2 8/4 8/4 8/3
LA.910.2.1.5- describe, discuss, and analyze an author‘s use of literary elements (i.e., theme, point of view, characterization, setting, plot), and explain and analyze different elements of figurative language (i.e., simile, metaphor, personification, hyperbole, symbolism, allusion, imagery) in multiple literary selections…
10/4 7/3
LA.3.2.1.6 - The student will write a book report or review that identifies the main idea, character(s), setting, sequence of events, and problem/solution;
6/2 4/2 7/4
Standard 2: Non-Fiction- The student identifies, analyzes, and applies knowledge of the elements of a variety of non-fiction, informational, and expository tests to demonstrate an understanding of the information presented.
8/4 8/4 8/4 8/3 8/4 8/5 6/4 7/4
LA.3.2.2.2 - The student will use information from the text to answer questions related to explicitly state main ideas or relevant details …. 2/2 4/3 4/2 4/3 4/3 5/3 7/4
LA.3.2.2.3 - The student will organize information to show an understanding of main ideas within a text through charting, mapping, or summarizing ….
6/2 4/1 8/4 4/1 4/1 4/2 1/1
Strand 3 Grades 9œ10: Information and Media Literacy Grade 3
Grade 4
Grade 5
Grade 6
Grade 7
Grade 8
Grade 9
Grade 10
Standard: 910.6 The student uses a systematic process for the collection, processing and presentation of information. 2/2
LA.910.6.2.2 - organize, synthesize analyze and evaluate the validity and reliability of information from multiple sources (including primary and secondary sources) to draw conclusions using a variety of techniques, and correctly use standardized citations;
2/2
LA.910.6.2.3 - write an informational report that integrates information and makes distinctions between the relative value and significance of specific data, facts, and ideas;
Chapter 3—Test Development 18 2007–08 Florida Alt Technical Report
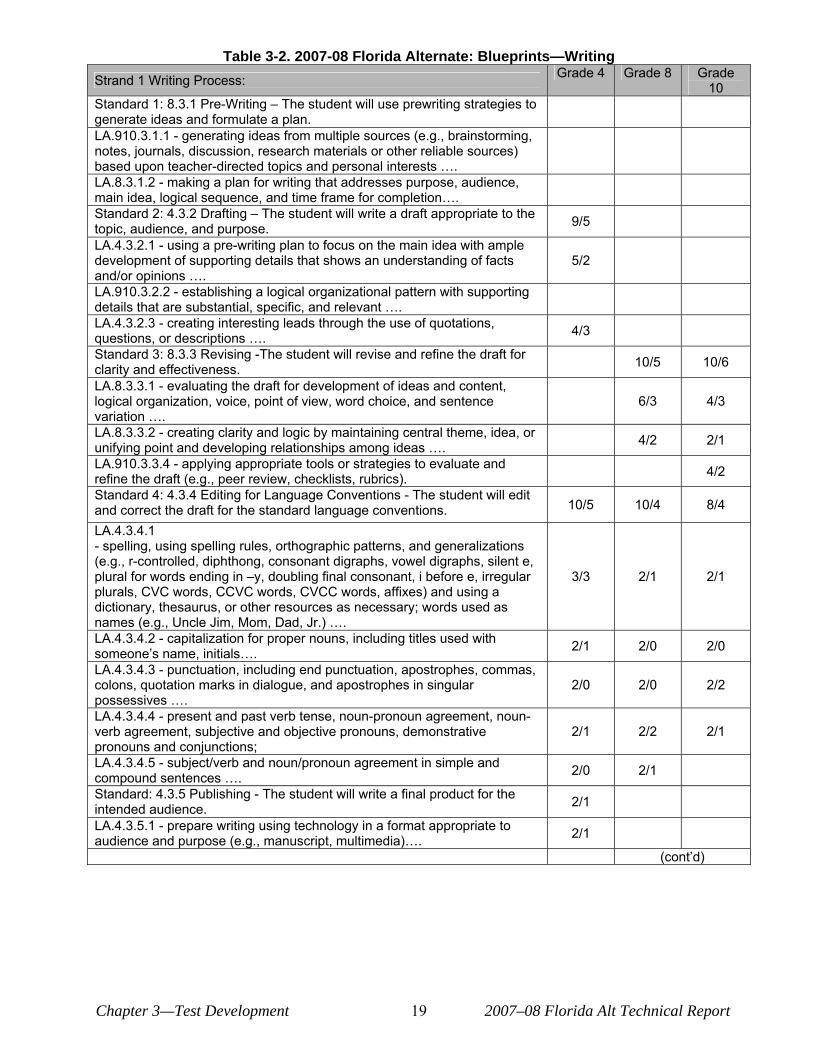
Table 3-2. 2007-08 Florida Alternate: Blueprints—Writing Strand 1 Writing Process: Grade 4 Grade 8 Grade
10 Standard 1: 8.3.1 Pre-Writing œ The student will use prewriting strategies to generate ideas and formulate a plan. LA.910.3.1.1 - generating ideas from multiple sources (e.g., brainstorming, notes, journals, discussion, research materials or other reliable sources) based upon teacher-directed topics and personal interests …. LA.8.3.1.2 - making a plan for writing that addresses purpose, audience, main idea, logical sequence, and time frame for completion…. Standard 2: 4.3.2 Drafting œ The student will write a draft appropriate to the topic, audience, and purpose. 9/5
LA.4.3.2.1 - using a pre-writing plan to focus on the main idea with ample development of supporting details that shows an understanding of facts and/or opinions ….
5/2
LA.910.3.2.2 - establishing a logical organizational pattern with supporting details that are substantial, specific, and relevant …. LA.4.3.2.3 - creating interesting leads through the use of quotations, questions, or descriptions …. 4/3
Standard 3: 8.3.3 Revising -The student will revise and refine the draft for clarity and effectiveness. 10/5 10/6
LA.8.3.3.1 - evaluating the draft for development of ideas and content, logical organization, voice, point of view, word choice, and sentence variation ….
6/3 4/3
LA.8.3.3.2 - creating clarity and logic by maintaining central theme, idea, or unifying point and developing relationships among ideas …. 4/2 2/1
LA.910.3.3.4 - applying appropriate tools or strategies to evaluate and refine the draft (e.g., peer review, checklists, rubrics). 4/2
Standard 4: 4.3.4 Editing for Language Conventions - The student will edit and correct the draft for the standard language conventions. 10/5 10/4 8/4
LA.4.3.4.1 - spelling, using spelling rules, orthographic patterns, and generalizations (e.g., r-controlled, diphthong, consonant digraphs, vowel digraphs, silent e, plural for words ending in œy, doubling final consonant, i before e, irregular plurals, CVC words, CCVC words, CVCC words, affixes) and using a dictionary, thesaurus, or other resources as necessary; words used as names (e.g., Uncle Jim, Mom, Dad, Jr.) ….
3/3 2/1 2/1
LA.4.3.4.2 - capitalization for proper nouns, including titles used with someone‘s name, initials…. 2/1 2/0 2/0
LA.4.3.4.3 - punctuation, including end punctuation, apostrophes, commas, colons, quotation marks in dialogue, and apostrophes in singular possessives ….
2/0 2/0 2/2
LA.4.3.4.4 - present and past verb tense, noun-pronoun agreement, noun-verb agreement, subjective and objective pronouns, demonstrative pronouns and conjunctions;
2/1 2/2 2/1
LA.4.3.4.5 - subject/verb and noun/pronoun agreement in simple and compound sentences …. 2/0 2/1
Standard: 4.3.5 Publishing - The student will write a final product for the intended audience. 2/1
LA.4.3.5.1 - prepare writing using technology in a format appropriate to audience and purpose (e.g., manuscript, multimedia)…. 2/1
(cont‘d)
Chapter 3—Test Development 19 2007–08 Florida Alt Technical Report
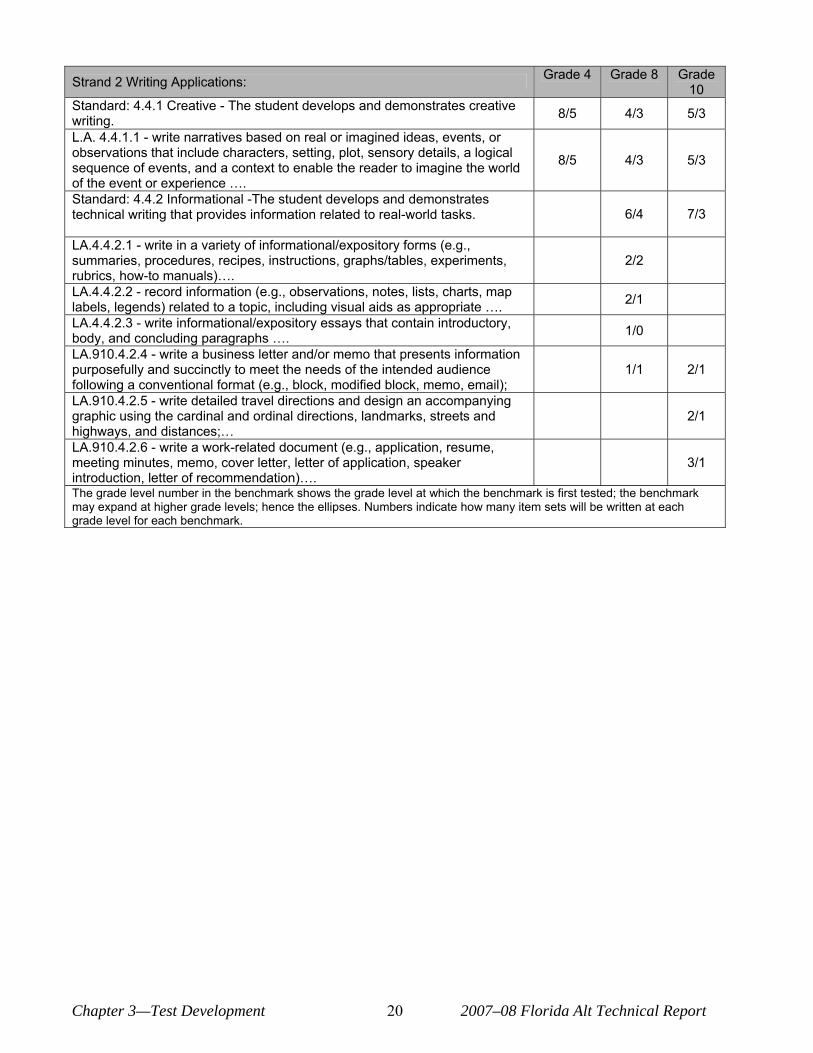
Strand 2 Writing Applications: Grade 4 Grade 8 Grade 10
Standard: 4.4.1 Creative - The student develops and demonstrates creative writing. 8/5 4/3 5/3
L.A. 4.4.1.1 - write narratives based on real or imagined ideas, events, or observations that include characters, setting, plot, sensory details, a logical sequence of events, and a context to enable the reader to imagine the world of the event or experience ….
8/5 4/3 5/3
Standard: 4.4.2 Informational -The student develops and demonstrates technical writing that provides information related to real-world tasks. 6/4 7/3
LA.4.4.2.1 - write in a variety of informational/expository forms (e.g., summaries, procedures, recipes, instructions, graphs/tables, experiments, rubrics, how-to manuals)….
2/2
LA.4.4.2.2 - record information (e.g., observations, notes, lists, charts, map labels, legends) related to a topic, including visual aids as appropriate …. 2/1
LA.4.4.2.3 - write informational/expository essays that contain introductory, body, and concluding paragraphs …. 1/0
LA.910.4.2.4 - write a business letter and/or memo that presents information purposefully and succinctly to meet the needs of the intended audience following a conventional format (e.g., block, modified block, memo, email);
1/1 2/1
LA.910.4.2.5 - write detailed travel directions and design an accompanying graphic using the cardinal and ordinal directions, landmarks, streets and highways, and distances;…
2/1
LA.910.4.2.6 - write a work-related document (e.g., application, resume, meeting minutes, memo, cover letter, letter of application, speaker introduction, letter of recommendation)….
3/1
The grade level number in the benchmark shows the grade level at which the benchmark is first tested; the benchmark may expand at higher grade levels; hence the ellipses. Numbers indicate how many item sets will be written at each grade level for each benchmark.
Chapter 3—Test Development 20 2007–08 Florida Alt Technical Report
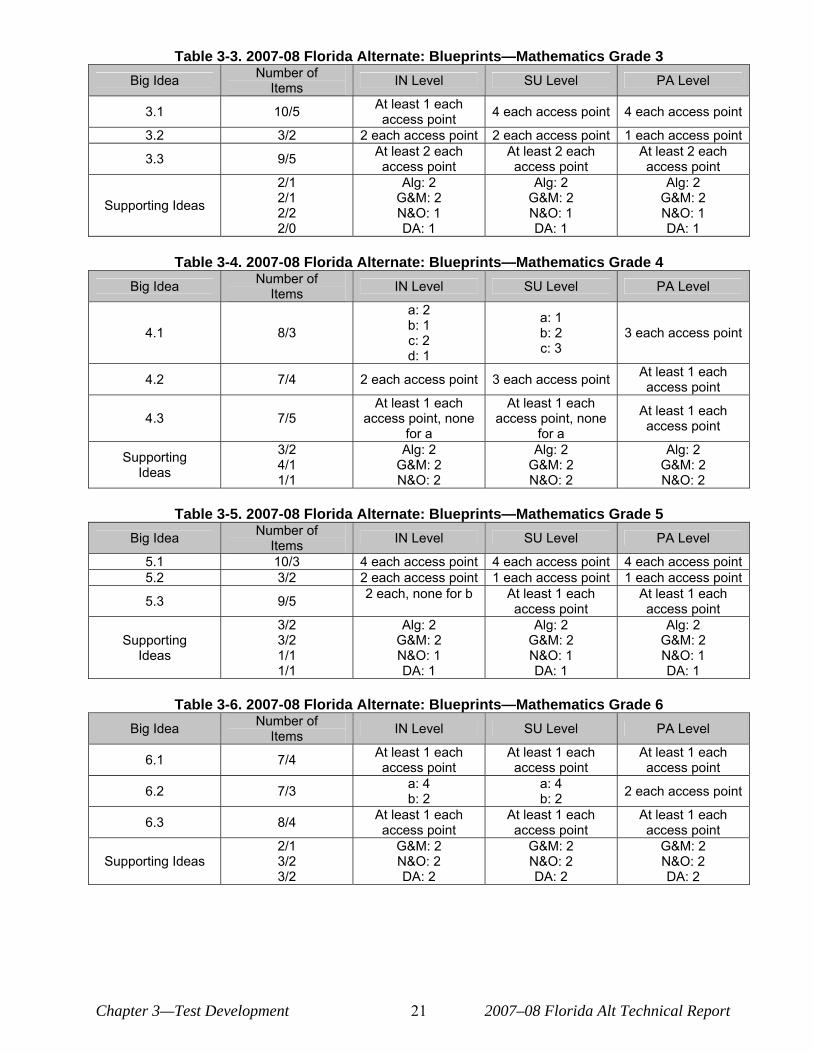
Table 3-3. 2007-08 Florida Alternate: Blueprints—Mathematics Grade 3 Big Idea Number of
Items IN Level SU Level PA Level
3.1 10/5 At least 1 each access point 4 each access point 4 each access point
3.2 3/2 2 each access point 2 each access point 1 each access point
3.3 9/5 At least 2 each access point
At least 2 each access point
At least 2 each access point
Supporting Ideas
2/1 2/1 2/2 2/0
Alg: 2 G&M: 2 N&O: 1 DA: 1
Alg: 2 G&M: 2 N&O: 1 DA: 1
Alg: 2 G&M: 2 N&O: 1 DA: 1
Table 3-4. 2007-08 Florida Alternate: Blueprints—Mathematics Grade 4 Big Idea Number of
Items IN Level SU Level PA Level
4.1 8/3
a: 2 b: 1 c: 2 d: 1
a: 1 b: 2 c: 3
3 each access point
4.2 7/4 2 each access point 3 each access point At least 1 each access point
4.3 7/5 At least 1 each
access point, none for a
At least 1 each access point, none
for a
At least 1 each access point
Supporting Ideas
3/2 4/1 1/1
Alg: 2 G&M: 2 N&O: 2
Alg: 2 G&M: 2 N&O: 2
Alg: 2 G&M: 2 N&O: 2
Table 3-5. 2007-08 Florida Alternate: Blueprints—Mathematics Grade 5 Big Idea Number of
Items IN Level SU Level PA Level
5.1 10/3 4 each access point 4 each access point 4 each access point 5.2 3/2 2 each access point 1 each access point 1 each access point
5.3 9/5 2 each, none for b At least 1 each access point
At least 1 each access point
Supporting Ideas
3/2 3/2 1/1 1/1
Alg: 2 G&M: 2 N&O: 1 DA: 1
Alg: 2 G&M: 2 N&O: 1 DA: 1
Alg: 2 G&M: 2 N&O: 1 DA: 1
Table 3-6. 2007-08 Florida Alternate: Blueprints—Mathematics Grade 6 Big Idea Number of
Items IN Level SU Level PA Level
6.1 7/4 At least 1 each access point
At least 1 each access point
At least 1 each access point
6.2 7/3 a: 4 b: 2
a: 4 b: 2 2 each access point
6.3 8/4 At least 1 each access point
At least 1 each access point
At least 1 each access point
Supporting Ideas 2/1 3/2 3/2
G&M: 2 N&O: 2 DA: 2
G&M: 2 N&O: 2 DA: 2
G&M: 2 N&O: 2 DA: 2
Chapter 3—Test Development 21 2007–08 Florida Alt Technical Report
Table 3-7. 2007-08 Florida Alternate: Blueprints—Mathematics Grade 7 Big Idea Number of
Items IN Level SU Level PA Level
7.1 7/4 a: 4 b: 2
At least 1 each access point 2 each access point
7.2 7/4 2 each access point
a: 2 b: 2 c: 1 d: 1
3 each access point
7.3 8/4 At least 1 each access point
At least 1 each access point
At least 1 each access point
Supporting Ideas
2/1 3/2 2/1 1/0
G&M: 2 N&O: 2 DA: 1 PR: 1
G&M: 2 N&O: 2 DA: 1 PR: 1
G&M: 2 N&O: 2 DA: 1 PR: 1
Table 3-8. 2007-08 Florida Alternate: Blueprints—Mathematics Grade 8 Big Idea Number of
Items IN Level SU Level PA Level
8.1 9/3 At least 2 each access point
a: 3 b: 1 c: 3 d: 1
4 each access point
8.2 9/5 At least 1 each access point
At least 1 each access point
At least 1 each access point
8.3 3/2 1 each access point 1 each access point 2 at access point
Supporting Ideas 3/1 3/3 3/2
Alg: 2 G&M: 2 N&O: 2
Alg: 2 G&M: 2 N&O: 2
Alg: 2 G&M: 2 N&O: 2
Table 3-9. 2007-08 Florida Alternate: Blueprints—Mathematics Grade 9 Content Area Total number
of items Item Distribution
By Standard
Algebra 3/2 3/2 4/2
A.1: 2 A.2: 2 A.3: 4
Geometry
2/1 3/1 2/0 3/2
G.1: 2 G.2: 2 G.3: 2 G.4: 2
Financial Literacy* 1/0 1/1 3/3
F.1: 1 F.2: 1 F.3: 2
Discrete Math 5/2 2 items to each bullet for each level
Chapter 3—Test Development 22 2007–08 Florida Alt Technical Report
Table 3-10. 2007-08 Florida Alternate: Blueprints—Mathematics Grade 10 Content Area Total number
of items Item Distribution
By Standard
Algebra
2/0 2/1 1/1 2/2 3/0
A.4: 2 A.5: 1 A.6: 1 A.7: 2 A.8: 2
Geometry
2/1 3/2 4/1 1/0
G.5: 2 G.6: 2 G.7: 2 G.8: 2
Financial Literacy* 1/1 2/2 2/1
F.1: 1 F.2: 1 F.3: 2
Probability 1/0 1/1
P.1: 1 P.2: 1
Statistics 3/3 S.3: 2 * Grades 9 and 10 are distinguished by complexity of the items
Table 3-11. 2007-08 Florida Alternate: Blueprints—Science Grade 5 Grade 8 Grade 11
Physical and Chemical Sciences 10/6 10/6 11/8 Strand A: The Nature of Matter 5/3 5/2 5/3 Strand B: Energy 3/2 2/2 3/3 Strand C: Force and Motion 2/1 3/2 3/2 Standard 4: The student uses systematic approaches to solve problems* Earth and Space Sciences 8/4 8/2 7/2 Strand D: Process that Shape the Earth 5/3 5/1 4/1 Strand E: Earth and Space 3/1 3/1 3/1 Standard 4: The student uses systematic approaches to solve problems* Life and Environmental Sciences 12/8 12/8 12/6
Strand F: Process of Life 7/3 7/5 7/3 Strand G: How Living Things Interact with Their Environment 5/3 5/3 5/3 Standard 4: The student uses systematic approaches to solve problems* *Items that assess Standard 4 (Scientific Thinking) will also assess a science content benchmark.
Chapter 3—Test Development 23 2007–08 Florida Alt Technical Report
3.4 Florida Alternate Assessment Field Test: Item Development
Items were initially developed by Measured Progress Curriculum and Assessment staff. A
lead developer was assigned in each of the content areas and it was their responsibility to oversee all
item development within that content area for the Florida Alternate Assessment. Once an item had
been developed and reviewed by the lead developer the item was then reviewed by a special
education specialist. The curriculum and assessment developer was responsible to make sure that the
item stayed true to the content of the Access Points it was assessing and the special education
specialist reviewed the item for the appropriateness of the topics utilized, materials required and
difficulty of the item for the population of students with significant cognitive disabilities. Items were
also reviewed to ensure that they met the item specifications.
Item specifications were developed and were included in the document Test Designs,
Blueprints and Item Specifications for Reading, Writing, Mathematics and Science which was
approved by the Department in May of 2007. The specifications outlined a variety of item details
such as the length and readabilities of passages for reading, the types of distracters at each of the
levels of complexity, parameters for graphics and the types of topics appropriate for students being
assessed through an alternate assessment. The item specifications document can be found in
Appendix G.
Items were further reviewed by an editorial staff to maintain consistency of language across
the items and content areas. Items were also reviewed by Florida teachers at a content review session
and the graphics for the items were reviewed by a vision specialist at the Florida Department of
Education.
Chapter 3—Test Development 24 2007–08 Florida Alt Technical Report
3.5 Florida Alternate Assessment Field Test: Bias and Sensitivity Review
Issues of bias in test materials are of particular concern because an important tenet of
assessment is to ensure that all students have an equal opportunity to demonstrate their knowledge
and skills. The Bias and Sensitivity Review Committee members met once in May 2007 prior to
field test. At this meeting, the committee had two tasks. The first task was to review the Bias and
Sensitivity Guidelines for the Development of the Florida Alternate Assessment. The second task was
to review the reading passages and a few initial science items to determine if they were likely to
place a particular group of students at an advantage or disadvantage for non-educational reasons.
Any passages that were identified as biased were either revised or removed.
The Bias and Sensitivity Review Committee consisted of nine individuals selected to
participate by the Florida Department of Education (see list in Appendix A). They included three
special education teachers, one special education administrator, two vision specialists, one bilingual
assessor, one assistive technology specialist and one school psychologist. The meeting was held via
video conference. The Measured Progress special education specialist and lead developers for
reading and science were also present along with the alternate assessment department staff from
Florida. The meeting began with a review of the Bias and Sensitivity Guidelines. Emphasis was
placed on the accessibility of the reading passages and science items for the population of students in
alternate assessment.
Recommendations for the science items centered on using common classroom items in the
graphics provided for the items whenever possible. This concern was raised as a way to help address
issues of assessment administration for students with visual impairments who might need to use
actual objects during testing. Participants also made recommendations in some of the science topic
areas as to activities or objects students would have more familiarity with. For example, more
students would have opportunities to use microwaves then ovens.
Chapter 3—Test Development 25 2007–08 Florida Alt Technical Report
For the reading passages, participants reviewed the passages and associated passage graphics.
Recommendations were made to keep graphics uncluttered by removing horizons and background
that did not need to be part of the graphics. Heavier line weights were recommended and if the detail
in a graphic distracted, recommendations were made to simplify the graphics.
For the passage topics panelists made recommendations on topics that students would have
the opportunity to be involved in. For example, a passage about snow might not be the best for
Florida students. Panelists also made recommendations when they felt a particular portion of the
passage showed bias toward a certain disability group, such as students with low hearing or low
vision. One final area of recommendations was sensitivity to experiences students may have had,
staying away from passages where students were laughed at or bullied. Overall the majority of
passages were accepted as is, a few were slightly revised and a few were thrown out altogether. All
information from the bias meeting was compiled and passages were marked as accepted or rejected
and any revisions were noted. This record was shared with the DOE staff.
3.6 Florida Alternate Assessment Field Test: Content Review
The content review for all items took place July 16-18, 2007 in Tampa. Panels were
convened for each of the four content areas, reading, writing, mathematics and science. Each
committee consisted of elementary, middle school and high school special educators and content
area educators. (See Appendix A for the list of panelists.)
Panels were facilitated by the lead developer for each of the content areas and two special
education specialists were also present to assist in each of the rooms as needed. Panelists were asked
to review the items to make sure that they addressed each of the Access Points, to review the
Teacher Will column for clarity on what the teacher needed to do and say, to make sure that there
was only one correct answer, to review the graphics within each of the items for clarity and to be
Chapter 3—Test Development 26 2007–08 Florida Alt Technical Report
aware of the difficulty levels within items (from participatory to independent) as well as across the
grade levels. Recommendations by the panelists were written on each of the items.
After the panelists completed their content area review the developers, special education
specialists and department staff met to review the panelists‘ recommendations and make final
decisions on each of the items. The recommendations centered on simplifying the graphics,
rearranging some of the items where the supported level of complexity seemed more difficult than
the independent level of complexity, and reducing the complexity of the materials and/or distracters.
Overall, the content review went well and teachers were pleased to be a part of the process.
Feedback for each of the content review panels is compiled in Appendix C.
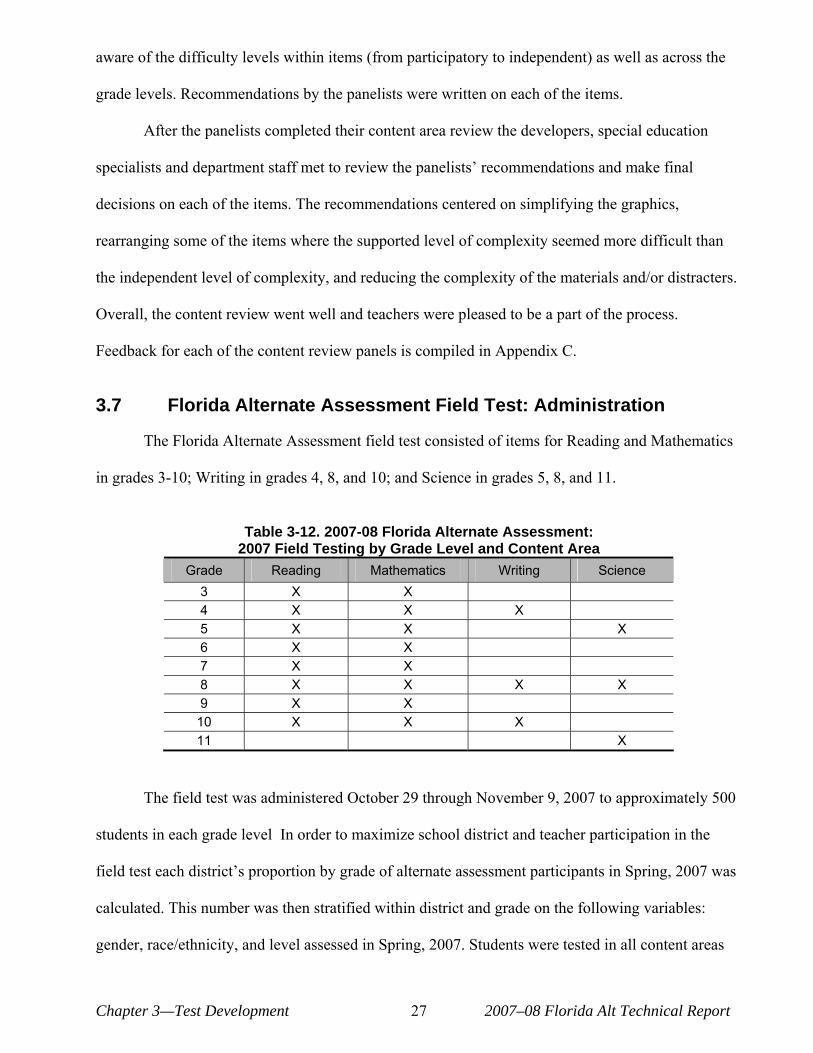
3.7 Florida Alternate Assessment Field Test: Administration
The Florida Alternate Assessment field test consisted of items for Reading and Mathematics
in grades 3-10; Writing in grades 4, 8, and 10; and Science in grades 5, 8, and 11.
Table 3-12. 2007-08 Florida Alternate Assessment: 2007 Field Testing by Grade Level and Content Area
Grade Reading Mathematics Writing Science 3 X X 4 X X X 5 X X X 6 X X 7 X X 8 X X X X 9 X X 10 X X X 11 X
The field test was administered October 29 through November 9, 2007 to approximately 500
students in each grade level In order to maximize school district and teacher participation in the
field test each district‘s proportion by grade of alternate assessment participants in Spring, 2007 was
calculated. This number was then stratified within district and grade on the following variables:
gender, race/ethnicity, and level assessed in Spring, 2007. Students were tested in all content areas
Chapter 3—Test Development 27 2007–08 Florida Alt Technical Report
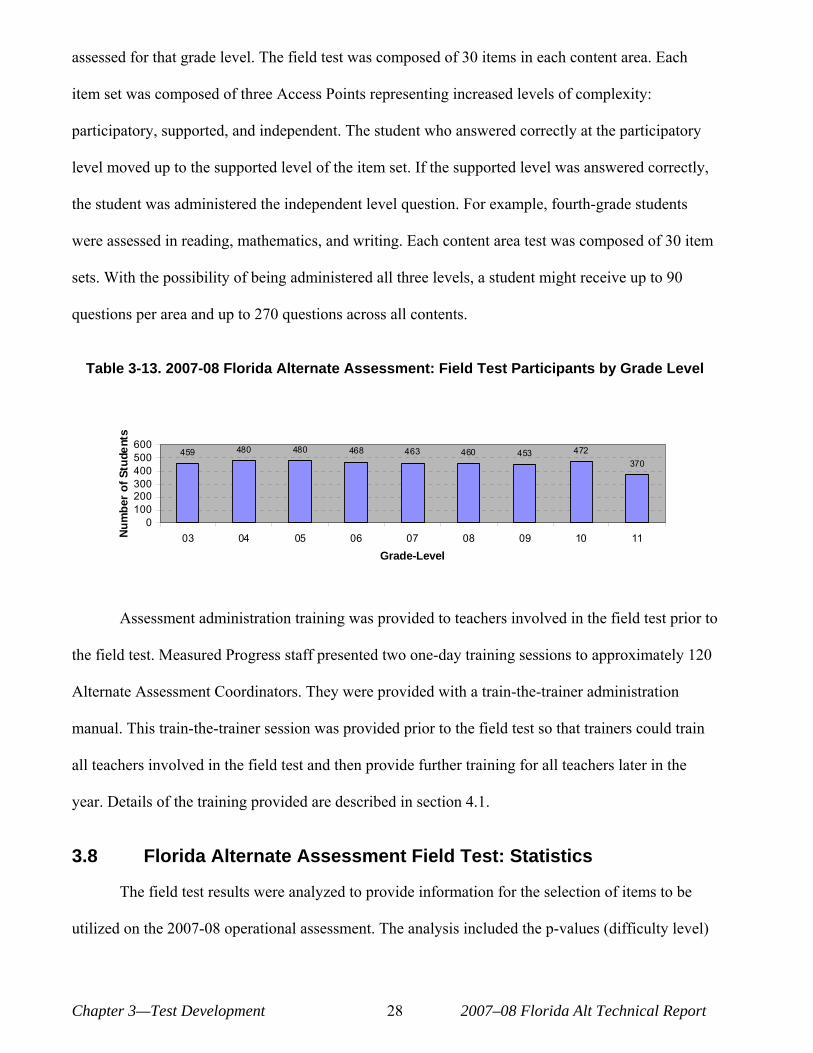
assessed for that grade level. The field test was composed of 30 items in each content area. Each
item set was composed of three Access Points representing increased levels of complexity:
participatory, supported, and independent. The student who answered correctly at the participatory
level moved up to the supported level of the item set. If the supported level was answered correctly,
the student was administered the independent level question. For example, fourth-grade students
were assessed in reading, mathematics, and writing. Each content area test was composed of 30 item
sets. With the possibility of being administered all three levels, a student might receive up to 90
questions per area and up to 270 questions across all contents.
Table 3-13. 2007-08 Florida Alternate Assessment: Field Test Participants by Grade Level
Num
ber
of S
tude
nts
600 500 400 300 200 100
0
459 480 480 468 463 460 453 472 370
03 04 05 06 07 08 09 10 11
Grade-Level
Assessment administration training was provided to teachers involved in the field test prior to
the field test. Measured Progress staff presented two one-day training sessions to approximately 120
Alternate Assessment Coordinators. They were provided with a train-the-trainer administration
manual. This train-the-trainer session was provided prior to the field test so that trainers could train
all teachers involved in the field test and then provide further training for all teachers later in the
year. Details of the training provided are described in section 4.1.
3.8 Florida Alternate Assessment Field Test: Statistics
The field test results were analyzed to provide information for the selection of items to be
utilized on the 2007-08 operational assessment. The analysis included the p-values (difficulty level)
Chapter 3—Test Development 28 2007–08 Florida Alt Technical Report
for each level of complexity of an item, discriminations (item correlations with total score), and DIF
values (for males versus females). DIF results showed no significance for any of the items.
Therefore, selection was based on p-values and discriminations and survey feedback (see next
section) on: item specifics, graphics within items, the amount of teacher materials to be gathered, the
number of cutouts required by items, and the balance of items required by the blueprints at each
grade and content area.
3.9 Florida Alternate Assessment Field Test: Survey Results
An on-line survey was provided during the field test administration window and for one
week after the close of the window. Approximately 2000 teachers responded to the on-line survey.
The survey consisted of three parts. The first part requested background information that included
teacher demographic information, whether or not the teacher was instructing the students using the
Access Points, and whether or not the teacher had attended the administration training. This first part
also asked for feedback on the administration process including the clarity of the administration
manual directions, the ease of the administration process, the ease of use of the materials required for
the assessment, and the appropriateness of the graphics included in the items. The second student
specific part asked for student demographic information, and specifics as to how that student
interacted with the assessment, such as whether the content was new to the student and whether the
format of the administration was new to the student. The third part of the on-line survey was a
voluntary portion and allowed teachers to respond to specific items and any issues that they had with
the items. There were not more than 5 to 10 responses for any one item.
Around 50% of the respondents stated that they were consistently instructing their students
utilizing the Access Points in both English language arts and mathematics. Ninety-three percent of
the teachers that responded had attended administration training and 81% felt that they had received
enough training to administer the field test. Around 70% of respondents felt it was clear how to
Chapter 3—Test Development 29 2007–08 Florida Alt Technical Report
administer the items. Forty-seven percent of respondents felt the graphics were appropriate for the
items, while 43% did not feel the graphics were appropriate. Over 80% of the respondents felt that
the auxiliary materials that needed to be cut out were difficult to organize. Other themes from the
survey indicated that the amount of time for administration was too long, that the cutting out and
organizing of the materials took a significant amount of time, and that students needed to hear the
item prompt more than one time. Survey results can be found in Appendix C.
3.10 Florida Alternate Assessment: Revisions Based on Field Test Results
Field test survey results were reviewed by both Measured Progress and Department of
Education staff. Results were also shared at a meeting of the Alternate Assessment Advisory on
November 29, 2007. The DOE requested their feedback and recommendations on the length of the
administration of the assessment based on the number of items, the types of graphics to use within
the assessment, and the format of the assessment and auxiliary materials. The advisory
recommended that the operational assessment consist of between 16 and 20 items only. This issue
was also shared with the Florida Technical Advisory Committee (TAC) earlier in November for their
input. Because item statistics were not available at the time, the TAC did not feel confident in
recommending a particular number of items for the assessment. They did note that the number of
items should match with the intent and type of information that Florida wanted to report out for their
alternate assessment. The assessment was reduced from a 24 item design to a 16 item design. The 24
item design was initially proposed to allow for the reporting out of information at the standard level,
however, based on conversations with the FLDOE, the Alternate Assessment Advisory and the
Florida Technical Assistance Advisory it was made clear that reporting out at the content area level
was the overall intent of the Florida Alternate Assessment.
Regarding item graphics, some of the advisory members felt they should be more —real-life“;
whiles some of the advisory members felt that the Picture Exchange Communication System
Chapter 3—Test Development 30 2007–08 Florida Alt Technical Report
(PECS), with their heavy lines and symbolic nature, were better. Their recommendation was not
conclusive.
The format that required teachers to cut out all of the auxiliary materials was recognized as a
major issue early in the field test window, so Measured Progress and Department staff had already
collaborated on a solution that was presented to the advisory committee. The materials would be
provided in Auxiliary Materials Booklets on 11 inch x 17 inch paper, bound on the 11 inch side.
Each level of the item would be presented on a separate page and would be positioned on the page
either horizontally or vertically. If the item included a stimulus card, it would be separated from the
response cards with a heavy black line. Each page of the booklet would be numbered with the grade,
level and item number in the upper right-hand corner (e.g., 3P-1 or 3S-1 or 3I-1, where 3 represented
grade3; P, S, and I represented Participatory, Supported and Independent levels, respectively; and 1
represented item number 1). This would allow for ease of use by the teacher during administration.
A minimal amount of items in Reading, Mathematics, and Science would still require cutouts
due to the nature of the item; for example, an item might require that the student arrange three
pictures in sequence. The only content area that would be composed entirely of cut outs would be the
writing test, and cards and strips would be pre-cut by the printer and no longer require teacher time
for cutting. A sample item of this new format can be found in Appendix D.
The advisory was presented with a sample of the above format and felt that it would address
the concerns that teachers had voiced based on the field test administration. It was also decided that
the administration manual would be updated to clarify test administration procedures, give
information on how to orient students to the assessment, better define and provide directions around
prompting and cueing, and clarify allowable adaptations for the alternate assessment.
Chapter 3—Test Development 31 2007–08 Florida Alt Technical Report

32
Chapter 4. TRAINING AND ADMINISTRATION
4.1 Administrator Training
4.1.1 Professional Development
A train-the-trainer model workshop was provided by Measured Progress to approximately
120 individuals (two trainings of 60 individuals each) in early September 2007. Another 212
individuals were trained through the Accountability and Assessment for Students with Disabilities
(AASD) project in late September 2007. These trainers then trained approximately 3709 additional
teachers prior to the administration of the field test.
The train-the-trainer workshop was provided by the Measured Progress special education
specialist who had been involved with the development and review of the alternate assessment items
and had written the administration manual. The training included an overview of the administration
manual, a review of all of the activities prepared for training teachers, a review of the sample items
included in the manual and a review of the items prepared for the trainers. The PowerPoint that was
utilized for the training included a detailed notes section that directed trainers on what to say and
how to present the training. (See Appendix C for feedback related to the train-the-trainer sessions.)
Following the train-the-trainer sessions an updated administration manual was sent out for all
trainers and teachers involved in administration of the alternate assessment. The Department also
provided each teacher a DVD showing the administration of items using the new format of the
assessment materials.
4.1.2 Administration Manual
The administration manual includes sections that outline the assessment and its purpose, the
participation criteria for the assessment, the general administration procedures and materials of the
assessment, the content specific directions needed for the assessment, the scoring rubric and
directions on how to score each item in the assessment, how to fill out the student answer document,
Chapter 4—Training and Administration 33 2007–08 Florida Alt Technical Report
sample items and criteria and allowable accommodations for specific sectors of the student
population.
The Field Test Administration Manual was revised and an Operational Administration
Manual was provided to trainers and teachers in January 2008. This revised manual addressed the
changes to the assessment materials format. It also clarified some administration issues that were
raised through the field test. It was clarified that teachers could repeat the item two times, for a total
of three times, to a student as needed. It was also clarified that in items where the student was asked
to respond with more than one answer that the student could be prompted to finish an answer. For
example, an item might ask a student to sequence three phrases, the manual revisions clarified that it
was allowable for the teacher to prompt —What comes next?“ until the student had finished
sequencing all three phrase. The manual also added some appendices, including a list of the items
that required teacher-gathered materials and what those materials are. This allowed teachers to begin
gathering materials prior to the assessment administration window.
4.1.3 Training DVD
The Florida Department of Education developed a half-hour long DVD using the new
administration manual and newly formatted sample items. These DVDs were provided to school
districts on disc and made available for video streaming on the FLDOE website in January 2008.
The DVDs include a variety of students being administered items. The item administrations include
students where they move through an item all the way to the independent level and those that require
scaffolding at the participatory level of the item. They also highlight the changes in administration,
such as the repeating of the item prompt and the focusing of the student on the assessment materials.
Chapter 4—Training and Administration 34 2007–08 Florida Alt Technical Report
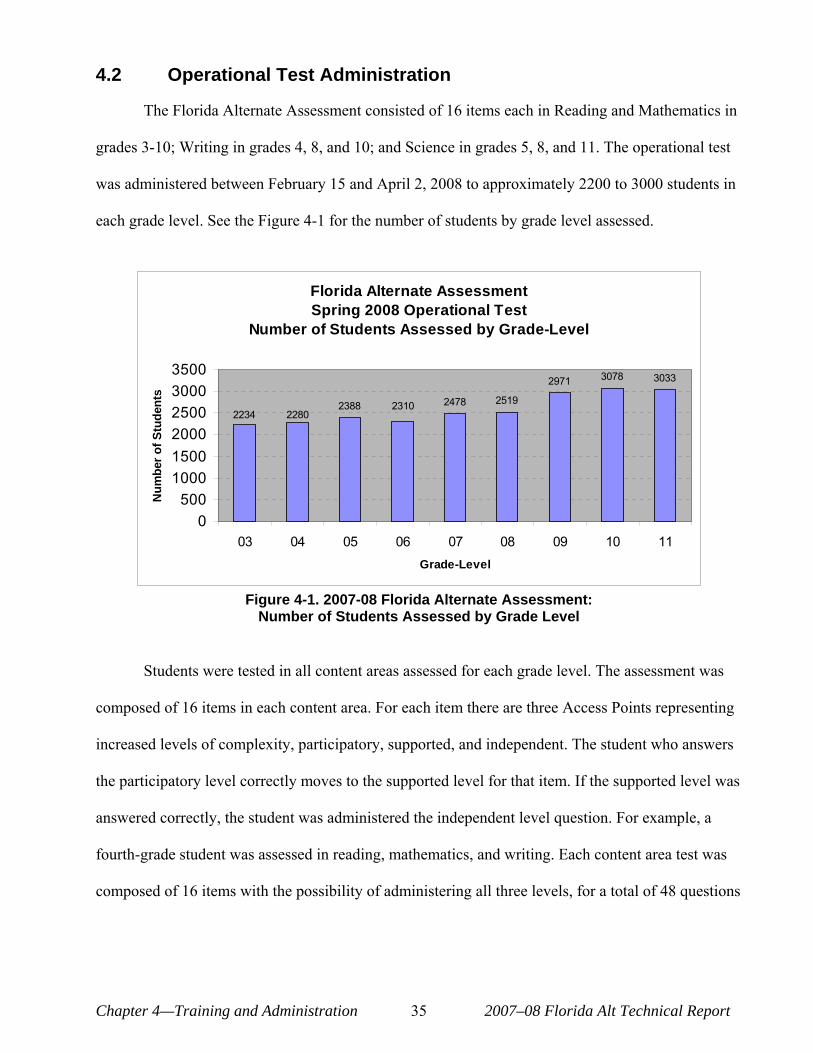
4.2 Operational Test Administration
The Florida Alternate Assessment consisted of 16 items each in Reading and Mathematics in
grades 3-10; Writing in grades 4, 8, and 10; and Science in grades 5, 8, and 11. The operational test
was administered between February 15 and April 2, 2008 to approximately 2200 to 3000 students in
each grade level. See the Figure 4-1 for the number of students by grade level assessed.
Florida Alternate Assessment Spring 2008 Operational Test
Number of Students Assessed by Grade-Level
2388 2478 2519
2971 3078 3033
2280 2310
2234
0 500
1000 1500 2000 2500 3000 3500
03 04 05 06 07 08 09 10 11 Grade-Level
Num
ber o
f Stu
dent
s
Figure 4-1. 2007-08 Florida Alternate Assessment: Number of Students Assessed by Grade Level
Students were tested in all content areas assessed for each grade level. The assessment was
composed of 16 items in each content area. For each item there are three Access Points representing
increased levels of complexity, participatory, supported, and independent. The student who answers
the participatory level correctly moves to the supported level for that item. If the supported level was
answered correctly, the student was administered the independent level question. For example, a
fourth-grade student was assessed in reading, mathematics, and writing. Each content area test was
composed of 16 items with the possibility of administering all three levels, for a total of 48 questions
Chapter 4—Training and Administration 35 2007–08 Florida Alt Technical Report
per content area. Depending on student performance, a total of 48 to 144 questions were
administered in grade 4.
4.2.1 Operational Test Survey Results
An on-line survey was provided during the administration window and for one week after the
close of the window. Approximately 850 teachers responded to the on-line survey. It is unclear the
number of total teachers that are involved in administering the assessment, however, 8000
administration manuals were distributed. The survey consisted of three parts. The first part requested
background information that included teacher demographic information, whether or not the teacher
was instructing the students using the Access Points, and whether or not the teacher had attended the
administration training. This first part also asked for feedback on the administration process
including the clarity of the updated administration manual directions, the ease of the administration
process, the ease of use of the materials required for the assessment based on the new format, and the
appropriateness of the graphics included in the items. The second part asked for student
demographic information, and specifics as to how that student interacted with the assessment, such
as how long the administration of each content area took for the student and the number of breaks
the student required during administration. The third part of the on-line survey was a voluntary
portion and allowed teachers to respond to specific items and any issues that they had with the items.
Once again there were not more than 5 to 10 responses on any one item.
Chapter 4—Training and Administration 36 2007–08 Florida Alt Technical Report
Around 50% of the respondents stated that they were consistently instructing their students
utilizing the Access Points in both English language arts and mathematics. Three hundred and fifty-
four of the five hundred teachers who had also participated in the field test responded that they had
attended an additional administration training and 96% of those who attended additional training felt
that they had received enough training to administer the new format of the assessment. Of those 500
teachers who had also participated in the field test 70% felt it was clear how to administer the items,
and 73% felt the graphics were appropriate for the items. About 93% of those same respondents felt
that the materials were more manageable and 90% stated that it was easier to organize the materials.
When comparing the amount of time that the reading test took to administer, with the change in the
number of items from 30 to 16, the amount of time it took was reduced. On the field test only 54%
of respondents were able to administer the test in 3 hours or less, while on the operational test 84%
were able to administer the test in 3 hours or less. Survey results can be found in Appendix C.
Chapter 4—Training and Administration 37 2007–08 Florida Alt Technical Report

Chapter 5. SCORING
5.1 Decision Rules for Scoring
In order to receive a valid score for a grade-relevant content area, all 16 items must be
completed correctly; this is regardless of whether a reason for not being assessed is bubbled on page
1 of the Student Answer Sheet (i.e., Took FCAT, Withdrew, Home school, etc.) or the ”Student
Took FCAT [content area]‘ bubble for a particular content area (page 2 of Student Answer Sheet) is
filled in.
The following list describes situations where a valid score for a specific content area cannot
be achieved:
° Invalid Bubble Completed- A total score cannot be calculated for any content areas
(complete or incomplete) on an Answer Sheet marked as —Invalid“. The Invalid bubble is
located on the bottom of page 1 of the Student Answer Sheet. Teachers are asked to mark
the Invalid bubble if the answer sheet is defective, soiled, or incorrectly completed.
° Missing Student Grade - A total score cannot be calculated for any content areas
(complete or incomplete) on an Answer Sheet where student grade has not been marked.
° Incomplete Content Area - A total score cannot be calculated for a content area unless
all 16 items have been completed. Content areas with less than 16 bubbled items are
labeled as NS (i.e., No Score œ not enough data to calculate a score).
° Multiple Responses Bubbled for an Item - A total score cannot be calculated for a
content area if more than one answer has been bubbled in for any one item. An item-level
score cannot be determined if an item has more than one answer. The content area is
therefore labeled as NS (i.e., No Score œ not enough data to calculate a score).
° Content Area not Assessed - For partially completed Student Answer Sheets (i.e., grade
3 student - only Reading content area completed), grade-relevant content area(s) that
were not completed are labeled as NA (i.e., Not Assessed).
See Figure 5-1 for a visual depiction of the scoring decision rules process.
Chapter 5—Scoring 39 2007–08 Florida Alt Technical Report
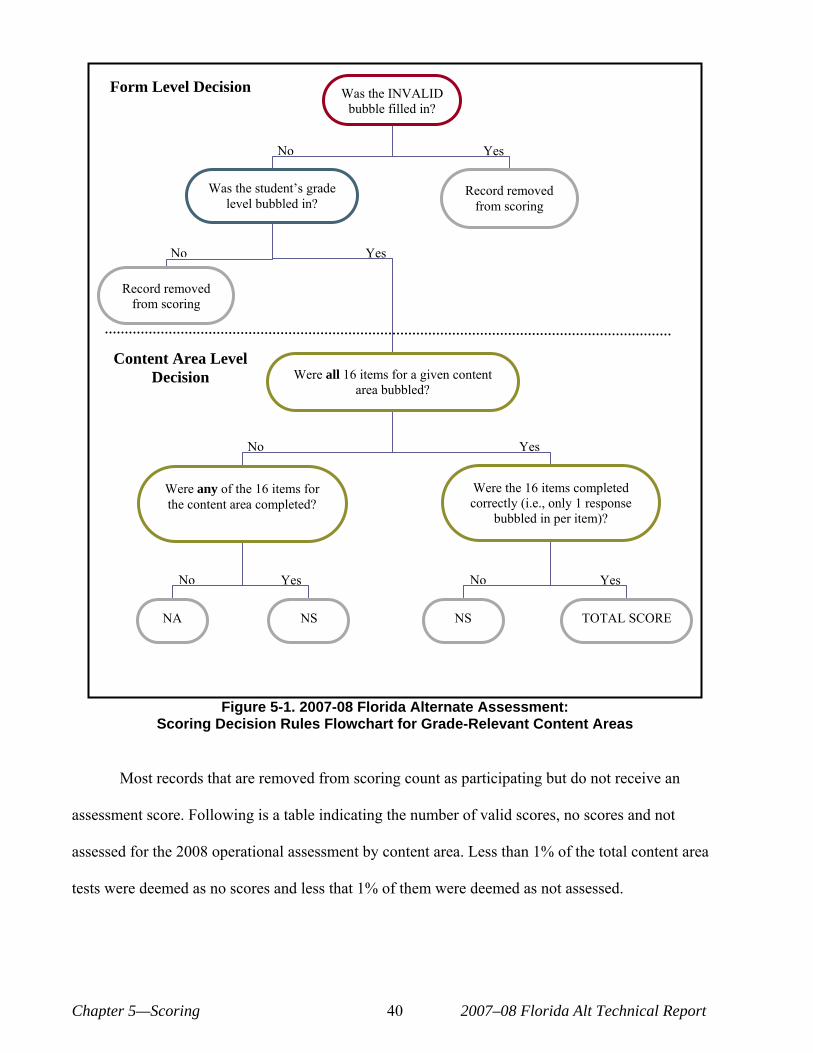
Form Level Decision Was the INVALID bubble filled in?
Content Area Level Decision
Was the student‘s grade level bubbled in?
Were any of the 16 items for the content area completed?
Were the 16 items completed correctly (i.e., only 1 response
bubbled in per item)?
No Yes
Record removed from scoring
Record removed from scoring
Were all 16 items for a given content area bubbled?
NSNA TOTAL SCORE NS
No Yes
No Yes
No YesNo Yes
Figure 5-1. 2007-08 Florida Alternate Assessment: Scoring Decision Rules Flowchart for Grade-Relevant Content Areas
Most records that are removed from scoring count as participating but do not receive an
assessment score. Following is a table indicating the number of valid scores, no scores and not
assessed for the 2008 operational assessment by content area. Less than 1% of the total content area
tests were deemed as no scores and less that 1% of them were deemed as not assessed.
Chapter 5—Scoring 40 2007–08 Florida Alt Technical Report
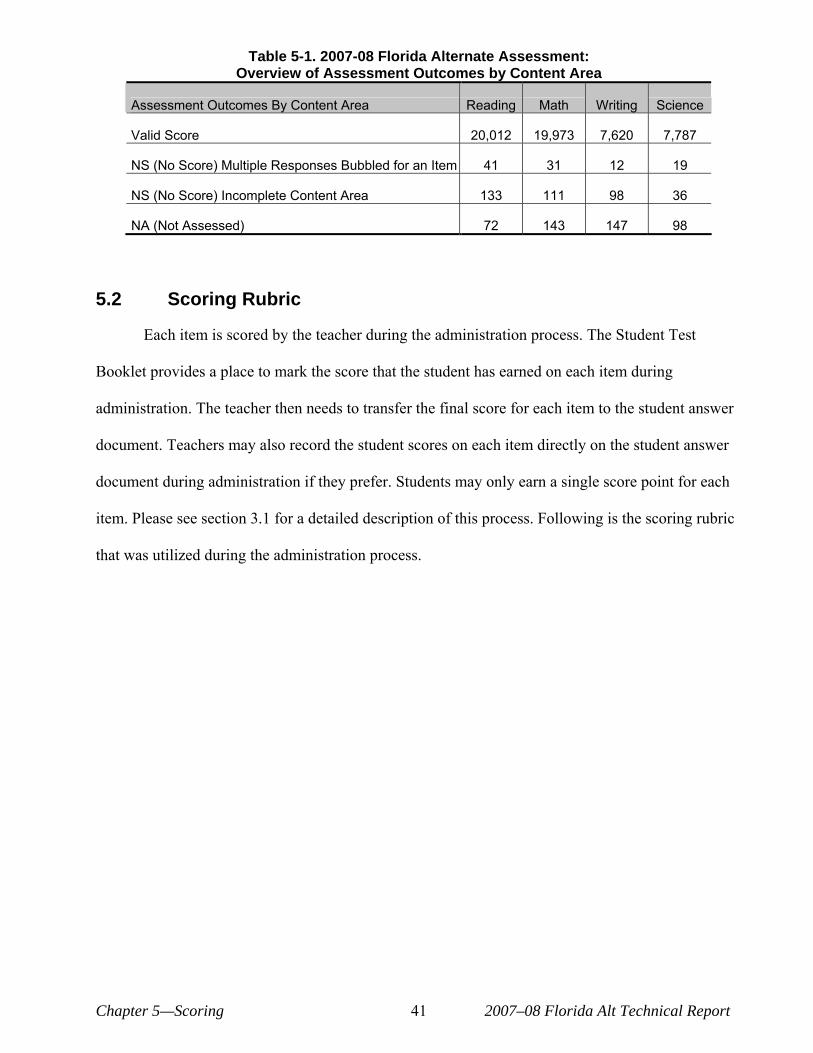
Table 5-1. 2007-08 Florida Alternate Assessment: Overview of Assessment Outcomes by Content Area
Assessment Outcomes By Content Area Math Writing Science Reading
Valid Score 20,012 19,973 7,620 7,787
NS (No Score) Multiple Responses Bubbled for an Item 41 31 12 19
NS (No Score) Incomplete Content Area 133 111 98 36
NA (Not Assessed) 72 143 147 98
5.2 Scoring Rubric
Each item is scored by the teacher during the administration process. The Student Test
Booklet provides a place to mark the score that the student has earned on each item during
administration. The teacher then needs to transfer the final score for each item to the student answer
document. Teachers may also record the student scores on each item directly on the student answer
document during administration if they prefer. Students may only earn a single score point for each
item. Please see section 3.1 for a detailed description of this process. Following is the scoring rubric
that was utilized during the administration process.
Chapter 5—Scoring 41 2007–08 Florida Alt Technical Report
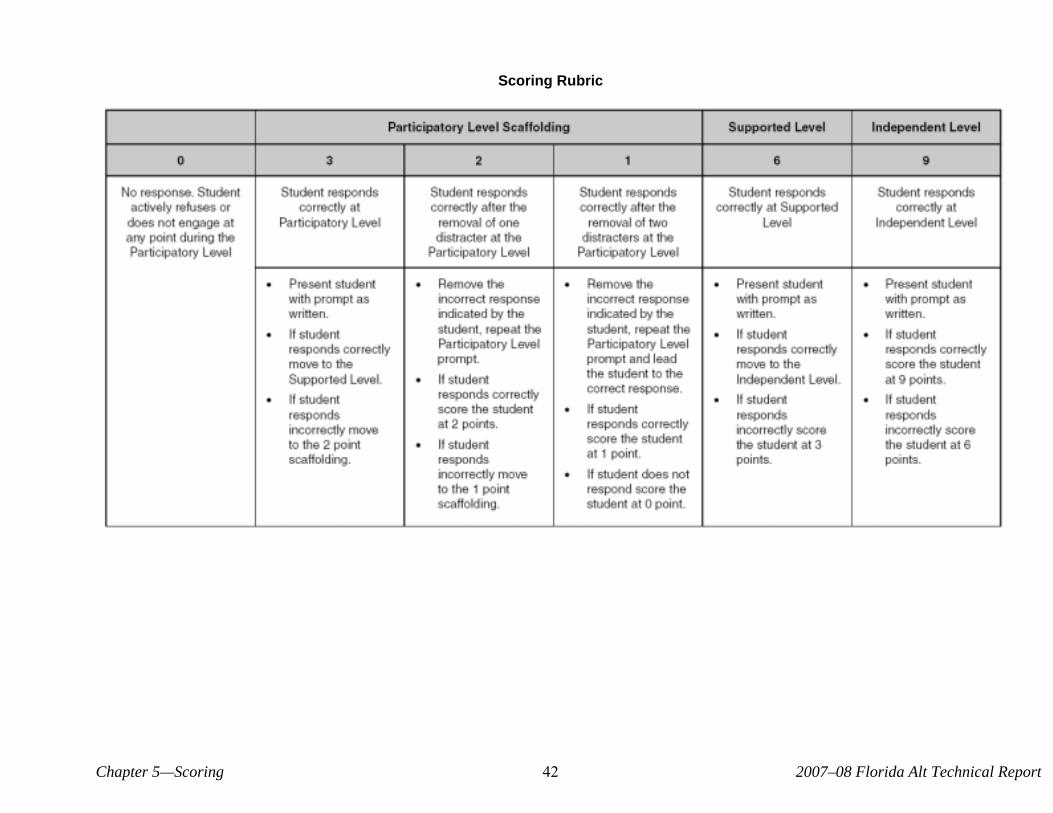
Scoring Rubric
Chapter 5—Scoring 42 2007–08 Florida Alt Technical Report
5.3 Scoring Process
5.3.1 Handling of Incoming Forms
Incoming Shipments
° Incoming shipment information is entered into a Florida Alternate Assessment
management database as shipments arrive. Barcodes from light blue TO BE SCORED
labels affixed to incoming boxes and courier tracking numbers are scanned into the
database, along with the name of the sending district, and the date of arrival. Each box
includes separate TO BE SCORED materials envelopes from each school returning
answer sheets for scoring. School envelopes include student answer sheets and a
Document Count and Return Summary Form. A blue label with a unique barcode
identifying the returning school is affixed to the front of each envelope. When boxes (or
packages) are opened, the barcode on each envelope‘s label is scanned into the
management database. Each envelope barcode is linked to the barcode on the box in
which it arrived.
° Depending on size, packages are either locked in a cabinet or stored in a separate locked
office before processing.
° Since processing of packages is done on a by-district basis, only boxes/packages for the
relevant district are moved to the processing area at a time.
Document Sorting
° TO BE SCORED materials are separated into 4 separate trays by district: 1) Completed
Student Answer Sheets; 2) Blank/Unused Student Answer Sheets with no demographic or
item-level data; 3) Document Count & Return Summary Forms; 4) Other miscellaneous
materials (e.g., business cards, post-it notes, student records) œ these other materials are
reviewed by supervisors and either stored or destroyed.
° All documents are removed from packaging. As a safety measure, all empty envelopes
are re-inspected once forms have been removed to ensure that no forms remain in the
envelopes.
° If additional notes from district coordinators or examiners are discovered (e.g., —DO NOT
SCAN“), the notes and corresponding answer sheets are shared with supervisors before
proceeding.
Chapter 5—Scoring 43 2007–08 Florida Alt Technical Report
° Additional staples and paperclips are removed from forms.
° Completed forms are checked for missing district numbers and/or school numbers as they
are processed:
o If either of these items is missing, the information is added only if the correct district/school number can be discerned from the envelope label or Document Count & Return Summary Form. Staff are trained to ask supervisors for assistance, whenever necessary.
° Student Answer Sheets and Document Count & Return Summary Forms are stored in
locked cabinets (separated by district) for the next stage of processing.
° After opening all boxes/packages for a particular district, staff members date and initial
next to the district‘s name in a processing log.
Chapter 5—Scoring 44 2007–08 Florida Alt Technical Report
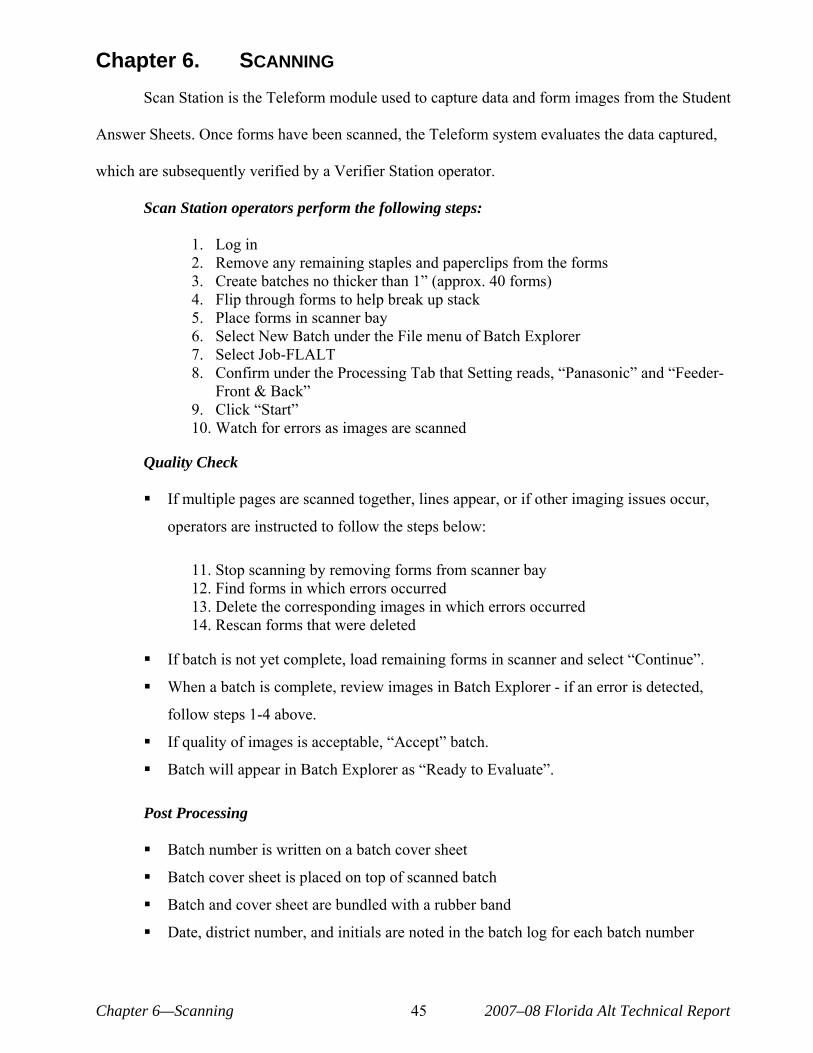
Chapter 6. SCANNING
Scan Station is the Teleform module used to capture data and form images from the Student
Answer Sheets. Once forms have been scanned, the Teleform system evaluates the data captured,
which are subsequently verified by a Verifier Station operator.
Scan Station operators perform the following steps:
1. Log in 2. Remove any remaining staples and paperclips from the forms 3. Create batches no thicker than 1“ (approx. 40 forms) 4. Flip through forms to help break up stack 5. Place forms in scanner bay 6. Select New Batch under the File menu of Batch Explorer 7. Select Job-FLALT 8. Confirm under the Processing Tab that Setting reads, —Panasonic“ and —Feeder-
Front & Back“ 9. Click —Start“ 10. Watch for errors as images are scanned
Quality Check
° If multiple pages are scanned together, lines appear, or if other imaging issues occur,
operators are instructed to follow the steps below:
11. Stop scanning by removing forms from scanner bay 12. Find forms in which errors occurred 13. Delete the corresponding images in which errors occurred 14. Rescan forms that were deleted
° If batch is not yet complete, load remaining forms in scanner and select —Continue“.
° When a batch is complete, review images in Batch Explorer - if an error is detected,
follow steps 1-4 above.
° If quality of images is acceptable, —Accept“ batch.
° Batch will appear in Batch Explorer as —Ready to Evaluate“.
Post Processing
° Batch number is written on a batch cover sheet
° Batch cover sheet is placed on top of scanned batch
° Batch and cover sheet are bundled with a rubber band
° Date, district number, and initials are noted in the batch log for each batch number
Chapter 6—Scanning 45 2007–08 Florida Alt Technical Report
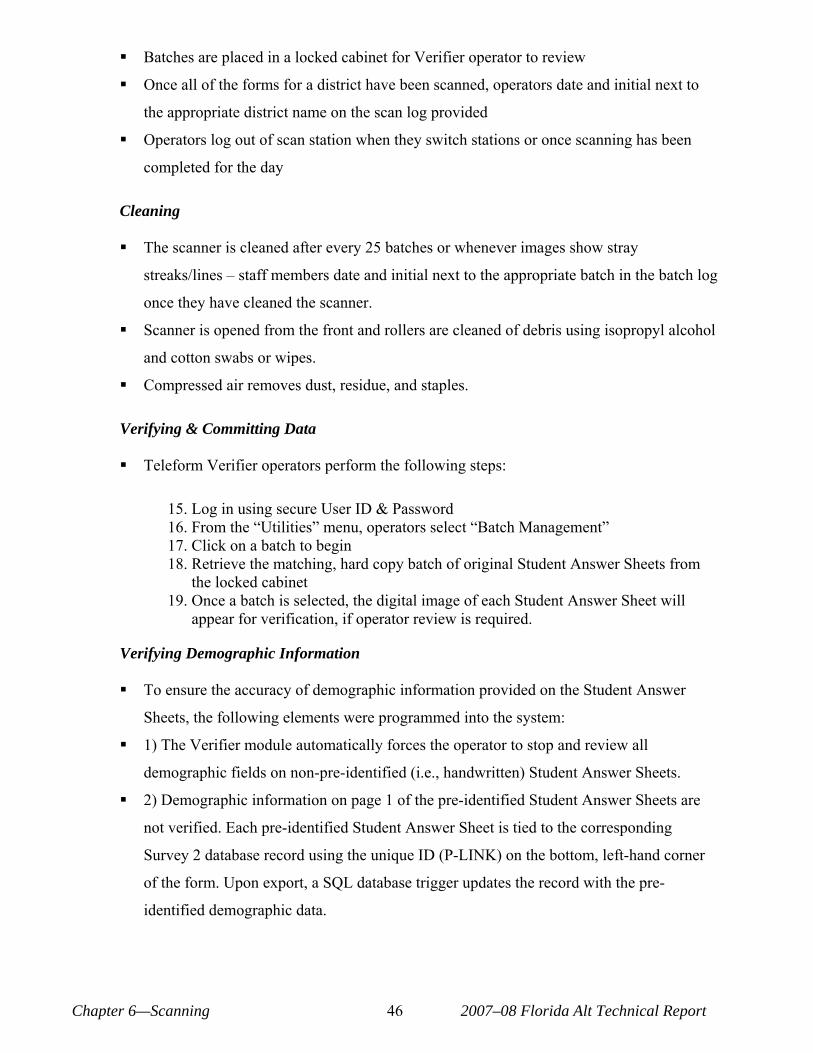
° Batches are placed in a locked cabinet for Verifier operator to review
° Once all of the forms for a district have been scanned, operators date and initial next to
the appropriate district name on the scan log provided
° Operators log out of scan station when they switch stations or once scanning has been
completed for the day
Cleaning
° The scanner is cleaned after every 25 batches or whenever images show stray
streaks/lines œ staff members date and initial next to the appropriate batch in the batch log
once they have cleaned the scanner.
° Scanner is opened from the front and rollers are cleaned of debris using isopropyl alcohol
and cotton swabs or wipes.
° Compressed air removes dust, residue, and staples.
Verifying & Committing Data
° Teleform Verifier operators perform the following steps:
15. Log in using secure User ID & Password 16. From the —Utilities“ menu, operators select —Batch Management“ 17. Click on a batch to begin 18. Retrieve the matching, hard copy batch of original Student Answer Sheets from
the locked cabinet 19. Once a batch is selected, the digital image of each Student Answer Sheet will
appear for verification, if operator review is required.
Verifying Demographic Information
° To ensure the accuracy of demographic information provided on the Student Answer
Sheets, the following elements were programmed into the system:
° 1) The Verifier module automatically forces the operator to stop and review all
demographic fields on non-pre-identified (i.e., handwritten) Student Answer Sheets.
° 2) Demographic information on page 1 of the pre-identified Student Answer Sheets are
not verified. Each pre-identified Student Answer Sheet is tied to the corresponding
Survey 2 database record using the unique ID (P-LINK) on the bottom, left-hand corner
of the form. Upon export, a SQL database trigger updates the record with the pre-
identified demographic data.
Chapter 6—Scanning 46 2007–08 Florida Alt Technical Report
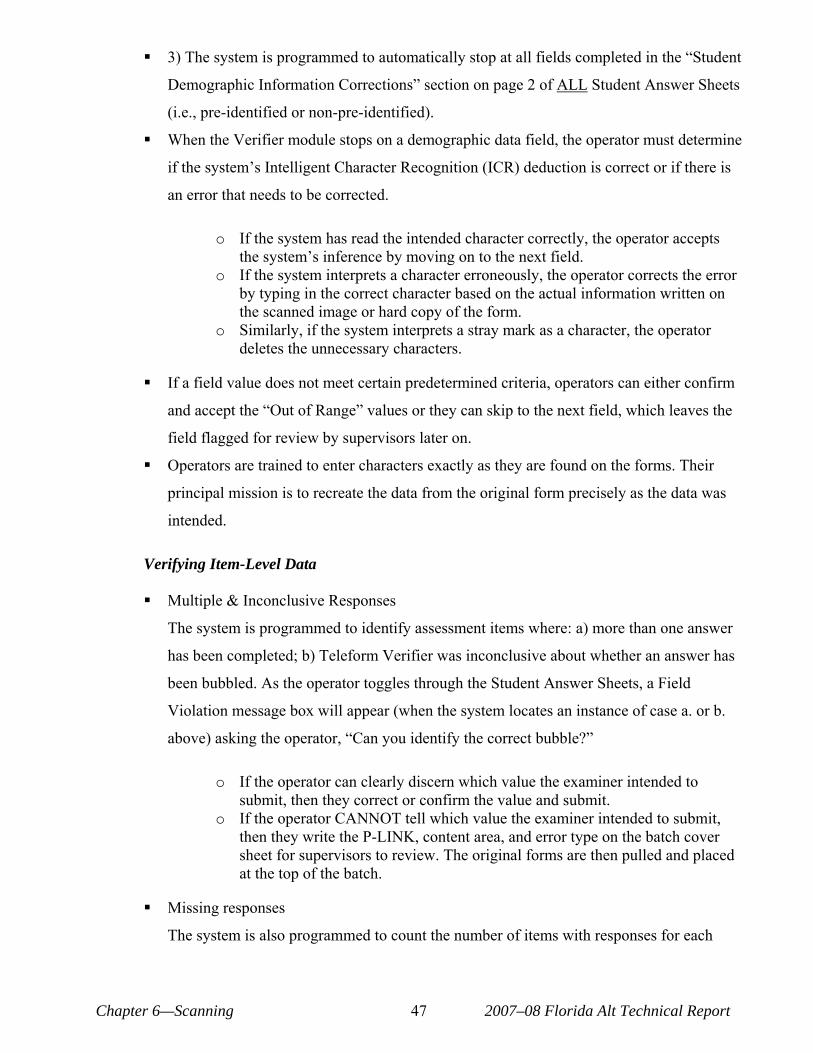
° 3) The system is programmed to automatically stop at all fields completed in the —Student
Demographic Information Corrections“ section on page 2 of ALL Student Answer Sheets
(i.e., pre-identified or non-pre-identified).
° When the Verifier module stops on a demographic data field, the operator must determine
if the system‘s Intelligent Character Recognition (ICR) deduction is correct or if there is
an error that needs to be corrected.
o If the system has read the intended character correctly, the operator accepts the system‘s inference by moving on to the next field.
o If the system interprets a character erroneously, the operator corrects the error by typing in the correct character based on the actual information written on the scanned image or hard copy of the form.
o Similarly, if the system interprets a stray mark as a character, the operator deletes the unnecessary characters.
° If a field value does not meet certain predetermined criteria, operators can either confirm
and accept the —Out of Range“ values or they can skip to the next field, which leaves the
field flagged for review by supervisors later on.
° Operators are trained to enter characters exactly as they are found on the forms. Their
principal mission is to recreate the data from the original form precisely as the data was
intended.
Verifying Item-Level Data
° Multiple & Inconclusive Responses
The system is programmed to identify assessment items where: a) more than one answer
has been completed; b) Teleform Verifier was inconclusive about whether an answer has
been bubbled. As the operator toggles through the Student Answer Sheets, a Field
Violation message box will appear (when the system locates an instance of case a. or b.
above) asking the operator, —Can you identify the correct bubble?“
o If the operator can clearly discern which value the examiner intended to submit, then they correct or confirm the value and submit.
o If the operator CANNOT tell which value the examiner intended to submit, then they write the P-LINK, content area, and error type on the batch cover sheet for supervisors to review. The original forms are then pulled and placed at the top of the batch.
° Missing responses
The system is also programmed to count the number of items with responses for each
Chapter 6—Scanning 47 2007–08 Florida Alt Technical Report
grade-relevant content area (e.g., only Science for 11th grade). If the total number of
counted responses does not match the total number of items for a content area (i.e., 16
items), then a flag is raised and the system will automatically stop on the incomplete
item(s). Verifier operators are trained to review the original Student Answer Sheet (rather
than the scanned image) to determine whether an item has, in fact, been completed. If any
item is blank for a grade-specific content area, the operator writes the P-LINK, content
area, and error type on the batch cover sheet for supervisors to review. The original forms
are then pulled and placed at the top of the batch.
Missing Pages
° If Verifier identifies a form as having a missing page, the operator deletes the form image
from the system and pulls the hard copy from the batch for rescanning. Verifier also
identifies forms that may have unidentified pages due to page overlap during scanning,
stray marks, torn forms, or damage to square cornerstone markers. These forms are also
rescanned.
Committing Batches to the SQL Server Database
° Once the batches have been verified, they are transferred to a supervisor for quality
checking.
° The front cover of each batch is checked by the supervisor for errors noted by Verifier
operators.
o If the batch cover sheet contains errors found (e.g., more than one answer has been bubbled for an item), the supervisor reviews the original Student Answer Sheets to confirm these errors.
° When the supervisor confirms that an error was, in fact, submitted by the examiner,
he/she initials the cover sheet next to the location where the error was noted.
° If an error is determined to be a false positive, the supervisor will correct the item in
Teleform Verifier, make a note of the change on the batch cover sheet, and sign and date
the cover sheet where the change is noted.
° All Student Answer Sheets where the system has identified errors have a status of —Needs
Review.“ A batch cannot be committed until the status of all Student Answer Sheets is
—Evaluated OK.“
Chapter 6—Scanning 48 2007–08 Florida Alt Technical Report
° Supervisors randomly check 5 Student Answer Sheets per batch where errors were not
flagged by the system.
° The batches can then be committed to the database. The supervisor signs off that the
batch has been committed.
6.1 Data Security
Individuals are only granted permission for actions needed to perform their jobs. Limiting
actions to those properly authorized protects the confidentiality and integrity of data within the
processing environment. All employees are required to sign a confidentiality agreement.
6.2 Electronic Records
All authorized personnel have individual usernames and passwords to access the stand-alone
network, which stores secure student data. If personnel leave their computers for more than two
minutes, a password-protected screen saver is activated. A very limited number of employees have
access to sensitive electronic records. All sensitive electronic records, including scanned answer
sheet images, assessment data, and student demographic information are stored on the SQL server
and backed up every night.
All electronic records are protected from unauthorized access while in storage and while
being processed through the use suitable information security techniques, such as password-
protection and analogous methods. Access control mechanisms must also be utilized to ensure that
only authorized users can access data to which they have been granted explicit access rights.
Additionally, any computer and/or electronic devices where these electronic records reside, such as
database servers, local hard drives, external hard drives, tape or optical backups, etc., are always
kept within secure premises, as described below.
Authorized individuals are trained to avoid transmitting sensitive data through electronic
means proven to be easily intercepted and/or modifiable, such as unencrypted email communications
Chapter 6—Scanning 49 2007–08 Florida Alt Technical Report
or unsecured FTP connections. Transmission of sensitive information via facsimile documents is
also prohibited.
6.3 Physical Records
Only authorized employees have access to student data for processing purposes. Each
employee must ensure that confidential data under their direction or control are properly labeled and
safeguarded according to their sensitivity and criticality. All physical records must be kept in full
view by the authorized employees while being accessed and/or processed, and properly stored and
secured if the premises are left for any period of time. Sensitive physical records are stored in locked
cabinets, and only supervisors have access to their keys.
Location Specifications
The premises where sensitive physical and electronic records are stored are protected at all
times from unauthorized access, through a combination of building security access systems, security
personnel, and suitable locks in doors and any other similar points of access. Storage and filing
cabinets are also protected by locking mechanisms, independently from any additional access control
to the rooms where they are located. Building windows are fixed panes made of impact-resistant
glass that do not open. The building‘s security access system limits access to the building after hours
and during weekends. An Access Card is required to gain entry to the building when the security
system is activated. The premises are also protected by a security company, which provides a
security guard 24hours a day, 7 days a week.
6.4 Data Disposal
Both physical and electronic records are destroyed, deleted and/or purged through any
number of means that guarantee the technical impossibility of these records being recovered, be it
partially or completely. Any backup copies of electronic records that might exist, regardless of
format, are also disposed of accordingly. Data assets, both physical and electronic, are kept for the
Chapter 6—Scanning 50 2007–08 Florida Alt Technical Report
period of time considered as mandatory by any applicable laws. If any data assets were to fall
outside the scope of these periods of time, then all necessary steps for their disposal are taken.
6.5 Secure Test Material Distribution & Return
All test material shipments to and from the districts are shipped using tracking mechanisms.
Every district and school materials box within a district shipment contains a label with an internal
scannable barcode as well as a standard courier/freight shipping label. For tracking purposes,
internal and shipping barcodes are stored in a management database before shipments are picked up
by couriers. Every district shipment includes school-level and district-level packing lists detailing all
of the materials included. For districts receiving pallets of materials, a pallet map is also provided,
describing how many cartons are included for each school and the skid numbers where the cartons
can be found.
Both district and school test coordinators are instructed to inventory shipment contents within
24 hours of receipt and report any discrepancies immediately. Once secure test materials arrive at the
districts, district assessment coordinators are responsible for storing these materials in secure, locked
facilities. It is the responsibility of district assessment coordinators to ensure that materials are
handled appropriately during distribution to and return from schools. Likewise, school test
coordinators are instructed to store test materials in secure locations. Materials are shipped using
DHL, UPS, or AAA Cooper only; the type of courier is determined based on type and quantity of
materials. All shipments to districts are tracked to ensure delivery by a specific date.
Chapter 6—Scanning 51 2007–08 Florida Alt Technical Report

Chapter 7. REPORTING
7.1 Report Shells
Reports are generated at the following levels:
State-level report œ contains the number of students assessed and percentages of students
scoring at each level of complexity (i.e., Participatory, Supported, Independent) and level of
performance (i.e., Basic, Proficient, Advanced) for each district as well as the State‘s overall results
by content area.
District-level reports œ contain the number of students assessed and percentages of students
scoring at each level of complexity (i.e., Participatory, Supported, Independent) and level of
performance (i.e., Basic, Proficient, Advanced) for each school in a given district as well as the
district‘s overall results by content area.
School-level reports œ includes the list of students assessed in a given school along with their
level of complexity (i.e., Participatory, Supported, Independent), level of performance (i.e., Basic,
Proficient, Advanced), and total score by content area. The report also contains a summary of the
school‘s overall results.
Student-level reports œ includes the student‘s basic demographic information (e.g., name,
grade, school, etc.), total score, level of complexity (i.e., Participatory, Supported, Independent), and
level of performance (i.e., Basic, Proficient, Advanced) by content area. See Appendix E for sample
report shells.
In addition to the reports listed above, parent and teacher brochures were prepared to be
returned with the individual student reports. The parent brochures focus on providing an overview of
the Florida Alternate Assessment including the Access Points and a description of the levels of
complexity, information on who determines whether or not the student will participate in alternate
assessment, when the assessment takes place, who administers the assessment and how the results
are used. The teacher brochure includes some of the same information, but focuses more on what
Chapter 7—Reporting 53 2007–08 Florida Alt Technical Report
results are provided and how they can be utilized by the teacher. (Copies of the brochures can be
found in Appendix F.)
7.2 Decision Rules for Reporting
° Reports are not generated for students where no items in the content area(s) specific to
the student‘s grade are completed.
° Data scanned from Student Answer Sheets marked as —Invalid“ are not included in
reports. The Invalid bubble is located on the bottom of page 1 of the Student Answer
Sheet. Teachers were asked to mark the Invalid bubble if the answer sheet was defective,
soiled, or incorrectly completed.
° Data scanned from Student Answer Sheets where no grade level is indicated are not
included in reports.
° Reports are not generated for students where deceased is indicated as the Reason Not
Assessed (page 1).
Chapter 7—Reporting 54 2007–08 Florida Alt Technical Report
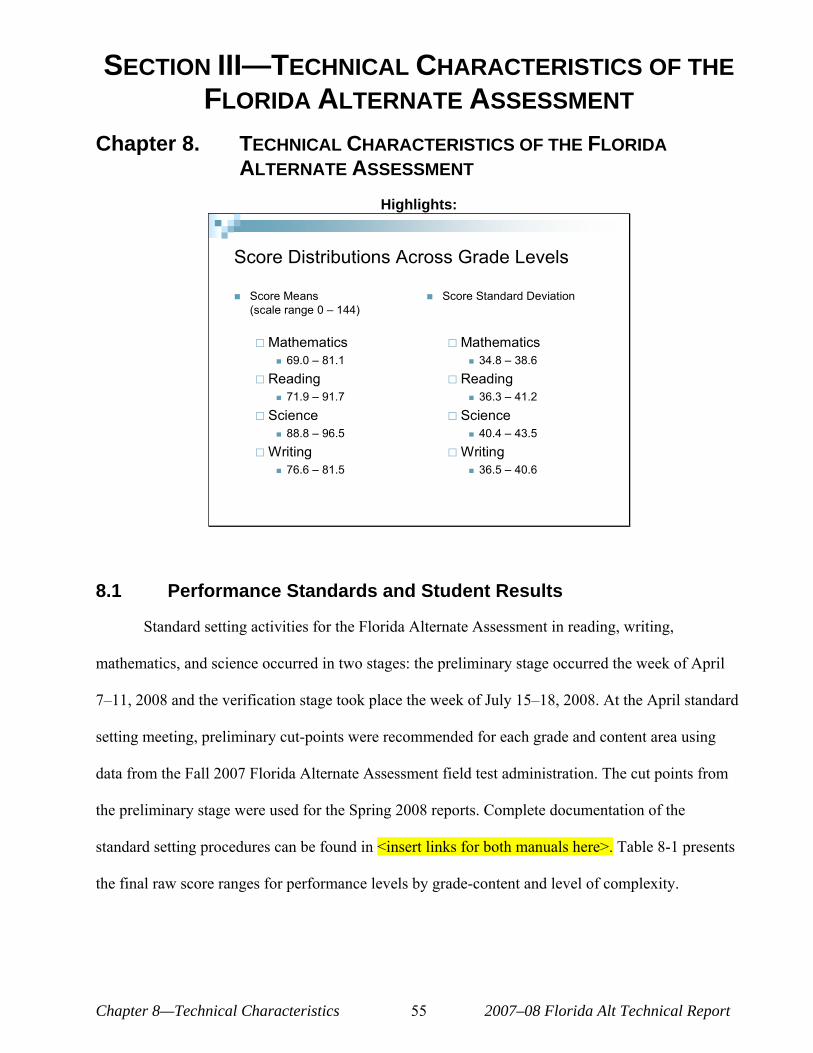
SECTION III—TECHNICAL CHARACTERISTICS OF THE FLORIDA ALTERNATE ASSESSMENT
Chapter 8. TECHNICAL CHARACTERISTICS OF THE FLORIDA ALTERNATE ASSESSMENT
Highlights:
Score Distributions Across Grade Levels
¢ Score Means ¢ Score Standard Deviation (scale range 0 œ 144)
£ Mathematics £ Mathematics ¢ 69.0 œ 81.1 ¢ 34.8 œ 38.6
£ Reading £ Reading ¢ 71.9 œ 91.7 ¢ 36.3 œ 41.2
£ Science £ Science ¢ 88.8 œ 96.5 ¢ 40.4 œ 43.5
£ Writing £ Writing ¢ 76.6 œ 81.5 ¢ 36.5 œ 40.6
8.1 Performance Standards and Student Results
Standard setting activities for the Florida Alternate Assessment in reading, writing,
mathematics, and science occurred in two stages: the preliminary stage occurred the week of April
7œ11, 2008 and the verification stage took place the week of July 15œ18, 2008. At the April standard
setting meeting, preliminary cut-points were recommended for each grade and content area using
data from the Fall 2007 Florida Alternate Assessment field test administration. The cut points from
the preliminary stage were used for the Spring 2008 reports. Complete documentation of the
standard setting procedures can be found in <insert links for both manuals here>. Table 8-1 presents
the final raw score ranges for performance levels by grade-content and level of complexity.
Chapter 8—Technical Characteristics 55 2007–08 Florida Alt Technical Report
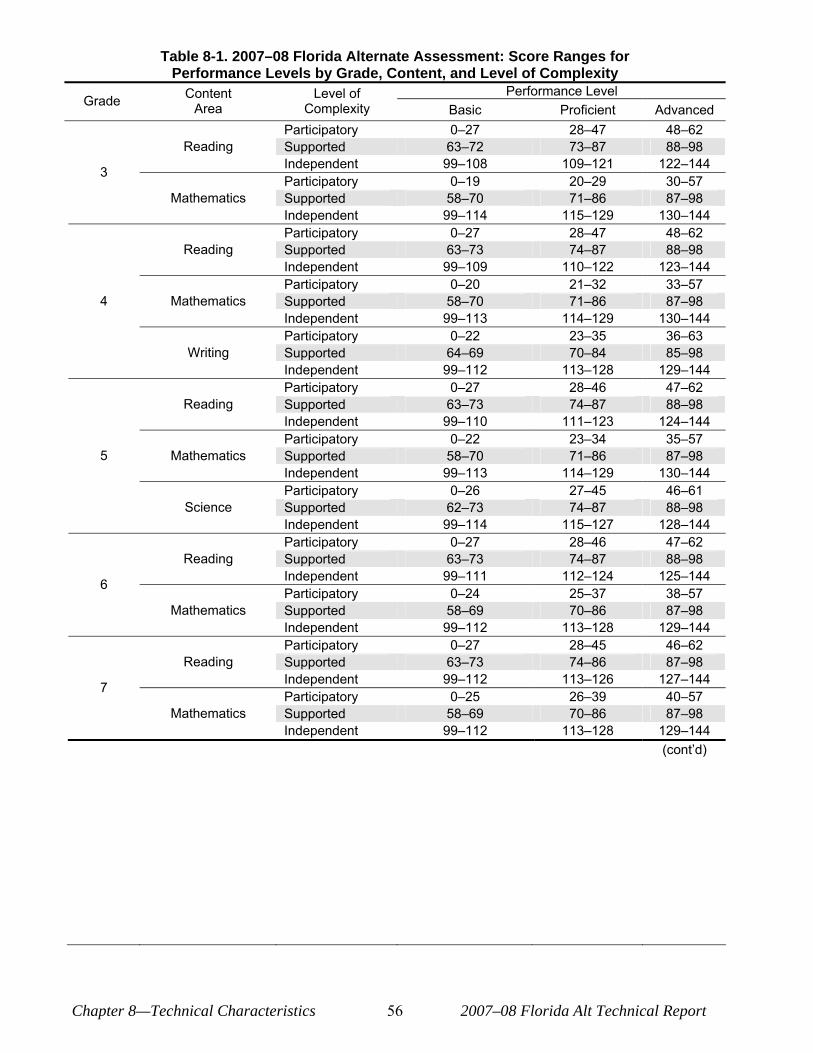
Grade
Table 8-1. 2007–08 Florida Alternate Assessment: Score Ranges for Performance Levels by Grade, Content, and Level of Complexity
Performance Level Content Area
Level of Complexity Basic Proficient
Participatory 0œ27 28œ47 Advanced
48œ62
3 Independent Participatory
99œ108 0œ19
109œ121 20œ29
122œ144 30œ57
Independent 99œ114 115œ129 130œ144
Supported 63œ72 73œ87 88œ98 Reading
Supported 58œ70 71œ86 87œ98 Mathematics
Participatory 0œ27 28œ47 48œ62 Supported 63œ73 74œ87 88œ98 Reading Independent 99œ109 110œ122 123œ144 Participatory 0œ20 21œ32 33œ57 Supported 58œ70 71œ86 87œ98 Mathematics 4 Independent 99œ113 114œ129 130œ144 Participatory 0œ22 23œ35 36œ63 Supported 64œ69 70œ84 85œ98 Writing Independent 99œ112 113œ128 129œ144 Participatory 0œ27 28œ46 47œ62 Supported 63œ73 74œ87 88œ98 Reading Independent 99œ110 111œ123 124œ144 Participatory 0œ22 23œ34 35œ57 Supported 58œ70 71œ86 87œ98 Mathematics 5 Independent 99œ113 114œ129 130œ144 Participatory 0œ26 27œ45 46œ61 Supported 62œ73 74œ87 88œ98 Science Independent 99œ114 115œ127 128œ144 Participatory 0œ27 28œ46 47œ62 Supported 63œ73 74œ87 88œ98 Reading
6 Independent Participatory
99œ111 0œ24
112œ124 25œ37
125œ144 38œ57
Independent 99œ112 113œ128 129œ144 Supported 58œ69 70œ86 87œ98 Mathematics
Participatory 0œ27 28œ45 46œ62 Supported 63œ73 74œ86 87œ98 Reading
7 Independent Participatory
99œ112 0œ25
113œ126 26œ39
127œ144 40œ57
Independent 99œ112 113œ128 129œ144 (cont‘d)
Supported 58œ69 70œ86 87œ98 Mathematics
Chapter 8—Technical Characteristics 56 2007–08 Florida Alt Technical Report
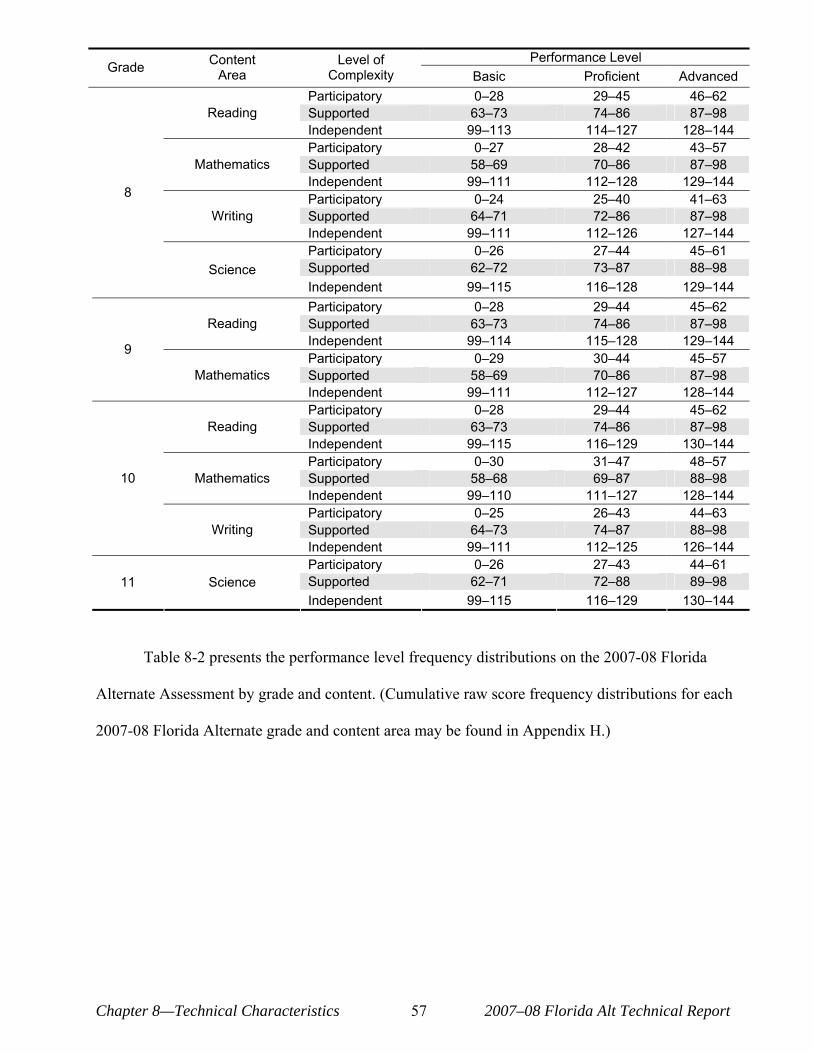
Content Level of Performance Level Grade Area Complexity Basic Proficient Advanced
Participatory 0œ28 29œ45 46œ62 Supported 63œ73 74œ86 87œ98 Reading Independent 99œ113 114œ127 128œ144 Participatory 0œ27 28œ42 43œ57 Supported 58œ69 70œ86 87œ98 Mathematics
8 Independent Participatory
99œ111 0œ24
112œ128 25œ40
129œ144 41œ63
Independent 99œ111 112œ126 127œ144 Supported 64œ71 72œ86 87œ98 Writing
Participatory 0œ26 27œ44 45œ61 Supported 62œ72 73œ87 88œ98 Science Independent 99œ115 116œ128 129œ144
Participatory 0œ28 29œ44 45œ62 Supported 63œ73 74œ86 87œ98 Reading
9 Independent Participatory
99œ114 0œ29
115œ128 30œ44
129œ144 45œ57
Independent 99œ111 112œ127 128œ144 Supported 58œ69 70œ86 87œ98 Mathematics
Participatory 0œ28 29œ44 45œ62 Supported 63œ73 74œ86 87œ98 Reading Independent 99œ115 116œ129 130œ144 Participatory 0œ30 31œ47 48œ57 Supported 58œ68 69œ87 88œ98 Mathematics 10 Independent 99œ110 111œ127 128œ144 Participatory 0œ25 26œ43 44œ63 Supported 64œ73 74œ87 88œ98 Writing Independent 99œ111 112œ125 126œ144
Supported 62œ71 72œ88 89œ98 Participatory 0œ26 27œ43 44œ61
11 Science Independent 99œ115 116œ129 130œ144
Table 8-2 presents the performance level frequency distributions on the 2007-08 Florida
Alternate Assessment by grade and content. (Cumulative raw score frequency distributions for each
2007-08 Florida Alternate grade and content area may be found in Appendix H.)
Chapter 8—Technical Characteristics 57 2007–08 Florida Alt Technical Report
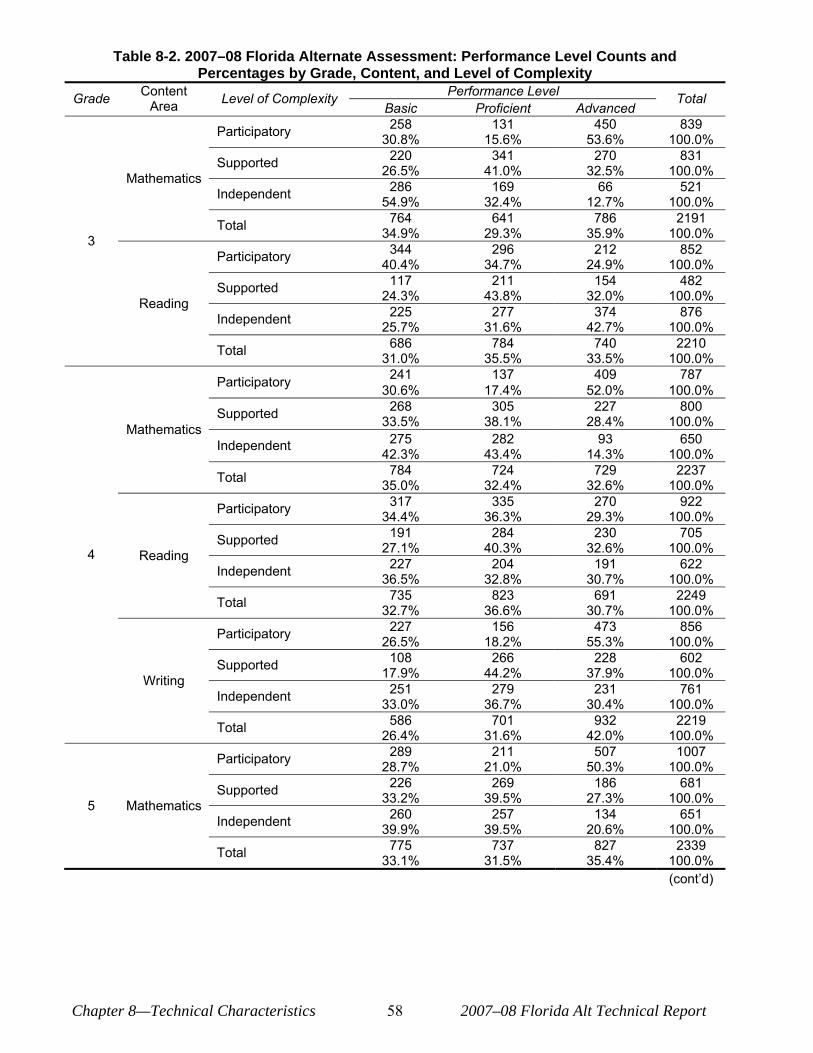
Table 8-2. 2007–08 Florida Alternate Assessment: Performance Level Counts and Percentages by Grade, Content, and Level of Complexity
Content Performance Level Grade Level of Complexity TotalArea Basic Proficient Advanced
Participatory 258 30.8%
131 15.6%
450 53.6%
839 100.0%
Mathematics Supported
Independent
220 26.5%
286 54.9%
341 41.0%
169 32.4%
270 32.5%
66 12.7%
831 100.0%
521 100.0%
3 Total
Participatory
764 34.9%
344 40.4%
641 29.3%
296 34.7%
786 35.9%
212 24.9%
2191 100.0%
852 100.0%
Reading Supported
Independent
117 24.3%
225 25.7%
211 43.8%
277 31.6%
154 32.0%
374 42.7%
482 100.0%
876 100.0%
Total 686 31.0%
784 35.5%
740 33.5%
2210 100.0%
Participatory 241 30.6%
137 17.4%
409 52.0%
787 100.0%
Mathematics Supported
Independent
268 33.5%
275 42.3%
305 38.1%
282 43.4%
227 28.4%
93 14.3%
800 100.0%
650 100.0%
Total 784 35.0%
724 32.4%
729 32.6%
2237 100.0%
Participatory 317 34.4%
335 36.3%
270 29.3%
922 100.0%
4 Reading Supported
Independent
191 27.1%
227 36.5%
284 40.3%
204 32.8%
230 32.6%
191 30.7%
705 100.0%
622 100.0%
Total 735 32.7%
823 36.6%
691 30.7%
2249 100.0%
Participatory 227 26.5%
156 18.2%
473 55.3%
856 100.0%
Writing Supported
Independent
108 17.9%
251 33.0%
266 44.2%
279 36.7%
228 37.9%
231 30.4%
602 100.0%
761 100.0%
Total 586 26.4%
701 31.6%
932 42.0%
2219 100.0%
Participatory 289 28.7%
211 21.0%
507 50.3%
1007 100.0%
5 Mathematics Supported
Independent
226 33.2%
260 39.9%
269 39.5%
257 39.5%
186 27.3%
134 20.6%
681 100.0%
651 100.0%
Total 775 33.1%
737 31.5%
827 35.4%
2339 100.0% (cont‘d)
Chapter 8—Technical Characteristics 58 2007–08 Florida Alt Technical Report
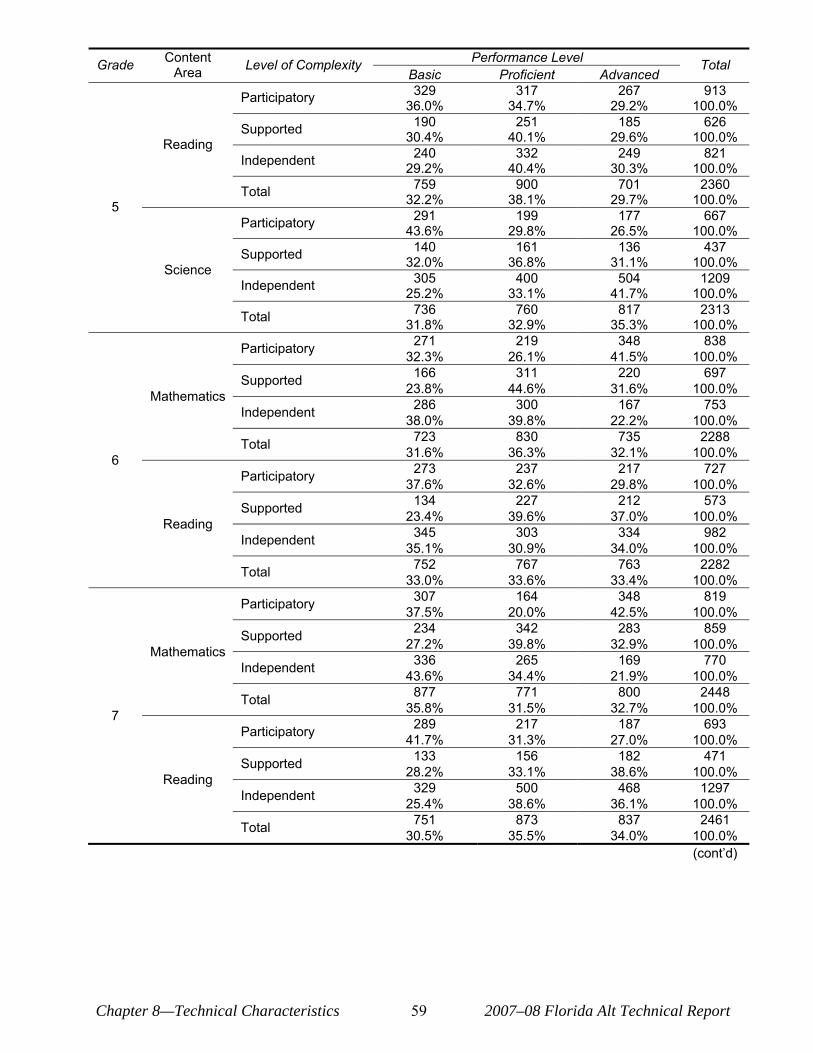
Grade Content Area Level of Complexity
BasicPerformance Level
Proficient Advanced Total
Participatory 329 36.0%
317 34.7%
267 29.2%
913 100.0%
Reading Supported
Independent
190 30.4%
240 29.2%
251 40.1%
332 40.4%
185 29.6%
249 30.3%
626 100.0%
821 100.0%
5 Total
Participatory
759 32.2%
291 43.6%
900 38.1%
199 29.8%
701 29.7%
177 26.5%
2360 100.0%
667 100.0%
Science Supported
Independent
140 32.0%
305 25.2%
161 36.8%
400 33.1%
136 31.1%
504 41.7%
437 100.0%
1209 100.0%
Total 736 31.8%
760 32.9%
817 35.3%
2313 100.0%
Participatory 271 32.3%
219 26.1%
348 41.5%
838 100.0%
Mathematics Supported
Independent
166 23.8%
286 38.0%
311 44.6%
300 39.8%
220 31.6%
167 22.2%
697 100.0%
753 100.0%
6 Total
Participatory
723 31.6%
273 37.6%
830 36.3%
237 32.6%
735 32.1%
217 29.8%
2288 100.0%
727 100.0%
Reading Supported
Independent
134 23.4%
345 35.1%
227 39.6%
303 30.9%
212 37.0%
334 34.0%
573 100.0%
982 100.0%
Total 752 33.0%
767 33.6%
763 33.4%
2282 100.0%
Participatory 307 37.5%
164 20.0%
348 42.5%
819 100.0%
Mathematics Supported
Independent
234 27.2%
336 43.6%
342 39.8%
265 34.4%
283 32.9%
169 21.9%
859 100.0%
770 100.0%
7 Total
Participatory
877 35.8%
289 41.7%
771 31.5%
217 31.3%
800 32.7%
187 27.0%
2448 100.0%
693 100.0%
Reading Supported
Independent
133 28.2%
329 25.4%
156 33.1%
500 38.6%
182 38.6%
468 36.1%
471 100.0%
1297 100.0%
Total 751 30.5%
873 35.5%
837 34.0%
2461 100.0% (cont‘d)
Chapter 8—Technical Characteristics 59 2007–08 Florida Alt Technical Report
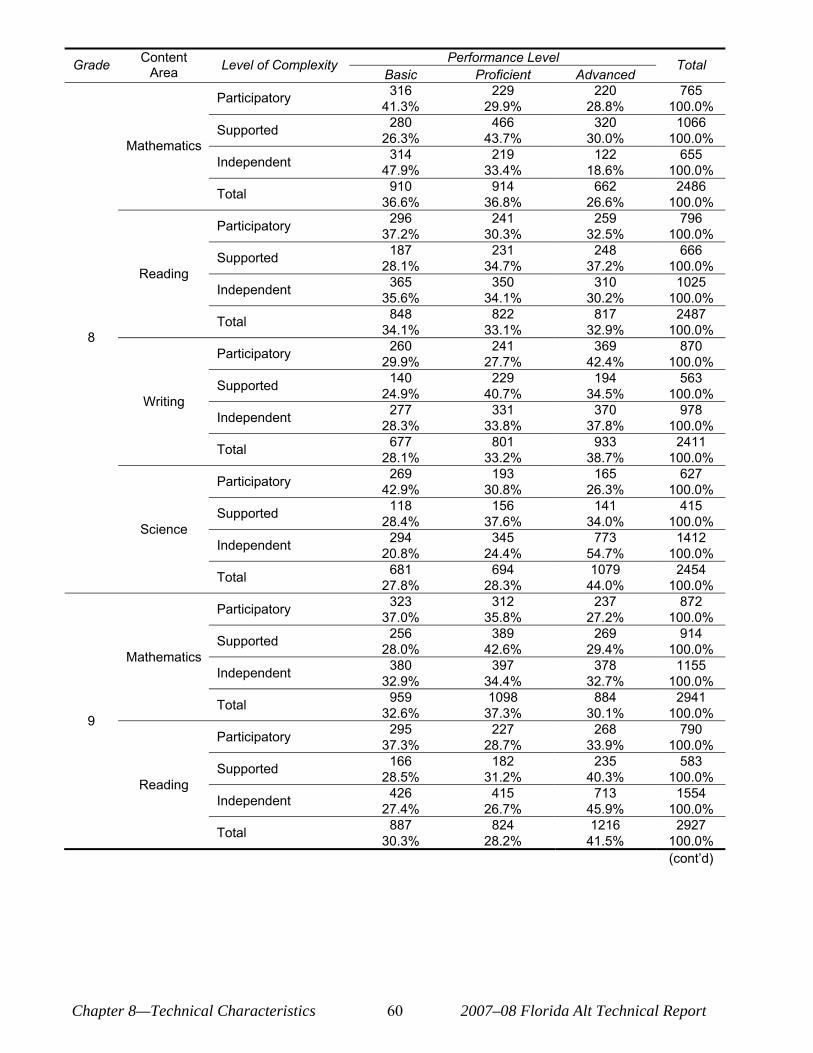
Grade Content Area Level of Complexity
BasicPerformance Level
Proficient Advanced Total
Participatory 316 41.3%
229 29.9%
220 28.8%
765 100.0%
Mathematics Supported
Independent
280 26.3%
314 47.9%
466 43.7%
219 33.4%
320 30.0%
122 18.6%
1066 100.0%
655 100.0%
Total 910 36.6%
914 36.8%
662 26.6%
2486 100.0%
Participatory 296 37.2%
241 30.3%
259 32.5%
796 100.0%
Reading Supported
Independent
187 28.1%
365 35.6%
231 34.7%
350 34.1%
248 37.2%
310 30.2%
666 100.0%
1025 100.0%
8 Total
Participatory
848 34.1%
260 29.9%
822 33.1%
241 27.7%
817 32.9%
369 42.4%
2487 100.0%
870 100.0%
Writing Supported
Independent
140 24.9%
277 28.3%
229 40.7%
331 33.8%
194 34.5%
370 37.8%
563 100.0%
978 100.0%
Total 677 28.1%
801 33.2%
933 38.7%
2411 100.0%
Participatory 269 42.9%
193 30.8%
165 26.3%
627 100.0%
Science Supported
Independent
118 28.4%
294 20.8%
156 37.6%
345 24.4%
141 34.0%
773 54.7%
415 100.0%
1412 100.0%
Total 681 27.8%
694 28.3%
1079 44.0%
2454 100.0%
Participatory 323 37.0%
312 35.8%
237 27.2%
872 100.0%
Mathematics Supported
Independent
256 28.0%
380 32.9%
389 42.6%
397 34.4%
269 29.4%
378 32.7%
914 100.0%
1155 100.0%
9 Total
Participatory
959 32.6%
295 37.3%
1098 37.3%
227 28.7%
884 30.1%
268 33.9%
2941 100.0%
790 100.0%
Reading Supported
Independent
166 28.5%
426 27.4%
182 31.2%
415 26.7%
235 40.3%
713 45.9%
583 100.0%
1554 100.0%
Total 887 30.3%
824 28.2%
1216 41.5%
2927 100.0% (cont‘d)
Chapter 8—Technical Characteristics 60 2007–08 Florida Alt Technical Report
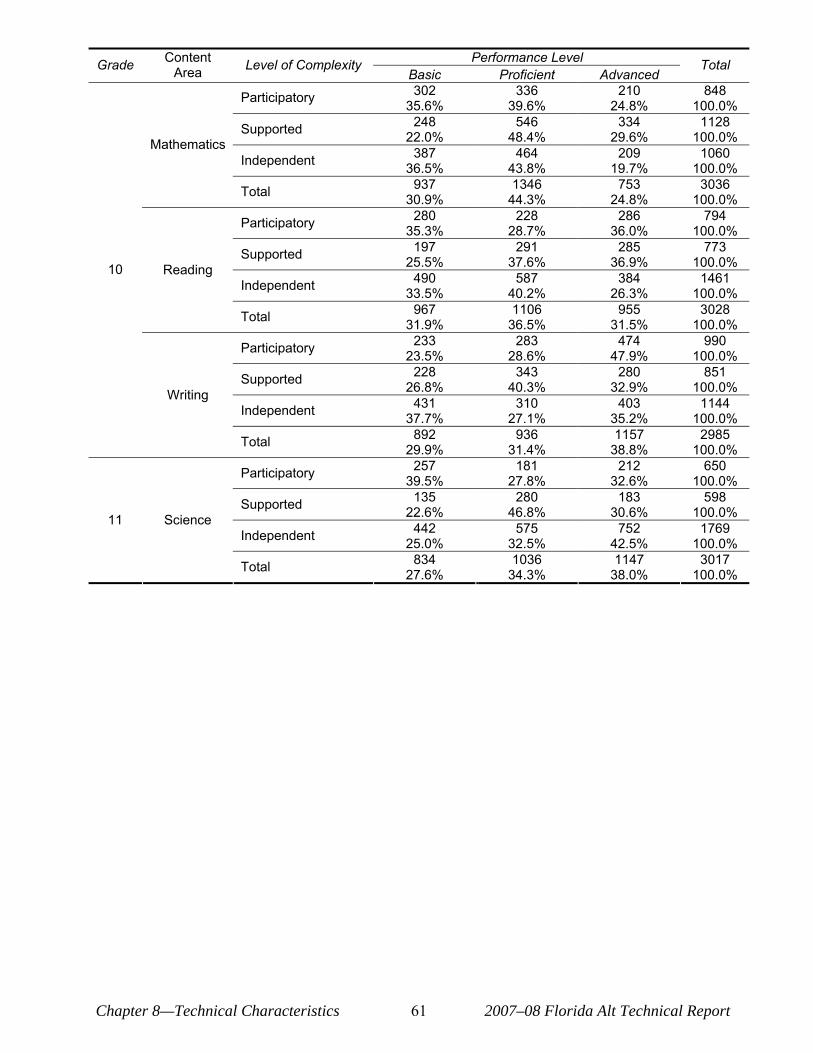
Grade Content Area Level of Complexity
BasicPerformance Level
Proficient Advanced Total
Participatory 302 35.6%
336 39.6%
210 24.8%
848 100.0%
Mathematics Supported
Independent
248 22.0%
387 36.5%
546 48.4%
464 43.8%
334 29.6%
209 19.7%
1128 100.0%
1060 100.0%
Total 937 30.9%
1346 44.3%
753 24.8%
3036 100.0%
Participatory 280 35.3%
228 28.7%
286 36.0%
794 100.0%
10 Reading Supported
Independent
197 25.5%
490 33.5%
291 37.6%
587 40.2%
285 36.9%
384 26.3%
773 100.0%
1461 100.0%
Total 967 31.9%
1106 36.5%
955 31.5%
3028 100.0%
Participatory 233 23.5%
283 28.6%
474 47.9%
990 100.0%
Writing Supported
Independent
228 26.8%
431 37.7%
343 40.3%
310 27.1%
280 32.9%
403 35.2%
851 100.0%
1144 100.0%
Total 892 29.9%
936 31.4%
1157 38.8%
2985 100.0%
Participatory 257 39.5%
181 27.8%
212 32.6%
650 100.0%
11 Science Supported
Independent
135 22.6%
442 25.0%
280 46.8%
575 32.5%
183 30.6%
752 42.5%
598 100.0%
1769 100.0%
Total 834 27.6%
1036 34.3%
1147 38.0%
3017 100.0%
Chapter 8—Technical Characteristics 61 2007–08 Florida Alt Technical Report
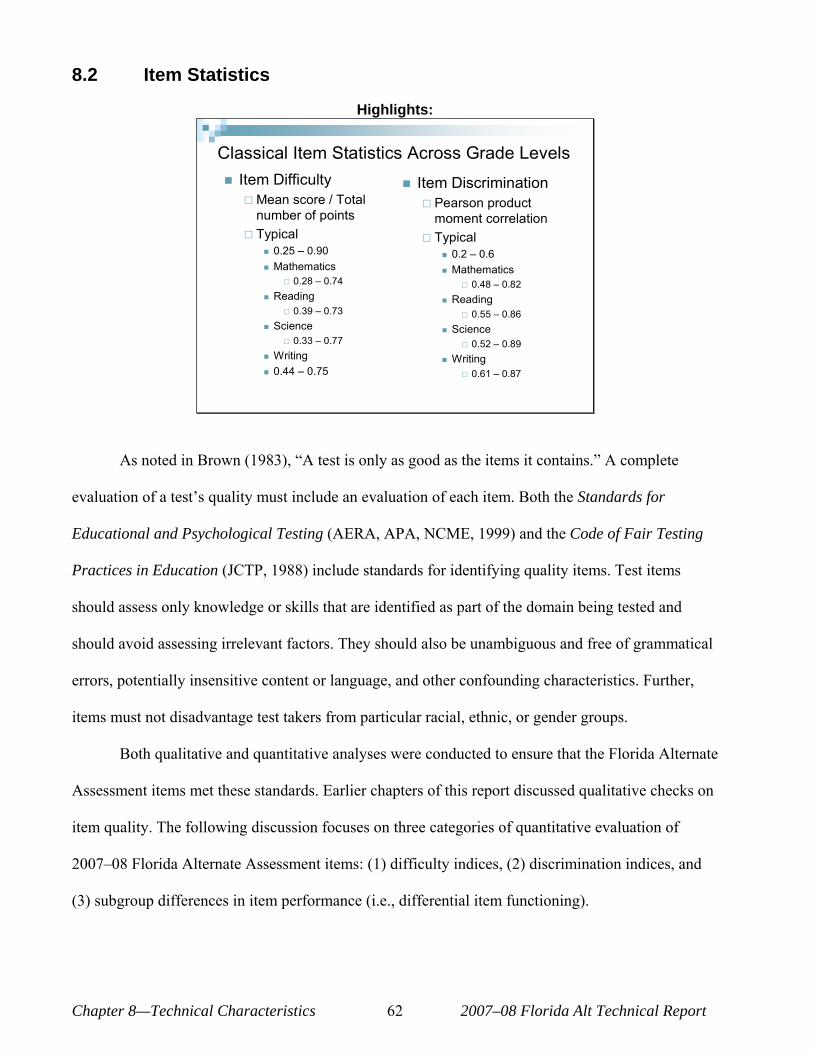
8.2 Item Statistics
Highlights:
Classical Item Statistics Across Grade Levels ¢ Item Difficulty ¢ Item Discrimination
£ Mean score / Total £ Pearson product number of points moment correlation
£ Typical £ Typical ¢ 0.25 œ 0.90 ¢ 0.2 œ 0.6 ¢ Mathematics ¢ Mathematics
£ 0.28 œ 0.74 £ 0.48 œ 0.82 ¢ Reading ¢ Reading
£ 0.39 œ 0.73 £ 0.55 œ 0.86 ¢ Science ¢ Science
£ 0.33 œ 0.77 £ 0.52 œ 0.89 ¢ Writing ¢ Writing ¢ 0.44 œ 0.75 £ 0.61 œ 0.87
As noted in Brown (1983), —A test is only as good as the items it contains.“ A complete
evaluation of a test‘s quality must include an evaluation of each item. Both the Standards for
Educational and Psychological Testing (AERA, APA, NCME, 1999) and the Code of Fair Testing
Practices in Education (JCTP, 1988) include standards for identifying quality items. Test items
should assess only knowledge or skills that are identified as part of the domain being tested and
should avoid assessing irrelevant factors. They should also be unambiguous and free of grammatical
errors, potentially insensitive content or language, and other confounding characteristics. Further,
items must not disadvantage test takers from particular racial, ethnic, or gender groups.
Both qualitative and quantitative analyses were conducted to ensure that the Florida Alternate
Assessment items met these standards. Earlier chapters of this report discussed qualitative checks on
item quality. The following discussion focuses on three categories of quantitative evaluation of
2007œ08 Florida Alternate Assessment items: (1) difficulty indices, (2) discrimination indices, and
(3) subgroup differences in item performance (i.e., differential item functioning).
Chapter 8—Technical Characteristics 62 2007–08 Florida Alt Technical Report
As explained earlier in this report, each grade-content test of the Florida Alternate
Assessment was composed exclusively of selected-response items (at the Participatory level, all
items were multiple-choice with 3 response options; i.e., the key and two distracters). Sixteen —sets“
of three MC items comprised a test: one item each at the Participatory, Supported, and Independent
Levels of Complexity.
The Participatory level items were administered up to three times to a student, depending on
whether the student responded correctly on the first try or needed scaffolding once or twice. (The
first scaffold removed a distracter, leaving the key and one distracter; the second scaffold removed
the remaining distracter, leaving only the key.) According to the scoring rubric, 3, 2, or 1 point was
awarded to the student, respectively, under these contingencies.
If and only if 3 points were earned on a Participatory item, the student was administered the
Supported level item one time. The student either answered correctly, earning an additional 3 points
for the set, or incorrectly, ending with a final item-set score of 3 points. If and only if 6 points were
earned on the Supported level item, the student was given a single opportunity on the Independent
level, and ended with an item-set score of 9 points for responding correctly or 6 points for
responding incorrectly.
In summary, Florida Alternate Assessment grade-content tests can be thought of as 16-item
tests if the Participatory, Supported, and Independent items are considered in sets. The scoring rubric
does just that, and treats each set as a polytomous item with six possible item scores: 0, 1, 2, 3, 6, 9.
The maximum possible total raw score is 144. Item statistics for the grade-content tests are described
and tabulated in the following subsections.
8.2.1 Difficulty Indices
All Florida Alternate Assessment items were evaluated in terms of difficulty according to
standard classical test theory (CTT) practice. The expected item difficulty, also known as the p-
Chapter 8—Technical Characteristics 63 2007–08 Florida Alt Technical Report
value, is the main index of item difficulty under the CTT framework. This index measures an item‘s
difficulty by averaging the proportion of points received across all students who took the item. In
order to place all items on a 0œ1 scale, the p-value was computed as the average score on the item
divided by its maximum possible score. Although the p-value is traditionally called a measure of
difficulty, it is properly interpreted as an easiness index, because larger p-values indicate easier
items. An index of 0.00 indicates that no student received credit for the item. At the opposite
extreme, an index of 1.00 indicates that every student received full credit for the item.
Items that are answered correctly by almost all students provide little information about
differences in student ability, but they do indicate knowledge or skills that have been mastered by
most students. The converse is true of items that are incorrectly answered by most students. In
general, to provide the most precise measurement, difficulty indices should range from near-chance
performance (0.25 for four-option MC items, 0.00 for CR items) to 0.90. Experience has indicated
that items conforming to this guideline provide satisfactory statistical information for the bulk of the
student population. However, on a criterion-referenced test such as Florida‘s Alternate Assessment,
it may be appropriate to include some items with difficulty values outside this region in order to
measure the skill that exists at a given grade level throughout the range. A generous range of item
difficulties also helps insure against excesses of scores at the floor or ceiling of the distribution.
8.2.2 Item Discrimination
It is a desirable feature of an item when higher-ability students perform better on it than do
lower-ability students. A commonly used measure of this characteristic is the correlation between
student performance on the item and total test score. Within CTT, this item-test correlation is
referred to as the item‘s discrimination, because, in effect, the strength of the correlation indicates
the extent to which successful performance on an item discriminates between high and low scores on
the test. For items on the 2007œ08 Florida Alternate Assessment, the Pearson product-moment
Chapter 8—Technical Characteristics 64 2007–08 Florida Alt Technical Report
correlation was used as the item discrimination index. The theoretical range of these statistics is œ1.0
to +1.0, with a typical range from +0.2 to +0.6.
One can think of a discrimination index as a measure of how closely an item assesses the
same knowledge and skills as other items that contribute to the criterion total score, in other words,
as a measure of construct consistency. It is therefore quite important to select an appropriate total
score criterion; for the 2007œ08 Florida Alternate Assessment, total raw score was used. Item-test
correlations were computed for each item, and results are summarized in the next section.
8.2.3 Summary of Item Analysis Results
Appendix I presents p-values and discriminations calculated on four bases: (1) using all
students, (2) using participatory students, (3) using supported students, and (3) using independent
students.
In general, when calculated for all students, the item difficulty and discrimination indices
were in acceptable and expected ranges. Across all grades and content areas, p-values fell between
0.28 and 0.77. Discrimination indices ranged between 0.48 and 0.89. Positive discrimination indices
indicate that students who performed well on individual items tended to perform well overall, and
vice-versa. As might be expected, the items appear easier (higher p-values) when calculated using
the independent students, slightly more difficult (i.e., lower p-values) when calculated using the
supported students, and still more difficult when calculated using the participatory students. The
items are most discriminating for the participatory students, slightly less discriminating for the
independent students, and not discriminating for the supported students. This trend in discrimination
indices occurs at all grade-contents and is an artifact of the scale used to score the items and of the
restriction of range that results from the scale and splitting the students according to three reduced
score ranges, which limits the possible variation of the scores and in turn the range of possible item
discriminations.
Chapter 8—Technical Characteristics 65 2007–08 Florida Alt Technical Report
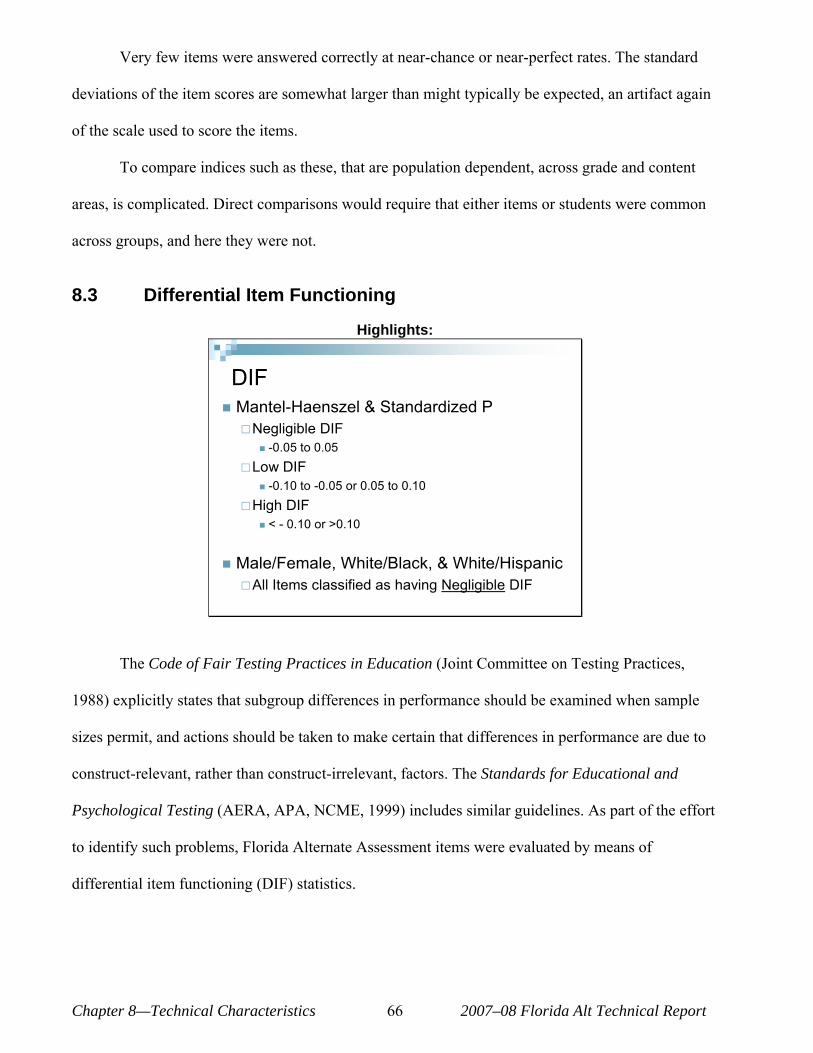
Very few items were answered correctly at near-chance or near-perfect rates. The standard
deviations of the item scores are somewhat larger than might typically be expected, an artifact again
of the scale used to score the items.
To compare indices such as these, that are population dependent, across grade and content
areas, is complicated. Direct comparisons would require that either items or students were common
across groups, and here they were not.
8.3 Differential Item Functioning
Highlights:
DIF ¢ Mantel-Haenszel & Standardized P
£Negligible DIF ¢ -0.05 to 0.05
£Low DIF ¢ -0.10 to -0.05 or 0.05 to 0.10
£High DIF ¢ < - 0.10 or >0.10
¢ Male/Female, White/Black, & White/Hispanic £All Items classified as having Negligible DIF
The Code of Fair Testing Practices in Education (Joint Committee on Testing Practices,
1988) explicitly states that subgroup differences in performance should be examined when sample
sizes permit, and actions should be taken to make certain that differences in performance are due to
construct-relevant, rather than construct-irrelevant, factors. The Standards for Educational and
Psychological Testing (AERA, APA, NCME, 1999) includes similar guidelines. As part of the effort
to identify such problems, Florida Alternate Assessment items were evaluated by means of
differential item functioning (DIF) statistics.
Chapter 8—Technical Characteristics 66 2007–08 Florida Alt Technical Report
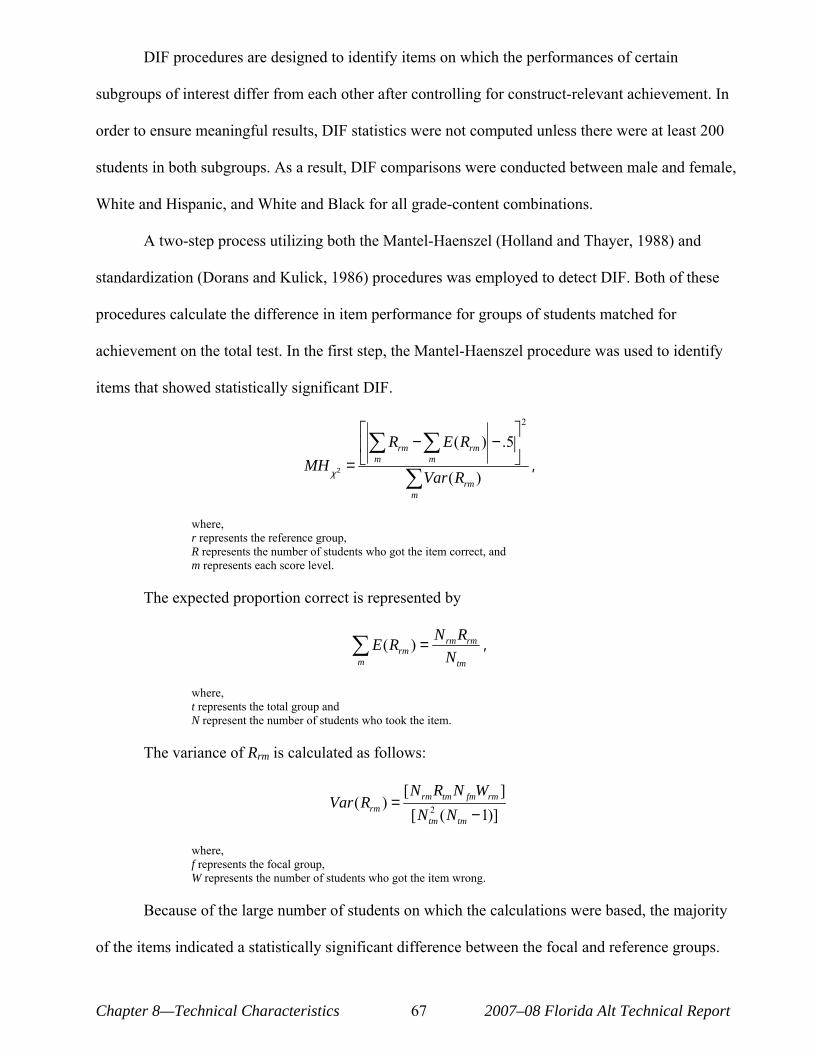
DIF procedures are designed to identify items on which the performances of certain
subgroups of interest differ from each other after controlling for construct-relevant achievement. In
order to ensure meaningful results, DIF statistics were not computed unless there were at least 200
students in both subgroups. As a result, DIF comparisons were conducted between male and female,
White and Hispanic, and White and Black for all grade-content combinations.
A two-step process utilizing both the Mantel-Haenszel (Holland and Thayer, 1988) and
standardization (Dorans and Kulick, 1986) procedures was employed to detect DIF. Both of these
procedures calculate the difference in item performance for groups of students matched for
achievement on the total test. In the first step, the Mantel-Haenszel procedure was used to identify
items that showed statistically significant DIF.
2
∑Rrm − ∑ ( rm )E R − .5 MHχ 2 = m m ,
∑ ( )Var R rm m
where, r represents the reference group, R represents the number of students who got the item correct, and m represents each score level.
The expected proportion correct is represented by
rm rm∑ ( rm ) N R ,E R =
m Ntm
where, t represents the total group and N represent the number of students who took the item.
The variance of Rrm is calculated as follows:
N R[ rm tm N fmWrm ]( rm ) = 2Var R [N N( −1)] tm tm
where, f represents the focal group, W represents the number of students who got the item wrong.
Because of the large number of students on which the calculations were based, the majority
of the items indicated a statistically significant difference between the focal and reference groups.
Chapter 8—Technical Characteristics 67 2007–08 Florida Alt Technical Report
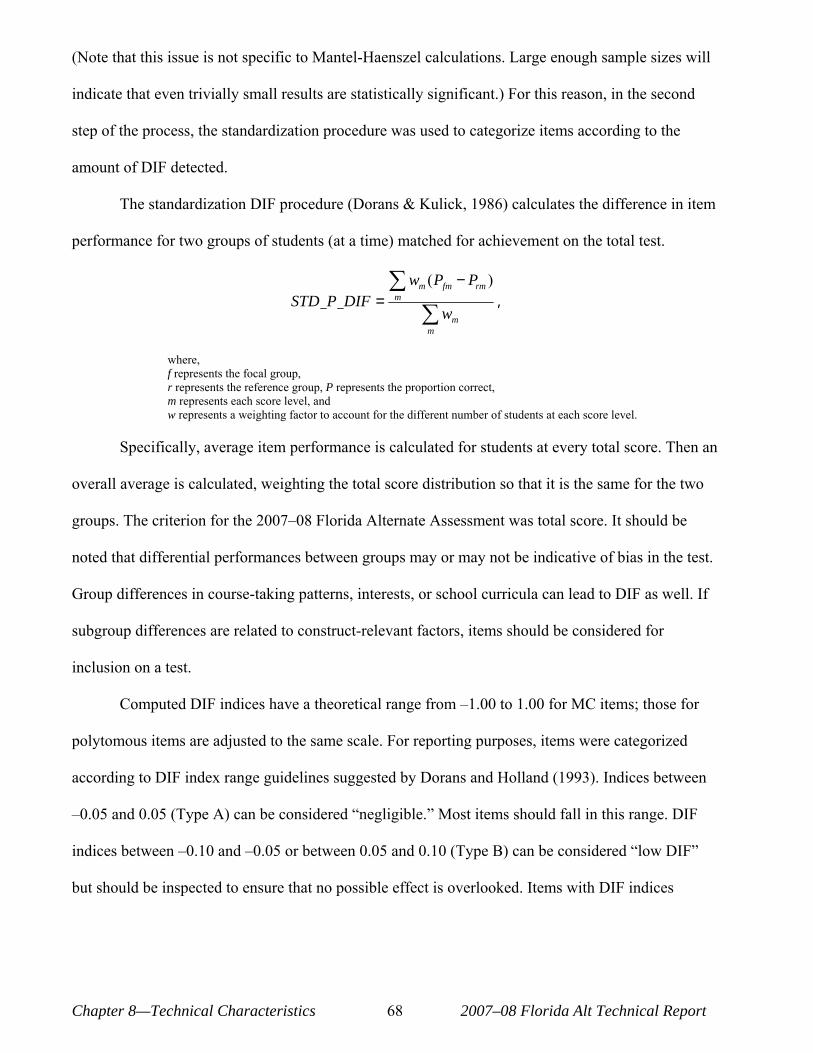
(Note that this issue is not specific to Mantel-Haenszel calculations. Large enough sample sizes will
indicate that even trivially small results are statistically significant.) For this reason, in the second
step of the process, the standardization procedure was used to categorize items according to the
amount of DIF detected.
The standardization DIF procedure (Dorans & Kulick, 1986) calculates the difference in item
performance for two groups of students (at a time) matched for achievement on the total test.
∑w Pm ( fm − Prm ) mSTD P DIF = ,∑wm
m
where, f represents the focal group, r represents the reference group, P represents the proportion correct, m represents each score level, and w represents a weighting factor to account for the different number of students at each score level.
Specifically, average item performance is calculated for students at every total score. Then an
overall average is calculated, weighting the total score distribution so that it is the same for the two
groups. The criterion for the 2007œ08 Florida Alternate Assessment was total score. It should be
noted that differential performances between groups may or may not be indicative of bias in the test.
Group differences in course-taking patterns, interests, or school curricula can lead to DIF as well. If
subgroup differences are related to construct-relevant factors, items should be considered for
inclusion on a test.
Computed DIF indices have a theoretical range from œ1.00 to 1.00 for MC items; those for
polytomous items are adjusted to the same scale. For reporting purposes, items were categorized
according to DIF index range guidelines suggested by Dorans and Holland (1993). Indices between
œ0.05 and 0.05 (Type A) can be considered —negligible.“ Most items should fall in this range. DIF
indices between œ0.10 and œ0.05 or between 0.05 and 0.10 (Type B) can be considered —low DIF“
but should be inspected to ensure that no possible effect is overlooked. Items with DIF indices
Chapter 8—Technical Characteristics 68 2007–08 Florida Alt Technical Report
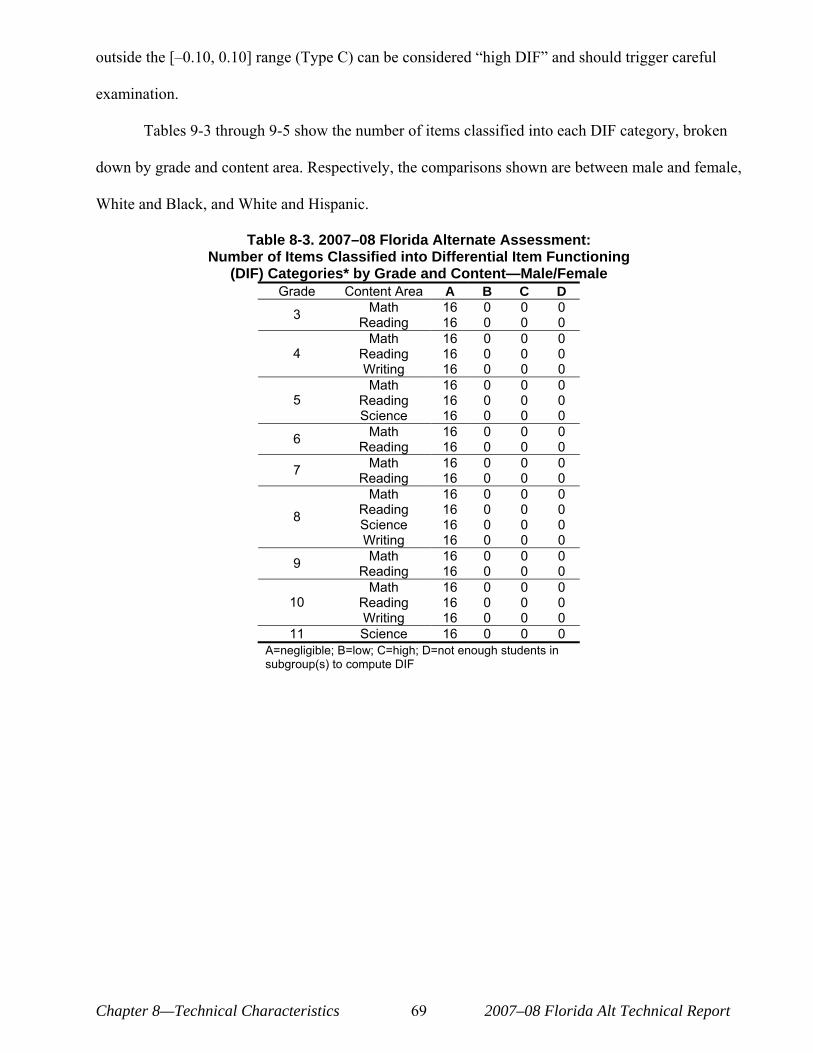
outside the [œ0.10, 0.10] range (Type C) can be considered —high DIF“ and should trigger careful
examination.
Tables 9-3 through 9-5 show the number of items classified into each DIF category, broken
down by grade and content area. Respectively, the comparisons shown are between male and female,
White and Black, and White and Hispanic.
Table 8-3. 2007–08 Florida Alternate Assessment: Number of Items Classified into Differential Item Functioning
(DIF) Categories* by Grade and Content—Male/Female Grade Content Area A B C D
3 Math Reading
16 16
0 0
0 0
0 0
Math 16 0 0 0 4 Reading 16 0 0 0
Writing 16 0 0 0 Math 16 0 0 0
5 Reading 16 0 0 0 Science 16 0 0 0
6 Math Reading
16 16
0 0
0 0
0 0
7 Math Reading
16 16
0 0
0 0
0 0
Math 16 0 0 0
8 Reading Science
16 16
0 0
0 0
0 0
Writing 16 0 0 0
9 Math Reading
16 16
0 0
0 0
0 0
Math 16 0 0 0 10 Reading 16 0 0 0
Writing 16 0 0 0 11 Science 16 0 0 0
A=negligible; B=low; C=high; D=not enough students in subgroup(s) to compute DIF
Chapter 8—Technical Characteristics 69 2007–08 Florida Alt Technical Report
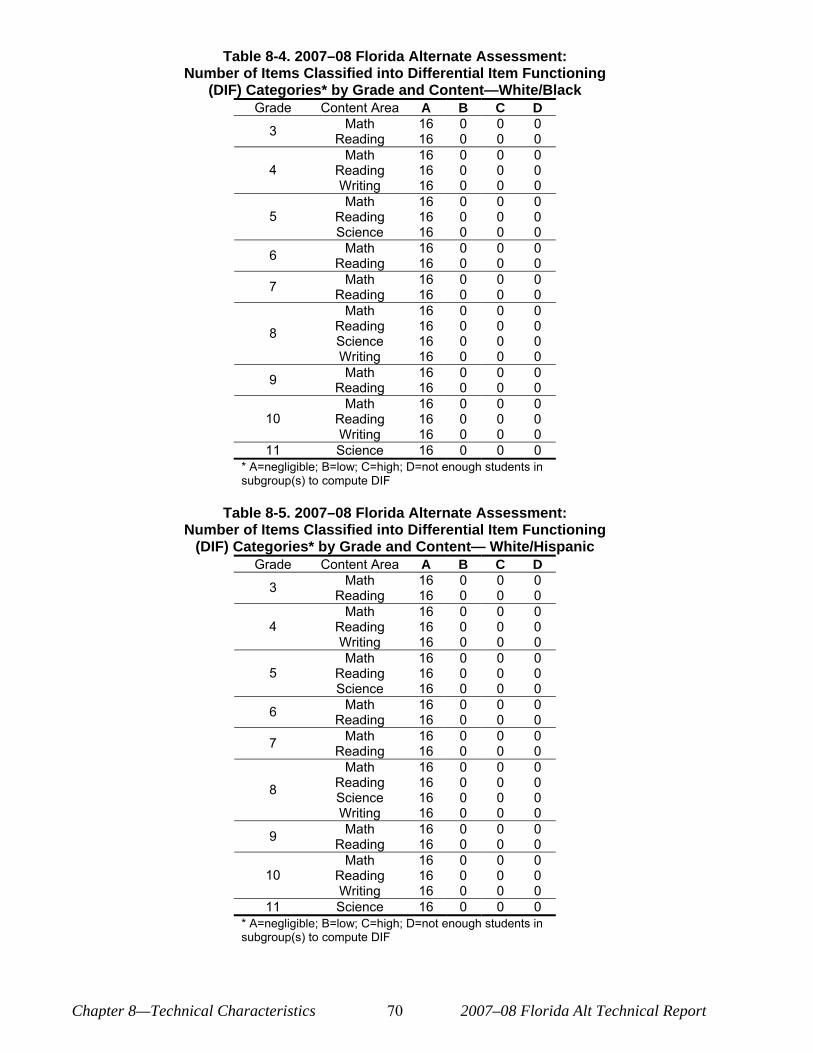
Table 8-4. 2007–08 Florida Alternate Assessment: Number of Items Classified into Differential Item Functioning
(DIF) Categories* by Grade and Content—White/Black Grade Content Area A B C D
3 Math Reading
16 16
0 0
0 0
0 0
Math 16 0 0 0 4 Reading 16 0 0 0
Writing 16 0 0 0 Math 16 0 0 0
5 Reading 16 0 0 0 Science 16 0 0 0
6 Math Reading
16 16
0 0
0 0
0 0
7 Math Reading
16 16
0 0
0 0
0 0
Math 16 0 0 0
8 Reading Science
16 16
0 0
0 0
0 0
Writing 16 0 0 0
9 Math Reading
16 16
0 0
0 0
0 0
Math 16 0 0 0 10 Reading 16 0 0 0
Writing 16 0 0 0 11 Science 16 0 0 0
* A=negligible; B=low; C=high; D=not enough students in subgroup(s) to compute DIF
Table 8-5. 2007–08 Florida Alternate Assessment: Number of Items Classified into Differential Item Functioning
(DIF) Categories* by Grade and Content— White/Hispanic Grade Content Area A B C D
3 Math Reading
16 16
0 0
0 0
0 0
Math 16 0 0 0 4 Reading 16 0 0 0
Writing 16 0 0 0 Math 16 0 0 0
5 Reading 16 0 0 0 Science 16 0 0 0
6 Math Reading
16 16
0 0
0 0
0 0
7 Math Reading
16 16
0 0
0 0
0 0
Math 16 0 0 0
8 Reading Science
16 16
0 0
0 0
0 0
Writing 16 0 0 0
9 Math Reading
16 16
0 0
0 0
0 0
Math 16 0 0 0 10 Reading 16 0 0 0
Writing 16 0 0 0 11 Science 16 0 0 0
* A=negligible; B=low; C=high; D=not enough students in subgroup(s) to compute DIF
Chapter 8—Technical Characteristics 70 2007–08 Florida Alt Technical Report
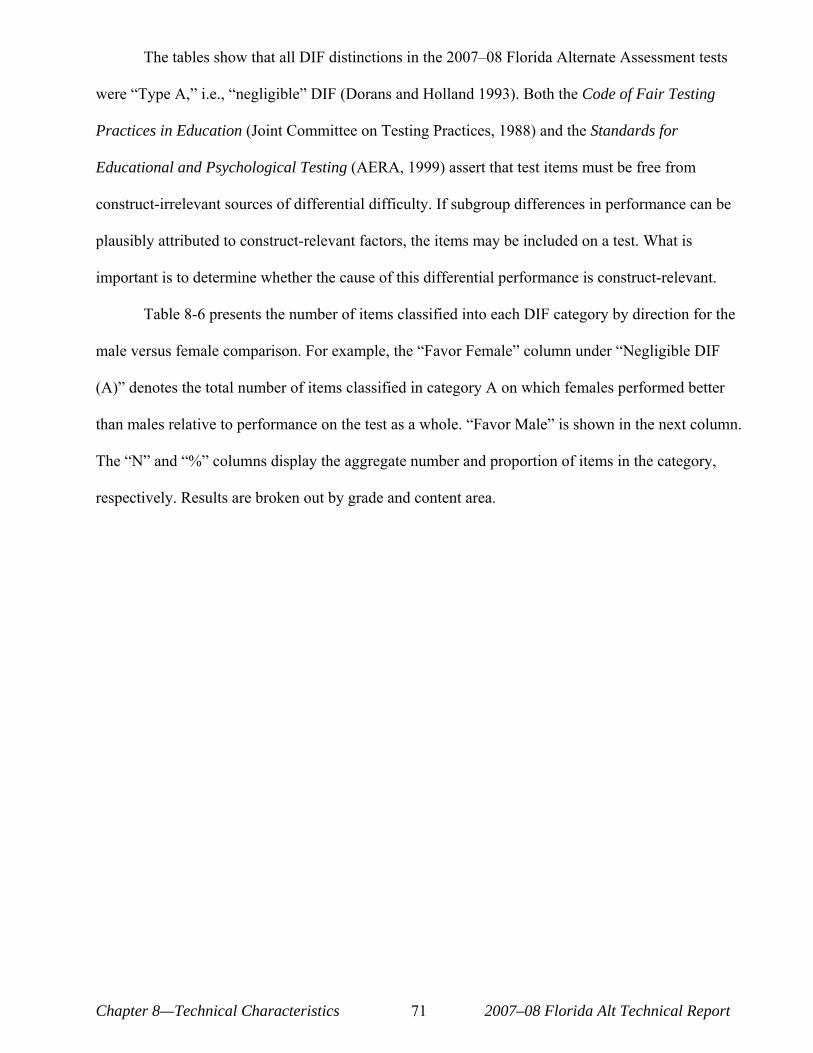
The tables show that all DIF distinctions in the 2007œ08 Florida Alternate Assessment tests
were —Type A,“ i.e., —negligible“ DIF (Dorans and Holland 1993). Both the Code of Fair Testing
Practices in Education (Joint Committee on Testing Practices, 1988) and the Standards for
Educational and Psychological Testing (AERA, 1999) assert that test items must be free from
construct-irrelevant sources of differential difficulty. If subgroup differences in performance can be
plausibly attributed to construct-relevant factors, the items may be included on a test. What is
important is to determine whether the cause of this differential performance is construct-relevant.
Table 8-6 presents the number of items classified into each DIF category by direction for the
male versus female comparison. For example, the —Favor Female“ column under —Negligible DIF
(A)“ denotes the total number of items classified in category A on which females performed better
than males relative to performance on the test as a whole. —Favor Male“ is shown in the next column.
The —N“ and —%“ columns display the aggregate number and proportion of items in the category,
respectively. Results are broken out by grade and content area.
Chapter 8—Technical Characteristics 71 2007–08 Florida Alt Technical Report
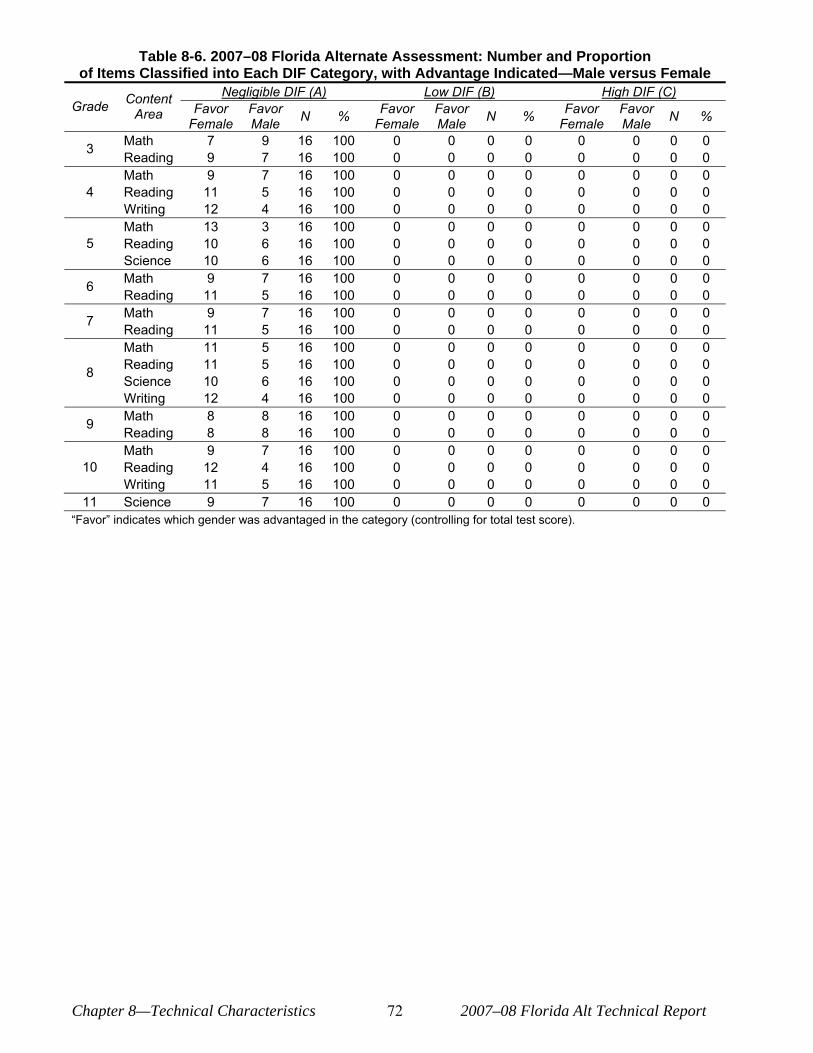
Table 8-6. 2007–08 Florida Alternate Assessment: Number and Proportion of Items Classified into Each DIF Category, with Advantage Indicated—Male versus Female
Negligible DIF (A) Low DIF (B) High DIF (C) Content Grade Favor Favor Favor Favor Favor Favor Area N % N % N %Female Male Female Male Female Male Math 7 9 16 100 0 0 0 0 0 0 0 03 Reading 9 7 16 100 0 0 0 0 0 0 0 0 Math 9 7 16 100 0 0 0 0 0 0 0 0
4 Reading 11 5 16 100 0 0 0 0 0 0 0 0 Writing 12 4 16 100 0 0 0 0 0 0 0 0 Math 13 3 16 100 0 0 0 0 0 0 0 0
5 Reading 10 6 16 100 0 0 0 0 0 0 0 0 Science 10 6 16 100 0 0 0 0 0 0 0 0
6 Math Reading
9 11
7 5
16 16
100 100
0 0
0 0
0 0
0 0
0 0
0 0
0 0
0 0
7 Math Reading
9 11
7 5
16 16
100 100
0 0
0 0
0 0
0 0
0 0
0 0
0 0
0 0
Math 11 5 16 100 0 0 0 0 0 0 0 0
8 Reading Science
11 10
5 6
16 16
100 100
0 0
0 0
0 0
0 0
0 0
0 0
0 0
0 0
Writing 12 4 16 100 0 0 0 0 0 0 0 0
9 Math Reading
8 8
8 8
16 16
100 100
0 0
0 0
0 0
0 0
0 0
0 0
0 0
0 0
Math 9 7 16 100 0 0 0 0 0 0 0 0 10 Reading 12 4 16 100 0 0 0 0 0 0 0 0
Writing 11 5 16 100 0 0 0 0 0 0 0 0 11 Science 9 7 16 100 0 0 0 0 0 0 0 0
—Favor“ indicates which gender was advantaged in the category (controlling for total test score).
Chapter 8—Technical Characteristics 72 2007–08 Florida Alt Technical Report
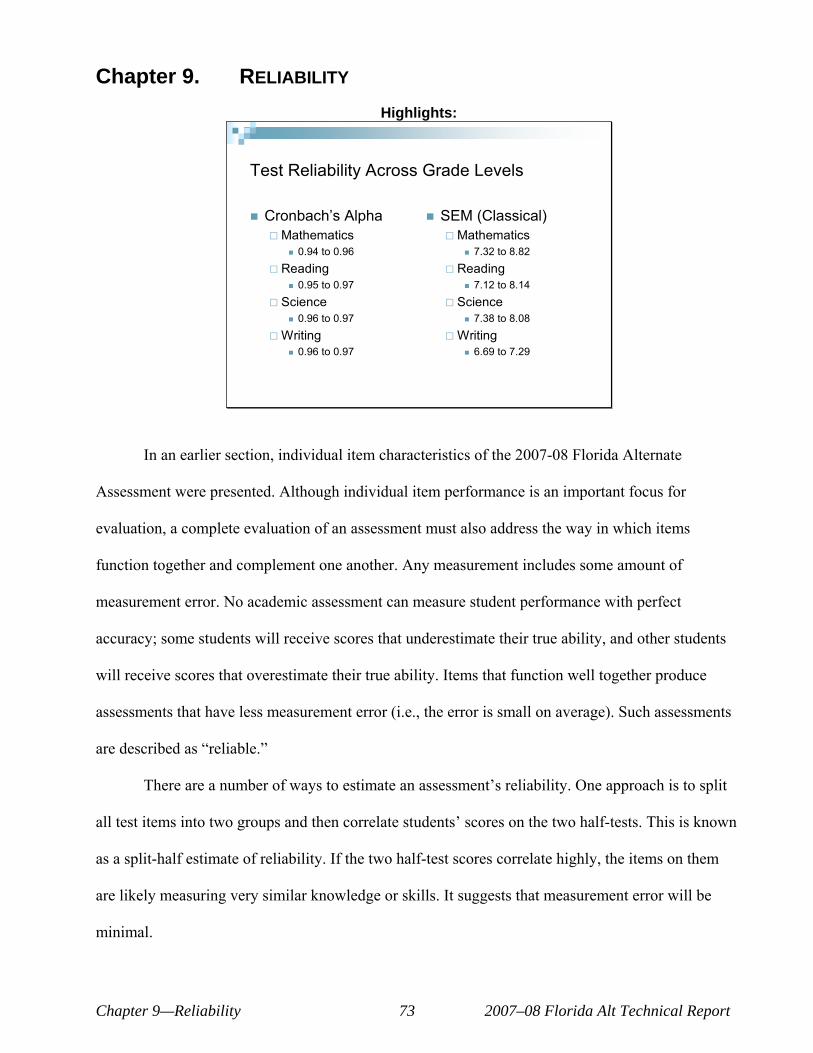
Chapter 9. RELIABILITY
Highlights:
Test Reliability Across Grade Levels
¢ Cronbach‘s Alpha ¢ SEM (Classical) £ Mathematics £ Mathematics
¢ 0.94 to 0.96 ¢ 7.32 to 8.82
£ Reading £ Reading ¢ 0.95 to 0.97 ¢ 7.12 to 8.14
£ Science £ Science ¢ 0.96 to 0.97 ¢ 7.38 to 8.08
£ Writing £ Writing ¢ 0.96 to 0.97 ¢ 6.69 to 7.29
In an earlier section, individual item characteristics of the 2007-08 Florida Alternate
Assessment were presented. Although individual item performance is an important focus for
evaluation, a complete evaluation of an assessment must also address the way in which items
function together and complement one another. Any measurement includes some amount of
measurement error. No academic assessment can measure student performance with perfect
accuracy; some students will receive scores that underestimate their true ability, and other students
will receive scores that overestimate their true ability. Items that function well together produce
assessments that have less measurement error (i.e., the error is small on average). Such assessments
are described as —reliable.“
There are a number of ways to estimate an assessment‘s reliability. One approach is to split
all test items into two groups and then correlate students‘ scores on the two half-tests. This is known
as a split-half estimate of reliability. If the two half-test scores correlate highly, the items on them
are likely measuring very similar knowledge or skills. It suggests that measurement error will be
minimal.
Chapter 9—Reliability 73 2007–08 Florida Alt Technical Report
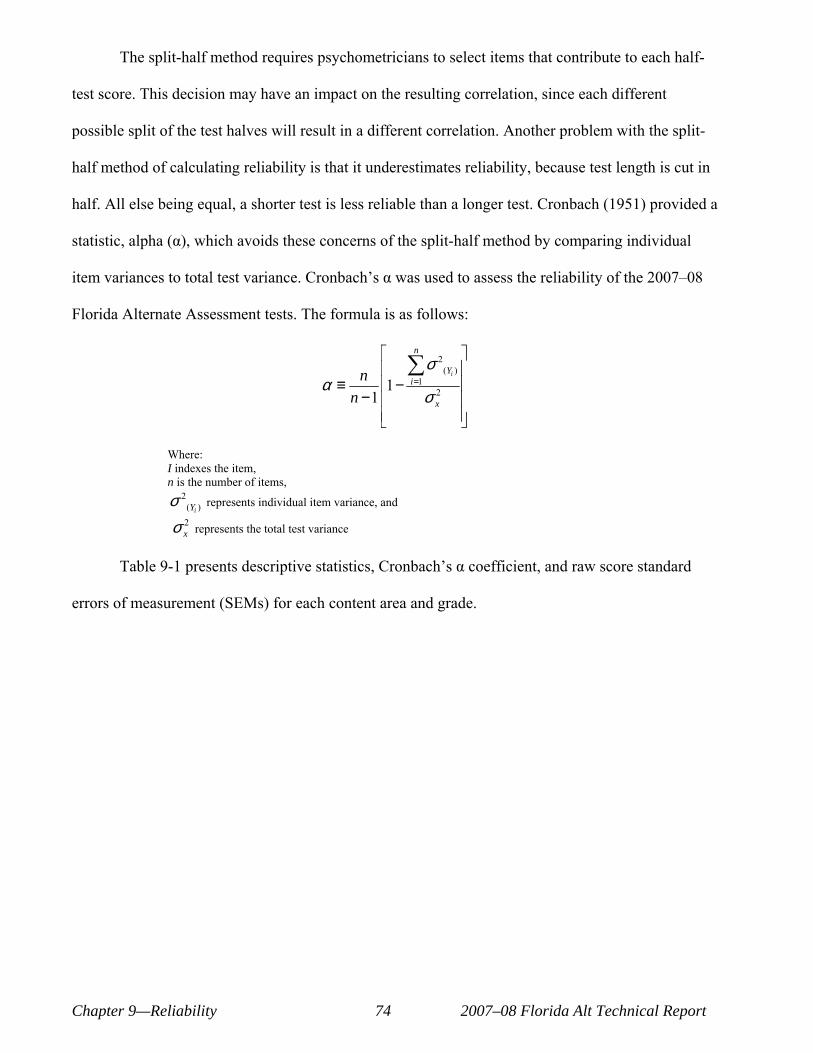
The split-half method requires psychometricians to select items that contribute to each half-
test score. This decision may have an impact on the resulting correlation, since each different
possible split of the test halves will result in a different correlation. Another problem with the split-
half method of calculating reliability is that it underestimates reliability, because test length is cut in
half. All else being equal, a shorter test is less reliable than a longer test. Cronbach (1951) provided a
statistic, alpha (α), which avoids these concerns of the split-half method by comparing individual
item variances to total test variance. Cronbach‘s α was used to assess the reliability of the 2007œ08
Florida Alternate Assessment tests. The formula is as follows:
n 2
∑σ ( )n Yi i=1α ≡ 1− 2
n −1 σ x
Where: I indexes the item, n is the number of items,
2σ ( ) represents individual item variance, and Yi
2σ represents the total test variance x
Table 9-1 presents descriptive statistics, Cronbach‘s α coefficient, and raw score standard
errors of measurement (SEMs) for each content area and grade.
Chapter 9—Reliability 74 2007–08 Florida Alt Technical Report
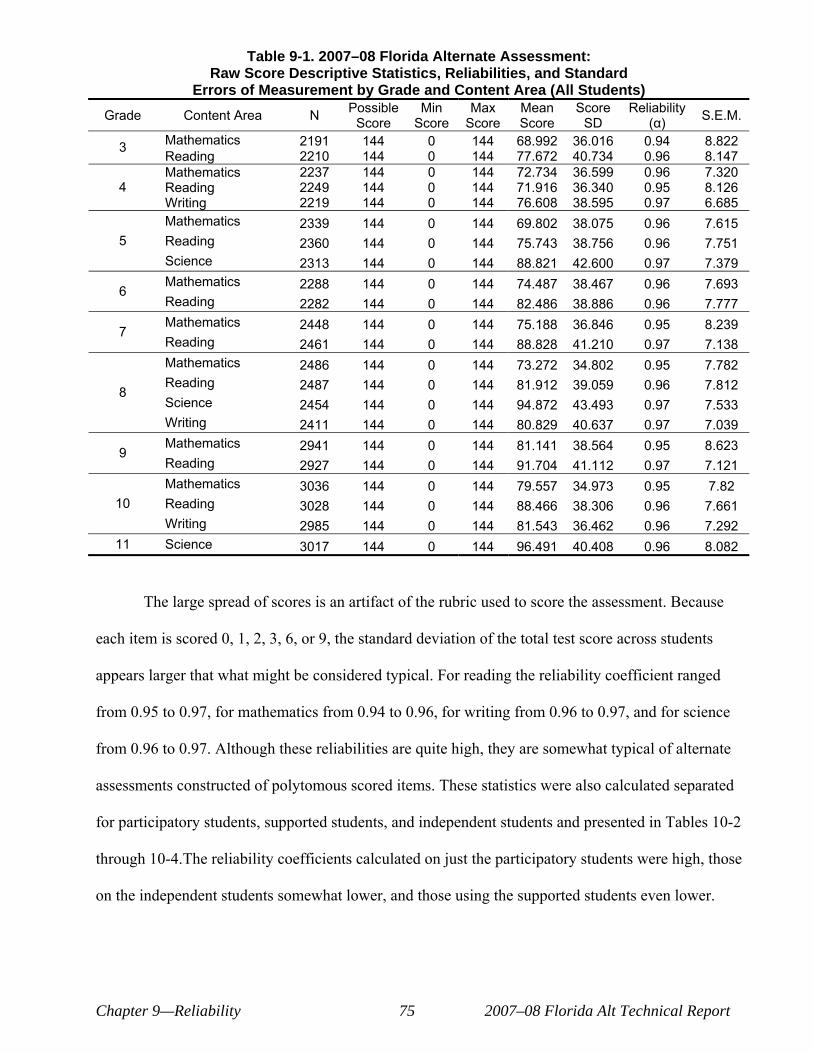
Table 9-1. 2007–08 Florida Alternate Assessment: Raw Score Descriptive Statistics, Reliabilities, and Standard
Errors of Measurement by Grade and Content Area (All Students) Grade Content Area N Possible
Score Min
Score Max
Score Mean Score
Score SD
Reliability (α) S.E.M.
3 Mathematics Reading
2191 2210
144 144
0 0
144 144
68.992 77.672
36.016 40.734
0.94 0.96
8.822 8.147
Mathematics 2237 144 0 144 72.734 36.599 0.96 7.320 4 Reading 2249 144 0 144 71.916 36.340 0.95 8.126
Writing 2219 144 0 144 76.608 38.595 0.97 6.685 Mathematics 2339 144 0 144 69.802 38.075 0.96 7.615
5 Reading 2360 144 0 144 75.743 38.756 0.96 7.751 Science 2313 144 0 144 88.821 42.600 0.97 7.379
6 Mathematics Reading
2288 2282
144 144
0 0
144 144
74.487 82.486
38.467 38.886
0.96 0.96
7.693 7.777
7 Mathematics Reading
2448 2461
144 144
0 0
144 144
75.188 88.828
36.846 41.210
0.95 0.97
8.239 7.138
Mathematics 2486 144 0 144 73.272 34.802 0.95 7.782
8 Reading Science
2487 2454
144 144
0 0
144 144
81.912 94.872
39.059 43.493
0.96 0.97
7.812 7.533
Writing 2411 144 0 144 80.829 40.637 0.97 7.039
9 Mathematics Reading
2941 2927
144 144
0 0
144 144
81.141 91.704
38.564 41.112
0.95 0.97
8.623 7.121
Mathematics 3036 144 0 144 79.557 34.973 0.95 7.82 10 Reading 3028 144 0 144 88.466 38.306 0.96 7.661
Writing 2985 144 0 144 81.543 36.462 0.96 7.292 11 Science 3017 144 0 144 96.491 40.408 0.96 8.082
The large spread of scores is an artifact of the rubric used to score the assessment. Because
each item is scored 0, 1, 2, 3, 6, or 9, the standard deviation of the total test score across students
appears larger that what might be considered typical. For reading the reliability coefficient ranged
from 0.95 to 0.97, for mathematics from 0.94 to 0.96, for writing from 0.96 to 0.97, and for science
from 0.96 to 0.97. Although these reliabilities are quite high, they are somewhat typical of alternate
assessments constructed of polytomous scored items. These statistics were also calculated separated
for participatory students, supported students, and independent students and presented in Tables 10-2
through 10-4.The reliability coefficients calculated on just the participatory students were high, those
on the independent students somewhat lower, and those using the supported students even lower.
Chapter 9—Reliability 75 2007–08 Florida Alt Technical Report
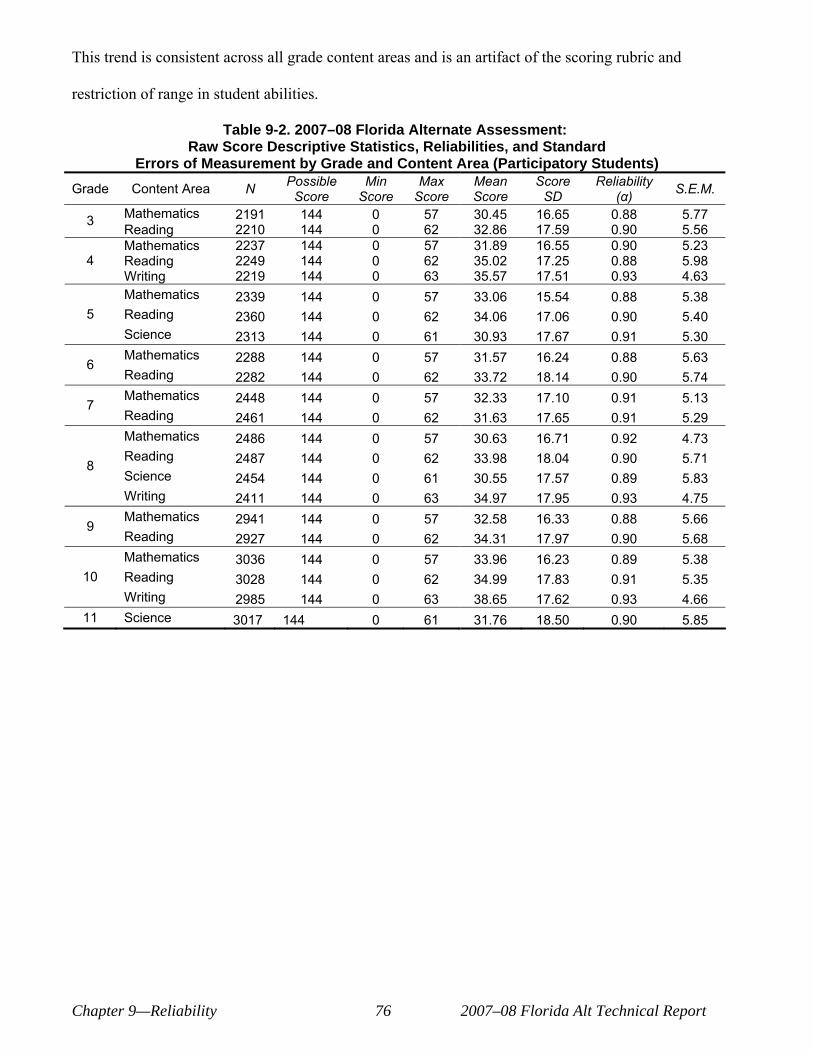
This trend is consistent across all grade content areas and is an artifact of the scoring rubric and
restriction of range in student abilities.
Table 9-2. 2007–08 Florida Alternate Assessment: Raw Score Descriptive Statistics, Reliabilities, and Standard
Errors of Measurement by Grade and Content Area (Participatory Students) Grade Content Area N Possible
Score Min
Score Max
Score Mean Score
Score SD
Reliability (α) S.E.M.
3 Mathematics Reading
2191 2210
144 144
0 0
57 62
30.45 32.86
16.65 17.59
0.88 0.90
5.77 5.56
Mathematics 2237 144 0 57 31.89 16.55 0.90 5.23 4 Reading 2249 144 0 62 35.02 17.25 0.88 5.98
Writing 2219 144 0 63 35.57 17.51 0.93 4.63 Mathematics 2339 144 0 57 33.06 15.54 0.88 5.38
5 Reading 2360 144 0 62 34.06 17.06 0.90 5.40 Science 2313 144 0 61 30.93 17.67 0.91 5.30
6 Mathematics Reading
2288 2282
144 144
0 0
57 62
31.57 33.72
16.24 18.14
0.88 0.90
5.63 5.74
7 Mathematics Reading
2448 2461
144 144
0 0
57 62
32.33 31.63
17.10 17.65
0.91 0.91
5.13 5.29
Mathematics 2486 144 0 57 30.63 16.71 0.92 4.73
8 Reading Science
2487 2454
144 144
0 0
62 61
33.98 30.55
18.04 17.57
0.90 0.89
5.71 5.83
Writing 2411 144 0 63 34.97 17.95 0.93 4.75
9 Mathematics Reading
2941 2927
144 144
0 0
57 62
32.58 34.31
16.33 17.97
0.88 0.90
5.66 5.68
Mathematics 3036 144 0 57 33.96 16.23 0.89 5.38 10 Reading 3028 144 0 62 34.99 17.83 0.91 5.35
Writing 2985 144 0 63 38.65 17.62 0.93 4.66 11 Science 3017 144 0 61 31.76 18.50 0.90 5.85
Chapter 9—Reliability 76 2007–08 Florida Alt Technical Report
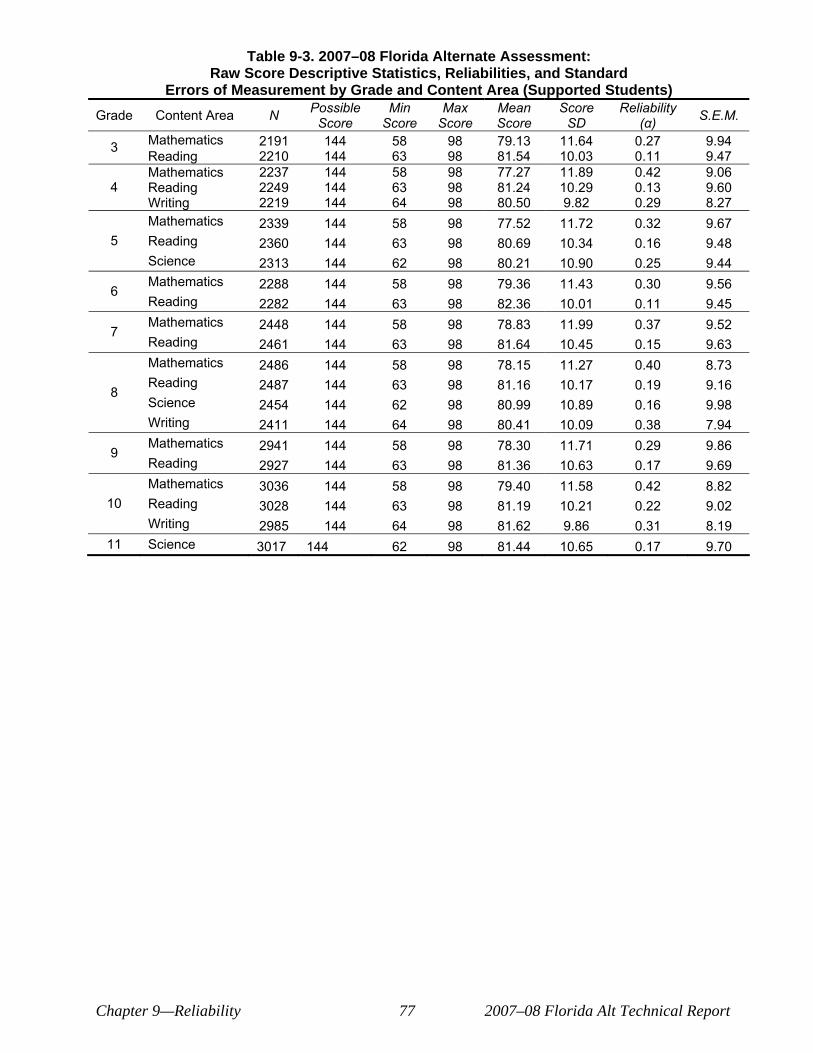
Table 9-3. 2007–08 Florida Alternate Assessment: Raw Score Descriptive Statistics, Reliabilities, and Standard
Errors of Measurement by Grade and Content Area (Supported Students) Grade Content Area N Possible
Score Min
Score Max
Score Mean Score
Score SD
Reliability (α) S.E.M.
3 Mathematics Reading
2191 2210
144 144
58 63
98 98
79.13 81.54
11.64 10.03
0.27 0.11
9.94 9.47
Mathematics 2237 144 58 98 77.27 11.89 0.42 9.06 4 Reading 2249 144 63 98 81.24 10.29 0.13 9.60
Writing 2219 144 64 98 80.50 9.82 0.29 8.27 Mathematics 2339 144 58 98 77.52 11.72 0.32 9.67
5 Reading 2360 144 63 98 80.69 10.34 0.16 9.48 Science 2313 144 62 98 80.21 10.90 0.25 9.44
6 Mathematics Reading
2288 2282
144 144
58 63
98 98
79.36 82.36
11.43 10.01
0.30 0.11
9.56 9.45
7 Mathematics Reading
2448 2461
144 144
58 63
98 98
78.83 81.64
11.99 10.45
0.37 0.15
9.52 9.63
Mathematics 2486 144 58 98 78.15 11.27 0.40 8.73
8 Reading Science
2487 2454
144 144
63 62
98 98
81.16 80.99
10.17 10.89
0.19 0.16
9.16 9.98
Writing 2411 144 64 98 80.41 10.09 0.38 7.94
9 Mathematics Reading
2941 2927
144 144
58 63
98 98
78.30 81.36
11.71 10.63
0.29 0.17
9.86 9.69
Mathematics 3036 144 58 98 79.40 11.58 0.42 8.82 10 Reading 3028 144 63 98 81.19 10.21 0.22 9.02
Writing 2985 144 64 98 81.62 9.86 0.31 8.19 11 Science 3017 144 62 98 81.44 10.65 0.17 9.70
Chapter 9—Reliability 77 2007–08 Florida Alt Technical Report
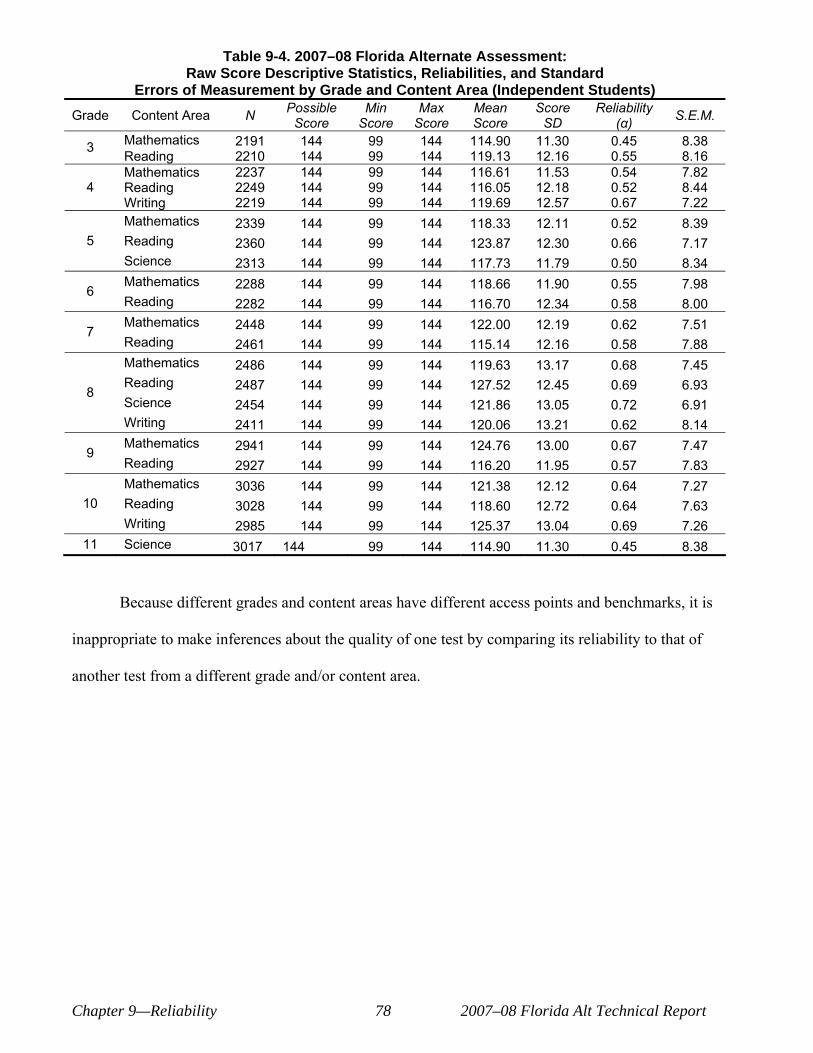
Table 9-4. 2007–08 Florida Alternate Assessment: Raw Score Descriptive Statistics, Reliabilities, and Standard
Errors of Measurement by Grade and Content Area (Independent Students) Grade Content Area N Possible
Score Min
Score Max
Score Mean Score
Score SD
Reliability (α) S.E.M.
3 Mathematics Reading
2191 2210
144 144
99 99
144 144
114.90 119.13
11.30 12.16
0.45 0.55
8.38 8.16
Mathematics 2237 144 99 144 116.61 11.53 0.54 7.82 4 Reading 2249 144 99 144 116.05 12.18 0.52 8.44
Writing 2219 144 99 144 119.69 12.57 0.67 7.22 Mathematics 2339 144 99 144 118.33 12.11 0.52 8.39
5 Reading 2360 144 99 144 123.87 12.30 0.66 7.17 Science 2313 144 99 144 117.73 11.79 0.50 8.34
6 Mathematics Reading
2288 2282
144 144
99 99
144 144
118.66 116.70
11.90 12.34
0.55 0.58
7.98 8.00
7 Mathematics Reading
2448 2461
144 144
99 99
144 144
122.00 115.14
12.19 12.16
0.62 0.58
7.51 7.88
Mathematics 2486 144 99 144 119.63 13.17 0.68 7.45
8 Reading Science
2487 2454
144 144
99 99
144 144
127.52 121.86
12.45 13.05
0.69 0.72
6.93 6.91
Writing 2411 144 99 144 120.06 13.21 0.62 8.14
9 Mathematics Reading
2941 2927
144 144
99 99
144 144
124.76 116.20
13.00 11.95
0.67 0.57
7.47 7.83
Mathematics 3036 144 99 144 121.38 12.12 0.64 7.27 10 Reading 3028 144 99 144 118.60 12.72 0.64 7.63
Writing 2985 144 99 144 125.37 13.04 0.69 7.26 11 Science 3017 144 99 144 114.90 11.30 0.45 8.38
Because different grades and content areas have different access points and benchmarks, it is
inappropriate to make inferences about the quality of one test by comparing its reliability to that of
another test from a different grade and/or content area.
Chapter 9—Reliability 78 2007–08 Florida Alt Technical Report
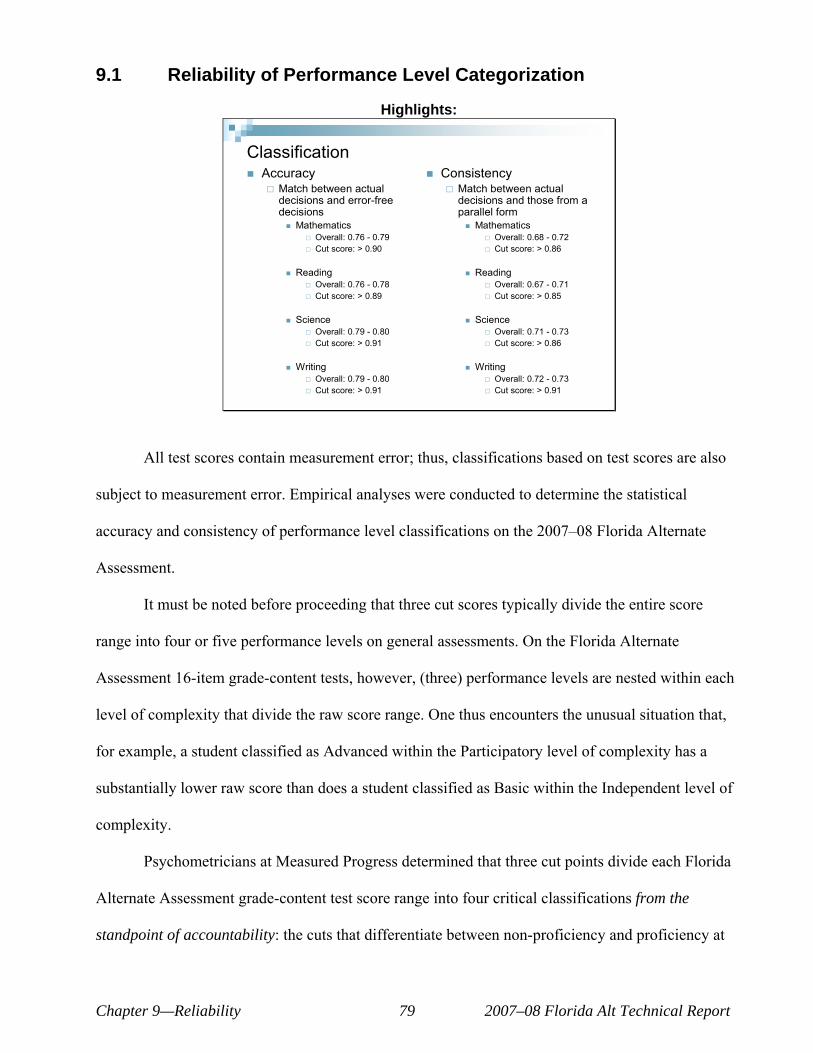
9.1 Reliability of Performance Level Categorization
Highlights:
Classification ¢ Accuracy ¢ Consistency
£ Match between actual £ Match between actual decisions and error-free decisions and those from a decisions parallel form
¢ Mathematics ¢ Mathematics £ Overall: 0.76 - 0.79 £ Overall: 0.68 - 0.72 £ Cut score: > 0.90 £ Cut score: > 0.86
¢ Reading ¢ Reading £ Overall: 0.76 - 0.78 £ Overall: 0.67 - 0.71 £ Cut score: > 0.89 £ Cut score: > 0.85
¢ Science ¢ Science £ Overall: 0.79 - 0.80 £ Overall: 0.71 - 0.73 £ Cut score: > 0.91 £ Cut score: > 0.86
¢ Writing ¢ Writing £ Overall: 0.79 - 0.80 £ Overall: 0.72 - 0.73 £ Cut score: > 0.91 £ Cut score: > 0.91
All test scores contain measurement error; thus, classifications based on test scores are also
subject to measurement error. Empirical analyses were conducted to determine the statistical
accuracy and consistency of performance level classifications on the 2007œ08 Florida Alternate
Assessment.
It must be noted before proceeding that three cut scores typically divide the entire score
range into four or five performance levels on general assessments. On the Florida Alternate
Assessment 16-item grade-content tests, however, (three) performance levels are nested within each
level of complexity that divide the raw score range. One thus encounters the unusual situation that,
for example, a student classified as Advanced within the Participatory level of complexity has a
substantially lower raw score than does a student classified as Basic within the Independent level of
complexity.
Psychometricians at Measured Progress determined that three cut points divide each Florida
Alternate Assessment grade-content test score range into four critical classifications from the
standpoint of accountability: the cuts that differentiate between non-proficiency and proficiency at
Chapter 9—Reliability 79 2007–08 Florida Alt Technical Report
each level of complexity (i.e., between Participatory-Basic and Participatory-Proficient, between
Supported-Basic and Supported-Proficient, and between Independent-Basic and Independent-
Proficient). The three cut points thereby result in four classifications: (1) below Participatory-
Proficient, (2) Participatory-Proficient through Supported-Basic, (3) Supported-Proficient through
Independent-Basic, and (4) Independent-Proficient and above. It is the accuracy and consistency of
these classifications that are described below.
9.1.1 Computing Accuracy and Consistency
Accuracy refers to the extent to which decisions based on test scores match decisions that
would have been made if the scores did not contain any measurement error. Accuracy must be
estimated, because errorless test scores do not exist. Consistency measures the extent to which
classification decisions based on test scores match the decisions based on scores from a second,
parallel form of the same test. Consistency can be evaluated directly from actual responses to test
items if two complete and parallel forms of the test are given to the same group of students. In
operational assessment programs, however, such a design is usually impractical. Instead, techniques,
such as those due to Livingston and Lewis (1995), have been developed to estimate both the
accuracy and consistency of classification decisions based on a single administration of a test. The
Livingston and Lewis technique was used for the 2007œ08 Florida Alternate Assessment because it
is easily adaptable to examinations of all kinds of formats, including mixed-format tests.
The accuracy and consistency estimates reported here make use of —true scores“ in the
classical test theory sense. A true score is the score that would be obtained if a test had no
measurement error. Of course, true scores cannot be observed and so must be estimated. In the
Livingston and Lewis method, estimated true scores are used to classify students into their —true“
classification.
Chapter 9—Reliability 80 2007–08 Florida Alt Technical Report
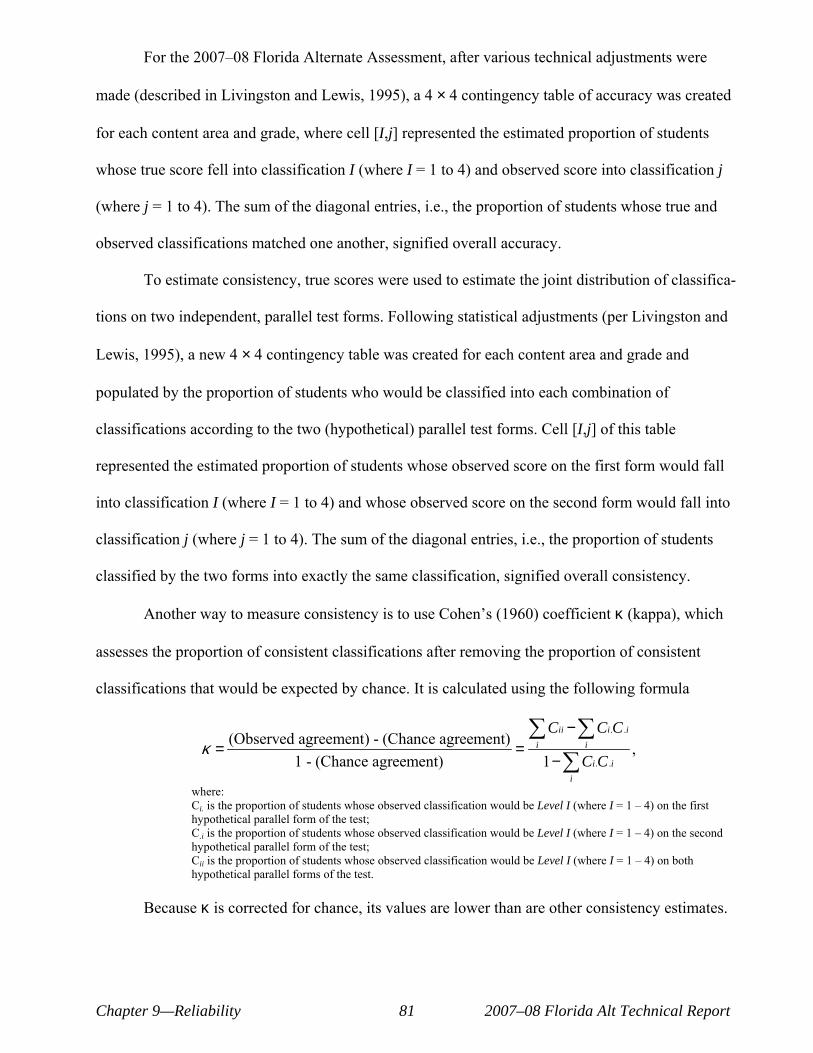
For the 2007œ08 Florida Alternate Assessment, after various technical adjustments were
made (described in Livingston and Lewis, 1995), a 4 × 4 contingency table of accuracy was created
for each content area and grade, where cell [I,j] represented the estimated proportion of students
whose true score fell into classification I (where I = 1 to 4) and observed score into classification j
(where j = 1 to 4). The sum of the diagonal entries, i.e., the proportion of students whose true and
observed classifications matched one another, signified overall accuracy.
To estimate consistency, true scores were used to estimate the joint distribution of classifica-
tions on two independent, parallel test forms. Following statistical adjustments (per Livingston and
Lewis, 1995), a new 4 × 4 contingency table was created for each content area and grade and
populated by the proportion of students who would be classified into each combination of
classifications according to the two (hypothetical) parallel test forms. Cell [I,j] of this table
represented the estimated proportion of students whose observed score on the first form would fall
into classification I (where I = 1 to 4) and whose observed score on the second form would fall into
classification j (where j = 1 to 4). The sum of the diagonal entries, i.e., the proportion of students
classified by the two forms into exactly the same classification, signified overall consistency.
Another way to measure consistency is to use Cohen‘s (1960) coefficient κ (kappa), which
assesses the proportion of consistent classifications after removing the proportion of consistent
classifications that would be expected by chance. It is calculated using the following formula
∑Cii − ∑C C i. .i(Observed agreement) - (Chance agreement) i iκ = = ,
1− ∑ i. .i1 - (Chance agreement) C C i
where: Ci. is the proportion of students whose observed classification would be Level I (where I = 1 œ 4) on the first hypothetical parallel form of the test; C.i is the proportion of students whose observed classification would be Level I (where I = 1 œ 4) on the second hypothetical parallel form of the test; Cii is the proportion of students whose observed classification would be Level I (where I = 1 œ 4) on both hypothetical parallel forms of the test.
Because κ is corrected for chance, its values are lower than are other consistency estimates.
Chapter 9—Reliability 81 2007–08 Florida Alt Technical Report
9.1.2 Accuracy and Consistency Results
Accuracy and consistency analyses overall, conditional on classification, and at three cut
scores are summarized in Table 9-2, while more detailed accuracy and consistency results may be
found in Appendix J.
For accuracy and consistency conditional upon classification, the denominator is the
proportion of students associated with a given classification. For example, the conditional accuracy
value is 0.80 for the second classification (i.e., that below Supported-Proficient and above
Participatory-Proficient) for mathematics grade 3. This figure indicates that among the students
whose true scores placed them in this second classification, 80% of them would be expected to be in
this classification when categorized according to their observed score. Similarly, the corresponding
consistency value of 0.75 indicates that 75% of students with observed scores in the second
classification would be expected to score in this classification again if a second, parallel test form
were used.
False positive and false negative decision rates are reported with the accuracy and
consistency estimates at the three cuts. False positives are the proportion of students whose observed
scores were above the cut and true scores below the cut. False negatives are the proportion of
students whose observed scores were below the cut and true scores above the cut.
It should be noted that Livingston & Lewis (1995) discuss two versions of the accuracy and
consistency tables. A standard version performs calculations for forms parallel to the form taken. An
—adjusted“ version adjusts the results of one form to match the observed score distribution obtained
in the data. The calculations described here use the standard version for two reasons: 1) this
—unadjusted“ version can be considered a smoothing of the data, thereby decreasing the variability of
the results; and 2) for results dealing with the consistency of two parallel forms, the unadjusted
tables are symmetric, indicating that the two parallel forms have the same statistical properties. This
Chapter 9—Reliability 82 2007–08 Florida Alt Technical Report
second reason is consistent with the notion of forms that are parallel, i.e., it is more intuitive and
interpretable for two parallel forms to have the same statistical distribution as one another.
Table 9-2 summarizes most of the results of the classification tables at a glance. As with
other types of reliability, it is inappropriate when analyzing the decision accuracy and consistency of
a given examination to compare results between grades and content areas.
Chapter 9—Reliability 83 2007–08 Florida Alt Technical Report

Table 9-2. 2007–08 Florida Alternate Assessment: Summary of
Decision Accuracy (and Consistency) Results for Proficiency Cuts on the Raw Score Scale
Content/ Conditional on Level At Basic-Proficient Cut Point within LOC Grade Overall Below P-P P-P thru S-B S-P thru I-B I-P and above Participatory Supported Independent
Math/3 0.79 (0.71) 0.72 (0.60) 0.80 (0.75) 0.76 (0.68) 0.86 (0.70) 0.96 (0.94) 0.90 (0.86) 0.94 (0.91) Math/4 0.79 (0.72) 0.74 (0.62) 0.80 (0.75) 0.76 (0.69) 0.88 (0.74) 0.96 (0.94) 0.90 (0.87) 0.93 (0.90) Math/5 0.78 (0.69) 0.68 (0.57) 0.79 (0.73) 0.75 (0.66) 0.88 (0.75) 0.93 (0.91) 0.91 (0.87) 0.93 (0.91) Math/6 0.76 (0.68) 0.75 (0.66) 0.75 (0.68) 0.72 (0.64) 0.87 (0.74) 0.95 (0.93) 0.91 (0.87) 0.91 (0.88) Math/7 0.77 (0.69) 0.75 (0.64) 0.76 (0.69) 0.75 (0.67) 0.88 (0.75) 0.95 (0.93) 0.90 (0.86) 0.92 (0.89) Math/8 0.78 (0.70) 0.76 (0.65) 0.76 (0.70) 0.76 (0.69) 0.87 (0.73) 0.95 (0.93) 0.90 (0.86) 0.93 (0.90) Math/9 0.76 (0.68) 0.75 (0.66) 0.71 (0.62) 0.71 (0.63) 0.90 (0.78) 0.95 (0.93) 0.91 (0.87) 0.91 (0.87) Math/10 0.77 (0.69) 0.75 (0.64) 0.73 (0.65) 0.75 (0.68) 0.88 (0.76) 0.96 (0.94) 0.90 (0.87) 0.91 (0.88) Reading/3 0.76 (0.68) 0.76 (0.69) 0.74 (0.65) 0.65 (0.55) 0.89 (0.80) 0.94 (0.91) 0.92 (0.89) 0.90 (0.87) Reading/4 0.76 (0.68) 0.76 (0.67) 0.77 (0.71) 0.70 (0.61) 0.88 (0.74) 0.94 (0.92) 0.90 (0.86) 0.92 (0.89) Reading/5 0.76 (0.67) 0.75 (0.67) 0.76 (0.68) 0.68 (0.59) 0.87 (0.76) 0.94 (0.92) 0.91 (0.88) 0.91 (0.87) Reading/6 0.76 (0.67) 0.78 (0.70) 0.73 (0.65) 0.67 (0.57) 0.87 (0.77) 0.95 (0.94) 0.92 (0.88) 0.89 (0.85) Reading/7 0.77 (0.69) 0.72 (0.65) 0.71 (0.61) 0.63 (0.52) 0.90 (0.83) 0.95 (0.93) 0.93 (0.90) 0.89 (0.85) Reading/8 0.77 (0.69) 0.76 (0.67) 0.74 (0.67) 0.70 (0.62) 0.90 (0.80) 0.95 (0.94) 0.91 (0.87) 0.91 (0.88) Reading/9 0.78 (0.71) 0.74 (0.66) 0.71 (0.62) 0.66 (0.57) 0.92 (0.84) 0.96 (0.94) 0.92 (0.90) 0.90 (0.86) Reading/10 0.78 (0.71) 0.75 (0.64) 0.74 (0.66) 0.72 (0.64) 0.91 (0.81) 0.96 (0.95) 0.92 (0.88) 0.90 (0.87) Science/5 0.79 (0.71) 0.74 (0.68) 0.73 (0.64) 0.67 (0.57) 0.91 (0.85) 0.95 (0.93) 0.93 (0.91) 0.90 (0.87) Science/8 0.80 (0.73) 0.71 (0.64) 0.70 (0.61) 0.65 (0.55) 0.93 (0.87) 0.95 (0.93) 0.94 (0.92) 0.91 (0.88) Science/11 0.79 (0.72) 0.73 (0.62) 0.70 (0.62) 0.68 (0.61) 0.93 (0.85) 0.97 (0.95) 0.92 (0.90) 0.90 (0.86) Writing/4 0.80 (0.73) 0.76 (0.67) 0.80 (0.74) 0.77 (0.69) 0.90 (0.79) 0.96 (0.94) 0.92 (0.89) 0.93 (0.90) Writing/8 0.79 (0.72) 0.76 (0.68) 0.77 (0.70) 0.72 (0.64) 0.91 (0.83) 0.95 (0.94) 0.92 (0.89) 0.92 (0.89) Writing/10 0.79 (0.72) 0.75 (0.64) 0.79 (0.73) 0.73 (0.66) 0.90 (0.79) 0.97 (0.95) 0.91 (0.88) 0.92 (0.89) Abbreviations: (Level of Complexity) P- = Participatory; S- = Supported; I- = Independent (Performance Levels) -B=Basic, -P = Proficient.
Chapter 9—Reliability 84 2007–08 Florida Alt Technical Report
SECTION IV: THE VALIDITY EVALUATION Chapter 10. REVISITING THE VALIDITY EVALUATION QUESTIONS
Each of the sections in this technical report contributes important information to an argument
for validity by addressing one or more of the following aspects of the Florida Alternate Assessment:
test development, test alignment, test administration, scoring, item analyses, reliability, performance
levels, and reporting.
To measure test content validity is to determine how well the assessment tasks represent the
curriculum and standards for each content area and grade level. This is informed by the assessment
development process, including how the Levels of Complexity, test blueprints, and student evidence
align to the curriculum and standards. Viewed through this lens, as provided in the Standards for
Educational and Psychological Testing (AERA, APA, NCME, 1999), evidence based on test content
was extensively described in the development and administrations sections of the report. Content
appropriateness review processes; adherence to the test blueprint; use of standardized administration
procedures; and appropriate test administration training are all components of validity evidence
based on test content. The state provided a vehicle for extensive administrator training and a detailed
administrator manual.
Information provided in another section of this report described the scoring procedures for
the Florida Alternate Assessment as well as the processing of scoring documents.
Evidence based on internal structure was presented in the section of this report titled under
the Technical Characteristics of the Florida Alternate Assessment. Technical characteristics of the
assessments were presented in terms of item statistics, reliability measures, and decision accuracy
and consistency indices.
Methods for gathering evidence on the consequences of testing will be discussed with the
FLDOE at a later date. The FLDOE is interested in performing studies that support the external
Chapter 10—Validity Evaluation 85 2007–08 Florida Alt Technical Report
validity of the assessment through the consistency and accuracy of student performance during daily
instruction as compared to performance on the assessment, inter-rater consistency of scoring of the
assessment, and through support of the levels of complexity and the hierarchy of skills they
represent. These studies when completed will be outlined in a future technical report. For the present
time, the report shells for the Florida Alternate Assessment speak to the efforts undertaken to
promote accurate and clear information provided to the public regarding test scores. Performance
level descriptors provide users with reference points for mastery at each grade level, which is
another useful and simple way to interpret scores. The continued development of the Florida
Alternate Assessment interpretation information for parents and teachers adds to the clarity of
information provided to the public.
The evidence presented in this report supports inferences of student achievement on the
content represented in the Sunshine State Standards and Sunshine State Standards Access Points for
reading, mathematics, writing, and science for the purposes of program and instructional
improvement and as a component of school accountability. As reflected in the most recent
Standards, validity has grown to be understood as a unitary concept with content, criterion-related,
and construct validity describing three aspects of validity rather than three separate types of validity.
In addition to validity being viewed from a unitary perspective, the concept of validity has been
broadened to address issues related to social consequences and value implications of test
interpretations and uses (Messick, 1989a, 1989b). It is in the same spirit that the validity evidence in
this report is presented.
Chapter 10—Validity Evaluation 86 2007–08 Florida Alt Technical Report
REFERENCES
References 87 2007–08 Florida Alt Technical Report

REFERENCES Allen, Mary J. & Yen, Wendy M. (1979). Introduction to Measurement Theory. Belmont, CA: Wadsworth,
Inc.
American Educational Research Association, American Psychological Association, & National Council on Measurement in Education (1999). Standards for educational and psychological testing. Washington, DC: American Educational Research Association.
Baker, F. B. (1992). Item response theory: parameter estimation techniques. New York, NY: Marcel Dekker, Inc.
Baker, F.B., Kim, S-H.(2004). Item Response Theory: parameter estimation techniques. New York: Marcel Dekker, Inc. 2nd Edition.
Brown, F. G. (1983). Principles of educational and psychological testing (3rd Edition). Fort Worth: Holt, Rinehart and Winston.
Chicago Manual of Style (15th ed.). (2003). Chicago: University of Chicago Press.
Cohen, J. (1960). A coefficient of agreement for nominal scales. Educational and Psychological Measurement, 20, 37-46.
Cronbach, L. J. (1951). Coefficient alpha and the internal structure of tests. Psychometrika, 16, 297-334.
Dorans, N. J., & E. Kulick (1986). Demonstrating the utility of the standardization approach to assessing unexpected differential item performance on the Scholastic Aptitude Test. Journal of Educational Measurement, 23, 355-368.
Dorans, N. J., & Holland, P. W. (1993). DIF detection and description. In P. W. Holland & H. Wainer (Eds.) Differential item functioning (pp. 35-66). Hillsdale, NJ: Lawrence Erlbaum Associates.
Feldt, L.S., & R. L. Brennan (1989). Reliability. In R.L. Linn (Ed.), Educational measurement (3rd ed., pp. 105-146). New York: Macmillan Publishing Company.
Hambleton, R.K., & H. Swaminathan (1985). Item response theory: Principles and applications. Boston, MA: Kluwer Academic Publishers.
Hambleton, R.K., & W. J. van der Linden (1997). Handbook of modern item response theory. New York, NY: Springer-Verlag.
Holland, P. & D. T. Thayer (1988). Differential item performance and the Mantel-Haenszel procedure. In H. Wainer & H. Braun (Eds.), Test validity (pp. 129-145). Hillsdale, NJ: Lawrence Erlbaum Associates.
Holland, P.W., & Wainer, H. (1993). Differential item functioning. Hillsdale, NJ: Erlbaum.
Joint Committee on Testing Practices (1988). Code of fair testing practices in education. Washington, D.C.: National Council on Measurement in Education.
Joint Committee on Testing Practices. 2004. Code of fair testing practices in education.
Kingston, N.K., Kahl, S.K., Sweeney, K.P., and Bay, L. (2001). Setting Performance Standards Using the Body of Work Method. In Cizek, G.J. (ed.). Setting Performance Standards: Concepts, Methods, and Perspectives. Mahwah, NJ: Lawrence Erlbaum.
References 89 2007–08 Florida Alt Technical Report
Kolen, M.J., & Brennan, R.L. (1995). Test Equating: Methods and Practices. New York: Springer-Verlag.
Livingston, S. A., & Lewis, C. (1995). Estimating the consistency and accuracy of classifications based on test scores. Journal of Educational Measurement, 32, 179-197.
Lord, F.M. & Novick, M.R. (1968). Statistical Theories of Mental Test Scores. Reading, MA: Addison-Wesley.
Muraki, E. & R. D. Bock (2003). PARSCALE 4.1. Lincolnwood, IL: Scientific Software International.Subkoviak, M.J. (1976). Estimating reliability from a single administration of a mastery test. Journal of Educational Measurement, 13, 265-276.
Petersen, N.S., Kolen, M.J., & Hoover, H.D. (1989) Scaling, norming, and equating. In R.L. Linn (Ed.), Educational measurement (3rd ed., pp. 221-262).
Stocking, M. L., & Lord, F. M. (1983). Developing a common metric in item response theory. Applied Psychological Measurement, 7, 201-210
Stout, W. F. (1987). A nonparametric approach for assessing latent trait dimensionality.Psychometrika, 52, 589-617.
Stout, W. F., Froelich, A. G., & Gao, F. (2001). Using resampling methods to produce an improved DIMTEST procedure. In A. Boomsma, M. A. J. van Duign, & T. A. B. Snijders(Eds.), Essays on Item Response Theory, (pp. 357-375). New York: Springer-Verlag.
Washington, DC: American Psychological Association. Available for download at http://www.apa.org/science/fairtestcode.html.
Zhang, J., & Stout, W. F. (1999). The theoretical DETECT index of dimensionality and its application to approximate simple structure. Psychometrika, 64, 213-249.
References 90 2007–08 Florida Alt Technical Report
APPENDICES
Appendices 91 2007–08 Florida Alt Technical Report

APPENDIX A—FLORIDA STAKEHOLDER LISTS
Appendix A—FL Stakeholders List 93 2007–08 Florida Alt Technical Report

Appendix A—FL Stakeholders List 94 2007–08 Florida Alt Technical Report
Reading Extensions Writing Team, July 2005 Rita Ammons
ESE Middle School Teacher, Lee County Schools Elizabeth Barton
Escambia County Schools Martha Berman
ESE Elementary Teacher, Miami-Dade County Holly Brozi
Vocational Education, Monroe County Ginger Copeland
ESE Middle School Teacher, Levy County Blanquite Cruz
ESOL Middle School Specialist, Lake County Meredith Duraslanti
ESE Middle School Teacher, Hardee County Patricia Fisher
Lake County Schools RhaoNan Florio
ESE Middle School Teacher, Marion County Bonnie Hammer
ESE Coordinator, Santa Rosa County Schools Trace Hines
District Administrator, Volusia County Victoria Hurley
Middle School Reading Teacher, Okaloosa County Kristen Landry
ESE PreK Teacher ,Wakulla County Randy LaRusso
Alternate Assessment Coordinator, Brevard County Maria Mesa
ESE High School Teacher, Miami-Dade County Mike Muldoon
Florida Inclusion Network Facilitator, USF-St. Petersburg Jodi O‘Meara
Curriculum Specialist, Manatee County Mike Perduto
Vocational Education, Brevard County Constance Pridgeon
District Curriculum Coordinator, Gilchrist County Dee Ragar
High School Reading Teacher, Sumter County Jamie Ruccolo
Appendix A—FL Stakeholders List 95 2007–08 Florida Alt Technical Report
Middle School Reading Teacher, Broward County Susan Seal
Middle School Reading Teacher, St. Lucie County Claire Smith
ESE Coordinator, Marion County Betty Spires
ESE Resource Specialist, Walton County LaJune Stephens
ESE Elementary Teacher, Taylor County Marie Thienel
ESE Middle School Teacher, Osceola County C.J. Weyrich œ
ESE Elementary Teacher, Franklin County
Writing Extensions Writing Team, 2005 Mary Asciutto
Elementary Teacher, Highlands County Anita Askew
Reading Teacher, Gulf County Schools Cindy Bania œ Pinellas County Schools
Alternate Assessment Coordinator and District Administrator Carolyn Baxter
Jackson County Schools Betsy Botts
Santa Rosa County Schools Sclena Brantley
Middle School Mathematics Teacher, Pasco County Daniel Brownyard
Elementary Teacher, Polk County Mevldine Carter
Escambia County Schools Cathy Chelberg
ESE Elementary Teacher, Seminole County = Badonna Dardis
Assistant Principal, Polk County Phyllis DeSesso
ESE Middle School Teacher, Hernando County = Marjorie Garland
Middle School Language Arts Teacher, Martin County = Margaret Hanka
ESE Middle School Teacher, Pasco County = Libby Harris
ESE Middle School Teacher, Columbia County =
Appendix A—FL Stakeholders List 96 2007–08 Florida Alt Technical Report
Bonnie Hernandez ESE Elementary Teacher, Bay County
Melissa Homan ESE High School Teacher, St. Lucie County
Sheila Newell ESE and Elementary Teacher, Polk County
Ellen Quartano High School English Teacher, Orange County
Ellen Sage Manatee County Schools
Nancy Shackelford Alternate Assessment Coordinator, Hendry County
Holly Ward High School English Teacher, Volusia County
Diane Wilen ESOL Elementary Specialist, Broward County
Reading and Language Arts Access Points Consultants Stacie Whinnery
University of West Florida Laurie Brennan
Elementary ESE Teacher, Leon County Tanja Estes
Secondary ESE Teacher, Leon County Michele Gould
Middle School ESE Teacher, Leon County Elaine Harrison
High School ESE Teacher, Leon County
Appendix A—FL Stakeholders List 97 2007–08 Florida Alt Technical Report
Alternate Assessment Advisory CommitteeMembers
Name Representing Denise Rusnak Broward County Rosalind Hall Levy County Debi Dukes Union County Janet Hurley Manatee County Bruce Harrison Leon County Jo Wilson Gilchrist County Jill Brookner Miami-Dade County Bill Elkin Lee County Barbara Hardy Bay County Ruth Casias Clay County Natalie Roca Sarasota County; Malcolm Thomas Escambia County Conney Dahn Martin County Patti Crooks Martin County Patty Rusler Orange County Sam Thompson Leon County Marjorie Murray Seminole County Stacie Whinnery University of West Florida Susan Tucker Duval County Brian McMahon Indian River County Jessica Webb Madison County Cornelia Orr Florida Department of Education Bambi Lockman Florida Department of Education Sheryl Sandvoss Florida Department of Education Kris Ellington Florida Department of Education Victoria Ash Florida Department of Education Carol Allman Consultant
Appendix A—FL Stakeholders List 98 2007–08 Florida Alt Technical Report
Other Attendees Name Representing
Anne Chartrand Facilitator, Southeast Regional Resource Center Karen Denbroeder Florida Department of Education Angela Nathaniel Florida Department of Education Chris Sarno Piedra Data Services Adalis Sanchez Piedra Data Services Gail Best Accountability and Assessment for Students with
Disabilities Bennett Buckles Accountability and Assessment for Students with
Disabilities Donna Hubbs Accountability and Assessment for Students with
Disabilities Leigh Palka Accountability and Assessment for Students with
Disabilities Susan Izard Measured Progress Rebecca Walk Measured Progress Brook Loch Measured Progress Jessica Demmons Measured Progress
Bias Review Committee
Name Role Gender Ethnicity District/Size Area of State
*Evelyn Langston ESE Dir. F 2 Putnam/MS Northeast
*Dawn Saunders FLDOE F 2 Leon/M North
*Peggy Harter Assistive Tech Specialist
F 1 Leon/FDLRS North
*Frank Wadler ESE Teacher; HI, VI, ESOL, Reading, MH
M 1 FSDB Northeast
*Lora McCalister-Cruel
ESE Teacher F 2 Bay/M Northwest
*Tony Silva School Psychologist M 3 Palm Beach/VL Southeast
*Gina Horton Instructional Support
Teacher/Specialize d Curriculum
F 1 Orange/VL Central
*Richard Stokes ESE Teacher, HS M 2 Pasco/L West Central
*Deland Innocent District Bilingual Assessor
M 6 Miami-Dade/VL South
Appendix A—FL Stakeholders List 99 2007–08 Florida Alt Technical Report
CONTENT REVIEW Reading Team Name/Role Gender District/Size Area of State
Elementary Constance Pridgeon; Gen ed F Gilchrist/S North Central
Sheila Newell; gen. ed 3rd F Polk/L Central
Tina Mayes; ESE K-5 (mostly autistic students) F Osceola/L Central
Joan Radford; Reading coach/former ESE F Hamilton/S North Central
Middle Anita Askew; Gen. ed., MS F Gulf/S Northwest
Sarah Trauger; Gen. ed Reading/ ESE background F Duval/VL Northeast
Cheryl Dudash; general ed; reading coach F Broward/VL Southeast
Jeanette Gresham; ESE MS F Pasco/L West Central
Rosalind Hall; ESE director F Levy/S Central
Debra Doster; ESE F Volusia/L Central East
High School Christine Richards; District HS Reading Specialist F St. Lucie/M Central East
Elisa Giordano; Gen Ed F Broward/VL South East
Susan Seal; Gen. ed, MS/HS F St. Lucie/M Central East
Llidia Velado; ESE F Volusia/L Central East
Richard Stokes; ESE M Pasco/L West Central
Appendix A—FL Stakeholders List 100 2007–08 Florida Alt Technical Report
Math Team Name/Role Gender District/ Size Area of State
Elementary Kim Dimaggio; Gen Ed F Orange/VL Central
Tiffany Stanley; Gen Ed F Orange/VL Central
Terrilynn Latour, Gen Ed F Broward/VL South East
Stephanie Skwyra; ESE 3-5 F Osceola/L Central
Leslie Rogers; ESE F Pinellas/VL Central West
Middle Angel Johnson; ESE MS/HS F Pasco/L West Central
Sharon Whitaker; ESE F Okeechobee/MS Central East
Delia H Pogorzelsa; Gen Ed F Leon/M North Central
Violette Espinoza; Gen Ed F Broward/V South East
Mary Lou Darby; Assessment F Santa Rosa/M North West
Sheribeth Marquis; Gen Ed; ESE F Leon/M North Central
High School Carla Frazier; Data Analysis F Manatee/L Central West
Jim Devune; Gen Ed M Flagler/MS North East
Merrill Levine; ESE F Broward/VL South East
Bridget White; ESE F Pasco/L West Central
Amy Modesto; ESE/HS F Orange/VL Central
Appendix A—FL Stakeholders List 101 2007–08 Florida Alt Technical Report
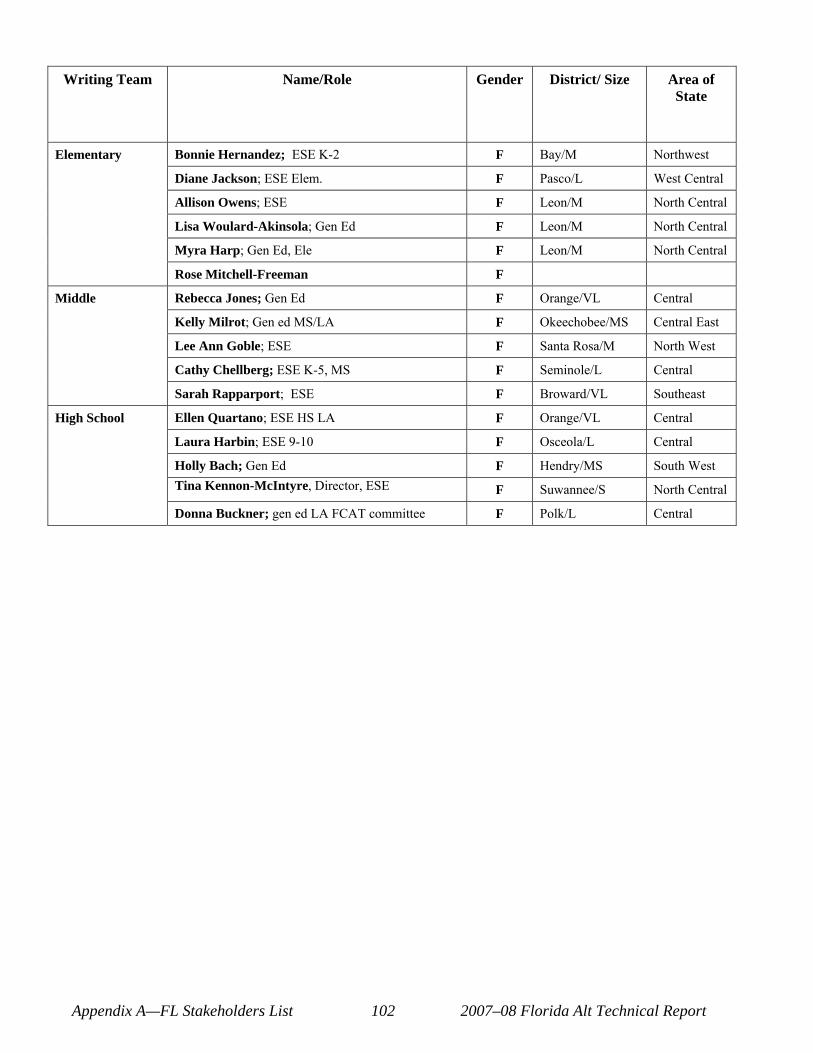
Writing Team Name/Role Gender District/ Size Area of State
Elementary Bonnie Hernandez; ESE K-2 F Bay/M Northwest
Diane Jackson; ESE Elem. F Pasco/L West Central
Allison Owens; ESE F Leon/M North Central
Lisa Woulard-Akinsola; Gen Ed F Leon/M North Central
Myra Harp; Gen Ed, Ele F Leon/M North Central
Rose Mitchell-Freeman F
Middle Rebecca Jones; Gen Ed F Orange/VL Central
Kelly Milrot; Gen ed MS/LA F Okeechobee/MS Central East
Lee Ann Goble; ESE F Santa Rosa/M North West
Cathy Chellberg; ESE K-5, MS F Seminole/L Central
Sarah Rapparport; ESE F Broward/VL Southeast
High School Ellen Quartano; ESE HS LA F Orange/VL Central
Laura Harbin; ESE 9-10 F Osceola/L Central
Holly Bach; Gen Ed F Hendry/MS South West Tina Kennon-McIntyre, Director, ESE F Suwannee/S North Central
Donna Buckner; gen ed LA FCAT committee F Polk/L Central
Appendix A—FL Stakeholders List 102 2007–08 Florida Alt Technical Report
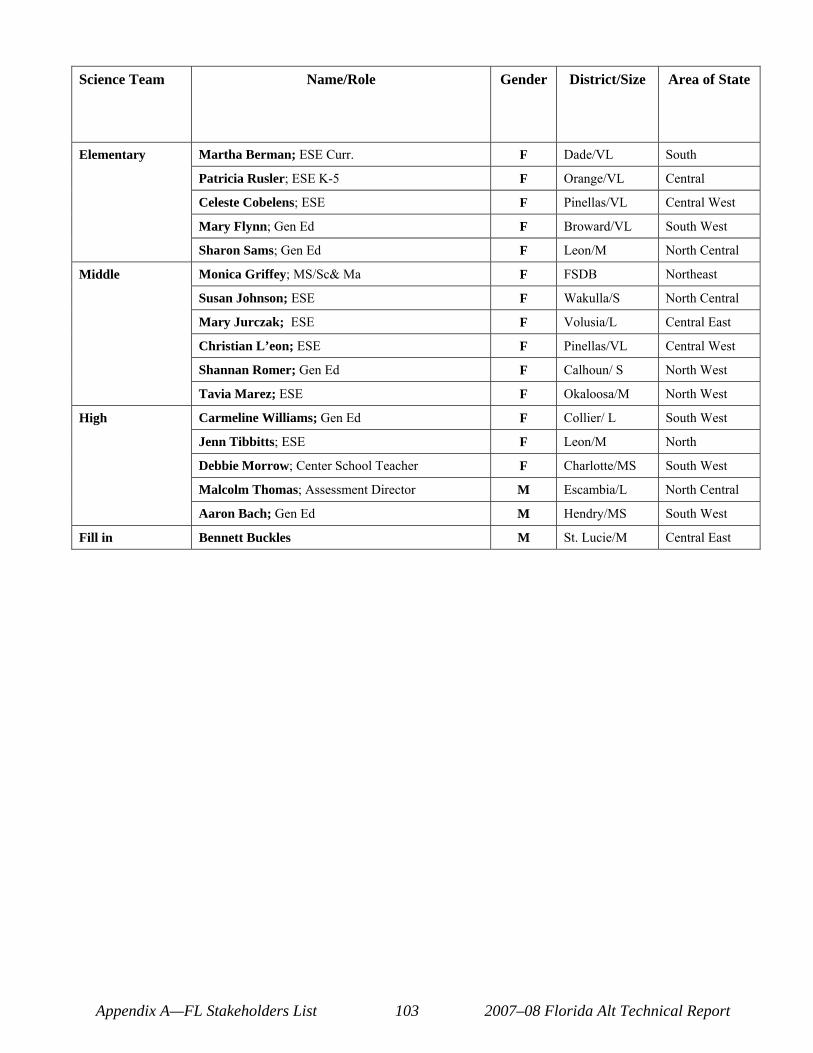
Science Team Name/Role Gender District/Size Area of State
Elementary Martha Berman; ESE Curr. F Dade/VL South
Patricia Rusler; ESE K-5 F Orange/VL Central
Celeste Cobelens; ESE F Pinellas/VL Central West
Mary Flynn; Gen Ed F Broward/VL South West
Sharon Sams; Gen Ed F Leon/M North Central
Middle Monica Griffey; MS/Sc& Ma F FSDB Northeast
Susan Johnson; ESE F Wakulla/S North Central
Mary Jurczak; ESE F Volusia/L Central East
Christian L’eon; ESE F Pinellas/VL Central West
Shannan Romer; Gen Ed F Calhoun/ S North West
Tavia Marez; ESE F Okaloosa/M North West
High Carmeline Williams; Gen Ed F Collier/ L South West
Jenn Tibbitts; ESE F Leon/M North
Debbie Morrow; Center School Teacher F Charlotte/MS South West
Malcolm Thomas; Assessment Director M Escambia/L North Central
Aaron Bach; Gen Ed M Hendry/MS South West
Fill in Bennett Buckles M St. Lucie/M Central East
Appendix A—FL Stakeholders List 103 2007–08 Florida Alt Technical Report

APPENDIX B—SAMPLE ITEM: FIELD TEST FORMAT
Appendix B—Sample Item Field Test Format 105 2007–08 Florida Alt Technical Report

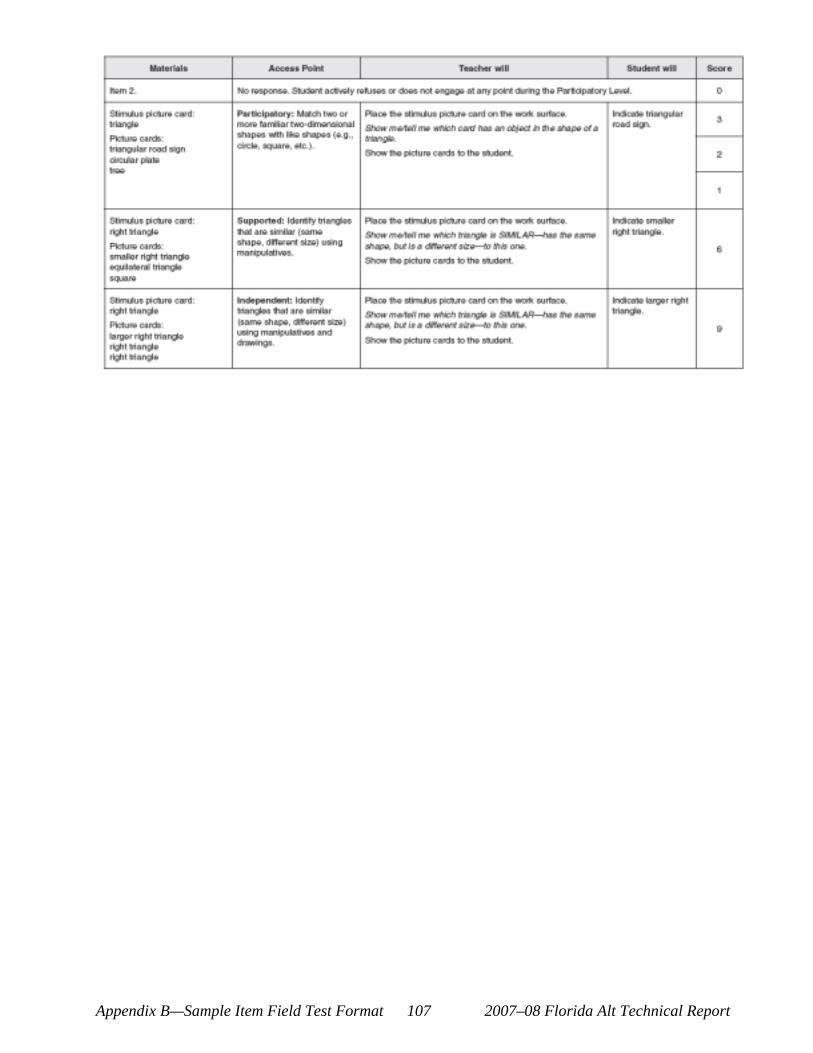
Appendix B—Sample Item Field Test Format 107 2007–08 Florida Alt Technical Report
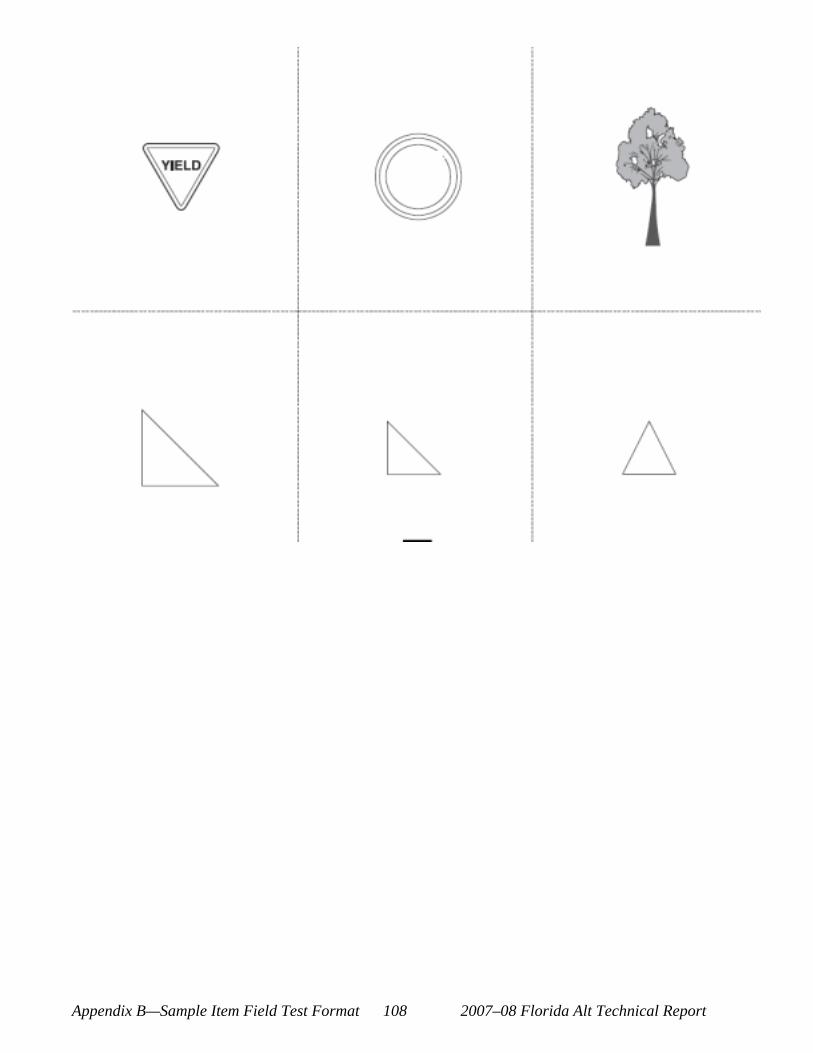
Appendix B—Sample Item Field Test Format 108 2007–08 Florida Alt Technical Report
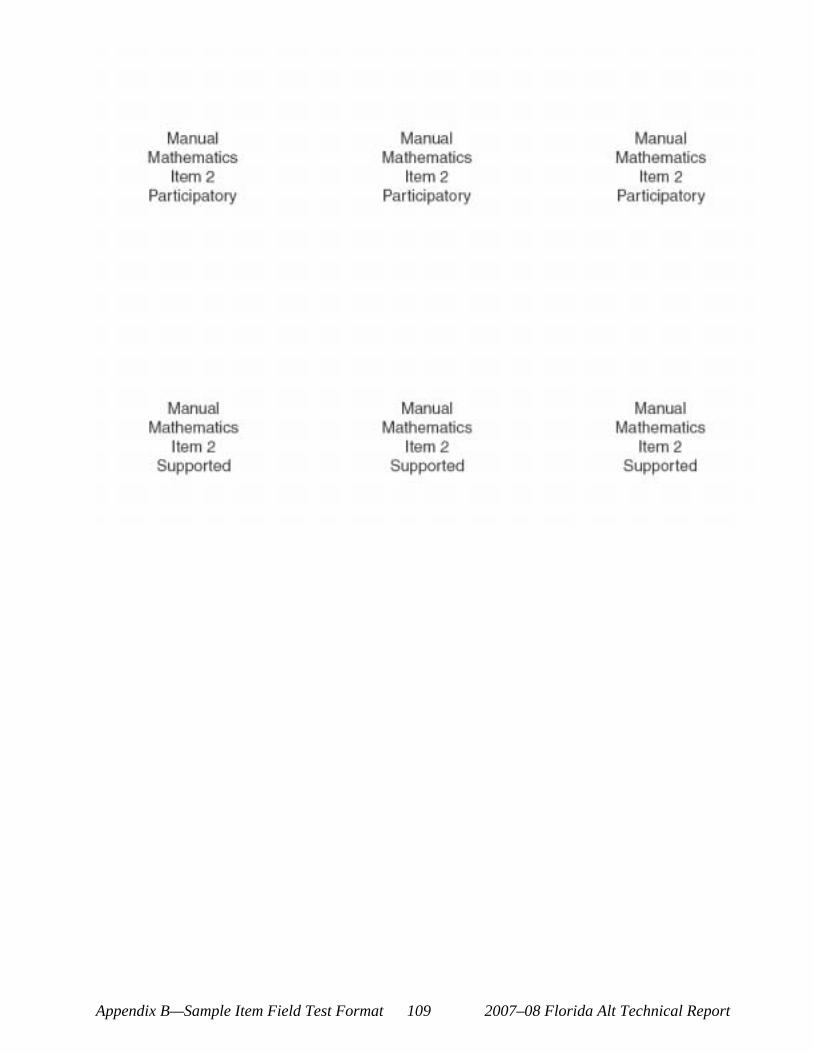
Appendix B—Sample Item Field Test Format 109 2007–08 Florida Alt Technical Report
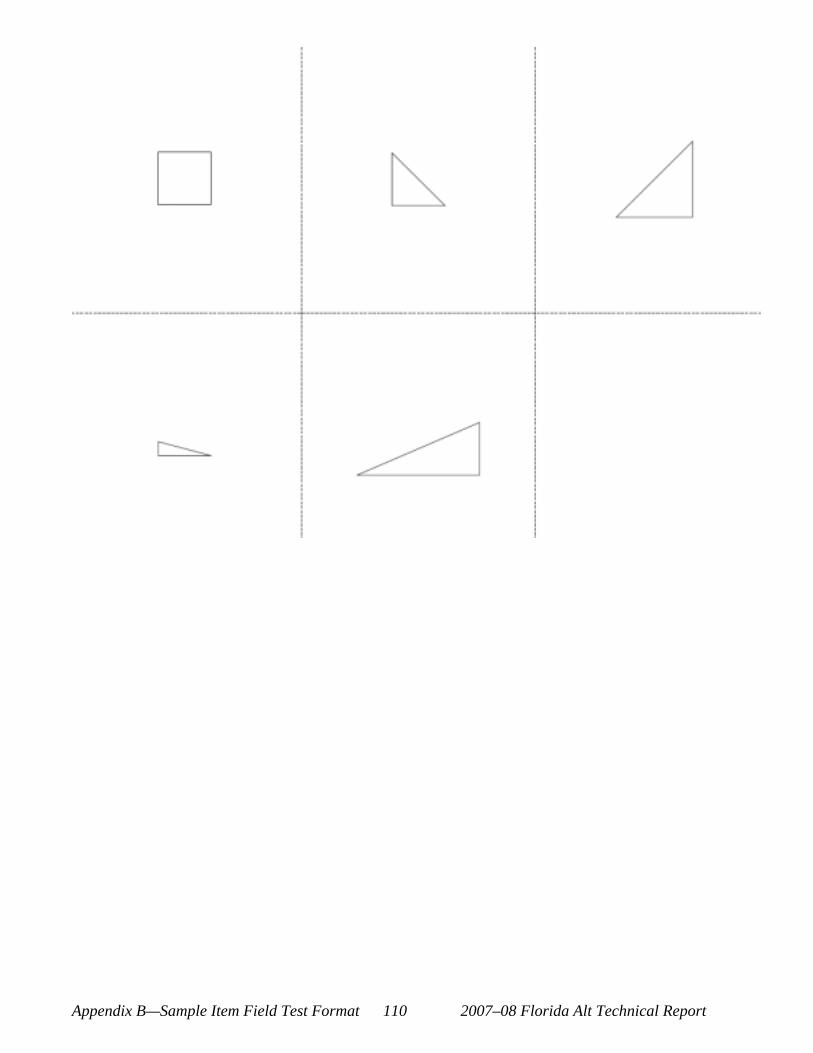
Appendix B—Sample Item Field Test Format 110 2007–08 Florida Alt Technical Report
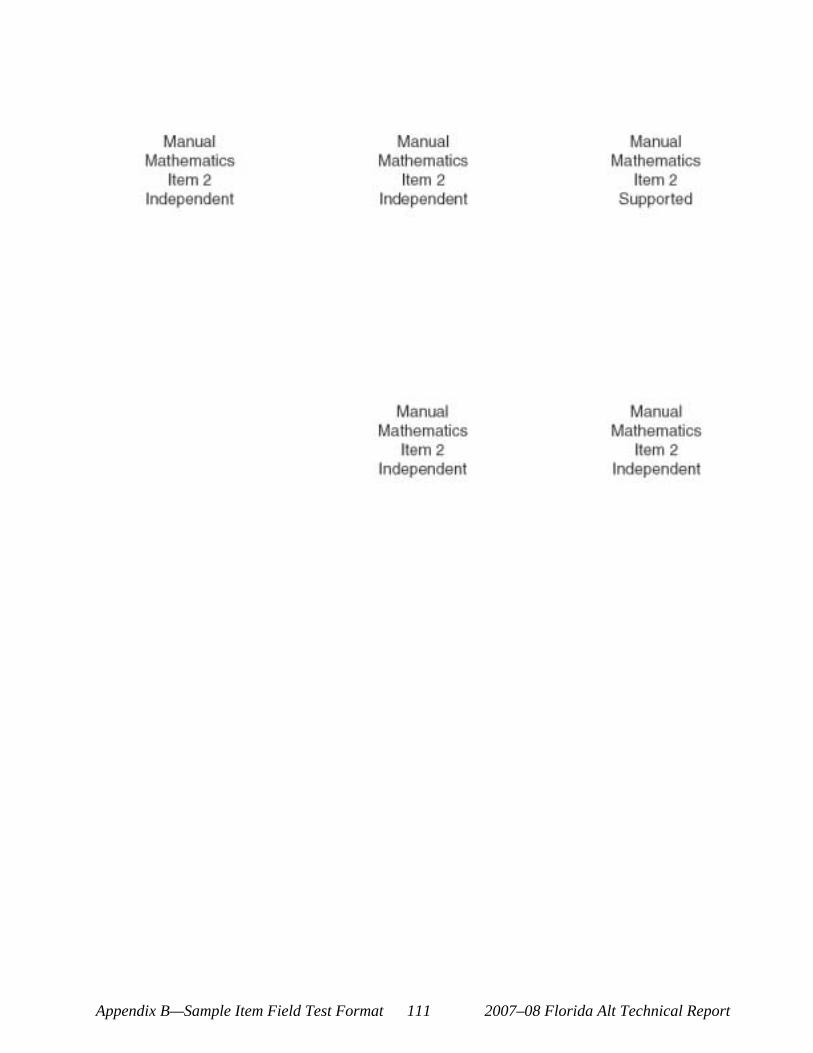
Appendix B—Sample Item Field Test Format 111 2007–08 Florida Alt Technical Report

APPENDIX C—SURVEYS AND RESULTS
Appendix C—Survey Results 113 2007–08 Florida Alt Technical Report

CONTENT REVIEW COMMITTEE FEEDBACK
Reading Strongly Disagree Disagree
Neither Agree Nor Disagree Agree
Strongly Agree
1 2 3 4 5 Overall the review worked well 0% 0% 0% 36% 64% The overview and item walk through were helpful 0% 7% 0% 21.5% 71.5%
The process for feedback and recommendations worked well. 0% 0% 7% 14% 79% The location of the meeting and facilities worked well 0% 0% 0% 7% 93%
Science Strongly Disagree Disagree
Neither Agree Nor Disagree Agree
Strongly Agree
1 2 3 4 5 Overall the review worked well 0% 0% 0% 25% 62.5% The overview and item walk through were helpful 6% 0% 0% 25% 69%
The process for feedback and recommendations worked well. 0% 0% 0% 31% 63% The location of the meeting and facilities worked well 0% 6% 0% 19% 69%
Math Strongly Disagree Disagree
Neither Agree Nor Disagree Agree
Strongly Agree
1 2 3 4 5 Overall the review worked well 0% 0% 0% 47% 53% The overview and item walk through were helpful 0% 0% 0% 33% 67%
The process for feedback and recommendations worked well. 0% 0% 0% 47% 53% The location of the meeting and facilities worked well 0% 0% 0% 20% 73%
Writing Strongly Disagree Disagree
Neither Agree Nor Disagree Agree
Strongly Agree
1 2 3 4 5 Overall the review worked well 0% 0% 0% 71% 29% The overview and item walk through were helpful 0% 0% 0% 57% 43%
The process for feedback and recommendations worked well. 0% 0% 0% 57% 43% The location of the meeting and facilities worked well 0% 0% 0% 29% 71%
Appendix C—Survey Results 115 2007–08 Florida Alt Technical Report
TRAIN-THE-TRAINER FEEDBACK
September 5th No Response
Strongly Disagree Disagree
Neither Agree
nor Disagree Agree
Strongly Agree
Overall the training worked well. 0% 0% 0% 6.5% 37% 56.5%
The questions activity was helpful. 0% 0% 4% 11% 41.5% 41.5%
The Scavenger Hunt Activity was helpful. 2% 2% 2% 20% 37% 39% The overview and manual walk through were helpful. 2% 0% 2% 2% 26% 68%
The Open Response Activity was helpful. 0% 0% 2% 15% 39% 44%
Seeing the administration demonstration was helpful. 7% 0% 2% 15% 26% 50%
The sample Items were helpful. 2% 0% 0% 6.5% 32.5% 5%
The questions I had about the new Florida Alternate Assessment were answered. 0% 0% 11% 13% 43% 33%
The materials provided were helpful. 0% 0% 2% 2% 33% 63%
Appendix C—Survey Results 116 2007–08 Florida Alt Technical Report
September 6th No Response 1 2 3 4 5
Overall the training worked well. 2.5% 0% 2.5% 0% 51% 44%
The questions activity was helpful. 0% 0% 0% 5% 51% 44.0%
The Scavenger Hunt Activity was helpful. 0% 0% 0% 12% 49% 39% The overview and manual walk through were helpful. 0% 0% 0% 2.5% 36.5% 61%
The Open Response Activity was helpful. 2% 0% 5% 5% 61% 27%
Seeing the administration demonstration was helpful. 12% 0% 3% 5% 34% 46%
The sample Items were helpful. 0% 0% 0% 2.5% 41.5% 56%
The questions I had about the new Florida Alternate Assessment were answered. 2.5% 2.5% 5% 5% 58% 27%
The materials provided were helpful. 0% 0% 0% 0% 49% 51%
Appendix C—Survey Results 117 2007–08 Florida Alt Technical Report
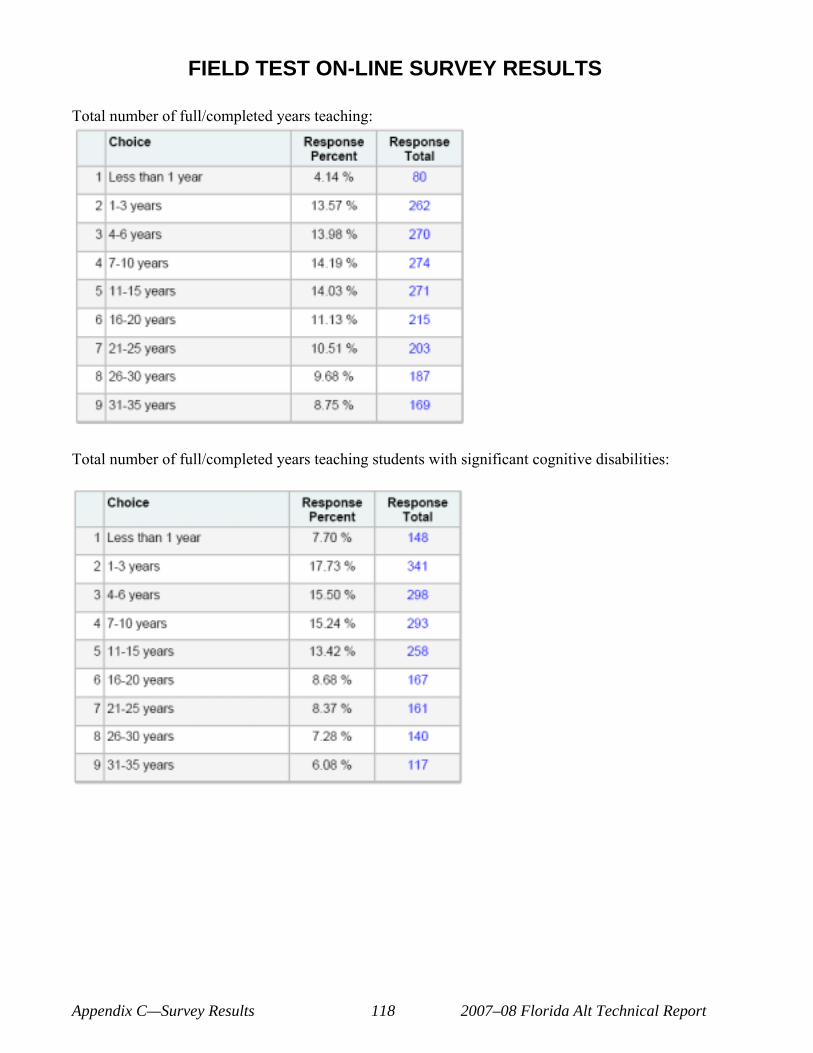
FIELD TEST ON-LINE SURVEY RESULTS
Total number of full/completed years teaching:
Total number of full/completed years teaching students with significant cognitive disabilities:
Appendix C—Survey Results 118 2007–08 Florida Alt Technical Report
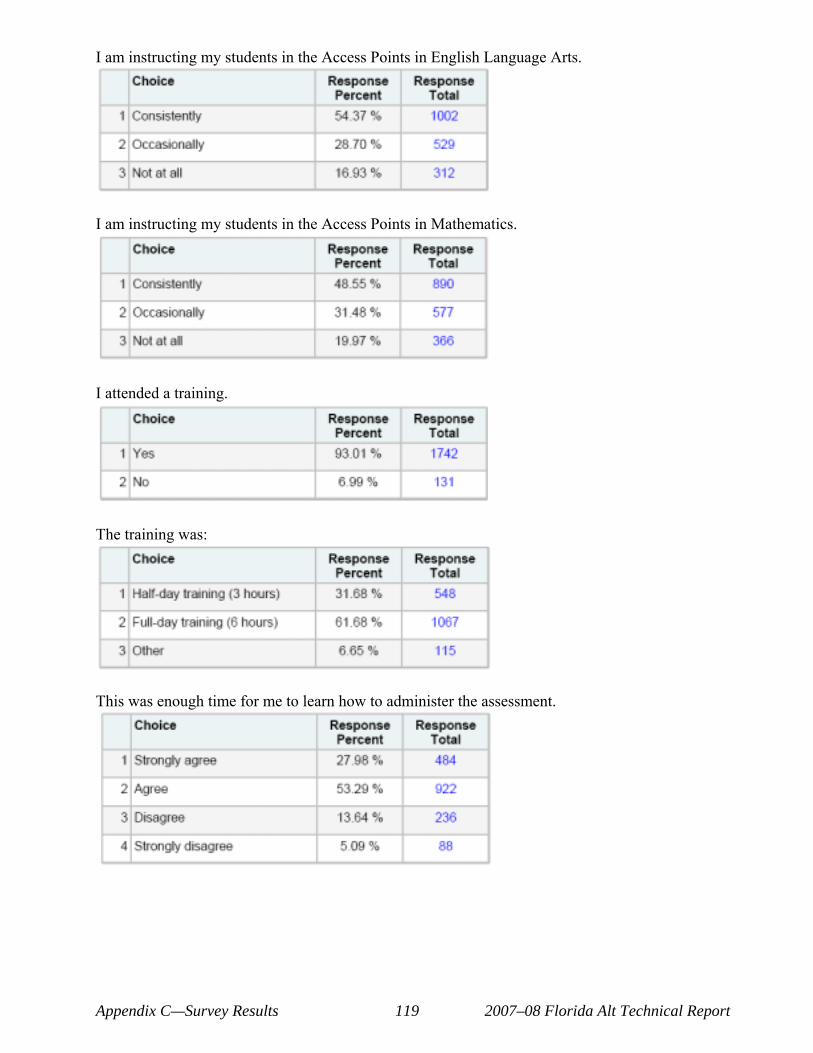
I am instructing my students in the Access Points in English Language Arts.
I am instructing my students in the Access Points in Mathematics.
I attended a training.
The training was:
This was enough time for me to learn how to administer the assessment.
Appendix C—Survey Results 119 2007–08 Florida Alt Technical Report
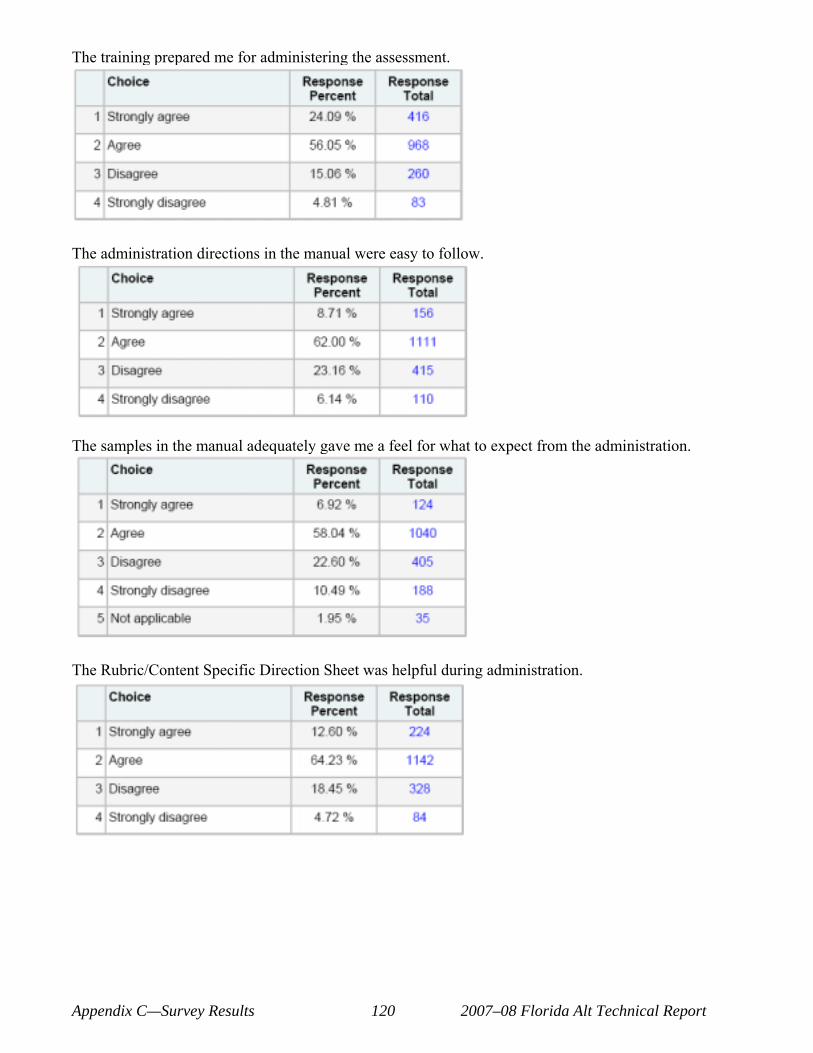
The training prepared me for administering the assessment.
The administration directions in the manual were easy to follow.
The samples in the manual adequately gave me a feel for what to expect from the administration.
The Rubric/Content Specific Direction Sheet was helpful during administration.
Appendix C—Survey Results 120 2007–08 Florida Alt Technical Report
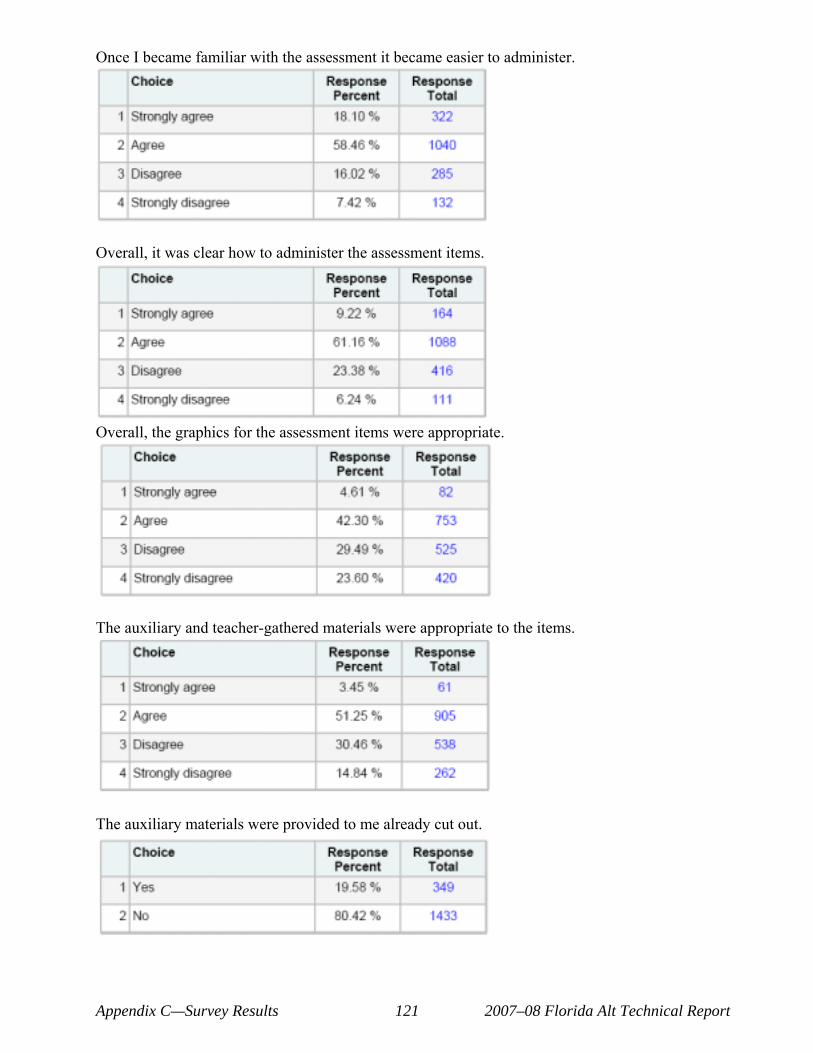
Once I became familiar with the assessment it became easier to administer.
Overall, it was clear how to administer the assessment items.
Overall, the graphics for the assessment items were appropriate.
The auxiliary and teacher-gathered materials were appropriate to the items.
The auxiliary materials were provided to me already cut out.
Appendix C—Survey Results 121 2007–08 Florida Alt Technical Report
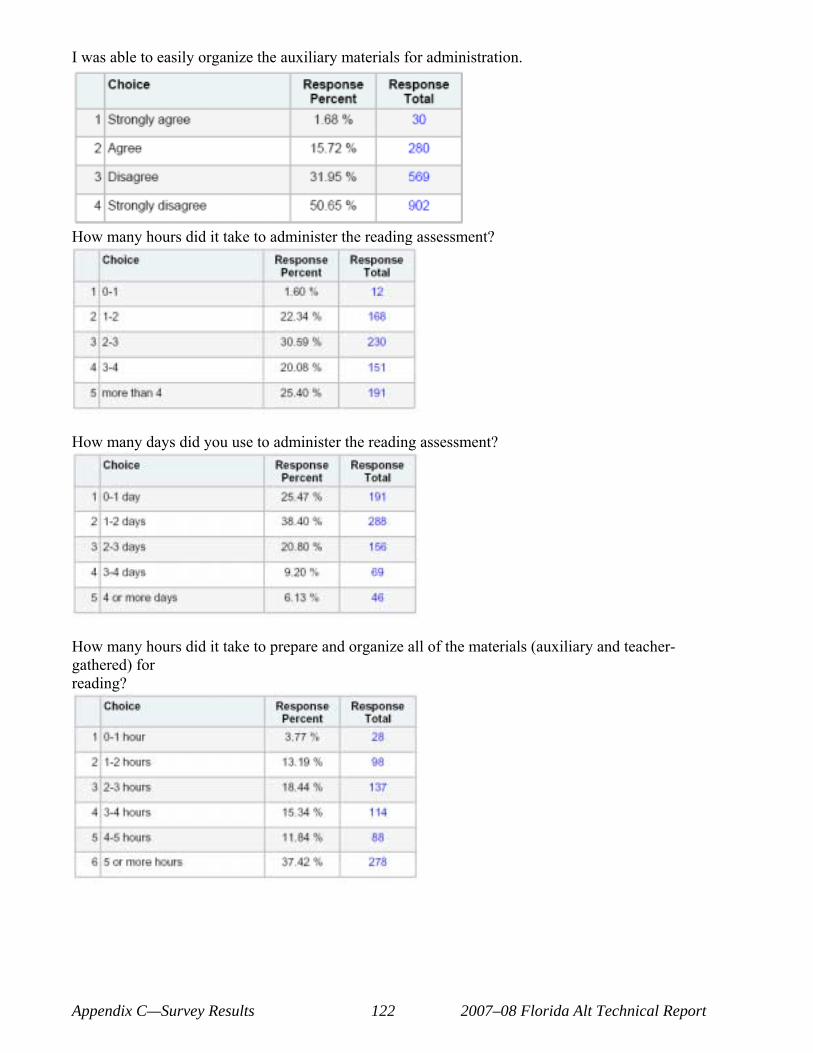
I was able to easily organize the auxiliary materials for administration.
How many hours did it take to administer the reading assessment?
How many days did you use to administer the reading assessment?
How many hours did it take to prepare and organize all of the materials (auxiliary and teacher-gathered) for reading?
Appendix C—Survey Results 122 2007–08 Florida Alt Technical Report
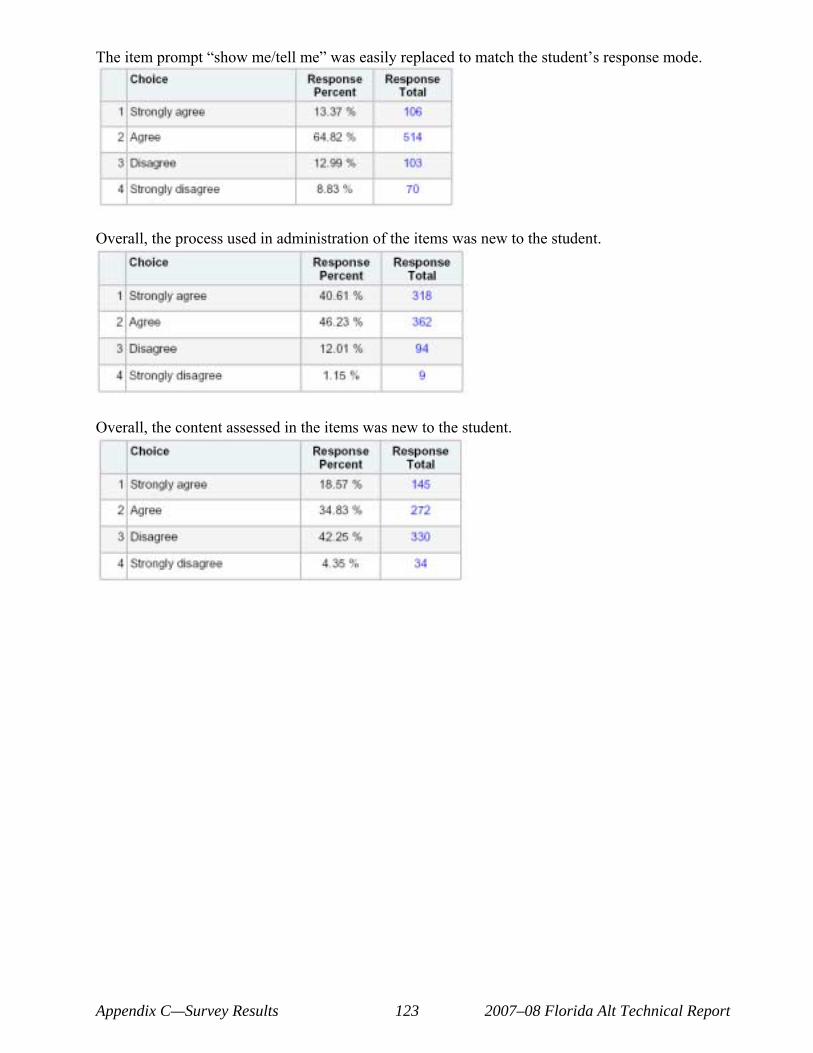
The item prompt —show me/tell me“ was easily replaced to match the student‘s response mode.
Overall, the process used in administration of the items was new to the student.
Overall, the content assessed in the items was new to the student.
Appendix C—Survey Results 123 2007–08 Florida Alt Technical Report
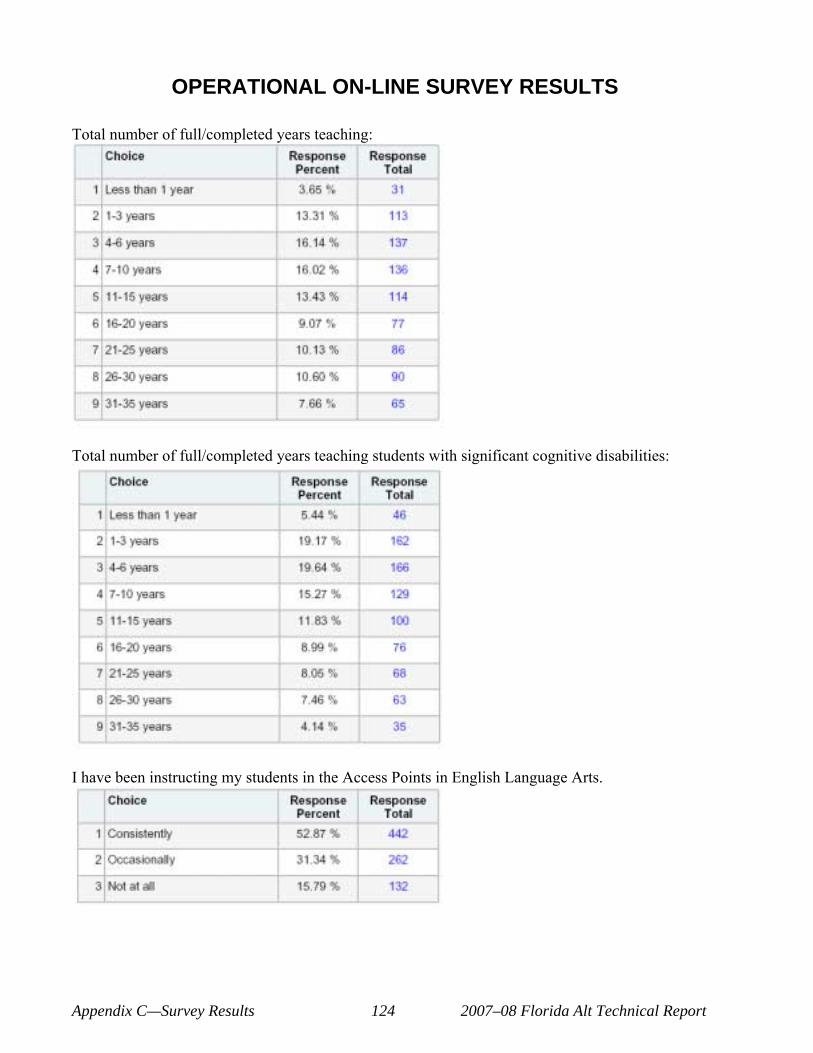
OPERATIONAL ON-LINE SURVEY RESULTS
Total number of full/completed years teaching:
Total number of full/completed years teaching students with significant cognitive disabilities:
I have been instructing my students in the Access Points in English Language Arts.
Appendix C—Survey Results 124 2007–08 Florida Alt Technical Report
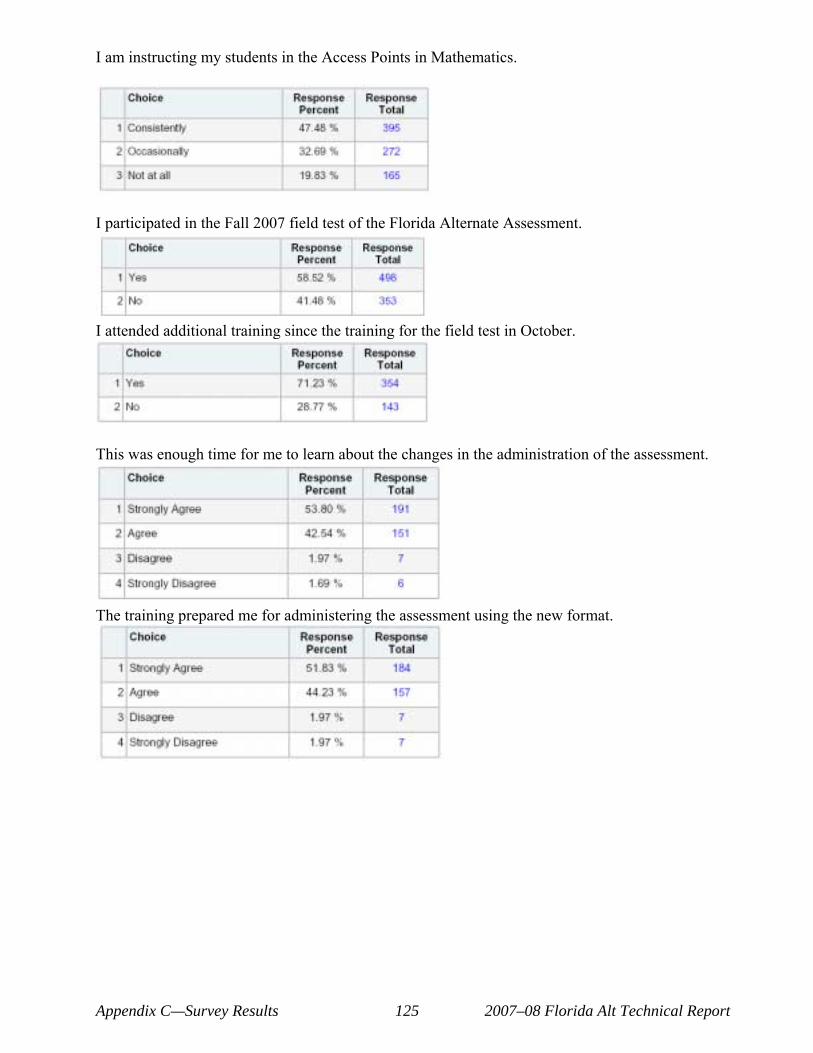
I am instructing my students in the Access Points in Mathematics.
I participated in the Fall 2007 field test of the Florida Alternate Assessment.
I attended additional training since the training for the field test in October.
This was enough time for me to learn about the changes in the administration of the assessment.
The training prepared me for administering the assessment using the new format.
Appendix C—Survey Results 125 2007–08 Florida Alt Technical Report
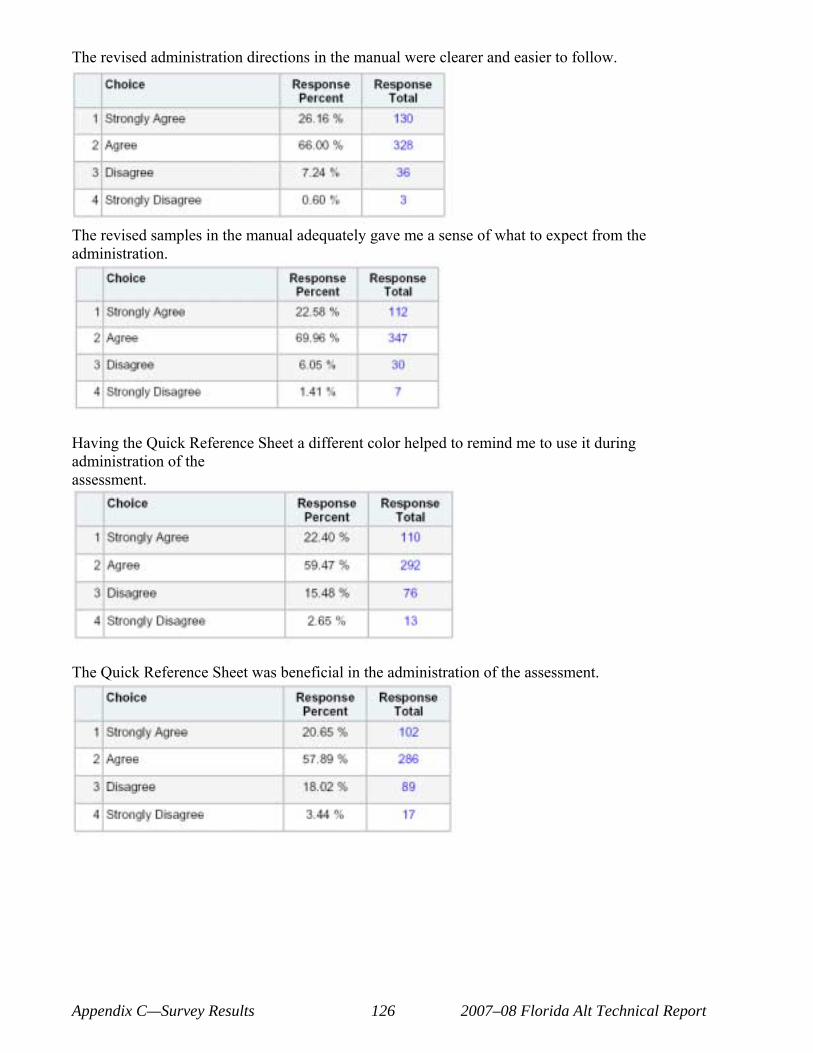
The revised administration directions in the manual were clearer and easier to follow.
The revised samples in the manual adequately gave me a sense of what to expect from the administration.
Having the Quick Reference Sheet a different color helped to remind me to use it during administration of the assessment.
The Quick Reference Sheet was beneficial in the administration of the assessment.
Appendix C—Survey Results 126 2007–08 Florida Alt Technical Report
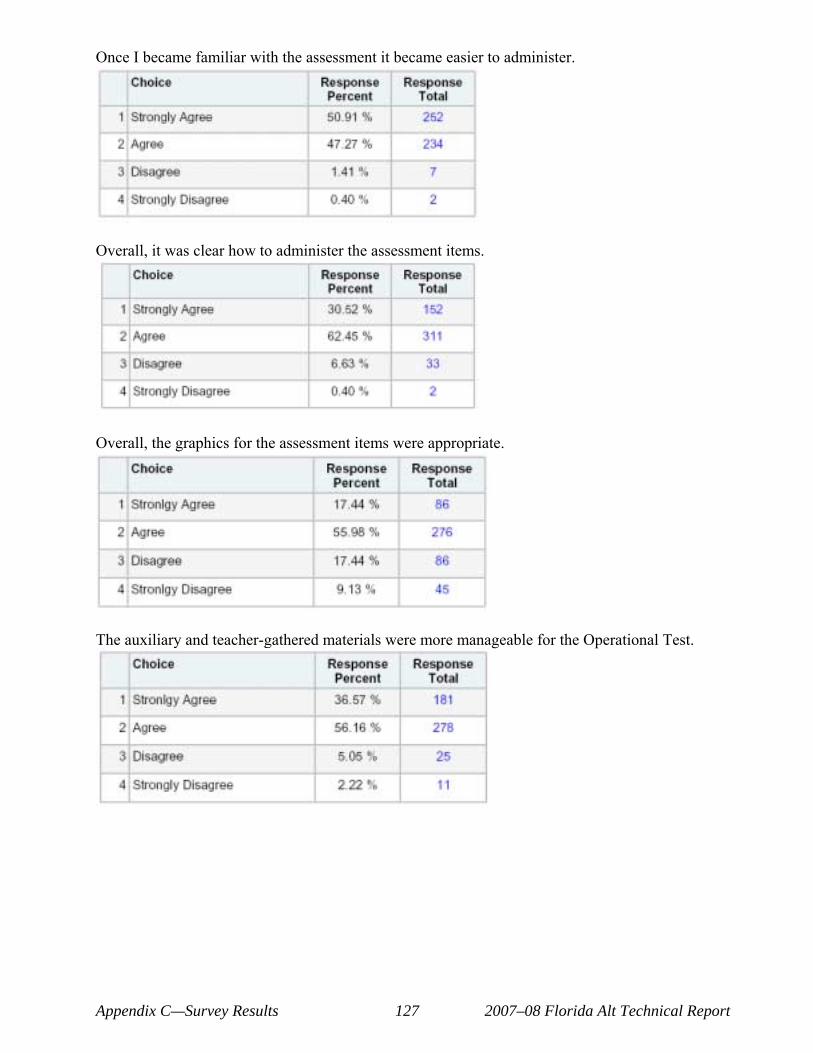
Once I became familiar with the assessment it became easier to administer.
Overall, it was clear how to administer the assessment items.
Overall, the graphics for the assessment items were appropriate.
The auxiliary and teacher-gathered materials were more manageable for the Operational Test.
Appendix C—Survey Results 127 2007–08 Florida Alt Technical Report
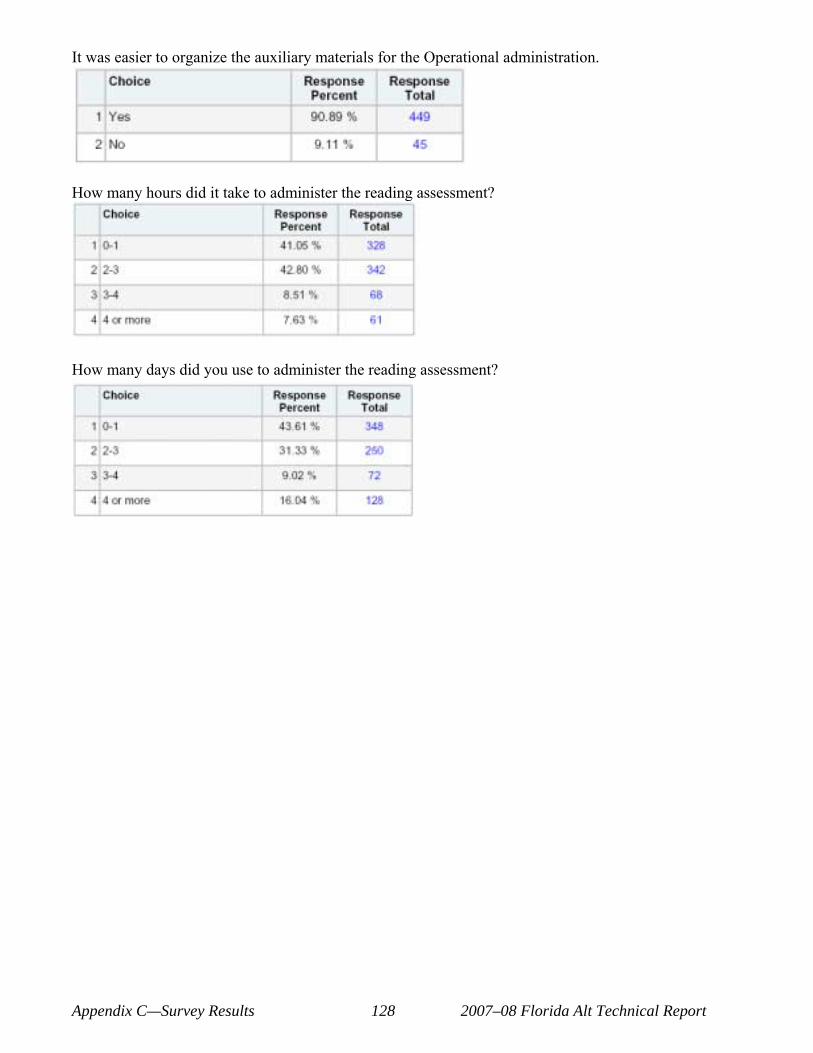
It was easier to organize the auxiliary materials for the Operational administration.
How many hours did it take to administer the reading assessment?
How many days did you use to administer the reading assessment?
Appendix C—Survey Results 128 2007–08 Florida Alt Technical Report
APPENDIX D—SAMPLE ITEM: OPERATIONAL TEST FORMAT
Appendix D—Sample Item Test Format 129 2007–08 Florida Alt Technical Report
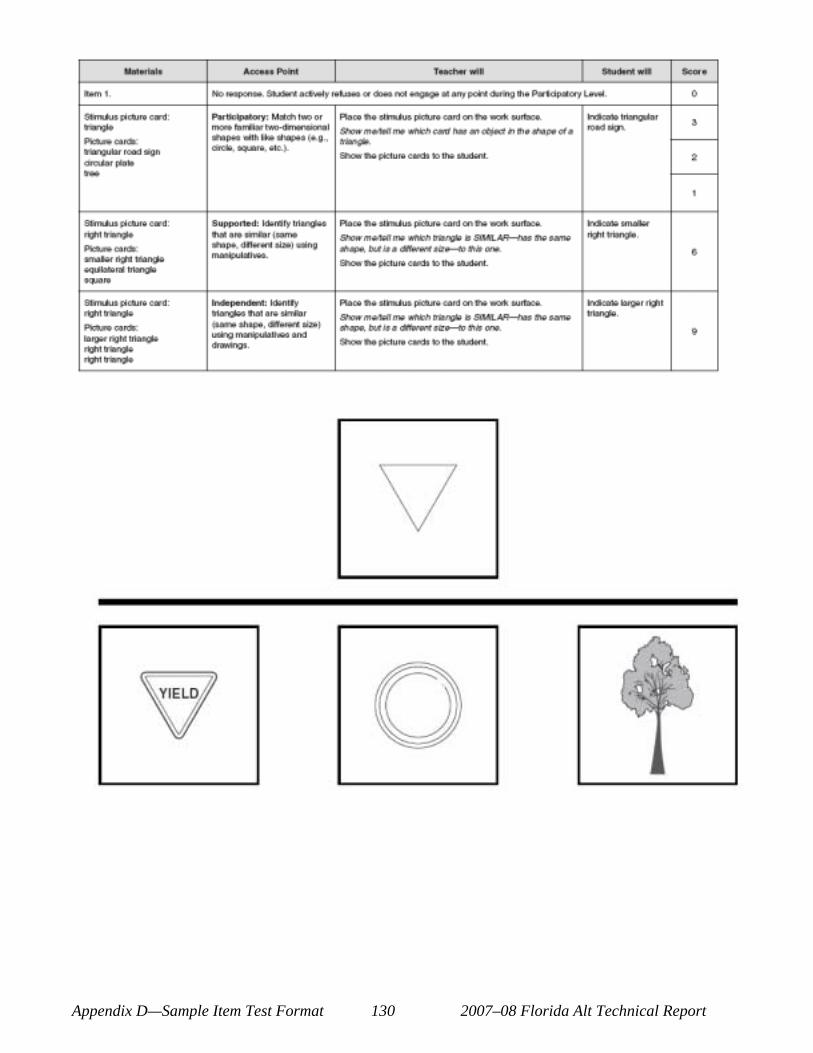
Appendix D—Sample Item Test Format 130 2007–08 Florida Alt Technical Report
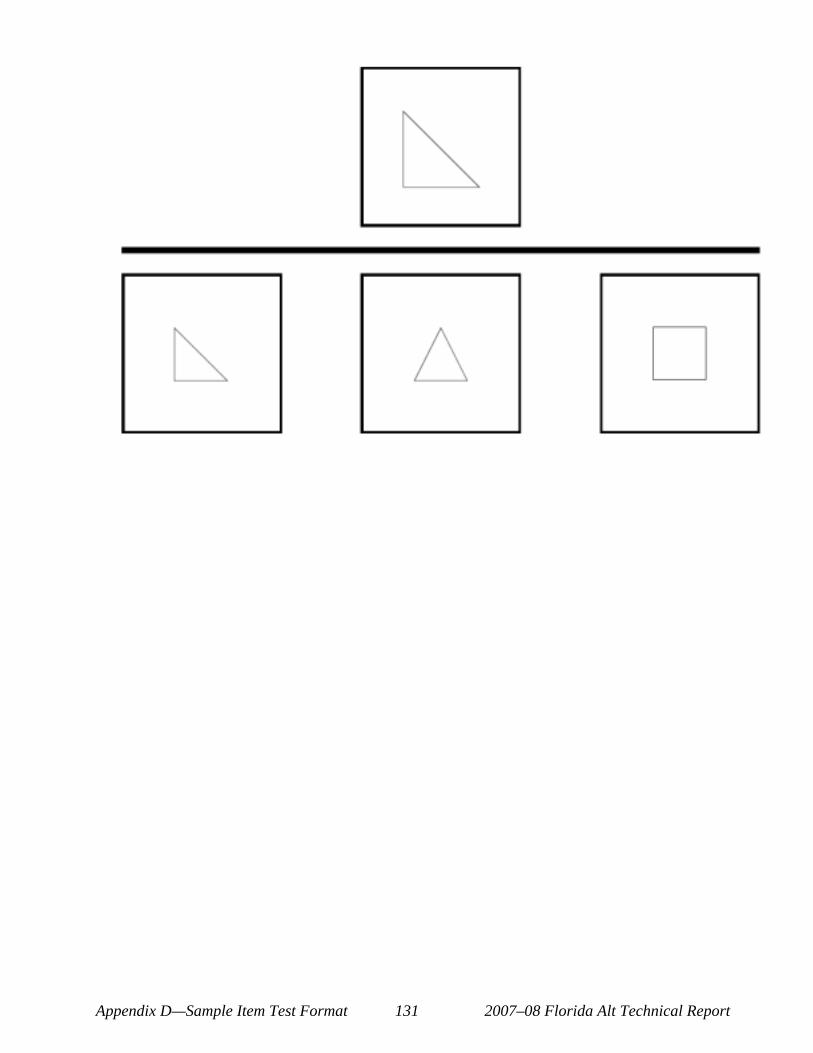
Appendix D—Sample Item Test Format 131 2007–08 Florida Alt Technical Report

APPENDIX E—REPORT SHELLS
Appendix E—Report Shells 133 2007–08 Florida Alt Technical Report

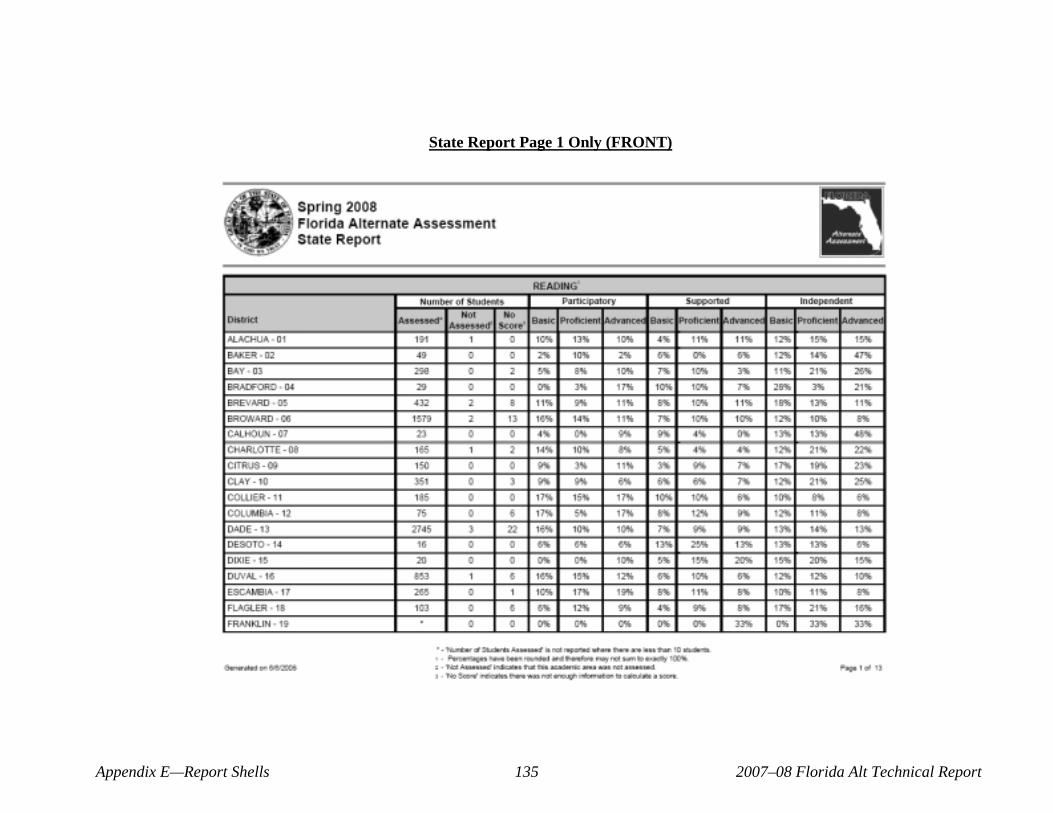
State Report Page 1 Only (FRONT)
Appendix E—Report Shells 135 2007–08 Florida Alt Technical Report
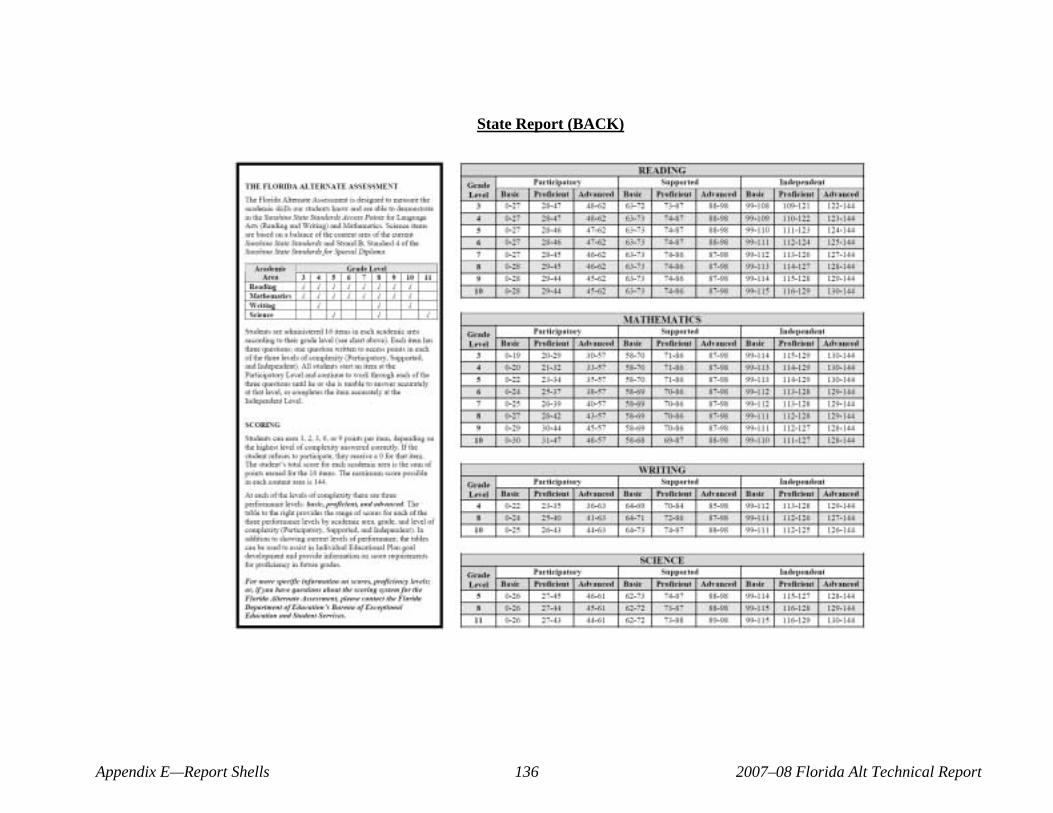
State Report (BACK)
Appendix E—Report Shells 136 2007–08 Florida Alt Technical Report
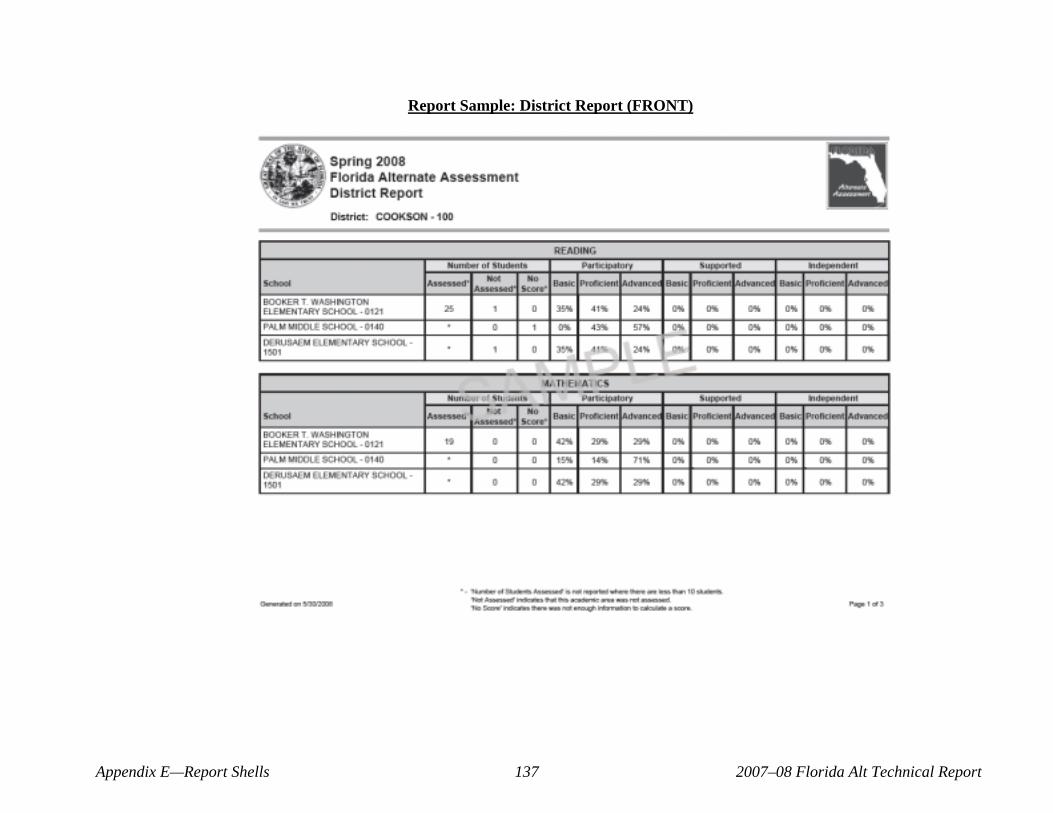
Report Sample: District Report (FRONT)
Appendix E—Report Shells 137 2007–08 Florida Alt Technical Report
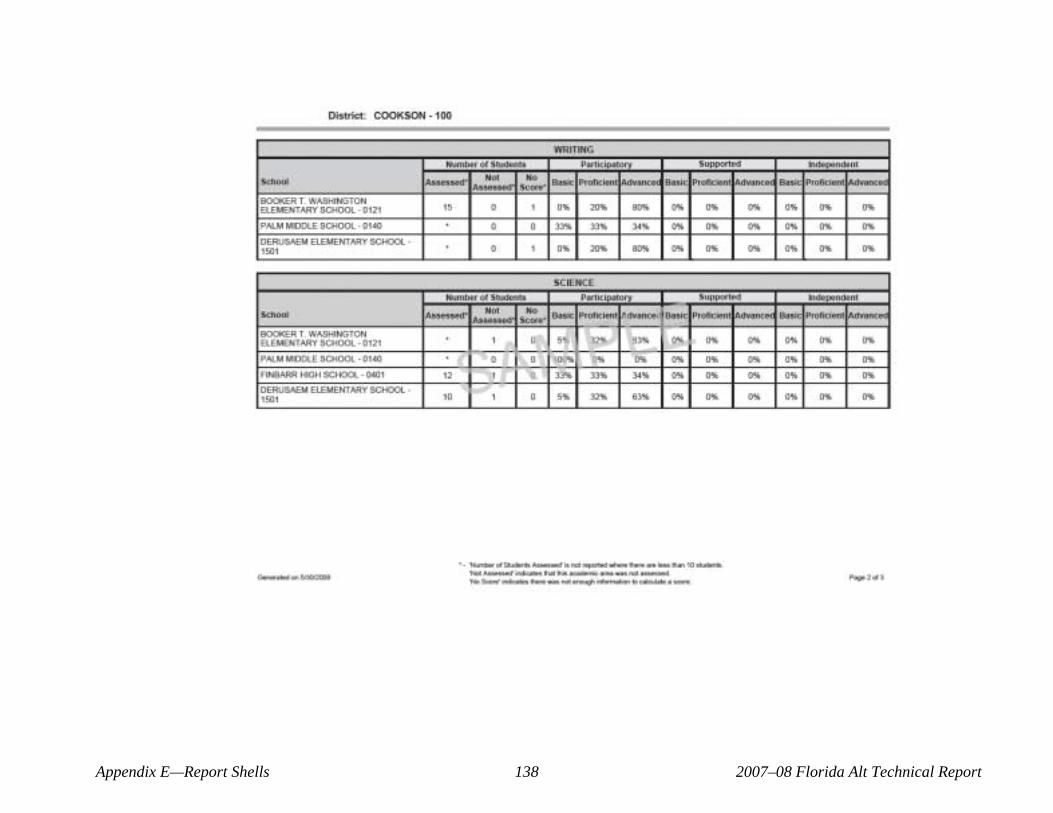
Appendix E—Report Shells 138 2007–08 Florida Alt Technical Report
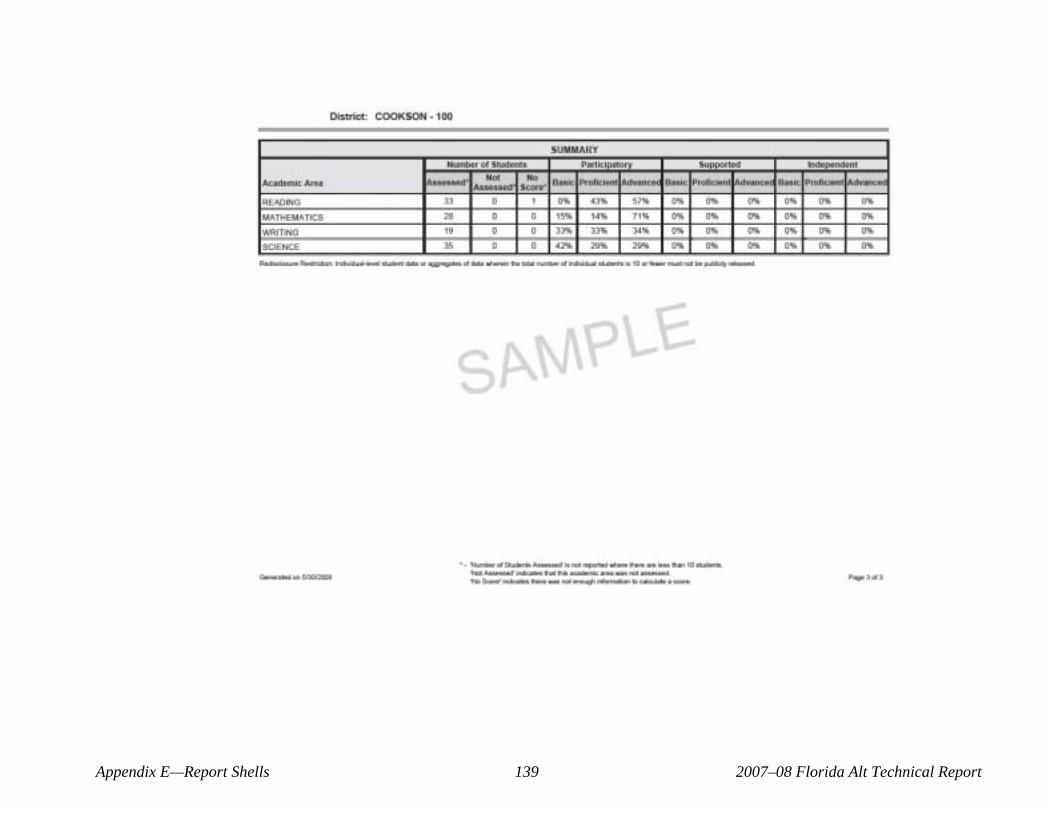
Appendix E—Report Shells 139 2007–08 Florida Alt Technical Report
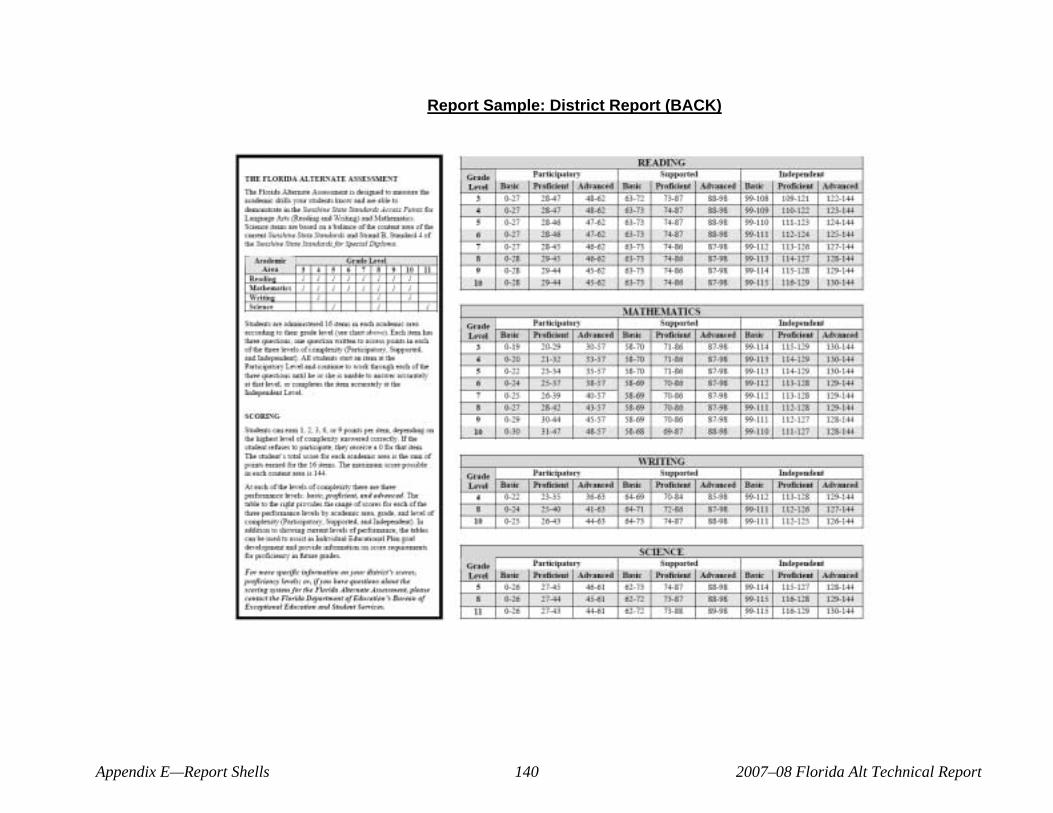
Report Sample: District Report (BACK)
Appendix E—Report Shells 140 2007–08 Florida Alt Technical Report
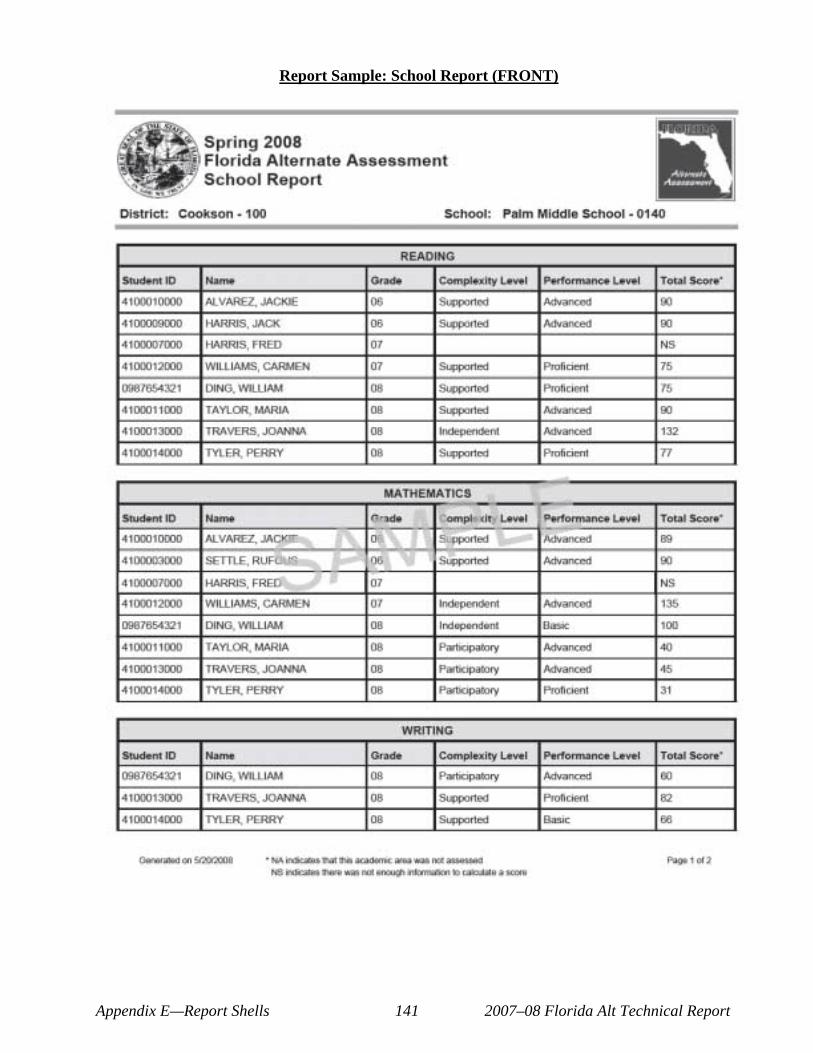
Report Sample: School Report (FRONT)
Appendix E—Report Shells 141 2007–08 Florida Alt Technical Report
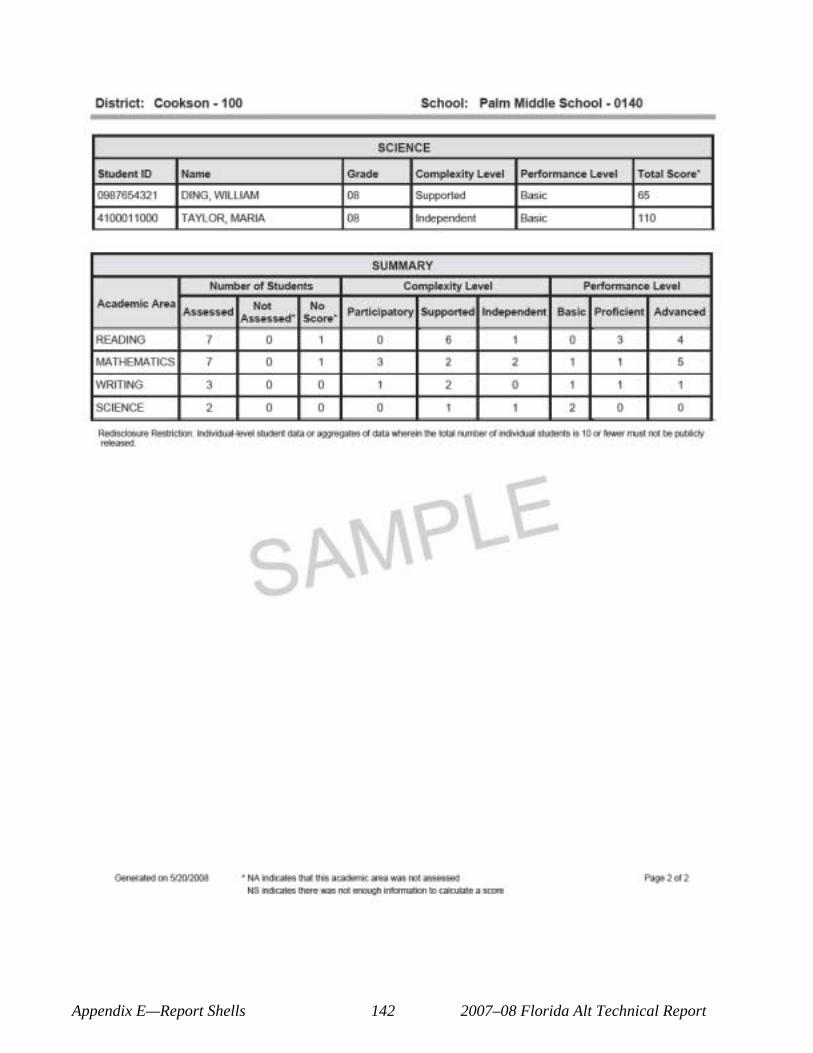
Appendix E—Report Shells 142 2007–08 Florida Alt Technical Report
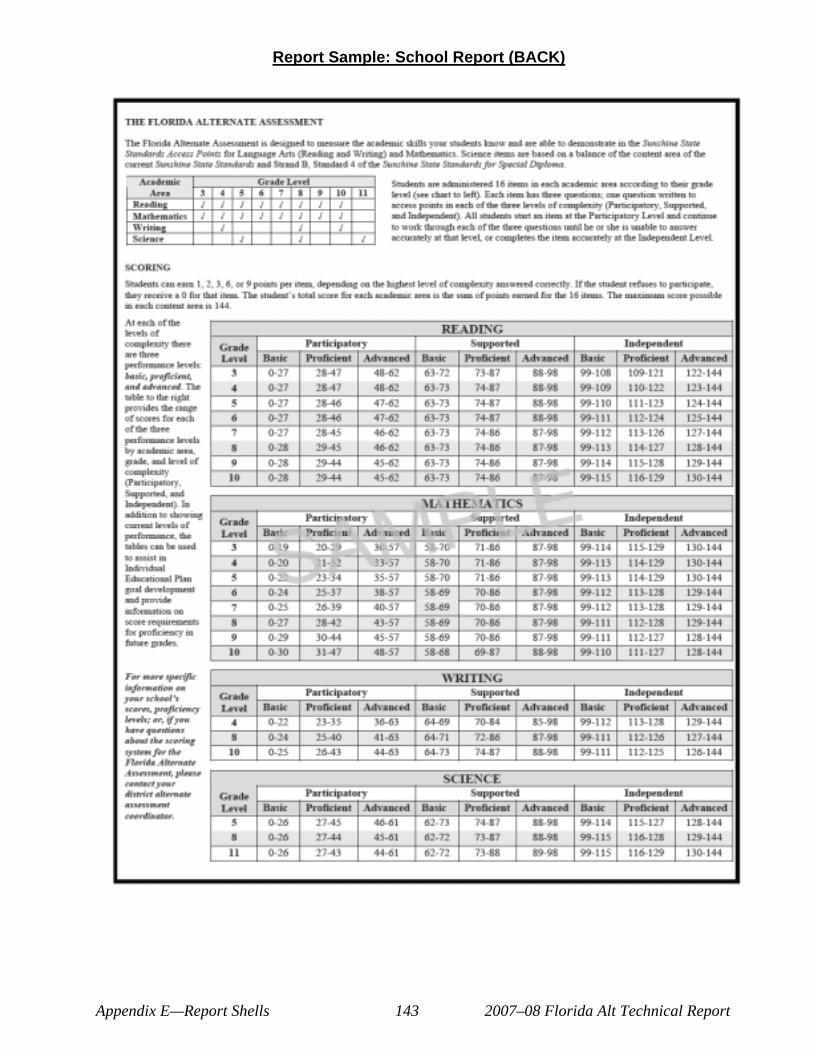
Report Sample: School Report (BACK)
Appendix E—Report Shells 143 2007–08 Florida Alt Technical Report
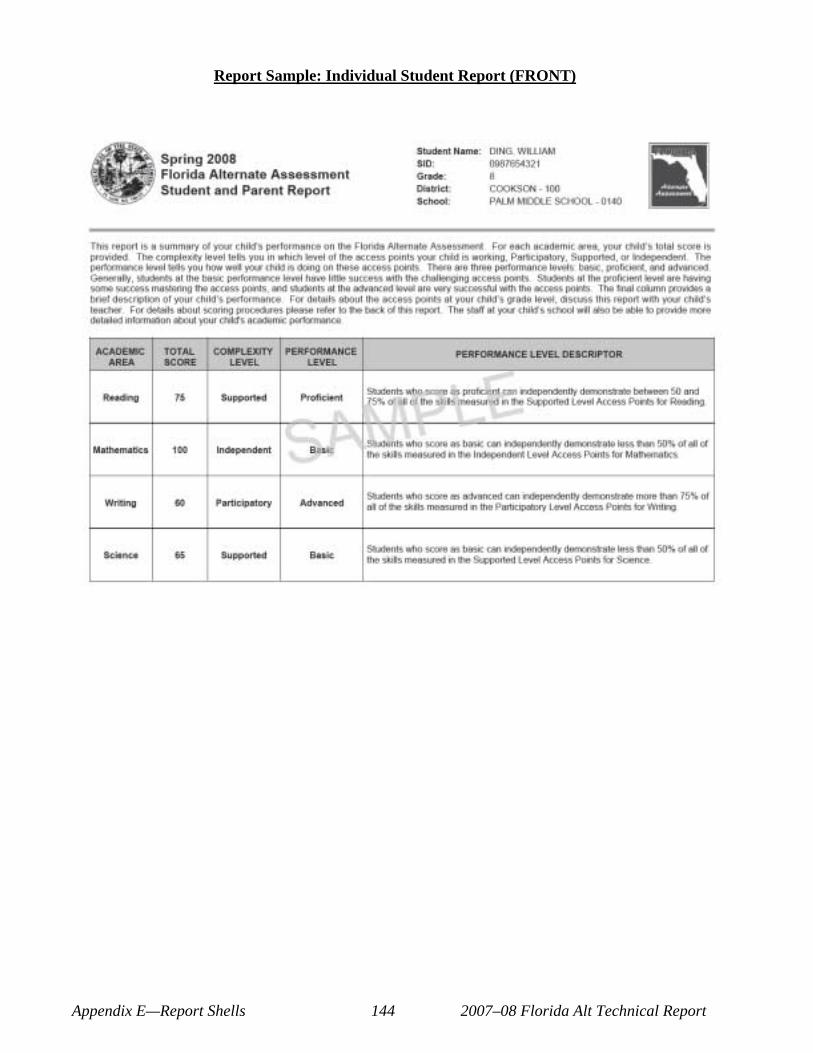
Report Sample: Individual Student Report (FRONT)
Appendix E—Report Shells 144 2007–08 Florida Alt Technical Report
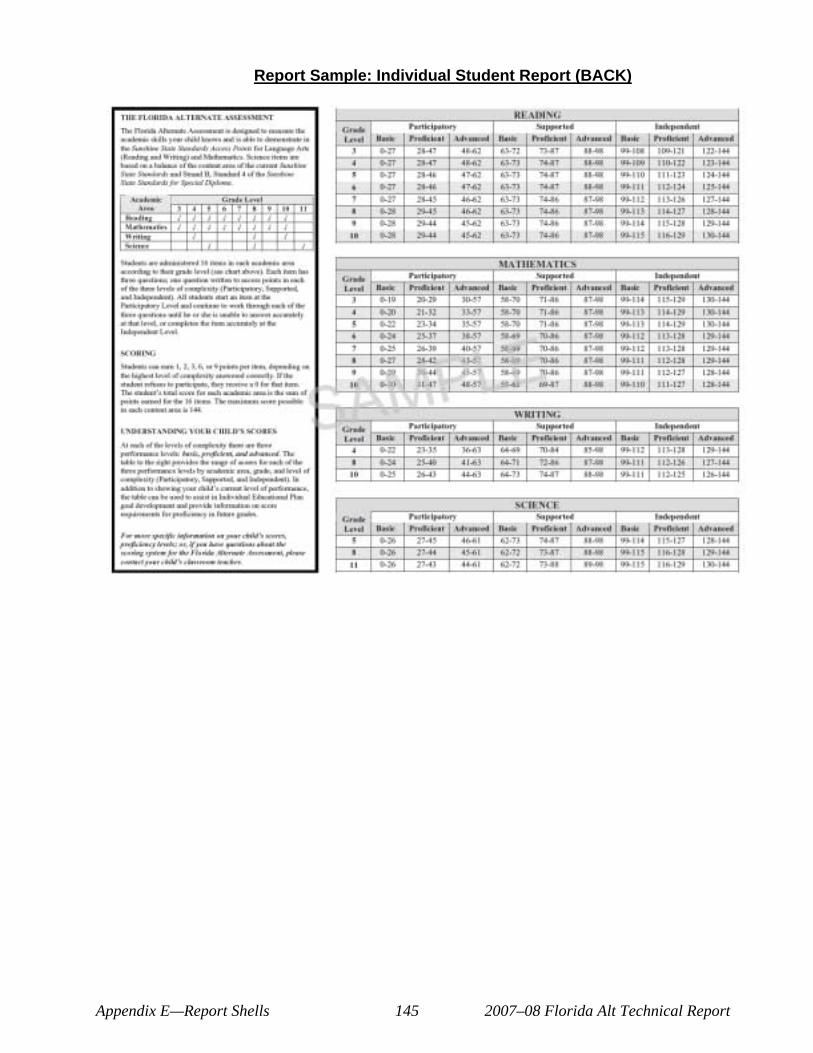
Report Sample: Individual Student Report (BACK)
Appendix E—Report Shells 145 2007–08 Florida Alt Technical Report

APPENDIX F—PARENT AND TEACHER BROCHURES
Appendix F—Parent & Teacher Brochure 147 2007–08 Florida Alt Technical Report
Dr. Eric J. Smith Commissioner of Education
Understanding the
Florida Alternate Assessment
Information for Parents 2007 – 2008
Appendix F—Parent & Teacher Brochure 148 2007–08 Florida Alt Technical Report
How will the assessment results be used? Your child‘s results can be used to: • assist the Individual Educational Plan (IEP) team in developing annual goals and objectives; • inform instructional planning; • improve student achievement in the classroom; • monitor progress from year to year; • determine teacher training needs; and • ensure that students are taught the knowledge and skills outlined in the Sunshine State Standards
Access Points.
What can I do as a parent to prepare my child for the Florida Alternate Assessment? • Make sure that your child is well rested. • Provide your child with a well-rounded diet. This will help ensure a healthy body and a healthy,
active mind. • Encourage your child to do their best.
How can I get more information about the Florida Alternate Assessment? More information about the Florida Alternate Assessment can be obtained by talking to your child‘s teacher or school district‘s ESE Administrator. You can also contact the Florida Department of Education Bureau of Exceptional Education and Student Services at 850.245.0475.
Translations of this publication are available in Spanish and Haitian Creole through your district‘s ESE Administrator, or you can download copies of this brochure at http://www.fldoe.org/ese/.
Appendix F—Parent & Teacher Brochure 149 2007–08 Florida Alt Technical Report
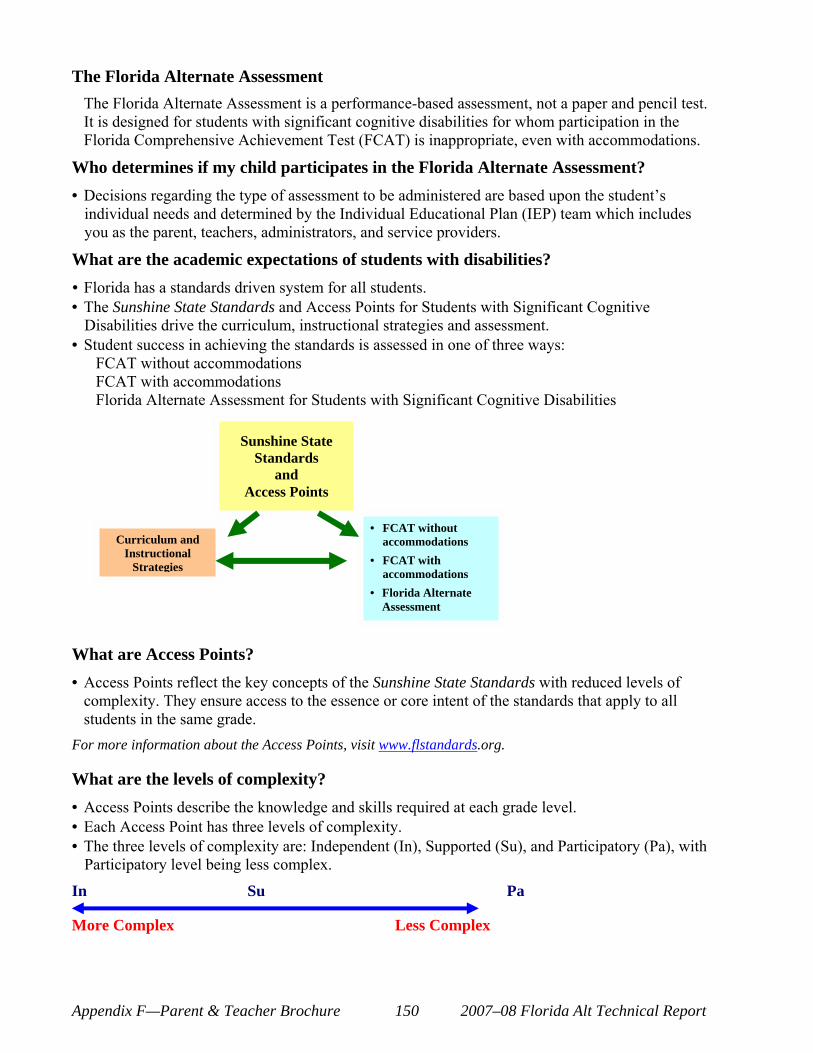
The Florida Alternate Assessment The Florida Alternate Assessment is a performance-based assessment, not a paper and pencil test. It is designed for students with significant cognitive disabilities for whom participation in the Florida Comprehensive Achievement Test (FCAT) is inappropriate, even with accommodations.
Who determines if my child participates in the Florida Alternate Assessment? • Decisions regarding the type of assessment to be administered are based upon the student‘s
individual needs and determined by the Individual Educational Plan (IEP) team which includes you as the parent, teachers, administrators, and service providers.
What are the academic expectations of students with disabilities? • Florida has a standards driven system for all students. • The Sunshine State Standards and Access Points for Students with Significant Cognitive
Disabilities drive the curriculum, instructional strategies and assessment. • Student success in achieving the standards is assessed in one of three ways:
FCAT without accommodations FCAT with accommodations Florida Alternate Assessment for Students with Significant Cognitive Disabilities
Sunshine State Standards
and Access Points
• FCAT without accommodations
• FCAT with accommodations
• Florida Alternate Assessment
Curriculum and Instructional
Strategies
What are Access Points? • Access Points reflect the key concepts of the Sunshine State Standards with reduced levels of
complexity. They ensure access to the essence or core intent of the standards that apply to all students in the same grade.
For more information about the Access Points, visit www.flstandards.org.
What are the levels of complexity? • Access Points describe the knowledge and skills required at each grade level. • Each Access Point has three levels of complexity. • The three levels of complexity are: Independent (In), Supported (Su), and Participatory (Pa), with
Participatory level being less complex.
In Su Pa
More Complex Less Complex
Appendix F—Parent & Teacher Brochure 150 2007–08 Florida Alt Technical Report
Dr. Eric J. Smith Commissioner of Education
Facts About the Florida Alternate Assessment
Information for Teachers
2007 – 2008
Appendix F—Parent & Teacher Brochure 151 2007–08 Florida Alt Technical Report
Who can administer the Florida Alternate Assessment? • The Florida Alternate Assessment is administered to each student individually by the student‘s
special education teacher. If this is not possible, the test administrator must be a certified teacher or other licensed professional who has worked extensively with the student, and is trained in the assessment procedures.
When is the Florida Alternate Assessment Administered? • The Florida Alternate Assessment is administered annually and assesses students in Reading
(grades 3 œ 10), Mathematics (grades 3 œ 10), Writing (grades 4, 8, and 10), and Science (grades 5, 8, and 11).
How can teachers use the assessment results? Results of the Florida Alternate Assessment show educators how students with significant cognitive disabilities are progressing toward learning the knowledge and skills contained in the Sunshine State Standards Access Points.
The results can be used to assist the IEP team in developing annual goals and objectives. The IEP team should examine the results in conjunction with other informationœsuch as progress reports, report cards, and parent and teacher observationsœto see what additional instruction is needed and in what areas.
The results can also be used to improve instructional planning. For example, a student exhibiting skills within the participatory level of complexity at an advanced performance level may be ready for more difficult work and will most likely be instructed on a combination of Access Points at both the participatory and supported levels. Students‘ scores may also indicate a need to have the curriculum adjusted or for students to be provided with additional supports and learning opportunities.
Overall the assessment scores can be used to plan instruction in order to improve student outcomes.
Do the Florida Alternate Assessment results count toward my school making Adequate Yearly Progress (AYP)? Yes, a student‘s alternate assessment score is included in the school and district‘s AYP calculation.
For more information about the Florida Alternate Assessment, contact your school district’s Exceptional Student Education (ESE) Administrator or the Florida Department of Education, Bureau of Exceptional Education and Student Services, at 850.245.0475.
Appendix F—Parent & Teacher Brochure 152 2007–08 Florida Alt Technical Report
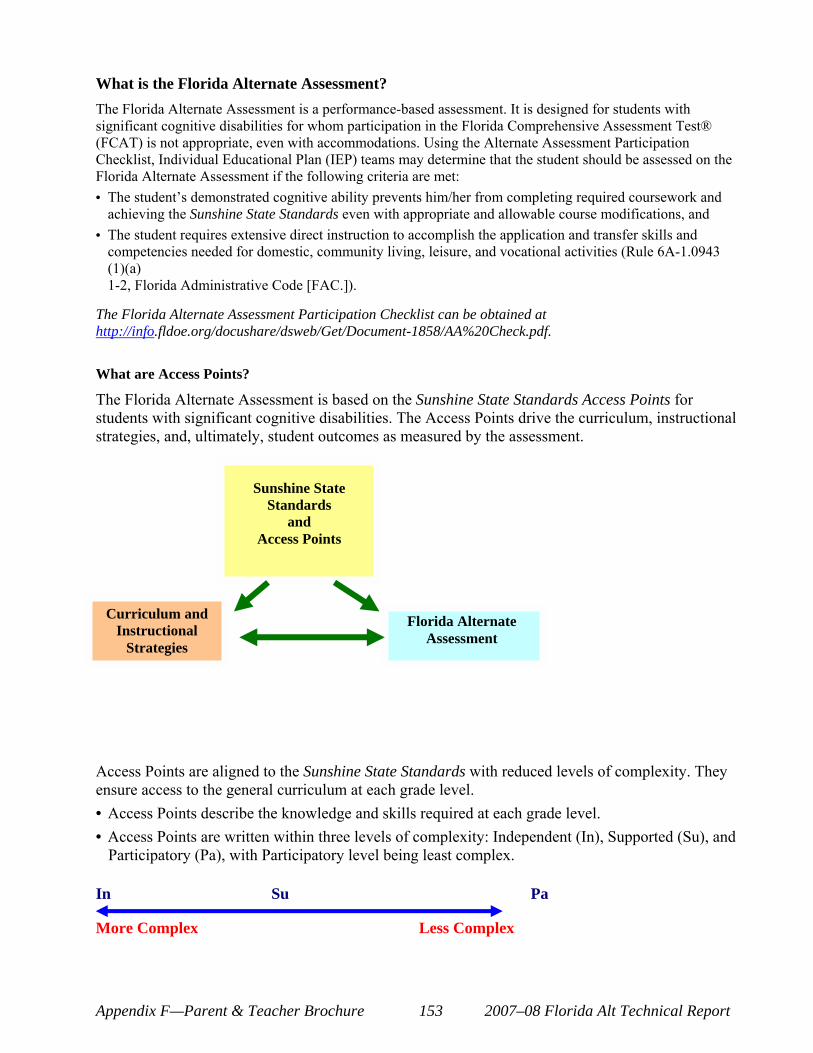
What is the Florida Alternate Assessment? The Florida Alternate Assessment is a performance-based assessment. It is designed for students with significant cognitive disabilities for whom participation in the Florida Comprehensive Assessment Test® (FCAT) is not appropriate, even with accommodations. Using the Alternate Assessment Participation Checklist, Individual Educational Plan (IEP) teams may determine that the student should be assessed on the Florida Alternate Assessment if the following criteria are met: • The student‘s demonstrated cognitive ability prevents him/her from completing required coursework and
achieving the Sunshine State Standards even with appropriate and allowable course modifications, and • The student requires extensive direct instruction to accomplish the application and transfer skills and
competencies needed for domestic, community living, leisure, and vocational activities (Rule 6A-1.0943 (1)(a) 1-2, Florida Administrative Code [FAC.]).
The Florida Alternate Assessment Participation Checklist can be obtained at http://info.fldoe.org/docushare/dsweb/Get/Document-1858/AA%20Check.pdf.
What are Access Points?
The Florida Alternate Assessment is based on the Sunshine State Standards Access Points for students with significant cognitive disabilities. The Access Points drive the curriculum, instructional strategies, and, ultimately, student outcomes as measured by the assessment.
Sunshine State Standards
and Access Points
Florida Alternate Assessment
Curriculum and Instructional
Strategies
Access Points are aligned to the Sunshine State Standards with reduced levels of complexity. They ensure access to the general curriculum at each grade level. • Access Points describe the knowledge and skills required at each grade level. • Access Points are written within three levels of complexity: Independent (In), Supported (Su), and
Participatory (Pa), with Participatory level being least complex.
In Su Pa
More Complex Less Complex
Appendix F—Parent & Teacher Brochure 153 2007–08 Florida Alt Technical Report
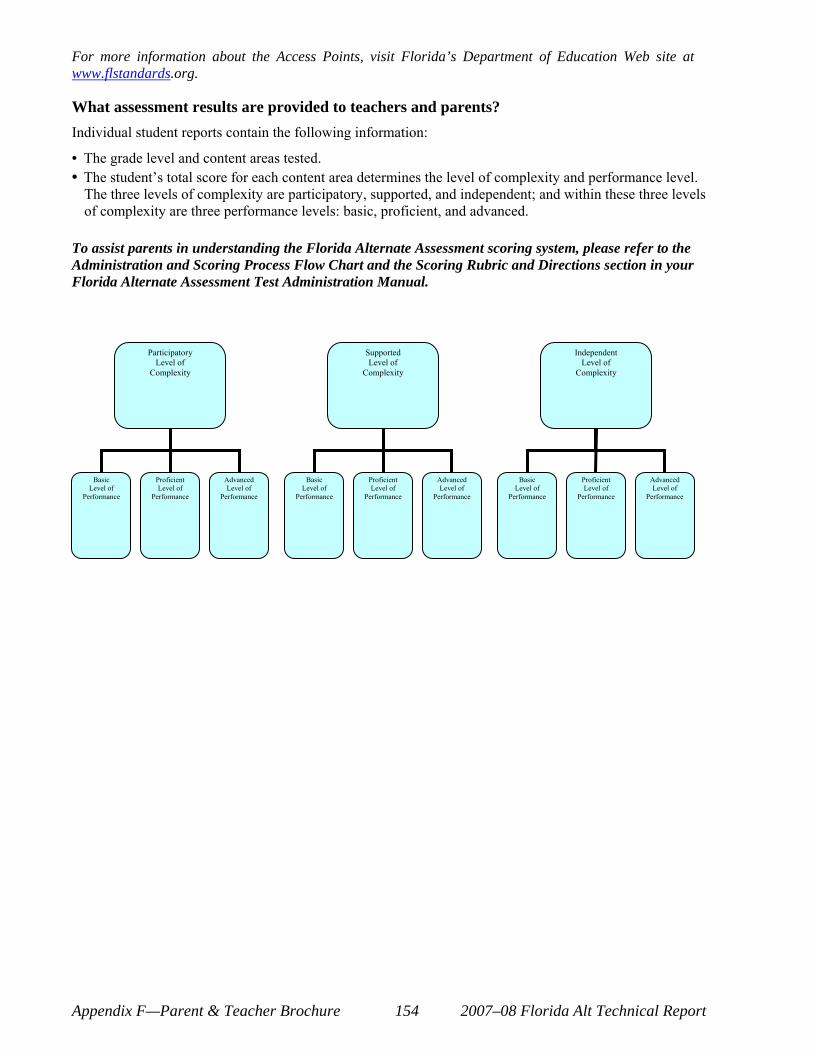
For more information about the Access Points, visit Florida’s Department of Education Web site at www.flstandards.org.
What assessment results are provided to teachers and parents? Individual student reports contain the following information:
• The grade level and content areas tested. • The student‘s total score for each content area determines the level of complexity and performance level.
The three levels of complexity are participatory, supported, and independent; and within these three levels of complexity are three performance levels: basic, proficient, and advanced.
To assist parents in understanding the Florida Alternate Assessment scoring system, please refer to the Administration and Scoring Process Flow Chart and the Scoring Rubric and Directions section in your Florida Alternate Assessment Test Administration Manual.
Participatory Level of
Complexity
Basic Level of
Performance
Proficient Level of
Performance
Advanced Level of
Performance
Supported Level of
Complexity
Basic Level of
Performance
Proficient Level of
Performance
Advanced Level of
Performance
Independent Level of
Complexity
Basic Level of
Performance
Proficient Level of
Performance
Advanced Level of
Performance
Appendix F—Parent & Teacher Brochure 154 2007–08 Florida Alt Technical Report
APPENDIX G—ITEM SPECIFICATIONS DOCUMENT
Appendix G—Item Specifications Document 155 2007–08 Florida Alt Technical Report

Appendix G—Item Specifications Document 156 2007–08 Florida Alt Technical Report
Florida Alternate Assessment Test Designs, Blueprints and Item Specifications for
Reading, Writing, Mathematics and Science
May 2007
Prepared by Measured Progress for the Florida Department of Education
Appendix G—Item Specifications Document 157 2007–08 Florida Alt Technical Report
Table of Contents
Overview ………………………………………………………………………….. 1
Items ………………………………………………………………………………. 2
Test Booklet Components Item Components Depth of Knowledge
Number of Items by Content and Grade Level
Reading …………………………………………………………………………… 6
Design Blueprint Passage Specifications
Writing …………………………………………………………………………….. 13
Design Blueprint
Mathematics ……………………………………………………………………... 16
Design Blueprint
Science …………………………………………………………………………… 20
Design Blueprint
Item Specifications ……………………………………………………………. 23
Appendix G—Item Specifications Document 158 2007–08 Florida Alt Technical Report
Overview
The new alternate assessment design for Florida is based on the revised Sunshine State Standards with three levels of access points (independent, supported, and participatory), to provide a tiered entry to the assessment for students at the various levels. This is critical as educators seek to provide access to the general education curriculum and foster higher expectations for the wide diversity of students with significant cognitive disabilities.
These assessments will contain primarily performance tasks made up of selected response options and some open response options. We therefore propose to use the access points to develop an assessment blueprint that will serve as the foundation for structured student performance tasks. Our proposed design is an innovative approach that provides test administrators with structured tasks comprised of item sets that reflect typical classroom activities and embed items frequently containing three response options for students to select with the communication systems they normally use.
Appendix G—Item Specifications Document 159 2007–08 Florida Alt Technical Report
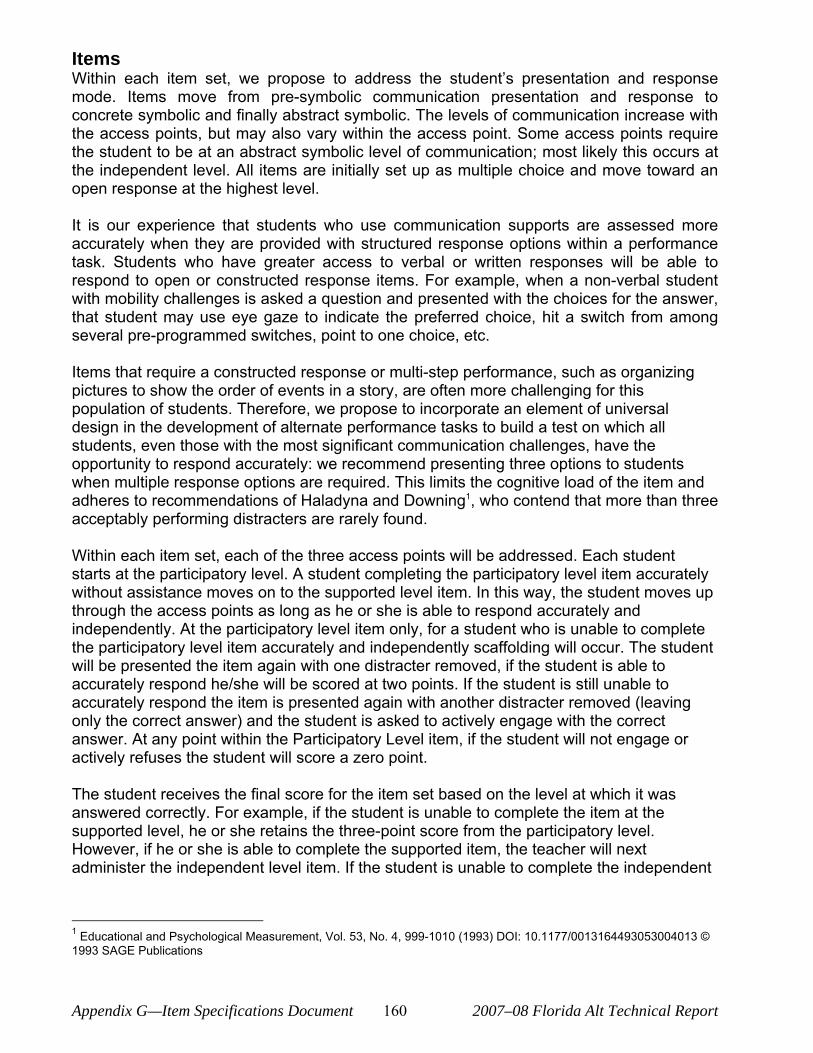
Items Within each item set, we propose to address the student‘s presentation and response mode. Items move from pre-symbolic communication presentation and response to concrete symbolic and finally abstract symbolic. The levels of communication increase with the access points, but may also vary within the access point. Some access points require the student to be at an abstract symbolic level of communication; most likely this occurs at the independent level. All items are initially set up as multiple choice and move toward an open response at the highest level.
It is our experience that students who use communication supports are assessed more accurately when they are provided with structured response options within a performance task. Students who have greater access to verbal or written responses will be able to respond to open or constructed response items. For example, when a non-verbal student with mobility challenges is asked a question and presented with the choices for the answer, that student may use eye gaze to indicate the preferred choice, hit a switch from among several pre-programmed switches, point to one choice, etc.
Items that require a constructed response or multi-step performance, such as organizing pictures to show the order of events in a story, are often more challenging for this population of students. Therefore, we propose to incorporate an element of universal design in the development of alternate performance tasks to build a test on which all students, even those with the most significant communication challenges, have the opportunity to respond accurately: we recommend presenting three options to students when multiple response options are required. This limits the cognitive load of the item and adheres to recommendations of Haladyna and Downing1, who contend that more than three acceptably performing distracters are rarely found.
Within each item set, each of the three access points will be addressed. Each student starts at the participatory level. A student completing the participatory level item accurately without assistance moves on to the supported level item. In this way, the student moves up through the access points as long as he or she is able to respond accurately and independently. At the participatory level item only, for a student who is unable to complete the participatory level item accurately and independently scaffolding will occur. The student will be presented the item again with one distracter removed, if the student is able to accurately respond he/she will be scored at two points. If the student is still unable to accurately respond the item is presented again with another distracter removed (leaving only the correct answer) and the student is asked to actively engage with the correct answer. At any point within the Participatory Level item, if the student will not engage or actively refuses the student will score a zero point.
The student receives the final score for the item set based on the level at which it was answered correctly. For example, if the student is unable to complete the item at the supported level, he or she retains the three-point score from the participatory level. However, if he or she is able to complete the supported item, the teacher will next administer the independent level item. If the student is unable to complete the independent
1 Educational and Psychological Measurement, Vol. 53, No. 4, 999-1010 (1993) DOI: 10.1177/0013164493053004013 © 1993 SAGE Publications
Appendix G—Item Specifications Document 160 2007–08 Florida Alt Technical Report
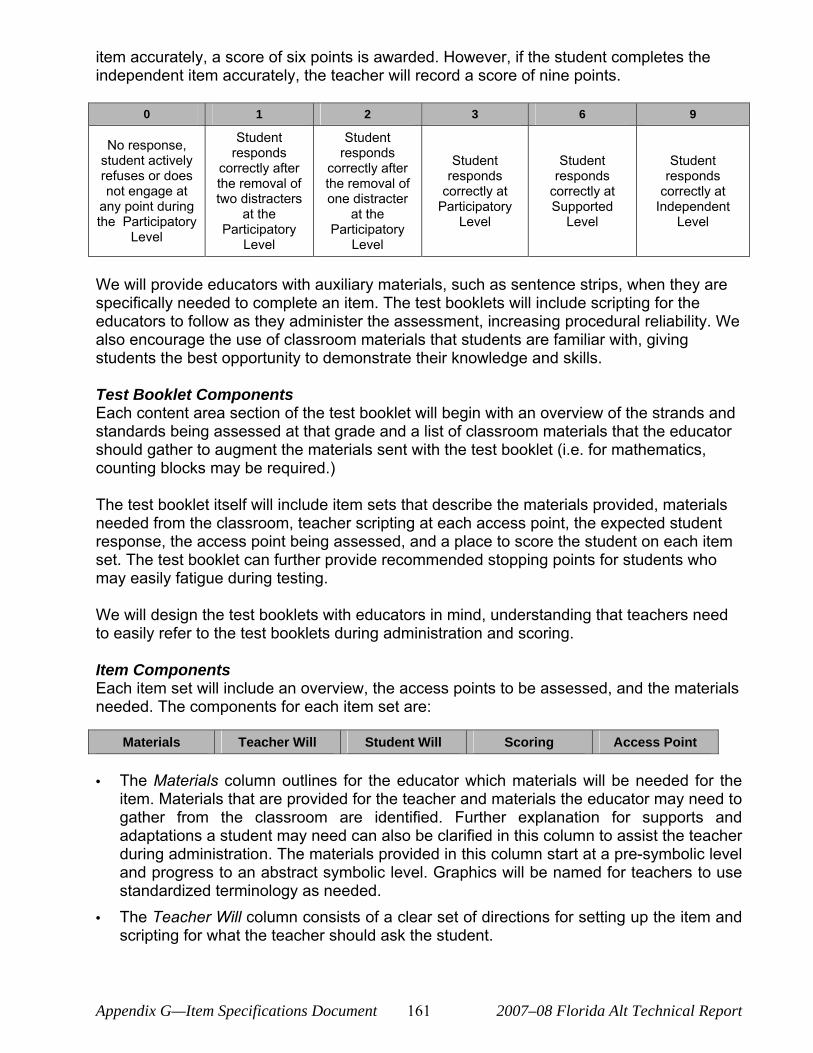
item accurately, a score of six points is awarded. However, if the student completes the independent item accurately, the teacher will record a score of nine points.
0 1 2 3 6 9
No response, student actively refuses or does not engage at
any point during the Participatory
Level
Student responds
correctly after the removal of two distracters
at the Participatory
Level
Student responds
correctly after the removal of one distracter
at the Participatory
Level
Student responds
correctly at Participatory
Level
Student responds
correctly at Supported
Level
Student responds
correctly at Independent
Level
We will provide educators with auxiliary materials, such as sentence strips, when they are specifically needed to complete an item. The test booklets will include scripting for the educators to follow as they administer the assessment, increasing procedural reliability. We also encourage the use of classroom materials that students are familiar with, giving students the best opportunity to demonstrate their knowledge and skills.
Test Booklet Components Each content area section of the test booklet will begin with an overview of the strands and standards being assessed at that grade and a list of classroom materials that the educator should gather to augment the materials sent with the test booklet (i.e. for mathematics, counting blocks may be required.)
The test booklet itself will include item sets that describe the materials provided, materials needed from the classroom, teacher scripting at each access point, the expected student response, the access point being assessed, and a place to score the student on each item set. The test booklet can further provide recommended stopping points for students who may easily fatigue during testing.
We will design the test booklets with educators in mind, understanding that teachers need to easily refer to the test booklets during administration and scoring.
Item Components Each item set will include an overview, the access points to be assessed, and the materials needed. The components for each item set are:
Materials Teacher Will Student Will Scoring Access Point
• The Materials column outlines for the educator which materials will be needed for the item. Materials that are provided for the teacher and materials the educator may need to gather from the classroom are identified. Further explanation for supports and adaptations a student may need can also be clarified in this column to assist the teacher during administration. The materials provided in this column start at a pre-symbolic level and progress to an abstract symbolic level. Graphics will be named for teachers to use standardized terminology as needed.
• The Teacher Will column consists of a clear set of directions for setting up the item and scripting for what the teacher should ask the student.
Appendix G—Item Specifications Document 161 2007–08 Florida Alt Technical Report
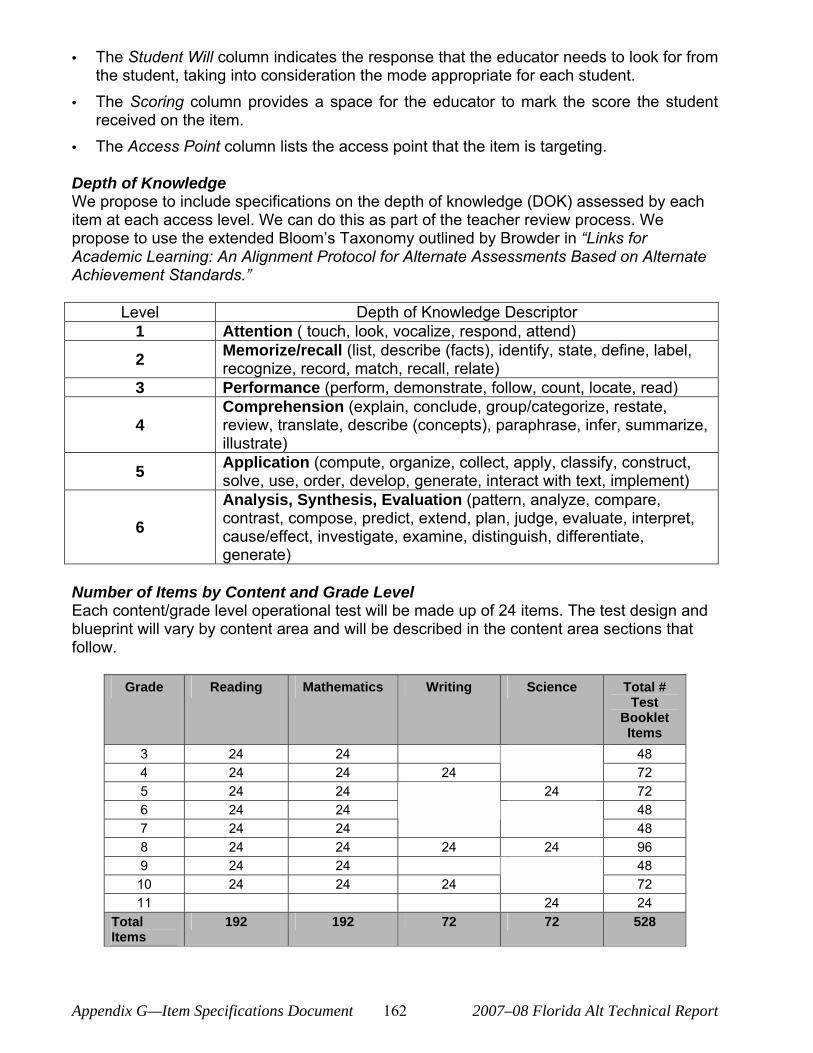
• The Student Will column indicates the response that the educator needs to look for from the student, taking into consideration the mode appropriate for each student.
• The Scoring column provides a space for the educator to mark the score the student received on the item.
• The Access Point column lists the access point that the item is targeting.
Depth of Knowledge We propose to include specifications on the depth of knowledge (DOK) assessed by each item at each access level. We can do this as part of the teacher review process. We propose to use the extended Bloom‘s Taxonomy outlined by Browder in —Links for Academic Learning: An Alignment Protocol for Alternate Assessments Based on Alternate Achievement Standards.“
Level Depth of Knowledge Descriptor 1 Attention ( touch, look, vocalize, respond, attend)
2 Memorize/recall (list, describe (facts), identify, state, define, label, recognize, record, match, recall, relate)
3 Performance (perform, demonstrate, follow, count, locate, read)
4 Comprehension (explain, conclude, group/categorize, restate, review, translate, describe (concepts), paraphrase, infer, summarize, illustrate)
5 Application (compute, organize, collect, apply, classify, construct, solve, use, order, develop, generate, interact with text, implement)
6 Analysis, Synthesis, Evaluation (pattern, analyze, compare, contrast, compose, predict, extend, plan, judge, evaluate, interpret, cause/effect, investigate, examine, distinguish, differentiate, generate)
Number of Items by Content and Grade Level Each content/grade level operational test will be made up of 24 items. The test design and blueprint will vary by content area and will be described in the content area sections that follow.
Grade Reading Mathematics Writing Science Total # Test
Booklet Items
3 24 24 48 4 24 24 24 72 5 24 24 24 72 6 24 24 48 7 24 24 48 8 24 24 24 24 96 9 24 24 48 10 24 24 24 72 11 24 24
Total Items
192 192 72 72 528
Appendix G—Item Specifications Document 162 2007–08 Florida Alt Technical Report
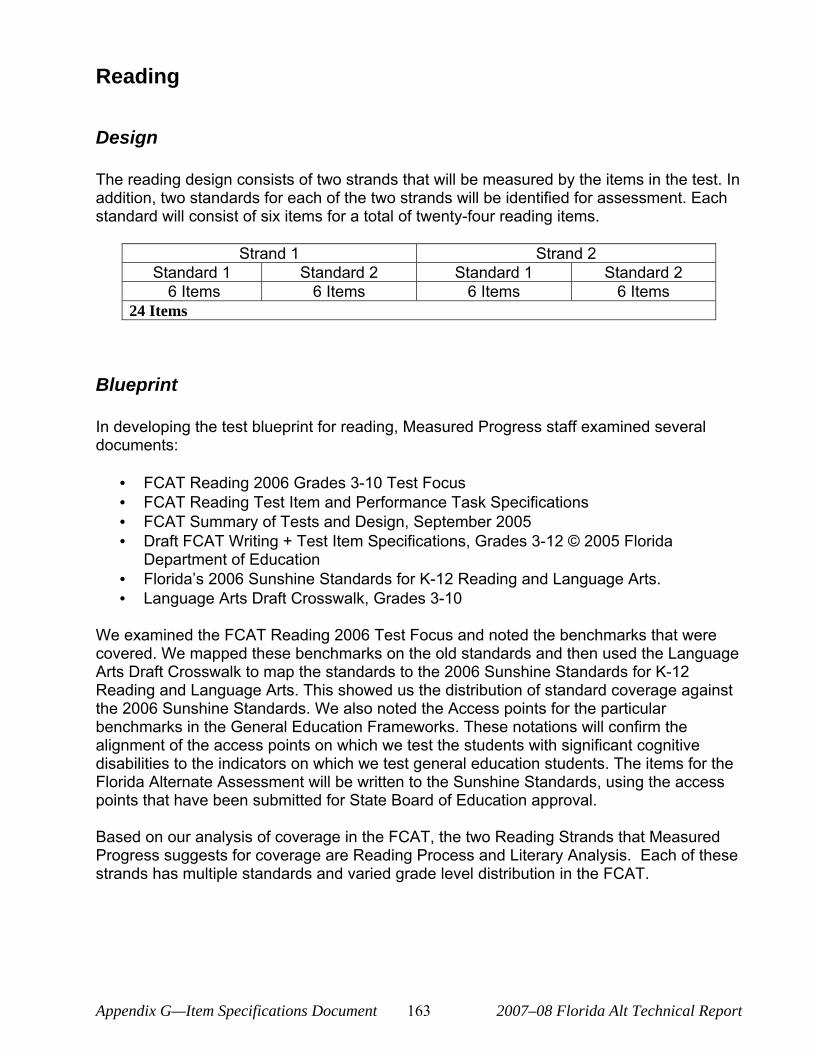
Reading
Design
The reading design consists of two strands that will be measured by the items in the test. In addition, two standards for each of the two strands will be identified for assessment. Each standard will consist of six items for a total of twenty-four reading items.
Strand 1 Strand 2 Standard 1 Standard 2 Standard 1 Standard 2
6 Items 6 Items 6 Items 6 Items 24 Items
Blueprint
In developing the test blueprint for reading, Measured Progress staff examined several documents:
• FCAT Reading 2006 Grades 3-10 Test Focus • FCAT Reading Test Item and Performance Task Specifications • FCAT Summary of Tests and Design, September 2005 • Draft FCAT Writing + Test Item Specifications, Grades 3-12 © 2005 Florida
Department of Education • Florida‘s 2006 Sunshine Standards for K-12 Reading and Language Arts. • Language Arts Draft Crosswalk, Grades 3-10
We examined the FCAT Reading 2006 Test Focus and noted the benchmarks that were covered. We mapped these benchmarks on the old standards and then used the Language Arts Draft Crosswalk to map the standards to the 2006 Sunshine Standards for K-12 Reading and Language Arts. This showed us the distribution of standard coverage against the 2006 Sunshine Standards. We also noted the Access points for the particular benchmarks in the General Education Frameworks. These notations will confirm the alignment of the access points on which we test the students with significant cognitive disabilities to the indicators on which we test general education students. The items for the Florida Alternate Assessment will be written to the Sunshine Standards, using the access points that have been submitted for State Board of Education approval.
Based on our analysis of coverage in the FCAT, the two Reading Strands that Measured Progress suggests for coverage are Reading Process and Literary Analysis. Each of these strands has multiple standards and varied grade level distribution in the FCAT.
Appendix G—Item Specifications Document 163 2007–08 Florida Alt Technical Report
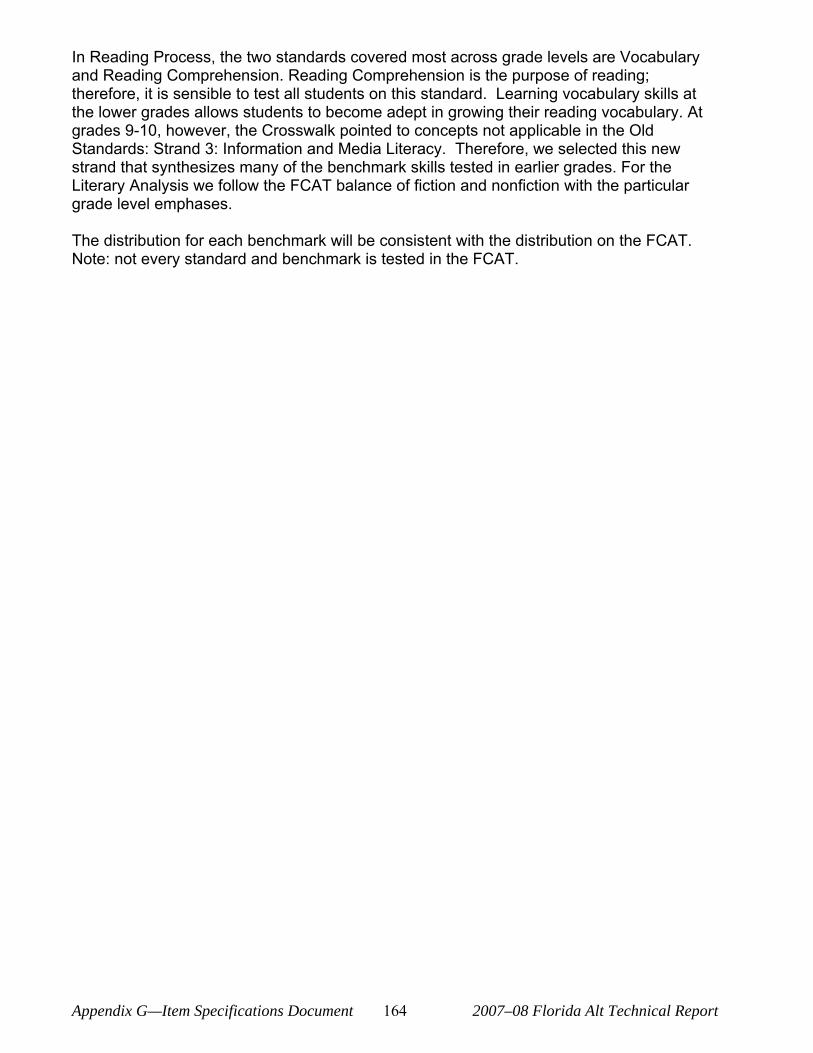
In Reading Process, the two standards covered most across grade levels are Vocabulary and Reading Comprehension. Reading Comprehension is the purpose of reading; therefore, it is sensible to test all students on this standard. Learning vocabulary skills at the lower grades allows students to become adept in growing their reading vocabulary. At grades 9-10, however, the Crosswalk pointed to concepts not applicable in the Old Standards: Strand 3: Information and Media Literacy. Therefore, we selected this new strand that synthesizes many of the benchmark skills tested in earlier grades. For the Literary Analysis we follow the FCAT balance of fiction and nonfiction with the particular grade level emphases.
The distribution for each benchmark will be consistent with the distribution on the FCAT. Note: not every standard and benchmark is tested in the FCAT.
Appendix G—Item Specifications Document 164 2007–08 Florida Alt Technical Report
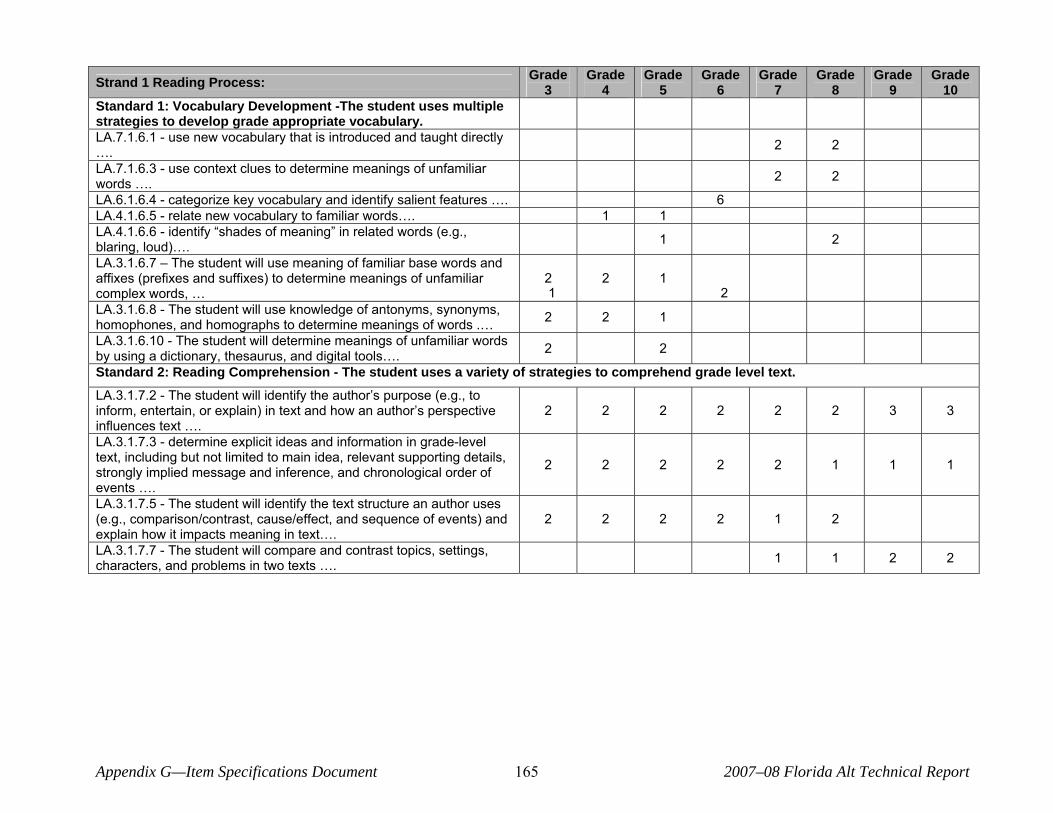
Strand 1 Reading Process: Grade 3
Grade 4
Grade 5
Grade 6
Grade 7
Grade 8
Grade 9
Grade 10
Standard 1: Vocabulary Development -The student uses multiple strategies to develop grade appropriate vocabulary. LA.7.1.6.1 - use new vocabulary that is introduced and taught directly …. 2 2
LA.7.1.6.3 - use context clues to determine meanings of unfamiliar words …. 2 2
LA.6.1.6.4 - categorize key vocabulary and identify salient features …. 6 LA.4.1.6.5 - relate new vocabulary to familiar words…. 1 1 LA.4.1.6.6 - identify —shades of meaning“ in related words (e.g., blaring, loud)….
1
1
2
2
LA.3.1.6.7 œ The student will use meaning of familiar base words and affixes (prefixes and suffixes) to determine meanings of unfamiliar complex words, …
2 2 1
LA.3.1.6.8 - The student will use knowledge of antonyms, synonyms, homophones, and homographs to determine meanings of words .… 2 2 1
LA.3.1.6.10 - The student will determine meanings of unfamiliar words by using a dictionary, thesaurus, and digital tools…. 2 2
Standard 2: Reading Comprehension - The student uses a variety of strategies to comprehend grade level text.
LA.3.1.7.2 - The student will identify the author‘s purpose (e.g., to inform, entertain, or explain) in text and how an author‘s perspective influences text ….
2 2 2 2 2 2 3 3
LA.3.1.7.3 - determine explicit ideas and information in grade-level text, including but not limited to main idea, relevant supporting details, strongly implied message and inference, and chronological order of events ….
2 2 2 2 2 1 1 1
LA.3.1.7.5 - The student will identify the text structure an author uses (e.g., comparison/contrast, cause/effect, and sequence of events) and explain how it impacts meaning in text….
2 2 2 2 1 2
LA.3.1.7.7 - The student will compare and contrast topics, settings, characters, and problems in two texts …. 1 1 2 2
Appendix G—Item Specifications Document 165 2007–08 Florida Alt Technical Report
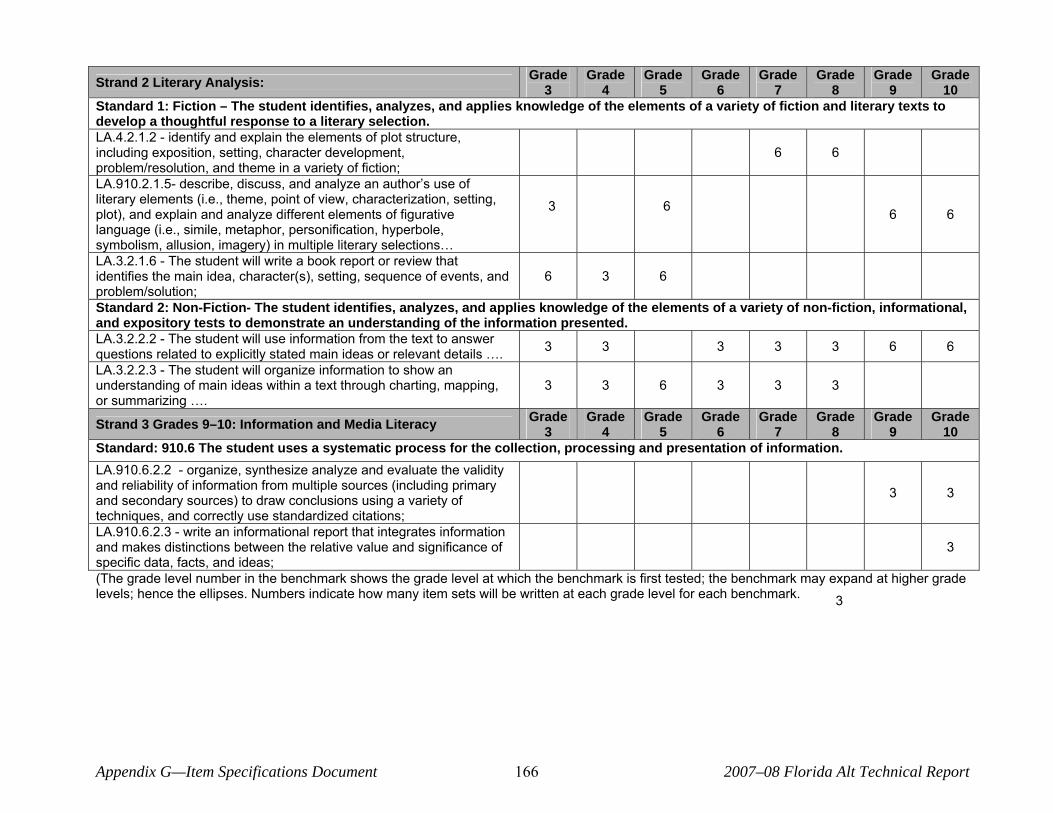
Strand 2 Literary Analysis: Grade 3
Grade 4
Grade 5
Grade 6
Grade 7
Grade 8
Grade 9
Grade 10
Standard 1: Fiction – The student identifies, analyzes, and applies knowledge of the elements of a variety of fiction and literary texts to develop a thoughtful response to a literary selection. LA.4.2.1.2 - identify and explain the elements of plot structure, including exposition, setting, character development, problem/resolution, and theme in a variety of fiction;
3 6
6 6
LA.910.2.1.5- describe, discuss, and analyze an author‘s use of literary elements (i.e., theme, point of view, characterization, setting, plot), and explain and analyze different elements of figurative language (i.e., simile, metaphor, personification, hyperbole, symbolism, allusion, imagery) in multiple literary selections…
6 6
LA.3.2.1.6 - The student will write a book report or review that identifies the main idea, character(s), setting, sequence of events, and problem/solution;
6 3 6
Standard 2: Non-Fiction- The student identifies, analyzes, and applies knowledge of the elements of a variety of non-fiction, informational, and expository tests to demonstrate an understanding of the information presented. LA.3.2.2.2 - The student will use information from the text to answer questions related to explicitly stated main ideas or relevant details …. 3 3 3 3 3 6 6
LA.3.2.2.3 - The student will organize information to show an understanding of main ideas within a text through charting, mapping, or summarizing ….
3 3 6 3 3 3
Strand 3 Grades 9–10: Information and Media Literacy Grade 3
Grade 4
Grade 5
Grade 6
Grade 7
Grade 8
Grade 9
Grade 10
Standard: 910.6 The student uses a systematic process for the collection, processing and presentation of information. LA.910.6.2.2 - organize, synthesize analyze and evaluate the validity and reliability of information from multiple sources (including primary and secondary sources) to draw conclusions using a variety of techniques, and correctly use standardized citations;
3 3
LA.910.6.2.3 - write an informational report that integrates information and makes distinctions between the relative value and significance of specific data, facts, and ideas;
3
3
(The grade level number in the benchmark shows the grade level at which the benchmark is first tested; the benchmark may expand at higher grade levels; hence the ellipses. Numbers indicate how many item sets will be written at each grade level for each benchmark.
Appendix G—Item Specifications Document 166 2007–08 Florida Alt Technical Report
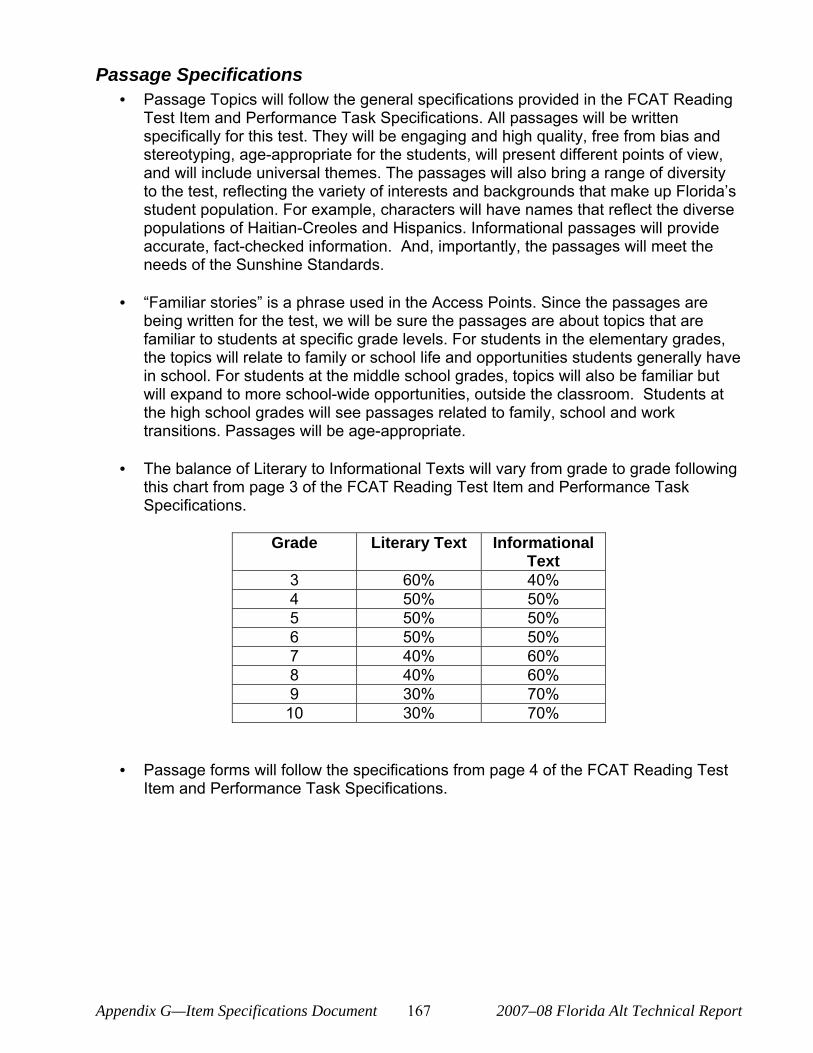
Passage Specifications • Passage Topics will follow the general specifications provided in the FCAT Reading
Test Item and Performance Task Specifications. All passages will be written specifically for this test. They will be engaging and high quality, free from bias and stereotyping, age-appropriate for the students, will present different points of view, and will include universal themes. The passages will also bring a range of diversity to the test, reflecting the variety of interests and backgrounds that make up Florida‘s student population. For example, characters will have names that reflect the diverse populations of Haitian-Creoles and Hispanics. Informational passages will provide accurate, fact-checked information. And, importantly, the passages will meet the needs of the Sunshine Standards.
• —Familiar stories“ is a phrase used in the Access Points. Since the passages are being written for the test, we will be sure the passages are about topics that are familiar to students at specific grade levels. For students in the elementary grades, the topics will relate to family or school life and opportunities students generally have in school. For students at the middle school grades, topics will also be familiar but will expand to more school-wide opportunities, outside the classroom. Students at the high school grades will see passages related to family, school and work transitions. Passages will be age-appropriate.
• The balance of Literary to Informational Texts will vary from grade to grade following this chart from page 3 of the FCAT Reading Test Item and Performance Task Specifications.
Grade Literary Text Informational Text
3 60% 40% 4 50% 50% 5 50% 50% 6 50% 50% 7 40% 60% 8 40% 60% 9 30% 70% 10 30% 70%
• Passage forms will follow the specifications from page 4 of the FCAT Reading Test Item and Performance Task Specifications.
Appendix G—Item Specifications Document 167 2007–08 Florida Alt Technical Report
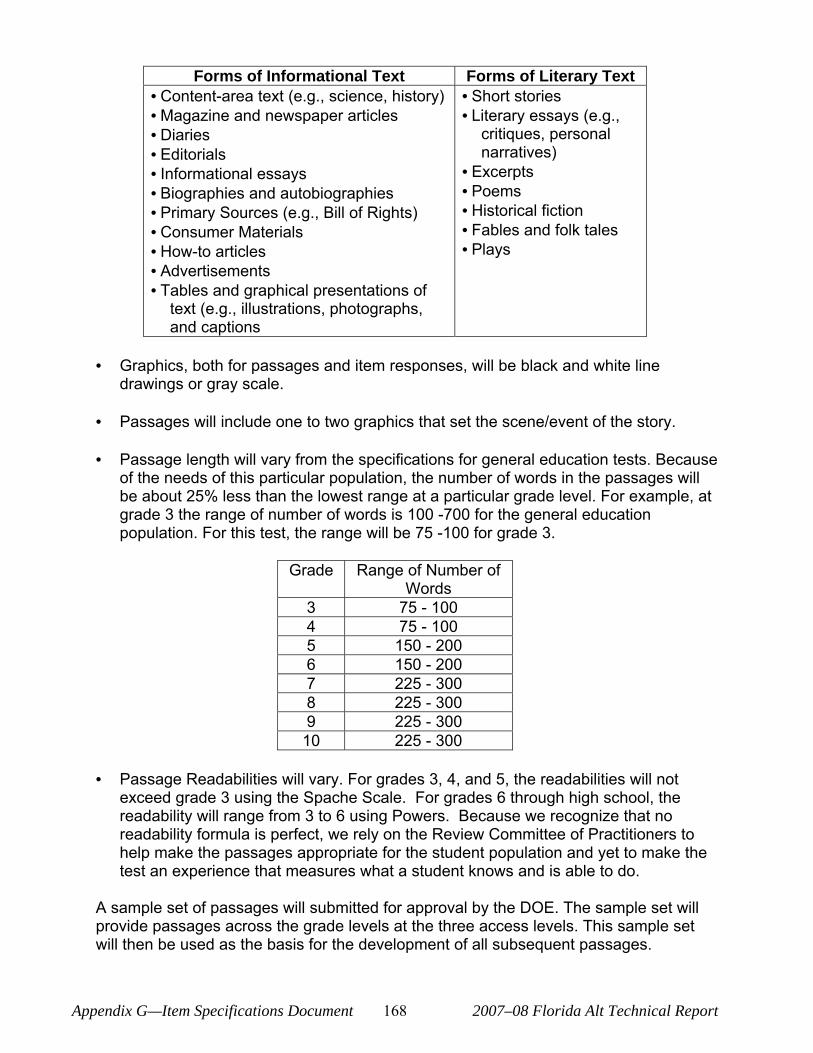
Forms of Informational Text Forms of Literary Text • Content-area text (e.g., science, history) • Magazine and newspaper articles • Diaries • Editorials • Informational essays • Biographies and autobiographies • Primary Sources (e.g., Bill of Rights) • Consumer Materials • How-to articles • Advertisements • Tables and graphical presentations of
text (e.g., illustrations, photographs, and captions
• Short stories • Literary essays (e.g.,
critiques, personal narratives)
• Excerpts • Poems • Historical fiction • Fables and folk tales • Plays
• Graphics, both for passages and item responses, will be black and white line drawings or gray scale.
• Passages will include one to two graphics that set the scene/event of the story.
• Passage length will vary from the specifications for general education tests. Because of the needs of this particular population, the number of words in the passages will be about 25% less than the lowest range at a particular grade level. For example, at grade 3 the range of number of words is 100 -700 for the general education population. For this test, the range will be 75 -100 for grade 3.
Grade Range of Number of Words
3 75 - 100 4 75 - 100 5 150 - 200 6 150 - 200 7 225 - 300 8 225 - 300 9 225 - 300 10 225 - 300
• Passage Readabilities will vary. For grades 3, 4, and 5, the readabilities will not exceed grade 3 using the Spache Scale. For grades 6 through high school, the readability will range from 3 to 6 using Powers. Because we recognize that no readability formula is perfect, we rely on the Review Committee of Practitioners to help make the passages appropriate for the student population and yet to make the test an experience that measures what a student knows and is able to do.
A sample set of passages will submitted for approval by the DOE. The sample set will provide passages across the grade levels at the three access levels. This sample set will then be used as the basis for the development of all subsequent passages.
Appendix G—Item Specifications Document 168 2007–08 Florida Alt Technical Report
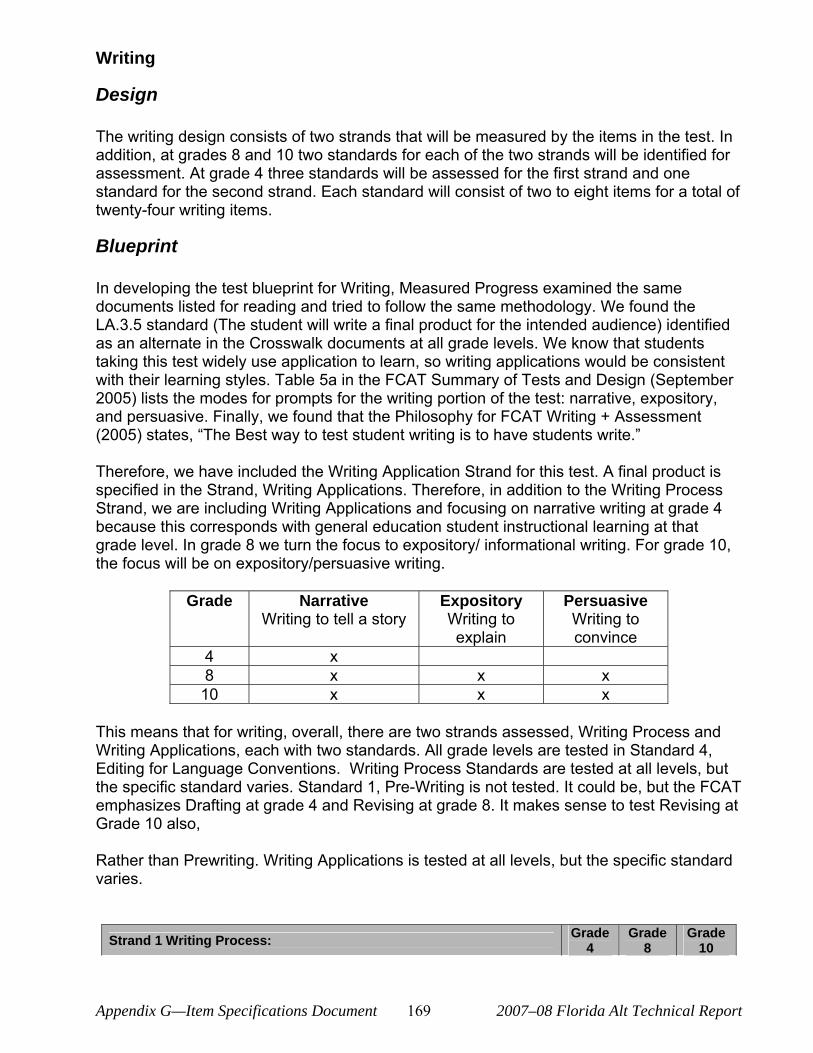
Writing
Design
The writing design consists of two strands that will be measured by the items in the test. In addition, at grades 8 and 10 two standards for each of the two strands will be identified for assessment. At grade 4 three standards will be assessed for the first strand and one standard for the second strand. Each standard will consist of two to eight items for a total of twenty-four writing items.
Blueprint
In developing the test blueprint for Writing, Measured Progress examined the same documents listed for reading and tried to follow the same methodology. We found the LA.3.5 standard (The student will write a final product for the intended audience) identified as an alternate in the Crosswalk documents at all grade levels. We know that students taking this test widely use application to learn, so writing applications would be consistent with their learning styles. Table 5a in the FCAT Summary of Tests and Design (September 2005) lists the modes for prompts for the writing portion of the test: narrative, expository, and persuasive. Finally, we found that the Philosophy for FCAT Writing + Assessment (2005) states, —The Best way to test student writing is to have students write.“
Therefore, we have included the Writing Application Strand for this test. A final product is specified in the Strand, Writing Applications. Therefore, in addition to the Writing Process Strand, we are including Writing Applications and focusing on narrative writing at grade 4 because this corresponds with general education student instructional learning at that grade level. In grade 8 we turn the focus to expository/ informational writing. For grade 10, the focus will be on expository/persuasive writing.
Grade Narrative Writing to tell a story
Expository Writing to explain
Persuasive Writing to convince
4 x 8 x x x 10 x x x
This means that for writing, overall, there are two strands assessed, Writing Process and Writing Applications, each with two standards. All grade levels are tested in Standard 4, Editing for Language Conventions. Writing Process Standards are tested at all levels, but the specific standard varies. Standard 1, Pre-Writing is not tested. It could be, but the FCAT emphasizes Drafting at grade 4 and Revising at grade 8. It makes sense to test Revising at Grade 10 also,
Rather than Prewriting. Writing Applications is tested at all levels, but the specific standard varies.
Strand 1 Writing Process: Grade 4
Grade 8
Grade 10
Appendix G—Item Specifications Document 169 2007–08 Florida Alt Technical Report
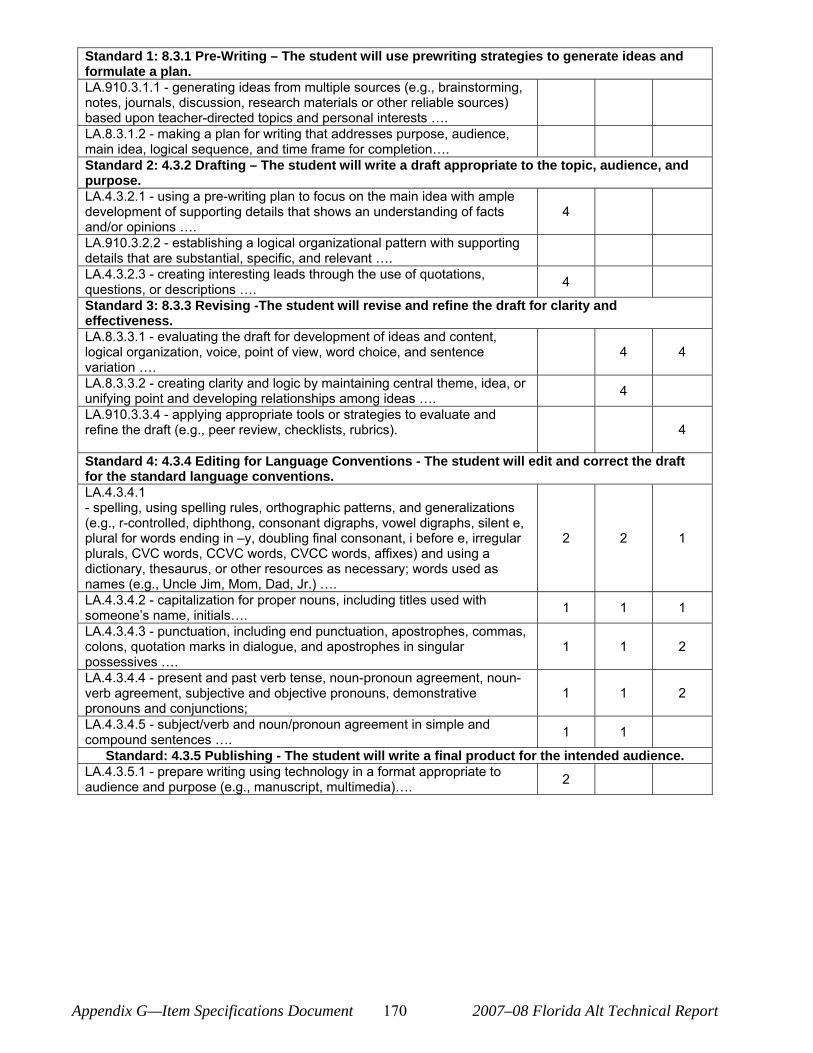
Standard 1: 8.3.1 Pre-Writing – The student will use prewriting strategies to generate ideas and formulate a plan. LA.910.3.1.1 - generating ideas from multiple sources (e.g., brainstorming, notes, journals, discussion, research materials or other reliable sources) based upon teacher-directed topics and personal interests …. LA.8.3.1.2 - making a plan for writing that addresses purpose, audience, main idea, logical sequence, and time frame for completion…. Standard 2: 4.3.2 Drafting – The student will write a draft appropriate to the topic, audience, and purpose. LA.4.3.2.1 - using a pre-writing plan to focus on the main idea with ample development of supporting details that shows an understanding of facts and/or opinions ….
4
LA.910.3.2.2 - establishing a logical organizational pattern with supporting details that are substantial, specific, and relevant …. LA.4.3.2.3 - creating interesting leads through the use of quotations, questions, or descriptions …. 4
Standard 3: 8.3.3 Revising -The student will revise and refine the draft for clarity and effectiveness. LA.8.3.3.1 - evaluating the draft for development of ideas and content, logical organization, voice, point of view, word choice, and sentence variation ….
4 4
LA.8.3.3.2 - creating clarity and logic by maintaining central theme, idea, or unifying point and developing relationships among ideas …. 4
LA.910.3.3.4 - applying appropriate tools or strategies to evaluate and refine the draft (e.g., peer review, checklists, rubrics). 4
Standard 4: 4.3.4 Editing for Language Conventions - The student will edit and correct the draft for the standard language conventions. LA.4.3.4.1 - spelling, using spelling rules, orthographic patterns, and generalizations (e.g., r-controlled, diphthong, consonant digraphs, vowel digraphs, silent e, plural for words ending in œy, doubling final consonant, i before e, irregular plurals, CVC words, CCVC words, CVCC words, affixes) and using a dictionary, thesaurus, or other resources as necessary; words used as names (e.g., Uncle Jim, Mom, Dad, Jr.) ….
2 2 1
LA.4.3.4.2 - capitalization for proper nouns, including titles used with someone‘s name, initials…. 1 1 1
LA.4.3.4.3 - punctuation, including end punctuation, apostrophes, commas, colons, quotation marks in dialogue, and apostrophes in singular possessives ….
1 1 2
LA.4.3.4.4 - present and past verb tense, noun-pronoun agreement, noun-verb agreement, subjective and objective pronouns, demonstrative pronouns and conjunctions;
1 1 2
LA.4.3.4.5 - subject/verb and noun/pronoun agreement in simple and compound sentences …. 1 1
Standard: 4.3.5 Publishing - The student will write a final product for the intended audience. LA.4.3.5.1 - prepare writing using technology in a format appropriate to audience and purpose (e.g., manuscript, multimedia)…. 2
Appendix G—Item Specifications Document 170 2007–08 Florida Alt Technical Report
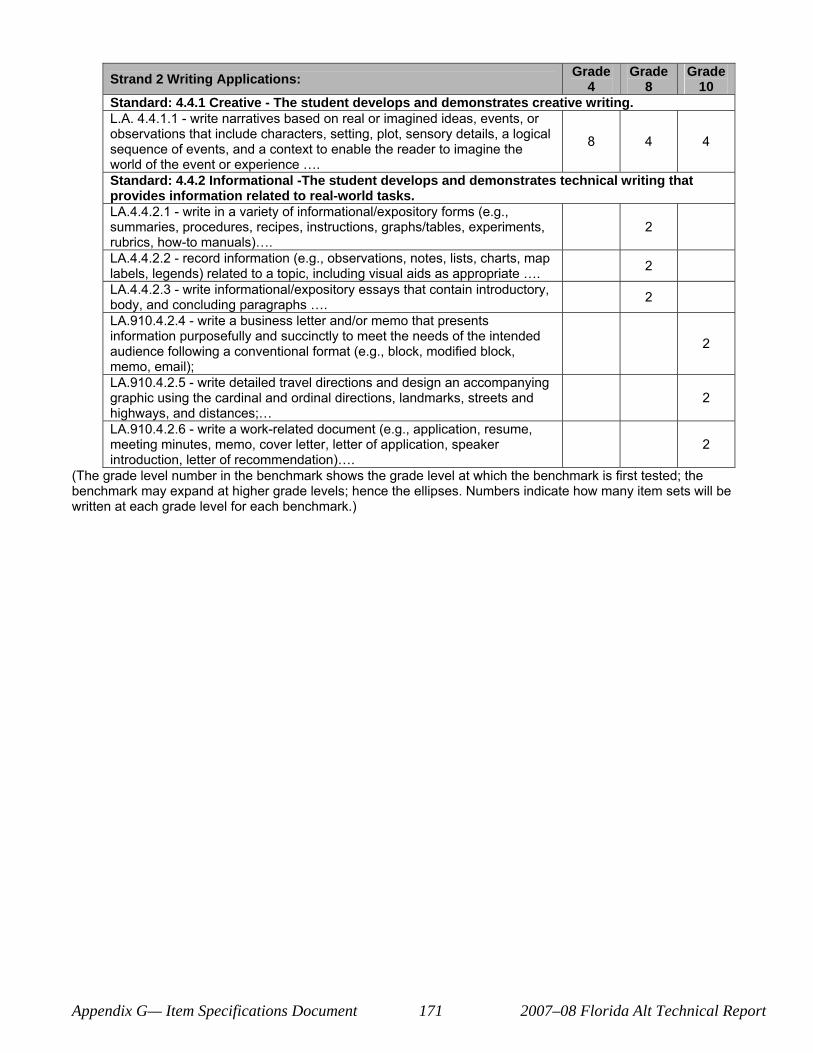
Strand 2 Writing Applications: Grade 4
Grade 8
Grade 10
Standard: 4.4.1 Creative - The student develops and demonstrates creative writing. L.A. 4.4.1.1 - write narratives based on real or imagined ideas, events, or observations that include characters, setting, plot, sensory details, a logical sequence of events, and a context to enable the reader to imagine the world of the event or experience ….
8 4 4
Standard: 4.4.2 Informational -The student develops and demonstrates technical writing that provides information related to real-world tasks. LA.4.4.2.1 - write in a variety of informational/expository forms (e.g., summaries, procedures, recipes, instructions, graphs/tables, experiments, rubrics, how-to manuals)….
2
LA.4.4.2.2 - record information (e.g., observations, notes, lists, charts, map labels, legends) related to a topic, including visual aids as appropriate …. 2
LA.4.4.2.3 - write informational/expository essays that contain introductory, body, and concluding paragraphs …. 2
LA.910.4.2.4 - write a business letter and/or memo that presents information purposefully and succinctly to meet the needs of the intended audience following a conventional format (e.g., block, modified block, memo, email);
2
LA.910.4.2.5 - write detailed travel directions and design an accompanying graphic using the cardinal and ordinal directions, landmarks, streets and highways, and distances;…
2
LA.910.4.2.6 - write a work-related document (e.g., application, resume, meeting minutes, memo, cover letter, letter of application, speaker introduction, letter of recommendation)….
2
(The grade level number in the benchmark shows the grade level at which the benchmark is first tested; the benchmark may expand at higher grade levels; hence the ellipses. Numbers indicate how many item sets will be written at each grade level for each benchmark.)
Appendix G— Item Specifications Document 171 2007–08 Florida Alt Technical Report
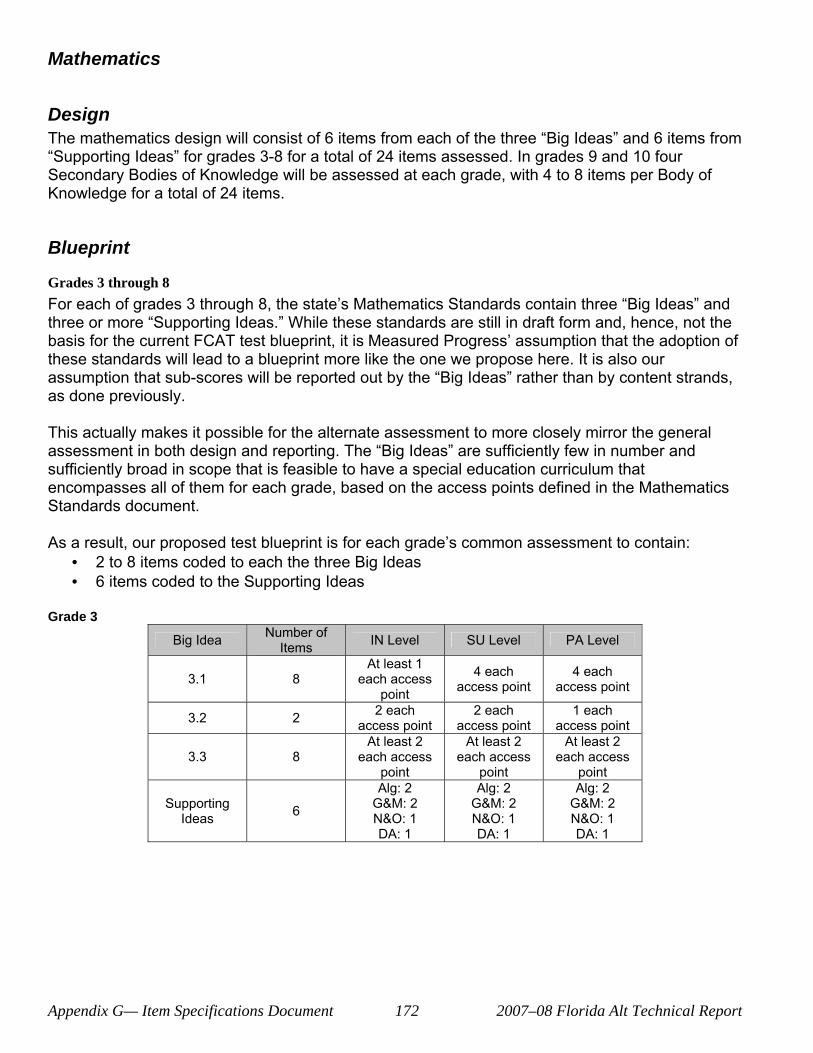
Mathematics
Design The mathematics design will consist of 6 items from each of the three —Big Ideas“ and 6 items from —Supporting Ideas“ for grades 3-8 for a total of 24 items assessed. In grades 9 and 10 four Secondary Bodies of Knowledge will be assessed at each grade, with 4 to 8 items per Body of Knowledge for a total of 24 items.
Blueprint
Grades 3 through 8 For each of grades 3 through 8, the state‘s Mathematics Standards contain three —Big Ideas“ and three or more —Supporting Ideas.“ While these standards are still in draft form and, hence, not the basis for the current FCAT test blueprint, it is Measured Progress‘ assumption that the adoption of these standards will lead to a blueprint more like the one we propose here. It is also our assumption that sub-scores will be reported out by the —Big Ideas“ rather than by content strands, as done previously.
This actually makes it possible for the alternate assessment to more closely mirror the general assessment in both design and reporting. The —Big Ideas“ are sufficiently few in number and sufficiently broad in scope that is feasible to have a special education curriculum that encompasses all of them for each grade, based on the access points defined in the Mathematics Standards document.
As a result, our proposed test blueprint is for each grade‘s common assessment to contain: • 2 to 8 items coded to each the three Big Ideas • 6 items coded to the Supporting Ideas
Grade 3
Big Idea Number of Items IN Level SU Level PA Level
3.1 8 At least 1
each access point
4 each access point
4 each access point
3.2 2 2 each access point
2 each access point
1 each access point
At least 2 At least 2 At least 2 3.3 8 each access each access each access
point point point
Supporting Ideas 6
Alg: 2 G&M: 2 N&O: 1 DA: 1
Alg: 2 G&M: 2 N&O: 1 DA: 1
Alg: 2 G&M: 2 N&O: 1 DA: 1
Appendix G— Item Specifications Document 172 2007–08 Florida Alt Technical Report
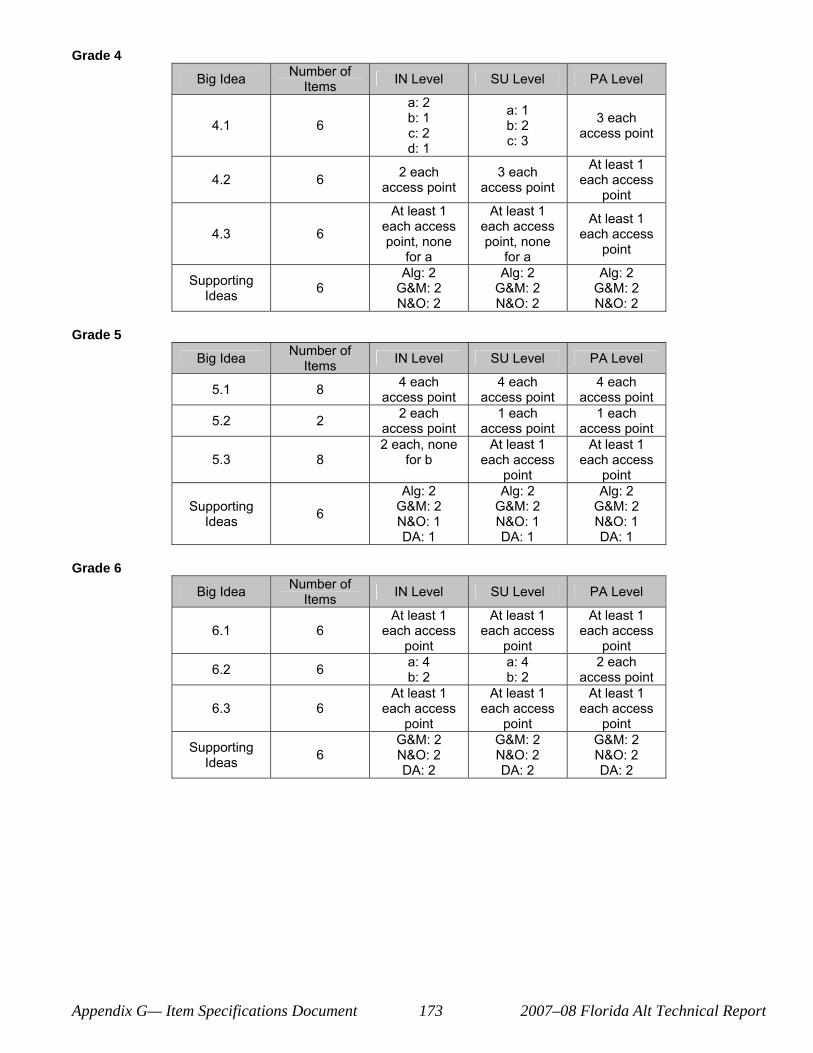
Grade 4
Grade 5
Grade 6
Big Idea Number of Items IN Level SU Level PA Level
4.1 6
a: 2 b: 1 c: 2 d: 1
a: 1 b: 2 c: 3
3 each access point
4.2 6 2 each access point
3 each access point
At least 1 each access
point
4.3 6
At least 1 each access point, none
for a
At least 1 each access point, none
for a
At least 1 each access
point
Supporting Ideas 6
Alg: 2 G&M: 2 N&O: 2
Alg: 2 G&M: 2 N&O: 2
Alg: 2 G&M: 2 N&O: 2
Big Idea Number of Items IN Level SU Level PA Level
5.1 8 4 each access point
4 each access point
4 each access point
5.2 2 2 each access point
1 each access point
1 each access point
5.3 8 2 each, none
for b At least 1
each access At least 1
each access point point
Supporting Ideas 6
Alg: 2 G&M: 2 N&O: 1 DA: 1
Alg: 2 G&M: 2 N&O: 1 DA: 1
Alg: 2 G&M: 2 N&O: 1 DA: 1
Big Idea Number of Items IN Level SU Level PA Level
At least 1 At least 1 At least 1 6.1 6 each access each access each access
point point point
6.2 6 a: 4 b: 2
a: 4 b: 2
2 each access point
At least 1 At least 1 At least 1 6.3 6 each access each access each access
point point point
Supporting Ideas 6
G&M: 2 N&O: 2 DA: 2
G&M: 2 N&O: 2 DA: 2
G&M: 2 N&O: 2 DA: 2
Appendix G— Item Specifications Document 173 2007–08 Florida Alt Technical Report
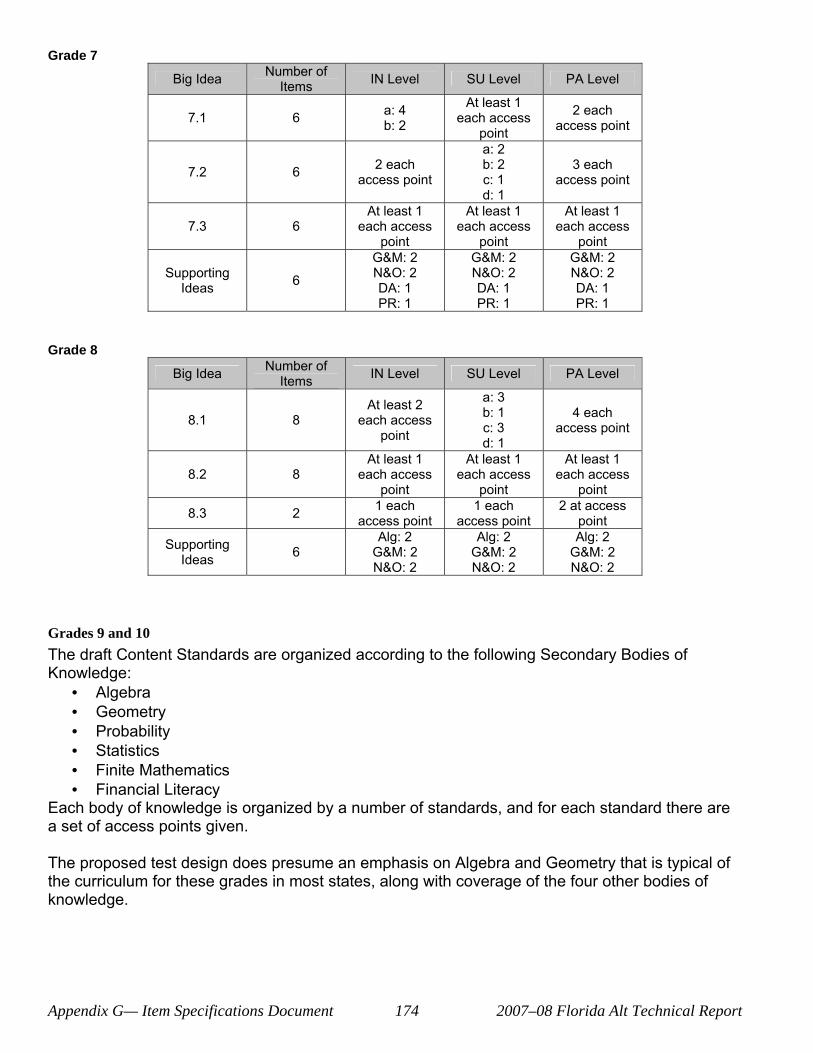
Grade 7
Grade 8
Big Idea Number of Items IN Level SU Level PA Level
7.1 6 a: 4 b: 2
At least 1 each access
point
2 each access point
7.2 6 2 each access point
a: 2 b: 2 c: 1 d: 1
3 each access point
At least 1 At least 1 At least 1 7.3 6 each access each access each access
point point point G&M: 2 G&M: 2 G&M: 2
Supporting Ideas 6 N&O: 2
DA: 1 N&O: 2 DA: 1
N&O: 2 DA: 1
PR: 1 PR: 1 PR: 1
Big Idea Number of Items IN Level SU Level PA Level
8.1 8 At least 2
each access point
a: 3 b: 1 c: 3 d: 1
4 each access point
At least 1 At least 1 At least 1 8.2 8 each access each access each access
point point point
8.3 2 1 each access point
1 each access point
2 at access point
Supporting Ideas 6
Alg: 2 G&M: 2 N&O: 2
Alg: 2 G&M: 2 N&O: 2
Alg: 2 G&M: 2 N&O: 2
Grades 9 and 10 The draft Content Standards are organized according to the following Secondary Bodies of Knowledge:
• Algebra • Geometry • Probability • Statistics • Finite Mathematics • Financial Literacy
Each body of knowledge is organized by a number of standards, and for each standard there are a set of access points given.
The proposed test design does presume an emphasis on Algebra and Geometry that is typical of the curriculum for these grades in most states, along with coverage of the four other bodies of knowledge.
Appendix G— Item Specifications Document 174 2007–08 Florida Alt Technical Report
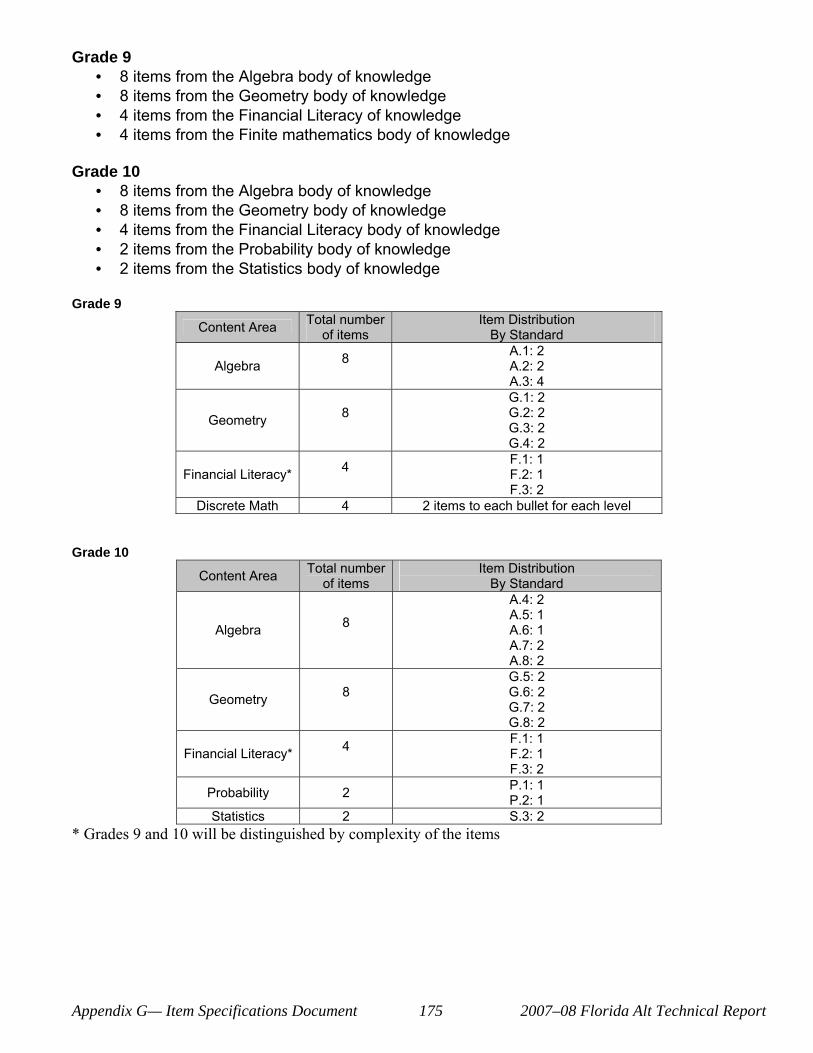
Grade 9 • 8 items from the Algebra body of knowledge • 8 items from the Geometry body of knowledge • 4 items from the Financial Literacy of knowledge • 4 items from the Finite mathematics body of knowledge
Grade 10 • 8 items from the Algebra body of knowledge • 8 items from the Geometry body of knowledge • 4 items from the Financial Literacy body of knowledge • 2 items from the Probability body of knowledge • 2 items from the Statistics body of knowledge
Grade 9
Content Area Total number of items
Item Distribution By Standard
Algebra 8 A.1: 2 A.2: 2 A.3: 4
Geometry 8 G.1: 2 G.2: 2 G.3: 2 G.4: 2
Financial Literacy* 4 F.1: 1 F.2: 1 F.3: 2
Discrete Math 4 2 items to each bullet for each level
Grade 10
Content Area Total number of items
Item Distribution By Standard
Algebra 8
A.4: 2 A.5: 1 A.6: 1 A.7: 2 A.8: 2
Geometry 8 G.5: 2 G.6: 2 G.7: 2 G.8: 2
Financial Literacy* 4 F.1: 1 F.2: 1 F.3: 2
Probability 2 P.1: 1 P.2: 1
Statistics 2 S.3: 2 * Grades 9 and 10 will be distinguished by complexity of the items
Appendix G— Item Specifications Document 175 2007–08 Florida Alt Technical Report
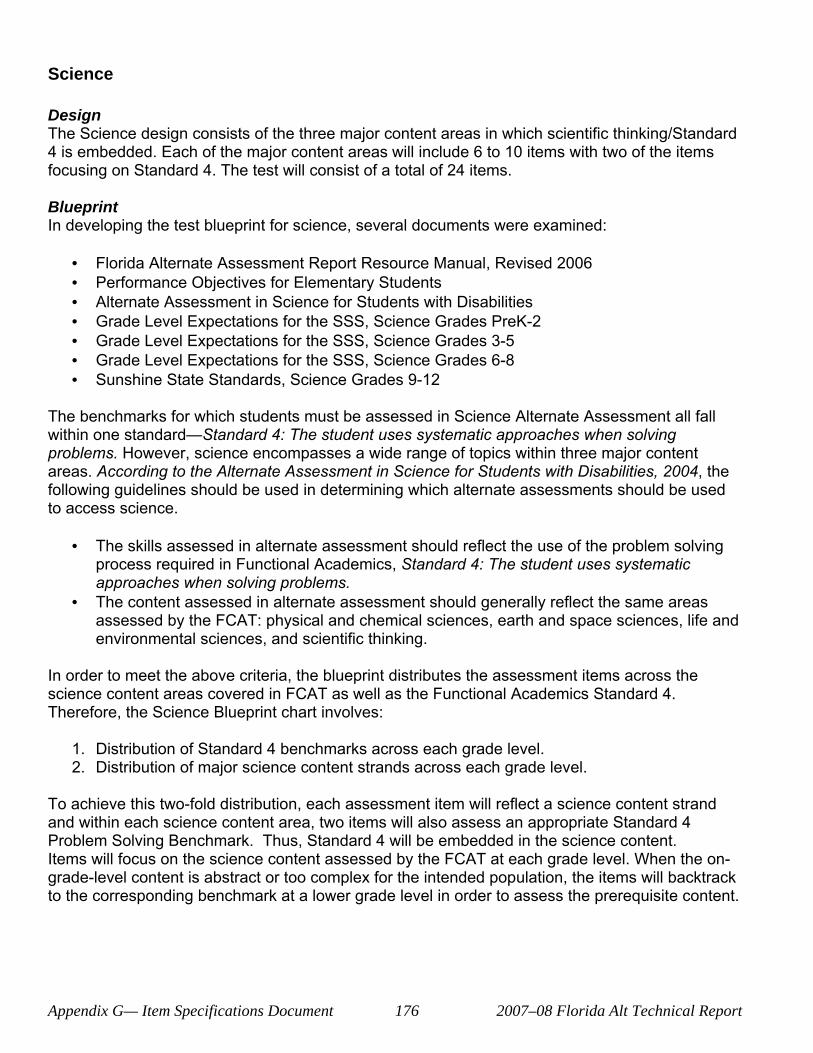
Science
Design The Science design consists of the three major content areas in which scientific thinking/Standard 4 is embedded. Each of the major content areas will include 6 to 10 items with two of the items focusing on Standard 4. The test will consist of a total of 24 items.
Blueprint In developing the test blueprint for science, several documents were examined:
• Florida Alternate Assessment Report Resource Manual, Revised 2006 • Performance Objectives for Elementary Students • Alternate Assessment in Science for Students with Disabilities • Grade Level Expectations for the SSS, Science Grades PreK-2 • Grade Level Expectations for the SSS, Science Grades 3-5 • Grade Level Expectations for the SSS, Science Grades 6-8 • Sunshine State Standards, Science Grades 9-12
The benchmarks for which students must be assessed in Science Alternate Assessment all fall within one standard–Standard 4: The student uses systematic approaches when solving problems. However, science encompasses a wide range of topics within three major content areas. According to the Alternate Assessment in Science for Students with Disabilities, 2004, the following guidelines should be used in determining which alternate assessments should be used to access science.
• The skills assessed in alternate assessment should reflect the use of the problem solving process required in Functional Academics, Standard 4: The student uses systematic approaches when solving problems.
• The content assessed in alternate assessment should generally reflect the same areas assessed by the FCAT: physical and chemical sciences, earth and space sciences, life and environmental sciences, and scientific thinking.
In order to meet the above criteria, the blueprint distributes the assessment items across the science content areas covered in FCAT as well as the Functional Academics Standard 4. Therefore, the Science Blueprint chart involves:
1. Distribution of Standard 4 benchmarks across each grade level. 2. Distribution of major science content strands across each grade level.
To achieve this two-fold distribution, each assessment item will reflect a science content strand and within each science content area, two items will also assess an appropriate Standard 4 Problem Solving Benchmark. Thus, Standard 4 will be embedded in the science content. Items will focus on the science content assessed by the FCAT at each grade level. When the on-grade-level content is abstract or too complex for the intended population, the items will backtrack to the corresponding benchmark at a lower grade level in order to assess the prerequisite content.
Appendix G— Item Specifications Document 176 2007–08 Florida Alt Technical Report
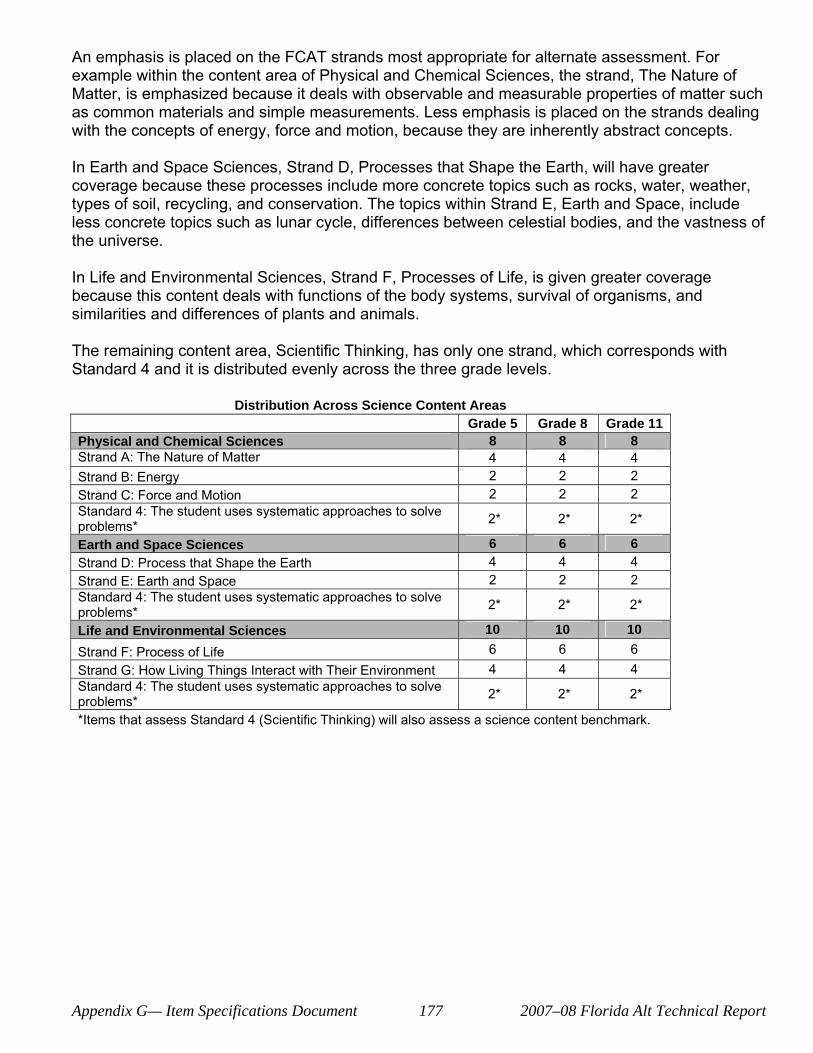
An emphasis is placed on the FCAT strands most appropriate for alternate assessment. For example within the content area of Physical and Chemical Sciences, the strand, The Nature of Matter, is emphasized because it deals with observable and measurable properties of matter such as common materials and simple measurements. Less emphasis is placed on the strands dealing with the concepts of energy, force and motion, because they are inherently abstract concepts.
In Earth and Space Sciences, Strand D, Processes that Shape the Earth, will have greater coverage because these processes include more concrete topics such as rocks, water, weather, types of soil, recycling, and conservation. The topics within Strand E, Earth and Space, include less concrete topics such as lunar cycle, differences between celestial bodies, and the vastness of the universe.
In Life and Environmental Sciences, Strand F, Processes of Life, is given greater coverage because this content deals with functions of the body systems, survival of organisms, and similarities and differences of plants and animals.
The remaining content area, Scientific Thinking, has only one strand, which corresponds with Standard 4 and it is distributed evenly across the three grade levels.
Distribution Across Science Content Areas Grade 5 Grade 8 Grade 11
Physical and Chemical Sciences 8 8 8 Strand A: The Nature of Matter 4 4 4 Strand B: Energy 2 2 2 Strand C: Force and Motion 2 2 2 Standard 4: The student uses systematic approaches to solve problems* 2* 2* 2*
Earth and Space Sciences 6 6 6 Strand D: Process that Shape the Earth 4 4 4 Strand E: Earth and Space 2 2 2 Standard 4: The student uses systematic approaches to solve problems* 2* 2* 2*
Life and Environmental Sciences 10 10 10 Strand F: Process of Life 6 6 6 Strand G: How Living Things Interact with Their Environment 4 4 4 Standard 4: The student uses systematic approaches to solve problems* 2* 2* 2*
*Items that assess Standard 4 (Scientific Thinking) will also assess a science content benchmark.
Appendix G— Item Specifications Document 177 2007–08 Florida Alt Technical Report
Item Specifications
• Items should clearly address the concept and/or skill described in the access points for each level. To the extent possible, the tasks for each of the access points within a given item should be related, i.e., the task for the Independent access point should assess the same concept and/or skill as the task for the Participatory, but at a higher level of cognitive demand.
• Where students are asked to select a single choice from a set of options, there should be at most three options provided. On occasion, however, for example in an item that asks a student to recognize examples and non-examples of a given concept, students may be given up to six options and asked to address each one. (e.g., show six different shapes and ask student to identify all the ones that are squares)
• Passages will be read aloud to the student.
• At all Access Points, word cards and sentence strips will be read to the student.
• Where not otherwise specified in the standard being assessed, numbers and other elements of items should be kept as simple as possible.
• To determine whether a word is appropriate to use in an item, a variety of sources will be used: Dolch Basic Sight Word List, Revised Dolch List, the work of Chall and Popp described in Teaching and Assessing Phonics: Why, What, When, How (Educators Publishing Service, Inc. 1996), EDL Core Vocabularies in Reading, Mathematics, Science, and Social Studies,( Steck-Vaughn Company, 1989), and The Living Word by Dale and O‘Rourke (World Book-Childcraft International, Inc., 1981). Again, we will rely on the Review Committee of Practitioners to help make the word choices appropriate for the student population and make the test an experience that measures what a student knows and is able to do.
• Simple content terminology will be used in grades 3-5, with more accurate content terminology usage at grades 6-11. For example in grades 3-5 the question may be —What is the story mostly about?“ and at grades 6-11 the question will be —What is the main idea?.“
• To the extent possible, items should involve situations or contexts that can be expected to be familiar to most students and that are age-appropriate. In particular, items for the secondary grades should involve situations, contexts, and objects that are of interest to older students.
• Items may presume the use of some readily available classroom materials, such as counters. However, most items should include all necessary materials, e.g., shapes. Shapes and other manipulatives (e.g., picture cards) will be provided as graphics on regular paper that classroom teachers will cut out for the students‘ use on the assessment. Graphics of objects that may be replaced by the real object need to be small enough to fit on a desk space and to remain stable (not rolling around).
• Participatory Access Point Students at the Participatory Access Point may respond indicating the answer with the mode the student most commonly uses in class to communicate, such as yes/no cards, picture cards, eye gaze, assistive technology, and signing. Materials provided for
Appendix G— Item Specifications Document 178 2007–08 Florida Alt Technical Report
responses will be picture cards, and number cards. The key and the two distracters will be clearly different from each other.
• Supported Access Point Students at the Supported Access Point may respond indicating the answer with the mode the student most commonly uses in class to communicate, such as picture, word cards, sentence strips, eye gaze, assistive technology, and signing. Materials provided for responses will be picture cards, word cards (with pictures for more difficult words), sentence strips (with pictures) and number cards. At least two of the options, the key and one distracter, will relate to the item stimulus.
• Independent Access Point Students at the Independent Access Point may respond indicating the answer with the mode the student most commonly uses in class to communicate, such as sentence strips, verbal or written responses, eye gaze, assistive technology, and signing. Materials provided for responses will be picture cards, word cards, sentence strips and number cards. All options, the key and the distracters, will relate to the item stimulus, or the student may be expected to provide the answer.
• Other item specifications will follow two sets of guidelines: 1. Those described in the FCAT Reading, Writing, Mathematics and Science Test Item and
Performance Task Specifications. 2. Item-writing guidelines typically followed by Measured Progress.
a. Aligned to the particular standard and appropriate level of difficulty, b. Items and tasks are clear, concise and easy to read. c. Having one and only one answer for multiple choice, d. Irrelevant clues to the correct answer are avoided. e. Most items will be positively worded. f. Distracters will have similar length. g. All options will be similar in grammatical structure and form. h. Item context will avoid any cultural, racial, or gender bias. i. Items will follow the principles of Universal Design
Appendix G— Item Specifications Document 179 2007–08 Florida Alt Technical Report

APPENDIX H—RAW SCORE CUMULATIVE DISTRIBUTIONS
Appendix H—Raw Score Cumulative Dist. 181 2007–08 Florida Alt Technical Report

182
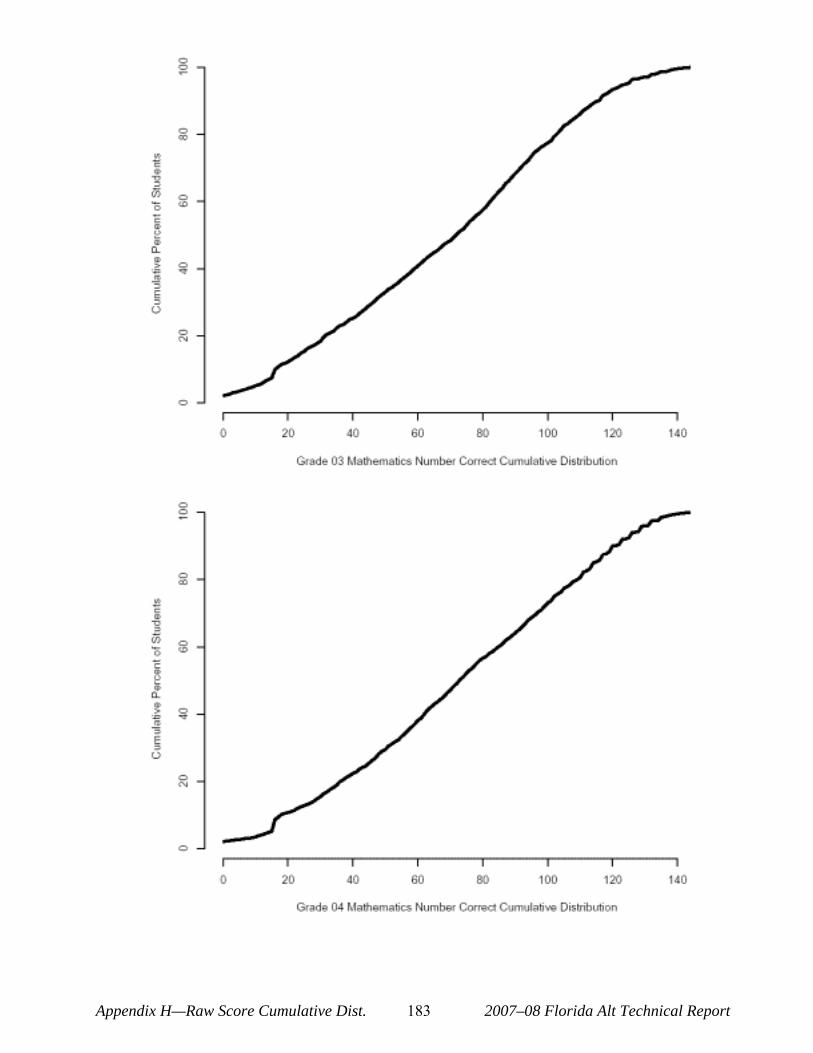
Appendix H—Raw Score Cumulative Dist. 183 2007–08 Florida Alt Technical Report
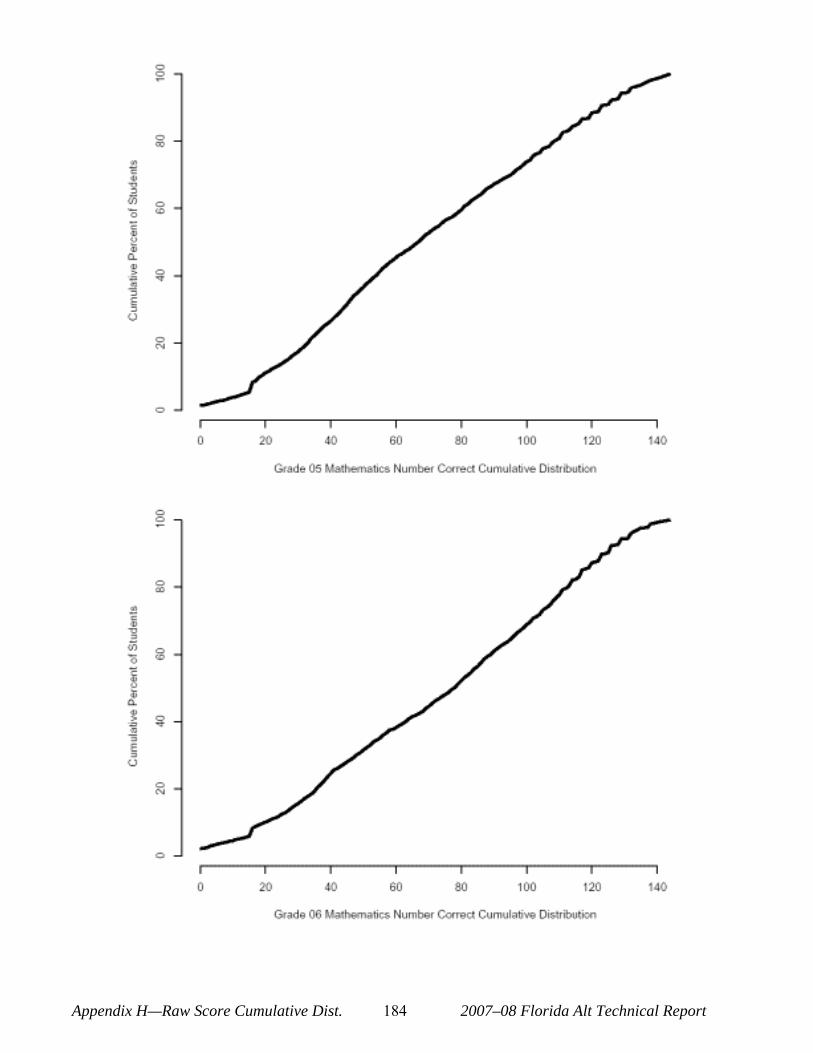
Appendix H—Raw Score Cumulative Dist. 184 2007–08 Florida Alt Technical Report
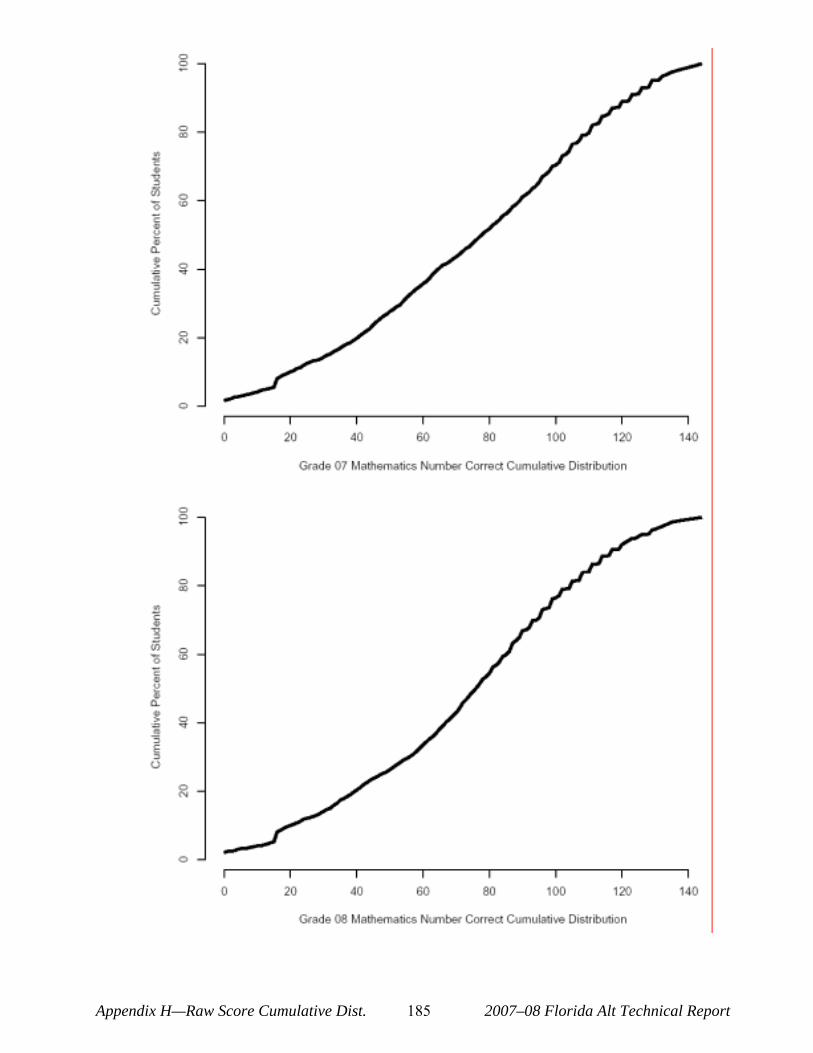
Appendix H—Raw Score Cumulative Dist. 185 2007–08 Florida Alt Technical Report
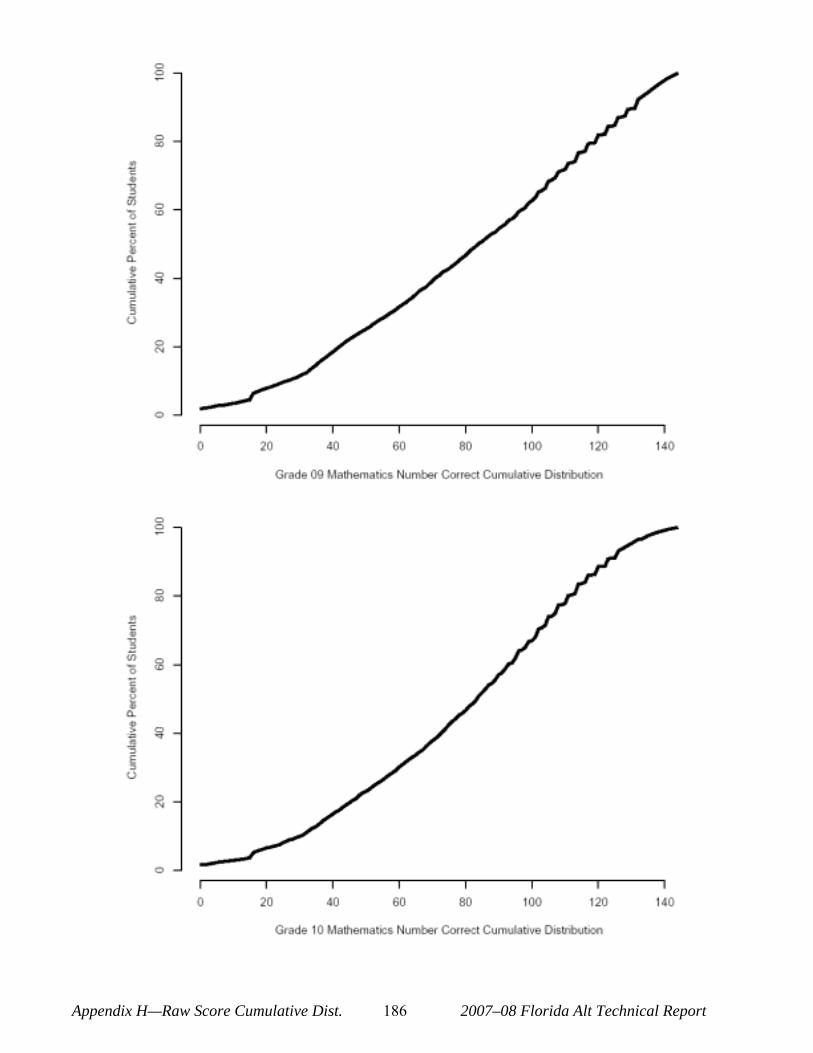
Appendix H—Raw Score Cumulative Dist. 186 2007–08 Florida Alt Technical Report
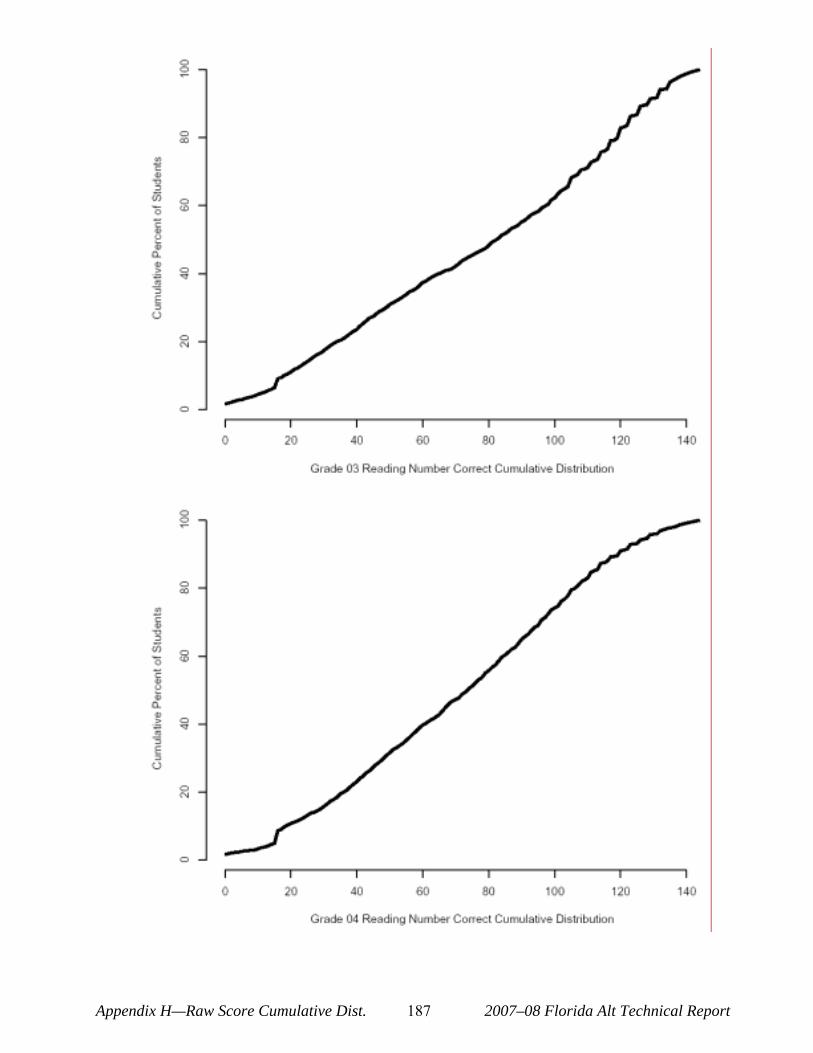
Appendix H—Raw Score Cumulative Dist. 187 2007–08 Florida Alt Technical Report
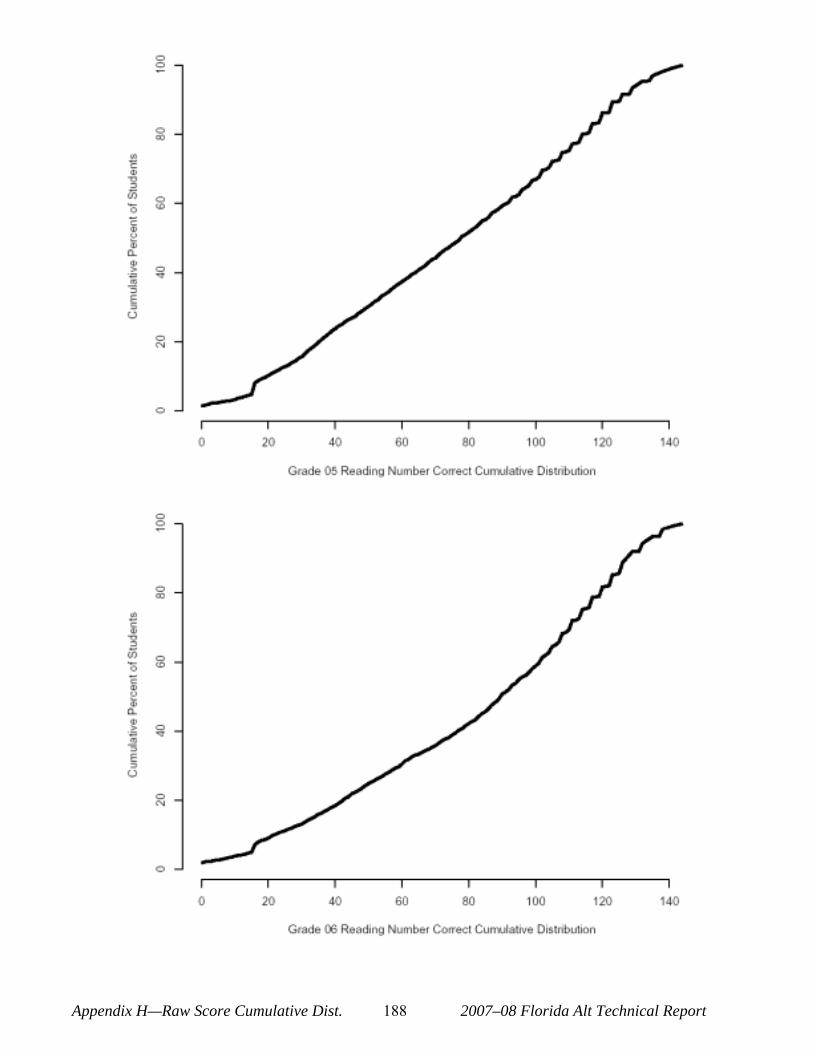
Appendix H—Raw Score Cumulative Dist. 188 2007–08 Florida Alt Technical Report
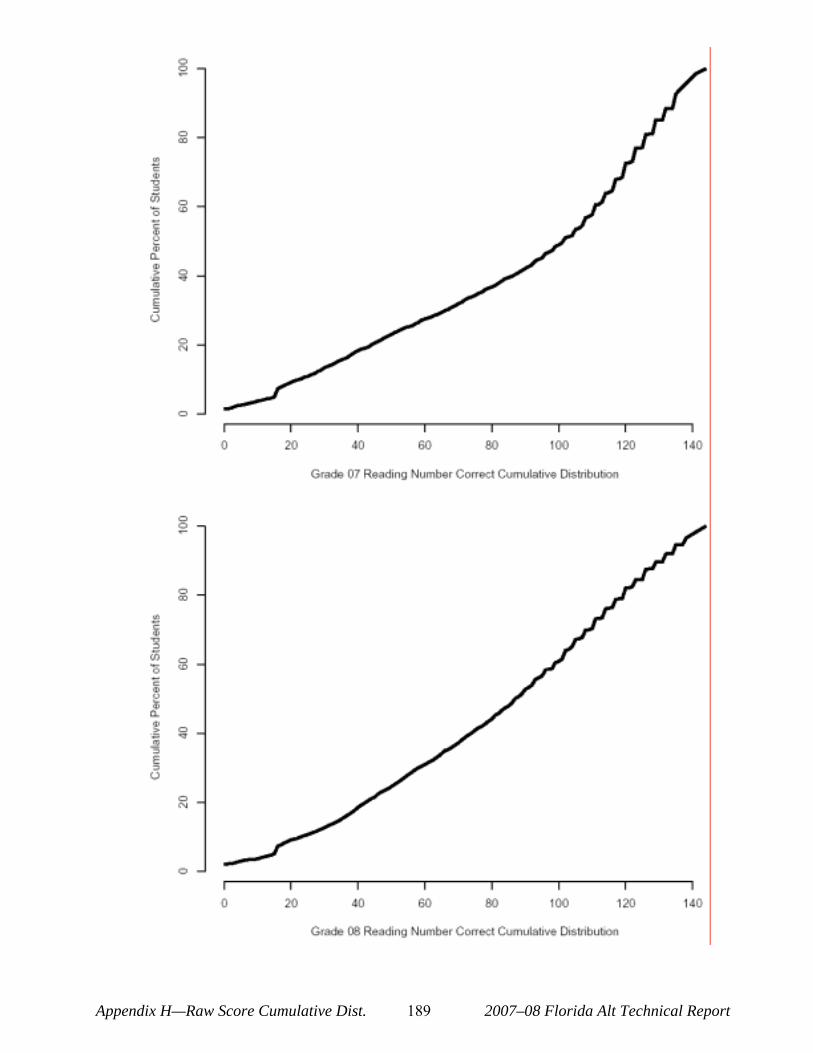
Appendix H—Raw Score Cumulative Dist. 189 2007–08 Florida Alt Technical Report
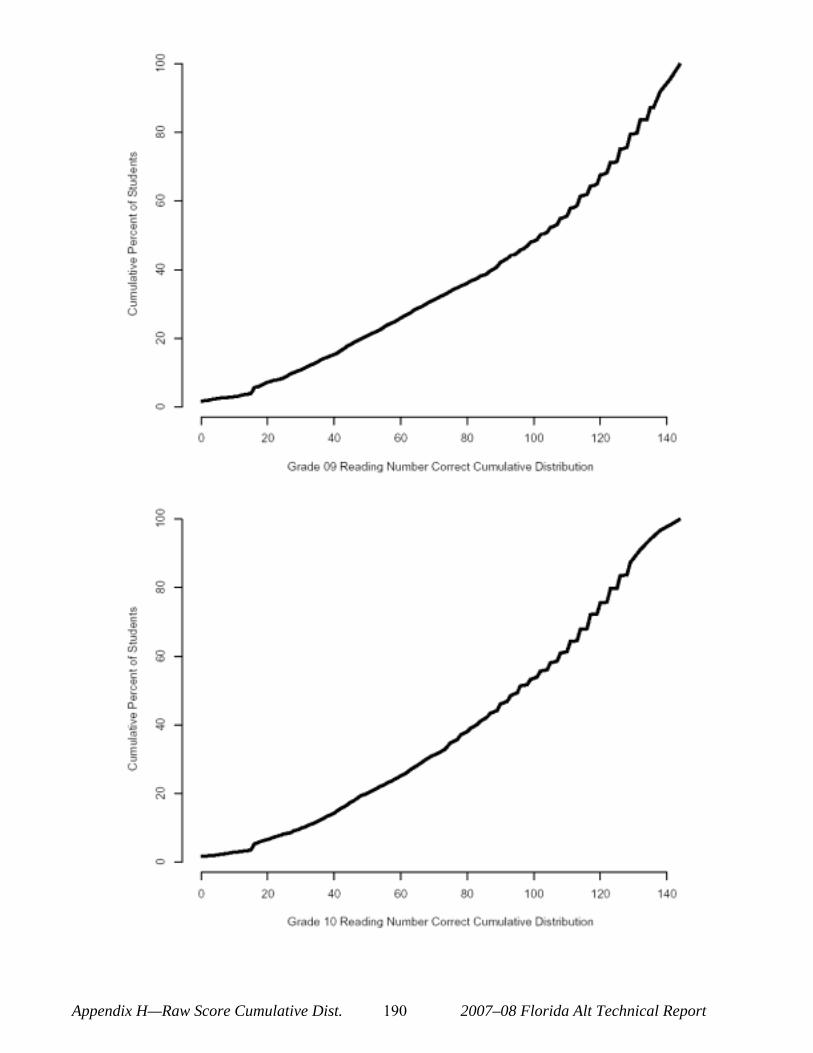
Appendix H—Raw Score Cumulative Dist. 190 2007–08 Florida Alt Technical Report
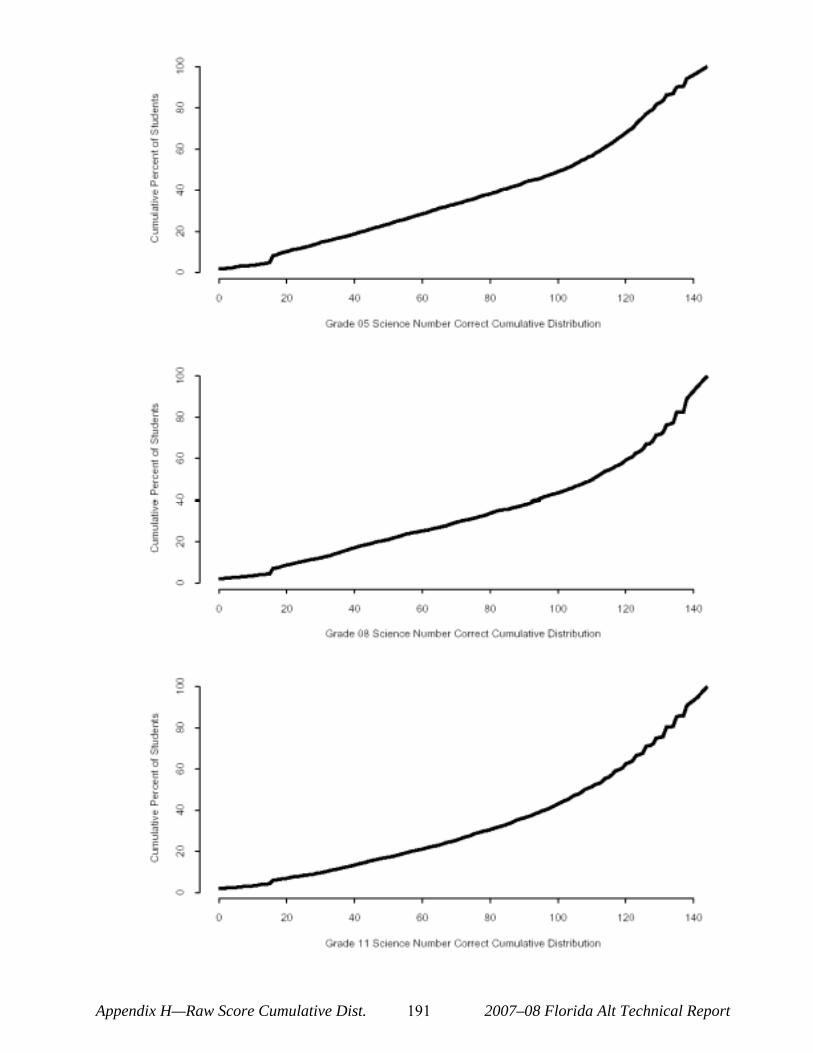
Appendix H—Raw Score Cumulative Dist. 191 2007–08 Florida Alt Technical Report

192
APPENDIX I—ITEM ANALYSIS RESULTS
Appendix I— Item Analysis Results 193 2007-08 Florida ALT Technical Report

Appendix I— Item Analysis Results 194 2007-08 Florida ALT Technical Report
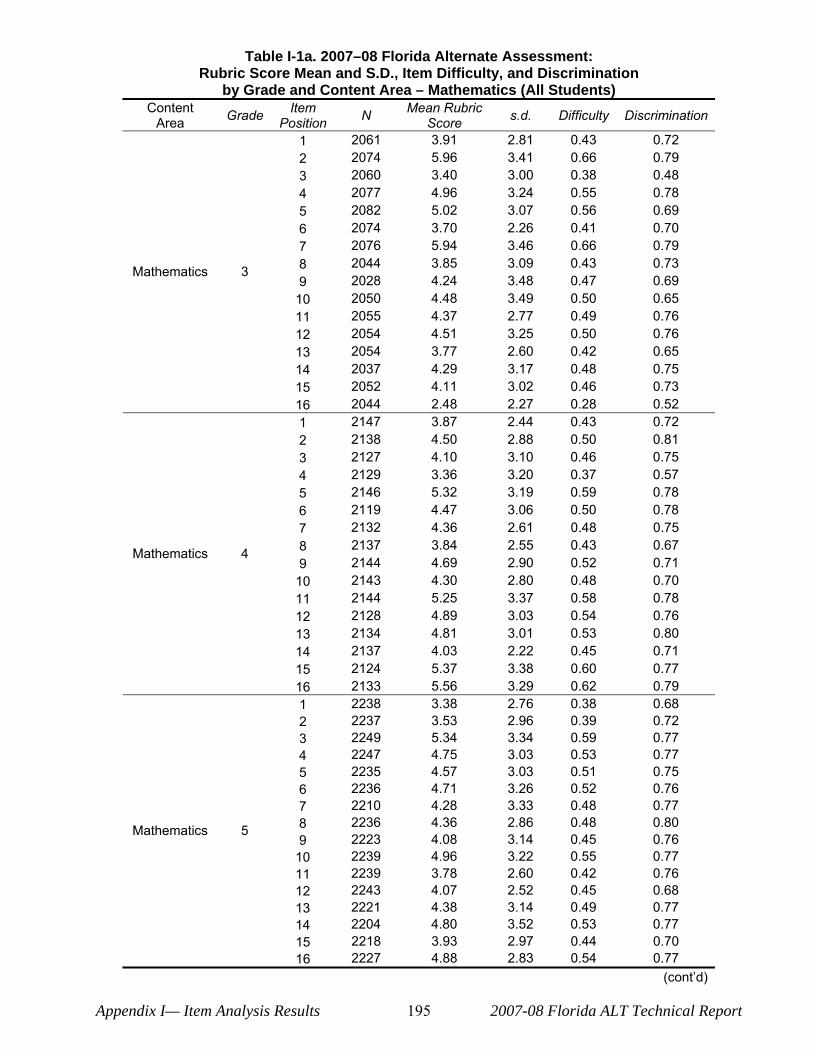
Table I-1a. 2007–08 Florida Alternate Assessment: Rubric Score Mean and S.D., Item Difficulty, and Discrimination
by Grade and Content Area – Mathematics (All Students) Content Item Mean Rubric Grade N s.d. Difficulty Discrimination Area Position Score
1 2061 3.91 2.81 0.43 0.72 2 2074 5.96 3.41 0.66 0.79 3 2060 3.40 3.00 0.38 0.48 4 2077 4.96 3.24 0.55 0.78 5 2082 5.02 3.07 0.56 0.69 6 2074 3.70 2.26 0.41 0.70 7 2076 5.94 3.46 0.66 0.79
Mathematics 3 8 9
2044 2028
3.85 4.24
3.09 3.48
0.43 0.47
0.73 0.69
10 2050 4.48 3.49 0.50 0.65 11 2055 4.37 2.77 0.49 0.76 12 2054 4.51 3.25 0.50 0.76 13 2054 3.77 2.60 0.42 0.65 14 2037 4.29 3.17 0.48 0.75 15 2052 4.11 3.02 0.46 0.73 16 2044 2.48 2.27 0.28 0.52 1 2147 3.87 2.44 0.43 0.72 2 2138 4.50 2.88 0.50 0.81 3 2127 4.10 3.10 0.46 0.75 4 2129 3.36 3.20 0.37 0.57 5 2146 5.32 3.19 0.59 0.78 6 2119 4.47 3.06 0.50 0.78 7 2132 4.36 2.61 0.48 0.75
Mathematics 4 8 9
2137 2144
3.84 4.69
2.55 2.90
0.43 0.52
0.67 0.71
10 2143 4.30 2.80 0.48 0.70 11 2144 5.25 3.37 0.58 0.78 12 2128 4.89 3.03 0.54 0.76 13 2134 4.81 3.01 0.53 0.80 14 2137 4.03 2.22 0.45 0.71 15 2124 5.37 3.38 0.60 0.77 16 2133 5.56 3.29 0.62 0.79 1 2238 3.38 2.76 0.38 0.68 2 2237 3.53 2.96 0.39 0.72 3 2249 5.34 3.34 0.59 0.77 4 2247 4.75 3.03 0.53 0.77 5 2235 4.57 3.03 0.51 0.75 6 2236 4.71 3.26 0.52 0.76 7 2210 4.28 3.33 0.48 0.77
Mathematics 5 8 9
2236 2223
4.36 4.08
2.86 3.14
0.48 0.45
0.80 0.76
10 2239 4.96 3.22 0.55 0.77 11 2239 3.78 2.60 0.42 0.76 12 2243 4.07 2.52 0.45 0.68 13 2221 4.38 3.14 0.49 0.77 14 2204 4.80 3.52 0.53 0.77 15 2218 3.93 2.97 0.44 0.70 16 2227 4.88 2.83 0.54 0.77
(cont‘d)
Appendix I— Item Analysis Results 195 2007-08 Florida ALT Technical Report
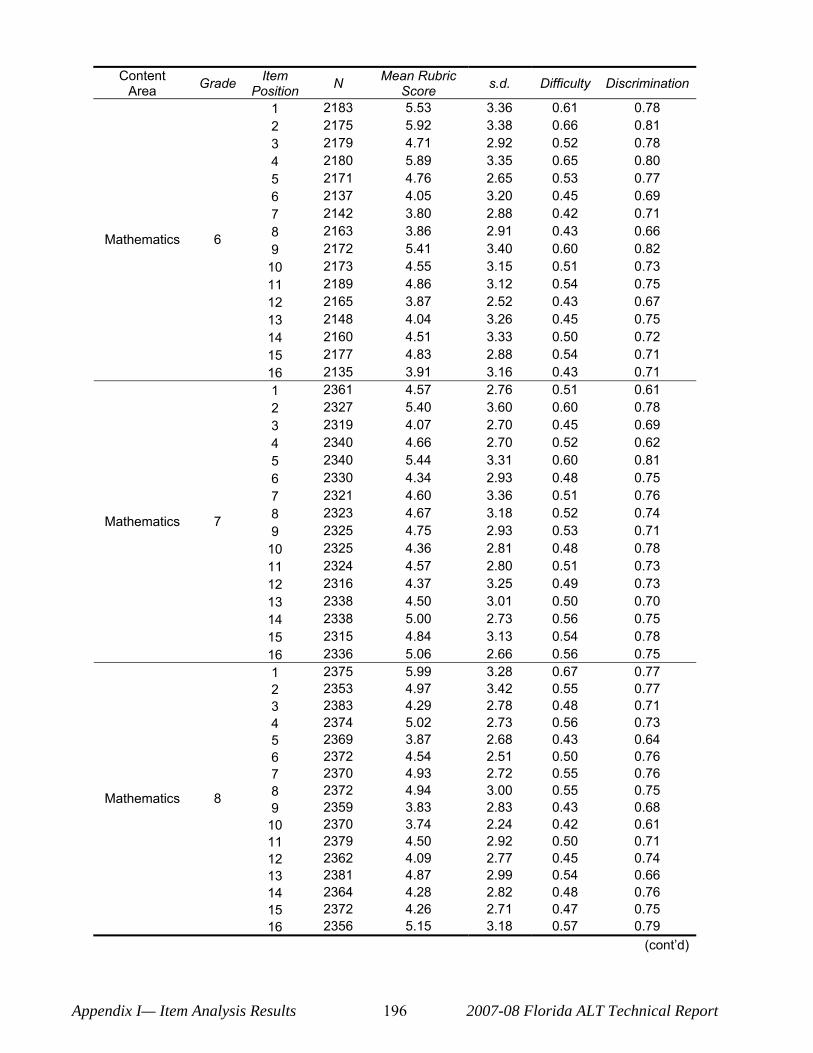
Content
Area Grade Item Position N Mean Rubric
Score s.d. Difficulty Discrimination
1 2183 5.53 3.36 0.61 0.78 2 2175 5.92 3.38 0.66 0.81 3 2179 4.71 2.92 0.52 0.78 4 2180 5.89 3.35 0.65 0.80 5 2171 4.76 2.65 0.53 0.77 6 2137 4.05 3.20 0.45 0.69 7 2142 3.80 2.88 0.42 0.71
Mathematics 6 8 9
2163 2172
3.86 5.41
2.91 3.40
0.43 0.60
0.66 0.82
10 2173 4.55 3.15 0.51 0.73 11 2189 4.86 3.12 0.54 0.75 12 2165 3.87 2.52 0.43 0.67 13 2148 4.04 3.26 0.45 0.75 14 2160 4.51 3.33 0.50 0.72 15 2177 4.83 2.88 0.54 0.71 16 2135 3.91 3.16 0.43 0.71 1 2361 4.57 2.76 0.51 0.61 2 2327 5.40 3.60 0.60 0.78 3 2319 4.07 2.70 0.45 0.69 4 2340 4.66 2.70 0.52 0.62 5 2340 5.44 3.31 0.60 0.81 6 2330 4.34 2.93 0.48 0.75 7 2321 4.60 3.36 0.51 0.76
Mathematics 7 8 9
2323 2325
4.67 4.75
3.18 2.93
0.52 0.53
0.74 0.71
10 2325 4.36 2.81 0.48 0.78 11 2324 4.57 2.80 0.51 0.73 12 2316 4.37 3.25 0.49 0.73 13 2338 4.50 3.01 0.50 0.70 14 2338 5.00 2.73 0.56 0.75 15 2315 4.84 3.13 0.54 0.78 16 2336 5.06 2.66 0.56 0.75 1 2375 5.99 3.28 0.67 0.77 2 2353 4.97 3.42 0.55 0.77 3 2383 4.29 2.78 0.48 0.71 4 2374 5.02 2.73 0.56 0.73 5 2369 3.87 2.68 0.43 0.64 6 2372 4.54 2.51 0.50 0.76 7 2370 4.93 2.72 0.55 0.76
Mathematics 8 8 9
2372 2359
4.94 3.83
3.00 2.83
0.55 0.43
0.75 0.68
10 2370 3.74 2.24 0.42 0.61 11 2379 4.50 2.92 0.50 0.71 12 2362 4.09 2.77 0.45 0.74 13 2381 4.87 2.99 0.54 0.66 14 2364 4.28 2.82 0.48 0.76 15 2372 4.26 2.71 0.47 0.75 16 2356 5.15 3.18 0.57 0.79
(cont‘d)
Appendix I— Item Analysis Results 196 2007-08 Florida ALT Technical Report
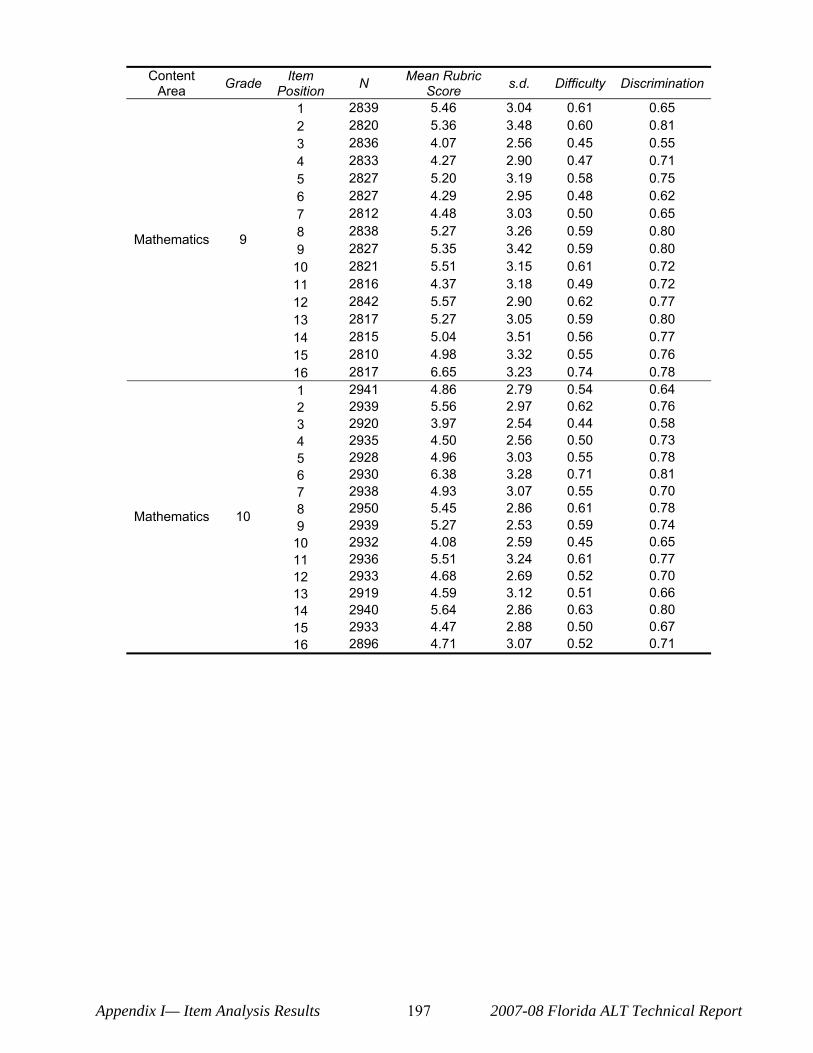
Content Area Grade Item
Position N Mean Rubric Score s.d. Difficulty Discrimination
1 2839 5.46 3.04 0.61 0.65 2 2820 5.36 3.48 0.60 0.81 3 2836 4.07 2.56 0.45 0.55 4 2833 4.27 2.90 0.47 0.71 5 2827 5.20 3.19 0.58 0.75 6 2827 4.29 2.95 0.48 0.62 7 2812 4.48 3.03 0.50 0.65
Mathematics 9 8 9
2838 2827
5.27 5.35
3.26 3.42
0.59 0.59
0.80 0.80
10 2821 5.51 3.15 0.61 0.72 11 2816 4.37 3.18 0.49 0.72 12 2842 5.57 2.90 0.62 0.77 13 2817 5.27 3.05 0.59 0.80 14 2815 5.04 3.51 0.56 0.77 15 2810 4.98 3.32 0.55 0.76 16 2817 6.65 3.23 0.74 0.78
Mathematics 10
1 2 3 4 5 6 7 8 9
10 11 12 13 14 15 16
2941 2939 2920 2935 2928 2930 2938 2950 2939 2932 2936 2933 2919 2940 2933 2896
4.86 5.56 3.97 4.50 4.96 6.38 4.93 5.45 5.27 4.08 5.51 4.68 4.59 5.64 4.47 4.71
2.79 2.97 2.54 2.56 3.03 3.28 3.07 2.86 2.53 2.59 3.24 2.69 3.12 2.86 2.88 3.07
0.54 0.62 0.44 0.50 0.55 0.71 0.55 0.61 0.59 0.45 0.61 0.52 0.51 0.63 0.50 0.52
0.64 0.76 0.58 0.73 0.78 0.81 0.70 0.78 0.74 0.65 0.77 0.70 0.66 0.80 0.67 0.71
Appendix I— Item Analysis Results 197 2007-08 Florida ALT Technical Report
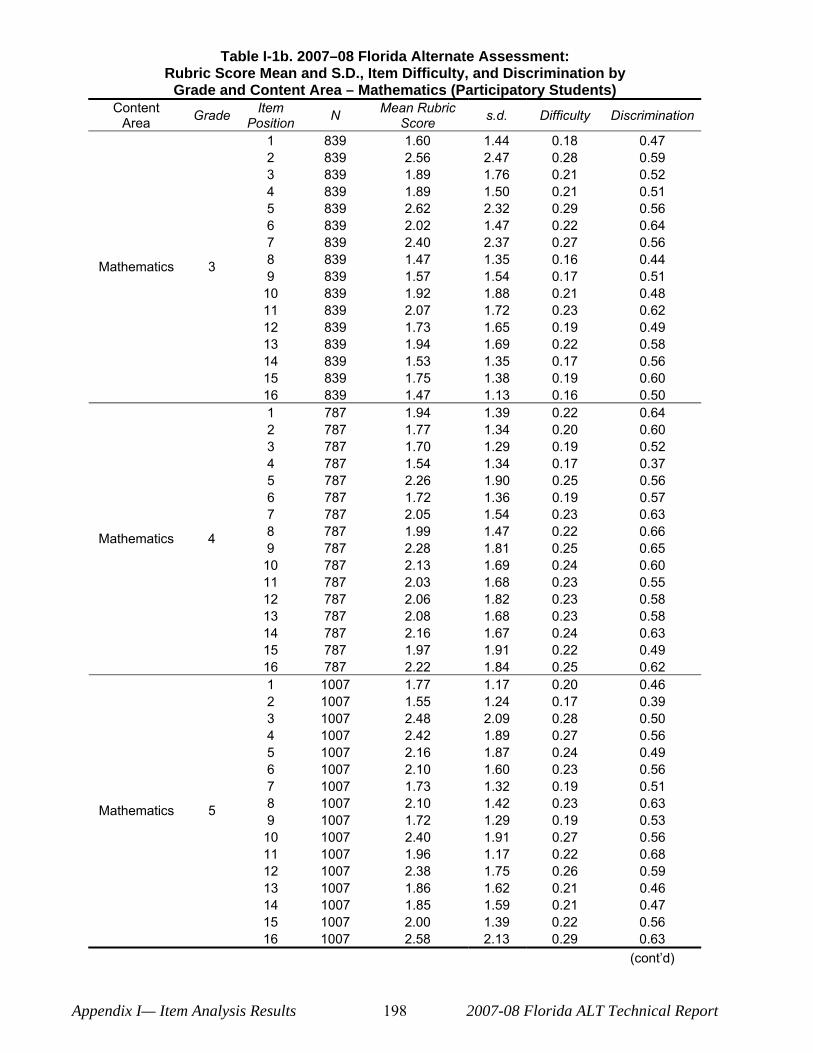
Table I-1b. 2007–08 Florida Alternate Assessment: Rubric Score Mean and S.D., Item Difficulty, and Discrimination by
Grade and Content Area – Mathematics (Participatory Students) Content Item Mean Rubric Grade N s.d. Difficulty Discrimination Area Position Score
1 839 1.60 1.44 0.18 0.47 2 839 2.56 2.47 0.28 0.59 3 839 1.89 1.76 0.21 0.52 4 839 1.89 1.50 0.21 0.51 5 839 2.62 2.32 0.29 0.56 6 839 2.02 1.47 0.22 0.64 7 839 2.40 2.37 0.27 0.56
Mathematics 3 8 9
839 839
1.47 1.57
1.35 1.54
0.16 0.17
0.44 0.51
10 839 1.92 1.88 0.21 0.48 11 839 2.07 1.72 0.23 0.62 12 839 1.73 1.65 0.19 0.49 13 839 1.94 1.69 0.22 0.58 14 839 1.53 1.35 0.17 0.56 15 839 1.75 1.38 0.19 0.60 16 839 1.47 1.13 0.16 0.50 1 787 1.94 1.39 0.22 0.64 2 787 1.77 1.34 0.20 0.60 3 787 1.70 1.29 0.19 0.52 4 787 1.54 1.34 0.17 0.37 5 787 2.26 1.90 0.25 0.56 6 787 1.72 1.36 0.19 0.57 7 787 2.05 1.54 0.23 0.63
Mathematics 4 8 9
787 787
1.99 2.28
1.47 1.81
0.22 0.25
0.66 0.65
10 787 2.13 1.69 0.24 0.60 11 787 2.03 1.68 0.23 0.55 12 787 2.06 1.82 0.23 0.58 13 787 2.08 1.68 0.23 0.58 14 787 2.16 1.67 0.24 0.63 15 787 1.97 1.91 0.22 0.49 16 787 2.22 1.84 0.25 0.62 1 1007 1.77 1.17 0.20 0.46 2 1007 1.55 1.24 0.17 0.39 3 1007 2.48 2.09 0.28 0.50 4 1007 2.42 1.89 0.27 0.56 5 1007 2.16 1.87 0.24 0.49 6 1007 2.10 1.60 0.23 0.56 7 1007 1.73 1.32 0.19 0.51
Mathematics 5 8 9
1007 1007
2.10 1.72
1.42 1.29
0.23 0.19
0.63 0.53
10 1007 2.40 1.91 0.27 0.56 11 1007 1.96 1.17 0.22 0.68 12 1007 2.38 1.75 0.26 0.59 13 1007 1.86 1.62 0.21 0.46 14 1007 1.85 1.59 0.21 0.47 15 1007 2.00 1.39 0.22 0.56 16 1007 2.58 2.13 0.29 0.63
(cont‘d)
Appendix I— Item Analysis Results 198 2007-08 Florida ALT Technical Report
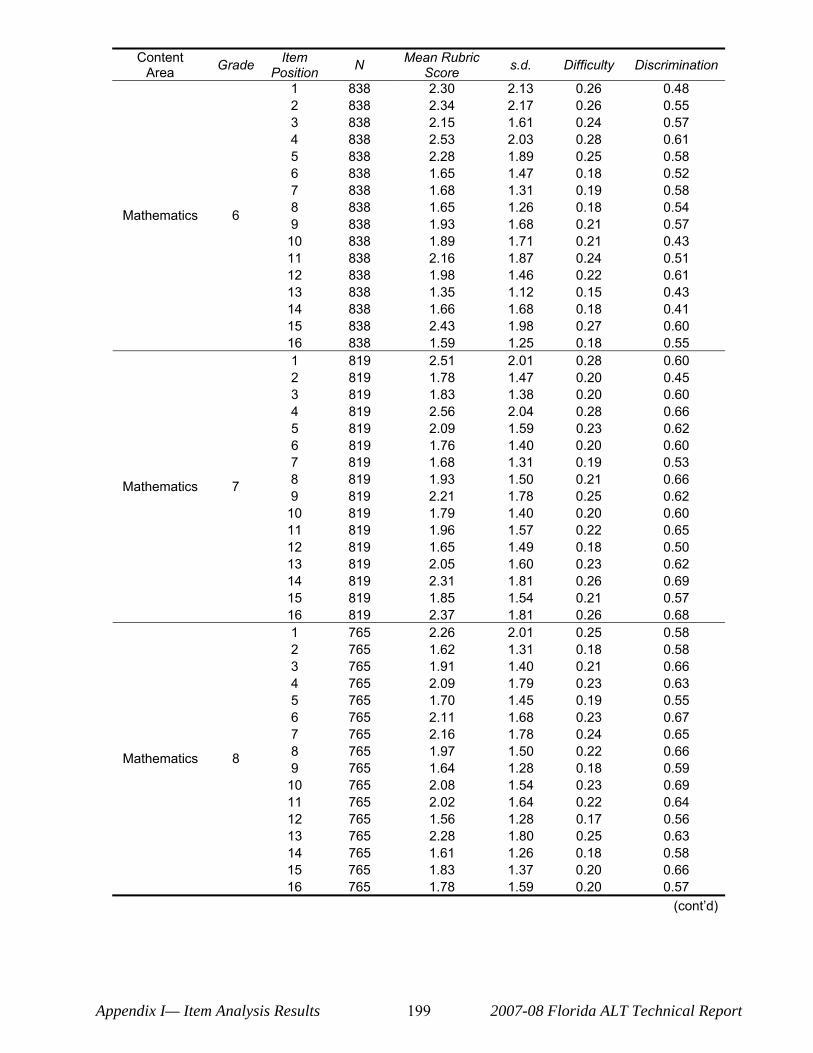
Content Area Grade Item
Position N Mean Rubric Score s.d. Difficulty Discrimination
1 838 2.30 2.13 0.26 0.48 2 838 2.34 2.17 0.26 0.55 3 838 2.15 1.61 0.24 0.57 4 838 2.53 2.03 0.28 0.61 5 838 2.28 1.89 0.25 0.58 6 838 1.65 1.47 0.18 0.52 7 838 1.68 1.31 0.19 0.58
Mathematics 6 8 9
838 838
1.65 1.93
1.26 1.68
0.18 0.21
0.54 0.57
10 838 1.89 1.71 0.21 0.43 11 838 2.16 1.87 0.24 0.51 12 838 1.98 1.46 0.22 0.61 13 838 1.35 1.12 0.15 0.43 14 838 1.66 1.68 0.18 0.41 15 838 2.43 1.98 0.27 0.60 16 838 1.59 1.25 0.18 0.55 1 819 2.51 2.01 0.28 0.60 2 819 1.78 1.47 0.20 0.45 3 819 1.83 1.38 0.20 0.60 4 819 2.56 2.04 0.28 0.66 5 819 2.09 1.59 0.23 0.62 6 819 1.76 1.40 0.20 0.60 7 819 1.68 1.31 0.19 0.53
Mathematics 7 8 9
819 819
1.93 2.21
1.50 1.78
0.21 0.25
0.66 0.62
10 819 1.79 1.40 0.20 0.60 11 819 1.96 1.57 0.22 0.65 12 819 1.65 1.49 0.18 0.50 13 819 2.05 1.60 0.23 0.62 14 819 2.31 1.81 0.26 0.69 15 819 1.85 1.54 0.21 0.57 16 819 2.37 1.81 0.26 0.68 1 765 2.26 2.01 0.25 0.58 2 765 1.62 1.31 0.18 0.58 3 765 1.91 1.40 0.21 0.66 4 765 2.09 1.79 0.23 0.63 5 765 1.70 1.45 0.19 0.55 6 765 2.11 1.68 0.23 0.67 7 765 2.16 1.78 0.24 0.65
Mathematics 8 8 9
765 765
1.97 1.64
1.50 1.28
0.22 0.18
0.66 0.59
10 765 2.08 1.54 0.23 0.69 11 765 2.02 1.64 0.22 0.64 12 765 1.56 1.28 0.17 0.56 13 765 2.28 1.80 0.25 0.63 14 765 1.61 1.26 0.18 0.58 15 765 1.83 1.37 0.20 0.66 16 765 1.78 1.59 0.20 0.57
(cont‘d)
Appendix I— Item Analysis Results 199 2007-08 Florida ALT Technical Report

Content Area Grade Item
Position N Mean Rubric Score s.d. Difficulty Discrimination
Mathematics 9
1 2 3 4 5 6 7 8 9
10 11 12 13 14 15 16
872 872 872 872 872 872 872 872 872 872 872 872 872 872 872 872
2.80 1.60 2.25 1.63 2.18 2.15 1.98 1.88 1.75 2.32 1.71 2.40 2.01 1.54 1.73 2.65
2.24 1.34 1.94 1.32 1.68 1.76 1.78 1.49 1.32 2.08 1.50 1.81 1.64 1.27 1.34 2.44
0.31 0.18 0.25 0.18 0.24 0.24 0.22 0.21 0.19 0.26 0.19 0.27 0.22 0.17 0.19 0.29
0.60 0.50 0.52 0.37 0.56 0.55 0.46 0.50 0.48 0.56 0.48 0.66 0.56 0.45 0.55 0.59
Mathematics 10
1 2 3 4 5 6 7 8 9
10 11 12 13 14 15 16
848 848 848 848 848 848 848 848 848 848 848 848 848 848 848 848
1.97 2.23 1.94 1.84 2.48 2.22 2.01 2.15 1.85 2.22 1.98 2.41 2.52 1.99 2.02 2.14
1.57 1.76 1.38 1.64 1.78 1.69 1.66 1.60 1.31 1.80 1.50 1.65 1.80 1.37 1.77 1.68
0.22 0.25 0.22 0.20 0.28 0.25 0.22 0.24 0.21 0.25 0.22 0.27 0.28 0.22 0.22 0.24
0.45 0.55 0.57 0.49 0.60 0.57 0.54 0.60 0.54 0.56 0.56 0.61 0.63 0.62 0.45 0.58
Appendix I— Item Analysis Results 200 2007-08 Florida ALT Technical Report
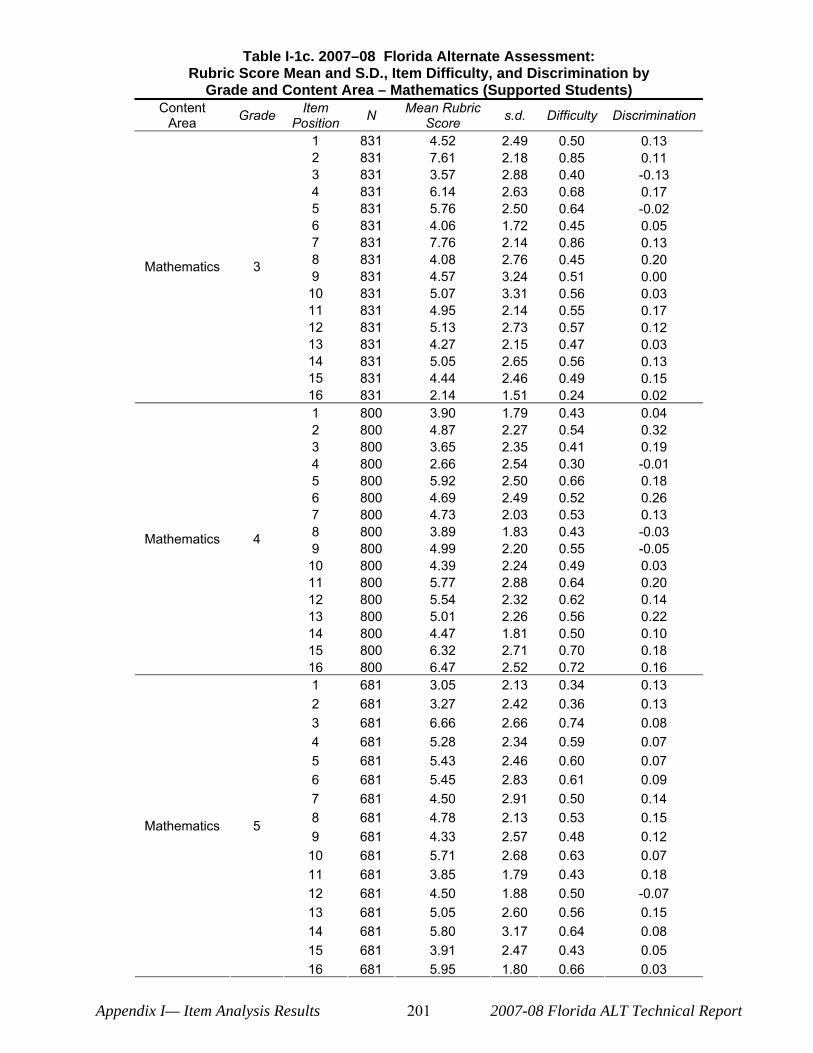
Table I-1c. 2007–08 Florida Alternate Assessment: Rubric Score Mean and S.D., Item Difficulty, and Discrimination by
Grade and Content Area – Mathematics (Supported Students) Content Item Mean Rubric Grade N s.d. Difficulty Discrimination Area Position Score
Mathematics 3
1 2 3 4 5 6 7 8 9 10 11 12 13 14 15 16
831 831 831 831 831 831 831 831 831 831 831 831 831 831 831 831
4.52 7.61 3.57 6.14 5.76 4.06 7.76 4.08 4.57 5.07 4.95 5.13 4.27 5.05 4.44 2.14
2.49 2.18 2.88 2.63 2.50 1.72 2.14 2.76 3.24 3.31 2.14 2.73 2.15 2.65 2.46 1.51
0.50 0.85 0.40 0.68 0.64 0.45 0.86 0.45 0.51 0.56 0.55 0.57 0.47 0.56 0.49 0.24
0.13 0.11 -0.13 0.17 -0.02 0.05 0.13 0.20 0.00 0.03 0.17 0.12 0.03 0.13 0.15 0.02
Mathematics 4
1 2 3 4 5 6 7 8 9 10 11 12 13 14 15 16
800 800 800 800 800 800 800 800 800 800 800 800 800 800 800 800
3.90 4.87 3.65 2.66 5.92 4.69 4.73 3.89 4.99 4.39 5.77 5.54 5.01 4.47 6.32 6.47
1.79 2.27 2.35 2.54 2.50 2.49 2.03 1.83 2.20 2.24 2.88 2.32 2.26 1.81 2.71 2.52
0.43 0.54 0.41 0.30 0.66 0.52 0.53 0.43 0.55 0.49 0.64 0.62 0.56 0.50 0.70 0.72
0.04 0.32 0.19 -0.01 0.18 0.26 0.13 -0.03 -0.05 0.03 0.20 0.14 0.22 0.10 0.18 0.16
1 681 3.05 2.13 0.34 0.13 2 681 3.27 2.42 0.36 0.13 3 681 6.66 2.66 0.74 0.08 4 681 5.28 2.34 0.59 0.07 5 681 5.43 2.46 0.60 0.07 6 681 5.45 2.83 0.61 0.09 7 681 4.50 2.91 0.50 0.14
Mathematics 5 8 9
681 681
4.78 4.33
2.13 2.57
0.53 0.48
0.15 0.12
10 681 5.71 2.68 0.63 0.07 11 681 3.85 1.79 0.43 0.18 12 681 4.50 1.88 0.50 -0.07 13 681 5.05 2.60 0.56 0.15 14 681 5.80 3.17 0.64 0.08 15 681 3.91 2.47 0.43 0.05 16 681 5.95 1.80 0.66 0.03
Appendix I— Item Analysis Results 201 2007-08 Florida ALT Technical Report
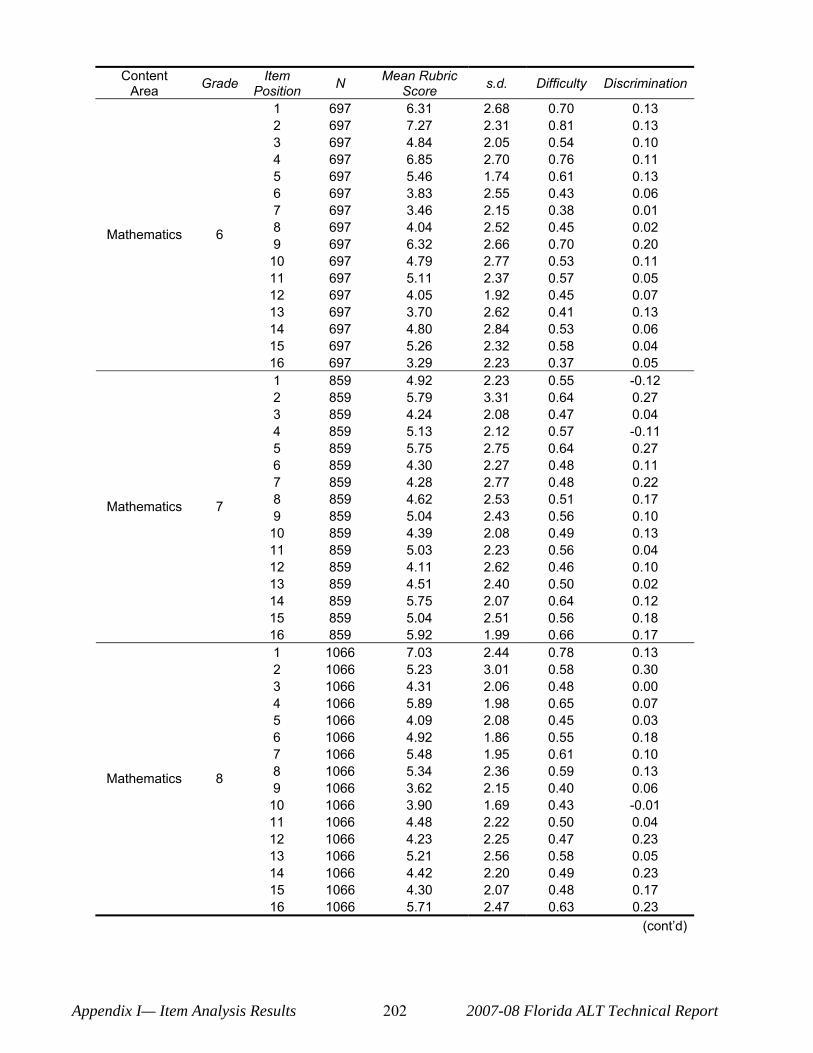
Content Area Grade Item
Position N Mean Rubric Score s.d. Difficulty Discrimination
1 697 6.31 2.68 0.70 0.13 2 697 7.27 2.31 0.81 0.13 3 697 4.84 2.05 0.54 0.10 4 697 6.85 2.70 0.76 0.11 5 697 5.46 1.74 0.61 0.13 6 697 3.83 2.55 0.43 0.06 7 697 3.46 2.15 0.38 0.01
Mathematics 6 8 9
697 697
4.04 6.32
2.52 2.66
0.45 0.70
0.02 0.20
10 697 4.79 2.77 0.53 0.11 11 697 5.11 2.37 0.57 0.05 12 697 4.05 1.92 0.45 0.07 13 697 3.70 2.62 0.41 0.13 14 697 4.80 2.84 0.53 0.06 15 697 5.26 2.32 0.58 0.04 16 697 3.29 2.23 0.37 0.05 1 859 4.92 2.23 0.55 -0.12 2 859 5.79 3.31 0.64 0.27 3 859 4.24 2.08 0.47 0.04 4 859 5.13 2.12 0.57 -0.11 5 859 5.75 2.75 0.64 0.27 6 859 4.30 2.27 0.48 0.11 7 859 4.28 2.77 0.48 0.22
Mathematics 7 8 9
859 859
4.62 5.04
2.53 2.43
0.51 0.56
0.17 0.10
10 859 4.39 2.08 0.49 0.13 11 859 5.03 2.23 0.56 0.04 12 859 4.11 2.62 0.46 0.10 13 859 4.51 2.40 0.50 0.02 14 859 5.75 2.07 0.64 0.12 15 859 5.04 2.51 0.56 0.18 16 859 5.92 1.99 0.66 0.17 1 1066 7.03 2.44 0.78 0.13 2 1066 5.23 3.01 0.58 0.30 3 1066 4.31 2.06 0.48 0.00 4 1066 5.89 1.98 0.65 0.07 5 1066 4.09 2.08 0.45 0.03 6 1066 4.92 1.86 0.55 0.18 7 1066 5.48 1.95 0.61 0.10
Mathematics 8 8 9
1066 1066
5.34 3.62
2.36 2.15
0.59 0.40
0.13 0.06
10 1066 3.90 1.69 0.43 -0.01 11 1066 4.48 2.22 0.50 0.04 12 1066 4.23 2.25 0.47 0.23 13 1066 5.21 2.56 0.58 0.05 14 1066 4.42 2.20 0.49 0.23 15 1066 4.30 2.07 0.48 0.17 16 1066 5.71 2.47 0.63 0.23
(cont‘d)
Appendix I— Item Analysis Results 202 2007-08 Florida ALT Technical Report
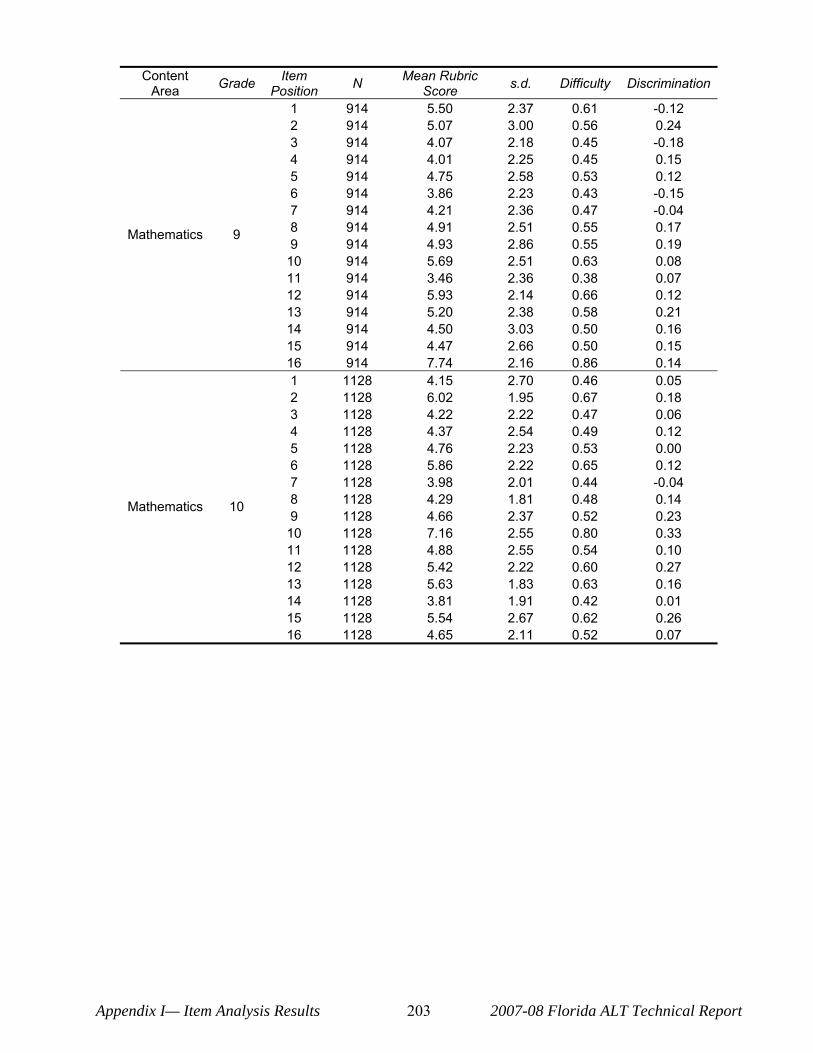
Content Area Grade Item
Position N Mean Rubric Score s.d. Difficulty Discrimination
Mathematics 9
1 2 3 4 5 6 7 8 9
10 11 12 13 14 15 16
914 914 914 914 914 914 914 914 914 914 914 914 914 914 914 914
5.50 5.07 4.07 4.01 4.75 3.86 4.21 4.91 4.93 5.69 3.46 5.93 5.20 4.50 4.47 7.74
2.37 3.00 2.18 2.25 2.58 2.23 2.36 2.51 2.86 2.51 2.36 2.14 2.38 3.03 2.66 2.16
0.61 0.56 0.45 0.45 0.53 0.43 0.47 0.55 0.55 0.63 0.38 0.66 0.58 0.50 0.50 0.86
-0.12 0.24 -0.18 0.15 0.12 -0.15 -0.04 0.17 0.19 0.08 0.07 0.12 0.21 0.16 0.15 0.14
Mathematics 10
1 2 3 4 5 6 7 8 9
10 11 12 13 14 15 16
1128 1128 1128 1128 1128 1128 1128 1128 1128 1128 1128 1128 1128 1128 1128 1128
4.15 6.02 4.22 4.37 4.76 5.86 3.98 4.29 4.66 7.16 4.88 5.42 5.63 3.81 5.54 4.65
2.70 1.95 2.22 2.54 2.23 2.22 2.01 1.81 2.37 2.55 2.55 2.22 1.83 1.91 2.67 2.11
0.46 0.67 0.47 0.49 0.53 0.65 0.44 0.48 0.52 0.80 0.54 0.60 0.63 0.42 0.62 0.52
0.05 0.18 0.06 0.12 0.00 0.12 -0.04 0.14 0.23 0.33 0.10 0.27 0.16 0.01 0.26 0.07
Appendix I— Item Analysis Results 203 2007-08 Florida ALT Technical Report
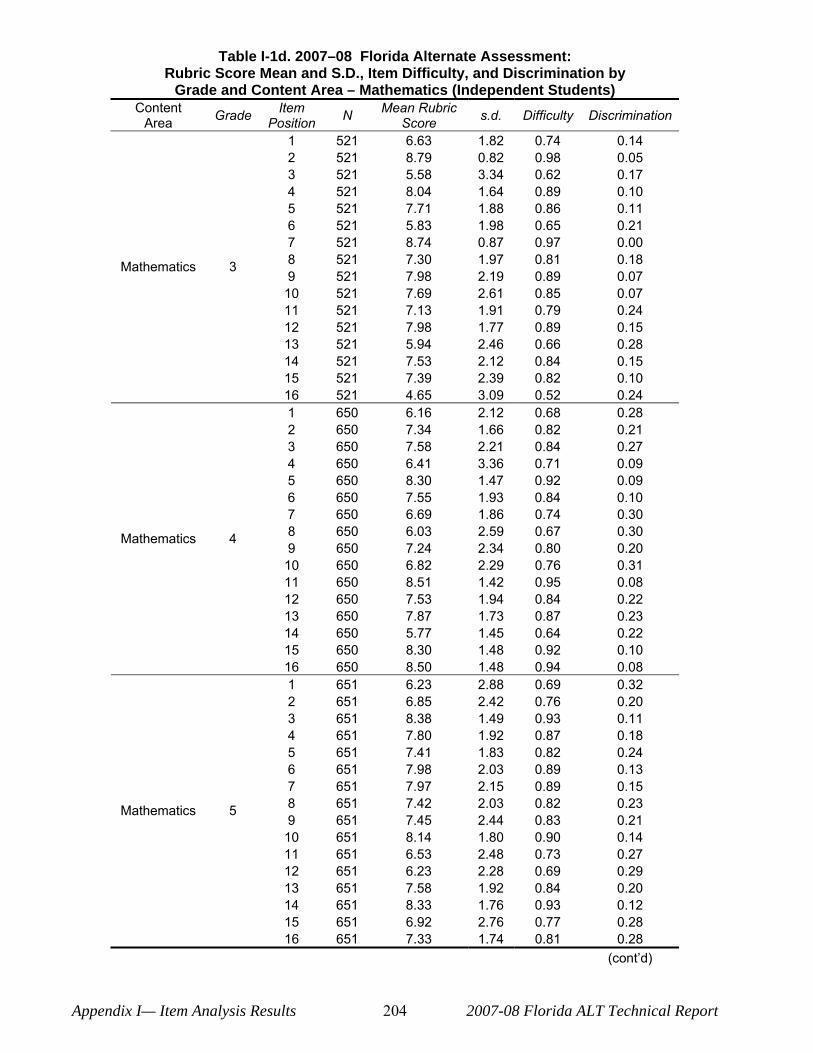
Table I-1d. 2007–08 Florida Alternate Assessment: Rubric Score Mean and S.D., Item Difficulty, and Discrimination by
Grade and Content Area – Mathematics (Independent Students) Content Item Mean Rubric Grade N s.d. Difficulty Discrimination Area Position Score
1 521 6.63 1.82 0.74 0.14 2 521 8.79 0.82 0.98 0.05 3 521 5.58 3.34 0.62 0.17 4 521 8.04 1.64 0.89 0.10 5 521 7.71 1.88 0.86 0.11 6 521 5.83 1.98 0.65 0.21 7 521 8.74 0.87 0.97 0.00
Mathematics 3 8 9
521 521
7.30 7.98
1.97 2.19
0.81 0.89
0.18 0.07
10 521 7.69 2.61 0.85 0.07 11 521 7.13 1.91 0.79 0.24 12 521 7.98 1.77 0.89 0.15 13 521 5.94 2.46 0.66 0.28 14 521 7.53 2.12 0.84 0.15 15 521 7.39 2.39 0.82 0.10 16 521 4.65 3.09 0.52 0.24 1 650 6.16 2.12 0.68 0.28 2 650 7.34 1.66 0.82 0.21 3 650 7.58 2.21 0.84 0.27 4 650 6.41 3.36 0.71 0.09 5 650 8.30 1.47 0.92 0.09 6 650 7.55 1.93 0.84 0.10 7 650 6.69 1.86 0.74 0.30
Mathematics 4 8 9
650 650
6.03 7.24
2.59 2.34
0.67 0.80
0.30 0.20
10 650 6.82 2.29 0.76 0.31 11 650 8.51 1.42 0.95 0.08 12 650 7.53 1.94 0.84 0.22 13 650 7.87 1.73 0.87 0.23 14 650 5.77 1.45 0.64 0.22 15 650 8.30 1.48 0.92 0.10 16 650 8.50 1.48 0.94 0.08 1 651 6.23 2.88 0.69 0.32 2 651 6.85 2.42 0.76 0.20 3 651 8.38 1.49 0.93 0.11 4 651 7.80 1.92 0.87 0.18 5 651 7.41 1.83 0.82 0.24 6 651 7.98 2.03 0.89 0.13 7 651 7.97 2.15 0.89 0.15
Mathematics 5 8 9
651 651
7.42 7.45
2.03 2.44
0.82 0.83
0.23 0.21
10 651 8.14 1.80 0.90 0.14 11 651 6.53 2.48 0.73 0.27 12 651 6.23 2.28 0.69 0.29 13 651 7.58 1.92 0.84 0.20 14 651 8.33 1.76 0.93 0.12 15 651 6.92 2.76 0.77 0.28 16 651 7.33 1.74 0.81 0.28
(cont‘d)
Appendix I— Item Analysis Results 204 2007-08 Florida ALT Technical Report
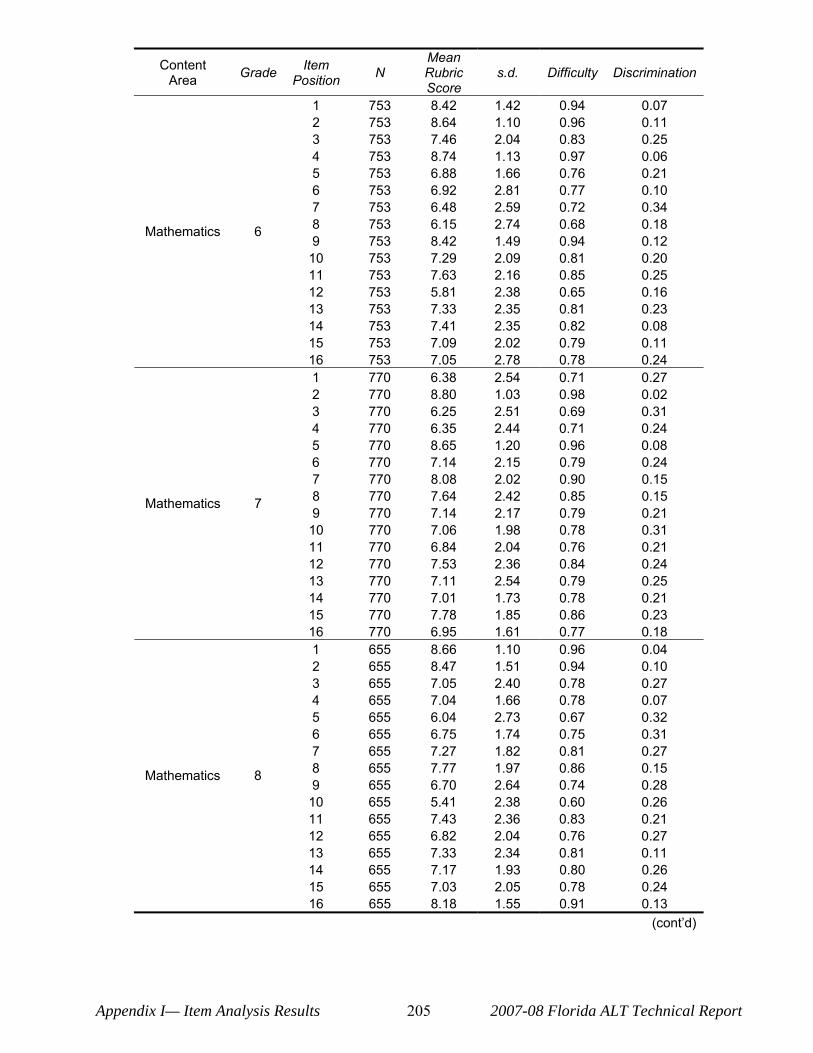
Content Area Grade Item
Position N Mean Rubric Score
s.d. Difficulty Discrimination
1 753 8.42 1.42 0.94 0.07 2 753 8.64 1.10 0.96 0.11 3 753 7.46 2.04 0.83 0.25 4 753 8.74 1.13 0.97 0.06 5 753 6.88 1.66 0.76 0.21 6 753 6.92 2.81 0.77 0.10 7 753 6.48 2.59 0.72 0.34
Mathematics 6 8 9
753 753
6.15 8.42
2.74 1.49
0.68 0.94
0.18 0.12
10 753 7.29 2.09 0.81 0.20 11 753 7.63 2.16 0.85 0.25 12 753 5.81 2.38 0.65 0.16 13 753 7.33 2.35 0.81 0.23 14 753 7.41 2.35 0.82 0.08 15 753 7.09 2.02 0.79 0.11 16 753 7.05 2.78 0.78 0.24 1 770 6.38 2.54 0.71 0.27 2 770 8.80 1.03 0.98 0.02 3 770 6.25 2.51 0.69 0.31 4 770 6.35 2.44 0.71 0.24 5 770 8.65 1.20 0.96 0.08 6 770 7.14 2.15 0.79 0.24 7 770 8.08 2.02 0.90 0.15
Mathematics 7 8 9
770 770
7.64 7.14
2.42 2.17
0.85 0.79
0.15 0.21
10 770 7.06 1.98 0.78 0.31 11 770 6.84 2.04 0.76 0.21 12 770 7.53 2.36 0.84 0.24 13 770 7.11 2.54 0.79 0.25 14 770 7.01 1.73 0.78 0.21 15 770 7.78 1.85 0.86 0.23 16 770 6.95 1.61 0.77 0.18 1 655 8.66 1.10 0.96 0.04 2 655 8.47 1.51 0.94 0.10 3 655 7.05 2.40 0.78 0.27 4 655 7.04 1.66 0.78 0.07 5 655 6.04 2.73 0.67 0.32 6 655 6.75 1.74 0.75 0.31 7 655 7.27 1.82 0.81 0.27
Mathematics 8 8 9
655 655
7.77 6.70
1.97 2.64
0.86 0.74
0.15 0.28
10 655 5.41 2.38 0.60 0.26 11 655 7.43 2.36 0.83 0.21 12 655 6.82 2.04 0.76 0.27 13 655 7.33 2.34 0.81 0.11 14 655 7.17 1.93 0.80 0.26 15 655 7.03 2.05 0.78 0.24 16 655 8.18 1.55 0.91 0.13
(cont‘d)
Appendix I— Item Analysis Results 205 2007-08 Florida ALT Technical Report
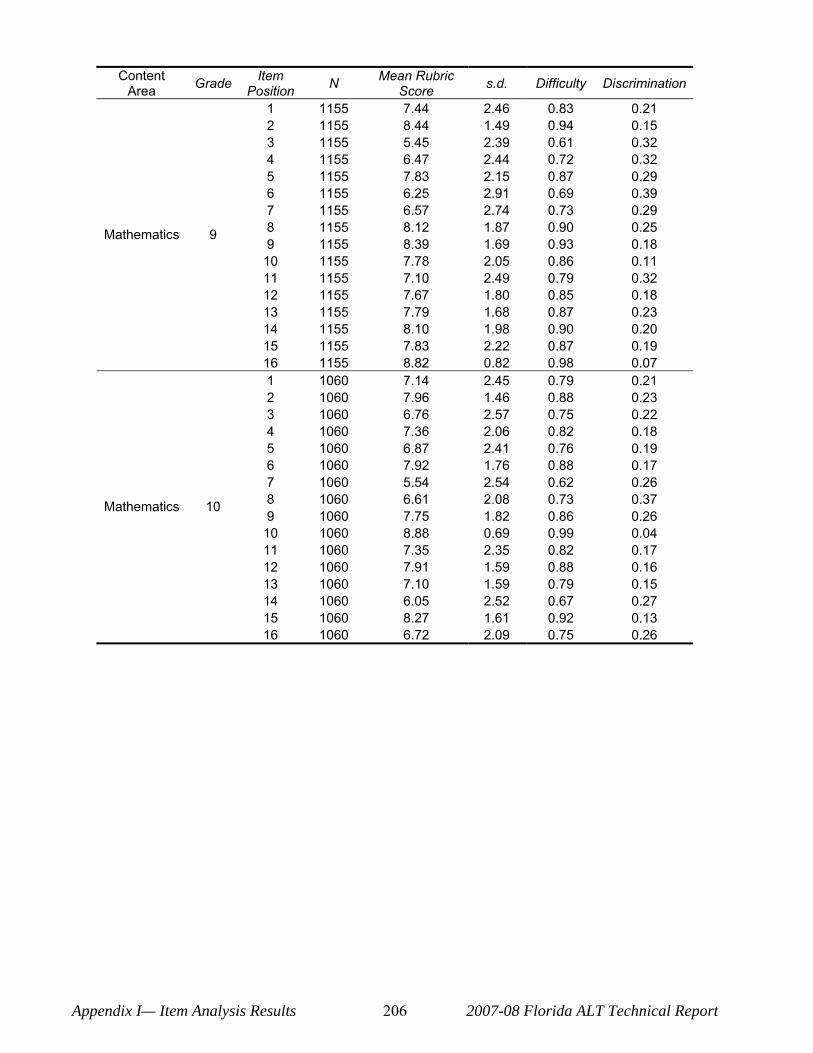
Content Area Grade Item
Position N Mean Rubric Score s.d. Difficulty Discrimination
Mathematics 9
1 2 3 4 5 6 7 8 9
10 11 12 13 14 15 16
1155 1155 1155 1155 1155 1155 1155 1155 1155 1155 1155 1155 1155 1155 1155 1155
7.44 8.44 5.45 6.47 7.83 6.25 6.57 8.12 8.39 7.78 7.10 7.67 7.79 8.10 7.83 8.82
2.46 1.49 2.39 2.44 2.15 2.91 2.74 1.87 1.69 2.05 2.49 1.80 1.68 1.98 2.22 0.82
0.83 0.94 0.61 0.72 0.87 0.69 0.73 0.90 0.93 0.86 0.79 0.85 0.87 0.90 0.87 0.98
0.21 0.15 0.32 0.32 0.29 0.39 0.29 0.25 0.18 0.11 0.32 0.18 0.23 0.20 0.19 0.07
Mathematics 10
1 2 3 4 5 6 7 8 9
10 11 12 13 14 15 16
1060 1060 1060 1060 1060 1060 1060 1060 1060 1060 1060 1060 1060 1060 1060 1060
7.14 7.96 6.76 7.36 6.87 7.92 5.54 6.61 7.75 8.88 7.35 7.91 7.10 6.05 8.27 6.72
2.45 1.46 2.57 2.06 2.41 1.76 2.54 2.08 1.82 0.69 2.35 1.59 1.59 2.52 1.61 2.09
0.79 0.88 0.75 0.82 0.76 0.88 0.62 0.73 0.86 0.99 0.82 0.88 0.79 0.67 0.92 0.75
0.21 0.23 0.22 0.18 0.19 0.17 0.26 0.37 0.26 0.04 0.17 0.16 0.15 0.27 0.13 0.26
Appendix I— Item Analysis Results 206 2007-08 Florida ALT Technical Report
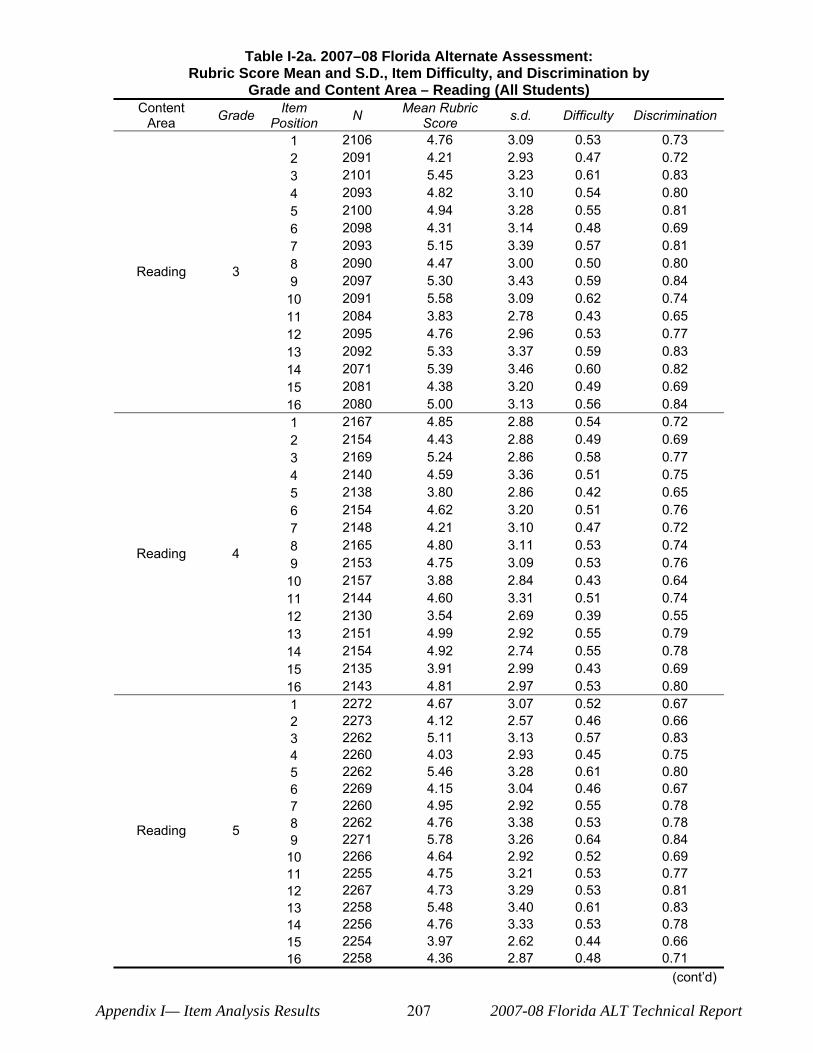
Table I-2a. 2007–08 Florida Alternate Assessment: Rubric Score Mean and S.D., Item Difficulty, and Discrimination by
Grade and Content Area – Reading (All Students) Content Item Mean Rubric Grade N s.d. Difficulty Discrimination Area Position Score
1 2106 4.76 3.09 0.53 0.73 2 2091 4.21 2.93 0.47 0.72 3 2101 5.45 3.23 0.61 0.83 4 2093 4.82 3.10 0.54 0.80 5 2100 4.94 3.28 0.55 0.81 6 2098 4.31 3.14 0.48 0.69 7 2093 5.15 3.39 0.57 0.81
Reading 3 8 9
2090 2097
4.47 5.30
3.00 3.43
0.50 0.59
0.80 0.84
10 2091 5.58 3.09 0.62 0.74 11 2084 3.83 2.78 0.43 0.65 12 2095 4.76 2.96 0.53 0.77 13 2092 5.33 3.37 0.59 0.83 14 2071 5.39 3.46 0.60 0.82 15 2081 4.38 3.20 0.49 0.69 16 2080 5.00 3.13 0.56 0.84 1 2167 4.85 2.88 0.54 0.72 2 2154 4.43 2.88 0.49 0.69 3 2169 5.24 2.86 0.58 0.77 4 2140 4.59 3.36 0.51 0.75 5 2138 3.80 2.86 0.42 0.65 6 2154 4.62 3.20 0.51 0.76 7 2148 4.21 3.10 0.47 0.72
Reading 4 8 9
2165 2153
4.80 4.75
3.11 3.09
0.53 0.53
0.74 0.76
10 2157 3.88 2.84 0.43 0.64 11 2144 4.60 3.31 0.51 0.74 12 2130 3.54 2.69 0.39 0.55 13 2151 4.99 2.92 0.55 0.79 14 2154 4.92 2.74 0.55 0.78 15 2135 3.91 2.99 0.43 0.69 16 2143 4.81 2.97 0.53 0.80 1 2272 4.67 3.07 0.52 0.67 2 2273 4.12 2.57 0.46 0.66 3 2262 5.11 3.13 0.57 0.83 4 2260 4.03 2.93 0.45 0.75 5 2262 5.46 3.28 0.61 0.80 6 2269 4.15 3.04 0.46 0.67 7 2260 4.95 2.92 0.55 0.78
Reading 5 8 9
2262 2271
4.76 5.78
3.38 3.26
0.53 0.64
0.78 0.84
10 2266 4.64 2.92 0.52 0.69 11 2255 4.75 3.21 0.53 0.77 12 2267 4.73 3.29 0.53 0.81 13 2258 5.48 3.40 0.61 0.83 14 2256 4.76 3.33 0.53 0.78 15 2254 3.97 2.62 0.44 0.66 16 2258 4.36 2.87 0.48 0.71
(cont‘d)
Appendix I— Item Analysis Results 207 2007-08 Florida ALT Technical Report
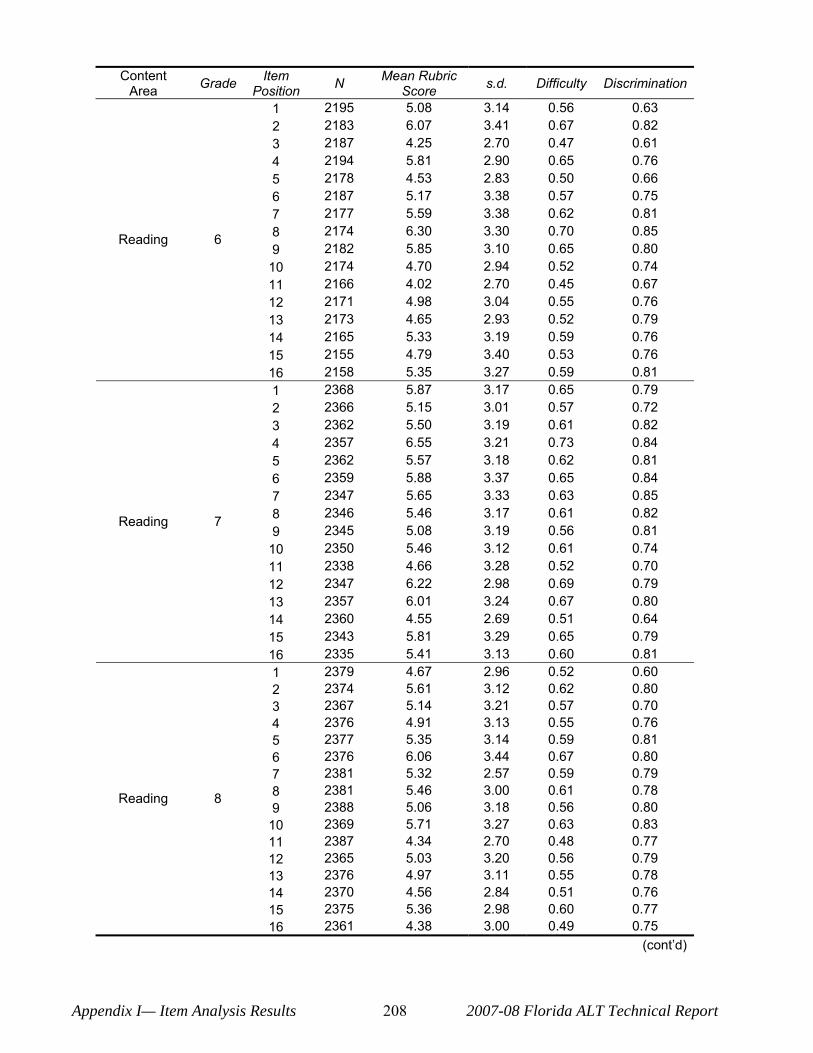
Content
Area Grade Item Position N Mean Rubric
Score s.d. Difficulty Discrimination
1 2195 5.08 3.14 0.56 0.63 2 2183 6.07 3.41 0.67 0.82 3 2187 4.25 2.70 0.47 0.61 4 2194 5.81 2.90 0.65 0.76 5 2178 4.53 2.83 0.50 0.66 6 2187 5.17 3.38 0.57 0.75 7 2177 5.59 3.38 0.62 0.81
Reading 6 8 9
2174 2182
6.30 5.85
3.30 3.10
0.70 0.65
0.85 0.80
10 2174 4.70 2.94 0.52 0.74 11 2166 4.02 2.70 0.45 0.67 12 2171 4.98 3.04 0.55 0.76 13 2173 4.65 2.93 0.52 0.79 14 2165 5.33 3.19 0.59 0.76 15 2155 4.79 3.40 0.53 0.76 16 2158 5.35 3.27 0.59 0.81 1 2368 5.87 3.17 0.65 0.79 2 2366 5.15 3.01 0.57 0.72 3 2362 5.50 3.19 0.61 0.82 4 2357 6.55 3.21 0.73 0.84 5 2362 5.57 3.18 0.62 0.81 6 2359 5.88 3.37 0.65 0.84 7 2347 5.65 3.33 0.63 0.85
Reading 7 8 9
2346 2345
5.46 5.08
3.17 3.19
0.61 0.56
0.82 0.81
10 2350 5.46 3.12 0.61 0.74 11 2338 4.66 3.28 0.52 0.70 12 2347 6.22 2.98 0.69 0.79 13 2357 6.01 3.24 0.67 0.80 14 2360 4.55 2.69 0.51 0.64 15 2343 5.81 3.29 0.65 0.79 16 2335 5.41 3.13 0.60 0.81 1 2379 4.67 2.96 0.52 0.60 2 2374 5.61 3.12 0.62 0.80 3 2367 5.14 3.21 0.57 0.70 4 2376 4.91 3.13 0.55 0.76 5 2377 5.35 3.14 0.59 0.81 6 2376 6.06 3.44 0.67 0.80 7 2381 5.32 2.57 0.59 0.79
Reading 8 8 9
2381 2388
5.46 5.06
3.00 3.18
0.61 0.56
0.78 0.80
10 2369 5.71 3.27 0.63 0.83 11 2387 4.34 2.70 0.48 0.77 12 2365 5.03 3.20 0.56 0.79 13 2376 4.97 3.11 0.55 0.78 14 2370 4.56 2.84 0.51 0.76 15 2375 5.36 2.98 0.60 0.77 16 2361 4.38 3.00 0.49 0.75
(cont‘d)
Appendix I— Item Analysis Results 208 2007-08 Florida ALT Technical Report
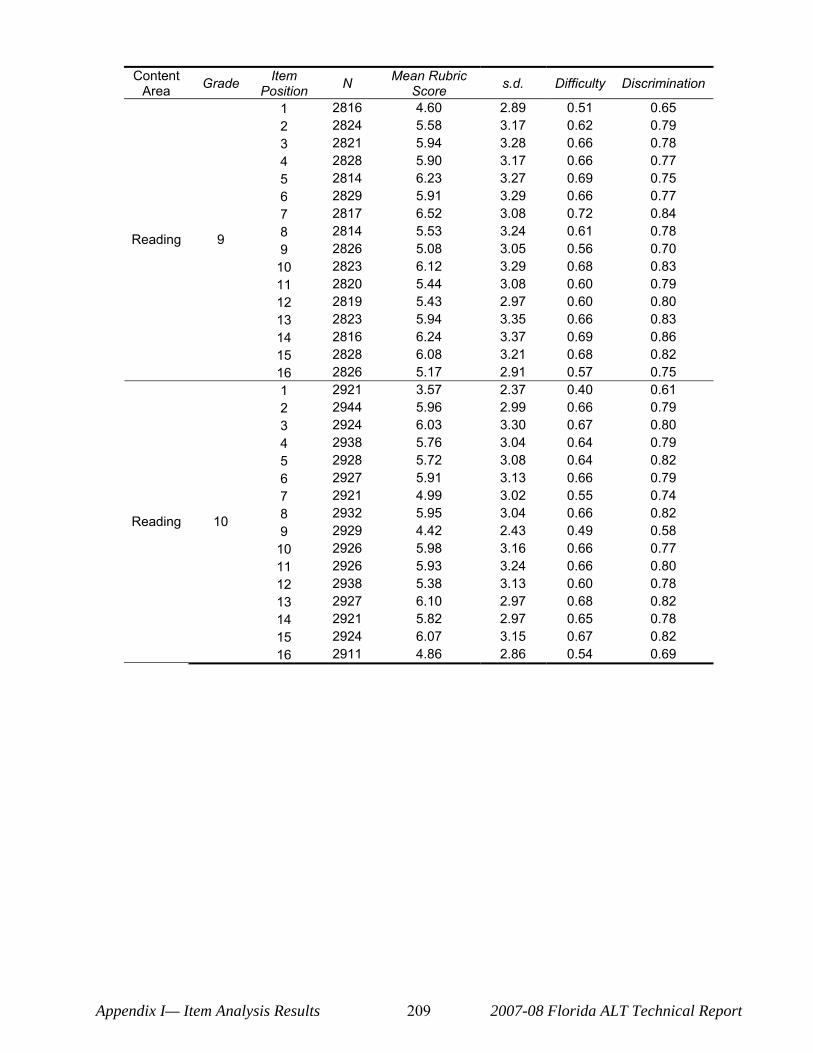
Content Area Grade Item
Position N Mean Rubric Score s.d. Difficulty Discrimination
1 2816 4.60 2.89 0.51 0.65 2 2824 5.58 3.17 0.62 0.79 3 2821 5.94 3.28 0.66 0.78 4 2828 5.90 3.17 0.66 0.77 5 2814 6.23 3.27 0.69 0.75 6 2829 5.91 3.29 0.66 0.77 7 2817 6.52 3.08 0.72 0.84
Reading 9 8 9
2814 2826
5.53 5.08
3.24 3.05
0.61 0.56
0.78 0.70
10 2823 6.12 3.29 0.68 0.83 11 2820 5.44 3.08 0.60 0.79 12 2819 5.43 2.97 0.60 0.80 13 2823 5.94 3.35 0.66 0.83 14 2816 6.24 3.37 0.69 0.86 15 2828 6.08 3.21 0.68 0.82 16 2826 5.17 2.91 0.57 0.75 1 2921 3.57 2.37 0.40 0.61 2 2944 5.96 2.99 0.66 0.79 3 2924 6.03 3.30 0.67 0.80 4 2938 5.76 3.04 0.64 0.79 5 2928 5.72 3.08 0.64 0.82 6 2927 5.91 3.13 0.66 0.79 7 2921 4.99 3.02 0.55 0.74
Reading 10 8 9
2932 2929
5.95 4.42
3.04 2.43
0.66 0.49
0.82 0.58
10 2926 5.98 3.16 0.66 0.77 11 2926 5.93 3.24 0.66 0.80 12 2938 5.38 3.13 0.60 0.78 13 2927 6.10 2.97 0.68 0.82 14 2921 5.82 2.97 0.65 0.78 15 2924 6.07 3.15 0.67 0.82 16 2911 4.86 2.86 0.54 0.69
Appendix I— Item Analysis Results 209 2007-08 Florida ALT Technical Report
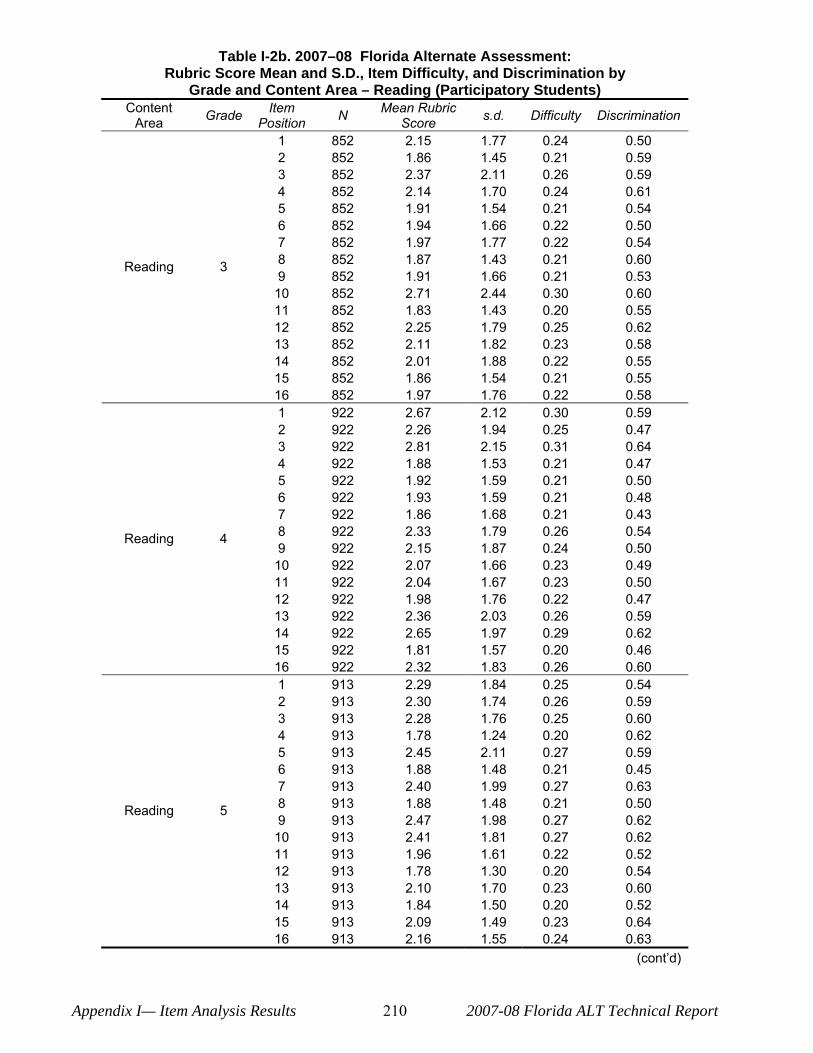
Table I-2b. 2007–08 Florida Alternate Assessment: Rubric Score Mean and S.D., Item Difficulty, and Discrimination by
Grade and Content Area – Reading (Participatory Students) Content Item Mean Rubric Grade N s.d. Difficulty Discrimination Area Position Score
1 852 2.15 1.77 0.24 0.50 2 852 1.86 1.45 0.21 0.59 3 852 2.37 2.11 0.26 0.59 4 852 2.14 1.70 0.24 0.61 5 852 1.91 1.54 0.21 0.54 6 852 1.94 1.66 0.22 0.50 7 852 1.97 1.77 0.22 0.54
Reading 3 8 9
852 852
1.87 1.91
1.43 1.66
0.21 0.21
0.60 0.53
10 852 2.71 2.44 0.30 0.60 11 852 1.83 1.43 0.20 0.55 12 852 2.25 1.79 0.25 0.62 13 852 2.11 1.82 0.23 0.58 14 852 2.01 1.88 0.22 0.55 15 852 1.86 1.54 0.21 0.55 16 852 1.97 1.76 0.22 0.58 1 922 2.67 2.12 0.30 0.59 2 922 2.26 1.94 0.25 0.47 3 922 2.81 2.15 0.31 0.64 4 922 1.88 1.53 0.21 0.47 5 922 1.92 1.59 0.21 0.50 6 922 1.93 1.59 0.21 0.48 7 922 1.86 1.68 0.21 0.43
Reading 4 8 9
922 922
2.33 2.15
1.79 1.87
0.26 0.24
0.54 0.50
10 922 2.07 1.66 0.23 0.49 11 922 2.04 1.67 0.23 0.50 12 922 1.98 1.76 0.22 0.47 13 922 2.36 2.03 0.26 0.59 14 922 2.65 1.97 0.29 0.62 15 922 1.81 1.57 0.20 0.46 16 922 2.32 1.83 0.26 0.60 1 913 2.29 1.84 0.25 0.54 2 913 2.30 1.74 0.26 0.59 3 913 2.28 1.76 0.25 0.60 4 913 1.78 1.24 0.20 0.62 5 913 2.45 2.11 0.27 0.59 6 913 1.88 1.48 0.21 0.45 7 913 2.40 1.99 0.27 0.63
Reading 5 8 9
913 913
1.88 2.47
1.48 1.98
0.21 0.27
0.50 0.62
10 913 2.41 1.81 0.27 0.62 11 913 1.96 1.61 0.22 0.52 12 913 1.78 1.30 0.20 0.54 13 913 2.10 1.70 0.23 0.60 14 913 1.84 1.50 0.20 0.52 15 913 2.09 1.49 0.23 0.64 16 913 2.16 1.55 0.24 0.63
(cont‘d)
Appendix I— Item Analysis Results 210 2007-08 Florida ALT Technical Report
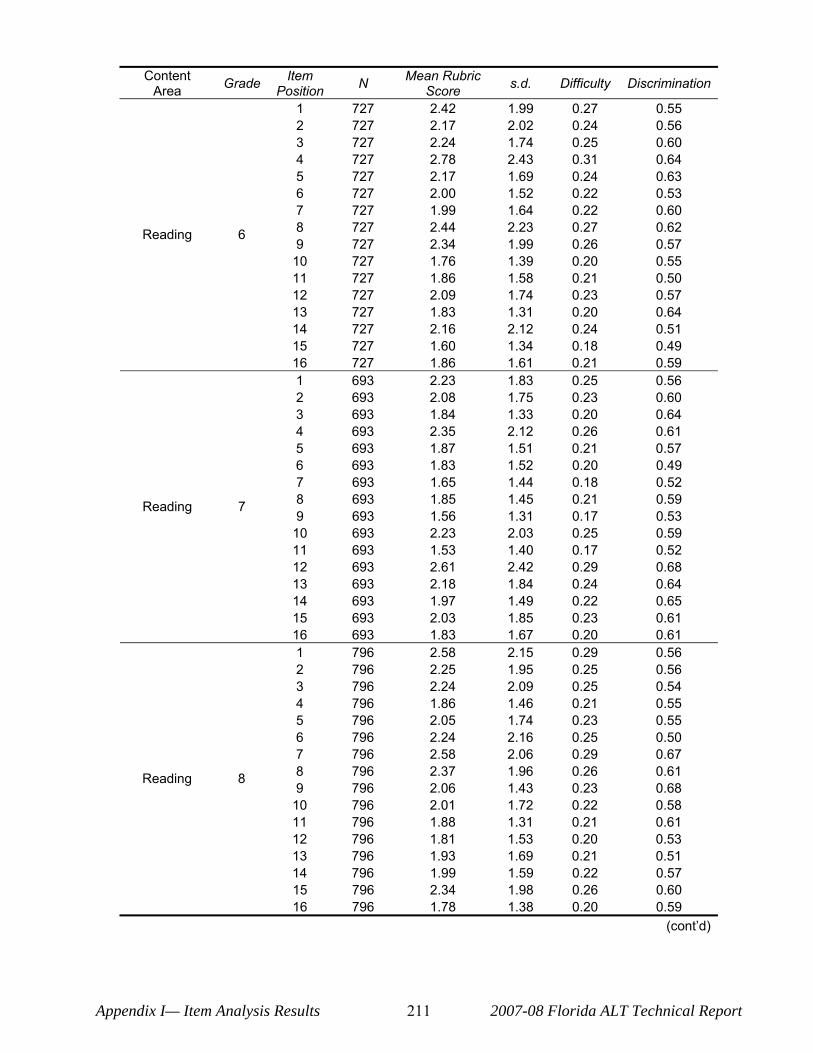
Content Area Grade Item
Position N Mean Rubric Score s.d. Difficulty Discrimination
1 727 2.42 1.99 0.27 0.55 2 727 2.17 2.02 0.24 0.56 3 727 2.24 1.74 0.25 0.60 4 727 2.78 2.43 0.31 0.64 5 727 2.17 1.69 0.24 0.63 6 727 2.00 1.52 0.22 0.53 7 727 1.99 1.64 0.22 0.60
Reading 6 8 9
727 727
2.44 2.34
2.23 1.99
0.27 0.26
0.62 0.57
10 727 1.76 1.39 0.20 0.55 11 727 1.86 1.58 0.21 0.50 12 727 2.09 1.74 0.23 0.57 13 727 1.83 1.31 0.20 0.64 14 727 2.16 2.12 0.24 0.51 15 727 1.60 1.34 0.18 0.49 16 727 1.86 1.61 0.21 0.59 1 693 2.23 1.83 0.25 0.56 2 693 2.08 1.75 0.23 0.60 3 693 1.84 1.33 0.20 0.64 4 693 2.35 2.12 0.26 0.61 5 693 1.87 1.51 0.21 0.57 6 693 1.83 1.52 0.20 0.49 7 693 1.65 1.44 0.18 0.52
Reading 7 8 9
693 693
1.85 1.56
1.45 1.31
0.21 0.17
0.59 0.53
10 693 2.23 2.03 0.25 0.59 11 693 1.53 1.40 0.17 0.52 12 693 2.61 2.42 0.29 0.68 13 693 2.18 1.84 0.24 0.64 14 693 1.97 1.49 0.22 0.65 15 693 2.03 1.85 0.23 0.61 16 693 1.83 1.67 0.20 0.61 1 796 2.58 2.15 0.29 0.56 2 796 2.25 1.95 0.25 0.56 3 796 2.24 2.09 0.25 0.54 4 796 1.86 1.46 0.21 0.55 5 796 2.05 1.74 0.23 0.55 6 796 2.24 2.16 0.25 0.50 7 796 2.58 2.06 0.29 0.67
Reading 8 8 9
796 796
2.37 2.06
1.96 1.43
0.26 0.23
0.61 0.68
10 796 2.01 1.72 0.22 0.58 11 796 1.88 1.31 0.21 0.61 12 796 1.81 1.53 0.20 0.53 13 796 1.93 1.69 0.21 0.51 14 796 1.99 1.59 0.22 0.57 15 796 2.34 1.98 0.26 0.60 16 796 1.78 1.38 0.20 0.59
(cont‘d)
Appendix I— Item Analysis Results 211 2007-08 Florida ALT Technical Report
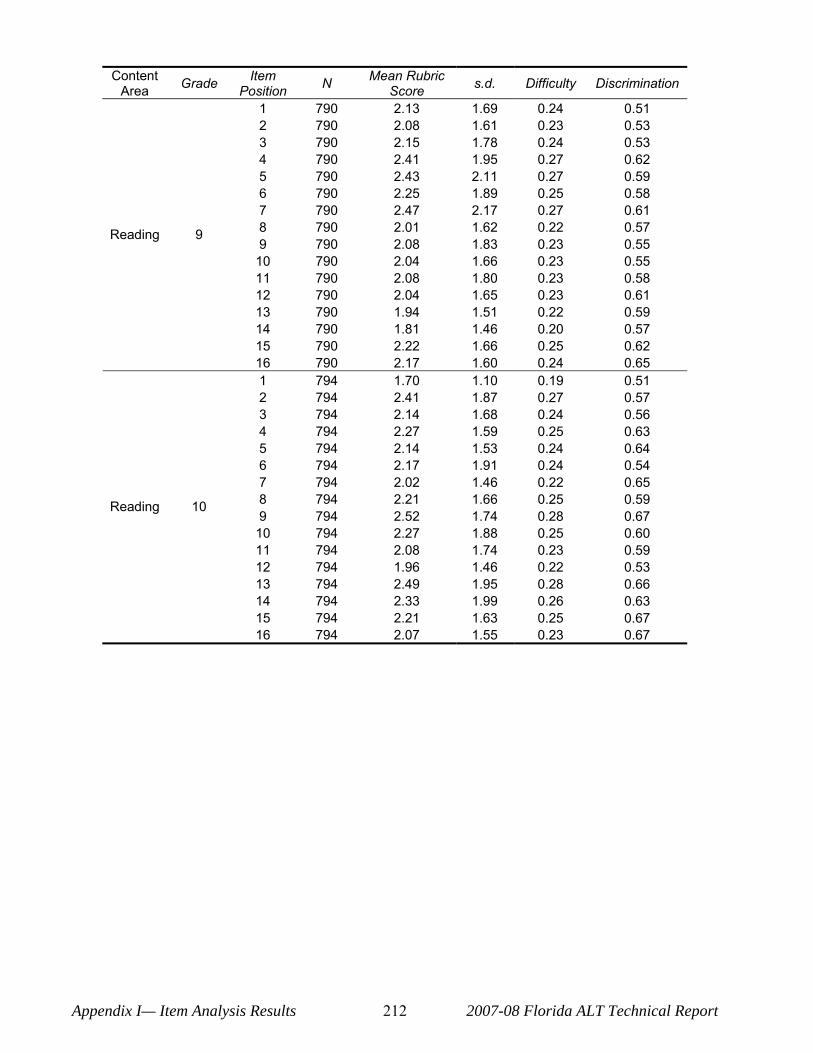
Content Area Grade Item
Position N Mean Rubric Score s.d. Difficulty Discrimination
Reading 9
1 2 3 4 5 6 7 8 9 10 11 12 13 14 15 16
790 790 790 790 790 790 790 790 790 790 790 790 790 790 790 790
2.13 2.08 2.15 2.41 2.43 2.25 2.47 2.01 2.08 2.04 2.08 2.04 1.94 1.81 2.22 2.17
1.69 1.61 1.78 1.95 2.11 1.89 2.17 1.62 1.83 1.66 1.80 1.65 1.51 1.46 1.66 1.60
0.24 0.23 0.24 0.27 0.27 0.25 0.27 0.22 0.23 0.23 0.23 0.23 0.22 0.20 0.25 0.24
0.51 0.53 0.53 0.62 0.59 0.58 0.61 0.57 0.55 0.55 0.58 0.61 0.59 0.57 0.62 0.65
Reading 10
1 2 3 4 5 6 7 8 9 10 11 12 13 14 15 16
794 794 794 794 794 794 794 794 794 794 794 794 794 794 794 794
1.70 2.41 2.14 2.27 2.14 2.17 2.02 2.21 2.52 2.27 2.08 1.96 2.49 2.33 2.21 2.07
1.10 1.87 1.68 1.59 1.53 1.91 1.46 1.66 1.74 1.88 1.74 1.46 1.95 1.99 1.63 1.55
0.19 0.27 0.24 0.25 0.24 0.24 0.22 0.25 0.28 0.25 0.23 0.22 0.28 0.26 0.25 0.23
0.51 0.57 0.56 0.63 0.64 0.54 0.65 0.59 0.67 0.60 0.59 0.53 0.66 0.63 0.67 0.67
Appendix I— Item Analysis Results 212 2007-08 Florida ALT Technical Report
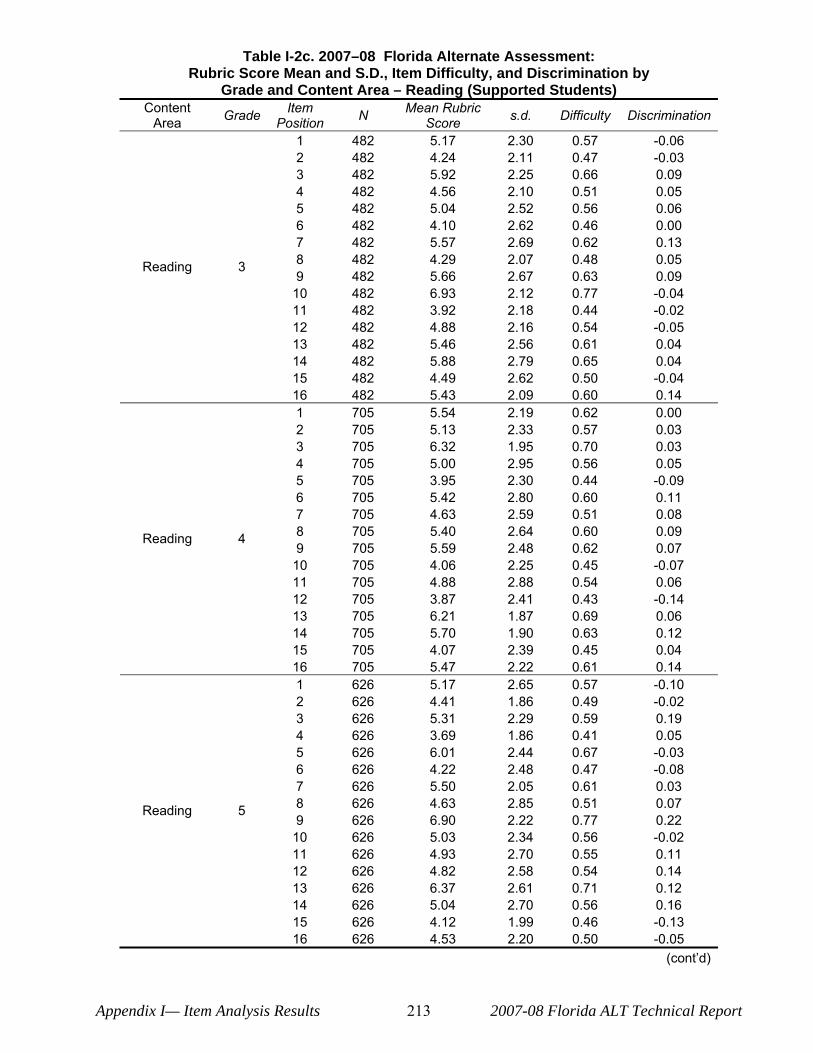
Table I-2c. 2007–08 Florida Alternate Assessment: Rubric Score Mean and S.D., Item Difficulty, and Discrimination by
Grade and Content Area – Reading (Supported Students) Content Item Mean Rubric Grade N s.d. Difficulty Discrimination Area Position Score
1 482 5.17 2.30 0.57 -0.06 2 482 4.24 2.11 0.47 -0.03 3 482 5.92 2.25 0.66 0.09 4 482 4.56 2.10 0.51 0.05 5 482 5.04 2.52 0.56 0.06 6 482 4.10 2.62 0.46 0.00 7 482 5.57 2.69 0.62 0.13
Reading 3 8 9
482 482
4.29 5.66
2.07 2.67
0.48 0.63
0.05 0.09
10 482 6.93 2.12 0.77 -0.04 11 482 3.92 2.18 0.44 -0.02 12 482 4.88 2.16 0.54 -0.05 13 482 5.46 2.56 0.61 0.04 14 482 5.88 2.79 0.65 0.04 15 482 4.49 2.62 0.50 -0.04 16 482 5.43 2.09 0.60 0.14 1 705 5.54 2.19 0.62 0.00 2 705 5.13 2.33 0.57 0.03 3 705 6.32 1.95 0.70 0.03 4 705 5.00 2.95 0.56 0.05 5 705 3.95 2.30 0.44 -0.09 6 705 5.42 2.80 0.60 0.11 7 705 4.63 2.59 0.51 0.08
Reading 4 8 9
705 705
5.40 5.59
2.64 2.48
0.60 0.62
0.09 0.07
10 705 4.06 2.25 0.45 -0.07 11 705 4.88 2.88 0.54 0.06 12 705 3.87 2.41 0.43 -0.14 13 705 6.21 1.87 0.69 0.06 14 705 5.70 1.90 0.63 0.12 15 705 4.07 2.39 0.45 0.04 16 705 5.47 2.22 0.61 0.14 1 626 5.17 2.65 0.57 -0.10 2 626 4.41 1.86 0.49 -0.02 3 626 5.31 2.29 0.59 0.19 4 626 3.69 1.86 0.41 0.05 5 626 6.01 2.44 0.67 -0.03 6 626 4.22 2.48 0.47 -0.08 7 626 5.50 2.05 0.61 0.03
Reading 5 8 9
626 626
4.63 6.90
2.85 2.22
0.51 0.77
0.07 0.22
10 626 5.03 2.34 0.56 -0.02 11 626 4.93 2.70 0.55 0.11 12 626 4.82 2.58 0.54 0.14 13 626 6.37 2.61 0.71 0.12 14 626 5.04 2.70 0.56 0.16 15 626 4.12 1.99 0.46 -0.13 16 626 4.53 2.20 0.50 -0.05
(cont‘d)
Appendix I— Item Analysis Results 213 2007-08 Florida ALT Technical Report
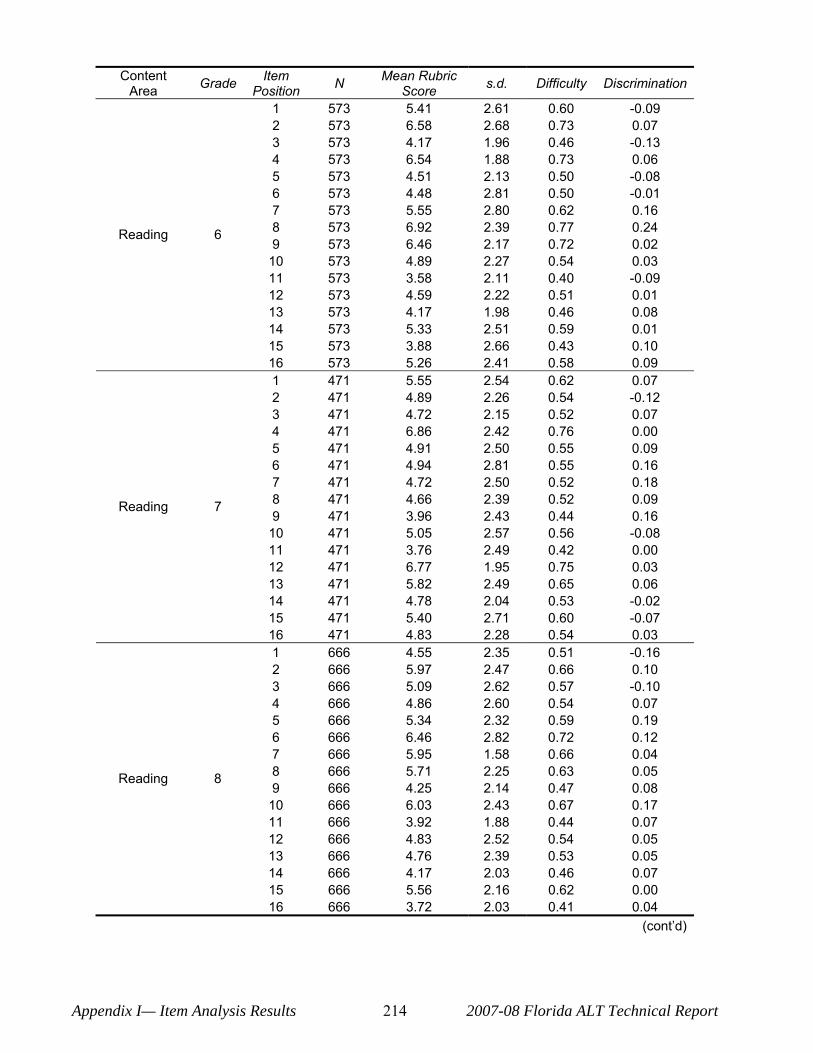
Content Area Grade Item
Position N Mean Rubric Score s.d. Difficulty Discrimination
1 573 5.41 2.61 0.60 -0.09 2 573 6.58 2.68 0.73 0.07 3 573 4.17 1.96 0.46 -0.13 4 573 6.54 1.88 0.73 0.06 5 573 4.51 2.13 0.50 -0.08 6 573 4.48 2.81 0.50 -0.01 7 573 5.55 2.80 0.62 0.16
Reading 6 8 9
573 573
6.92 6.46
2.39 2.17
0.77 0.72
0.24 0.02
10 573 4.89 2.27 0.54 0.03 11 573 3.58 2.11 0.40 -0.09 12 573 4.59 2.22 0.51 0.01 13 573 4.17 1.98 0.46 0.08 14 573 5.33 2.51 0.59 0.01 15 573 3.88 2.66 0.43 0.10 16 573 5.26 2.41 0.58 0.09 1 471 5.55 2.54 0.62 0.07 2 471 4.89 2.26 0.54 -0.12 3 471 4.72 2.15 0.52 0.07 4 471 6.86 2.42 0.76 0.00 5 471 4.91 2.50 0.55 0.09 6 471 4.94 2.81 0.55 0.16 7 471 4.72 2.50 0.52 0.18
Reading 7 8 9
471 471
4.66 3.96
2.39 2.43
0.52 0.44
0.09 0.16
10 471 5.05 2.57 0.56 -0.08 11 471 3.76 2.49 0.42 0.00 12 471 6.77 1.95 0.75 0.03 13 471 5.82 2.49 0.65 0.06 14 471 4.78 2.04 0.53 -0.02 15 471 5.40 2.71 0.60 -0.07 16 471 4.83 2.28 0.54 0.03 1 666 4.55 2.35 0.51 -0.16 2 666 5.97 2.47 0.66 0.10 3 666 5.09 2.62 0.57 -0.10 4 666 4.86 2.60 0.54 0.07 5 666 5.34 2.32 0.59 0.19 6 666 6.46 2.82 0.72 0.12 7 666 5.95 1.58 0.66 0.04
Reading 8 8 9
666 666
5.71 4.25
2.25 2.14
0.63 0.47
0.05 0.08
10 666 6.03 2.43 0.67 0.17 11 666 3.92 1.88 0.44 0.07 12 666 4.83 2.52 0.54 0.05 13 666 4.76 2.39 0.53 0.05 14 666 4.17 2.03 0.46 0.07 15 666 5.56 2.16 0.62 0.00 16 666 3.72 2.03 0.41 0.04
(cont‘d)
Appendix I— Item Analysis Results 214 2007-08 Florida ALT Technical Report
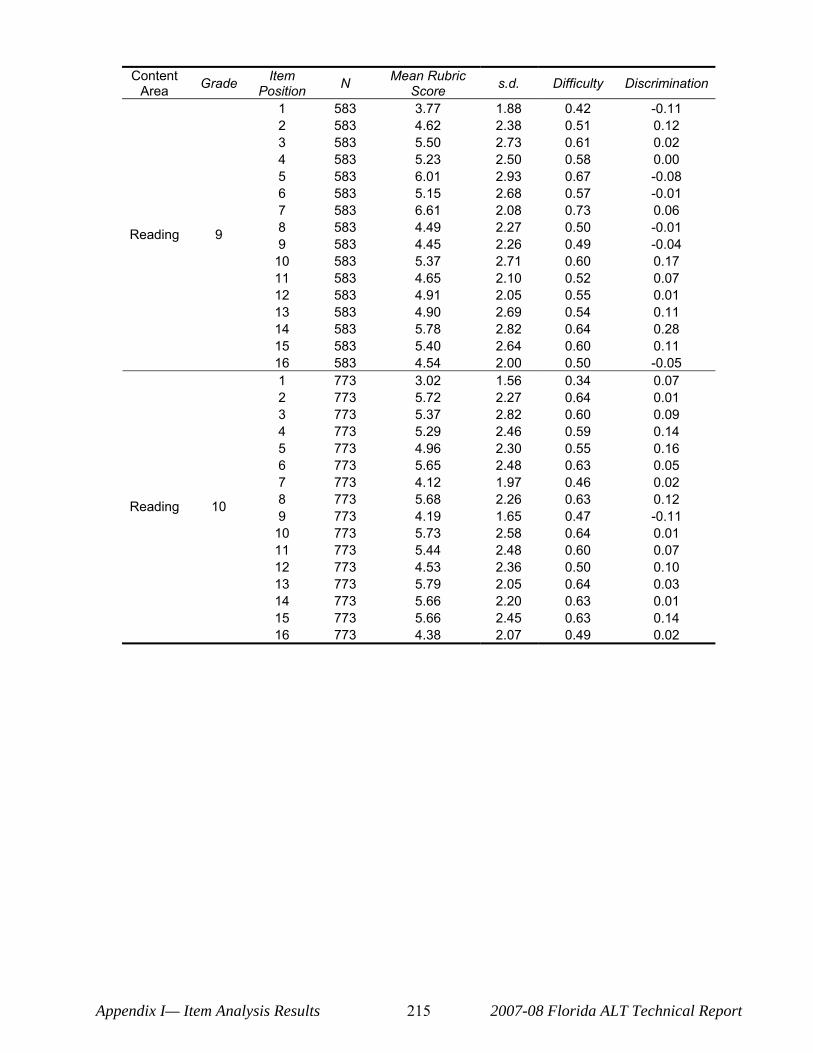
Content Area Grade Item
Position N Mean Rubric Score s.d. Difficulty Discrimination
Reading 9
1 2 3 4 5 6 7 8 9
10 11 12 13 14 15 16
583 583 583 583 583 583 583 583 583 583 583 583 583 583 583 583
3.77 4.62 5.50 5.23 6.01 5.15 6.61 4.49 4.45 5.37 4.65 4.91 4.90 5.78 5.40 4.54
1.88 2.38 2.73 2.50 2.93 2.68 2.08 2.27 2.26 2.71 2.10 2.05 2.69 2.82 2.64 2.00
0.42 0.51 0.61 0.58 0.67 0.57 0.73 0.50 0.49 0.60 0.52 0.55 0.54 0.64 0.60 0.50
-0.11 0.12 0.02 0.00 -0.08 -0.01 0.06 -0.01 -0.04 0.17 0.07 0.01 0.11 0.28 0.11 -0.05
Reading 10
1 2 3 4 5 6 7 8 9
10 11 12 13 14 15 16
773 773 773 773 773 773 773 773 773 773 773 773 773 773 773 773
3.02 5.72 5.37 5.29 4.96 5.65 4.12 5.68 4.19 5.73 5.44 4.53 5.79 5.66 5.66 4.38
1.56 2.27 2.82 2.46 2.30 2.48 1.97 2.26 1.65 2.58 2.48 2.36 2.05 2.20 2.45 2.07
0.34 0.64 0.60 0.59 0.55 0.63 0.46 0.63 0.47 0.64 0.60 0.50 0.64 0.63 0.63 0.49
0.07 0.01 0.09 0.14 0.16 0.05 0.02 0.12 -0.11 0.01 0.07 0.10 0.03 0.01 0.14 0.02
Appendix I— Item Analysis Results 215 2007-08 Florida ALT Technical Report
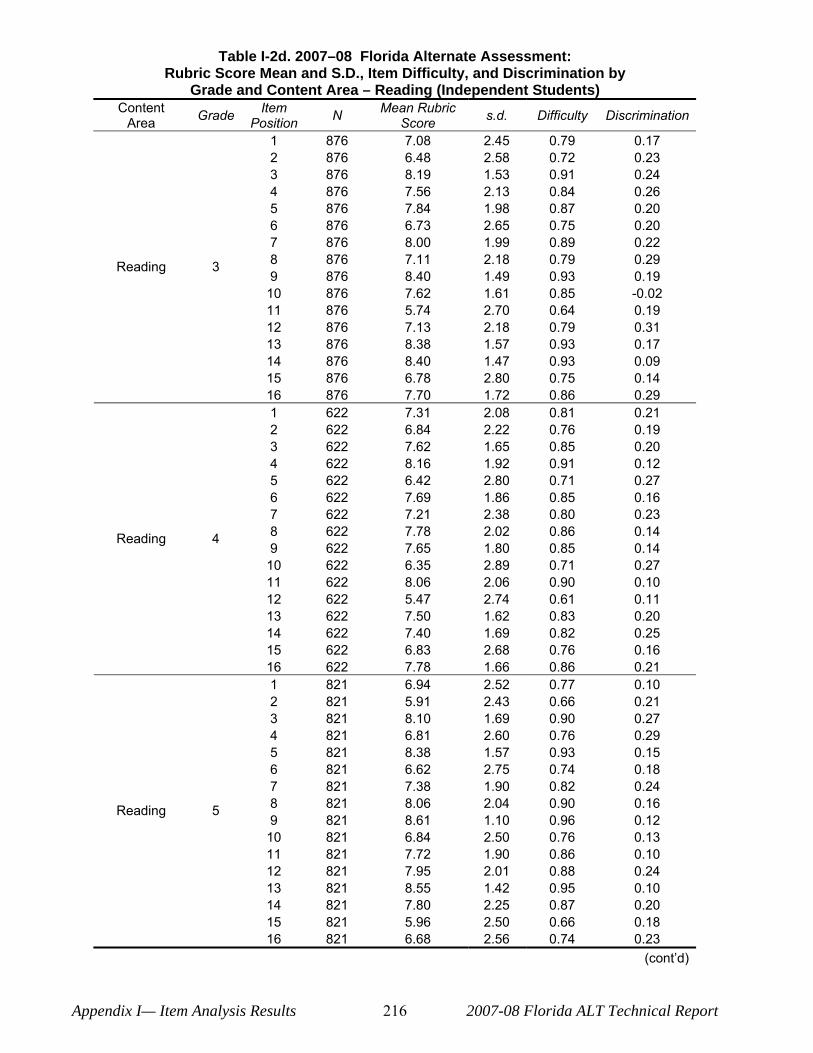
Table I-2d. 2007–08 Florida Alternate Assessment: Rubric Score Mean and S.D., Item Difficulty, and Discrimination by
Grade and Content Area – Reading (Independent Students) Content Item Mean Rubric Grade N s.d. Difficulty Discrimination Area Position Score
1 876 7.08 2.45 0.79 0.17 2 876 6.48 2.58 0.72 0.23 3 876 8.19 1.53 0.91 0.24 4 876 7.56 2.13 0.84 0.26 5 876 7.84 1.98 0.87 0.20 6 876 6.73 2.65 0.75 0.20 7 876 8.00 1.99 0.89 0.22
Reading 3 8 9
876 876
7.11 8.40
2.18 1.49
0.79 0.93
0.29 0.19
10 876 7.62 1.61 0.85 -0.02 11 876 5.74 2.70 0.64 0.19 12 876 7.13 2.18 0.79 0.31 13 876 8.38 1.57 0.93 0.17 14 876 8.40 1.47 0.93 0.09 15 876 6.78 2.80 0.75 0.14 16 876 7.70 1.72 0.86 0.29 1 622 7.31 2.08 0.81 0.21 2 622 6.84 2.22 0.76 0.19 3 622 7.62 1.65 0.85 0.20 4 622 8.16 1.92 0.91 0.12 5 622 6.42 2.80 0.71 0.27 6 622 7.69 1.86 0.85 0.16 7 622 7.21 2.38 0.80 0.23
Reading 4 8 9
622 622
7.78 7.65
2.02 1.80
0.86 0.85
0.14 0.14
10 622 6.35 2.89 0.71 0.27 11 622 8.06 2.06 0.90 0.10 12 622 5.47 2.74 0.61 0.11 13 622 7.50 1.62 0.83 0.20 14 622 7.40 1.69 0.82 0.25 15 622 6.83 2.68 0.76 0.16 16 622 7.78 1.66 0.86 0.21 1 821 6.94 2.52 0.77 0.10 2 821 5.91 2.43 0.66 0.21 3 821 8.10 1.69 0.90 0.27 4 821 6.81 2.60 0.76 0.29 5 821 8.38 1.57 0.93 0.15 6 821 6.62 2.75 0.74 0.18 7 821 7.38 1.90 0.82 0.24
Reading 5 8 9
821 821
8.06 8.61
2.04 1.10
0.90 0.96
0.16 0.12
10 821 6.84 2.50 0.76 0.13 11 821 7.72 1.90 0.86 0.10 12 821 7.95 2.01 0.88 0.24 13 821 8.55 1.42 0.95 0.10 14 821 7.80 2.25 0.87 0.20 15 821 5.96 2.50 0.66 0.18 16 821 6.68 2.56 0.74 0.23
(cont‘d)
Appendix I— Item Analysis Results 216 2007-08 Florida ALT Technical Report
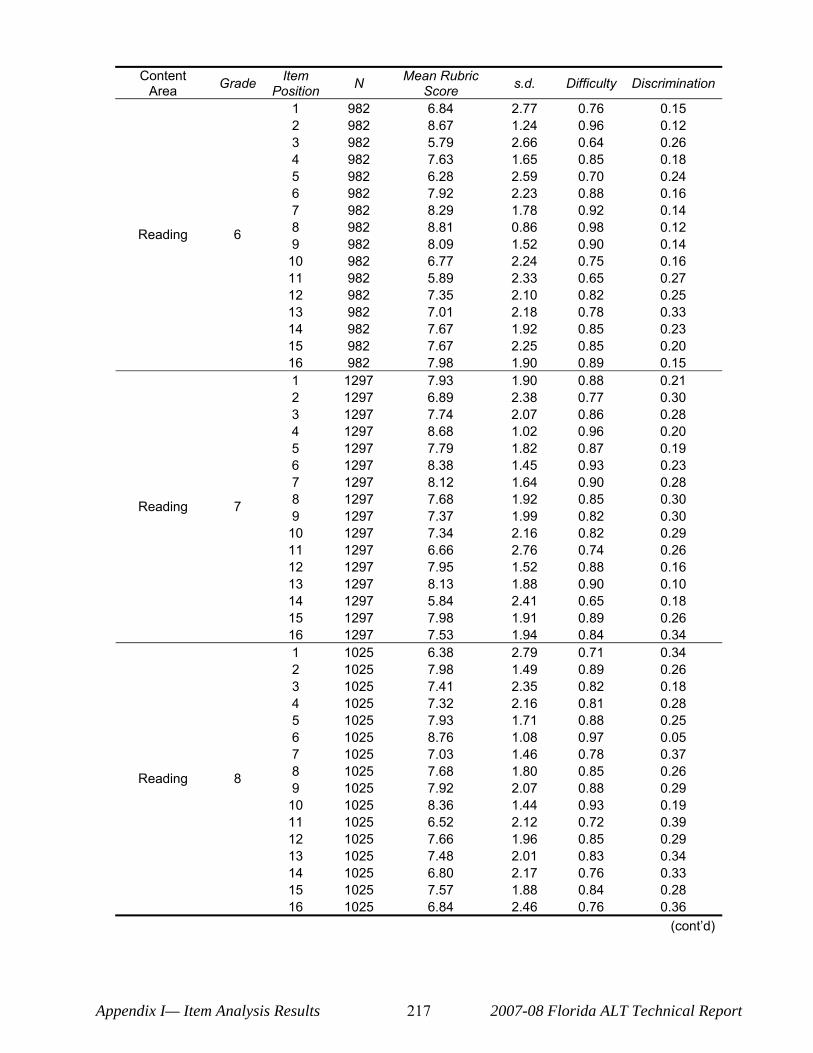
Content Area Grade Item
Position N Mean Rubric Score s.d. Difficulty Discrimination
1 982 6.84 2.77 0.76 0.15 2 982 8.67 1.24 0.96 0.12 3 982 5.79 2.66 0.64 0.26 4 982 7.63 1.65 0.85 0.18 5 982 6.28 2.59 0.70 0.24 6 982 7.92 2.23 0.88 0.16 7 982 8.29 1.78 0.92 0.14
Reading 6 8 9
982 982
8.81 8.09
0.86 1.52
0.98 0.90
0.12 0.14
10 982 6.77 2.24 0.75 0.16 11 982 5.89 2.33 0.65 0.27 12 982 7.35 2.10 0.82 0.25 13 982 7.01 2.18 0.78 0.33 14 982 7.67 1.92 0.85 0.23 15 982 7.67 2.25 0.85 0.20 16 982 7.98 1.90 0.89 0.15 1 1297 7.93 1.90 0.88 0.21 2 1297 6.89 2.38 0.77 0.30 3 1297 7.74 2.07 0.86 0.28 4 1297 8.68 1.02 0.96 0.20 5 1297 7.79 1.82 0.87 0.19 6 1297 8.38 1.45 0.93 0.23 7 1297 8.12 1.64 0.90 0.28
Reading 7 8 9
1297 1297
7.68 7.37
1.92 1.99
0.85 0.82
0.30 0.30
10 1297 7.34 2.16 0.82 0.29 11 1297 6.66 2.76 0.74 0.26 12 1297 7.95 1.52 0.88 0.16 13 1297 8.13 1.88 0.90 0.10 14 1297 5.84 2.41 0.65 0.18 15 1297 7.98 1.91 0.89 0.26 16 1297 7.53 1.94 0.84 0.34 1 1025 6.38 2.79 0.71 0.34 2 1025 7.98 1.49 0.89 0.26 3 1025 7.41 2.35 0.82 0.18 4 1025 7.32 2.16 0.81 0.28 5 1025 7.93 1.71 0.88 0.25 6 1025 8.76 1.08 0.97 0.05 7 1025 7.03 1.46 0.78 0.37
Reading 8 8 9
1025 1025
7.68 7.92
1.80 2.07
0.85 0.88
0.26 0.29
10 1025 8.36 1.44 0.93 0.19 11 1025 6.52 2.12 0.72 0.39 12 1025 7.66 1.96 0.85 0.29 13 1025 7.48 2.01 0.83 0.34 14 1025 6.80 2.17 0.76 0.33 15 1025 7.57 1.88 0.84 0.28 16 1025 6.84 2.46 0.76 0.36
(cont‘d)
Appendix I— Item Analysis Results 217 2007-08 Florida ALT Technical Report
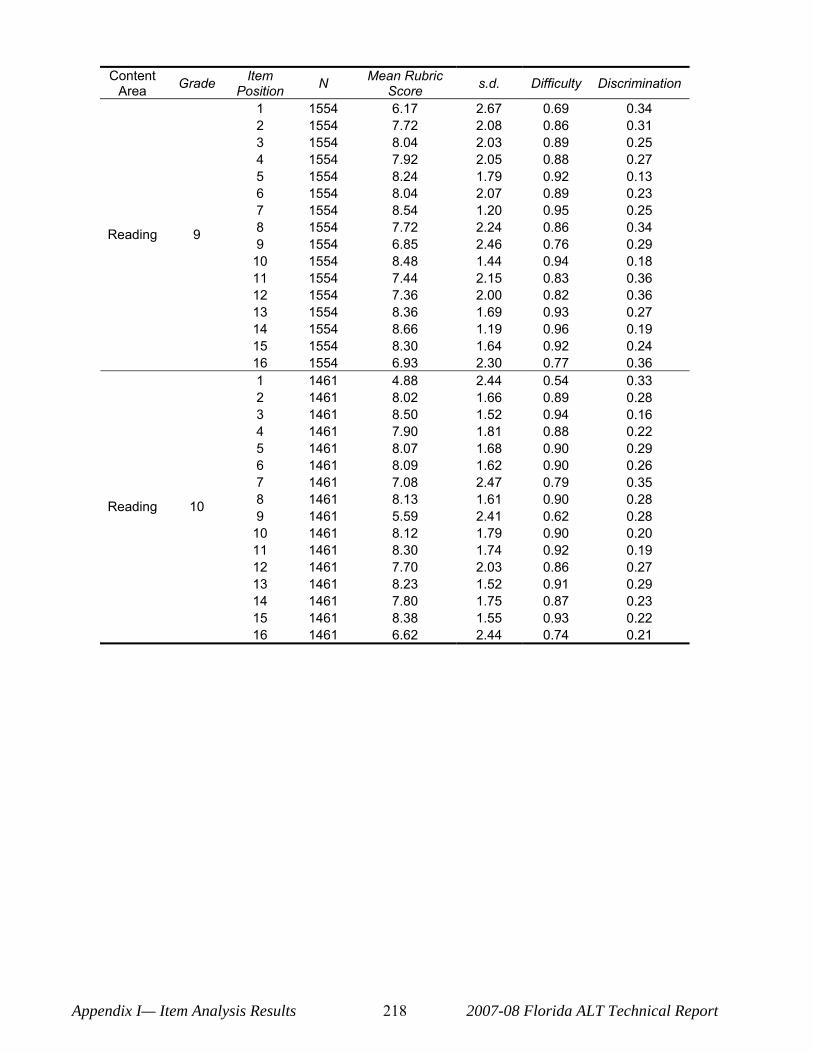
Content Area Grade Item
Position N Mean Rubric Score s.d. Difficulty Discrimination
Reading 9
1 2 3 4 5 6 7 8 9
10 11 12 13 14 15 16
1554 1554 1554 1554 1554 1554 1554 1554 1554 1554 1554 1554 1554 1554 1554 1554
6.17 7.72 8.04 7.92 8.24 8.04 8.54 7.72 6.85 8.48 7.44 7.36 8.36 8.66 8.30 6.93
2.67 2.08 2.03 2.05 1.79 2.07 1.20 2.24 2.46 1.44 2.15 2.00 1.69 1.19 1.64 2.30
0.69 0.86 0.89 0.88 0.92 0.89 0.95 0.86 0.76 0.94 0.83 0.82 0.93 0.96 0.92 0.77
0.34 0.31 0.25 0.27 0.13 0.23 0.25 0.34 0.29 0.18 0.36 0.36 0.27 0.19 0.24 0.36
Reading 10
1 2 3 4 5 6 7 8 9
10 11 12 13 14 15 16
1461 1461 1461 1461 1461 1461 1461 1461 1461 1461 1461 1461 1461 1461 1461 1461
4.88 8.02 8.50 7.90 8.07 8.09 7.08 8.13 5.59 8.12 8.30 7.70 8.23 7.80 8.38 6.62
2.44 1.66 1.52 1.81 1.68 1.62 2.47 1.61 2.41 1.79 1.74 2.03 1.52 1.75 1.55 2.44
0.54 0.89 0.94 0.88 0.90 0.90 0.79 0.90 0.62 0.90 0.92 0.86 0.91 0.87 0.93 0.74
0.33 0.28 0.16 0.22 0.29 0.26 0.35 0.28 0.28 0.20 0.19 0.27 0.29 0.23 0.22 0.21
Appendix I— Item Analysis Results 218 2007-08 Florida ALT Technical Report
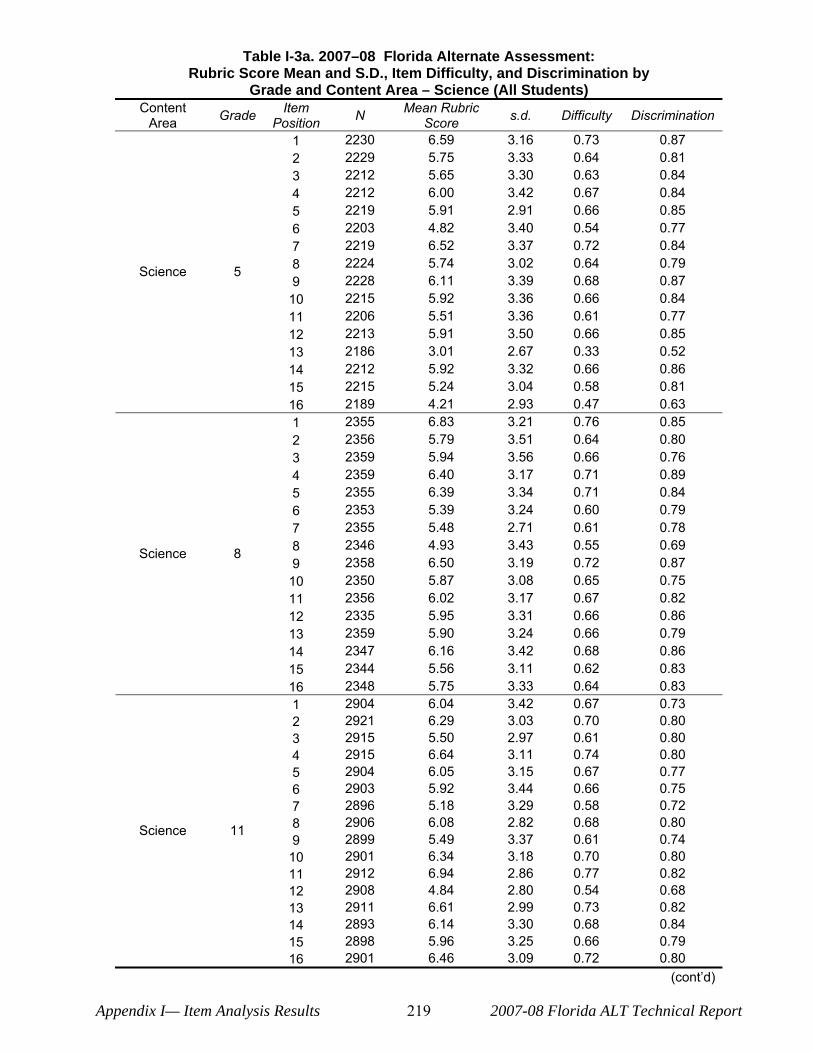
Table I-3a. 2007–08 Florida Alternate Assessment: Rubric Score Mean and S.D., Item Difficulty, and Discrimination by
Grade and Content Area – Science (All Students) Content Item Mean Rubric Grade N s.d. Difficulty Discrimination Area Position Score
1 2230 6.59 3.16 0.73 0.87 2 2229 5.75 3.33 0.64 0.81 3 2212 5.65 3.30 0.63 0.84 4 2212 6.00 3.42 0.67 0.84 5 2219 5.91 2.91 0.66 0.85 6 2203 4.82 3.40 0.54 0.77 7 2219 6.52 3.37 0.72 0.84
Science 5 8 9
2224 2228
5.74 6.11
3.02 3.39
0.64 0.68
0.79 0.87
10 2215 5.92 3.36 0.66 0.84 11 2206 5.51 3.36 0.61 0.77 12 2213 5.91 3.50 0.66 0.85 13 2186 3.01 2.67 0.33 0.52 14 2212 5.92 3.32 0.66 0.86 15 2215 5.24 3.04 0.58 0.81 16 2189 4.21 2.93 0.47 0.63 1 2355 6.83 3.21 0.76 0.85 2 2356 5.79 3.51 0.64 0.80 3 2359 5.94 3.56 0.66 0.76 4 2359 6.40 3.17 0.71 0.89 5 2355 6.39 3.34 0.71 0.84 6 2353 5.39 3.24 0.60 0.79 7 2355 5.48 2.71 0.61 0.78
Science 8 8 9
2346 2358
4.93 6.50
3.43 3.19
0.55 0.72
0.69 0.87
10 2350 5.87 3.08 0.65 0.75 11 2356 6.02 3.17 0.67 0.82 12 2335 5.95 3.31 0.66 0.86 13 2359 5.90 3.24 0.66 0.79 14 2347 6.16 3.42 0.68 0.86 15 2344 5.56 3.11 0.62 0.83 16 2348 5.75 3.33 0.64 0.83 1 2904 6.04 3.42 0.67 0.73 2 2921 6.29 3.03 0.70 0.80 3 2915 5.50 2.97 0.61 0.80 4 2915 6.64 3.11 0.74 0.80 5 2904 6.05 3.15 0.67 0.77 6 2903 5.92 3.44 0.66 0.75 7 2896 5.18 3.29 0.58 0.72
Science 11 8 9
2906 2899
6.08 5.49
2.82 3.37
0.68 0.61
0.80 0.74
10 2901 6.34 3.18 0.70 0.80 11 2912 6.94 2.86 0.77 0.82 12 2908 4.84 2.80 0.54 0.68 13 2911 6.61 2.99 0.73 0.82 14 2893 6.14 3.30 0.68 0.84 15 2898 5.96 3.25 0.66 0.79 16 2901 6.46 3.09 0.72 0.80
(cont‘d)
Appendix I— Item Analysis Results 219 2007-08 Florida ALT Technical Report
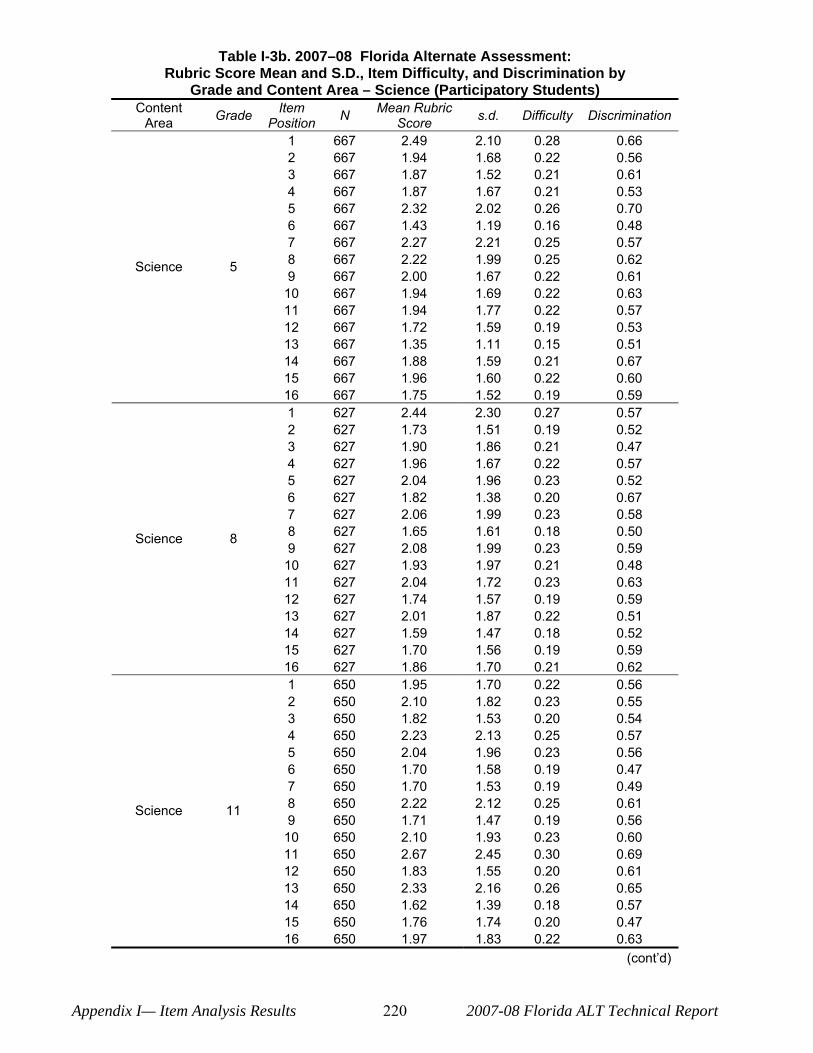
Table I-3b. 2007–08 Florida Alternate Assessment: Rubric Score Mean and S.D., Item Difficulty, and Discrimination by
Grade and Content Area – Science (Participatory Students) Content Item Mean Rubric Grade N s.d. Difficulty Discrimination Area Position Score
1 667 2.49 2.10 0.28 0.66 2 667 1.94 1.68 0.22 0.56 3 667 1.87 1.52 0.21 0.61 4 667 1.87 1.67 0.21 0.53 5 667 2.32 2.02 0.26 0.70 6 667 1.43 1.19 0.16 0.48 7 667 2.27 2.21 0.25 0.57
Science 5 8 9
667 667
2.22 2.00
1.99 1.67
0.25 0.22
0.62 0.61
10 667 1.94 1.69 0.22 0.63 11 667 1.94 1.77 0.22 0.57 12 667 1.72 1.59 0.19 0.53 13 667 1.35 1.11 0.15 0.51 14 667 1.88 1.59 0.21 0.67 15 667 1.96 1.60 0.22 0.60 16 667 1.75 1.52 0.19 0.59 1 627 2.44 2.30 0.27 0.57 2 627 1.73 1.51 0.19 0.52 3 627 1.90 1.86 0.21 0.47 4 627 1.96 1.67 0.22 0.57 5 627 2.04 1.96 0.23 0.52 6 627 1.82 1.38 0.20 0.67 7 627 2.06 1.99 0.23 0.58
Science 8 8 9
627 627
1.65 2.08
1.61 1.99
0.18 0.23
0.50 0.59
10 627 1.93 1.97 0.21 0.48 11 627 2.04 1.72 0.23 0.63 12 627 1.74 1.57 0.19 0.59 13 627 2.01 1.87 0.22 0.51 14 627 1.59 1.47 0.18 0.52 15 627 1.70 1.56 0.19 0.59 16 627 1.86 1.70 0.21 0.62 1 650 1.95 1.70 0.22 0.56 2 650 2.10 1.82 0.23 0.55 3 650 1.82 1.53 0.20 0.54 4 650 2.23 2.13 0.25 0.57 5 650 2.04 1.96 0.23 0.56 6 650 1.70 1.58 0.19 0.47 7 650 1.70 1.53 0.19 0.49
Science 11 8 9
650 650
2.22 1.71
2.12 1.47
0.25 0.19
0.61 0.56
10 650 2.10 1.93 0.23 0.60 11 650 2.67 2.45 0.30 0.69 12 650 1.83 1.55 0.20 0.61 13 650 2.33 2.16 0.26 0.65 14 650 1.62 1.39 0.18 0.57 15 650 1.76 1.74 0.20 0.47 16 650 1.97 1.83 0.22 0.63
(cont‘d)
Appendix I— Item Analysis Results 220 2007-08 Florida ALT Technical Report
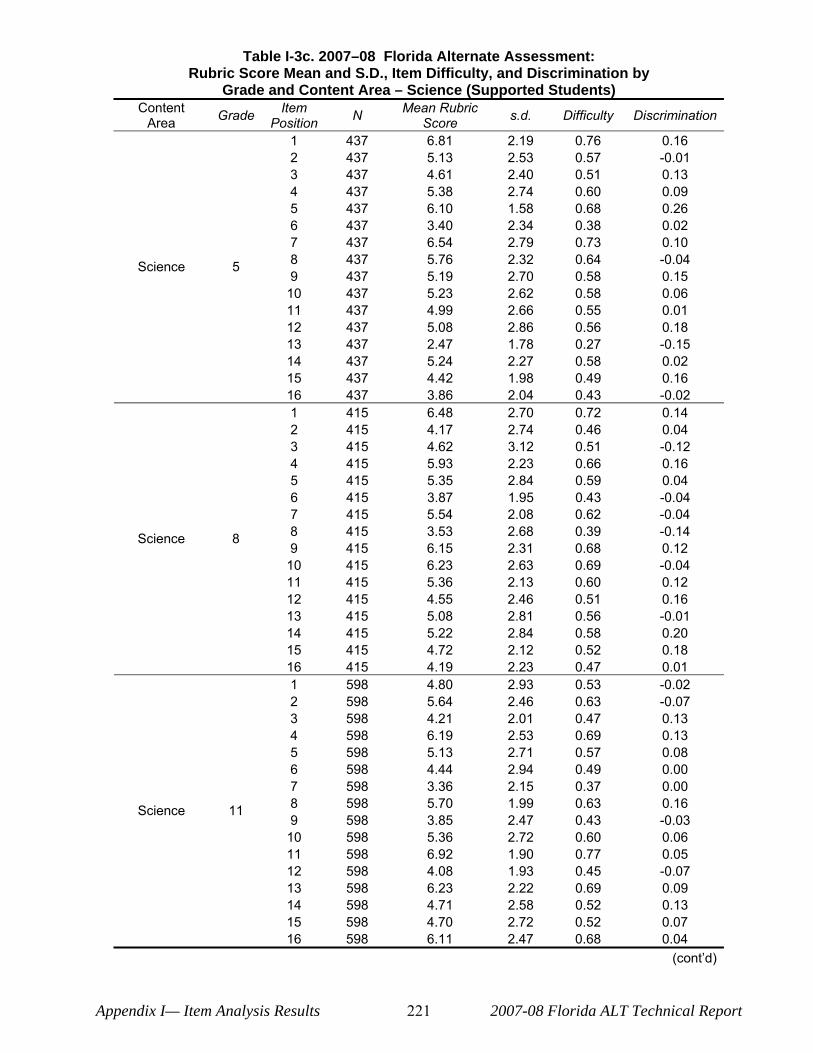
Table I-3c. 2007–08 Florida Alternate Assessment: Rubric Score Mean and S.D., Item Difficulty, and Discrimination by
Grade and Content Area – Science (Supported Students) Content Item Mean Rubric Grade N s.d. Difficulty Discrimination Area Position Score
1 437 6.81 2.19 0.76 0.16 2 437 5.13 2.53 0.57 -0.01 3 437 4.61 2.40 0.51 0.13 4 437 5.38 2.74 0.60 0.09 5 437 6.10 1.58 0.68 0.26 6 437 3.40 2.34 0.38 0.02 7 437 6.54 2.79 0.73 0.10
Science 5 8 9
437 437
5.76 5.19
2.32 2.70
0.64 0.58
-0.04 0.15
10 437 5.23 2.62 0.58 0.06 11 437 4.99 2.66 0.55 0.01 12 437 5.08 2.86 0.56 0.18 13 437 2.47 1.78 0.27 -0.15 14 437 5.24 2.27 0.58 0.02 15 437 4.42 1.98 0.49 0.16 16 437 3.86 2.04 0.43 -0.02 1 415 6.48 2.70 0.72 0.14 2 415 4.17 2.74 0.46 0.04 3 415 4.62 3.12 0.51 -0.12 4 415 5.93 2.23 0.66 0.16 5 415 5.35 2.84 0.59 0.04 6 415 3.87 1.95 0.43 -0.04 7 415 5.54 2.08 0.62 -0.04
Science 8 8 9
415 415
3.53 6.15
2.68 2.31
0.39 0.68
-0.14 0.12
10 415 6.23 2.63 0.69 -0.04 11 415 5.36 2.13 0.60 0.12 12 415 4.55 2.46 0.51 0.16 13 415 5.08 2.81 0.56 -0.01 14 415 5.22 2.84 0.58 0.20 15 415 4.72 2.12 0.52 0.18 16 415 4.19 2.23 0.47 0.01 1 598 4.80 2.93 0.53 -0.02 2 598 5.64 2.46 0.63 -0.07 3 598 4.21 2.01 0.47 0.13 4 598 6.19 2.53 0.69 0.13 5 598 5.13 2.71 0.57 0.08 6 598 4.44 2.94 0.49 0.00 7 598 3.36 2.15 0.37 0.00
Science 11 8 9
598 598
5.70 3.85
1.99 2.47
0.63 0.43
0.16 -0.03
10 598 5.36 2.72 0.60 0.06 11 598 6.92 1.90 0.77 0.05 12 598 4.08 1.93 0.45 -0.07 13 598 6.23 2.22 0.69 0.09 14 598 4.71 2.58 0.52 0.13 15 598 4.70 2.72 0.52 0.07 16 598 6.11 2.47 0.68 0.04
(cont‘d)
Appendix I— Item Analysis Results 221 2007-08 Florida ALT Technical Report
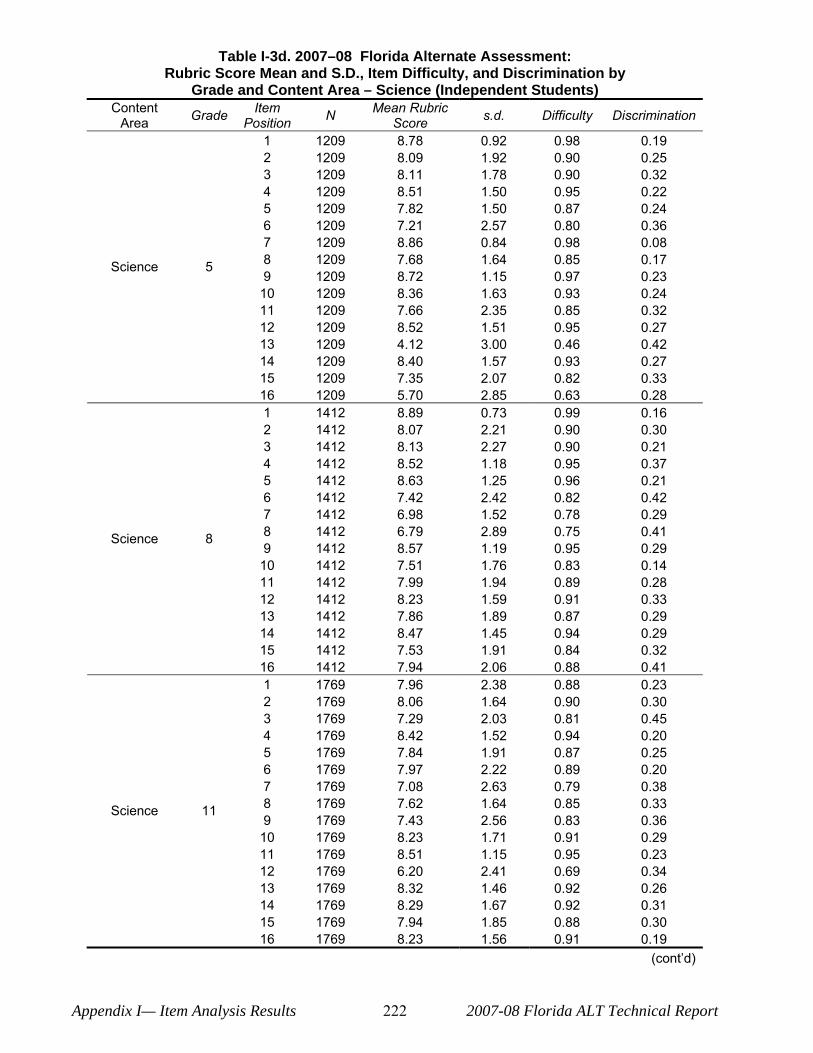
Table I-3d. 2007–08 Florida Alternate Assessment: Rubric Score Mean and S.D., Item Difficulty, and Discrimination by
Grade and Content Area – Science (Independent Students) Content Item Mean Rubric Grade N s.d. Difficulty Discrimination Area Position Score
1 2 3 4 5 6 7 8 9
10 11 12 13 14 15
Science 5
16 1 2 3 4 5 6 7 8 9
10 11 12 13 14 15
Science 8
16 1 2 3 4 5 6 7 8 9
10 11 12 13 14 15
Science 11
16
1209 1209 1209 1209 1209 1209 1209 1209 1209 1209 1209 1209 1209 1209 1209 1209 1412 1412 1412 1412 1412 1412 1412 1412 1412 1412 1412 1412 1412 1412 1412 1412 1769 1769 1769 1769 1769 1769 1769 1769 1769 1769 1769 1769 1769 1769 1769 1769
8.78 8.09 8.11 8.51 7.82 7.21 8.86 7.68 8.72 8.36 7.66 8.52 4.12 8.40 7.35 5.70 8.89 8.07 8.13 8.52 8.63 7.42 6.98 6.79 8.57 7.51 7.99 8.23 7.86 8.47 7.53 7.94 7.96 8.06 7.29 8.42 7.84 7.97 7.08 7.62 7.43 8.23 8.51 6.20 8.32 8.29 7.94 8.23
0.92 0.98 0.19 1.92 0.90 0.25 1.78 0.90 0.32 1.50 0.95 0.22 1.50 0.87 0.24 2.57 0.80 0.36 0.84 0.98 0.08 1.64 0.85 0.17 1.15 0.97 0.23 1.63 0.93 0.24 2.35 0.85 0.32 1.51 0.95 0.27 3.00 0.46 0.42 1.57 0.93 0.27 2.07 0.82 0.33 2.85 0.63 0.28 0.73 0.99 0.16 2.21 0.90 0.30 2.27 0.90 0.21 1.18 0.95 0.37 1.25 0.96 0.21 2.42 0.82 0.42 1.52 0.78 0.29 2.89 0.75 0.41 1.19 0.95 0.29 1.76 0.83 0.14 1.94 0.89 0.28 1.59 0.91 0.33 1.89 0.87 0.29 1.45 0.94 0.29 1.91 0.84 0.32 2.06 0.88 0.41 2.38 0.88 0.23 1.64 0.90 0.30 2.03 0.81 0.45 1.52 0.94 0.20 1.91 0.87 0.25 2.22 0.89 0.20 2.63 0.79 0.38 1.64 0.85 0.33 2.56 0.83 0.36 1.71 0.91 0.29 1.15 0.95 0.23 2.41 0.69 0.34 1.46 0.92 0.26 1.67 0.92 0.31 1.85 0.88 0.30 1.56 0.91 0.19
(cont‘d)
Appendix I— Item Analysis Results 222 2007-08 Florida ALT Technical Report
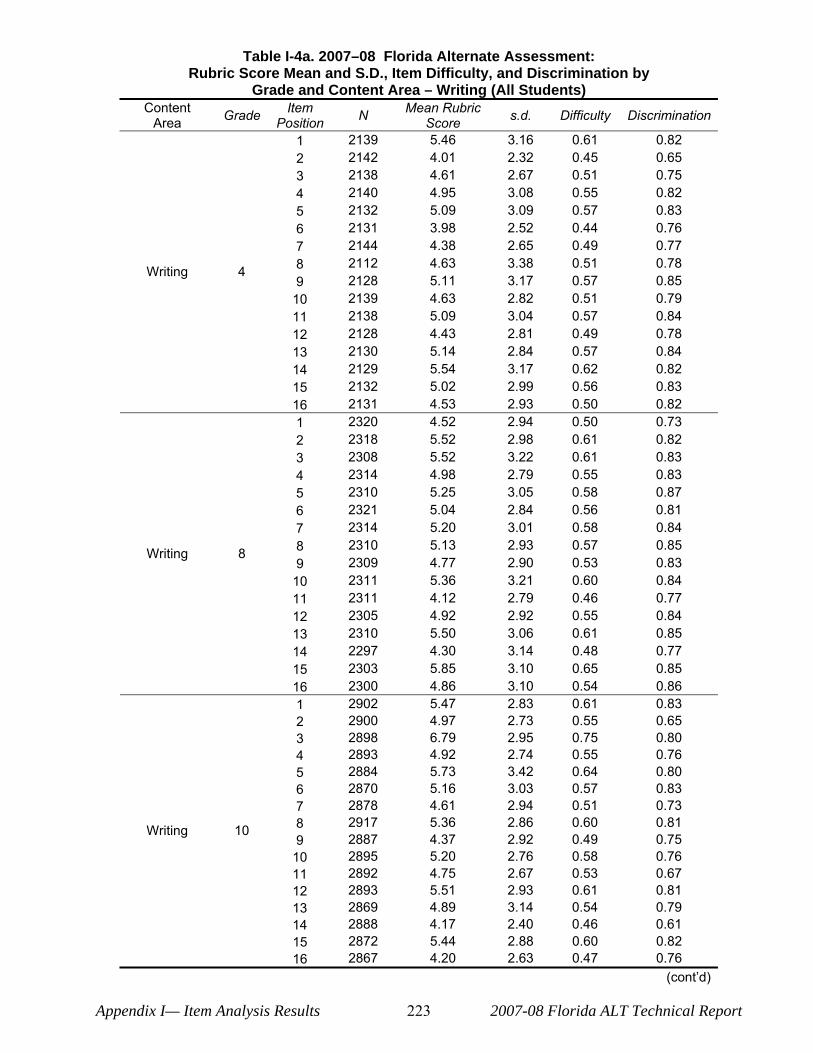
Table I-4a. 2007–08 Florida Alternate Assessment: Rubric Score Mean and S.D., Item Difficulty, and Discrimination by
Grade and Content Area – Writing (All Students) Content Item Mean Rubric Grade N s.d. Difficulty Discrimination Area Position Score
1 2139 5.46 3.16 0.61 0.82 2 2142 4.01 2.32 0.45 0.65 3 2138 4.61 2.67 0.51 0.75 4 2140 4.95 3.08 0.55 0.82 5 2132 5.09 3.09 0.57 0.83 6 2131 3.98 2.52 0.44 0.76 7 2144 4.38 2.65 0.49 0.77
Writing 4 8 9
2112 2128
4.63 5.11
3.38 3.17
0.51 0.57
0.78 0.85
10 2139 4.63 2.82 0.51 0.79 11 2138 5.09 3.04 0.57 0.84 12 2128 4.43 2.81 0.49 0.78 13 2130 5.14 2.84 0.57 0.84 14 2129 5.54 3.17 0.62 0.82 15 2132 5.02 2.99 0.56 0.83 16 2131 4.53 2.93 0.50 0.82 1 2320 4.52 2.94 0.50 0.73 2 2318 5.52 2.98 0.61 0.82 3 2308 5.52 3.22 0.61 0.83 4 2314 4.98 2.79 0.55 0.83 5 2310 5.25 3.05 0.58 0.87 6 2321 5.04 2.84 0.56 0.81 7 2314 5.20 3.01 0.58 0.84
Writing 8 8 9
2310 2309
5.13 4.77
2.93 2.90
0.57 0.53
0.85 0.83
10 2311 5.36 3.21 0.60 0.84 11 2311 4.12 2.79 0.46 0.77 12 2305 4.92 2.92 0.55 0.84 13 2310 5.50 3.06 0.61 0.85 14 2297 4.30 3.14 0.48 0.77 15 2303 5.85 3.10 0.65 0.85 16 2300 4.86 3.10 0.54 0.86 1 2902 5.47 2.83 0.61 0.83 2 2900 4.97 2.73 0.55 0.65 3 2898 6.79 2.95 0.75 0.80 4 2893 4.92 2.74 0.55 0.76 5 2884 5.73 3.42 0.64 0.80 6 2870 5.16 3.03 0.57 0.83 7 2878 4.61 2.94 0.51 0.73
Writing 10 8 9
2917 2887
5.36 4.37
2.86 2.92
0.60 0.49
0.81 0.75
10 2895 5.20 2.76 0.58 0.76 11 2892 4.75 2.67 0.53 0.67 12 2893 5.51 2.93 0.61 0.81 13 2869 4.89 3.14 0.54 0.79 14 2888 4.17 2.40 0.46 0.61 15 2872 5.44 2.88 0.60 0.82 16 2867 4.20 2.63 0.47 0.76
(cont‘d)
Appendix I— Item Analysis Results 223 2007-08 Florida ALT Technical Report
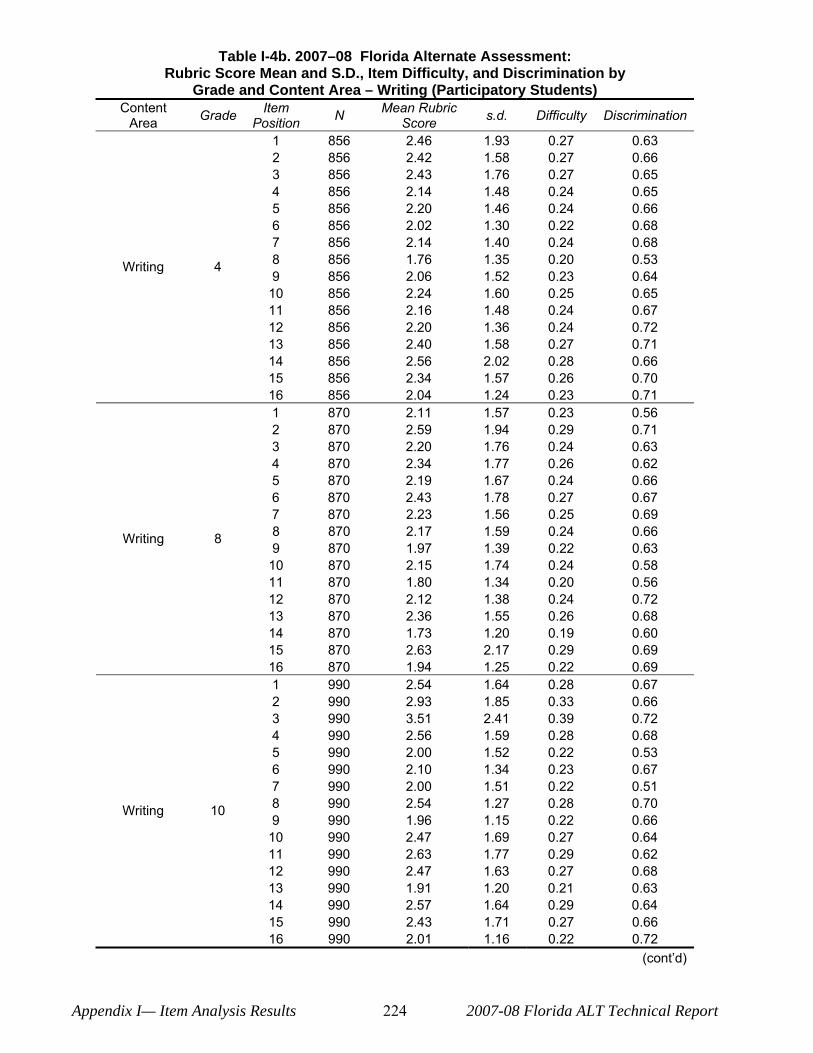
Table I-4b. 2007–08 Florida Alternate Assessment: Rubric Score Mean and S.D., Item Difficulty, and Discrimination by
Grade and Content Area – Writing (Participatory Students) Content Item Mean Rubric Grade N s.d. Difficulty Discrimination Area Position Score
1 856 2.46 1.93 0.27 0.63 2 856 2.42 1.58 0.27 0.66 3 856 2.43 1.76 0.27 0.65 4 856 2.14 1.48 0.24 0.65 5 856 2.20 1.46 0.24 0.66 6 856 2.02 1.30 0.22 0.68 7 856 2.14 1.40 0.24 0.68
Writing 4 8 9
856 856
1.76 2.06
1.35 1.52
0.20 0.23
0.53 0.64
10 856 2.24 1.60 0.25 0.65 11 856 2.16 1.48 0.24 0.67 12 856 2.20 1.36 0.24 0.72 13 856 2.40 1.58 0.27 0.71 14 856 2.56 2.02 0.28 0.66 15 856 2.34 1.57 0.26 0.70 16 856 2.04 1.24 0.23 0.71 1 870 2.11 1.57 0.23 0.56 2 870 2.59 1.94 0.29 0.71 3 870 2.20 1.76 0.24 0.63 4 870 2.34 1.77 0.26 0.62 5 870 2.19 1.67 0.24 0.66 6 870 2.43 1.78 0.27 0.67 7 870 2.23 1.56 0.25 0.69
Writing 8 8 9
870 870
2.17 1.97
1.59 1.39
0.24 0.22
0.66 0.63
10 870 2.15 1.74 0.24 0.58 11 870 1.80 1.34 0.20 0.56 12 870 2.12 1.38 0.24 0.72 13 870 2.36 1.55 0.26 0.68 14 870 1.73 1.20 0.19 0.60 15 870 2.63 2.17 0.29 0.69 16 870 1.94 1.25 0.22 0.69 1 990 2.54 1.64 0.28 0.67 2 990 2.93 1.85 0.33 0.66 3 990 3.51 2.41 0.39 0.72 4 990 2.56 1.59 0.28 0.68 5 990 2.00 1.52 0.22 0.53 6 990 2.10 1.34 0.23 0.67 7 990 2.00 1.51 0.22 0.51
Writing 10 8 9
990 990
2.54 1.96
1.27 1.15
0.28 0.22
0.70 0.66
10 990 2.47 1.69 0.27 0.64 11 990 2.63 1.77 0.29 0.62 12 990 2.47 1.63 0.27 0.68 13 990 1.91 1.20 0.21 0.63 14 990 2.57 1.64 0.29 0.64 15 990 2.43 1.71 0.27 0.66 16 990 2.01 1.16 0.22 0.72
(cont‘d)
Appendix I— Item Analysis Results 224 2007-08 Florida ALT Technical Report
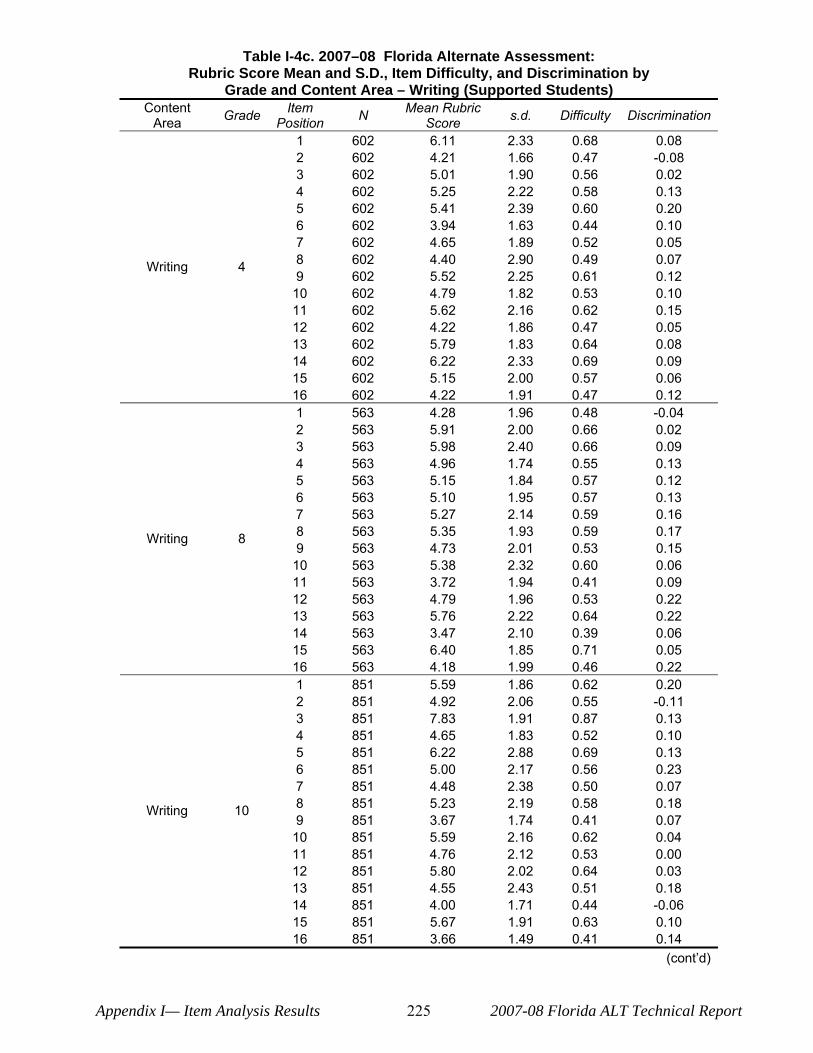
Table I-4c. 2007–08 Florida Alternate Assessment: Rubric Score Mean and S.D., Item Difficulty, and Discrimination by
Grade and Content Area – Writing (Supported Students) Content Item Mean Rubric Grade N s.d. Difficulty Discrimination Area Position Score
1 602 6.11 2.33 0.68 0.08 2 602 4.21 1.66 0.47 -0.08 3 602 5.01 1.90 0.56 0.02 4 602 5.25 2.22 0.58 0.13 5 602 5.41 2.39 0.60 0.20 6 602 3.94 1.63 0.44 0.10 7 602 4.65 1.89 0.52 0.05
Writing 4 8 9
602 602
4.40 5.52
2.90 2.25
0.49 0.61
0.07 0.12
10 602 4.79 1.82 0.53 0.10 11 602 5.62 2.16 0.62 0.15 12 602 4.22 1.86 0.47 0.05 13 602 5.79 1.83 0.64 0.08 14 602 6.22 2.33 0.69 0.09 15 602 5.15 2.00 0.57 0.06 16 602 4.22 1.91 0.47 0.12 1 563 4.28 1.96 0.48 -0.04 2 563 5.91 2.00 0.66 0.02 3 563 5.98 2.40 0.66 0.09 4 563 4.96 1.74 0.55 0.13 5 563 5.15 1.84 0.57 0.12 6 563 5.10 1.95 0.57 0.13 7 563 5.27 2.14 0.59 0.16
Writing 8 8 9
563 563
5.35 4.73
1.93 2.01
0.59 0.53
0.17 0.15
10 563 5.38 2.32 0.60 0.06 11 563 3.72 1.94 0.41 0.09 12 563 4.79 1.96 0.53 0.22 13 563 5.76 2.22 0.64 0.22 14 563 3.47 2.10 0.39 0.06 15 563 6.40 1.85 0.71 0.05 16 563 4.18 1.99 0.46 0.22 1 851 5.59 1.86 0.62 0.20 2 851 4.92 2.06 0.55 -0.11 3 851 7.83 1.91 0.87 0.13 4 851 4.65 1.83 0.52 0.10 5 851 6.22 2.88 0.69 0.13 6 851 5.00 2.17 0.56 0.23 7 851 4.48 2.38 0.50 0.07
Writing 10 8 9
851 851
5.23 3.67
2.19 1.74
0.58 0.41
0.18 0.07
10 851 5.59 2.16 0.62 0.04 11 851 4.76 2.12 0.53 0.00 12 851 5.80 2.02 0.64 0.03 13 851 4.55 2.43 0.51 0.18 14 851 4.00 1.71 0.44 -0.06 15 851 5.67 1.91 0.63 0.10 16 851 3.66 1.49 0.41 0.14
(cont‘d)
Appendix I— Item Analysis Results 225 2007-08 Florida ALT Technical Report
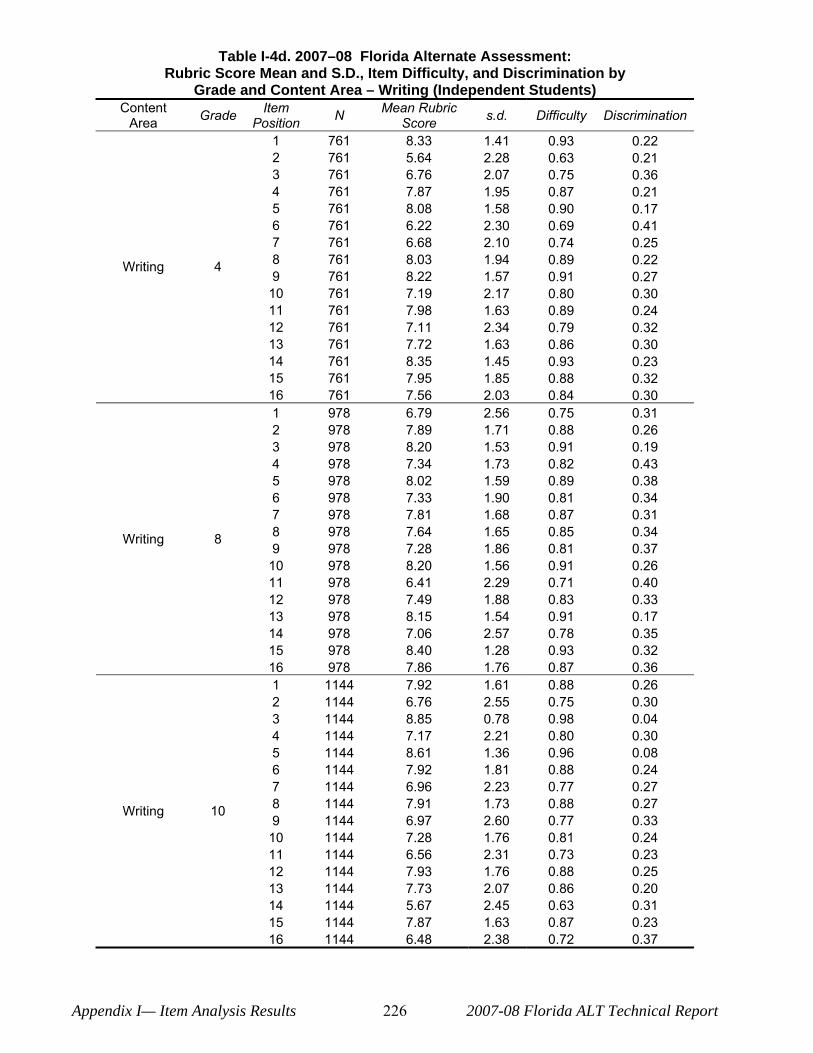
Table I-4d. 2007–08 Florida Alternate Assessment: Rubric Score Mean and S.D., Item Difficulty, and Discrimination by
Grade and Content Area – Writing (Independent Students) Content Item Mean Rubric Grade N s.d. Difficulty Discrimination Area Position Score
Writing 4
1 2 3 4 5 6 7 8 9
10 11 12 13 14 15 16
761 761 761 761 761 761 761 761 761 761 761 761 761 761 761 761
8.33 5.64 6.76 7.87 8.08 6.22 6.68 8.03 8.22 7.19 7.98 7.11 7.72 8.35 7.95 7.56
1.41 2.28 2.07 1.95 1.58 2.30 2.10 1.94 1.57 2.17 1.63 2.34 1.63 1.45 1.85 2.03
0.93 0.63 0.75 0.87 0.90 0.69 0.74 0.89 0.91 0.80 0.89 0.79 0.86 0.93 0.88 0.84
0.22 0.21 0.36 0.21 0.17 0.41 0.25 0.22 0.27 0.30 0.24 0.32 0.30 0.23 0.32 0.30
Writing 8
1 2 3 4 5 6 7 8 9
10 11 12 13 14 15 16
978 978 978 978 978 978 978 978 978 978 978 978 978 978 978 978
6.79 7.89 8.20 7.34 8.02 7.33 7.81 7.64 7.28 8.20 6.41 7.49 8.15 7.06 8.40 7.86
2.56 1.71 1.53 1.73 1.59 1.90 1.68 1.65 1.86 1.56 2.29 1.88 1.54 2.57 1.28 1.76
0.75 0.88 0.91 0.82 0.89 0.81 0.87 0.85 0.81 0.91 0.71 0.83 0.91 0.78 0.93 0.87
0.31 0.26 0.19 0.43 0.38 0.34 0.31 0.34 0.37 0.26 0.40 0.33 0.17 0.35 0.32 0.36
Writing 10
1 2 3 4 5 6 7 8 9
10 11 12 13 14 15 16
1144 1144 1144 1144 1144 1144 1144 1144 1144 1144 1144 1144 1144 1144 1144 1144
7.92 6.76 8.85 7.17 8.61 7.92 6.96 7.91 6.97 7.28 6.56 7.93 7.73 5.67 7.87 6.48
1.61 2.55 0.78 2.21 1.36 1.81 2.23 1.73 2.60 1.76 2.31 1.76 2.07 2.45 1.63 2.38
0.88 0.75 0.98 0.80 0.96 0.88 0.77 0.88 0.77 0.81 0.73 0.88 0.86 0.63 0.87 0.72
0.26 0.30 0.04 0.30 0.08 0.24 0.27 0.27 0.33 0.24 0.23 0.25 0.20 0.31 0.23 0.37
Appendix I— Item Analysis Results 226 2007-08 Florida ALT Technical Report
APPENDIX J—DECISION ACCURACY AND CONSISTENCY
Appendix J—Decision Accuracy & Consistency 227 2007–08 Florida Alt Technical Report

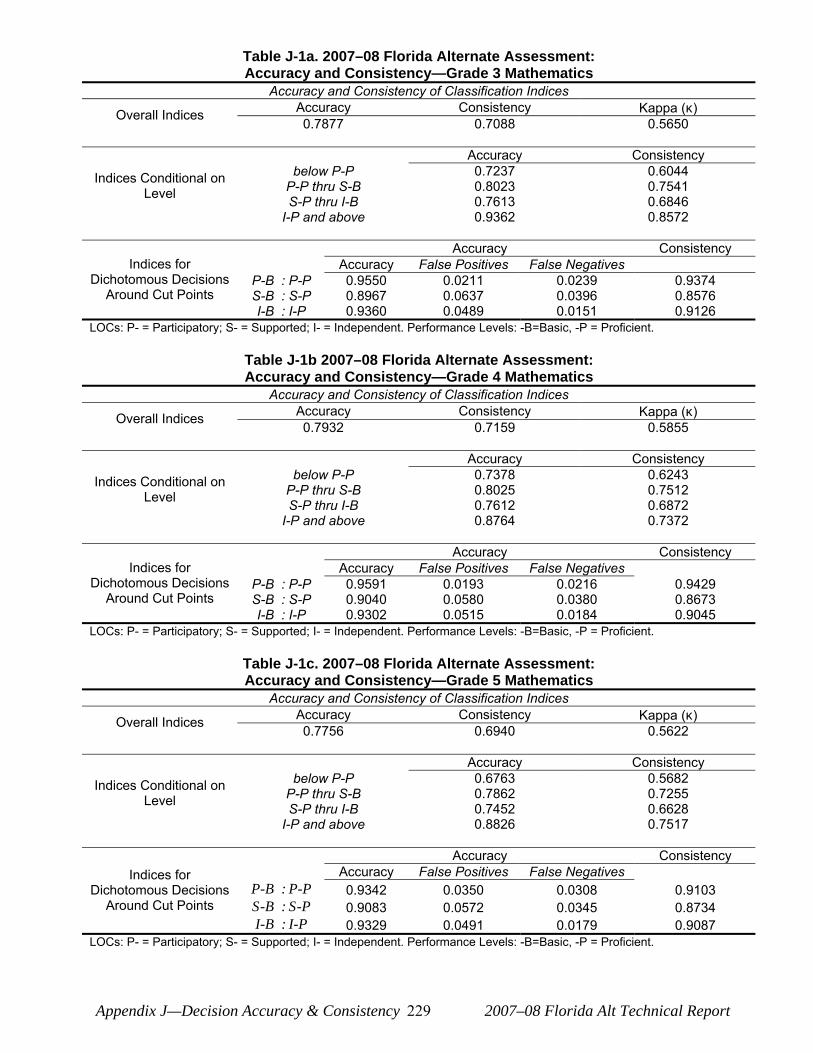
Table J-1a. 2007–08 Florida Alternate Assessment: Accuracy and Consistency—Grade 3 Mathematics
Accuracy and Consistency of Classification Indices Accuracy Consistency Kappa (κ)Overall Indices 0.7877 0.7088 0.5650
Accuracy Consistency below P-P 0.7237 0.6044Indices Conditional on P-P thru S-B 0.8023 0.7541Level S-P thru I-B 0.7613 0.6846
I-P and above 0.9362 0.8572
Accuracy Consistency Indices for Accuracy False Positives False Negatives
Dichotomous Decisions P-B : P-P 0.9550 0.0211 0.0239 0.9374 Around Cut Points S-B : S-P 0.8967 0.0637 0.0396 0.8576
I-B : I-P 0.9360 0.0489 0.0151 0.9126 LOCs: P- = Participatory; S- = Supported; I- = Independent. Performance Levels: -B=Basic, -P = Proficient.
Table J-1b 2007–08 Florida Alternate Assessment: Accuracy and Consistency—Grade 4 Mathematics
Accuracy and Consistency of Classification Indices Accuracy Consistency Kappa (κ)Overall Indices 0.7932 0.7159 0.5855
Indices Conditional on Level
Indices for Dichotomous Decisions
Around Cut Points
below P-P P-P thru S-B S-P thru I-B
I-P and above
Accuracy P-B : P-P 0.9591 S-B : S-P 0.9040 I-B : I-P 0.9302
Accuracy Consistency 0.7378 0.6243 0.8025 0.7512 0.7612 0.6872 0.8764 0.7372
Accuracy Consistency False Positives False Negatives
0.0193 0.0216 0.9429 0.0580 0.0380 0.8673 0.0515 0.0184 0.9045
LOCs: P- = Participatory; S- = Supported; I- = Independent. Performance Levels: -B=Basic, -P = Proficient.
Table J-1c. 2007–08 Florida Alternate Assessment: Accuracy and Consistency—Grade 5 Mathematics
Accuracy and Consistency of Classification Indices Accuracy Consistency Kappa (κ)Overall Indices 0.7756 0.6940 0.5622
Indices Conditional on Level
Indices for Dichotomous Decisions
Around Cut Points
below P-P P-P thru S-B S-P thru I-B
I-P and above
Accuracy P-B : P-P 0.9342 S-B : S-P 0.9083 I-B : I-P 0.9329
Accuracy Consistency 0.6763 0.5682 0.7862 0.7255 0.7452 0.6628 0.8826 0.7517
Accuracy Consistency False Positives False Negatives
0.0350 0.0308 0.9103 0.0572 0.0345 0.8734 0.0491 0.0179 0.9087
LOCs: P- = Participatory; S- = Supported; I- = Independent. Performance Levels: -B=Basic, -P = Proficient.
Appendix J—Decision Accuracy & Consistency 229 2007–08 Florida Alt Technical Report
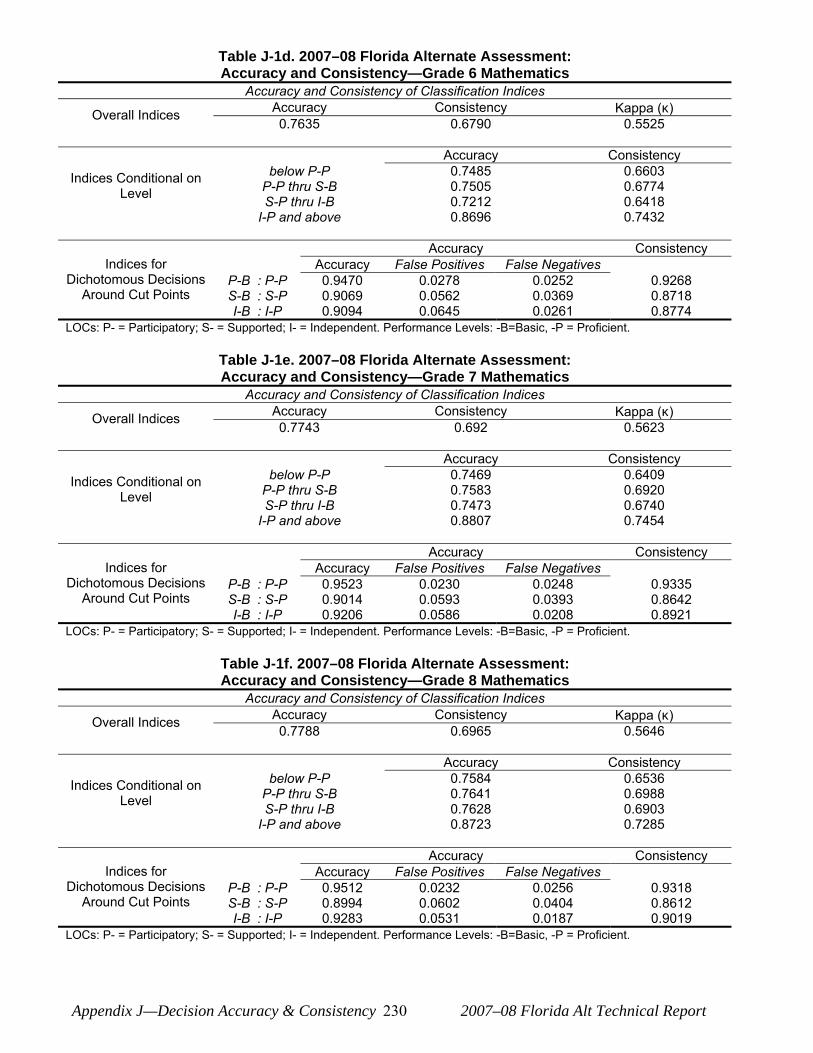
Table J-1d. 2007–08 Florida Alternate Assessment: Accuracy and Consistency—Grade 6 Mathematics
Accuracy and Consistency of Classification Indices Accuracy Consistency Kappa (κ)Overall Indices 0.7635 0.6790 0.5525
Accuracy Consistency below P-P 0.7485 0.6603Indices Conditional on P-P thru S-B 0.7505 0.6774Level S-P thru I-B 0.7212 0.6418
I-P and above 0.8696 0.7432
Accuracy Consistency Indices for Accuracy False Positives False Negatives
Dichotomous Decisions P-B : P-P 0.9470 0.0278 0.0252 0.9268 Around Cut Points S-B : S-P 0.9069 0.0562 0.0369 0.8718
I-B : I-P 0.9094 0.0645 0.0261 0.8774 LOCs: P- = Participatory; S- = Supported; I- = Independent. Performance Levels: -B=Basic, -P = Proficient.
Table J-1e. 2007–08 Florida Alternate Assessment: Accuracy and Consistency—Grade 7 Mathematics
Accuracy and Consistency of Classification Indices Accuracy Consistency Kappa (κ)Overall Indices 0.7743 0.692 0.5623
Indices Conditional on Level
Indices for Dichotomous Decisions
Around Cut Points
below P-P P-P thru S-B S-P thru I-B
I-P and above
Accuracy P-B : P-P 0.9523 S-B : S-P 0.9014 I-B : I-P 0.9206
Accuracy Consistency 0.7469 0.6409 0.7583 0.6920 0.7473 0.6740 0.8807 0.7454
Accuracy Consistency False Positives False Negatives
0.0230 0.0248 0.9335 0.0593 0.0393 0.8642 0.0586 0.0208 0.8921
LOCs: P- = Participatory; S- = Supported; I- = Independent. Performance Levels: -B=Basic, -P = Proficient.
Table J-1f. 2007–08 Florida Alternate Assessment: Accuracy and Consistency—Grade 8 Mathematics
Accuracy and Consistency of Classification Indices Accuracy Consistency Kappa (κ)Overall Indices 0.7788 0.6965 0.5646
Indices Conditional on Level
Indices for Dichotomous Decisions
Around Cut Points
below P-P P-P thru S-B S-P thru I-B
I-P and above
Accuracy P-B : P-P 0.9512 S-B : S-P 0.8994 I-B : I-P 0.9283
Accuracy Consistency 0.7584 0.6536 0.7641 0.6988 0.7628 0.6903 0.8723 0.7285
Accuracy Consistency False Positives False Negatives
0.0232 0.0256 0.9318 0.0602 0.0404 0.8612 0.0531 0.0187 0.9019
LOCs: P- = Participatory; S- = Supported; I- = Independent. Performance Levels: -B=Basic, -P = Proficient.
Appendix J—Decision Accuracy & Consistency 230 2007–08 Florida Alt Technical Report
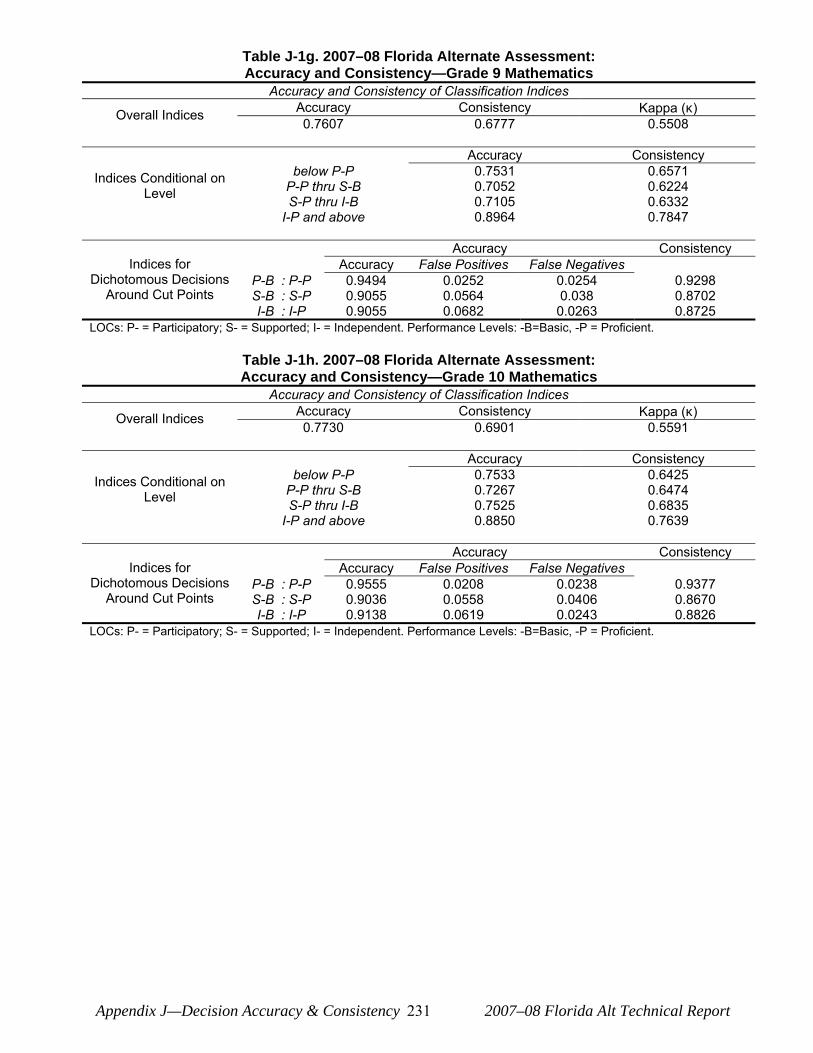
Table J-1g. 2007–08 Florida Alternate Assessment: Accuracy and Consistency—Grade 9 Mathematics
Accuracy and Consistency of Classification Indices Accuracy Consistency Kappa (κ)Overall Indices 0.7607 0.6777 0.5508
Accuracy Consistency below P-P 0.7531 0.6571Indices Conditional on P-P thru S-B 0.7052 0.6224Level S-P thru I-B 0.7105 0.6332
I-P and above 0.8964 0.7847
Accuracy Consistency Indices for Accuracy False Positives False Negatives
Dichotomous Decisions P-B : P-P 0.9494 0.0252 0.0254 0.9298 Around Cut Points S-B : S-P 0.9055 0.0564 0.038 0.8702
I-B : I-P 0.9055 0.0682 0.0263 0.8725 LOCs: P- = Participatory; S- = Supported; I- = Independent. Performance Levels: -B=Basic, -P = Proficient.
Table J-1h. 2007–08 Florida Alternate Assessment: Accuracy and Consistency—Grade 10 Mathematics
Accuracy and Consistency of Classification Indices Accuracy Consistency Kappa (κ)Overall Indices 0.7730 0.6901 0.5591
Indices Conditional on Level
Indices for Dichotomous Decisions
Around Cut Points
below P-P P-P thru S-B S-P thru I-B
I-P and above
Accuracy P-B : P-P 0.9555 S-B : S-P 0.9036 I-B : I-P 0.9138
Accuracy Consistency 0.7533 0.6425 0.7267 0.6474 0.7525 0.6835 0.8850 0.7639
Accuracy Consistency False Positives False Negatives
0.0208 0.0238 0.9377 0.0558 0.0406 0.8670 0.0619 0.0243 0.8826
LOCs: P- = Participatory; S- = Supported; I- = Independent. Performance Levels: -B=Basic, -P = Proficient.
Appendix J—Decision Accuracy & Consistency 231 2007–08 Florida Alt Technical Report
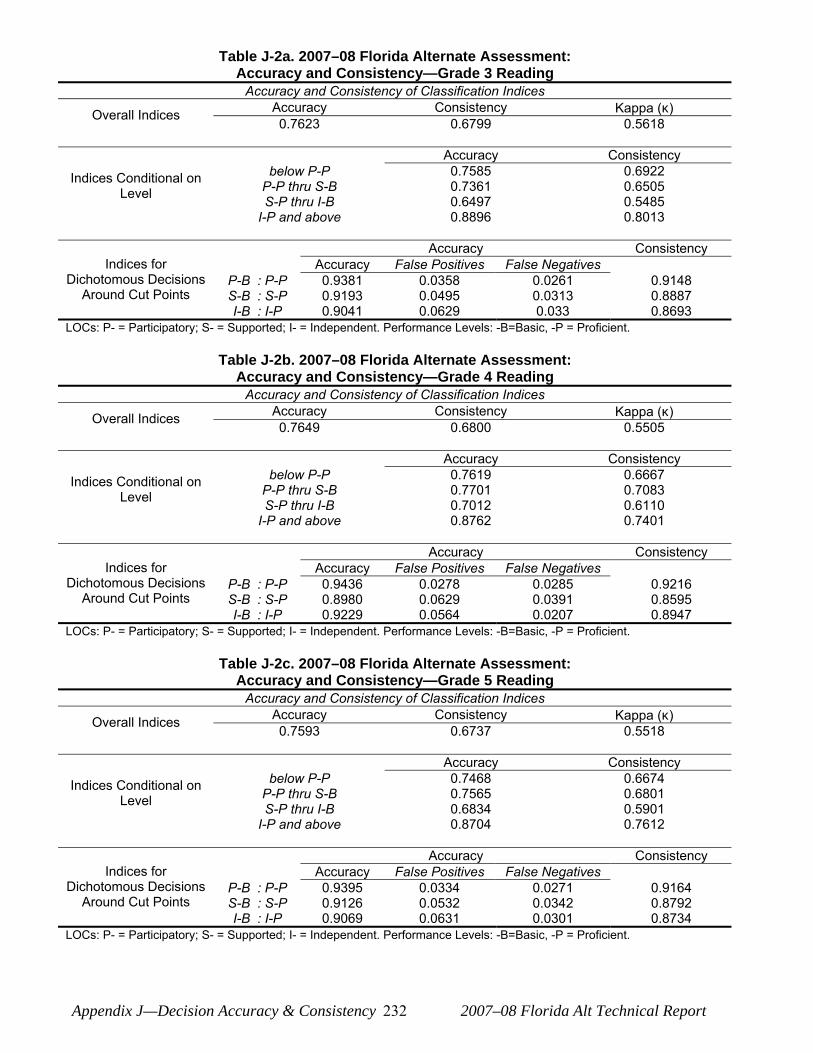
Table J-2a. 2007–08 Florida Alternate Assessment: Accuracy and Consistency—Grade 3 Reading
Accuracy and Consistency of Classification Indices Accuracy Consistency Kappa (κ)Overall Indices 0.7623 0.6799 0.5618
Accuracy Consistency below P-P 0.7585 0.6922Indices Conditional on P-P thru S-B 0.7361 0.6505Level S-P thru I-B 0.6497 0.5485
I-P and above 0.8896 0.8013
Accuracy Consistency Indices for Accuracy False Positives False Negatives
Dichotomous Decisions P-B : P-P 0.9381 0.0358 0.0261 0.9148 Around Cut Points S-B : S-P 0.9193 0.0495 0.0313 0.8887
I-B : I-P 0.9041 0.0629 0.033 0.8693 LOCs: P- = Participatory; S- = Supported; I- = Independent. Performance Levels: -B=Basic, -P = Proficient.
Table J-2b. 2007–08 Florida Alternate Assessment: Accuracy and Consistency—Grade 4 Reading
Accuracy and Consistency of Classification Indices Accuracy Consistency Kappa (κ)Overall Indices 0.7649 0.6800 0.5505
Indices Conditional on Level
Indices for Dichotomous Decisions
Around Cut Points
below P-P P-P thru S-B S-P thru I-B
I-P and above
Accuracy P-B : P-P 0.9436 S-B : S-P 0.8980 I-B : I-P 0.9229
Accuracy Consistency 0.7619 0.6667 0.7701 0.7083 0.7012 0.6110 0.8762 0.7401
Accuracy Consistency False Positives False Negatives
0.0278 0.0285 0.9216 0.0629 0.0391 0.8595 0.0564 0.0207 0.8947
LOCs: P- = Participatory; S- = Supported; I- = Independent. Performance Levels: -B=Basic, -P = Proficient.
Table J-2c. 2007–08 Florida Alternate Assessment: Accuracy and Consistency—Grade 5 Reading
Accuracy and Consistency of Classification Indices Accuracy Consistency Kappa (κ)Overall Indices 0.7593 0.6737 0.5518
Indices Conditional on Level
Indices for Dichotomous Decisions
Around Cut Points
below P-P P-P thru S-B S-P thru I-B
I-P and above
Accuracy P-B : P-P 0.9395 S-B : S-P 0.9126 I-B : I-P 0.9069
Accuracy Consistency 0.7468 0.6674 0.7565 0.6801 0.6834 0.5901 0.8704 0.7612
Accuracy Consistency False Positives False Negatives
0.0334 0.0271 0.9164 0.0532 0.0342 0.8792 0.0631 0.0301 0.8734
LOCs: P- = Participatory; S- = Supported; I- = Independent. Performance Levels: -B=Basic, -P = Proficient.
Appendix J—Decision Accuracy & Consistency 232 2007–08 Florida Alt Technical Report
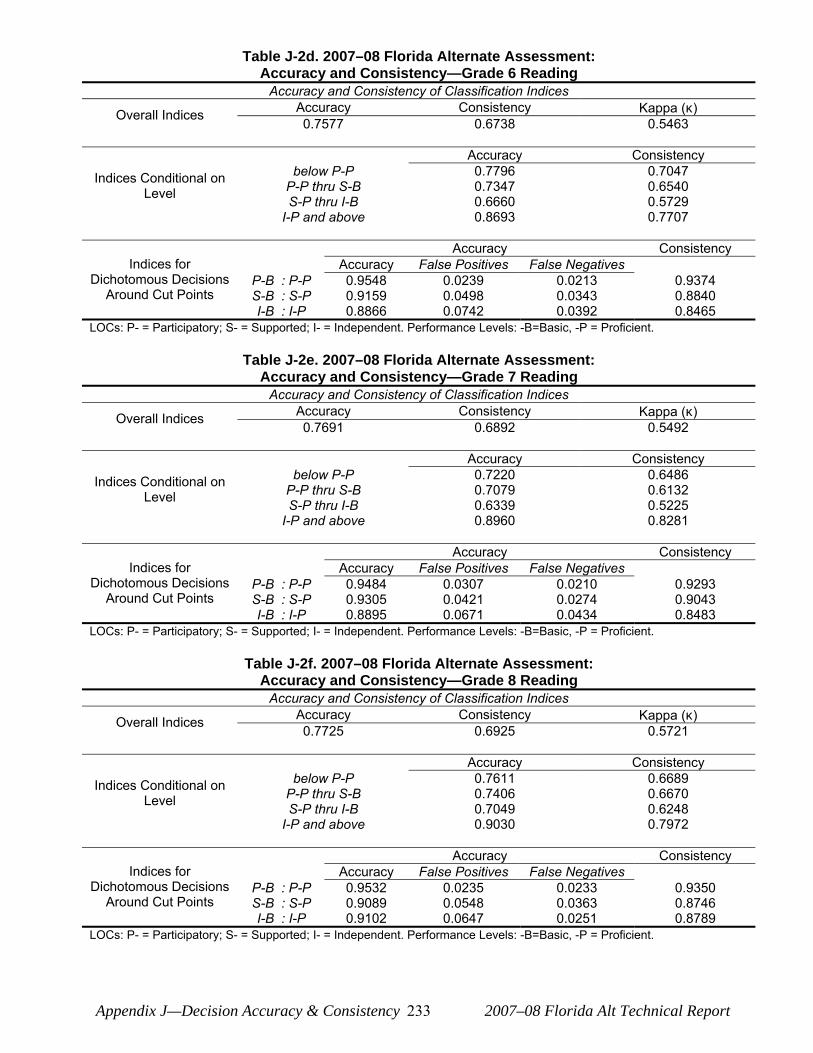
Table J-2d. 2007–08 Florida Alternate Assessment: Accuracy and Consistency—Grade 6 Reading
Accuracy and Consistency of Classification Indices Accuracy Consistency Kappa (κ)Overall Indices 0.7577 0.6738 0.5463
Accuracy Consistency below P-P 0.7796 0.7047Indices Conditional on P-P thru S-B 0.7347 0.6540Level S-P thru I-B 0.6660 0.5729
I-P and above 0.8693 0.7707
Accuracy Consistency Indices for Accuracy False Positives False Negatives
Dichotomous Decisions P-B : P-P 0.9548 0.0239 0.0213 0.9374 Around Cut Points S-B : S-P 0.9159 0.0498 0.0343 0.8840
I-B : I-P 0.8866 0.0742 0.0392 0.8465 LOCs: P- = Participatory; S- = Supported; I- = Independent. Performance Levels: -B=Basic, -P = Proficient.
Table J-2e. 2007–08 Florida Alternate Assessment: Accuracy and Consistency—Grade 7 Reading
Accuracy and Consistency of Classification Indices Accuracy Consistency Kappa (κ)Overall Indices 0.7691 0.6892 0.5492
Indices Conditional on Level
Indices for Dichotomous Decisions
Around Cut Points
below P-P P-P thru S-B S-P thru I-B
I-P and above
Accuracy P-B : P-P 0.9484 S-B : S-P 0.9305 I-B : I-P 0.8895
Accuracy Consistency 0.7220 0.6486 0.7079 0.6132 0.6339 0.5225 0.8960 0.8281
Accuracy Consistency False Positives False Negatives
0.0307 0.0210 0.9293 0.0421 0.0274 0.9043 0.0671 0.0434 0.8483
LOCs: P- = Participatory; S- = Supported; I- = Independent. Performance Levels: -B=Basic, -P = Proficient.
Table J-2f. 2007–08 Florida Alternate Assessment: Accuracy and Consistency—Grade 8 Reading
Accuracy and Consistency of Classification Indices Accuracy Consistency Kappa (κ)Overall Indices 0.7725 0.6925 0.5721
Indices Conditional on Level
Indices for Dichotomous Decisions
Around Cut Points
below P-P P-P thru S-B S-P thru I-B
I-P and above
Accuracy P-B : P-P 0.9532 S-B : S-P 0.9089 I-B : I-P 0.9102
Accuracy Consistency 0.7611 0.6689 0.7406 0.6670 0.7049 0.6248 0.9030 0.7972
Accuracy Consistency False Positives False Negatives
0.0235 0.0233 0.9350 0.0548 0.0363 0.8746 0.0647 0.0251 0.8789
LOCs: P- = Participatory; S- = Supported; I- = Independent. Performance Levels: -B=Basic, -P = Proficient.
Appendix J—Decision Accuracy & Consistency 233 2007–08 Florida Alt Technical Report
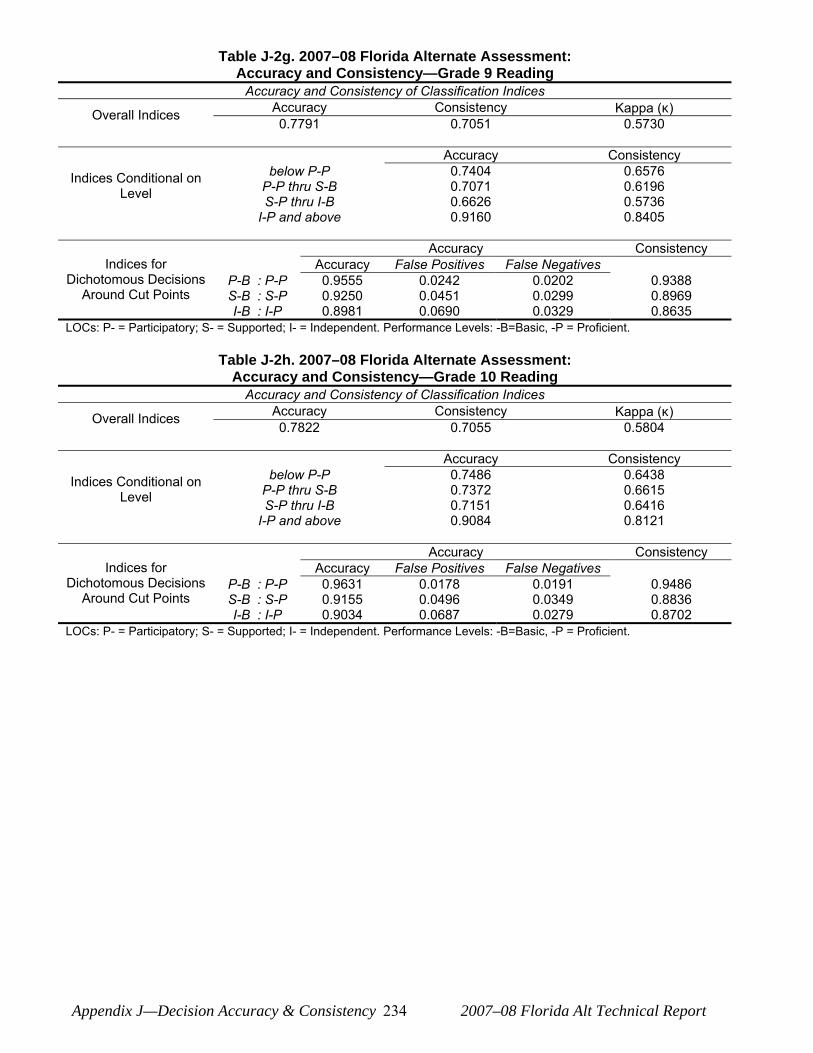
Table J-2g. 2007–08 Florida Alternate Assessment: Accuracy and Consistency—Grade 9 Reading
Accuracy and Consistency of Classification Indices Accuracy Consistency Kappa (κ)Overall Indices 0.7791 0.7051 0.5730
Accuracy Consistency below P-P 0.7404 0.6576Indices Conditional on P-P thru S-B 0.7071 0.6196Level S-P thru I-B 0.6626 0.5736
I-P and above 0.9160 0.8405
Accuracy Consistency Indices for Accuracy False Positives False Negatives
Dichotomous Decisions P-B : P-P 0.9555 0.0242 0.0202 0.9388 Around Cut Points S-B : S-P 0.9250 0.0451 0.0299 0.8969
I-B : I-P 0.8981 0.0690 0.0329 0.8635 LOCs: P- = Participatory; S- = Supported; I- = Independent. Performance Levels: -B=Basic, -P = Proficient.
Table J-2h. 2007–08 Florida Alternate Assessment: Accuracy and Consistency—Grade 10 Reading
Accuracy and Consistency of Classification Indices Accuracy Consistency Kappa (κ)Overall Indices 0.7822 0.7055 0.5804
Indices Conditional on Level
Indices for Dichotomous Decisions
Around Cut Points
below P-P P-P thru S-B S-P thru I-B
I-P and above
Accuracy P-B : P-P 0.9631 S-B : S-P 0.9155 I-B : I-P 0.9034
Accuracy Consistency 0.7486 0.6438 0.7372 0.6615 0.7151 0.6416 0.9084 0.8121
Accuracy Consistency False Positives False Negatives
0.0178 0.0191 0.9486 0.0496 0.0349 0.8836 0.0687 0.0279 0.8702
LOCs: P- = Participatory; S- = Supported; I- = Independent. Performance Levels: -B=Basic, -P = Proficient.
Appendix J—Decision Accuracy & Consistency 234 2007–08 Florida Alt Technical Report

Table J-3a. 2007–08 Florida Alternate Assessment: Accuracy and Consistency—Grade 5 Science
Accuracy and Consistency of Classification Indices Accuracy Consistency Kappa (κ)Overall Indices 0.7889 0.7145 0.5911
Accuracy Consistency below P-P 0.7427 0.6766Indices Conditional on P-P thru S-B 0.7314 0.6408Level S-P thru I-B 0.6699 0.5701
I-P and above 0.9124 0.8467
Accuracy Consistency Indices for Accuracy False Positives False Negatives
Dichotomous Decisions P-B : P-P 0.9494 0.0301 0.0204 0.9305 Around Cut Points S-B : S-P 0.9347 0.0397 0.0256 0.9099
I-B : I-P 0.9045 0.0606 0.0349 0.8698 LOCs: P- = Participatory; S- = Supported; I- = Independent. Performance Levels: -B=Basic, -P = Proficient.
Table J-3b. 2007–08 Florida Alternate Assessment: Accuracy and Consistency—Grade 8 Science
Accuracy and Consistency of Classification Indices Accuracy Consistency Kappa (κ)Overall Indices 0.7977 0.7292 0.5912
Indices Conditional on Level
Indices for Dichotomous Decisions
Around Cut Points
below P-P P-P thru S-B S-P thru I-B
I-P and above
Accuracy P-B : P-P 0.9508 S-B : S-P 0.9383 I-B : I-P 0.9081
Accuracy Consistency 0.7135 0.6445 0.7038 0.6071 0.6515 0.5509 0.9297 0.8734
Accuracy Consistency False Positives False Negatives
0.0302 0.0189 0.9330 0.0379 0.0238 0.9152 0.0592 0.0327 0.8754
LOCs: P- = Participatory; S- = Supported; I- = Independent. Performance Levels: -B=Basic, -P = Proficient.
Table J-3c. 2007–08 Florida Alternate Assessment: Accuracy and Consistency—Grade 11 Science
Accuracy and Consistency of Classification Indices Accuracy Consistency Kappa (κ)Overall Indices 0.7892 0.7191 0.5803
Indices Conditional on Level
Indices for Dichotomous Decisions
Around Cut Points
below P-P P-P thru S-B S-P thru I-B
I-P and above
Accuracy P-B : P-P 0.9665 S-B : S-P 0.9245 I-B : I-P 0.8979
Accuracy Consistency 0.7279 0.6209 0.7040 0.6196 0.6831 0.6073 0.9260 0.8490
Accuracy Consistency False Positives False Negatives
0.0166 0.0170 0.9536 0.0442 0.0313 0.8964 0.0720 0.0301 0.8643
LOCs: P- = Participatory; S- = Supported; I- = Independent. Performance Levels: -B=Basic, -P = Proficient.
Appendix J—Decision Accuracy & Consistency 235 2007–08 Florida Alt Technical Report
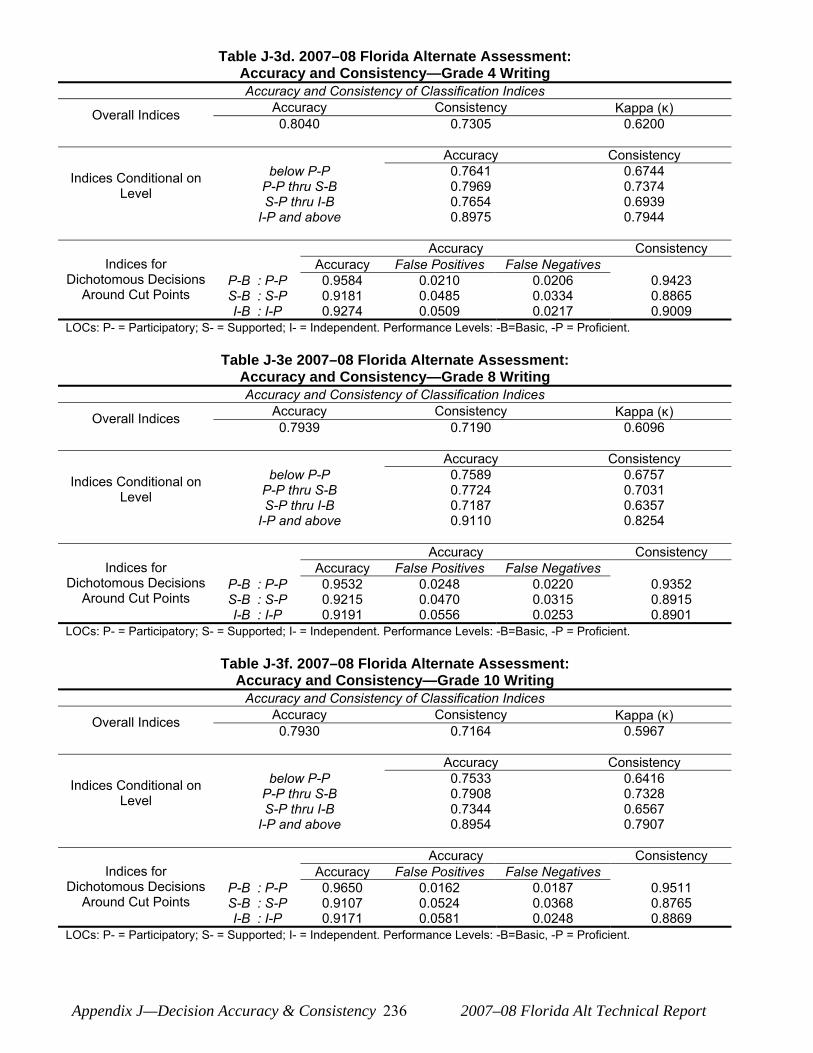
Table J-3d. 2007–08 Florida Alternate Assessment: Accuracy and Consistency—Grade 4 Writing Accuracy and Consistency of Classification Indices
Accuracy Consistency Kappa (κ)Overall Indices 0.8040 0.7305 0.6200
Accuracy Consistency below P-P 0.7641 0.6744Indices Conditional on P-P thru S-B 0.7969 0.7374Level S-P thru I-B 0.7654 0.6939
I-P and above 0.8975 0.7944
Accuracy Consistency Indices for Accuracy False Positives False Negatives
Dichotomous Decisions P-B : P-P 0.9584 0.0210 0.0206 0.9423 Around Cut Points S-B : S-P 0.9181 0.0485 0.0334 0.8865
I-B : I-P 0.9274 0.0509 0.0217 0.9009 LOCs: P- = Participatory; S- = Supported; I- = Independent. Performance Levels: -B=Basic, -P = Proficient.
Table J-3e 2007–08 Florida Alternate Assessment: Accuracy and Consistency—Grade 8 Writing Accuracy and Consistency of Classification Indices
Accuracy Consistency Kappa (κ)Overall Indices 0.7939 0.7190 0.6096
Indices Conditional on Level
Indices for Dichotomous Decisions
Around Cut Points
below P-P P-P thru S-B S-P thru I-B
I-P and above
Accuracy P-B : P-P 0.9532 S-B : S-P 0.9215 I-B : I-P 0.9191
Accuracy Consistency 0.7589 0.6757 0.7724 0.7031 0.7187 0.6357 0.9110 0.8254
Accuracy Consistency False Positives False Negatives
0.0248 0.0220 0.9352 0.0470 0.0315 0.8915 0.0556 0.0253 0.8901
LOCs: P- = Participatory; S- = Supported; I- = Independent. Performance Levels: -B=Basic, -P = Proficient.
Table J-3f. 2007–08 Florida Alternate Assessment: Accuracy and Consistency—Grade 10 Writing
Accuracy and Consistency of Classification Indices Accuracy Consistency Kappa (κ)Overall Indices 0.7930 0.7164 0.5967
Indices Conditional on Level
Indices for Dichotomous Decisions
Around Cut Points
below P-P P-P thru S-B S-P thru I-B
I-P and above
Accuracy P-B : P-P 0.9650 S-B : S-P 0.9107 I-B : I-P 0.9171
Accuracy Consistency 0.7533 0.6416 0.7908 0.7328 0.7344 0.6567 0.8954 0.7907
Accuracy Consistency False Positives False Negatives
0.0162 0.0187 0.9511 0.0524 0.0368 0.8765 0.0581 0.0248 0.8869
LOCs: P- = Participatory; S- = Supported; I- = Independent. Performance Levels: -B=Basic, -P = Proficient.
Appendix J—Decision Accuracy & Consistency 236 2007–08 Florida Alt Technical Report

Appendix J—Decision Accuracy & Consistency 237 2007–08 Florida Alt Technical Report
Related Documents