ORIGINAL ARTICLE Floodplain sediments of the 2002 catastrophic flood at the Vltava (Moldau) River and its tributaries: mineralogy, chemical composition, and post-sedimentary evolution Toma ´s ˇ Navra ´til Jan Rohovec Karel Z ˇ a ´k Received: 7 September 2007 / Accepted: 28 December 2007 / Published online: 24 January 2008 Ó Springer-Verlag 2008 Abstract Fine-grained floodplain sediments of the cata- strophic 2002 flood deposited along the lower reaches of the Berounka and Vltava Rivers, Czech Republic, were not highly contaminated with heavy metals and other toxic elements. This is due to the dominantly mineral character of the sediments (C tot in the range 3.97–5.01%, relatively low content of clay minerals), and due to the very high degree of contamination dilution by eroded pre-industrial non-contaminated floodplain sediments. Despite this high degree of dilution, the influence of the small Litavka River, draining the historical Pb–Zn–Ag Prˇı ´bram ore region, is well visible. The Litavka River is one of important sources of Pb and Zn contamination in the whole Berounka–Vlt- ava–Labe river system. The 2002 flood sediments deposited in the floodplain of the Berounka and Vltava Rivers show poor vertical chemical zoning, except for some components enriched in the uppermost layer by precipitation from evaporated pore-water contained in the mud, i.e. secondary carbonate. The content of C carb of the sediments (0.05–0.15%) is partly represented by this sec- ondary carbonate, which is later leached by rainwater, and partly by fragments of river mollusk shells. A majority of the heavy metals contained in sediments can be readily leached by diluted acids, and to a much smaller degree by rainwater. Keywords Vltava (Moldau) River Á Berounka River Á Floodplain sediments Á Czech Republic Á 2002 Catastrophic flood Introduction River valleys of the lower reaches of the Vltava River (Moldau in the English and German languages) and its tributaries in the western part of the Czech Republic are characterized by a relatively wide floodplain. The surface of this floodplain is usually located 2–5 m above the water level during normal river flow. The main gravel and sand accu- mulations of this floodplain were deposited during the late Weichselian and Early Holocene periods. A layer of fine- grained sediments, usually 0.5–2.0 m thick (locally [ 2 m), accumulated on the surface of these gravels and sands during the Late Holocene (most of the deposition occurred during the last 1,000 years; Czudek 2005, pp. 138–141). Floodplain sediments (Darnley et al. 1995) reflect the geochemistry of the surface weathered zone in their entire upstream river basin (Demetriades et al. 2006), because fine-grained allu- vium (silt and clay) is carried in suspension from eroded source materials over significant distances, and is finally deposited on the floodplain in low energy environments. These fine-grained sediments, with particles mainly of silt size (silt particles: 1 / 256 to 1 / 16 mm), to a smaller degree of clay size (clay particles: \ 1 / 256 mm), and occasionally also with grains of sand size (sand particles: 1 / 16 to 2 mm), are formed by the deposition of suspended particulate matter (further abbreviated SPM) from the muddy floodwaters. The widespread deposition and subsequent formation of fluvial soils in floodplains during the last millennium is usually interpreted as the result of several factors, including defor- estation, an increase in the area with agricultural activities in the catchments, and climate change. Floodplain sediments are an important geochemical media, as they can be used in the search for new mineral resources, in monitoring envi- ronmental change, and also in the prediction of potential environmental hazards (Demetriades et al. 2006). T. Navra ´til (&) Á J. Rohovec Á K. Z ˇ a ´k Institute of Geology AS CR, Rozvojova ´ 269, 165 00 Praha 6, Czech Republic e-mail: [email protected] 123 Environ Geol (2008) 56:399–412 DOI 10.1007/s00254-007-1178-8

Welcome message from author
This document is posted to help you gain knowledge. Please leave a comment to let me know what you think about it! Share it to your friends and learn new things together.
Transcript
ORIGINAL ARTICLE
Floodplain sediments of the 2002 catastrophic flood at the Vltava(Moldau) River and its tributaries: mineralogy, chemicalcomposition, and post-sedimentary evolution
Tomas Navratil Æ Jan Rohovec Æ Karel Zak
Received: 7 September 2007 / Accepted: 28 December 2007 / Published online: 24 January 2008
� Springer-Verlag 2008
Abstract Fine-grained floodplain sediments of the cata-
strophic 2002 flood deposited along the lower reaches of
the Berounka and Vltava Rivers, Czech Republic, were not
highly contaminated with heavy metals and other toxic
elements. This is due to the dominantly mineral character
of the sediments (Ctot in the range 3.97–5.01%, relatively
low content of clay minerals), and due to the very high
degree of contamination dilution by eroded pre-industrial
non-contaminated floodplain sediments. Despite this high
degree of dilution, the influence of the small Litavka River,
draining the historical Pb–Zn–Ag Prıbram ore region, is
well visible. The Litavka River is one of important sources
of Pb and Zn contamination in the whole Berounka–Vlt-
ava–Labe river system. The 2002 flood sediments
deposited in the floodplain of the Berounka and Vltava
Rivers show poor vertical chemical zoning, except for
some components enriched in the uppermost layer by
precipitation from evaporated pore-water contained in the
mud, i.e. secondary carbonate. The content of Ccarb of the
sediments (0.05–0.15%) is partly represented by this sec-
ondary carbonate, which is later leached by rainwater, and
partly by fragments of river mollusk shells. A majority of
the heavy metals contained in sediments can be readily
leached by diluted acids, and to a much smaller degree by
rainwater.
Keywords Vltava (Moldau) River � Berounka River �Floodplain sediments � Czech Republic �2002 Catastrophic flood
Introduction
River valleys of the lower reaches of the Vltava River
(Moldau in the English and German languages) and its
tributaries in the western part of the Czech Republic are
characterized by a relatively wide floodplain. The surface of
this floodplain is usually located 2–5 m above the water level
during normal river flow. The main gravel and sand accu-
mulations of this floodplain were deposited during the late
Weichselian and Early Holocene periods. A layer of fine-
grained sediments, usually 0.5–2.0 m thick (locally[2 m),
accumulated on the surface of these gravels and sands during
the Late Holocene (most of the deposition occurred during
the last 1,000 years; Czudek 2005, pp. 138–141). Floodplain
sediments (Darnley et al. 1995) reflect the geochemistry of
the surface weathered zone in their entire upstream river
basin (Demetriades et al. 2006), because fine-grained allu-
vium (silt and clay) is carried in suspension from eroded
source materials over significant distances, and is finally
deposited on the floodplain in low energy environments.
These fine-grained sediments, with particles mainly of silt
size (silt particles: 1/256 to 1/16 mm), to a smaller degree of
clay size (clay particles:\1/256 mm), and occasionally also
with grains of sand size (sand particles: 1/16 to 2 mm), are
formed by the deposition of suspended particulate matter
(further abbreviated SPM) from the muddy floodwaters. The
widespread deposition and subsequent formation of fluvial
soils in floodplains during the last millennium is usually
interpreted as the result of several factors, including defor-
estation, an increase in the area with agricultural activities in
the catchments, and climate change. Floodplain sediments
are an important geochemical media, as they can be used in
the search for new mineral resources, in monitoring envi-
ronmental change, and also in the prediction of potential
environmental hazards (Demetriades et al. 2006).
T. Navratil (&) � J. Rohovec � K. Zak
Institute of Geology AS CR, Rozvojova 269,
165 00 Praha 6, Czech Republic
e-mail: [email protected]
123
Environ Geol (2008) 56:399–412
DOI 10.1007/s00254-007-1178-8
Floodplains of the major Czech rivers cover a relatively
small proportion of the area of the whole Czech Republic
(less than 1%); nevertheless, they represent areas of
intensive agricultural activity, important groundwater
resources, and unfortunately also areas where parts of
towns and villages have been built. Depending on the
relative elevation above the usual water level, these
floodplains are flooded from several times per century to
several times per millennium. Since the studied rivers
belong to low- to moderate-gradient rivers, the water on
their floodplain usually flows slowly during a flood (typi-
cally 1 m s-1 or less). Each flood event can deposit a
sediment layer from several mm to several tens of centi-
meters thick. Because of very quick bioturbation and
agricultural activities (plowing) the original layering of
these sediments is usually quickly destroyed. In excavated
vertical profiles, these Late Holocene floodplain sediments
are usually quite homogeneous.
The August 2002 flood of the Labe (Elbe) River, Vltava
River and most of their tributaries was the biggest flood
recorded in this area during at least the last 200 years, and
one of largest floods of the last millennium (sine 2003a;
Becker and Grunevald 2003). It was caused by extreme
rainfall amounts originating from a ‘‘Genoa cyclone’’
(Becker and Grunevald 2003). Several hundreds bridges
were destroyed, more than 300 villages and towns were
flooded, and some parts of the city of Prague were evac-
uated. Descriptions of the meteorological preconditions of
this flood event, data about precipitation quantity, river
flow data, and data about the quantity of SPM transported
have been published several times (e.g., the final official
report about this flood event, sine 2003a; Becker and
Grunevald 2003). The contents of persistent organic pol-
lutants (POP), and environmentally important elements
have been studied both in river water, suspended matter,
and sediments (e.g., sine 2003a, b; Holoubek et al. 2003;
Baborowski et al. 2004).
This paper focuses on the mineralogical and chemical
composition of the floodplain silt-dominated sediments
deposited by the 2002 flood in the lower reach of the Vltava
River and its largest tributary, the Berounka River. The
quantity and composition of SPM in the river water evolved
during the flood, and the SPM particles were further sorted
by their size and density during sedimentation. The aim of
this study was therefore to improve understanding of the
primary mineralogical and chemical composition of the
deposited sediments and of their vertical zoning. Another
focus of this study was to evaluate post-sedimentary pro-
cesses, including a study of the leachability of main and
trace elements both by diluted acid and rainwater. Results of
this study are quite important, since these sediments are
incorporated into cultivated soils, and in fact represent the
dominant component of modern floodplain soils.
The Vltava River was the largest source of SPM for the
upper reach of the Labe River during the described August
2002 flood. Since the chemical composition of SPM
transported by the Labe has been monitored (Baborowski
et al. 2004), a study of sediments further enables an eval-
uation of chemical differences between sediments
deposited during the flood in the Vltava watershed and
SPM sampled during this flood in the Labe about 400 km
downstream in Magdeburg.
Studied rivers and selected sampling sites
The Vltava River, the main southern tributary of the Labe
River, has a total catchment area of 28,090 km2 and
baseflow discharge at the confluence with the Labe of
151 m3 s-1. The largest Vltava tributary, the Berounka
River, has a catchment area of 8,861 km2 and average flow
at the confluence with the Vltava of 36 m3 s-1. The peak
flow conditions of the Vltava and Berounka Rivers during
the August 2002 flood at the gauging profiles closest to the
study area were (all data from sine 2003a):
• Berounka River at Beroun (35.6 km above the conflu-
ence with the Vltava River); common average flow at
this profile is 35.6 m3 s-1; peak flow was 2,170 m3 s-1
at 23 p.m. 13 August 2002.
• Vltava River at Praha-Chuchle (immediately below the
confluence with the Berounka River); common average
flow at this profile is 148 m3 s-1; peak flow was
5,160 m3 s-1 at 11 a.m. 14 August 2002.
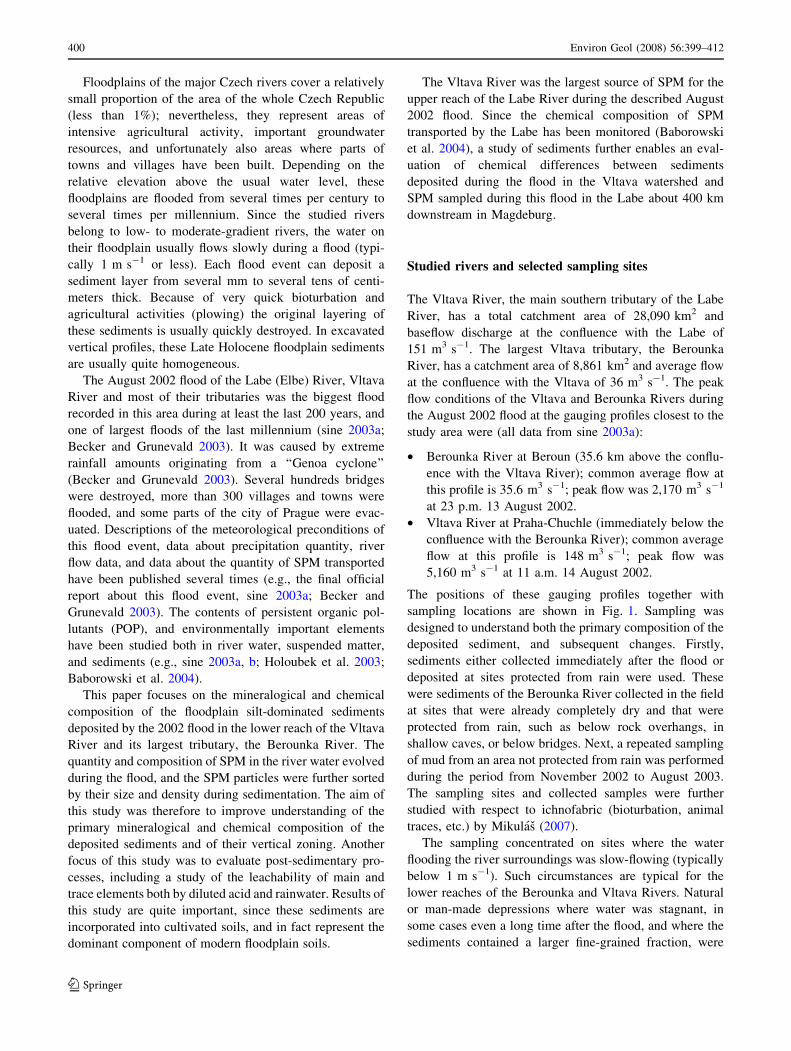
The positions of these gauging profiles together with
sampling locations are shown in Fig. 1. Sampling was
designed to understand both the primary composition of the
deposited sediment, and subsequent changes. Firstly,
sediments either collected immediately after the flood or
deposited at sites protected from rain were used. These
were sediments of the Berounka River collected in the field
at sites that were already completely dry and that were
protected from rain, such as below rock overhangs, in
shallow caves, or below bridges. Next, a repeated sampling
of mud from an area not protected from rain was performed
during the period from November 2002 to August 2003.
The sampling sites and collected samples were further
studied with respect to ichnofabric (bioturbation, animal
traces, etc.) by Mikulas (2007).
The sampling concentrated on sites where the water
flooding the river surroundings was slow-flowing (typically
below 1 m s-1). Such circumstances are typical for the
lower reaches of the Berounka and Vltava Rivers. Natural
or man-made depressions where water was stagnant, in
some cases even a long time after the flood, and where the
sediments contained a larger fine-grained fraction, were
400 Environ Geol (2008) 56:399–412
123
avoided. The sampling focused on sediments all having a
similar grain size distribution, being dominated by silt-size
particles.
The sampling at the Berounka River was further
designed to evaluate changes of the chemical composition
of the deposited sediment above and below its confluence
with the Litavka River. The Litavka River is a small river
with a watershed area of 629.4 km2 and average flow at the
confluence with the Berounka of 2.71 m3 s-1. It drains the
Prıbram ore region, where Pb, Zn, Ag, and later also U ores
were mined and processed in the past. The Litavka River is
known for its high contamination by heavy metals (e.g.,
Ettler et al. 2005).
Laboratory methods
Samples of floodplain sediments deposited during the
August 2002 flood were collected in the field as bulk
samples covering the whole thickness of the deposited
sediment layer. The bottom sections of the samples, con-
taining traces of the underlying materials, were removed.
In the laboratory, all sediment samples were air-dried at
ambient laboratory temperature. The thickness of the sed-
iment layer after drying varied from 20 to 70 mm. Sub-
sample aliquots were removed for physico-chemical anal-
yses. In cases where several sub-samples were taken from a
vertical profile, the boundaries between the samples were
selected based on visible changes in grain size or sediment
color. Prior to analytical procedures, samples were sieved,
and the size fraction \2 mm was further homogenized in
an agate mill. The fraction [2 mm contained almost
exclusively larger fragments of organic materials (wood,
fragments of plants, etc.) and was not included in the
analyses. During all these procedures, only plastic metal-
free tools and sieves were used. Portions of several samples
were then used for X-ray mineral determination using a
Philips X’Pert Automated Powder Diffraction apparatus in
the laboratories of the Institute of Geology AS CR.
Three methods of sample decomposition/leaching were
used:
– total concentrations of studied elements in sediments
were analyzed after digesting the sample completely in
a mixture of HF and HNO3,
– the maximal possible concentrations of elements which
could be released from each of the sampled sediments
under natural conditions were evaluated after digestion
of sample with 0.1M HNO3 for 24 h at laboratory
temperature. This content is referred to as the acid-
leachable concentration of the studied elements (Brug-
mann 1995),
– the more realistic concentration of elements which
could be readily released from the sediments under
natural conditions was tested using leaching with a
collected bulk precipitation solution. This concentra-
tion is referred to in the text as the ‘‘exchangeable’’
concentration.
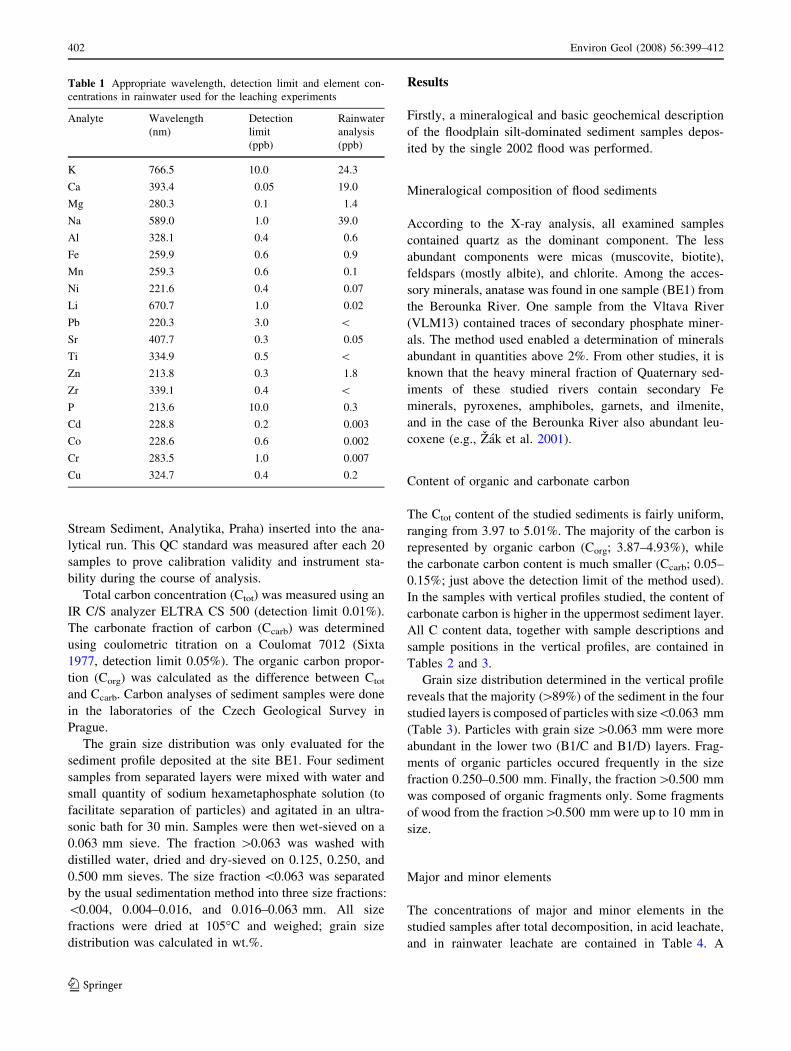
Approximately 5 l of rainwater used for leaching experi-
ments was sampled during a single storm event. The
chemical properties of this rainwater were typical for
precipitation in the region (pH 4.9); the detailed compo-
sition can be found in Table 1.
Total content of Si was not determined (due to the
removal of SiF4 in the course of total decomposition). All
sample decompositions and analyses of solutes were per-
formed in the laboratories of the Institute of Geology AS
CR, Prague. The obtained sample solutions were analyzed
using the ICP EOS technique on an Iris Intrepid 2 Duo
instrument, equipped with a concentric nebulizer. The
plasma and instrument parameters were set according to
the manufacturer’s recommendations: axial plasma view,
RF power 1,150 W, auxiliary argon flux 1.0 ml min-1,
nebulizer pressure 25.0 psi, sample uptake 2.40 ml min-1.
The instrument was calibrated by mixed standard solutions,
prepared from 1,000 ppm certified single standard solu-
tions (supplier Analytika, Praha) in 3% HNO3. The
calibration curves were constructed using at least four
points (blank and mixed standards) covering the whole
range of the actual sample concentrations. The calibration
was performed for the major and micro elements sepa-
rately. The quality of analytical results was assured by
certifying the analytes of a QC standard material (River
14o13'
50o0'
Prague
Beroun
akvatiL
aknuoreB
avatlV
VLM3,4,8,16,
20,22,27,28
BE 1,3
BE 2
BE 4
BE 5-6
N
4km
VLM 1,13
VB
L
Berounka sub-basin
Moldau basin
Fig. 1 Positions of river gauging profiles operated by the Czech
Hydrometeorological Institute (L Litavka gauge, B Berounka gauge,
V Vltava gauge) and of the sampling sites (BE and VLM). At thebottom position of study are in the Moldau basin and Berounka sub-
basin
Environ Geol (2008) 56:399–412 401
123
Stream Sediment, Analytika, Praha) inserted into the ana-
lytical run. This QC standard was measured after each 20
samples to prove calibration validity and instrument sta-
bility during the course of analysis.
Total carbon concentration (Ctot) was measured using an
IR C/S analyzer ELTRA CS 500 (detection limit 0.01%).
The carbonate fraction of carbon (Ccarb) was determined
using coulometric titration on a Coulomat 7012 (Sixta
1977, detection limit 0.05%). The organic carbon propor-
tion (Corg) was calculated as the difference between Ctot
and Ccarb. Carbon analyses of sediment samples were done
in the laboratories of the Czech Geological Survey in
Prague.
The grain size distribution was only evaluated for the
sediment profile deposited at the site BE1. Four sediment
samples from separated layers were mixed with water and
small quantity of sodium hexametaphosphate solution (to
facilitate separation of particles) and agitated in an ultra-
sonic bath for 30 min. Samples were then wet-sieved on a
0.063 mm sieve. The fraction [0.063 was washed with
distilled water, dried and dry-sieved on 0.125, 0.250, and
0.500 mm sieves. The size fraction \0.063 was separated
by the usual sedimentation method into three size fractions:
\0.004, 0.004–0.016, and 0.016–0.063 mm. All size
fractions were dried at 105�C and weighed; grain size
distribution was calculated in wt.%.
Results
Firstly, a mineralogical and basic geochemical description
of the floodplain silt-dominated sediment samples depos-
ited by the single 2002 flood was performed.
Mineralogical composition of flood sediments
According to the X-ray analysis, all examined samples
contained quartz as the dominant component. The less
abundant components were micas (muscovite, biotite),
feldspars (mostly albite), and chlorite. Among the acces-
sory minerals, anatase was found in one sample (BE1) from
the Berounka River. One sample from the Vltava River
(VLM13) contained traces of secondary phosphate miner-
als. The method used enabled a determination of minerals
abundant in quantities above 2%. From other studies, it is
known that the heavy mineral fraction of Quaternary sed-
iments of these studied rivers contain secondary Fe
minerals, pyroxenes, amphiboles, garnets, and ilmenite,
and in the case of the Berounka River also abundant leu-
coxene (e.g., Zak et al. 2001).
Content of organic and carbonate carbon
The Ctot content of the studied sediments is fairly uniform,
ranging from 3.97 to 5.01%. The majority of the carbon is
represented by organic carbon (Corg; 3.87–4.93%), while
the carbonate carbon content is much smaller (Ccarb; 0.05–
0.15%; just above the detection limit of the method used).
In the samples with vertical profiles studied, the content of
carbonate carbon is higher in the uppermost sediment layer.
All C content data, together with sample descriptions and
sample positions in the vertical profiles, are contained in
Tables 2 and 3.
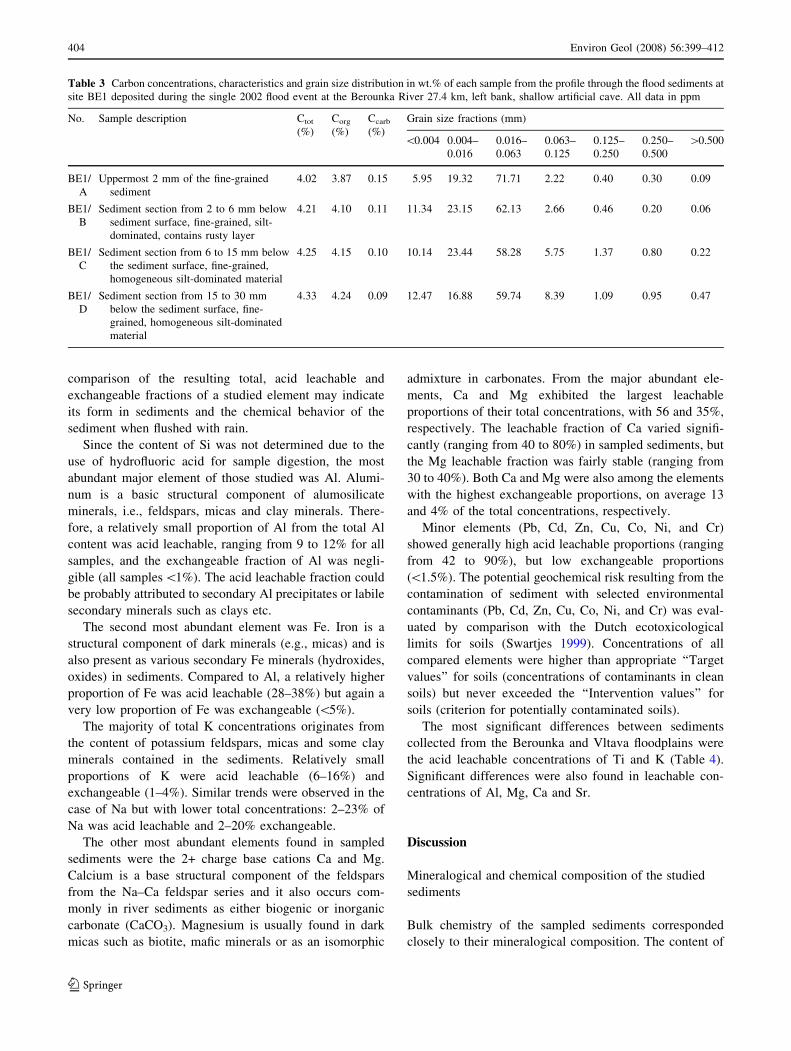
Grain size distribution determined in the vertical profile
reveals that the majority ([89%) of the sediment in the four
studied layers is composed of particles with size\0.063 mm
(Table 3). Particles with grain size[0.063 mm were more
abundant in the lower two (B1/C and B1/D) layers. Frag-
ments of organic particles occured frequently in the size
fraction 0.250–0.500 mm. Finally, the fraction[0.500 mm
was composed of organic fragments only. Some fragments
of wood from the fraction[0.500 mm were up to 10 mm in
size.
Major and minor elements
The concentrations of major and minor elements in the
studied samples after total decomposition, in acid leachate,
and in rainwater leachate are contained in Table 4. A
Table 1 Appropriate wavelength, detection limit and element con-
centrations in rainwater used for the leaching experiments
Analyte Wavelength
(nm)
Detection
limit
(ppb)
Rainwater
analysis
(ppb)
K 766.5 10.0 24.3
Ca 393.4 0.05 19.0
Mg 280.3 0.1 1.4
Na 589.0 1.0 39.0
Al 328.1 0.4 0.6
Fe 259.9 0.6 0.9
Mn 259.3 0.6 0.1
Ni 221.6 0.4 0.07
Li 670.7 1.0 0.02
Pb 220.3 3.0 \Sr 407.7 0.3 0.05
Ti 334.9 0.5 \Zn 213.8 0.3 1.8
Zr 339.1 0.4 \P 213.6 10.0 0.3
Cd 228.8 0.2 0.003
Co 228.6 0.6 0.002
Cr 283.5 1.0 0.007
Cu 324.7 0.4 0.2
402 Environ Geol (2008) 56:399–412
123
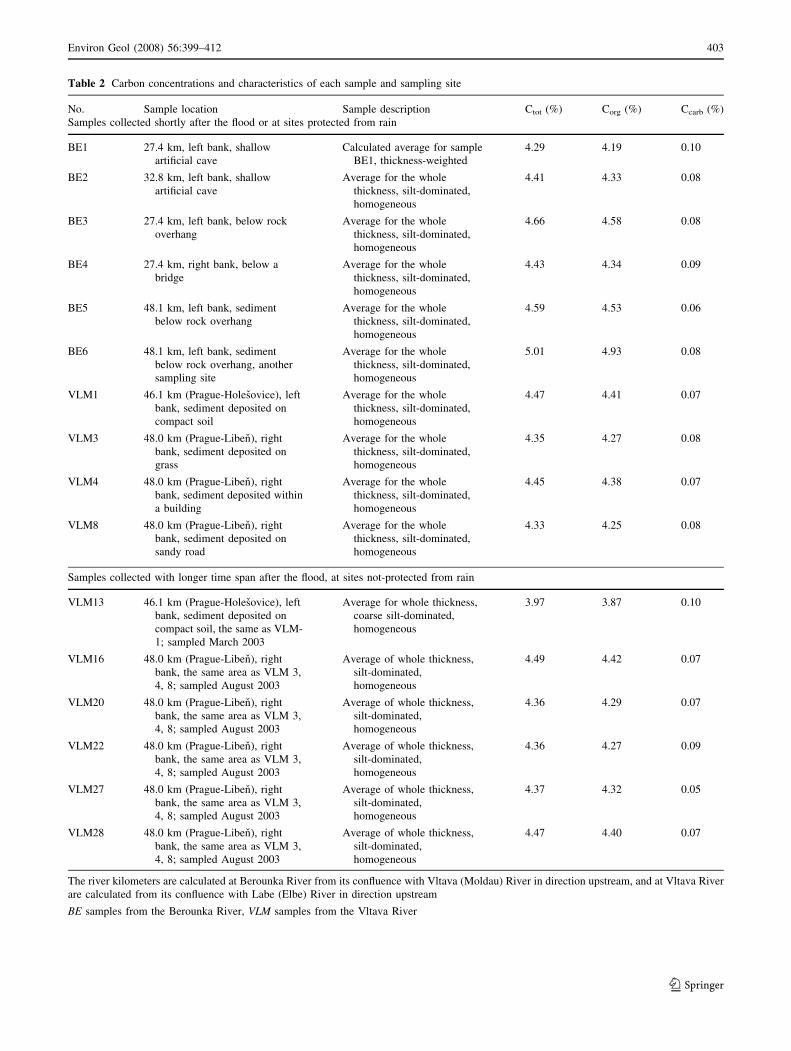
Table 2 Carbon concentrations and characteristics of each sample and sampling site
No. Sample location Sample description Ctot (%) Corg (%) Ccarb (%)
Samples collected shortly after the flood or at sites protected from rain
BE1 27.4 km, left bank, shallow
artificial cave
Calculated average for sample
BE1, thickness-weighted
4.29 4.19 0.10
BE2 32.8 km, left bank, shallow
artificial cave
Average for the whole
thickness, silt-dominated,
homogeneous
4.41 4.33 0.08
BE3 27.4 km, left bank, below rock
overhang
Average for the whole
thickness, silt-dominated,
homogeneous
4.66 4.58 0.08
BE4 27.4 km, right bank, below a
bridge
Average for the whole
thickness, silt-dominated,
homogeneous
4.43 4.34 0.09
BE5 48.1 km, left bank, sediment
below rock overhang
Average for the whole
thickness, silt-dominated,
homogeneous
4.59 4.53 0.06
BE6 48.1 km, left bank, sediment
below rock overhang, another
sampling site
Average for the whole
thickness, silt-dominated,
homogeneous
5.01 4.93 0.08
VLM1 46.1 km (Prague-Holesovice), left
bank, sediment deposited on
compact soil
Average for the whole
thickness, silt-dominated,
homogeneous
4.47 4.41 0.07
VLM3 48.0 km (Prague-Liben), right
bank, sediment deposited on
grass
Average for the whole
thickness, silt-dominated,
homogeneous
4.35 4.27 0.08
VLM4 48.0 km (Prague-Liben), right
bank, sediment deposited within
a building
Average for the whole
thickness, silt-dominated,
homogeneous
4.45 4.38 0.07
VLM8 48.0 km (Prague-Liben), right
bank, sediment deposited on
sandy road
Average for the whole
thickness, silt-dominated,
homogeneous
4.33 4.25 0.08
Samples collected with longer time span after the flood, at sites not-protected from rain
VLM13 46.1 km (Prague-Holesovice), left
bank, sediment deposited on
compact soil, the same as VLM-
1; sampled March 2003
Average for whole thickness,
coarse silt-dominated,
homogeneous
3.97 3.87 0.10
VLM16 48.0 km (Prague-Liben), right
bank, the same area as VLM 3,
4, 8; sampled August 2003
Average of whole thickness,
silt-dominated,
homogeneous
4.49 4.42 0.07
VLM20 48.0 km (Prague-Liben), right
bank, the same area as VLM 3,
4, 8; sampled August 2003
Average of whole thickness,
silt-dominated,
homogeneous
4.36 4.29 0.07
VLM22 48.0 km (Prague-Liben), right
bank, the same area as VLM 3,
4, 8; sampled August 2003
Average of whole thickness,
silt-dominated,
homogeneous
4.36 4.27 0.09
VLM27 48.0 km (Prague-Liben), right
bank, the same area as VLM 3,
4, 8; sampled August 2003
Average of whole thickness,
silt-dominated,
homogeneous
4.37 4.32 0.05
VLM28 48.0 km (Prague-Liben), right
bank, the same area as VLM 3,
4, 8; sampled August 2003
Average of whole thickness,
silt-dominated,
homogeneous
4.47 4.40 0.07
The river kilometers are calculated at Berounka River from its confluence with Vltava (Moldau) River in direction upstream, and at Vltava River
are calculated from its confluence with Labe (Elbe) River in direction upstream
BE samples from the Berounka River, VLM samples from the Vltava River
Environ Geol (2008) 56:399–412 403
123
comparison of the resulting total, acid leachable and
exchangeable fractions of a studied element may indicate
its form in sediments and the chemical behavior of the
sediment when flushed with rain.
Since the content of Si was not determined due to the
use of hydrofluoric acid for sample digestion, the most
abundant major element of those studied was Al. Alumi-
num is a basic structural component of alumosilicate
minerals, i.e., feldspars, micas and clay minerals. There-
fore, a relatively small proportion of Al from the total Al
content was acid leachable, ranging from 9 to 12% for all
samples, and the exchangeable fraction of Al was negli-
gible (all samples\1%). The acid leachable fraction could
be probably attributed to secondary Al precipitates or labile
secondary minerals such as clays etc.
The second most abundant element was Fe. Iron is a
structural component of dark minerals (e.g., micas) and is
also present as various secondary Fe minerals (hydroxides,
oxides) in sediments. Compared to Al, a relatively higher
proportion of Fe was acid leachable (28–38%) but again a
very low proportion of Fe was exchangeable (\5%).
The majority of total K concentrations originates from
the content of potassium feldspars, micas and some clay
minerals contained in the sediments. Relatively small
proportions of K were acid leachable (6–16%) and
exchangeable (1–4%). Similar trends were observed in the
case of Na but with lower total concentrations: 2–23% of
Na was acid leachable and 2–20% exchangeable.
The other most abundant elements found in sampled
sediments were the 2+ charge base cations Ca and Mg.
Calcium is a base structural component of the feldspars
from the Na–Ca feldspar series and it also occurs com-
monly in river sediments as either biogenic or inorganic
carbonate (CaCO3). Magnesium is usually found in dark
micas such as biotite, mafic minerals or as an isomorphic
admixture in carbonates. From the major abundant ele-
ments, Ca and Mg exhibited the largest leachable
proportions of their total concentrations, with 56 and 35%,
respectively. The leachable fraction of Ca varied signifi-
cantly (ranging from 40 to 80%) in sampled sediments, but
the Mg leachable fraction was fairly stable (ranging from
30 to 40%). Both Ca and Mg were also among the elements
with the highest exchangeable proportions, on average 13
and 4% of the total concentrations, respectively.
Minor elements (Pb, Cd, Zn, Cu, Co, Ni, and Cr)
showed generally high acid leachable proportions (ranging
from 42 to 90%), but low exchangeable proportions
(\1.5%). The potential geochemical risk resulting from the
contamination of sediment with selected environmental
contaminants (Pb, Cd, Zn, Cu, Co, Ni, and Cr) was eval-
uated by comparison with the Dutch ecotoxicological
limits for soils (Swartjes 1999). Concentrations of all
compared elements were higher than appropriate ‘‘Target
values’’ for soils (concentrations of contaminants in clean
soils) but never exceeded the ‘‘Intervention values’’ for
soils (criterion for potentially contaminated soils).
The most significant differences between sediments
collected from the Berounka and Vltava floodplains were
the acid leachable concentrations of Ti and K (Table 4).
Significant differences were also found in leachable con-
centrations of Al, Mg, Ca and Sr.
Discussion
Mineralogical and chemical composition of the studied
sediments
Bulk chemistry of the sampled sediments corresponded
closely to their mineralogical composition. The content of
Table 3 Carbon concentrations, characteristics and grain size distribution in wt.% of each sample from the profile through the flood sediments at
site BE1 deposited during the single 2002 flood event at the Berounka River 27.4 km, left bank, shallow artificial cave. All data in ppm
No. Sample description Ctot
(%)
Corg
(%)
Ccarb
(%)
Grain size fractions (mm)
\0.004 0.004–
0.016
0.016–
0.063
0.063–
0.125
0.125–
0.250
0.250–
0.500
[0.500
BE1/
A
Uppermost 2 mm of the fine-grained
sediment
4.02 3.87 0.15 5.95 19.32 71.71 2.22 0.40 0.30 0.09
BE1/
B
Sediment section from 2 to 6 mm below
sediment surface, fine-grained, silt-
dominated, contains rusty layer
4.21 4.10 0.11 11.34 23.15 62.13 2.66 0.46 0.20 0.06
BE1/
C
Sediment section from 6 to 15 mm below
the sediment surface, fine-grained,
homogeneous silt-dominated material
4.25 4.15 0.10 10.14 23.44 58.28 5.75 1.37 0.80 0.22
BE1/
D
Sediment section from 15 to 30 mm
below the sediment surface, fine-
grained, homogeneous silt-dominated
material
4.33 4.24 0.09 12.47 16.88 59.74 8.39 1.09 0.95 0.47
404 Environ Geol (2008) 56:399–412
123
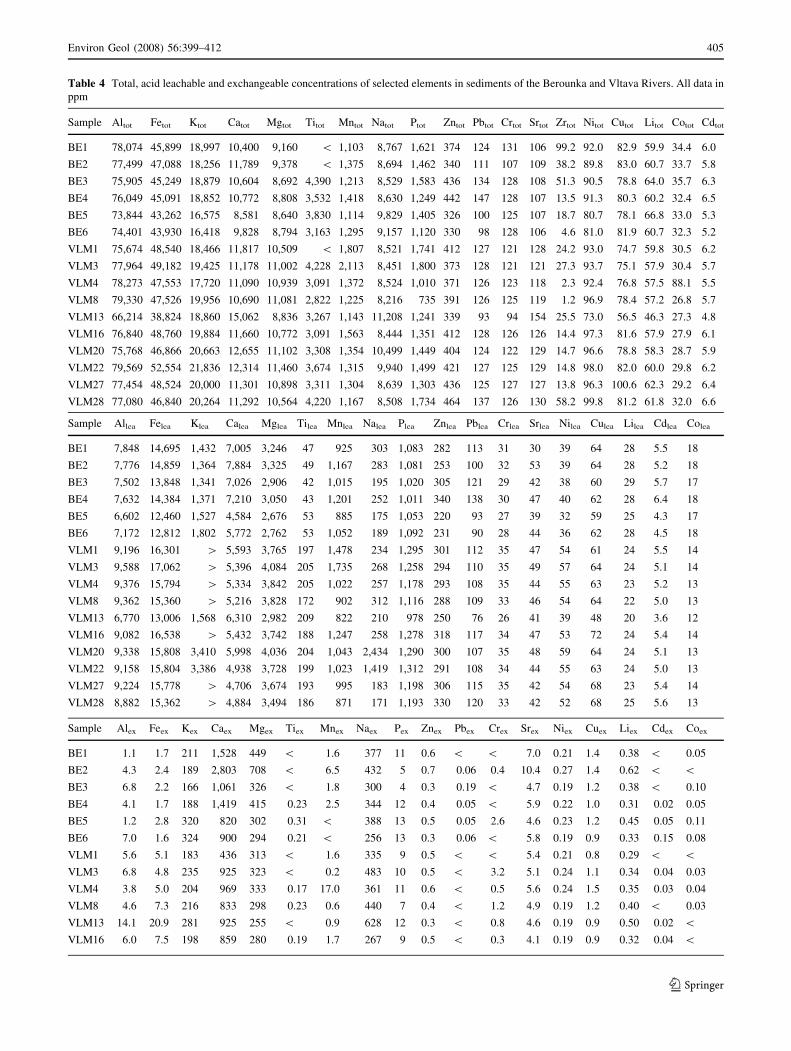
Table 4 Total, acid leachable and exchangeable concentrations of selected elements in sediments of the Berounka and Vltava Rivers. All data in
ppm
Sample Altot Fetot Ktot Catot Mgtot Titot Mntot Natot Ptot Zntot Pbtot Crtot Srtot Zrtot Nitot Cutot Litot Cotot Cdtot
BE1 78,074 45,899 18,997 10,400 9,160 \ 1,103 8,767 1,621 374 124 131 106 99.2 92.0 82.9 59.9 34.4 6.0
BE2 77,499 47,088 18,256 11,789 9,378 \ 1,375 8,694 1,462 340 111 107 109 38.2 89.8 83.0 60.7 33.7 5.8
BE3 75,905 45,249 18,879 10,604 8,692 4,390 1,213 8,529 1,583 436 134 128 108 51.3 90.5 78.8 64.0 35.7 6.3
BE4 76,049 45,091 18,852 10,772 8,808 3,532 1,418 8,630 1,249 442 147 128 107 13.5 91.3 80.3 60.2 32.4 6.5
BE5 73,844 43,262 16,575 8,581 8,640 3,830 1,114 9,829 1,405 326 100 125 107 18.7 80.7 78.1 66.8 33.0 5.3
BE6 74,401 43,930 16,418 9,828 8,794 3,163 1,295 9,157 1,120 330 98 128 106 4.6 81.0 81.9 60.7 32.3 5.2
VLM1 75,674 48,540 18,466 11,817 10,509 \ 1,807 8,521 1,741 412 127 121 128 24.2 93.0 74.7 59.8 30.5 6.2
VLM3 77,964 49,182 19,425 11,178 11,002 4,228 2,113 8,451 1,800 373 128 121 121 27.3 93.7 75.1 57.9 30.4 5.7
VLM4 78,273 47,553 17,720 11,090 10,939 3,091 1,372 8,524 1,010 371 126 123 118 2.3 92.4 76.8 57.5 88.1 5.5
VLM8 79,330 47,526 19,956 10,690 11,081 2,822 1,225 8,216 735 391 126 125 119 1.2 96.9 78.4 57.2 26.8 5.7
VLM13 66,214 38,824 18,860 15,062 8,836 3,267 1,143 11,208 1,241 339 93 94 154 25.5 73.0 56.5 46.3 27.3 4.8
VLM16 76,840 48,760 19,884 11,660 10,772 3,091 1,563 8,444 1,351 412 128 126 126 14.4 97.3 81.6 57.9 27.9 6.1
VLM20 75,768 46,866 20,663 12,655 11,102 3,308 1,354 10,499 1,449 404 124 122 129 14.7 96.6 78.8 58.3 28.7 5.9
VLM22 79,569 52,554 21,836 12,314 11,460 3,674 1,315 9,940 1,499 421 127 125 129 14.8 98.0 82.0 60.0 29.8 6.2
VLM27 77,454 48,524 20,000 11,301 10,898 3,311 1,304 8,639 1,303 436 125 127 127 13.8 96.3 100.6 62.3 29.2 6.4
VLM28 77,080 46,840 20,264 11,292 10,564 4,220 1,167 8,508 1,734 464 137 126 130 58.2 99.8 81.2 61.8 32.0 6.6
Sample Allea Felea Klea Calea Mglea Tilea Mnlea Nalea Plea Znlea Pblea Crlea Srlea Nilea Culea Lilea Cdlea Colea
BE1 7,848 14,695 1,432 7,005 3,246 47 925 303 1,083 282 113 31 30 39 64 28 5.5 18
BE2 7,776 14,859 1,364 7,884 3,325 49 1,167 283 1,081 253 100 32 53 39 64 28 5.2 18
BE3 7,502 13,848 1,341 7,026 2,906 42 1,015 195 1,020 305 121 29 42 38 60 29 5.7 17
BE4 7,632 14,384 1,371 7,210 3,050 43 1,201 252 1,011 340 138 30 47 40 62 28 6.4 18
BE5 6,602 12,460 1,527 4,584 2,676 53 885 175 1,053 220 93 27 39 32 59 25 4.3 17
BE6 7,172 12,812 1,802 5,772 2,762 53 1,052 189 1,092 231 90 28 44 36 62 28 4.5 18
VLM1 9,196 16,301 [ 5,593 3,765 197 1,478 234 1,295 301 112 35 47 54 61 24 5.5 14
VLM3 9,588 17,062 [ 5,396 4,084 205 1,735 268 1,258 294 110 35 49 57 64 24 5.1 14
VLM4 9,376 15,794 [ 5,334 3,842 205 1,022 257 1,178 293 108 35 44 55 63 23 5.2 13
VLM8 9,362 15,360 [ 5,216 3,828 172 902 312 1,116 288 109 33 46 54 64 22 5.0 13
VLM13 6,770 13,006 1,568 6,310 2,982 209 822 210 978 250 76 26 41 39 48 20 3.6 12
VLM16 9,082 16,538 [ 5,432 3,742 188 1,247 258 1,278 318 117 34 47 53 72 24 5.4 14
VLM20 9,338 15,808 3,410 5,998 4,036 204 1,043 2,434 1,290 300 107 35 48 59 64 24 5.1 13
VLM22 9,158 15,804 3,386 4,938 3,728 199 1,023 1,419 1,312 291 108 34 44 55 63 24 5.0 13
VLM27 9,224 15,778 [ 4,706 3,674 193 995 183 1,198 306 115 35 42 54 68 23 5.4 14
VLM28 8,882 15,362 [ 4,884 3,494 186 871 171 1,193 330 120 33 42 52 68 25 5.6 13
Sample Alex Feex Kex Caex Mgex Tiex Mnex Naex Pex Znex Pbex Crex Srex Niex Cuex Liex Cdex Coex
BE1 1.1 1.7 211 1,528 449 \ 1.6 377 11 0.6 \ \ 7.0 0.21 1.4 0.38 \ 0.05
BE2 4.3 2.4 189 2,803 708 \ 6.5 432 5 0.7 0.06 0.4 10.4 0.27 1.4 0.62 \ \BE3 6.8 2.2 166 1,061 326 \ 1.8 300 4 0.3 0.19 \ 4.7 0.19 1.2 0.38 \ 0.10
BE4 4.1 1.7 188 1,419 415 0.23 2.5 344 12 0.4 0.05 \ 5.9 0.22 1.0 0.31 0.02 0.05
BE5 1.2 2.8 320 820 302 0.31 \ 388 13 0.5 0.05 2.6 4.6 0.23 1.2 0.45 0.05 0.11
BE6 7.0 1.6 324 900 294 0.21 \ 256 13 0.3 0.06 \ 5.8 0.19 0.9 0.33 0.15 0.08
VLM1 5.6 5.1 183 436 313 \ 1.6 335 9 0.5 \ \ 5.4 0.21 0.8 0.29 \ \VLM3 6.8 4.8 235 925 323 \ 0.2 483 10 0.5 \ 3.2 5.1 0.24 1.1 0.34 0.04 0.03
VLM4 3.8 5.0 204 969 333 0.17 17.0 361 11 0.6 \ 0.5 5.6 0.24 1.5 0.35 0.03 0.04
VLM8 4.6 7.3 216 833 298 0.23 0.6 440 7 0.4 \ 1.2 4.9 0.19 1.2 0.40 \ 0.03
VLM13 14.1 20.9 281 925 255 \ 0.9 628 12 0.3 \ 0.8 4.6 0.19 0.9 0.50 0.02 \VLM16 6.0 7.5 198 859 280 0.19 1.7 267 9 0.5 \ 0.3 4.1 0.19 0.9 0.32 0.04 \
Environ Geol (2008) 56:399–412 405
123
clay minerals and organic matter was relatively small. All
studied sediments contained some biogenic and mineral
carbonates; therefore, the material would have been semi-
neutral or alkalic after deposition and drying. Since rock
(limestone) carbonates generally are not resistant during
transport in rivers like the Vltava and Berounka which drain
catchments composed of dominantly silicate rocks, the
observed carbonate content within the studied sediments
originated above all from two major processes. The first is
evaporation of the pore-water contained in the mud, which
occurs exclusively in the uppermost layer of the sediment.
Evaporation of water might favor the precipitation of sec-
ondary carbonates from increased-concentration solutions.
The second process results from the presence of biogenic
carbonates. Fragmented shells of freshwater mollusks are
quite abundant in floodplain sediments of some sections of
the studied rivers. Layers up to several cm thick composed
mostly of shells and fragments have been locally found after
the flood, especially in the Vltava floodplain above Prague.
These shell fragments were dominated by Sphaerium cor-
neum s. l. (Linnaeus, 1758), Viviparus viviparus (Linnaeus,
1758) and Unio pictorum (Linnaeus, 1758) (determination
by J. Hlavac). Small fragments (up to several mm in size) of
these shells were visible in some of the sampled sediments
from the Vltava River. The sediments will remain semi-
neutral or alkalic until the newly formed fine-grained car-
bonate is leached by rainwater, and dissolution of shell
fragments will be much slower.
The base cations Ca, K, Mg and Na were the elements
with the highest exchangeable fractions (rainwater
leachable). Significant amounts of base cations might be
weakly bound onto the sediment cation exchange complex
(CEC) and exchanged with H+ or NH4+ from the leaching
solution (e.g., rainwater). Exchangeable concentrations of
Ca and Mg correlated with the content of carbonate car-
bon, and thus dissolution of disintegrated carbonates
might represent another source apart from CEC. However,
the correlation of total Ca concentration with carbonate
CO2 content in the sediment indicates that the major
source of calcium is the carbonate bound Ca. Some
samples contained more Ca, bound perhaps in feldspar
(plagioclase).
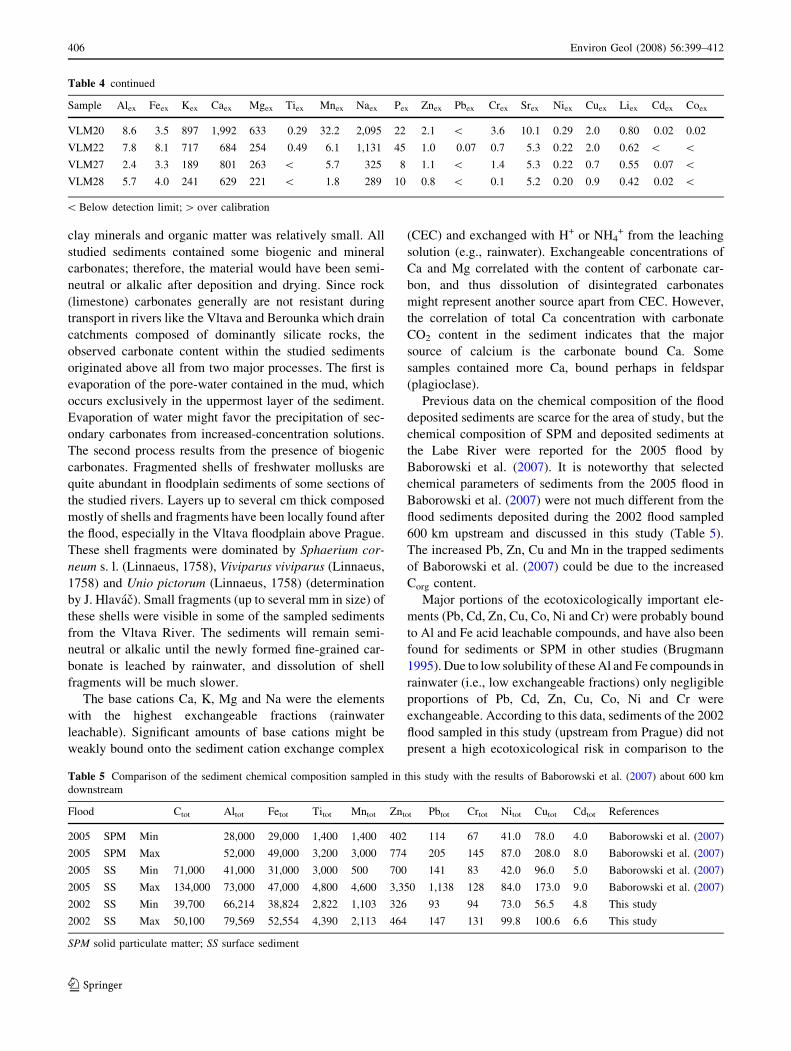
Previous data on the chemical composition of the flood
deposited sediments are scarce for the area of study, but the
chemical composition of SPM and deposited sediments at
the Labe River were reported for the 2005 flood by
Baborowski et al. (2007). It is noteworthy that selected
chemical parameters of sediments from the 2005 flood in
Baborowski et al. (2007) were not much different from the
flood sediments deposited during the 2002 flood sampled
600 km upstream and discussed in this study (Table 5).
The increased Pb, Zn, Cu and Mn in the trapped sediments
of Baborowski et al. (2007) could be due to the increased
Corg content.
Major portions of the ecotoxicologically important ele-
ments (Pb, Cd, Zn, Cu, Co, Ni and Cr) were probably bound
to Al and Fe acid leachable compounds, and have also been
found for sediments or SPM in other studies (Brugmann
1995). Due to low solubility of these Al and Fe compounds in
rainwater (i.e., low exchangeable fractions) only negligible
proportions of Pb, Cd, Zn, Cu, Co, Ni and Cr were
exchangeable. According to this data, sediments of the 2002
flood sampled in this study (upstream from Prague) did not
present a high ecotoxicological risk in comparison to the
Table 4 continued
Sample Alex Feex Kex Caex Mgex Tiex Mnex Naex Pex Znex Pbex Crex Srex Niex Cuex Liex Cdex Coex
VLM20 8.6 3.5 897 1,992 633 0.29 32.2 2,095 22 2.1 \ 3.6 10.1 0.29 2.0 0.80 0.02 0.02
VLM22 7.8 8.1 717 684 254 0.49 6.1 1,131 45 1.0 0.07 0.7 5.3 0.22 2.0 0.62 \ \VLM27 2.4 3.3 189 801 263 \ 5.7 325 8 1.1 \ 1.4 5.3 0.22 0.7 0.55 0.07 \VLM28 5.7 4.0 241 629 221 \ 1.8 289 10 0.8 \ 0.1 5.2 0.20 0.9 0.42 0.02 \
\ Below detection limit; [ over calibration
Table 5 Comparison of the sediment chemical composition sampled in this study with the results of Baborowski et al. (2007) about 600 km
downstream
Flood Ctot Altot Fetot Titot Mntot Zntot Pbtot Crtot Nitot Cutot Cdtot References
2005 SPM Min 28,000 29,000 1,400 1,400 402 114 67 41.0 78.0 4.0 Baborowski et al. (2007)
2005 SPM Max 52,000 49,000 3,200 3,000 774 205 145 87.0 208.0 8.0 Baborowski et al. (2007)
2005 SS Min 71,000 41,000 31,000 3,000 500 700 141 83 42.0 96.0 5.0 Baborowski et al. (2007)
2005 SS Max 134,000 73,000 47,000 4,800 4,600 3,350 1,138 128 84.0 173.0 9.0 Baborowski et al. (2007)
2002 SS Min 39,700 66,214 38,824 2,822 1,103 326 93 94 73.0 56.5 4.8 This study
2002 SS Max 50,100 79,569 52,554 4,390 2,113 464 147 131 99.8 100.6 6.6 This study
SPM solid particulate matter; SS surface sediment
406 Environ Geol (2008) 56:399–412
123
limits for critical concentrations of toxic elements in soils
(Swartjes 1999).
The higher concentrations of Pb and Zn in samples BE1,
BE2, BE3 and BE4 in comparison to concentrations found
in samples BE5 and BE6 may indicate the influence of the
Litavka River on the chemical composition of flood sedi-
ments of the Berounka River. The Litavka River draining
the Prıbram ore region is known for its high contamination
by heavy metals (e.g., Ettler et al. 2005). Although the
differences between concentrations were small, it is
important to note that according to sine (2003a) the flow of
the Berounka at the confluence with the Litavka peaked on
13 August 2002 (11 p.m.) with a flow of 2,170 m3 s-1,
while the flow of the Litavka peaked much earlier, on 13
August 2002 (7 a.m.) with 210 m3 s-1. Thus, the dilution
factor of flux from the Litavka into the Berounka was
approximately 1:10 or more. Even with such a high dilu-
tion factor, concentrations of Pb and Zn were elevated in
sediments collected below the Litavka River inflow.
Furthermore, the mixing effect of water masses con-
taining the SPM in the turbulent river flow during the flood
was not very effective. Sample BE4, sampled 8 km
downstream from the Berounka and Litavka confluence,
but from the same bank as the Litavka inlet, still contained
higher Pb concentrations than samples BE1 and BE3 from
the opposite bank. Therefore, the ineffective mixing of the
water masses and SPM was still evident after transport
from the Litavka inflow over 8 km downstream to the sites
BE1, BE3 and BE4.
Vertical chemical zoning of the deposited mud
Development of the SPM quality during flood
With respect to SPM, the first significant event during a
flood is the mobilization of all non-consolidated fine-
grained organic matter-rich sediments at the riverbed,
deposited there prior to the flood. Such material is easily
re-suspended during the initial stage of a flood. Therefore,
the first water phase of a flood usually contains higher
concentrations of suspended matter (Lehman et al. 1999)
and pollutants (Baborowski et al. 2004). These re-sus-
pended fine sediments may not be deposited on the
riverbanks, since the river flow in this phase of the flood
remains restricted to the streambed channel. Due to this,
the first peak of suspended matter content in the river water
usually occurs prior to the flood crest.
With increasing river discharge approaching the flood
crest, the river overflows the stream channel and material
from the floodplains or fields (usually fluvial soils with a
cultivated layer on top) is eroded and carried downstream.
During the 2002 flood at the Vltava River and its
tributaries, numerous new river channels formed within the
floodplain, the cultivated layer from fields was removed in
places, and at some sites with high water turbulence ero-
sion, depressions within the floodplain formed, up to 3 m
deep and several tens or hundreds of meters long. A sig-
nificant portion of this SPM material was re-deposited,
especially in the area below the confluence of the Vltava
and Labe Rivers, where temporary lakes formed.
The particle size and mass of suspended material during
the flood relates primarily to the discharge, as the dry
weight and particle size of suspended material reaches
maximal values during the flood crest and afterwards
decreases (Baborowski et al. 2004).
Profiles through the fresh floodplain sediment
of the Berounka River
The spatial distribution and extent of contamination of
floodplain sediments has been studied at a number of
catchments (e.g., Martin 1997; Walling et al. 2003;
Baborowski et al. 2007, etc.), but information on the ver-
tical distribution of elements in a profile through a
deposited sediment is rather sparse (Taylor 1996; Martin
2000). This section discusses the vertical distribution in a
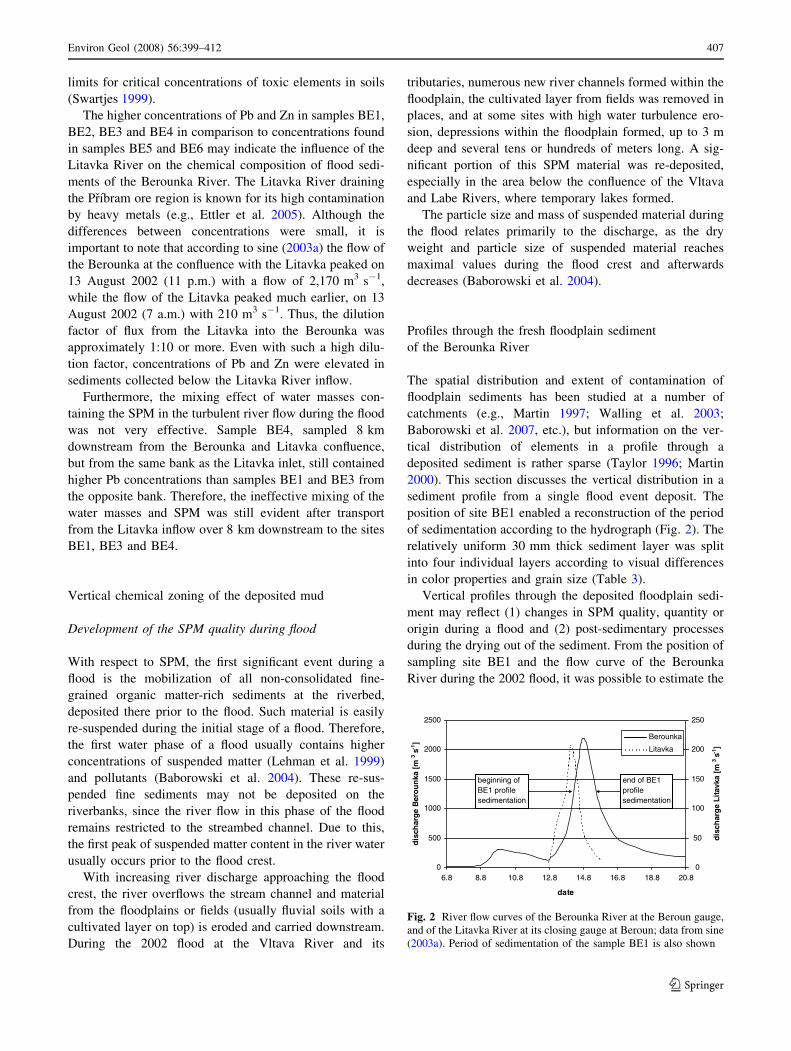
sediment profile from a single flood event deposit. The
position of site BE1 enabled a reconstruction of the period
of sedimentation according to the hydrograph (Fig. 2). The
relatively uniform 30 mm thick sediment layer was split
into four individual layers according to visual differences
in color properties and grain size (Table 3).
Vertical profiles through the deposited floodplain sedi-
ment may reflect (1) changes in SPM quality, quantity or
origin during a flood and (2) post-sedimentary processes
during the drying out of the sediment. From the position of
sampling site BE1 and the flow curve of the Berounka
River during the 2002 flood, it was possible to estimate the
0
500
1000
1500
2000
2500
6.8 8.8 10.8 12.8 14.8 16.8 18.8 20.8
date
m[ akn
uore
B egra
hcsid
3s
1-]
0
50
100
150
200
250m[ akv ati
L egr a
hcs id
3s
1-]
Berounka
Litavka
beginning of BE1 profile sedimentation
end of BE1 profile sedimentation
Fig. 2 River flow curves of the Berounka River at the Beroun gauge,
and of the Litavka River at its closing gauge at Beroun; data from sine
(2003a). Period of sedimentation of the sample BE1 is also shown
Environ Geol (2008) 56:399–412 407
123
beginning and end of sedimentation at this site. Sedimen-
tation started on 13 August 13 (12 a.m.) when the discharge
of the Berounka (approximately 1,400 m3 s-1) at the Be-
roun gauge was increasing (Fig. 2). Simultaneously, the
discharge from the Litavka River had already been
decreasing from its peak on 13 August (7 a.m.). Sedi-
mentation of the BE1 profile ceased on 14 August (6 p.m.)
(Fig. 2).
The contribution of discharge (and thus of SPM) from the
Litavka to the Berounka decreased from the beginning of the
sedimentation of profile BE1 until its end. Simultaneously,
the Berounka changed from increasing discharge while
approaching the flood crest to decreasing discharge (Fig. 2).
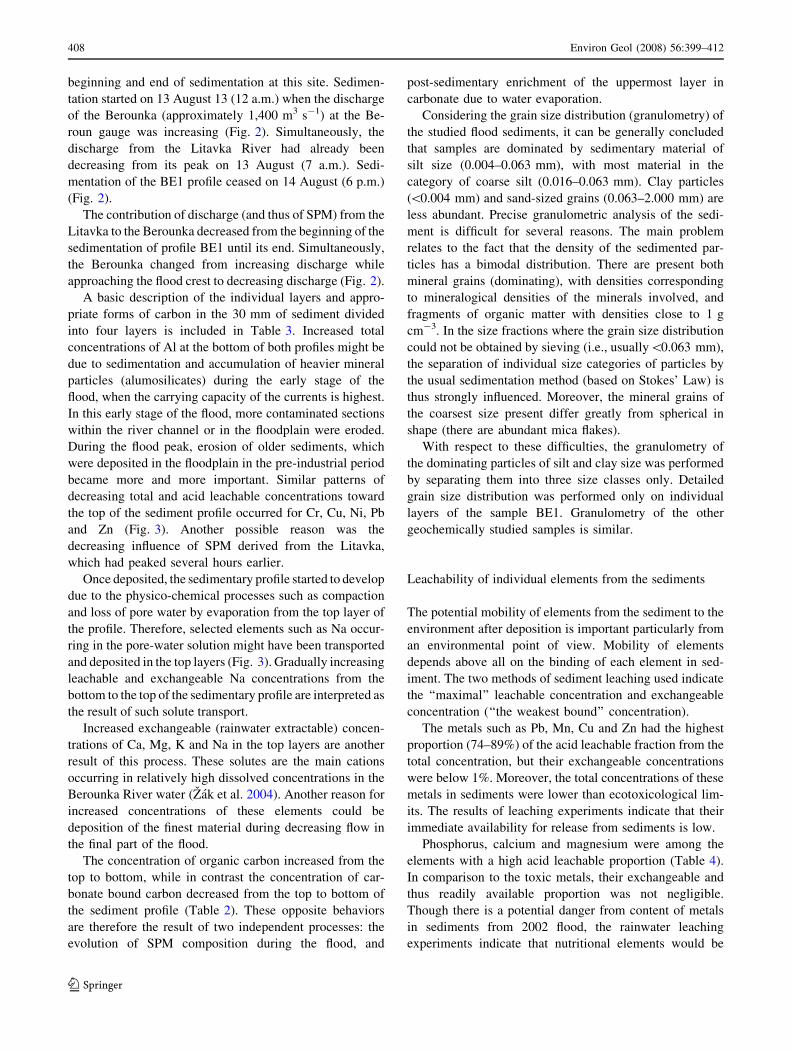
A basic description of the individual layers and appro-
priate forms of carbon in the 30 mm of sediment divided
into four layers is included in Table 3. Increased total
concentrations of Al at the bottom of both profiles might be
due to sedimentation and accumulation of heavier mineral
particles (alumosilicates) during the early stage of the
flood, when the carrying capacity of the currents is highest.
In this early stage of the flood, more contaminated sections
within the river channel or in the floodplain were eroded.
During the flood peak, erosion of older sediments, which
were deposited in the floodplain in the pre-industrial period
became more and more important. Similar patterns of
decreasing total and acid leachable concentrations toward
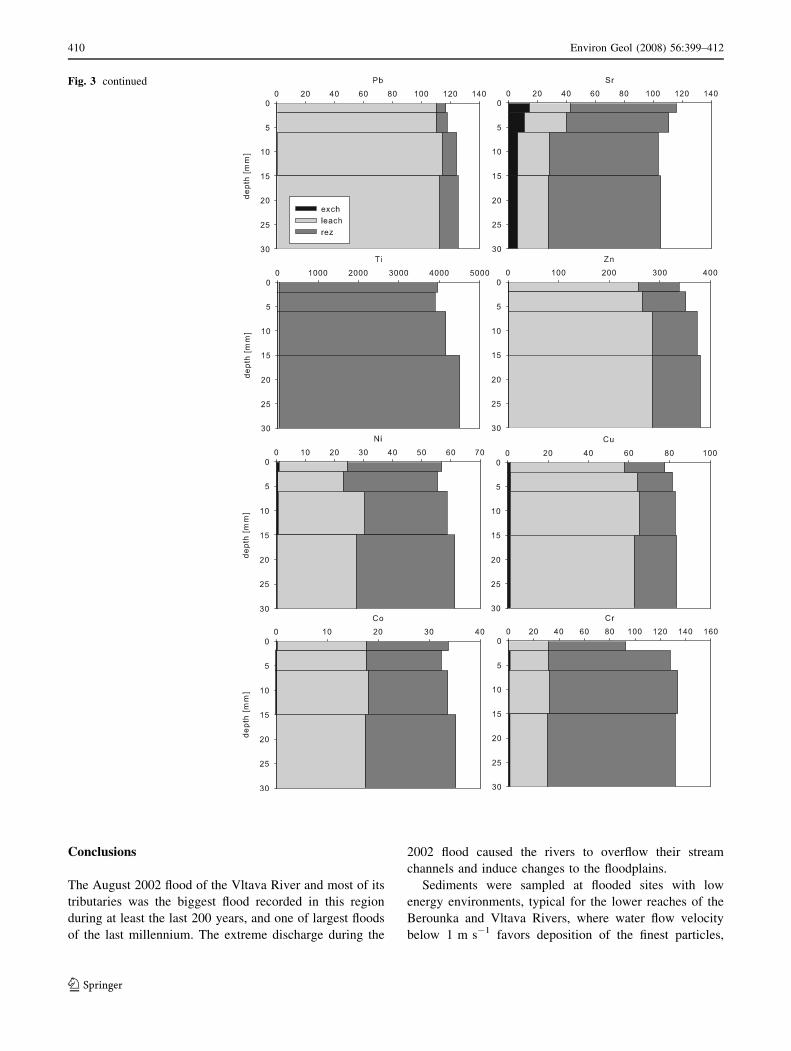
the top of the sediment profile occurred for Cr, Cu, Ni, Pb
and Zn (Fig. 3). Another possible reason was the
decreasing influence of SPM derived from the Litavka,
which had peaked several hours earlier.
Once deposited, the sedimentary profile started to develop
due to the physico-chemical processes such as compaction
and loss of pore water by evaporation from the top layer of
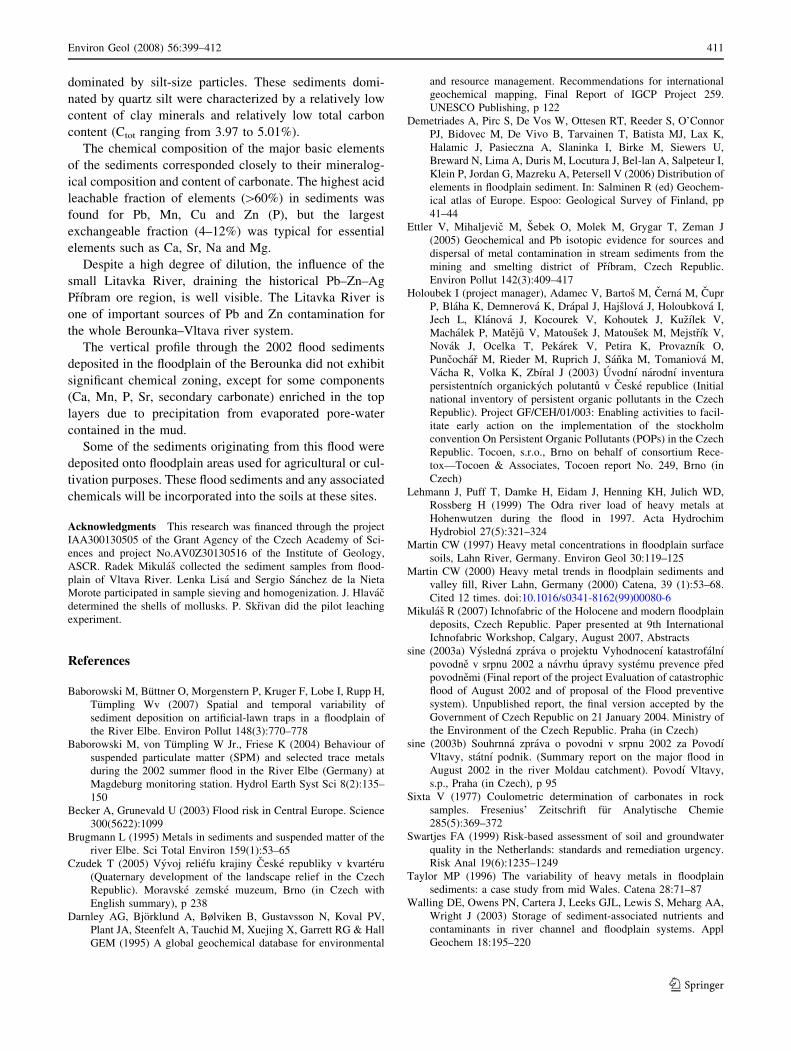
the profile. Therefore, selected elements such as Na occur-
ring in the pore-water solution might have been transported
and deposited in the top layers (Fig. 3). Gradually increasing
leachable and exchangeable Na concentrations from the
bottom to the top of the sedimentary profile are interpreted as
the result of such solute transport.
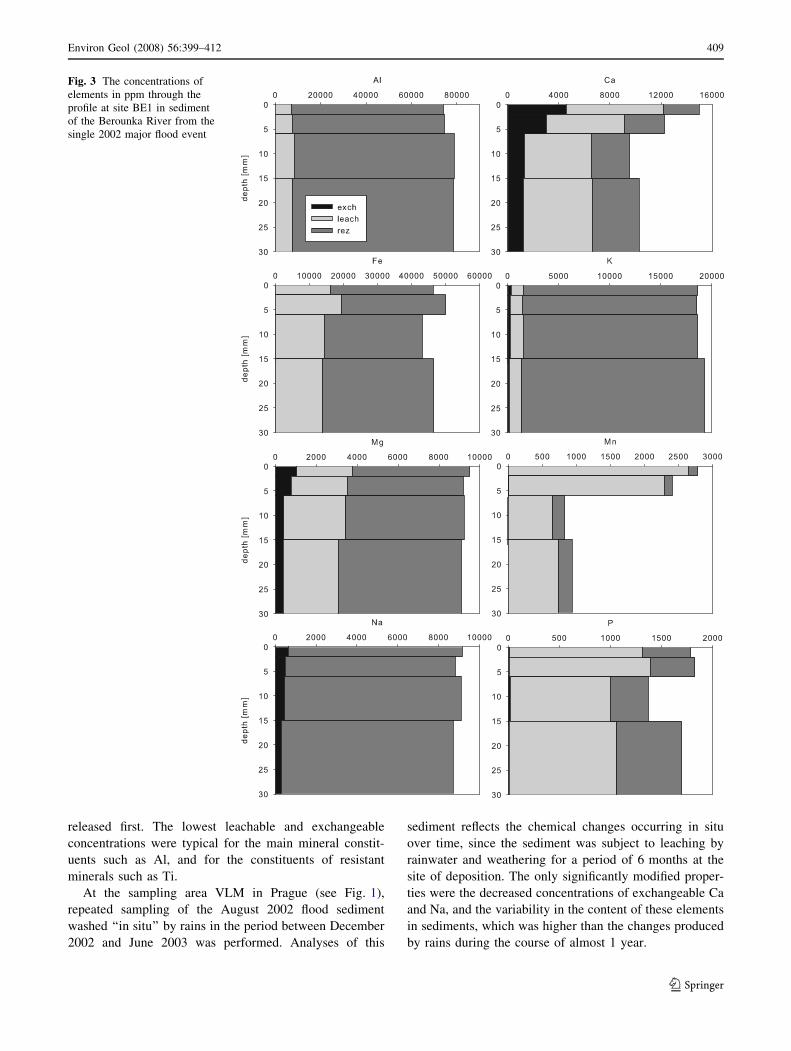
Increased exchangeable (rainwater extractable) concen-
trations of Ca, Mg, K and Na in the top layers are another
result of this process. These solutes are the main cations
occurring in relatively high dissolved concentrations in the
Berounka River water (Zak et al. 2004). Another reason for
increased concentrations of these elements could be
deposition of the finest material during decreasing flow in
the final part of the flood.
The concentration of organic carbon increased from the
top to bottom, while in contrast the concentration of car-
bonate bound carbon decreased from the top to bottom of
the sediment profile (Table 2). These opposite behaviors
are therefore the result of two independent processes: the
evolution of SPM composition during the flood, and
post-sedimentary enrichment of the uppermost layer in
carbonate due to water evaporation.
Considering the grain size distribution (granulometry) of
the studied flood sediments, it can be generally concluded
that samples are dominated by sedimentary material of
silt size (0.004–0.063 mm), with most material in the
category of coarse silt (0.016–0.063 mm). Clay particles
(\0.004 mm) and sand-sized grains (0.063–2.000 mm) are
less abundant. Precise granulometric analysis of the sedi-
ment is difficult for several reasons. The main problem
relates to the fact that the density of the sedimented par-
ticles has a bimodal distribution. There are present both
mineral grains (dominating), with densities corresponding
to mineralogical densities of the minerals involved, and
fragments of organic matter with densities close to 1 g
cm-3. In the size fractions where the grain size distribution
could not be obtained by sieving (i.e., usually\0.063 mm),
the separation of individual size categories of particles by
the usual sedimentation method (based on Stokes’ Law) is
thus strongly influenced. Moreover, the mineral grains of
the coarsest size present differ greatly from spherical in
shape (there are abundant mica flakes).
With respect to these difficulties, the granulometry of
the dominating particles of silt and clay size was performed
by separating them into three size classes only. Detailed
grain size distribution was performed only on individual
layers of the sample BE1. Granulometry of the other
geochemically studied samples is similar.
Leachability of individual elements from the sediments
The potential mobility of elements from the sediment to the
environment after deposition is important particularly from
an environmental point of view. Mobility of elements
depends above all on the binding of each element in sed-
iment. The two methods of sediment leaching used indicate
the ‘‘maximal’’ leachable concentration and exchangeable
concentration (‘‘the weakest bound’’ concentration).
The metals such as Pb, Mn, Cu and Zn had the highest
proportion (74–89%) of the acid leachable fraction from the
total concentration, but their exchangeable concentrations
were below 1%. Moreover, the total concentrations of these
metals in sediments were lower than ecotoxicological lim-
its. The results of leaching experiments indicate that their
immediate availability for release from sediments is low.
Phosphorus, calcium and magnesium were among the
elements with a high acid leachable proportion (Table 4).
In comparison to the toxic metals, their exchangeable and
thus readily available proportion was not negligible.
Though there is a potential danger from content of metals
in sediments from 2002 flood, the rainwater leaching
experiments indicate that nutritional elements would be
408 Environ Geol (2008) 56:399–412
123
released first. The lowest leachable and exchangeable
concentrations were typical for the main mineral constit-
uents such as Al, and for the constituents of resistant
minerals such as Ti.
At the sampling area VLM in Prague (see Fig. 1),
repeated sampling of the August 2002 flood sediment
washed ‘‘in situ’’ by rains in the period between December
2002 and June 2003 was performed. Analyses of this
sediment reflects the chemical changes occurring in situ
over time, since the sediment was subject to leaching by
rainwater and weathering for a period of 6 months at the
site of deposition. The only significantly modified proper-
ties were the decreased concentrations of exchangeable Ca
and Na, and the variability in the content of these elements
in sediments, which was higher than the changes produced
by rains during the course of almost 1 year.
Fig. 3 The concentrations of
elements in ppm through the
profile at site BE1 in sediment
of the Berounka River from the
single 2002 major flood event
Environ Geol (2008) 56:399–412 409
123
Conclusions
The August 2002 flood of the Vltava River and most of its
tributaries was the biggest flood recorded in this region
during at least the last 200 years, and one of largest floods
of the last millennium. The extreme discharge during the
2002 flood caused the rivers to overflow their stream
channels and induce changes to the floodplains.
Sediments were sampled at flooded sites with low
energy environments, typical for the lower reaches of the
Berounka and Vltava Rivers, where water flow velocity
below 1 m s-1 favors deposition of the finest particles,
Fig. 3 continued
410 Environ Geol (2008) 56:399–412
123
dominated by silt-size particles. These sediments domi-
nated by quartz silt were characterized by a relatively low
content of clay minerals and relatively low total carbon
content (Ctot ranging from 3.97 to 5.01%).
The chemical composition of the major basic elements
of the sediments corresponded closely to their mineralog-
ical composition and content of carbonate. The highest acid
leachable fraction of elements ([60%) in sediments was
found for Pb, Mn, Cu and Zn (P), but the largest
exchangeable fraction (4–12%) was typical for essential
elements such as Ca, Sr, Na and Mg.
Despite a high degree of dilution, the influence of the
small Litavka River, draining the historical Pb–Zn–Ag
Prıbram ore region, is well visible. The Litavka River is
one of important sources of Pb and Zn contamination for
the whole Berounka–Vltava river system.
The vertical profile through the 2002 flood sediments
deposited in the floodplain of the Berounka did not exhibit
significant chemical zoning, except for some components
(Ca, Mn, P, Sr, secondary carbonate) enriched in the top
layers due to precipitation from evaporated pore-water
contained in the mud.
Some of the sediments originating from this flood were
deposited onto floodplain areas used for agricultural or cul-
tivation purposes. These flood sediments and any associated
chemicals will be incorporated into the soils at these sites.
Acknowledgments This research was financed through the project
IAA300130505 of the Grant Agency of the Czech Academy of Sci-
ences and project No.AV0Z30130516 of the Institute of Geology,
ASCR. Radek Mikulas collected the sediment samples from flood-
plain of Vltava River. Lenka Lisa and Sergio Sanchez de la Nieta
Morote participated in sample sieving and homogenization. J. Hlavac
determined the shells of mollusks. P. Skrivan did the pilot leaching
experiment.
References
Baborowski M, Buttner O, Morgenstern P, Kruger F, Lobe I, Rupp H,
Tumpling Wv (2007) Spatial and temporal variability of
sediment deposition on artificial-lawn traps in a floodplain of
the River Elbe. Environ Pollut 148(3):770–778
Baborowski M, von Tumpling W Jr., Friese K (2004) Behaviour of
suspended particulate matter (SPM) and selected trace metals
during the 2002 summer flood in the River Elbe (Germany) at
Magdeburg monitoring station. Hydrol Earth Syst Sci 8(2):135–
150
Becker A, Grunevald U (2003) Flood risk in Central Europe. Science
300(5622):1099
Brugmann L (1995) Metals in sediments and suspended matter of the
river Elbe. Sci Total Environ 159(1):53–65
Czudek T (2005) Vyvoj reliefu krajiny Ceske republiky v kvarteru
(Quaternary development of the landscape relief in the Czech
Republic). Moravske zemske muzeum, Brno (in Czech with
English summary), p 238
Darnley AG, Bjorklund A, Bølviken B, Gustavsson N, Koval PV,
Plant JA, Steenfelt A, Tauchid M, Xuejing X, Garrett RG & Hall
GEM (1995) A global geochemical database for environmental
and resource management. Recommendations for international
geochemical mapping, Final Report of IGCP Project 259.
UNESCO Publishing, p 122
Demetriades A, Pirc S, De Vos W, Ottesen RT, Reeder S, O’Connor
PJ, Bidovec M, De Vivo B, Tarvainen T, Batista MJ, Lax K,
Halamic J, Pasieczna A, Slaninka I, Birke M, Siewers U,
Breward N, Lima A, Duris M, Locutura J, Bel-lan A, Salpeteur I,
Klein P, Jordan G, Mazreku A, Petersell V (2006) Distribution of
elements in floodplain sediment. In: Salminen R (ed) Geochem-
ical atlas of Europe. Espoo: Geological Survey of Finland, pp
41–44
Ettler V, Mihaljevic M, Sebek O, Molek M, Grygar T, Zeman J
(2005) Geochemical and Pb isotopic evidence for sources and
dispersal of metal contamination in stream sediments from the
mining and smelting district of Prıbram, Czech Republic.
Environ Pollut 142(3):409–417
Holoubek I (project manager), Adamec V, Bartos M, Cerna M, Cupr
P, Blaha K, Demnerova K, Drapal J, Hajslova J, Holoubkova I,
Jech L, Klanova J, Kocourek V, Kohoutek J, Kuzılek V,
Machalek P, Mateju V, Matousek J, Matousek M, Mejstrık V,
Novak J, Ocelka T, Pekarek V, Petira K, Provaznık O,
Puncochar M, Rieder M, Ruprich J, Sanka M, Tomaniova M,
Vacha R, Volka K, Zbıral J (2003) Uvodnı narodnı inventura
persistentnıch organickych polutantu v Ceske republice (Initial
national inventory of persistent organic pollutants in the Czech
Republic). Project GF/CEH/01/003: Enabling activities to facil-
itate early action on the implementation of the stockholm
convention On Persistent Organic Pollutants (POPs) in the Czech
Republic. Tocoen, s.r.o., Brno on behalf of consortium Rece-
tox—Tocoen & Associates, Tocoen report No. 249, Brno (in
Czech)
Lehmann J, Puff T, Damke H, Eidam J, Henning KH, Julich WD,
Rossberg H (1999) The Odra river load of heavy metals at
Hohenwutzen during the flood in 1997. Acta Hydrochim
Hydrobiol 27(5):321–324
Martin CW (1997) Heavy metal concentrations in floodplain surface
soils, Lahn River, Germany. Environ Geol 30:119–125
Martin CW (2000) Heavy metal trends in floodplain sediments and
valley fill, River Lahn, Germany (2000) Catena, 39 (1):53–68.
Cited 12 times. doi:10.1016/s0341-8162(99)00080-6
Mikulas R (2007) Ichnofabric of the Holocene and modern floodplain
deposits, Czech Republic. Paper presented at 9th International
Ichnofabric Workshop, Calgary, August 2007, Abstracts
sine (2003a) Vysledna zprava o projektu Vyhodnocenı katastrofalnı
povodne v srpnu 2002 a navrhu upravy systemu prevence pred
povodnemi (Final report of the project Evaluation of catastrophic
flood of August 2002 and of proposal of the Flood preventive
system). Unpublished report, the final version accepted by the
Government of Czech Republic on 21 January 2004. Ministry of
the Environment of the Czech Republic. Praha (in Czech)
sine (2003b) Souhrnna zprava o povodni v srpnu 2002 za Povodı
Vltavy, statnı podnik. (Summary report on the major flood in
August 2002 in the river Moldau catchment). Povodı Vltavy,
s.p., Praha (in Czech), p 95
Sixta V (1977) Coulometric determination of carbonates in rock
samples. Fresenius’ Zeitschrift fur Analytische Chemie
285(5):369–372
Swartjes FA (1999) Risk-based assessment of soil and groundwater
quality in the Netherlands: standards and remediation urgency.
Risk Anal 19(6):1235–1249
Taylor MP (1996) The variability of heavy metals in floodplain
sediments: a case study from mid Wales. Catena 28:71–87
Walling DE, Owens PN, Cartera J, Leeks GJL, Lewis S, Meharg AA,
Wright J (2003) Storage of sediment-associated nutrients and
contaminants in river channel and floodplain systems. Appl
Geochem 18:195–220
Environ Geol (2008) 56:399–412 411
123
Zak K, Taborsky Z, Lachmanova M, Pudilova M (2001) Heavy
mineral assemblages in allochthonous clastic cave sediments of
the Bohemian Karst: a pilot study. Cesky Kras 27:5–14. Beroun
(in Czech with English abstract)
Zak K, Vysoka H, Bruthans J, Hlavac J (2004) Hydrogeology of karst
system of Spring Domasov—Tetın resurgence: new observation
and data. Cesky Kras 30:45–50. Beroun (in Czech with English
abstract)
412 Environ Geol (2008) 56:399–412
123
Related Documents