© 2017 Muhammad Rezaul Rakib, Md. Nurul Islam and Muhammod Nazrul Islam. This open access article is distributed under a Creative Commons Attribution (CC-BY) 3.0 license. Current Research in Geosciences Original Research Paper Flood Vulnerability Mapping to Riverine Floods: A Study on the Old Brahmaputra River Muhammad Rezaul Rakib, Md. Nurul Islam and Muhammod Nazrul Islam Department of Geography and Environment, Jahangirnagar University, Bangladesh Article history Received: 21-07-2017 Revised: 25-09-2017 Accepted: 16-10-2017 Corresponding Author: Muhammad Rezaul Rakib Department of Geography and Environment, Jahangirnagar University, Bangladesh Email: [email protected] Abstract: Flood is an inevitable natural phenomenon occurring from time to time in all rivers and natural drainage systems of Bangladesh. It causes damage to lives and natural resources as well as the loss of economy and health. This study illustrates the flood vulnerability mapping to riverine floods in the Old Brahmaputra River in Mymensingh Sadar upazila. The flood vulnerability mapping of fourteen unions of Mymensingh Sadar is made by using satellite images, a structured questionnaire, observation and secondary data. Flood vulnerability mapping is a necessary pre-requisite for comprehensive flood mitigation programs. This study emphasizes the importance and needs of looking the phenomena of floods and floods vulnerable area at the national scale in order to fully understand and completely deal with the problem. Totally flood vulnerable unions are Borar Char, Paranganj, Sirta, Char Ishwardi and Char Nilakshmia and flood vulnerable free unions are Ghagra, Dapunia and Akua. With these flood vulnerability mapping, the legal authority can take necessary steps to reduce the flood risk. Keywords: Flood, Vulnerability, River, Map, Old Brahmaputra Introduction Flood is the major disaster affecting Bangladesh year after year. It is an inevitable natural phenomenon occurring from time to time in all rivers and natural drainage systems. The heavy monsoon rain, melting ice, aggradations of riverbed and lowland condition are responsible for flood (Adnan, 1991; Khalequzzaman, 1994). The impact of floods has been increased due to a number of factors, with rising sea levels and increased development on a flood plain (Prithvish and Smita, 2007). In 1987, 1988 and 1998 Bangladesh experienced three extreme floods (Qader, 2003). Regular flooding of the major rivers causes enormous hardship and damage to lives and natural resources. Flood brings not only physical disruption but also socio-psychological and economic dislodgment in the affected areas. Flood impacts on the society and people lose agricultural land, settlements and infrastructures, caused damage of millions of taka often in each and every year of the country. A large number of the population becomes rootless by losing agricultural land and settlements (Alexander 1989a; 1989b; Khalequzzaman, 1991a; 1991b; 1992). Bangladesh is highly vulnerable to floods due to its geographical location at the deltas of the Ganges, Brahmaputra and Meghna rivers. About 92.5% of the area of three basins lies outside the boundaries of the country. The hydro-meteorological characteristics of the three river basins are unique and they often cause large to extremely large floods in Bangladesh (Qader, 2003). Flood along the Old Brahmaputra frequently occurs during the rainy season (BWDB, 2010). There are some districts in Bangladesh massively affected by flood; Mymensingh district is one of them. The present research is carried out in the Old Brahmaputra River in Mymensingh Sadar upazila. The Old Brahmaputra River in Mymensingh Sadar causes a great damage and destruction which is not a new phenomenon and at present, this problem is becoming more and more serious. Many towns, cultivable lands, irrigation projects and other valuable infrastructures are situated on the bank of this river. The recurrent flood of this river creates numerous problems. So it is important to make a study on the vulnerability mapping of floods in the Old Brahmaputra River. Concept of Flood Vulnerability The concept of vulnerability expresses the multidimensionality of disasters by focusing attention on the totality of relationships in a given social situation which constitute a condition that, in combination with environmental forces, produces a disaster (Bankoff et al., 2004). Vulnerability to natural hazards is an integral factor in understanding the true extent of risk.

Welcome message from author
This document is posted to help you gain knowledge. Please leave a comment to let me know what you think about it! Share it to your friends and learn new things together.
Transcript
© 2017 Muhammad Rezaul Rakib, Md. Nurul Islam and Muhammod Nazrul Islam. This open access article is distributed
under a Creative Commons Attribution (CC-BY) 3.0 license.
Current Research in Geosciences
Original Research Paper
Flood Vulnerability Mapping to Riverine Floods: A Study on
the Old Brahmaputra River
Muhammad Rezaul Rakib, Md. Nurul Islam and Muhammod Nazrul Islam
Department of Geography and Environment, Jahangirnagar University, Bangladesh Article history
Received: 21-07-2017
Revised: 25-09-2017
Accepted: 16-10-2017
Corresponding Author:
Muhammad Rezaul Rakib
Department of Geography and
Environment, Jahangirnagar
University, Bangladesh
Email: [email protected]
Abstract: Flood is an inevitable natural phenomenon occurring from time
to time in all rivers and natural drainage systems of Bangladesh. It causes
damage to lives and natural resources as well as the loss of economy and
health. This study illustrates the flood vulnerability mapping to riverine
floods in the Old Brahmaputra River in Mymensingh Sadar upazila. The
flood vulnerability mapping of fourteen unions of Mymensingh Sadar is
made by using satellite images, a structured questionnaire, observation and
secondary data. Flood vulnerability mapping is a necessary pre-requisite for
comprehensive flood mitigation programs. This study emphasizes the
importance and needs of looking the phenomena of floods and floods
vulnerable area at the national scale in order to fully understand and completely
deal with the problem. Totally flood vulnerable unions are Borar Char,
Paranganj, Sirta, Char Ishwardi and Char Nilakshmia and flood vulnerable free
unions are Ghagra, Dapunia and Akua. With these flood vulnerability mapping,
the legal authority can take necessary steps to reduce the flood risk.
Keywords: Flood, Vulnerability, River, Map, Old Brahmaputra
Introduction
Flood is the major disaster affecting Bangladesh year
after year. It is an inevitable natural phenomenon
occurring from time to time in all rivers and natural
drainage systems. The heavy monsoon rain, melting ice,
aggradations of riverbed and lowland condition are
responsible for flood (Adnan, 1991; Khalequzzaman,
1994). The impact of floods has been increased due to a
number of factors, with rising sea levels and increased
development on a flood plain (Prithvish and Smita,
2007). In 1987, 1988 and 1998 Bangladesh experienced
three extreme floods (Qader, 2003). Regular flooding of
the major rivers causes enormous hardship and damage to
lives and natural resources. Flood brings not only physical
disruption but also socio-psychological and economic
dislodgment in the affected areas. Flood impacts on the
society and people lose agricultural land, settlements
and infrastructures, caused damage of millions of taka
often in each and every year of the country. A large
number of the population becomes rootless by losing
agricultural land and settlements (Alexander 1989a;
1989b; Khalequzzaman, 1991a; 1991b; 1992).
Bangladesh is highly vulnerable to floods due to its
geographical location at the deltas of the Ganges,
Brahmaputra and Meghna rivers. About 92.5% of the
area of three basins lies outside the boundaries of the
country. The hydro-meteorological characteristics of the
three river basins are unique and they often cause large
to extremely large floods in Bangladesh (Qader, 2003).
Flood along the Old Brahmaputra frequently occurs
during the rainy season (BWDB, 2010). There are some
districts in Bangladesh massively affected by flood;
Mymensingh district is one of them. The present research is
carried out in the Old Brahmaputra River in Mymensingh
Sadar upazila. The Old Brahmaputra River in Mymensingh
Sadar causes a great damage and destruction which is not a
new phenomenon and at present, this problem is becoming
more and more serious. Many towns, cultivable lands,
irrigation projects and other valuable infrastructures are
situated on the bank of this river. The recurrent flood of this
river creates numerous problems. So it is important to make
a study on the vulnerability mapping of floods in the Old
Brahmaputra River.
Concept of Flood Vulnerability
The concept of vulnerability expresses the
multidimensionality of disasters by focusing attention on
the totality of relationships in a given social situation
which constitute a condition that, in combination with
environmental forces, produces a disaster (Bankoff et al.,
2004). Vulnerability to natural hazards is an integral
factor in understanding the true extent of risk.

Muhammad Rezaul Rakib et al. / Current Research in Geosciences 2017, 7 (2): 47.58
DOI: 10.3844/ajgsp.2017.47.58
48
Vulnerability factors can be divided into three main
areas physical vulnerability, social vulnerability and
economic vulnerability (Geoscience, 2014). Risk assessment is a qualitative or quantitative
evaluation of the environmental and health risk resulting from exposure to a chemical or physical agent. Risk assessment is the identification of danger and estimation of the probability of an occurrence (Enhealth, 2002). The most common method used to define flood risk consists of calculating the hazard, that is, the physical and statistical aspects of the actual flood (for example: Flood return period, the extent and depth of the flood and flow rate) and the level of vulnerability, the exposure of people and things to the flood and the susceptibility of the elements at risk of suffering damage due to flooding (Veleda et al., 2017). This definition has also been adopted by the EU Floods Directive (2007). Hence, it is comprised of three parameters (Martinez-Graña et al., 2013; 2016): Hazard, vulnerability and exposure and is calculated using the following equation:
Risk = Hazard ×Vulnerability×Exposure
Flood vulnerability assessment is an assessment of the risk of flooding to the development being proposed and its possible effects on flood risks elsewhere in terms of its effects. It is the assessment of the livelihood of flooding in a particular area so that development needs and mitigation measures can be carefully considered (Jacobs, 2007). So, an assessment that is required where development is likely to have an impact on water courses and land and properties in the immediate vicinity of watercourses that may be liable to flood.
The vulnerability index was calculated using the following parametric thematic maps: Geomorphology, slopes, elevations, distances, water height and inundation range (Martínez-Graña et al., 2016). In the flood vulnerable map, the following areas could be differentiated.
Most Vulnerable Area
Presents a high probability of flooding represented in
red on the map and signifies a highly vulnerable to humans,
due to the depth of the water sheet and the area which is
always flooded whenever flood occurred in this study area.
Moderate Vulnerable Area
Presents a medium probability of flooding represented
in orange on the map and is susceptible to frequent
flooding. However, this area is recurrently flooded area but
not affect mostly thus it is the moderate vulnerable area.
Less Vulnerable Area
Presents a low probability of flooding represented in yellow on the map and corresponds to those land sectors that present extraordinary and infrequent flooding. However, this area is flooded when the catastrophic flood occurred thus turn into vulnerable. In addition to,
which area may be inundated but not susceptible to flooding is defined as the flood free area
Aim and Objectives
The main aim of this study is to mapping the flood vulnerability in the Old Brahmaputra River. In order to come up with a reasonable analysis to the study of the vulnerability mapping of flood following specific objectives is set to be performed:
• Identification and mapping the vulnerable area
affected by riverine flood; and
• Providing planning strategy for the proper
development of the study area to reduce the quantity
and quality of vulnerability of floods
Data Source and Methodology
This study is based on primary and secondary data. For the empirical analysis of flood vulnerability mapping, primary data has been collected from the field by formal questionnaire survey and GPS survey. GPS survey provides the absolute and relative location of the vulnerable houses and different physical and cultural features in the global context. For verifying the data informal interview and observation has also done. Different maps, satellite images and database from the BBS, SPARRSO, FFWC, BWDB and BDMB are the sources of static data for this research. With this database, a specific methodology has been followed to produce this research work meaningfully. This study has planned to carry out mainly on the basis of the techniques of Remote Sensing and GIS. Collected data were processed through various levels and had to be compiled at some time. Processing and analyzing the satellite images have been carried out. Data have been analyzed in GIS to visualize the vulnerable zone of floods. Different types of the map produced by using Arc View GIS software with the help of the Land Sat Thematic Mapping Image. Therefore for the fruitful completion of the research work hydrological and some geographical approaches have been analyzed.
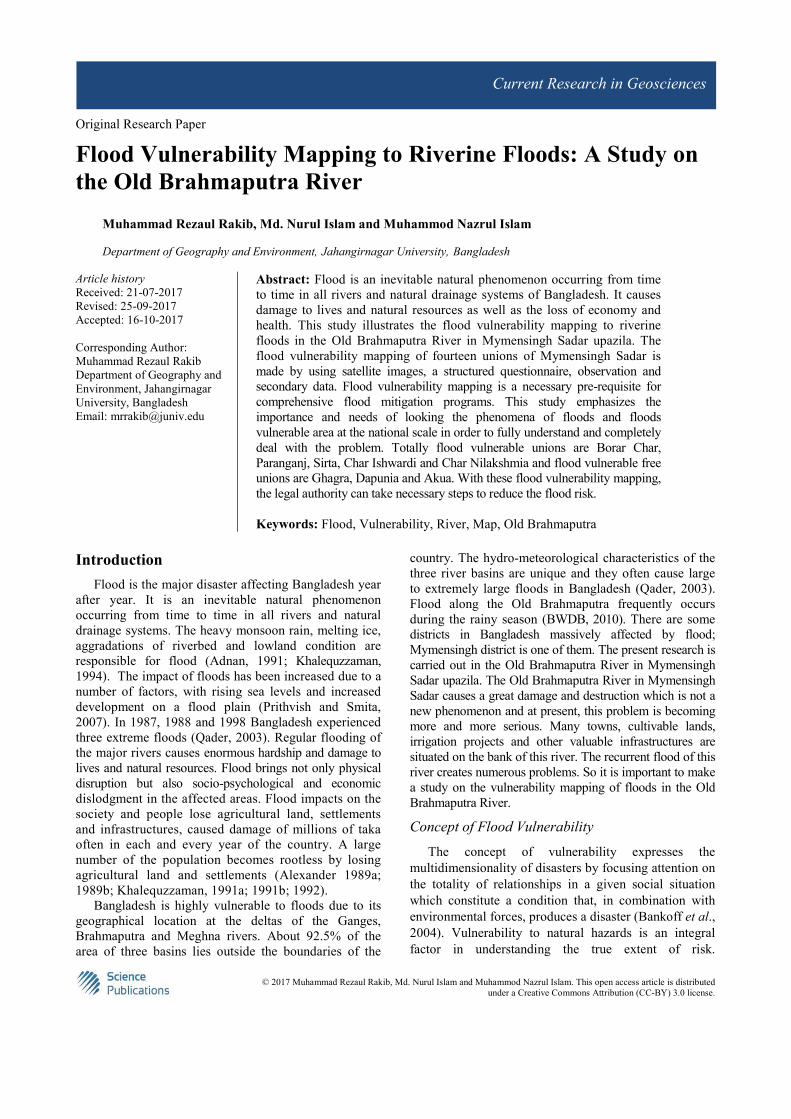
Study Area
Mymensingh Sadar upazila of Mymensingh district is
selected as study area for the purpose of the study. The
absolute location of study area is between 24042' N and
240
55' N latitudes and between 900
13'E and 900
28'E
longitudes with an area of 388.45 square kilometers (Fig.
1). This upazila consists of 1 municipality, 14 union
parishads, 136 mouzas and 173 villages and total
population is 566368 (Banglapedia, 2014). The Old
Brahmaputra, the Sutia and the Negeshwariaremain
rivers. The Old Brahmaputra River originates from the
left bank of the Brahmaputra to the north of
Bahadurabad. Flowing more or less to the southeast it
passes by Jamalpur and Mymensingh towns and falls
into the Meghna at Bhairab Bazar (Banglapedia, 2014).
Muhammad Rezaul Rakib et al. / Current Research in Geosciences 2017, 7 (2): 47.58
DOI: 10.3844/ajgsp.2017.47.58
49
Fig. 1: Study area map (Mymensingh Sadar Upazila) Source: BCA, complied by Author, 2017
Results and Discussion
The flood vulnerability mapping is a necessary pre-
requisite for comprehensive flood mitigation programs.
Flood zoning concept provides a basis for delineating the
flood risk areas. Flood zoning as a concept, however,
refers to land relative to its vulnerability to flooding and
damage to life and property, recognizing geomorphic
units as a basis for flood zoning (Hoyer, 1974). The
sequential LANDSAT imageries of Mymensingh Sadar
upazila in 1998 and 2007 are compared and mapped to
identify the vulnerable zone by flood in the study area.
To flood mitigation, it needs to identify the accurately
vulnerable area and provide flood hazard information in
the form of maps.
Flood Vulnerability Mapping
Sadar Upazila of Mymensingh district has been
subjected to severely affect by the riverine floods. Flood
continued along the 37 kilometers long both banks the
Old Brahmaputra River under this upazila. The 1998
flood in the Old Brahmaputra River threatened the health
and lives of millions through food shortages, the loss of
purchasing power for basic necessities and the potential
spread of water-borne disease. Poor households did
suffering substantial hardship during and after the flood.
The 1998 and 2007 severe floods proved that floods
and damages are not decreasing. The flood damage
potential is increasing due to the possible causes. High
magnitude floods strike on a regular basis in the river
basins in Bangladesh. The frequently occurring floods
are very costly in terms of human life and economic loss.
Therefore, the ability to estimate damages associated
with the flood events is very important and is necessary
for the evaluation of future alternate flood control
policies. Generally, the 1998 and 2007 severe floods are
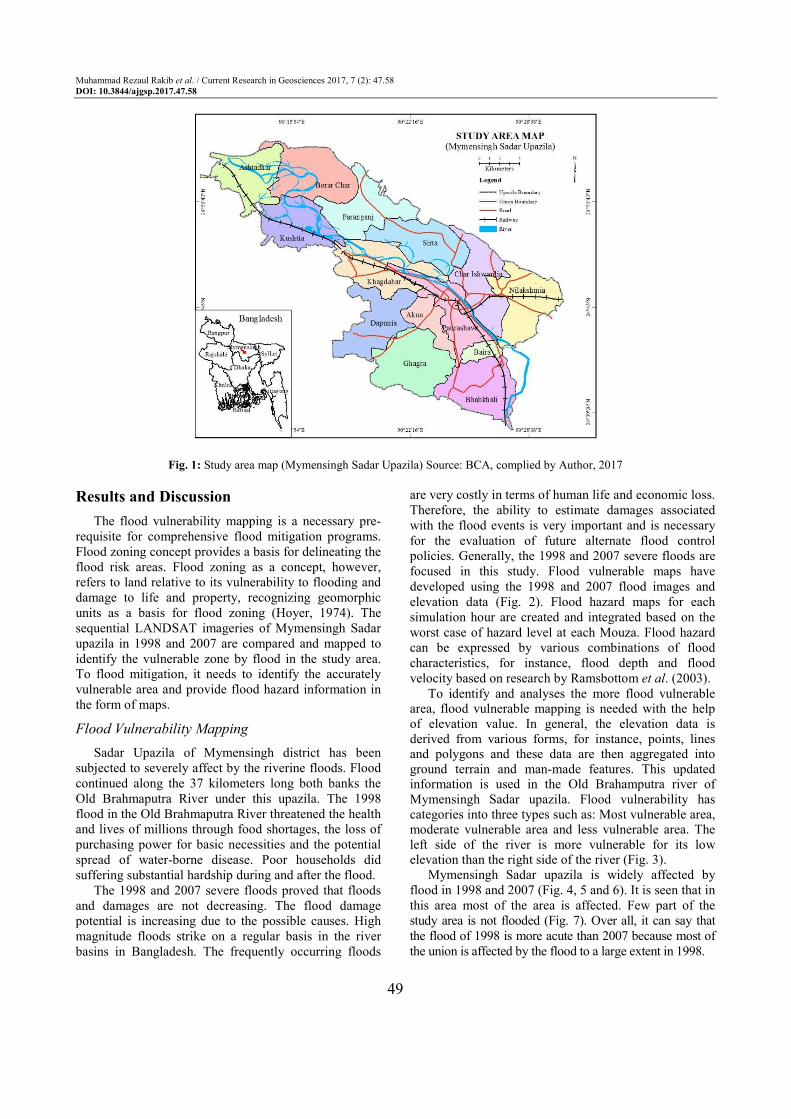
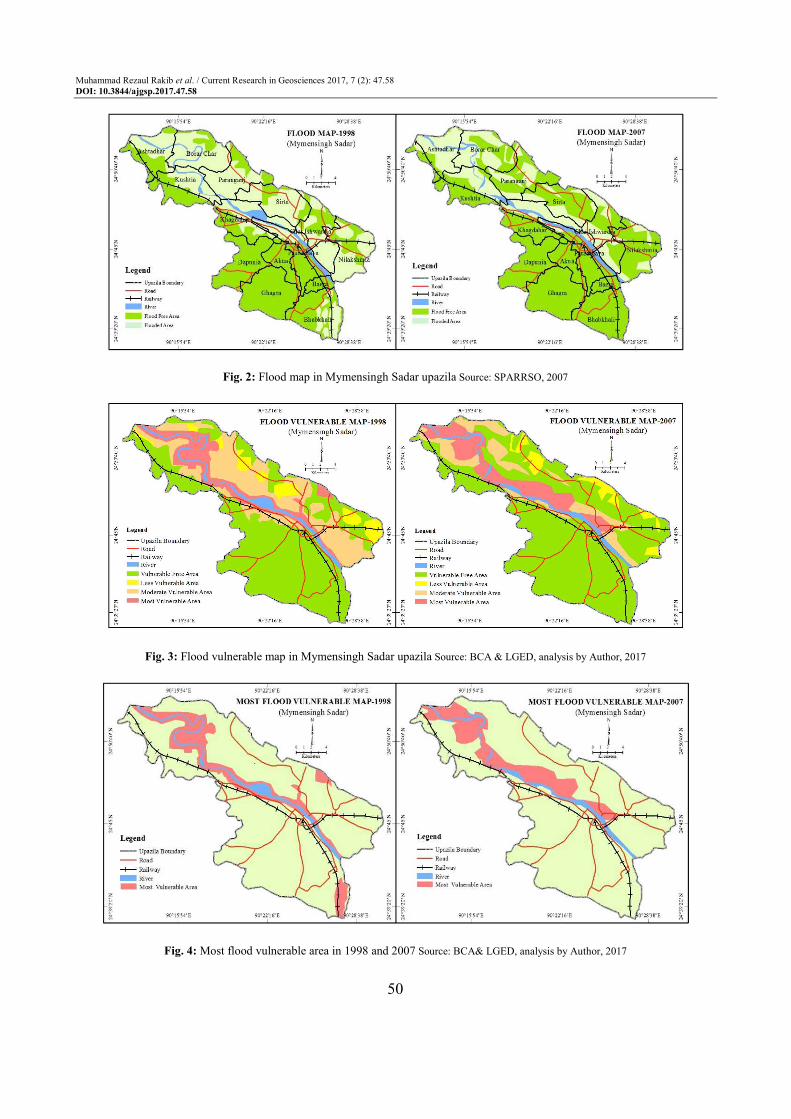
focused in this study. Flood vulnerable maps have
developed using the 1998 and 2007 flood images and
elevation data (Fig. 2). Flood hazard maps for each
simulation hour are created and integrated based on the
worst case of hazard level at each Mouza. Flood hazard
can be expressed by various combinations of flood
characteristics, for instance, flood depth and flood
velocity based on research by Ramsbottom et al. (2003).
To identify and analyses the more flood vulnerable area, flood vulnerable mapping is needed with the help
of elevation value. In general, the elevation data is
derived from various forms, for instance, points, lines and polygons and these data are then aggregated into
ground terrain and man-made features. This updated information is used in the Old Brahamputra river of
Mymensingh Sadar upazila. Flood vulnerability has
categories into three types such as: Most vulnerable area, moderate vulnerable area and less vulnerable area. The
left side of the river is more vulnerable for its low elevation than the right side of the river (Fig. 3).
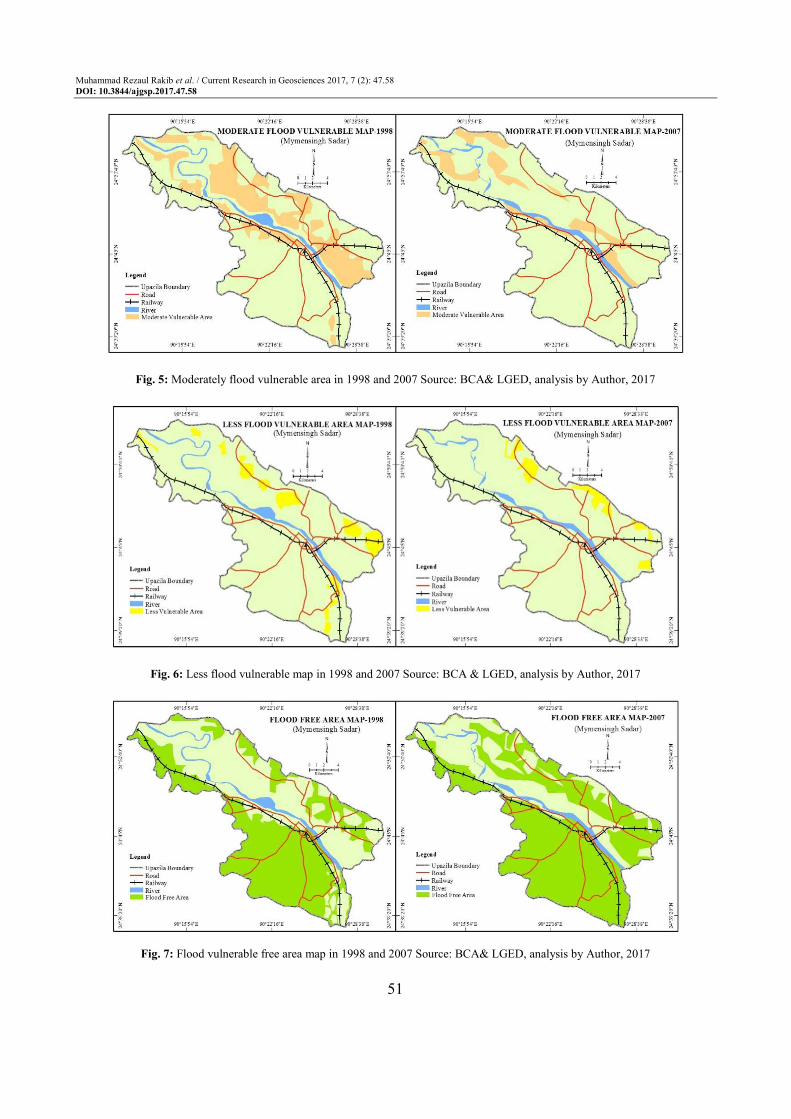
Mymensingh Sadar upazila is widely affected by
flood in 1998 and 2007 (Fig. 4, 5 and 6). It is seen that in
this area most of the area is affected. Few part of the
study area is not flooded (Fig. 7). Over all, it can say that
the flood of 1998 is more acute than 2007 because most of
the union is affected by the flood to a large extent in 1998.
Muhammad Rezaul Rakib et al. / Current Research in Geosciences 2017, 7 (2): 47.58
DOI: 10.3844/ajgsp.2017.47.58
50
Fig. 2: Flood map in Mymensingh Sadar upazila Source: SPARRSO, 2007
Fig. 3: Flood vulnerable map in Mymensingh Sadar upazila Source: BCA & LGED, analysis by Author, 2017
Fig. 4: Most flood vulnerable area in 1998 and 2007 Source: BCA& LGED, analysis by Author, 2017
Muhammad Rezaul Rakib et al. / Current Research in Geosciences 2017, 7 (2): 47.58
DOI: 10.3844/ajgsp.2017.47.58
51
Fig. 5: Moderately flood vulnerable area in 1998 and 2007 Source: BCA& LGED, analysis by Author, 2017
Fig. 6: Less flood vulnerable map in 1998 and 2007 Source: BCA & LGED, analysis by Author, 2017
Fig. 7: Flood vulnerable free area map in 1998 and 2007 Source: BCA& LGED, analysis by Author, 2017
Muhammad Rezaul Rakib et al. / Current Research in Geosciences 2017, 7 (2): 47.58
DOI: 10.3844/ajgsp.2017.47.58
52
Flood Vulnerability Mapping According to Union
Flood has a great impact on Mymensingh Sadar
upazila. It caused damages and destructions which have
no bounds. Most of the study area is affected by floods.
The amount of inundation is highest in 1998 flood rather
than 2007 flood. The 1998 flood is more devastating
because most of the unions are affected by the flood to a
large extent in 1998 (Table 1). There are fourteen
unions in this study area. Among them, all unions are
not flooded equally. Some unions face more
vulnerability, some faces most vulnerability, some
unions faces less vulnerability and some unions
remain free from flood. All the mouzas of these
unions are also not flooded equally. To identify the
most vulnerable union or mouza, it is very important
to develop flood vulnerability map according to
unions. Flood vulnerability map helps to identify the
most vulnerable area easily.
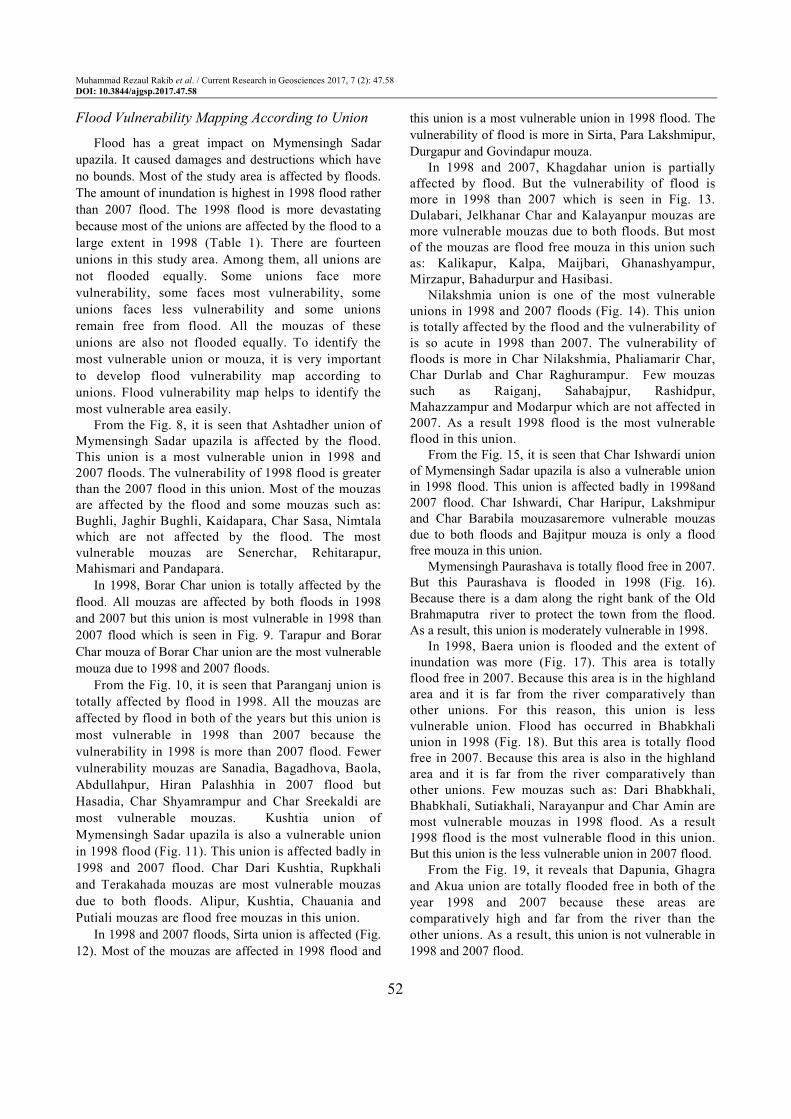
From the Fig. 8, it is seen that Ashtadher union of
Mymensingh Sadar upazila is affected by the flood.
This union is a most vulnerable union in 1998 and
2007 floods. The vulnerability of 1998 flood is greater
than the 2007 flood in this union. Most of the mouzas
are affected by the flood and some mouzas such as:
Bughli, Jaghir Bughli, Kaidapara, Char Sasa, Nimtala
which are not affected by the flood. The most
vulnerable mouzas are Senerchar, Rehitarapur,
Mahismari and Pandapara.
In 1998, Borar Char union is totally affected by the
flood. All mouzas are affected by both floods in 1998
and 2007 but this union is most vulnerable in 1998 than
2007 flood which is seen in Fig. 9. Tarapur and Borar
Char mouza of Borar Char union are the most vulnerable
mouza due to 1998 and 2007 floods.
From the Fig. 10, it is seen that Paranganj union is
totally affected by flood in 1998. All the mouzas are
affected by flood in both of the years but this union is
most vulnerable in 1998 than 2007 because the
vulnerability in 1998 is more than 2007 flood. Fewer
vulnerability mouzas are Sanadia, Bagadhova, Baola,
Abdullahpur, Hiran Palashhia in 2007 flood but
Hasadia, Char Shyamrampur and Char Sreekaldi are
most vulnerable mouzas. Kushtia union of
Mymensingh Sadar upazila is also a vulnerable union
in 1998 flood (Fig. 11). This union is affected badly in
1998 and 2007 flood. Char Dari Kushtia, Rupkhali
and Terakahada mouzas are most vulnerable mouzas
due to both floods. Alipur, Kushtia, Chauania and
Putiali mouzas are flood free mouzas in this union.
In 1998 and 2007 floods, Sirta union is affected (Fig.
12). Most of the mouzas are affected in 1998 flood and
this union is a most vulnerable union in 1998 flood. The
vulnerability of flood is more in Sirta, Para Lakshmipur,
Durgapur and Govindapur mouza.
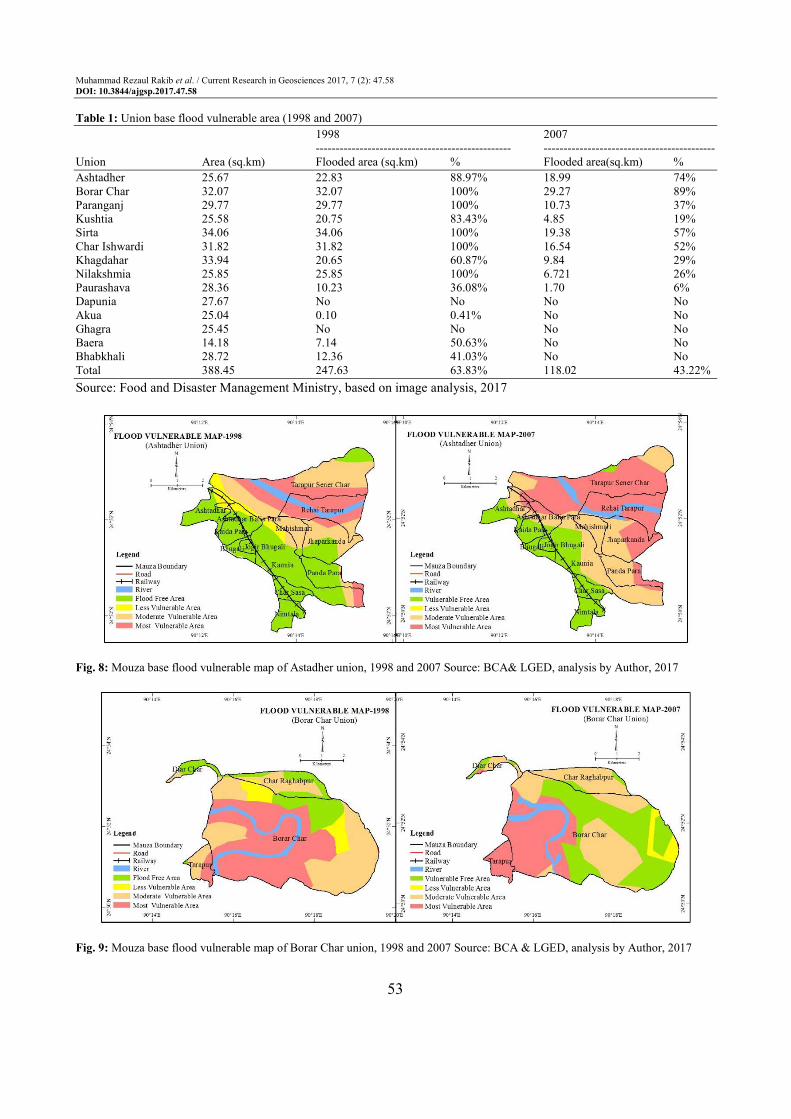
In 1998 and 2007, Khagdahar union is partially
affected by flood. But the vulnerability of flood is
more in 1998 than 2007 which is seen in Fig. 13.
Dulabari, Jelkhanar Char and Kalayanpur mouzas are
more vulnerable mouzas due to both floods. But most
of the mouzas are flood free mouza in this union such
as: Kalikapur, Kalpa, Maijbari, Ghanashyampur,
Mirzapur, Bahadurpur and Hasibasi.
Nilakshmia union is one of the most vulnerable
unions in 1998 and 2007 floods (Fig. 14). This union
is totally affected by the flood and the vulnerability of
is so acute in 1998 than 2007. The vulnerability of
floods is more in Char Nilakshmia, Phaliamarir Char,
Char Durlab and Char Raghurampur. Few mouzas
such as Raiganj, Sahabajpur, Rashidpur,
Mahazzampur and Modarpur which are not affected in
2007. As a result 1998 flood is the most vulnerable
flood in this union.
From the Fig. 15, it is seen that Char Ishwardi union
of Mymensingh Sadar upazila is also a vulnerable union
in 1998 flood. This union is affected badly in 1998and
2007 flood. Char Ishwardi, Char Haripur, Lakshmipur
and Char Barabila mouzasaremore vulnerable mouzas
due to both floods and Bajitpur mouza is only a flood
free mouza in this union.
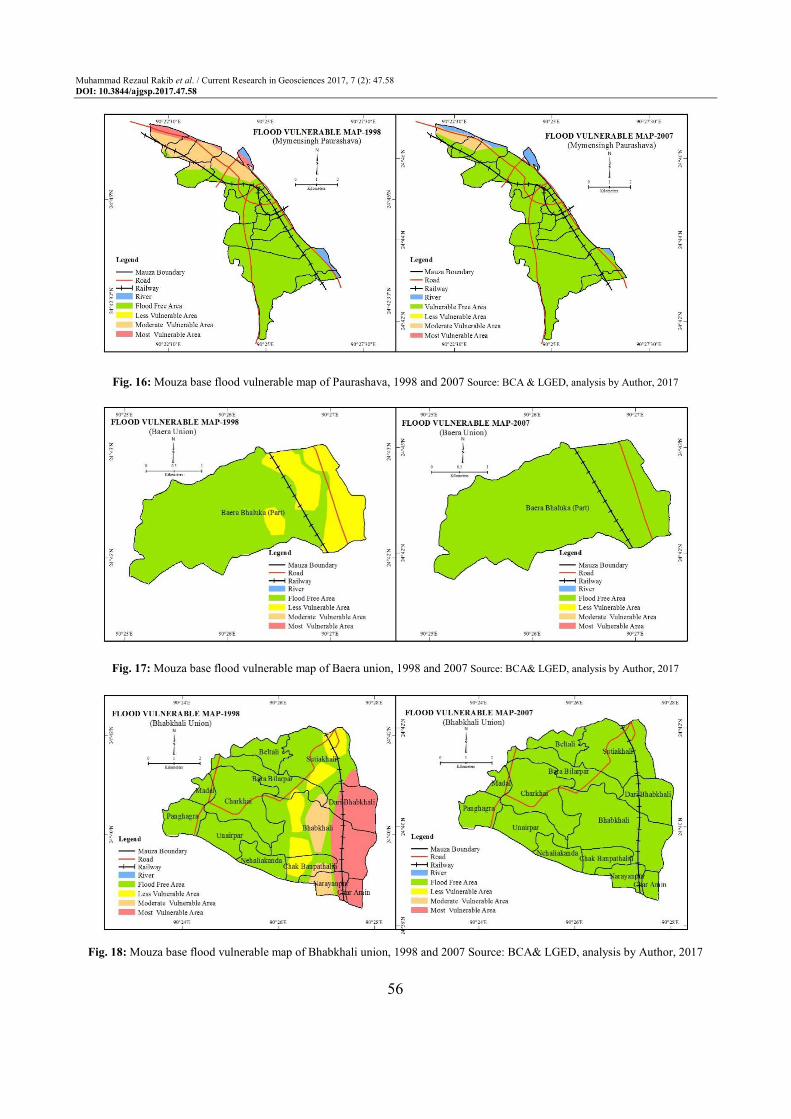
Mymensingh Paurashava is totally flood free in 2007.
But this Paurashava is flooded in 1998 (Fig. 16).
Because there is a dam along the right bank of the Old
Brahmaputra river to protect the town from the flood.
As a result, this union is moderately vulnerable in 1998.
In 1998, Baera union is flooded and the extent of
inundation was more (Fig. 17). This area is totally
flood free in 2007. Because this area is in the highland
area and it is far from the river comparatively than
other unions. For this reason, this union is less
vulnerable union. Flood has occurred in Bhabkhali
union in 1998 (Fig. 18). But this area is totally flood
free in 2007. Because this area is also in the highland
area and it is far from the river comparatively than
other unions. Few mouzas such as: Dari Bhabkhali,
Bhabkhali, Sutiakhali, Narayanpur and Char Amin are
most vulnerable mouzas in 1998 flood. As a result
1998 flood is the most vulnerable flood in this union.
But this union is the less vulnerable union in 2007 flood.
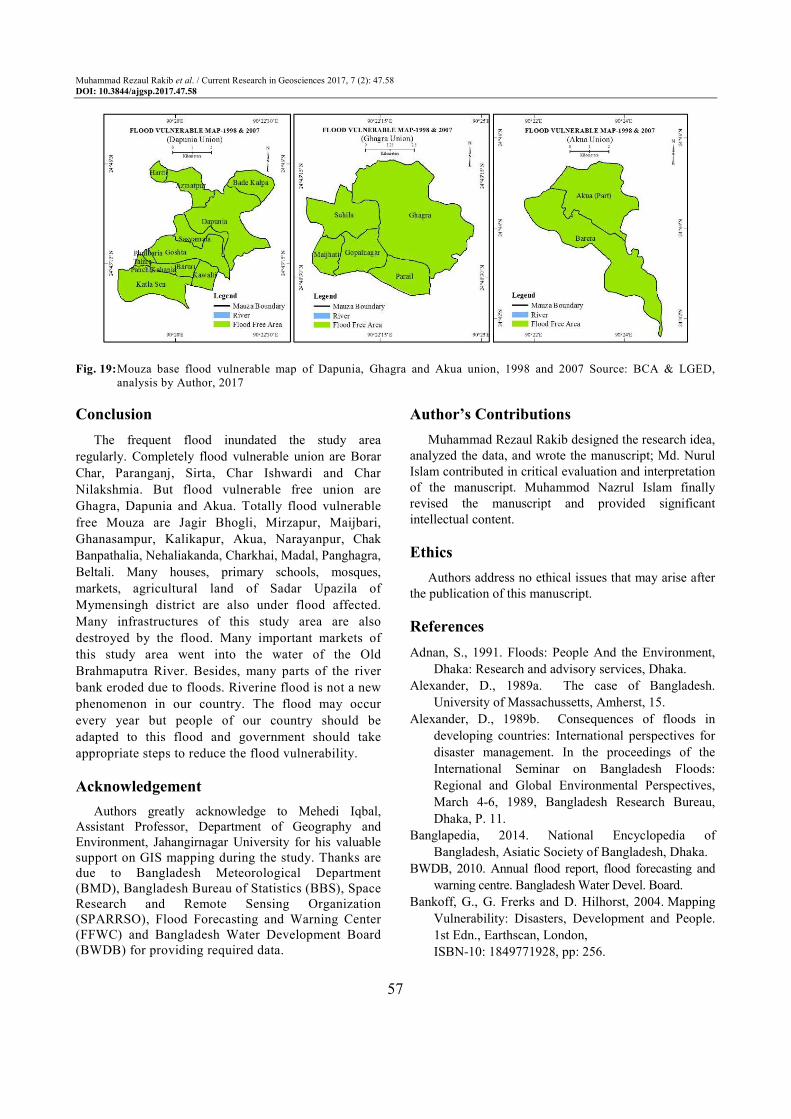
From the Fig. 19, it reveals that Dapunia, Ghagra
and Akua union are totally flooded free in both of the
year 1998 and 2007 because these areas are
comparatively high and far from the river than the
other unions. As a result, this union is not vulnerable in
1998 and 2007 flood.
Muhammad Rezaul Rakib et al. / Current Research in Geosciences 2017, 7 (2): 47.58
DOI: 10.3844/ajgsp.2017.47.58
53
Table 1: Union base flood vulnerable area (1998 and 2007)
1998 2007
------------------------------------------------- -------------------------------------------
Union Area (sq.km) Flooded area (sq.km) % Flooded area(sq.km) %
Ashtadher 25.67 22.83 88.97% 18.99 74%
Borar Char 32.07 32.07 100% 29.27 89%
Paranganj 29.77 29.77 100% 10.73 37%
Kushtia 25.58 20.75 83.43% 4.85 19%
Sirta 34.06 34.06 100% 19.38 57%
Char Ishwardi 31.82 31.82 100% 16.54 52%
Khagdahar 33.94 20.65 60.87% 9.84 29%
Nilakshmia 25.85 25.85 100% 6.721 26%
Paurashava 28.36 10.23 36.08% 1.70 6%
Dapunia 27.67 No No No No
Akua 25.04 0.10 0.41% No No
Ghagra 25.45 No No No No
Baera 14.18 7.14 50.63% No No
Bhabkhali 28.72 12.36 41.03% No No
Total 388.45 247.63 63.83% 118.02 43.22%
Source: Food and Disaster Management Ministry, based on image analysis, 2017
Fig. 8: Mouza base flood vulnerable map of Astadher union, 1998 and 2007 Source: BCA& LGED, analysis by Author, 2017
Fig. 9: Mouza base flood vulnerable map of Borar Char union, 1998 and 2007 Source: BCA & LGED, analysis by Author, 2017

Muhammad Rezaul Rakib et al. / Current Research in Geosciences 2017, 7 (2): 47.58
DOI: 10.3844/ajgsp.2017.47.58
54
Fig. 10: Mouza base flood vulnerable map of Paranganj union, 1998 and 2007 Source: BCA & LGED, analysis by Author, 2017
Fig. 11: Mouza base flood vulnerable map of Kushtia union, 1998 and 2007 Source: BCA& LGED, analysis by Author, 2017
Fig. 12: Mouza base flood vulnerable map of Sirta union, 1998 and 2007 Source: BCA & LGED, analysis by Author, 2017
Muhammad Rezaul Rakib et al. / Current Research in Geosciences 2017, 7 (2): 47.58
DOI: 10.3844/ajgsp.2017.47.58
55
Fig. 13: Mouza base flood vulnerable map of Khagdahar union, 1998 and 2007 Source: BCA & LGED, analysis by Author, 2017
Fig. 14: Mouza base flood vulnerable map of Nilakshmia union, 1998 and 2007 Source: BCA& LGED, analysis by Author, 2017
Fig. 15: Mouza base flood vulnerable map of Char Ishwardi union, 1998 and 2007 Source: BCA& LGED, analysis by Author, 2017
Muhammad Rezaul Rakib et al. / Current Research in Geosciences 2017, 7 (2): 47.58
DOI: 10.3844/ajgsp.2017.47.58
56
Fig. 16: Mouza base flood vulnerable map of Paurashava, 1998 and 2007 Source: BCA & LGED, analysis by Author, 2017
Fig. 17: Mouza base flood vulnerable map of Baera union, 1998 and 2007 Source: BCA& LGED, analysis by Author, 2017
Fig. 18: Mouza base flood vulnerable map of Bhabkhali union, 1998 and 2007 Source: BCA& LGED, analysis by Author, 2017
Muhammad Rezaul Rakib et al. / Current Research in Geosciences 2017, 7 (2): 47.58
DOI: 10.3844/ajgsp.2017.47.58
57
Fig. 19: Mouza base flood vulnerable map of Dapunia, Ghagra and Akua union, 1998 and 2007 Source: BCA & LGED,
analysis by Author, 2017
Conclusion
The frequent flood inundated the study area
regularly. Completely flood vulnerable union are Borar
Char, Paranganj, Sirta, Char Ishwardi and Char
Nilakshmia. But flood vulnerable free union are
Ghagra, Dapunia and Akua. Totally flood vulnerable
free Mouza are Jagir Bhogli, Mirzapur, Maijbari,
Ghanasampur, Kalikapur, Akua, Narayanpur, Chak
Banpathalia, Nehaliakanda, Charkhai, Madal, Panghagra,
Beltali. Many houses, primary schools, mosques,
markets, agricultural land of Sadar Upazila of
Mymensingh district are also under flood affected.
Many infrastructures of this study area are also
destroyed by the flood. Many important markets of
this study area went into the water of the Old
Brahmaputra River. Besides, many parts of the river
bank eroded due to floods. Riverine flood is not a new
phenomenon in our country. The flood may occur
every year but people of our country should be
adapted to this flood and government should take
appropriate steps to reduce the flood vulnerability.
Acknowledgement
Authors greatly acknowledge to Mehedi Iqbal,
Assistant Professor, Department of Geography and
Environment, Jahangirnagar University for his valuable
support on GIS mapping during the study. Thanks are
due to Bangladesh Meteorological Department
(BMD), Bangladesh Bureau of Statistics (BBS), Space
Research and Remote Sensing Organization
(SPARRSO), Flood Forecasting and Warning Center
(FFWC) and Bangladesh Water Development Board
(BWDB) for providing required data.
Author’s Contributions
Muhammad Rezaul Rakib designed the research idea,
analyzed the data, and wrote the manuscript; Md. Nurul
Islam contributed in critical evaluation and interpretation
of the manuscript. Muhammod Nazrul Islam finally
revised the manuscript and provided significant
intellectual content.
Ethics
Authors address no ethical issues that may arise after
the publication of this manuscript.
References
Adnan, S., 1991. Floods: People And the Environment,
Dhaka: Research and advisory services, Dhaka.
Alexander, D., 1989a. The case of Bangladesh.
University of Massachussetts, Amherst, 15.
Alexander, D., 1989b. Consequences of floods in
developing countries: International perspectives for
disaster management. In the proceedings of the
International Seminar on Bangladesh Floods:
Regional and Global Environmental Perspectives,
March 4-6, 1989, Bangladesh Research Bureau,
Dhaka, P. 11.
Banglapedia, 2014. National Encyclopedia of
Bangladesh, Asiatic Society of Bangladesh, Dhaka.
BWDB, 2010. Annual flood report, flood forecasting and
warning centre. Bangladesh Water Devel. Board.
Bankoff, G., G. Frerks and D. Hilhorst, 2004. Mapping
Vulnerability: Disasters, Development and People.
1st Edn., Earthscan, London,
ISBN-10: 1849771928, pp: 256.
Muhammad Rezaul Rakib et al. / Current Research in Geosciences 2017, 7 (2): 47.58
DOI: 10.3844/ajgsp.2017.47.58
58
Enhealth, 2002. Environmental Health Risk Assessment: Guidelines for assessing human health risks from environmental hazards. Department of Health and Ageing, Australia.
Geoscience, 2014. http://www.ga.gov.au/scientific-
topics/hazards/risk-impact/vulnerability.
Hoyer, B.E., 1974. Flood Inundation Mapping and
Remote Sensing in Iowa, Iowa Geologic Survey
Publication Information Circular No. 6 (Iowa: Iowa
Geologic Survey, 1974).
Jacobs, 2007. Strategic Flood Risk Assessment (SFRA).
1st Edn., London Borough of Hounslow, London.
Khalequzzaman, M., 1991a. Flood control megaproject
in Bangladesh: Solution or Problem? Proceedings
of the symposium Bangladesh and Natural Disasters
Organized, Nov. 24-24, Canada-Bangladesh
ForumOttawa, pp: 16.
Khalequzzaman, M., 1991b. Recent floods in Bangladesh:
Possible causes and solutions. Perugia, Italy.
Khalequzzaman, M., 1992. Feasibility of the flood
control megaproject in Bangladesh. Int. J. Environ.
Educ. Information: 11: 19-24.
Khalequzzaman, M., 1994. Recent floods in bangladesh:
Possible causes and solutions, University of
Delaware Newark, DE 19716, USA, 9: 65-80.
Martinez-Graña, A.M., J.L. Goy, C. Zazo and M. Yenes,
2013. Engineering geology maps for planning and
management of natural parks: Las Batuecas-Sierra
de Francia and “Quilamas” (Central Spanish
System, Salamanca, Spain). Geosciences, 3: 46-62.
Martínez-Graña, A.M., T. Boski, J.L. Goy, C. Zazo
and C.J. Dabrio, 2016. Coastal-flood risk
management in central Algarve: Vulnerability and
flood risk indices (South Portugal). Ecological
Indicators, 71: 302-316.
Prithvish, N. and S. Smita, 2007. Geographical information
system concepts and business opportunities, concept
publishing company, New Delhi.
Qader, M.M.M., 2003. Three recent extreme floods in
Bangladesh: A Hydro-meteorological analysis.
Springer, Natural Hazards, 28: 35-64.
Ramsbottom, D., P. Floyd and E. Penning-Rowsell,
2003. Defra/Environment Agency, Flood and
Coastal Defense R&D Programme. 1st Edn., Defra
Flood Management Division, London. Veleda, S., A.M. Martinez-Graña, F. Santos-Frances, J.
Sanchez-San Roman and M. Criado, 2017. Analysis of the Hazard, vulnerability and exposure to the risk of flooding (Alba de Yeltes, Salamanca, Spain). Applied Sci., 7: 157-157. DOI: 10.3390/app7020157
Related Documents