Geosciences 2015, 5, 203-221; doi:10.3390/geosciences5020203 geosciences ISSN 2076-3263 www.mdpi.com/journal/geosciences Article Flash Floods in the Guelmim Area/Southwest Morocco–Use of Remote Sensing and GIS-Tools for the Detection of Flooding-Prone Areas Barbara Theilen-Willige 1, *, Abdessamad Charif 2 , Abdelhadi El Ouahidi 2 , Mohamed Chaibi 2 , Mohamed Ayt Ougougdal 2 and Halima AitMalek 2 1 Technische Universität Berlin (TUB), Institute of Applied Geosciences; Ernst-Reuter-Platz 1, D-10587 Berlin, Germany 2 University of Cadi Ayyad, Polydisciplinary Faculty, Safi, 4162, Route de Sidi Bouzid, 46000 Safi, Morocco; E-Mails: [email protected] (A.C.); [email protected] (A.E.O.); [email protected] (M.C.); [email protected] (M.A.O.); [email protected] (H.A.) * Author to whom correspondence should be addressed; E-Mail: [email protected]; Tel.: +49-7771-1868. Academic Editors: Ken McCaffrey and Jesus Martinez-Frias Received: 11 January 2015 / Accepted: 12 May 2015 / Published: 27 May 2015 Abstract: The violent storms of 22–30 November 2014, resulted in flash floods and wadi floods (rivers) in large parts of Southern Morocco, at the foot of the Atlas Mountains. The Guelmim area was the most affected part with at least 32 fatalities and damages due to inundations. The flooding hazard in the Guelmim region initiated this study in order to investigate the use of remote sensing and geographic information system (GIS) for the detection and identification of areas most likely to be flooded in the future again due to their morphologic properties during similar weather conditions. By combining morphometric analysis and visual interpretation based on Landsat 8 satellite data and derived images such as water index (NDWI) images, areas with relatively higher soil moisture and recently deposited sediments were identified. The resulting maps of weighted overlay procedures, aggregating causal, morphometric factors influencing the susceptibility to flooding (lowest height levels, flattest areas), allowed for the distinguishing of areas with higher, medium and lower susceptibility to flooding. Thus, GIS and remote sensing tools contribut to the recognition and mapping of areas and infrastructure prone to flooding in the Guelmim area. Keywords: flooding; southern Morocco; remote sensing; GIS OPEN ACCESS

Welcome message from author
This document is posted to help you gain knowledge. Please leave a comment to let me know what you think about it! Share it to your friends and learn new things together.
Transcript

Geosciences 2015, 5, 203-221; doi:10.3390/geosciences5020203
geosciences ISSN 2076-3263
www.mdpi.com/journal/geosciences
Article
Flash Floods in the Guelmim Area/Southwest Morocco–Use of Remote Sensing and GIS-Tools for the Detection of Flooding-Prone Areas
Barbara Theilen-Willige 1,*, Abdessamad Charif 2, Abdelhadi El Ouahidi 2, Mohamed Chaibi 2,
Mohamed Ayt Ougougdal 2 and Halima AitMalek 2
1 Technische Universität Berlin (TUB), Institute of Applied Geosciences; Ernst-Reuter-Platz 1,
D-10587 Berlin, Germany 2 University of Cadi Ayyad, Polydisciplinary Faculty, Safi, 4162, Route de Sidi Bouzid,
46000 Safi, Morocco; E-Mails: [email protected] (A.C.); [email protected] (A.E.O.);
[email protected] (M.C.); [email protected] (M.A.O.); [email protected] (H.A.)
* Author to whom correspondence should be addressed;
E-Mail: [email protected]; Tel.: +49-7771-1868.
Academic Editors: Ken McCaffrey and Jesus Martinez-Frias
Received: 11 January 2015 / Accepted: 12 May 2015 / Published: 27 May 2015
Abstract: The violent storms of 22–30 November 2014, resulted in flash floods and wadi
floods (rivers) in large parts of Southern Morocco, at the foot of the Atlas Mountains. The
Guelmim area was the most affected part with at least 32 fatalities and damages due to
inundations. The flooding hazard in the Guelmim region initiated this study in order to
investigate the use of remote sensing and geographic information system (GIS) for the
detection and identification of areas most likely to be flooded in the future again due to their
morphologic properties during similar weather conditions. By combining morphometric
analysis and visual interpretation based on Landsat 8 satellite data and derived images such
as water index (NDWI) images, areas with relatively higher soil moisture and recently
deposited sediments were identified. The resulting maps of weighted overlay procedures,
aggregating causal, morphometric factors influencing the susceptibility to flooding (lowest
height levels, flattest areas), allowed for the distinguishing of areas with higher, medium and
lower susceptibility to flooding. Thus, GIS and remote sensing tools contribut to the
recognition and mapping of areas and infrastructure prone to flooding in the Guelmim area.
Keywords: flooding; southern Morocco; remote sensing; GIS
OPEN ACCESS
Geosciences 2015, 5 204
1. Introduction
Leaving aside droughts, floods are one of the most dangerous meteorological hazards in Morocco,
followed by wind-/sandstorms, with the largest frequency of occurrence and the largest number of
victims [1]. Heavy rains often induce floods in Morocco, including flash floods, riverine floods and mud
floods during the rainy season [2,3]. Violent storms on 22–30 November 2014 resulted in flash floods
and wadi (rivers) flooding in a large part of southern Morocco, at the foot of the Atlas Mountains.
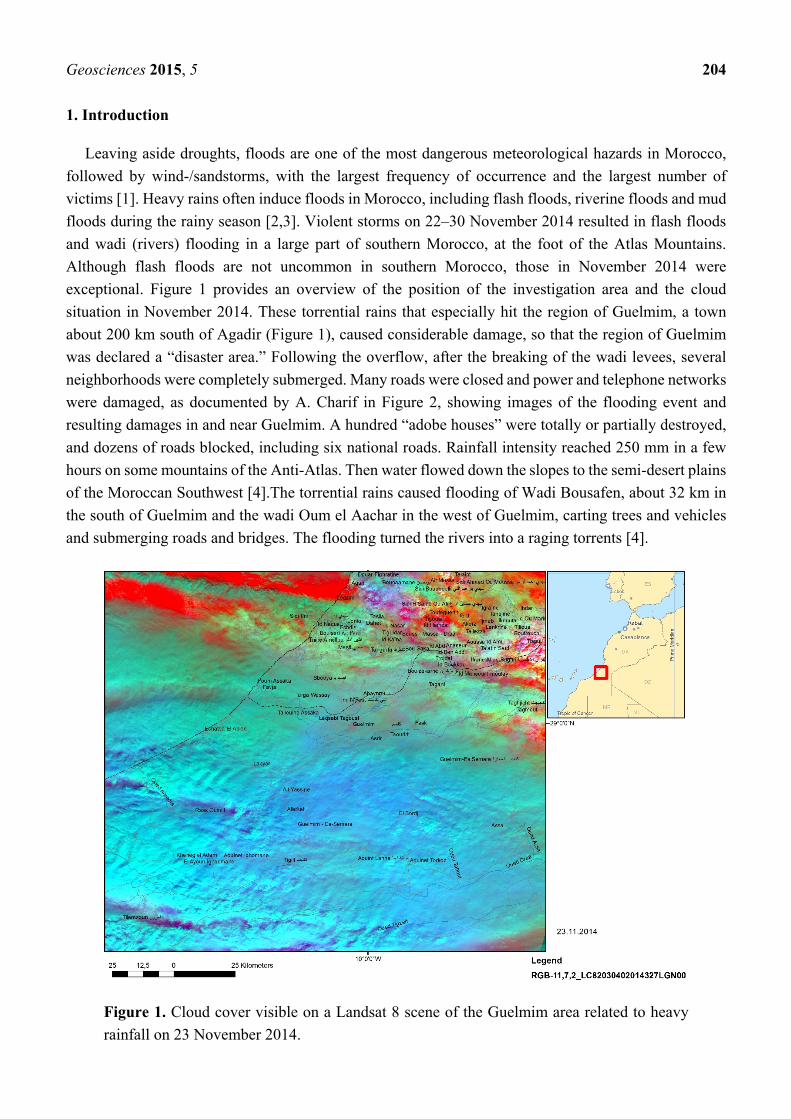
Although flash floods are not uncommon in southern Morocco, those in November 2014 were
exceptional. Figure 1 provides an overview of the position of the investigation area and the cloud
situation in November 2014. These torrential rains that especially hit the region of Guelmim, a town
about 200 km south of Agadir (Figure 1), caused considerable damage, so that the region of Guelmim
was declared a “disaster area.” Following the overflow, after the breaking of the wadi levees, several
neighborhoods were completely submerged. Many roads were closed and power and telephone networks
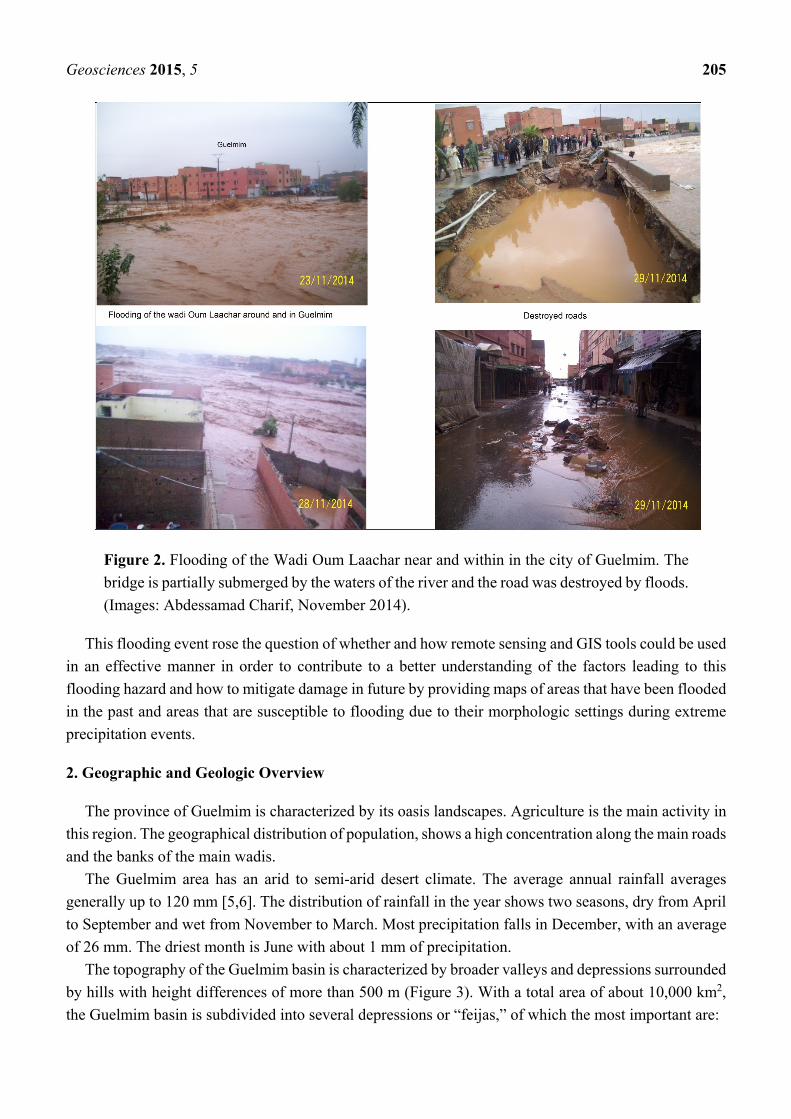
were damaged, as documented by A. Charif in Figure 2, showing images of the flooding event and
resulting damages in and near Guelmim. A hundred “adobe houses” were totally or partially destroyed,
and dozens of roads blocked, including six national roads. Rainfall intensity reached 250 mm in a few
hours on some mountains of the Anti-Atlas. Then water flowed down the slopes to the semi-desert plains
of the Moroccan Southwest [4].The torrential rains caused flooding of Wadi Bousafen, about 32 km in
the south of Guelmim and the wadi Oum el Aachar in the west of Guelmim, carting trees and vehicles
and submerging roads and bridges. The flooding turned the rivers into a raging torrents [4].
Figure 1. Cloud cover visible on a Landsat 8 scene of the Guelmim area related to heavy
rainfall on 23 November 2014.
Geosciences 2015, 5 205
Figure 2. Flooding of the Wadi Oum Laachar near and within in the city of Guelmim. The
bridge is partially submerged by the waters of the river and the road was destroyed by floods.
(Images: Abdessamad Charif, November 2014).
This flooding event rose the question of whether and how remote sensing and GIS tools could be used
in an effective manner in order to contribute to a better understanding of the factors leading to this
flooding hazard and how to mitigate damage in future by providing maps of areas that have been flooded
in the past and areas that are susceptible to flooding due to their morphologic settings during extreme
precipitation events.
2. Geographic and Geologic Overview
The province of Guelmim is characterized by its oasis landscapes. Agriculture is the main activity in
this region. The geographical distribution of population, shows a high concentration along the main roads
and the banks of the main wadis.
The Guelmim area has an arid to semi-arid desert climate. The average annual rainfall averages
generally up to 120 mm [5,6]. The distribution of rainfall in the year shows two seasons, dry from April
to September and wet from November to March. Most precipitation falls in December, with an average
of 26 mm. The driest month is June with about 1 mm of precipitation.
The topography of the Guelmim basin is characterized by broader valleys and depressions surrounded
by hills with height differences of more than 500 m (Figure 3). With a total area of about 10,000 km2,
the Guelmim basin is subdivided into several depressions or “feijas,” of which the most important are:

Geosciences 2015, 5 206
1. Northern part of the Guelmim basin: The great “internal Feija” Guelmim-Bouizakerne
following the southern fallout primary limestone of the Anti-Atlas. It widens from east to west,
reaching 7–10 km in the valley of Wadi Umm Al Achar, between the mountains of Ait
Baamrane and Jbel Tayert; its altitude varies from 600 m to 200 m north to south (position:
1 in Figure 3).
2. At the center: The valley of Wadi Seyyad-Ouerguennoun, consisting of Precambrian and
Georgian mass, form an “external Feija” 5 km wide on average (position: 2 on Figure 4).
3. In the southwest, the depression is bordered by the northern flank of Jebel Guir-Taissa, which
appears narrow, and parallel gutters between quartzite ridges of the upper part of the Acadian
and those Ordovician Aït Lahcen, reach 350 m to 550 m [7,8]. The river system opens into a
plain regular and low gradient (0.5%) practice where a natural spreading of flood waters is
controlled by the Ait Ahmed dam (position: 3 on Figure 4).
Rivers discharging from the mountains surrounding the sedimentary basins contribute to an enormous
input of sedimentary loads, almost in the scope of flash flood hazards, covering the foot-slopes
and basins.
Figure 3. Height level map based on SRTM DEM-data.
Figure 4 shows a 3D perspective Landsat 8 satellite view of the study area visualizing the
geomorphologic setting.

Geosciences 2015, 5 207
The drainage pattern in the Guelmim area is often inactive as a dry-valley network during low flow
periods in summer. Most of the rivers are seasonal and mostly dry except during the period from
December to March when the beds allow flood water transportation. With the exception of flows
generated by precipitation limited in time and intensity, surface waters are rare.
Figure 4. Perspective 3D view of a Landsat 8 image merged with ASTER DEM data of the
Guelmim area facing north.
The depression in the southwest of Guelmim is situated in height levels between 250 and 300 m. This
depression is bordered in the west by coast-parallel, elongated hills and ridges forming barriers to surface
water runoff and discharge into the Atlantic (Figure 3, depression area 3). This natural barrier is leading
to water retention in case of high precipitation intensities and, thus, is one of the factors supporting the
risk of flash floods. The dimension of the flash floods in the Guelmim area as at the end of November
2014 can be explained by these natural barriers allowing water discharge into the Atlantic in narrow
riverbeds such as the Oued Assaka. Traces of former flooding events in the Guelmim basin are visible
on the satellite images, including meandering drainage lines.
Mainly four wadis characterize the drainage pattern of the plain of Guelmim (Figure 5):
1. Oum Laachar originates from the northern Anti-Atlas and has a length of 62 km with a pool
of 930 km2. Its main tributaries are located in the plains.
2. Oued Seyad arises on the southern slopes of the Anti-Atlas. It flows in an east-west direction
along its length and receives numerous tributaries at its right bank. The most important are:
Kelmt, Tanzirt, Taouimarht, Ifrane, Ben Rhezrou and Umm Aachar; the size of its watershed
is 3175 km2 with a length of 147 km. Dams implemented to derive the floodwaters at this
wadi are Ait Ahmed, Ait Messaoud, Ait Me Hand, Umm Aghanim and Ouaroun,
3. Oued Noun Ouerg drains the southern area of the Anti-Atlas, the area of its basin is 2240 km2
with a length of 143 km and its watershed comprises about 2240 km2.
4. Oued Assaka is discharging into the Atlantic, fed from the confluence of three wadis: Achar
Oum El Sayed and Ouergnoun, draining an area of 6500 km2 [9,10].

Geosciences 2015, 5 208
When analyzing the morphological watershed area, it becomes obvious that the large size of the
morphological catchment area supports the flash flood occurrence, concentrating surface water run-off
and sediment load in the broader valleys and depressions (Figures 5 and 6). Figure 6 contains a
topographic W-E cross-section visualizing the near-coast barrier.
Figure 5. Morphologic catchment area of the Guelmim depression and main wadis (1) Oum
Laachar; (2) Oued Sayad; (3) Oued Noun; (4) Oued Assaka.
Figure 6. Topographic profile visualizing the coast-parallel barriers for surface water run-off.

Geosciences 2015, 5 209
3. Methods
Satellite imageries and DEM data were used for generating an image-based GIS and combined with
different geodata and other thematic maps such as geologic and tectonic maps, and precipitation data.
The approach consists of the following steps:
(a) Morphometric analysis of the investigation area involving the quantitative analysis of the
landforms based on DEM data aiming at the extraction of land surface parameters by using a
set of numerical measures derived from DEMs such as slope steepness, curvature or convexity.
(b) Detection of areas with relatively higher surface water input than the environment based on the
weighted overlay of causal, morphometric factors (lowest height level, lowest slope degree, etc.) influencing the susceptibility to flooding.
3.1. Evaluations of Digital Elevation Model Data (DEM)
In the areas with relatively higher surface water input as in depressions and valleys, usually the
inundation processes are more intense than in the surrounding higher environment. Therefore, the
investigations are focused on the detection of areas with relatively higher surface water input after
precipitations due to their morphometric properties (lowest and flattest areas).
Digital elevation models (DEMs) provide an opportunity to quantify land surface geometry in terms
of elevation and its derivatives. The morphometric analysis of digital elevation data helps as well to
visualize the small-scaled variations in the surface, characterized for example by subtle changes of
depressions and elevations. Morphometric maps such as slope gradient, hill shade, height level, and
curvature maps were generated based on SRTM and ASTER digital elevation model (DEM) data using
ArcGIS from ESRI and ENVI digital image processing software from EXELIS as well as open-source
Quantum-GIS. From SRTM (1 Arc Second Global: 30 m spatial resolution) and ASTER DEM (30 m)
data derived morphometric maps (slope gradient maps, drainage, etc.) were combined with lithologic
and hydromorphologic information in a GIS database [11–13]. As the DEM data were gained by
different satellite systems as optical sensors (ASTER) and radar sensors (SRTM), there are different
constrictions in the accuracy of the data. Therefore, both datasets were used for correlation and testing.
The limitation of the approach lies in the constricted accuracy of the SRTM and ASTER DEM datasets.
However, it is suited to obtain a first basic overview of the susceptible areas and hazard perspectives
according to a standardized approach with no costs for the DEM-data input. Of course, many further
factors and data play an important role that (if available) should be included into the database. By
combining some of the causal or preparatory factors in a georeferenced GIS environment those areas
can be detected, where causal factors influencing the susceptibility to flooding occur aggregated and
superimpose over each other.
In order to detect those areas, where causal factors are superimposing over each other, a weighted
overlay procedure was carried out. It is aiming at the detection of areas with higher susceptibility to
flooding by extracting geomorphologic, causal/preparatory factors such as lowest, local height levels
and lowest slope degrees and, then, by aggregating these factors in the weighted overlay tool of ArcGIS.
(As causal factors are considered further on the curvature, lithology, groundwater table level, vegetation
cover and land use.) Causal factors determine the initial, favorable conditions for the occurrence of

Geosciences 2015, 5 210
flooding while the triggering factors such as high precipitation rates determine more the timing. The
triggering mechanisms are quite unpredictable, as they vary in time; however, the causal factors can be
integrated as layers into a GIS.
The weighted overlay method takes into consideration the relative importance of the parameters and
the classes belonging to each parameter (ESRI, online support). The basic pre-requisite for use of
weighting tools of GIS is the determination of weights and rating values representing the relative
importance of factors and their categories. The method starts by assigning an arbitrary weight to the most
important criterion (highest percentage), as well as to the least important attribute according to the
relative importance of parameters.
The basic prerequisite for use of weighting tools of GIS is the determination of weights and rating
values representing the relative importance of factors and their categories. The method starts by
assigning an arbitrary weight to the most important criterion (highest percentage), as well as to the least
important attribute according to the relative importance of parameters. The susceptibility to flooding of
the area is calculated by adding every layer with a weighted influence together and to sum all layers.
Some of the causal factors can be determined systematically: from slope gradient maps those areas with
the lowest slope degrees were extracted, and from curvature maps, so were the areas with no curvature
as these are more susceptible to flash floods. Height level maps helped to search for the lowest
topographic areas (Figure 7). After extracting, aggregating and weighting the potential causal factors
influencing with different percentages of influence, an overview map was derived indicating those
regions with relatively higher susceptibility to flooding due to their morphometric properties. The local
lowest slope gradient and height levels were given the highest percentage of influence (30%).
Figure 7. Weighted overlay of morphometric factors influencing the susceptibility to
flooding. The resulting weighted overlay map is divided into susceptibility classes. The
susceptibility to flooding is classified by values from 0 to 7, whereby 7 is the highest, assumed
susceptibility to flooding due to the aggregation of causal morphometric/preparatory factors.

Geosciences 2015, 5 211
The ArcGIS-integrated hydrotools are forming an important input by allowing the hydromorphologic
analysis. The mapping of morphological watersheds is an important aspect as they influence the
hydromorphodynamic processes in the investigation area to a great deal. Based on SRTM and Aster
DEM data the flow direction, flow accumulation and length, and watersheds were calculated as well as
the drainage network.
3.2. Digital Image Processing
Different satellite data and image processing tools were applied in order to find out whether the
satellite data can contribute to the detection of causal factors influencing the susceptibility to flooding
and to pre- and post-flooding event monitoring. LANDSAT data of the Guelmim area provided by the
Global Land Cover Facility/University of Maryland, USA and the Earth Explorer/USGS were used for
evaluations. The free available LANDSAT data were then digitally processed, especially those from
November and December 2014. The following digital image processing tools were mainly performed:
Filter Tools: Low pass and high pass filters and directional variations were used for the detection of
subtle surface structures such as meanders or landslides. Merging the “morphologic” image products
derived from “Morphologic Convolution” image processing in ENVI software with RGB imageries, the
evaluation feasibilities for the detection of recent sedimentary covers were improved.
Principal Component Analysis: The principal components tool was used to transform the data in
the input bands from the input multivariate attribute space to a new multivariate attribute space whose
axes are rotated with respect to the original space. The result of the tool was a multiband raster with the
same number of bands as the specified number of components (one band per axis or component in the
new multivariate space).
Normalized Difference Water Index (NDWI): Surface-soil moisture is specifically sensitive to
changes in precipitation patterns. During droughts and floods extremes in surface-soil moisture can
propagate into extremes in total water storage with major impacts on agricultural production and water
supply. The monitoring of surface water related to flash floods and areas with high soil moisture is
essential as input for a flooding hazard database. For this purpose the normalized difference water index
(NDWI) is derived from Landsat data as a satellite-derived index from the near-infrared (NIR) and
short-wave infrared (SWIR) channels [14], a band-ratio approach according to GAO (1996) using these
two multispectral bands, and, thus, enhancing information about water bodies and near-surface soil
moisture [15,16]. By the use of this approach, water body information can be extracted more accurately
and easily than by general feature classification methods.
In the scope of this study the normalized difference water index (NDWI) was derived from
Landsat 8 imageries collected with acquisition dates since 2013. After calculating the NDWI in ENVI
image processing software using the bands 5 and 6 as well as 5 and 7, image products with greyscale
values between 0 and 255 were created. The NDWI values were ranging from zero to 255 by assigning
the lowest NDWI value in each image cube a value of zero and the maximum NDWI a value of 255.
The image products were color-coded and the values of 0−255 histogram-stretched. As in the visible
spectrum reflectance, characteristics of surface water can be detected easily; the result of the
histogram-stretching was correlated with the visible surface water on the RGB imageries giving the

Geosciences 2015, 5 212
highest NDWI value to surface water. Thus, water surfaces correspond to the highest values of the
NDWI-calculation (Figure 8). Surface water and water-saturated soils are represented hereby on the
chosen color table in ENVI software in this case in white. Plants with relatively higher water content
appear white as well. Similar spectral response, however, is observed from larger roads and buildings.
Shadows due to sun exposition of the hills can cause white to appear as well. Therefore, a careful analysis
is necessary to avoid interpretation errors. In flat areas less errors can be assumed. The image products
were compared not only with the corresponding RGB imageries, but also with height level and hillshade
maps in order to verify the results and avoid misinterpretations. The color-coded NDWI image products
were then loaded/integrated into ArcGIS. As higher values of the NDWI calculation can be correlated
with higher water saturation of soils, higher groundwater tables and surface water, a request was started
in ArcMap selecting all values of the NDWI grayscale image (values: 0–255) above 180, … 240, and
250). Thus, areas with relatively higher soil humidity can be detected.
Figure 8. Landsat 8 images (3 November 2014) visualizing areas with relatively higher soil
moisture using NDWI calculations using Landsat 8 bands 5 and 7 (water surfaces are
presented in white, and higher soil moisture or vegetation-water content in purple).

Geosciences 2015, 5 213
4. Evaluation Results
The evaluation results are presented here in order to demonstrate their use for the monitoring and
documentation of areas prone to flash floods as input into a GIS-integrated flooding hazard database.
The complex task of flash flood documentation and monitoring in the Guelmim area is supported by the
combination of land surface morphometric information with spectral information from Landsat data.
4.1. Evaluation Results Based on Digital Elevation Data
As field investigations of A. Charif in November 2014 clearly demonstrated that the lowest and
flattest areas were affected most by the flash floods, the morphometric analysis based on the digital
elevation data was focused on the extraction of those terrain properties and their overlay in ArcGIS. The
weighted overlay results based on SRTM (30 m resolution) data show areas where causal, morphologic
factors influencing the susceptibility to flooding are aggregated (dark-blue areas in Figures 9 and 10).
They show the following properties: depressions and broadervalleys situated in height levels between
200 and 300 m, flat areas with slope degrees <10°, curvature = 0, and drop raster values < 200,000
(values derived from calculations in ArcGIS, using the hydrology tools). The results of Figure 10 are
based on a weighted overlay of the factors given the highest percentage to the height and slope gradient
(30%) and the other factors equal percentage of influence.
Figure 9. Areas susceptible to flooding according to their morphometric properties.

Geosciences 2015, 5 214
Figure 10. Areas susceptible to flooding due to the aggregation of causal, morphometric factors.
4.2. Evaluation Results of Landsat 8 Data
Landsat 8 imageries of the Guelmim area before and after the heavy rains in November 2014 were
evaluated in order to contribute to the detection of river beds with higher sediment load due to the spectral
response of recent, unconsolidated sediments (Figure 11). When comparing the Landsat 8 image from 3
November 2014 with the Landsat 8 image from 9 December 2014 (Figure 11) using Landsat 8 Band
combinations of RGB 7, 6, 2, and 8 (pansharpening) the almost recent sedimentary deposits due to flash
floods become visible in dark-green colors due to their characteristic spectral properties.
In Figure 12a, the principal component (PC) image is shown, that was derived from a Landsat 8 RGB
image (bands 7, 6 and 3, merged with band 8, acquisition: 9 December 2014). The PC image allows the
detection of recently deposited sediments in blue-violet colors by visual analysis.
When comparing the results of the weighted overlay calculations with the PC image, the occurrence
of the recent sediments visible in blue-violet on the PC image coincides with areas assumed to be prone
to a higher flooding susceptibility due to their morphometric disposition (Figure 12b).
The NDWI-water index image derived from the Landsat 8 (9 December 2014) data (Figure 13)
visualizes that the recent sedimentary deposits obviously contain relatively higher soil moisture contents
than the environment by showing the highest values (in white and violet) within these youngest deposits.
After extracting the higher NDWI values from the Landsat 8 NDWI image (9 December 2014) and
comparing the result with the weighted overlay map of morphometric, causal factors (Figure 14), the
comparison shows, that the areas with relatively higher NDWI values (almost related to higher soil
moisture content in the upper centimeters of the sedimentary covers) are situated within those areas

Geosciences 2015, 5 215
considered to be prone to to flooding on the weighted overlay map. Those areas with relatively higher
soil moisture can be detected in the lowest and flattest parts of the Guelmim basin. Even after more than
a week following the heavy rainfall in November 2014, remnants of the flooding such as smaller surface
water bodies and areas with relatively higher soil humidity are visible in the Landsat 8 NDWI scene.
Thus, by the combined use of these approaches, areas prone to flooding can be detected more precisely.
Figure 11. Comparison of the Landsat 8 RGB images (Bands 7, 6, 2 + 8) from 3 November
2014 and 9 December 2014. The almost recent sediments are visible in green colors on the
image after the November 2014 flash floods (lower image).
The higher NDWI values in the hills in the NW of Guelmim (upper left of the images in Figure 14)
might be related to higher precipitation input or to shadow effects causing errors in the evaluation process
of the NDWI data.
When comparing images before and after the November flooding event, the riverbeds with recent
sediment deposits can be detected due to their specific, spectral reflectivity (Figure 15, right image) on
the Landsat 8 scene of 9 December 2014. Comparisons of Landsat 8 images before and after the
November 2014 floods indicate road segments that were affected by the flash floods and their
sedimentary deposits. This knowledge might be of importance for the mitigation of infrastructural
damages such as of roads and bridges during future flooding events.
In order to contribute to the mitigation of loss and damage, those roads intersecting with drainage
courses and river beds were mapped. The intersecting road sections are shown as red lines on Figure 16.

Geosciences 2015, 5 216
Whenever flash floods occur again, these road segments could be blocked in time, guarded or even
constructed more safely.
(a)
(b)
Figure 12. (a) PC Landsat 8 image showing recent sedimentary deposits (blue-violet)
after the November 2014 flash floods; (b) Comparison of the weighted overlay results with
the Landsat 8 principal component image. The areas with the highest susceptibility to
flooding due to their morphometric properties were flooded during the November
2014 flash floods.

Geosciences 2015, 5 217
Figure 13. Landsat 8 principal component image showing recent debris flow and sediments
in blue-violet colors (acquisition time: 9 December 2014) and corresponding NDWI-water
index image indicating in white the highest NDWI values (lower image).
Figure 14. Overlay of the higher NDWI values with the weighted overlay results.
The highest NDWI values (white, violet) within the Guelmim basin can be identified in
areas with the highest susceptibility to flash floods due to their morphometric properties
and disposition.

Geosciences 2015, 5 218
Figure 15. Road segments in flooding prone areas as visible on Landsat 8 scenes before (left
image) and after the November 2014 flash floods (right image). The sedimentary deposits
related to the flooding event are visible in brown colors.
Figure 16. Roads intersecting waterways and flash flood areas (red lines).

Geosciences 2015, 5 219
5. Conclusions
According to IPCC [17] climate change will include changing rainfall patterns and will generate more
extreme climatic events such as extreme rainfall events leading to flash floods. Extreme precipitation
events might occur more frequently in Morocco as well, such as that in November 2014.
Prevention of damage to human life and infrastructure related to extreme rainfall and resulting flash
floods requires preparedness and mitigation measurements that should be based on a regularly updated,
GIS-integrated data mining. The evaluation of satellite-gained digital elevation data contributes to the
detection of areas susceptible to flooding due to their morphometric disposition. The resulting maps of
weighted overlay procedures, aggregating causal, morphometric factors influencing the susceptibility to
flooding (lowest height levels, flattest areas), allowed the distinguishing of areas with higher, medium
and lower susceptibility to flooding. The different images derived from digital image processing of
Landsat 8 data support the detection of recent sediment deposits related to the earliest flooding event in
November 2014 and, thus, the detection of the extent of the flash flood-affected areas. Landsat 8 images
used for the documentation of the flooding events form an essential input to a natural hazard database [18]
by providing information of infrastructure (road segments, bridges, settlements) that might be affected
by future flooding events. Thus, the combination of the evaluation results based on digital elevation data
and satellite image data prove to be effective as an input for flash flood-hazard assessment.
Acknowledgments
This study was initiated in the scope of a collaborative research project based on the bilateral
Moroccan-German Programme of Scientific Research (PMARS, 2013–2015), supported by the
Moroccan Ministry of Higher Education and Scientific Research (ENSSUP) and the Federal Ministry of
Education and Research (BMBF), the University of Cadi Ayyad, Safi, Morocco, and Berlin University
of Technology (TU Berlin). This support is kindly acknowledged. The authors thank the reviewers of
this manuscript for their efforts and contributions.
Author Contributions
Barbara Theilen-Willige wrote the remote sensing part and the GIS-integrated evaluation of the
article; Abdessamad Charif, Abdelhadi El Ouahidi, Mohamed Chaibi, Mohamed Ayt Ougougdal and
Halima Ait Malek were responsible for the geologic description and the field research in the study area.
Appendix
GIS-Data:
OpenStreetMap: http://download.geofabrik.de/osm/europe/
OneGeologyPortal: http://portal.onegeology.org/
http://www.diva-gis.org/gdata
http://www.arcgis.com/home/

Geosciences 2015, 5 220
Satellite Data:
ASTER DGDEM: http://www.gdem.aster.ersdac.or.jp/search.jsp
SRTM DEM: http://srtm.csi.cgiar.org/SELECTION/inputCoord.asp
LANDSAT: University of Maryland, http://glcfapp.glcf.umd.edu:8080/esdi/index.jsp
USGS: http://earthexplorer.usgs.gov/
Conflicts of Interest
The authors declare no conflict of interest.
References and Notes
1. EM-Dat. The International Disaster Database. Available online:http://emdat.be/disaster_list/
index.html (accessed on 12 December 2014).
2. Theilen-Willige, B. Use of RapidEye-Data for the Detection of Natural Hazard Prone Areas
(Earthquake, Tsunami, Landslides, Desertification) in W-Morocco. Report for the German
Aerospace Center and RapidEye AG, 2013, RESA-Project No. 621, doi:10.13140/2.1.1692.9604.
Available online: http://resaweb.dlr.de/fileadmin/resa/documents/berichte/2012/RESA_02_2012
_0621.pdf (accessed on 18 May 2015).
3. Theilen-Willige, B.; Löwner, R.; ElBchari, F.; Wenzel, H. Remote Sensing and GIS contribution to
the detection of areas susceptible to local site effects during earthquakes and to Tsunami Waves in
W-Morocco. In Proceedings of the Vienna Congress on Recent Advances in Earthquake
Engineering and Structural Dynamics, 2013 (VEESD 2013), Vienna, Austria, 28–30 August 2013.
4. RYOT News and Associated Press. Available online: http://www.ryot.org/severe-flash-flooding-
morocco-left-least-17-dead-many-missing/874673 (accessed on 8 December 2014).
5. Climate-Data.org. Climate data for cities worldwide, Guelmim. Available online: http://en.climate-
data.org/location/4101/(accessed on 8 December 2014).
6. WorldClim-Global -Free climate data for ecological modeling and GIS. Available online:
http://www.worldclim.org/download (accessed on 14 December 2014).
7. Choubert, G. Histoire géologique du domaine de l’Anti-Atlas. Notes et Mémoires du Service Géologique du Maroc 1952, 100–101.
8. Dijon, R. Reconnaissances hydrogéologiques et resources en eau du bassin des Oueds Seyyad,
Ouerg, Noun. Maroc Sud occidental. Notes et Mémoires du Service Géologique du Maroc 1969,
no 197.154.
9. Riser, J. Anti-Atlas. Encyclopédie berbère, Anacutas–Anti-Atlas, Ed isud Volumes, 1988;
pp. 776–791. Aix-en-Provence. Available online: http://encyclopedieberbere.revues.org/2522
(accessed on 17 December 2014).
10. Naser, N. Utilisation des Systeme d’Information Géographiques en Hydrogéologie en Vue de
l’éboration d’un Outil de Gestion des Ressources en Eau du Bassin de Guelmim. Institut
Agronomique et Veterinaire (IAV), Hassan II, Rabat, Royaume du Maroc, Memoire de Troixieme
Cycle Pour l’obtention du Diplôme d’Ingénieur d’Etat en Génie Rural. Available online:
http://www.spate-irrigation.org/wordpress/wp-content/uploads/2011/06/MemoireNaserNajlae
_GR_2006.pdf (accessed on 17 December 2014).

Geosciences 2015, 5 221
11. Theilen-Willige, B.; Ait Malek, H.; Charif, A.; El Bchari, F.; Chaïbi, M. Remote Sensing and GIS
Contribution to the Investigation of Karst Landscapes in NW-Morocco. Geosciences 2014, 4,
50–72.
12. Theilen-Willige, B.; Löwner, R.; El Bchari, F.; Ait Malek, H.; Boumaggard, E.; Chaibi, M.;
Charif, A.; Nakhcha, C.; Ait Ougougdal, M.; Ridaoui, M. Remote sensing and GIS contribution to
the detection of areas susceptible to natural hazards in the Safi Area, W-Morocco. In Proceedings
of the 1st International Conference on Information and Communication Technologies for Disaster
Management (ICT-DM’2014), Algiers, Algeria, 24–25 March 2014.
13. Theilen-Willige, B.; Ait Malek, H.; Ait Ougougdal, M.; Boumaggard, E.; Buchert, W.; Chaibi, M.;
Charif, A.; El Bchari, F.; Löwner, R.; Müller, J.; et al. Remote sensing and GIS contribution to the
detection of coastal areas prone to flooding hazard (tsunami and meteo-waves, storm surge, flash
floods) in W-Morocco. Available online: http://www.crts.gov.ma/sites/default/files/
geo_observateur/geoobs21.pdf (accessed on 18 May 2015).
14. Gao, B.C. NDWI-A normalized difference water index for remote sensing of vegetation liquid
water from space. Remote Sens. Environ. 1996, 58, 257–266.
15. Ceccato, P.; Flasse, S.; Tarantola, S.; Jacquemond, S.; Gregoire, J.M. Detecting vegetation water
content using reflectance in the optical domain. Remote Sens. Environ. 2001, 77, 22–33.
16. Ceccato, P.; Flasse, S.; Gregoire, J.M. Designing a spectral index to estimate vegetation water
content from remote sensing data: Part 2. Validation and applications. Remote Sens. Environ. 2002,
82, 198–207.
17. IPCC. Climate Change 2014-Synthesis Report. Available online: http://www.ipcc.ch/pdf/
assessment-report/ar5/syr/SYR_AR5_LONGERREPORT_Corr2.pdf (accessed on 28 February 2015).
18. Löwner, R.; Theilen-Willige, B.; El Bchari, F.; Charif, A.; Aït Malek, H. Environmental risk
management in the Region of Safi, Morocco. Zbl. Geol. Paläont. 2014, 12-1, 227–239.
© 2015 by the authors; licensee MDPI, Basel, Switzerland. This article is an open access article
distributed under the terms and conditions of the Creative Commons Attribution license
(http://creativecommons.org/licenses/by/4.0/).
Related Documents