Flash flooding in Spain: geomorphological approaches supporting flood frequency analysis, and the implications for the design of structures Alma L ´ opez-Avil ´ es MCIWEM Development Control Engineer/Climate Change Policy Advisor, Environment Agency Keywords dating; flash flooding; flood frequency; fluvial deposits; geomorphological; hydraulic; hydrological; return period. Correspondence Alma L ´ opez-Avil ´ es, Development Control Engineer/Climate Change Policy Advisor, Environment Agency, Swift House, Frimley Business Park, Firmley, Camberley, Surrey, GU16 7SQ, UK. Email: alopez_aviles@environment-agency. gov.uk CIWEM 2005 Young Author’s Competition, 18 May 2005, Imperial College, London, UK. doi:10.1111/j.1747-6593.2006.00063.x Abstract Conventional methods for the estimation of flood frequency are generally based on the statistical analysis of data series resulting from the measurement of water levels at specific locations, which are translated into discharges (m 3 /s) using standard stage/discharge relationships. Subsequently, these gauged flows are used to identify the largest flood event experienced by a river or catchment, and to produce growth curves used in the estimation of the return periods of specific flood events, as well as in the calculation of discharges for specific required design events (e.g. return period 1 in 100 year). In areas where gauging data records are scarce, and/or the data series are short or interrupted, geomorphological interpretation of the physical environment, dating of fluvial deposits and flooding episodes and hydraulic reconstruction of past flood events can be used as complementary tools aiding conventional hydrological and flood frequency analysis methods. This paper will discuss the undertaking of this approach in the Guadalope Catchment in northeast Spain. It will examine the findings in relation to the inadequate design of existing structures such as dams, spillways, canals and reservoirs, and will also look at the potential risks associated with flooding at present. Introduction There are more than 1200 large (4 15 m high) dams in Spain, which generate 12% of the country’s electricity (World Commission on Dams 2000). Furthermore, the supply of water to towns and villages is largely dependent on water stored in reservoirs built behind these dams. Like in many other parts of the world, in Spain, gauging and rainfall data series are often short or incom- plete, especially in the more remote mountainous areas where large dams and reservoirs are located. Further- more, catchment characteristics and the typically Medi- terranean rainfall pattern in many regions of eastern and southern Spain make the prediction of flooding events of specific return periods a difficult task. A combination of steep slopes, low vegetation density, narrow bedrock channels and the antecedent conditions of many catch- ments, together with high-intensity localised rainfall episodes lead to high-velocity large-magnitude flash flooding along many Mediterranean basins. In addition to gauged data analysis, unconventional approaches to flood frequency estimation can help in the first stages of the design of structures such as large dams by improving safety factors. The following sections of this paper will describe the research methods used in the Guadalope Catchment, and will discuss the main findings in relation to the risks associated with the poor safety factors of recently constructed dams. Research area and methods The Guadalope Catchment The Guadalope River flows northward from the uplands of El Maestrazgo in northeast Spain to the Ebro River basin. The main tributary of the Guadalope is the Ber- gantes River, which joins in from the southeast part of the catchment (see Fig. 1). The drainage area of the Guada- lope basin is 3892 km 2 , with the Bergantes sub-basin accounting for 1221 km 2 of the total area. The upland part of the catchment is set on highlands of the Iberian Range, where the topography, adverse climate, precarious communications infrastructure and lack of employment Water and Environment Journal 21 (2007) 217–226 c 2007 The Author. Journal compilation c 2007 CIWEM. 217 Water and Environment Journal. Print ISSN 1747-6585

Welcome message from author
This document is posted to help you gain knowledge. Please leave a comment to let me know what you think about it! Share it to your friends and learn new things together.
Transcript
Flash flooding in Spain: geomorphological approachessupporting flood frequency analysis, and the implicationsfor the design of structures
Alma Lopez-Aviles MCIWEM
Development Control Engineer/Climate Change Policy Advisor, Environment Agency
Keywords
dating; flash flooding; flood frequency; fluvial
deposits; geomorphological; hydraulic;
hydrological; return period.
Correspondence
Alma Lopez-Aviles, Development
Control Engineer/Climate Change Policy
Advisor, Environment Agency, Swift House,
Frimley Business Park, Firmley, Camberley,
Surrey, GU16 7SQ, UK.
Email: alopez_aviles@environment-agency.
gov.uk
CIWEM 2005 Young Author’s Competition, 18
May 2005, Imperial College, London, UK.
doi:10.1111/j.1747-6593.2006.00063.x
Abstract
Conventional methods for the estimation of flood frequency are generally
based on the statistical analysis of data series resulting from the measurement
of water levels at specific locations, which are translated into discharges (m3/s)
using standard stage/discharge relationships. Subsequently, these gauged flows
are used to identify the largest flood event experienced by a river or catchment,
and to produce growth curves used in the estimation of the return periods of
specific flood events, as well as in the calculation of discharges for specific
required design events (e.g. return period 1 in 100 year). In areas where
gauging data records are scarce, and/or the data series are short or interrupted,
geomorphological interpretation of the physical environment, dating of fluvial
deposits and flooding episodes and hydraulic reconstruction of past flood
events can be used as complementary tools aiding conventional hydrological
and flood frequency analysis methods. This paper will discuss the undertaking
of this approach in the Guadalope Catchment in northeast Spain. It will
examine the findings in relation to the inadequate design of existing structures
such as dams, spillways, canals and reservoirs, and will also look at the potential
risks associated with flooding at present.
Introduction
There are more than 1200 large (4 15 m high) dams in
Spain, which generate 12% of the country’s electricity
(World Commission on Dams 2000). Furthermore, the
supply of water to towns and villages is largely dependent
on water stored in reservoirs built behind these dams.
Like in many other parts of the world, in Spain,
gauging and rainfall data series are often short or incom-
plete, especially in the more remote mountainous areas
where large dams and reservoirs are located. Further-
more, catchment characteristics and the typically Medi-
terranean rainfall pattern in many regions of eastern and
southern Spain make the prediction of flooding events of
specific return periods a difficult task. A combination of
steep slopes, low vegetation density, narrow bedrock
channels and the antecedent conditions of many catch-
ments, together with high-intensity localised rainfall
episodes lead to high-velocity large-magnitude flash
flooding along many Mediterranean basins.
In addition to gauged data analysis, unconventional
approaches to flood frequency estimation can help in the
first stages of the design of structures such as large dams
by improving safety factors. The following sections of this
paper will describe the research methods used in the
Guadalope Catchment, and will discuss the main findings
in relation to the risks associated with the poor safety
factors of recently constructed dams.
Research area and methods
The Guadalope Catchment
The Guadalope River flows northward from the uplands
of El Maestrazgo in northeast Spain to the Ebro River
basin. The main tributary of the Guadalope is the Ber-
gantes River, which joins in from the southeast part of the
catchment (see Fig. 1). The drainage area of the Guada-
lope basin is 3892 km2, with the Bergantes sub-basin
accounting for 1221 km2 of the total area. The upland
part of the catchment is set on highlands of the Iberian
Range, where the topography, adverse climate, precarious
communications infrastructure and lack of employment
Water and Environment Journal 21 (2007) 217–226 c� 2007 The Author. Journal compilation c� 2007 CIWEM. 217
Water and Environment Journal. Print ISSN 1747-6585
have driven local populations away towards more eco-
nomically developed parts of the region or country.
By European standards, the density of population in
Spain is quite low (i.e. approximately 40 million people
live in the second largest country in Western Europe, thus
approximately 79 inhabitants/km2). Spain is also consid-
ered to be the second most mountainous country in
Europe (World Bank 2004). Some areas of the Iberian
Range are among the less populated and less developed
parts of the country. It is in these mountainous areas that
many dams and reservoirs have been built, and where
gauging and rainfall data are scarce and series are often
incomplete.
Methods
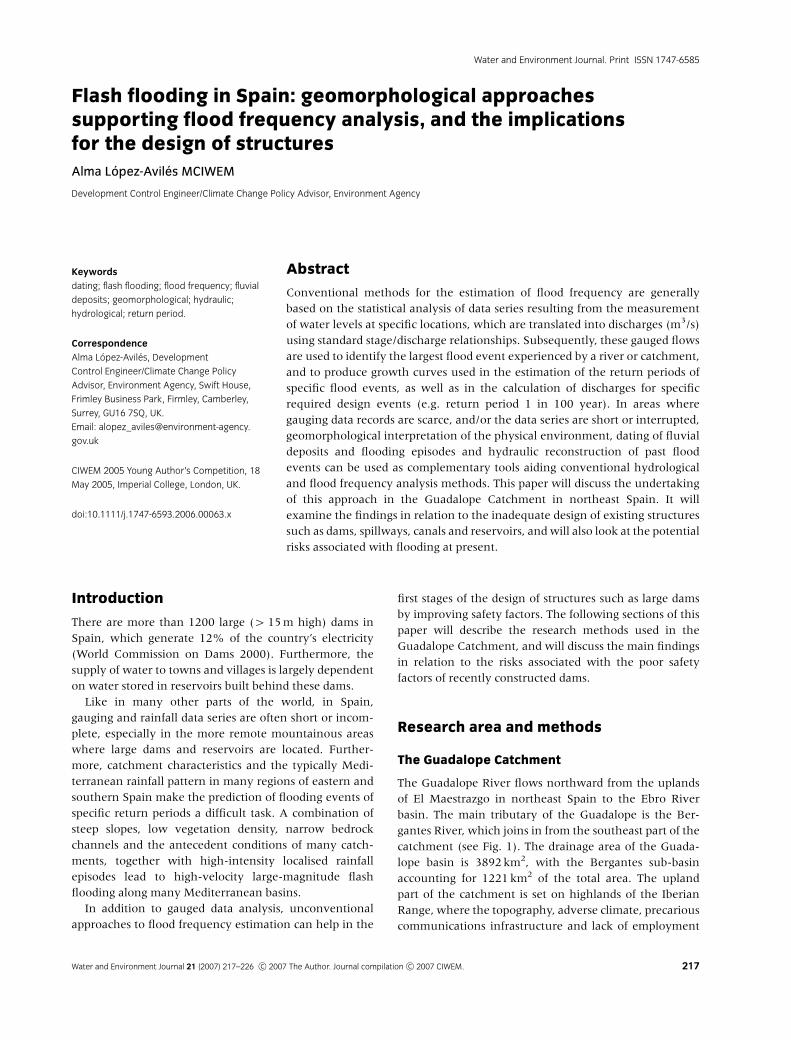
Given the few gauging stations available in the catch-
ment (i.e. Station 30 on the upstream part of the Guada-
lope, Station 31 on the Bergantes, Station 15 on the
Guadalope in Alcaniz and Station 99 on the Guadalope
near its confluence with the Ebro River in Caspe – see
Fig. 1), and the short length and poor quality of
the gauging records, it was considered that a compilation
of historic information on flood events would help
to build the scenario regarding flooding within the
catchment.
Flood History Databases (Comision Tecnica de Inunda-
ciones 1985) for the region as well as historic documents
held in local libraries were consulted in order to obtain
references about exceptionally large rainfall or flood
events experienced within the Guadalope Catchment.
These references were recorded unsystematically in a
variety of documents, and therefore it is acknowledged
that a greater number of significant flood events might
have occurred within this basin, but could have been
missed in the search. Furthermore, interviews with el-
derly members of local communities who had witnessed
recent flood events were conducted to provide supple-
mentary information to historic documents. This compi-
lation of historic information on past flood events helped
Reservoirs
Meteorologicalstations
Gauging stations
Settlements
Zaragoza
Mequinenza
Riba-Roja
40°N
5°W
0 250km
Calanda
Study Site
Castelserás
Alcaniz~
N
0 10 20 30 km
C a
t a
l a
n i
d e
s
Morella Vella
Morella
Castellfort
IglesuelaFortanete
Station 88
V. Pinares
C. Almuden AliagaM. Jarque
Station 100
Station 201
Station 106
Station 15
Station 99
Caspe
Caspe
Valmuel
E. Estanca
Andorra
Station 30Station 31Santolea
CastelloteM. Matas
Torrevelilla
Cerollera
Aguaviva
GallipuenCalanda
IberianRange
Pyrenees
Ebro River
A
.R
ega l
loB
aj o
Ar a g ó n
Mar
tín R
iver
Aguas
Vivas River
Mat
arra
na
Riv
er
Mediterranean SeaMediterranean SeaS i e r r a d e l M a e s t r a z g o
Gua
dalo
peRiv
er
Ebro
Bergan
t es River
~
Mediterranean Sea
Fig. 1. Location map of the Guadalope Catchment, including gauging and rainfall stations. A. Regallo, Arroyo Regallo; C. Almuden, Cuevas de Almuden;
E. Estanca, Embalse de la Estanca; M. Jarque, Mezquita de Jarque; M. Matas, Mas de las Matas; V. Pinares, Villarroya de Pinares.
Water and Environment Journal 21 (2007) 217–226 c� 2007 The Author. Journal compilation c� 2007 CIWEM.218
Flash flooding in Spain A. Lopez-Aviles
in the flood frequency analysis process by extending the
data series.
Simultaneously, a bedrock-controlled reach of the Ber-
gantes River (see Fig. 1) was selected as representative of
the characteristics of this subcatchment, and thus where
detailed geomorphological analysis, hydraulic reconstruc-
tion and dating of deposits were to take place. The
characteristics of this study area and its sedimentation
regime are described in more detail in Lopez-Aviles et al.
(1998) and Lopez-Aviles (1998).
A number of geomorphological units (e.g. fine deposits,
gravel terraces, bars, bedrock benches) were identified,
and sediment samples were taken for dating of the
respective units, aiming to interpret incision and aggrada-
tion cycles in relation to dominant climatic conditions.
Sediment dating techniques included: (a) 14C analysis of
organic matter contained within slack-water deposits,
(b) dendrochronology of trees growing on the floodplain
(i.e. establishing the age of these trees assumes a mini-
mum age for relevant floodplain sedimentary gravel
units, and therefore a minimum period since the last time
a large flood event affected the specific units) and (c)
luminescence (infrared-stimulated luminescence – IRSL)
dating of sediment grains (mainly feldspar and quartz)
showing the last time that these deposits were exposed to
light before being buried by a flood. Luminescence meth-
ods measure the radiation accumulated in the minerals
once they were buried.
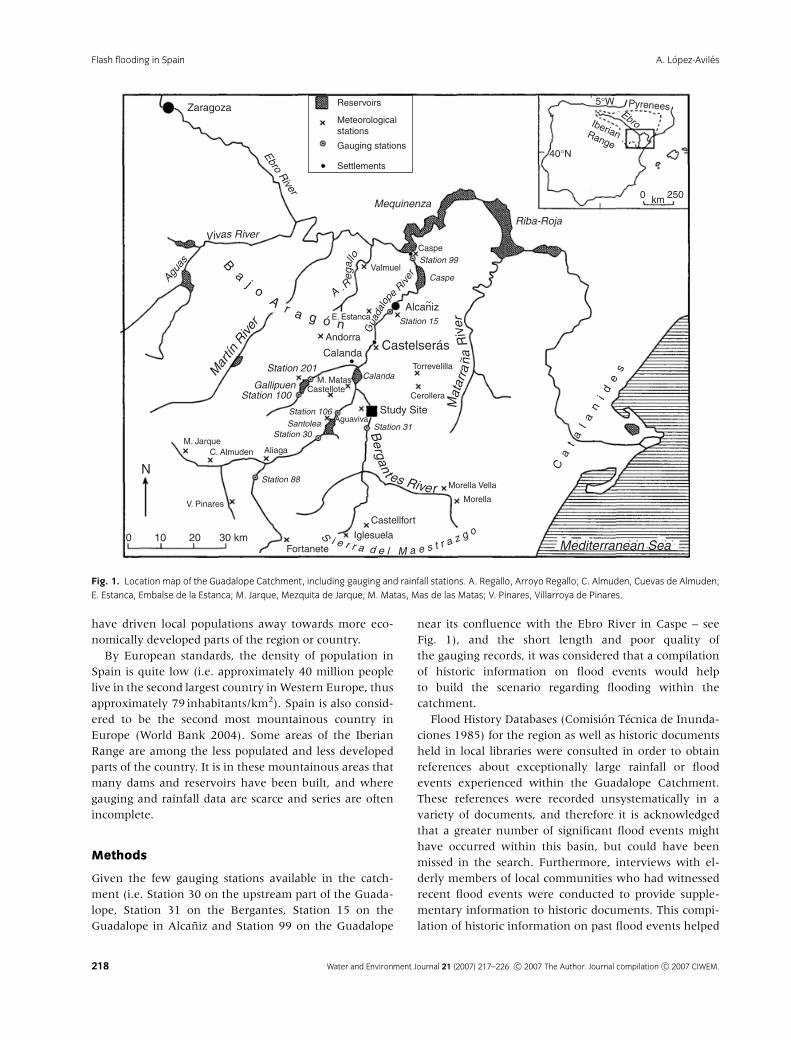
The study site was surveyed and mapped in detail (see
Fig. 2), and hydraulic reconstruction of flood conditions
derived from high water marks (slack water deposits,
debris) at specific locations was undertaken at relevant
cross-sections (see Fig. 3). The purpose of this exercise
was to estimate the order of magnitude of known flood
events that either predated gauging stations or were not
measured at the existing ones, but for which historic and/
or geomorphological evidence was available.
The hydraulic reconstruction of past flood events in-
volved the calculation of flow velocities and discharges
using standard formulae (i.e. continuity equation with
Manning’s velocity and roughness coefficient):
Q ¼ wdV ; ð1Þ
where Q is the discharge in m3/s, V is the mean velocity, w
is the mean channel width and d is the mean depth equal
to the cross-sectional area divided by bankful width:
V ¼ R2=3S1=2=n; ð2Þ
where V is the mean velocity in m/s, R is the hydraulic
radius equal to the cross-sectional area divided by the
wetted perimeter, S is the average water surface slope and
n is the Manning’s roughness coefficient. This was calcu-
lated for the various locations using a number of methods.
For further details, see Chapter 5 in Lopez-Aviles (1998).
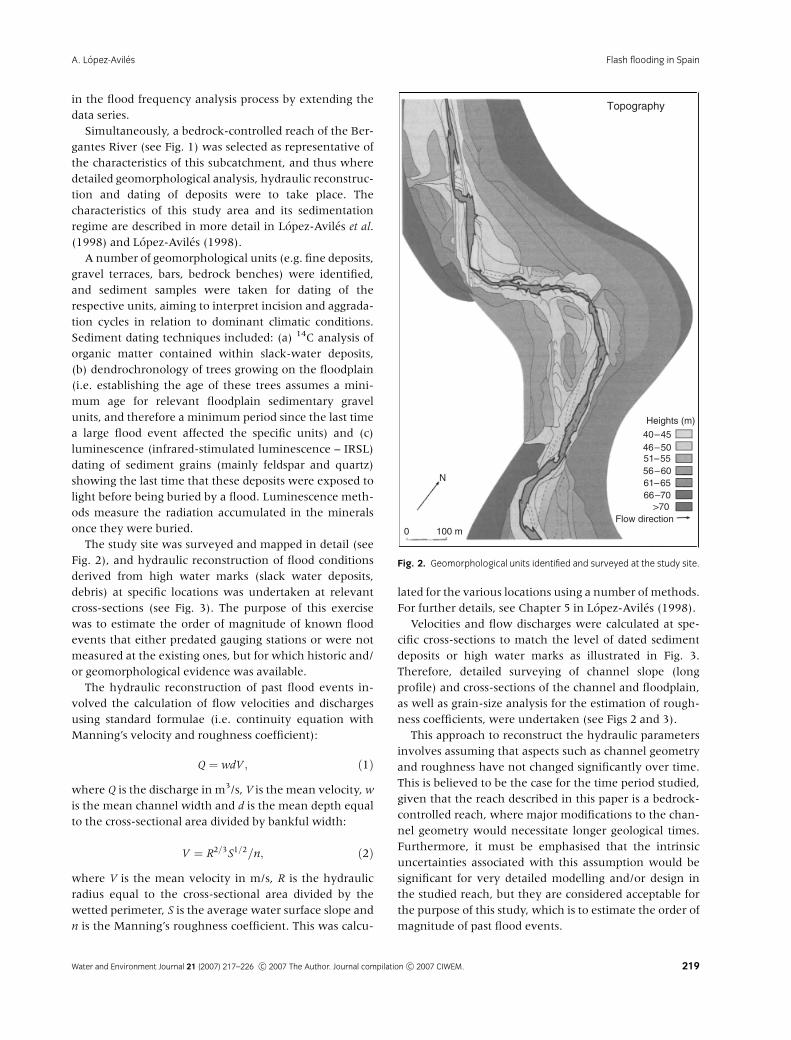
Velocities and flow discharges were calculated at spe-
cific cross-sections to match the level of dated sediment
deposits or high water marks as illustrated in Fig. 3.
Therefore, detailed surveying of channel slope (long
profile) and cross-sections of the channel and floodplain,
as well as grain-size analysis for the estimation of rough-
ness coefficients, were undertaken (see Figs 2 and 3).
This approach to reconstruct the hydraulic parameters
involves assuming that aspects such as channel geometry
and roughness have not changed significantly over time.
This is believed to be the case for the time period studied,
given that the reach described in this paper is a bedrock-
controlled reach, where major modifications to the chan-
nel geometry would necessitate longer geological times.
Furthermore, it must be emphasised that the intrinsic
uncertainties associated with this assumption would be
significant for very detailed modelling and/or design in
the studied reach, but they are considered acceptable for
the purpose of this study, which is to estimate the order of
magnitude of past flood events.
Heights (m)
40–4546–5051–5556–6061–6566–70
>70Flow direction
0 100 m
N
Topography
Fig. 2. Geomorphological units identified and surveyed at the study site.
Water and Environment Journal 21 (2007) 217–226 c� 2007 The Author. Journal compilation c� 2007 CIWEM. 219
Flash flooding in SpainA. Lopez-Aviles
Discussion
Hydrology of the Guadalope Catchment
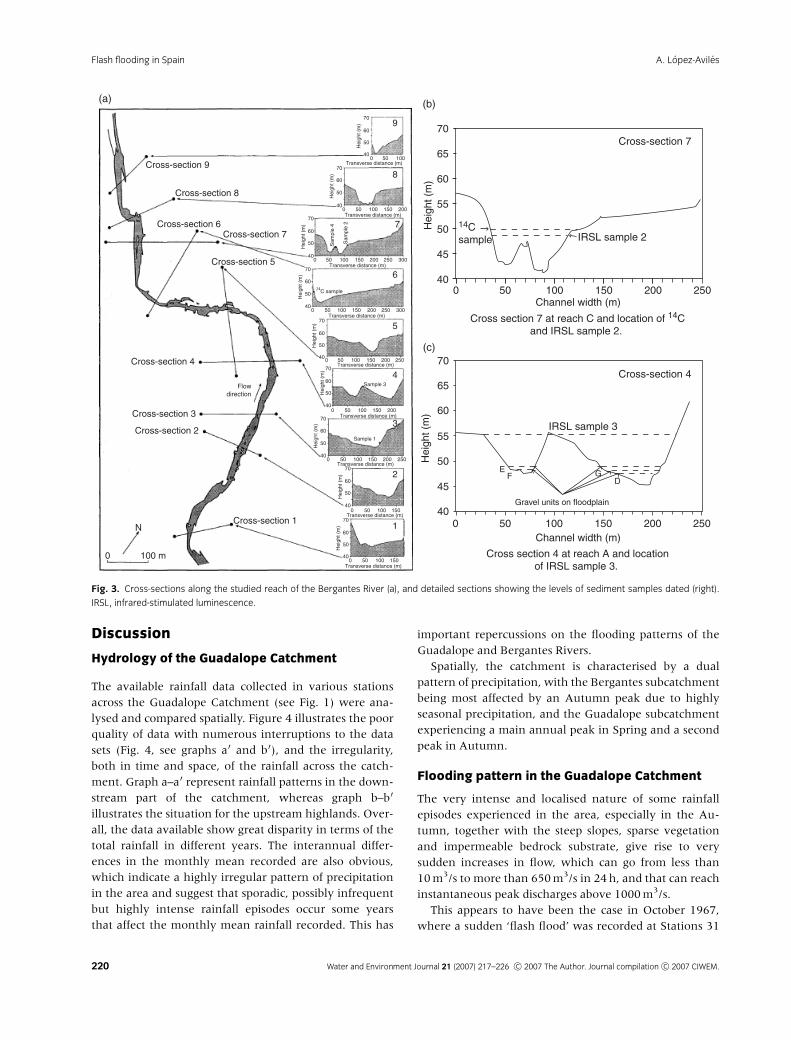
The available rainfall data collected in various stations
across the Guadalope Catchment (see Fig. 1) were ana-
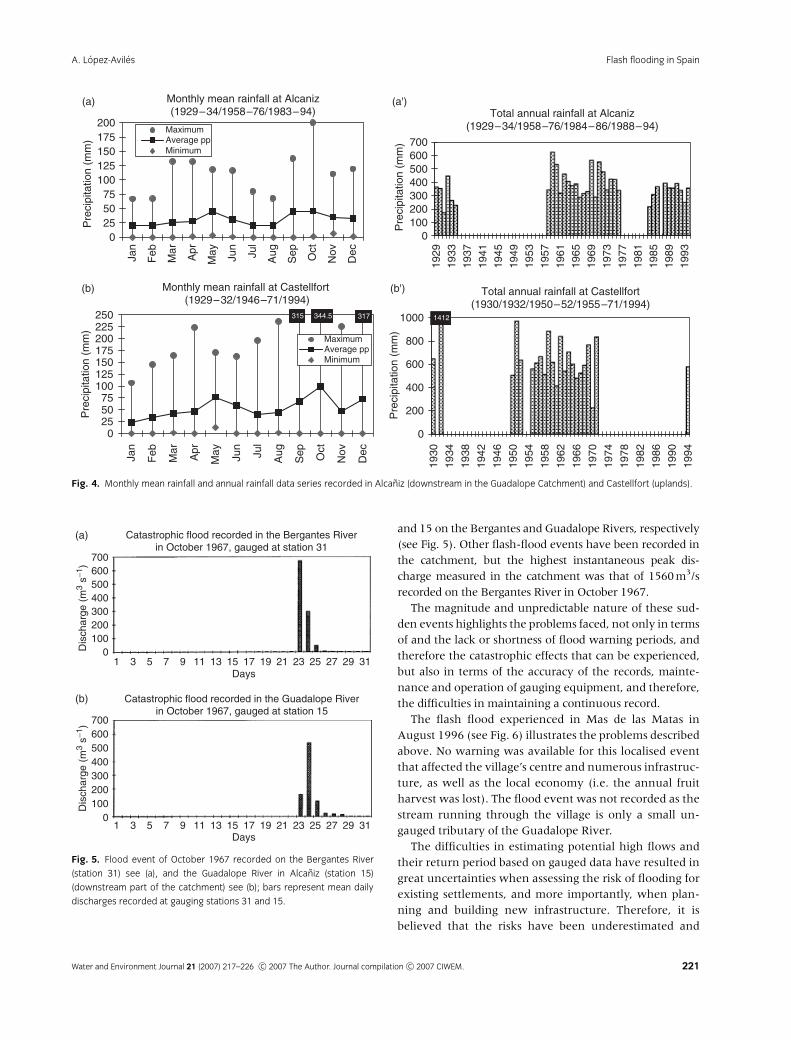
lysed and compared spatially. Figure 4 illustrates the poor
quality of data with numerous interruptions to the data
sets (Fig. 4, see graphs a0 and b0), and the irregularity,
both in time and space, of the rainfall across the catch-
ment. Graph a–a0 represent rainfall patterns in the down-
stream part of the catchment, whereas graph b–b0
illustrates the situation for the upstream highlands. Over-
all, the data available show great disparity in terms of the
total rainfall in different years. The interannual differ-
ences in the monthly mean recorded are also obvious,
which indicate a highly irregular pattern of precipitation
in the area and suggest that sporadic, possibly infrequent
but highly intense rainfall episodes occur some years
that affect the monthly mean rainfall recorded. This has
important repercussions on the flooding patterns of the
Guadalope and Bergantes Rivers.
Spatially, the catchment is characterised by a dual
pattern of precipitation, with the Bergantes subcatchment
being most affected by an Autumn peak due to highly
seasonal precipitation, and the Guadalope subcatchment
experiencing a main annual peak in Spring and a second
peak in Autumn.
Flooding pattern in the Guadalope Catchment
The very intense and localised nature of some rainfall
episodes experienced in the area, especially in the Au-
tumn, together with the steep slopes, sparse vegetation
and impermeable bedrock substrate, give rise to very
sudden increases in flow, which can go from less than
10 m3/s to more than 650 m3/s in 24 h, and that can reach
instantaneous peak discharges above 1000 m3/s.
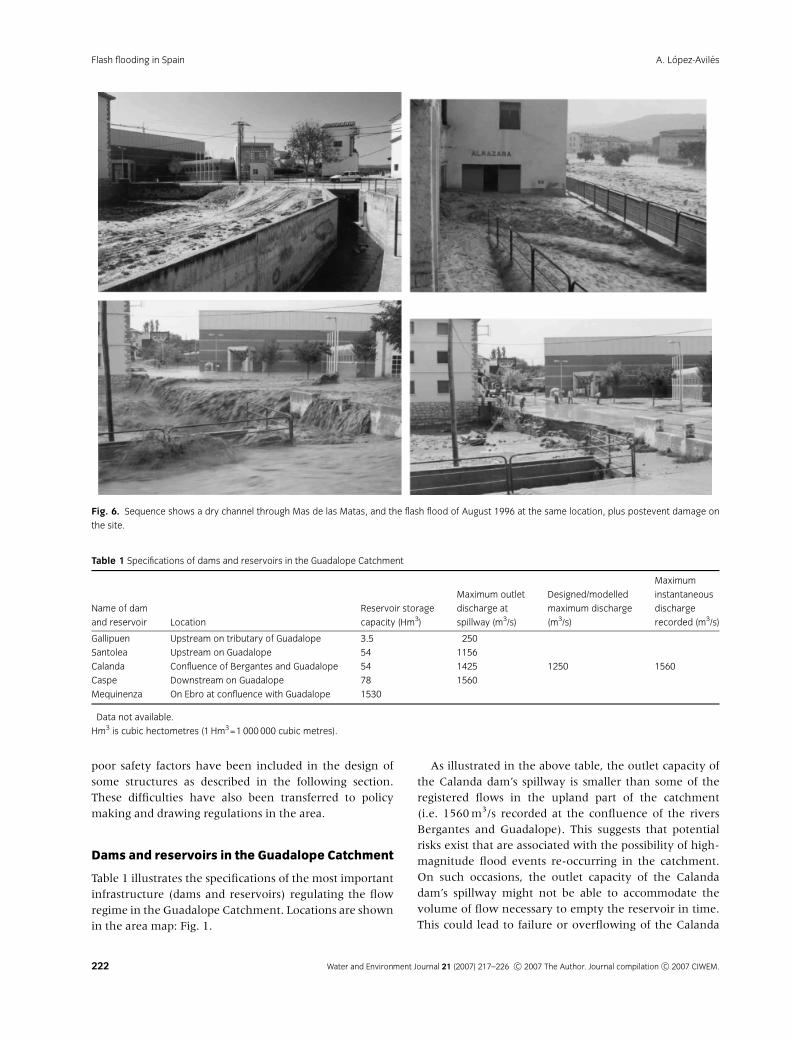
This appears to have been the case in October 1967,
where a sudden ‘flash flood’ was recorded at Stations 31
Cross-section 9
Cross-section 8
Cross-section 6Cross-section 7
Cross-section 5
Cross-section 4
Cross-section 3
Cross-section 2
Cross-section 1N
0 100 m
1
2
3
4
5
6
8
970
65
60
55
50
45
400 50 100 150 200 250
Hei
ght (
m)
Channel width (m)
70
65
60
55
50
45
400 50 100 150 200 250
Hei
ght (
m)
Channel width (m)
Cross section 7 at reach C and location of 14Cand IRSL sample 2.
Cross section 4 at reach A and locationof IRSL sample 3.
Cross-section 7
Cross-section 4
IRSL sample 2
IRSL sample 3
14Csample
7
GED
Gravel units on floodplain
F
(a) (b)
(c)
Fig. 3. Cross-sections along the studied reach of the Bergantes River (a), and detailed sections showing the levels of sediment samples dated (right).
IRSL, infrared-stimulated luminescence.
Water and Environment Journal 21 (2007) 217–226 c� 2007 The Author. Journal compilation c� 2007 CIWEM.220
Flash flooding in Spain A. Lopez-Aviles
and 15 on the Bergantes and Guadalope Rivers, respectively
(see Fig. 5). Other flash-flood events have been recorded in
the catchment, but the highest instantaneous peak dis-
charge measured in the catchment was that of 1560 m3/s
recorded on the Bergantes River in October 1967.
The magnitude and unpredictable nature of these sud-
den events highlights the problems faced, not only in terms
of and the lack or shortness of flood warning periods, and
therefore the catastrophic effects that can be experienced,
but also in terms of the accuracy of the records, mainte-
nance and operation of gauging equipment, and therefore,
the difficulties in maintaining a continuous record.
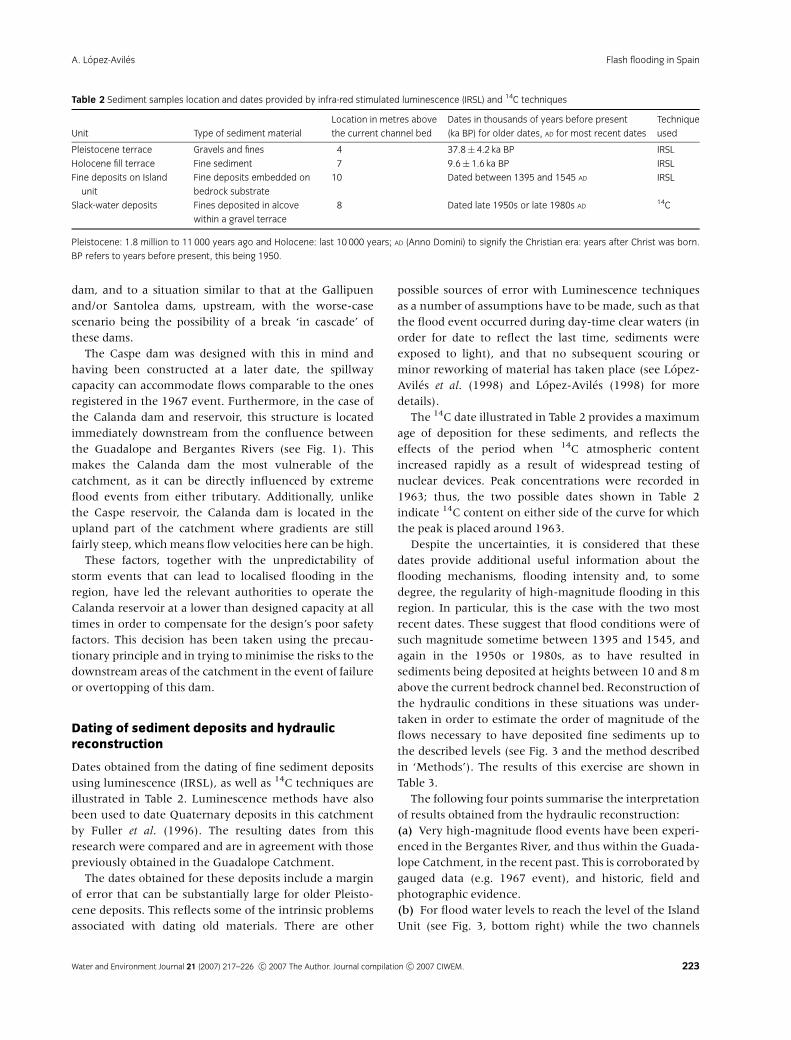
The flash flood experienced in Mas de las Matas in
August 1996 (see Fig. 6) illustrates the problems described
above. No warning was available for this localised event
that affected the village’s centre and numerous infrastruc-
ture, as well as the local economy (i.e. the annual fruit
harvest was lost). The flood event was not recorded as the
stream running through the village is only a small un-
gauged tributary of the Guadalope River.
The difficulties in estimating potential high flows and
their return period based on gauged data have resulted in
great uncertainties when assessing the risk of flooding for
existing settlements, and more importantly, when plan-
ning and building new infrastructure. Therefore, it is
believed that the risks have been underestimated and
Monthly mean rainfall at Alcaniz(1929–34/1958–76/1983–94)
0255075
100125150175200
Jan
Feb
Mar
Apr
May Jun
Jul
Aug
Sep Oct
Nov
Dec
Jan
Feb
Mar
Apr
May Jun
Jul
Aug
Sep Oct
Nov
Dec
Pre
cipi
tatio
n (m
m)
Pre
cipi
tatio
n (m
m)
MaximumAverage ppMinimum
Total annual rainfall at Alcaniz (1929–34/1958–76/1984–86/1988–94)
0100200300400500600700
1929
1933
1937
1941
1945
1949
1953
1957
1961
1965
1969
1973
1977
1981
1985
1989
1993
Monthly mean rainfall at Castellfort (1929–32/1946–71/1994)
0255075
100125150175200225250
Pre
cipi
tatio
n (m
m)
MaximumAverage ppMinimum
Total annual rainfall at Castellfort (1930/1932/1950–52/1955–71/1994)
0
200
400
600
800
1000
1930
1934
1938
1942
1946
1950
1954
1958
1962
1966
1970
1974
1978
1982
1986
1990
1994
Pre
cipi
tatio
n (m
m)
(a)
(b)
(a')
(b')
Fig. 4. Monthly mean rainfall and annual rainfall data series recorded in Alcaniz (downstream in the Guadalope Catchment) and Castellfort (uplands).
700
Catastrophic flood recorded in the Bergantes Riverin October 1967, gauged at station 31
Catastrophic flood recorded in the Guadalope Riverin October 1967, gauged at station 15
600500400300200100
0
700600500400300200100
0
1 3 5 7 9 11 13 15 17 19 21 23 25 27 29 31
1 3 5 7 9 11 13 15 17 19 21 23 25 27 29 31
Days
Days
Dis
char
ge (
m3
s−1)
Dis
char
ge (
m3
s−1)
(a)
(b)
Fig. 5. Flood event of October 1967 recorded on the Bergantes River
(station 31) see (a), and the Guadalope River in Alcaniz (station 15)
(downstream part of the catchment) see (b); bars represent mean daily
discharges recorded at gauging stations 31 and 15.
Water and Environment Journal 21 (2007) 217–226 c� 2007 The Author. Journal compilation c� 2007 CIWEM. 221
Flash flooding in SpainA. Lopez-Aviles
poor safety factors have been included in the design of
some structures as described in the following section.
These difficulties have also been transferred to policy
making and drawing regulations in the area.
Dams and reservoirs in the Guadalope Catchment
Table 1 illustrates the specifications of the most important
infrastructure (dams and reservoirs) regulating the flow
regime in the Guadalope Catchment. Locations are shown
in the area map: Fig. 1.
As illustrated in the above table, the outlet capacity of
the Calanda dam’s spillway is smaller than some of the
registered flows in the upland part of the catchment
(i.e. 1560 m3/s recorded at the confluence of the rivers
Bergantes and Guadalope). This suggests that potential
risks exist that are associated with the possibility of high-
magnitude flood events re-occurring in the catchment.
On such occasions, the outlet capacity of the Calanda
dam’s spillway might not be able to accommodate the
volume of flow necessary to empty the reservoir in time.
This could lead to failure or overflowing of the Calanda
Fig. 6. Sequence shows a dry channel through Mas de las Matas, and the flash flood of August 1996 at the same location, plus postevent damage on
the site.
Table 1 Specifications of dams and reservoirs in the Guadalope Catchment
Name of dam
and reservoir Location
Reservoir storage
capacity (Hm3)
Maximum outlet
discharge at
spillway (m3/s)
Designed/modelled
maximum discharge
(m3/s)
Maximum
instantaneous
discharge
recorded (m3/s)
Gallipuen Upstream on tributary of Guadalope 3.5 250 � �
Santolea Upstream on Guadalope 54 1156 � �
Calanda Confluence of Bergantes and Guadalope 54 1425 1250 1560
Caspe Downstream on Guadalope 78 1560 � �
Mequinenza On Ebro at confluence with Guadalope 1530 � � �
�Data not available.
Hm3 is cubic hectometres (1 Hm3 =1 000 000 cubic metres).
Water and Environment Journal 21 (2007) 217–226 c� 2007 The Author. Journal compilation c� 2007 CIWEM.222
Flash flooding in Spain A. Lopez-Aviles
dam, and to a situation similar to that at the Gallipuen
and/or Santolea dams, upstream, with the worse-case
scenario being the possibility of a break ‘in cascade’ of
these dams.
The Caspe dam was designed with this in mind and
having been constructed at a later date, the spillway
capacity can accommodate flows comparable to the ones
registered in the 1967 event. Furthermore, in the case of
the Calanda dam and reservoir, this structure is located
immediately downstream from the confluence between
the Guadalope and Bergantes Rivers (see Fig. 1). This
makes the Calanda dam the most vulnerable of the
catchment, as it can be directly influenced by extreme
flood events from either tributary. Additionally, unlike
the Caspe reservoir, the Calanda dam is located in the
upland part of the catchment where gradients are still
fairly steep, which means flow velocities here can be high.
These factors, together with the unpredictability of
storm events that can lead to localised flooding in the
region, have led the relevant authorities to operate the
Calanda reservoir at a lower than designed capacity at all
times in order to compensate for the design’s poor safety
factors. This decision has been taken using the precau-
tionary principle and in trying to minimise the risks to the
downstream areas of the catchment in the event of failure
or overtopping of this dam.
Dating of sediment deposits and hydraulicreconstruction
Dates obtained from the dating of fine sediment deposits
using luminescence (IRSL), as well as 14C techniques are
illustrated in Table 2. Luminescence methods have also
been used to date Quaternary deposits in this catchment
by Fuller et al. (1996). The resulting dates from this
research were compared and are in agreement with those
previously obtained in the Guadalope Catchment.
The dates obtained for these deposits include a margin
of error that can be substantially large for older Pleisto-
cene deposits. This reflects some of the intrinsic problems
associated with dating old materials. There are other
possible sources of error with Luminescence techniques
as a number of assumptions have to be made, such as that
the flood event occurred during day-time clear waters (in
order for date to reflect the last time, sediments were
exposed to light), and that no subsequent scouring or
minor reworking of material has taken place (see Lopez-
Aviles et al. (1998) and Lopez-Aviles (1998) for more
details).
The 14C date illustrated in Table 2 provides a maximum
age of deposition for these sediments, and reflects the
effects of the period when 14C atmospheric content
increased rapidly as a result of widespread testing of
nuclear devices. Peak concentrations were recorded in
1963; thus, the two possible dates shown in Table 2
indicate 14C content on either side of the curve for which
the peak is placed around 1963.
Despite the uncertainties, it is considered that these
dates provide additional useful information about the
flooding mechanisms, flooding intensity and, to some
degree, the regularity of high-magnitude flooding in this
region. In particular, this is the case with the two most
recent dates. These suggest that flood conditions were of
such magnitude sometime between 1395 and 1545, and
again in the 1950s or 1980s, as to have resulted in
sediments being deposited at heights between 10 and 8 m
above the current bedrock channel bed. Reconstruction of
the hydraulic conditions in these situations was under-
taken in order to estimate the order of magnitude of the
flows necessary to have deposited fine sediments up to
the described levels (see Fig. 3 and the method described
in ‘Methods’). The results of this exercise are shown in
Table 3.
The following four points summarise the interpretation
of results obtained from the hydraulic reconstruction:
(a) Very high-magnitude flood events have been experi-
enced in the Bergantes River, and thus within the Guada-
lope Catchment, in the recent past. This is corroborated by
gauged data (e.g. 1967 event), and historic, field and
photographic evidence.
(b) For flood water levels to reach the level of the Island
Unit (see Fig. 3, bottom right) while the two channels
Table 2 Sediment samples location and dates provided by infra-red stimulated luminescence (IRSL) and 14C techniques
Unit Type of sediment material
Location in metres above
the current channel bed
Dates in thousands of years before present
(ka BP) for older dates, AD for most recent dates
Technique
used
Pleistocene terrace Gravels and fines 4 37.8� 4.2 ka BP IRSL
Holocene fill terrace Fine sediment 7 9.6� 1.6 ka BP IRSL
Fine deposits on Island
unit
Fine deposits embedded on
bedrock substrate
10 Dated between 1395 and 1545 AD IRSL
Slack-water deposits Fines deposited in alcove
within a gravel terrace
8 Dated late 1950s or late 1980s AD14C
Pleistocene: 1.8 million to 11 000 years ago and Holocene: last 10 000 years; AD (Anno Domini) to signify the Christian era: years after Christ was born.
BP refers to years before present, this being 1950.
Water and Environment Journal 21 (2007) 217–226 c� 2007 The Author. Journal compilation c� 2007 CIWEM. 223
Flash flooding in SpainA. Lopez-Aviles
around the island are flowing at full capacity, extremely
large discharges (up to 7500 m3/s) are required. This is
considered less likely than the alternative, which could
involve the secondary channel being obstructed by debris,
thus blocking flow passage through this channel during
peak flows, and rerouting the flow over the Island unit.
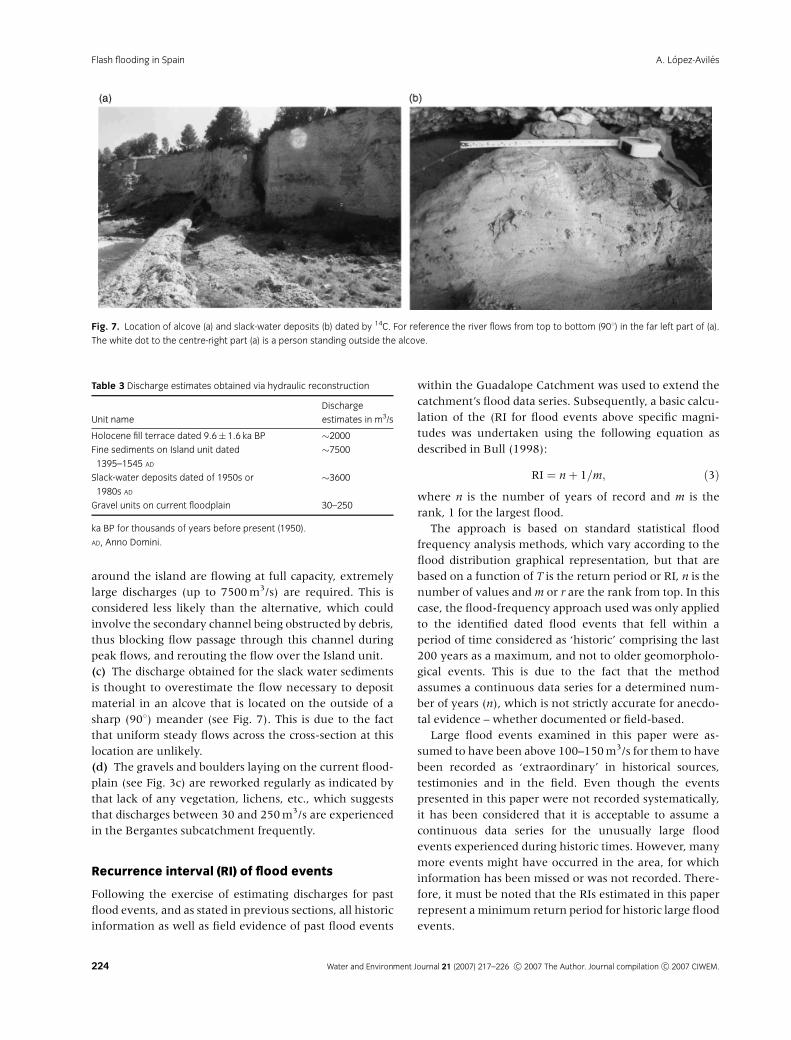
(c) The discharge obtained for the slack water sediments
is thought to overestimate the flow necessary to deposit
material in an alcove that is located on the outside of a
sharp (901) meander (see Fig. 7). This is due to the fact
that uniform steady flows across the cross-section at this
location are unlikely.
(d) The gravels and boulders laying on the current flood-
plain (see Fig. 3c) are reworked regularly as indicated by
that lack of any vegetation, lichens, etc., which suggests
that discharges between 30 and 250 m3/s are experienced
in the Bergantes subcatchment frequently.
Recurrence interval (RI) of flood events
Following the exercise of estimating discharges for past
flood events, and as stated in previous sections, all historic
information as well as field evidence of past flood events
within the Guadalope Catchment was used to extend the
catchment’s flood data series. Subsequently, a basic calcu-
lation of the (RI for flood events above specific magni-
tudes was undertaken using the following equation as
described in Bull (1998):
RI ¼ nþ 1=m; ð3Þ
where n is the number of years of record and m is the
rank, 1 for the largest flood.
The approach is based on standard statistical flood
frequency analysis methods, which vary according to the
flood distribution graphical representation, but that are
based on a function of T is the return period or RI, n is the
number of values and m or r are the rank from top. In this
case, the flood-frequency approach used was only applied
to the identified dated flood events that fell within a
period of time considered as ‘historic’ comprising the last
200 years as a maximum, and not to older geomorpholo-
gical events. This is due to the fact that the method
assumes a continuous data series for a determined num-
ber of years (n), which is not strictly accurate for anecdo-
tal evidence – whether documented or field-based.
Large flood events examined in this paper were as-
sumed to have been above 100–150 m3/s for them to have
been recorded as ‘extraordinary’ in historical sources,
testimonies and in the field. Even though the events
presented in this paper were not recorded systematically,
it has been considered that it is acceptable to assume a
continuous data series for the unusually large flood
events experienced during historic times. However, many
more events might have occurred in the area, for which
information has been missed or was not recorded. There-
fore, it must be noted that the RIs estimated in this paper
represent a minimum return period for historic large flood
events.
Fig. 7. Location of alcove (a) and slack-water deposits (b) dated by 14C. For reference the river flows from top to bottom (901) in the far left part of (a).
The white dot to the centre-right part (a) is a person standing outside the alcove.
Table 3 Discharge estimates obtained via hydraulic reconstruction
Unit name
Discharge
estimates in m3/s
Holocene fill terrace dated 9.6� 1.6 ka BP �2000
Fine sediments on Island unit dated
1395–1545 AD
�7500
Slack-water deposits dated of 1950s or
1980s AD
�3600
Gravel units on current floodplain 30–250
ka BP for thousands of years before present (1950).
AD, Anno Domini.
Water and Environment Journal 21 (2007) 217–226 c� 2007 The Author. Journal compilation c� 2007 CIWEM.224
Flash flooding in Spain A. Lopez-Aviles
However, the further back into the past (i.e. for geo-
morphological events), the larger the uncertainty about
whether flood events for which evidence/records are not
available might have occurred in between known flood-
ing episodes. Therefore, the data series cannot be assumed
as continuous, and thus, no attempt has been made in this
paper to analyse the possible return period for these
geomorphological events, as the results could be mislead-
ing. The data associated with older geomorphological
events shown in this paper are presented as further
evidence that large catastrophic flood events do occur in
the Guadalope–Bergantes Catchment.
The method used in this research shows how to extend
the length of conventional gauged data series by adding
historic and field evidence of past large flood events. It
also illustrates how it can be useful to investigate historic
evidence of large-magnitude floods before designing
structures, especially if the available gauging and rainfall
records are not very long. However, the results have to be
treated with caution and can only be seen as an attempt
to estimate minimum RIs for historic flood events based
on a series of assumptions.
The results from this exercise as well as the main
conclusions of this research are described further in the
following sections.
Summary of results
The main conclusions from this research indicate that
very high-magnitude flood events have been experienced
by the Bergantes River in historic times. This type of
flooding is believed to be more frequent than previously
thought in this catchment. This has been corroborated by
gauged data recorded both on the Guadalope and Ber-
gantes Rivers in the last few decades, and by the rainfall
pattern of the region, which is characterised by sporadic
localised and very intense rainfall events.
Regarding the functional floodplain of the Bergantes
River, estimates of past discharges calculated using stan-
dard formulae (see ‘Methods’) suggest that discharges
between 30 and 250 m3/s are required to rework the
active floodplain. By comparing these magnitudes with
gauged data for the Bergantes River, it is estimated that
reworking of the active floodplain takes place every year
or every other year.
Following basic analysis of RIs for flood events of
specific magnitudes (see Eq. 3), the 1967 event (known
to be above 1500 m3/s according to gauging station in-
formation) was ranked alongside known events recorded
for this area as far back as 1945 (approximately 1000 m3/s
downstream from the study reach). Based on the data
available, magnitudes of a similar order to that of the 1967
event are believed to have a minimum return period of
1 in 50 years in the Bergantes River. However, if the 14C
date of the 1950s or the 1980s – obtained from deposits
located within the study site – is included in the frequency
analysis, the suggestion is that flood events of an order of
magnitude larger than 1000–1500 m3/s can occur even
more frequently in the Bergantes Catchment (i.e. RI up to
1 in 25 years). This is corroborated by geomorphological
evidence of very large flood events that have occurred in
the Bergantes Catchment in the past (see Tables 2 and 3).
Conclusions
(1) Given that large flash-flooding episodes appear to be
more common in the Bergantes Catchment than pre-
viously thought, and as these flood events seem to be
responsible for most of the geomorphological work in the
valleys, it is recommended that any new structures
planned within the Guadalope–Bergantes Catchment
should be designed accordingly. Inadequate design of
spillways for dams and reservoirs may potentially lead to
failure or under-capacity to empty reservoirs, which may
in turn have catastrophic effects on the local infrastruc-
ture and economy. The area’s transport system including
roads, railways and bridges runs parallel and across water-
courses, especially in the most mountainous upper part of
the catchment. Additionally, the cooling system of the
thermal power station of Andorra depends on water
supplied from the Calanda reservoir via a canal that flows
parallel to the Guadalope River. Therefore, the lack of
water supply caused by damage to either the canal or
reservoir would have significant repercussions.
(2) Flooding by failure or overtopping of dams, and the
potential risk of a break of dams ‘in cascade’ would also
have important repercussions for the local economy. The
damages would be derived from direct impact on the area’s
agriculture, farming and mining (coal) activities, and
indirectly, due to the transport disruptions caused. The
potential damages derived from loss of life, and the
devastating effects on human settlements are incalculable.
(3) Geomorphological approaches such as the ones de-
scribed in this paper can help to improve safety factors for
dams and reservoirs at the design stage, by estimating
historic flood magnitudes to complement gauged data
series. This principle can be applicable elsewhere in the
world, and the approaches used in this area of Spain can
be used wherever evidence of past flood events is docu-
mented either in written or oral form, photographic form
or as field (geomorphological) evidence (e.g. slack-water
deposits, high water marks, etc.).
(4) However, the sources of information and dating
techniques used to extend the available data in this area
of Spain might vary in other parts of the world depending
on the available evidence and type of environment, as
Water and Environment Journal 21 (2007) 217–226 c� 2007 The Author. Journal compilation c� 2007 CIWEM. 225
Flash flooding in SpainA. Lopez-Aviles
there are limitations in the use of some of the techniques.
For example, trees and other organic debris associated
with high flows and flood episodes can be dated using
dendrochronology and 14C techniques, but might not be
available or suitable under conditions of regular or re-
peated slow-onset flooding. The presence or not of lichens
can be used to determine the time elapsed since the last
high-flow episode at specific locations. The existence or
not of documented or witness evidence and its quality will
determine whether this can be used to extend data series.
Furthermore, some techniques such as luminescence
dating of sediment deposits are known to work better in
semi-arid environments where the water content within
sediments is more regular for longer periods than in
highly seasonal climates such as that of the UK. This
makes luminescence techniques less suitable in temperate
environments, and indicates that a degree of good judge-
ment is required from the professional as to the selection
and adequacy of the approaches to use.
Acknowledgements
This paper would not have been possible without the
eternal support and help of my husband Yacob, to whom I
am always grateful. I also thank my PhD supervisor
Professor Phillip Ashworth, my dear friend Jose Antonio
Benavente for his help and guidance while working in
this region of Spain, and my parents for the number of
trips they have taken to the Northeast of Spain over the
years and their help in collecting field data. I am also very
grateful to Alfredo Gasion, the local photographer of Mas
de las Matas, for allowing me to use his photographs of
the 1996 flood event.
The views expressed in this paper are exclusively the
author’s views based on knowledge of the area, empirical
evidence and methods used world-wide. They do not
represent the Environment Agency’s views. The material
used in the paper includes original research by the author
constituting part of her doctoral studies.
References
Bull, W.B. (1998) Floods; Degradation and Aggradation. In
Baker, V.R., Kochel, R.C. and Patton, P.C. (eds). Flood
Geomorphology Chapter 8, pp. 157–166. New York.
Comision Tecnica de Inundaciones. (1985) Estudio de
Inundaciones Historicas: mapa de riesgos potenciales de la
Cuenca del Ebro. Vol. IV–VIII. Comision Nacional de
Proteccion Civil, Spain.
Fuller, I.C., Macklin, M.G., Passmore, D.G., Brewer, P.A.,
Lewin, J. and Wintle, A.G. (1996) Geochronologies and
Environmental Records of Quaternary Fluvial Sequences
in the Guadalope Basin, Northeast Spain, Based on
Luminescence Dating. In Branson, J., Brown, A.G. and
Gregory, K. J. (eds) Global Continental Changes: The Context of
Palaeohydrology, pp. 99–120. The Geological Society, London.
Lopez-Aviles, A. (1998) Flood regime and Quaternary
sedimentation style in the Guadalope Basin, Northeast Spain.
PhD Thesis, University of Leeds, Leeds, LS, UK.
Lopez-Aviles, A., Ashworth, P.J. and Macklin, M.G. (1998)
Floods and Quaternary Sedimentation Style in a Bedrock
Controlled Reach of the Bergantes River, Ebro Basin,
Northeast Spain. In Benito, G., Baker, V.R. and Gregory, K.J.
(eds) Palaeohydrology and Environmental Change, pp. 181–196.
Wiley and Sons, Chichester, UK.
World Commission on Dams. (2000) Dams and Development:
A New Framework for Decision Making. Earthscan, London.
World Bank. (2004) World Development Report. The World Bank,
Washington DC.
Water and Environment Journal 21 (2007) 217–226 c� 2007 The Author. Journal compilation c� 2007 CIWEM.226
Flash flooding in Spain A. Lopez-Aviles
Related Documents