Welcome message from author
This document is posted to help you gain knowledge. Please leave a comment to let me know what you think about it! Share it to your friends and learn new things together.
Transcript


To obtain additional copies of this report or rights to copy it, please contact:Parkland Institute, University of Alberta11045 Saskatchewan DriveEdmonton, Alberta T6G 2E1Phone: (780)492-8558Fax: (780) 492-8738http://parklandinstitute.caEmail: [email protected] 978-1-894949-31-6
fixing what’s broken: f a i r a n d s u s t a i n a b l e s o l u t i o n s t o a l b e r t a’s r e v e n u e p r o b l e m s
Greg FlanaganThis report published by the Parkland Institute May 2011 © All rights reserved.
contents
Acknowledgements 4 About the Author 4 About the Parkland Institute 5Executive Summary 6
s e c t i o n o n e : i n t r o d u c t i o n a n d l i m i t o f r e p o r t 11
1.1 The purpose of public taxation and government revenue procurement 13 1.2 Dependence on natural resource revenue—profit 13 1.3 Tax room 15
s e c t i o n t w o : c o n s u m p t i o n t a x e s 17
2.1 General sales tax 19 2.2 Specific consumption taxes—the various consumption taxes are outlined and discussed and Alberta is compared to other provinces 19 2.3 The implementation of a general sales tax is analyzed and the revenue that could be raised is considered 25
2.4 A carbon tax is briefly considered 29
s e c t i o n t h r e e : i n c o m e t a x e s 32
3.1 Corporate taxes are briefly discussed as is the experience and consequence of the rush to the bottom of the ‘competitive’ tax pack 34
3.2 The personal income tax system is outlined, rates of Canadian provinces are compared, and the result of Alberta’s constant tax regime (‘flat tax’) is discussed 38

fixing what’s broken: fair and sustainable solutions to alberta’s revenue problems
3
3.3 Alberta’s personal income tax is analyzed using the past (pre 2001) and the current system to evaluate the loss of progressivity and revenue. Alternative tax systems are considered and evaluated for progressivity and revenue benefits 43
s e c t i o n f o u r : c o n c l u s i o n s a n d r e c o m m e n d a t i o n s 46
Appendix: Sales Tax Exemptions and Rebates 50

parkland institute | may 2011
4
Acknowledgements
I would like to thank Diana Gibson at the Parkland Institute for her extensive time and work on this project. I am also indebted to Parkland Institute for hosting a workshop in Edmonton on October, 2010 where participants pro-vided valuable suggestions and comments on the tax perspectives presented in this report.
Much appreciation is extended to the external reviewers of an earlier draft: Melville McMillan and Trevor Harrison each submitted detailed comments providing much insight and valuable suggestions that helped significantly in improving the report. As well, thanks to David Thompson for providing encouragement and useful general comments. Thanks also to Scott Harris and Jes Elliott for the final proofing and layout of the report. I am, of course, entirely responsible for any errors and omissions in the analysis, and for the final views expressed.
About the Author
Greg Flanagan is a public finance economist based in Calgary. He has taught for 30 years in Alberta at various colleges and universities, including 17 years at Mount Royal University (College) and four years as dean at St. Mary’s Uni-versity-College. From 2003 until his recent retirement, he was assistant dean, the Faculty of Management, University of Lethbridge. He holds degrees from University of Calgary (BA Economics), York University (MES Political Econ-omy), and the University of British Columbia (MA Economics). His research interests focus on the economics of public policy. He has served as a director on the board of Parkland Institute, Faculty of Arts, University of Alberta since its inception. He is co-author of two textbooks: Economics in a Canadian Setting, HarperCollins Publishers, 1993; and Economics Issues, a Canadian Perspective, McGraw-Hill, 1997. As well, he has authored numerous papers and articles.

fixing what’s broken: fair and sustainable solutions to alberta’s revenue problems
5
About Parkland Institute
Parkland Institute is an Alberta research network that examines public policy issues. We are based in the Faculty of Arts at the University of Alberta and our research network includes members from most of Alberta’s academic institutions as well as other organizations involved in public policy research. Parkland Institute was founded in 1996 and its mandate is to:
• conduct research on economic, social, cultural, and political issues facing Albertans and Canadians.
• publish research and provide informed comment on current policy issues to the media and the public.
• sponsor conferences and public forums on issues facing Alber-tans.
• bring together academic and non-academic communities.All Parkland Institute reports are academically peer reviewed to ensure the integrity and accuracy of the research.
For more information visit www.parklandinstitute.ca

parkland institute | may 2011
6
Executive Summary
When one considers public sector finances in Alberta over the last two decades the volatility is dizzying. This stems from the use of oil and gas revenues to fund public programs and services. Debate in Alberta has heated up recently after the Premier’s Economic Council identified this as a problem and recom-mended that the government reduce its reliance on oil and gas revenues. The cuts to education have further raised the temperature on this debate by expos-ing how vulnerable it makes Albertans.
This report contributes to that conversation by taking it the next step - how can we raise the revenues we need to cut our dependence on oil and gas? It ex-plores what revenues Alberta currently brings in, how this revenue compares to other jurisdictions, what policy choices are possible and their effects on the budget.
Dependence on Natural Resource
Revenue
Alberta relies heavily on resource revenues to fund programs like health care and education. Resource revenues made up over 40% of the budget in the early 1990s, dropping to a low of approximately 19% in 2000/01, and rising again to approximately 35% in 2008/09. These revenues have been used to cut taxes and make Alberta by far the lowest tax jurisdiction in North America and one of the lowest of developed economies.
Tax Room
Alberta’s reliance on tax revenue has been weak compared to other Canadian provinces. Alberta’s total taxes constitute just over 6% of provincial GDP, com-pared to a range of 8% to over 14% for other provinces. The Alberta govern-ment reports on its website that if Albertans and Alberta businesses were in any other province, they would pay between about $11 billion to almost $20 billion more in taxes. If Albertans decided to increase taxes there is consid-erable tax room to do so. Alberta is the only Canadian jurisdiction without a sales tax, and with the ‘flat tax’ and is relatively low on a number of other taxes. Alberta also has no revenue from mining and logging taxes levied on profits of natural resource-based industries.

fixing what’s broken: fair and sustainable solutions to alberta’s revenue problems
7
Consumption Taxes
Because Alberta does not impose a provincial (general) sales tax (PST), its rev-enues from consumption taxes are the lowest in the country. Alberta brings in $1092 per person, approximately one-half the average (mean) of $2150.
Alberta without a PST might be relatively lower in consumption taxes on the whole, but Alberta is significantly higher than the other provinces in the gaming revenue, at $462 per person—more than double the average of $199; and combined tobacco and liquor taxes are also higher, at $228 compared to $157. With gasoline and motive fuel taxes, though, Alberta is second-lowest, receiving only about 70% of the average, at $197 compared to $275. If gasoline and other motive fuels were increased to the average Alberta could obtain an additional $287 million.
A Carbon Tax
It is generally accepted that carbon dioxide emissions are a serious factor in global warming, as well as a local pollutant. A carbon tax is a general fee for carbon content of fuels like coal, oil, and gas to compensate for emissions produced from their use. The revenues could be put into programs to offset the financial impact for low income Albertans and to reduce costs for environ-mentally friendly activities such as transit, making it overall revenue neutral. Although the implementation of a carbon tax may not be a revenue generator, it should nonetheless be implemented in Alberta.
Income Taxes
In 2009 Alberta raised $12.44 billion in income tax revenue. This amounted to only 34% of own-source revenue and 31% to total revenue for the year. Personal income tax was $8.67 billion while corporate income tax revenue was $3.77 billion. In terms of gross provincial product (GDP) 2008 data, these tax revenues constitute a total of 4.47% of GDP; personal income tax was 2.86% of GDP; and corporate income tax was a mere 1.61% of GDP, this in a year with the highest income tax revenue ever achieved in the province.
Corporate Income Tax
The combined federal/provincial corporate income tax rate currently at 28% has fallen from 33.62% in 2005 and is set to decline to 25% by 2012. Small business tax at 14% has also declined from tax rates in the 30% range. These corporate income tax reductions will give Canadian corporations the lowest

parkland institute | may 2011
8
tax rate on new business investment in the Group of Seven (G7) by 2011 and the lowest statutory tax rate in the G7 by 2012. Provinces are engaged in a race to the bottom, a race that no jurisdiction can win.
There is no tax advantage for US companies as they pay the difference to the US Treasury. American corporations working in Canada will receive a tax credit for taxes paid (25%) in Canada but will pay rates of 35% at home. This constitutes a transfer of wealth from Canada to the US government of at least $1.1billion. Also, American firms also have higher health care costs. This is an extra cost to the firms above what Canadian firms have to contribute. Corpo-rate taxes should be levied with this discrepancy in mind.
It needs to be noted that the above tables showing tax rates show the statutory tax rates. Studies of effective tax rates show that what companies actually pay in tax is considerably lower. For example, a recent National Bureau of Eco-nomic Research paper finds Canada’s corporate tax rate to be 7% for domestic firms and 21% for multinational firms, when the statutory rate was about 36%. These loopholes and tax expenditures need to be closed.
Personal Income Tax
Alberta is the only jurisdiction with a single (flat) tax regime. Other prov-inces have from three to five tax brackets ranging from a low of 4% to a high of 17.5% (24% if we include Quebec). Alberta has by far the highest exempt income from personal income at $16,161.
The tradition in the economics discipline extending at least as far back as Adam Smith’s Wealth of Nations (1776) has emphasized progressive taxation. Those with the greatest ability to pay—high-income earners—realize the larg-est benefits from the economic system, both economic and political. There-fore, it is expected that they would contribute to the public revenue needs more than proportionally to their income.
The report proposes a simple and continuously progressive system. The taxes would proportionately transferred to higher incomes. Anyone earning less than $25,000 taxable income ($40,000 gross income) would have a reduced tax bill.

fixing what’s broken: fair and sustainable solutions to alberta’s revenue problems
9
Conclusions and Recommendations
1. p u b l i c p r i o r i t i e s s h o u l d d e t e r m i n e s p e n d i n g a n d t a x l e v e l s -
Albertans need to ascertain the appropriate level of public services to be pro-vided by their government. This process obviously involves political ideolo-gies and differing social norms mediated through the political process. It is quite amazing the degree of consensus that can be achieved through this pro-cess. For example, regardless of the quite vast ideological difference among citizens in Alberta there is almost complete agreement on the providing of healthcare through a public financed single-payer system. As well, education is quite universally seen as an investment in the future, and that it should largely be provided and funded through state mechanisms. Whatever the set of public services determined, the chosen set will imply a cost estimate, and therefore, the revenue the tax system needs to generate can be determined. Once the degree of tax revenues needed is established, the fairest tax struc-ture can be determined to achieve this revenue target.
2. i n c r e a s e r e s o u r c e r e n t s a n d s a v i n g s -
It has been well documented that Alberta has been collecting far less resource rents than comparable jurisdictions with similar resources. Resource rents should be objectively determined by analysis. If we act to increase taxes and reduce reliance on resource revenues, we must have a commitment to save resource revenue in a permanent trust. For the purposes of current budget expenditures, only the annual income from the resource trust fund should be used.
3. i n s t i t u t e a s i m p l e a n d c o n t i n u o u s l y p r o g r e s s i v e i n c o m e t a x s y s t e m -
It is of prime importance that Alberta implement a simple, fair, and progres-sive personal income tax regime to replace the current (2000) single tax rate system. As well as reinstating fairness to the tax system, a progressive tax system could bring in approximately an additional $1 billion in revenue while retaining the current (high) personal exemptions and reducing current taxes to lower income groups. Yet the rate increases for high income earners under such a regime would be reasonable.
4. s t o p t h e d o w n w a r d s p i r a l i n c o r p o r a t e t a x e s -
Corporate income taxes are on a downward death spiral as provincial (and national) jurisdictions compete for mobile investments. Firms are then pay-

parkland institute | may 2011
10
ing less and less of the social costs of running a high functioning society. For Canada this leaves the healthcare and education systems particularly poorly funded at the same time that corporations increasingly require a healthy, well-educated workforce. We need to reassess the corporate income tax and cooperate or initiate national (and international) agreements to prevent beggar-your-neighbour corporate tax policies.
5. r a i s e g a s o l i n e a n d f u e l t a x e s -
Gasoline and fuel taxes could be increased in Alberta without introducing any competitive disadvantage. This could bring in additional revenues in the hun-dreds of millions of dollars.
6. a l b e r t a s h o u l d i n t r o d u c e a c a r b o n t a x / l e v y -
The British Columbia model could be considered. This levy would be used to correct the cost distortions caused by emitting carbon into the atmosphere without having to pay for it. The ‘tragedy of the commons’ in the form of global climate change and other environmental disruptions are the result of emissions being free. Carbon levies need to include charges in both produc-tion and consumption activities to address this. However, revenues should be returned to the payers for fairness, that their general standard of well-being is not changed, just their activities and mechanisms that produce carbon. There-fore, a carbon tax would generate no extra revenue for budget purposes. By introducing a provincial carbon tax Alberta may also scoop the federal govern-ment and prevent it from capturing that source of revenue.
7. s a l e s t a x -
It is well recognized that an income tax alone cannot capture tax fairly from all. For example, the wealthy can utilize the income tax act (and mechanisms) to reduce and avoid paying taxes. Though not ideal, in the absence of tax reform to close those loopholes, a sales tax is one more cut at collecting tax fairly and high income individuals do also spend more. A 5% general provincial sales tax should be introduced in Alberta. This would achieve approximately $5 billion in extra revenue. This sales tax should be ‘harmonized’ with the fed-eral GST right from the start to eliminate any extra administration expenses. All revenue would go to public expenditures. At 5% a sales tax in Alberta would be minimally disruptive, would bring Alberta’s consumption taxes in line with the other provinces and therefore would have little or no impact on growth or competitive advantage of Alberta. This tax should come with a generous low-income rebate system.

fixing what’s broken: fair and sustainable solutions to alberta’s revenue problems
11
section 1 : introduction and limit of report
When one considers public sector finances in Alberta over the last two de-cades the volatility is dizzying. If graphed, provincial revenue and the expen-diture statistics would look like a roller coaster ride; indeed, an out-of-control roller coaster ride, with public revenues dominated by, and largely driven by, natural resource rents. And for public sector employees and for all Albertans it has been a roller coaster ride. This budget volatility is both disruptive and costly in its own right and needs to be curtailed.
Of the vast quantity of budget discussion in Alberta the revenue side gets little play. What we hear a lot about is expenditures—that they are too high, too low, not enough here, too much there. 1 The problem is that this discussion is done in the context of: (1) the assumption that taxes cannot be discussed, (2) deficits and debt are abhorrent, and therefore (3) a reliance on volatile resource revenues for financing. Yes, Albertans need to have a rational debate about the appropriate size and level of expenditure on the public sector. How-ever, we need a more balanced approach to budgeting in Alberta that brings this other side—revenues—into the discussion.
Public sector expenditures are crucial to our quality of life. The constitutional responsibilities of provincial governments include the costly areas of educa-tion and healthcare. As well, modern communication and transportation are increasingly complex and necessary public goods. Also, social services, in an increasingly interdependent collection of individuals, need considerable public resources in a fair-minded society. Because of the large economies of scale, for example, in single-payer healthcare, the numerous externalities 2 in education and social services, the efficiency of public transportation and com-munication systems (think of the alternative of toll booths everywhere), the provision of these services is most appropriately accomplished in the public sphere. Government is necessarily large in an advanced complex productive society, and the provision of public services is expensive.
1 For a perspective on Alberta’s expenditures being too high see: Boessenkool, Ken, “Does Alberta have a Spending Problem?”, SPP Communiqué, The School of Public Policy, University of Calgary, Vol. 2 Issue 1, February 2010. Boessenkool is in agreement about the need for a fiscal adjustment –tax increases or expenditure reductions – and less reliance on resource income to finance current government expenditures in order to return to a sustainable fiscal track. He argues for a $5billion reduction in expenditures as the solution. This paper takes the position that expenditure is an open public question but that the public discussion must also include tax increases as the solution.
2 The economic effects one’s decisions/actions have on others not party to them.

parkland institute | may 2011
12
This report specifically considers the revenue side of the budget ledger. What revenues Alberta currently brings in, how this revenue compares to other jurisdictions, and what policy choices are possible and their effects on the budget.

fixing what’s broken: fair and sustainable solutions to alberta’s revenue problems
13
1.1 The purpose of public taxation and government revenue procurement
To achieve the efficiencies of public provision requires an appropriate revenue stream. This revenue should be obtained in the most efficient and equitable manner possible. The revenue sources should be stable and ideally counter-cyclical to the ups and downs of the business cycle. All provinces have similar problems of being responsible to fund programs while having somewhat constrained tax powers compared to the federal government.
As citizens we seem to have lost the connection between taxes and the wealth and wellbeing we derive both individually and collectively from the public services these taxes provide. This is partially because neoconservative govern-ments in Canada have been stumbling over each other in a race to reduce taxes. When budget deficits then appear we hear the cry that we can’t afford this ‘unsustainable’ level of public services and must cut the public sector. This is not only destructive of our public system, it is also destabilizing of the whole economy, including the private sector and employment.
1.2 Dependence on Natural resource revenue—profit
Other provinces envy Alberta, with its great advantage in being endowed with vast natural wealth in the form of gas and oil and to a lesser extent forests and minerals. This wealth has been providing considerable funds to public sector financing in Alberta. On a revenue basis there is no need for the Alberta gov-ernment to raise tax rates now or in the foreseeable future in order to fund public programs. However, the use of natural resource revenues as annual operating funds has exacerbated the budget difficulties in Alberta. Alberta has been a leader in neoconservative thought, with its emphasis on low taxes, small government, and rewarding the wealthy—alleged to be the most pro-ductive creators of wealth.
The Alberta government reports on its website the tax advantage in Alberta 3: “If Albertans and Alberta businesses were in any other province, they would pay between about $11 billion to almost $20 billion more in taxes, every single year.” The government boasts to the country and to the world about its ‘tax advantage’—low taxes (the ‘Alberta Advantage’?) while it spends most of the income from its resources on current expenditures. 4
3 Alberta Tax Advantage: http://www.finance.alberta.ca/publications/budget/budget2011/tax.pdf
4 Op Cit

parkland institute | may 2011
14
In Figure 1-1 the bottom (blue) line shows the dependence of each annual budget on the natural resource revenues as a percentage of total provincial government expenditures. It was over 40% of the budget in the early 1990s, dropping to a low of approximately 19% in 2000/01, and rising again to ap-proximately 35% in 2008/09. The red line indicates the need for resource revenues to balance the budget. In the early 1990s we ran deficits that meant we needed more than 100% of the royalty revenue. In 2001/02 we only needed approximately 35% of all the rents to fund current expenditures. In the last two decades we could not have financed Alberta government responsibilities without drawing heavily on our natural resource revenues.
0%
20%
40%
60%
80%
100%
120%
140%
160%
180%
Perc
ent o
f Tot
al E
xpen
ditu
res
Year
A l b e r t a F i s c a l D e p e n d e n c e o n ' I n v e s t m e n t I n c o m e '
Dependence
Percent needed
Perc
ent U
sed
for C
urre
nt E
xpen
ditu
res
FIGURE 1-1

fixing what’s broken: fair and sustainable solutions to alberta’s revenue problems
15
Natural resources are largely owned collectively through our provincial gov-ernment. This ownership requires that our elected representatives manage resource development appropriately and that they obtain a fair return for the public on the exploitation of these resources. Obtaining a financial return on resources is termed rent capture and is not as simple as pricing the resource per unit and selling it to a developer. Rent capture takes many forms including royalty structures, land sales, and taxes.
Recently the question of collecting a ‘fair share’ of resource revenue has been much in the news. Premier Ed Stelmach, on winning the leadership of the Pro-gressive Conservatives, initiated an expert royalty review panel that reported in September 2007. 5 Initially the panel’s recommendations were implemented, but the government later backpedalled under industry pressure. The whole question of the appropriate rent capture—a fair share—is therefore still up in the air. Certainly much evidence suggests that Alberta has never captured sufficient rent for its resources when compared to other oil-and-gas-endowed jurisdictions such as Norway and Alaska. 6
This report, although about government revenues, is not about rent capture, fairness or otherwise. This report is about taxes. I would go so far as to say that resource revenues should not be part of the operating budget. Resource revenues, appropriately determined and collected, should be ‘banked’ into a long-term fund or funds. The income from these fund(s) could go into operat-ing revenues, thereby lessening over time the need for tax revenues. Con-troversial as it may be in contemporary Alberta, it is my belief that current government operating expenses should, at least over time and the business cycle, be supported by sufficient tax revenue. Having said this, the process of weaning the Alberta public sector from using current rent income would likely have to be phased in. This has been the subject of increasing public debate in Alberta and more than one expert panel has recommended that the Alberta government reduce its reliance on resource revenues. 7 Enough said for the purposes here about natural resource revenues.
1.3 Tax room
While Alberta’s reliance on natural resource revenue has been high, reliance on tax revenue has been weak compared to other Canadian provinces. Figure 1-2 compares the tax revenue obtained in 2008 as a percentage of the provin-
5 Our Fair Share: September, 2007 http://www.albertaroyaltyreview.ca/panel/final_report.pdf
6 For a recent analysis of the Alberta’s royalty regime see: Regan Boychuk, Misplaced Generos-ity: Extraordinary profits in Alberta’s oil and gas industry, Parkland Institute, November 2010.
7 Premier’s Council for Economic Strategy, Shaping Alberta’s Future, May 2011, http://www.premier.alberta.ca/plansinitiatives/economic/index.cfm. See also Preserving Prosperity, Alberta Financial Investment and Planning Advisory Committee, December 2007.

parkland institute | may 2011
16
cial gross product (GDP) for each province. Alberta’s total taxes constitute just over 6% of provincial GDP, considerably lower than other provinces.
*Includes all income taxes, consumption taxes, property and related taxes
If Albertans decided to increase taxes there is considerable tax room to do so. Alberta is the only Canadian jurisdiction without a sales tax, and in 2000 Alberta instituted the ‘flat tax’, more appropriately termed the constant-rate tax system, while also reducing tax rates from the previous tax system. This tax regime has reduced personal tax revenue by billions of dollars, with most of this tax relief going to the wealthiest in Alberta. 8
Would Albertans support greater taxes to have healthcare or education funded
8 See: Flanagan, Greg, “Shifting the Burden”, Alberta Views, Calgary, Alberta, Sept/Oct 2000, pp 21-27; and Mel McMillan, “Alberta single Rate Tax, some implications and alternatives”, Canadian Tax Journal (2000) Volume 15 No. 4 1022.
0% 1% 2% 3% 4% 5% 6% 7% 8% 9%
10% 11% 12% 13% 14% 15%
NFL PEI NS NB QU ON MN SK BC AB
Province
T a x R e v e n u e * a s a P e r c e n t o f G r o s s P r o v i n c i a l P r o d u c t ( 2 0 0 8 )
FIGURE 1-2

fixing what’s broken: fair and sustainable solutions to alberta’s revenue problems
17
as necessary? The government has never asked. 9 There is enormous tax room to fund the public services that the population values and wants. Albertans are wealthy and generally generous. Albertans should be given the opportu-nity to decide both the level of public sector services and the tax system to pay for it. The dependence on resource rents for current public expenditures needs to change.
The level of public services should be objectively determined through political processes that include all Albertans. A consideration of the revenue potential in Alberta shows that claims that public services are unaffordable or unsus-tainable are weak. In the long run, we need a vision and a plan. This plan should include the other side of the budget—mechanisms to ensure stable and predictable funding of public sector services.
section 2: consumption taxes
Consumption taxes are taxes imposed on the sale of goods and services to consumers. They are grouped into two main categories: (1) A general sales tax that imposes a certain percentage tax on the price of the good or service included in the domain of the tax and (2) Specific taxes levied only on certain products at differing rates. These taxes can be levied as a percentage of price or as per-unit tax on the quantity bought/sold.
Consumption taxes are used for a number of policy objectives. Obviously number one is to raise revenues in order to pay for public services. Addition-ally, though these taxes may change behaviour in socially desired ways. 10 A consumer, it is said, has the choice between leisure and work (income). The consumer can then use his or her income from work to spend on goods and services, or they can save a portion.
A general sales tax with no exemptions will not change the relative prices of goods and services facing a consumer, but will make leisure relatively less ex-pensive. As a normal ‘good’, the substitution effect would indicate that leisure should increase and work effort decrease for the average consumer. This is not guaranteed as there is also an income effect. And the fact that the consumer would have less net income after a sales tax may require greater work effort to achieve a desired income or standard of living. In this case the income ef-fect is opposite to, and more than offsets, the substitution effect. Similarly for saving, the difference between income and expenditures. If savings (untaxed) are relatively cheaper, then people will save more with a sales tax in place.
9 Others have; for example, the United Nurses of Alberta polled Albertans, who responded that they would be prepared to pay more tax for better healthcare.
10 ‘Desired’ being a subjective term this use of the tax system can be ideologically suspect.

parkland institute | may 2011
18
Most economists support sales taxes because of this effect on savings, argu-ing that greater savings fund greater investment, which increases economic growth.
A sales tax on a specific good will change—increase—the relative price of this good compared to the prices of other goods and services. The consumer will likely 11 buy less of this good at the higher net price. For example, cigarette taxes reduce smoking—a socially desired outcome given the correlation of smoking and health risks. A subsidy on the purchase of a specific good will do the opposite. The consumer will likely buy more of this good at the lower net price. The Conservative federal government has increased the use of these subsidies for, for example, transit passes.
Figure 2-1 shows the total consumption tax revenues for each province. Al-berta is by far the lowest at $1,092 per capita compared to the national average of $2,150. This low level is due, of course, to the absence of a general provincial sales tax (PST).
11 Subject to the ‘price elasticity’ of the good. For example, addictions reduce the sensitivity to price increases.
$0
$500
$1,000
$1,500
$2,000
$2,500
NFL PEI NS NB QU ON MB SK BC AB Mean
Per C
apita
Province
2 0 0 9 C o n s u m p t i o n T a x e s
Statistics Canada series v207010
FIGURE 2-1

fixing what’s broken: fair and sustainable solutions to alberta’s revenue problems
19
2.1 General sales tax
General sales taxes include the federal GST and the various provincial retail sales taxes. In April 1996, the federal government reached an agreement with the three Atlantic provinces—Newfoundland and Labrador, New Brunswick, and Nova Scotia—to harmonize their provincial retail sales taxes with the federal GST. This arrangement is termed the Harmonized Sales Tax (HST). On July 1, 2010 British Columbia and Ontario also entered into HST agreements with the federal government. The one-time compensation of the federal to the provinces for harmonization is included under general purpose transfers and not consumption or general sales tax categories.
If all individuals, regardless of income, spent all of their income (or even the same proportion) then a comprehensive sales tax would be neither regressive nor progressive but a constant tax, with each person paying the same percent-age of income in tax. However, sales taxes are considered regressive because lower income earners spend a greater proportion of their income. This means that the average tax rate falls as income rises, making the tax regressive. To offset this regressivity two methods are applied: (1) The tax base is not com-prehensive—there are goods and services exempt from the tax, and (2) Grants are paid to individuals based on their income and assumed expenditure level and, therefore, sales tax paid. Both these methods are applied in the applica-tion of the GST (and therefore the HST).
When the tax base or range of goods taxed has exemptions, such as for food and children’s clothing with the GST, then these goods become relatively cheaper and purchasing patterns are changed. These exemptions, however, are usually introduced to reduce the regressive nature of sales taxes. De-termining exemptions is not easy though. The Canada Revenue Agency has numerous interpretive guides, most notably RC4022 General Information for GST/HST Registrants. 12 With certain basic goods being exempt from sales taxes and sales-tax rebates for lower-income individuals makes general sales taxes much more progressive in implementation. Details of sales tax exemptions are considered in Appendix 1.
2.2 Specific consumption taxes
Specific taxes are often levied to change behaviour—for example, alcohol and tobacco taxes—by making certain goods more expensive, and thereby reducing their consumption. However, often the ‘bad’ goods are addictive and consumption is therefore inelastic to price. Thus, the tax on these goods can raise considerable revenue but not do much to deter behaviour. There is also
12 http://www.cra-arc.gc.ca/E/pub/gp/rc4022/README.html

parkland institute | may 2011
20
a balance between the tax rate and the incentive for illegal or underground transactions to evade the tax. This may be an increased problem for alcohol in a province where the government does not control the retail of liquor. Howev-er, increased taxes on tobacco have been quite successful in reducing tobacco use, especially among youth who are not yet addicted and who are more price-sensitive.
Specific taxes could also be levied to internalize negative externalities (sub-sidies for positive ones). To a degree a fuel tax can fill this function, as many externalities exist in transportation and fuel production. Historically, fuel tax has had different objectives, such as financing roads. The generalized carbon tax applied in British Columbia is a tax on the externality of carbon produc-tion and global warming. This tax is administered on consumption of energy. It is not a revenue source, as the objective is to change behaviour and achieve revenue neutrality so the revenues obtained are returned to the consumer in the form of income supplements. The relative price ration is biased against the free market outcome for carbon-generating activities and all other goods. The consumer chooses less carbon goods and more other goods as carbon goods become more expensive, while remaining roughly as well off from the income.
Specific sales taxes applied to some goods include:
a) Alcoholic beverages – Liquor gallonage taxes are a levy on the volume of alcoholic beverages produced. Liquor taxes also in-clude all forms of special levies, excise tax, excise duty or other taxes imposed on the production and sale of alcoholic bever-ages. If a general sales tax is also applied to alcoholic beverages, that revenue is considered general sales tax revenue. Similarly, customs duties on imported alcoholic beverages are classified as custom duties (federal). Because government-owned liquor boards operate as fiscal monopolies liquor profits are consid-ered a tax on alcohol. These profits were previously classified as government investment income.
The Alberta government under Premier Ed Stelmach recently rolled back the liquor markup. This rollback means that liquor markup rates will be reduced about 30% from the 2009 rates. This is a return to the markup rates that were established in 2002. 13
Figure 2-2 shows the liquor profits obtained in 2009 by each province. Alberta collected $184 per capita, above the mean of $136. However, Alberta was a high-consumption jurisdiction, so
13 See for rates: http://www.alsaweb.ca/Documentation/MarkupRatesSchedule_effective-9July2009.pdf

fixing what’s broken: fair and sustainable solutions to alberta’s revenue problems
21
it should be noted this measure is based not on consumption levels but revenue divided by population.
b) Tobacco taxes include special levies such as excise tax, excise duty and provincial specific taxes on the production and sale of tobacco products. General sales taxes and customs duties appli-cable to tobacco products are also included under their respec-tive headings. Tobacco taxes in Alberta since April 8, 2009 are: per-cigarette or tobacco stick: $.20; package of 25: $5.00; carton (8 packages): $40.00; loose tobacco per gram: $30; $60 per 200 grams; cigars: 103% of the ‘taxable price’ of the cigar ($.20 mini-mum, $6.27 maximum).
Figure 2-3 shows the per capita tax revenue obtained from alco-hol and tobacco for each province. Alberta at $228 is also above the provincial mean of $157.
c) Amusement tax includes charges on admissions to theatres, cinemas, recreational, cultural or other entertainment activi-ties. Taxes levied by provincial and territorial governments on pari-mutuel betting at horse race tracks and on casinos’ gam-ing activities are also included.
d) Fuel tax is usually a per-unit charge, including taxes on gaso-line, aviation, diesel, and on propane or other substances when used as motive fuel. Fuel taxes in Alberta since April 1, 2007 are per litre, including additives: aviation gas and jet fuel: $0.015; gasoline (all grades): $0.090: diesel (all grades): $0.090 14; ethanol and biodiesel: $0.090; liquid petroleum gas (LPG): $0.065 15; lo-comotive fuel tax is based on consumption in Alberta and pay-able by the railway: $0.015; bunker fuel, kerosene, methanol, condensate: $0.090, if used by a consumer to generate motive power with an internal combustion or turbine engine. There is no tax if the product is used for heating or other non-motive purposes. Natural gas is not taxed under the Fuel Tax Act.
Figure 2-4 shows that Alberta obtains only $197 per capita in gasoline and fuels tax revenue, compared to the average $275 per capita in all provinces combined. Alberta, the second low-est only to Manitoba, is the premier oil producing jurisdiction in Canada, and Albertans have expected—and PC governments have delivered—lower prices at the pumps. Interestingly, Sas-
14 There is no tax on marked gasoline and marked diesel sold in Alberta.
15 Every distributor of LPG currently pays this tax on LPG delivered into a dispensing system capable of being used to dispense LPG for motive use.

parkland institute | may 2011
22
katchewan—another oil producing province—is much higher than the provincial average at $413.
e) Gaming profits accounts for total remitted profits of govern-ment-owned lottery and other gaming corporations. Because government-owned lottery and other gaming corporations op-erate as fiscal monopolies, their profits are considered as taxes on products (indirect taxes). Those amounts were previously classified as investment income. Figure 2-5 shows that Alberta obtains $462 in gaming revenue per capita, compared to the av-erage $199. Alberta is criticized for being increasingly depen-dent on gaming profits; more than double the average, and with liquor revenues exceeding $2 billion a year. 16
f) Other consumption taxes include three sub-groups: an air transportation tax (which was discontinued on November 1, 1998) was the tax levied by the federal government on the price of air transportation purchased either in Canada or outside the country for the use of air transportation facilities in Canada; special taxes on meals and hotel accommodations; and mis-cellaneous consumption taxes imposed at the federal level on jewelry and watches, toilet preparations and an assortment of sundry items, and for revenue paid to the federal government from provincial lottery corporations. At the provincial level it includes the proceeds from special taxes on telecommunica-tions and advertising taxes, computer software, electricity, gas, coal, and fuel oil, and on other goods and services, as well as the Quebec tax on insurance premiums. Alberta, for example, has imposed since April 1 2005 a tourism levy of 4%.
Summary
Because Alberta does not impose a provincial (general) sales tax (PST), its rev-enues from consumption taxes are the lowest in the country. Figure 2-1 shows the respective per capita revenue for each province for total consumption taxes and levies in 2009. Alberta brings in $1092 per person, approximately one-half the average (mean) of $2150.
Alberta without a PST might be relatively lower in consumption taxes on the whole, but Alberta is significantly higher than the other provinces in the gaming revenue obtained, at $462 per person—more than double the aver-age of $199 (Figure 2-3); and tobacco and liquor taxes are also higher, at $228
16 Jason Fekete and Rinata D’Aliesio, “Booze, gambling revenues now worth more than gas royalties to Stelmach government”, The Calgary Herald, August 27, 2010.

fixing what’s broken: fair and sustainable solutions to alberta’s revenue problems
23
$0
$50
$100
$150
$200
$250
NFL PEI NS NB QU ON MB SK BC AB Mean
Per C
apita
Province
2 0 0 9 L i q u o r P r o fi t s
Statistics Canada series v207015
FIGURE 2-2
compared to $157 (Figure 2-3); Alberta is also above average in liquor profits, at $184 compared to $136 (Figure 2-2). With gasoline and motive fuel taxes, though, Alberta is second-lowest, receiving only about 70% of the average, at $197 compared to $275. If gasoline and other motive fuels were increased to the average Alberta could obtain an additional $287 million.

parkland institute | may 2011
24
FIGURE 2-3
FIGURE 2-4
$0
$50
$100
$150
$200
$250
$300
$350
$400
NFL PEI NS NB QU ON MB SK BC AB Mean
Per C
apita
Province
2 0 0 9 A l c o h o l i c B e v e r a g e s a n d T o b a c c o T a x e s
Statistics Canada series v207012
$0
$50
$100
$150
$200
$250
$300
$350
$400
$450
NFL PEI NS NB QU ON MB SK BC AB Mean
Per C
apita
Province
2 0 0 9 G a s o l i n e & M o t i v e F u e l s T a x e s
Statistics Canada series v207010

fixing what’s broken: fair and sustainable solutions to alberta’s revenue problems
25
$0
$50
$100
$150
$200
$250
$300
$350
$400
$450
$500
NFL PEI NS NB QU ON MB SK BC AB Mean
Per C
apita
Province
2 0 0 9 P r o v i n c i a l G a m i n g P r o � t s
Statistics Canada series v207016
FIGURE 2-5
2.3 An Alberta general sales tax?
This brings us to the question of implementing a general sales tax in Alberta. Alberta is the only jurisdiction in Canada (and most of the world) without a PST. Ironically, Alberta was the first province in Canada to implement a sales tax, on May 1 1936, only to abolish it in August 1937. Except for Alberta, the retail sales tax is an important portion of provincial revenue in Canada and has provided the provinces with considerable funds to provide the public ser-vices citizens expect, and which are constitutionally the responsibility of the provinces. Alberta has relied on natural resource revenues to fill this gap.
Table 2-1 shows the various sales taxes in Canadian jurisdictions. The PST ranges from a low of 5% in Saskatchewan (excepting Alberta at zero) to 10% (effective 10.5%). Figure 2-6 shows the per capita revenue provincial sales taxes bring in to each province. The average (mean) per capita revenue from PST is $1277, with New Brunswick at the top at $1412 per capita. If Alberta obtained the average (mean) sales tax revenue per capita it would have amounted to approximately $4.7 billion in 2009. As the analysis shows, this is achievable with a relatively low rate of 5%.

parkland institute | may 2011
26
The actual amount of revenue that a sales tax would bring in depends on the tax base, the tax rate, and the income and expenditures of the population, among other factors. The tax base includes the goods and services to which the tax applies. That is all goods and services minus the exempt categories (see Appendix 1). These differ among provinces but are brought into line with the GST when HST agreements are enacted. The responsiveness of demand for goods and services in the tax base also matters. In the extreme, if consumers significantly reduce consumption of a good after the tax is imposed the tax will bring in little revenue.
The income of the population is extremely important, as income levels deter-mine consumption levels. Table 2-1 includes the ratio of income to population. This ratio is normalized at 1.0 for all of Canada. Newfoundland and Labrador, for example, is at 0.77, meaning that citizens of Newfoundland and Labrador have on average only 77% of the national average income. Alberta is at 1.27, showing that Albertans have 27% more income per capita than the national average. This high income has correlated high expenditures. Therefore, if Al-berta were to implement a general sales tax, the PST tax rate for Alberta could be significantly lower than any other jurisdiction and still bring in the average Canadian per capita revenue.

fixing what’s broken: fair and sustainable solutions to alberta’s revenue problems
27
TABLE 2.1
S a l e s T a x R a t e s 2 0 1 0
Type Provincial rate
Combined rate
Ratio Income/Pop Notes
Canada GST 5.0% Decreased from 7% in two (1%) stages
Newfoundland and Labrador
HST 8.0% 13.0% 0.77
Prince Edward Island
GST + PST
10.0% 15.0% 0.78 Provincial rate is nominally 10%, but is also applied to federal 5% GST. Effective provincial rate is 10.5%.
Nova Scotia HST 10.0% 15.0% 0.85 New Brunswick
HST 8.0% 13.0% 0.79
Quebec GST + QST
7.5% 12.5% 0.88 Provincial rate is nominally 7.5%, but is also applied to federal 5% GST. Effective provincial rate is 7.875%. Rate will increase to 8.5% on January 1, 2011, and to 9.5% on January 1, 2012
Ontario HST 8.0% 13.0% 1.06 Since July 1st, 2010 Manitoba GST +
PST 7.0% 12.0% 0.87
Saskatchewan GST + PST
5.0% 10.0% 0.91 Reduced from 7% on 28 October 2006. There is a separate 10% liquor consumption tax. The non-alcoholic portion of a restaurant meal is not taxed.
Alberta GST 0.0% 5.0% 1.27 British Columbia HST 7.0% 12.0% 0.99 Since July 1st, 2010

parkland institute | may 2011
28
$0
$200
$400
$600
$800
$1,000
$1,200
$1,400
$1,600
NFL PEI NS NB QU ON MB SK BC AB Mean
Per C
apita
Province
2 0 0 9 S a l e s T a x ( P S T )
Statistics Canada Table
0.00%
0.10%
0.20%
0.30%
0.40%
0.50%
0.60%
0.70%
0.80%
0.90%
NFL PEI NS NB QU ON MN SK BC AB Cdn
2 0 0 9 P r o v i n c i a l S a l e s T a x : p e r c e n t o f G D P ; a n d p e r c e n t o f P e r s o n a l
E x p e n d i t u r e ; r e l a l i z e d p e r p e r c e n t o f t a x
Tax/GDP/PST%
Tax/PE/PST%
Wei
ghte
d m
eans
FIGURE 2-7
FIGURE 2-6
fixing what’s broken: fair and sustainable solutions to alberta’s revenue problems
29
Calculating the actual revenue for Alberta from a PST
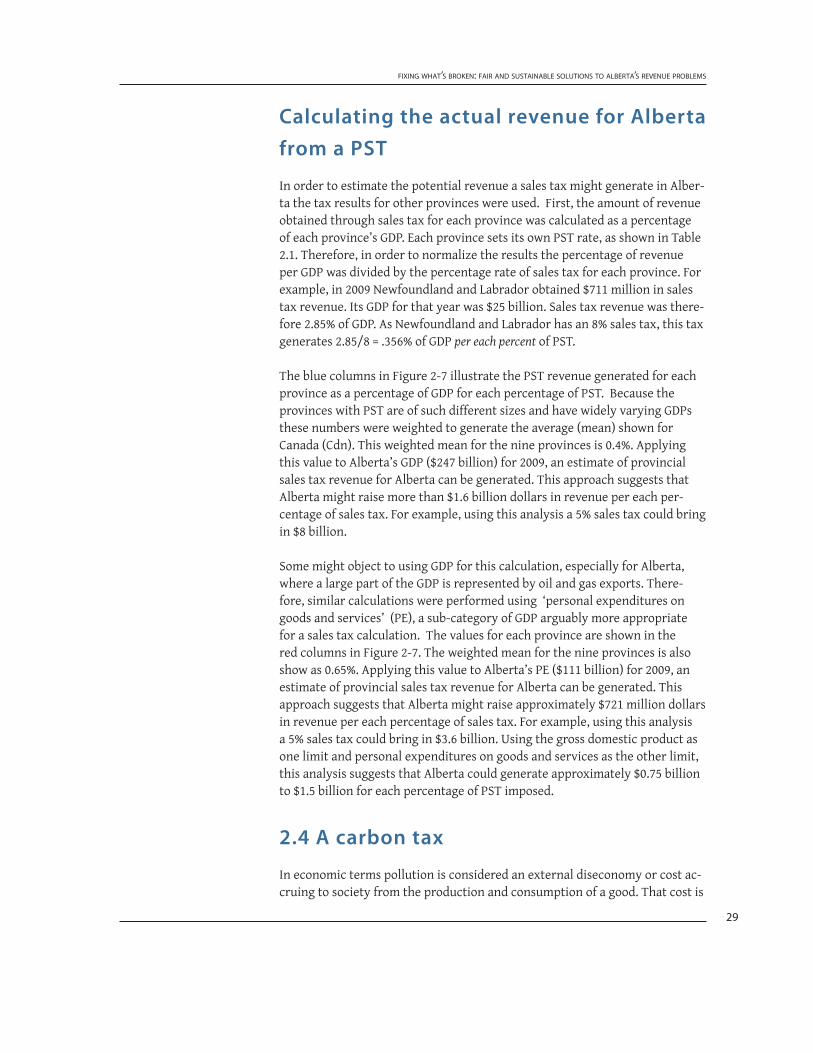
In order to estimate the potential revenue a sales tax might generate in Alber-ta the tax results for other provinces were used. First, the amount of revenue obtained through sales tax for each province was calculated as a percentage of each province’s GDP. Each province sets its own PST rate, as shown in Table 2.1. Therefore, in order to normalize the results the percentage of revenue per GDP was divided by the percentage rate of sales tax for each province. For example, in 2009 Newfoundland and Labrador obtained $711 million in sales tax revenue. Its GDP for that year was $25 billion. Sales tax revenue was there-fore 2.85% of GDP. As Newfoundland and Labrador has an 8% sales tax, this tax generates 2.85/8 = .356% of GDP per each percent of PST.
The blue columns in Figure 2-7 illustrate the PST revenue generated for each province as a percentage of GDP for each percentage of PST. Because the provinces with PST are of such different sizes and have widely varying GDPs these numbers were weighted to generate the average (mean) shown for Canada (Cdn). This weighted mean for the nine provinces is 0.4%. Applying this value to Alberta’s GDP ($247 billion) for 2009, an estimate of provincial sales tax revenue for Alberta can be generated. This approach suggests that Alberta might raise more than $1.6 billion dollars in revenue per each per-centage of sales tax. For example, using this analysis a 5% sales tax could bring in $8 billion.
Some might object to using GDP for this calculation, especially for Alberta, where a large part of the GDP is represented by oil and gas exports. There-fore, similar calculations were performed using ‘personal expenditures on goods and services’ (PE), a sub-category of GDP arguably more appropriate for a sales tax calculation. The values for each province are shown in the red columns in Figure 2-7. The weighted mean for the nine provinces is also show as 0.65%. Applying this value to Alberta’s PE ($111 billion) for 2009, an estimate of provincial sales tax revenue for Alberta can be generated. This approach suggests that Alberta might raise approximately $721 million dollars in revenue per each percentage of sales tax. For example, using this analysis a 5% sales tax could bring in $3.6 billion. Using the gross domestic product as one limit and personal expenditures on goods and services as the other limit, this analysis suggests that Alberta could generate approximately $0.75 billion to $1.5 billion for each percentage of PST imposed.
2.4 A carbon tax
In economic terms pollution is considered an external diseconomy or cost ac-cruing to society from the production and consumption of a good. That cost is

parkland institute | may 2011
30
often not included in (is external to) the direct cost individuals pay in the mar-ket exchange of a good. The burning or consumption of carbon-based energy sources generates a cost on the environment and people that is not part of the cost calculus of the producer (firm) or the consumer, as it is ‘external’ to these agents. It is generally accepted that carbon dioxide emissions are a serious fac-tor in global warming, as well as a local pollutant. A carbon tax is a general fee for carbon content of fuels like coal, oil, and gas. The fee is meant to compen-sate for emissions produced from their use. This is effectively a consumption tax on the carbon dioxide emissions from burning fossil fuels. Thus, ‘carbon tax’ is shorthand for carbon dioxide tax or a CO2 price. 17
A carbon tax, fee, or levy is meant to internalize the external costs of car-bon dioxide emissions. In economic terminology this type of levy is called a Pigouvian tax. The theory of Pigouvian taxes suggests that they be used to correct the inherent market failure, but not be used to generate net revenue or change the general wellbeing of the agents—only reduce their production and use of carbon-based energy. A carbon tax, therefore, should (according to this approach) be revenue neutral. That is, little, if any, of the tax revenues raised by taxing carbon emissions should be retained by government. Revenues obtained should be returned to the agents so that their behaviour—use or pro-duction of pollutants—is decreased, but that the agents do not become worse off financially or in real income due to the imposition of these fees. Revenues would be returned to the public, including through subsidises to mitigate the otherwise negative impacts of carbon taxes on low-income energy users.
Recently, it has become acceptable to apply carbon tax revenues to ‘green’ en-ergy projects, research, or transportation. It should be recognized that use of Pigouvian tax revenue to subsidize other goods could be double barrelled. As-suming the carbon tax internalizes the external costs of CO2 pollution, making other energy and energy-efficient products (such as public transit) relatively cheaper, it would thereby correct the market failure. The application of these funds to other goods could only be justified by some additional market failure in these green goods, for example, external benefits not yet considered.
Since the 1990s many countries in Europe have had considerable experience with various forms of levies on carbon use. This experience should be studied in any process of designing a carbon tax for Alberta, as Canada’s experience has been spotty. In July 2007 Alberta introduced a carbon tax (or alternatives action) on companies that emit more than 100,000 tonnes of CO2 annually.
17 http://www.carbontax.org/introduction/#why

fixing what’s broken: fair and sustainable solutions to alberta’s revenue problems
31
These companies have these choices: 18
• pay $15 per tonne of excess carbon dioxide equivalent (‘Ordinary Payments’) into the Climate Change and Emissions Management Fund (the ‘Fund’);
• purchase ‘Emissions Performance Credits’ from facilities that have re-duced their emissions intensity below required targets; or
• purchase ‘Emissions Offsets’, being carbon dioxide equivalent reduc-tions generated from Alberta-based projects not subject to reduction obligations under the Specified Gas Emitters Regulation.
The legislation intends to give companies a financial incentive to lower emis-sions while fostering technology to reduce emissions. This is a very limited approach to the problem: the fee is much too small to offset the external cost of emissions; Alberta has the highest CO2 gas emissions in Canada but only the largest firms are affected, a serious limitation when the large number of small energy producers are exempt; and the tax does not directly affect consump-tion of energy, especially given that Alberta has the lowest fuel and energy taxes. The Liberal Party under then-leader Stéphane Dion proposed a revenue-neu-tral carbon tax (offset by tax cuts for individuals) in the 2008 Canadian federal election. This proposal, known as the Green Shift, became a contentious issue and proved to be unpopular and contributed to the defeat of Liberal Party. The Alberta government was opposed to a nationwide carbon tax, as it would cause Alberta’s economy to bear the costs proportionately more compared to other provinces. Alberta’s (minimal) carbon tax allows the revenue to stay in Alberta.
British Columbia has the most comprehensive carbon tax. Implemented on July 1, 2008, the carbon tax was initially $10 per tonne of CO2
equivalent emis-sions (for example, 2.41 cents per litre on gasoline). CO2
equivalent emissions are determined for all energy types. The tax has been increased each year and will in 2012 reach a final price of $30 per tonne (7.2 cents per litre of gasoline). The BC carbon tax attempts to be revenue neutral, achieved through reduced corporate and income taxes. The BC government also sent out carbon tax rebate cheques before the tax actually went into effect to all residents.
The BC carbon tax is based on consumption and is therefore administered the same way as any consumption tax (like the motive fuel tax). It is payable at the time of retail purchase or use of fossil fuels. All individuals (including visitors to BC) and businesses which purchase or use fossil fuel in the province
18 Alberta Finance and Enterprise, Tax and Revenue Administration, Alberta Corporate Tax Act Special Notice: Income Tax Treatment of Payments under the Climate Change and Emissions Management Act and Regulations November 16, 2007.

parkland institute | may 2011
32
will pay the carbon tax. 19
British Columbia introduced the first tax of this kind in North America. It appears to be working as it should. As initially feared that a carbon fee would hurt the BC economy and be an unfair burden for low-income families. How-ever, these fears have not materialized, as the implementation in BC of the tax is tied to reductions in personal and corporate income taxes and tax credits for low-income individuals.
“Models estimate the tax will cut the province’s emissions by 5%, but 2009 carbon emissions data has not been released yet; so, these figures have yet to be verified. These positive results have led to glowing recommendations from economic gurus. Harvard professor Michael Porter, a world-renowned leader in competitiveness, recently said, ‘The right policy regime is a carbon tax, and the province of British Columbia has pretty much got it right.’” 20
This discussion only introduces the concept of a carbon tax. A major study on the theory, practice, and implementation of a carbon tax in Alberta is beyond this report but needs to be done. However, as a major energy producer Alberta should be a leader in carbon tax policy. Unfortunately, it is not! Although the implementation of a carbon tax may not be a revenue generator, it should nonetheless be implemented in Alberta.
section 3: income taxes
Income tax assessments and revenue are based on the taxable income of individuals and businesses. Personal income tax is assessed on the income of individuals and unincorporated businesses. This includes special levies on income, such as a surtax that governments charge from time to time. The proceeds from income tax on capital gains of individuals and unincorporated businesses are included here. Refundable personal income tax credits are also in this category. Corporation income tax includes taxes on taxable profits of corporations and special taxes occasionally levied on profits of corporations. Mining and logging taxes are specific taxes sometimes levied on profits of natural resource-based industries. Also included are refundable tax credits that are grossed up as revenue and expenditures. These taxes were previously classified as natural resource revenue. ‘Other’ includes income taxes which cannot be allocated to any of the other categories.
19 This includes producers who use their own fuel in the course of their operations. For example, coal, oil and gas producers.
20 Ottawa Citizen, “B.C.’s Carbon Tax May Be A Model System for the World”, July 28, 2010

fixing what’s broken: fair and sustainable solutions to alberta’s revenue problems
33
In 2009 Alberta raised $12.44 billion in income tax revenue. This amounted to only 34% of own-source revenue and 31% to total revenue for the year. Personal income tax was $8.67 billion while corporate income tax revenue was $3.77 billion. In terms of gross provincial product (GDP) 2008 data, these tax revenues constitute a total of 4.47% of GDP; personal income tax was 2.86% of GDP; and corporate income tax was a mere 1.61% of GDP, this in a year with the highest income tax revenue ever achieved in the province. Figure 3-1 shows income tax revenue as a percentage of GDP over time.
Alberta has no revenue from mining and logging taxes levied on profits of natural resource-based industries. Figure 3-2 shows the different amounts per capita this tax brings in for each province.
FIGURE 3-1
0.0%
0.5%
1.0%
1.5%
2.0%
2.5%
3.0%
3.5%
4.0%
4.5%
Year
A l b e r t a I n c o m e T a x a s P e r c e n t a g e o f G D P
Personal Income Tax Revenue
Corporate Income Tax Revenue

parkland institute | may 2011
34
3.1 Corporate income tax
Federal rates 21
Effective January 1, 2010 the federal corporate income tax rate went from 19% (2009 corporate income tax rate) to 18%. Yearly tax reductions will see the cor-porate income tax rate fall to 15% as of January 1, 2012 (16.5% effective January 1, 2011; 15% effective January 1, 2012).
For Canadian-controlled private corporations claiming the small business de-duction, the net tax rate is 11% effective January 1, 2008 (12% before January 1, 2008; as well the corporate surtax went to zero, effective January 1, 2008).
For the other corporations, the net tax rate decrease schedule is: • 21% before January 1, 2008; 19.5% effective January 1, 2008• 19% effective January 1, 2009
21 Canada Revenue Agency, T2 Corporation – Income Tax Guide 2009 http://www.cra-arc. gc.ca/E/pub/tg/t4012/t4012-09e.pdf
FIGURE 3-2
$0
$200
$400
$600
$800
$1,000
$1,200
NFL PEI NS NB QU ON MB SK BC AB
Per C
apita
Province
2 0 0 9 M i n i n g & L o g g i n g T a x
Statistics Canada series v207007

fixing what’s broken: fair and sustainable solutions to alberta’s revenue problems
35
• 18% effective January 1, 2010• 16.5% effective January 1, 2011• 15% effective January 1, 2012
These corporate income tax reductions, says the Department of Finance Canada, will give Canadian corporations the lowest tax rate on new business investment in the Group of Seven (G7) by 2011 and the lowest statutory tax rate in the G7 by 2012. 22
In addition to the federal corporate tax the provinces and territories have two rates of income tax, the lower provincial income tax rate applies to either the income eligible for the federal small business deduction or the income based on limits established by the particular province or territory. The higher provincial income tax rate applies to all other taxable income. Although it varies by year and jurisdiction, generally, the amount eligible for the lower rate is $500,000. Table 3-1 shows the corporate tax rates for the provinces and territories of Canada. Alberta, at 10%, is the lowest of all, and lower than all of the provinces by a minimum of 2% (BC) and up to 6 `% lower than Nova Scotia and New Brunswick. 23
22 KPMG has Canada second only to Mexico for lowest corporate taxes already in 2008 KMPG’s Guide to International Business Location, “Competitive Alternatives Special Report: Focus on Tax”.
23 Corporate Tax Rates for Canadian Provinces & Territories in effect on January 1, 2010, many will change during 2010. For example, December 1, 2010,. Manitoba lowered its small business tax to zero. BC will match this in 2012. Other provinces will likely follow.

parkland institute | may 2011
36
Alberta government budget 2011, tax plan. The above information provided by Canada Revenue Agency.
‘Competitive’ corporate taxes 24
The evolution from 2005 on of Alberta’s combined federal and provincial cor-porate tax schedule is shown in Table 3-2.
The Alberta government boasts that it has one of the most competitive tax environments in North America. It is the only province that does not have a provincial retail sales tax and there are no provincial capital or payroll taxes, which are common in many other provinces and U.S. states.
The combined federal/provincial corporate income tax rate currently at 28% has fallen from 33.62% in 2005 and is set to decline to 25% by 2012 for general businesses with income in excess of $500,000. Small business tax at 14% has
24 http://www.albertacanada.com/about-alberta/competitive-corporate-taxes.html
TABLE 3.1
C o r p o r a t e I n c o m e T a x R a t e s
Province or territory Lower rate Higher rate
Newfoundland and Labrador 5.0% 14.0%
Nova Scotia 5.0% 16.0%
Prince Edward Island 4.3% 16.0%
New Brunswick 5.0% 11.0%
Ontario 5.5% 12.0%
Quebec 11.9%
Manitoba 2.0% 12.0%
Saskatchewan 4.5% 12.0%
Alberta 3.0% 10.0%
British Columbia 4.5% 10.5%
Yukon 4.0% 15.0%
Northwest Territories 4.0% 11.5%
Nunavut 4.0% 12.0%

fixing what’s broken: fair and sustainable solutions to alberta’s revenue problems
37
also declined from tax rates in the 30% range. This idea of ‘competitive’ corporate taxation appears to have caught on across Canada. Each jurisdiction is attempting to outdo its neighbours in order to attract portable capital investment. This is a competition no jurisdiction can win as corporate tax spirals down everywhere.
The consequences of this is to leave government revenues diminished. Foreign
TABLE 3.2
2 0 0 5 – 2 0 1 2 F e d e r a l a n d A l b e r t a C o m b i n e d C o r p o r a t e T a x R a t e s
2012 2011 2010 2009 2008 2007 2006 2005 First $300,000 of CCPC’s ABI
14.00% 14.00% 14.00% 14.00% 14.00% 16.12% 16.12% 16.12%
CCPC’s ABI - $300K - $400K
14.00% 14.00% 14.00% 14.00% 14.00% 16.12% 25.12% 25.12%
CCPS’s ABI - $400K - $430K
14.00% 14.00% 14.00% 14.00% 22.50% 25.12% 32.12% 33.62%
CCPC’s ABI - $430K - $460K
14.00% 14.00% 14.00% 14.00% 22.50% 32.12% 32.12% 33.62%
CCPC’s ABI - $460K - $500K
14.00% 14.00% 14.00% 14.00% 29.50% 32.12% 32.12% 33.62%
CCPS’s ABI in excess of $500K
25.00% 26.50% 28.00% 29.00% 29.50% 32.12% 32.12% 33.62%
Investment Income
44.67% 44.67% 44.67% 44.67% 44.67% 45.79% 45.79% 47.29%
CCPC – Canadian Controlled Private Corporation; ABI – Active Business Income
Notes:
a. The business limit is reduced where taxable capital of the preceding year exceeds $10 million or if taxable capital of the current year exceeds $10 million and the corporation is associated with more fewer or different corporations in the current year than in the preceding year.
b. Some of the above rates are legislated and some are proposed.
c. Proposed changes to the Alberta corporate income tax rates are effective April 1 of the respective year. The above table shows the corporate income tax rates on a calendar year basis. The calculation of the above corporate income tax rates is based on the changes to the Alberta corporate income tax rates and the changes to the Alberta small business limit brackets being effective January 1 instead of April 1.
d. The highest corporate tax rate on ABI for a particular taxation year is the corporate tax rate applicable to most public companies for that particular taxation year.

parkland institute | may 2011
38
corporations do not even benefit, as they pay the difference in local taxes to their own government. For example, American corporations working in Canada will receive a tax credit for taxes paid (25%) in Canada but will pay rates of 35% at home. This constitutes a transfer of wealth from Canada to the US government with any of the corporate, shareholder, and consumer advan-tages touted of lower corporate taxes. 25
A second issue is healthcare costs. In the United States any firm of reasonable size has to provide medical insurance to its employees. This is an extra cost to the firms above what Canadian firms have to contribute. In Canada health care costs are an increasing proportion of provincial budgets at the same time these provinces are reducing corporate taxes. Corporate taxes should be levied with this discrepancy in mind. Corporations operating in Canada are getting the financial benefit of publically provided health care without carrying their share of the costs.
A third reason for corporate income tax is to capture economic rent from the use of public resources that may have slipped through any rent capture scheme. This is a shotgun second chance approach to capturing rent as it affects all corporations similarly. It would likely be better to concentrate on capturing rent appropriately in the first place.
There are also problems with differential rates of tax on ‘small’ and ‘large’ corporations. This kind of or progressivity leads to tax avoidance behaviour at the expense of tax revenue and efficiency. 26 Firms have an incentive to remain small or break up into smaller entities. Individuals have an incentive to be-come corporations in order to avoid personal tax.
And finally it needs to be noted that the above tables showing tax rates show the statutory tax rates. Studies of effective tax rates show that what compa-nies actually pay in tax is considerably lower. For example, a recent National Bureau of Economic Research paper finds Canada’s corporate tax rate to be 7% for domestic firms and 21% for multinational firms, when the statutory rate was about36%. 27
3.2 Personal Income Tax
Table 3-3 shows the various tax rates for each province and territory for 2009. Alberta is the only jurisdiction with a single (flat) tax regime. Other prov-
25 Erin Weir, “The Treasury Transfer Effect, Are Canada’s corporate tax cuts shifting billions to the U.S. Treasury?”, Canadian Centre for Policy Alternatives, 2009.
26 Jack Mintz, “Why the small business tax must stay”, Financial Post, August 19, 2009.
27 Kevin S. Markle, and Douglas A. Shackelford, Cross-country Comparisons of Corporate Income Taxes, Working Paper 16839, National Bureau of Economic Research, Cambridge, MA, Febru-ary 2011 , http://www.nber.org/papers/w16839.

fixing what’s broken: fair and sustainable solutions to alberta’s revenue problems
39
inces have from three to five tax brackets ranging from a low of 4% to a high of 17.5% (24% if we include Quebec). Alberta has by far the highest exempt income from personal income at $16,161 with an equal spousal exemption. 28
28 Kevin Milligan, “Corporations don’t walk or talk - and don’t pay taxes”, Globe and Mail, April 28, 2011.
TABLE 3.3
P r o v i n c i a l / T e r r i t o r i a l P e r s o n a l I n c o m e T a x r a t e s f o r 2 0 0 9
Under the current tax on income method, tax for all provinces (except Quebec) and territories is calculated the same way as federal tax.
Provinces / Territories Rate(s) Personal Exemption Newfoundland and Labrador 7.7% on the first $31,061 of
taxable income, + $7,566
12.8% on the next $31,060, +
15.5% on the amount over $62,121
Prince Edward Island 9.8% on the first $31,984 of taxable income, +
$7,708
13.8% on the next $31,985, +
16.7% on the amount over $63,969
Nova Scotia 8.79% on the first $29,590 of taxable income, +
$7,731
14.95% on the next $29,590, +
16.67% on the next $33,820 +
17.5% on the amount over $93,000
New Brunswick 9.65% on the first $35,707 of taxable income, +
$8,395
14.5% on the next $35,708, +
16% on the next $44,690, +
17% on the amount over $116,105
Quebec 16% on the first $38,570 of taxable income, +
$10,505 + very many extra deductions
20% on the next $38,570, +
24% on the amount over $77,140
Ontario 6.05% on the first $36,848 of taxable income, +
$8,681
9.15% on the next $36,850, +
11.16% on the amount over $73,698
Manitoba 10.8% on the first $31,000 of taxable income, +
$8,034.00
12.75% on the next $36,000, +
17.4% on the amount over $67,000
Saskatchewan 11% on the first $40,113 of taxable income, +
$12,945
13% on the next $74,497, +
15% on the amount over $114,610
Alberta 10% of taxable income $16,161
British Columbia 5.06% on the first $35,716 of taxable income, +
$9,189
7.7% on the next $35,717, +
10.5% on the next $10,581, + 12.29% on the next $17,574, +
14.7% on the amount over $99,588
Yukon 7.04% on the first $38,832 of taxable income, +
$9,600
9.68% on the next $38,832, + 11.44% on the next $48,600, +
12.76% on the amount over $126,264
Northwest Territories 5.9% on the first $36,885 of taxable income, +
$12,355
8.6% on the next $36,887, +
12.2% on the next $46,164, +
14.05% on the amount over $119,936
Nunavut 4% on the first $38,832 of taxable income, +
$11,360
7% on the next $38,832, +
9% on the next $48,600, +
11.5% on the amount over $126,264

parkland institute | may 2011
40
P r o v i n c i a l / T e r r i t o r i a l P e r s o n a l I n c o m e T a x r a t e s f o r 2 0 0 9
Under the current tax on income method, tax for all provinces (except Quebec) and territories is calculated the same way as federal tax.
Provinces / Territories Rate(s) Personal Exemption Newfoundland and Labrador 7.7% on the first $31,061 of
taxable income, + $7,566
12.8% on the next $31,060, +
15.5% on the amount over $62,121
Prince Edward Island 9.8% on the first $31,984 of taxable income, +
$7,708
13.8% on the next $31,985, +
16.7% on the amount over $63,969
Nova Scotia 8.79% on the first $29,590 of taxable income, +
$7,731
14.95% on the next $29,590, +
16.67% on the next $33,820 +
17.5% on the amount over $93,000
New Brunswick 9.65% on the first $35,707 of taxable income, +
$8,395
14.5% on the next $35,708, +
16% on the next $44,690, +
17% on the amount over $116,105
Quebec 16% on the first $38,570 of taxable income, +
$10,505 + very many extra deductions
20% on the next $38,570, +
24% on the amount over $77,140
Ontario 6.05% on the first $36,848 of taxable income, +
$8,681
9.15% on the next $36,850, +
11.16% on the amount over $73,698
Manitoba 10.8% on the first $31,000 of taxable income, +
$8,034.00
12.75% on the next $36,000, +
17.4% on the amount over $67,000
Saskatchewan 11% on the first $40,113 of taxable income, +
$12,945
13% on the next $74,497, +
15% on the amount over $114,610
Alberta 10% of taxable income $16,161
British Columbia 5.06% on the first $35,716 of taxable income, +
$9,189
7.7% on the next $35,717, +
10.5% on the next $10,581, + 12.29% on the next $17,574, +
14.7% on the amount over $99,588
Yukon 7.04% on the first $38,832 of taxable income, +
$9,600
9.68% on the next $38,832, + 11.44% on the next $48,600, +
12.76% on the amount over $126,264
Northwest Territories 5.9% on the first $36,885 of taxable income, +
$12,355
8.6% on the next $36,887, +
12.2% on the next $46,164, +
14.05% on the amount over $119,936
Nunavut 4% on the first $38,832 of taxable income, +
$11,360
7% on the next $38,832, +
9% on the next $48,600, +
11.5% on the amount over $126,264

fixing what’s broken: fair and sustainable solutions to alberta’s revenue problems
41
The Alberta finance minister in 1999, Stockwell Day, proposed a radical tax change he called ‘A New Tax Plan for Albertans.’ This plan introduced the controversial ‘flat’ income tax which has reduced income taxes by billions of dollars over the last decade. Most of these tax savings have gone to those in higher income brackets as the progressivity of the tax system was diminished extensively.
A tax can be proportional, regressive, or progressive. A tax where the average tax rate increases with income is progressive; and a tax rate where the aver-age tax rate falls as income increases is regressive; and if the average tax rate remains the same over all income levels the tax is proportional. This new con-stant tax rate was still progressive—ever so slightly—because of the zero-rated or exempt portion of income. The exempt income was raised significantly along with the new tax regime, thereby assisting very low income earners. As well, spousal exemptions were made equal, thereby raising considerably the non-taxable portion of a family’s income.
Day gave many reasons for these tax changes: taxes reduce economic growth and thereby reduce government revenues necessary to fund public services; business and people will move to low-tax jurisdictions; individuals should be able to make their own choices on their own priorities; people should be encouraged to work and invest; Alberta would have the lowest taxes in Canada (and the United States!); the taxation process would be simplified and fairer.
The tradition in the economics discipline extending at least as far back as Adam Smith’s Wealth of Nations (1776) has emphasized progressive taxation. From this point of view the tax burden should fall on those most able to pay. An individual’s income depends not only on their own efforts but the social circumstances they find themselves in, as well as outright luck at birth. Those with the greatest ability to pay—high-income earners—realize the largest benefits from the economic system, both economic and political. Therefore, it is expected that they would contribute to the public revenue needs more than proportionally to their income. The more free markets direct the economy the larger the personal rewards individuals can obtain by exploiting their abili-ties, resources, and good luck. Progressive taxes are a reasonable price to pay for the most successful who depend that much more on the society that nur-tures their gains. This new tax approved for the 2000 taxation year severely undermined the fairness of the personal income tax system and significantly reduced tax revenue from income, especially from very high income earners. The first step in any tax reform should correct this tax perversion.
Alberta boasts the lowest taxes in Canada, but although Alberta has a high exempt income from personal income ($16,161) and a constant rate—10% on

parkland institute | may 2011
42
taxable income—it does not have the lowest tax rate for low-income individu-als.
Figure 3-3 shows the effective average tax schedules for all of the provinces from gross incomes of $20,000 or more. Compared to Alberta, Ontario has lower average income tax for all incomes below $250,000. In British Columbia average taxes are less than Alberta for incomes below $150,000, and New-foundland and Labrador has lower taxes on those earning less than approxi-mately $65,000. Nova Scotia is lower up to $45,000, and Saskatchewan is lower up to $50,000. The other provinces are slightly higher up to $50,000, but all provinces except Alberta increase significantly as income increases. This is because all other provinces have a progressive—increasing—tax rates as in-come increases, whereas Alberta’s constant 10% tax rate makes the average tax curve flatten out.
FIGURE 3-3
2%
4%
6%
8%
10%
12%
14%
16%
18%
20%
22%
$20,000 $35,000 $50,000 $65,000 $80,000 $100,000 $150,000 $300,000
Perc
ent
Income
A v e r a g e T a x R a t e a t V a r i o u s I n c o m e L e v e l s 2 0 0 9
NL PEI NS NB ON MN SK AB BC QU

fixing what’s broken: fair and sustainable solutions to alberta’s revenue problems
43
3.3 Analysis of Alberta’s income tax
Table 3-4 shows the number of individuals by income class in Alberta for the year 2006. Then three tax regimes are compared:
The constant tax rate system where the marginal tax in constant at 10%.
Then the tax rates extant in 1999 are applied to the same taxable income (with the 2006 income exemption). The 1999 tax regime had a marginal tax rate (MT) staring at 7.48%, rising to 11.44% and then maxing out at 12.76%.
Lastly, a continuously progressive tax system is applied. This tax system is of the form MT = aYb, where MT is the marginal tax rate at income (Y), a and b are constant parameters that can be easily changed through policy. 29 Param-eter a will affect the marginal rate for the first ranges of taxable income while parameter b will affect the size of the marginal tax rate and how quickly it will rise. The table, as an example uses the values: a = 0.05 and b = 0.07. This rendition creates a MT starting at 8.6% and rising to 12.3% at the $300,000 medium income level. The MT would continue to rise to 15% for someone earning $10,000,000.
In each case the taxes paid will equal the sum of the marginal tax rates times the number of individuals with each taxable income range.
The table goes on to show the estimate of the revenue from each potential tax system. The constant marginal tax rate of 10% would generate $8 billion. The 1999 tax regime would generate $9 billion or approximately $1 billion more than the flat 10% tax. The continuous tax function MT = .05Y.07 would generate over ~$0.75 billion additional revenue.
What is particularly important about this function (or returning to the 1999 tax regime) is the shifting of the tax burden to higher incomes. This is illus-trated by observing the difference in tax revenue obtained from each income class. Note that anyone earning less than $25,000 taxable income ($40,000 gross income) would have a reduced tax bill. This is not as beneficial to lower-income groups as a return to 1999 tax rates would present where anyone having a taxable income less than $35,000 ($50,000 gross income) would have a reduction in taxes.
In order to reform the Alberta tax system we could return to a progressive multi-tax bracket system, for example a three-tier system such as BC or a five-tier system such as Ontario. Alternative methods to increase the progres-sivity and shift the tax burden have been suggested. Tony Clark, for example,
29 Taxes would be equal to the integral of the MT function, i.e. T = a/(b-1)Yb-1

parkland institute | may 2011
44
provides an excellent detailed analysis of the Alberta tax regime modeling different surtax scenarios. 30 Clark recommends keeping the 10% constant rate tax and imposing surtaxes on higher incomes. This approach has some advan-tages, most notably that Alberta has used surtaxes in the past.
However, the nature of the tax function MT = aYb, in addition to being continu-ously progressive throughout the income range, allows for small changes in a and b in order to fine tune the tax system to any progressivity desired. It is a most simple system for those calling for simplicity in taxes, as Stockwell Day did. Simplicity does not preclude progressivity.
The simplicity argument for taxes entails much more than tax rates though. What must really be tackled in order to simplify taxes would be either to change the federal definition of taxable income or a change to a simple inde-pendent tax base for Alberta. A revision (and simplification) of the tax base calls for an elimination of all of the deductions, tax credits, tax expenditures, special determinations for dividend and capital gains income, and etc. found in the federal determination of taxable income. The purpose of the tax system is to provide funding for government programs. Fairness in achieving this should be the next main objective of the taxation system. The existing system of determining taxable income (federal) is far too complicated and inefficient. Lower income earners pay more than their fair share while the wealthy avoid taxes through various loopholes. This criticism is not new. For example, the landmark six-volume Carter Commission report 31 called for a streamlined tax base where the clarion call “a buck is a buck” proposed taxing all earned in-come equally, regardless of how it is earned (or that “the same tax be levied on increases in economic power of the same amount however acquired”). Unfor-tunately, this report and others did not make it through the political mine-fields of special interests and tax manipulation for diverse public policy goals.
30 Tony Clark, “Alberta Income Tax Modelling”, August 2010.
31 Kenneth Carter, Royal Commission on Taxation, Government of Canada, 1966.

fixing what’s broken: fair and sustainable solutions to alberta’s revenue problems
45
TABLE 3.4
A l b e r t a T o t a l T a x F i l e r s
Gross Income
<$5K $5K+ $10K+ $15K+ $20K+ $25K+ $35K+
Midpoint $2,500 $7,500 $12,500 $17,500 $22,500 $30,000 $42,500
Taxable (-$15,000)
-$12,500 -$7,500 -$2,500 $2,500 $7,500 $15,000 $27,500
Population 214,650 2,307,980 2,121,960 1,903,580 1,670,820 1,474,130 1,148,230
Difference 214,650 186,020 218,380 232,760 196,690 325,900 395,170
Tax
10% 0 0 $58,190,000 $147,517,500 $488,850,000 $1,086,717,500
1999 MT .0748 .0748 .0748 .1144
0 0 $43,526,120 $110,343,090 $365,659,800 $812,864,690
Difference -$14,663,880 -$37,174,410 -$123,190,200 -$273,852,810
Marginal Tax Rate
aY^b 0.086 0.093 0.098 0.102
Tax a=.05 $50,312,299 $137,742,460 $479,150,573 $1,111,322,107
Difference b=.07 -$7,877,701 -$9,775,040 -$9,699,427 $24,604,607
Gross Income
$50K+ $75K+ $100K+ $150K+ $200K+
Midpoint $62,500 $82,500 $125,000 $175,000 $225,000
Taxable (-$15,000)
$47,500 $67,500 $110,000 $160,000 $210,000
Population 753,060 374,610 190,990 74,280 41,880
Difference 378,450 183,620 116,710 32,400 13,300
Tax
10% $1,797,637,500 $1,239,435,000 $1,283,810,000 $518,400,000 $279,300,000
1999 MT .1144 .1276 .1276 .1276 .1276
$2,056,497,300 $1,581,519,060 $1,638,141,560 $661,478,400 $356,386,800
Difference $258,859,800 $342,084,060 $354,331,560 $143,078,400 $77,086,800
Marginal Tax Rate
0.106 0.109 0.113 0.116 0.118
Tax $1,910,032,145 $1,349,724,168 $1,446,665,906 $599,685,290 $329,303,458
Difference $112,394,645 $110,289,168 $162,855,906 $81,285,290 $50,003,458
Gross Income
$250K+ Total
Midpoint $400,000
Taxable (-$15,000)
$385,000
Population 28,580 2,522,630
Difference 28,580 2,522,630
Tax
10% $1,100,330,000 $8,000,187,500
1999 MT .1276 $1,404,021,080 $9,030,437,900
Difference $303,691,080 $1,030,250,400
Marginal Tax Rate
0.123
Tax $1,353,552,824 $8,767,491,230
Difference $253,222,824 $767,303,730

parkland institute | may 2011
46
section 4: conclusions and recommendations 32
1. a l b e r t a n s n e e d t o a s c e r t a i n t h e a p p r o p r i a t e l e v e l o f p u b l i c s e r v i c e s t o b e p r o v i d e d b y t h e i r g o v e r n m e n t .
This process obviously involves political ideologies and differing social norms mediated through the political process. However, it is quite amazing how much in this process could be discussed and debated objectively and the degree of consensus that can be achieved through awareness of the relevant knowledge. For example, regardless of the quite vast ideological difference among citizens in Alberta there is almost complete agreement on the providing of healthcare through a public financed single-payer system. As well, education is quite universally seen as an investment in the future, and that it should largely be provided and funded through state mechanisms. Whatever the set of public services determined, the chosen set will imply a cost estimate, and therefore, the revenue the tax system needs to generate can be determined. Once the degree of tax revenues needed is established, the fairest tax structure can be
32 The views expressed here are the authors alone and not necessarily shared by Parkland Institute.
A l b e r t a T o t a l T a x F i l e r s
Gross Income
<$5K $5K+ $10K+ $15K+ $20K+ $25K+ $35K+
Midpoint $2,500 $7,500 $12,500 $17,500 $22,500 $30,000 $42,500
Taxable (-$15,000)
-$12,500 -$7,500 -$2,500 $2,500 $7,500 $15,000 $27,500
Population 214,650 2,307,980 2,121,960 1,903,580 1,670,820 1,474,130 1,148,230
Difference 214,650 186,020 218,380 232,760 196,690 325,900 395,170
Tax
10% 0 0 $58,190,000 $147,517,500 $488,850,000 $1,086,717,500
1999 MT .0748 .0748 .0748 .1144
0 0 $43,526,120 $110,343,090 $365,659,800 $812,864,690
Difference -$14,663,880 -$37,174,410 -$123,190,200 -$273,852,810
Marginal Tax Rate
aY^b 0.086 0.093 0.098 0.102
Tax a=.05 $50,312,299 $137,742,460 $479,150,573 $1,111,322,107
Difference b=.07 -$7,877,701 -$9,775,040 -$9,699,427 $24,604,607
Gross Income
$50K+ $75K+ $100K+ $150K+ $200K+
Midpoint $62,500 $82,500 $125,000 $175,000 $225,000
Taxable (-$15,000)
$47,500 $67,500 $110,000 $160,000 $210,000
Population 753,060 374,610 190,990 74,280 41,880
Difference 378,450 183,620 116,710 32,400 13,300
Tax
10% $1,797,637,500 $1,239,435,000 $1,283,810,000 $518,400,000 $279,300,000
1999 MT .1144 .1276 .1276 .1276 .1276
$2,056,497,300 $1,581,519,060 $1,638,141,560 $661,478,400 $356,386,800
Difference $258,859,800 $342,084,060 $354,331,560 $143,078,400 $77,086,800
Marginal Tax Rate
0.106 0.109 0.113 0.116 0.118
Tax $1,910,032,145 $1,349,724,168 $1,446,665,906 $599,685,290 $329,303,458
Difference $112,394,645 $110,289,168 $162,855,906 $81,285,290 $50,003,458
Gross Income
$250K+ Total
Midpoint $400,000
Taxable (-$15,000)
$385,000
Population 28,580 2,522,630
Difference 28,580 2,522,630
Tax
10% $1,100,330,000 $8,000,187,500
1999 MT .1276 $1,404,021,080 $9,030,437,900
Difference $303,691,080 $1,030,250,400
Marginal Tax Rate
0.123
Tax $1,353,552,824 $8,767,491,230
Difference $253,222,824 $767,303,730

fixing what’s broken: fair and sustainable solutions to alberta’s revenue problems
47
determined to achieve this revenue target. Albertans, as citizens anywhere do, need to accept that paying taxes is part of the civil society we all desire. Unfortunately taxes are often the forgotten part of budget.
2. a l b e r t a n s h a v e t h r o u g h t h e i r g o v e r n m e n t s b e e n a v o i d i n g t h e r e a l i t y o f t a x e s b y c o v e r i n g t h e i r s o c i a l s e r v i c e c o s t s w i t h r e s o u r c e r e n t — p r i m a r i l y o i l a n d g a s r o y a l t i e s .
It has been well documented that Alberta has been collecting far less resource rents than comparable jurisdictions with similar resources. 33 Resource rent capture is not a topic of this report. Resource rents should be objectively determined by analysis. Nor does the amount of resource revenue affect the thesis of this report—that current account public expenditures should be financed through tax revenues over the business cycle. Excessive reliance on resource revenues results in a cyclic revenue stream that does not match the stable path of required services/expenditures. However, resource rents and tax revenue are linked. If we act to increase taxes and reduce reliance on resource revenues, we must have a commitment to save resource revenue in a permanent trust. For the purposes of current budget expenditures, only the annual income from the resource trust fund should be used. That is the trust fund’s annual income stream can be used as revenue in the current budgeting process. 34
3. i t i s o f p r i m e i m p o r t a n c e t h a t a l b e r t a i m p l e m e n t a s i m p l e, f a i r, a n d p r o g r e s s i v e p e r s o n a l i n c o m e t a x r e g i m e t o r e p l a c e t h e c u r r e n t (2000) s i n g l e t a x r a t e s y s t e m . As well as reinstating fairness to the tax system, a progressive tax system as outlined in 3.2 above could bring in approximately an additional $1 billion in revenue while retaining the current (high) personal exemptions and reducing current taxes to lower income groups. Yet the rate increases for high income earners under such a regime would be reasonable.
33 Regan Boychuk, Misplaced Generosity: Extraordinary profits in Alberta’s oil and gas indus-try, Parkland Institute, November 2010.
34 Instead of using trust fund income for general revenue, it could be distributed as a per capita dividend, or used as a pension or seniors’ dividend to elderly Albertans and those who have been Albertans.

parkland institute | may 2011
48
4. c o r p o r a t e i n c o m e t a x e s a r e o n a d o w n w a r d d e a t h s p i r a l a s p r o v i n c i a l ( a n d n a t i o n a l ) j u r i s d i c t i o n s c o m p e t e f o r c o r p o r a t e i n v e s t m e n t s .
Firms are then paying less and less of the social costs of running a high func-tioning society. For Canada this leaves the healthcare and education systems particularly poorly funded at the same time that corporations increasingly require a healthy, well-educated workforce. We need to reassess the corporate income tax and cooperate or initiate national (and international) agreements to prevent beggar-your-neighbour corporate tax policies. In the meantime Al-berta could aspire to be at least average, rather than be the lowest. We should also keep in mind that capital mobility due to tax levels is predicated on an ‘all other things equal ‘ basis. Often capital investment depends on local conditions and resources. The oil sands can’t move and a highly educated and productive work force depends on local social programs.
5. g a s o l i n e a n d f u e l t a x e s c o u l d b e i n c r e a s e d i n a l b e r t a w i t h o u t i n t r o d u c i n g a n y c o m p e t i t i v e d i s a d v a n t a g e.
This could bring in additional revenues in the hundreds of millions of dollars. More generally, a carbon tax or levy needs to be introduced.
6. a l b e r t a s h o u l d i n t r o d u c e a c a r b o n t a x / l e v y.
The British Columbia model could be considered. This levy would be used to correct the cost distortions caused by emitting carbon into the atmosphere without having to pay for this service in financial terms. Without a financial cost the environmental service of atmospheric carbon sinks is overused (pol-lution) and carbon reduction and abatement is not stimulated by cost. The ‘tragedy of the commons’ in the form of global climate change and other en-vironmental disruptions are the result of this service being free. Carbon levies need to introduce charges in both production and consumption activities to correct market decisions. However, revenues should be returned to the payers for fairness, that their general standard of well-being is not changed, just their activities and mechanisms that produce carbon. Therefore, a carbon tax would generate no extra revenue for budget purposes. By introducing a provincial carbon tax Alberta may also scoop the federal government and prevent it from capturing that source of revenue.

fixing what’s broken: fair and sustainable solutions to alberta’s revenue problems
49
7. i t i s w e l l r e c o g n i z e d t h a t a n i n c o m e t a x a l o n e c a n n o t c a p t u r e t a x f a i r l y f r o m a l l .
For example, the wealthy can utilize the income tax act (and mechanisms) to reduce and avoid paying taxes. A sales tax is one more cut at collect-ing tax fairly and high income individuals do also spend more. It is time for an Alberta provincial sales tax. A 5% general provincial sales tax should be introduced in Alberta. This would achieve approximately $5 billion in extra revenue. 35 This sales tax should be ‘harmonized’ with the federal GST right from the start. This would eliminate any extra administration expenses. All revenue would go to public expenditures. At 5% a sales tax in Alberta would be minimally disruptive, would bring Alberta’s consumption taxes in line with the other provinces and therefore would have little or no impact on growth or competitive advantage of Alberta. Nonetheless, this is a controversial proposal given the fact that Alberta does not currently have a sales tax. While a PST is not shocking to non-Albertans, in order to make it acceptable, this tax should come with a generous low-income rebate system.
35 The analysis in Section 2.3 suggests that for each percentage of a sales tax $750 million to $1.5 billion could be obtained.

parkland institute | may 2011
50
appendix: sales tax exemptions and rebates
Exemptions: Generally the list of general sales tax exemptions includes:
Exempt supplies – are supplies of property and services that are not subject to the GST/HST. GST/HST registrants cannot claim input tax credits to recover the GST/HST paid or payable on expenses related to making such supplies. In-put tax credit (ITC) – means a credit GST/HST registrants can claim to recover the GST/HST paid or payable for property or services they acquired, imported into Canada, or brought into a participating province for use, consumption, or supply in the course of their commercial activities.
Participating province – means the province of British Columbia, New Bruns-wick, Newfoundland and Labrador, Nova Scotia, or Ontario.
Person – means an individual, a partnership, a corporation, the estate of a de-ceased individual, a trust, or any organization such as a society, a union, a club, an association, or a commission.
Property – includes goods, real property and intangible personal property such as trademarks, rights to use a patent, and admissions to a place of amuse-ment, but does not include money.
Public institution – means a registered charity for income tax purposes that is also a school authority, a public college, a university, a hospital authority or a local authority determined to be a municipality.
Public service body – means a charity, non-profit organization, municipality, university, public college, school authority, or hospital authority.
Real property – includes: • a mobile home or floating home and any leasehold or ownership
interest in such property; • in Quebec, immovable property and every lease of such property; and • in any other place in Canada, all land, buildings of a permanent na-
ture, and any interest in real property.
Registrant – means a person that is registered or has to be registered for the GST/HST.
Small supplier – refers to a person whose revenue from worldwide taxable supplies was equal to or less than $30,000 ($50,000 for public service bodies) in a calendar quarter and over the last four consecutive calendar quarters. Chari-ties and public institutions are also considered small suppliers if they meet the

fixing what’s broken: fair and sustainable solutions to alberta’s revenue problems
51
gross revenue test of $250,000 or less.
Supply – means the provision of property or a service in any way, including sale, transfer, barter, exchange, licence, rental, lease, gift, and disposition. Taxable supplies – are supplies of property and services that are made in the course of a commercial activity and are subject to the GST/HST (including zero-rated supplies).
Zero-rated supplies – are supplies of property and services that are taxable at the rate of 0%. This means there is no GST/HST charged on these supplies, but GST/HST registrants can claim ITCs for the GST/HST paid or payable on purchases and expenses made to provide them.
Examples of taxable goods and services include: • sales of new housing 36. • sales and rentals of commercial real property; • sales and leases of automobiles; • car repairs; • soft drinks, candies, and potato chips; • clothing and footwear; advertising (unless provided to a non-resident
of Canada who is not registered for the GST/HST); • taxi and limousine transportation; • legal and accounting services; • franchises; • hotel accommodation; and• barber and hairstylist services.
Zero-rated supplies: Some supplies are zero-rated under the GST/HST—that is, GST/HST applies at a rate of 0%. This means that consumers are not charged GST/HST on these goods and services but businesses may claim input tax credits for the GST/HST paid or payable on purchases and expenses made to provide these supplies.
Examples of supplies taxable at 0% (zero-rated) include: 37 • basic groceries such as milk, bread, and vegetables; • agricultural products such as grain, raw wool, and dried tobacco
leaves; • most farm livestock; • most fishery products such as fish for human consumption; • prescription drugs and drug-dispensing services; • medical devices such as hearing aids and artificial teeth; • exports (most goods and services for which you charge and collect
36 Certain sales of new housing may be subject to a previous rate of GST/HST. For more information, see “Sales of new housing” on page 50, RC4022 General Information for GST/HST Registrants, Canada Revenue Agency;
37 For more information, see GST/HST Memoranda Series, Chapter 4, Zero-Rated Supplies, RC4022 General Information for GST/HST Registrants, Canada Revenue Agency;

parkland institute | may 2011
52
the GST/HST in Canada, are zero-rated when exported); and • many transportation services where the origin or destination is out-
side Canada.
Some supplies are exempt from the GST/HST—that is, no GST/HST applies to them. This means that you do not charge the GST/HST on these supplies of property and services, and you do not claim input tax credits.
Examples of exempt supplies include:• a sale of housing that was last used by an individual as a place of resi-
dence; • long-term rentals of residential accommodation (of one month or
more) and residential condominium fees; • most health, medical, and dental services performed by licensed phy-
sicians or dentists for medical reasons; • child care services, where the primary purpose is to provide care and
supervision to children 14 years of age or under for periods of less than 24 hours per day;
• most domestic ferry services; • many educational services such as: – courses supplied by a vocational
school leading to a certificate or a diploma that certifies the ability of individuals to practice or perform a trade or a vocation, or – tutoring services made to an individual in a course that follows a curriculum designated by a school authority;
• music lessons; • most services provided by financial institutions such as lending
money or operating deposit accounts; • arranging for and the issuance of insurance policies by an insurer
and the arranging for the issuance of insurance policies by insurance agents;
• most goods and services provided by charities; and • certain goods and services provided by non-profit organizations, gov-
ernments, and public service bodies such as municipal transit services and standard residential services such as water distribution.
Tax credits-rebates: The GST/HST credit is a tax-free quarterly payment that helps individuals and families with low and modest incomes offset all or part of the GST or HST that they pay.
A single person with a taxable income of $8,096 or less would receive $250. Any income over $8,096 up to $14,646 would receive an extra 2% of the differ-ence to the maximum of $131.00. If income exceeded $32,506 the credit ($381) would be reduced by 5 % of the difference.
For a married couple with a taxable income of $32,506 or less the credit is $250 for each spouse or common-law partner and $131.00 for each child. If joint income exceeded $32,506 the credit ($500) would be reduced by 5% of the dif-ference.
In addition similar provincial programs to the PST/HST credits exist. For

fixing what’s broken: fair and sustainable solutions to alberta’s revenue problems
53
example, an individuals and families with an income less than $20,000 receive $230 per person rebate on the HST. 38 In BC the carbon tax is also refunded to low income individuals and families.
38 For details see: RC4210(E) Rev. 10 GST/HST Credit Including related provincial credits and benefits For the period from July 2010 to June 2011Canada Revenue Agency. http://www.cra-arc.gc.ca/E/pub/tg/rc4210/rc4210-10e.pdf
Related Documents