Fixed Income Investing The Yield Curve and Trading Strategies Yield Curve Determinants Default risk Supply/demand Term structure Central bank intervention Interpreting slope Positive, flat and inverted Interest Rate Cycle

Welcome message from author
This document is posted to help you gain knowledge. Please leave a comment to let me know what you think about it! Share it to your friends and learn new things together.
Transcript
Fixed Income InvestingThe Yield Curve and Trading Strategies
Yield Curve Determinants
Default risk
Supply/demand
Term structure
Central bank intervention
Interpreting slope
Positive, flat and inverted
Interest Rate Cycle

Greece
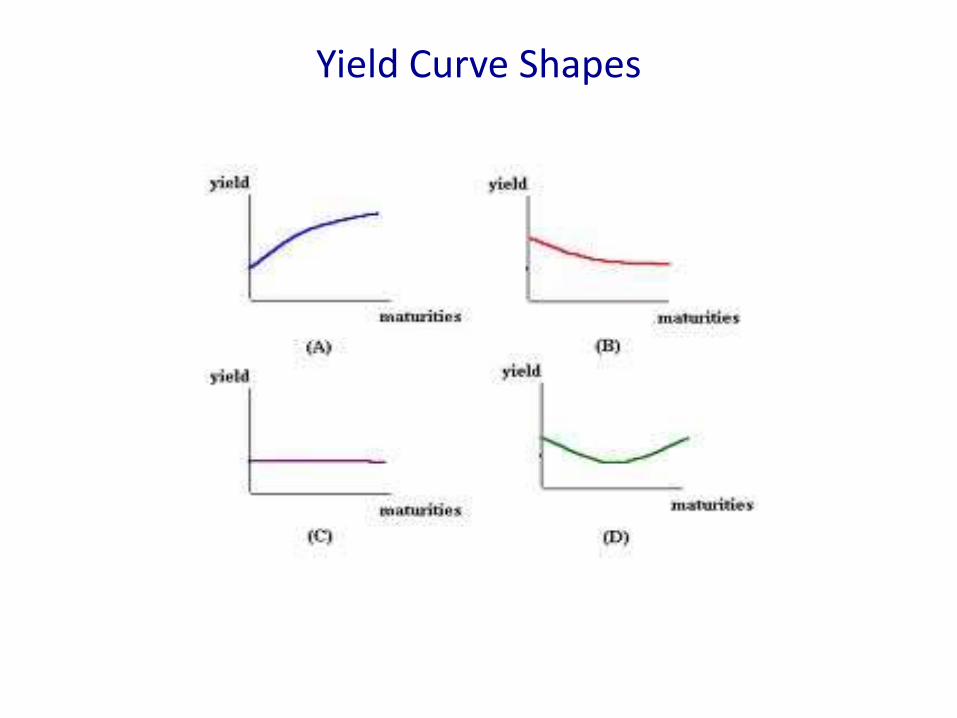
Yield Curve Shapes
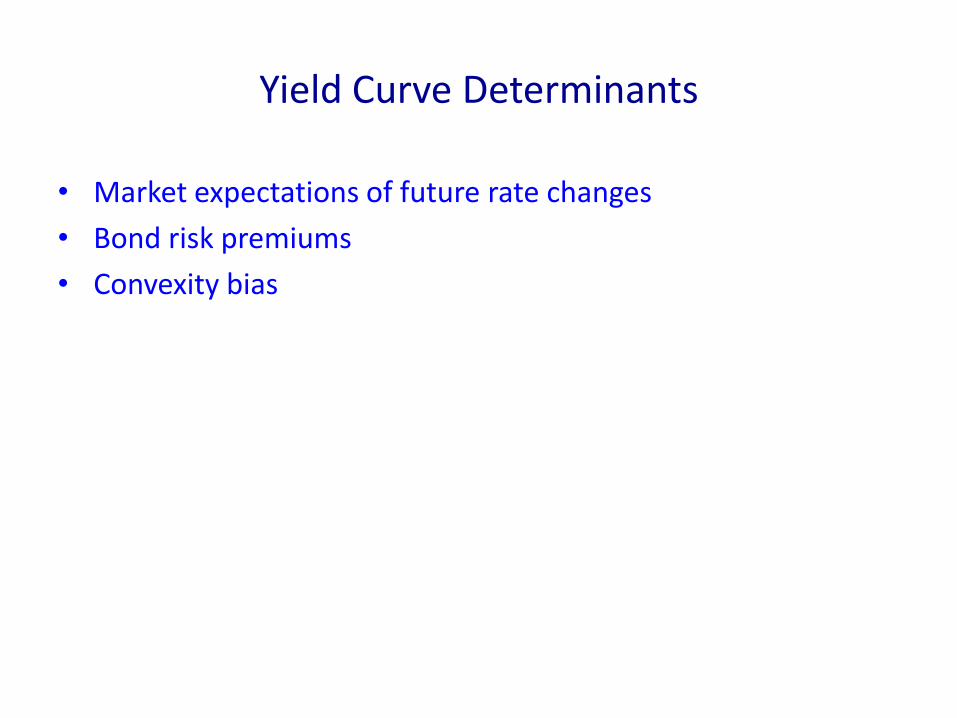
Yield Curve Determinants
• Market expectations of future rate changes
• Bond risk premiums
• Convexity bias

US Treasury Yield Curve2/30 Year

Components of CPI
• FOOD AND BEVERAGES (breakfast cereal, milk, coffee, chicken, wine, full service meals, snacks)
• HOUSING (rent of primary residence, owners' equivalent rent, fuel oil, bedroom furniture)
• APPAREL (men's shirts and sweaters, women's dresses, jewelry)
• TRANSPORTATION (new vehicles, airline fares, gasoline, motor vehicle insurance)
• MEDICAL CARE (prescription drugs and medical supplies, physicians' services, eyeglasses and eye care, hospital services)
• RECREATION (televisions, toys, pets and pet products, sports equipment, admissions);
• EDUCATION AND COMMUNICATION (college tuition, postage, telephone services, computer software and accessories);
• OTHER GOODS AND SERVICES (tobacco and smoking products, haircuts and other personal services, funeral expenses).
Corporate Leverage Increasing
• Leverage has risen to near its crisis peak, even after adjusting for the increase in balance sheet cash
• Debt continued to grow in 2Q13, increasing 2.1% (+$59bn) q/q and 9.1% (+$239bn) y/y reaching a new decade high of $2.9tn for the companies in our analysis. Despite strong balance sheets and high cash balances, companies continued to issue debt at the highest pace since the crisis, due in part, to low yields until recently.
• Gross debt increased by 9% over the past 4 quarters, 7% for the prior 4 quarters, and 5% for the 4 quarters two years ago, so there has been no moderation in pace of debt growth as of yet, despite limited EBITDA growth.

CPI THE COST OF GOVERNMENT
• Also included within these major groups are various government-charged user fees, such as water and sewerage charges, auto registration fees, and vehicle tolls. In addition, the CPI includes taxes (such as sales and excise taxes) that are directly associated with the prices of specific goods and services.
• However, the CPI excludes taxes (such as income and Social Security taxes) not directly associated with the purchase of consumer goods and services.
• The CPI does not include investment items, such as stocks, bonds, real estate, and life insurance. (These items relate to savings and not to day-to-day consumption expenses.)
• For each of the more than 200 item categories, using scientific statistical procedures, the Bureau has chosen samples of several hundred specific items within selected business establishments frequented by consumers to represent the thousands of varieties available in the marketplace. For example, in a given supermarket, the Bureau may choose a plastic bag of golden delicious apples, U.S. extra fancy grade, weighing 4.4 pounds to represent the Apples category.

CPI Flaws
1) PRODUCTIVITY
2) COST OF GOVERNMENT
3) SHELTER

THE POWER OF THE CPI
• Government Financing Interest Expense
Indexed Benefits
• GDP Deflator
• Term Structure and Liquidity

What goods and services does the CPI cover?
The CPI represents all goods and services purchased
for consumption by the reference population (U or W)
BLS has classified all expenditure items into more than
200 categories, arranged into eight major groups.
Owners’ equivalent rent of primary residence (OER) Rent of primary residence (Rent)
How the CPI measures price change of Shelter, the service that housing units provide their occupants, is a major part of the CPI market basket—the goods and services that people need for day-to-day living. Two CPI indexes, Owners’ equivalent rent of primary residence (OER) and Rent of primary residence (Rent), measure the change in the shelter cost consumers receive from their primary residences. Housing units are not in the CPI market basket. Like most other economic series, the CPI views housing units as capital (or investment) goods and not as consumption items. Spending to purchase and improve houses and other housing units is investment and not consumption. Shelter, the service the housing units provide, is the relevant consumption item for the CPI. The cost of shelter for renter- occupied housing is rent. For an owner-occupied unit, the cost of shelter is the implicit rent that owner occupants would have to pay if they were renting their homes.

Home Prices and Consumption
• Extreme changes in the price of homes may have a significant impact on consumers’ cost of living and consumption patterns
Related Documents