Fitting on the Earth and the Need for Integrative Analysis Robert Socolow Princeton University [email protected] A talk for ARPA-E Washington, DC June 3, 2010

Fitting on the Earth and the Need for Integrative Analysis Robert Socolow Princeton University [email protected] A talk for ARPA-E Washington, DC June.
Dec 20, 2015
Welcome message from author
This document is posted to help you gain knowledge. Please leave a comment to let me know what you think about it! Share it to your friends and learn new things together.
Transcript

Fitting on the Earthand the Need for Integrative Analysis
Robert SocolowPrinceton University
A talk for ARPA-EWashington, DC
June 3, 2010
Fitting on the Earth
“Fitting on the earth” has become a dominant task for the next several decades.
ARPA-E can enhance both its in-house decision-making and the overall national research enterprise by fostering analytical work that deepens our understanding of this new bundle of issues.
In this talk, I have sought messages for ARPA-E and, more generally, for ARPA-X.

Planetary carbon
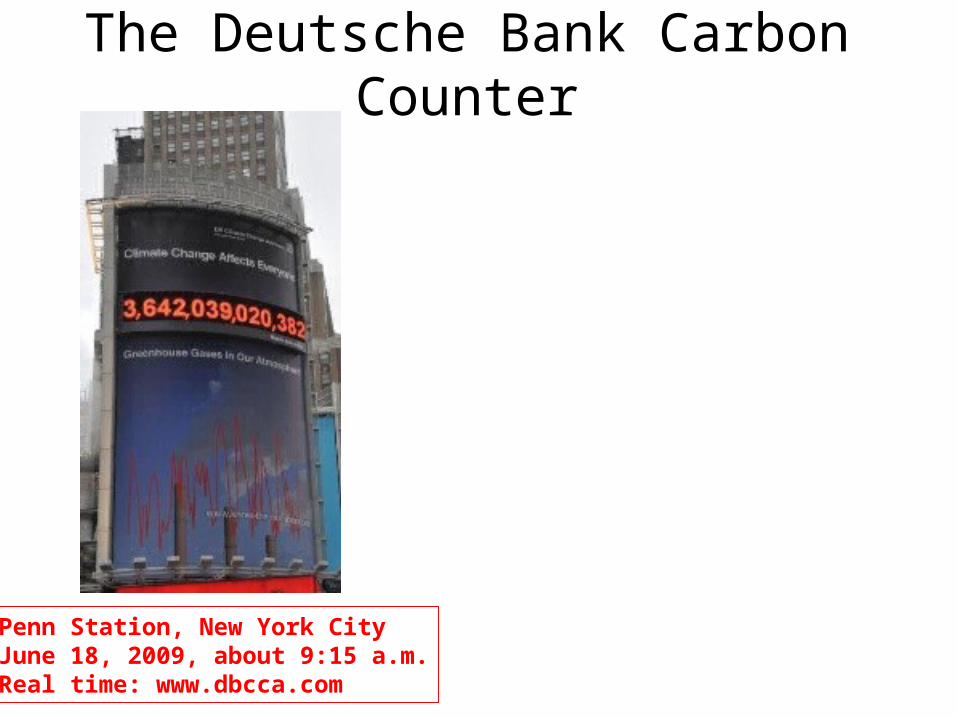
The Deutsche Bank Carbon Counter
Penn Station, New York CityJune 18, 2009, about 9:15 a.m.Real time: www.dbcca.com

The Deutsche Bank Carbon Counter
Penn Station, New York CityJune 18, 2009, about 9:15 a.m.Real time: www.dbcca.com
The number shown, about 3.6 trillion tons, is the mass of CO2 that would provide as much warming (“forcing”) as is provided by all the current long-lived gases (Kyoto and Montreal gases).
The mass of CO2 in the atmosphere is about 3.0 trillion tons.
The number climbs 750 ton/second, or two-thirds of one percent per year.
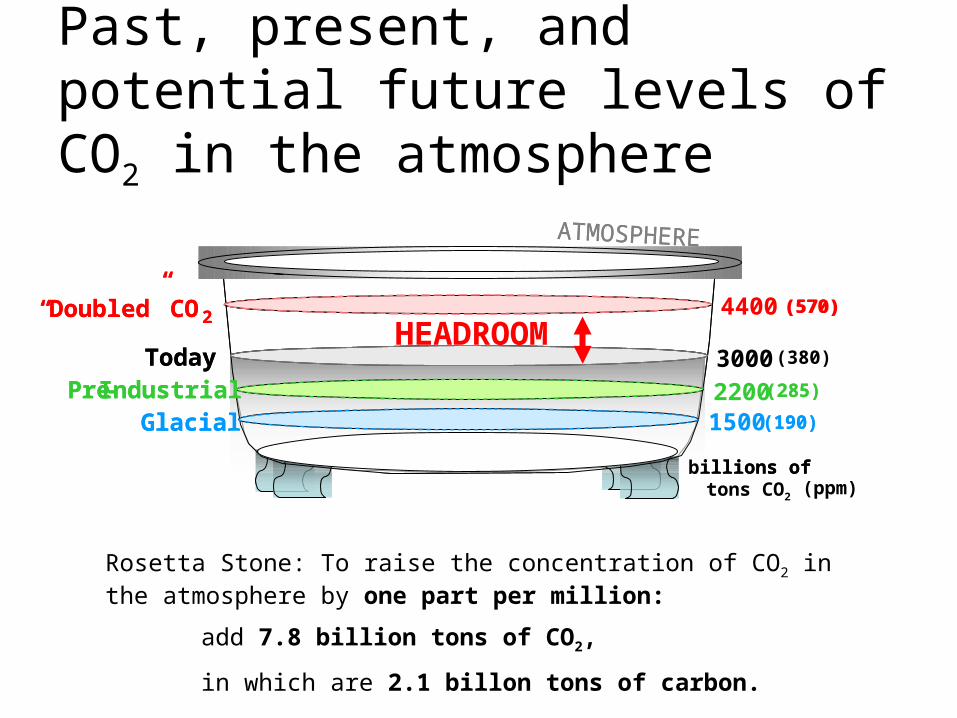
Past, present, and potential future levels of CO2 in the atmosphere
Rosetta Stone: To raise the concentration of CO2 in the atmosphere by one part per million:
add 7.8 billion tons of CO2,
in which are 2.1 billon tons of carbon.
Billions of tons of carbon
“Doubled” CO2
TodayPre-Industrial
Glacial
3000
4400
22001500
billions of
ATMOSPHERE
(570)
(285)
(190)
Billions of tons of carbon
“Doubled” CO2
TodayPre-Industrial
Glacial
billions of tons CO2
ATMOSPHERE
(ppm)
(570)
(380)
(285)
(190)
HEADROOM
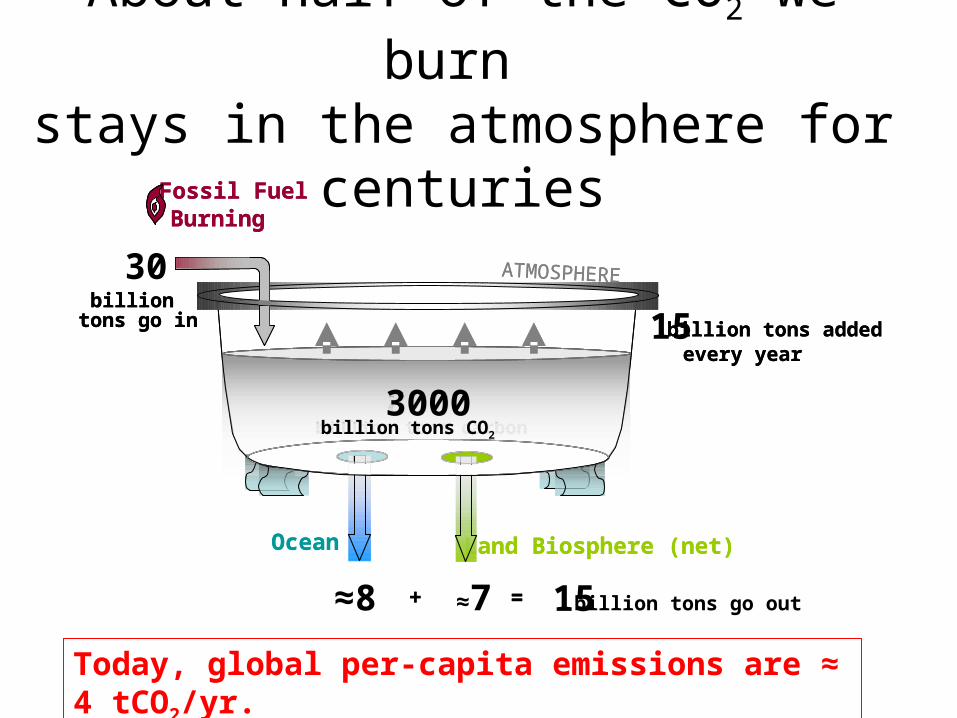
About half of the CO2 we burn stays in the atmosphere for centuries
≈8 ≈7 = 15
Ocean Land Biosphere (net)
Fossil FuelBurning
+
30
800billion tons carbon
billion tons go in
ATMOSPHERE
billion tons added every year
= billion tons go out
Ocean Land Biosphere (net)
Fossil FuelBurning
+
3000billion tons CO2
15billion
tons go in
ATMOSPHERE
billion tons added every year
Today, global per-capita emissions are ≈ 4 tCO2/yr.

Activity Amount producing 4 ton CO2/yr emissions
a) Drive 24,000 km/yr, 5 liters/100km (45 mph)
b) Fly 24,000 km/yr
c) Heat home Natural gas, average house, average climate
d) Lights300 kWh/month when all coal-power *(600 kWh/month, natural-gas-power)
Four ways to emit 4 ton CO2/yr(today’s global per capita average)

9
There is no “line in the sand” No “safety on one side, hazard on the other”
Our assignment is to manage risk.
Eventual temperature change (relative to pre-industrial)0°C 1°C 2°C 3°C 4°C 5°C
5% 95%400 ppm C02e
550 ppm C02e
650 ppm C02e
750 ppm C02e
450 ppm C02e
“Climate sensitivity”distribution
Source: Stern Review, 2006, Executive Summary, p. v, citing 1) Wigley and Raper (2001) and Murphy et. al. (2004) for the wide green lines, triangles, and circles; and 2) (Meinshausen, 2006) for the narrow blue lines and arrows. Based on a slide by Hal Harvey.
FA
TT
AILIA
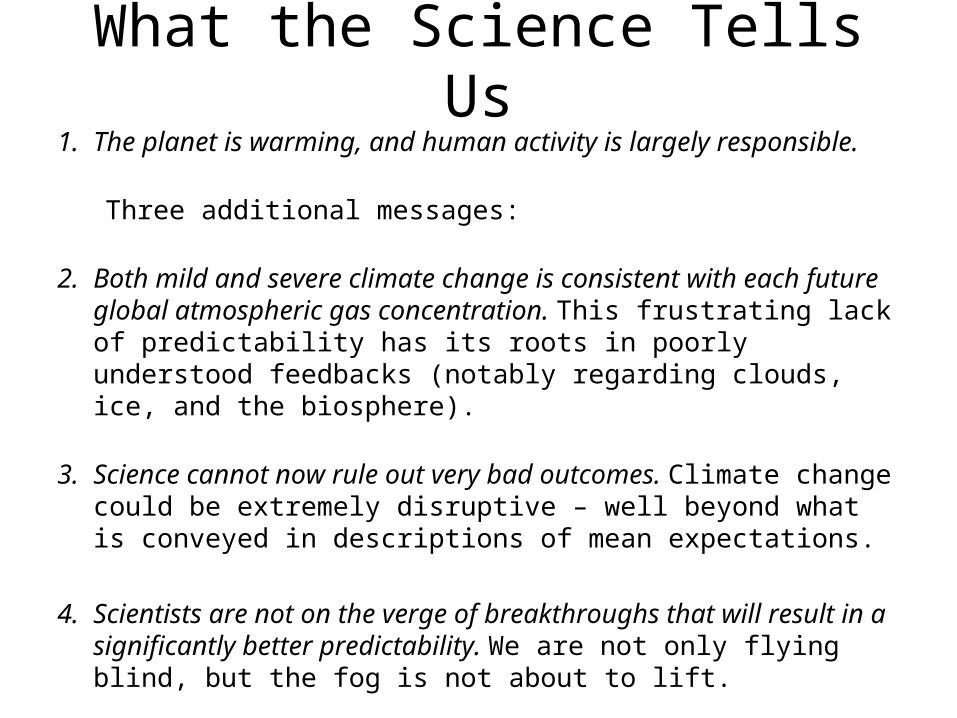
What the Science Tells Us1. The planet is warming, and human activity is largely responsible.
Three additional messages:
2. Both mild and severe climate change is consistent with each future global atmospheric gas concentration. This frustrating lack of predictability has its roots in poorly understood feedbacks (notably regarding clouds, ice, and the biosphere).
3. Science cannot now rule out very bad outcomes. Climate change could be extremely disruptive – well beyond what is conveyed in descriptions of mean expectations.
4. Scientists are not on the verge of breakthroughs that will result in a significantly better predictability. We are not only flying blind, but the fog is not about to lift.

Which argument is stronger?
Act because of what we know.
Act because of what we don’t know.
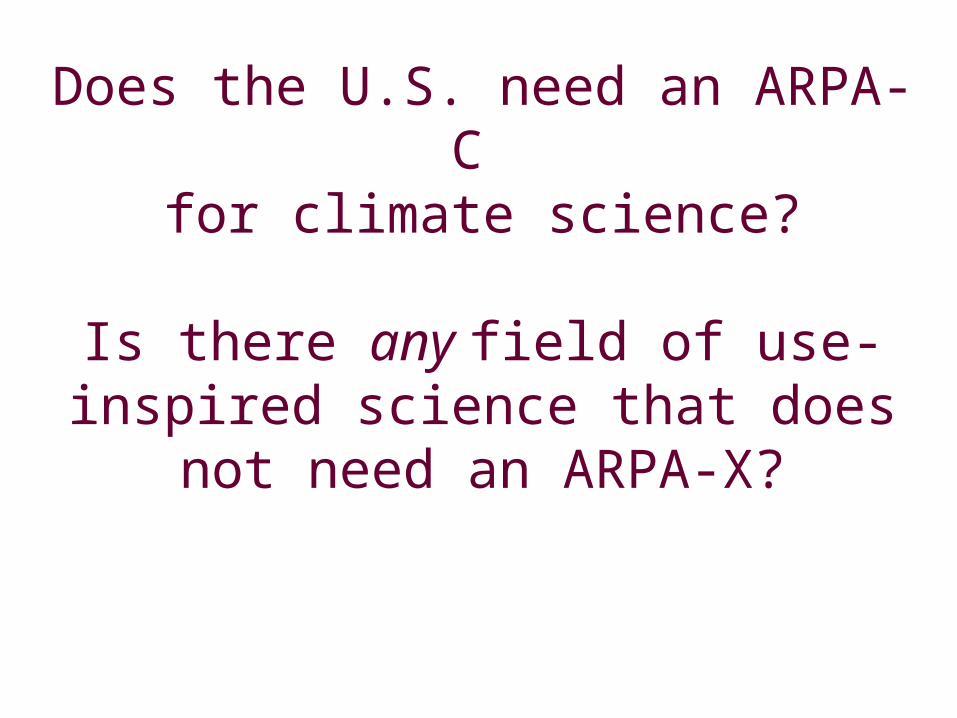
Does the U.S. need an ARPA-C for climate science?
Is there any field of use-inspired science that does not need an
ARPA-X?

The Wedge Model: Quantifying the task of significantly reducing global emissions of CO2

Historical emissions
0
30
60
1950 2000 2050 2100
Historical Emissions
6
Billions of tons of CO2 emitted per year

6
Interim GoalCurrent p
ath =
“ram
p”
Historical emissions Flat path
Stabilization Triangle
0
30
60
1950 2000 2050 2100
The Stabilization Triangle
Today and for the interim goal, global per-capita emissions are ≈ 4 to 5 tCO2/yr.
Billions of tons of CO2 emitted per year

6
Billions of tons of CO2 emitted per year
Current p
ath =
“ram
p”
Flat path
0
30
60
1950 2000 2050 2100
Stabilization Wedges
16 GtC/y
Eight “wedges”
Historical emissions
Interim Goal
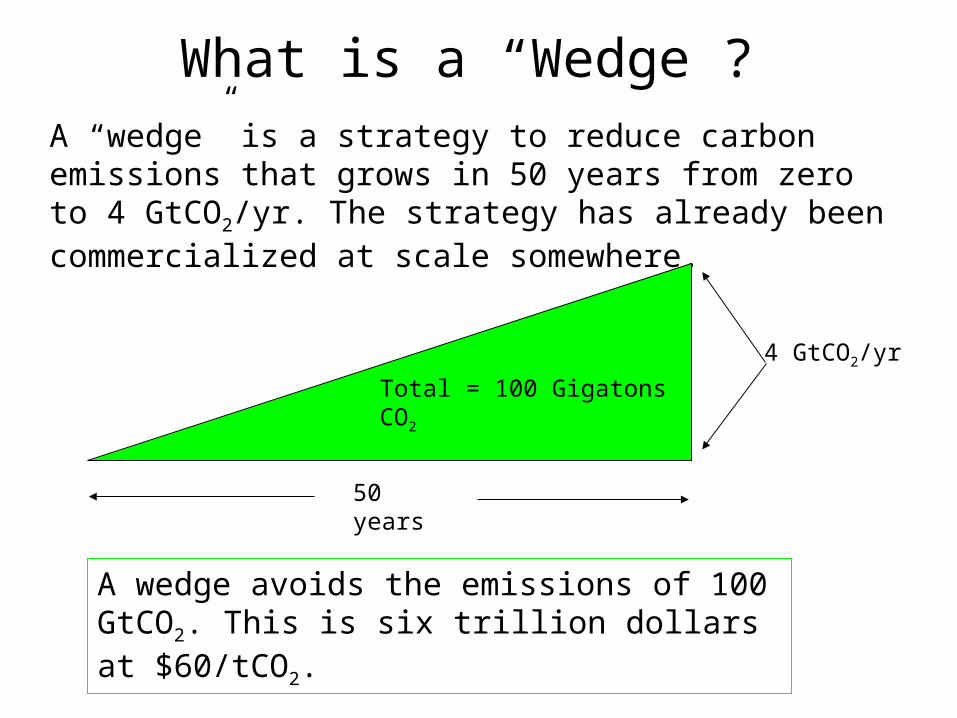
What is a “Wedge”?A “wedge” is a strategy to reduce carbon emissions that grows in 50 years from zero to 4 GtCO2/yr. The strategy has already been commercialized at scale somewhere.
4 GtCO2/yr
50 years
Total = 100 Gigatons CO2
A wedge avoids the emissions of 100 GtCO2. This is six trillion dollars at $60/tCO2.

Energy Efficiency
Decarbonized Electricity
DecarbonizedFuels
2010 2060
30 GtCO2/yr
60 GtCO2/yr
MethaneManagement
TriangleStabilization
Fill the Stabilization Triangle with Eight Wedges in six broad categories
Extra Carbon in Forests, Soils, Oceans
Smaller Families

“The Wedge Model is the iPod of climate change: You fill it with your favorite things.”
David Hawkins, NRDC, 2007.
Therefore, prepare to negotiate with others, who have different favorite things.

A U.S. View of Wedges: Demand
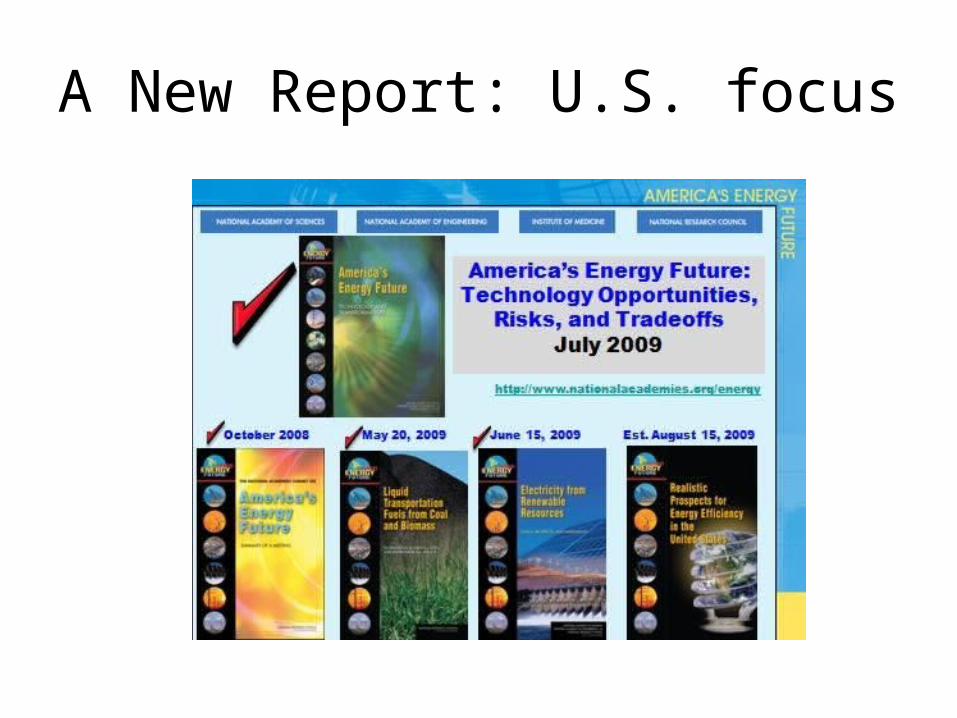
A New Report: U.S. focus

U.S. Fossil-fuel CO2 emissionsU.S. CO2 Emissions 2007
0
500
1000
1500
2000
2500
3000
Residential Commerical Industrial Transportation Electric Generation
Mill
ion
Met
ric T
ons
of C
arbo
n D
ioxi
de
Natural GasPetroleumCoal
U.S. total emissions: 6.0 billion tons CO2
Source: J. Sweeney, 2009

Legacy: National Highway System

Efficient Use of FuelEfficient Use of Fuel
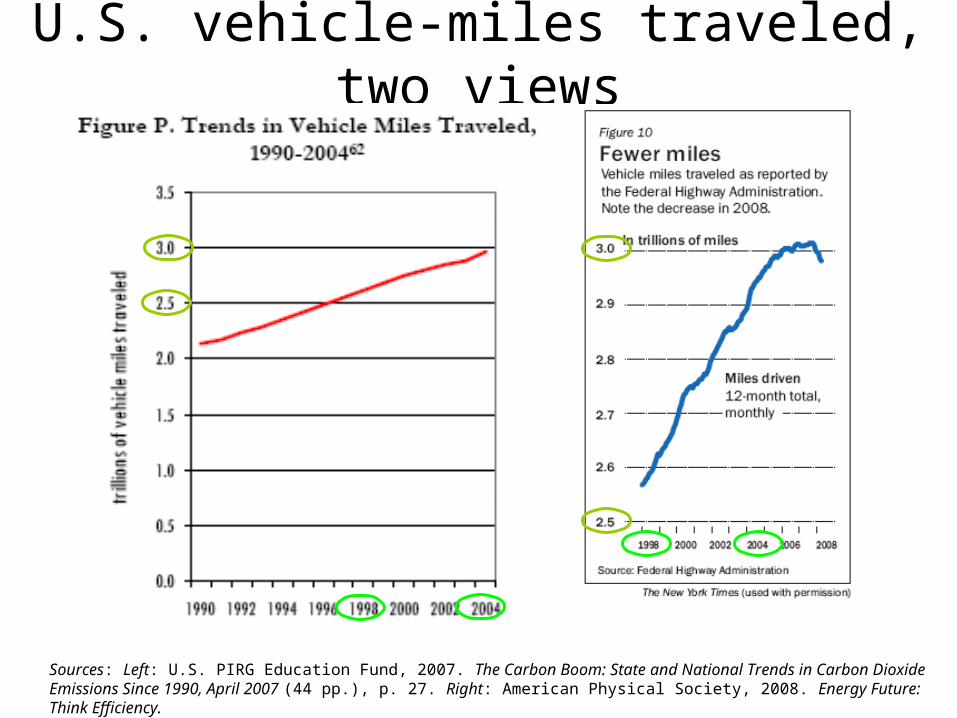
U.S. vehicle-miles traveled, two views
Sources: Left: U.S. PIRG Education Fund, 2007. The Carbon Boom: State and National Trends in Carbon Dioxide Emissions Since 1990, April 2007 (44 pp.), p. 27. Right: American Physical Society, 2008. Energy Future: Think Efficiency.

At the power plant, CO2 heads for the sky, most electrons head for buildings!
0
500
1000
1500
2000
2500
Residential Commerical Industrial Transportation
Mill
ion
Met
ric T
ons
of C
arbo
n D
ioxi
de
Through ElectricityNatural GasPetroleumCoal
U.S. CO2 emissions, 2007, electricity allocated. Source: J. Sweeney, 2009.

Efficient Use of ElectricityEfficient Use of Electricity
Measure, learn, iterate. (Trust, but verify.)

U.S. Electricity Growth Continues to Slow(3-year rolling average percent growth)
0
2
4
6
8
10
12
14
1950 1960 1970 1980 1990 2000 2010 2020 2030
ProjectionsPeriod Annual Growth
1950s 9.0
1960s 7.3
1970s 4.2
1980s 3.1
1990s 2.4
2000-2006 1.2
2006-2030 1.1
Exponential curve (20 years for rate to fall by half): EIA
Per
cen
t p
er y
ear

U.S. Electricity Growth Continues to Slow(3-year rolling average percent growth)
ProjectionsPeriod Annual Growth
1950s 9.0
1960s 7.3
1970s 4.2
1980s 3.1
1990s 2.4
2000-2006 1.2
2006-2030 1.1
0
2
4
6
8
10
12
14
1950 1960 1970 1980 1990 2000 2010 2020 2030Nothing in physics or economics forbids negative values! Blue dashed line: RHS.
Per
cen
t p
er y
ear

Is peak energy demand behind us?
If the U.S. takes efficiency seriously, annual consumption from now on could be less than in any past year – for both:
•U.S. oil consumption
•U.S. electric power consumption
The consequences of falling demand are more profound for power than for fuel, because power plants are around a lot longer than vehicles.
However, the two domains are becoming linked by batteries and fuel cells and centralized polygeneration.

How can ARPA-E address the post-consumer society, where smart
technology and changes in tastes result in a decline in the absolute throughput of natural resources?
More generally, how can ARPA-E identify and confront sacred cows?
A U.S. View of Wedges: Supply

Legacy: U.S. Power Plants
Source: Benchmarking Air Emissions, April 2006. The report was co-sponsored by CERES, NRDC and PSEG.
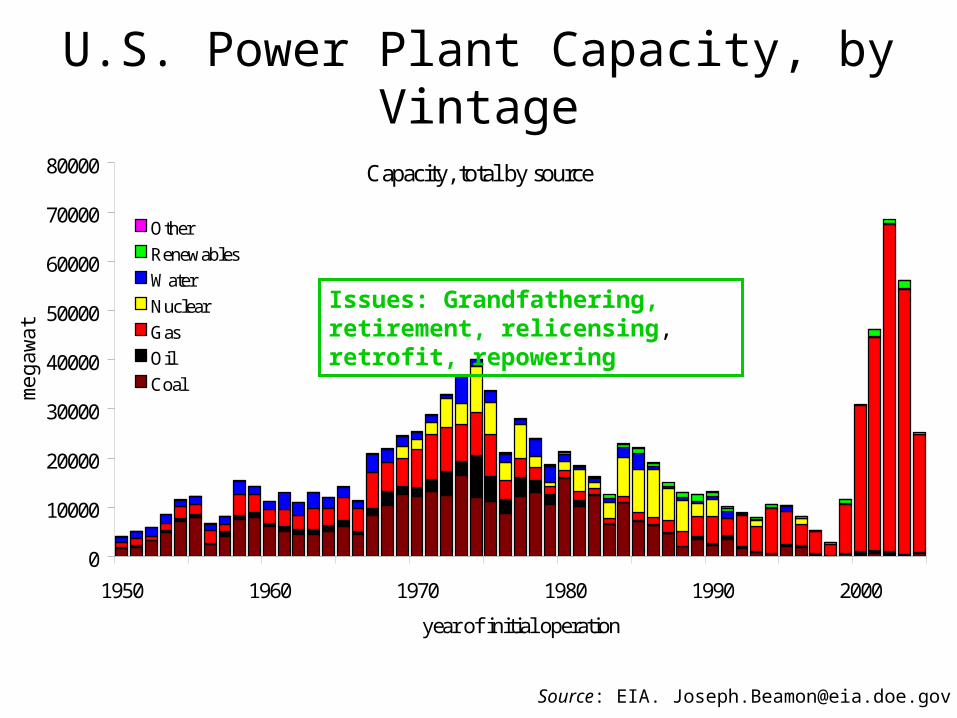
Capacity, total by source
0
10000
20000
30000
40000
50000
60000
70000
80000
1950 1960 1970 1980 1990 2000
year of initial operation
meg
awat
t
Other
Renewables
Water
Nuclear
Gas
Oil
Coal
U.S. Power Plant Capacity, by Vintage
Issues: Grandfathering, retirement, relicensing, retrofit, repowering
Source: EIA. [email protected]
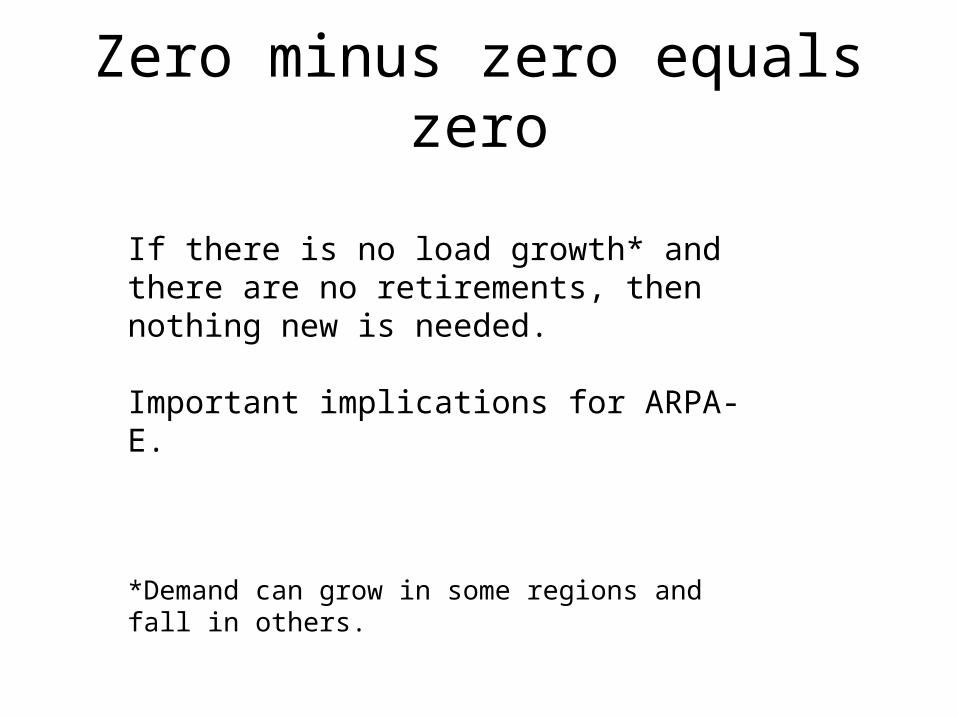
Zero minus zero equals zero
If there is no load growth* and there are no retirements, then nothing new is needed.
Important implications for ARPA-E.
*Demand can grow in some regions and fall in others.
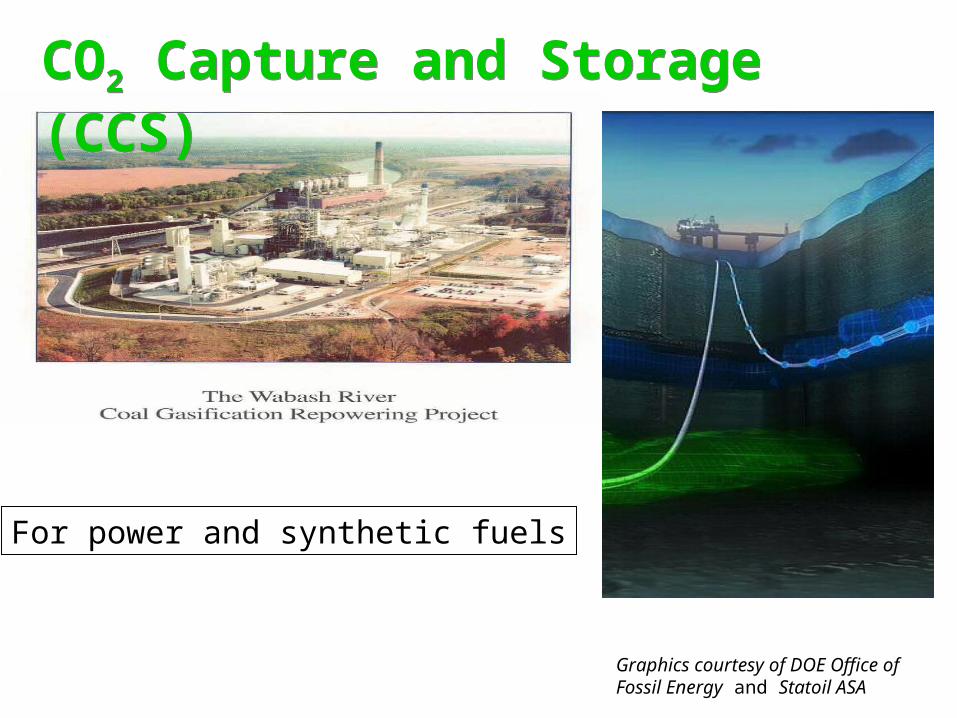
CO2 Capture and Storage (CCS)CO2 Capture and Storage (CCS)
Graphics courtesy of DOE Office of Fossil Energy and Statoil ASA
For power and synthetic fuels
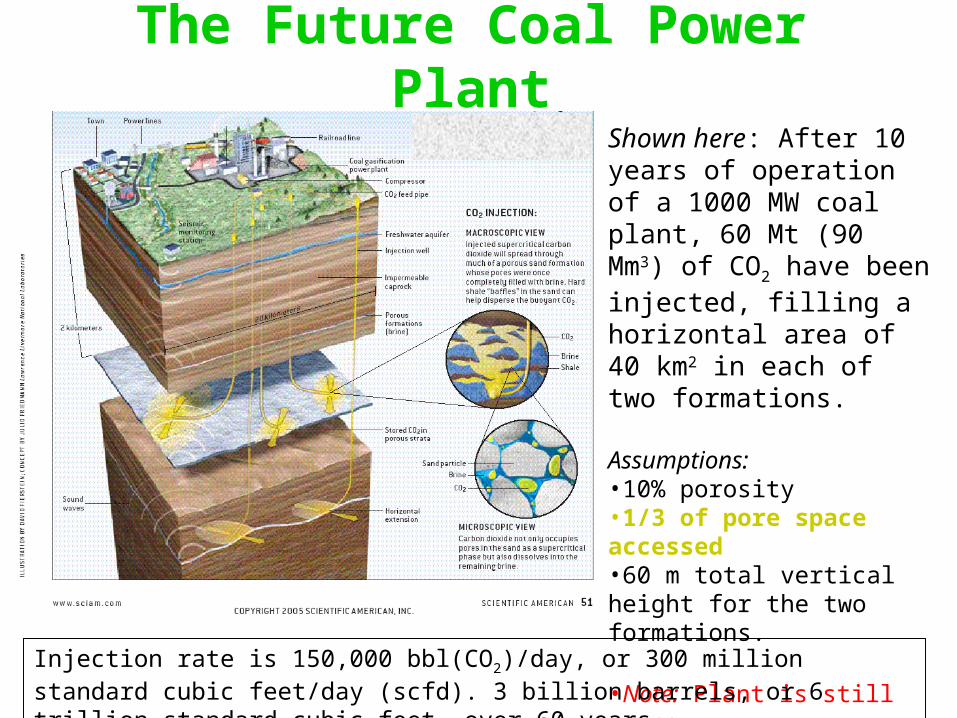
The Future Coal Power PlantShown here: After 10 years of operation of a 1000 MW coal plant, 60 Mt (90 Mm3) of CO2 have been injected, filling a horizontal area of 40 km2 in each of two formations.
Assumptions:•10% porosity•1/3 of pore space accessed•60 m total vertical height for the two formations.
•Note: Plant is still young.
Injection rate is 150,000 bbl(CO2)/day, or 300 million standard cubic feet/day (scfd). 3 billion barrels, or 6 trillion standard cubic feet, over 60 years.

U.S. CO2 pipeline infrastructureWeybourne

765 kV backbone for 350 GW wind
Source: American Electric Power, 2007.http://www.aep.com/about/i765project/docs/WindTransmissionVisionWhitePaper.pdf.
19,000 miles of new 765 kV line.
$60 billion.
There are no green electrons.

Fission Power – with Dry Cask StorageFission Power – with Dry Cask Storage
Site: Surry station, James River, VA; 1625 MW since 1972-73,. Credit: Dominion.
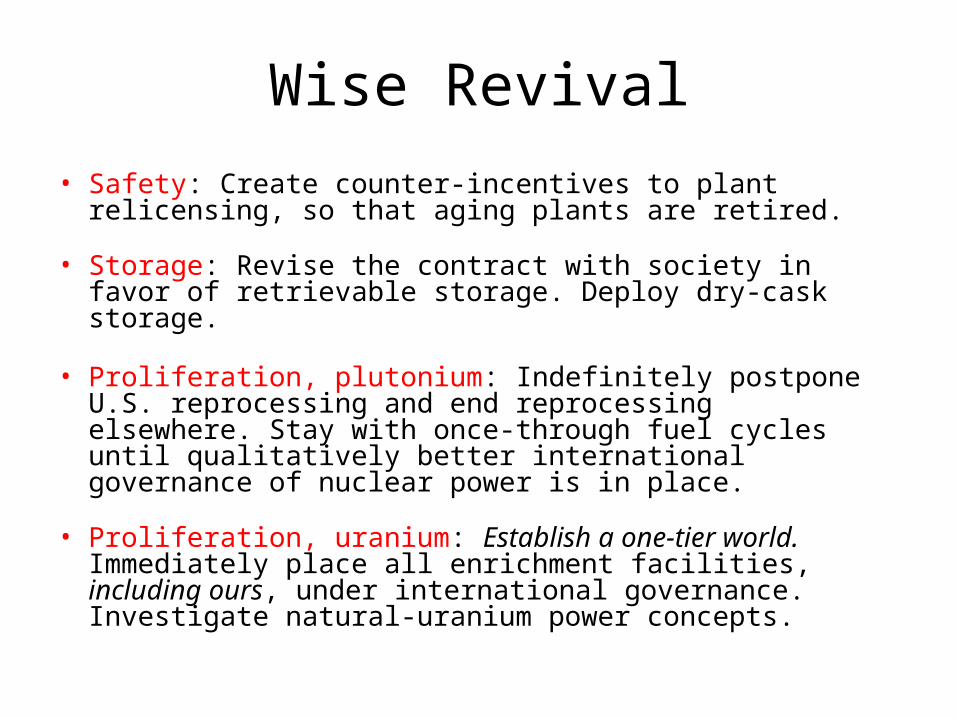
Wise Revival
• Safety: Create counter-incentives to plant relicensing, so that aging plants are retired.
• Storage: Revise the contract with society in favor of retrievable storage. Deploy dry-cask storage.
• Proliferation, plutonium: Indefinitely postpone U.S. reprocessing and end reprocessing elsewhere. Stay with once-through fuel cycles until qualitatively better international governance of nuclear power is in place.
• Proliferation, uranium: Establish a one-tier world. Immediately place all enrichment facilities, including ours, under international governance. Investigate natural-uranium power concepts.
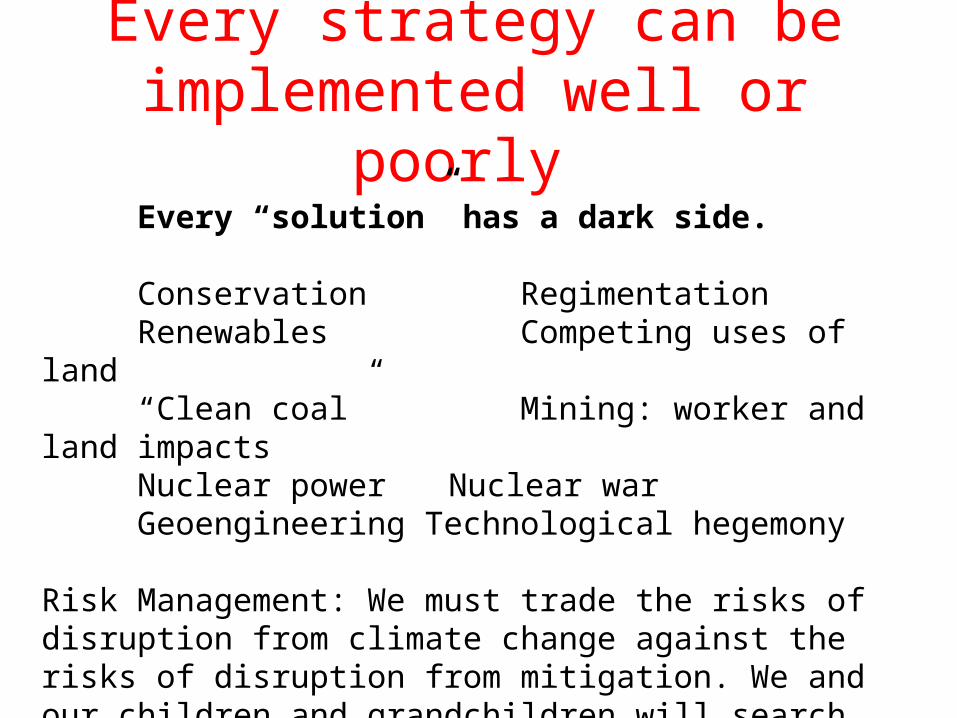
Every strategy can be implemented well or poorly
Every “solution” has a dark side.
Conservation RegimentationRenewables Competing uses of land“Clean coal” Mining: worker and land impactsNuclear power Nuclear warGeoengineering Technological hegemony
Risk Management: We must trade the risks of disruption from climate change against the risks of disruption from mitigation. We and our children and grandchildren will search for an optimum pace.

Hippocratic Oath
I will apply, for the benefit of the sick, all measures that are required, avoiding those twin traps of overtreatment and therapeutic nihilism.*
* Modern version, Louis Lasagna, 1964, http://www.pbs.org/wgbh/nova/doctors/oath_modern.html
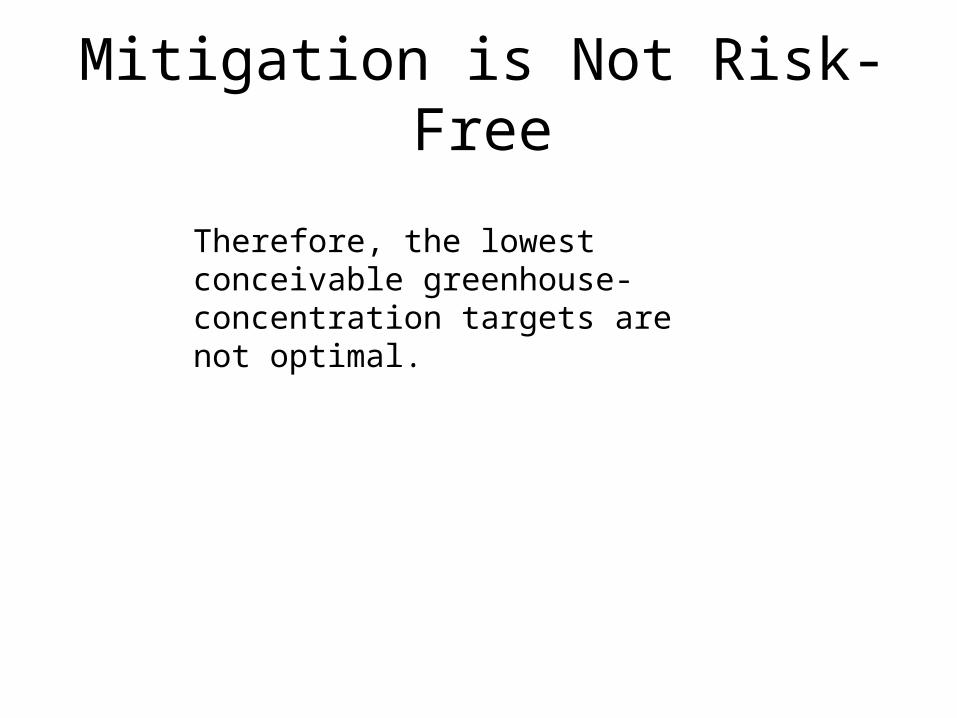
Mitigation is Not Risk-Free
Therefore, the lowest conceivable greenhouse-concentration targets are not optimal.
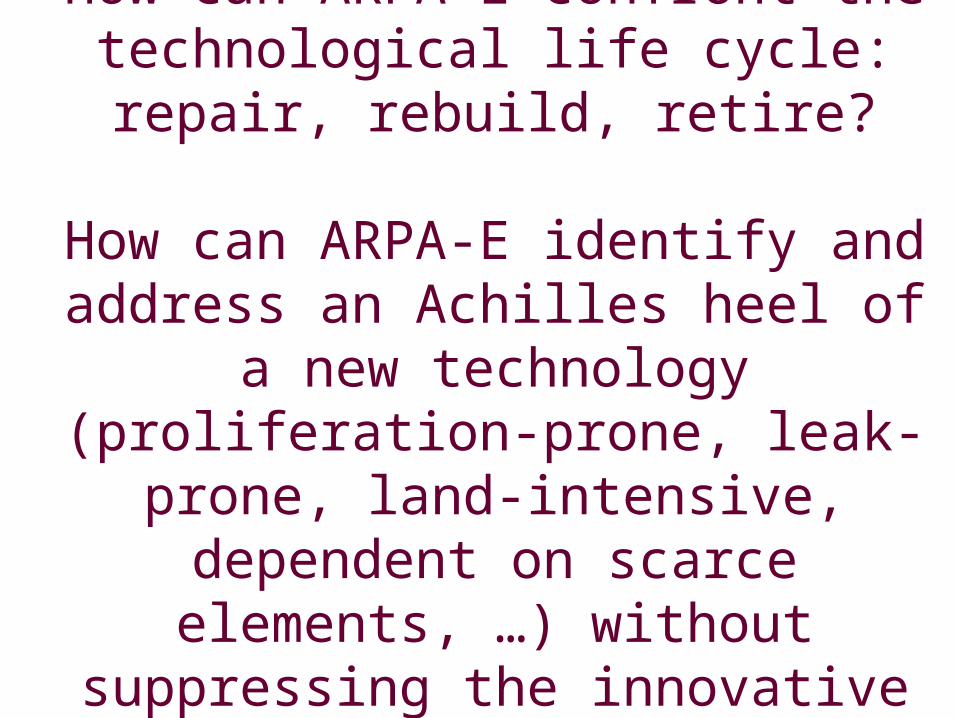
How can ARPA-E confront the technological life cycle: repair,
rebuild, retire?
How can ARPA-E identify and address an Achilles heel of a new
technology (proliferation-prone, leak-prone, land-intensive, dependent on
scarce elements, …) without suppressing the innovative spirit?

One-Billion High Emitters

Per-capita fossil-fuel CO2 emissions, 2005
1-
World emissions: 27 billion tons CO2
STABILIZATION
AVERAGE TODAY
Source: IEA WEO 2007
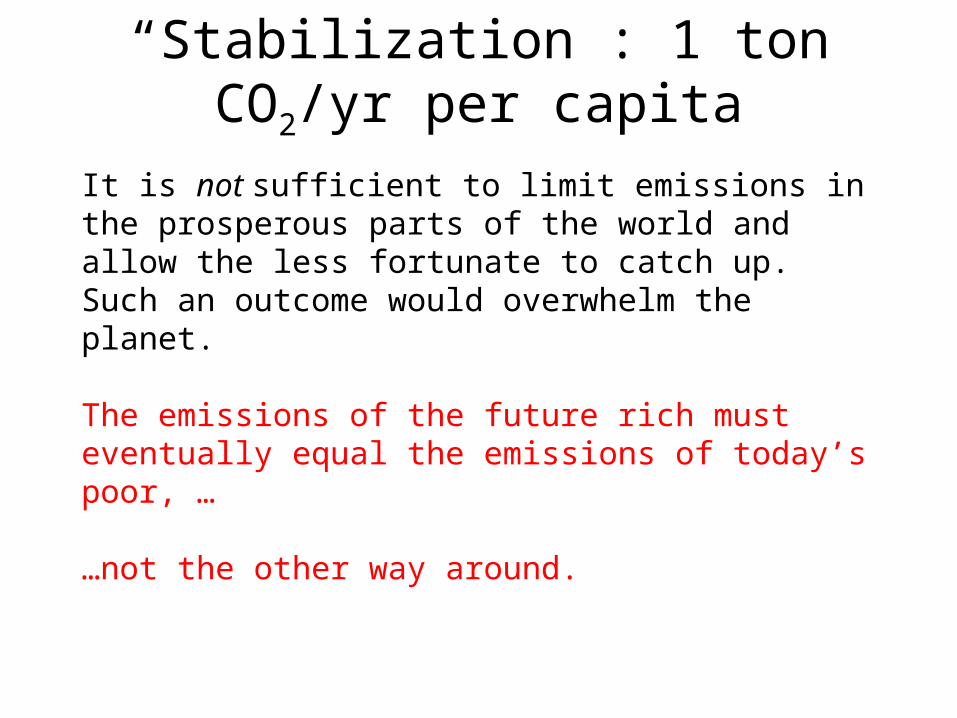
“Stabilization”: 1 ton CO2/yr per capita
It is not sufficient to limit emissions in the prosperous parts of the world and allow the less fortunate to catch up. Such an outcome would overwhelm the planet.
The emissions of the future rich must eventually equal the emissions of today’s poor, …
…not the other way around.
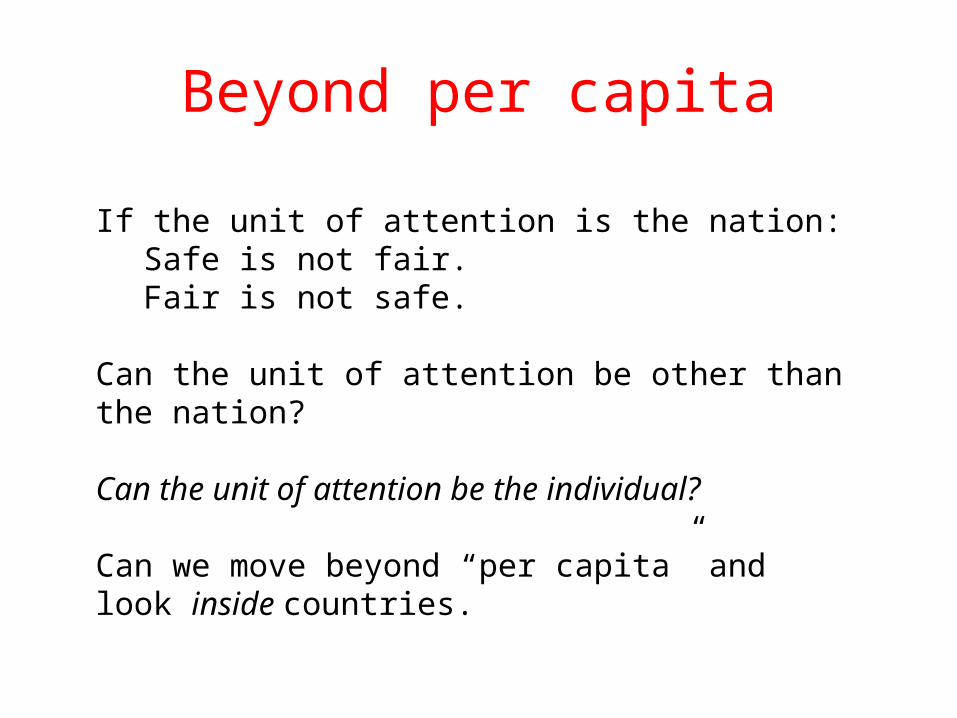
Beyond per capita
If the unit of attention is the nation:Safe is not fair.Fair is not safe.
Can the unit of attention be other than the nation?
Can the unit of attention be the individual?
Can we move beyond “per capita” and look inside countries.

Binned global population and emissions, 2003
Vertical axis: tons CO2 per person per year.Shown: Global population, CO2 emissions only from fossil fuels.Bin boundaries are per capita values today for Brazil (2) and European Union (10)
“High emitters”
“Low emitters”
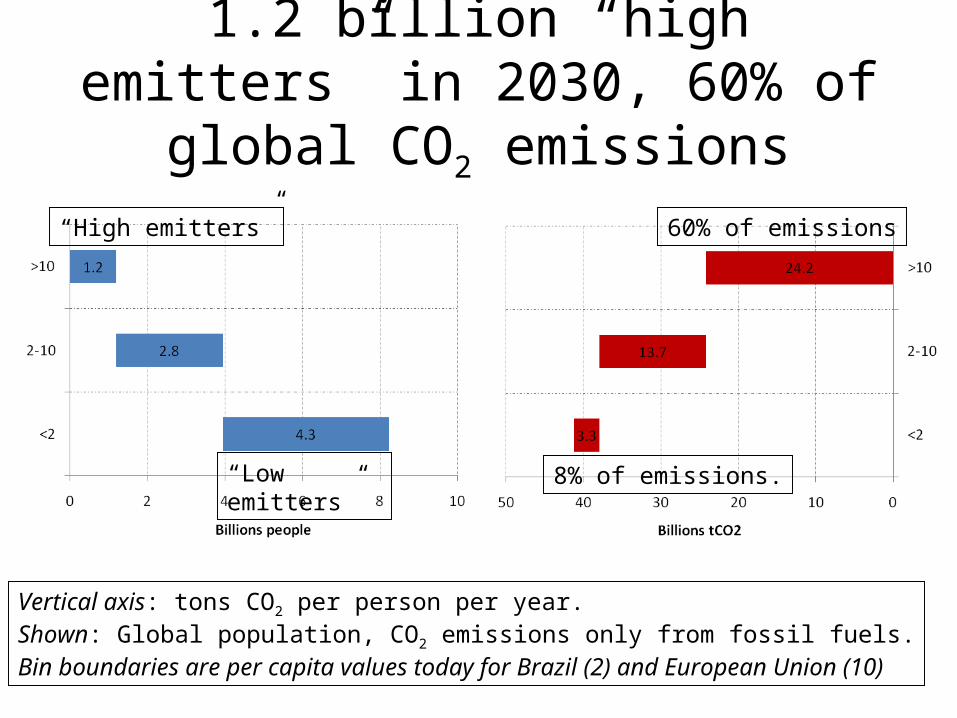
1.2 billion “high emitters” in 2030, 60% of global CO2 emissions
Vertical axis: tons CO2 per person per year.Shown: Global population, CO2 emissions only from fossil fuels.Bin boundaries are per capita values today for Brazil (2) and European Union (10)
8% of emissions.
“High emitters”
“Low emitters”
60% of emissions
2-10
<2
>10
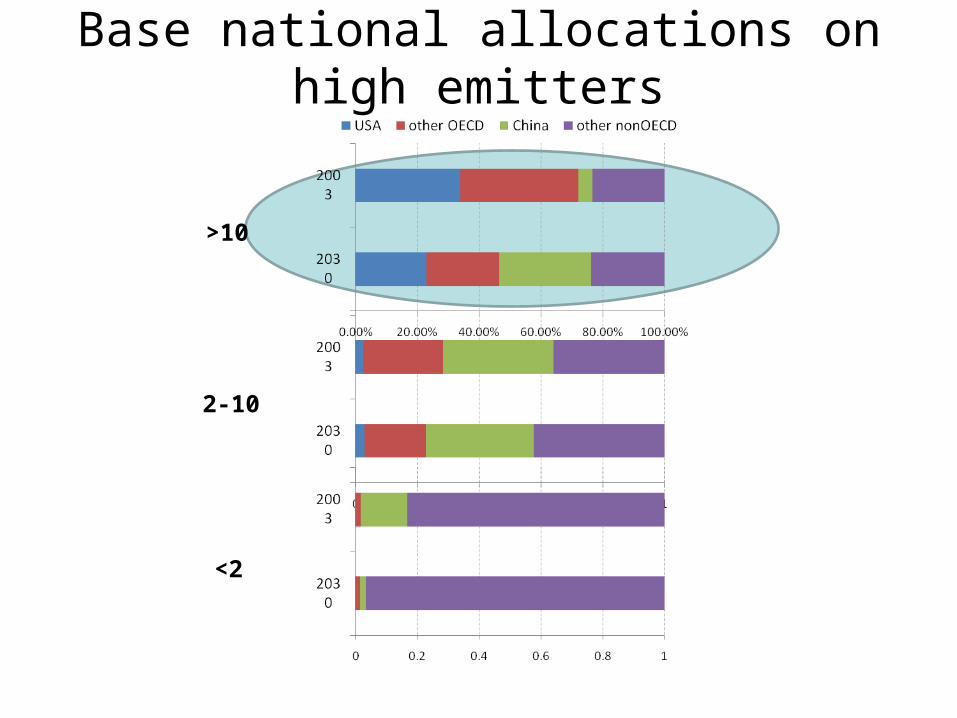
Base national allocations on high emitters

A 2009 Paper
Proceedings of the National Academy of Sciences, July 21, 2009, vol. 106 no. 29, pp. 11884-11888
Published online before print July 6, 2009, doi: 10.1073/pnas.0905232106
Available at: http://www.pnas.org/content/106/29/11884

Rank all people in the world, highest to lowest emissions
2003, 26 GtCO2 total
2030, 43 GtCO2 total
For 2030, use EIA regional CO2 projections, assume regional emissions distributions are unchanged.

Count high-emitting individuals
GtCO2
2003, 26 GtCO2
2030, 43 GtCO22030

National Emissions
Target
Required ReductionsPersonal Emissions Cap
+ + + + +
+
=
=
Individual emissions above the cap determine the required reduction
Source: Steve Pacala, private communication, 2008

Regional emissions in 2030
30 Gt global cap, 10.8 individual cap
For a 30 GtCO2 global cap in 2030, four regions have comparable assignments
Non-OECD minus China
30 Gt global cap, 10.8 t individual cap
U.S.
China
OECD minus U.S.
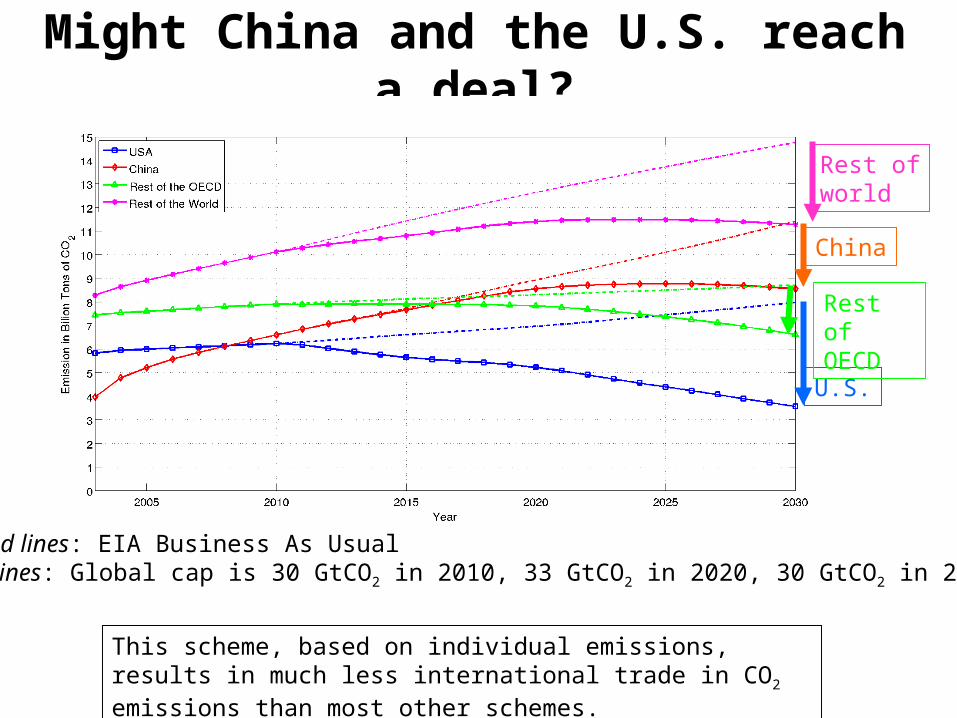
Might China and the U.S. reach a deal?
Dashed lines: EIA Business As UsualSolid lines: Global cap is 30 GtCO2 in 2010, 33 GtCO2 in 2020, 30 GtCO2 in 2030.
China
U.S.
This scheme, based on individual emissions, results in much less international trade in CO2 emissions than most other schemes.
Rest ofworld
Rest of OECD

The developing world will decide what kind of planet we live on.
For a while longer, the industrialized countries will lead.
But “R-P countries” will dominate global environmental problem-solving over this century.
R-P countries are countries with a significant fraction of rich people sharing global consumptions patterns
andabundant abject poverty.

How can ARPA-E promote globally coordinated green innovation?

What about Global Poverty?

2-10
<2
>10
Population distribution across 4 regionsThe poor need not be denied fossil fuels
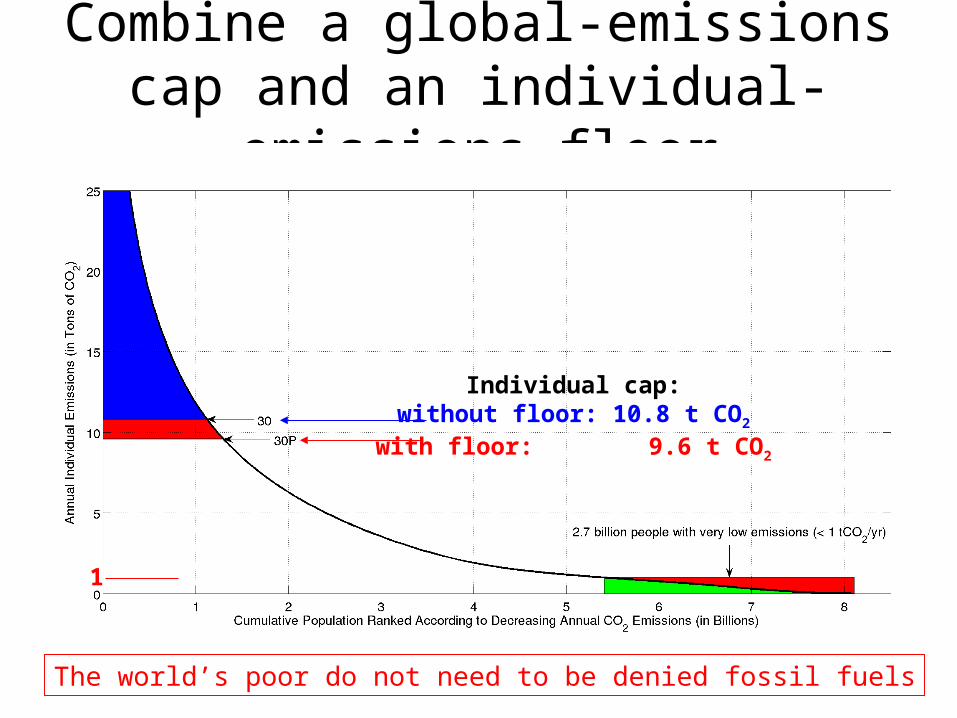
Combine a global-emissions cap and an individual-emissions floor
Individual cap:without floor: 10.8 t CO2
with floor: 9.6 t CO2
1
The world’s poor do not need to be denied fossil fuels

What does 1 tCO2/person-yr allow today?
Direct Energy Use
Household rate of use (4.5 people)
Individual emissions (kgCO2/yr)
Cooking 1 LPG canister per month
120
Transport 70 km by bus, car, motorbike per day
220
Electricity 800 kWh per year 160
Total 500
1 tCO2/yr: Double the “direct” emissions to account for “indirect” emissions.
Should ARPA-E tithe? Could a tenth of ARPA-E be
devoted to finding technological solutions for the energy problems
of the very poor?

Concluding Thoughts
Grounds for optimism
•The world today has a terribly inefficient energy system.
•Carbon emissions have just begun to be priced.
•Most of the 2060 physical plant is not yet built.

Prospicience
Prospicience: “The art [and science] of looking ahead.”
In the past 50 years we have become aware of the history of our Universe, our Earth, and life.
Can we achieve a comparable understanding of human civilization at various future times: 50 years ahead – vs. 500 years and vs. 5000 years?
We have scarcely begun to ask: What are we on Earth to do?
Never in history has the work of so few led to so much being asked of so many!
The “few” are the climate science researchers.
The “many” are the rest of us.
Understandably, we wish we lived on a larger planet, with a larger atmosphere so that our emissions would be less significant –
and also a planet with larger fisheries, bigger forests, more abundant ground water, so that all our actions mattered less.

Fitting on the Earth
But our planet, Earth, is the only one we have.
Fortunately:
Our science has discovered threats fairly early;
We can identify a myriad of helpful technologies;
We have a moral compass that tells us to care not only about those alive today but also about the collective future of our species.
What has seemed too hard becomes what simply must be done.

Co-authors, recent papersWedges
Steve PacalaRoberta HotinskiJeff Greenblatt
Nuclear powerAlex Glaser
One-billion high emittersShoibal ChakravartyAnanth Chikkatur (Harvard)Heleen de Coninck (Energy Research Center of the Netherlands)Steve PacalaMassimo Tavoni (FEEM, Milan)
Related Documents