Volume IV 2012–2013 Latin America High Yield Comprehensive Analysis of ‘B+’ Issuers and Below

Fitch Latin America High Yield 2012-2013
Oct 30, 2014
Comprehensive analysis of ‘B+’ Issuers and below by Fitch
Welcome message from author
This document is posted to help you gain knowledge. Please leave a comment to let me know what you think about it! Share it to your friends and learn new things together.
Transcript
Volume IV 2012–2013
Latin America High Yield Comprehensive Analysis of ‘B+’ Issuers and Below

Latin America High Yield
November 8, 2012
Corporates
Table of Contents
Executive Summary .................................................. 1
Latin America Non-Financial Institutions Corporate
Financial Statistics ................................................ 11
AES Andres Dominicana, Ltd. .................................. 14
Alto Palermo S.A. (APSA) ........................................ 19
Arcor S.A.I.C. ............................................................ 25
Arendal, S. de R.L. de C.V. ...................................... 31
Axtel, S.A.B. de C.V. ................................................. 33
Bio-PAPPEL, S.A.B. de C.V. .................................... 39
Cablevision S.A. ....................................................... 45
CAP Limited .............................................................. 51
Capex S.A. ............................................................... 56
Ceagro Agricola S.A. ................................................ 62
Celulosa Argentina Ltda. .......................................... 67
CEMEX, S.A.B. de C.V. ............................................ 71
Cimento Tupi S.A. ..................................................... 77
CLISA Compania Latinoamericana de
Infraestructura y Servicios ..................................... 82
Compañía de Transporte de Energía Eléctrica en Alta
Tensión Transener S.A. (Transener) ..................... 86
Corporacion Electrica Nacional S.A.
(CORPOELEC) .............................................. 92
Corporacion Pesquera Inca SAC .............................. 95
Cresud S.A.C.I.F. y A. .............................................. 100
Digicel Group Limited ............................................... 106
Empresa Generadora de Electricidad Haina, S.A. .... 111
Empresa Generadora de Electricidad Itabo, S.A. ..... 116
Gol Linhas Aereas Inteligentes S.A. ......................... 121
Grupo Famsa, S.A.B. de C.V. ................................... 127
Grupo Posadas, S.A. de C.V. ................................... 132
Grupo Senda Autotransporte, S.A. de C.V.
(Grupo Senda) ...................................................... 138
Industrias Metalurgicas Pescarmona S.A. (IMPSA) ... 144
Inversiones y Representaciones S.A. ....................... 150
Maestro Peru S.A. (Maestro) .................................... 156
Marfrig Alimentos S.A. .............................................. 160
Minerva S.A. ............................................................. 165
OAS S.A. .................................................................. 170
OGX Petroleo e Gas Participações S.A. ................... 180
Pan American Energy LLC ....................................... 185
Petroleos de Venezuela S.A. (PDVSA) .................... 189
Rede Energia S.A. .................................................... 193
Rodopa Industria e Comercio de Alimentos Ltda. .... 199
SANLUIS Rassini S.A. de C.V.. ................................ 203
Servicios Corporativos Javer, S.A.P.I. de C.V. ......... 207
Sidetur (Siderurgica del Turbio, S.A.) ....................... 213
Sifco S.A. .................................................................. 216
Telecom Argentina S.A. ............................................ 221
Transportadora de Gas del Norte S.A. (TGN) .......... 225
Transportadora de Gas del Sur S.A. (TGS) .............. 233
Urbi Desarrollos Urbanos, S.A. B. de C.V. ............... 238
Virgolino de Oliveira S.A. Açúcar e Álcool ................ 243
WPE International Cooperatief (WPEI) ..................... 249
YPF S.A. ................................................................... 255
Fitch Analyst Directory ............................................. 260
www.fitchratings.com November 8, 2012
Corporates
Latin America High Yield Comprehensive Analysis of ‘B+’ Issuers and Below
Credit Outlook Turns Mildly Positive for Speculative Credits
Improving Macroeconomic Backdrop: Fitch forecasts GDP growth to be 3.9% in 2013 in
Latin America, an improvement from 3.0% in 2012. Consumer demand is strong due to low
unemployment levels, rising wages, modest inflation, improving consumer confidence, and
wider access to credit. The key growth engine for 2013 is Brazil, which also has the highest
number of leveraged corporates in the ‘B’ rating category. Fitch expects growth to reach 4.2%
in Brazil during 2013, a sharp improvement from forecasted growth of 1.5% in 2012.
Record Capital Market Activity Lowers Refinancing Risk: Latin America corporates issued
USD48 billion of debt in the international capital markets during the first nine months of 2012.
This figure compares favorably with USD51 billion of issuance activity during the 12 months of
2011. Speculative credits such as Cemex, Digicel, Maestro, Minerva, PDVSA, Virgolino,
Cimento Tupi, OAS, OGX, and VRG Linhas Aereas were very active during 2012, issuing
about USD9 billion of debt.
Eurozone Financial Crisis Should Not Hurt Access to Credit: Concern over the potential for
a disorderly default in the eurozone has diminished. As a result, Fitch’s base case scenario
expects credit market access for Latin America corporates during 2013 to grow versus 2012
due to low interest rates in developed markets and high demand for emerging market debt. The
risk of bank credits being withdrawn from ‘B’ credits in Latin America due to the Euro crisis is
small and manageable.
Downgrades to Upgrade Ratio Should Revert to Normal Levels: The credit quality of highly
speculative corporate ratings in Latin America weakened sharply during the first nine months of
2012. Fitch downgraded nine corporates rated ‘B+’ and lower and upgraded only four similarly
rated companies. This compares with 23 upgrades and 21 downgrades for its broader Latin
America corporate portfolio. The 2.2x ratio of downgrades to upgrades during 2012 should
revert to around 1.0x during 2013.
Negative Leverage Trends: Leverage ratios have been weakening since 2009 for the 48
companies rated ‘B+’ and lower due to USD16 billion of additional debt, which was offset by
only USD1.4 billion of additional EBITDA. Lower levels of capex in 2013 and an improving
operating environment should reverse the trend. During the LTM, the aggregate total
debt/EBITDA ratio for these companies was 4.2x, while their collective net debt/EBTIDA ratio
was 3.4x. In comparison, during 2009 these leverage ratios were 3.4x and 2.5x, respectively.
Modest Direct Exposure to China and Commodities: Direct exposure to China and
commodity prices is low among the weakest credits in Latin America. Only seven of the 48
speculative corporates are in the metals and mining, pulp and paper, or oil and gas sectors.
All of their businesses are focused on their respective domestic markets.
Above-Average Recovery Prospects in the Event of a Default: Fitch’s bespoke analysis for
36 companies that have issued USD20 billion of bonds in the international capital markets
indicates above-average aggregate recovery levels of 70% in the event of a default. Concerns
about the bankruptcy framework in many markets, as well as the application and enforcement
of existing laws, can limit the uplift on issuance ratings.
Analysts Joe Bormann, CFA +1 312 368-3349 [email protected]
Jay Djemal +1 312 263-1032 [email protected]
Yolanda Torres +1 312 606-2301 [email protected]
Juan Pablo Arias +1 312 606-2329 [email protected]
Ingo Araujo +55 11 4504-2205 [email protected]
Ana P. Ares +54 11 5235-8121 [email protected]
Lucas Aristizabal +1 312 368-3260 [email protected]
Miguel Guzman Betancourt +52 81 8399-9100 [email protected]
Gabriela A. Catri +54 11 5235-8129 [email protected]
John C. Culver, CFA +1 312 368-3216 [email protected]
Gabriela Curutchet +54 11 5235-8122 [email protected]
Rogelio Gonzalez +52 81 8399-9100 [email protected]
Debora Jalles +55 21 4503-2629 [email protected]
Josseline Jenssen +591 2 277-4470 [email protected]
Viktoria Krane +1 212 908-0367, x1367 [email protected]
Managing Director of Latin America Corporates Daniel R. Kastholm, CFA +1 312 368-2070 [email protected]
Editorial Advisor Traci Dixon, Editor
Latin America High Yield 2
November 8, 2012
Corporates
Strong Balance Sheets but High Government Meddling in Argentina: Argentine corporates
have strong capital structures to mitigate issues such as high inflation, government intervention,
economic uncertainty, and limited access to debt markets. Access to local and international
debt markets is restricted due to concerns about the sovereign.
Brazilian Corporates Should Benefit from Government Actions: Brazilian corporates in the
‘B’ category are the most leveraged in Latin America. A rebound in the Brazilian economy
would be an important step in reversing the negative credit trends that have developed since
2009. Small companies such as Cimento Tupi, Rodopa, Sifco, and Virgolino would benefit
most from improving cash flow trends, as they do not have the business profile to attract
lending under a distressed scenario.
Corporate Governance Remains a Key Concern in Mexico: Many of the weakest credits in
Mexico are controlled by families. Concern about corporate governance is extremely high
among investors due to a bankruptcy regime that allows intra-company loans to be treated pari
pasu with external debt. From a macro perspective, the near-term outlook for Mexican
corporates is positive due to a rebound in its manufacturing sector.
2012 Portfolio Overview and Performance Review
Fitch’s portfolio of corporates rated ‘B+’ and lower grew to 48 issuers in 2012 from 43 during
2011. The growth of the this speculative group of issuers was due to the addition of five new
ratings in the ‘B’ category — Corporacion Electrica Nacional (Corpoelec), Maestro Peru,
Rodopa Industria e Comercio de Alimentos Ltda., SANLUIS Rassini, Virgolino de Oliveira S.A.,
and Acucar e Alcool — and the downgrade of four credits into the ‘B’ category from the ‘BB’
category — Corporacion Pesquera Inca SAC (COPEINCA), GOL Linhas Aereas Inteligentes
S.A., Pan American Energy LLC, and Urbi Desarrollos Urbanos, S.A.B. de C.V.
During 2012, Fitch withdrew the ‘B–’ rating of Agro Industrial Vista Alegre Ltda., the ‘B’ rating of
ODS S.A. and the ‘B’ rating of Galvao Participações. The only company to get upgraded out of
the ‘B’ category was TAM S.A., which was upgraded to ‘BB’ from ‘B+’ following its merger with
LATAM Airlines Group.
The credit performance of these 48 corporates was weaker than Fitch’s broader Latin America
portfolio. During the first nine months of 2012, Fitch upgraded the ratings of 23 corporates in
Latin America and downgraded the ratings of 21 companies. In contrast, among the highly
speculative ratings, downgrades outpaced upgrades by a ratio of 2.2x, as Fitch downgraded
nine corporates and only upgraded the ratings of four companies rated ‘B+’ or lower.
Upgrades included Arendal to ‘B’ from ‘B–’; TGN to ‘CCC’ from ‘D’; Grupo Senda to ‘B’ from
‘B–’; and TAM to ‘BB’ from ‘B+’. Notable downgrades include Urbi to ‘B’ from ‘BB–’; OGX to ‘B’
from ‘B+’; Axtel to ‘B–’, Rating Watch Negative, from ‘B’; and Transener to ‘CCC’ from ‘B–’.
The only defaults among Latin America corporates during 2012 were those of Rede Energia
and its subsidiaries, Centrais Eletricas do Para (Celpa) and Centrais Eletricas Matogrossenses
S.A. (Cemat). Rede Energia had been rated ‘B–’ since 2009 and was downgraded to ‘CCC’ in
2011, while Celpa and Cemat had been rated ‘B–’ since 2011. These defaults were due to the
lethal combination of weak liquidity, high leverage, poor cash flow generation, and large
investments.
Analysts (Continued) Francisco Mercadal +5 62 499-3340 [email protected]
Cecilia Minguillón +54 11 5235-8123 [email protected]
Alberto Moreno +52 81 8399-9100 [email protected]
Natalia O’Byrne +57 1 326-9999 [email protected]
Gisele Paolino +55 21 4503-2624 [email protected]
Renata Pinho +55 11 4504-2207 [email protected]
Sergio.Rodriguez, CFA +5281 8399-9100 [email protected]
Indalecio Riojas +52 81 8399-9100 [email protected]
Jose R. Romero +55 11 4504-2601 [email protected]
Alberto de los Santos +52 81 8399-9100 [email protected]
Mauro Storino +55 11 4503-2625 [email protected]
Fernando Torres +55 11 5235-8124 [email protected]
Julio Ugueto +58 212 286-3232 [email protected]
Jose Vertiz +1 212 908-0641 [email protected]
Liliana Yabiku +55 11 4504-2208 [email protected]
Latin America High Yield 3
November 8, 2012
Corporates
Improving Macroeconomic Backdrop; Inflation Is Key Risk
The profile of the lowest rated corporates in Latin America can broadly be broken into two
equal camps — those companies domiciled in Venezuela, Argentina, Jamaica, or the
Dominican Republic that face high systemic risk, and those whose credit profiles reflect specific,
individual corporate risks. Among the second camp, key credit risks may be related to issues
such as poor corporate governance, low liquidity, high leverage, and/or a weak business
position. The common denominator between both camps is that all corporates benefit from
strong regional growth and slow improvements in the global economy.
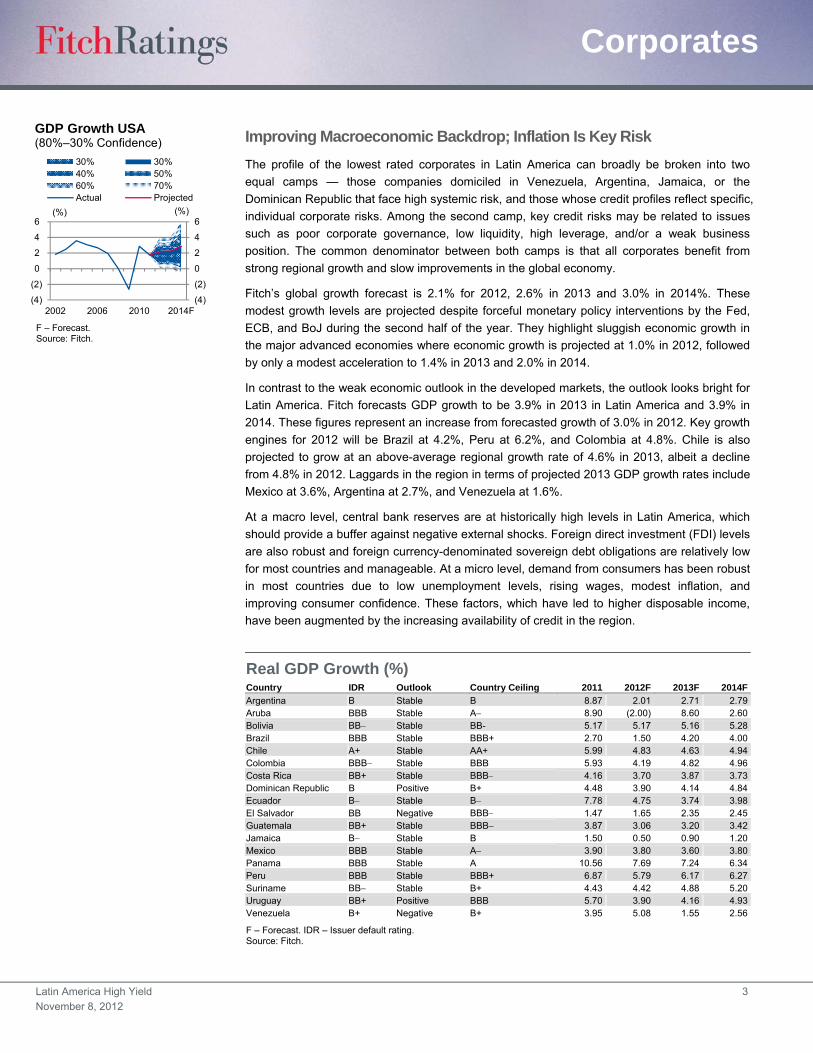
Fitch’s global growth forecast is 2.1% for 2012, 2.6% in 2013 and 3.0% in 2014%. These
modest growth levels are projected despite forceful monetary policy interventions by the Fed,
ECB, and BoJ during the second half of the year. They highlight sluggish economic growth in
the major advanced economies where economic growth is projected at 1.0% in 2012, followed
by only a modest acceleration to 1.4% in 2013 and 2.0% in 2014.
In contrast to the weak economic outlook in the developed markets, the outlook looks bright for
Latin America. Fitch forecasts GDP growth to be 3.9% in 2013 in Latin America and 3.9% in
2014. These figures represent an increase from forecasted growth of 3.0% in 2012. Key growth
engines for 2012 will be Brazil at 4.2%, Peru at 6.2%, and Colombia at 4.8%. Chile is also
projected to grow at an above-average regional growth rate of 4.6% in 2013, albeit a decline
from 4.8% in 2012. Laggards in the region in terms of projected 2013 GDP growth rates include
Mexico at 3.6%, Argentina at 2.7%, and Venezuela at 1.6%.
At a macro level, central bank reserves are at historically high levels in Latin America, which
should provide a buffer against negative external shocks. Foreign direct investment (FDI) levels
are also robust and foreign currency-denominated sovereign debt obligations are relatively low
for most countries and manageable. At a micro level, demand from consumers has been robust
in most countries due to low unemployment levels, rising wages, modest inflation, and
improving consumer confidence. These factors, which have led to higher disposable income,
have been augmented by the increasing availability of credit in the region.
(4)
(2)
0
2
4
6
2002 2006 2010 2014F(4)
(2)
0
2
4
6
30% 30%40% 50%60% 70%Actual Projected
F – Forecast.Source: Fitch.
GDP Growth USA(80%–30% Confidence)
(%) (%)
Real GDP Growth (%) Country IDR Outlook Country Ceiling 2011 2012F 2013F 2014F
Argentina B Stable B 8.87 2.01 2.71 2.79Aruba BBB Stable A 8.90 (2.00) 8.60 2.60Bolivia BB Stable BB- 5.17 5.17 5.16 5.28Brazil BBB Stable BBB+ 2.70 1.50 4.20 4.00Chile A+ Stable AA+ 5.99 4.83 4.63 4.94Colombia BBB Stable BBB 5.93 4.19 4.82 4.96Costa Rica BB+ Stable BBB 4.16 3.70 3.87 3.73Dominican Republic B Positive B+ 4.48 3.90 4.14 4.84Ecuador B Stable B 7.78 4.75 3.74 3.98El Salvador BB Negative BBB 1.47 1.65 2.35 2.45Guatemala BB+ Stable BBB 3.87 3.06 3.20 3.42Jamaica B Stable B 1.50 0.50 0.90 1.20Mexico BBB Stable A 3.90 3.80 3.60 3.80Panama BBB Stable A 10.56 7.69 7.24 6.34Peru BBB Stable BBB+ 6.87 5.79 6.17 6.27Suriname BB Stable B+ 4.43 4.42 4.88 5.20Uruguay BB+ Positive BBB 5.70 3.90 4.16 4.93Venezuela B+ Negative B+ 3.95 5.08 1.55 2.56
F – Forecast. IDR – Issuer default rating. Source: Fitch.
Latin America High Yield 4
November 8, 2012
Corporates
Inflation remains a key risk for the region as loose monetary and fiscal policies in developed
markets have increased the money supply. Several central banks in Latin America have taken
actions to weaken their currencies in response to the measure taken by the Fed, ECB, and BoJ.
In Latin America, food and energy are a disproportionally high percentage of the consumer
basket. Food, as a percentage of the CPI basket, is more than 35% in Peru and ranges
between 20% and 30% in Brazil, Colombia, and Mexico. Any sharp increase in the prices for
these items could weaken disposable income in the region and could lower demand.
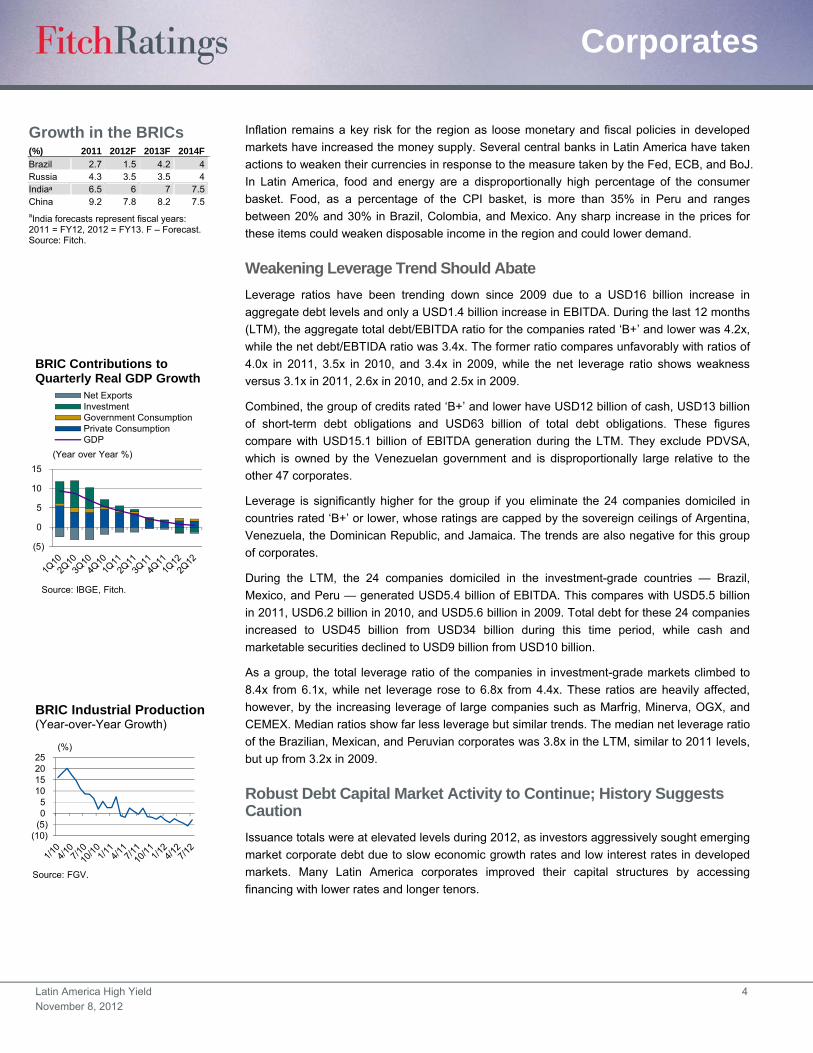
Weakening Leverage Trend Should Abate
Leverage ratios have been trending down since 2009 due to a USD16 billion increase in
aggregate debt levels and only a USD1.4 billion increase in EBITDA. During the last 12 months
(LTM), the aggregate total debt/EBITDA ratio for the companies rated ‘B+’ and lower was 4.2x,
while the net debt/EBTIDA ratio was 3.4x. The former ratio compares unfavorably with ratios of
4.0x in 2011, 3.5x in 2010, and 3.4x in 2009, while the net leverage ratio shows weakness
versus 3.1x in 2011, 2.6x in 2010, and 2.5x in 2009.
Combined, the group of credits rated ‘B+’ and lower have USD12 billion of cash, USD13 billion
of short-term debt obligations and USD63 billion of total debt obligations. These figures
compare with USD15.1 billion of EBITDA generation during the LTM. They exclude PDVSA,
which is owned by the Venezuelan government and is disproportionally large relative to the
other 47 corporates.
Leverage is significantly higher for the group if you eliminate the 24 companies domiciled in
countries rated ‘B+’ or lower, whose ratings are capped by the sovereign ceilings of Argentina,
Venezuela, the Dominican Republic, and Jamaica. The trends are also negative for this group
of corporates.
During the LTM, the 24 companies domiciled in the investment-grade countries — Brazil,
Mexico, and Peru — generated USD5.4 billion of EBITDA. This compares with USD5.5 billion
in 2011, USD6.2 billion in 2010, and USD5.6 billion in 2009. Total debt for these 24 companies
increased to USD45 billion from USD34 billion during this time period, while cash and
marketable securities declined to USD9 billion from USD10 billion.
As a group, the total leverage ratio of the companies in investment-grade markets climbed to
8.4x from 6.1x, while net leverage rose to 6.8x from 4.4x. These ratios are heavily affected,
however, by the increasing leverage of large companies such as Marfrig, Minerva, OGX, and
CEMEX. Median ratios show far less leverage but similar trends. The median net leverage ratio
of the Brazilian, Mexican, and Peruvian corporates was 3.8x in the LTM, similar to 2011 levels,
but up from 3.2x in 2009.
Robust Debt Capital Market Activity to Continue; History Suggests Caution
Issuance totals were at elevated levels during 2012, as investors aggressively sought emerging
market corporate debt due to slow economic growth rates and low interest rates in developed
markets. Many Latin America corporates improved their capital structures by accessing
financing with lower rates and longer tenors.
Growth in the BRICs (%) 2011 2012F 2013F 2014F
Brazil 2.7 1.5 4.2 4 Russia 4.3 3.5 3.5 4 Indiaᵃ 6.5 6 7 7.5 China 9.2 7.8 8.2 7.5 aIndia forecasts represent fiscal years: 2011 = FY12, 2012 = FY13. F – Forecast. Source: Fitch.
(5)
0
5
10
15
Net ExportsInvestmentGovernment ConsumptionPrivate ConsumptionGDP
Source: IBGE, Fitch.
(Year over Year %)
BRIC Contributions to Quarterly Real GDP Growth
(10)(5)05
10152025
Source: FGV.
(%)
BRIC Industrial Production(Year-over-Year Growth)
Latin America High Yield 5
November 8, 2012
Corporates
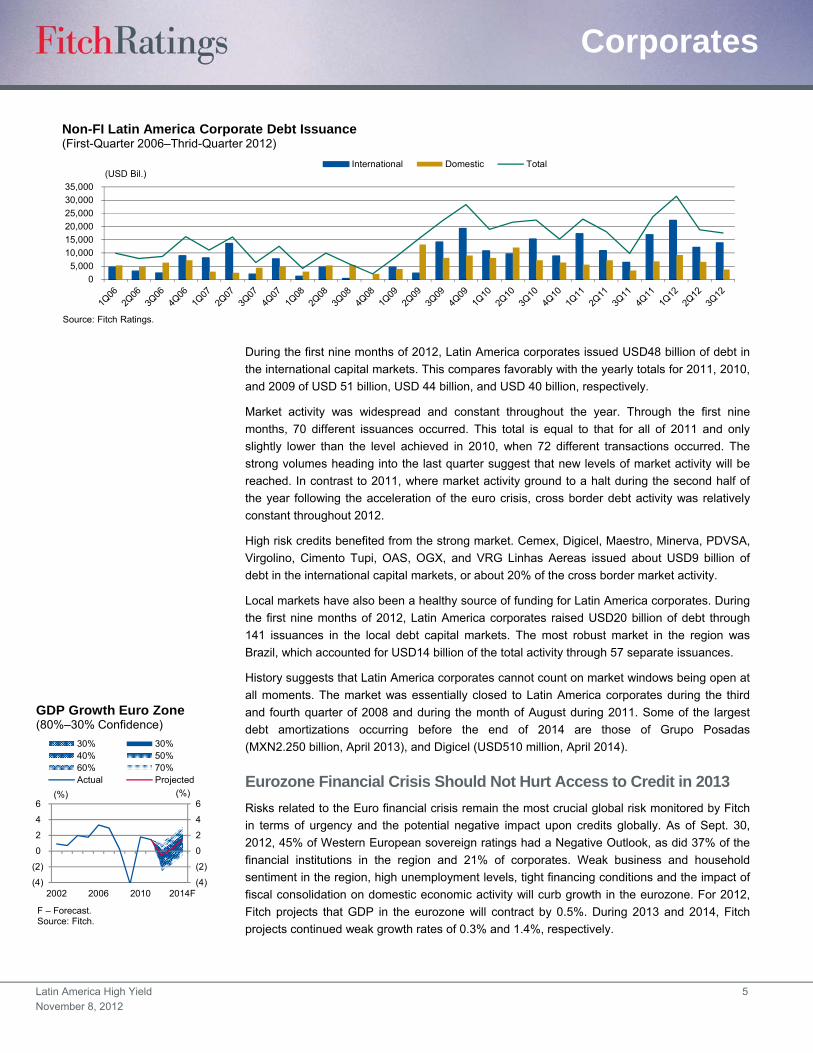
During the first nine months of 2012, Latin America corporates issued USD48 billion of debt in
the international capital markets. This compares favorably with the yearly totals for 2011, 2010,
and 2009 of USD 51 billion, USD 44 billion, and USD 40 billion, respectively.
Market activity was widespread and constant throughout the year. Through the first nine
months, 70 different issuances occurred. This total is equal to that for all of 2011 and only
slightly lower than the level achieved in 2010, when 72 different transactions occurred. The
strong volumes heading into the last quarter suggest that new levels of market activity will be
reached. In contrast to 2011, where market activity ground to a halt during the second half of
the year following the acceleration of the euro crisis, cross border debt activity was relatively
constant throughout 2012.
High risk credits benefited from the strong market. Cemex, Digicel, Maestro, Minerva, PDVSA,
Virgolino, Cimento Tupi, OAS, OGX, and VRG Linhas Aereas issued about USD9 billion of
debt in the international capital markets, or about 20% of the cross border market activity.
Local markets have also been a healthy source of funding for Latin America corporates. During
the first nine months of 2012, Latin America corporates raised USD20 billion of debt through
141 issuances in the local debt capital markets. The most robust market in the region was
Brazil, which accounted for USD14 billion of the total activity through 57 separate issuances.
History suggests that Latin America corporates cannot count on market windows being open at
all moments. The market was essentially closed to Latin America corporates during the third
and fourth quarter of 2008 and during the month of August during 2011. Some of the largest
debt amortizations occurring before the end of 2014 are those of Grupo Posadas
(MXN2.250 billion, April 2013), and Digicel (USD510 million, April 2014).
Eurozone Financial Crisis Should Not Hurt Access to Credit in 2013
Risks related to the Euro financial crisis remain the most crucial global risk monitored by Fitch
in terms of urgency and the potential negative impact upon credits globally. As of Sept. 30,
2012, 45% of Western European sovereign ratings had a Negative Outlook, as did 37% of the
financial institutions in the region and 21% of corporates. Weak business and household
sentiment in the region, high unemployment levels, tight financing conditions and the impact of
fiscal consolidation on domestic economic activity will curb growth in the eurozone. For 2012,
Fitch projects that GDP in the eurozone will contract by 0.5%. During 2013 and 2014, Fitch
projects continued weak growth rates of 0.3% and 1.4%, respectively.
0
5,000
10,000
15,000
20,000
25,000
30,000
35,000
International Domestic Total
Source: Fitch Ratings.
(USD Bil.)
Non-FI Latin America Corporate Debt Issuance (First-Quarter 2006–Thrid-Quarter 2012)
(4)
(2)
0
2
4
6
2002 2006 2010 2014F(4)
(2)
0
2
4
6
30% 30%40% 50%60% 70%Actual Projected
F – Forecast.Source: Fitch.
GDP Growth Euro Zone(80%–30% Confidence)
(%) (%)
Latin America High Yield 6
November 8, 2012
Corporates
Key euro-related risks for speculative Latin America corporates are whether capital market
access would disappear for a prolonged period of time and if bank lines would be withdrawn.
Secondary risks would be whether economic growth rates in the region would drop sharply if
broad-based support for the euro dissolved, which is not Fitch’s base case, and whether export
opportunities would diminish.
Positively for all corporates, including the ‘B’ rated companies in Latin America, concern over
the potential for a shock to the eurozone from a disorderly default has been lessened as
ongoing negotiations among politicians in Europe represent a willingness to maintain the
European Union. The willingness to make concessions, as well as the aggressive position
taken by the ECB, should result in a gradual normalization of financial market conditions.
Fitch’s base case scenario is that credit market access for Latin America corporates during
2013 will grow vis-à-vis 2012 given low interest rates and strong demand for emerging market
debt. This type of environment suggests that most corporates will have the opportunity to
refinance upcoming debt obligations, including the most speculative credits. It is doubtful,
however, that the pace of market activity will remain as steady as 2012.
The risk of bank credits being withdrawn from ‘B’ credits in Latin America due to the Euro crisis
is small and should be manageable. The largest foreign banking presence in the region is in
Chile, where foreign loans as a percentage of GDP is estimated to be close to 30%. Fitch has
no corporates rated in the ‘B’ range in that country. In contrast, the presence of foreign banks is
low in the countries where 60% of the ‘B’ rated corporates are domiciled — Argentina and
Brazil. In Brazil, foreign bank loans are less than 10% of GDP and in Argentina they are less
than 4% of GDP. If a credit line is withdrawn by a foreign bank in Brazil, most companies with
reasonable business prospects should be able to obtain financing either from a government or
private sector bank. The foreign banking presence in Mexico and Peru ranges between 12%
and 15% of GDP. These two countries combined account for 23% of the lowest rated credits.
Modest Direct Exposure to China and Commodities
The slowdown in China’s economy to 7.6% in second-quarter 2012 from 9.3% in 2011 has
refocused attention on the possibility of slower future growth rates. Fitch has trimmed its
expectations for China’s 2012 growth to 7.8% and expects growth to rebound slightly to 8.2%
in 2013 due to some modest quasi-fiscal stimulus.
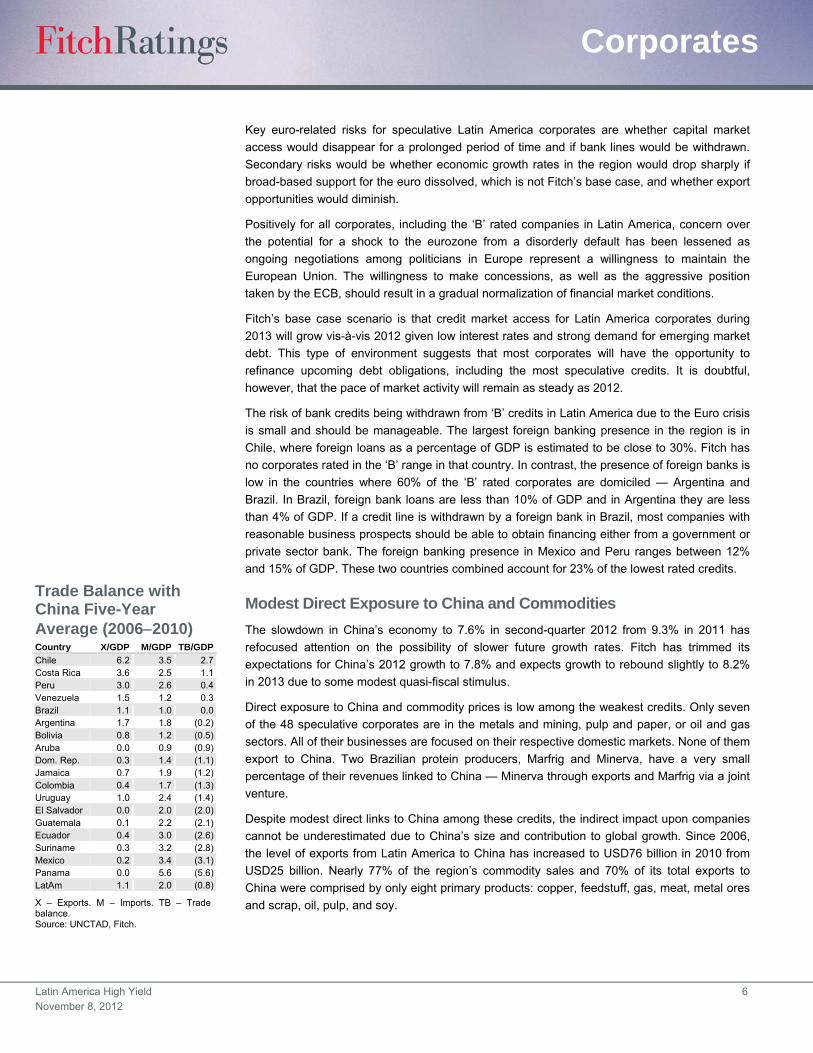
Direct exposure to China and commodity prices is low among the weakest credits. Only seven
of the 48 speculative corporates are in the metals and mining, pulp and paper, or oil and gas
sectors. All of their businesses are focused on their respective domestic markets. None of them
export to China. Two Brazilian protein producers, Marfrig and Minerva, have a very small
percentage of their revenues linked to China — Minerva through exports and Marfrig via a joint
venture.
Despite modest direct links to China among these credits, the indirect impact upon companies
cannot be underestimated due to China’s size and contribution to global growth. Since 2006,
the level of exports from Latin America to China has increased to USD76 billion in 2010 from
USD25 billion. Nearly 77% of the region’s commodity sales and 70% of its total exports to
China were comprised by only eight primary products: copper, feedstuff, gas, meat, metal ores
and scrap, oil, pulp, and soy.
Trade Balance with China Five-Year Average (20062010) Country X/GDP M/GDP TB/GDP
Chile 6.2 3.5 2.7 Costa Rica 3.6 2.5 1.1 Peru 3.0 2.6 0.4 Venezuela 1.5 1.2 0.3 Brazil 1.1 1.0 0.0 Argentina 1.7 1.8 (0.2) Bolivia 0.8 1.2 (0.5) Aruba 0.0 0.9 (0.9) Dom. Rep. 0.3 1.4 (1.1) Jamaica 0.7 1.9 (1.2) Colombia 0.4 1.7 (1.3) Uruguay 1.0 2.4 (1.4) El Salvador 0.0 2.0 (2.0) Guatemala 0.1 2.2 (2.1) Ecuador 0.4 3.0 (2.6) Suriname 0.3 3.2 (2.8) Mexico 0.2 3.4 (3.1) Panama 0.0 5.6 (5.6) LatAm 1.1 2.0 (0.8)
X – Exports. M – Imports. TB – Trade balance. Source: UNCTAD, Fitch.

Latin America High Yield 7
November 8, 2012
Corporates
Five Latin American economies — Brazil, Chile, Costa Rica, Peru, and Venezuela —
accounted for 81% of the total regional sales to the Asian giant in 2010. Among them, Brazil,
Chile, and Peru have achieved the greatest ratings momentum by turning a cyclical upturn into
credit strength, as they strengthened their external liquidity and solvency positions. Colombia
has also benefited. On the other side of the equation, Jamaica and the Dominican Republic
have suffered from rising energy and food costs, as it imports these products. These countries
faced balance of payments imbalances and confidence shocks, making them reliant upon the
IMF.
Higher Government Meddling in Argentina; Strong Balance Sheets
Argentine corporates represent 16 of the 48 companies rated in the ‘B’ category or lower by
Fitch. These companies have strong capital structures to mitigate issues such as high inflation,
government intervention, economic uncertainty, and limited access to debt markets. The
median liquidity ratio (measured by cash plus EBITDA/short-term debt) of these corporates is
2.0x, while the median leverage ratio is 1.6x. These key credit protection measures are much
stronger than that of their ‘B’ rated peer group, which are not constrained by systemic
government risk.
All but two of the corporate ratings in Argentina are capped by the ‘B’ country ceiling of the
Argentine government due to their exposure to the imposition of transfer and convertibility
restrictions on foreign currency. The trend has not been positive for capital controls as the
government has tightened exchange restrictions in response to declining reserve levels.
Several of the ratings were placed on Rating Watch Negative on Oct 31, 2012, following Fitch's
decision to place the ‘B’ foreign currency issuer default rting (IDR) of the Republic of Argentina
(Argentina) on Rating Watch Negative, as a result of increased uncertainty about the
government’s ability to service its international securities issued under New York Law due to a
ruling in a U.S. court about on a timely basis using the U.S. financial system. In and of itself,
this ruling should not directly affect the ability of the Argentine corporates to make payments on
their foreign currency obligations using the U.S. financial system. Indirectly, this ruling may
further affect the willingness of the Argentine government to provide corporates with foreign
exchange to make payments to their cross currency debt obligations.
Debt capital market activity has been limited for Argentine corporates due to concerns about
government interference in the private sector. During 2012, no Argentine corporate issued
bonds in the international markets. International issuances have ground to a halt following the
government’s actions after the 2011 elections — particularly the nationalization of YPF, the
0
100
200
300
400
500
600
700
2000 2001 2002 2003 2004 2005 2006 2007 2008 2009 2010 2011 2012
Oil Soy Copper Gold
Source: Bloomberg, Fitch.
(Index)
A Decade-Long Commodity Price Boom(Jan. 2000 = 100)
Fitch’s Ratings Actions During the Commodity Boom (2003–2011)
Country LT FC IDR
Net Notching
Brazil BBB 6 Argentinaª B 5 Peru BBB 4 Uruguayª BB+ 4 Bolivia B+ 2 Chile A+ 2 Colombia BBB 2 Panama BBB 2 Costa Rica BB+ 1 Ecuadorª B 1 Mexico BBB 1 Suriname B+ 1 Venezuela B+ 1 Aruba BBB 0 Guatemala BB+ 0 Dom. Rep.ª B -1 El Salvador BB -1 Jamaicaª B -2
ªTotals are influenced by multi-notch upgrades/downgrades during sovereign defaults or restructuring exercises. Note: Countries in bold have deeper trade and financial linkages with China. LT – Long-term. FC – Foreign currency. IDR – Issuer default ratings. Source: Fitch.
Latin America High Yield 8
November 8, 2012
Corporates
imposition of additional capital controls on select industries, and the change in the central
bank’s charter. Among companies with international ratings, only IRSA, IMPSA, Cresud, and
YPF placed bonds in the domestic market during 2012. Many companies are reluctant to tap
the local debt market following the nationalization of the pension funds, as they seek to limit the
government’s ownership of their stock and bonds.
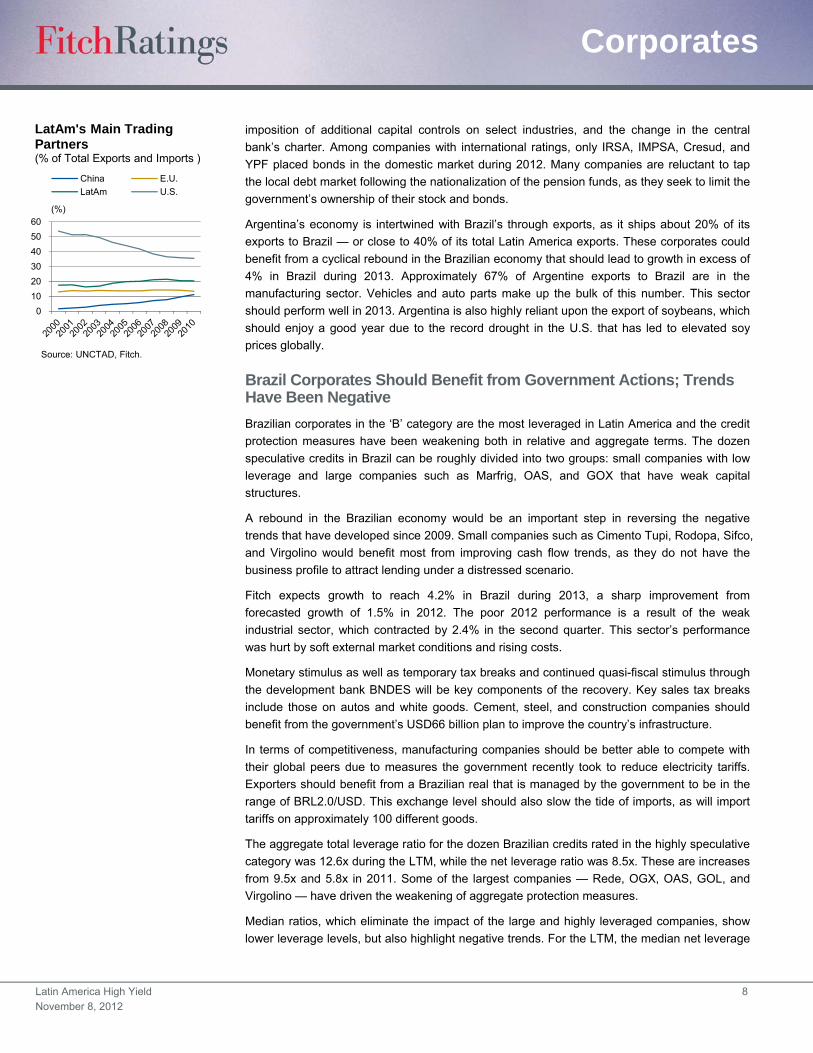
Argentina’s economy is intertwined with Brazil’s through exports, as it ships about 20% of its
exports to Brazil — or close to 40% of its total Latin America exports. These corporates could
benefit from a cyclical rebound in the Brazilian economy that should lead to growth in excess of
4% in Brazil during 2013. Approximately 67% of Argentine exports to Brazil are in the
manufacturing sector. Vehicles and auto parts make up the bulk of this number. This sector
should perform well in 2013. Argentina is also highly reliant upon the export of soybeans, which
should enjoy a good year due to the record drought in the U.S. that has led to elevated soy
prices globally.
Brazil Corporates Should Benefit from Government Actions; Trends Have Been Negative
Brazilian corporates in the ‘B’ category are the most leveraged in Latin America and the credit
protection measures have been weakening both in relative and aggregate terms. The dozen
speculative credits in Brazil can be roughly divided into two groups: small companies with low
leverage and large companies such as Marfrig, OAS, and GOX that have weak capital
structures.
A rebound in the Brazilian economy would be an important step in reversing the negative
trends that have developed since 2009. Small companies such as Cimento Tupi, Rodopa, Sifco,
and Virgolino would benefit most from improving cash flow trends, as they do not have the
business profile to attract lending under a distressed scenario.
Fitch expects growth to reach 4.2% in Brazil during 2013, a sharp improvement from
forecasted growth of 1.5% in 2012. The poor 2012 performance is a result of the weak
industrial sector, which contracted by 2.4% in the second quarter. This sector’s performance
was hurt by soft external market conditions and rising costs.
Monetary stimulus as well as temporary tax breaks and continued quasi-fiscal stimulus through
the development bank BNDES will be key components of the recovery. Key sales tax breaks
include those on autos and white goods. Cement, steel, and construction companies should
benefit from the government’s USD66 billion plan to improve the country’s infrastructure.
In terms of competitiveness, manufacturing companies should be better able to compete with
their global peers due to measures the government recently took to reduce electricity tariffs.
Exporters should benefit from a Brazilian real that is managed by the government to be in the
range of BRL2.0/USD. This exchange level should also slow the tide of imports, as will import
tariffs on approximately 100 different goods.
The aggregate total leverage ratio for the dozen Brazilian credits rated in the highly speculative
category was 12.6x during the LTM, while the net leverage ratio was 8.5x. These are increases
from 9.5x and 5.8x in 2011. Some of the largest companies — Rede, OGX, OAS, GOL, and
Virgolino — have driven the weakening of aggregate protection measures.
Median ratios, which eliminate the impact of the large and highly leveraged companies, show
lower leverage levels, but also highlight negative trends. For the LTM, the median net leverage
0
10
20
30
40
50
60
China E.U.
LatAm U.S.
Source: UNCTAD, Fitch.
(%)
LatAm's Main Trading Partners(% of Total Exports and Imports )
Latin America High Yield 9
November 8, 2012
Corporates
ratio of the Brazilian credits was 5.2x. This ratio compares unfavorably with those of 4.5x in
2011 and 4.0x in 2010 and is about 60% higher than during 2009 when it was 3.2x.
Corporate Governance Remains a Key Concern in Mexico
The 10 credits in Mexico rated in the range of ‘B+’ or lower are in industries such as cement,
home building, auto parts, oil services, food and beverage, packaging, retailing, lodging, and
transportation. This disparate group of credits have few things in common other than high
leverage. Some corporates, such as Arendal and Axtel, are small relative to their competitors.
Others, such as Urbi and Javer, are relatively big companies within fragmented industries that
exhibit high operating risk. Several companies are in the ‘B’ category because their
management teams have made poor strategic or financial decisions. This group includes
companies such as Posadas, Cemex, Bio-Pappel, Senda, and SANLUIS.
Unlike its peers in Brazil, the Mexican credits have been deleveraging during the past few
years. The median net leverage ratio of the Mexican credits during the LTM was 3.3x. This
ratio compares with 3.8x in 2011 and 3.7x in 2010 and 4.3x in 2009.
From a macro perspective, the near-term outlook for Mexican corporates is positive. Mexico’s
exposure to the U.S. is high due to trade and remittances. For 2013 and 2014, Fitch projects
U.S. growth rates of 2.25% and 2.8%, respectively. These growth rates should support growth
levels in Mexico of about 3.6% in 2013 and 3.8% during 2014. Continuing challenges that need
to be addressed to increase Mexico’s low growth rate relative to other emerging economies are
the country’s moderate saving and investment rates, monopolies in important industries, state
ownership of the energy sector, high labor informality, and limited flexibility.
A bright spot for the Mexican economy has been a revival of its manufacturing sector due to
the country’s close proximity to the U.S. market and rising costs in China. The auto sector has
probably been the sector that has benefited to the greatest degree. Unlike several countries in
Latin America that have a high degree of exposure to China and commodity prices, Mexico’s
risks as they relate to those issues are more modest. Exports to China have averaged about
0.2% of GDP during the past five years, while imports have averaged 3.4% of GDP.
While corporate governance is a global credit concern, unease is extremely high among
investors in the weakest credits in Mexico. The bankruptcy regime in Mexico is relatively new
and untested. There is a lack of precedent on many issues and rulings can be unpredictable.
Many of the lowest rated Mexican corporates are controlled by families, despite being publicly
traded companies. The participation of key family members as executives in business
operations is high and there is often a lack of independent members in the board of directors.
Related party transactions are numerous.
The actions of Mexican glassmaker Vitro have elevated concerns about corporate governance
and Mexico’s bankruptcy regime. Vitro defaulted on its debt during 2009 due to declining
demand for glass from construction and auto manufacturers, losses on derivative instruments,
and a weak capital structure. After the default, the company created a very large intracompany
loan. In late 2010, the company filed for bankruptcy and these intracompany loans were
recognized by the judge in the case, which allowed them to vote on the restructuring plan. This
essentially gave the company’s shareholders the ability to impose large losses on external
creditors and retain control.
Vitro’s actions could have repercussions for companies that want to issue bonds in the future.
CEMEX’s new facilities agreement, which was completed in September 2012, had restrictions
and conditions imposed on intercompany loans. Among them, any amount payable under any
Latin America High Yield 10
November 8, 2012
Corporates
intercompany claim of any obligor would be subordinated to claims under the new facilities
agreement and all other senior debt of such obligors in the event of insolvency or similar
proceedings in relation to Cemex. The Intercreditor Agreement established a Mexican-law
regulated voting trust mechanism whereby intercompany claims of Cemex entities incorporate
in Mexico at any time would be voted in a Concurso Mercantil proceeding in accordance with a
trustee that is under instruction from the third-party lenders under the new facilities agreement.
Recovery Prospects Are Above Average in the Event of a Default
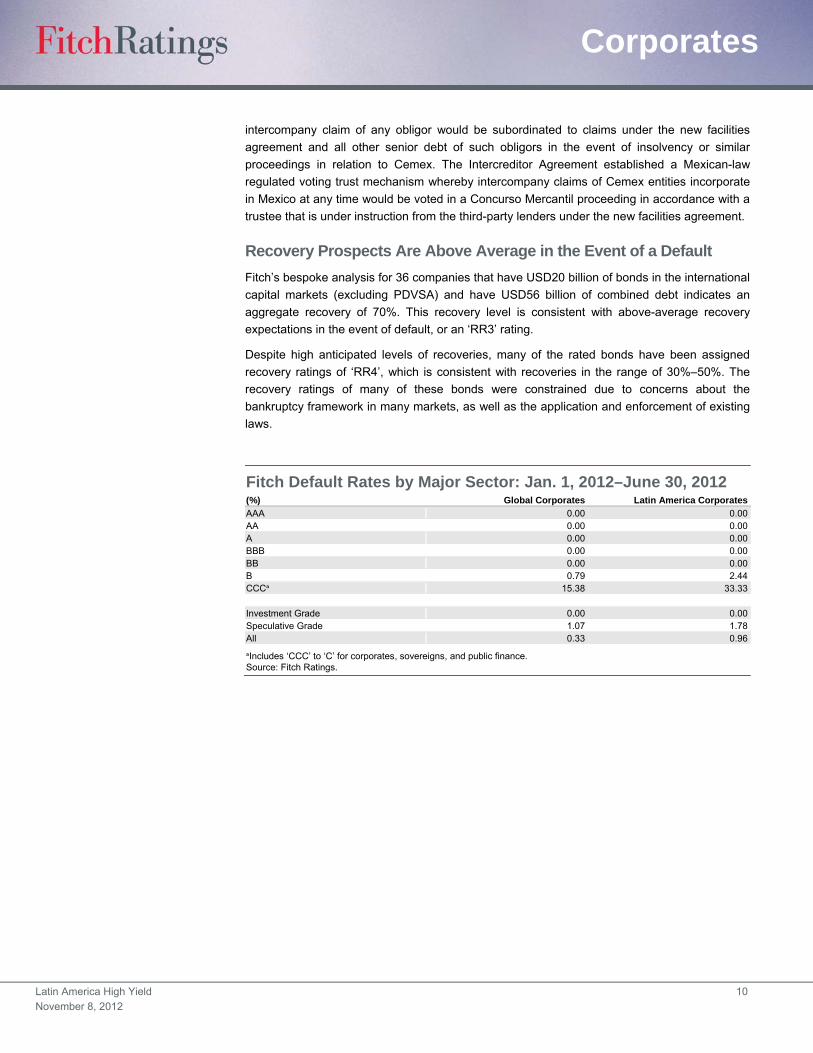
Fitch’s bespoke analysis for 36 companies that have USD20 billion of bonds in the international
capital markets (excluding PDVSA) and have USD56 billion of combined debt indicates an
aggregate recovery of 70%. This recovery level is consistent with above-average recovery
expectations in the event of default, or an ‘RR3’ rating.
Despite high anticipated levels of recoveries, many of the rated bonds have been assigned
recovery ratings of ‘RR4’, which is consistent with recoveries in the range of 30%–50%. The
recovery ratings of many of these bonds were constrained due to concerns about the
bankruptcy framework in many markets, as well as the application and enforcement of existing
laws.
Fitch Default Rates by Major Sector: Jan. 1, 2012–June 30, 2012 (%) Global Corporates Latin America Corporates
AAA 0.00 0.00AA 0.00 0.00A 0.00 0.00BBB 0.00 0.00BB 0.00 0.00B 0.79 2.44CCCᵃ 15.38 33.33
Investment Grade 0.00 0.00Speculative Grade 1.07 1.78All 0.33 0.96
ᵃIncludes ‘CCC’ to ‘C’ for corporates, sovereigns, and public finance. Source: Fitch Ratings.

Latin America High Yield 11
November 8, 2012
Corporates
Latin America Non-Financial Institutions Corporate Financial Statistics (USD Mil.) Cash Total Short-Term Debt Total Debt
Company Name LTM as of 2009 2010 2011 2012a 2009 2010 2011 2012a 2009 2010 2011 2012a
AES Andres Dominicana SPV (Aes Dominicana) June 2012 63 120 131 155 5 N.A. N.A. N.A. 161 164 164 164Alto Palermo S.A. (APSA) June 2012 17 18 42 31 62 52 30 18 246 226 180 172Arcor S.A.I.C. June 2012 186 190 99 126 178 140 161 154 417 497 449 472Arendal, S. de R. L. de C. V. June 2012 5 5 6 24 29 31 27 35 31 32 35 37Axtel, S.A.B. de C.V. June 2012 107 106 102 51 72 53 27 26 758 844 894 873Bio-PAPPEL, S.A.B. de C.V. June 2012 75 59 69 80 3 7 9 9 260 275 282 248Cablevision S.A. June 2012 38 100 126 143 52 33 72 101 542 512 655 652Capex S.A. June 2012 24 26 45 6 8 20 20 27 261 199 230 238Ceagro Agricola Ltda. June 2012 4 120 43 24 10 9 34 31 34 131 156 149Celulosa Argentina S.A. May 2012 6 6 7 7 80 69 77 72 212 173 157 159CEMEX, S.A.B. de C.V. June 2012 1,080 676 1,153 611 595 465 381 109 19,381 17,894 18,162 17,251Cimento Tupi S.A. June 2012 9 5 28 35 20 30 26 33 42 63 155 215Clarendon Alumina Production Limited (CAP) March 2011 1 1 4 N.A. 128 89 169 N.A. 460 373 424 N.A.Compania de Transporte de Energia Electrica en Alta Tension Transener S.A. June 2012 16 27 32 28 14 13 4 4 159 148 155 154Compania Latinoamericana de Infraestructura y Servicios June 2012 93 83 95 61 58 107 159 159 192 268 313 346Construtora OAS Ltda June 2012 138 312 608 384 19 46 87 98 146 199 414 571Corporacion Pesquera Inca SAC (COPEINCA) June 2012 12 34 60 43 38 16 48 83 144 218 266 293Cresud S.A.C.I.F. y A. June 2012 56 76 173 110 142 272 322 242 372 490 832 858Digicel Group Limited June 2012 492 1,041 613 343 350 166 388 228 3,140 3,793 4,528 4,887Empresa Generadora de Electricidad Haina, S.A. March 2012 40 111 184 149 6 20 48 48 202 207 281 301Empresa Generadora de Electricidad Itabo, S.A. June 2012 79 72 53 51 N.A. N.A. N.A. N.A. 125 131 129 129GOL Linhas Aereas Inteligentes S.A. June 2012 818 1,174 1,205 843 340 205 835 300 1,801 2,219 2,685 2,590Grupo Famsa, S.A.B. de C.V. June 2012 131 90 104 134 786 898 890 987 864 1,100 1,162 1,257Grupo Posadas, S.A. de C.V. June 2012 50 47 30 35 72 17 40 194 380 471 452 443Grupo Senda Autotransporte, S.A. de C.V. (Grupo Senda) June 2012 11 11 12 7 29 30 35 30 222 218 225 216Industrias Metalurgicas Pescarmona S.A. (IMPSA) June 2012 93 62 53 61 111 117 169 324 578 579 845 1,343Inversiones y Representaciones S.A. June 2012 68 86 93 84 93 156 167 127 370 421 597 584Maestro Peru S.A. June 2012 4 6 6 6 29 19 46 64 53 55 111 122Marfrig Alimentos S.A. June 2012 1,743 2,299 1,871 1,499 942 1,911 1,491 1,698 3,252 6,055 6,437 6,143Minerva S.A. June 2012 244 342 402 405 167 141 291 139 703 972 1,131 1,204OAS S.A. June 2012 392 690 788 925 185 393 521 635 719 1,554 2,019 2,410OGX Petroleo E Gas Participacoes S.A. June 2012 4,216 2,516 2,936 2,942 173 134 12 43 173 141 2,574 3,994Pan American Energy LLC June 2012 232 434 958 753 384 381 447 747 1,554 1,759 1,756 1,874Petroleos de Venezuela S.A. (PDVSA) Dec. 2011 6,981 6,017 8,610 N.A. 2,956 3,604 2,396 N.A. 21,445 24,950 34,892 N.A.Rede Energia S.A. June 2012 238 451 369 221 857 1,352 1,939 1,729 3,893 4,600 4,429 3,725Rodopa Industria e Comercio de Alimentos Ltda. June 2012 2 15 19 18 8 37 57 79 16 55 92 98SANLUIS Rassini, S.A. de C.V. June 2012 13 21 21 37 218 208 41 50 233 364 250 259Servicios Corporativos Javer, S.A.P.I. de C.V. June 2012 62 40 30 27 21 2 8 4 201 210 276 275Siderurgica del Turbio, S.A. (Sidetur) June 2012 58 51 29 45 19 9 5 5 106 90 83 79Sifco S.A. June 2012 49 72 90 99 43 141 155 176 220 360 367 368Telecom Argentina S.A. June 2012 341 351 658 521 202 11 4 7 217 41 31 29Transportadora de Gas del Norte S.A. (TGN) June 2012 81 124 153 175 381 414 453 473 381 414 453 473Transportadora de Gas del Sur S.A. (TGS) June 2012 271 275 107 150 4 4 4 4 401 380 379 378Urbi Desarrollos Urbanos, S.A.B. de C.V. June 2012 336 487 395 432 295 263 461 259 603 888 1,067 1,426Virgolino de Oliveira S/A Acucar e Alcool June 2012 N.A. 23 54 91 N.A. 332 271 324 N.A. 717 879 1,092WPE INTERNATIONAL Cooperatief U.A. June 2012 93 62 53 61 111 117 169 324 578 579 845 1,343YPF S.A. June 2012 567 639 341 102 1,238 1,561 1,894 2,186 1,804 1,969 2,980 2,350
aLTM. N.A. Not applicable. Continued on next page. Source: Fitch Ratings.

Latin America High Yield 12
November 8, 2012
Corporates
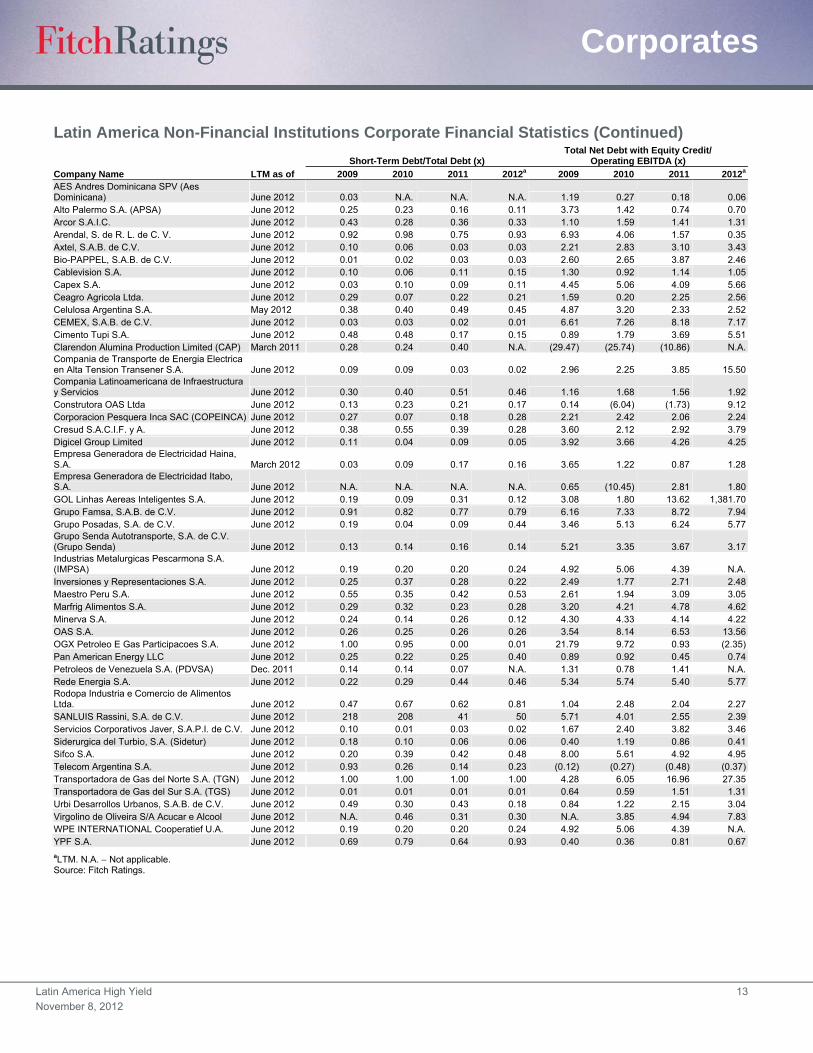
Latin America Non-Financial Institutions Corporate Financial Statistics (Continued)
Operating EBITDA (USD Mil.) Cash/Short-Term Debt (x) Cash+EBITDA/
Short-Term Debt (x)
Company Name LTM as of 2009 2010 2011 2012a 2009 2010 2011 2012a 2009 2010 2011 2012a
AES Andres Dominicana SPV (Aes Dominicana) June 2012 82 164 183 150 12.60 N.A. N.A. N.A. 29.00 N.A. N.A. N.A.Alto Palermo S.A. (APSA) June 2012 49 113 144 157 0.27 0.34 1.41 1.71 1.05 2.49 6.27 10.37 Arcor S.A.I.C. June 2012 210 193 248 265 1.04 1.36 0.62 0.82 2.22 2.74 2.16 2.54 Arendal, S. de R. L. de C. V. June 2012 4 7 18 36 0.17 0.17 0.24 0.70 0.30 0.38 0.93 1.75 Axtel, S.A.B. de C.V. June 2012 294 261 256 240 1.48 1.99 3.74 1.95 5.55 6.91 13.13 11.15 Bio-PAPPEL, S.A.B. de C.V. June 2012 71 81 55 68 23.23 9.02 7.68 9.25 45.36 21.34 13.78 17.13 Cablevision S.A. June 2012 389 449 464 483 0.73 3.07 1.76 1.42 8.22 16.86 8.26 6.22 Capex S.A. June 2012 53 34 45 41 3.18 1.25 2.22 0.22 10.21 2.93 4.44 1.75 Ceagro Agricola Ltda. June 2012 19 58 50 49 0.36 12.98 1.27 0.78 2.31 19.31 2.77 2.37 Celulosa Argentina S.A. May 2012 42 52 65 60 0.08 0.08 0.09 0.10 0.60 0.84 0.93 0.93 CEMEX, S.A.B. de C.V. June 2012 2,768 2,372 2,080 2,321 1.82 1.45 3.02 5.62 6.47 6.55 8.48 26.97 Cimento Tupi S.A. June 2012 37 32 34 33 0.46 0.15 1.06 1.05 2.26 1.23 2.37 2.04 Clarendon Alumina Production Limited (CAP) March 2011 (16) (14) (39) N.A. 0.01 0.01 0.02 N.A. (0.11) (0.15) (0.20) N.A.Compania de Transporte de Energia Electrica en Alta Tension Transener S.A. June 2012 48 54 32 8 1.21 2.05 7.44 7.36 4.72 6.10 14.84 9.48 Compania Latinoamericana de Infraestructura y Servicios June 2012 85 110 140 148 1.60 0.78 0.60 0.38 3.06 1.81 1.47 1.31 Construtora OAS Ltda June 2012 63 19 112 21 7.24 6.74 6.98 3.90 10.58 7.14 8.27 4.11 Corporacion Pesquera Inca SAC (COPEINCA) June 2012 60 76 100 112 0.33 2.13 1.27 0.52 1.88 6.85 3.36 1.87 Cresud S.A.C.I.F. y A. June 2012 88 195 226 197 0.39 0.28 0.54 0.45 1.01 1.00 1.24 1.27 Digicel Group Limited June 2012 676 753 919 1,070 1.41 6.27 1.58 1.51 3.34 10.80 3.95 6.21 Empresa Generadora de Electricidad Haina, S.A. March 2012 45 79 112 119 6.59 5.66 3.86 3.13 14.02 9.67 6.21 5.62 Empresa Generadora de Electricidad Itabo, S.A. June 2012 70 (6) 27 43 N.A. N.A. N.A. N.A. N.A. N.A. N.A. N.A.GOL Linhas Aereas Inteligentes S.A. June 2012 320 581 109 1 2.40 5.72 1.44 2.81 3.34 8.55 1.57 2.82 Grupo Famsa, S.A.B. de C.V. June 2012 119 138 121 141 0.17 0.10 0.12 0.14 0.32 0.25 0.25 0.28 Grupo Posadas, S.A. de C.V. June 2012 95 83 68 71 0.70 2.73 0.76 0.18 2.02 7.57 2.47 0.54 Grupo Senda Autotransporte, S.A. de C.V. (Grupo Senda) June 2012 40 62 58 66 0.39 0.36 0.34 0.24 1.80 2.43 1.98 2.40 Industrias Metalurgicas Pescarmona S.A. (IMPSA) June 2012 99 102 180 N.A. 0.84 0.53 0.31 0.19 1.72 1.41 1.38 0.19 Inversiones y Representaciones S.A. June 2012 114 180 186 202 0.74 0.55 0.55 0.66 1.96 1.70 1.66 2.25 Maestro Peru S.A. June 2012 19 25 34 38 0.14 0.29 0.13 0.09 0.78 1.62 0.86 0.68 Marfrig Alimentos S.A. June 2012 471 891 954 1,005 1.85 1.20 1.25 0.88 2.35 1.67 1.89 1.47 Minerva S.A. June 2012 107 146 176 190 1.46 2.43 1.38 2.92 2.09 3.47 1.98 4.29 OAS S.A. June 2012 92 106 188 110 2.12 1.76 1.51 1.46 2.62 2.03 1.88 1.63 OGX Petroleo E Gas Participacoes S.A. June 2012 (186) (244) (389) (448) 24.38 18.77 248.09 68.32 23.31 16.94 215.18 57.92 Pan American Energy LLC June 2012 1,487 1,435 1,779 1,521 0.60 1.14 2.14 1.01 4.47 4.90 6.12 3.04 Petroleos de Venezuela S.A. (PDVSA) Dec. 2011 11,065 24,171 18,684 N.A. 2.36 1.67 3.59 N.A. 6.10 8.38 11.39 N.A.Rede Energia S.A. June 2012 684 723 752 607 0.28 0.33 0.19 0.13 1.08 0.87 0.58 0.48 Rodopa Industria e Comercio de Alimentos Ltda. June 2012 14 16 36 35 0.25 0.40 0.33 0.23 2.05 0.85 0.96 0.67 SANLUIS Rassini, S.A. de C.V. June 2012 39 86 90 93 0.06 0.10 0.51 0.74 0.24 0.51 2.69 2.60 Servicios Corporativos Javer, S.A.P.I. de C.V. June 2012 83 71 64 72 3.01 25.32 3.84 6.34 7.08 70.55 12.16 23.47 Siderurgica del Turbio, S.A. (Sidetur) June 2012 119 33 62 84 2.98 5.81 5.83 8.94 9.15 9.54 18.17 25.66 Sifco S.A. June 2012 21 51 56 54 1.15 0.51 0.58 0.56 1.65 0.88 0.94 0.87 Telecom Argentina S.A. June 2012 1,032 1,151 1,312 1,339 1.69 33.02 148.32 76.00 6.80 141.48 444.05 271.39 Transportadora de Gas del Norte S.A. (TGN) June 2012 70 48 18 11 0.21 0.30 0.34 0.37 0.40 0.42 0.38 0.39 Transportadora de Gas del Sur S.A. (TGS) June 2012 204 175 181 173 68.42 74.31 28.98 40.84 119.88 121.64 77.83 87.89 Urbi Desarrollos Urbanos, S.A.B. de C.V. June 2012 316 329 312 327 1.14 1.85 0.86 1.67 2.21 3.10 1.53 2.93 Virgolino de Oliveira S/A Acucar e Alcool June 2012 N.A. 180 167 128 N.A. 0.07 0.20 0.28 N.A. 0.61 0.81 0.67 WPE INTERNATIONAL Cooperatief U.A. June 2012 99 102 180 N.A. 0.84 0.53 0.31 0.19 1.72 1.41 1.38 0.19 YPF S.A. June 2012 3,130 3,728 3,275 3,358 0.46 0.41 0.18 0.05 2.99 2.80 1.91 1.58
aLTM. N.A. Not applicable. Continued on next page. Source: Fitch Ratings.
Latin America High Yield 13
November 8, 2012
Corporates
Latin America Non-Financial Institutions Corporate Financial Statistics (Continued)
Short-Term Debt/Total Debt (x) Total Net Debt with Equity Credit/
Operating EBITDA (x)
Company Name LTM as of 2009 2010 2011 2012a 2009 2010 2011 2012a
AES Andres Dominicana SPV (Aes Dominicana) June 2012 0.03 N.A. N.A. N.A. 1.19 0.27 0.18 0.06Alto Palermo S.A. (APSA) June 2012 0.25 0.23 0.16 0.11 3.73 1.42 0.74 0.70Arcor S.A.I.C. June 2012 0.43 0.28 0.36 0.33 1.10 1.59 1.41 1.31Arendal, S. de R. L. de C. V. June 2012 0.92 0.98 0.75 0.93 6.93 4.06 1.57 0.35Axtel, S.A.B. de C.V. June 2012 0.10 0.06 0.03 0.03 2.21 2.83 3.10 3.43Bio-PAPPEL, S.A.B. de C.V. June 2012 0.01 0.02 0.03 0.03 2.60 2.65 3.87 2.46Cablevision S.A. June 2012 0.10 0.06 0.11 0.15 1.30 0.92 1.14 1.05Capex S.A. June 2012 0.03 0.10 0.09 0.11 4.45 5.06 4.09 5.66Ceagro Agricola Ltda. June 2012 0.29 0.07 0.22 0.21 1.59 0.20 2.25 2.56Celulosa Argentina S.A. May 2012 0.38 0.40 0.49 0.45 4.87 3.20 2.33 2.52CEMEX, S.A.B. de C.V. June 2012 0.03 0.03 0.02 0.01 6.61 7.26 8.18 7.17Cimento Tupi S.A. June 2012 0.48 0.48 0.17 0.15 0.89 1.79 3.69 5.51Clarendon Alumina Production Limited (CAP) March 2011 0.28 0.24 0.40 N.A. (29.47) (25.74) (10.86) N.A.Compania de Transporte de Energia Electrica en Alta Tension Transener S.A. June 2012 0.09 0.09 0.03 0.02 2.96 2.25 3.85 15.50Compania Latinoamericana de Infraestructura y Servicios June 2012 0.30 0.40 0.51 0.46 1.16 1.68 1.56 1.92Construtora OAS Ltda June 2012 0.13 0.23 0.21 0.17 0.14 (6.04) (1.73) 9.12Corporacion Pesquera Inca SAC (COPEINCA) June 2012 0.27 0.07 0.18 0.28 2.21 2.42 2.06 2.24Cresud S.A.C.I.F. y A. June 2012 0.38 0.55 0.39 0.28 3.60 2.12 2.92 3.79Digicel Group Limited June 2012 0.11 0.04 0.09 0.05 3.92 3.66 4.26 4.25Empresa Generadora de Electricidad Haina, S.A. March 2012 0.03 0.09 0.17 0.16 3.65 1.22 0.87 1.28Empresa Generadora de Electricidad Itabo, S.A. June 2012 N.A. N.A. N.A. N.A. 0.65 (10.45) 2.81 1.80GOL Linhas Aereas Inteligentes S.A. June 2012 0.19 0.09 0.31 0.12 3.08 1.80 13.62 1,381.70Grupo Famsa, S.A.B. de C.V. June 2012 0.91 0.82 0.77 0.79 6.16 7.33 8.72 7.94Grupo Posadas, S.A. de C.V. June 2012 0.19 0.04 0.09 0.44 3.46 5.13 6.24 5.77Grupo Senda Autotransporte, S.A. de C.V. (Grupo Senda) June 2012 0.13 0.14 0.16 0.14 5.21 3.35 3.67 3.17Industrias Metalurgicas Pescarmona S.A. (IMPSA) June 2012 0.19 0.20 0.20 0.24 4.92 5.06 4.39 N.A.Inversiones y Representaciones S.A. June 2012 0.25 0.37 0.28 0.22 2.49 1.77 2.71 2.48Maestro Peru S.A. June 2012 0.55 0.35 0.42 0.53 2.61 1.94 3.09 3.05Marfrig Alimentos S.A. June 2012 0.29 0.32 0.23 0.28 3.20 4.21 4.78 4.62Minerva S.A. June 2012 0.24 0.14 0.26 0.12 4.30 4.33 4.14 4.22OAS S.A. June 2012 0.26 0.25 0.26 0.26 3.54 8.14 6.53 13.56 OGX Petroleo E Gas Participacoes S.A. June 2012 1.00 0.95 0.00 0.01 21.79 9.72 0.93 (2.35)Pan American Energy LLC June 2012 0.25 0.22 0.25 0.40 0.89 0.92 0.45 0.74 Petroleos de Venezuela S.A. (PDVSA) Dec. 2011 0.14 0.14 0.07 N.A. 1.31 0.78 1.41 N.A.Rede Energia S.A. June 2012 0.22 0.29 0.44 0.46 5.34 5.74 5.40 5.77 Rodopa Industria e Comercio de Alimentos Ltda. June 2012 0.47 0.67 0.62 0.81 1.04 2.48 2.04 2.27 SANLUIS Rassini, S.A. de C.V. June 2012 218 208 41 50 5.71 4.01 2.55 2.39 Servicios Corporativos Javer, S.A.P.I. de C.V. June 2012 0.10 0.01 0.03 0.02 1.67 2.40 3.82 3.46 Siderurgica del Turbio, S.A. (Sidetur) June 2012 0.18 0.10 0.06 0.06 0.40 1.19 0.86 0.41 Sifco S.A. June 2012 0.20 0.39 0.42 0.48 8.00 5.61 4.92 4.95 Telecom Argentina S.A. June 2012 0.93 0.26 0.14 0.23 (0.12) (0.27) (0.48) (0.37)Transportadora de Gas del Norte S.A. (TGN) June 2012 1.00 1.00 1.00 1.00 4.28 6.05 16.96 27.35 Transportadora de Gas del Sur S.A. (TGS) June 2012 0.01 0.01 0.01 0.01 0.64 0.59 1.51 1.31 Urbi Desarrollos Urbanos, S.A.B. de C.V. June 2012 0.49 0.30 0.43 0.18 0.84 1.22 2.15 3.04 Virgolino de Oliveira S/A Acucar e Alcool June 2012 N.A. 0.46 0.31 0.30 N.A. 3.85 4.94 7.83 WPE INTERNATIONAL Cooperatief U.A. June 2012 0.19 0.20 0.20 0.24 4.92 5.06 4.39 N.A.YPF S.A. June 2012 0.69 0.79 0.64 0.93 0.40 0.36 0.81 0.67
aLTM. N.A. Not applicable. Source: Fitch Ratings.
Latin America High Yield 14
November 8, 2012
Corporates
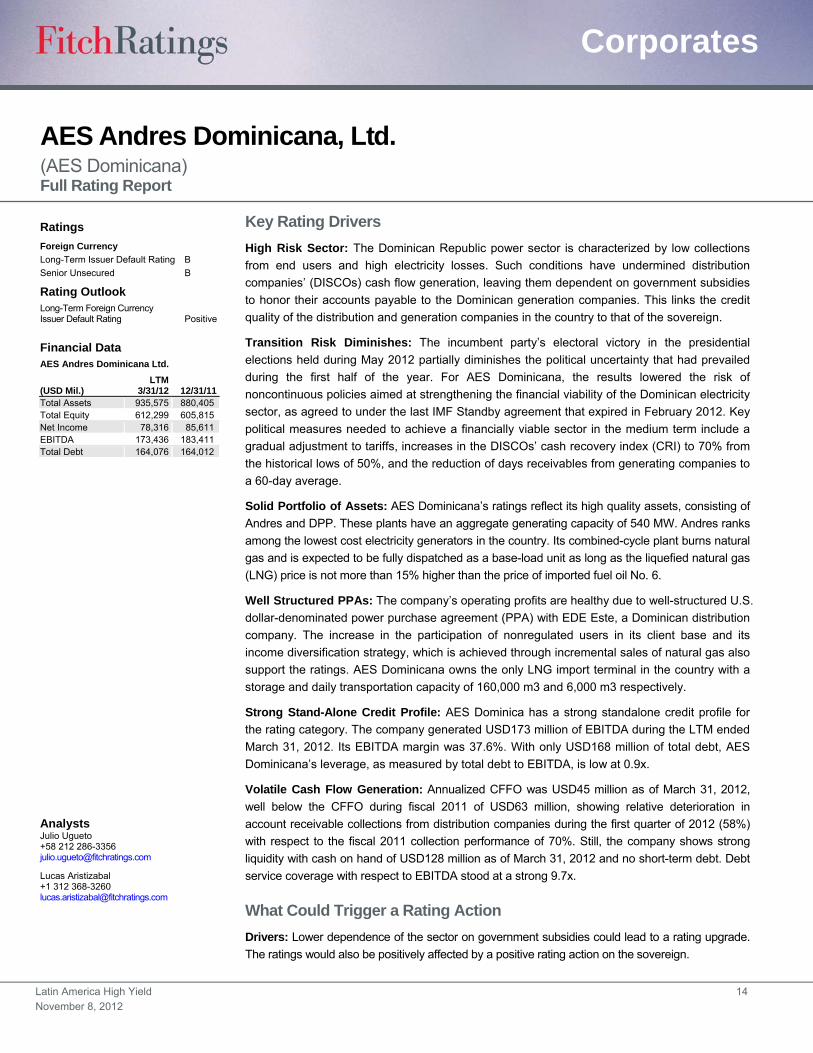
AES Andres Dominicana, Ltd. (AES Dominicana) Full Rating Report
Key Rating Drivers
High Risk Sector: The Dominican Republic power sector is characterized by low collections
from end users and high electricity losses. Such conditions have undermined distribution
companies’ (DISCOs) cash flow generation, leaving them dependent on government subsidies
to honor their accounts payable to the Dominican generation companies. This links the credit
quality of the distribution and generation companies in the country to that of the sovereign.
Transition Risk Diminishes: The incumbent party’s electoral victory in the presidential
elections held during May 2012 partially diminishes the political uncertainty that had prevailed
during the first half of the year. For AES Dominicana, the results lowered the risk of
noncontinuous policies aimed at strengthening the financial viability of the Dominican electricity
sector, as agreed to under the last IMF Standby agreement that expired in February 2012. Key
political measures needed to achieve a financially viable sector in the medium term include a
gradual adjustment to tariffs, increases in the DISCOs’ cash recovery index (CRI) to 70% from
the historical lows of 50%, and the reduction of days receivables from generating companies to
a 60-day average.
Solid Portfolio of Assets: AES Dominicana’s ratings reflect its high quality assets, consisting of
Andres and DPP. These plants have an aggregate generating capacity of 540 MW. Andres ranks
among the lowest cost electricity generators in the country. Its combined-cycle plant burns natural
gas and is expected to be fully dispatched as a base-load unit as long as the liquefied natural gas
(LNG) price is not more than 15% higher than the price of imported fuel oil No. 6.
Well Structured PPAs: The company’s operating profits are healthy due to well-structured U.S.
dollar-denominated power purchase agreement (PPA) with EDE Este, a Dominican distribution
company. The increase in the participation of nonregulated users in its client base and its
income diversification strategy, which is achieved through incremental sales of natural gas also
support the ratings. AES Dominicana owns the only LNG import terminal in the country with a
storage and daily transportation capacity of 160,000 m3 and 6,000 m3 respectively.
Strong Stand-Alone Credit Profile: AES Dominica has a strong standalone credit profile for
the rating category. The company generated USD173 million of EBITDA during the LTM ended
March 31, 2012. Its EBITDA margin was 37.6%. With only USD168 million of total debt, AES
Dominicana’s leverage, as measured by total debt to EBITDA, is low at 0.9x.
Volatile Cash Flow Generation: Annualized CFFO was USD45 million as of March 31, 2012,
well below the CFFO during fiscal 2011 of USD63 million, showing relative deterioration in
account receivable collections from distribution companies during the first quarter of 2012 (58%)
with respect to the fiscal 2011 collection performance of 70%. Still, the company shows strong
liquidity with cash on hand of USD128 million as of March 31, 2012 and no short-term debt. Debt
service coverage with respect to EBITDA stood at a strong 9.7x.
What Could Trigger a Rating Action
Drivers: Lower dependence of the sector on government subsidies could lead to a rating upgrade.
The ratings would also be positively affected by a positive rating action on the sovereign.
Ratings
Foreign Currency
Long-Term Issuer Default Rating B
Senior Unsecured B
Rating Outlook Long-Term Foreign Currency Issuer Default Rating Positive
Financial Data AES Andres Dominicana Ltd.
(USD Mil.) LTM
3/31/12 12/31/11 Total Assets 935,575 880,405 Total Equity 612,299 605,815 Net Income 78,316 85,611 EBITDA 173,436 183,411 Total Debt 164,076 164,012
Analysts Julio Ugueto +58 212 286-3356 [email protected]
Lucas Aristizabal +1 312 368-3260 [email protected]

Latin America High Yield 15
November 8, 2012
Corporates
Recovery Analysis
AES Dominicana’s senior notes issuance has been assigned a recovery rating of ‘RR4’. The
recovery was based upon the treatment of AES Dominicana as a going concern, as a
liquidation scenario is considered highly unlikely. The ratings have been capped at ‘RR4’ due
to concerns about the low probability of high recoveries for bondholders of corporates
domiciled in the Dominican Republic.
Fitch currently maintains a positive outlook for the sovereign, and, as such, we do not foresee a
bankruptcy scenario for AES Dominicana unless a low probability event, such as a severe
fiscal crisis that impacts the company’s cash flow to a point that its liquidity is constrained.
As a result we have opted for estimating a distressed enterprise valuation to arrive at the
recovery scenario attached below. The distressed EBITDA is calculated to cover the
company’s fixed charges and critical maintenance capex, which is then adjusted by a
conservative 5x multiple to arrive at a distressed company valuation. This distressed valuation
would be associated with a severe fiscal crisis that would lead to a sustained cash flow drain
for all generating companies in the country and contemplates the low probability event of a
nonfriendly renegotiation scenario of the company’s PPA’s with distribution companies to the
detriment of AES Dominicana. In this hypothetical scenario, it would be reasonable to expect a
low demand for the company’s assets under a competitive bidding process, further supporting
the distressed valuation commented above.
Recovery Analysis AES Dominicana (USD Mil.) IDR: B Going Concern Enterprise Value
LTM EBITDA as of March 31, 2012 173.4 Discount (%) 83.9 Distressed EBITDA 28.0 Multiple (x) 5.0 Going Concern Enterprise Value 140.0 Post-Restructuring EBITDA Estimation Guidelines Interest Expense 18 Distribution of Value by Priority Rent Expense — Greater of Going Concern Enterprise or Liquidation Value 140.0Est. Maintenance Capital Expenditures 10 Less Administrative Claims (10%) 14.0Total Adjusted Enterprise Value for Claims 126.0 Distribution of Value
Secured Priority Lien Value Recovered Recovery (%)Recovery
Rating Notching Rating
Senior Secured — — — — — —Secured — — — — — —
Unsecured Priority Amount
Outstanding Value
RecoveredRecovery
(%)Concession
Allocation (%) Recovery Rating Notching Rating
Issuer Default Rating — — — — — — BSenior Unsecured 164 126 77 — RR2 +2 BB–Subordinated — — — — — — —Junior Subordinated — — — — — — —
Source: Fitch.
Latin America High Yield 16
November 8, 2012
Corporates
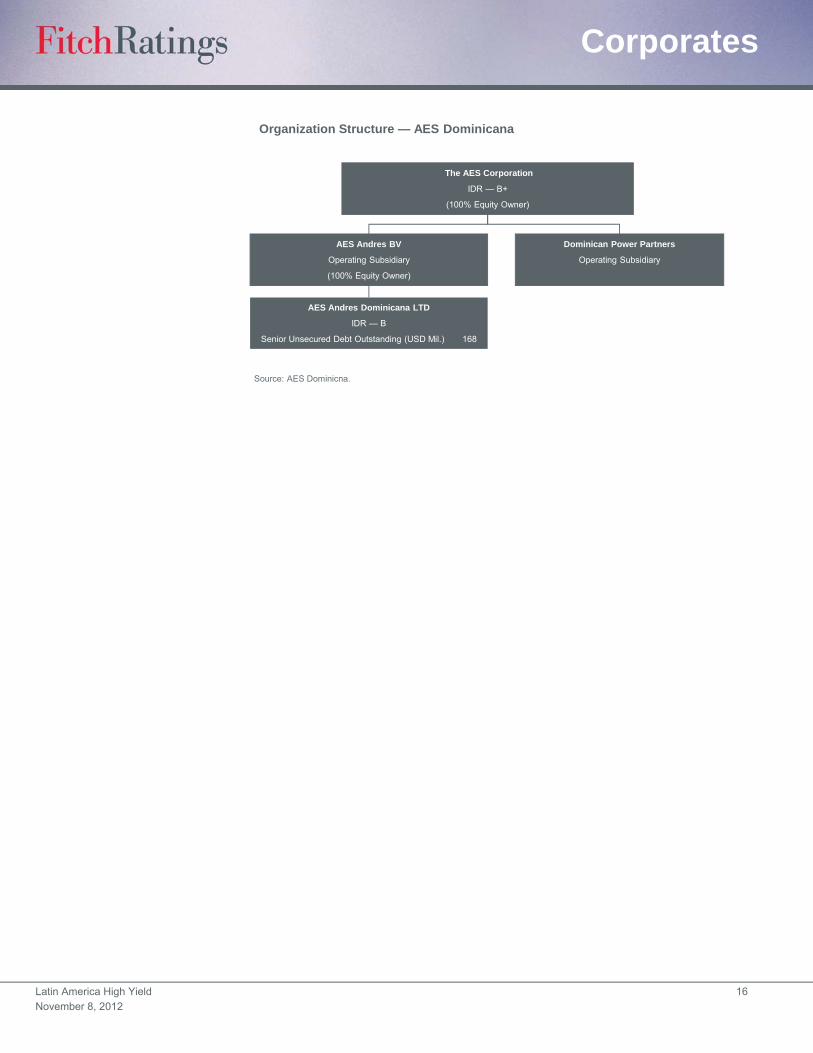
Source: AES Dominicna.
AES Andres BV
Operating Subsidiary
(100% Equity Owner)
Dominican Power Partners
Operating Subsidiary
Organization Structure — AES Dominicana
The AES Corporation
IDR — B+
(100% Equity Owner)
AES Andres Dominicana LTD
IDR — B
Senior Unsecured Debt Outstanding (USD Mil.) 168
Latin America High Yield 17
November 8, 2012
Corporates
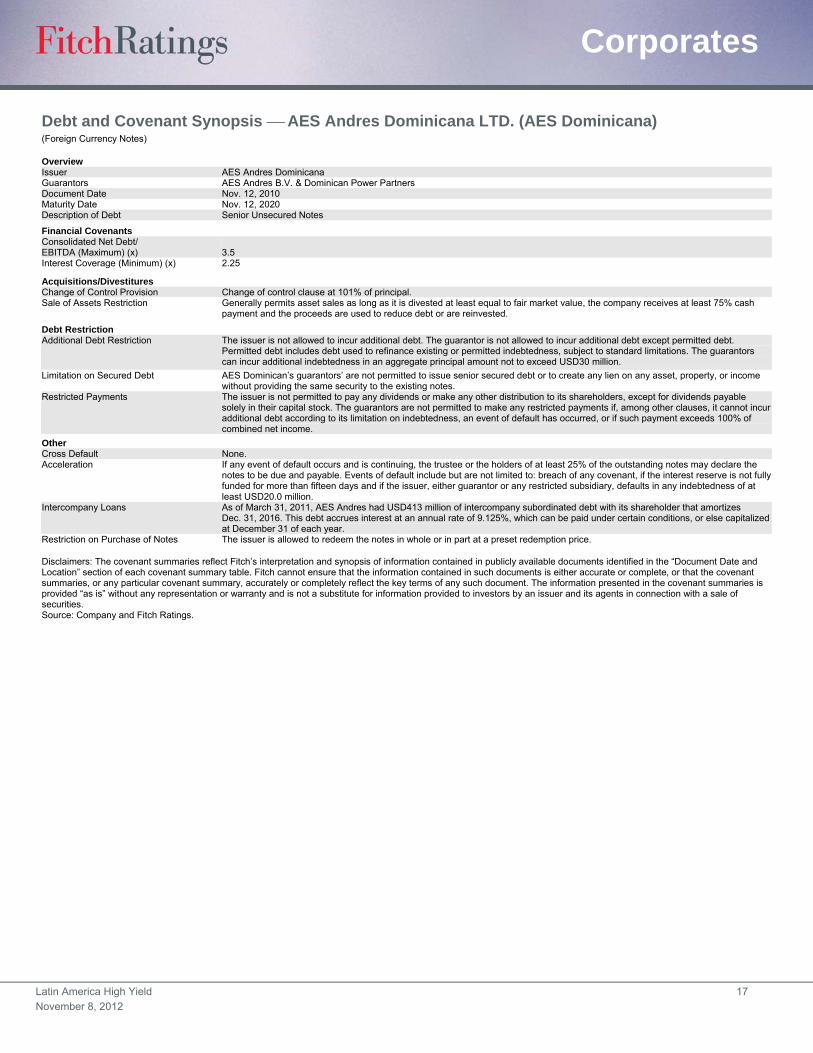
Debt and Covenant Synopsis AES Andres Dominicana LTD. (AES Dominicana) (Foreign Currency Notes)
Overview Issuer AES Andres Dominicana Guarantors AES Andres B.V. & Dominican Power Partners Document Date Nov. 12, 2010 Maturity Date Nov. 12, 2020 Description of Debt Senior Unsecured Notes
Financial Covenants Consolidated Net Debt/ EBITDA (Maximum) (x) 3.5 Interest Coverage (Minimum) (x) 2.25
Acquisitions/Divestitures Change of Control Provision Change of control clause at 101% of principal. Sale of Assets Restriction Generally permits asset sales as long as it is divested at least equal to fair market value, the company receives at least 75% cash
payment and the proceeds are used to reduce debt or are reinvested.
Debt Restriction Additional Debt Restriction The issuer is not allowed to incur additional debt. The guarantor is not allowed to incur additional debt except permitted debt.
Permitted debt includes debt used to refinance existing or permitted indebtedness, subject to standard limitations. The guarantors can incur additional indebtedness in an aggregate principal amount not to exceed USD30 million.
Limitation on Secured Debt AES Dominican’s guarantors’ are not permitted to issue senior secured debt or to create any lien on any asset, property, or income without providing the same security to the existing notes.
Restricted Payments The issuer is not permitted to pay any dividends or make any other distribution to its shareholders, except for dividends payable solely in their capital stock. The guarantors are not permitted to make any restricted payments if, among other clauses, it cannot incur additional debt according to its limitation on indebtedness, an event of default has occurred, or if such payment exceeds 100% of combined net income.
Other Cross Default None. Acceleration If any event of default occurs and is continuing, the trustee or the holders of at least 25% of the outstanding notes may declare the
notes to be due and payable. Events of default include but are not limited to: breach of any covenant, if the interest reserve is not fully funded for more than fifteen days and if the issuer, either guarantor or any restricted subsidiary, defaults in any indebtedness of at least USD20.0 million.
Intercompany Loans As of March 31, 2011, AES Andres had USD413 million of intercompany subordinated debt with its shareholder that amortizes Dec. 31, 2016. This debt accrues interest at an annual rate of 9.125%, which can be paid under certain conditions, or else capitalized at December 31 of each year.
Restriction on Purchase of Notes The issuer is allowed to redeem the notes in whole or in part at a preset redemption price. Disclaimers: The covenant summaries reflect Fitch’s interpretation and synopsis of information contained in publicly available documents identified in the “Document Date and Location” section of each covenant summary table. Fitch cannot ensure that the information contained in such documents is either accurate or complete, or that the covenant summaries, or any particular covenant summary, accurately or completely reflect the key terms of any such document. The information presented in the covenant summaries is provided “as is” without any representation or warranty and is not a substitute for information provided to investors by an issuer and its agents in connection with a sale of securities. Source: Company and Fitch Ratings.

Latin America High Yield 18
November 8, 2012
Corporates
Financial Summary AES Andres Dominicana Ltd. (USD Mil., As of Dec. 31) LTM 3/31/12 2011 2010 2009 2008
Profitability
Operating EBITDA 173,436 183,411 161,900 82,438 112,253
Operating EBITDAR 173,436 183,411 161,900 82,438 112,253
Operating EBITDA Margin (%) 38 41 43 35 31
Operating EBITDAR Margin (%) 38 41 43 35 31
FFO Return on Adjusted Capital (%) 9 14 13 7 9
Free Cash Flow Margin (%) (4) 0 21 (3) (5)
Return on Average Equity (%) 26 15 19 1 5
Coverage (x)
FFO Interest Coverage 3.9 6.4 4.4 1.9 2.9
Operating EBITDA/Gross Interest Expense 9.7 10.9 7.8 3.4 5.6
Operating EBITDAR/Interest Expense + Rents 9.7 10.9 7.8 3.4 5.6
Operating EBITDA/Debt Service Coverage 9.7 10.9 7.8 2.8 2.5
Operating EBITDAR/Debt Service Coverage 9.7 10.9 7.8 2.8 2.5
FFO Fixed-Charge Coverage 3.9 6.4 4.4 1.9 2.9
FCF Debt Service Coverage (0.1) 0.9 4.9 0.6 0.0
(FCF + Cash and Marketable Securities)/Debt Service Coverage 7.0 8.7 10.7 2.8 0.9
Cash Flow from Operations/Capital Expenditures 1.5 2.2 7.6 0.7 (1.7)
Leverage (x)
FFO Adjusted Leverage 2.4 1.5 1.8 3.5 3.1
Total Debt with Equity Credit/Operating EBITDA 0.9 0.9 1.0 2.0 1.6
Total Net Debt with Equity Credit/Operating EBITDA 0.2 0.2 0.3 1.2 1.3
Total Adjusted Debt/Operating EBITDAR 0.9 0.9 1.0 2.0 1.6
Total Adjusted Net Debt/Operating EBITDAR 0.2 0.2 0.3 1.2 1.3
Implied Cost of Funds (%) 0.2 0.1 0.3 0.1 0.1
Secured Debt/Total Debt — — — — —
Short-Term Debt/Total Debt — — — 0.0 0.1
Balance Sheet
Total Assets 935,575 880,405 853,356 713,062 718,418
Cash and Marketable Securities 127,703 131,130 119,652 63,040 40,450
Short-Term Debt — — — 5,000 25,000
Long-Term Debt 164,076 164,012 163,773 156,000 156,000
Total Debt 164,076 164,012 163,773 161,000 181,000
Equity Credit — — — — —
Total Debt with Equity Credit 164,076 164,012 163,773 161,000 181,000
Off-Balance Sheet Debt — — — — —
Total Adjusted Debt with Equity Credit 164,076 164,012 163,773 161,000 181,000
Total Equity 612,299 605,815 559,193 458,304 454,676
Total Adjusted Capital 776,375 769,827 722,966 619,304 635,676
Cash Flow
Funds from Operations 51,802 90,649 70,285 20,957 37,850
Change in Working Capital (6,460) (27,823) 22,857 (3,616) (49,343)
Cash Flow from Operations 45,342 62,826 93,142 17,341 (11,493)
Total Non-Operating/Nonrecurring Cash Flow — — — — —
Capital Expenditures (29,742) (28,617) (12,273) (23,479) (6,743)
Common Dividends (35,903) (35,903) — — —
Free Cash Flow (20,303) (1,694) 80,869 (6,138) (18,236)
Net Acquisitions and Divestitures — — — — —
Other Investments, Net 7,978 14,179 (16,277) 51,571 12,155
Net Debt Proceeds 2 7 (3,492) (20,000) 9,596
Net Equity Proceeds — — — — —
Other (Investments and Financing) (1,045) (1,014) (3,279) (1,286) (1,473)
Total Change in Cash (13,368) 11,478 57,821 24,147 2,042
Income Statement
Revenue 461,351 444,386 376,738 234,536 358,249
Revenue Growth (%) 4 18 0151 (35) 26
Operating EBIT 146,515 157,343 135,414 66,900 97,500
Gross Interest Expense 17,872 16,800 20,625 24,399 19,910
Rental Expense — — — — —
Net Income 78,316 85,611 53,823 3,493 21,378
Source: Fitch.
Latin America High Yield 19
November 8, 2012
Corporates
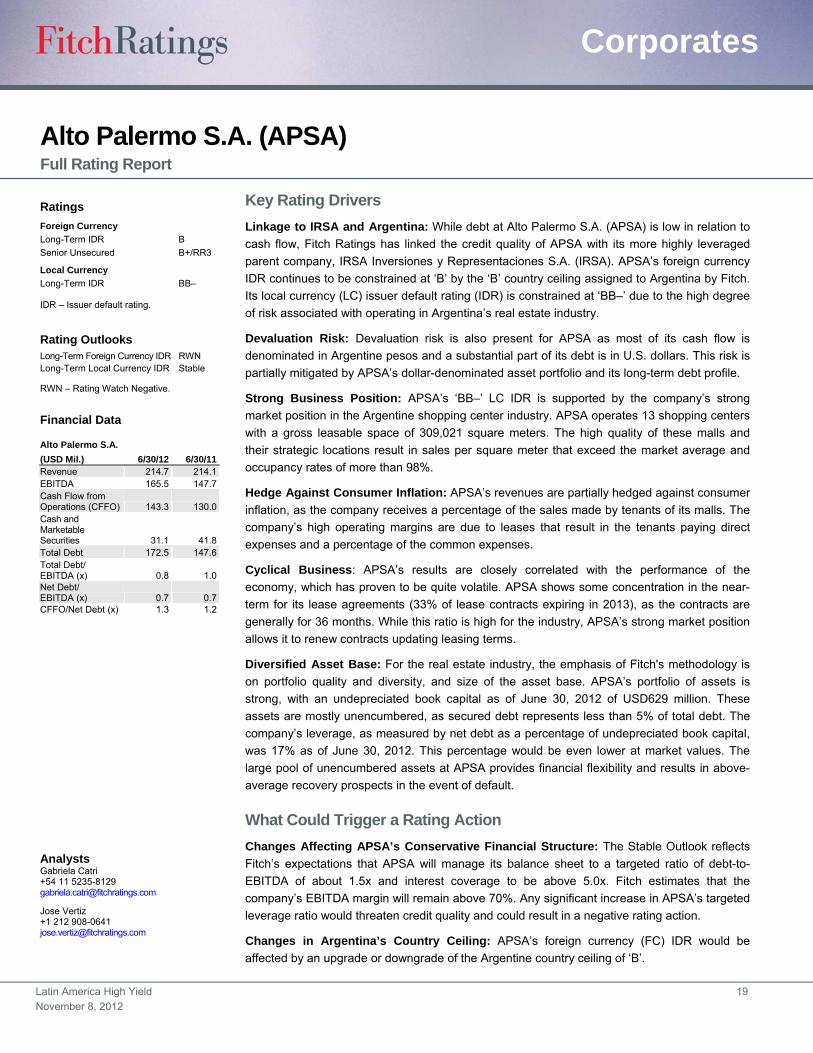
Alto Palermo S.A. (APSA) Full Rating Report
Key Rating Drivers
Linkage to IRSA and Argentina: While debt at Alto Palermo S.A. (APSA) is low in relation to
cash flow, Fitch Ratings has linked the credit quality of APSA with its more highly leveraged
parent company, IRSA Inversiones y Representaciones S.A. (IRSA). APSA’s foreign currency
IDR continues to be constrained at ‘B’ by the ‘B’ country ceiling assigned to Argentina by Fitch.
Its local currency (LC) issuer default rating (IDR) is constrained at ‘BB–’ due to the high degree
of risk associated with operating in Argentina’s real estate industry.
Devaluation Risk: Devaluation risk is also present for APSA as most of its cash flow is
denominated in Argentine pesos and a substantial part of its debt is in U.S. dollars. This risk is
partially mitigated by APSA’s dollar-denominated asset portfolio and its long-term debt profile.
Strong Business Position: APSA’s ‘BB–’ LC IDR is supported by the company’s strong
market position in the Argentine shopping center industry. APSA operates 13 shopping centers
with a gross leasable space of 309,021 square meters. The high quality of these malls and
their strategic locations result in sales per square meter that exceed the market average and
occupancy rates of more than 98%.
Hedge Against Consumer Inflation: APSA’s revenues are partially hedged against consumer
inflation, as the company receives a percentage of the sales made by tenants of its malls. The
company’s high operating margins are due to leases that result in the tenants paying direct
expenses and a percentage of the common expenses.
Cyclical Business: APSA’s results are closely correlated with the performance of the
economy, which has proven to be quite volatile. APSA shows some concentration in the near-
term for its lease agreements (33% of lease contracts expiring in 2013), as the contracts are
generally for 36 months. While this ratio is high for the industry, APSA’s strong market position
allows it to renew contracts updating leasing terms.
Diversified Asset Base: For the real estate industry, the emphasis of Fitch's methodology is
on portfolio quality and diversity, and size of the asset base. APSA’s portfolio of assets is
strong, with an undepreciated book capital as of June 30, 2012 of USD629 million. These
assets are mostly unencumbered, as secured debt represents less than 5% of total debt. The
company’s leverage, as measured by net debt as a percentage of undepreciated book capital,
was 17% as of June 30, 2012. This percentage would be even lower at market values. The
large pool of unencumbered assets at APSA provides financial flexibility and results in above-
average recovery prospects in the event of default.
What Could Trigger a Rating Action
Changes Affecting APSA’s Conservative Financial Structure: The Stable Outlook reflects
Fitch’s expectations that APSA will manage its balance sheet to a targeted ratio of debt-to-
EBITDA of about 1.5x and interest coverage to be above 5.0x. Fitch estimates that the
company’s EBITDA margin will remain above 70%. Any significant increase in APSA’s targeted
leverage ratio would threaten credit quality and could result in a negative rating action.
Changes in Argentina’s Country Ceiling: APSA’s foreign currency (FC) IDR would be
affected by an upgrade or downgrade of the Argentine country ceiling of ‘B’.
Ratings
Foreign Currency
Long-Term IDR B
Senior Unsecured B+/RR3
Local Currency
Long-Term IDR BB–
IDR – Issuer default rating.
Rating Outlooks Long-Term Foreign Currency IDR RWN Long-Term Local Currency IDR Stable
RWN – Rating Watch Negative.
Financial Data
Alto Palermo S.A.
(USD Mil.) 6/30/12 6/30/11 Revenue 214.7 214.1 EBITDA 165.5 147.7 Cash Flow from Operations (CFFO) 143.3 130.0 Cash and Marketable Securities 31.1 41.8 Total Debt 172.5 147.6 Total Debt/ EBITDA (x) 0.8 1.0 Net Debt/ EBITDA (x) 0.7 0.7 CFFO/Net Debt (x) 1.3 1.2
Analysts Gabriela Catri +54 11 5235-8129 [email protected]
Jose Vertiz +1 212 908-0641 [email protected]
Latin America High Yield 20
November 8, 2012
Corporates
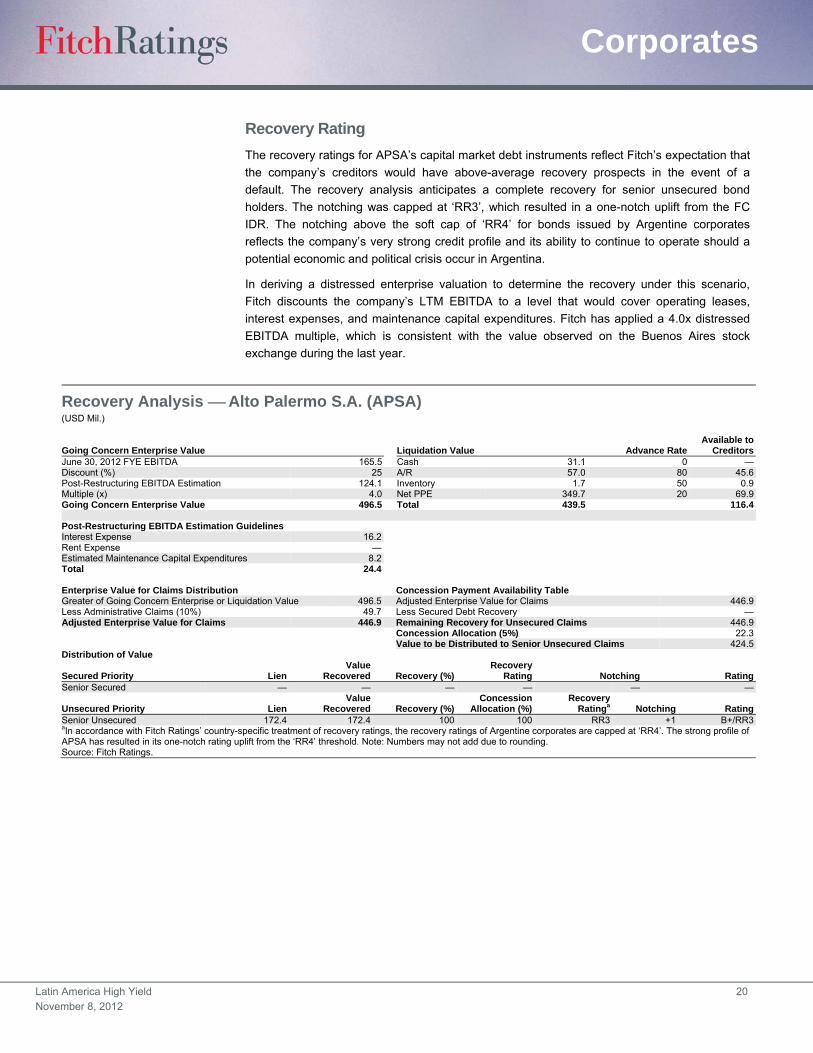
Recovery Rating
The recovery ratings for APSA’s capital market debt instruments reflect Fitch’s expectation that
the company’s creditors would have above-average recovery prospects in the event of a
default. The recovery analysis anticipates a complete recovery for senior unsecured bond
holders. The notching was capped at ‘RR3’, which resulted in a one-notch uplift from the FC
IDR. The notching above the soft cap of ‘RR4’ for bonds issued by Argentine corporates
reflects the company’s very strong credit profile and its ability to continue to operate should a
potential economic and political crisis occur in Argentina.
In deriving a distressed enterprise valuation to determine the recovery under this scenario,
Fitch discounts the company’s LTM EBITDA to a level that would cover operating leases,
interest expenses, and maintenance capital expenditures. Fitch has applied a 4.0x distressed
EBITDA multiple, which is consistent with the value observed on the Buenos Aires stock
exchange during the last year.
Recovery Analysis Alto Palermo S.A. (APSA) (USD Mil.)
Going Concern Enterprise Value Liquidation Value Advance RateAvailable to
CreditorsJune 30, 2012 FYE EBITDA 165.5 Cash 31.1 0 —Discount (%) 25 A/R 57.0 80 45.6Post-Restructuring EBITDA Estimation 124.1 Inventory 1.7 50 0.9Multiple (x) 4.0 Net PPE 349.7 20 69.9Going Concern Enterprise Value 496.5 Total 439.5 116.4 Post-Restructuring EBITDA Estimation Guidelines Interest Expense 16.2Rent Expense —Estimated Maintenance Capital Expenditures 8.2Total 24.4
Enterprise Value for Claims Distribution Concession Payment Availability Table Greater of Going Concern Enterprise or Liquidation Value 496.5 Adjusted Enterprise Value for Claims 446.9Less Administrative Claims (10%) 49.7 Less Secured Debt Recovery —Adjusted Enterprise Value for Claims 446.9 Remaining Recovery for Unsecured Claims 446.9 Concession Allocation (5%) 22.3 Value to be Distributed to Senior Unsecured Claims 424.5Distribution of Value
Secured Priority Lien Value
Recovered Recovery (%)Recovery
Rating Notching RatingSenior Secured — — — — — —
Unsecured Priority Lien Value
Recovered Recovery (%)Concession
Allocation (%)Recovery
Ratinga Notching RatingSenior Unsecured 172.4 172.4 100 100 RR3 +1 B+/RR3aIn accordance with Fitch Ratings’ country-specific treatment of recovery ratings, the recovery ratings of Argentine corporates are capped at ‘RR4’. The strong profile of APSA has resulted in its one-notch rating uplift from the ‘RR4’ threshold. Note: Numbers may not add due to rounding. Source: Fitch Ratings.
Latin America High Yield 21
November 8, 2012
Corporates
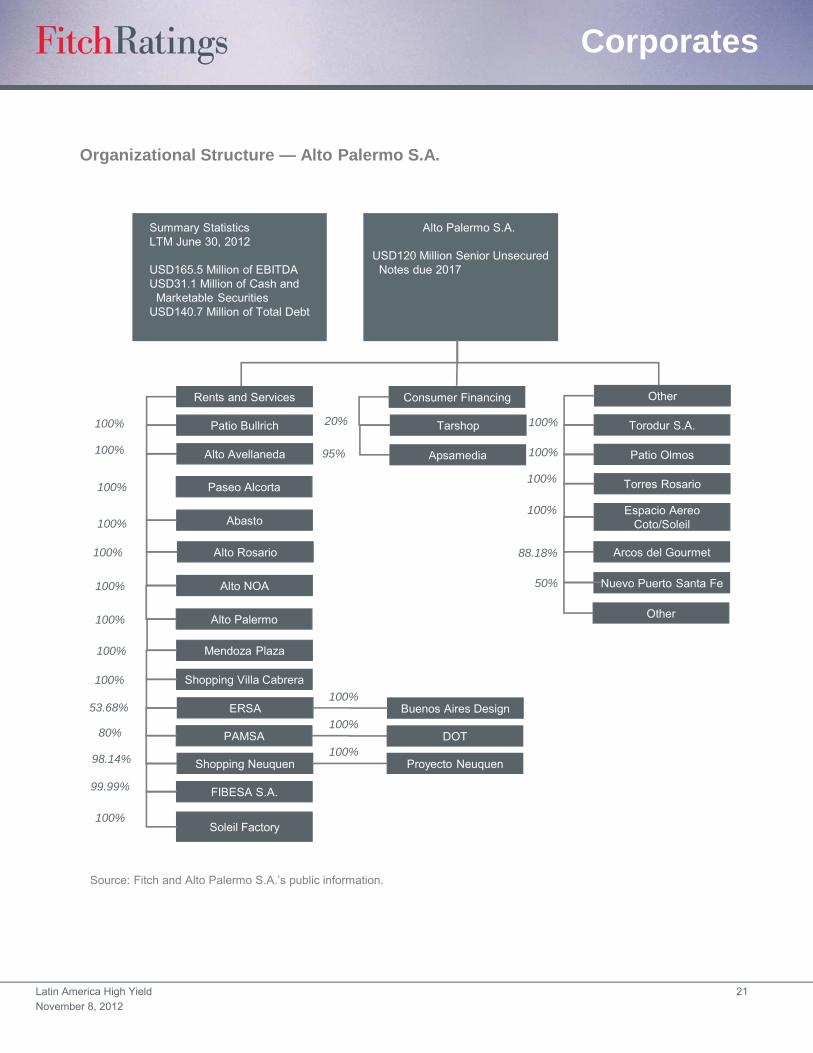
Organizational Structure — Alto Palermo S.A.
Alto Palermo S.A.
USD120 Million Senior UnsecuredNotes due 2017
Source: Fitch and Alto Palermo S.A.’s public information.
Summary StatisticsLTM June 30, 2012
USD165.5 Million of EBITDAUSD31.1 Million of Cash and
Marketable SecuritiesUSD140.7 Million of Total Debt
Rents and Services Consumer Financing Other
Patio Bullrich
Apsamedia
Arcos del Gourmet
Espacio Aereo Coto/Soleil
Torres Rosario
Tarshop
Patio Olmos
Torodur S.A.
Alto Avellaneda
Abasto
Alto Rosario
Alto NOA
Alto Palermo
Mendoza Plaza
Shopping Villa Cabrera
ERSA Buenos Aires Design
PAMSA
Shopping Neuquen
FIBESA S.A.
DOT
Proyecto Neuquen
Soleil Factory
100%
100%
100%
100%
100%
100%
100%
95%
20% 100%
100%
100%
100%
100%
100%
100%53.68%
80%
98.14%
99.99%
100%
Nuevo Puerto Santa Fe
Other
88.18%
50%
Paseo Alcorta
100%
100%
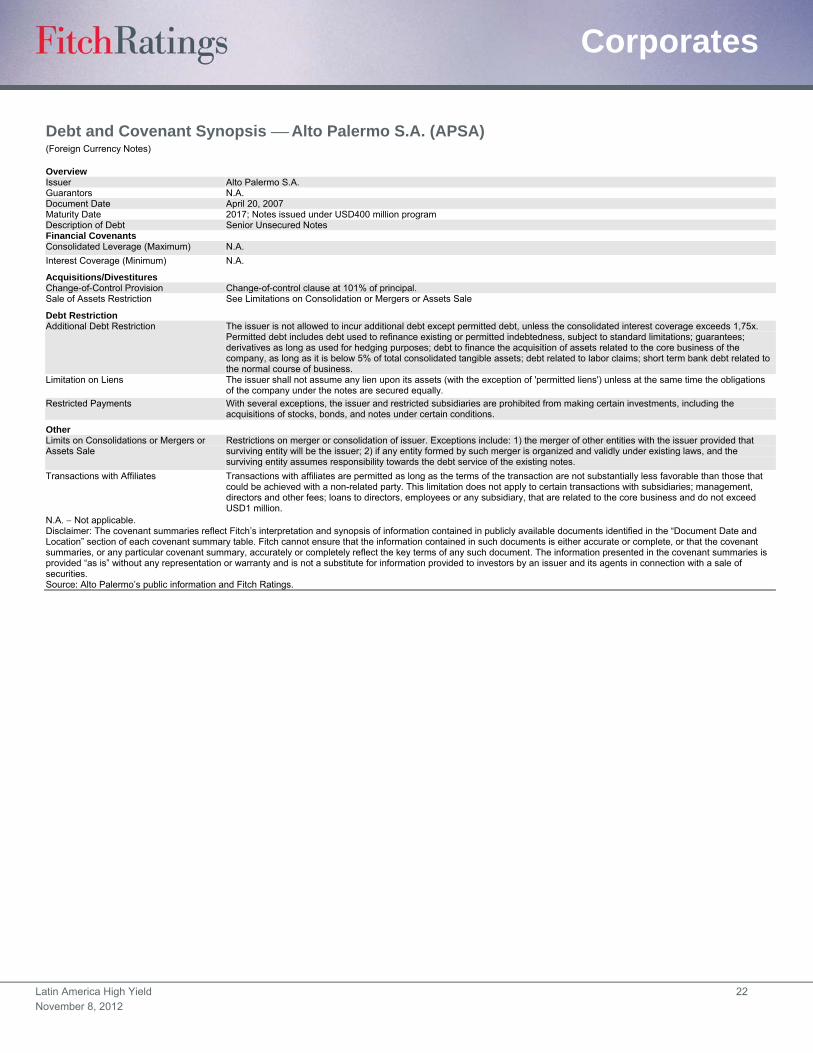
Latin America High Yield 22
November 8, 2012
Corporates
Debt and Covenant Synopsis Alto Palermo S.A. (APSA) (Foreign Currency Notes)
Overview Issuer Alto Palermo S.A. Guarantors N.A. Document Date April 20, 2007 Maturity Date 2017; Notes issued under USD400 million program Description of Debt Senior Unsecured Notes Financial Covenants Consolidated Leverage (Maximum) N.A.
Interest Coverage (Minimum) N.A.
Acquisitions/Divestitures Change-of-Control Provision Change-of-control clause at 101% of principal. Sale of Assets Restriction See Limitations on Consolidation or Mergers or Assets Sale
Debt Restriction Additional Debt Restriction The issuer is not allowed to incur additional debt except permitted debt, unless the consolidated interest coverage exceeds 1,75x.
Permitted debt includes debt used to refinance existing or permitted indebtedness, subject to standard limitations; guarantees; derivatives as long as used for hedging purposes; debt to finance the acquisition of assets related to the core business of the company, as long as it is below 5% of total consolidated tangible assets; debt related to labor claims; short term bank debt related to the normal course of business.
Limitation on Liens The issuer shall not assume any lien upon its assets (with the exception of 'permitted liens') unless at the same time the obligations of the company under the notes are secured equally.
Restricted Payments With several exceptions, the issuer and restricted subsidiaries are prohibited from making certain investments, including the acquisitions of stocks, bonds, and notes under certain conditions.
Other Limits on Consolidations or Mergers or Assets Sale
Restrictions on merger or consolidation of issuer. Exceptions include: 1) the merger of other entities with the issuer provided that surviving entity will be the issuer; 2) if any entity formed by such merger is organized and validly under existing laws, and the surviving entity assumes responsibility towards the debt service of the existing notes.
Transactions with Affiliates Transactions with affiliates are permitted as long as the terms of the transaction are not substantially less favorable than those that could be achieved with a non-related party. This limitation does not apply to certain transactions with subsidiaries; management, directors and other fees; loans to directors, employees or any subsidiary, that are related to the core business and do not exceed USD1 million.
N.A. Not applicable. Disclaimer: The covenant summaries reflect Fitch’s interpretation and synopsis of information contained in publicly available documents identified in the “Document Date and Location” section of each covenant summary table. Fitch cannot ensure that the information contained in such documents is either accurate or complete, or that the covenant summaries, or any particular covenant summary, accurately or completely reflect the key terms of any such document. The information presented in the covenant summaries is provided “as is” without any representation or warranty and is not a substitute for information provided to investors by an issuer and its agents in connection with a sale of securities. Source: Alto Palermo’s public information and Fitch Ratings.

Latin America High Yield 23
November 8, 2012
Corporates
Financial Summary — Alto Palermo S.A. (APSA) Period-End Exchange Rate 4.5238 4.1100 3.9317 3.799 3.0235 3.0905
Average Exchange Rate 4.3012 3.9998 3.8458 3.7279 3.1247 3.0861
(USD 000, Fiscal Years Ended June 30) 2012 2011 2010 2009 2008 2007Profitability Operating EBITDA 165,548 147,754 114,622 49,202 76,548 72,630 Operating EBITDA Margin (%) 77.1 69.0 56.2 28.5 37.4 46.4 FFO Return on Adjusted Capital (%) 43.2 39.3 20.2 17.3 17.6 13.7 Free Cash Flow Margin (%) 31.3 26.0 1.8 (34.6) (24.9) (5.3)Return on Average Equity (%) 32.4 26.1 12.9 (2.2) 8.6 7.4 Coverage (x) FFO Interest Coverage 10.0 7.9 3.8 4.3 5.6 6.7 Operating EBITDA/Gross Interest Expense 10.2 7.2 5.0 2.8 4.9 7.2 Operating EBITDAR/(Interest Expense + Rental Expenses) 10.2 7.2 5.0 2.8 4.9 7.2 Operating EBITDA/Debt Service Coverage 4.8 3.0 1.5 0.6 1.4 2.0 Operating EBITDAR/Debt Service Coverage 4.8 3.0 1.5 0.6 1.4 2.0 FFO Fixed-Charge Coverage 10.0 7.9 3.8 4.3 5.6 6.7 FCF Debt Service Coverage 2.4 1.5 0.4 (0.5) (0.7) 0.0 (Free Cash Flow + Cash and Marketable Securities)/Debt Service Coverage 3.3 2.4 0.6 (0.3) 1.1 4.3 Cash Flow from Operations/Capital Expenditures 7.9 10.1 2.3 0.3 0.6 1.1 Capital Structure and Leverage (x) FFO Adjusted Leverage 0.9 0.9 2.0 2.6 2.4 3.0 Total Debt with Equity Credit/Operating EBITDA 0.8 1.0 1.5 4.0 2.7 2.7 Total Net Debt with Equity Credit/Operating EBITDA 0.7 0.7 1.4 3.7 1.5 0.6 Total Adjusted Debt/Operating EBITDAR 0.8 1.0 1.5 4.0 2.7 2.7 Total Adjusted Net Debt/Operating EBITDAR 0.7 0.7 1.4 3.7 1.5 0.6 Implied Cost of Funds 9.2 10.1 9.8 7.0 6.2 6.2Secured Debt/Total Debt — — — — 0.0 0.0 Short-Term Debt/Total Debt 0.1 0.2 0.2 0.3 0.1 0.1 Balance Sheet Total Assets 550,063 565,931 631,928 645,305 738,248 677,467 Cash and Marketable Securities 31,124 41,814 17,527 16,988 95,213 159,227 Short-Term Debt 18,172 29,590 51,963 62,075 38,293 27,137 Long-Term Debt 154,290 149,757 172,481 182,188 219,051 219,625 Total Debt 172,462 179,347 224,444 244,263 257,344 246,762 Equity Credit 31,769 31,755 47,220 47,203 47,252 47,266 Total Debt with Equity Credit 140,693 147,592 177,224 197,060 210,092 199,496 Off-Balance Sheet Debt 0 0 0 0 0 0 Total Adjusted Debt with Equity Credit 140,693 147,592 177,224 197,060 210,092 199,496 Total Equity 215,852 254,296 244,501 233,855 306,319 289,706 Total Adjusted Capital 356,546 401,888 421,725 430,915 516,411 489,202 Cash Flow Funds from Operations 145,850 141,845 63,872 58,359 72,078 57,051 Change in Working Capital (2,502) (11,790) (31,296) (35,411) (18,279) 1,182 Cash Flow from Operations 143,349 130,055 32,576 22,948 53,799 58,233 Total Non-Operating/Nonrecurring Cash Flow 0 0 0 0 0 0 Capital Expenditures (18,081) (12,920) (13,997) (66,360) (86,463) (51,137)Dividends (58,079) (61,473) (14,862) (16,159) (18,270) (15,419)Free Cash Flow (FCF) 67,189 55,662 3,716 (59,571) (50,934) (8,323)Net Acquisitions and Divestitures 0 0 0 0 0 0 Other Investments, Net (40,376) (896) 17,481 (17,535) (22,555) (8,544)Net Debt Proceeds (36,645) (31,935) (21,456) 8,718 (3,607) 155,908 Net Equity Proceeds 631 202 1,412 12,886 6,998 0 Other, Financing Activities (470) 0 0 0 0 0 Total Change in Cash (9,671) 23,034 1,154 (55,501) (70,097) 139,041 Income Statement Net Revenue 214,735 214,128 204,086 172,366 204,869 156,583 Revenue Growth (%) 0.3 4.9 18.4 (15.9) 30.8 30.0 Operating EBIT 138,799 118,414 83,338 24,203 51,912 50,075 Gross Interest Expense 16,165 20,488 23,048 17,627 15,701 10,024 Net Income 76,221 65,148 30,969 (5,918) 25,593 20,757
Source: Fitch and Alto Palermo S.A.’s public information.
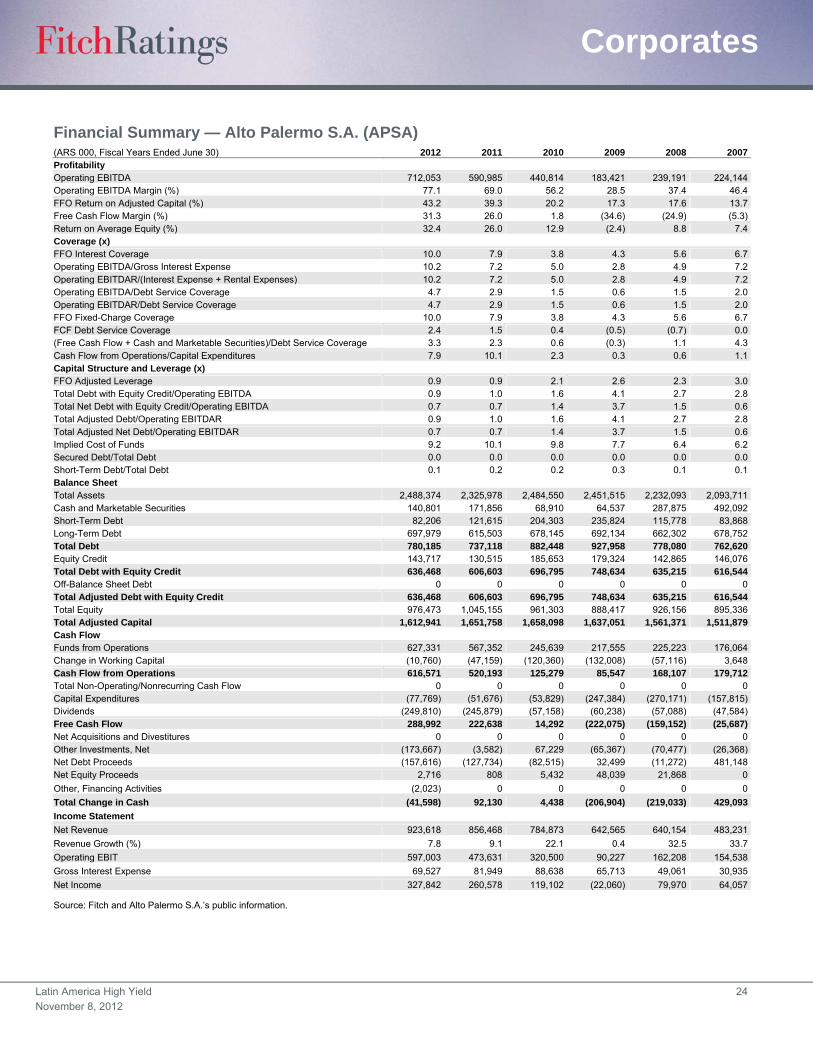
Latin America High Yield 24
November 8, 2012
Corporates
Financial Summary — Alto Palermo S.A. (APSA) (ARS 000, Fiscal Years Ended June 30) 2012 2011 2010 2009 2008 2007Profitability Operating EBITDA 712,053 590,985 440,814 183,421 239,191 224,144Operating EBITDA Margin (%) 77.1 69.0 56.2 28.5 37.4 46.4FFO Return on Adjusted Capital (%) 43.2 39.3 20.2 17.3 17.6 13.7Free Cash Flow Margin (%) 31.3 26.0 1.8 (34.6) (24.9) (5.3)Return on Average Equity (%) 32.4 26.0 12.9 (2.4) 8.8 7.4Coverage (x) FFO Interest Coverage 10.0 7.9 3.8 4.3 5.6 6.7Operating EBITDA/Gross Interest Expense 10.2 7.2 5.0 2.8 4.9 7.2Operating EBITDAR/(Interest Expense + Rental Expenses) 10.2 7.2 5.0 2.8 4.9 7.2Operating EBITDA/Debt Service Coverage 4.7 2.9 1.5 0.6 1.5 2.0Operating EBITDAR/Debt Service Coverage 4.7 2.9 1.5 0.6 1.5 2.0FFO Fixed-Charge Coverage 10.0 7.9 3.8 4.3 5.6 6.7FCF Debt Service Coverage 2.4 1.5 0.4 (0.5) (0.7) 0.0(Free Cash Flow + Cash and Marketable Securities)/Debt Service Coverage 3.3 2.3 0.6 (0.3) 1.1 4.3Cash Flow from Operations/Capital Expenditures 7.9 10.1 2.3 0.3 0.6 1.1Capital Structure and Leverage (x) FFO Adjusted Leverage 0.9 0.9 2.1 2.6 2.3 3.0Total Debt with Equity Credit/Operating EBITDA 0.9 1.0 1.6 4.1 2.7 2.8Total Net Debt with Equity Credit/Operating EBITDA 0.7 0.7 1.4 3.7 1.5 0.6Total Adjusted Debt/Operating EBITDAR 0.9 1.0 1.6 4.1 2.7 2.8Total Adjusted Net Debt/Operating EBITDAR 0.7 0.7 1.4 3.7 1.5 0.6Implied Cost of Funds 9.2 10.1 9.8 7.7 6.4 6.2Secured Debt/Total Debt 0.0 0.0 0.0 0.0 0.0 0.0Short-Term Debt/Total Debt 0.1 0.2 0.2 0.3 0.1 0.1Balance Sheet Total Assets 2,488,374 2,325,978 2,484,550 2,451,515 2,232,093 2,093,711Cash and Marketable Securities 140,801 171,856 68,910 64,537 287,875 492,092Short-Term Debt 82,206 121,615 204,303 235,824 115,778 83,868Long-Term Debt 697,979 615,503 678,145 692,134 662,302 678,752Total Debt 780,185 737,118 882,448 927,958 778,080 762,620Equity Credit 143,717 130,515 185,653 179,324 142,865 146,076Total Debt with Equity Credit 636,468 606,603 696,795 748,634 635,215 616,544Off-Balance Sheet Debt 0 0 0 0 0 0Total Adjusted Debt with Equity Credit 636,468 606,603 696,795 748,634 635,215 616,544Total Equity 976,473 1,045,155 961,303 888,417 926,156 895,336Total Adjusted Capital 1,612,941 1,651,758 1,658,098 1,637,051 1,561,371 1,511,879Cash Flow Funds from Operations 627,331 567,352 245,639 217,555 225,223 176,064Change in Working Capital (10,760) (47,159) (120,360) (132,008) (57,116) 3,648Cash Flow from Operations 616,571 520,193 125,279 85,547 168,107 179,712Total Non-Operating/Nonrecurring Cash Flow 0 0 0 0 0 0Capital Expenditures (77,769) (51,676) (53,829) (247,384) (270,171) (157,815)Dividends (249,810) (245,879) (57,158) (60,238) (57,088) (47,584)Free Cash Flow 288,992 222,638 14,292 (222,075) (159,152) (25,687)Net Acquisitions and Divestitures 0 0 0 0 0 0Other Investments, Net (173,667) (3,582) 67,229 (65,367) (70,477) (26,368)Net Debt Proceeds (157,616) (127,734) (82,515) 32,499 (11,272) 481,148Net Equity Proceeds 2,716 808 5,432 48,039 21,868 0
Other, Financing Activities (2,023) 0 0 0 0 0
Total Change in Cash (41,598) 92,130 4,438 (206,904) (219,033) 429,093
Income Statement
Net Revenue 923,618 856,468 784,873 642,565 640,154 483,231
Revenue Growth (%) 7.8 9.1 22.1 0.4 32.5 33.7
Operating EBIT 597,003 473,631 320,500 90,227 162,208 154,538
Gross Interest Expense 69,527 81,949 88,638 65,713 49,061 30,935
Net Income 327,842 260,578 119,102 (22,060) 79,970 64,057
Source: Fitch and Alto Palermo S.A.’s public information.
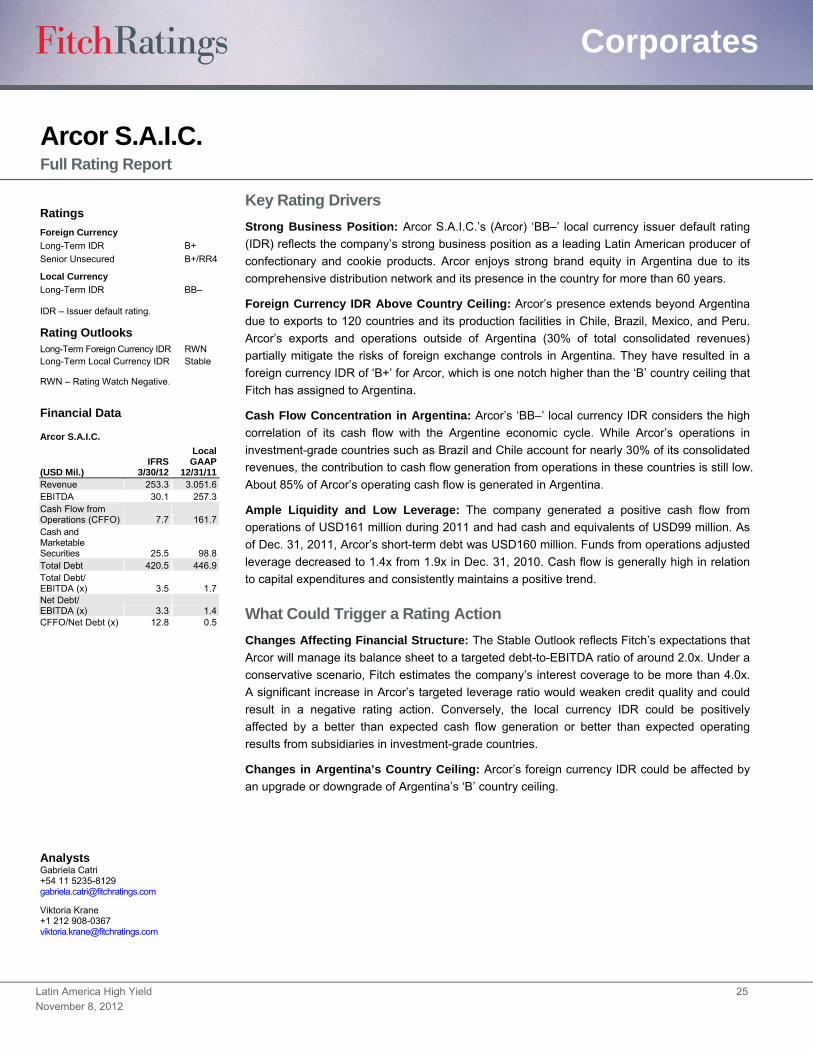
Latin America High Yield 25
November 8, 2012
Corporates
Arcor S.A.I.C. Full Rating Report
Key Rating Drivers
Strong Business Position: Arcor S.A.I.C.’s (Arcor) ‘BB–’ local currency issuer default rating
(IDR) reflects the company’s strong business position as a leading Latin American producer of
confectionary and cookie products. Arcor enjoys strong brand equity in Argentina due to its
comprehensive distribution network and its presence in the country for more than 60 years.
Foreign Currency IDR Above Country Ceiling: Arcor’s presence extends beyond Argentina
due to exports to 120 countries and its production facilities in Chile, Brazil, Mexico, and Peru.
Arcor’s exports and operations outside of Argentina (30% of total consolidated revenues)
partially mitigate the risks of foreign exchange controls in Argentina. They have resulted in a
foreign currency IDR of ‘B+’ for Arcor, which is one notch higher than the ‘B’ country ceiling that
Fitch has assigned to Argentina.
Cash Flow Concentration in Argentina: Arcor’s ‘BB–’ local currency IDR considers the high
correlation of its cash flow with the Argentine economic cycle. While Arcor’s operations in
investment-grade countries such as Brazil and Chile account for nearly 30% of its consolidated
revenues, the contribution to cash flow generation from operations in these countries is still low.
About 85% of Arcor’s operating cash flow is generated in Argentina.
Ample Liquidity and Low Leverage: The company generated a positive cash flow from
operations of USD161 million during 2011 and had cash and equivalents of USD99 million. As
of Dec. 31, 2011, Arcor’s short-term debt was USD160 million. Funds from operations adjusted
leverage decreased to 1.4x from 1.9x in Dec. 31, 2010. Cash flow is generally high in relation
to capital expenditures and consistently maintains a positive trend.
What Could Trigger a Rating Action
Changes Affecting Financial Structure: The Stable Outlook reflects Fitch’s expectations that
Arcor will manage its balance sheet to a targeted debt-to-EBITDA ratio of around 2.0x. Under a
conservative scenario, Fitch estimates the company’s interest coverage to be more than 4.0x.
A significant increase in Arcor’s targeted leverage ratio would weaken credit quality and could
result in a negative rating action. Conversely, the local currency IDR could be positively
affected by a better than expected cash flow generation or better than expected operating
results from subsidiaries in investment-grade countries.
Changes in Argentina’s Country Ceiling: Arcor’s foreign currency IDR could be affected by
an upgrade or downgrade of Argentina’s ‘B’ country ceiling.
Ratings
Foreign Currency
Long-Term IDR B+
Senior Unsecured B+/RR4
Local Currency
Long-Term IDR BB–
IDR – Issuer default rating.
Rating Outlooks Long-Term Foreign Currency IDR RWN Long-Term Local Currency IDR Stable
RWN – Rating Watch Negative.
Financial Data
Arcor S.A.I.C.
(USD Mil.) IFRS
3/30/12
Local GAAP
12/31/11 Revenue 253.3 3.051.6 EBITDA 30.1 257.3 Cash Flow from Operations (CFFO) 7.7 161.7 Cash and Marketable Securities 25.5 98.8 Total Debt 420.5 446.9 Total Debt/ EBITDA (x) 3.5 1.7 Net Debt/ EBITDA (x) 3.3 1.4 CFFO/Net Debt (x) 12.8 0.5
Analysts Gabriela Catri +54 11 5235-8129 [email protected]
Viktoria Krane +1 212 908-0367 [email protected]
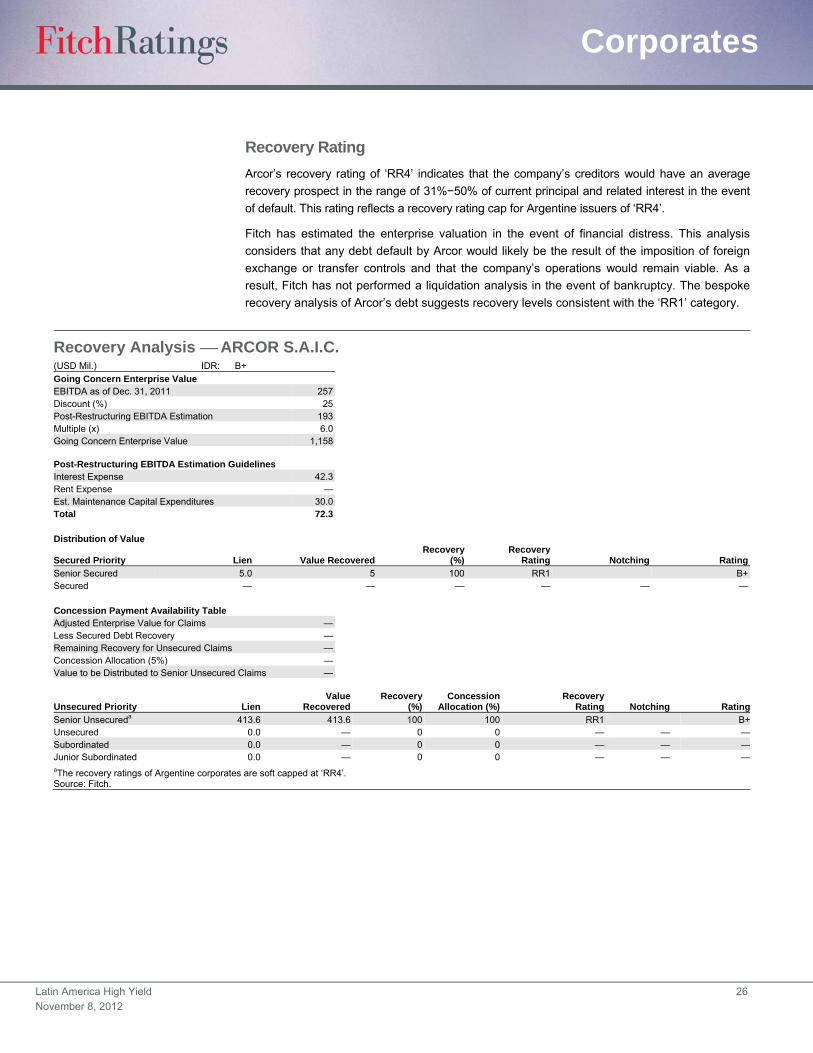
Latin America High Yield 26
November 8, 2012
Corporates
Recovery Rating
Arcor’s recovery rating of ‘RR4’ indicates that the company’s creditors would have an average
recovery prospect in the range of 31%−50% of current principal and related interest in the event
of default. This rating reflects a recovery rating cap for Argentine issuers of ‘RR4’.
Fitch has estimated the enterprise valuation in the event of financial distress. This analysis
considers that any debt default by Arcor would likely be the result of the imposition of foreign
exchange or transfer controls and that the company’s operations would remain viable. As a
result, Fitch has not performed a liquidation analysis in the event of bankruptcy. The bespoke
recovery analysis of Arcor’s debt suggests recovery levels consistent with the ‘RR1’ category.
Recovery Analysis ARCOR S.A.I.C. (USD Mil.) IDR: B+
Going Concern Enterprise Value EBITDA as of Dec. 31, 2011 257 Discount (%) 25 Post-Restructuring EBITDA Estimation 193 Multiple (x) 6.0 Going Concern Enterprise Value 1,158 Post-Restructuring EBITDA Estimation Guidelines Interest Expense 42.3 Rent Expense — Est. Maintenance Capital Expenditures 30.0 Total 72.3 Distribution of Value
Secured Priority Lien Value RecoveredRecovery
(%)Recovery
Rating Notching Rating
Senior Secured 5.0 5 100 RR1 B+Secured — — — — — — Concession Payment Availability Table Adjusted Enterprise Value for Claims — Less Secured Debt Recovery — Remaining Recovery for Unsecured Claims — Concession Allocation (5%) — Value to be Distributed to Senior Unsecured Claims —
Unsecured Priority Lien Value
RecoveredRecovery
(%)Concession
Allocation (%)Recovery
Rating Notching Rating
Senior Unsecureda 413.6 413.6 100 100 RR1 B+Unsecured 0.0 — 0 0 — — —Subordinated 0.0 — 0 0 — — —Junior Subordinated 0.0 — 0 0 — — —aThe recovery ratings of Argentine corporates are soft capped at ‘RR4’. Source: Fitch.
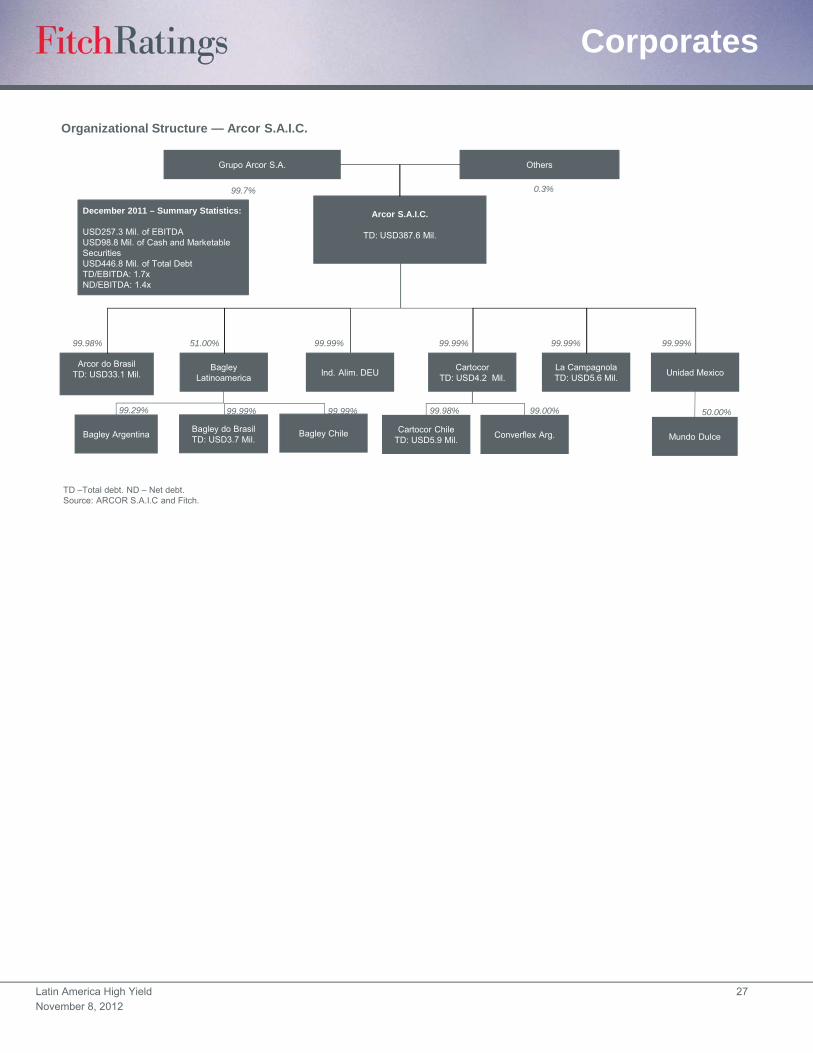
Latin America High Yield 27
November 8, 2012
Corporates
Organizational Structure — Arcor S.A.I.C.
TD –Total debt. ND – Net debt.Source: ARCOR S.A.I.C and Fitch.
Arcor S.A.I.C.
TD: USD387.6 Mil.
La CampagnolaTD: USD5.6 Mil.
Bagley Latinoamerica
Ind. Alim. DEUCartocor
TD: USD4.2 Mil.
Arcor do BrasilTD: USD33.1 Mil.
0.3%
Grupo Arcor S.A.
Unidad Mexico
Bagley Argentina Bagley ChileBagley do BrasilTD: USD3.7 Mil.
Cartocor ChileTD: USD5.9 Mil.
Others
Mundo Dulce
99.7%
99.98%
Converflex Arg.
51.00% 99.99% 99.99% 99.99% 99.99%
99.29% 99.99%99.99% 99.98% 99.00% 50.00%
December 2011 – Summary Statistics:
USD257.3 Mil. of EBITDAUSD98.8 Mil. of Cash and MarketableSecuritiesUSD446.8 Mil. of Total DebtTD/EBITDA: 1.7xND/EBITDA: 1.4x

Latin America High Yield 28
November 8, 2012
Corporates
Debt and Covenant Synopsis — Arcor S.A.I.C. (Foreign Currency Notes)
Overview Issuer Arcor S.A.I.C. Guarantors N.A. Document Date Oct. 26, 2010 Maturity Date 2017 Description of Debt Senior Unsecured Notes
Financial Covenants Consolidated Net Debt/ EBITDA (Maximum) N.A. Interest Coverage (Minimum) N.A.
Acquisitions/Divestitures Change of Control Provision Change of control clause at 101% of principal. Limitation on Sale of Restricted Subsidiaries
The company will not and will not permit any restricted subsidiary transfer, convey, lease, sell, or dispose of any voting stock of any restricted subsidiary, except: to the company or to other restricted subsidiary; in compliance with covenants Limitation on Sales of Assets, Limitation on Restricted Payments.
Debt Restriction Additional Debt Restriction The company will not and will not permit any restricted subsidiary to incur in any indebtedness (other than Permitted Debt).
Exceptions are: 1) on the date of such incurrence, the fixed charge coverage ratio would be no less than 3x and 2) no default or event of default shall have occurred.
Other Transactions with Affiliates The company will not and will not allow its restricted subsidiaries to enter into a transaction with affiliates, unless: 1) the
transaction is on terms that are no less favorable than those that would have been obtained in a comparable transaction with a Person that is not an affiliate; 2) the company delivers to the trustee for transactions in excess of USD15 million, a resolution from its board of directors.
Sale and Leaseback Transactions The company or its restricted subsidiaries will not enter into any sale and lease back transactions unless pursuant to the provisions of the covenant described under 'limitation on Indebtedness'.
FQE – Fiscal quarter-end. FYE – Fiscal year-end. N.A. – Not applicable. Disclaimer: The covenant summaries reflect Fitch’s interpretation and synopsis of information contained in publicly available documents identified in the “Document Date and Location” section of each covenant summary table. Fitch cannot ensure that the information contained in such documents is either accurate or complete, or that the covenant summaries, or any particular covenant summary, accurately or completely reflect the key terms of any such document. The information presented in the covenant summaries is provided “as is” without any representation or warranty and is not a substitute for information provided to investors by an issuer and its agents in connection with a sale of securities. Source: Company and Fitch Ratings.
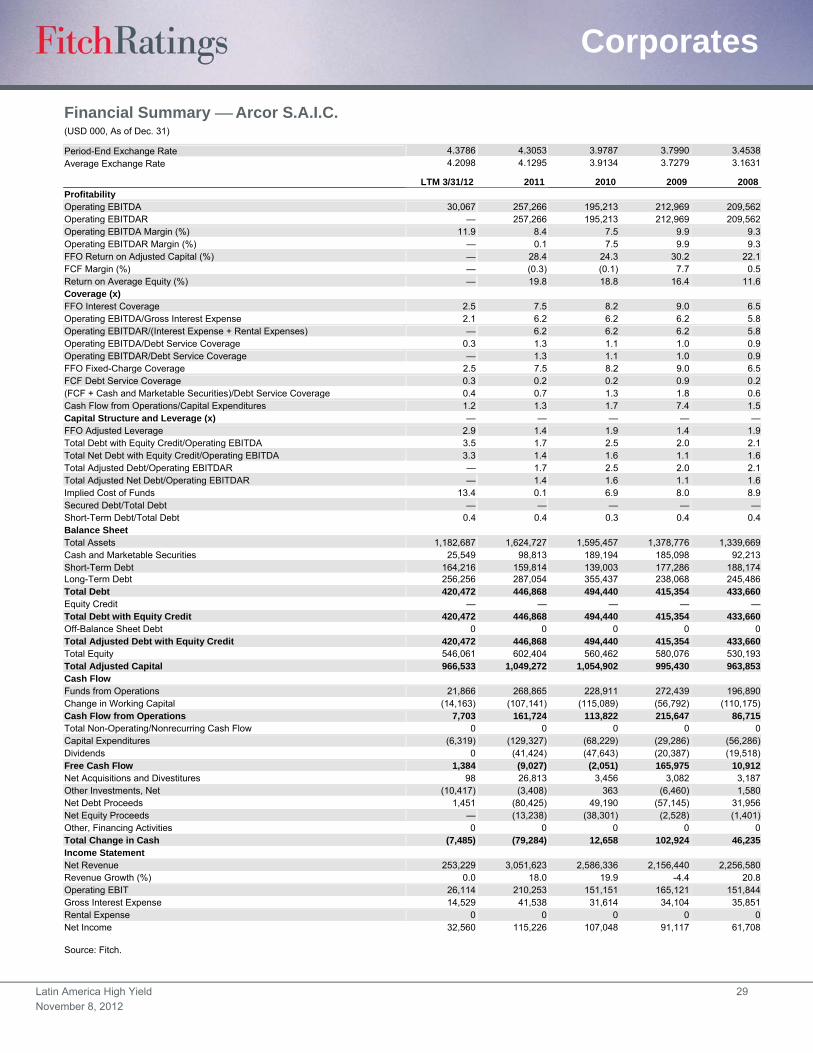
Latin America High Yield 29
November 8, 2012
Corporates
Financial Summary Arcor S.A.I.C. (USD 000, As of Dec. 31)
Period-End Exchange Rate 4.3786 4.3053 3.9787 3.7990 3.4538
Average Exchange Rate 4.2098 4.1295 3.9134 3.7279 3.1631
LTM 3/31/12 2011 2010 2009 2008Profitability Operating EBITDA 30,067 257,266 195,213 212,969 209,562 Operating EBITDAR — 257,266 195,213 212,969 209,562 Operating EBITDA Margin (%) 11.9 8.4 7.5 9.9 9.3Operating EBITDAR Margin (%) — 0.1 7.5 9.9 9.3FFO Return on Adjusted Capital (%) — 28.4 24.3 30.2 22.1FCF Margin (%) — (0.3) (0.1) 7.7 0.5Return on Average Equity (%) — 19.8 18.8 16.4 11.6Coverage (x) FFO Interest Coverage 2.5 7.5 8.2 9.0 6.5Operating EBITDA/Gross Interest Expense 2.1 6.2 6.2 6.2 5.8Operating EBITDAR/(Interest Expense + Rental Expenses) — 6.2 6.2 6.2 5.8Operating EBITDA/Debt Service Coverage 0.3 1.3 1.1 1.0 0.9Operating EBITDAR/Debt Service Coverage — 1.3 1.1 1.0 0.9FFO Fixed-Charge Coverage 2.5 7.5 8.2 9.0 6.5FCF Debt Service Coverage 0.3 0.2 0.2 0.9 0.2(FCF + Cash and Marketable Securities)/Debt Service Coverage 0.4 0.7 1.3 1.8 0.6Cash Flow from Operations/Capital Expenditures 1.2 1.3 1.7 7.4 1.5Capital Structure and Leverage (x) — — — — —FFO Adjusted Leverage 2.9 1.4 1.9 1.4 1.9Total Debt with Equity Credit/Operating EBITDA 3.5 1.7 2.5 2.0 2.1Total Net Debt with Equity Credit/Operating EBITDA 3.3 1.4 1.6 1.1 1.6Total Adjusted Debt/Operating EBITDAR — 1.7 2.5 2.0 2.1Total Adjusted Net Debt/Operating EBITDAR — 1.4 1.6 1.1 1.6Implied Cost of Funds 13.4 0.1 6.9 8.0 8.9Secured Debt/Total Debt — — — — —Short-Term Debt/Total Debt 0.4 0.4 0.3 0.4 0.4Balance Sheet Total Assets 1,182,687 1,624,727 1,595,457 1,378,776 1,339,669 Cash and Marketable Securities 25,549 98,813 189,194 185,098 92,213 Short-Term Debt 164,216 159,814 139,003 177,286 188,174 Long-Term Debt 256,256 287,054 355,437 238,068 245,486 Total Debt 420,472 446,868 494,440 415,354 433,660 Equity Credit — — — — —Total Debt with Equity Credit 420,472 446,868 494,440 415,354 433,660 Off-Balance Sheet Debt 0 0 0 0 0 Total Adjusted Debt with Equity Credit 420,472 446,868 494,440 415,354 433,660 Total Equity 546,061 602,404 560,462 580,076 530,193 Total Adjusted Capital 966,533 1,049,272 1,054,902 995,430 963,853 Cash Flow Funds from Operations 21,866 268,865 228,911 272,439 196,890 Change in Working Capital (14,163) (107,141) (115,089) (56,792) (110,175)Cash Flow from Operations 7,703 161,724 113,822 215,647 86,715 Total Non-Operating/Nonrecurring Cash Flow 0 0 0 0 0 Capital Expenditures (6,319) (129,327) (68,229) (29,286) (56,286)Dividends 0 (41,424) (47,643) (20,387) (19,518)Free Cash Flow 1,384 (9,027) (2,051) 165,975 10,912 Net Acquisitions and Divestitures 98 26,813 3,456 3,082 3,187 Other Investments, Net (10,417) (3,408) 363 (6,460) 1,580 Net Debt Proceeds 1,451 (80,425) 49,190 (57,145) 31,956 Net Equity Proceeds — (13,238) (38,301) (2,528) (1,401)Other, Financing Activities 0 0 0 0 0 Total Change in Cash (7,485) (79,284) 12,658 102,924 46,235 Income Statement Net Revenue 253,229 3,051,623 2,586,336 2,156,440 2,256,580 Revenue Growth (%) 0.0 18.0 19.9 -4.4 20.8Operating EBIT 26,114 210,253 151,151 165,121 151,844 Gross Interest Expense 14,529 41,538 31,614 34,104 35,851 Rental Expense 0 0 0 0 0 Net Income 32,560 115,226 107,048 91,117 61,708
Source: Fitch.
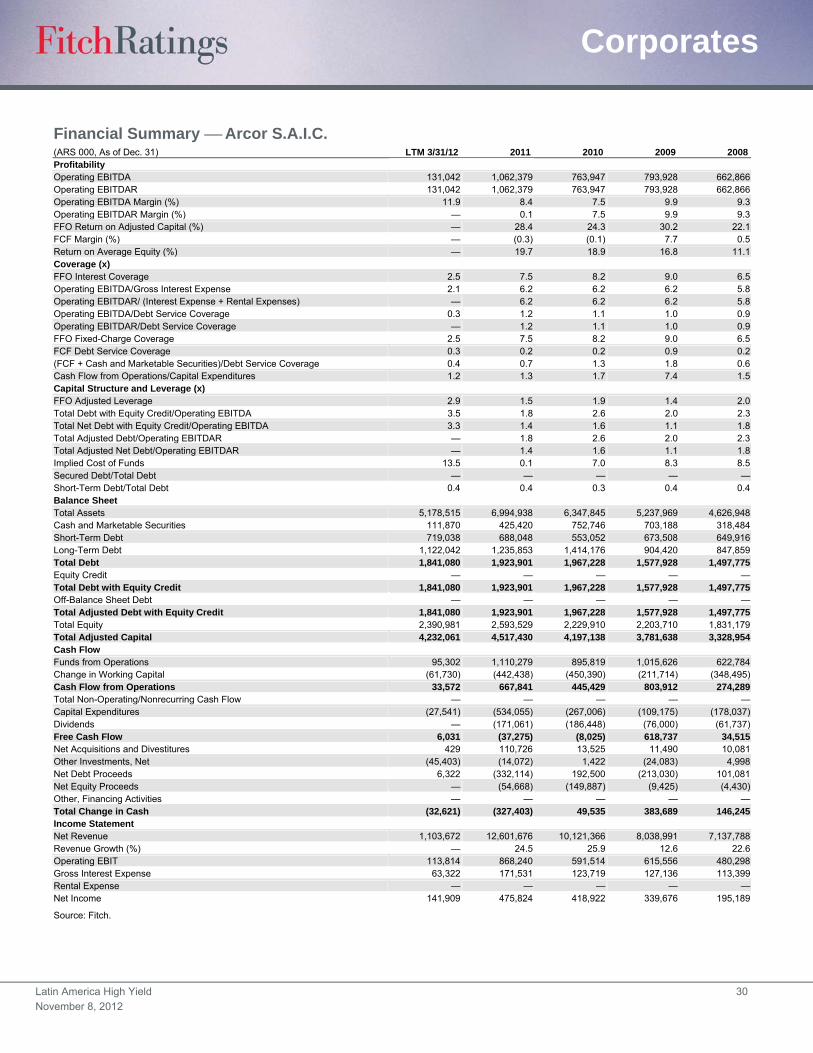
Latin America High Yield 30
November 8, 2012
Corporates
Financial Summary Arcor S.A.I.C. (ARS 000, As of Dec. 31) LTM 3/31/12 2011 2010 2009 2008Profitability Operating EBITDA 131,042 1,062,379 763,947 793,928 662,866 Operating EBITDAR 131,042 1,062,379 763,947 793,928 662,866 Operating EBITDA Margin (%) 11.9 8.4 7.5 9.9 9.3 Operating EBITDAR Margin (%) — 0.1 7.5 9.9 9.3 FFO Return on Adjusted Capital (%) — 28.4 24.3 30.2 22.1 FCF Margin (%) — (0.3) (0.1) 7.7 0.5 Return on Average Equity (%) — 19.7 18.9 16.8 11.1 Coverage (x) FFO Interest Coverage 2.5 7.5 8.2 9.0 6.5 Operating EBITDA/Gross Interest Expense 2.1 6.2 6.2 6.2 5.8 Operating EBITDAR/ (Interest Expense + Rental Expenses) — 6.2 6.2 6.2 5.8 Operating EBITDA/Debt Service Coverage 0.3 1.2 1.1 1.0 0.9 Operating EBITDAR/Debt Service Coverage — 1.2 1.1 1.0 0.9 FFO Fixed-Charge Coverage 2.5 7.5 8.2 9.0 6.5 FCF Debt Service Coverage 0.3 0.2 0.2 0.9 0.2 (FCF + Cash and Marketable Securities)/Debt Service Coverage 0.4 0.7 1.3 1.8 0.6 Cash Flow from Operations/Capital Expenditures 1.2 1.3 1.7 7.4 1.5 Capital Structure and Leverage (x) FFO Adjusted Leverage 2.9 1.5 1.9 1.4 2.0 Total Debt with Equity Credit/Operating EBITDA 3.5 1.8 2.6 2.0 2.3 Total Net Debt with Equity Credit/Operating EBITDA 3.3 1.4 1.6 1.1 1.8 Total Adjusted Debt/Operating EBITDAR — 1.8 2.6 2.0 2.3 Total Adjusted Net Debt/Operating EBITDAR — 1.4 1.6 1.1 1.8 Implied Cost of Funds 13.5 0.1 7.0 8.3 8.5 Secured Debt/Total Debt — — — — —Short-Term Debt/Total Debt 0.4 0.4 0.3 0.4 0.4 Balance Sheet Total Assets 5,178,515 6,994,938 6,347,845 5,237,969 4,626,948 Cash and Marketable Securities 111,870 425,420 752,746 703,188 318,484 Short-Term Debt 719,038 688,048 553,052 673,508 649,916 Long-Term Debt 1,122,042 1,235,853 1,414,176 904,420 847,859 Total Debt 1,841,080 1,923,901 1,967,228 1,577,928 1,497,775 Equity Credit — — — — —Total Debt with Equity Credit 1,841,080 1,923,901 1,967,228 1,577,928 1,497,775 Off-Balance Sheet Debt — — — — —Total Adjusted Debt with Equity Credit 1,841,080 1,923,901 1,967,228 1,577,928 1,497,775 Total Equity 2,390,981 2,593,529 2,229,910 2,203,710 1,831,179 Total Adjusted Capital 4,232,061 4,517,430 4,197,138 3,781,638 3,328,954 Cash Flow Funds from Operations 95,302 1,110,279 895,819 1,015,626 622,784 Change in Working Capital (61,730) (442,438) (450,390) (211,714) (348,495)Cash Flow from Operations 33,572 667,841 445,429 803,912 274,289 Total Non-Operating/Nonrecurring Cash Flow — — — — —Capital Expenditures (27,541) (534,055) (267,006) (109,175) (178,037)Dividends — (171,061) (186,448) (76,000) (61,737)Free Cash Flow 6,031 (37,275) (8,025) 618,737 34,515 Net Acquisitions and Divestitures 429 110,726 13,525 11,490 10,081 Other Investments, Net (45,403) (14,072) 1,422 (24,083) 4,998 Net Debt Proceeds 6,322 (332,114) 192,500 (213,030) 101,081 Net Equity Proceeds — (54,668) (149,887) (9,425) (4,430)Other, Financing Activities — — — — —Total Change in Cash (32,621) (327,403) 49,535 383,689 146,245 Income Statement Net Revenue 1,103,672 12,601,676 10,121,366 8,038,991 7,137,788 Revenue Growth (%) — 24.5 25.9 12.6 22.6Operating EBIT 113,814 868,240 591,514 615,556 480,298 Gross Interest Expense 63,322 171,531 123,719 127,136 113,399 Rental Expense — — — — —Net Income 141,909 475,824 418,922 339,676 195,189
Source: Fitch.
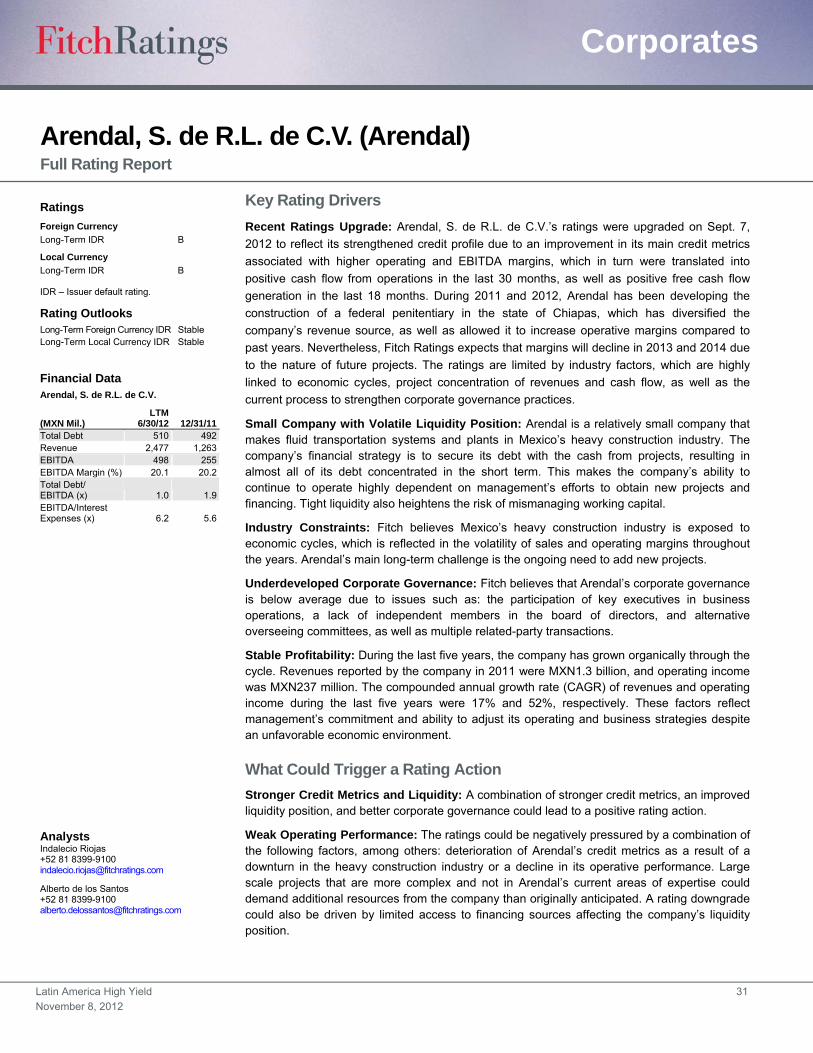
Latin America High Yield 31
November 8, 2012
Corporates
Arendal, S. de R.L. de C.V. (Arendal) Full Rating Report
Key Rating Drivers
Recent Ratings Upgrade: Arendal, S. de R.L. de C.V.’s ratings were upgraded on Sept. 7,
2012 to reflect its strengthened credit profile due to an improvement in its main credit metrics
associated with higher operating and EBITDA margins, which in turn were translated into
positive cash flow from operations in the last 30 months, as well as positive free cash flow
generation in the last 18 months. During 2011 and 2012, Arendal has been developing the
construction of a federal penitentiary in the state of Chiapas, which has diversified the
company’s revenue source, as well as allowed it to increase operative margins compared to
past years. Nevertheless, Fitch Ratings expects that margins will decline in 2013 and 2014 due
to the nature of future projects. The ratings are limited by industry factors, which are highly
linked to economic cycles, project concentration of revenues and cash flow, as well as the
current process to strengthen corporate governance practices.
Small Company with Volatile Liquidity Position: Arendal is a relatively small company that makes fluid transportation systems and plants in Mexico’s heavy construction industry. The company’s financial strategy is to secure its debt with the cash from projects, resulting in almost all of its debt concentrated in the short term. This makes the company’s ability to continue to operate highly dependent on management’s efforts to obtain new projects and financing. Tight liquidity also heightens the risk of mismanaging working capital.
Industry Constraints: Fitch believes Mexico’s heavy construction industry is exposed to economic cycles, which is reflected in the volatility of sales and operating margins throughout the years. Arendal’s main long-term challenge is the ongoing need to add new projects.
Underdeveloped Corporate Governance: Fitch believes that Arendal’s corporate governance is below average due to issues such as: the participation of key executives in business operations, a lack of independent members in the board of directors, and alternative overseeing committees, as well as multiple related-party transactions.
Stable Profitability: During the last five years, the company has grown organically through the cycle. Revenues reported by the company in 2011 were MXN1.3 billion, and operating income was MXN237 million. The compounded annual growth rate (CAGR) of revenues and operating income during the last five years were 17% and 52%, respectively. These factors reflect management’s commitment and ability to adjust its operating and business strategies despite an unfavorable economic environment.
What Could Trigger a Rating Action
Stronger Credit Metrics and Liquidity: A combination of stronger credit metrics, an improved liquidity position, and better corporate governance could lead to a positive rating action.
Weak Operating Performance: The ratings could be negatively pressured by a combination of the following factors, among others: deterioration of Arendal’s credit metrics as a result of a downturn in the heavy construction industry or a decline in its operative performance. Large scale projects that are more complex and not in Arendal’s current areas of expertise could demand additional resources from the company than originally anticipated. A rating downgrade could also be driven by limited access to financing sources affecting the company’s liquidity position.
Ratings
Foreign Currency
Long-Term IDR B
Local Currency
Long-Term IDR B
IDR – Issuer default rating.
Rating Outlooks Long-Term Foreign Currency IDR Stable Long-Term Local Currency IDR Stable
Financial Data Arendal, S. de R.L. de C.V.
(MXN Mil.) LTM
6/30/12 12/31/11 Total Debt 510 492 Revenue 2,477 1,263 EBITDA 498 255 EBITDA Margin (%) 20.1 20.2 Total Debt/ EBITDA (x) 1.0 1.9 EBITDA/Interest Expenses (x) 6.2 5.6
Analysts Indalecio Riojas +52 81 8399-9100 [email protected]
Alberto de los Santos +52 81 8399-9100 [email protected]

Latin America High Yield 32
November 8, 2012
Corporates
Organizational Structure — Arendal, S. de R.L. de C.V. (MXN Million, As of June 30, 2012)
Source: Company reports and Fitch estimates.
Arendal, S. de R.L. de C.V. Foreign Currency IDR — BLocal Currency IDR — B
Credit Facilities for Projects 501.3Financial Leases 8.7 Total Debt 510.0
MAKOBIL,S. de R.L. de C.V.
Aspica, S. de R.L. de C.V.
99.9%99.9%
These three companies provide and manage the personnel services to the sites and corporate offices.
ARB ArendalServicios,
S.A. de C.V.
76.0%
ARB ArendalConstrucciones,
S.A. de C.V.
99.9%
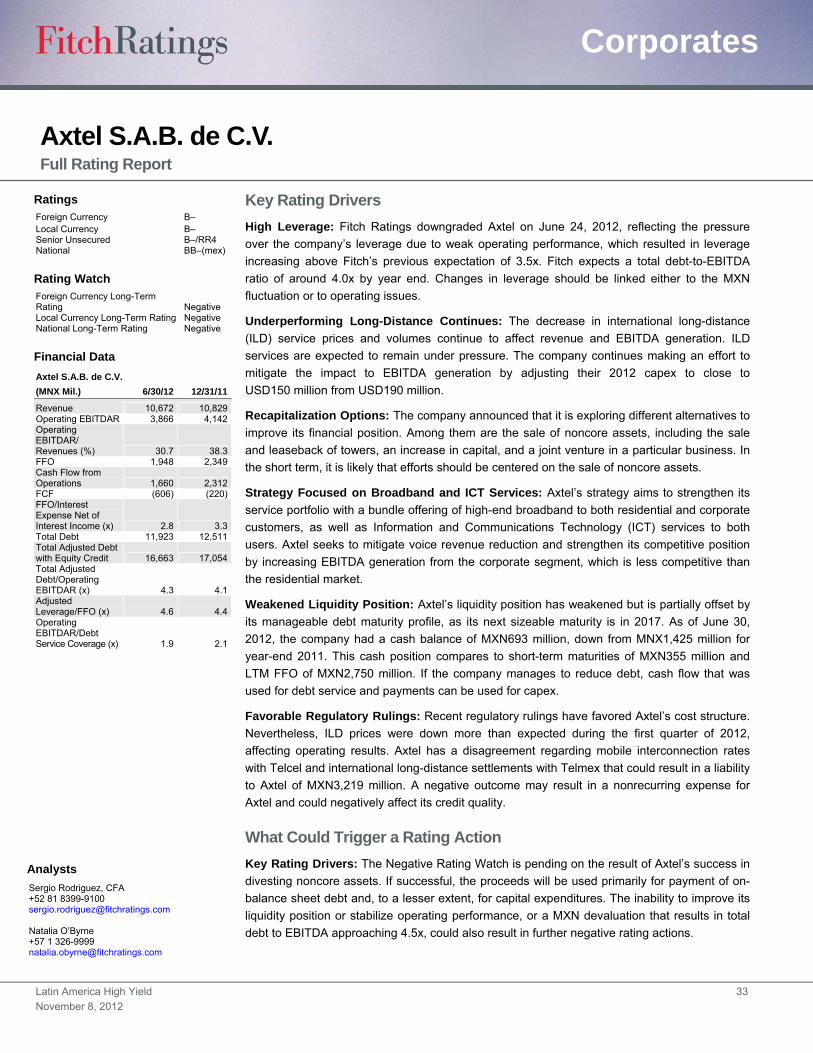
Latin America High Yield 33
November 8, 2012
Corporates
Axtel S.A.B. de C.V. Full Rating Report
Key Rating Drivers
High Leverage: Fitch Ratings downgraded Axtel on June 24, 2012, reflecting the pressure
over the company’s leverage due to weak operating performance, which resulted in leverage
increasing above Fitch’s previous expectation of 3.5x. Fitch expects a total debt-to-EBITDA
ratio of around 4.0x by year end. Changes in leverage should be linked either to the MXN
fluctuation or to operating issues.
Underperforming Long-Distance Continues: The decrease in international long-distance
(ILD) service prices and volumes continue to affect revenue and EBITDA generation. ILD
services are expected to remain under pressure. The company continues making an effort to
mitigate the impact to EBITDA generation by adjusting their 2012 capex to close to
USD150 million from USD190 million.
Recapitalization Options: The company announced that it is exploring different alternatives to
improve its financial position. Among them are the sale of noncore assets, including the sale
and leaseback of towers, an increase in capital, and a joint venture in a particular business. In
the short term, it is likely that efforts should be centered on the sale of noncore assets.
Strategy Focused on Broadband and ICT Services: Axtel’s strategy aims to strengthen its
service portfolio with a bundle offering of high-end broadband to both residential and corporate
customers, as well as Information and Communications Technology (ICT) services to both
users. Axtel seeks to mitigate voice revenue reduction and strengthen its competitive position
by increasing EBITDA generation from the corporate segment, which is less competitive than
the residential market.
Weakened Liquidity Position: Axtel’s liquidity position has weakened but is partially offset by
its manageable debt maturity profile, as its next sizeable maturity is in 2017. As of June 30,
2012, the company had a cash balance of MXN693 million, down from MNX1,425 million for
year-end 2011. This cash position compares to short-term maturities of MXN355 million and
LTM FFO of MXN2,750 million. If the company manages to reduce debt, cash flow that was
used for debt service and payments can be used for capex.
Favorable Regulatory Rulings: Recent regulatory rulings have favored Axtel’s cost structure.
Nevertheless, ILD prices were down more than expected during the first quarter of 2012,
affecting operating results. Axtel has a disagreement regarding mobile interconnection rates
with Telcel and international long-distance settlements with Telmex that could result in a liability
to Axtel of MXN3,219 million. A negative outcome may result in a nonrecurring expense for
Axtel and could negatively affect its credit quality.
What Could Trigger a Rating Action
Key Rating Drivers: The Negative Rating Watch is pending on the result of Axtel’s success in
divesting noncore assets. If successful, the proceeds will be used primarily for payment of on-
balance sheet debt and, to a lesser extent, for capital expenditures. The inability to improve its
liquidity position or stabilize operating performance, or a MXN devaluation that results in total
debt to EBITDA approaching 4.5x, could also result in further negative rating actions.
Ratings Foreign Currency B– Local Currency B– Senior Unsecured B–/RR4 National BB–(mex)
Rating Watch Foreign Currency Long-Term Rating Negative Local Currency Long-Term Rating Negative National Long-Term Rating Negative
Financial Data
Axtel S.A.B. de C.V.
(MNX Mil.) 6/30/12 12/31/11
Revenue 10,672 10,829 Operating EBITDAR 3,866 4,142 Operating EBITDAR/ Revenues (%) 30.7 38.3 FFO 1,948 2,349 Cash Flow from Operations 1,660 2,312 FCF (606) (220) FFO/Interest Expense Net of Interest Income (x) 2.8 3.3 Total Debt 11,923 12,511 Total Adjusted Debt with Equity Credit 16,663 17,054 Total Adjusted Debt/Operating EBITDAR (x) 4.3 4.1 Adjusted Leverage/FFO (x) 4.6 4.4 Operating EBITDAR/Debt Service Coverage (x) 1.9 2.1
Analysts
Sergio Rodriguez, CFA +52 81 8399-9100 [email protected] Natalia O’Byrne +57 1 326-9999 [email protected]
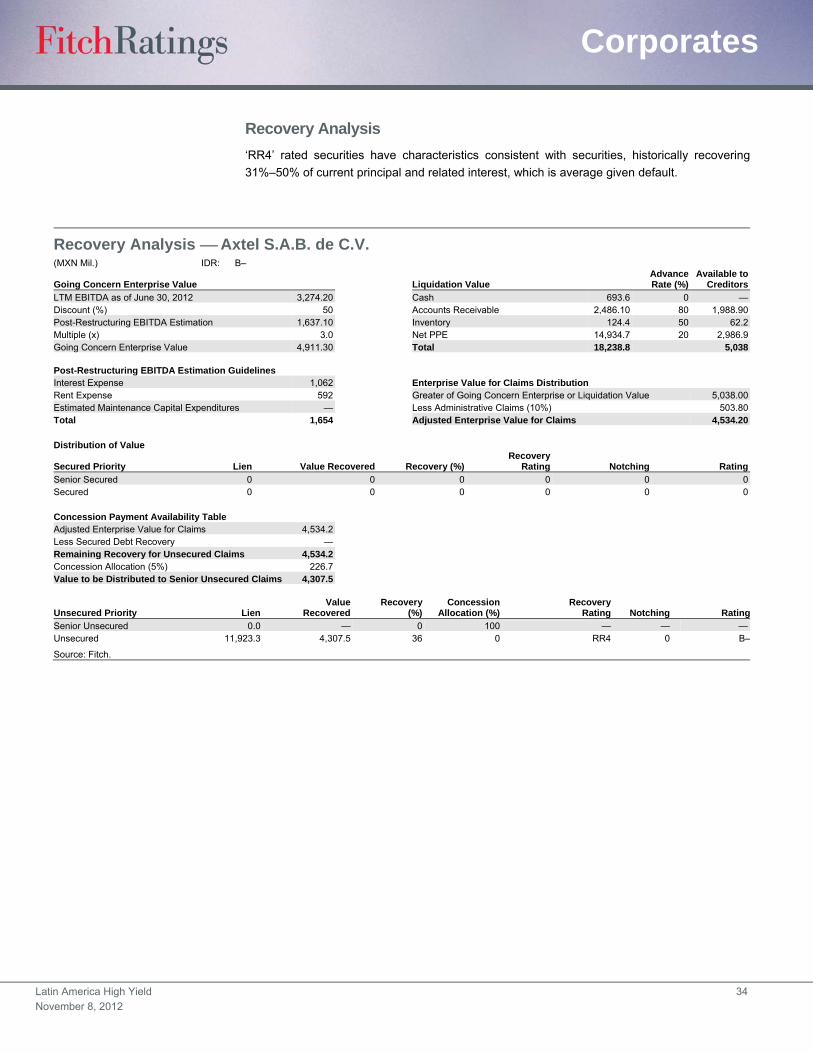
Latin America High Yield 34
November 8, 2012
Corporates
Recovery Analysis
‘RR4’ rated securities have characteristics consistent with securities, historically recovering
31%–50% of current principal and related interest, which is average given default.
Recovery Analysis Axtel S.A.B. de C.V. (MXN Mil.) IDR: B–
Going Concern Enterprise Value Liquidation Value AdvanceRate (%)
Available toCreditors
LTM EBITDA as of June 30, 2012 3,274.20 Cash 693.6 0 —Discount (%) 50 Accounts Receivable 2,486.10 80 1,988.90Post-Restructuring EBITDA Estimation 1,637.10 Inventory 124.4 50 62.2Multiple (x) 3.0 Net PPE 14,934.7 20 2,986.9Going Concern Enterprise Value 4,911.30 Total 18,238.8 5,038 Post-Restructuring EBITDA Estimation Guidelines Interest Expense 1,062 Enterprise Value for Claims Distribution Rent Expense 592 Greater of Going Concern Enterprise or Liquidation Value 5,038.00Estimated Maintenance Capital Expenditures — Less Administrative Claims (10%) 503.80Total 1,654 Adjusted Enterprise Value for Claims 4,534.20 Distribution of Value
Secured Priority Lien Value Recovered Recovery (%)Recovery
Rating Notching Rating
Senior Secured 0 0 0 0 0 0Secured 0 0 0 0 0 0 Concession Payment Availability Table Adjusted Enterprise Value for Claims 4,534.2 Less Secured Debt Recovery — Remaining Recovery for Unsecured Claims 4,534.2 Concession Allocation (5%) 226.7 Value to be Distributed to Senior Unsecured Claims 4,307.5
Unsecured Priority Lien Value
RecoveredRecovery
(%)Concession
Allocation (%)Recovery
Rating Notching Rating
Senior Unsecured 0.0 — 0 100 — — —Unsecured 11,923.3 4,307.5 36 0 RR4 0 B–
Source: Fitch.
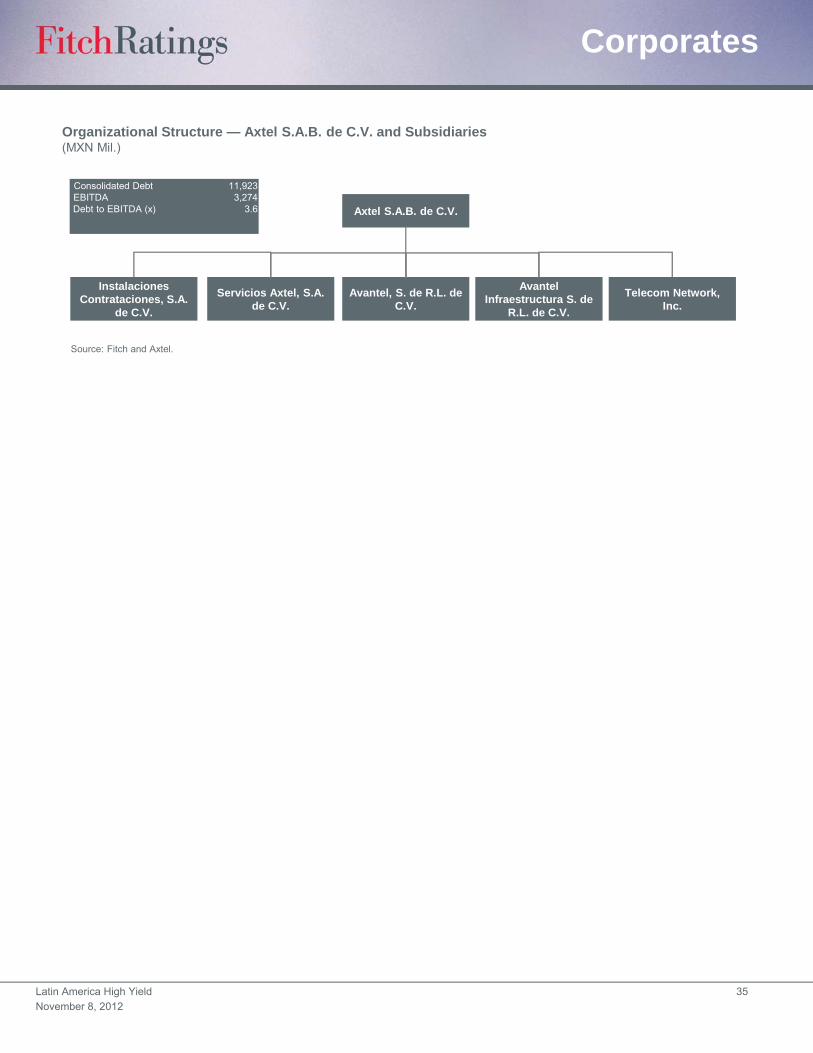
Latin America High Yield 35
November 8, 2012
Corporates
Organizational Structure — Axtel S.A.B. de C.V. and Subsidiaries(MXN Mil.)
Source: Fitch and Axtel.
Axtel S.A.B. de C.V.
Consolidated Debt 11,923 EBITDA 3,274Debt to EBITDA (x) 3.6
Instalaciones Contrataciones, S.A.
de C.V.
Servicios Axtel, S.A. de C.V.
Avantel, S. de R.L. de C.V.
Avantel Infraestructura S. de
R.L. de C.V.
Telecom Network, Inc.
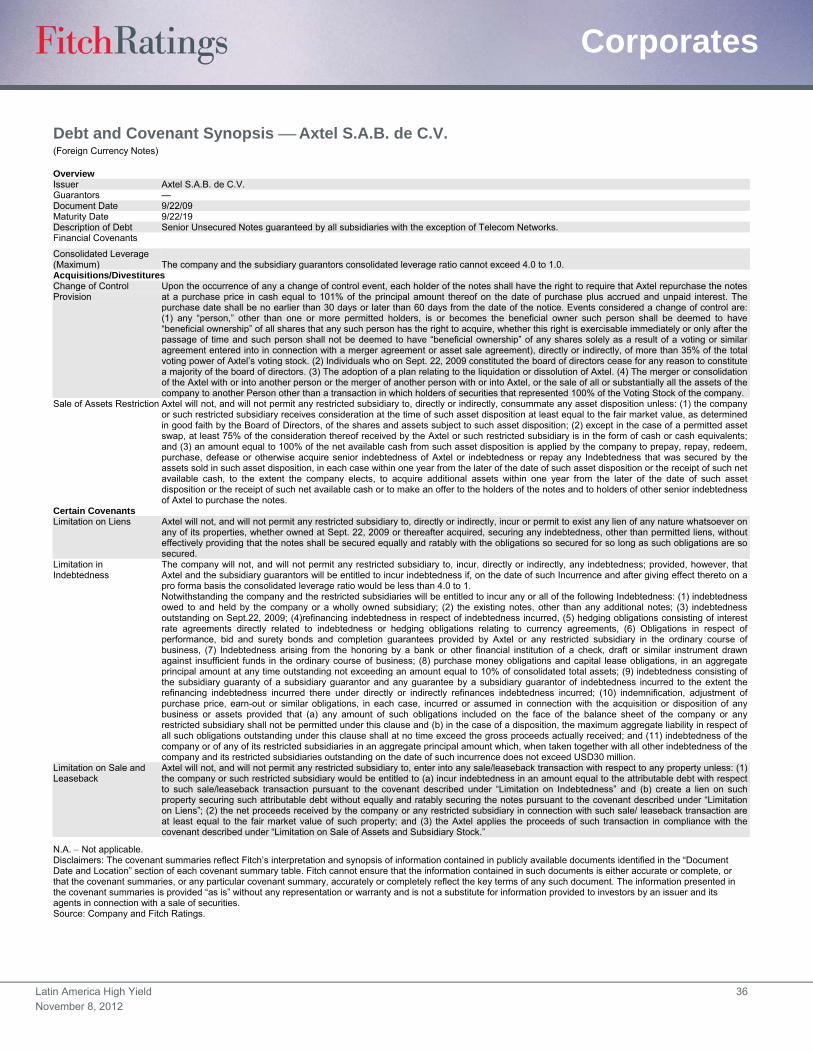
Latin America High Yield 36
November 8, 2012
Corporates
Debt and Covenant Synopsis Axtel S.A.B. de C.V. (Foreign Currency Notes)
Overview Issuer Axtel S.A.B. de C.V. Guarantors — Document Date 9/22/09 Maturity Date 9/22/19 Description of Debt Senior Unsecured Notes guaranteed by all subsidiaries with the exception of Telecom Networks. Financial Covenants
Consolidated Leverage (Maximum) The company and the subsidiary guarantors consolidated leverage ratio cannot exceed 4.0 to 1.0. Acquisitions/Divestitures Change of Control Provision
Upon the occurrence of any a change of control event, each holder of the notes shall have the right to require that Axtel repurchase the notes at a purchase price in cash equal to 101% of the principal amount thereof on the date of purchase plus accrued and unpaid interest. The purchase date shall be no earlier than 30 days or later than 60 days from the date of the notice. Events considered a change of control are: (1) any “person,” other than one or more permitted holders, is or becomes the beneficial owner such person shall be deemed to have “beneficial ownership” of all shares that any such person has the right to acquire, whether this right is exercisable immediately or only after the passage of time and such person shall not be deemed to have “beneficial ownership” of any shares solely as a result of a voting or similar agreement entered into in connection with a merger agreement or asset sale agreement), directly or indirectly, of more than 35% of the total voting power of Axtel’s voting stock. (2) Individuals who on Sept. 22, 2009 constituted the board of directors cease for any reason to constitute a majority of the board of directors. (3) The adoption of a plan relating to the liquidation or dissolution of Axtel. (4) The merger or consolidation of the Axtel with or into another person or the merger of another person with or into Axtel, or the sale of all or substantially all the assets of the company to another Person other than a transaction in which holders of securities that represented 100% of the Voting Stock of the company.
Sale of Assets Restriction Axtel will not, and will not permit any restricted subsidiary to, directly or indirectly, consummate any asset disposition unless: (1) the company or such restricted subsidiary receives consideration at the time of such asset disposition at least equal to the fair market value, as determined in good faith by the Board of Directors, of the shares and assets subject to such asset disposition; (2) except in the case of a permitted asset swap, at least 75% of the consideration thereof received by the Axtel or such restricted subsidiary is in the form of cash or cash equivalents; and (3) an amount equal to 100% of the net available cash from such asset disposition is applied by the company to prepay, repay, redeem, purchase, defease or otherwise acquire senior indebtedness of Axtel or indebtedness or repay any Indebtedness that was secured by the assets sold in such asset disposition, in each case within one year from the later of the date of such asset disposition or the receipt of such net available cash, to the extent the company elects, to acquire additional assets within one year from the later of the date of such asset disposition or the receipt of such net available cash or to make an offer to the holders of the notes and to holders of other senior indebtedness of Axtel to purchase the notes.
Certain Covenants Limitation on Liens Axtel will not, and will not permit any restricted subsidiary to, directly or indirectly, incur or permit to exist any lien of any nature whatsoever on
any of its properties, whether owned at Sept. 22, 2009 or thereafter acquired, securing any indebtedness, other than permitted liens, without effectively providing that the notes shall be secured equally and ratably with the obligations so secured for so long as such obligations are so secured.
Limitation in Indebtedness
The company will not, and will not permit any restricted subsidiary to, incur, directly or indirectly, any indebtedness; provided, however, that Axtel and the subsidiary guarantors will be entitled to incur indebtedness if, on the date of such Incurrence and after giving effect thereto on a pro forma basis the consolidated leverage ratio would be less than 4.0 to 1. Notwithstanding the company and the restricted subsidiaries will be entitled to incur any or all of the following Indebtedness: (1) indebtedness owed to and held by the company or a wholly owned subsidiary; (2) the existing notes, other than any additional notes; (3) indebtedness outstanding on Sept.22, 2009; (4)refinancing indebtedness in respect of indebtedness incurred, (5) hedging obligations consisting of interest rate agreements directly related to indebtedness or hedging obligations relating to currency agreements, (6) Obligations in respect of performance, bid and surety bonds and completion guarantees provided by Axtel or any restricted subsidiary in the ordinary course of business, (7) Indebtedness arising from the honoring by a bank or other financial institution of a check, draft or similar instrument drawn against insufficient funds in the ordinary course of business; (8) purchase money obligations and capital lease obligations, in an aggregate principal amount at any time outstanding not exceeding an amount equal to 10% of consolidated total assets; (9) indebtedness consisting of the subsidiary guaranty of a subsidiary guarantor and any guarantee by a subsidiary guarantor of indebtedness incurred to the extent the refinancing indebtedness incurred there under directly or indirectly refinances indebtedness incurred; (10) indemnification, adjustment of purchase price, earn-out or similar obligations, in each case, incurred or assumed in connection with the acquisition or disposition of any business or assets provided that (a) any amount of such obligations included on the face of the balance sheet of the company or any restricted subsidiary shall not be permitted under this clause and (b) in the case of a disposition, the maximum aggregate liability in respect of all such obligations outstanding under this clause shall at no time exceed the gross proceeds actually received; and (11) indebtedness of the company or of any of its restricted subsidiaries in an aggregate principal amount which, when taken together with all other indebtedness of the company and its restricted subsidiaries outstanding on the date of such incurrence does not exceed USD30 million.
Limitation on Sale and Leaseback
Axtel will not, and will not permit any restricted subsidiary to, enter into any sale/leaseback transaction with respect to any property unless: (1) the company or such restricted subsidiary would be entitled to (a) incur indebtedness in an amount equal to the attributable debt with respect to such sale/leaseback transaction pursuant to the covenant described under “Limitation on Indebtedness” and (b) create a lien on such property securing such attributable debt without equally and ratably securing the notes pursuant to the covenant described under “Limitation on Liens”; (2) the net proceeds received by the company or any restricted subsidiary in connection with such sale/ leaseback transaction are at least equal to the fair market value of such property; and (3) the Axtel applies the proceeds of such transaction in compliance with the covenant described under “Limitation on Sale of Assets and Subsidiary Stock.”
N.A. Not applicable. Disclaimers: The covenant summaries reflect Fitch’s interpretation and synopsis of information contained in publicly available documents identified in the “Document Date and Location” section of each covenant summary table. Fitch cannot ensure that the information contained in such documents is either accurate or complete, or that the covenant summaries, or any particular covenant summary, accurately or completely reflect the key terms of any such document. The information presented in the covenant summaries is provided “as is” without any representation or warranty and is not a substitute for information provided to investors by an issuer and its agents in connection with a sale of securities. Source: Company and Fitch Ratings.
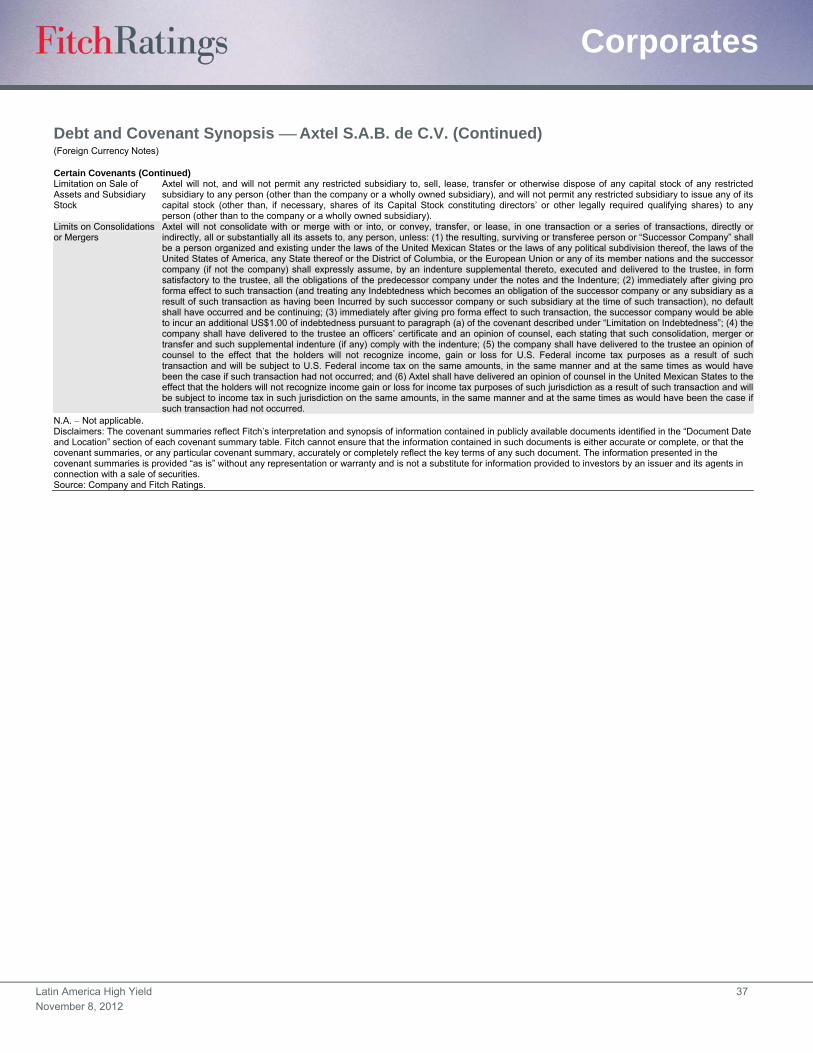
Latin America High Yield 37
November 8, 2012
Corporates
Debt and Covenant Synopsis Axtel S.A.B. de C.V. (Continued) (Foreign Currency Notes)
Certain Covenants (Continued) Limitation on Sale of Assets and Subsidiary Stock
Axtel will not, and will not permit any restricted subsidiary to, sell, lease, transfer or otherwise dispose of any capital stock of any restricted subsidiary to any person (other than the company or a wholly owned subsidiary), and will not permit any restricted subsidiary to issue any of its capital stock (other than, if necessary, shares of its Capital Stock constituting directors’ or other legally required qualifying shares) to any person (other than to the company or a wholly owned subsidiary).
Limits on Consolidations or Mergers
Axtel will not consolidate with or merge with or into, or convey, transfer, or lease, in one transaction or a series of transactions, directly or indirectly, all or substantially all its assets to, any person, unless: (1) the resulting, surviving or transferee person or “Successor Company” shall be a person organized and existing under the laws of the United Mexican States or the laws of any political subdivision thereof, the laws of the United States of America, any State thereof or the District of Columbia, or the European Union or any of its member nations and the successor company (if not the company) shall expressly assume, by an indenture supplemental thereto, executed and delivered to the trustee, in form satisfactory to the trustee, all the obligations of the predecessor company under the notes and the Indenture; (2) immediately after giving pro forma effect to such transaction (and treating any Indebtedness which becomes an obligation of the successor company or any subsidiary as a result of such transaction as having been Incurred by such successor company or such subsidiary at the time of such transaction), no default shall have occurred and be continuing; (3) immediately after giving pro forma effect to such transaction, the successor company would be able to incur an additional US$1.00 of indebtedness pursuant to paragraph (a) of the covenant described under “Limitation on Indebtedness”; (4) the company shall have delivered to the trustee an officers’ certificate and an opinion of counsel, each stating that such consolidation, merger or transfer and such supplemental indenture (if any) comply with the indenture; (5) the company shall have delivered to the trustee an opinion of counsel to the effect that the holders will not recognize income, gain or loss for U.S. Federal income tax purposes as a result of such transaction and will be subject to U.S. Federal income tax on the same amounts, in the same manner and at the same times as would have been the case if such transaction had not occurred; and (6) Axtel shall have delivered an opinion of counsel in the United Mexican States to the effect that the holders will not recognize income gain or loss for income tax purposes of such jurisdiction as a result of such transaction and will be subject to income tax in such jurisdiction on the same amounts, in the same manner and at the same times as would have been the case if such transaction had not occurred.
N.A. Not applicable. Disclaimers: The covenant summaries reflect Fitch’s interpretation and synopsis of information contained in publicly available documents identified in the “Document Date and Location” section of each covenant summary table. Fitch cannot ensure that the information contained in such documents is either accurate or complete, or that the covenant summaries, or any particular covenant summary, accurately or completely reflect the key terms of any such document. The information presented in the covenant summaries is provided “as is” without any representation or warranty and is not a substitute for information provided to investors by an issuer and its agents in connection with a sale of securities. Source: Company and Fitch Ratings.
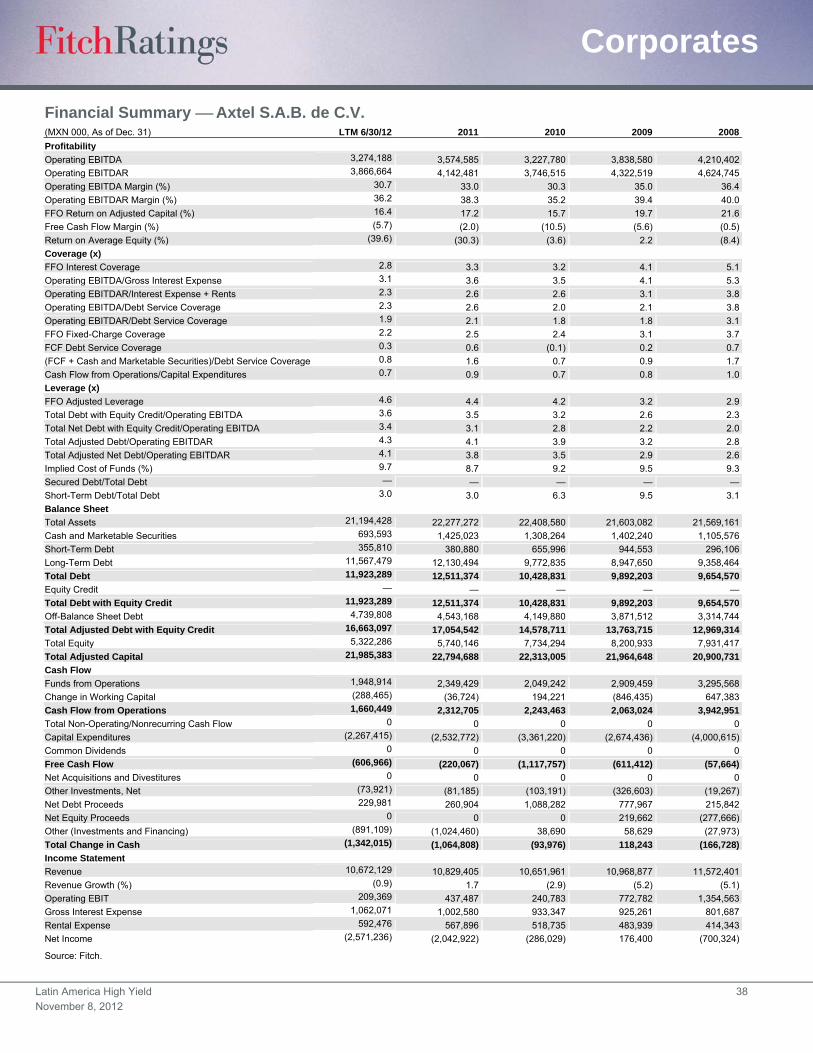
Latin America High Yield 38
November 8, 2012
Corporates
Financial Summary Axtel S.A.B. de C.V. (MXN 000, As of Dec. 31) LTM 6/30/12 2011 2010 2009 2008
Profitability
Operating EBITDA 3,274,188 3,574,585 3,227,780 3,838,580 4,210,402
Operating EBITDAR 3,866,664 4,142,481 3,746,515 4,322,519 4,624,745
Operating EBITDA Margin (%) 30.7 33.0 30.3 35.0 36.4
Operating EBITDAR Margin (%) 36.2 38.3 35.2 39.4 40.0
FFO Return on Adjusted Capital (%) 16.4 17.2 15.7 19.7 21.6
Free Cash Flow Margin (%) (5.7) (2.0) (10.5) (5.6) (0.5)
Return on Average Equity (%) (39.6) (30.3) (3.6) 2.2 (8.4)
Coverage (x)
FFO Interest Coverage 2.8 3.3 3.2 4.1 5.1
Operating EBITDA/Gross Interest Expense 3.1 3.6 3.5 4.1 5.3
Operating EBITDAR/Interest Expense + Rents 2.3 2.6 2.6 3.1 3.8
Operating EBITDA/Debt Service Coverage 2.3 2.6 2.0 2.1 3.8
Operating EBITDAR/Debt Service Coverage 1.9 2.1 1.8 1.8 3.1
FFO Fixed-Charge Coverage 2.2 2.5 2.4 3.1 3.7
FCF Debt Service Coverage 0.3 0.6 (0.1) 0.2 0.7
(FCF + Cash and Marketable Securities)/Debt Service Coverage 0.8 1.6 0.7 0.9 1.7
Cash Flow from Operations/Capital Expenditures 0.7 0.9 0.7 0.8 1.0
Leverage (x)
FFO Adjusted Leverage 4.6 4.4 4.2 3.2 2.9
Total Debt with Equity Credit/Operating EBITDA 3.6 3.5 3.2 2.6 2.3
Total Net Debt with Equity Credit/Operating EBITDA 3.4 3.1 2.8 2.2 2.0
Total Adjusted Debt/Operating EBITDAR 4.3 4.1 3.9 3.2 2.8
Total Adjusted Net Debt/Operating EBITDAR 4.1 3.8 3.5 2.9 2.6
Implied Cost of Funds (%) 9.7 8.7 9.2 9.5 9.3
Secured Debt/Total Debt — — — — —
Short-Term Debt/Total Debt 3.0 3.0 6.3 9.5 3.1
Balance Sheet
Total Assets 21,194,428 22,277,272 22,408,580 21,603,082 21,569,161
Cash and Marketable Securities 693,593 1,425,023 1,308,264 1,402,240 1,105,576
Short-Term Debt 355,810 380,880 655,996 944,553 296,106
Long-Term Debt 11,567,479 12,130,494 9,772,835 8,947,650 9,358,464
Total Debt 11,923,289 12,511,374 10,428,831 9,892,203 9,654,570
Equity Credit — — — — —
Total Debt with Equity Credit 11,923,289 12,511,374 10,428,831 9,892,203 9,654,570
Off-Balance Sheet Debt 4,739,808 4,543,168 4,149,880 3,871,512 3,314,744
Total Adjusted Debt with Equity Credit 16,663,097 17,054,542 14,578,711 13,763,715 12,969,314
Total Equity 5,322,286 5,740,146 7,734,294 8,200,933 7,931,417
Total Adjusted Capital 21,985,383 22,794,688 22,313,005 21,964,648 20,900,731
Cash Flow
Funds from Operations 1,948,914 2,349,429 2,049,242 2,909,459 3,295,568
Change in Working Capital (288,465) (36,724) 194,221 (846,435) 647,383
Cash Flow from Operations 1,660,449 2,312,705 2,243,463 2,063,024 3,942,951
Total Non-Operating/Nonrecurring Cash Flow 0 0 0 0 0
Capital Expenditures (2,267,415) (2,532,772) (3,361,220) (2,674,436) (4,000,615)
Common Dividends 0 0 0 0 0
Free Cash Flow (606,966) (220,067) (1,117,757) (611,412) (57,664)
Net Acquisitions and Divestitures 0 0 0 0 0
Other Investments, Net (73,921) (81,185) (103,191) (326,603) (19,267)
Net Debt Proceeds 229,981 260,904 1,088,282 777,967 215,842
Net Equity Proceeds 0 0 0 219,662 (277,666)
Other (Investments and Financing) (891,109) (1,024,460) 38,690 58,629 (27,973)
Total Change in Cash (1,342,015) (1,064,808) (93,976) 118,243 (166,728)
Income Statement
Revenue 10,672,129 10,829,405 10,651,961 10,968,877 11,572,401
Revenue Growth (%) (0.9) 1.7 (2.9) (5.2) (5.1)
Operating EBIT 209,369 437,487 240,783 772,782 1,354,563
Gross Interest Expense 1,062,071 1,002,580 933,347 925,261 801,687
Rental Expense 592,476 567,896 518,735 483,939 414,343
Net Income (2,571,236) (2,042,922) (286,029) 176,400 (700,324)
Source: Fitch.

Latin America High Yield 39
November 8, 2012
Corporates
Bio PAPPEL S.A.B de C.V. Full Rating Report
Key Rating Drivers
Leading Market Position: Bio PAPPEL S.A.B de C.V. (Bio-PAPPEL) is the largest paper and
packaging company in Mexico with some operations in the U.S., and 1.3 million tons of sales
during 2011. The main paper and packaging products manufactured and sold by Bio-PAPPEL
are corrugated containers, containerboard, newsprint, multiwall sacks and bags, uncoated free
sheet paper, and kraft paper. As the largest producer of these products in Mexico, the
company has a diversified customer base.
Weak Debt Repayment Record: Bio-PAPPEL has restructured its debt twice over the last 12
years (in 2002 and 2008). A key driver of these debt restructurings was the company’s
vulnerability to high costs for raw materials and energy. While the company has made efforts to
improve its cost structure and decrease its vulnerability to costs that are outside of its control,
Bio-PAPPEL is currently vulnerable to rising recycled fiber prices, as well as those for
electricity and natural gas.
Mixed Operating Environment: The global economic environment during the past few years
has resulted in relatively high energy and recycled fiber prices, while the Mexican economy has
performed relatively well. The confluence of these factors has translated into a stable
performance by Bio-PAPPEL’s packaging division and a rebound in the performance of its
paper division. Combined, these factors have led to growth in the company’s EBITDA to
MXN935 million for the LTM ended June 30, 2012 from a low of MXN285 million during 2008.
At the end of June 2012, Bio-PAPPEL had MXN1.1 billion of cash and marketable securities
and MXN3.4 billion of total debt.
Financing of Customers: Many of Bio-PAPPEL’s customers are small and are not able to
obtain financing from banks at attractive rates and terms. As a result, the company tends to
have very large account receivables balances relative to EBITDA, as it essentially acts as a
lender for some of its customers.
What Could Trigger a Rating Action
Diminishing the Debt Burden: A positive factor for credit quality would be a reduction of the
issuer’s debt burden, which could reduce leverage variability under changing EBITDA levels.
Stabilizing Price Cost Spread: The successful widening and stabilization of the spread
between price and cost per ton, thus making EBITDA generation more constant, would be
positive for creditworthiness. Conversely, a consistent weakening of the price versus cost unit
spread would be considered negative for credit quality.
Ratings
Foreign Currency
Long-Term IDR B
Senior Unsecured B/RR4
Local Currency
Long-Term IDR B
IDR Issuer default rating.
Rating Outlooks Long-Term Foreign Currency IDR Stable Long-Term Local Currency IDR Stable
Financial Data Bio Pappel S.A.B. de C.V.
(MXN Mil.) LTM
6/30/12 2011 Revenue 12,023 11,008 EBITDA 964 769 Total Debt 3,389 3,939 Gross Interest Expense 302 284 Debt/EBITDA (x) 3.5 5.1 EBITDA/ Gross Interest Expense (x) 3.2 2.7
Note: LTM 2Q12 data is LTM IFRS.
Analysts Miguel Guzman Betancourt +52 81 8399-9100 [email protected]
Alberto de los Santos +52 81 8399-9100 [email protected]
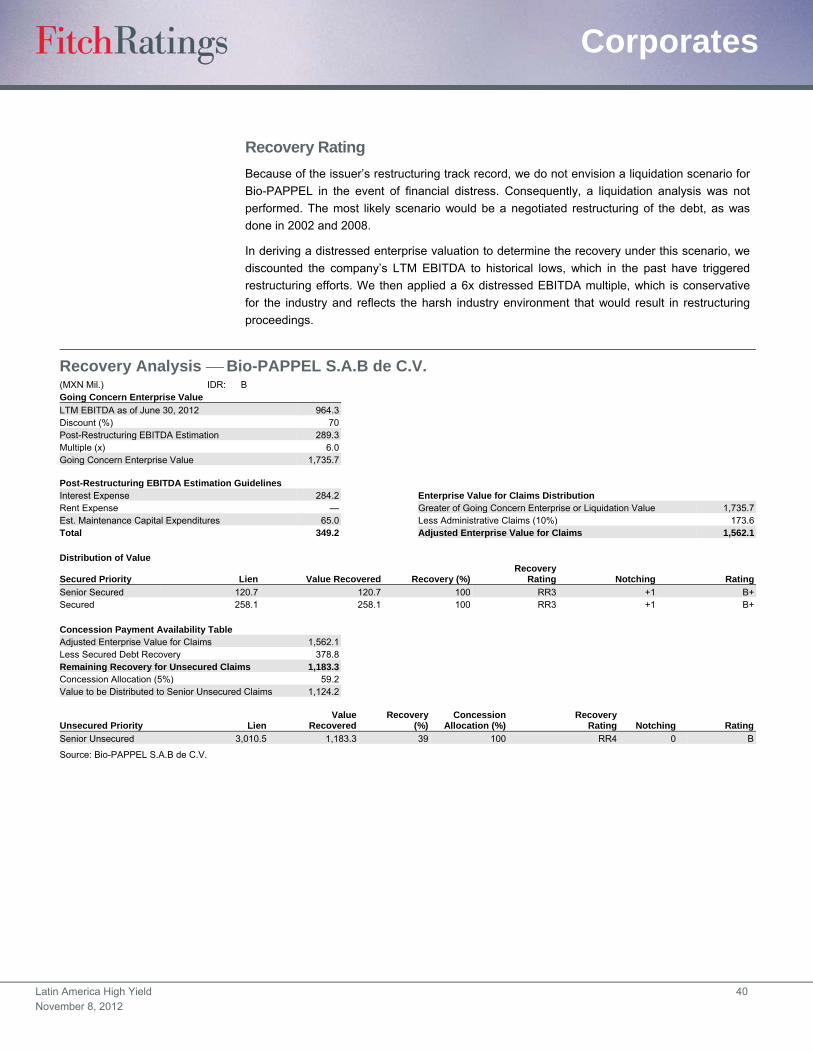
Latin America High Yield 40
November 8, 2012
Corporates
Recovery Rating
Because of the issuer’s restructuring track record, we do not envision a liquidation scenario for
Bio-PAPPEL in the event of financial distress. Consequently, a liquidation analysis was not
performed. The most likely scenario would be a negotiated restructuring of the debt, as was
done in 2002 and 2008.
In deriving a distressed enterprise valuation to determine the recovery under this scenario, we
discounted the company’s LTM EBITDA to historical lows, which in the past have triggered
restructuring efforts. We then applied a 6x distressed EBITDA multiple, which is conservative
for the industry and reflects the harsh industry environment that would result in restructuring
proceedings.
Recovery Analysis Bio-PAPPEL S.A.B de C.V. (MXN Mil.) IDR: B Going Concern Enterprise Value
LTM EBITDA as of June 30, 2012 964.3 Discount (%) 70 Post-Restructuring EBITDA Estimation 289.3 Multiple (x) 6.0 Going Concern Enterprise Value 1,735.7 Post-Restructuring EBITDA Estimation Guidelines Interest Expense 284.2 Enterprise Value for Claims Distribution Rent Expense — Greater of Going Concern Enterprise or Liquidation Value 1,735.7Est. Maintenance Capital Expenditures 65.0 Less Administrative Claims (10%) 173.6Total 349.2 Adjusted Enterprise Value for Claims 1,562.1 Distribution of Value
Secured Priority Lien Value Recovered Recovery (%)Recovery
Rating Notching Rating
Senior Secured 120.7 120.7 100 RR3 +1 B+Secured 258.1 258.1 100 RR3 +1 B+ Concession Payment Availability Table Adjusted Enterprise Value for Claims 1,562.1 Less Secured Debt Recovery 378.8 Remaining Recovery for Unsecured Claims 1,183.3 Concession Allocation (5%) 59.2 Value to be Distributed to Senior Unsecured Claims 1,124.2
Unsecured Priority Lien Value
RecoveredRecovery
(%)Concession
Allocation (%)Recovery
Rating Notching Rating
Senior Unsecured 3,010.5 1,183.3 39 100 RR4 0 B
Source: Bio-PAPPEL S.A.B de C.V.
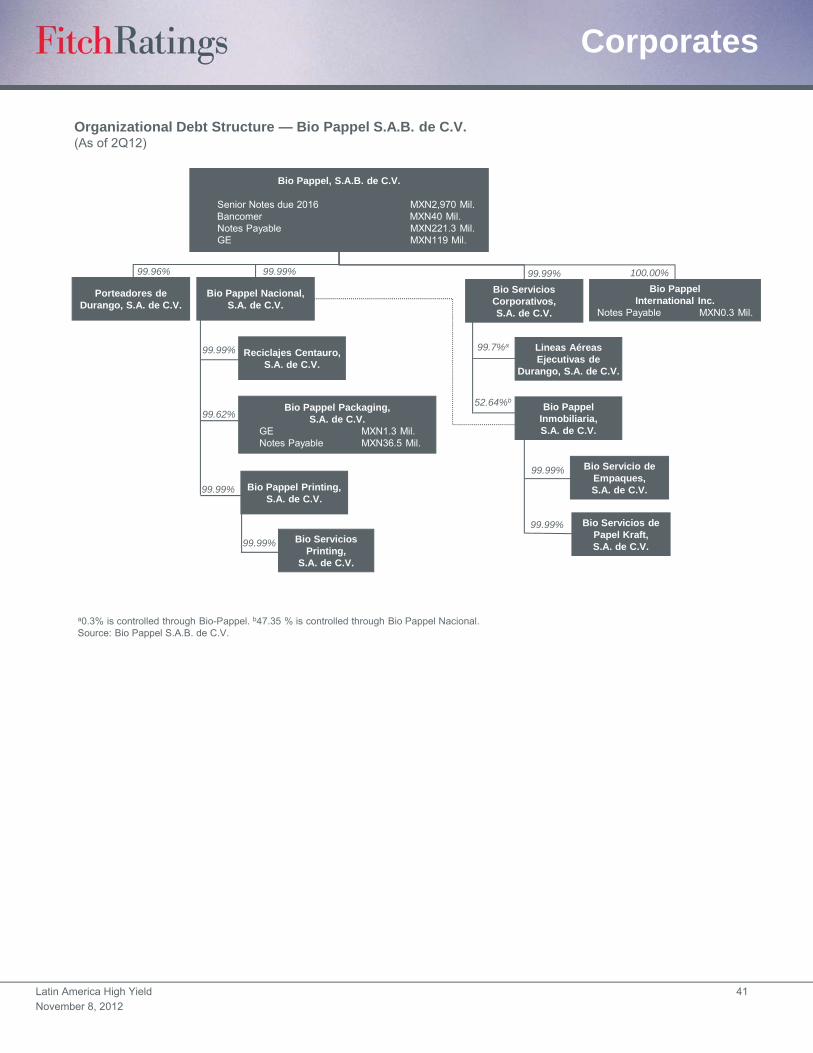
Latin America High Yield 41
November 8, 2012
Corporates
Organizational Debt Structure — Bio Pappel S.A.B. de C.V.(As of 2Q12)
a0.3% is controlled through Bio-Pappel. b47.35 % is controlled through Bio Pappel Nacional.Source: Bio Pappel S.A.B. de C.V.
Bio Pappel, S.A.B. de C.V.
Senior Notes due 2016 MXN2,970 Mil.Bancomer MXN40 Mil.Notes Payable MXN221.3 Mil.GE MXN119 Mil.
99.99%
Porteadores de Durango, S.A. de C.V.
Bio Pappel Nacional, S.A. de C.V.
Bio Servicios Corporativos, S.A. de C.V.
Bio Pappel International Inc.
Notes Payable MXN0.3 Mil.
Reciclajes Centauro, S.A. de C.V.
Lineas Aéreas Ejecutivas de
Durango, S.A. de C.V.
Bio Pappel Packaging, S.A. de C.V.
GE MXN1.3 Mil.Notes Payable MXN36.5 Mil.
Bio Pappel Printing, S.A. de C.V.
Bio Servicios Printing,
S.A. de C.V.
Bio Pappel Inmobiliaria, S.A. de C.V.
Bio Servicio de Empaques, S.A. de C.V.
Bio Servicios de Papel Kraft, S.A. de C.V.
99.7%a
52.64%b
99.96% 99.99% 99.99% 100.00%
99.62%
99.99%
99.99%
99.99%
99.99%

Latin America High Yield 42
November 8, 2012
Corporates
Debt and Covenant Synopsis — Bio-PAPPEL, S.A.B. de C.V. (As of Dec. 31, 2009) Overview Issuer Corporación Durango, S.A.B. de. C.V. (renamed Bio Pappel, S.A.B. de C.V.) Guarantors Each direct and indirect subsidiary of Bio Pappel, S.A.B. de. C.V. including:
Porteadores de Durango, S.A. de C.V., Reciclajes Centauro, S.A. de C.V., Administración Corporativa de Durango, S.A. de C.V. (“ACD”) (renamed Bio Servicios Corporativos, S.A. de. C.V.) Líneas Aéreas Ejecutivas de Durango, S.A. de C.V. Empaques de Cartón Titán, S.A. de C.V. (“Titán”) (renamed Bio Pappel Packaging, S.A. de C.V.) Inmobiliaria Industrial Tizayuca, S.A. de C.V. (renamed Bio Pappel Inmobiliaria, S.A. de C.V.) Servicios Industriales Tizayuca, S.A. de C.V. (merged into Bio Servicios de Papel Kraft, S.A. de C.V.) Atenmex, S.A. de C.V., Atensa, S.A. de C.V. (merged into Bio Servicios de Papel Kraft, S.A. de C.V.) Ectsa Industrial, S.A. de C.V. (renamed Bio Servicios de Empaques, S.A. de C.V.) Eyemsa Industrial, S.A. de C.V. (merged into Bio Servicios de Empaques, S.A. de C.V.) Cartonpack Industrial, S.A. de C.V. (“Cartónpack”) (merged into Bio Servicios de Empaques, S.A. de C.V.) Administración Industrial Centauro, S.A. de C.V. (merged into Bio Servicios de Papel Kraft, S.A. de C.V.) Administradora Industrial Durango, S.A. de C.V. (renamed Bio Servicios de Papel Kraft, S.A. de C.V.) Ponderosa Industrial de México, S.A. de C.V. (“PIMSA”) (recently sold) Mexpape, S.A. de C.V. (renamed Bio Servicios Printing, S.A. de C.V.) Fapatux, S.A. de C.V. (merged into Bio Pappel Printing, S.A. de C.V.), Servicios Pipsamex, S.A. de C.V. (merged into Bio Servicios Printing, S.A. de C.V.) Formatodo Industrial, S.A. de C.V. (merged into Bio Servicios Printing, S.A. de C.V.) Paper International, Inc. (merged into Bio Pappel International, Inc.) Fiber Management of Texas, Inc. (merged into Paper International, Inc which was later merged into Bio Pappel International, Inc.) Grupo Pipsamex, S.A. de C.V. (renamed Bio Pappel Printing, S.A. de. C.V.) McKinley Paper Company (renamed Bio Pappel International, Inc.) Summafibers Inc. (merged into Bio Pappel International, Inc.) Empresas Titán, S.A. de C.V. (merged into Bio Pappel Packaging, S.A. de. C.V.) Compañía Norteamericana de Inversiones en Celulosa y Papel, S.A. de C.V. (merged into Bio Pappel Inmobiliaria, S.A. de C.V.)
Document Date Aug. 27, 2009 Maturity Date Aug. 27, 2016 Description of Debt Senior Guaranteed Notes Financial Covenants Consolidated Leverage (Maximum) N.A. Interest Coverage (Minimum) N.A. Acquisitions/Divestitures Change-of-Control Provision Change-of-control clause at 101% of principal. Sale of Assets Restriction Neither the issuer nor guarantors can sell assets other than: 1) worn or obsolete assets with an aggregate value of less than USD100,000;
2) asset sales in the ordinary course of business; or 3) asset sales in which the net proceeds are used to repay the notes. If the issuer or the guarantors sell capital stock of their subsidiaries, the net proceeds must be used to repay the notes. A fairness opinion is needed if an equity issuance or asset sale of capital stock of a note issuer involves more than 5% of its capital stock, or if more than 1% if the capital stock is sold to an affiliate, obligor, or other related entity of any guarantor.
Debt Restrictions Additional Debt Restriction Neither the issuer nor guarantors are allowed to incur additional debt except permitted debt. Permitted debt includes debt used to refinance
existing or permitted indebtedness, subject to standard limitations. The issuer or its subsidiaries can incur or maintain up to USD30 million of additional indebtedness through 2012. This figure then escalates annually, reaching USD60 million by 2016. (Debt thresholds shall not be cumulative.) Debt can also be incurred for finance trade receivables in connection with hedging agreements and in respect to certain intercompany loans under certain conditions.
Limitation on Secured Debt Beyond customary permitted liens, subject to certain conditions, Durango or its subsidiaries may incur liens: 1) securing permitted indebtedness provided that liens in respect of such refinanced debt existed prior to such refinancing and do not extend beyond the collateral securing such debt prior to its refinancing, 2) arising out of letters of credit, or 3) arising out of the sale of goods; 4) statutory liens; 5) arising from ordinary course transactions and activities.
Restricted Payments With certain exceptions, the issuer or guarantors are prohibited from making certain investments, including the acquisitions of stocks, bonds, and notes, as well as the making of deposits or loans with certain defined persons and entities. The investment restrictions also identify certain financial instruments that the company can invest in, such as commercial paper of highly rated entities.
N.A. Not applicable. Continued on next page. Disclaimers: The covenant summaries reflect Fitch’s interpretation and synopsis of information contained in publicly available documents identified in the “Document Date and Location” section of each covenant summary table. Fitch cannot ensure that the information contained in such documents is either accurate or complete, or that the covenant summaries, or any particular covenant summary, accurately or completely reflect the key terms of any such document. The information presented in the covenant summaries is provided “as is” without any representation or warranty and is not a substitute for information provided to investors by an issuer and its agents in connection with a sale of securities. Source: Company and Fitch Ratings.

Latin America High Yield 43
November 8, 2012
Corporates
Debt and Covenant Synopsis — Bio PAPPEL, S.A.B. de C.V. (Continued) Other Cross Default Cross default when an uncured event of default occurs for debt of more than USD10 million. Acceleration If any event of default occurs and is continuing, the trustee or the holders of at least 25% of the outstanding notes may declare the notes to
be due and payable. Notes become automatically due and payable upon certain events of insolvency or bankruptcy. Holders of the majority of the outstanding notes may rescind a declaration of acceleration within 60 days.
PIK Interest Rate The interest rate for notes is 6% during the first year, 7% during years two through four, and 10% during the fifth, sixth, and seventh year. During the first two years, 3% of the coupon can be paid with a PIK coupon, and during the third year 2% of the coupon can be paid with a PIK coupon.
Intercompany Loans Intercompany loans are subordinated. Restriction on Purchase of Notes
The issuer, guarantor, or affiliates may purchase notes at par provided the notes shall be retired or pledged. Notes purchased shall have no voting rights to the extent permitted by law in bankruptcy or any other situation.
Transactions with Affiliates Transactions between issuer or guarantors and affiliates for more than USD100,000 shall require a fairness opinion. Limits on Consolidations or Mergers
Restrictions on merger or consolidation of issuer and guarantors. Exceptions include: 1) the merger of guarantors; 2) the merger of other entities with the issuer provided that surviving entity will be the issuer or another corporation existing under the laws of Mexico or the U.S., and that no event of default occurs or is continuing, the company’s pro forma net worth increases, and that the company’s debt be rated at least ‘B+’ prior to the merger and is affirmed at ‘B+’ or higher; or 3) the merger of other entities with a guarantor provided that surviving entity will be the guarantor or another corporation existing under the laws of Mexico or the U.S., that no event of default occurs or is continuing, the company’s pro forma net worth increases, and that the company’s debt rating be at least ‘B+’ prior to the merger and is affirmed at ‘B+’ or higher. Any surviving entity would assume all obligations of the issuer or guarantor under the indenture.
Mandatory Redemption The note will be redeemed on a pro rata basis if an issuer or guarantor sells assets with a value of at least USD5 million or greater than USD10 million during a 180-day period through a series of lesser sales. Notes will also be automatically redeemed if equity is issued, using 85% of net cash proceeds.
N.A. Not applicable. Disclaimers: The covenant summaries reflect Fitch’s interpretation and synopsis of information contained in publicly available documents identified in the “Document Date and Location” section of each covenant summary table. Fitch cannot ensure that the information contained in such documents is either accurate or complete, or that the covenant summaries, or any particular covenant summary, accurately or completely reflect the key terms of any such document. The information presented in the covenant summaries is provided “as is” without any representation or warranty and is not a substitute for information provided to investors by an issuer and its agents in connection with a sale of securities. Source: Company and Fitch Ratings.
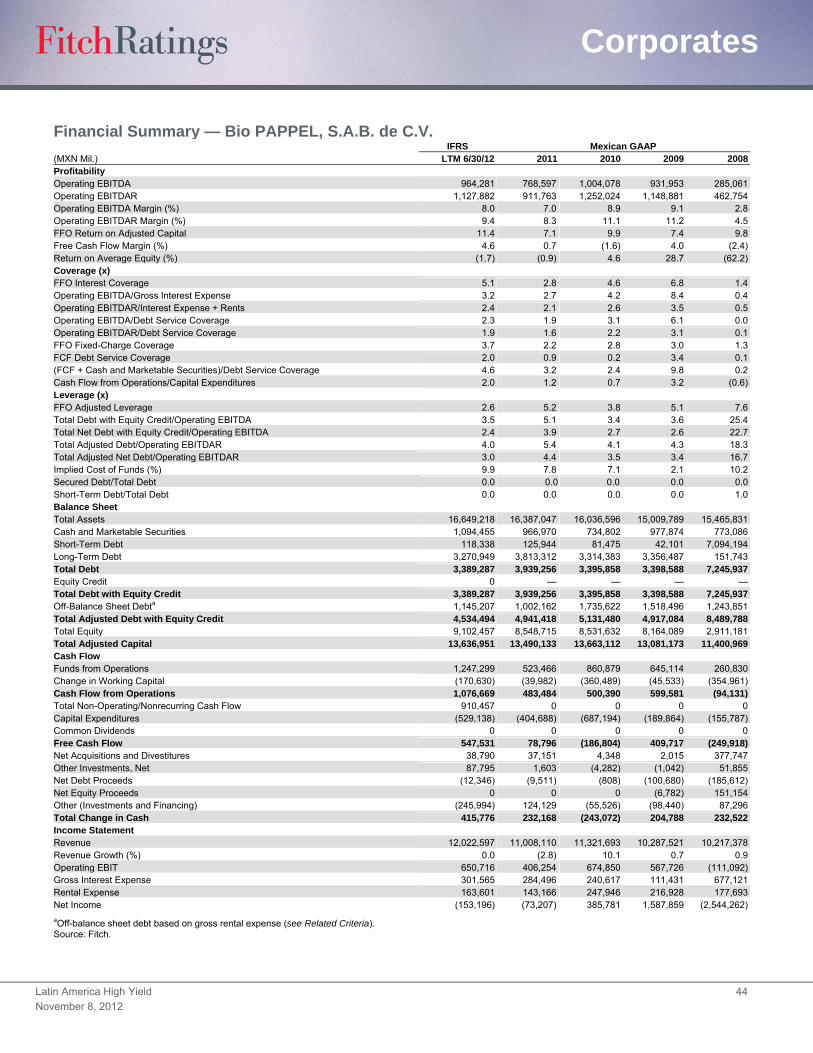
Latin America High Yield 44
November 8, 2012
Corporates
Financial Summary — Bio PAPPEL, S.A.B. de C.V. IFRS Mexican GAAP (MXN Mil.) LTM 6/30/12 2011 2010 2009 2008Profitability Operating EBITDA 964,281 768,597 1,004,078 931,953 285,061Operating EBITDAR 1,127,882 911,763 1,252,024 1,148,881 462,754Operating EBITDA Margin (%) 8.0 7.0 8.9 9.1 2.8Operating EBITDAR Margin (%) 9.4 8.3 11.1 11.2 4.5FFO Return on Adjusted Capital 11.4 7.1 9.9 7.4 9.8Free Cash Flow Margin (%) 4.6 0.7 (1.6) 4.0 (2.4)Return on Average Equity (%) (1.7) (0.9) 4.6 28.7 (62.2)Coverage (x) FFO Interest Coverage 5.1 2.8 4.6 6.8 1.4Operating EBITDA/Gross Interest Expense 3.2 2.7 4.2 8.4 0.4Operating EBITDAR/Interest Expense + Rents 2.4 2.1 2.6 3.5 0.5Operating EBITDA/Debt Service Coverage 2.3 1.9 3.1 6.1 0.0Operating EBITDAR/Debt Service Coverage 1.9 1.6 2.2 3.1 0.1FFO Fixed-Charge Coverage 3.7 2.2 2.8 3.0 1.3FCF Debt Service Coverage 2.0 0.9 0.2 3.4 0.1(FCF + Cash and Marketable Securities)/Debt Service Coverage 4.6 3.2 2.4 9.8 0.2Cash Flow from Operations/Capital Expenditures 2.0 1.2 0.7 3.2 (0.6)Leverage (x) FFO Adjusted Leverage 2.6 5.2 3.8 5.1 7.6Total Debt with Equity Credit/Operating EBITDA 3.5 5.1 3.4 3.6 25.4Total Net Debt with Equity Credit/Operating EBITDA 2.4 3.9 2.7 2.6 22.7Total Adjusted Debt/Operating EBITDAR 4.0 5.4 4.1 4.3 18.3Total Adjusted Net Debt/Operating EBITDAR 3.0 4.4 3.5 3.4 16.7Implied Cost of Funds (%) 9.9 7.8 7.1 2.1 10.2Secured Debt/Total Debt 0.0 0.0 0.0 0.0 0.0Short-Term Debt/Total Debt 0.0 0.0 0.0 0.0 1.0Balance Sheet Total Assets 16,649,218 16,387,047 16,036,596 15,009,789 15,465,831Cash and Marketable Securities 1,094,455 966,970 734,802 977,874 773,086Short-Term Debt 118,338 125,944 81,475 42,101 7,094,194Long-Term Debt 3,270,949 3,813,312 3,314,383 3,356,487 151,743Total Debt 3,389,287 3,939,256 3,395,858 3,398,588 7,245,937Equity Credit 0 — — — —Total Debt with Equity Credit 3,389,287 3,939,256 3,395,858 3,398,588 7,245,937Off-Balance Sheet Debta 1,145,207 1,002,162 1,735,622 1,518,496 1,243,851Total Adjusted Debt with Equity Credit 4,534,494 4,941,418 5,131,480 4,917,084 8,489,788Total Equity 9,102,457 8,548,715 8,531,632 8,164,089 2,911,181Total Adjusted Capital 13,636,951 13,490,133 13,663,112 13,081,173 11,400,969Cash Flow Funds from Operations 1,247,299 523,466 860,879 645,114 260,830Change in Working Capital (170,630) (39,982) (360,489) (45,533) (354,961)Cash Flow from Operations 1,076,669 483,484 500,390 599,581 (94,131)Total Non-Operating/Nonrecurring Cash Flow 910,457 0 0 0 0Capital Expenditures (529,138) (404,688) (687,194) (189,864) (155,787)Common Dividends 0 0 0 0 0Free Cash Flow 547,531 78,796 (186,804) 409,717 (249,918)Net Acquisitions and Divestitures 38,790 37,151 4,348 2,015 377,747Other Investments, Net 87,795 1,603 (4,282) (1,042) 51,855Net Debt Proceeds (12,346) (9,511) (808) (100,680) (185,612)Net Equity Proceeds 0 0 0 (6,782) 151,154Other (Investments and Financing) (245,994) 124,129 (55,526) (98,440) 87,296Total Change in Cash 415,776 232,168 (243,072) 204,788 232,522Income Statement Revenue 12,022,597 11,008,110 11,321,693 10,287,521 10,217,378Revenue Growth (%) 0.0 (2.8) 10.1 0.7 0.9Operating EBIT 650,716 406,254 674,850 567,726 (111,092)Gross Interest Expense 301,565 284,496 240,617 111,431 677,121Rental Expense 163,601 143,166 247,946 216,928 177,693Net Income (153,196) (73,207) 385,781 1,587,859 (2,544,262)
aOff-balance sheet debt based on gross rental expense (see Related Criteria). Source: Fitch.
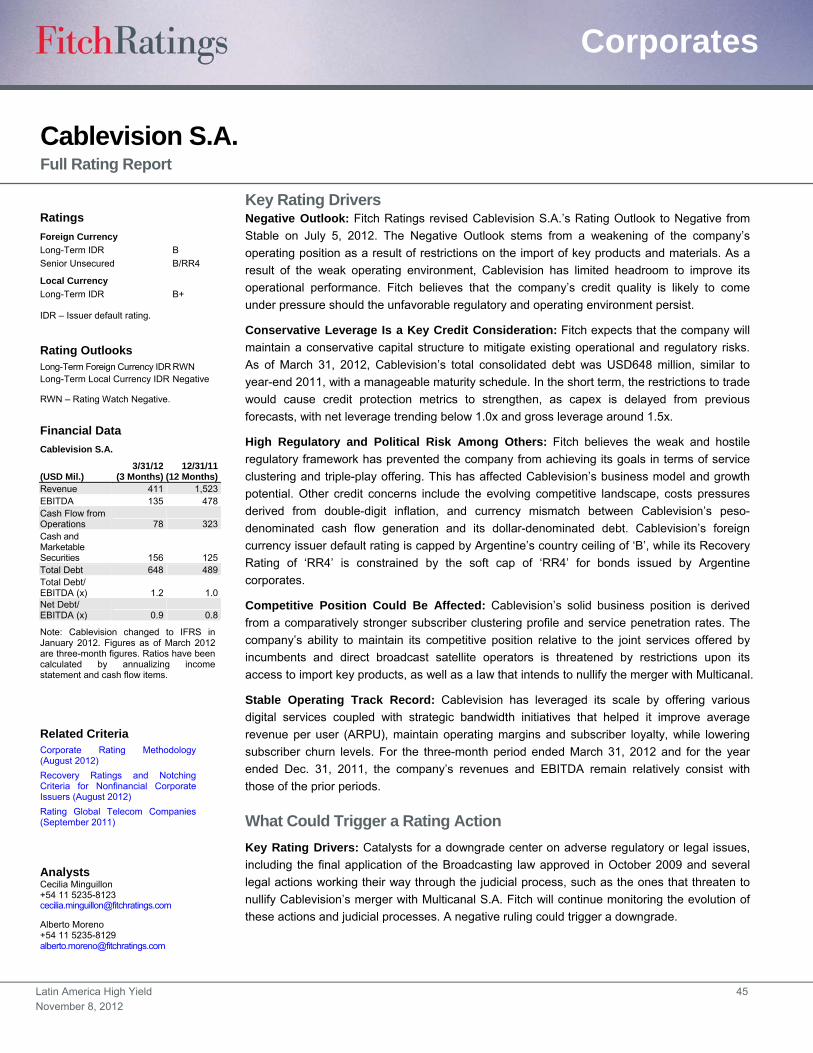
Latin America High Yield 45
November 8, 2012
Corporates
Cablevision S.A. Full Rating Report
Key Rating Drivers Negative Outlook: Fitch Ratings revised Cablevision S.A.’s Rating Outlook to Negative from
Stable on July 5, 2012. The Negative Outlook stems from a weakening of the company’s
operating position as a result of restrictions on the import of key products and materials. As a
result of the weak operating environment, Cablevision has limited headroom to improve its
operational performance. Fitch believes that the company’s credit quality is likely to come
under pressure should the unfavorable regulatory and operating environment persist.
Conservative Leverage Is a Key Credit Consideration: Fitch expects that the company will
maintain a conservative capital structure to mitigate existing operational and regulatory risks.
As of March 31, 2012, Cablevision’s total consolidated debt was USD648 million, similar to
year-end 2011, with a manageable maturity schedule. In the short term, the restrictions to trade
would cause credit protection metrics to strengthen, as capex is delayed from previous
forecasts, with net leverage trending below 1.0x and gross leverage around 1.5x.
High Regulatory and Political Risk Among Others: Fitch believes the weak and hostile
regulatory framework has prevented the company from achieving its goals in terms of service
clustering and triple-play offering. This has affected Cablevision’s business model and growth
potential. Other credit concerns include the evolving competitive landscape, costs pressures
derived from double-digit inflation, and currency mismatch between Cablevision’s peso-
denominated cash flow generation and its dollar-denominated debt. Cablevision’s foreign
currency issuer default rating is capped by Argentine’s country ceiling of ‘B’, while its Recovery
Rating of ‘RR4’ is constrained by the soft cap of ‘RR4’ for bonds issued by Argentine
corporates.
Competitive Position Could Be Affected: Cablevision’s solid business position is derived
from a comparatively stronger subscriber clustering profile and service penetration rates. The
company’s ability to maintain its competitive position relative to the joint services offered by
incumbents and direct broadcast satellite operators is threatened by restrictions upon its
access to import key products, as well as a law that intends to nullify the merger with Multicanal.
Stable Operating Track Record: Cablevision has leveraged its scale by offering various
digital services coupled with strategic bandwidth initiatives that helped it improve average
revenue per user (ARPU), maintain operating margins and subscriber loyalty, while lowering
subscriber churn levels. For the three-month period ended March 31, 2012 and for the year
ended Dec. 31, 2011, the company’s revenues and EBITDA remain relatively consist with
those of the prior periods.
What Could Trigger a Rating Action
Key Rating Drivers: Catalysts for a downgrade center on adverse regulatory or legal issues,
including the final application of the Broadcasting law approved in October 2009 and several
legal actions working their way through the judicial process, such as the ones that threaten to
nullify Cablevision’s merger with Multicanal S.A. Fitch will continue monitoring the evolution of
these actions and judicial processes. A negative ruling could trigger a downgrade.
Ratings
Foreign Currency
Long-Term IDR B
Senior Unsecured B/RR4
Local Currency
Long-Term IDR B+
IDR – Issuer default rating.
Rating Outlooks Long-Term Foreign Currency IDR RWN Long-Term Local Currency IDR Negative
RWN – Rating Watch Negative.
Financial Data
Cablevision S.A.
(USD Mil.) 3/31/12
(3 Months) 12/31/11
(12 Months) Revenue 411 1,523 EBITDA 135 478 Cash Flow from Operations 78 323 Cash and Marketable Securities 156 125 Total Debt 648 489 Total Debt/ EBITDA (x) 1.2 1.0 Net Debt/ EBITDA (x) 0.9 0.8
Note: Cablevision changed to IFRS in January 2012. Figures as of March 2012 are three-month figures. Ratios have been calculated by annualizing income statement and cash flow items.
Related Criteria Corporate Rating Methodology (August 2012)
Recovery Ratings and Notching Criteria for Nonfinancial Corporate Issuers (August 2012)
Rating Global Telecom Companies (September 2011)
Analysts Cecilia Minguillon +54 11 5235-8123 [email protected]
Alberto Moreno +54 11 5235-8129 [email protected]
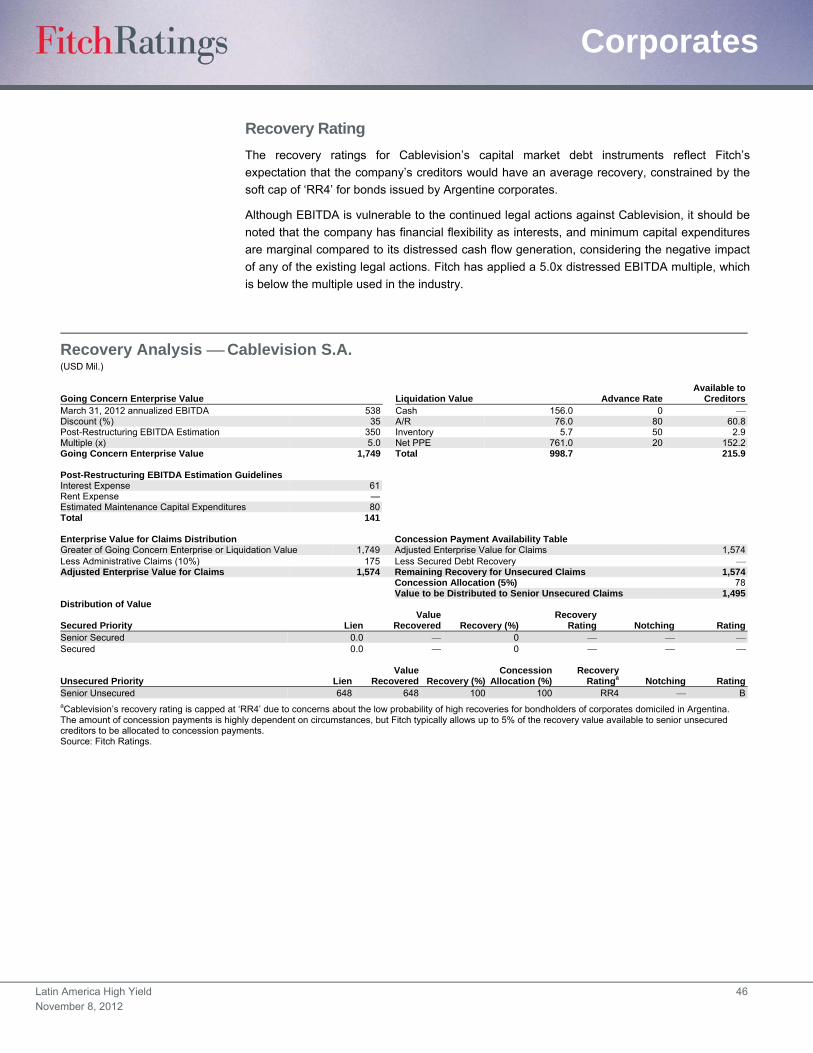
Latin America High Yield 46
November 8, 2012
Corporates
Recovery Rating
The recovery ratings for Cablevision’s capital market debt instruments reflect Fitch’s
expectation that the company’s creditors would have an average recovery, constrained by the
soft cap of ‘RR4’ for bonds issued by Argentine corporates.
Although EBITDA is vulnerable to the continued legal actions against Cablevision, it should be
noted that the company has financial flexibility as interests, and minimum capital expenditures
are marginal compared to its distressed cash flow generation, considering the negative impact
of any of the existing legal actions. Fitch has applied a 5.0x distressed EBITDA multiple, which
is below the multiple used in the industry.
Recovery Analysis Cablevision S.A. (USD Mil.)
Going Concern Enterprise Value Liquidation Value Advance RateAvailable to
CreditorsMarch 31, 2012 annualized EBITDA 538 Cash 156.0 0 Discount (%) 35 A/R 76.0 80 60.8Post-Restructuring EBITDA Estimation 350 Inventory 5.7 50 2.9Multiple (x) 5.0 Net PPE 761.0 20 152.2Going Concern Enterprise Value 1,749 Total 998.7 215.9 Post-Restructuring EBITDA Estimation Guidelines Interest Expense 61Rent Expense —Estimated Maintenance Capital Expenditures 80Total 141
Enterprise Value for Claims Distribution Concession Payment Availability Table Greater of Going Concern Enterprise or Liquidation Value 1,749 Adjusted Enterprise Value for Claims 1,574Less Administrative Claims (10%) 175 Less Secured Debt Recovery Adjusted Enterprise Value for Claims 1,574 Remaining Recovery for Unsecured Claims 1,574 Concession Allocation (5%) 78 Value to be Distributed to Senior Unsecured Claims 1,495Distribution of Value
Secured Priority LienValue
Recovered Recovery (%)Recovery
Rating Notching RatingSenior Secured 0.0 0 Secured 0.0 0
Unsecured Priority LienValue
Recovered Recovery (%)Concession
Allocation (%)Recovery
Ratinga Notching RatingSenior Unsecured 648 648 100 100 RR4 BaCablevision’s recovery rating is capped at ‘RR4’ due to concerns about the low probability of high recoveries for bondholders of corporates domiciled in Argentina. The amount of concession payments is highly dependent on circumstances, but Fitch typically allows up to 5% of the recovery value available to senior unsecured creditors to be allocated to concession payments. Source: Fitch Ratings.

Latin America High Yield 47
November 8, 2012
Corporates
Organizational Structure — Cablevision S.A.(USD Mil.)
Source: Fitch and Cablevision S.A.
70% Television Dirigida SAECA
LTM March 31, 2012 Summary Statistics
EBITDA 538 Cash and Marketable Securities 156Total Debt 648
Cablevision S.A.IDR — B/Rating Outlook Negative
UruguayArgentina Paraguay
70%
100%
70%
100%
Cablevision Comunicaciones
SAECA
Consorcio Multipunto S.A.
PEM S.A. Adesol S.A.
Teledeportes Paraguay S.A.
CV Verasategui S.A.
Cable Imagen SRL
Wolves Television S.A.
Aire Vision Internacional S.A.
Prima S.A.
Fintelco S.A.
100%
100%
100%
100%
60%
70%
100%
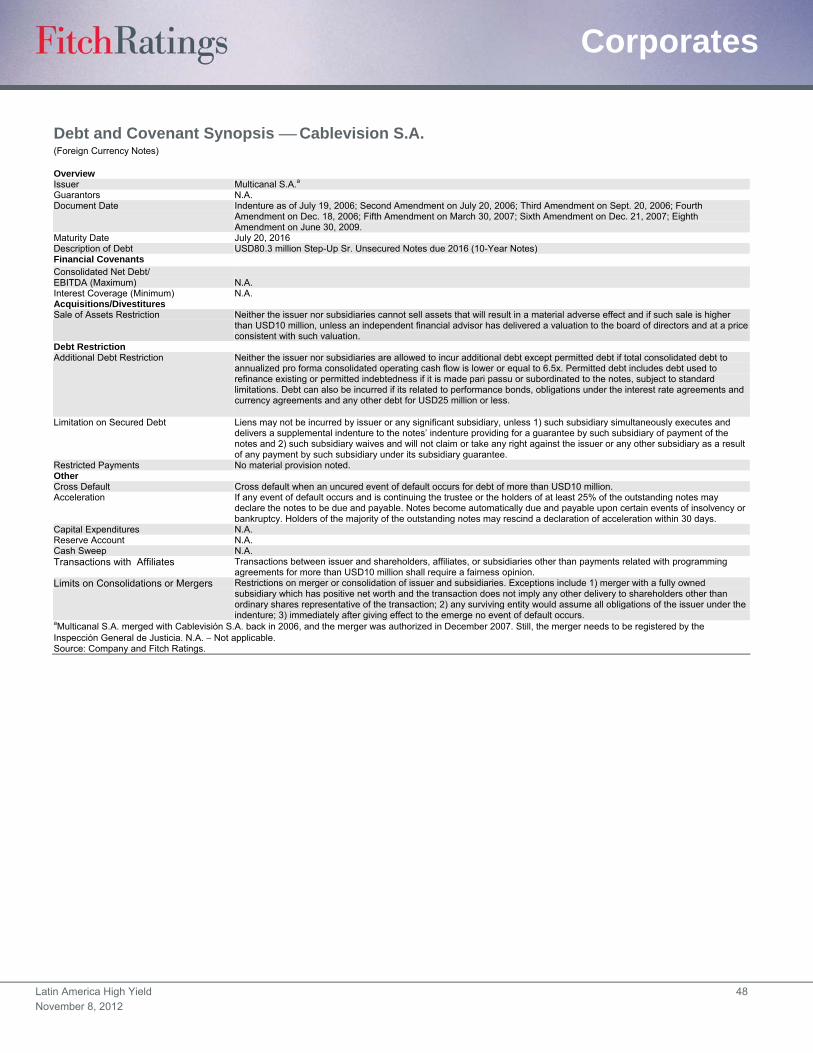
Latin America High Yield 48
November 8, 2012
Corporates
Debt and Covenant Synopsis Cablevision S.A. (Foreign Currency Notes)
Overview Issuer Multicanal S.A.a Guarantors N.A. Document Date Indenture as of July 19, 2006; Second Amendment on July 20, 2006; Third Amendment on Sept. 20, 2006; Fourth
Amendment on Dec. 18, 2006; Fifth Amendment on March 30, 2007; Sixth Amendment on Dec. 21, 2007; Eighth Amendment on June 30, 2009.
Maturity Date July 20, 2016 Description of Debt USD80.3 million Step-Up Sr. Unsecured Notes due 2016 (10-Year Notes) Financial Covenants Consolidated Net Debt/ EBITDA (Maximum) N.A. Interest Coverage (Minimum) N.A. Acquisitions/Divestitures Sale of Assets Restriction Neither the issuer nor subsidiaries cannot sell assets that will result in a material adverse effect and if such sale is higher
than USD10 million, unless an independent financial advisor has delivered a valuation to the board of directors and at a price consistent with such valuation.
Debt Restriction Additional Debt Restriction Neither the issuer nor subsidiaries are allowed to incur additional debt except permitted debt if total consolidated debt to
annualized pro forma consolidated operating cash flow is lower or equal to 6.5x. Permitted debt includes debt used to refinance existing or permitted indebtedness if it is made pari passu or subordinated to the notes, subject to standard limitations. Debt can also be incurred if its related to performance bonds, obligations under the interest rate agreements and currency agreements and any other debt for USD25 million or less.
Limitation on Secured Debt Liens may not be incurred by issuer or any significant subsidiary, unless 1) such subsidiary simultaneously executes and delivers a supplemental indenture to the notes’ indenture providing for a guarantee by such subsidiary of payment of the notes and 2) such subsidiary waives and will not claim or take any right against the issuer or any other subsidiary as a result of any payment by such subsidiary under its subsidiary guarantee.
Restricted Payments No material provision noted. Other Cross Default Cross default when an uncured event of default occurs for debt of more than USD10 million. Acceleration If any event of default occurs and is continuing the trustee or the holders of at least 25% of the outstanding notes may
declare the notes to be due and payable. Notes become automatically due and payable upon certain events of insolvency or bankruptcy. Holders of the majority of the outstanding notes may rescind a declaration of acceleration within 30 days.
Capital Expenditures N.A. Reserve Account N.A. Cash Sweep N.A. Transactions with Affiliates Transactions between issuer and shareholders, affiliates, or subsidiaries other than payments related with programming
agreements for more than USD10 million shall require a fairness opinion. Limits on Consolidations or Mergers Restrictions on merger or consolidation of issuer and subsidiaries. Exceptions include 1) merger with a fully owned
subsidiary which has positive net worth and the transaction does not imply any other delivery to shareholders other than ordinary shares representative of the transaction; 2) any surviving entity would assume all obligations of the issuer under the indenture; 3) immediately after giving effect to the emerge no event of default occurs.
aMulticanal S.A. merged with Cablevisión S.A. back in 2006, and the merger was authorized in December 2007. Still, the merger needs to be registered by the Inspección General de Justicia. N.A. Not applicable. Source: Company and Fitch Ratings.
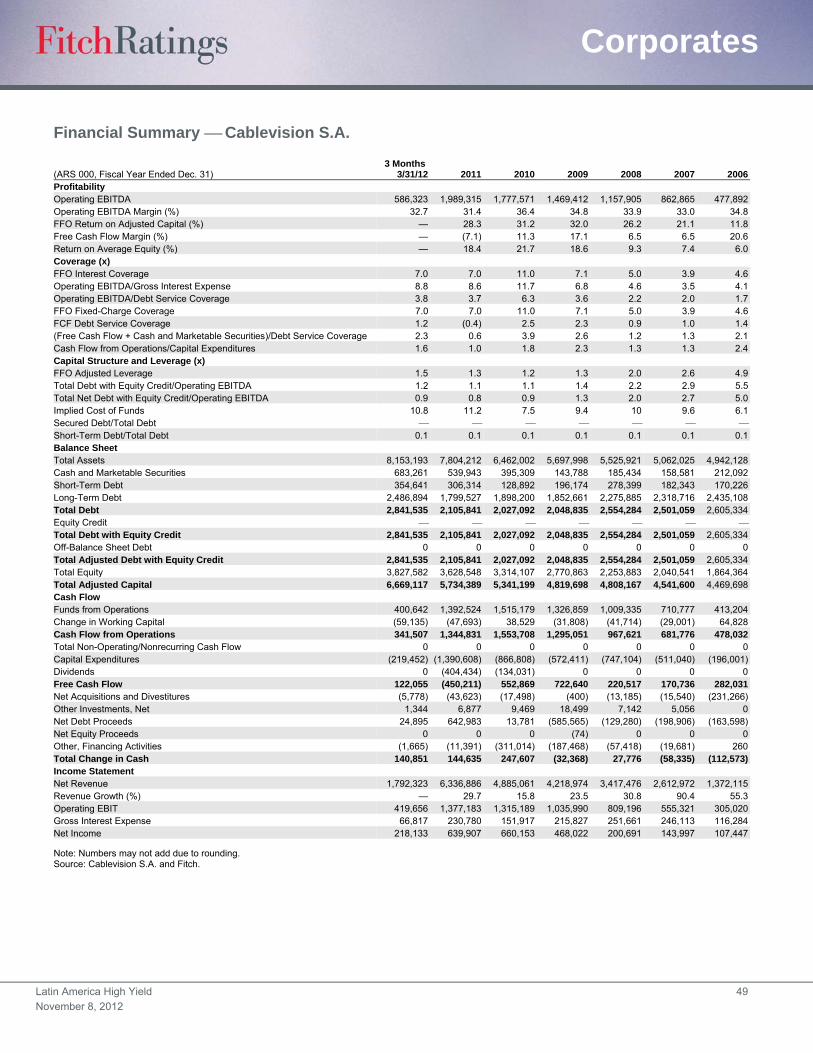
Latin America High Yield 49
November 8, 2012
Corporates
Financial Summary Cablevision S.A.
(ARS 000, Fiscal Year Ended Dec. 31) 3 Months
3/31/12 2011 2010 2009 2008 2007 2006Profitability Operating EBITDA 586,323 1,989,315 1,777,571 1,469,412 1,157,905 862,865 477,892Operating EBITDA Margin (%) 32.7 31.4 36.4 34.8 33.9 33.0 34.8FFO Return on Adjusted Capital (%) — 28.3 31.2 32.0 26.2 21.1 11.8Free Cash Flow Margin (%) — (7.1) 11.3 17.1 6.5 6.5 20.6Return on Average Equity (%) — 18.4 21.7 18.6 9.3 7.4 6.0Coverage (x) FFO Interest Coverage 7.0 7.0 11.0 7.1 5.0 3.9 4.6Operating EBITDA/Gross Interest Expense 8.8 8.6 11.7 6.8 4.6 3.5 4.1Operating EBITDA/Debt Service Coverage 3.8 3.7 6.3 3.6 2.2 2.0 1.7FFO Fixed-Charge Coverage 7.0 7.0 11.0 7.1 5.0 3.9 4.6FCF Debt Service Coverage 1.2 (0.4) 2.5 2.3 0.9 1.0 1.4(Free Cash Flow + Cash and Marketable Securities)/Debt Service Coverage 2.3 0.6 3.9 2.6 1.2 1.3 2.1Cash Flow from Operations/Capital Expenditures 1.6 1.0 1.8 2.3 1.3 1.3 2.4Capital Structure and Leverage (x) FFO Adjusted Leverage 1.5 1.3 1.2 1.3 2.0 2.6 4.9Total Debt with Equity Credit/Operating EBITDA 1.2 1.1 1.1 1.4 2.2 2.9 5.5Total Net Debt with Equity Credit/Operating EBITDA 0.9 0.8 0.9 1.3 2.0 2.7 5.0Implied Cost of Funds 10.8 11.2 7.5 9.4 10 9.6 6.1Secured Debt/Total Debt Short-Term Debt/Total Debt 0.1 0.1 0.1 0.1 0.1 0.1 0.1Balance Sheet Total Assets 8,153,193 7,804,212 6,462,002 5,697,998 5,525,921 5,062,025 4,942,128Cash and Marketable Securities 683,261 539,943 395,309 143,788 185,434 158,581 212,092Short-Term Debt 354,641 306,314 128,892 196,174 278,399 182,343 170,226Long-Term Debt 2,486,894 1,799,527 1,898,200 1,852,661 2,275,885 2,318,716 2,435,108Total Debt 2,841,535 2,105,841 2,027,092 2,048,835 2,554,284 2,501,059 2,605,334Equity Credit Total Debt with Equity Credit 2,841,535 2,105,841 2,027,092 2,048,835 2,554,284 2,501,059 2,605,334Off-Balance Sheet Debt 0 0 0 0 0 0 0Total Adjusted Debt with Equity Credit 2,841,535 2,105,841 2,027,092 2,048,835 2,554,284 2,501,059 2,605,334Total Equity 3,827,582 3,628,548 3,314,107 2,770,863 2,253,883 2,040,541 1,864,364Total Adjusted Capital 6,669,117 5,734,389 5,341,199 4,819,698 4,808,167 4,541,600 4,469,698Cash Flow Funds from Operations 400,642 1,392,524 1,515,179 1,326,859 1,009,335 710,777 413,204Change in Working Capital (59,135) (47,693) 38,529 (31,808) (41,714) (29,001) 64,828Cash Flow from Operations 341,507 1,344,831 1,553,708 1,295,051 967,621 681,776 478,032Total Non-Operating/Nonrecurring Cash Flow 0 0 0 0 0 0 0Capital Expenditures (219,452) (1,390,608) (866,808) (572,411) (747,104) (511,040) (196,001)Dividends 0 (404,434) (134,031) 0 0 0 0Free Cash Flow 122,055 (450,211) 552,869 722,640 220,517 170,736 282,031Net Acquisitions and Divestitures (5,778) (43,623) (17,498) (400) (13,185) (15,540) (231,266)Other Investments, Net 1,344 6,877 9,469 18,499 7,142 5,056 0Net Debt Proceeds 24,895 642,983 13,781 (585,565) (129,280) (198,906) (163,598)Net Equity Proceeds 0 0 0 (74) 0 0 0Other, Financing Activities (1,665) (11,391) (311,014) (187,468) (57,418) (19,681) 260Total Change in Cash 140,851 144,635 247,607 (32,368) 27,776 (58,335) (112,573)Income Statement Net Revenue 1,792,323 6,336,886 4,885,061 4,218,974 3,417,476 2,612,972 1,372,115Revenue Growth (%) — 29.7 15.8 23.5 30.8 90.4 55.3Operating EBIT 419,656 1,377,183 1,315,189 1,035,990 809,196 555,321 305,020Gross Interest Expense 66,817 230,780 151,917 215,827 251,661 246,113 116,284Net Income 218,133 639,907 660,153 468,022 200,691 143,997 107,447
Note: Numbers may not add due to rounding. Source: Cablevision S.A. and Fitch.
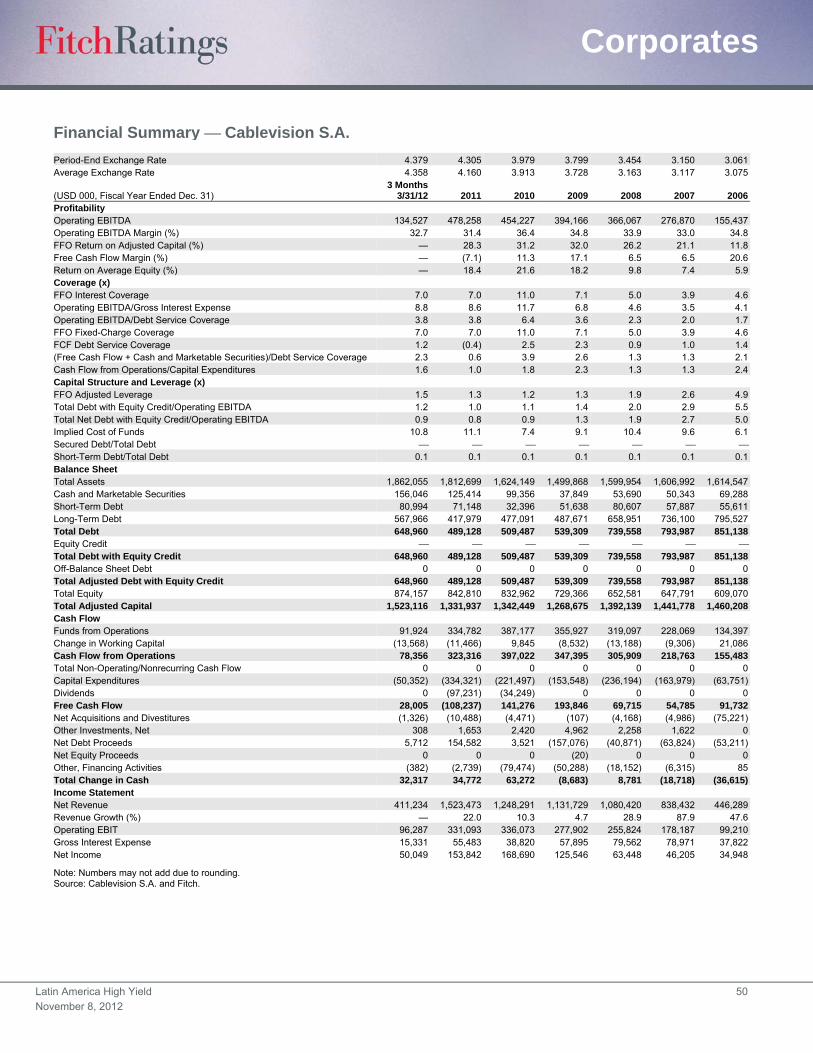
Latin America High Yield 50
November 8, 2012
Corporates
Financial Summary Cablevision S.A. Period-End Exchange Rate 4.379 4.305 3.979 3.799 3.454 3.150 3.061Average Exchange Rate 4.358 4.160 3.913 3.728 3.163 3.117 3.075
(USD 000, Fiscal Year Ended Dec. 31) 3 Months 3/31/12 2011 2010 2009 2008 2007 2006
Profitability Operating EBITDA 134,527 478,258 454,227 394,166 366,067 276,870 155,437Operating EBITDA Margin (%) 32.7 31.4 36.4 34.8 33.9 33.0 34.8FFO Return on Adjusted Capital (%) — 28.3 31.2 32.0 26.2 21.1 11.8Free Cash Flow Margin (%) — (7.1) 11.3 17.1 6.5 6.5 20.6Return on Average Equity (%) — 18.4 21.6 18.2 9.8 7.4 5.9Coverage (x) FFO Interest Coverage 7.0 7.0 11.0 7.1 5.0 3.9 4.6Operating EBITDA/Gross Interest Expense 8.8 8.6 11.7 6.8 4.6 3.5 4.1Operating EBITDA/Debt Service Coverage 3.8 3.8 6.4 3.6 2.3 2.0 1.7FFO Fixed-Charge Coverage 7.0 7.0 11.0 7.1 5.0 3.9 4.6FCF Debt Service Coverage 1.2 (0.4) 2.5 2.3 0.9 1.0 1.4(Free Cash Flow + Cash and Marketable Securities)/Debt Service Coverage 2.3 0.6 3.9 2.6 1.3 1.3 2.1Cash Flow from Operations/Capital Expenditures 1.6 1.0 1.8 2.3 1.3 1.3 2.4Capital Structure and Leverage (x) FFO Adjusted Leverage 1.5 1.3 1.2 1.3 1.9 2.6 4.9Total Debt with Equity Credit/Operating EBITDA 1.2 1.0 1.1 1.4 2.0 2.9 5.5Total Net Debt with Equity Credit/Operating EBITDA 0.9 0.8 0.9 1.3 1.9 2.7 5.0Implied Cost of Funds 10.8 11.1 7.4 9.1 10.4 9.6 6.1Secured Debt/Total Debt Short-Term Debt/Total Debt 0.1 0.1 0.1 0.1 0.1 0.1 0.1Balance Sheet Total Assets 1,862,055 1,812,699 1,624,149 1,499,868 1,599,954 1,606,992 1,614,547Cash and Marketable Securities 156,046 125,414 99,356 37,849 53,690 50,343 69,288Short-Term Debt 80,994 71,148 32,396 51,638 80,607 57,887 55,611Long-Term Debt 567,966 417,979 477,091 487,671 658,951 736,100 795,527Total Debt 648,960 489,128 509,487 539,309 739,558 793,987 851,138Equity Credit Total Debt with Equity Credit 648,960 489,128 509,487 539,309 739,558 793,987 851,138Off-Balance Sheet Debt 0 0 0 0 0 0 0Total Adjusted Debt with Equity Credit 648,960 489,128 509,487 539,309 739,558 793,987 851,138Total Equity 874,157 842,810 832,962 729,366 652,581 647,791 609,070Total Adjusted Capital 1,523,116 1,331,937 1,342,449 1,268,675 1,392,139 1,441,778 1,460,208Cash Flow Funds from Operations 91,924 334,782 387,177 355,927 319,097 228,069 134,397Change in Working Capital (13,568) (11,466) 9,845 (8,532) (13,188) (9,306) 21,086Cash Flow from Operations 78,356 323,316 397,022 347,395 305,909 218,763 155,483Total Non-Operating/Nonrecurring Cash Flow 0 0 0 0 0 0 0Capital Expenditures (50,352) (334,321) (221,497) (153,548) (236,194) (163,979) (63,751)Dividends 0 (97,231) (34,249) 0 0 0 0Free Cash Flow 28,005 (108,237) 141,276 193,846 69,715 54,785 91,732Net Acquisitions and Divestitures (1,326) (10,488) (4,471) (107) (4,168) (4,986) (75,221)Other Investments, Net 308 1,653 2,420 4,962 2,258 1,622 0Net Debt Proceeds 5,712 154,582 3,521 (157,076) (40,871) (63,824) (53,211)Net Equity Proceeds 0 0 0 (20) 0 0 0Other, Financing Activities (382) (2,739) (79,474) (50,288) (18,152) (6,315) 85Total Change in Cash 32,317 34,772 63,272 (8,683) 8,781 (18,718) (36,615)Income Statement Net Revenue 411,234 1,523,473 1,248,291 1,131,729 1,080,420 838,432 446,289Revenue Growth (%) — 22.0 10.3 4.7 28.9 87.9 47.6Operating EBIT 96,287 331,093 336,073 277,902 255,824 178,187 99,210Gross Interest Expense 15,331 55,483 38,820 57,895 79,562 78,971 37,822Net Income 50,049 153,842 168,690 125,546 63,448 46,205 34,948
Note: Numbers may not add due to rounding. Source: Cablevision S.A. and Fitch.

Latin America High Yield 51
November 8, 2012
Corporates
CAP Limited Clarendon Alumina Production Limited Full Rating Report
Key Rating Drivers
Government Support Vital: CAP Limited’s (CAP) ratings are linked to those of Jamaica’s and
reflect its 100% ownership by the government of Jamaica (GoJ), without support from which it
could not continue operating. CAP is the holding company for the Jamaican government’s 45%
ownership in an unincorporated joint venture with a subsidiary of Alcoa Inc. (Alcoa) called
Jamalco, which is a bauxite mining and alumina refining operation in Jamaica. This joint
venture involves the proportionate sharing of production costs and the alumina output of the
Clarendon Alumina Refinery (CAR). CAR’s current production rate is about 1.36 million tons
per year.
Grants Required to Fulfill Financial Obligations: CAP is obliged to fund its share of running
and operating expenses at CAR, and it would be unable to meet these obligations without
support from the GoJ. CAP received grants from the GoJ of USD17 million in fiscal 2011 and
USD107.4 million in fiscal 2010. These grants ensure that CAP is able to meet its supply
agreement obligations with customers. The long-term foreign currency IDR of Jamaica is rated
‘B’ by Fitch Ratings with a Stable Outlook. CAP’s Stable Outlook mirrors the sovereign rating
outlook on Jamaica, to which its ratings are tied.
Weak Stand-Alone Financial Profile: On a stand-alone basis, CAP has an extremely weak
financial profile for its rating category. Total debt has increased to USD424 million in fiscal
2011 from USD373 million in fiscal 2010, while EBITDA has deteriorated further to negative
USD39 million from negative USD14 million over the same period. The decline in EBITDA is
primarily a result of the unfavorable long-term contract the company has with Glencore. Fiscal
2011 revenues of USD127 million were based on total alumina sales of 602,202 metric tons.
This was flat to revenues of USD126 million in fiscal 2010.
Unsecured Notes Guaranteed by Sovereign: CAP’s USD200 million, 8.5% unsecured notes
due November 2021 continue to be supported by an explicit unconditional and irrevocable
guarantee by the GoJ for timely interest and principal on the notes. The GoJ guaranteed
approximately 90% of CAP’s USD424 million of total debt as of the fiscal year-end March 31,
2011. Cash at USD4.1 million is extremely low in relation to short-term debt of USD169 million.
What Could Trigger a Rating Action
Ratings Tied to Sovereign: CAP’s future rating actions are directly linked to Fitch’s actions
taken on Jamaica. If Fitch were to further downgrade the ratings on the sovereign due to
concerns regarding macroeconomic pressures or upgrade the ratings due to liquidity
improvement, then CAP’s ratings would also mirror this action. This rating linkage will continue
as long as the company remains 100% owned by the GoJ.
The GoJ announced in 2009 that it is seeking to sell its 45% stake in Jamalco, and Fitch
understands that this process is ongoing. Fitch notes that Alcoa has a right of first refusal on
buying the shares. CAP’s USD200 million 8.5% unsecured notes due 2021 are subject to a
change-of-control clause, which creditors may choose to activate. Should any potential change
of control result in effective acceleration of the obligation, Fitch will review for possible rating
action.
Ratings
Foreign Currency
Long-Term IDR B–
Senior Unsecured B–/RR4
Local Currency
Long-Term IDR B–
IDR – Issuer default rating.
Rating Outlooks Long-Term Foreign Currency IDR Stable Long-Term Local Currency IDR Stable
Financial Data CAP Limited
3/31/11 3/31/10 Total Adjusted Capital (USD Mil.) 242 264 Total Debt (USD Mil.) 424 373 Operating Revenue (USD Mil.) 127 126 Net Income (USD Mil.) (73) 44 FCF Margin (%) (17) 37 ROAE (%) 50 (33) Total Debt to EBITDA (x) (11.0) (25.8)
Analysts Jay Djemal +1 312 368-3134 [email protected]
Joe Bormann, CFA +1 312 368-3349 [email protected]
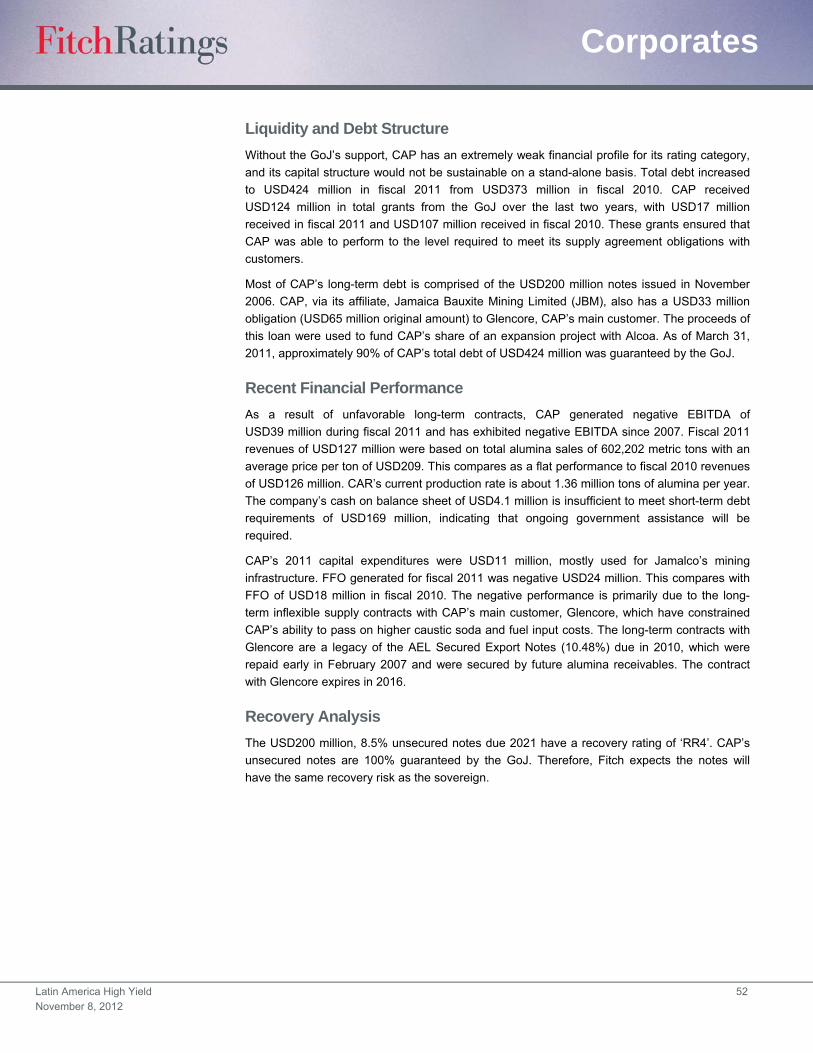
Latin America High Yield 52
November 8, 2012
Corporates
Liquidity and Debt Structure
Without the GoJ’s support, CAP has an extremely weak financial profile for its rating category,
and its capital structure would not be sustainable on a stand-alone basis. Total debt increased
to USD424 million in fiscal 2011 from USD373 million in fiscal 2010. CAP received
USD124 million in total grants from the GoJ over the last two years, with USD17 million
received in fiscal 2011 and USD107 million received in fiscal 2010. These grants ensured that
CAP was able to perform to the level required to meet its supply agreement obligations with
customers.
Most of CAP’s long-term debt is comprised of the USD200 million notes issued in November
2006. CAP, via its affiliate, Jamaica Bauxite Mining Limited (JBM), also has a USD33 million
obligation (USD65 million original amount) to Glencore, CAP’s main customer. The proceeds of
this loan were used to fund CAP’s share of an expansion project with Alcoa. As of March 31,
2011, approximately 90% of CAP’s total debt of USD424 million was guaranteed by the GoJ.
Recent Financial Performance
As a result of unfavorable long-term contracts, CAP generated negative EBITDA of
USD39 million during fiscal 2011 and has exhibited negative EBITDA since 2007. Fiscal 2011
revenues of USD127 million were based on total alumina sales of 602,202 metric tons with an
average price per ton of USD209. This compares as a flat performance to fiscal 2010 revenues
of USD126 million. CAR’s current production rate is about 1.36 million tons of alumina per year.
The company’s cash on balance sheet of USD4.1 million is insufficient to meet short-term debt
requirements of USD169 million, indicating that ongoing government assistance will be
required.
CAP’s 2011 capital expenditures were USD11 million, mostly used for Jamalco’s mining
infrastructure. FFO generated for fiscal 2011 was negative USD24 million. This compares with
FFO of USD18 million in fiscal 2010. The negative performance is primarily due to the long-
term inflexible supply contracts with CAP’s main customer, Glencore, which have constrained
CAP’s ability to pass on higher caustic soda and fuel input costs. The long-term contracts with
Glencore are a legacy of the AEL Secured Export Notes (10.48%) due in 2010, which were
repaid early in February 2007 and were secured by future alumina receivables. The contract
with Glencore expires in 2016.
Recovery Analysis
The USD200 million, 8.5% unsecured notes due 2021 have a recovery rating of ‘RR4’. CAP’s
unsecured notes are 100% guaranteed by the GoJ. Therefore, Fitch expects the notes will
have the same recovery risk as the sovereign.
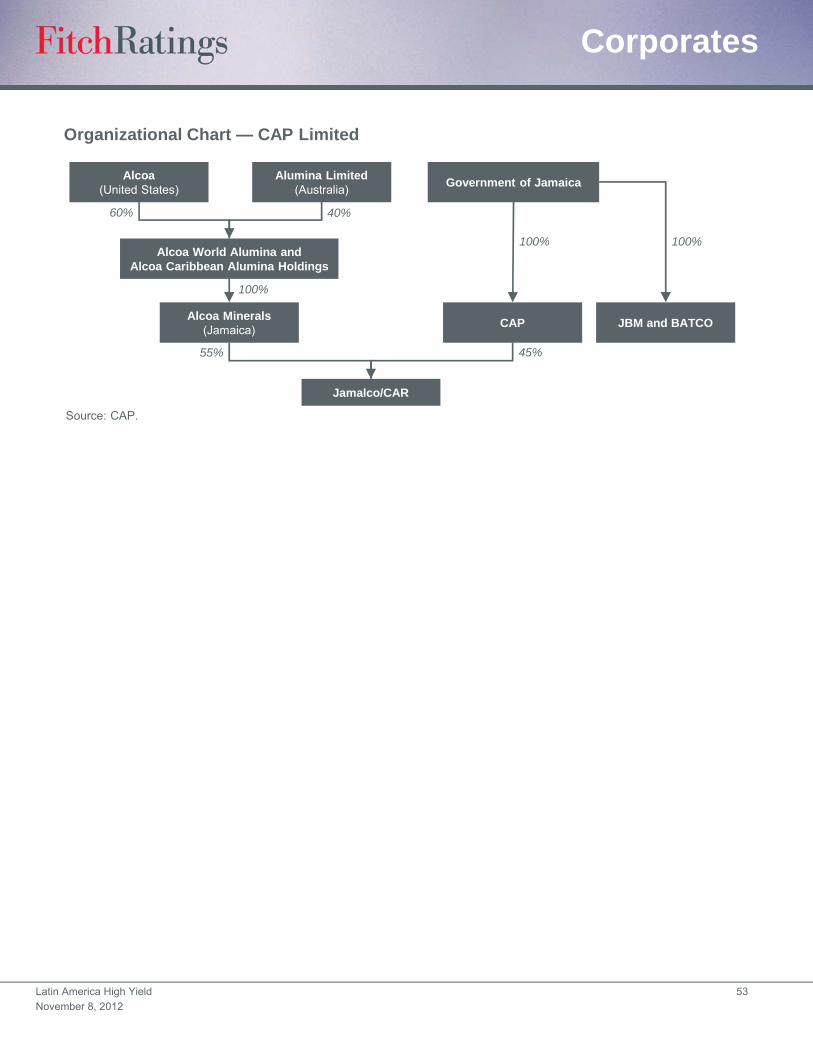
Latin America High Yield 53
November 8, 2012
Corporates
Organizational Chart — CAP Limited
Alcoa(United States)
Source: CAP.
Alumina Limited(Australia)
Government of Jamaica
Alcoa World Alumina and Alcoa Caribbean Alumina Holdings
Alcoa Minerals(Jamaica)
CAP JBM and BATCO
Jamalco/CAR
60% 40%
100%
55% 45%
100% 100%
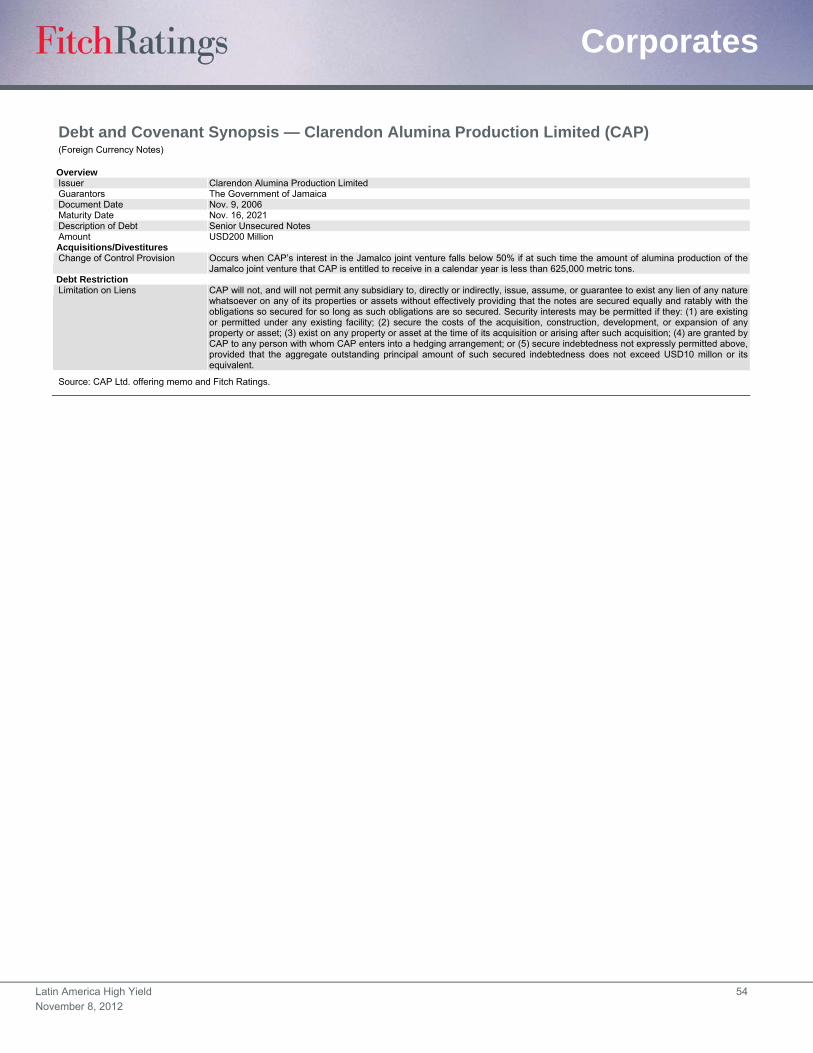
Latin America High Yield 54
November 8, 2012
Corporates
Debt and Covenant Synopsis — Clarendon Alumina Production Limited (CAP) (Foreign Currency Notes)
Overview Issuer Clarendon Alumina Production Limited Guarantors The Government of Jamaica Document Date Nov. 9, 2006 Maturity Date Nov. 16, 2021 Description of Debt Senior Unsecured Notes Amount USD200 Million
Acquisitions/Divestitures Change of Control Provision Occurs when CAP’s interest in the Jamalco joint venture falls below 50% if at such time the amount of alumina production of the
Jamalco joint venture that CAP is entitled to receive in a calendar year is less than 625,000 metric tons. Debt Restriction Limitation on Liens CAP will not, and will not permit any subsidiary to, directly or indirectly, issue, assume, or guarantee to exist any lien of any nature
whatsoever on any of its properties or assets without effectively providing that the notes are secured equally and ratably with the obligations so secured for so long as such obligations are so secured. Security interests may be permitted if they: (1) are existing or permitted under any existing facility; (2) secure the costs of the acquisition, construction, development, or expansion of any property or asset; (3) exist on any property or asset at the time of its acquisition or arising after such acquisition; (4) are granted by CAP to any person with whom CAP enters into a hedging arrangement; or (5) secure indebtedness not expressly permitted above, provided that the aggregate outstanding principal amount of such secured indebtedness does not exceed USD10 millon or its equivalent.
Source: CAP Ltd. offering memo and Fitch Ratings.
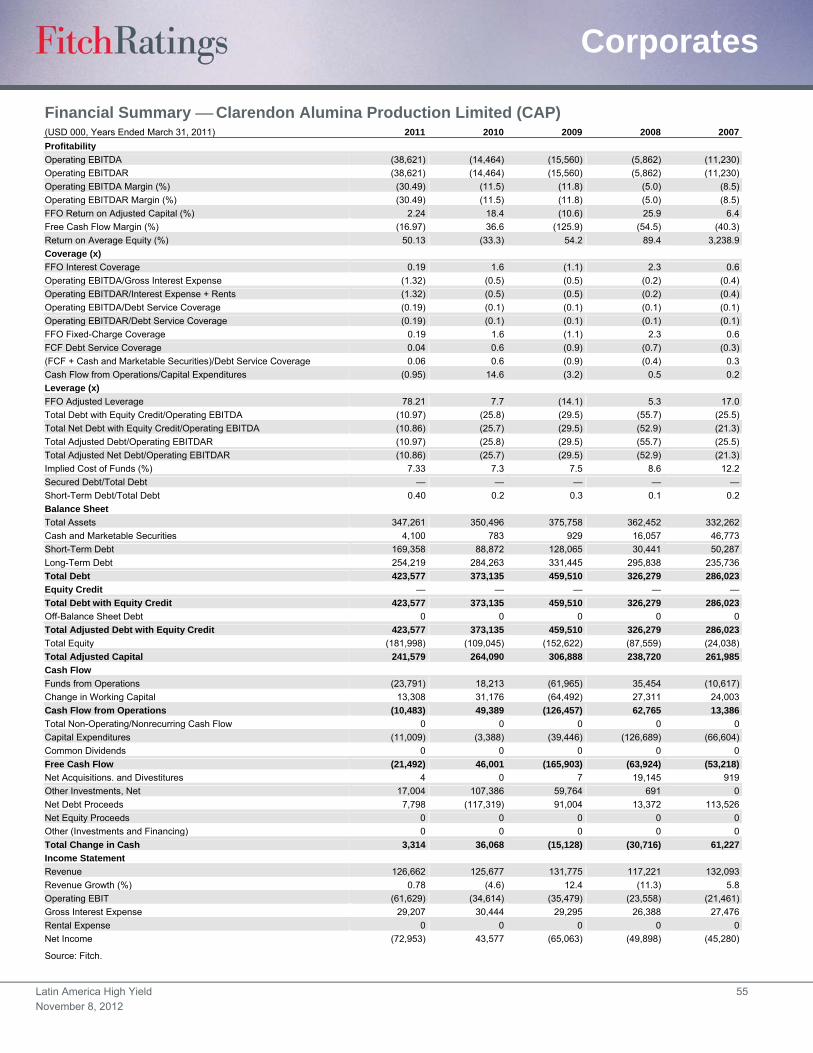
Latin America High Yield 55
November 8, 2012
Corporates
Financial Summary Clarendon Alumina Production Limited (CAP) (USD 000, Years Ended March 31, 2011) 2011 2010 2009 2008 2007
Profitability
Operating EBITDA (38,621) (14,464) (15,560) (5,862) (11,230)
Operating EBITDAR (38,621) (14,464) (15,560) (5,862) (11,230)
Operating EBITDA Margin (%) (30.49) (11.5) (11.8) (5.0) (8.5)
Operating EBITDAR Margin (%) (30.49) (11.5) (11.8) (5.0) (8.5)
FFO Return on Adjusted Capital (%) 2.24 18.4 (10.6) 25.9 6.4
Free Cash Flow Margin (%) (16.97) 36.6 (125.9) (54.5) (40.3)
Return on Average Equity (%) 50.13 (33.3) 54.2 89.4 3,238.9
Coverage (x)
FFO Interest Coverage 0.19 1.6 (1.1) 2.3 0.6
Operating EBITDA/Gross Interest Expense (1.32) (0.5) (0.5) (0.2) (0.4)
Operating EBITDAR/Interest Expense + Rents (1.32) (0.5) (0.5) (0.2) (0.4)
Operating EBITDA/Debt Service Coverage (0.19) (0.1) (0.1) (0.1) (0.1)
Operating EBITDAR/Debt Service Coverage (0.19) (0.1) (0.1) (0.1) (0.1)
FFO Fixed-Charge Coverage 0.19 1.6 (1.1) 2.3 0.6
FCF Debt Service Coverage 0.04 0.6 (0.9) (0.7) (0.3)
(FCF + Cash and Marketable Securities)/Debt Service Coverage 0.06 0.6 (0.9) (0.4) 0.3
Cash Flow from Operations/Capital Expenditures (0.95) 14.6 (3.2) 0.5 0.2
Leverage (x)
FFO Adjusted Leverage 78.21 7.7 (14.1) 5.3 17.0
Total Debt with Equity Credit/Operating EBITDA (10.97) (25.8) (29.5) (55.7) (25.5)
Total Net Debt with Equity Credit/Operating EBITDA (10.86) (25.7) (29.5) (52.9) (21.3)
Total Adjusted Debt/Operating EBITDAR (10.97) (25.8) (29.5) (55.7) (25.5)
Total Adjusted Net Debt/Operating EBITDAR (10.86) (25.7) (29.5) (52.9) (21.3)
Implied Cost of Funds (%) 7.33 7.3 7.5 8.6 12.2
Secured Debt/Total Debt — — — — —
Short-Term Debt/Total Debt 0.40 0.2 0.3 0.1 0.2
Balance Sheet
Total Assets 347,261 350,496 375,758 362,452 332,262
Cash and Marketable Securities 4,100 783 929 16,057 46,773
Short-Term Debt 169,358 88,872 128,065 30,441 50,287
Long-Term Debt 254,219 284,263 331,445 295,838 235,736
Total Debt 423,577 373,135 459,510 326,279 286,023
Equity Credit — — — — —
Total Debt with Equity Credit 423,577 373,135 459,510 326,279 286,023
Off-Balance Sheet Debt 0 0 0 0 0
Total Adjusted Debt with Equity Credit 423,577 373,135 459,510 326,279 286,023
Total Equity (181,998) (109,045) (152,622) (87,559) (24,038)
Total Adjusted Capital 241,579 264,090 306,888 238,720 261,985
Cash Flow
Funds from Operations (23,791) 18,213 (61,965) 35,454 (10,617)
Change in Working Capital 13,308 31,176 (64,492) 27,311 24,003
Cash Flow from Operations (10,483) 49,389 (126,457) 62,765 13,386
Total Non-Operating/Nonrecurring Cash Flow 0 0 0 0 0
Capital Expenditures (11,009) (3,388) (39,446) (126,689) (66,604)
Common Dividends 0 0 0 0 0
Free Cash Flow (21,492) 46,001 (165,903) (63,924) (53,218)
Net Acquisitions. and Divestitures 4 0 7 19,145 919
Other Investments, Net 17,004 107,386 59,764 691 0
Net Debt Proceeds 7,798 (117,319) 91,004 13,372 113,526
Net Equity Proceeds 0 0 0 0 0
Other (Investments and Financing) 0 0 0 0 0
Total Change in Cash 3,314 36,068 (15,128) (30,716) 61,227
Income Statement
Revenue 126,662 125,677 131,775 117,221 132,093
Revenue Growth (%) 0.78 (4.6) 12.4 (11.3) 5.8
Operating EBIT (61,629) (34,614) (35,479) (23,558) (21,461)
Gross Interest Expense 29,207 30,444 29,295 26,388 27,476
Rental Expense 0 0 0 0 0
Net Income (72,953) 43,577 (65,063) (49,898) (45,280)
Source: Fitch.
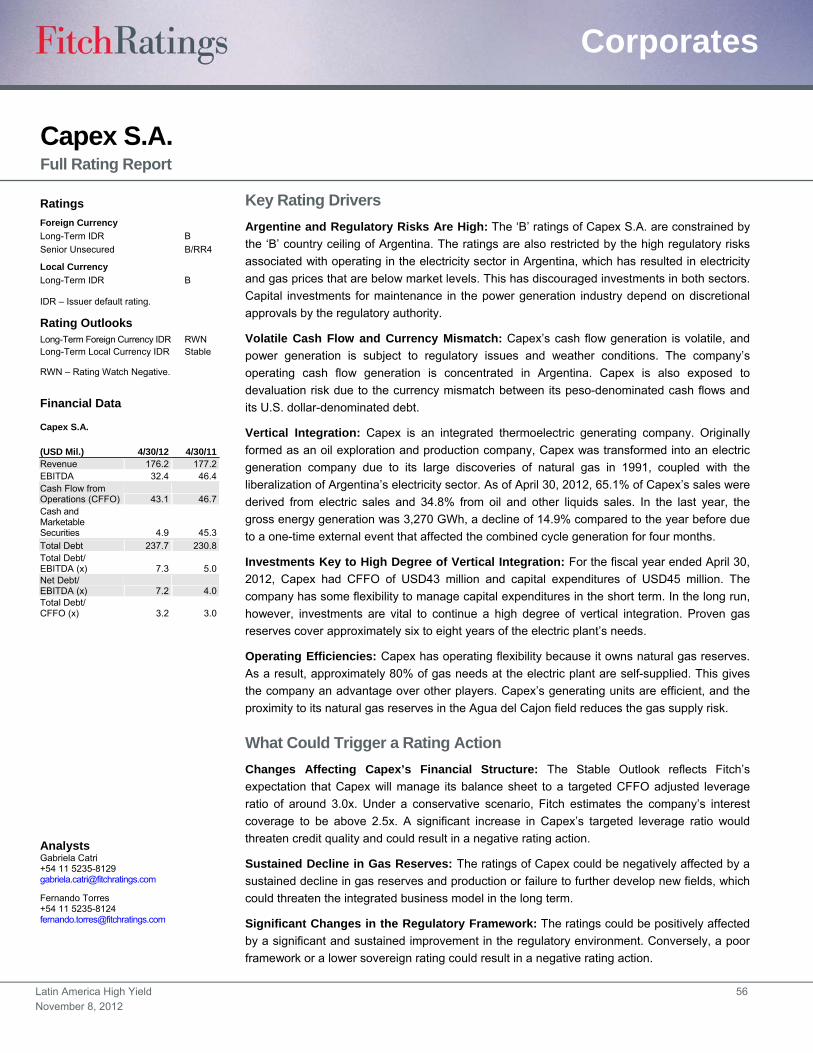
Latin America High Yield 56
November 8, 2012
Corporates
Capex S.A. Full Rating Report
Key Rating Drivers
Argentine and Regulatory Risks Are High: The ‘B’ ratings of Capex S.A. are constrained by
the ‘B’ country ceiling of Argentina. The ratings are also restricted by the high regulatory risks
associated with operating in the electricity sector in Argentina, which has resulted in electricity
and gas prices that are below market levels. This has discouraged investments in both sectors.
Capital investments for maintenance in the power generation industry depend on discretional
approvals by the regulatory authority.
Volatile Cash Flow and Currency Mismatch: Capex’s cash flow generation is volatile, and
power generation is subject to regulatory issues and weather conditions. The company’s
operating cash flow generation is concentrated in Argentina. Capex is also exposed to
devaluation risk due to the currency mismatch between its peso-denominated cash flows and
its U.S. dollar-denominated debt.
Vertical Integration: Capex is an integrated thermoelectric generating company. Originally
formed as an oil exploration and production company, Capex was transformed into an electric
generation company due to its large discoveries of natural gas in 1991, coupled with the
liberalization of Argentina’s electricity sector. As of April 30, 2012, 65.1% of Capex’s sales were
derived from electric sales and 34.8% from oil and other liquids sales. In the last year, the
gross energy generation was 3,270 GWh, a decline of 14.9% compared to the year before due
to a one-time external event that affected the combined cycle generation for four months.
Investments Key to High Degree of Vertical Integration: For the fiscal year ended April 30,
2012, Capex had CFFO of USD43 million and capital expenditures of USD45 million. The
company has some flexibility to manage capital expenditures in the short term. In the long run,
however, investments are vital to continue a high degree of vertical integration. Proven gas
reserves cover approximately six to eight years of the electric plant’s needs.
Operating Efficiencies: Capex has operating flexibility because it owns natural gas reserves.
As a result, approximately 80% of gas needs at the electric plant are self-supplied. This gives
the company an advantage over other players. Capex’s generating units are efficient, and the
proximity to its natural gas reserves in the Agua del Cajon field reduces the gas supply risk.
What Could Trigger a Rating Action
Changes Affecting Capex’s Financial Structure: The Stable Outlook reflects Fitch’s
expectation that Capex will manage its balance sheet to a targeted CFFO adjusted leverage
ratio of around 3.0x. Under a conservative scenario, Fitch estimates the company’s interest
coverage to be above 2.5x. A significant increase in Capex’s targeted leverage ratio would
threaten credit quality and could result in a negative rating action.
Sustained Decline in Gas Reserves: The ratings of Capex could be negatively affected by a
sustained decline in gas reserves and production or failure to further develop new fields, which
could threaten the integrated business model in the long term.
Significant Changes in the Regulatory Framework: The ratings could be positively affected
by a significant and sustained improvement in the regulatory environment. Conversely, a poor
framework or a lower sovereign rating could result in a negative rating action.
Ratings
Foreign Currency
Long-Term IDR B
Senior Unsecured B/RR4
Local Currency
Long-Term IDR B
IDR – Issuer default rating.
Rating Outlooks Long-Term Foreign Currency IDR RWN Long-Term Local Currency IDR Stable
RWN – Rating Watch Negative.
Financial Data
Capex S.A.
(USD Mil.)
4/30/12 4/30/11 Revenue 176.2 177.2 EBITDA 32.4 46.4 Cash Flow from Operations (CFFO) 43.1 46.7 Cash and Marketable Securities 4.9 45.3 Total Debt 237.7 230.8 Total Debt/ EBITDA (x) 7.3 5.0 Net Debt/ EBITDA (x) 7.2 4.0 Total Debt/ CFFO (x) 3.2 3.0
Analysts Gabriela Catri +54 11 5235-8129 [email protected]
Fernando Torres +54 11 5235-8124 [email protected]
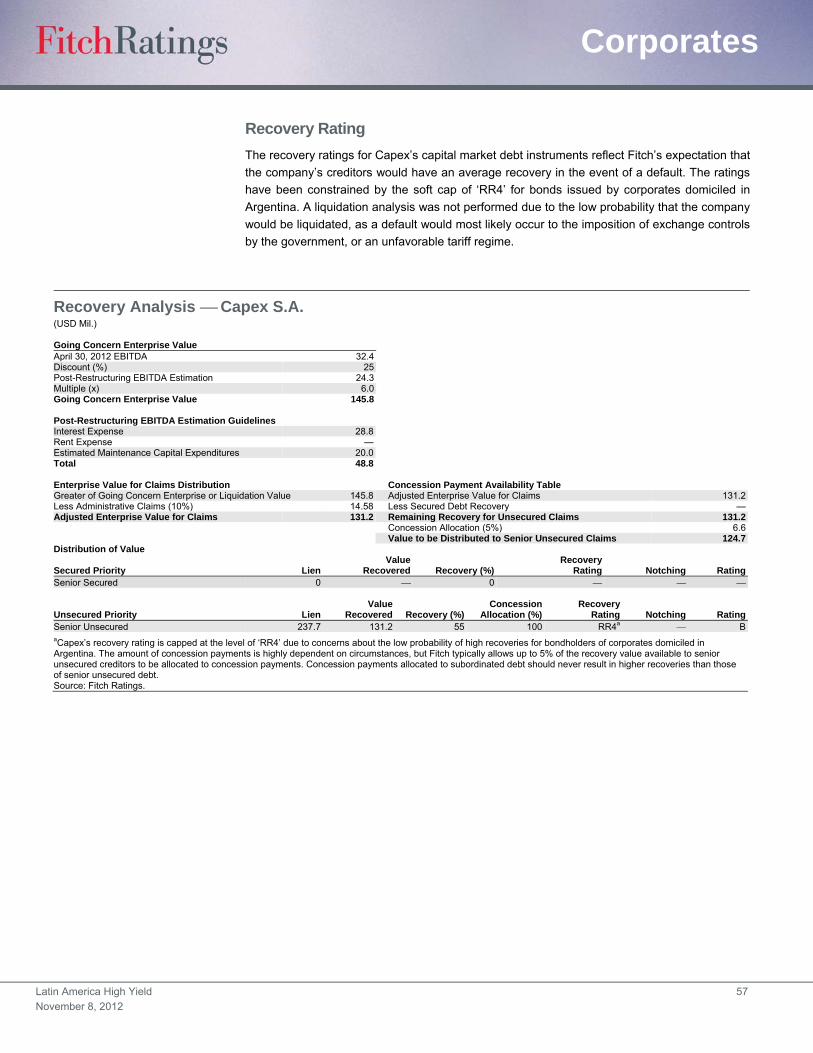
Latin America High Yield 57
November 8, 2012
Corporates
Recovery Rating
The recovery ratings for Capex’s capital market debt instruments reflect Fitch’s expectation that
the company’s creditors would have an average recovery in the event of a default. The ratings
have been constrained by the soft cap of ‘RR4’ for bonds issued by corporates domiciled in
Argentina. A liquidation analysis was not performed due to the low probability that the company
would be liquidated, as a default would most likely occur to the imposition of exchange controls
by the government, or an unfavorable tariff regime.
Recovery Analysis Capex S.A. (USD Mil.) Going Concern Enterprise Value April 30, 2012 EBITDA 32.4 Discount (%) 25 Post-Restructuring EBITDA Estimation 24.3 Multiple (x) 6.0 Going Concern Enterprise Value 145.8 Post-Restructuring EBITDA Estimation Guidelines Interest Expense 28.8Rent Expense —Estimated Maintenance Capital Expenditures 20.0Total 48.8
Enterprise Value for Claims Distribution Concession Payment Availability Table Greater of Going Concern Enterprise or Liquidation Value 145.8 Adjusted Enterprise Value for Claims 131.2Less Administrative Claims (10%) 14.58 Less Secured Debt Recovery —Adjusted Enterprise Value for Claims 131.2 Remaining Recovery for Unsecured Claims 131.2 Concession Allocation (5%) 6.6 Value to be Distributed to Senior Unsecured Claims 124.7Distribution of Value
Secured Priority Lien Value
Recovered Recovery (%)Recovery
Rating Notching RatingSenior Secured 0 0
Unsecured Priority Lien Value
Recovered Recovery (%)Concession
Allocation (%)Recovery
Rating Notching RatingSenior Unsecured 237.7 131.2 55 100 RR4a BaCapex’s recovery rating is capped at the level of ‘RR4’ due to concerns about the low probability of high recoveries for bondholders of corporates domiciled in Argentina. The amount of concession payments is highly dependent on circumstances, but Fitch typically allows up to 5% of the recovery value available to senior unsecured creditors to be allocated to concession payments. Concession payments allocated to subordinated debt should never result in higher recoveries than those of senior unsecured debt. Source: Fitch Ratings.
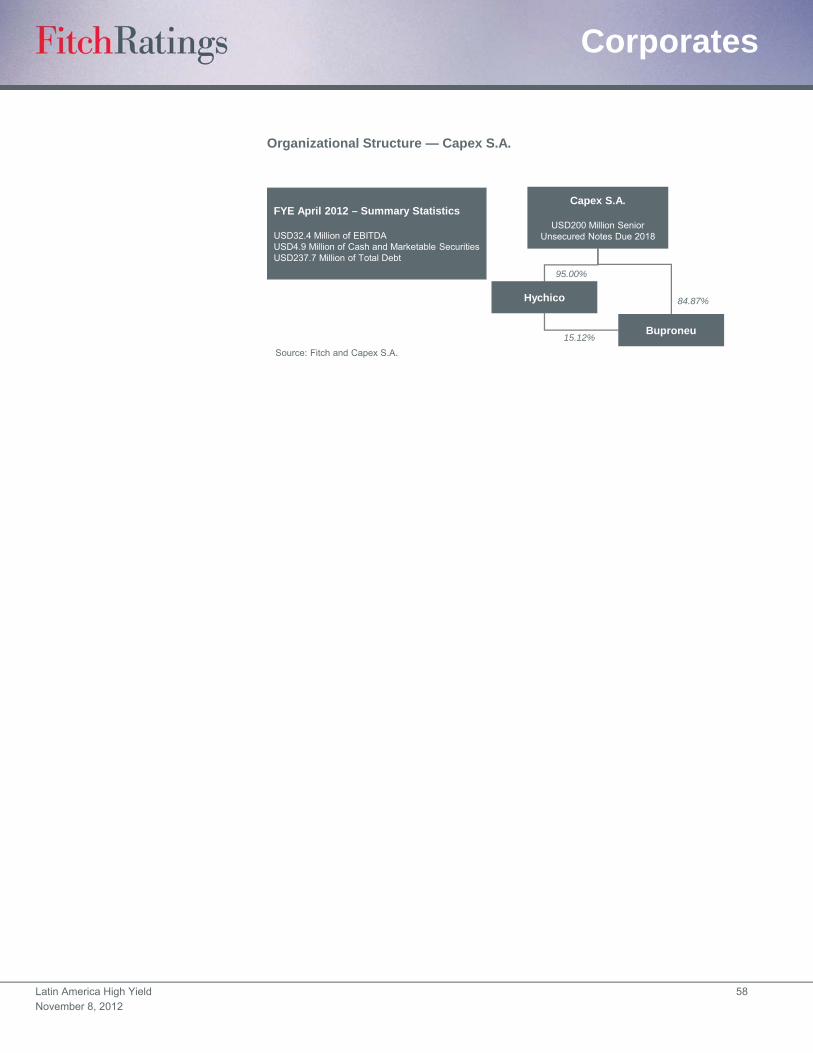
Latin America High Yield 58
November 8, 2012
Corporates
Organizational Structure — Capex S.A.
Source: Fitch and Capex S.A.
Capex S.A.
USD200 Million Senior Unsecured Notes Due 2018
Buproneu
95.00%
FYE April 2012 – Summary Statistics
USD32.4 Million of EBITDAUSD4.9 Million of Cash and Marketable SecuritiesUSD237.7 Million of Total Debt
Hychico 84.87%
15.12%
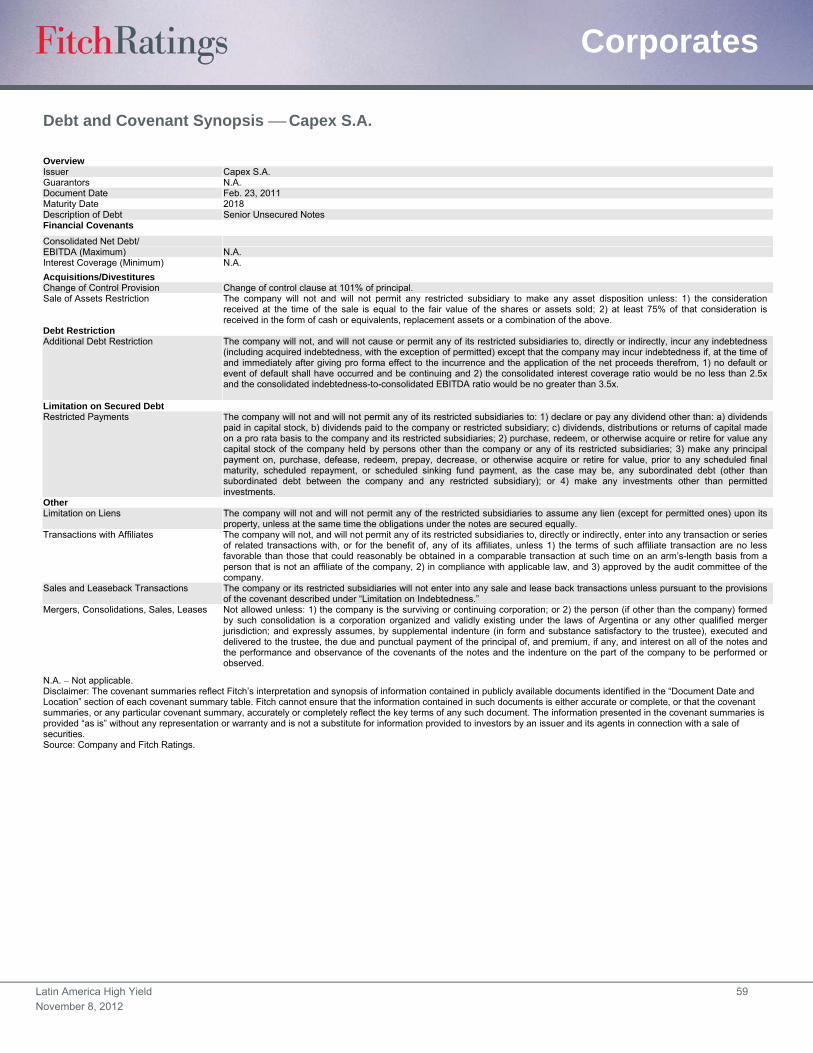
Latin America High Yield 59
November 8, 2012
Corporates
Debt and Covenant Synopsis Capex S.A.
Overview Issuer Capex S.A. Guarantors N.A. Document Date Feb. 23, 2011 Maturity Date 2018 Description of Debt Senior Unsecured Notes Financial Covenants
Consolidated Net Debt/ EBITDA (Maximum) N.A. Interest Coverage (Minimum) N.A.
Acquisitions/Divestitures Change of Control Provision Change of control clause at 101% of principal. Sale of Assets Restriction The company will not and will not permit any restricted subsidiary to make any asset disposition unless: 1) the consideration
received at the time of the sale is equal to the fair value of the shares or assets sold; 2) at least 75% of that consideration is received in the form of cash or equivalents, replacement assets or a combination of the above.
Debt Restriction Additional Debt Restriction The company will not, and will not cause or permit any of its restricted subsidiaries to, directly or indirectly, incur any indebtedness
(including acquired indebtedness, with the exception of permitted) except that the company may incur indebtedness if, at the time of and immediately after giving pro forma effect to the incurrence and the application of the net proceeds therefrom, 1) no default or event of default shall have occurred and be continuing and 2) the consolidated interest coverage ratio would be no less than 2.5x and the consolidated indebtedness-to-consolidated EBITDA ratio would be no greater than 3.5x.
Limitation on Secured Debt Restricted Payments The company will not and will not permit any of its restricted subsidiaries to: 1) declare or pay any dividend other than: a) dividends
paid in capital stock, b) dividends paid to the company or restricted subsidiary; c) dividends, distributions or returns of capital made on a pro rata basis to the company and its restricted subsidiaries; 2) purchase, redeem, or otherwise acquire or retire for value any capital stock of the company held by persons other than the company or any of its restricted subsidiaries; 3) make any principal payment on, purchase, defease, redeem, prepay, decrease, or otherwise acquire or retire for value, prior to any scheduled final maturity, scheduled repayment, or scheduled sinking fund payment, as the case may be, any subordinated debt (other than subordinated debt between the company and any restricted subsidiary); or 4) make any investments other than permitted investments.
Other Limitation on Liens The company will not and will not permit any of the restricted subsidiaries to assume any lien (except for permitted ones) upon its
property, unless at the same time the obligations under the notes are secured equally. Transactions with Affiliates The company will not, and will not permit any of its restricted subsidiaries to, directly or indirectly, enter into any transaction or series
of related transactions with, or for the benefit of, any of its affiliates, unless 1) the terms of such affiliate transaction are no less favorable than those that could reasonably be obtained in a comparable transaction at such time on an arm’s-length basis from a person that is not an affiliate of the company, 2) in compliance with applicable law, and 3) approved by the audit committee of the company.
Sales and Leaseback Transactions The company or its restricted subsidiaries will not enter into any sale and lease back transactions unless pursuant to the provisions of the covenant described under “Limitation on Indebtedness.”
Mergers, Consolidations, Sales, Leases Not allowed unless: 1) the company is the surviving or continuing corporation; or 2) the person (if other than the company) formed by such consolidation is a corporation organized and validly existing under the laws of Argentina or any other qualified merger jurisdiction; and expressly assumes, by supplemental indenture (in form and substance satisfactory to the trustee), executed and delivered to the trustee, the due and punctual payment of the principal of, and premium, if any, and interest on all of the notes and the performance and observance of the covenants of the notes and the indenture on the part of the company to be performed or observed.
N.A. Not applicable. Disclaimer: The covenant summaries reflect Fitch’s interpretation and synopsis of information contained in publicly available documents identified in the “Document Date and Location” section of each covenant summary table. Fitch cannot ensure that the information contained in such documents is either accurate or complete, or that the covenant summaries, or any particular covenant summary, accurately or completely reflect the key terms of any such document. The information presented in the covenant summaries is provided “as is” without any representation or warranty and is not a substitute for information provided to investors by an issuer and its agents in connection with a sale of securities. Source: Company and Fitch Ratings.
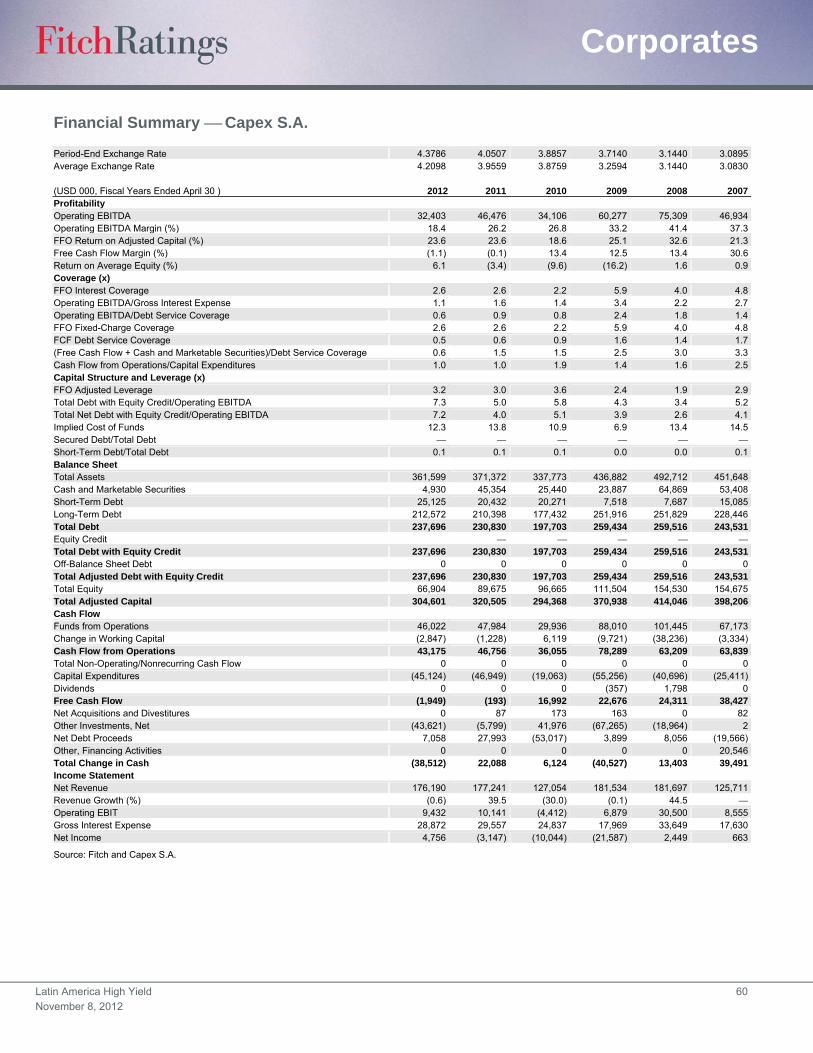
Latin America High Yield 60
November 8, 2012
Corporates
Financial Summary Capex S.A. Period-End Exchange Rate 4.3786 4.0507 3.8857 3.7140 3.1440 3.0895Average Exchange Rate 4.2098 3.9559 3.8759 3.2594 3.1440 3.0830 (USD 000, Fiscal Years Ended April 30 ) 2012 2011 2010 2009 2008 2007Profitability Operating EBITDA 32,403 46,476 34,106 60,277 75,309 46,934 Operating EBITDA Margin (%) 18.4 26.2 26.8 33.2 41.4 37.3 FFO Return on Adjusted Capital (%) 23.6 23.6 18.6 25.1 32.6 21.3 Free Cash Flow Margin (%) (1.1) (0.1) 13.4 12.5 13.4 30.6 Return on Average Equity (%) 6.1 (3.4) (9.6) (16.2) 1.6 0.9 Coverage (x) FFO Interest Coverage 2.6 2.6 2.2 5.9 4.0 4.8 Operating EBITDA/Gross Interest Expense 1.1 1.6 1.4 3.4 2.2 2.7 Operating EBITDA/Debt Service Coverage 0.6 0.9 0.8 2.4 1.8 1.4 FFO Fixed-Charge Coverage 2.6 2.6 2.2 5.9 4.0 4.8 FCF Debt Service Coverage 0.5 0.6 0.9 1.6 1.4 1.7 (Free Cash Flow + Cash and Marketable Securities)/Debt Service Coverage 0.6 1.5 1.5 2.5 3.0 3.3 Cash Flow from Operations/Capital Expenditures 1.0 1.0 1.9 1.4 1.6 2.5 Capital Structure and Leverage (x) FFO Adjusted Leverage 3.2 3.0 3.6 2.4 1.9 2.9 Total Debt with Equity Credit/Operating EBITDA 7.3 5.0 5.8 4.3 3.4 5.2 Total Net Debt with Equity Credit/Operating EBITDA 7.2 4.0 5.1 3.9 2.6 4.1 Implied Cost of Funds 12.3 13.8 10.9 6.9 13.4 14.5 Secured Debt/Total Debt Short-Term Debt/Total Debt 0.1 0.1 0.1 0.0 0.0 0.1 Balance Sheet Total Assets 361,599 371,372 337,773 436,882 492,712 451,648 Cash and Marketable Securities 4,930 45,354 25,440 23,887 64,869 53,408 Short-Term Debt 25,125 20,432 20,271 7,518 7,687 15,085 Long-Term Debt 212,572 210,398 177,432 251,916 251,829 228,446 Total Debt 237,696 230,830 197,703 259,434 259,516 243,531 Equity Credit Total Debt with Equity Credit 237,696 230,830 197,703 259,434 259,516 243,531 Off-Balance Sheet Debt 0 0 0 0 0 0 Total Adjusted Debt with Equity Credit 237,696 230,830 197,703 259,434 259,516 243,531 Total Equity 66,904 89,675 96,665 111,504 154,530 154,675 Total Adjusted Capital 304,601 320,505 294,368 370,938 414,046 398,206 Cash Flow Funds from Operations 46,022 47,984 29,936 88,010 101,445 67,173 Change in Working Capital (2,847) (1,228) 6,119 (9,721) (38,236) (3,334)Cash Flow from Operations 43,175 46,756 36,055 78,289 63,209 63,839 Total Non-Operating/Nonrecurring Cash Flow 0 0 0 0 0 0 Capital Expenditures (45,124) (46,949) (19,063) (55,256) (40,696) (25,411)Dividends 0 0 0 (357) 1,798 0 Free Cash Flow (1,949) (193) 16,992 22,676 24,311 38,427 Net Acquisitions and Divestitures 0 87 173 163 0 82 Other Investments, Net (43,621) (5,799) 41,976 (67,265) (18,964) 2 Net Debt Proceeds 7,058 27,993 (53,017) 3,899 8,056 (19,566)Other, Financing Activities 0 0 0 0 0 20,546 Total Change in Cash (38,512) 22,088 6,124 (40,527) 13,403 39,491 Income Statement Net Revenue 176,190 177,241 127,054 181,534 181,697 125,711 Revenue Growth (%) (0.6) 39.5 (30.0) (0.1) 44.5 Operating EBIT 9,432 10,141 (4,412) 6,879 30,500 8,555 Gross Interest Expense 28,872 29,557 24,837 17,969 33,649 17,630 Net Income 4,756 (3,147) (10,044) (21,587) 2,449 663
Source: Fitch and Capex S.A.
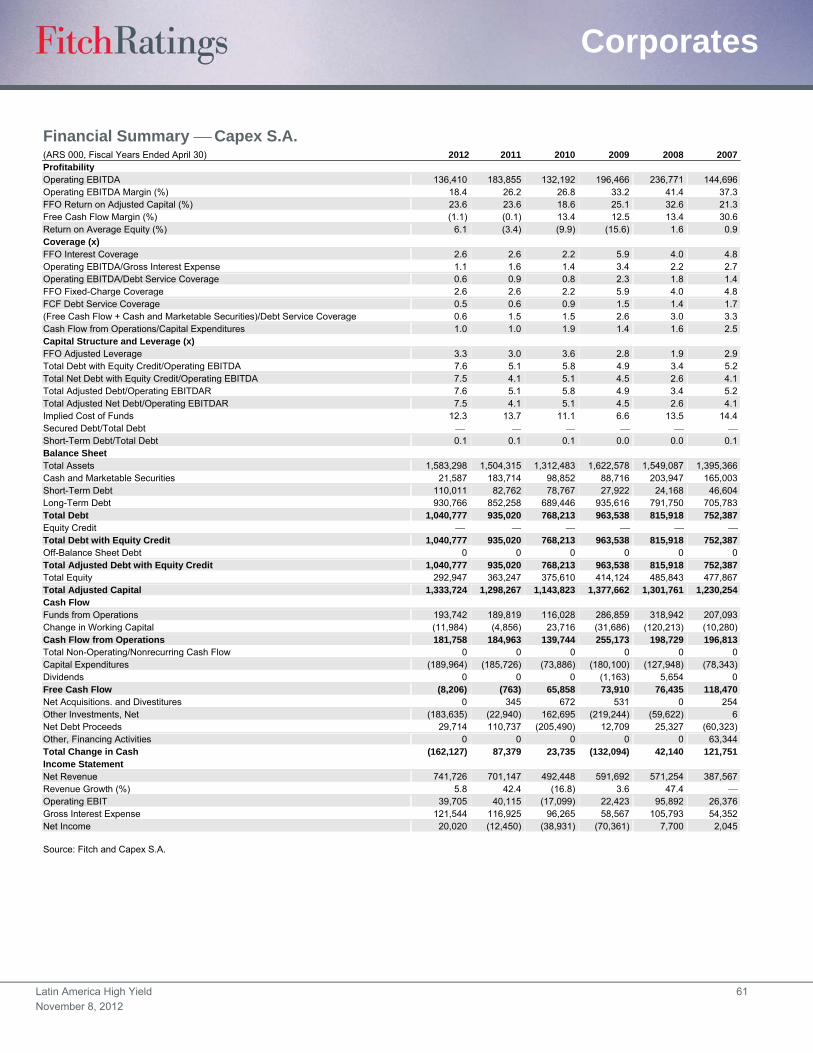
Latin America High Yield 61
November 8, 2012
Corporates
Financial Summary Capex S.A. (ARS 000, Fiscal Years Ended April 30) 2012 2011 2010 2009 2008 2007Profitability Operating EBITDA 136,410 183,855 132,192 196,466 236,771 144,696 Operating EBITDA Margin (%) 18.4 26.2 26.8 33.2 41.4 37.3 FFO Return on Adjusted Capital (%) 23.6 23.6 18.6 25.1 32.6 21.3 Free Cash Flow Margin (%) (1.1) (0.1) 13.4 12.5 13.4 30.6 Return on Average Equity (%) 6.1 (3.4) (9.9) (15.6) 1.6 0.9 Coverage (x) FFO Interest Coverage 2.6 2.6 2.2 5.9 4.0 4.8 Operating EBITDA/Gross Interest Expense 1.1 1.6 1.4 3.4 2.2 2.7 Operating EBITDA/Debt Service Coverage 0.6 0.9 0.8 2.3 1.8 1.4 FFO Fixed-Charge Coverage 2.6 2.6 2.2 5.9 4.0 4.8 FCF Debt Service Coverage 0.5 0.6 0.9 1.5 1.4 1.7 (Free Cash Flow + Cash and Marketable Securities)/Debt Service Coverage 0.6 1.5 1.5 2.6 3.0 3.3 Cash Flow from Operations/Capital Expenditures 1.0 1.0 1.9 1.4 1.6 2.5 Capital Structure and Leverage (x) FFO Adjusted Leverage 3.3 3.0 3.6 2.8 1.9 2.9 Total Debt with Equity Credit/Operating EBITDA 7.6 5.1 5.8 4.9 3.4 5.2 Total Net Debt with Equity Credit/Operating EBITDA 7.5 4.1 5.1 4.5 2.6 4.1 Total Adjusted Debt/Operating EBITDAR 7.6 5.1 5.8 4.9 3.4 5.2 Total Adjusted Net Debt/Operating EBITDAR 7.5 4.1 5.1 4.5 2.6 4.1 Implied Cost of Funds 12.3 13.7 11.1 6.6 13.5 14.4 Secured Debt/Total Debt Short-Term Debt/Total Debt 0.1 0.1 0.1 0.0 0.0 0.1 Balance Sheet Total Assets 1,583,298 1,504,315 1,312,483 1,622,578 1,549,087 1,395,366 Cash and Marketable Securities 21,587 183,714 98,852 88,716 203,947 165,003 Short-Term Debt 110,011 82,762 78,767 27,922 24,168 46,604 Long-Term Debt 930,766 852,258 689,446 935,616 791,750 705,783 Total Debt 1,040,777 935,020 768,213 963,538 815,918 752,387 Equity Credit Total Debt with Equity Credit 1,040,777 935,020 768,213 963,538 815,918 752,387 Off-Balance Sheet Debt 0 0 0 0 0 0 Total Adjusted Debt with Equity Credit 1,040,777 935,020 768,213 963,538 815,918 752,387 Total Equity 292,947 363,247 375,610 414,124 485,843 477,867 Total Adjusted Capital 1,333,724 1,298,267 1,143,823 1,377,662 1,301,761 1,230,254 Cash Flow Funds from Operations 193,742 189,819 116,028 286,859 318,942 207,093 Change in Working Capital (11,984) (4,856) 23,716 (31,686) (120,213) (10,280)Cash Flow from Operations 181,758 184,963 139,744 255,173 198,729 196,813 Total Non-Operating/Nonrecurring Cash Flow 0 0 0 0 0 0 Capital Expenditures (189,964) (185,726) (73,886) (180,100) (127,948) (78,343)Dividends 0 0 0 (1,163) 5,654 0 Free Cash Flow (8,206) (763) 65,858 73,910 76,435 118,470 Net Acquisitions. and Divestitures 0 345 672 531 0 254 Other Investments, Net (183,635) (22,940) 162,695 (219,244) (59,622) 6 Net Debt Proceeds 29,714 110,737 (205,490) 12,709 25,327 (60,323)Other, Financing Activities 0 0 0 0 0 63,344 Total Change in Cash (162,127) 87,379 23,735 (132,094) 42,140 121,751 Income Statement Net Revenue 741,726 701,147 492,448 591,692 571,254 387,567 Revenue Growth (%) 5.8 42.4 (16.8) 3.6 47.4 Operating EBIT 39,705 40,115 (17,099) 22,423 95,892 26,376 Gross Interest Expense 121,544 116,925 96,265 58,567 105,793 54,352 Net Income 20,020 (12,450) (38,931) (70,361) 7,700 2,045
Source: Fitch and Capex S.A.
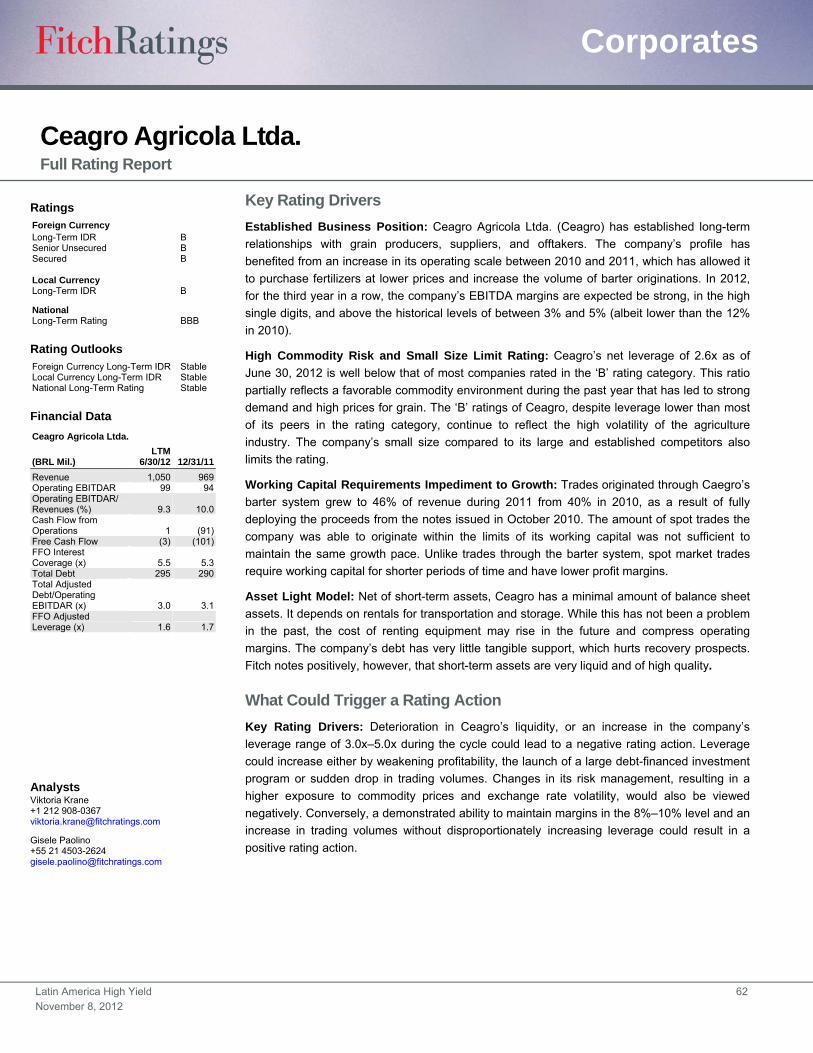
Latin America High Yield 62
November 8, 2012
Corporates
Ceagro Agricola Ltda. Full Rating Report
Key Rating Drivers
Established Business Position: Ceagro Agricola Ltda. (Ceagro) has established long-term
relationships with grain producers, suppliers, and offtakers. The company’s profile has
benefited from an increase in its operating scale between 2010 and 2011, which has allowed it
to purchase fertilizers at lower prices and increase the volume of barter originations. In 2012,
for the third year in a row, the company’s EBITDA margins are expected be strong, in the high
single digits, and above the historical levels of between 3% and 5% (albeit lower than the 12%
in 2010).
High Commodity Risk and Small Size Limit Rating: Ceagro’s net leverage of 2.6x as of
June 30, 2012 is well below that of most companies rated in the ‘B’ rating category. This ratio
partially reflects a favorable commodity environment during the past year that has led to strong
demand and high prices for grain. The ‘B’ ratings of Ceagro, despite leverage lower than most
of its peers in the rating category, continue to reflect the high volatility of the agriculture
industry. The company’s small size compared to its large and established competitors also
limits the rating.
Working Capital Requirements Impediment to Growth: Trades originated through Caegro’s
barter system grew to 46% of revenue during 2011 from 40% in 2010, as a result of fully
deploying the proceeds from the notes issued in October 2010. The amount of spot trades the
company was able to originate within the limits of its working capital was not sufficient to
maintain the same growth pace. Unlike trades through the barter system, spot market trades
require working capital for shorter periods of time and have lower profit margins.
Asset Light Model: Net of short-term assets, Ceagro has a minimal amount of balance sheet
assets. It depends on rentals for transportation and storage. While this has not been a problem
in the past, the cost of renting equipment may rise in the future and compress operating
margins. The company’s debt has very little tangible support, which hurts recovery prospects.
Fitch notes positively, however, that short-term assets are very liquid and of high quality.
What Could Trigger a Rating Action
Key Rating Drivers: Deterioration in Ceagro’s liquidity, or an increase in the company’s
leverage range of 3.0x–5.0x during the cycle could lead to a negative rating action. Leverage
could increase either by weakening profitability, the launch of a large debt-financed investment
program or sudden drop in trading volumes. Changes in its risk management, resulting in a
higher exposure to commodity prices and exchange rate volatility, would also be viewed
negatively. Conversely, a demonstrated ability to maintain margins in the 8%–10% level and an
increase in trading volumes without disproportionately increasing leverage could result in a
positive rating action.
Ratings Foreign Currency Long-Term IDR B Senior Unsecured B Secured B Local Currency Long-Term IDR B
National Long-Term Rating BBB
Rating Outlooks Foreign Currency Long-Term IDR Stable Local Currency Long-Term IDR Stable National Long-Term Rating Stable
Financial Data
Ceagro Agricola Ltda.
(BRL Mil.) LTM
6/30/12 12/31/11
Revenue 1,050 969 Operating EBITDAR 99 94 Operating EBITDAR/ Revenues (%) 9.3 10.0 Cash Flow from Operations 1 (91) Free Cash Flow (3) (101) FFO Interest Coverage (x) 5.5 5.3 Total Debt 295 290 Total Adjusted Debt/Operating EBITDAR (x) 3.0 3.1 FFO Adjusted Leverage (x) 1.6 1.7
Analysts Viktoria Krane +1 212 908-0367 [email protected]
Gisele Paolino +55 21 4503-2624 [email protected]
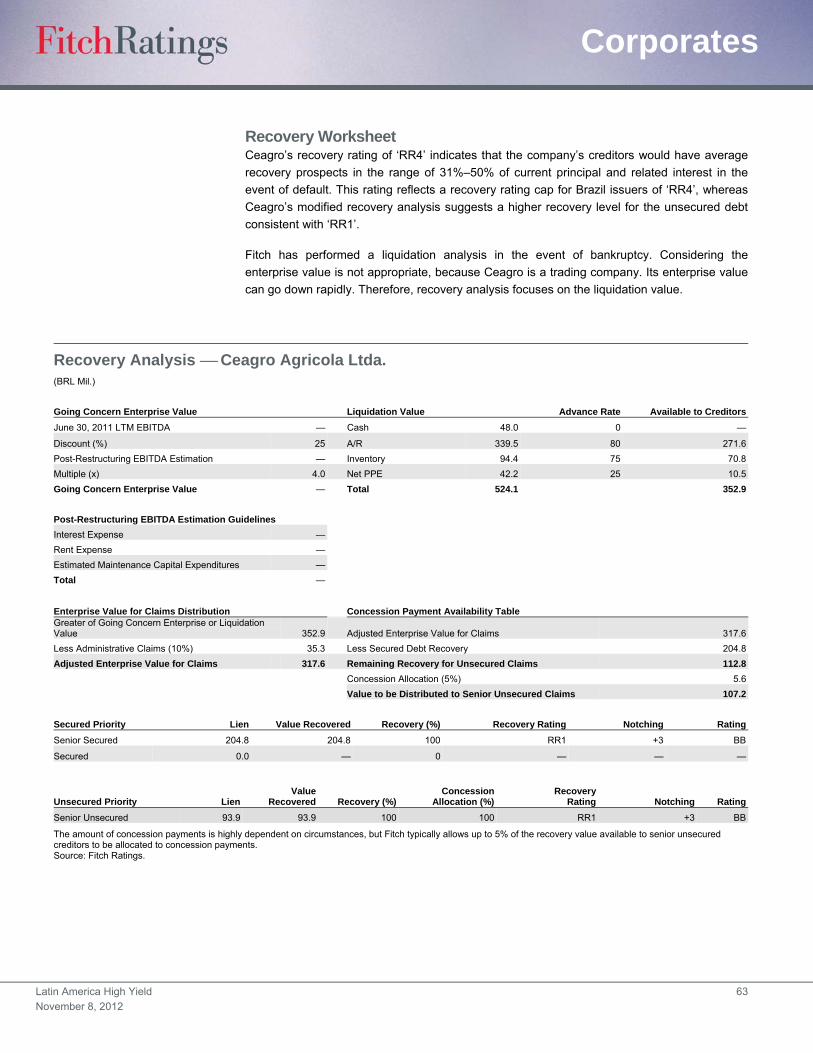
Latin America High Yield 63
November 8, 2012
Corporates
Recovery Worksheet Ceagro’s recovery rating of ‘RR4’ indicates that the company’s creditors would have average
recovery prospects in the range of 31%–50% of current principal and related interest in the
event of default. This rating reflects a recovery rating cap for Brazil issuers of ‘RR4’, whereas
Ceagro’s modified recovery analysis suggests a higher recovery level for the unsecured debt
consistent with ‘RR1’.
Fitch has performed a liquidation analysis in the event of bankruptcy. Considering the
enterprise value is not appropriate, because Ceagro is a trading company. Its enterprise value
can go down rapidly. Therefore, recovery analysis focuses on the liquidation value.
Recovery Analysis Ceagro Agricola Ltda. (BRL Mil.)
Going Concern Enterprise Value Liquidation Value Advance Rate Available to Creditors
June 30, 2011 LTM EBITDA — Cash 48.0 0 —
Discount (%) 25 A/R 339.5 80 271.6
Post-Restructuring EBITDA Estimation — Inventory 94.4 75 70.8
Multiple (x) 4.0 Net PPE 42.2 25 10.5
Going Concern Enterprise Value — Total 524.1 352.9
Post-Restructuring EBITDA Estimation Guidelines
Interest Expense —
Rent Expense —
Estimated Maintenance Capital Expenditures —
Total —
Enterprise Value for Claims Distribution Concession Payment Availability Table Greater of Going Concern Enterprise or Liquidation Value 352.9 Adjusted Enterprise Value for Claims 317.6
Less Administrative Claims (10%) 35.3 Less Secured Debt Recovery 204.8
Adjusted Enterprise Value for Claims 317.6 Remaining Recovery for Unsecured Claims 112.8
Concession Allocation (5%) 5.6
Value to be Distributed to Senior Unsecured Claims 107.2
Secured Priority Lien Value Recovered Recovery (%) Recovery Rating Notching Rating
Senior Secured 204.8 204.8 100 RR1 +3 BB
Secured 0.0 — 0 — — —
Unsecured Priority Lien Value
Recovered Recovery (%)Concession
Allocation (%)Recovery
Rating Notching Rating
Senior Unsecured 93.9 93.9 100 100 RR1 +3 BB
The amount of concession payments is highly dependent on circumstances, but Fitch typically allows up to 5% of the recovery value available to senior unsecured creditors to be allocated to concession payments. Source: Fitch Ratings.
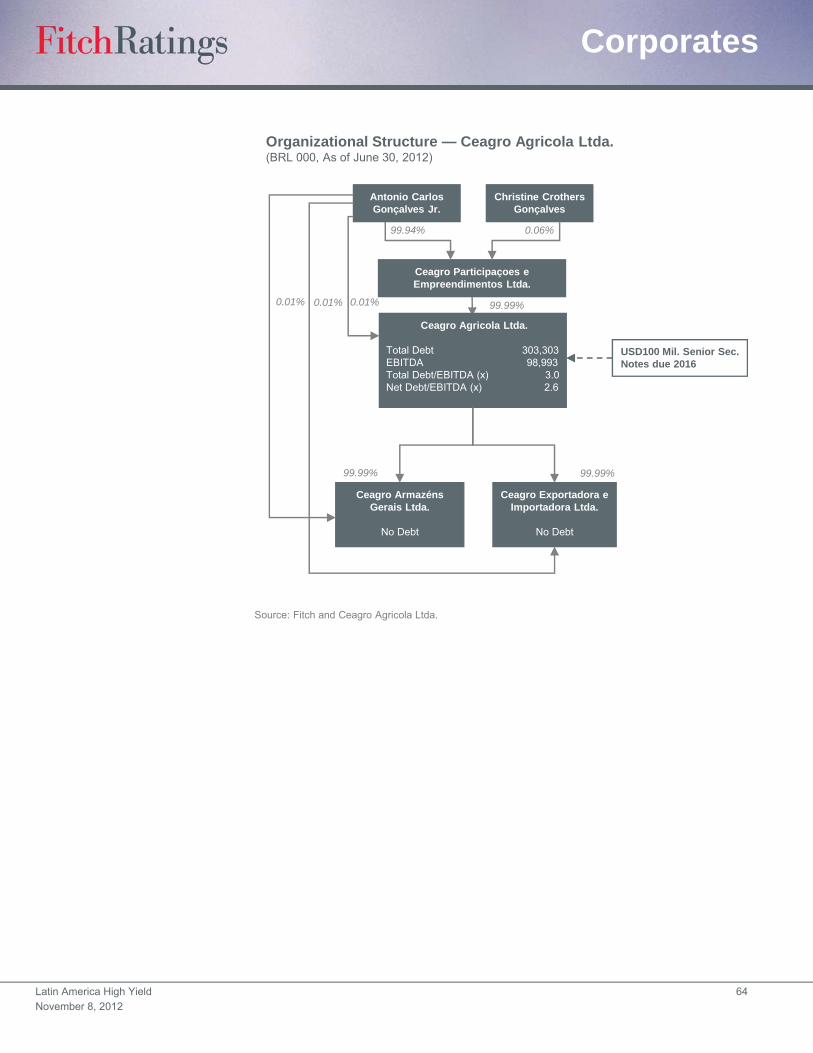
Latin America High Yield 64
November 8, 2012
Corporates
Organizational Structure — Ceagro Agricola Ltda.(BRL 000, As of June 30, 2012)
Ceagro Participaçoes e Empreendimentos Ltda.
Source: Fitch and Ceagro Agricola Ltda.
Christine Crothers Gonçalves
Ceagro Agricola Ltda.
Total Debt 303,303EBITDA 98,993Total Debt/EBITDA (x) 3.0Net Debt/EBITDA (x) 2.6
Ceagro Exportadora e Importadora Ltda.
No Debt
Ceagro ArmazénsGerais Ltda.
No Debt
Antonio Carlos Gonçalves Jr.
99.99%99.99%
99.99%
99.94% 0.06%
0.01%0.01% 0.01%
USD100 Mil. Senior Sec.Notes due 2016
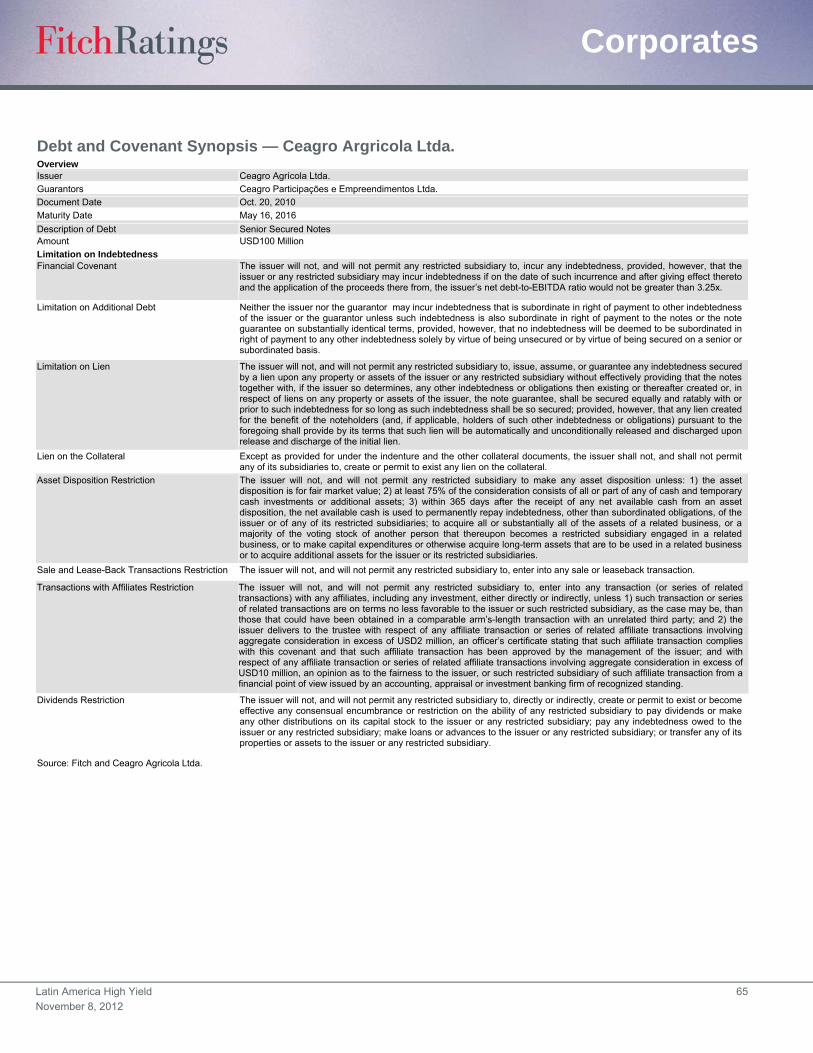
Latin America High Yield 65
November 8, 2012
Corporates
Debt and Covenant Synopsis — Ceagro Argricola Ltda. Overview Issuer Ceagro Agrícola Ltda.
Guarantors Ceagro Participações e Empreendimentos Ltda.
Document Date Oct. 20, 2010
Maturity Date May 16, 2016
Description of Debt Senior Secured Notes Amount USD100 Million
Limitation on Indebtedness Financial Covenant The issuer will not, and will not permit any restricted subsidiary to, incur any indebtedness, provided, however, that the
issuer or any restricted subsidiary may incur indebtedness if on the date of such incurrence and after giving effect thereto and the application of the proceeds there from, the issuer’s net debt-to-EBITDA ratio would not be greater than 3.25x.
Limitation on Additional Debt Neither the issuer nor the guarantor may incur indebtedness that is subordinate in right of payment to other indebtedness of the issuer or the guarantor unless such indebtedness is also subordinate in right of payment to the notes or the note guarantee on substantially identical terms, provided, however, that no indebtedness will be deemed to be subordinated in right of payment to any other indebtedness solely by virtue of being unsecured or by virtue of being secured on a senior or subordinated basis.
Limitation on Lien The issuer will not, and will not permit any restricted subsidiary to, issue, assume, or guarantee any indebtedness secured by a lien upon any property or assets of the issuer or any restricted subsidiary without effectively providing that the notes together with, if the issuer so determines, any other indebtedness or obligations then existing or thereafter created or, in respect of liens on any property or assets of the issuer, the note guarantee, shall be secured equally and ratably with or prior to such indebtedness for so long as such indebtedness shall be so secured; provided, however, that any lien created for the benefit of the noteholders (and, if applicable, holders of such other indebtedness or obligations) pursuant to the foregoing shall provide by its terms that such lien will be automatically and unconditionally released and discharged upon release and discharge of the initial lien.
Lien on the Collateral Except as provided for under the indenture and the other collateral documents, the issuer shall not, and shall not permit any of its subsidiaries to, create or permit to exist any lien on the collateral.
Asset Disposition Restriction The issuer will not, and will not permit any restricted subsidiary to make any asset disposition unless: 1) the asset disposition is for fair market value; 2) at least 75% of the consideration consists of all or part of any of cash and temporary cash investments or additional assets; 3) within 365 days after the receipt of any net available cash from an asset disposition, the net available cash is used to permanently repay indebtedness, other than subordinated obligations, of the issuer or of any of its restricted subsidiaries; to acquire all or substantially all of the assets of a related business, or a majority of the voting stock of another person that thereupon becomes a restricted subsidiary engaged in a related business, or to make capital expenditures or otherwise acquire long-term assets that are to be used in a related business or to acquire additional assets for the issuer or its restricted subsidiaries.
Sale and Lease-Back Transactions Restriction The issuer will not, and will not permit any restricted subsidiary to, enter into any sale or leaseback transaction.
Transactions with Affiliates Restriction The issuer will not, and will not permit any restricted subsidiary to, enter into any transaction (or series of related transactions) with any affiliates, including any investment, either directly or indirectly, unless 1) such transaction or series of related transactions are on terms no less favorable to the issuer or such restricted subsidiary, as the case may be, than those that could have been obtained in a comparable arm’s-length transaction with an unrelated third party; and 2) the issuer delivers to the trustee with respect of any affiliate transaction or series of related affiliate transactions involving aggregate consideration in excess of USD2 million, an officer’s certificate stating that such affiliate transaction complies with this covenant and that such affiliate transaction has been approved by the management of the issuer; and with respect of any affiliate transaction or series of related affiliate transactions involving aggregate consideration in excess of USD10 million, an opinion as to the fairness to the issuer, or such restricted subsidiary of such affiliate transaction from a financial point of view issued by an accounting, appraisal or investment banking firm of recognized standing.
Dividends Restriction The issuer will not, and will not permit any restricted subsidiary to, directly or indirectly, create or permit to exist or become effective any consensual encumbrance or restriction on the ability of any restricted subsidiary to pay dividends or make any other distributions on its capital stock to the issuer or any restricted subsidiary; pay any indebtedness owed to the issuer or any restricted subsidiary; make loans or advances to the issuer or any restricted subsidiary; or transfer any of its properties or assets to the issuer or any restricted subsidiary.
Source: Fitch and Ceagro Agricola Ltda.

Latin America High Yield 66
November 8, 2012
Corporates
Financial Summary — Ceagro Agricola Ltda.
(BRL 000, Years Ended as of Dec. 31) LTM 6/30/12 2011 2010 2009 2008
Profitability Operating EBITDA 98,993 93,794 98,397 33,757 21,075
Operating EBITDAR 98,993 93,794 100,877 35,932 22,723
Operating EBITDA Margin 9.34 9.68 11.99 4.69 3.19
Operating EBITDAR Margin 9.34 9.68 12.29 4.99 3.44
FFO Return on Adjusted Capital (%) 36.37 34.89 19.94 8.67 26.44
Free Cash Flow Margin (%) — (10.00) 0.64 (3.00) (1.00)
Return on Average Equity (%) 7.58 17.78 47.67 36.15 31.79
Coverage (x)
FFO Interest Coverage 5.47 5.32 3.82 4.22 9.79
Operating EBITDA/Interest Expense 2.88 2.94 4.87 13.85 9.29
Operating EBITDAR/Interest Expense + Rents 2.88 2.94 4.45 7.79 5.8
Operating EBITDA/Debt Service Coverage 1.03 0.99 2.75 1.71 3.88
Operating EBITDAR/Debt Service Coverage 1.03 0.99 2.64 1.64 3.21
FFO Fixed-Charge Coverage 5.47 5.32 3.51 2.7 6.09
FCF Debt Service Coverage 0.32 (1.00) 0.71 (1.00) (1.00)
(FCF + Cash and Marketable Securities)/Debt Service Coverage 0.82 0.11 6.36 (1.00) (1.00)
Cash Flow from Operations/Capital Expenditures 0.28 (9.00) 2.95 (30.00) (7.00)
Capital Structure and Leverage (x)
FFO Adjusted Leverage 1.60 1.71 2.94 5.68 1.66
Total Debt with Equity Credit/Operating EBITDA 3.04 3.10 2.25 1.78 1.49
Total Net Debt with Equity Credit/Operating EBITDA 2.56 2.25 0.20 1.59 1.34
Total Adjusted Debt/Operating EBITDAR 3.04 3.10 2.32 1.97 1.74
Total Adjusted Net Debt/Operating EBITDAR 2.56 2.25 0.32 1.80 1.61
Implied Cost of Funds (%) 13.45 12.49 14.35 5.34 11.01
Secured Debt/Total Debt — — — — —
Short-Term Debt/Total Debt 0.21 0.22 0.07 0.29 0.10
Balance Sheet
Total Assets 745,738 499,960 404,693 138,635 84,325
Cash and Marketable Securities 48,040 79,769 201,857 6,213 3,097
Short-Term Debt 61,964 62,640 15,550 17,339 3,157
Long-Term Debt 239,339 227,808 205,910 42,607 28,212
Total Debt 301,303 290,448 221,460 59,946 31,369
Equity Credit — — — — —
Total Debt with Equity Credit 301,303 290,448 221,460 59,946 31,369
Off-Balance Sheet Debt — — 12,400 10,875 8,240
Total Adjusted Debt with Equity Credit 301,303 290,448 233,860 70,821 39,609
Total Equity 215,291 197,094 164,911 72,999 50,651
Total Adjusted Capital 516,594 487,542 398,771 143,820 90,260
Cash Flow
Funds from Operations 153,543 138,157 56,856 7,857 19,946
Change in Operating Working Capital (152,233) (229,642) (48,868) (30,105) (27,997)
Cash Flow from Operations 1,310 (91,485) 7,988 (22,248) (8,051)
Total Non-Operating/Nonrecurring Cash Flow — — — — —
Capital Expenditures (4,744) (9,937) (2,704) (751) (1,096)
Dividends — — — — —
Free Cash Flow (3,434) (101,422) 5,284 (22,999) (9,147)
Net Acquisitions and Divestitures 234 234 — (27) (14,511)
Other Investments, Net 30 — — — —
Net Debt Proceeds (34,721) (20,900) 160,359 26,142 19,491
Net Equity Proceeds — — 30,001 — —
Other Financing, Net — — — — —
Total Change in Cash (37,891) (122,088) 195,644 3,116 (4,167)
Income Statement
Net Revenues 1,059,799 969,080 820,801 719,820 661,412
Revenue Growth (%) 9.33 18.07 14.03 8.83 73.53
Operating EBIT 98,282 93,277 98,090 33,668 20,739
Gross Interest Expense 34,344 31,957 20,192 2,437 2,269
Rental Expense — — 2,480 2,175 1,648
Net Income 15,713 32,183 56,711 22,349
Source: Company reports and Fitch estimates.
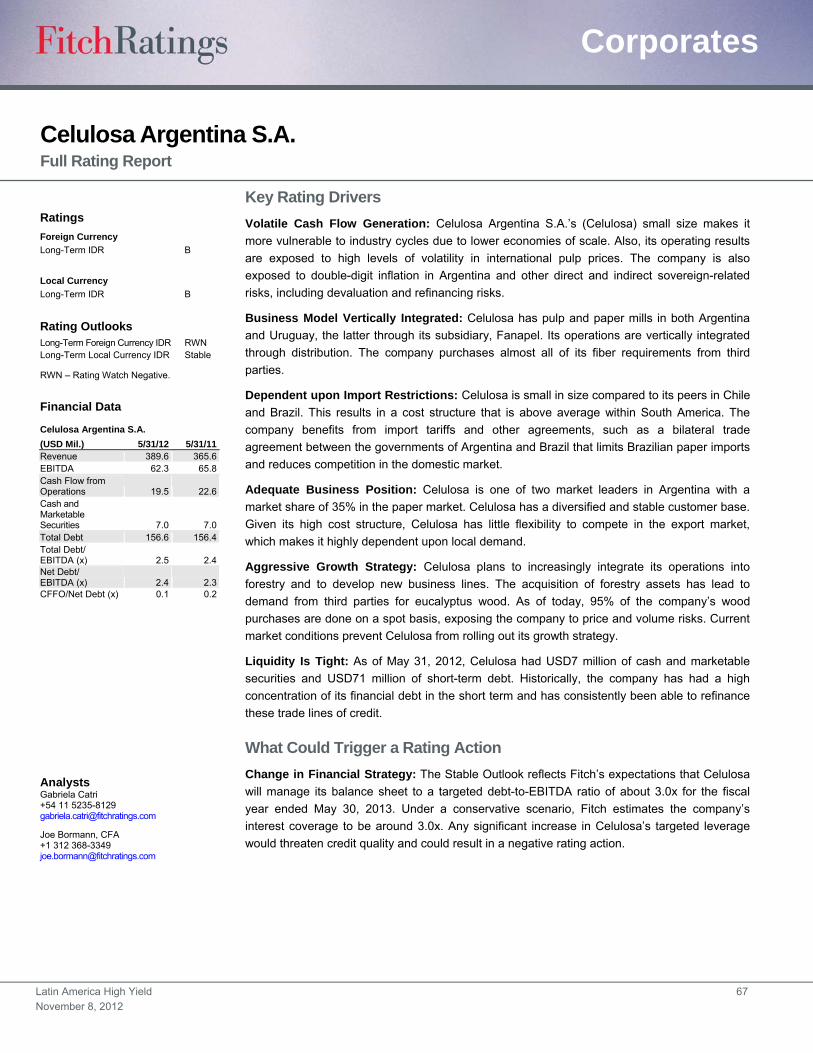
Latin America High Yield 67
November 8, 2012
Corporates
Celulosa Argentina S.A. Full Rating Report
Key Rating Drivers
Volatile Cash Flow Generation: Celulosa Argentina S.A.’s (Celulosa) small size makes it
more vulnerable to industry cycles due to lower economies of scale. Also, its operating results
are exposed to high levels of volatility in international pulp prices. The company is also
exposed to double-digit inflation in Argentina and other direct and indirect sovereign-related
risks, including devaluation and refinancing risks.
Business Model Vertically Integrated: Celulosa has pulp and paper mills in both Argentina
and Uruguay, the latter through its subsidiary, Fanapel. Its operations are vertically integrated
through distribution. The company purchases almost all of its fiber requirements from third
parties.
Dependent upon Import Restrictions: Celulosa is small in size compared to its peers in Chile
and Brazil. This results in a cost structure that is above average within South America. The
company benefits from import tariffs and other agreements, such as a bilateral trade
agreement between the governments of Argentina and Brazil that limits Brazilian paper imports
and reduces competition in the domestic market.
Adequate Business Position: Celulosa is one of two market leaders in Argentina with a
market share of 35% in the paper market. Celulosa has a diversified and stable customer base.
Given its high cost structure, Celulosa has little flexibility to compete in the export market,
which makes it highly dependent upon local demand.
Aggressive Growth Strategy: Celulosa plans to increasingly integrate its operations into
forestry and to develop new business lines. The acquisition of forestry assets has lead to
demand from third parties for eucalyptus wood. As of today, 95% of the company’s wood
purchases are done on a spot basis, exposing the company to price and volume risks. Current
market conditions prevent Celulosa from rolling out its growth strategy.
Liquidity Is Tight: As of May 31, 2012, Celulosa had USD7 million of cash and marketable
securities and USD71 million of short-term debt. Historically, the company has had a high
concentration of its financial debt in the short term and has consistently been able to refinance
these trade lines of credit.
What Could Trigger a Rating Action
Change in Financial Strategy: The Stable Outlook reflects Fitch’s expectations that Celulosa
will manage its balance sheet to a targeted debt-to-EBITDA ratio of about 3.0x for the fiscal
year ended May 30, 2013. Under a conservative scenario, Fitch estimates the company’s
interest coverage to be around 3.0x. Any significant increase in Celulosa’s targeted leverage
would threaten credit quality and could result in a negative rating action.
Ratings
Foreign Currency
Long-Term IDR B
Local Currency
Long-Term IDR B
Rating Outlooks Long-Term Foreign Currency IDR RWN Long-Term Local Currency IDR Stable
RWN – Rating Watch Negative.
Financial Data
Celulosa Argentina S.A.
(USD Mil.) 5/31/12 5/31/11 Revenue 389.6 365.6 EBITDA 62.3 65.8 Cash Flow from Operations 19.5 22.6 Cash and Marketable Securities 7.0 7.0 Total Debt 156.6 156.4 Total Debt/ EBITDA (x) 2.5 2.4 Net Debt/ EBITDA (x) 2.4 2.3 CFFO/Net Debt (x) 0.1 0.2
Analysts Gabriela Catri +54 11 5235-8129 [email protected]
Joe Bormann, CFA +1 312 368-3349 [email protected]
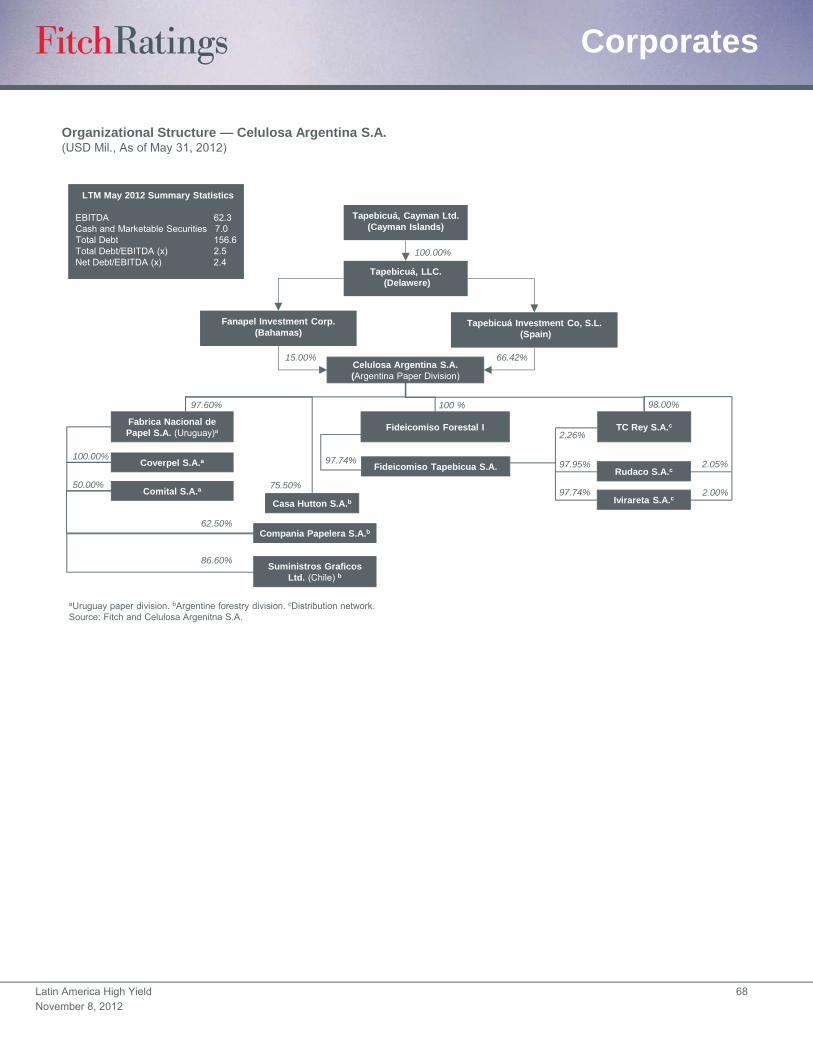
Latin America High Yield 68
November 8, 2012
Corporates
Organizational Structure — Celulosa Argentina S.A.(USD Mil., As of May 31, 2012)
aUruguay paper division. bArgentine forestry division. cDistribution network. Source: Fitch and Celulosa Argenitna S.A.
Celulosa Argentina S.A.(Argentina Paper Division)
98.00%
LTM May 2012 Summary Statistics
EBITDA 62.3Cash and Marketable Securities 7.0Total Debt 156.6Total Debt/EBITDA (x) 2.5Net Debt/EBITDA (x) 2.4
Fabrica Nacional de Papel S.A. (Uruguay)a
Casa Hutton S.A.b
Fideicomiso Forestal I
Fideicomiso Tapebicua S.A.
TC Rey S.A.c
2.05%
2.00%
2.26%
97.95%
97.74%
97.74%
75.50%
97.60%
50.00%
62.50%
86.60%
Coverpel S.A.a
Suministros Graficos Ltd. (Chile) b
Comital S.A.a
Compania Papelera S.A.b
100.00%
Rudaco S.A.c
Ivirareta S.A.c
100.00%
Tapebicuá, Cayman Ltd. (Cayman Islands)
Tapebicuá, LLC. (Delawere)
Tapebicuá Investment Co, S.L.(Spain)
Fanapel Investment Corp. (Bahamas)
66.42%15.00%
100 %
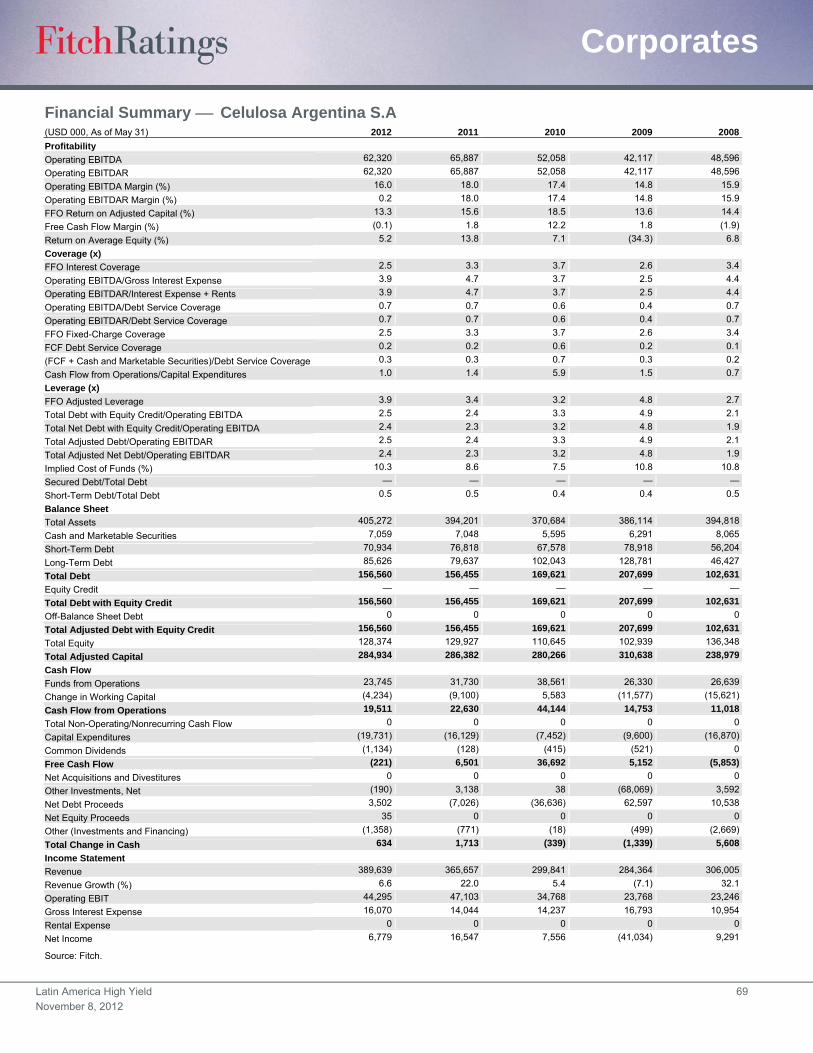
Latin America High Yield 69
November 8, 2012
Corporates
Financial Summary Celulosa Argentina S.A (USD 000, As of May 31) 2012 2011 2010 2009 2008
Profitability
Operating EBITDA 62,320 65,887 52,058 42,117 48,596
Operating EBITDAR 62,320 65,887 52,058 42,117 48,596
Operating EBITDA Margin (%) 16.0 18.0 17.4 14.8 15.9
Operating EBITDAR Margin (%) 0.2 18.0 17.4 14.8 15.9
FFO Return on Adjusted Capital (%) 13.3 15.6 18.5 13.6 14.4
Free Cash Flow Margin (%) (0.1) 1.8 12.2 1.8 (1.9)
Return on Average Equity (%) 5.2 13.8 7.1 (34.3) 6.8
Coverage (x)
FFO Interest Coverage 2.5 3.3 3.7 2.6 3.4
Operating EBITDA/Gross Interest Expense 3.9 4.7 3.7 2.5 4.4
Operating EBITDAR/Interest Expense + Rents 3.9 4.7 3.7 2.5 4.4
Operating EBITDA/Debt Service Coverage 0.7 0.7 0.6 0.4 0.7
Operating EBITDAR/Debt Service Coverage 0.7 0.7 0.6 0.4 0.7
FFO Fixed-Charge Coverage 2.5 3.3 3.7 2.6 3.4
FCF Debt Service Coverage 0.2 0.2 0.6 0.2 0.1
(FCF + Cash and Marketable Securities)/Debt Service Coverage 0.3 0.3 0.7 0.3 0.2
Cash Flow from Operations/Capital Expenditures 1.0 1.4 5.9 1.5 0.7
Leverage (x)
FFO Adjusted Leverage 3.9 3.4 3.2 4.8 2.7
Total Debt with Equity Credit/Operating EBITDA 2.5 2.4 3.3 4.9 2.1
Total Net Debt with Equity Credit/Operating EBITDA 2.4 2.3 3.2 4.8 1.9
Total Adjusted Debt/Operating EBITDAR 2.5 2.4 3.3 4.9 2.1
Total Adjusted Net Debt/Operating EBITDAR 2.4 2.3 3.2 4.8 1.9
Implied Cost of Funds (%) 10.3 8.6 7.5 10.8 10.8
Secured Debt/Total Debt — — — — —
Short-Term Debt/Total Debt 0.5 0.5 0.4 0.4 0.5
Balance Sheet
Total Assets 405,272 394,201 370,684 386,114 394,818
Cash and Marketable Securities 7,059 7,048 5,595 6,291 8,065
Short-Term Debt 70,934 76,818 67,578 78,918 56,204
Long-Term Debt 85,626 79,637 102,043 128,781 46,427
Total Debt 156,560 156,455 169,621 207,699 102,631
Equity Credit — — — — —
Total Debt with Equity Credit 156,560 156,455 169,621 207,699 102,631
Off-Balance Sheet Debt 0 0 0 0 0
Total Adjusted Debt with Equity Credit 156,560 156,455 169,621 207,699 102,631
Total Equity 128,374 129,927 110,645 102,939 136,348
Total Adjusted Capital 284,934 286,382 280,266 310,638 238,979
Cash Flow
Funds from Operations 23,745 31,730 38,561 26,330 26,639
Change in Working Capital (4,234) (9,100) 5,583 (11,577) (15,621)
Cash Flow from Operations 19,511 22,630 44,144 14,753 11,018
Total Non-Operating/Nonrecurring Cash Flow 0 0 0 0 0
Capital Expenditures (19,731) (16,129) (7,452) (9,600) (16,870)
Common Dividends (1,134) (128) (415) (521) 0
Free Cash Flow (221) 6,501 36,692 5,152 (5,853)
Net Acquisitions and Divestitures 0 0 0 0 0
Other Investments, Net (190) 3,138 38 (68,069) 3,592
Net Debt Proceeds 3,502 (7,026) (36,636) 62,597 10,538
Net Equity Proceeds 35 0 0 0 0
Other (Investments and Financing) (1,358) (771) (18) (499) (2,669)
Total Change in Cash 634 1,713 (339) (1,339) 5,608
Income Statement
Revenue 389,639 365,657 299,841 284,364 306,005
Revenue Growth (%) 6.6 22.0 5.4 (7.1) 32.1
Operating EBIT 44,295 47,103 34,768 23,768 23,246
Gross Interest Expense 16,070 14,044 14,237 16,793 10,954
Rental Expense 0 0 0 0 0
Net Income 6,779 16,547 7,556 (41,034) 9,291
Source: Fitch.
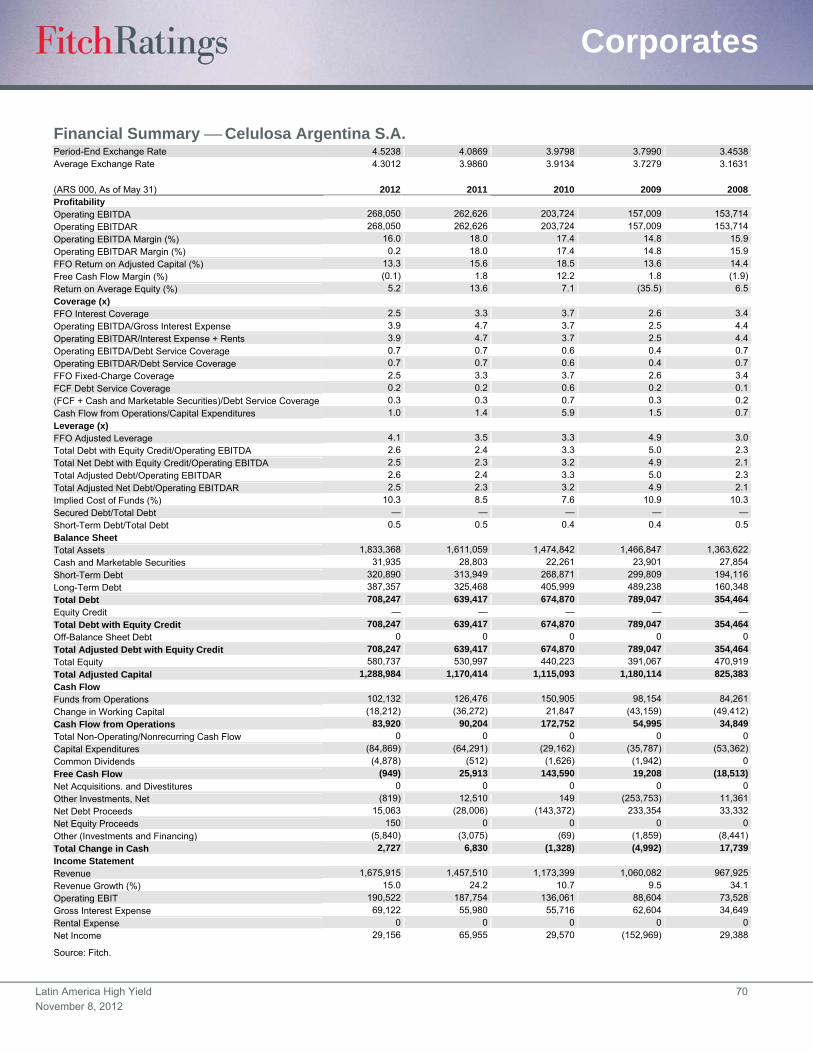
Latin America High Yield 70
November 8, 2012
Corporates
Financial Summary Celulosa Argentina S.A. Period-End Exchange Rate 4.5238 4.0869 3.9798 3.7990 3.4538Average Exchange Rate 4.3012 3.9860 3.9134 3.7279 3.1631
(ARS 000, As of May 31) 2012 2011 2010 2009 2008Profitability Operating EBITDA 268,050 262,626 203,724 157,009 153,714
Operating EBITDAR 268,050 262,626 203,724 157,009 153,714
Operating EBITDA Margin (%) 16.0 18.0 17.4 14.8 15.9
Operating EBITDAR Margin (%) 0.2 18.0 17.4 14.8 15.9
FFO Return on Adjusted Capital (%) 13.3 15.6 18.5 13.6 14.4
Free Cash Flow Margin (%) (0.1) 1.8 12.2 1.8 (1.9)
Return on Average Equity (%) 5.2 13.6 7.1 (35.5) 6.5
Coverage (x)
FFO Interest Coverage 2.5 3.3 3.7 2.6 3.4
Operating EBITDA/Gross Interest Expense 3.9 4.7 3.7 2.5 4.4
Operating EBITDAR/Interest Expense + Rents 3.9 4.7 3.7 2.5 4.4
Operating EBITDA/Debt Service Coverage 0.7 0.7 0.6 0.4 0.7
Operating EBITDAR/Debt Service Coverage 0.7 0.7 0.6 0.4 0.7
FFO Fixed-Charge Coverage 2.5 3.3 3.7 2.6 3.4
FCF Debt Service Coverage 0.2 0.2 0.6 0.2 0.1
(FCF + Cash and Marketable Securities)/Debt Service Coverage 0.3 0.3 0.7 0.3 0.2
Cash Flow from Operations/Capital Expenditures 1.0 1.4 5.9 1.5 0.7
Leverage (x)
FFO Adjusted Leverage 4.1 3.5 3.3 4.9 3.0
Total Debt with Equity Credit/Operating EBITDA 2.6 2.4 3.3 5.0 2.3
Total Net Debt with Equity Credit/Operating EBITDA 2.5 2.3 3.2 4.9 2.1
Total Adjusted Debt/Operating EBITDAR 2.6 2.4 3.3 5.0 2.3
Total Adjusted Net Debt/Operating EBITDAR 2.5 2.3 3.2 4.9 2.1
Implied Cost of Funds (%) 10.3 8.5 7.6 10.9 10.3
Secured Debt/Total Debt — — — — —
Short-Term Debt/Total Debt 0.5 0.5 0.4 0.4 0.5
Balance Sheet
Total Assets 1,833,368 1,611,059 1,474,842 1,466,847 1,363,622
Cash and Marketable Securities 31,935 28,803 22,261 23,901 27,854
Short-Term Debt 320,890 313,949 268,871 299,809 194,116
Long-Term Debt 387,357 325,468 405,999 489,238 160,348
Total Debt 708,247 639,417 674,870 789,047 354,464
Equity Credit — — — — —
Total Debt with Equity Credit 708,247 639,417 674,870 789,047 354,464
Off-Balance Sheet Debt 0 0 0 0 0
Total Adjusted Debt with Equity Credit 708,247 639,417 674,870 789,047 354,464
Total Equity 580,737 530,997 440,223 391,067 470,919
Total Adjusted Capital 1,288,984 1,170,414 1,115,093 1,180,114 825,383
Cash Flow
Funds from Operations 102,132 126,476 150,905 98,154 84,261
Change in Working Capital (18,212) (36,272) 21,847 (43,159) (49,412)
Cash Flow from Operations 83,920 90,204 172,752 54,995 34,849
Total Non-Operating/Nonrecurring Cash Flow 0 0 0 0 0
Capital Expenditures (84,869) (64,291) (29,162) (35,787) (53,362)
Common Dividends (4,878) (512) (1,626) (1,942) 0
Free Cash Flow (949) 25,913 143,590 19,208 (18,513)
Net Acquisitions. and Divestitures 0 0 0 0 0
Other Investments, Net (819) 12,510 149 (253,753) 11,361
Net Debt Proceeds 15,063 (28,006) (143,372) 233,354 33,332
Net Equity Proceeds 150 0 0 0 0
Other (Investments and Financing) (5,840) (3,075) (69) (1,859) (8,441)
Total Change in Cash 2,727 6,830 (1,328) (4,992) 17,739
Income Statement
Revenue 1,675,915 1,457,510 1,173,399 1,060,082 967,925
Revenue Growth (%) 15.0 24.2 10.7 9.5 34.1
Operating EBIT 190,522 187,754 136,061 88,604 73,528
Gross Interest Expense 69,122 55,980 55,716 62,604 34,649
Rental Expense 0 0 0 0 0
Net Income 29,156 65,955 29,570 (152,969) 29,388
Source: Fitch.
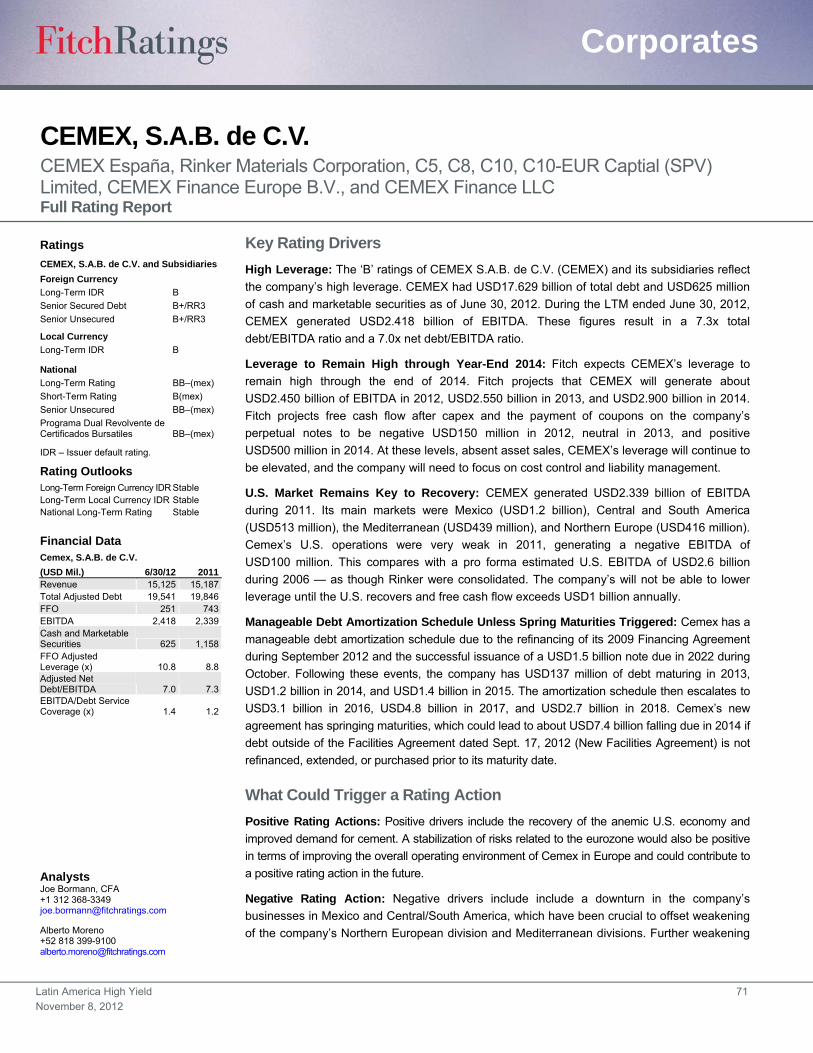
Latin America High Yield 71
November 8, 2012
Corporates
CEMEX, S.A.B. de C.V. CEMEX España, Rinker Materials Corporation, C5, C8, C10, C10-EUR Captial (SPV) Limited, CEMEX Finance Europe B.V., and CEMEX Finance LLC Full Rating Report
Key Rating Drivers
High Leverage: The ‘B’ ratings of CEMEX S.A.B. de C.V. (CEMEX) and its subsidiaries reflect
the company’s high leverage. CEMEX had USD17.629 billion of total debt and USD625 million
of cash and marketable securities as of June 30, 2012. During the LTM ended June 30, 2012,
CEMEX generated USD2.418 billion of EBITDA. These figures result in a 7.3x total
debt/EBITDA ratio and a 7.0x net debt/EBITDA ratio.
Leverage to Remain High through Year-End 2014: Fitch expects CEMEX’s leverage to
remain high through the end of 2014. Fitch projects that CEMEX will generate about
USD2.450 billion of EBITDA in 2012, USD2.550 billion in 2013, and USD2.900 billion in 2014.
Fitch projects free cash flow after capex and the payment of coupons on the company’s
perpetual notes to be negative USD150 million in 2012, neutral in 2013, and positive
USD500 million in 2014. At these levels, absent asset sales, CEMEX’s leverage will continue to
be elevated, and the company will need to focus on cost control and liability management.
U.S. Market Remains Key to Recovery: CEMEX generated USD2.339 billion of EBITDA
during 2011. Its main markets were Mexico (USD1.2 billion), Central and South America
(USD513 million), the Mediterranean (USD439 million), and Northern Europe (USD416 million).
Cemex’s U.S. operations were very weak in 2011, generating a negative EBITDA of
USD100 million. This compares with a pro forma estimated U.S. EBITDA of USD2.6 billion
during 2006 — as though Rinker were consolidated. The company’s will not be able to lower
leverage until the U.S. recovers and free cash flow exceeds USD1 billion annually.
Manageable Debt Amortization Schedule Unless Spring Maturities Triggered: Cemex has a
manageable debt amortization schedule due to the refinancing of its 2009 Financing Agreement
during September 2012 and the successful issuance of a USD1.5 billion note due in 2022 during
October. Following these events, the company has USD137 million of debt maturing in 2013,
USD1.2 billion in 2014, and USD1.4 billion in 2015. The amortization schedule then escalates to
USD3.1 billion in 2016, USD4.8 billion in 2017, and USD2.7 billion in 2018. Cemex’s new
agreement has springing maturities, which could lead to about USD7.4 billion falling due in 2014 if
debt outside of the Facilities Agreement dated Sept. 17, 2012 (New Facilities Agreement) is not
refinanced, extended, or purchased prior to its maturity date.
What Could Trigger a Rating Action
Positive Rating Actions: Positive drivers include the recovery of the anemic U.S. economy and
improved demand for cement. A stabilization of risks related to the eurozone would also be positive
in terms of improving the overall operating environment of Cemex in Europe and could contribute to
a positive rating action in the future.
Negative Rating Action: Negative drivers include include a downturn in the company’s
businesses in Mexico and Central/South America, which have been crucial to offset weakening
of the company’s Northern European division and Mediterranean divisions. Further weakening
Ratings
CEMEX, S.A.B. de C.V. and Subsidiaries
Foreign Currency
Long-Term IDR B
Senior Secured Debt B+/RR3
Senior Unsecured B+/RR3
Local Currency
Long-Term IDR B
National
Long-Term Rating BB–(mex)
Short-Term Rating B(mex)
Senior Unsecured BB–(mex)
Programa Dual Revolvente de Certificados Bursatiles BB–(mex)
IDR – Issuer default rating.
Rating Outlooks Long-Term Foreign Currency IDR Stable Long-Term Local Currency IDR Stable National Long-Term Rating Stable
Financial Data Cemex, S.A.B. de C.V.
(USD Mil.) 6/30/12 2011 Revenue 15,125 15,187 Total Adjusted Debt 19,541 19,846 FFO 251 743 EBITDA 2,418 2,339 Cash and Marketable Securities 625 1,158 FFO Adjusted Leverage (x) 10.8 8.8 Adjusted Net Debt/EBITDA 7.0 7.3 EBITDA/Debt Service Coverage (x) 1.4 1.2
Analysts Joe Bormann, CFA +1 312 368-3349 [email protected] Alberto Moreno +52 818 399-9100 [email protected]
Latin America High Yield 72
November 8, 2012
Corporates
in Europe or the U.S. would also have a material impact upon cash flow and could lead to a
ratings downgrade.
Recovery Rating
CEMEX and its subsidiaries have issued debt instruments from Mexico, the U.S., the British
Virgin Islands, the Netherlands, and Spain. The guarantors of these instruments are also
domiciled in various countries. As a result of the complexity of the company’s capital structure
and the various legal jurisdictions, we do not envision a bankruptcy scenario for CEMEX in the
event of additional financial distress, as creditors would most likely not want to enter a process
with such a high degree of uncertainty regarding the outcome. Fitch’s opinion is that the most
likely scenario under additional stress would be a negotiated restructuring of the debt.
Consequently, a liquidation analysis was not performed.
In deriving a distressed enterprise valuation to determine the recovery under this scenario, we
discounted the company’s LTM EBITDA to USD2.0 billion, which is a level that would just cover
operating leases, interest expenses, and maintenance capital expenditures. A 20% decline in
EBITDA to this level would most likely be driven by a more marked deterioration of the
eurozone, which would send the U.S. into a double-dip recession, and have a negative impact
upon Cemex’s Mexican operations. Currently, the strong performance of CEMEX’s Central
America, South America, and Caribbean operations, and the gradual improvement of its U.S.
operations, have been able to offset the negative cash flow trajectory of its Mediterranean
operations, comprised mainly of Egypt and Spain, as well as its Northern European division.
We applied a 6x distressed EBITDA multiple. This is a conservative multiple. CEMEX sold its
business in Australia to Holcim during 2009 for a multiple of about 9x the estimated EBITDA
during 2009 of USD200 million or 8x the estimated 2008 EBITDA of USD265 million. The low
6.0x multiple reflects the high leverage within the industry, which would hamper a competitive
bidding process. It also reflects the fact that if Europe would deteriorate to the point that the
U.S. entered a double-dip recession, the core operations of some potential bidders would also
be hemorrhaging cash, limiting their ability to pursue the purchase of CEMEX or some of its
larger assets.
Regarding the specifics of the recovery analysis, the subordinated debt consists of the
subordinated convertible instruments. The priority bank debt consists of the bank debt CEMEX
has with Bancomex, which is secured by property, plant, and equipment. The Euro 2014 notes
have been included in the debt categorized as senior secured despite not having the security
package of the New Facilities Agreement. These notes were issued by Cemex Financed,
Europe B.V. and only have Cemex Espana as a guarantor. The treatment of them in this
manner reflects their relatively favorable position in the amortization schedule, which should
give them a degree of negotiating power in the event of a restructuring.
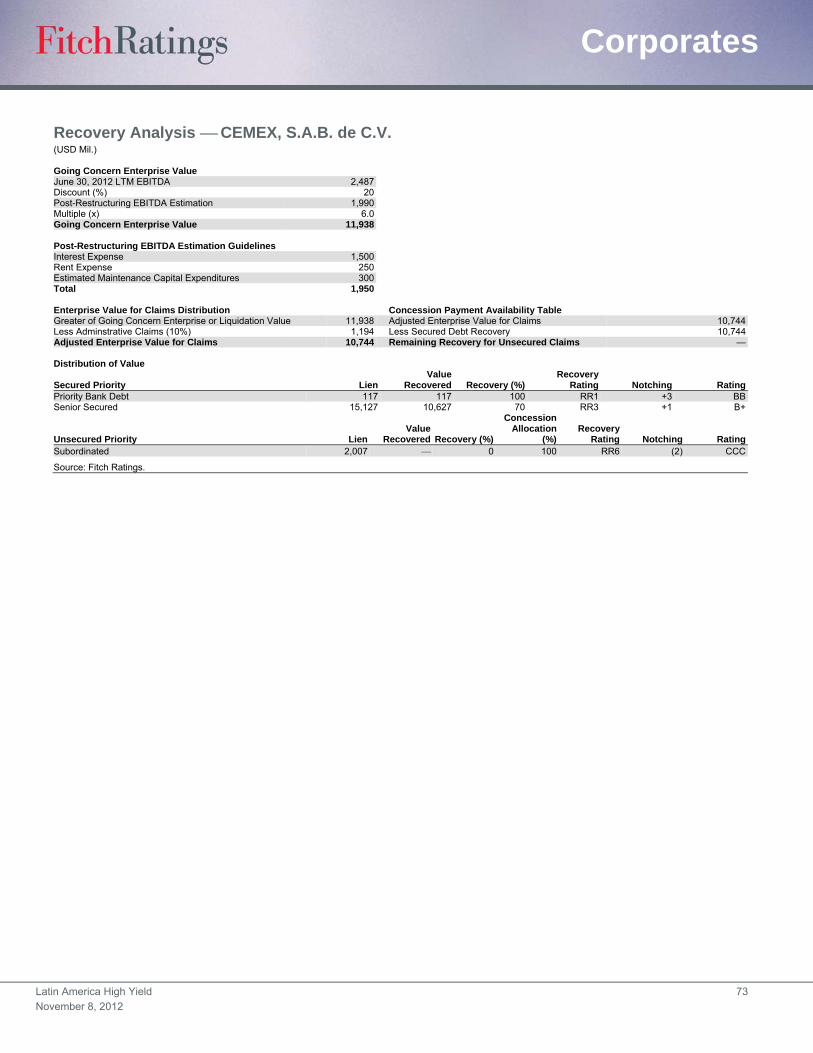
Latin America High Yield 73
November 8, 2012
Corporates
Recovery Analysis CEMEX, S.A.B. de C.V. (USD Mil.) Going Concern Enterprise Value June 30, 2012 LTM EBITDA 2,487Discount (%) 20Post-Restructuring EBITDA Estimation 1,990Multiple (x) 6.0Going Concern Enterprise Value 11,938 Post-Restructuring EBITDA Estimation Guidelines Interest Expense 1,500Rent Expense 250Estimated Maintenance Capital Expenditures 300Total 1,950
Enterprise Value for Claims Distribution Concession Payment Availability Table Greater of Going Concern Enterprise or Liquidation Value 11,938 Adjusted Enterprise Value for Claims 10,744Less Adminstrative Claims (10%) 1,194 Less Secured Debt Recovery 10,744Adjusted Enterprise Value for Claims 10,744 Remaining Recovery for Unsecured Claims —
Distribution of Value
Secured Priority LienValue
Recovered Recovery (%)Recovery
Rating Notching RatingPriority Bank Debt 117 117 100 RR1 +3 BBSenior Secured 15,127 10,627 70 RR3 +1 B+
Unsecured Priority LienValue
Recovered Recovery (%)
Concession Allocation
(%)Recovery
Rating Notching RatingSubordinated 2,007 0 100 RR6 (2) CCC
Source: Fitch Ratings.

Latin America High Yield 74
November 8, 2012
Corporates
Source: Fitch and CEMEX, S.A.B. de C.V. financial statements.
CEMEX España, S.A.(Spain) (issued through
Luxembourg branch)
CEMEX Finance LLC(USA)
100% 100%
$1,068 Sr. Secured Notes Due 2020
EUR115 Sr. Secured Notes Due 2017
$704 and EUR179 Sr Secured Notes due 2019
100%100%
$1,750 Sr. Secured Note Due 2016
EUR350 Sr. Secured Note Due 2017
CEMEX Inc.(USA)
CEMEX Corp(USA)
CEMEX Finance Europe B.V.
(The Netherlands)
EUR900 Unsecured Notes Due 2014
(EUR 430 Outstanding)
CEMEX Materials LLC(USA)
100%
100%
New Sunward Holding B.V.(Netherlands)
Centro Distribuidor de Cement, S.A. de C.V.
(Mexico)
CEMEX Mexico,S.A. de C.V.
(Mexico)
CEMEX, S.A.B. de C.V.(Mexico)
$41 Sr. Secured Certificados Bursátiles$800 Sr. Secured Floating Rate Notes Due 2015$1,650 Sr. Secured Notes Due 2018$715 Convertible Subordinated Notes Due 2015$978 Convertible Subordinated Notes Due 2016$690 Convertible Subordinated Notes Due 2018$500 Proposed Sr Secured Exchange Notes due 2018
100%
100%
100%
100%
Empresas Tolteca de Mexico, S.A. de C.V.(Mexico)100%
C-10, Perpetual, EUR730 Dual Currency Notes (EUR81 Outstanding)C-8, Perpetual, $750 Dual Currency Notes ($140 Outstanding)C-5, Perpetual, $350 Dual Currency Notes ($66 Outstanding)C-10, Perpetual, $900 Dual Currency Notes ($184 Outstanding)
(British Virgin Islands)
100%
$150 Rinker Unsecured Notes Due 2025
2011 Summary Statistics
Balance Sheet as of June 30, 2012
Multiple International Subsidiaries
100%
New Sunward Holding Financial Ventures B.V.(Netherlands)
100%
Organizational Structure — CEMEX, S.A.B. de C.V.(USD Mil., Unless Otherwise Stated)
2,339 of EBITDA
$1,196 Mexico($100) United States$416 Northern Europe$513 Central and South America, Caribbean$439 Mediterranean$81 Asia($206) Others
$625 Cash and Marketable Securities
$17,629 of Total Debt
$7,156 Subject to Financing Agreement$41 Certificados Bursatiles$9,501 International Fixed Income Debt$462 Perpetual Notes$469 Other Subsidiary Bank Debt

Latin America High Yield 75
November 8, 2012
Corporates
Financial Summary CEMEX, S.A.B. de C.V.
Period-End Exchange Rate 12.8099 13.9298 12.3507 13.0811 13.6944
Average Exchange Rate 12.6676 12.4407 12.629 13.5002 11.1635
(USD Mil., As of Dec. 31) LTM 3/31/12 2011 2010 2009 2008
Profitability
Operating EBITDA 2,418 2,339 2,321 2,678 4,367
Operating EBITDAR 2,661 2,596 2,521 2,923 4,567
Operating EBITDA Margin (%) 16.0 15.4 16.4 18.3 20.0
Operating EBITDAR Margin (%) 17.6 17.1 17.9 19.9 21.0
FFO Return on Adjusted Capital (%) 6.5 6.7 8.7 6.8 8.4
Free Cash Flow Margin (%) 2.2 1.8 7.3 6.0 1.2
Return on Average Equity (%) (9.5) (10.3) (8.0) 0.7 1.4
Coverage (x)
FFO Interest Coverage 1.2 1.5 2.0 1.9 4.0
Operating EBITDA/Gross Interest Expense 1.5 1.5 1.6 2.2 4.8
Operating EBITDAR/Interest Expense + Rents 1.5 1.5 1.6 2.0 4.1
Operating EBITDA/Debt Service Coverage 1.4 1.2 1.2 1.5 0.6
Operating EBITDAR/Debt Service Coverage 1.4 1.2 1.2 1.4 0.6
FFO Fixed-Charge Coverage 1.1 1.4 1.9 1.7 3.5
FCF Debt Service Coverage 1.1 0.9 1.3 1.2 0.2
(FCF + Cash and Marketable Securities)/Debt Service Coverage 1.5 1.5 1.7 1.8 0.3
Cash Flow from Operations/Capital Expenditures 2.1 1.6 2.9 2.3 1.5
Leverage (x)
FFO Adjusted Leverage 10.8 8.8 6.9 9.4 6.0
Total Debt with Equity Credit/Operating EBITDA 7.3 7.8 7.7 7.2 5.0
Total Net Debt with Equity Credit/Operating EBITDA 7.0 7.3 7.4 6.8 4.8
Total Adjusted Debt/Operating EBITDAR 7.3 7.6 7.7 7.2 5.1
Total Adjusted Net Debt/Operating EBITDAR 7.1 7.2 7.4 6.9 4.9
Implied Cost of Funds (%) 8.7 8.4 7.6 5.8 4.1
Balance Sheet
Total Assets 38,356 39,362 41,706 44,514 45,538
Cash and Marketable Securities 625 1,158 676 1,078 993
Short-Term Debt 111 383 466 594 6,957
Long-Term Debt 17,518 17,858 17,438 18,754 15,053
Total Debt 17,629 18,241 17,903 19,348 22,010
Total Debt with Equity Credit 17,251 18,241 17,903 19,348 —
Total Equity 11,462 13,973 15,982 16,643 14,296
Total Adjusted Capital 31,002 33,820 35,315 37,760 37,450
Cash Flow
Funds from Operations 251 743 1,386 1,045 2,738
Change in Working Capital 390 1 196 372 63
Cash Flow from Operations 641 744 1,582 1,416 2,801
Total Non-Operating/Nonrecurring Cash Flow — — — 76 0
Capital Expenditures (310) (478) (544) (615) (1,903)
Common Dividends — — — — (628)
Free Cash Flow 331 267 1,037 877 270
Net Acquisitions and Divestitures 120 99 93 1,564 971
Other Investments, Net 20 258 304 (526) (123)
Net Debt Proceeds (142) 458 (761) (2,653) (494)
Net Equity Proceeds 1 1 0 1,774 609
Other (Investments and Financing) (429) (458) (91) (862) (792)
Total Change in Cash (100) 625 582 175 442
Income Statement
Revenue 15,125 15,187 14,115 14,652 21,785
Revenue Growth (%) (0.9) 7.6 (3.7) (32.7) 1
Operating EBIT 1,079 963 859 1,173 2,498
Gross Interest Expense 1,562 1,522 1,419 1,201 916
Rental Expense 244 257 200 245 201
Net Income (1,296) (1,537) (1,308) 104 204
Source: Fitch Ratings.
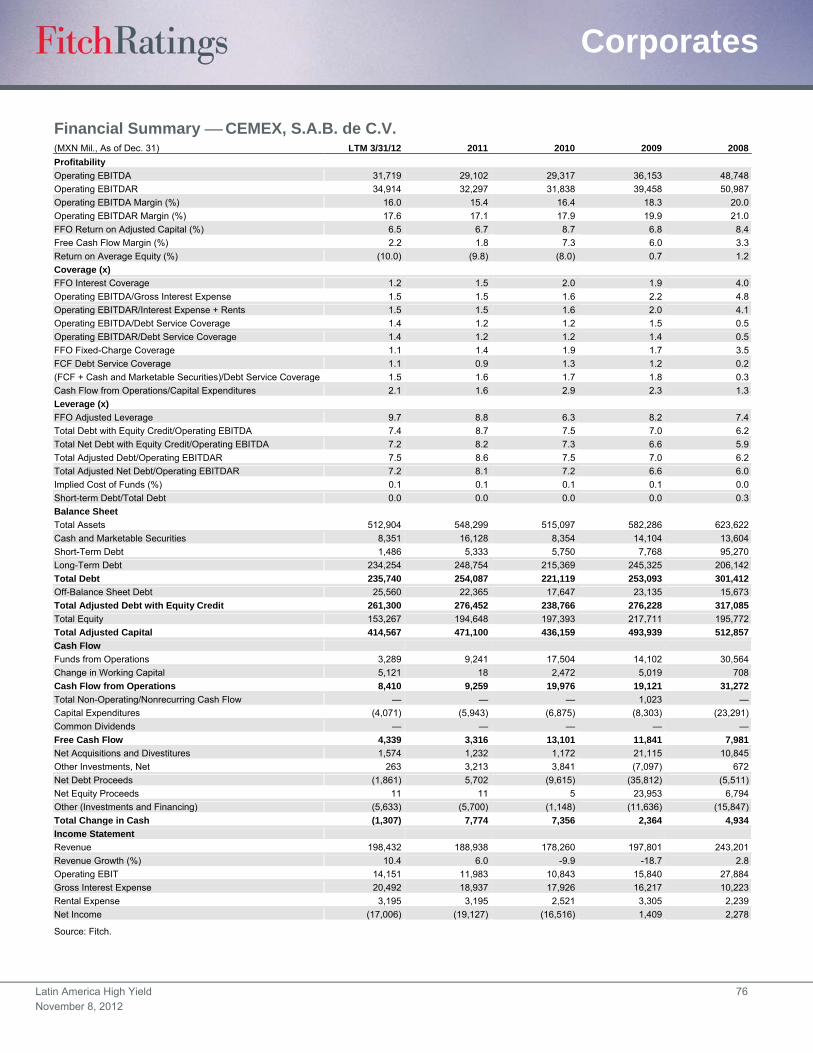
Latin America High Yield 76
November 8, 2012
Corporates
Financial Summary CEMEX, S.A.B. de C.V. (MXN Mil., As of Dec. 31) LTM 3/31/12 2011 2010 2009 2008
Profitability
Operating EBITDA 31,719 29,102 29,317 36,153 48,748
Operating EBITDAR 34,914 32,297 31,838 39,458 50,987
Operating EBITDA Margin (%) 16.0 15.4 16.4 18.3 20.0
Operating EBITDAR Margin (%) 17.6 17.1 17.9 19.9 21.0
FFO Return on Adjusted Capital (%) 6.5 6.7 8.7 6.8 8.4
Free Cash Flow Margin (%) 2.2 1.8 7.3 6.0 3.3
Return on Average Equity (%) (10.0) (9.8) (8.0) 0.7 1.2
Coverage (x)
FFO Interest Coverage 1.2 1.5 2.0 1.9 4.0
Operating EBITDA/Gross Interest Expense 1.5 1.5 1.6 2.2 4.8
Operating EBITDAR/Interest Expense + Rents 1.5 1.5 1.6 2.0 4.1
Operating EBITDA/Debt Service Coverage 1.4 1.2 1.2 1.5 0.5
Operating EBITDAR/Debt Service Coverage 1.4 1.2 1.2 1.4 0.5
FFO Fixed-Charge Coverage 1.1 1.4 1.9 1.7 3.5
FCF Debt Service Coverage 1.1 0.9 1.3 1.2 0.2
(FCF + Cash and Marketable Securities)/Debt Service Coverage 1.5 1.6 1.7 1.8 0.3
Cash Flow from Operations/Capital Expenditures 2.1 1.6 2.9 2.3 1.3
Leverage (x)
FFO Adjusted Leverage 9.7 8.8 6.3 8.2 7.4
Total Debt with Equity Credit/Operating EBITDA 7.4 8.7 7.5 7.0 6.2
Total Net Debt with Equity Credit/Operating EBITDA 7.2 8.2 7.3 6.6 5.9
Total Adjusted Debt/Operating EBITDAR 7.5 8.6 7.5 7.0 6.2
Total Adjusted Net Debt/Operating EBITDAR 7.2 8.1 7.2 6.6 6.0
Implied Cost of Funds (%) 0.1 0.1 0.1 0.1 0.0
Short-term Debt/Total Debt 0.0 0.0 0.0 0.0 0.3
Balance Sheet
Total Assets 512,904 548,299 515,097 582,286 623,622
Cash and Marketable Securities 8,351 16,128 8,354 14,104 13,604
Short-Term Debt 1,486 5,333 5,750 7,768 95,270
Long-Term Debt 234,254 248,754 215,369 245,325 206,142
Total Debt 235,740 254,087 221,119 253,093 301,412
Off-Balance Sheet Debt 25,560 22,365 17,647 23,135 15,673
Total Adjusted Debt with Equity Credit 261,300 276,452 238,766 276,228 317,085
Total Equity 153,267 194,648 197,393 217,711 195,772
Total Adjusted Capital 414,567 471,100 436,159 493,939 512,857
Cash Flow
Funds from Operations 3,289 9,241 17,504 14,102 30,564
Change in Working Capital 5,121 18 2,472 5,019 708
Cash Flow from Operations 8,410 9,259 19,976 19,121 31,272
Total Non-Operating/Nonrecurring Cash Flow — — — 1,023 —
Capital Expenditures (4,071) (5,943) (6,875) (8,303) (23,291)
Common Dividends — — — — —
Free Cash Flow 4,339 3,316 13,101 11,841 7,981
Net Acquisitions and Divestitures 1,574 1,232 1,172 21,115 10,845
Other Investments, Net 263 3,213 3,841 (7,097) 672
Net Debt Proceeds (1,861) 5,702 (9,615) (35,812) (5,511)
Net Equity Proceeds 11 11 5 23,953 6,794
Other (Investments and Financing) (5,633) (5,700) (1,148) (11,636) (15,847)
Total Change in Cash (1,307) 7,774 7,356 2,364 4,934
Income Statement
Revenue 198,432 188,938 178,260 197,801 243,201
Revenue Growth (%) 10.4 6.0 -9.9 -18.7 2.8
Operating EBIT 14,151 11,983 10,843 15,840 27,884
Gross Interest Expense 20,492 18,937 17,926 16,217 10,223
Rental Expense 3,195 3,195 2,521 3,305 2,239
Net Income (17,006) (19,127) (16,516) 1,409 2,278
Source: Fitch.
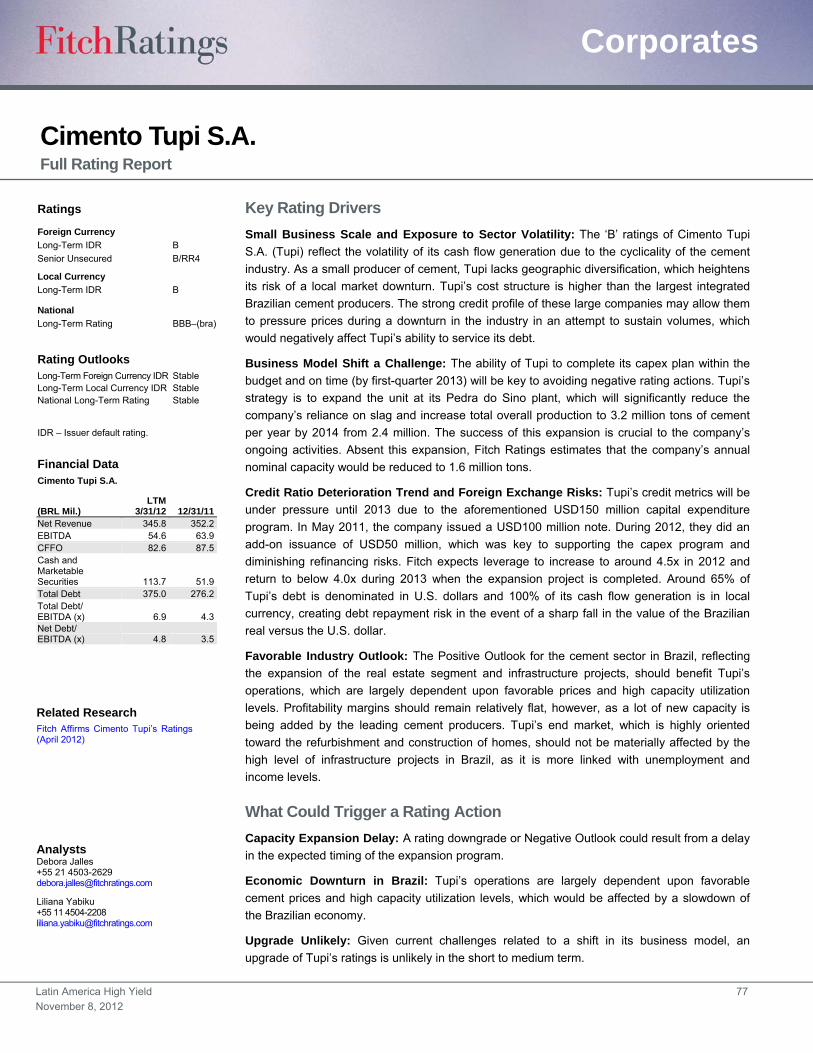
Latin America High Yield 77
November 8, 2012
Corporates
Cimento Tupi S.A. Full Rating Report
Key Rating Drivers
Small Business Scale and Exposure to Sector Volatility: The ‘B’ ratings of Cimento Tupi
S.A. (Tupi) reflect the volatility of its cash flow generation due to the cyclicality of the cement
industry. As a small producer of cement, Tupi lacks geographic diversification, which heightens
its risk of a local market downturn. Tupi’s cost structure is higher than the largest integrated
Brazilian cement producers. The strong credit profile of these large companies may allow them
to pressure prices during a downturn in the industry in an attempt to sustain volumes, which
would negatively affect Tupi’s ability to service its debt.
Business Model Shift a Challenge: The ability of Tupi to complete its capex plan within the
budget and on time (by first-quarter 2013) will be key to avoiding negative rating actions. Tupi’s
strategy is to expand the unit at its Pedra do Sino plant, which will significantly reduce the
company’s reliance on slag and increase total overall production to 3.2 million tons of cement
per year by 2014 from 2.4 million. The success of this expansion is crucial to the company’s
ongoing activities. Absent this expansion, Fitch Ratings estimates that the company’s annual
nominal capacity would be reduced to 1.6 million tons.
Credit Ratio Deterioration Trend and Foreign Exchange Risks: Tupi’s credit metrics will be
under pressure until 2013 due to the aforementioned USD150 million capital expenditure
program. In May 2011, the company issued a USD100 million note. During 2012, they did an
add-on issuance of USD50 million, which was key to supporting the capex program and
diminishing refinancing risks. Fitch expects leverage to increase to around 4.5x in 2012 and
return to below 4.0x during 2013 when the expansion project is completed. Around 65% of
Tupi’s debt is denominated in U.S. dollars and 100% of its cash flow generation is in local
currency, creating debt repayment risk in the event of a sharp fall in the value of the Brazilian
real versus the U.S. dollar.
Favorable Industry Outlook: The Positive Outlook for the cement sector in Brazil, reflecting
the expansion of the real estate segment and infrastructure projects, should benefit Tupi’s
operations, which are largely dependent upon favorable prices and high capacity utilization
levels. Profitability margins should remain relatively flat, however, as a lot of new capacity is
being added by the leading cement producers. Tupi’s end market, which is highly oriented
toward the refurbishment and construction of homes, should not be materially affected by the
high level of infrastructure projects in Brazil, as it is more linked with unemployment and
income levels.
What Could Trigger a Rating Action
Capacity Expansion Delay: A rating downgrade or Negative Outlook could result from a delay
in the expected timing of the expansion program.
Economic Downturn in Brazil: Tupi’s operations are largely dependent upon favorable
cement prices and high capacity utilization levels, which would be affected by a slowdown of
the Brazilian economy.
Upgrade Unlikely: Given current challenges related to a shift in its business model, an
upgrade of Tupi’s ratings is unlikely in the short to medium term.
Ratings
Foreign Currency
Long-Term IDR B
Senior Unsecured B/RR4
Local Currency
Long-Term IDR B
National
Long-Term Rating BBB–(bra)
Rating Outlooks Long-Term Foreign Currency IDR Stable Long-Term Local Currency IDR Stable National Long-Term Rating Stable
IDR – Issuer default rating.
Financial Data Cimento Tupi S.A.
(BRL Mil.) LTM
3/31/12 12/31/11 Net Revenue 345.8 352.2 EBITDA 54.6 63.9 CFFO 82.6 87.5 Cash and Marketable Securities 113.7 51.9 Total Debt 375.0 276.2 Total Debt/ EBITDA (x) 6.9 4.3 Net Debt/ EBITDA (x) 4.8 3.5
Related Research Fitch Affirms Cimento Tupi’s Ratings (April 2012)
Analysts Debora Jalles +55 21 4503-2629 [email protected]
Liliana Yabiku +55 11 4504-2208 [email protected]
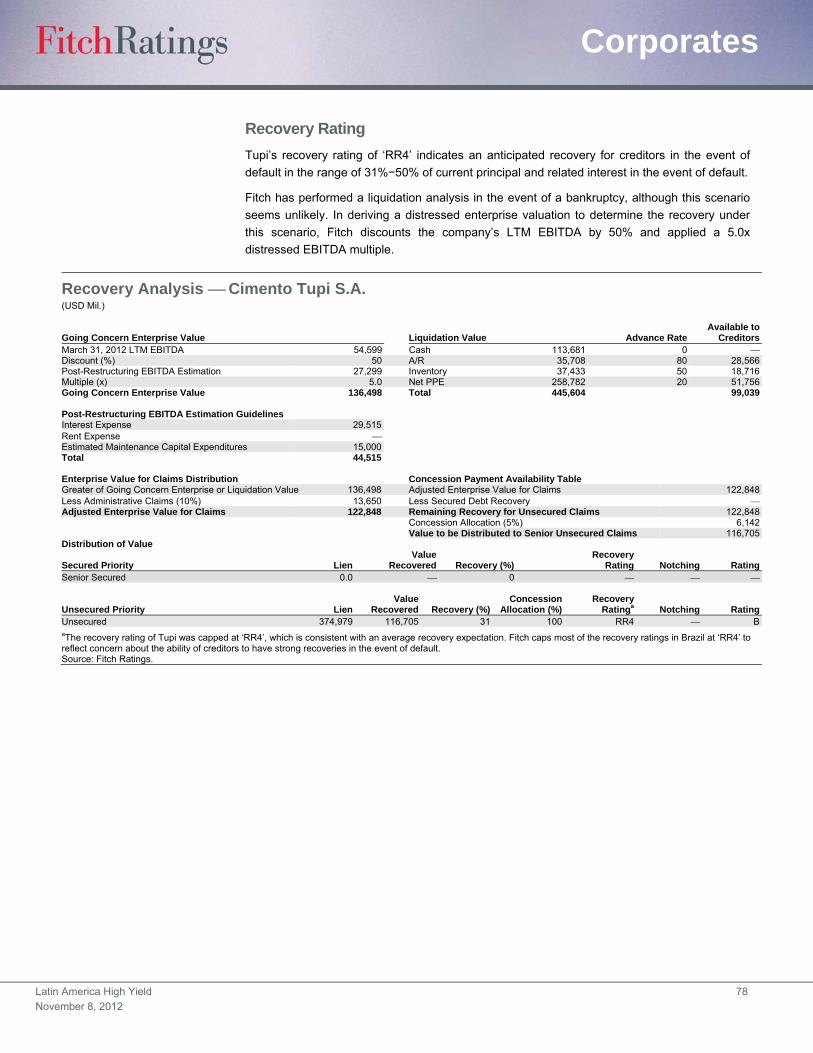
Latin America High Yield 78
November 8, 2012
Corporates
Recovery Rating
Tupi’s recovery rating of ‘RR4’ indicates an anticipated recovery for creditors in the event of
default in the range of 31%−50% of current principal and related interest in the event of default.
Fitch has performed a liquidation analysis in the event of a bankruptcy, although this scenario
seems unlikely. In deriving a distressed enterprise valuation to determine the recovery under
this scenario, Fitch discounts the company’s LTM EBITDA by 50% and applied a 5.0x
distressed EBITDA multiple.
Recovery Analysis Cimento Tupi S.A. (USD Mil.)
Going Concern Enterprise Value Liquidation Value Advance RateAvailable to
CreditorsMarch 31, 2012 LTM EBITDA 54,599 Cash 113,681 0 Discount (%) 50 A/R 35,708 80 28,566Post-Restructuring EBITDA Estimation 27,299 Inventory 37,433 50 18,716Multiple (x) 5.0 Net PPE 258,782 20 51,756Going Concern Enterprise Value 136,498 Total 445,604 99,039 Post-Restructuring EBITDA Estimation Guidelines Interest Expense 29,515Rent Expense Estimated Maintenance Capital Expenditures 15,000Total 44,515
Enterprise Value for Claims Distribution Concession Payment Availability Table Greater of Going Concern Enterprise or Liquidation Value 136,498 Adjusted Enterprise Value for Claims 122,848Less Administrative Claims (10%) 13,650 Less Secured Debt Recovery Adjusted Enterprise Value for Claims 122,848 Remaining Recovery for Unsecured Claims 122,848 Concession Allocation (5%) 6,142 Value to be Distributed to Senior Unsecured Claims 116,705Distribution of Value
Secured Priority LienValue
Recovered Recovery (%)Recovery
Rating Notching RatingSenior Secured 0.0 0
Unsecured Priority LienValue
Recovered Recovery (%)Concession
Allocation (%)Recovery
Ratinga Notching RatingUnsecured 374,979 116,705 31 100 RR4 BaThe recovery rating of Tupi was capped at ‘RR4’, which is consistent with an average recovery expectation. Fitch caps most of the recovery ratings in Brazil at ‘RR4’ to reflect concern about the ability of creditors to have strong recoveries in the event of default. Source: Fitch Ratings.
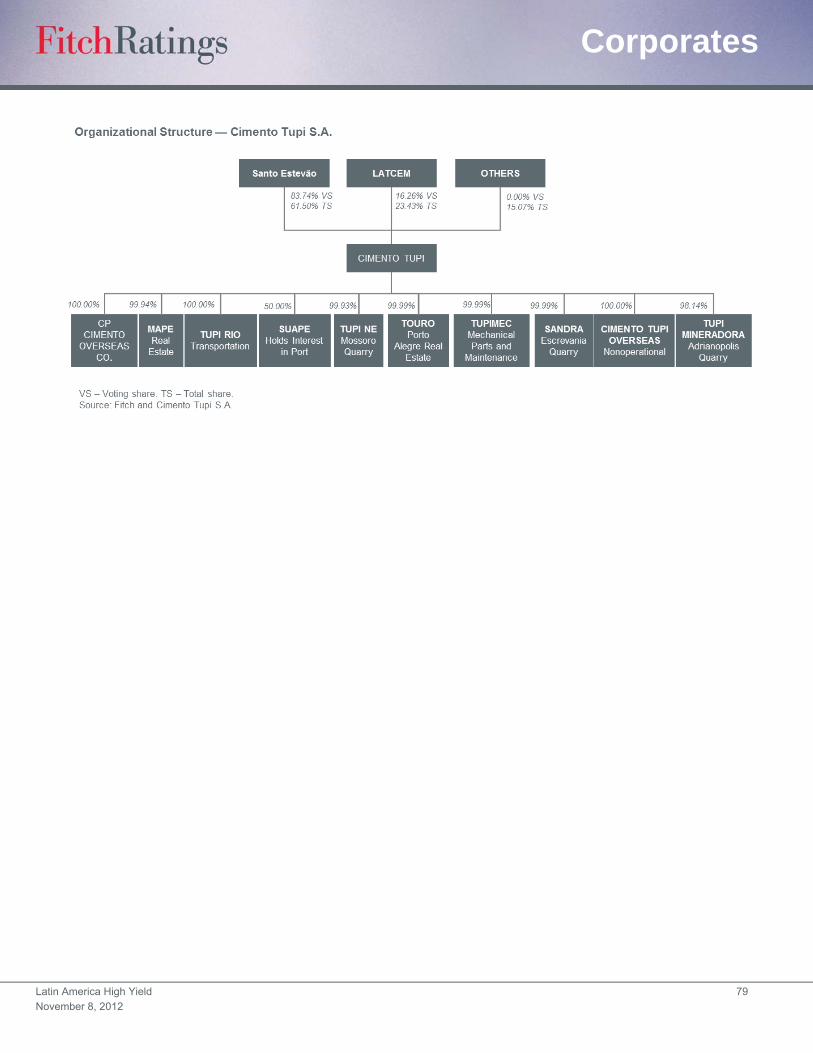
Latin America High Yield 79
November 8, 2012
Corporates
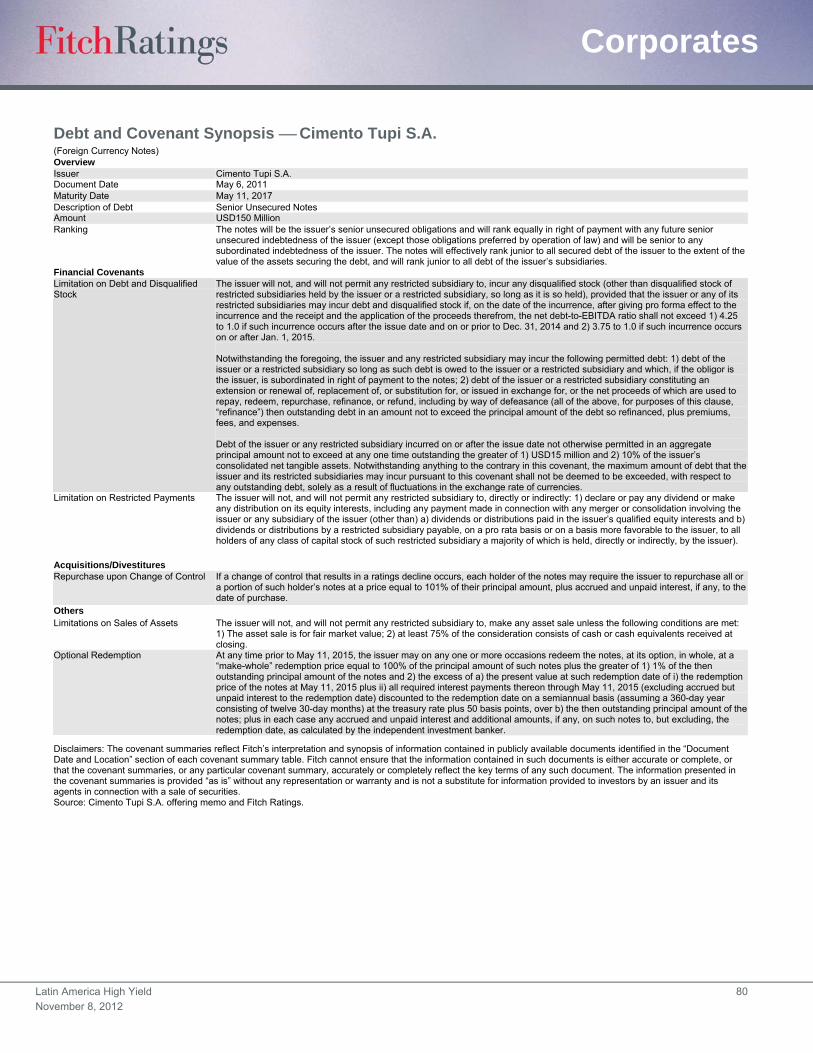
Latin America High Yield 80
November 8, 2012
Corporates
Debt and Covenant Synopsis Cimento Tupi S.A. (Foreign Currency Notes) Overview Issuer Cimento Tupi S.A. Document Date May 6, 2011 Maturity Date May 11, 2017 Description of Debt Senior Unsecured Notes Amount USD150 Million Ranking The notes will be the issuer’s senior unsecured obligations and will rank equally in right of payment with any future senior
unsecured indebtedness of the issuer (except those obligations preferred by operation of law) and will be senior to any subordinated indebtedness of the issuer. The notes will effectively rank junior to all secured debt of the issuer to the extent of the value of the assets securing the debt, and will rank junior to all debt of the issuer’s subsidiaries.
Financial Covenants Limitation on Debt and Disqualified Stock
The issuer will not, and will not permit any restricted subsidiary to, incur any disqualified stock (other than disqualified stock of restricted subsidiaries held by the issuer or a restricted subsidiary, so long as it is so held), provided that the issuer or any of its restricted subsidiaries may incur debt and disqualified stock if, on the date of the incurrence, after giving pro forma effect to the incurrence and the receipt and the application of the proceeds therefrom, the net debt-to-EBITDA ratio shall not exceed 1) 4.25 to 1.0 if such incurrence occurs after the issue date and on or prior to Dec. 31, 2014 and 2) 3.75 to 1.0 if such incurrence occurs on or after Jan. 1, 2015. Notwithstanding the foregoing, the issuer and any restricted subsidiary may incur the following permitted debt: 1) debt of the issuer or a restricted subsidiary so long as such debt is owed to the issuer or a restricted subsidiary and which, if the obligor is the issuer, is subordinated in right of payment to the notes; 2) debt of the issuer or a restricted subsidiary constituting an extension or renewal of, replacement of, or substitution for, or issued in exchange for, or the net proceeds of which are used to repay, redeem, repurchase, refinance, or refund, including by way of defeasance (all of the above, for purposes of this clause, “refinance”) then outstanding debt in an amount not to exceed the principal amount of the debt so refinanced, plus premiums, fees, and expenses. Debt of the issuer or any restricted subsidiary incurred on or after the issue date not otherwise permitted in an aggregate principal amount not to exceed at any one time outstanding the greater of 1) USD15 million and 2) 10% of the issuer’s consolidated net tangible assets. Notwithstanding anything to the contrary in this covenant, the maximum amount of debt that the issuer and its restricted subsidiaries may incur pursuant to this covenant shall not be deemed to be exceeded, with respect to any outstanding debt, solely as a result of fluctuations in the exchange rate of currencies.
Limitation on Restricted Payments The issuer will not, and will not permit any restricted subsidiary to, directly or indirectly: 1) declare or pay any dividend or make any distribution on its equity interests, including any payment made in connection with any merger or consolidation involving the issuer or any subsidiary of the issuer (other than) a) dividends or distributions paid in the issuer’s qualified equity interests and b) dividends or distributions by a restricted subsidiary payable, on a pro rata basis or on a basis more favorable to the issuer, to all holders of any class of capital stock of such restricted subsidiary a majority of which is held, directly or indirectly, by the issuer).
Acquisitions/Divestitures Repurchase upon Change of Control If a change of control that results in a ratings decline occurs, each holder of the notes may require the issuer to repurchase all or
a portion of such holder’s notes at a price equal to 101% of their principal amount, plus accrued and unpaid interest, if any, to the date of purchase.
Others Limitations on Sales of Assets
The issuer will not, and will not permit any restricted subsidiary to, make any asset sale unless the following conditions are met: 1) The asset sale is for fair market value; 2) at least 75% of the consideration consists of cash or cash equivalents received at closing.
Optional Redemption At any time prior to May 11, 2015, the issuer may on any one or more occasions redeem the notes, at its option, in whole, at a “make-whole” redemption price equal to 100% of the principal amount of such notes plus the greater of 1) 1% of the then outstanding principal amount of the notes and 2) the excess of a) the present value at such redemption date of i) the redemption price of the notes at May 11, 2015 plus ii) all required interest payments thereon through May 11, 2015 (excluding accrued but unpaid interest to the redemption date) discounted to the redemption date on a semiannual basis (assuming a 360-day year consisting of twelve 30-day months) at the treasury rate plus 50 basis points, over b) the then outstanding principal amount of the notes; plus in each case any accrued and unpaid interest and additional amounts, if any, on such notes to, but excluding, the redemption date, as calculated by the independent investment banker.
Disclaimers: The covenant summaries reflect Fitch’s interpretation and synopsis of information contained in publicly available documents identified in the “Document Date and Location” section of each covenant summary table. Fitch cannot ensure that the information contained in such documents is either accurate or complete, or that the covenant summaries, or any particular covenant summary, accurately or completely reflect the key terms of any such document. The information presented in the covenant summaries is provided “as is” without any representation or warranty and is not a substitute for information provided to investors by an issuer and its agents in connection with a sale of securities. Source: Cimento Tupi S.A. offering memo and Fitch Ratings.
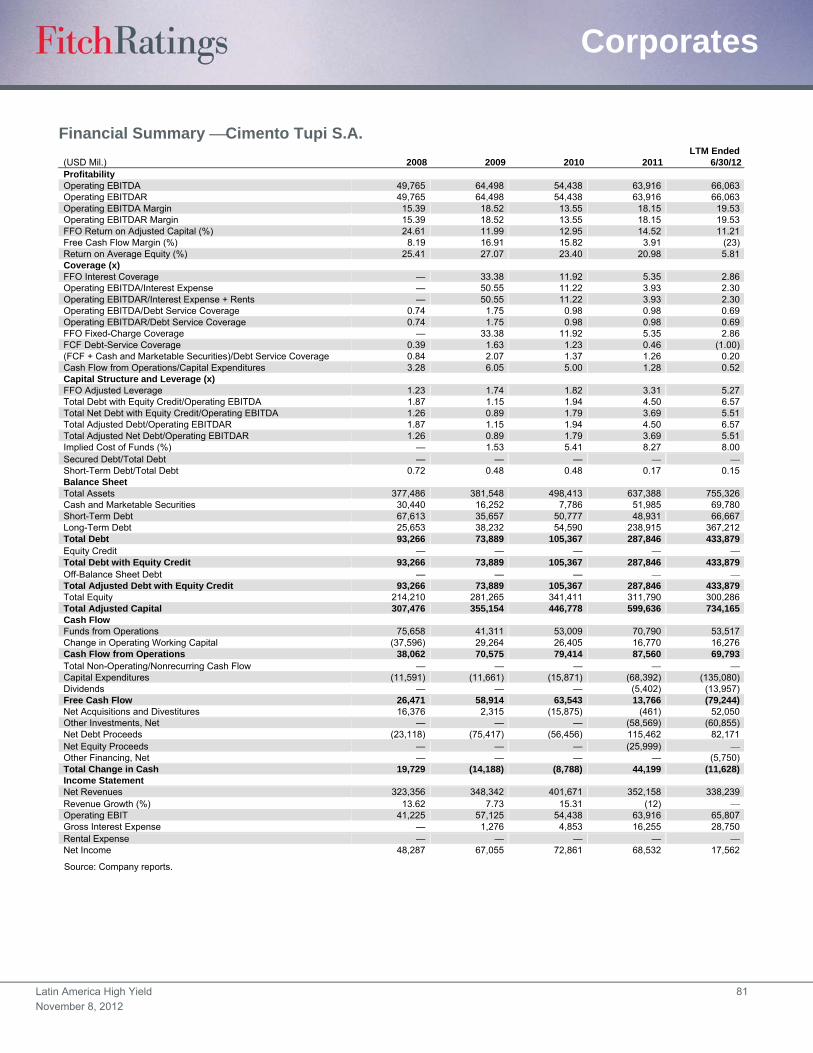
Latin America High Yield 81
November 8, 2012
Corporates
Financial Summary Cimento Tupi S.A. LTM Ended(USD Mil.) 2008 2009 2010 2011 6/30/12Profitability Operating EBITDA 49,765 64,498 54,438 63,916 66,063Operating EBITDAR 49,765 64,498 54,438 63,916 66,063Operating EBITDA Margin 15.39 18.52 13.55 18.15 19.53Operating EBITDAR Margin 15.39 18.52 13.55 18.15 19.53FFO Return on Adjusted Capital (%) 24.61 11.99 12.95 14.52 11.21Free Cash Flow Margin (%) 8.19 16.91 15.82 3.91 (23)Return on Average Equity (%) 25.41 27.07 23.40 20.98 5.81Coverage (x) FFO Interest Coverage — 33.38 11.92 5.35 2.86Operating EBITDA/Interest Expense — 50.55 11.22 3.93 2.30Operating EBITDAR/Interest Expense + Rents — 50.55 11.22 3.93 2.30Operating EBITDA/Debt Service Coverage 0.74 1.75 0.98 0.98 0.69Operating EBITDAR/Debt Service Coverage 0.74 1.75 0.98 0.98 0.69FFO Fixed-Charge Coverage — 33.38 11.92 5.35 2.86FCF Debt-Service Coverage 0.39 1.63 1.23 0.46 (1.00)(FCF + Cash and Marketable Securities)/Debt Service Coverage 0.84 2.07 1.37 1.26 0.20Cash Flow from Operations/Capital Expenditures 3.28 6.05 5.00 1.28 0.52Capital Structure and Leverage (x) FFO Adjusted Leverage 1.23 1.74 1.82 3.31 5.27Total Debt with Equity Credit/Operating EBITDA 1.87 1.15 1.94 4.50 6.57Total Net Debt with Equity Credit/Operating EBITDA 1.26 0.89 1.79 3.69 5.51Total Adjusted Debt/Operating EBITDAR 1.87 1.15 1.94 4.50 6.57Total Adjusted Net Debt/Operating EBITDAR 1.26 0.89 1.79 3.69 5.51Implied Cost of Funds (%) — 1.53 5.41 8.27 8.00Secured Debt/Total Debt — — — Short-Term Debt/Total Debt 0.72 0.48 0.48 0.17 0.15Balance Sheet Total Assets 377,486 381,548 498,413 637,388 755,326Cash and Marketable Securities 30,440 16,252 7,786 51,985 69,780Short-Term Debt 67,613 35,657 50,777 48,931 66,667Long-Term Debt 25,653 38,232 54,590 238,915 367,212Total Debt 93,266 73,889 105,367 287,846 433,879Equity Credit — — — Total Debt with Equity Credit 93,266 73,889 105,367 287,846 433,879Off-Balance Sheet Debt — — — Total Adjusted Debt with Equity Credit 93,266 73,889 105,367 287,846 433,879Total Equity 214,210 281,265 341,411 311,790 300,286Total Adjusted Capital 307,476 355,154 446,778 599,636 734,165Cash Flow Funds from Operations 75,658 41,311 53,009 70,790 53,517Change in Operating Working Capital (37,596) 29,264 26,405 16,770 16,276Cash Flow from Operations 38,062 70,575 79,414 87,560 69,793Total Non-Operating/Nonrecurring Cash Flow — — — Capital Expenditures (11,591) (11,661) (15,871) (68,392) (135,080)Dividends — — — (5,402) (13,957)Free Cash Flow 26,471 58,914 63,543 13,766 (79,244)Net Acquisitions and Divestitures 16,376 2,315 (15,875) (461) 52,050Other Investments, Net — — — (58,569) (60,855)Net Debt Proceeds (23,118) (75,417) (56,456) 115,462 82,171Net Equity Proceeds — — — (25,999) Other Financing, Net — — — — (5,750)Total Change in Cash 19,729 (14,188) (8,788) 44,199 (11,628)Income Statement Net Revenues 323,356 348,342 401,671 352,158 338,239Revenue Growth (%) 13.62 7.73 15.31 (12) Operating EBIT 41,225 57,125 54,438 63,916 65,807Gross Interest Expense — 1,276 4,853 16,255 28,750Rental Expense — — — — Net Income 48,287 67,055 72,861 68,532 17,562
Source: Company reports.
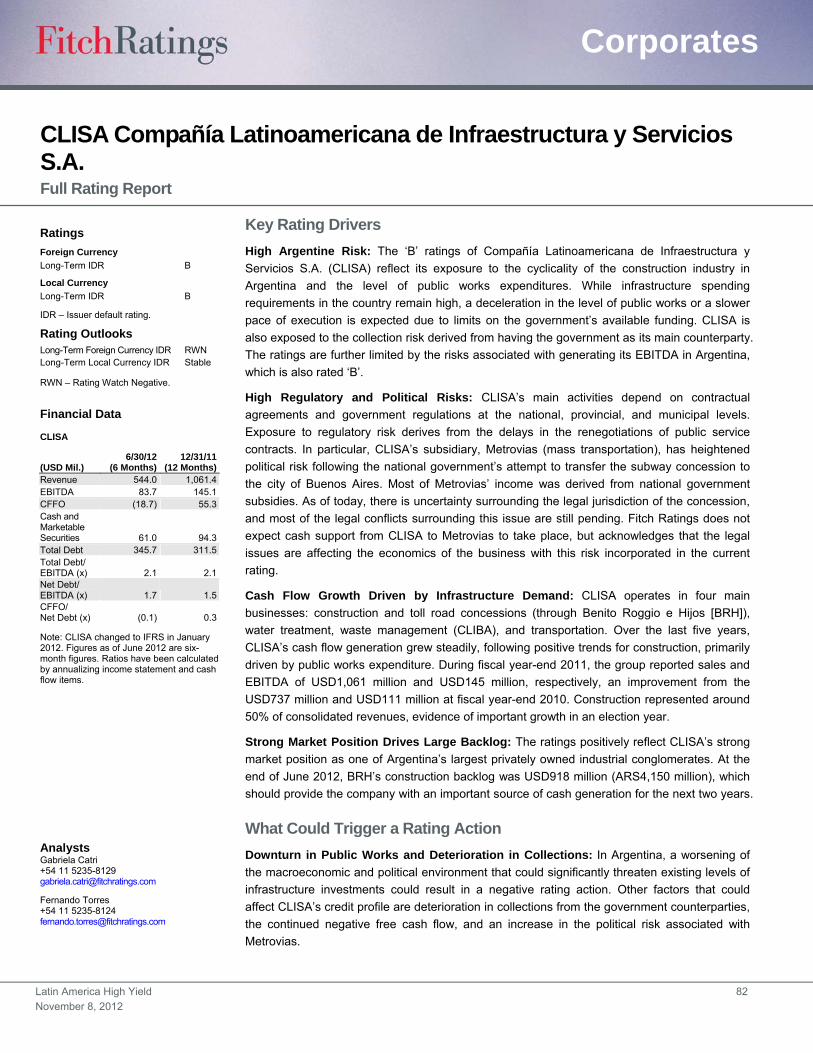
Latin America High Yield 82
November 8, 2012
Corporates
CLISA Compañía Latinoamericana de Infraestructura y Servicios S.A. Full Rating Report
Key Rating Drivers
High Argentine Risk: The ‘B’ ratings of Compañía Latinoamericana de Infraestructura y
Servicios S.A. (CLISA) reflect its exposure to the cyclicality of the construction industry in
Argentina and the level of public works expenditures. While infrastructure spending
requirements in the country remain high, a deceleration in the level of public works or a slower
pace of execution is expected due to limits on the government’s available funding. CLISA is
also exposed to the collection risk derived from having the government as its main counterparty.
The ratings are further limited by the risks associated with generating its EBITDA in Argentina,
which is also rated ‘B’.
High Regulatory and Political Risks: CLISA’s main activities depend on contractual
agreements and government regulations at the national, provincial, and municipal levels.
Exposure to regulatory risk derives from the delays in the renegotiations of public service
contracts. In particular, CLISA’s subsidiary, Metrovias (mass transportation), has heightened
political risk following the national government’s attempt to transfer the subway concession to
the city of Buenos Aires. Most of Metrovias’ income was derived from national government
subsidies. As of today, there is uncertainty surrounding the legal jurisdiction of the concession,
and most of the legal conflicts surrounding this issue are still pending. Fitch Ratings does not
expect cash support from CLISA to Metrovias to take place, but acknowledges that the legal
issues are affecting the economics of the business with this risk incorporated in the current
rating.
Cash Flow Growth Driven by Infrastructure Demand: CLISA operates in four main
businesses: construction and toll road concessions (through Benito Roggio e Hijos [BRH]),
water treatment, waste management (CLIBA), and transportation. Over the last five years,
CLISA’s cash flow generation grew steadily, following positive trends for construction, primarily
driven by public works expenditure. During fiscal year-end 2011, the group reported sales and
EBITDA of USD1,061 million and USD145 million, respectively, an improvement from the
USD737 million and USD111 million at fiscal year-end 2010. Construction represented around
50% of consolidated revenues, evidence of important growth in an election year.
Strong Market Position Drives Large Backlog: The ratings positively reflect CLISA’s strong
market position as one of Argentina’s largest privately owned industrial conglomerates. At the
end of June 2012, BRH’s construction backlog was USD918 million (ARS4,150 million), which
should provide the company with an important source of cash generation for the next two years.
What Could Trigger a Rating Action
Downturn in Public Works and Deterioration in Collections: In Argentina, a worsening of
the macroeconomic and political environment that could significantly threaten existing levels of
infrastructure investments could result in a negative rating action. Other factors that could
affect CLISA’s credit profile are deterioration in collections from the government counterparties,
the continued negative free cash flow, and an increase in the political risk associated with
Metrovias.
Ratings
Foreign Currency
Long-Term IDR B
Local Currency
Long-Term IDR B
IDR – Issuer default rating.
Rating Outlooks Long-Term Foreign Currency IDR RWN Long-Term Local Currency IDR Stable
RWN – Rating Watch Negative.
Financial Data
CLISA
(USD Mil.) 6/30/12
(6 Months) 12/31/11
(12 Months) Revenue 544.0 1,061.4 EBITDA 83.7 145.1 CFFO (18.7) 55.3 Cash and Marketable Securities 61.0 94.3 Total Debt 345.7 311.5 Total Debt/ EBITDA (x) 2.1 2.1 Net Debt/ EBITDA (x) 1.7 1.5 CFFO/ Net Debt (x) (0.1) 0.3
Note: CLISA changed to IFRS in January 2012. Figures as of June 2012 are six-month figures. Ratios have been calculated by annualizing income statement and cash flow items.
Analysts Gabriela Catri +54 11 5235-8129 [email protected]
Fernando Torres +54 11 5235-8124 [email protected]
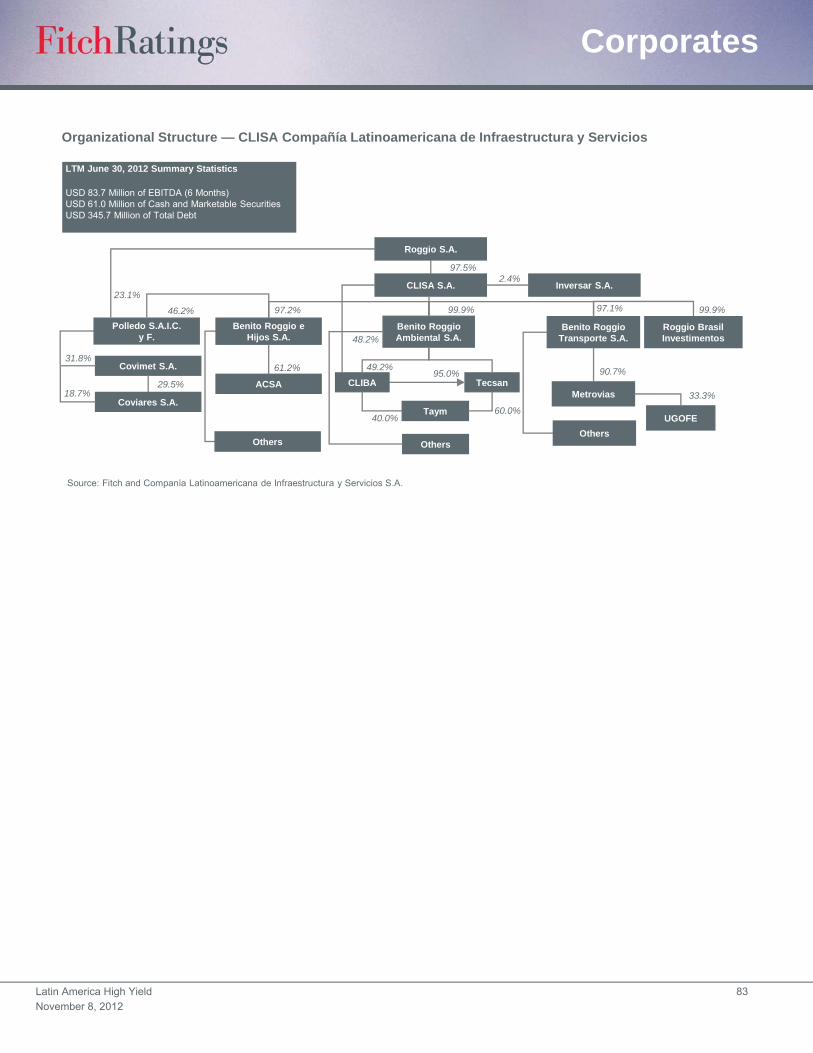
Latin America High Yield 83
November 8, 2012
Corporates
Organizational Structure — CLISA Compañía Latinoamericana de Infraestructura y Servicios
Source: Fitch and Companía Latinoamericana de Infraestructura y Servicios S.A.
CLISA S.A.
Polledo S.A.I.C. y F.
31.8%
Roggio S.A.
Covimet S.A.
Coviares S.A.
Benito Roggio e Hijos S.A.
ACSA
Others
Benito RoggioAmbiental S.A.
CLIBA Tecsan
Taym
Others
Benito RoggioTransporte S.A.
18.7%29.5%
61.2%
97.2%
49.2%
99.9%
97.5%
95.0%
48.2%
40.0%60.0%
46.2%
23.1%Inversar S.A.
Roggio BrasilInvestimentos
Metrovias
Others
UGOFE
33.3%
90.7%
97.1% 99.9%
2.4%
LTM June 30, 2012 Summary Statistics
USD 83.7 Million of EBITDA (6 Months)USD 61.0 Million of Cash and Marketable SecuritiesUSD 345.7 Million of Total Debt
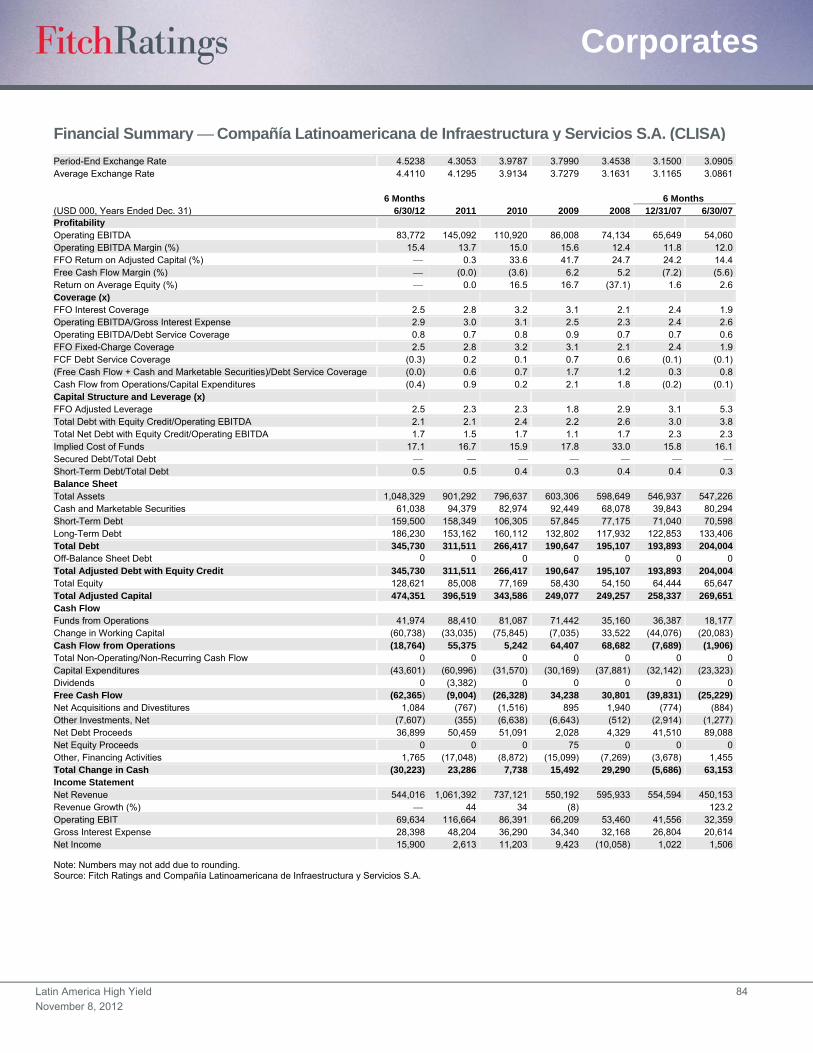
Latin America High Yield 84
November 8, 2012
Corporates
Financial Summary Compañía Latinoamericana de Infraestructura y Servicios S.A. (CLISA) Period-End Exchange Rate 4.5238 4.3053 3.9787 3.7990 3.4538 3.1500 3.0905Average Exchange Rate 4.4110 4.1295 3.9134 3.7279 3.1631 3.1165 3.0861 6 Months 6 Months (USD 000, Years Ended Dec. 31) 6/30/12 2011 2010 2009 2008 12/31/07 6/30/07Profitability Operating EBITDA 83,772 145,092 110,920 86,008 74,134 65,649 54,060Operating EBITDA Margin (%) 15.4 13.7 15.0 15.6 12.4 11.8 12.0FFO Return on Adjusted Capital (%) 0.3 33.6 41.7 24.7 24.2 14.4Free Cash Flow Margin (%) (0.0) (3.6) 6.2 5.2 (7.2) (5.6)Return on Average Equity (%) 0.0 16.5 16.7 (37.1) 1.6 2.6Coverage (x) FFO Interest Coverage 2.5 2.8 3.2 3.1 2.1 2.4 1.9Operating EBITDA/Gross Interest Expense 2.9 3.0 3.1 2.5 2.3 2.4 2.6Operating EBITDA/Debt Service Coverage 0.8 0.7 0.8 0.9 0.7 0.7 0.6FFO Fixed-Charge Coverage 2.5 2.8 3.2 3.1 2.1 2.4 1.9FCF Debt Service Coverage (0.3) 0.2 0.1 0.7 0.6 (0.1) (0.1)(Free Cash Flow + Cash and Marketable Securities)/Debt Service Coverage (0.0) 0.6 0.7 1.7 1.2 0.3 0.8Cash Flow from Operations/Capital Expenditures (0.4) 0.9 0.2 2.1 1.8 (0.2) (0.1)Capital Structure and Leverage (x) FFO Adjusted Leverage 2.5 2.3 2.3 1.8 2.9 3.1 5.3Total Debt with Equity Credit/Operating EBITDA 2.1 2.1 2.4 2.2 2.6 3.0 3.8Total Net Debt with Equity Credit/Operating EBITDA 1.7 1.5 1.7 1.1 1.7 2.3 2.3Implied Cost of Funds 17.1 16.7 15.9 17.8 33.0 15.8 16.1Secured Debt/Total Debt Short-Term Debt/Total Debt 0.5 0.5 0.4 0.3 0.4 0.4 0.3Balance Sheet Total Assets 1,048,329 901,292 796,637 603,306 598,649 546,937 547,226Cash and Marketable Securities 61,038 94,379 82,974 92,449 68,078 39,843 80,294Short-Term Debt 159,500 158,349 106,305 57,845 77,175 71,040 70,598Long-Term Debt 186,230 153,162 160,112 132,802 117,932 122,853 133,406Total Debt 345,730 311,511 266,417 190,647 195,107 193,893 204,004Off-Balance Sheet Debt 0 0 0 0 0 0 0Total Adjusted Debt with Equity Credit 345,730 311,511 266,417 190,647 195,107 193,893 204,004Total Equity 128,621 85,008 77,169 58,430 54,150 64,444 65,647Total Adjusted Capital 474,351 396,519 343,586 249,077 249,257 258,337 269,651Cash Flow Funds from Operations 41,974 88,410 81,087 71,442 35,160 36,387 18,177Change in Working Capital (60,738) (33,035) (75,845) (7,035) 33,522 (44,076) (20,083)Cash Flow from Operations (18,764) 55,375 5,242 64,407 68,682 (7,689) (1,906)Total Non-Operating/Non-Recurring Cash Flow 0 0 0 0 0 0 0Capital Expenditures (43,601) (60,996) (31,570) (30,169) (37,881) (32,142) (23,323)Dividends 0 (3,382) 0 0 0 0 0Free Cash Flow (62,365) (9,004) (26,328) 34,238 30,801 (39,831) (25,229)Net Acquisitions and Divestitures 1,084 (767) (1,516) 895 1,940 (774) (884)Other Investments, Net (7,607) (355) (6,638) (6,643) (512) (2,914) (1,277)Net Debt Proceeds 36,899 50,459 51,091 2,028 4,329 41,510 89,088Net Equity Proceeds 0 0 0 75 0 0 0Other, Financing Activities 1,765 (17,048) (8,872) (15,099) (7,269) (3,678) 1,455Total Change in Cash (30,223) 23,286 7,738 15,492 29,290 (5,686) 63,153Income Statement Net Revenue 544,016 1,061,392 737,121 550,192 595,933 554,594 450,153Revenue Growth (%) 44 34 (8) 123.2Operating EBIT 69,634 116,664 86,391 66,209 53,460 41,556 32,359Gross Interest Expense 28,398 48,204 36,290 34,340 32,168 26,804 20,614Net Income 15,900 2,613 11,203 9,423 (10,058) 1,022 1,506
Note: Numbers may not add due to rounding. Source: Fitch Ratings and Compañía Latinoamericana de Infraestructura y Servicios S.A.
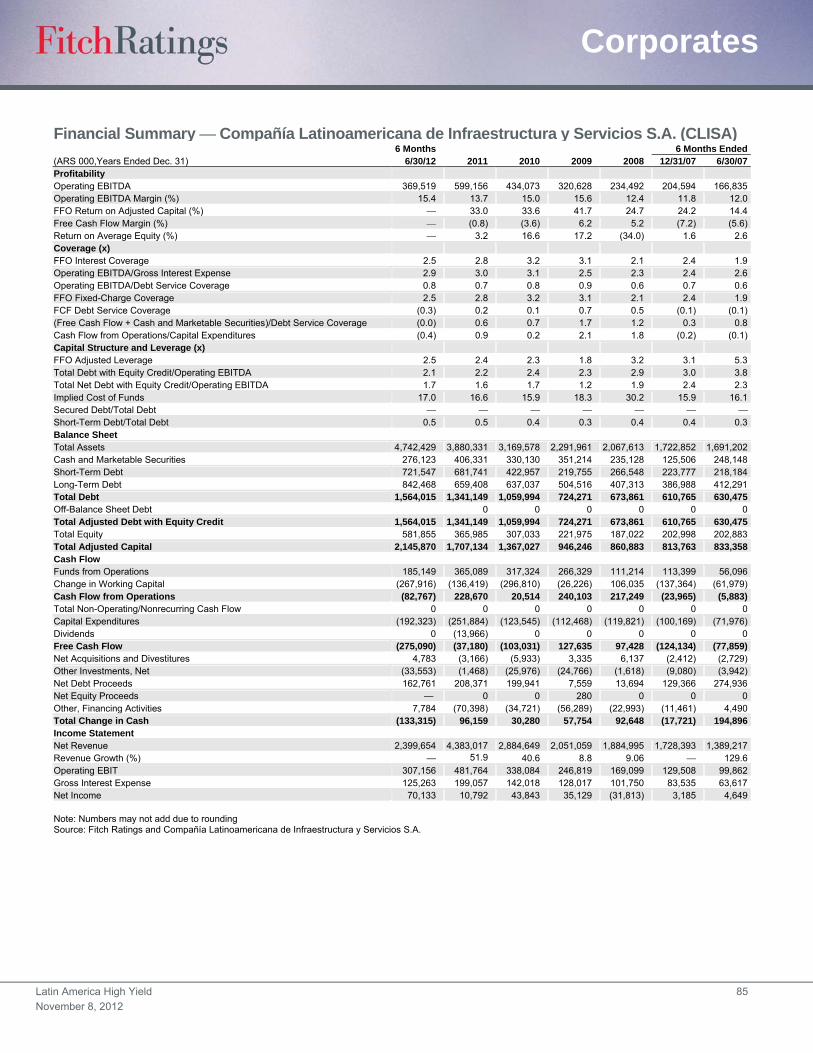
Latin America High Yield 85
November 8, 2012
Corporates
Financial Summary Compañía Latinoamericana de Infraestructura y Servicios S.A. (CLISA) 6 Months 6 Months Ended(ARS 000,Years Ended Dec. 31) 6/30/12 2011 2010 2009 2008 12/31/07 6/30/07Profitability Operating EBITDA 369,519 599,156 434,073 320,628 234,492 204,594 166,835 Operating EBITDA Margin (%) 15.4 13.7 15.0 15.6 12.4 11.8 12.0 FFO Return on Adjusted Capital (%) 33.0 33.6 41.7 24.7 24.2 14.4 Free Cash Flow Margin (%) (0.8) (3.6) 6.2 5.2 (7.2) (5.6)Return on Average Equity (%) 3.2 16.6 17.2 (34.0) 1.6 2.6 Coverage (x) FFO Interest Coverage 2.5 2.8 3.2 3.1 2.1 2.4 1.9 Operating EBITDA/Gross Interest Expense 2.9 3.0 3.1 2.5 2.3 2.4 2.6 Operating EBITDA/Debt Service Coverage 0.8 0.7 0.8 0.9 0.6 0.7 0.6 FFO Fixed-Charge Coverage 2.5 2.8 3.2 3.1 2.1 2.4 1.9 FCF Debt Service Coverage (0.3) 0.2 0.1 0.7 0.5 (0.1) (0.1)(Free Cash Flow + Cash and Marketable Securities)/Debt Service Coverage (0.0) 0.6 0.7 1.7 1.2 0.3 0.8 Cash Flow from Operations/Capital Expenditures (0.4) 0.9 0.2 2.1 1.8 (0.2) (0.1)Capital Structure and Leverage (x) FFO Adjusted Leverage 2.5 2.4 2.3 1.8 3.2 3.1 5.3 Total Debt with Equity Credit/Operating EBITDA 2.1 2.2 2.4 2.3 2.9 3.0 3.8 Total Net Debt with Equity Credit/Operating EBITDA 1.7 1.6 1.7 1.2 1.9 2.4 2.3 Implied Cost of Funds 17.0 16.6 15.9 18.3 30.2 15.9 16.1 Secured Debt/Total Debt Short-Term Debt/Total Debt 0.5 0.5 0.4 0.3 0.4 0.4 0.3 Balance Sheet Total Assets 4,742,429 3,880,331 3,169,578 2,291,961 2,067,613 1,722,852 1,691,202 Cash and Marketable Securities 276,123 406,331 330,130 351,214 235,128 125,506 248,148 Short-Term Debt 721,547 681,741 422,957 219,755 266,548 223,777 218,184 Long-Term Debt 842,468 659,408 637,037 504,516 407,313 386,988 412,291 Total Debt 1,564,015 1,341,149 1,059,994 724,271 673,861 610,765 630,475 Off-Balance Sheet Debt 0 0 0 0 0 0 Total Adjusted Debt with Equity Credit 1,564,015 1,341,149 1,059,994 724,271 673,861 610,765 630,475 Total Equity 581,855 365,985 307,033 221,975 187,022 202,998 202,883 Total Adjusted Capital 2,145,870 1,707,134 1,367,027 946,246 860,883 813,763 833,358 Cash Flow Funds from Operations 185,149 365,089 317,324 266,329 111,214 113,399 56,096 Change in Working Capital (267,916) (136,419) (296,810) (26,226) 106,035 (137,364) (61,979)Cash Flow from Operations (82,767) 228,670 20,514 240,103 217,249 (23,965) (5,883)Total Non-Operating/Nonrecurring Cash Flow 0 0 0 0 0 0 0 Capital Expenditures (192,323) (251,884) (123,545) (112,468) (119,821) (100,169) (71,976)Dividends 0 (13,966) 0 0 0 0 0 Free Cash Flow (275,090) (37,180) (103,031) 127,635 97,428 (124,134) (77,859)Net Acquisitions and Divestitures 4,783 (3,166) (5,933) 3,335 6,137 (2,412) (2,729)Other Investments, Net (33,553) (1,468) (25,976) (24,766) (1,618) (9,080) (3,942)Net Debt Proceeds 162,761 208,371 199,941 7,559 13,694 129,366 274,936 Net Equity Proceeds — 0 0 280 0 0 0 Other, Financing Activities 7,784 (70,398) (34,721) (56,289) (22,993) (11,461) 4,490 Total Change in Cash (133,315) 96,159 30,280 57,754 92,648 (17,721) 194,896 Income Statement Net Revenue 2,399,654 4,383,017 2,884,649 2,051,059 1,884,995 1,728,393 1,389,217 Revenue Growth (%) — 51.9 40.6 8.8 9.06 129.6Operating EBIT 307,156 481,764 338,084 246,819 169,099 129,508 99,862 Gross Interest Expense 125,263 199,057 142,018 128,017 101,750 83,535 63,617 Net Income 70,133 10,792 43,843 35,129 (31,813) 3,185 4,649
Note: Numbers may not add due to rounding Source: Fitch Ratings and Compañía Latinoamericana de Infraestructura y Servicios S.A.
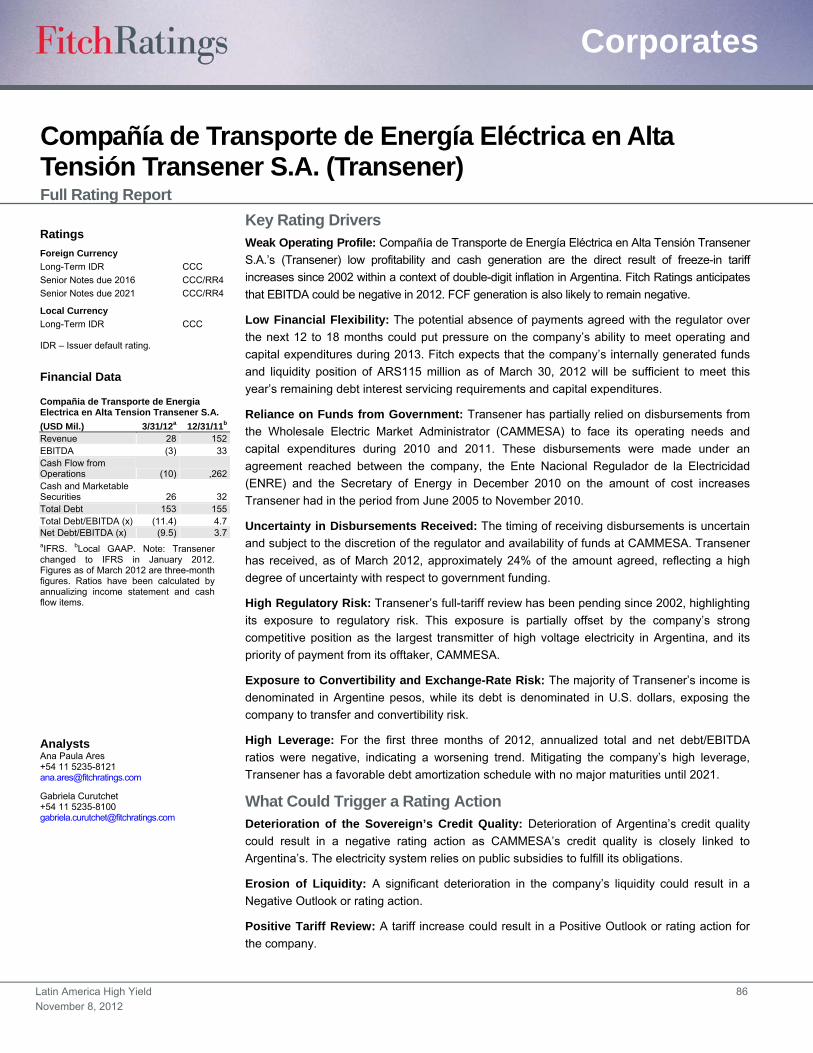
Latin America High Yield 86
November 8, 2012
Corporates
Compañía de Transporte de Energía Eléctrica en Alta Tensión Transener S.A. (Transener) Full Rating Report
Key Rating Drivers Weak Operating Profile: Compañía de Transporte de Energía Eléctrica en Alta Tensión Transener
S.A.’s (Transener) low profitability and cash generation are the direct result of freeze-in tariff
increases since 2002 within a context of double-digit inflation in Argentina. Fitch Ratings anticipates
that EBITDA could be negative in 2012. FCF generation is also likely to remain negative.
Low Financial Flexibility: The potential absence of payments agreed with the regulator over
the next 12 to 18 months could put pressure on the company’s ability to meet operating and
capital expenditures during 2013. Fitch expects that the company’s internally generated funds
and liquidity position of ARS115 million as of March 30, 2012 will be sufficient to meet this
year’s remaining debt interest servicing requirements and capital expenditures.
Reliance on Funds from Government: Transener has partially relied on disbursements from
the Wholesale Electric Market Administrator (CAMMESA) to face its operating needs and
capital expenditures during 2010 and 2011. These disbursements were made under an
agreement reached between the company, the Ente Nacional Regulador de la Electricidad
(ENRE) and the Secretary of Energy in December 2010 on the amount of cost increases
Transener had in the period from June 2005 to November 2010.
Uncertainty in Disbursements Received: The timing of receiving disbursements is uncertain
and subject to the discretion of the regulator and availability of funds at CAMMESA. Transener
has received, as of March 2012, approximately 24% of the amount agreed, reflecting a high
degree of uncertainty with respect to government funding.
High Regulatory Risk: Transener’s full-tariff review has been pending since 2002, highlighting
its exposure to regulatory risk. This exposure is partially offset by the company’s strong
competitive position as the largest transmitter of high voltage electricity in Argentina, and its
priority of payment from its offtaker, CAMMESA.
Exposure to Convertibility and Exchange-Rate Risk: The majority of Transener’s income is
denominated in Argentine pesos, while its debt is denominated in U.S. dollars, exposing the
company to transfer and convertibility risk.
High Leverage: For the first three months of 2012, annualized total and net debt/EBITDA
ratios were negative, indicating a worsening trend. Mitigating the company’s high leverage,
Transener has a favorable debt amortization schedule with no major maturities until 2021.
What Could Trigger a Rating Action Deterioration of the Sovereign’s Credit Quality: Deterioration of Argentina’s credit quality
could result in a negative rating action as CAMMESA’s credit quality is closely linked to
Argentina’s. The electricity system relies on public subsidies to fulfill its obligations.
Erosion of Liquidity: A significant deterioration in the company’s liquidity could result in a
Negative Outlook or rating action.
Positive Tariff Review: A tariff increase could result in a Positive Outlook or rating action for
the company.
Ratings
Foreign Currency
Long-Term IDR CCC
Senior Notes due 2016 CCC/RR4
Senior Notes due 2021 CCC/RR4
Local Currency
Long-Term IDR CCC
IDR – Issuer default rating.
Financial Data
Compañia de Transporte de Energia Electrica en Alta Tension Transener S.A.
(USD Mil.) 3/31/12a 12/31/11b Revenue 28 152 EBITDA (3) 33 Cash Flow from Operations (10) ,262 Cash and Marketable Securities 26 32 Total Debt 153 155 Total Debt/EBITDA (x) (11.4) 4.7 Net Debt/EBITDA (x) (9.5) 3.7 aIFRS. bLocal GAAP. Note: Transener changed to IFRS in January 2012. Figures as of March 2012 are three-month figures. Ratios have been calculated by annualizing income statement and cash flow items.
Analysts Ana Paula Ares +54 11 5235-8121 [email protected]
Gabriela Curutchet +54 11 5235-8100 [email protected]
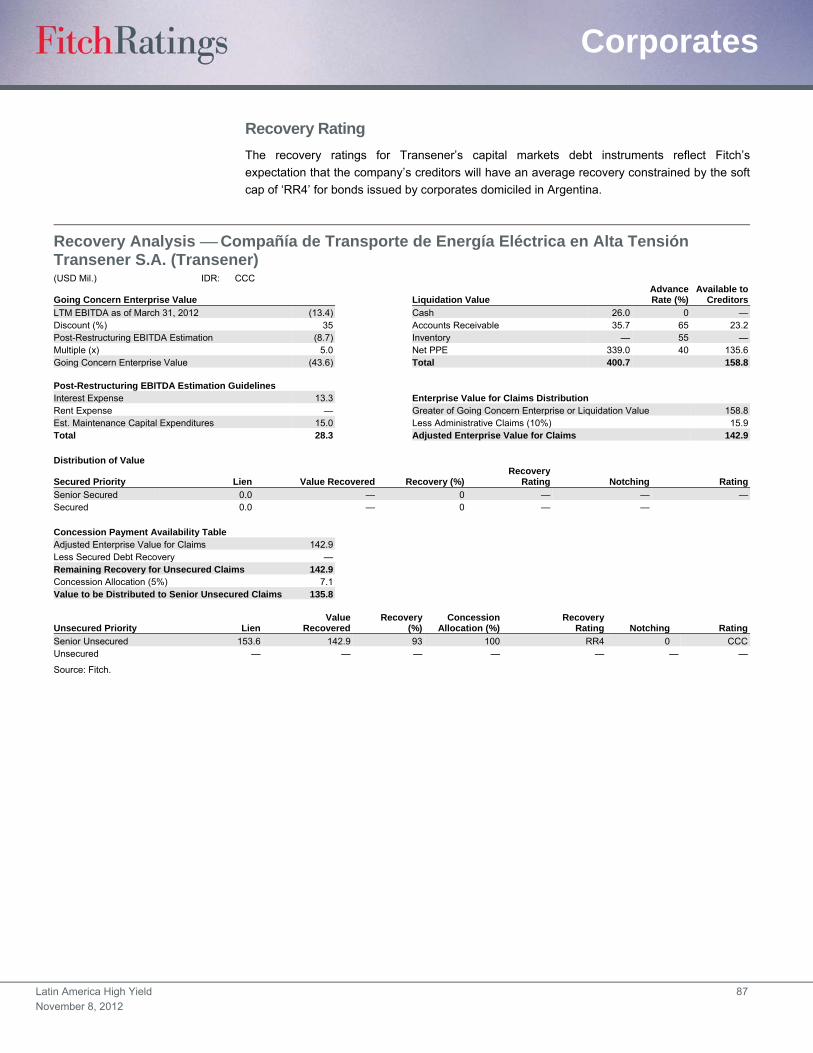
Latin America High Yield 87
November 8, 2012
Corporates
Recovery Rating
The recovery ratings for Transener’s capital markets debt instruments reflect Fitch’s
expectation that the company’s creditors will have an average recovery constrained by the soft
cap of ‘RR4’ for bonds issued by corporates domiciled in Argentina.
Recovery Analysis Compañía de Transporte de Energía Eléctrica en Alta Tensión Transener S.A. (Transener) (USD Mil.) IDR: CCC
Going Concern Enterprise Value Liquidation Value AdvanceRate (%)
Available toCreditors
LTM EBITDA as of March 31, 2012 (13.4) Cash 26.0 0 —Discount (%) 35 Accounts Receivable 35.7 65 23.2Post-Restructuring EBITDA Estimation (8.7) Inventory — 55 —Multiple (x) 5.0 Net PPE 339.0 40 135.6Going Concern Enterprise Value (43.6) Total 400.7 158.8 Post-Restructuring EBITDA Estimation Guidelines Interest Expense 13.3 Enterprise Value for Claims Distribution Rent Expense — Greater of Going Concern Enterprise or Liquidation Value 158.8Est. Maintenance Capital Expenditures 15.0 Less Administrative Claims (10%) 15.9Total 28.3 Adjusted Enterprise Value for Claims 142.9 Distribution of Value
Secured Priority Lien Value Recovered Recovery (%)Recovery
Rating Notching Rating
Senior Secured 0.0 — 0 — — —Secured 0.0 — 0 — — Concession Payment Availability Table Adjusted Enterprise Value for Claims 142.9 Less Secured Debt Recovery — Remaining Recovery for Unsecured Claims 142.9 Concession Allocation (5%) 7.1 Value to be Distributed to Senior Unsecured Claims 135.8
Unsecured Priority Lien Value
RecoveredRecovery
(%)Concession
Allocation (%)Recovery
Rating Notching Rating
Senior Unsecured 153.6 142.9 93 100 RR4 0 CCCUnsecured — — — — — — —
Source: Fitch.
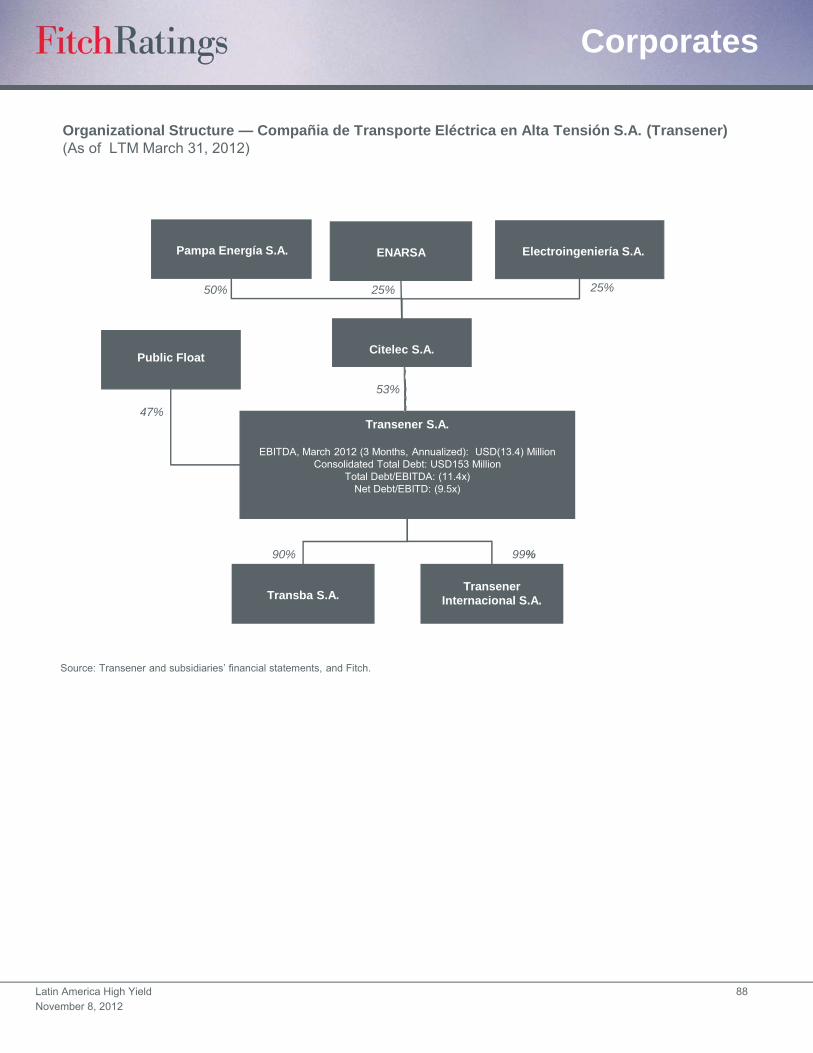
Latin America High Yield 88
November 8, 2012
Corporates
Organizational Structure — Compañia de Transporte Eléctrica en Alta Tensión S.A. (Transener)(As of LTM March 31, 2012)
Source: Transener and subsidiaries’ financial statements, and Fitch.
Transener S.A.
EBITDA, March 2012 (3 Months, Annualized): USD(13.4) MillionConsolidated Total Debt: USD153 Million
Total Debt/EBITDA: (11.4x)Net Debt/EBITD: (9.5x)
Transba S.A.
90%
Transener Internacional S.A.
99%
Public FloatCitelec S.A.
Pampa Energía S.A. ENARSA Electroingeniería S.A.
50% 25% 25%
47%
53%

Latin America High Yield 89
November 8, 2012
Corporates
Debt and Covenant Synopsis Compañía de Transporte de Energia Electrica en Alta Tension Transener S.A. (Transener)
Overview Issuer Compañía de Transporte de Energia Electrica en Alta Tension Transener S.A. (Transener) Guarantors N.A. — Debt is Senior Unsecured Document Date Dec. 20, 2006 Maturity Date Dec. 15, 2016 Description of Debt Senior Unsecured Notes Financial Covenants Consolidated Net Debt/ EBITDA (Maximum) N.A. Interest Coverage (Minimum) N.A.
Acquisitions/Divestitures Change of Control Provision Change of control clause at 100% of principal. Change of control means that the Argentine government directly or indirectly
owns over 50% of Transener’s voting rights. Sale of Assets Restriction The company and its affiliates might sell assets as long as 75% of the asset sale is paid in cash. Debt Restriction Additional Debt Restriction The issuer is not allowed to incur additional debt except permitted debt. Permitted debt includes debt used to refinance
existing or permitted indebtedness, subject to standard limitations. Transener can incur or maintain up to USD30 million of additional indebtedness if following such transaction interest coverage is above 2.0x and consolidated debt to EBITDA is below 3.75x. This figure is USD10 million for Transener’s subsidiaries. Debt can also be incurred to finance trade receivables, in connection with hedging agreements, and in respect to certain intercompany loans under certain conditions.
Limitation on Secured Debt The issuer and its subsidiaries are allowed to incur in customary permitted liens related to the normal course of business. These include a maximum outstanding debt of USD10 million.
Restricted Payments The issuer is prohibited from making dividend payments and from making certain investments, including the acquisition of stocks. The issuer is allowed to make restricted payments for up to USD20 million as long as it is in full compliance with the terms and conditions of the notes.
Other Cross Default N.A. Acceleration If any event of default occurs and is continuing, the trustee or the holders of at least 25% of the outstanding notes may
declare the notes to be due and payable. Notes become automatically due and payable upon certain events of insolvency or bankruptcy.
PIK Interest Rate N.A.
Intercompany Loans Intercompany loans are permitted and are not subordinated to the notes. Restriction on Purchase of Notes The issuer may rescue the notes since Dec. 15, 2011 at par value plus 0.5 of annual interest rate in 2011, par value plus
0.25 of annual interest rate in 2012, at par value plus 0.125 of annual interest rate in 2013, and at par value in 2014 and on. Transactions with Affiliates Transactions between the issuer and affiliates for over USD5 million require approval from the board of directors and above
USD20 million require a fairness opinion. Limits on Consolidations or Mergers Restrictions on merger of issuer and subsidiaries. Exceptions include that the surviving entity will be a corporation existing
under the laws of Argentina or United States, no event of default occurs or is continuing, the company’s pro forma debt levels allow it to incur additional indebtedness. Any surviving entity would assume all obligations of issuers under the indenture.
N.A. Not applicable. Disclaimer: The covenant summaries reflect Fitch’s interpretation and synopsis of information contained in publicly available documents identified in the “Document Date and Location” section of each covenant summary table. Fitch cannot ensure that the information contained in such documents is either accurate or complete, or that the covenant summaries, or any particular covenant summary, accurately or completely reflect the key terms of any such document. The information presented in the covenant summaries is provided “as is” without any representation or warranty and is not a substitute for information provided to investors by an issuer and its agents in connection with a sale of securities. Source: Company and Fitch Ratings.

Latin America High Yield 90
November 8, 2012
Corporates
Debt and Covenant Synopsis Compañía de Transporte de Energia Electrica en Alta Tension S.A. (Transener)
Overview Issuer Compañía de Transporte de Energia Electrica en Alta Tension Transener S.A. (Transener) Guarantors N.A. — Debt is Senior Unsecured Document Date Aug. 2, 2011 Maturity Date Aug. 15, 2021 Description of Debt Senior Unsecured Notes Financial Covenants Consolidated Net Debt/ EBITDA (Maximum) N.A. Interest Coverage (Minimum) N.A. Acquisitions/Divestitures Change of Control Provision Change of control clause at 101% of principal. Sale of Assets Restriction The company and its affiliates might sell assets as long as 75% of the asset sale is paid in cash. Debt Restriction Additional Debt Restriction The issuer is not allowed to incur additional debt except permitted debt. Permitted debt includes debt used to refinance
existing or permitted indebtedness, subject to standard limitations. Transener can incur or maintain up to USD30 million of additional indebtedness if following such transaction interest coverage is above 2.0x and consolidated debt to EBITDA is below 3.75x. This figure is USD10 million for Transener’s subsidiaries. Debt can also be incurred to finance trade receivables in connection with hedging agreements, and in respect to certain intercompany loans under certain conditions.
Limitation on Secured Debt The issuer and its subsidiaries are allowed to incur in customary permitted liens related to the normal course of business. These include a maximum outstanding debt of USD10 million.
Restricted Payments The issuer is prohibited from making dividend payments and from making certain investments, including the acquisition of stocks. The issuer is allowed to make restricted payments for up to USD20 million as long as it is in full compliance with the terms and conditions of the notes.
Other Cross Default N.A. Acceleration If any event of default occurs and is continuing, the trustee or the holders of at least 25% of the outstanding notes may
declare the notes to be due and payable. Notes become automatically due and payable upon certain events of insolvency or bankruptcy.
PIK Interest Rate N.A. Intercompany Loans Intercompany loans are permitted and are not subordinated to the notes. Restriction on Purchase of Notes The issuer may elect to redeem the notes at any time after the fifth anniversary of the date of issuance, inclusive, in its
entirety, not partially, rescue at the following prices, expressed as percentages of nominal value: 2016 100% + 50% of coupon, 2017 100% + 25% of coupon, 2018 100% + 12,5% of coupon, 2019 and thereafter 100%.
Transactions with Affiliates Transactions between the issuer and affiliates for over USD5 million require approval from the board of directors, and above USD20 million require a fairness opinion.
Limits on Consolidations or Mergers Restrictions on merger of issuer and subsidiaries. Exceptions include that the surviving entity will be a corporation existing under the laws of Argentina or United States, no event of default occurs or is continuing, the company’s pro forma debt levels allow it to incur additional indebtedness. Any surviving entity would assume all obligations of issuers under the indenture.
N.A. Not applicable. Disclaimer: The covenant summaries reflect Fitch’s interpretation and synopsis of information contained in publicly available documents identified in the “Document Date and Location” section of each covenant summary table. Fitch cannot ensure that the information contained in such documents is either accurate or complete, or that the covenant summaries, or any particular covenant summary, accurately or completely reflect the key terms of any such document. The information presented in the covenant summaries is provided “as is” without any representation or warranty and is not a substitute for information provided to investors by an issuer and its agents in connection with a sale of securities. Source: Company and Fitch Ratings.
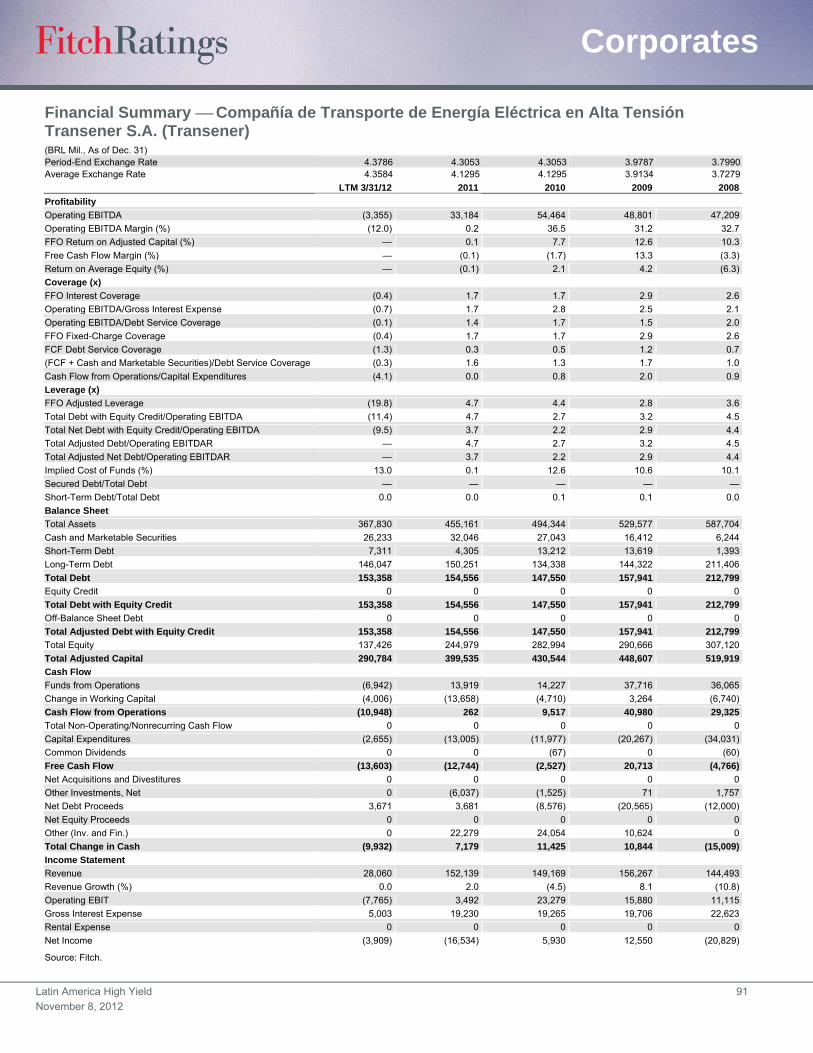
Latin America High Yield 91
November 8, 2012
Corporates
Financial Summary Compañía de Transporte de Energía Eléctrica en Alta Tensión Transener S.A. (Transener) (BRL Mil., As of Dec. 31) Period-End Exchange Rate 4.3786 4.3053 4.3053 3.9787 3.7990Average Exchange Rate 4.3584 4.1295 4.1295 3.9134 3.7279
LTM 3/31/12 2011 2010 2009 2008
Profitability
Operating EBITDA (3,355) 33,184 54,464 48,801 47,209
Operating EBITDA Margin (%) (12.0) 0.2 36.5 31.2 32.7
FFO Return on Adjusted Capital (%) — 0.1 7.7 12.6 10.3
Free Cash Flow Margin (%) — (0.1) (1.7) 13.3 (3.3)
Return on Average Equity (%) — (0.1) 2.1 4.2 (6.3)
Coverage (x)
FFO Interest Coverage (0.4) 1.7 1.7 2.9 2.6
Operating EBITDA/Gross Interest Expense (0.7) 1.7 2.8 2.5 2.1
Operating EBITDA/Debt Service Coverage (0.1) 1.4 1.7 1.5 2.0
FFO Fixed-Charge Coverage (0.4) 1.7 1.7 2.9 2.6
FCF Debt Service Coverage (1.3) 0.3 0.5 1.2 0.7
(FCF + Cash and Marketable Securities)/Debt Service Coverage (0.3) 1.6 1.3 1.7 1.0
Cash Flow from Operations/Capital Expenditures (4.1) 0.0 0.8 2.0 0.9
Leverage (x)
FFO Adjusted Leverage (19.8) 4.7 4.4 2.8 3.6
Total Debt with Equity Credit/Operating EBITDA (11.4) 4.7 2.7 3.2 4.5
Total Net Debt with Equity Credit/Operating EBITDA (9.5) 3.7 2.2 2.9 4.4
Total Adjusted Debt/Operating EBITDAR — 4.7 2.7 3.2 4.5
Total Adjusted Net Debt/Operating EBITDAR — 3.7 2.2 2.9 4.4
Implied Cost of Funds (%) 13.0 0.1 12.6 10.6 10.1
Secured Debt/Total Debt — — — — —
Short-Term Debt/Total Debt 0.0 0.0 0.1 0.1 0.0
Balance Sheet
Total Assets 367,830 455,161 494,344 529,577 587,704
Cash and Marketable Securities 26,233 32,046 27,043 16,412 6,244
Short-Term Debt 7,311 4,305 13,212 13,619 1,393
Long-Term Debt 146,047 150,251 134,338 144,322 211,406
Total Debt 153,358 154,556 147,550 157,941 212,799
Equity Credit 0 0 0 0 0
Total Debt with Equity Credit 153,358 154,556 147,550 157,941 212,799
Off-Balance Sheet Debt 0 0 0 0 0
Total Adjusted Debt with Equity Credit 153,358 154,556 147,550 157,941 212,799
Total Equity 137,426 244,979 282,994 290,666 307,120
Total Adjusted Capital 290,784 399,535 430,544 448,607 519,919
Cash Flow
Funds from Operations (6,942) 13,919 14,227 37,716 36,065
Change in Working Capital (4,006) (13,658) (4,710) 3,264 (6,740)
Cash Flow from Operations (10,948) 262 9,517 40,980 29,325
Total Non-Operating/Nonrecurring Cash Flow 0 0 0 0 0
Capital Expenditures (2,655) (13,005) (11,977) (20,267) (34,031)
Common Dividends 0 0 (67) 0 (60)
Free Cash Flow (13,603) (12,744) (2,527) 20,713 (4,766)
Net Acquisitions and Divestitures 0 0 0 0 0
Other Investments, Net 0 (6,037) (1,525) 71 1,757
Net Debt Proceeds 3,671 3,681 (8,576) (20,565) (12,000)
Net Equity Proceeds 0 0 0 0 0
Other (Inv. and Fin.) 0 22,279 24,054 10,624 0
Total Change in Cash (9,932) 7,179 11,425 10,844 (15,009)
Income Statement
Revenue 28,060 152,139 149,169 156,267 144,493
Revenue Growth (%) 0.0 2.0 (4.5) 8.1 (10.8)
Operating EBIT (7,765) 3,492 23,279 15,880 11,115
Gross Interest Expense 5,003 19,230 19,265 19,706 22,623
Rental Expense 0 0 0 0 0
Net Income (3,909) (16,534) 5,930 12,550 (20,829)
Source: Fitch.
Latin America High Yield 92
November 8, 2012
Corporates
Corporacion Electrica Nacional S.A. (CORPOELEC) Full Rating Report
Key Rating Drivers Ratings Linked to the Government: Corporacion Electrica Nacional S.A.’s (CORPOELEC)
ratings reflect its ownership by the Republic of Venezuela, to which its ratings are tied. The
company is overseen by the Ministry of Popular Power for Electricity (MPPE), its sole
shareholder. CORPOELEC has a public mandate to operate the nation’s electricity sector
according to the planning directives of the MPPE and depends on public sector transfers for
the sustainability of its operations.
Monopolistic Position: CORPOELEC is a vertically integrated public utility responsible for the
operation of the country’s electricity assets and the provision of electricity services in
Venezuela. CORPOELEC was created in 2007 when the government nationalized the
electricity sector. The entity absorbed all of the country’s generation assets along with its
transmission, distribution, and electric power retail infrastructure during the period 2010 to 2011.
This provided CORPOELEC with an installed capacity of 25,655 MW and a client base of
5.7 million users as of December 2011.
Negative Operational Results Expected to Continue: The current tariff regime has been in
place since 2002, and no tariff adjustments are expected in the near future. This situation will
exacerbate CORPOELEC’s negative operational performance and will increase its dependence
on public funding going forward. This status quo will continue to erode the entity’s credit profile
on a standalone basis.
Sovereign Support Needed to Fund Capex: The company receives explicit support from both
the central government through operational and capital expenditure allocations contained in the
nation’s budget, and from PDVSA in the form of subsidized fuel costs. CORPOELEC received
USD3.4 billion of government financing split across various agencies in 2011. For 2012,
CORPOELEC’s capex will be financed with funds from the special indebtedness law, as
contained in the national budget, for approximately USD2.2 billion in addition to financing from
other government sources. These funds will be used to combine 4,329 MW of thermoelectric
generation capacity and associated infrastructure in 2012.
Liquidity Depends on Public Sector’s Current Transfers: CORPOELEC received
USD540 million in current transfers in order to cover operational costs during 2011. For 2012,
the company has resources earmarked from the national budget totaling USD980 million to
meet its day to day operations.
Pro Forma Debt Structure: At Dec. 31, 2011, CORPOELEC’s pro forma financial long-term debt
was USD6,688 million, of which USD663 million constituted the absorbed EDC bond issuance,
rated ‘B+/RR4’ by Fitch. C.A. La Electricidad de Caracas’ (EDC) USD663 million senior
unsecured bond issuance due 2014 and 2018 is now a direct obligation of CORPOELEC as the
latter took control of EDC on Dec. 22, 2011. EDC ceased to exist in April 2012. CORPOELEC’s
audited 2011 financial statements were not available at the time of publication.
What Could Trigger a Rating Action Key Rating Drivers: A downgrade of the sovereign or lack of sovereign support would lead to
a downgrade of CORPOELEC’s ratings. An upgrade of the sovereign would be viewed
positively and could lead to a positive rating action.
Ratings
Foreign Currency
Long-Term FC IDR B+
Long-Term LC IDR B+
Senior Unsecured B+/RR4
FC – Foreign currency. LC – Local currency. IDR – Issuer default rating.
Rating Outlooks Long-Term LC and FC IDR Negative
Analysts Julio Ugueto +58 212 286-3356 [email protected]
Lucas Aristizabal +1 312 368-3260 [email protected]

Latin America High Yield 93
November 8, 2012
Corporates
Recovery Analysis
Fitch’s “Country-Specific Treatment of Recovery Ratings” criteria published June 15, 2012 has
been used to cap the rating at ‘RR4’. In this criteria report, Venezuela is categorized as a
Group D jurisdiction, which has a soft cap for recovery ratings at ‘RR4’.
República Bolivariana de Venezuela
Ministerio del Poder Popular para la Energía Eléctrica
Corporacion ElectricaNacional S.A. (CORPOELEC)
Administradora Serdeco C.A.
EDC Network Comunicaciones S.C.S.
Comunicaciones Moviles ‘‘Conmovil’’
Source: CORPOELEC.
Proccedatos Aracoy
Organizational Structure — CORPOELEC
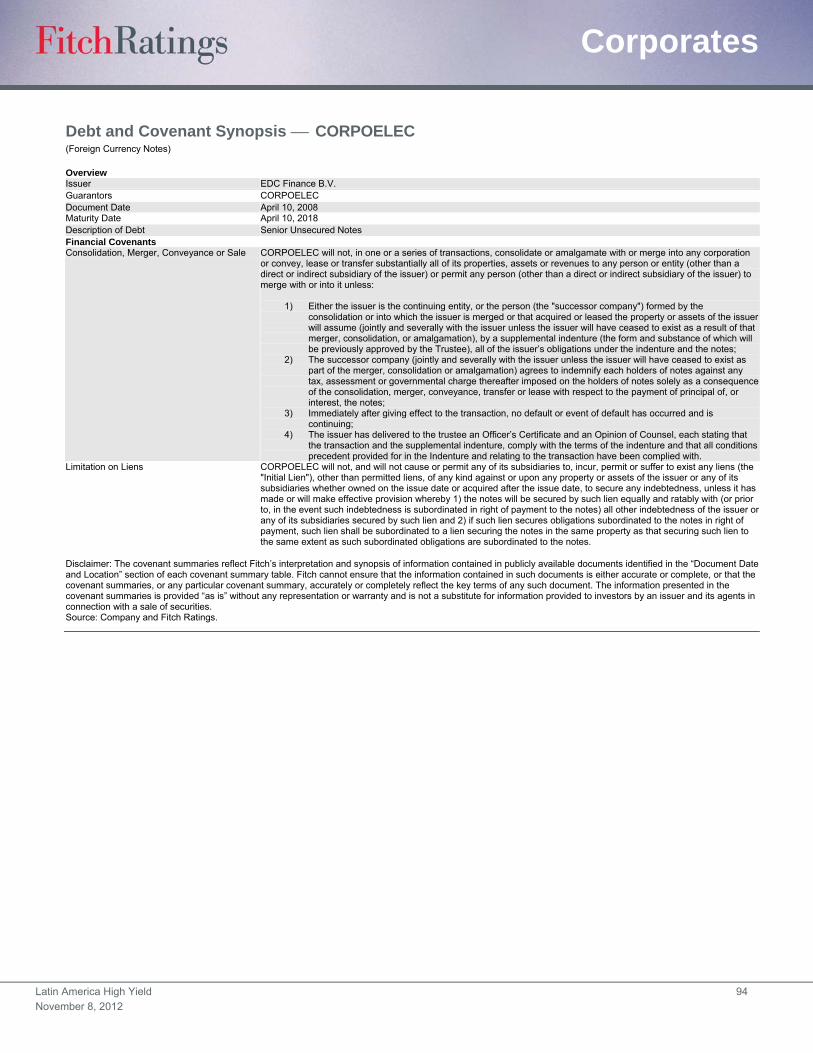
Latin America High Yield 94
November 8, 2012
Corporates
Debt and Covenant Synopsis CORPOELEC (Foreign Currency Notes)
Overview Issuer EDC Finance B.V. Guarantors CORPOELEC Document Date April 10, 2008 Maturity Date April 10, 2018 Description of Debt Senior Unsecured Notes Financial Covenants Consolidation, Merger, Conveyance or Sale CORPOELEC will not, in one or a series of transactions, consolidate or amalgamate with or merge into any corporation
or convey, lease or transfer substantially all of its properties, assets or revenues to any person or entity (other than a direct or indirect subsidiary of the issuer) or permit any person (other than a direct or indirect subsidiary of the issuer) to merge with or into it unless:
1) Either the issuer is the continuing entity, or the person (the "successor company") formed by the consolidation or into which the issuer is merged or that acquired or leased the property or assets of the issuer will assume (jointly and severally with the issuer unless the issuer will have ceased to exist as a result of that merger, consolidation, or amalgamation), by a supplemental indenture (the form and substance of which will be previously approved by the Trustee), all of the issuer’s obligations under the indenture and the notes;
2) The successor company (jointly and severally with the issuer unless the issuer will have ceased to exist as part of the merger, consolidation or amalgamation) agrees to indemnify each holders of notes against any tax, assessment or governmental charge thereafter imposed on the holders of notes solely as a consequence of the consolidation, merger, conveyance, transfer or lease with respect to the payment of principal of, or interest, the notes;
3) Immediately after giving effect to the transaction, no default or event of default has occurred and is continuing;
4) The issuer has delivered to the trustee an Officer’s Certificate and an Opinion of Counsel, each stating that the transaction and the supplemental indenture, comply with the terms of the indenture and that all conditions precedent provided for in the Indenture and relating to the transaction have been complied with.
Limitation on Liens CORPOELEC will not, and will not cause or permit any of its subsidiaries to, incur, permit or suffer to exist any liens (the "Initial Lien"), other than permitted liens, of any kind against or upon any property or assets of the issuer or any of its subsidiaries whether owned on the issue date or acquired after the issue date, to secure any indebtedness, unless it has made or will make effective provision whereby 1) the notes will be secured by such lien equally and ratably with (or prior to, in the event such indebtedness is subordinated in right of payment to the notes) all other indebtedness of the issuer or any of its subsidiaries secured by such lien and 2) if such lien secures obligations subordinated to the notes in right of payment, such lien shall be subordinated to a lien securing the notes in the same property as that securing such lien to the same extent as such subordinated obligations are subordinated to the notes.
Disclaimer: The covenant summaries reflect Fitch’s interpretation and synopsis of information contained in publicly available documents identified in the “Document Date and Location” section of each covenant summary table. Fitch cannot ensure that the information contained in such documents is either accurate or complete, or that the covenant summaries, or any particular covenant summary, accurately or completely reflect the key terms of any such document. The information presented in the covenant summaries is provided “as is” without any representation or warranty and is not a substitute for information provided to investors by an issuer and its agents in connection with a sale of securities. Source: Company and Fitch Ratings.
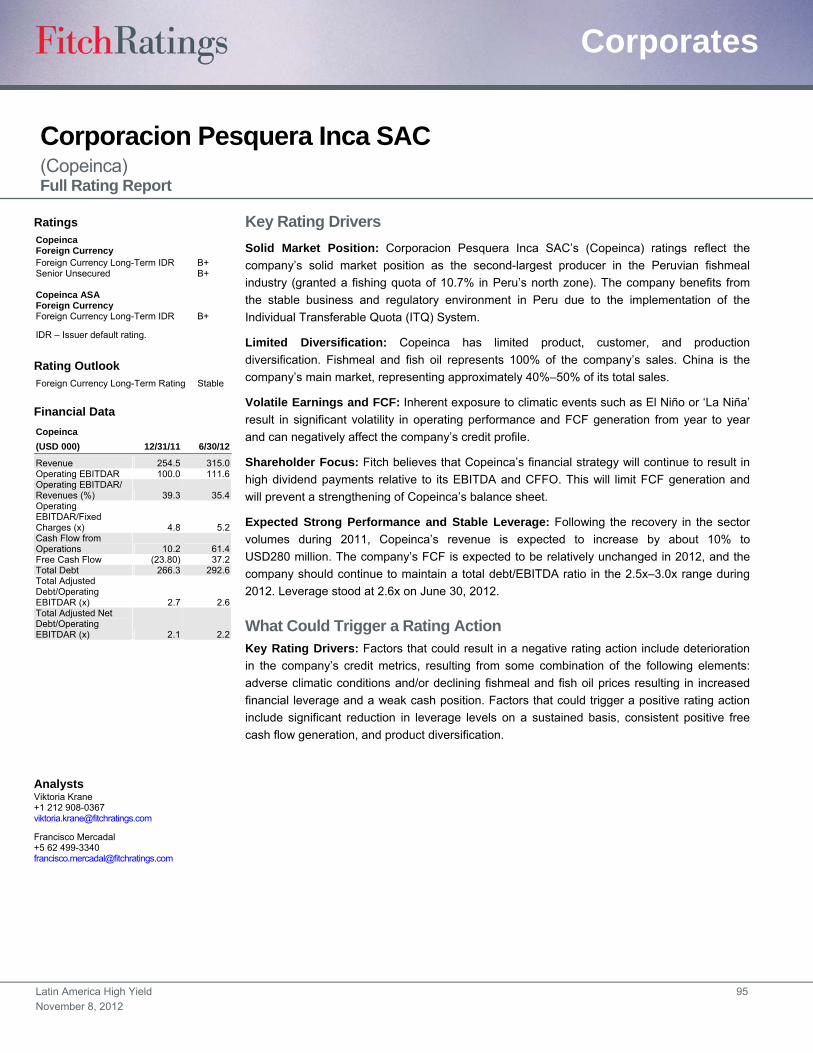
Latin America High Yield 95
November 8, 2012
Corporates
Corporacion Pesquera Inca SAC (Copeinca) Full Rating Report
Key Rating Drivers
Solid Market Position: Corporacion Pesquera Inca SAC’s (Copeinca) ratings reflect the
company’s solid market position as the second-largest producer in the Peruvian fishmeal
industry (granted a fishing quota of 10.7% in Peru’s north zone). The company benefits from
the stable business and regulatory environment in Peru due to the implementation of the
Individual Transferable Quota (ITQ) System.
Limited Diversification: Copeinca has limited product, customer, and production
diversification. Fishmeal and fish oil represents 100% of the company’s sales. China is the
company’s main market, representing approximately 40%–50% of its total sales.
Volatile Earnings and FCF: Inherent exposure to climatic events such as El Niño or ‘La Niña’
result in significant volatility in operating performance and FCF generation from year to year
and can negatively affect the company’s credit profile.
Shareholder Focus: Fitch believes that Copeinca’s financial strategy will continue to result in
high dividend payments relative to its EBITDA and CFFO. This will limit FCF generation and
will prevent a strengthening of Copeinca’s balance sheet.
Expected Strong Performance and Stable Leverage: Following the recovery in the sector
volumes during 2011, Copeinca’s revenue is expected to increase by about 10% to
USD280 million. The company’s FCF is expected to be relatively unchanged in 2012, and the
company should continue to maintain a total debt/EBITDA ratio in the 2.5x–3.0x range during
2012. Leverage stood at 2.6x on June 30, 2012.
What Could Trigger a Rating Action Key Rating Drivers: Factors that could result in a negative rating action include deterioration
in the company’s credit metrics, resulting from some combination of the following elements:
adverse climatic conditions and/or declining fishmeal and fish oil prices resulting in increased
financial leverage and a weak cash position. Factors that could trigger a positive rating action
include significant reduction in leverage levels on a sustained basis, consistent positive free
cash flow generation, and product diversification.
Ratings Copeinca Foreign Currency Foreign Currency Long-Term IDR B+ Senior Unsecured B+ Copeinca ASA Foreign Currency Foreign Currency Long-Term IDR B+
IDR – Issuer default rating.
Rating Outlook Foreign Currency Long-Term Rating Stable
Financial Data
Copeinca
(USD 000) 12/31/11 6/30/12
Revenue 254.5 315.0 Operating EBITDAR 100.0 111.6 Operating EBITDAR/ Revenues (%) 39.3 35.4 Operating EBITDAR/Fixed Charges (x) 4.8 5.2 Cash Flow from Operations 10.2 61.4 Free Cash Flow (23.80) 37.2 Total Debt 266.3 292.6 Total Adjusted Debt/Operating EBITDAR (x) 2.7 2.6 Total Adjusted Net Debt/Operating EBITDAR (x) 2.1 2.2
Analysts Viktoria Krane +1 212 908-0367 [email protected]
Francisco Mercadal +5 62 499-3340 [email protected]
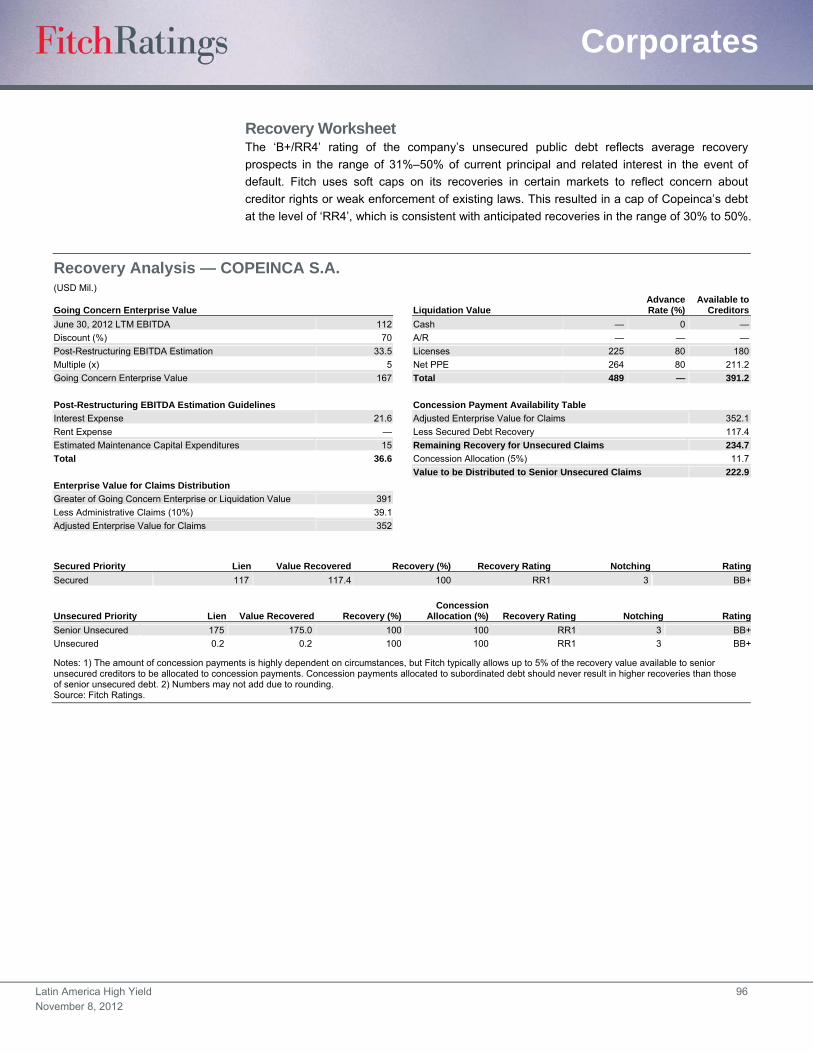
Latin America High Yield 96
November 8, 2012
Corporates
Recovery Worksheet The ‘B+/RR4’ rating of the company’s unsecured public debt reflects average recovery
prospects in the range of 31%–50% of current principal and related interest in the event of
default. Fitch uses soft caps on its recoveries in certain markets to reflect concern about
creditor rights or weak enforcement of existing laws. This resulted in a cap of Copeinca’s debt
at the level of ‘RR4’, which is consistent with anticipated recoveries in the range of 30% to 50%.
Recovery Analysis — COPEINCA S.A.
(USD Mil.)
Going Concern Enterprise Value Liquidation Value Advance Rate (%)
Available to Creditors
June 30, 2012 LTM EBITDA 112 Cash — 0 —
Discount (%) 70 A/R — — —
Post-Restructuring EBITDA Estimation 33.5 Licenses 225 80 180
Multiple (x) 5 Net PPE 264 80 211.2
Going Concern Enterprise Value 167 Total 489 — 391.2
Post-Restructuring EBITDA Estimation Guidelines Concession Payment Availability Table
Interest Expense 21.6 Adjusted Enterprise Value for Claims 352.1
Rent Expense — Less Secured Debt Recovery 117.4
Estimated Maintenance Capital Expenditures 15 Remaining Recovery for Unsecured Claims 234.7
Total 36.6 Concession Allocation (5%) 11.7
Value to be Distributed to Senior Unsecured Claims 222.9
Enterprise Value for Claims Distribution
Greater of Going Concern Enterprise or Liquidation Value 391
Less Administrative Claims (10%) 39.1
Adjusted Enterprise Value for Claims 352
Secured Priority Lien Value Recovered Recovery (%) Recovery Rating Notching Rating
Secured 117 117.4 100 RR1 3 BB+
Unsecured Priority Lien Value Recovered Recovery (%)Concession
Allocation (%) Recovery Rating Notching Rating
Senior Unsecured 175 175.0 100 100 RR1 3 BB+
Unsecured 0.2 0.2 100 100 RR1 3 BB+
Notes: 1) The amount of concession payments is highly dependent on circumstances, but Fitch typically allows up to 5% of the recovery value available to senior unsecured creditors to be allocated to concession payments. Concession payments allocated to subordinated debt should never result in higher recoveries than those of senior unsecured debt. 2) Numbers may not add due to rounding. Source: Fitch Ratings.
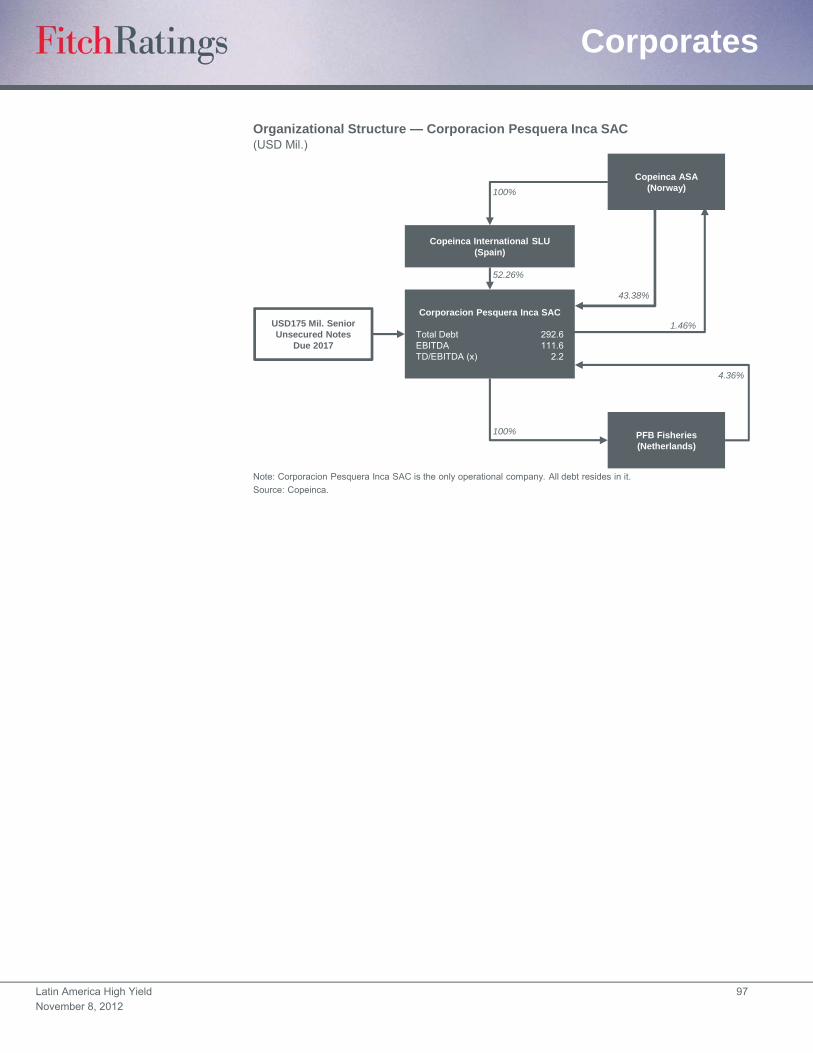
Latin America High Yield 97
November 8, 2012
Corporates
Organizational Structure — Corporacion Pesquera Inca SAC(USD Mil.)
Note: Corporacion Pesquera Inca SAC is the only operational company. All debt resides in it.
Source: Copeinca.
Copeinca ASA(Norway)
PFB Fisheries(Netherlands)
Copeinca International SLU(Spain)
Corporacion Pesquera Inca SAC
Total Debt 292.6EBITDA 111.6TD/EBITDA (x) 2.2
USD175 Mil. Senior Unsecured Notes
Due 2017
100%
100%
52.26%
43.38%
1.46%
4.36%
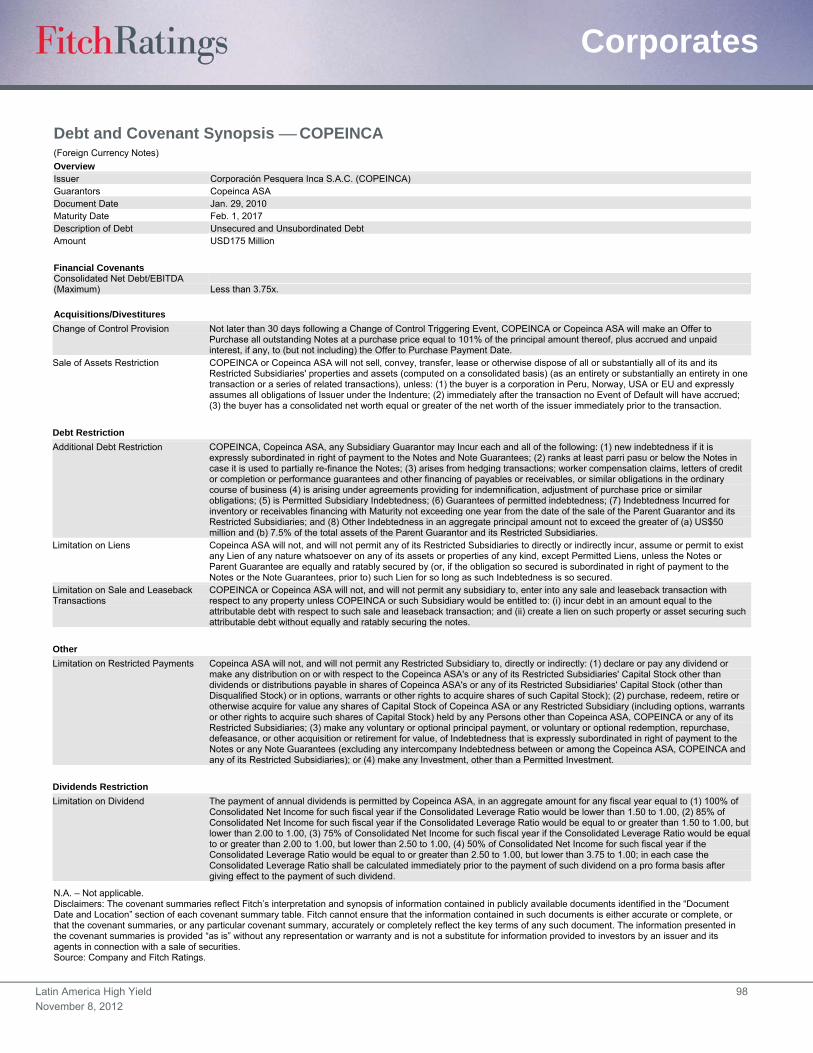
Latin America High Yield 98
November 8, 2012
Corporates
Debt and Covenant Synopsis COPEINCA (Foreign Currency Notes)
Overview Issuer Corporación Pesquera Inca S.A.C. (COPEINCA) Guarantors Copeinca ASA Document Date Jan. 29, 2010 Maturity Date Feb. 1, 2017 Description of Debt Unsecured and Unsubordinated Debt Amount USD175 Million
Financial Covenants Consolidated Net Debt/EBITDA (Maximum) Less than 3.75x.
Acquisitions/Divestitures
Change of Control Provision Not later than 30 days following a Change of Control Triggering Event, COPEINCA or Copeinca ASA will make an Offer to Purchase all outstanding Notes at a purchase price equal to 101% of the principal amount thereof, plus accrued and unpaid interest, if any, to (but not including) the Offer to Purchase Payment Date.
Sale of Assets Restriction COPEINCA or Copeinca ASA will not sell, convey, transfer, lease or otherwise dispose of all or substantially all of its and its Restricted Subsidiaries' properties and assets (computed on a consolidated basis) (as an entirety or substantially an entirety in one transaction or a series of related transactions), unless: (1) the buyer is a corporation in Peru, Norway, USA or EU and expressly assumes all obligations of Issuer under the Indenture; (2) immediately after the transaction no Event of Default will have accrued; (3) the buyer has a consolidated net worth equal or greater of the net worth of the issuer immediately prior to the transaction.
Debt Restriction
Additional Debt Restriction COPEINCA, Copeinca ASA, any Subsidiary Guarantor may Incur each and all of the following: (1) new indebtedness if it is expressly subordinated in right of payment to the Notes and Note Guarantees; (2) ranks at least parri pasu or below the Notes in case it is used to partially re-finance the Notes; (3) arises from hedging transactions; worker compensation claims, letters of credit or completion or performance guarantees and other financing of payables or receivables, or similar obligations in the ordinary course of business (4) is arising under agreements providing for indemnification, adjustment of purchase price or similar obligations; (5) is Permitted Subsidiary Indebtedness; (6) Guarantees of permitted indebtedness; (7) Indebtedness Incurred for inventory or receivables financing with Maturity not exceeding one year from the date of the sale of the Parent Guarantor and its Restricted Subsidiaries; and (8) Other Indebtedness in an aggregate principal amount not to exceed the greater of (a) US$50 million and (b) 7.5% of the total assets of the Parent Guarantor and its Restricted Subsidiaries.
Limitation on Liens Copeinca ASA will not, and will not permit any of its Restricted Subsidiaries to directly or indirectly incur, assume or permit to exist any Lien of any nature whatsoever on any of its assets or properties of any kind, except Permitted Liens, unless the Notes or Parent Guarantee are equally and ratably secured by (or, if the obligation so secured is subordinated in right of payment to the Notes or the Note Guarantees, prior to) such Lien for so long as such Indebtedness is so secured.
Limitation on Sale and Leaseback Transactions
COPEINCA or Copeinca ASA will not, and will not permit any subsidiary to, enter into any sale and leaseback transaction with respect to any property unless COPEINCA or such Subsidiary would be entitled to: (i) incur debt in an amount equal to the attributable debt with respect to such sale and leaseback transaction; and (ii) create a lien on such property or asset securing such attributable debt without equally and ratably securing the notes.
Other
Limitation on Restricted Payments Copeinca ASA will not, and will not permit any Restricted Subsidiary to, directly or indirectly: (1) declare or pay any dividend or make any distribution on or with respect to the Copeinca ASA's or any of its Restricted Subsidiaries' Capital Stock other than dividends or distributions payable in shares of Copeinca ASA's or any of its Restricted Subsidiaries' Capital Stock (other than Disqualified Stock) or in options, warrants or other rights to acquire shares of such Capital Stock); (2) purchase, redeem, retire or otherwise acquire for value any shares of Capital Stock of Copeinca ASA or any Restricted Subsidiary (including options, warrants or other rights to acquire such shares of Capital Stock) held by any Persons other than Copeinca ASA, COPEINCA or any of its Restricted Subsidiaries; (3) make any voluntary or optional principal payment, or voluntary or optional redemption, repurchase, defeasance, or other acquisition or retirement for value, of Indebtedness that is expressly subordinated in right of payment to the Notes or any Note Guarantees (excluding any intercompany Indebtedness between or among the Copeinca ASA, COPEINCA and any of its Restricted Subsidiaries); or (4) make any Investment, other than a Permitted Investment.
Dividends Restriction
Limitation on Dividend The payment of annual dividends is permitted by Copeinca ASA, in an aggregate amount for any fiscal year equal to (1) 100% of Consolidated Net Income for such fiscal year if the Consolidated Leverage Ratio would be lower than 1.50 to 1.00, (2) 85% of Consolidated Net Income for such fiscal year if the Consolidated Leverage Ratio would be equal to or greater than 1.50 to 1.00, but lower than 2.00 to 1.00, (3) 75% of Consolidated Net Income for such fiscal year if the Consolidated Leverage Ratio would be equal to or greater than 2.00 to 1.00, but lower than 2.50 to 1.00, (4) 50% of Consolidated Net Income for such fiscal year if the Consolidated Leverage Ratio would be equal to or greater than 2.50 to 1.00, but lower than 3.75 to 1.00; in each case the Consolidated Leverage Ratio shall be calculated immediately prior to the payment of such dividend on a pro forma basis after giving effect to the payment of such dividend.
N.A. – Not applicable. Disclaimers: The covenant summaries reflect Fitch’s interpretation and synopsis of information contained in publicly available documents identified in the “Document Date and Location” section of each covenant summary table. Fitch cannot ensure that the information contained in such documents is either accurate or complete, or that the covenant summaries, or any particular covenant summary, accurately or completely reflect the key terms of any such document. The information presented in the covenant summaries is provided “as is” without any representation or warranty and is not a substitute for information provided to investors by an issuer and its agents in connection with a sale of securities. Source: Company and Fitch Ratings.
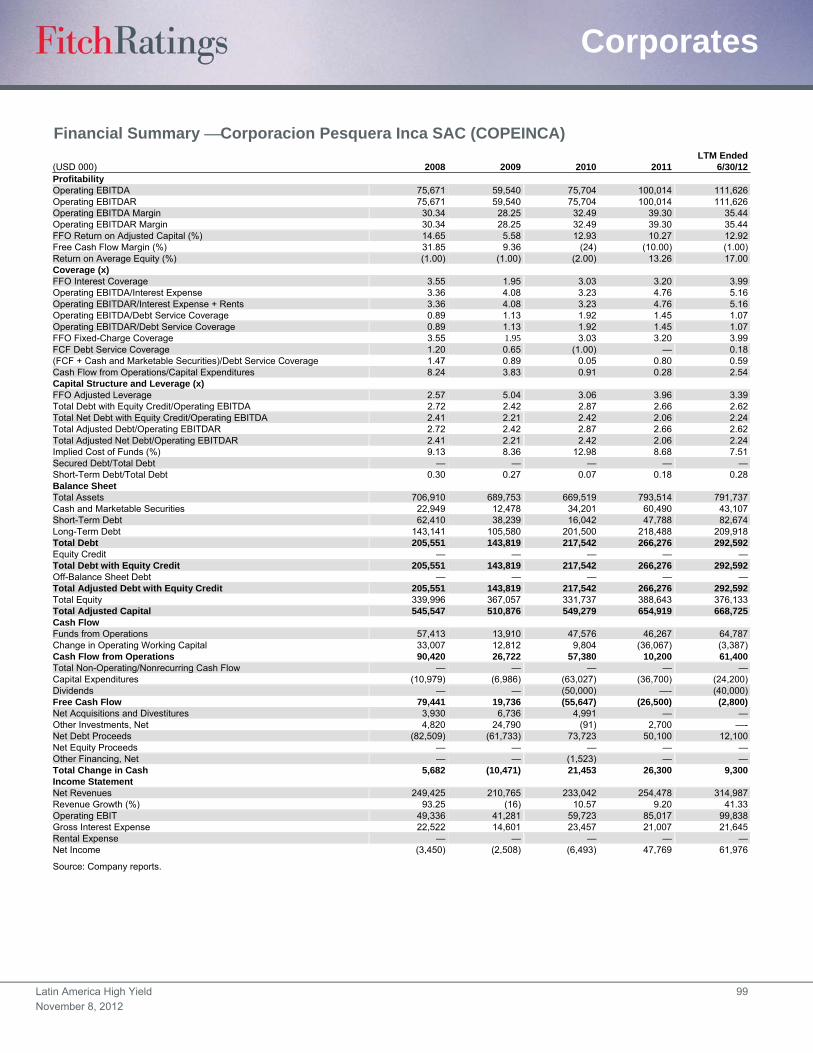
Latin America High Yield 99
November 8, 2012
Corporates
Financial Summary Corporacion Pesquera Inca SAC (COPEINCA) LTM Ended
(USD 000) 2008 2009 2010 2011 6/30/12Profitability Operating EBITDA 75,671 59,540 75,704 100,014 111,626Operating EBITDAR 75,671 59,540 75,704 100,014 111,626Operating EBITDA Margin 30.34 28.25 32.49 39.30 35.44Operating EBITDAR Margin 30.34 28.25 32.49 39.30 35.44FFO Return on Adjusted Capital (%) 14.65 5.58 12.93 10.27 12.92Free Cash Flow Margin (%) 31.85 9.36 (24) (10.00) (1.00)Return on Average Equity (%) (1.00) (1.00) (2.00) 13.26 17.00Coverage (x) FFO Interest Coverage 3.55 1.95 3.03 3.20 3.99Operating EBITDA/Interest Expense 3.36 4.08 3.23 4.76 5.16Operating EBITDAR/Interest Expense + Rents 3.36 4.08 3.23 4.76 5.16Operating EBITDA/Debt Service Coverage 0.89 1.13 1.92 1.45 1.07Operating EBITDAR/Debt Service Coverage 0.89 1.13 1.92 1.45 1.07FFO Fixed-Charge Coverage 3.55 1.95 3.03 3.20 3.99FCF Debt Service Coverage 1.20 0.65 (1.00) — 0.18(FCF + Cash and Marketable Securities)/Debt Service Coverage 1.47 0.89 0.05 0.80 0.59Cash Flow from Operations/Capital Expenditures 8.24 3.83 0.91 0.28 2.54Capital Structure and Leverage (x) FFO Adjusted Leverage 2.57 5.04 3.06 3.96 3.39Total Debt with Equity Credit/Operating EBITDA 2.72 2.42 2.87 2.66 2.62Total Net Debt with Equity Credit/Operating EBITDA 2.41 2.21 2.42 2.06 2.24Total Adjusted Debt/Operating EBITDAR 2.72 2.42 2.87 2.66 2.62Total Adjusted Net Debt/Operating EBITDAR 2.41 2.21 2.42 2.06 2.24Implied Cost of Funds (%) 9.13 8.36 12.98 8.68 7.51Secured Debt/Total Debt — — — — —Short-Term Debt/Total Debt 0.30 0.27 0.07 0.18 0.28Balance Sheet Total Assets 706,910 689,753 669,519 793,514 791,737Cash and Marketable Securities 22,949 12,478 34,201 60,490 43,107Short-Term Debt 62,410 38,239 16,042 47,788 82,674Long-Term Debt 143,141 105,580 201,500 218,488 209,918Total Debt 205,551 143,819 217,542 266,276 292,592Equity Credit — — — — —Total Debt with Equity Credit 205,551 143,819 217,542 266,276 292,592Off-Balance Sheet Debt — — — — —Total Adjusted Debt with Equity Credit 205,551 143,819 217,542 266,276 292,592Total Equity 339,996 367,057 331,737 388,643 376,133Total Adjusted Capital 545,547 510,876 549,279 654,919 668,725Cash Flow Funds from Operations 57,413 13,910 47,576 46,267 64,787Change in Operating Working Capital 33,007 12,812 9,804 (36,067) (3,387)Cash Flow from Operations 90,420 26,722 57,380 10,200 61,400Total Non-Operating/Nonrecurring Cash Flow — — — — —Capital Expenditures (10,979) (6,986) (63,027) (36,700) (24,200)Dividends — — (50,000) —- (40,000)Free Cash Flow 79,441 19,736 (55,647) (26,500) (2,800)Net Acquisitions and Divestitures 3,930 6,736 4,991 — —Other Investments, Net 4,820 24,790 (91) 2,700 —-Net Debt Proceeds (82,509) (61,733) 73,723 50,100 12,100Net Equity Proceeds — — — — —Other Financing, Net — — (1,523) — —Total Change in Cash 5,682 (10,471) 21,453 26,300 9,300Income Statement Net Revenues 249,425 210,765 233,042 254,478 314,987Revenue Growth (%) 93.25 (16) 10.57 9.20 41.33Operating EBIT 49,336 41,281 59,723 85,017 99,838Gross Interest Expense 22,522 14,601 23,457 21,007 21,645Rental Expense — — — — —Net Income (3,450) (2,508) (6,493) 47,769 61,976
Source: Company reports.

Latin America High Yield 100
November 8, 2012
Corporates
Cresud S.A.C.I.F. y A. Full Rating Report
Key Rating Drivers
Leading Position in Real Estate and Agribusiness Sectors: Cresud S.A.C.I.F. y A. (Cresud)
owns 64.2% of IRSA (‘BB’ local currency issuer default rating [IDR]), a leading real estate
company in Argentina dedicated to real estate development, office rentals, and shopping mall
operations through its subsidiary, Alto Palermo (APSA). As of June 30, 2012, Inversiones y
Representaciones S.A. (IRSA) represented the total of Cresud’s consolidated EBITDA (due to
negative results in the agribusiness segment), and 66% of consolidated assets. Additionally,
Cresud has a growing presence in the agribusiness sector, acquiring farms with the intent to
benefit from an appreciation of the land’s value over the medium to long term.
Rating Linkage to IRSA Results in Structural Subordination of Credit Rating: Fitch
Ratings links the ratings of Cresud and IRSA. This linkage reflects factors such as strong
strategic and operational ties and the fact that IRSA’s upstream dividends represent a
significant part of Cresud’s cash flow from operations. Cresud’s local currency IDR is notched
down from IRSA’s rating because of the structural subordination of its debt and its weaker
stand-alone financial profile. The dividend flow to Cresud from IRSA is expected to be relatively
stable. During 2011, the company received dividends of USD14 million in June and
USD31 million in November, while in June 2012 it received another USD14 million from IRSA.
Foreign Currency IDR Constrained: Cresud’s foreign currency IDR is constrained at ‘B’ due
to the ‘B’ country ceiling of Argentina, which also has a foreign currency credit rating of ‘B’.
Country ceilings capture the risk of exchange controls being imposed that would prevent or
materially impede the private sector’s ability to convert local currency into foreign currency and
transfer the proceeds to nonresident creditors — transfer and convertibility (T&C) risk.
Cyclical Cash Generation: Cresud’s ratings are constrained by above-average risks
associated with operating in the real estate segment in Argentina. Due to weather conditions
and commodity prices, the cash flow of its agribusiness division is also volatile. Cresud has an
important portfolio of farms in Argentina and also has a presence in Bolivia, Paraguay, and in
Brazil through its 39.64% stake in BrasilAgro.
Strong Asset Portfolio and Moderate Leverage: Cresud’s leverage is moderate and its
liquidity is manageable, as a result of unencumbered assets and land that could be sold.
Regarding the real estate industry, the emphasis of Fitch’s methodology is on portfolio quality,
diversity, and size. Cresud’s consolidated portfolio of real estate assets is strong with
USD1.6 billion of undepreciated book capital as of June 30, 2012. The company’s leverage,
measured by consolidated net debt as a percentage of undepreciated book capital of real
estate assets, was 47%. This percentage would be even lower at market values.
What Could Trigger a Rating Action
Key Rating Drivers: The Stable Outlook reflects Fitch’s expectation that Cresud will manage
its balance sheet to a consolidated ratio of net debt-to-EBITDA of around 4.0x. Any significant
increase in Cresud's leverage ratio would weaken credit quality and could result in a negative
rating action. Cresud’s ratings would also be affected by an upgrade or downgrade of the
Argentina’s country ceiling.
Ratings
Foreign Currency
Long-Term IDR B
Senior Unsecured B/RR4
Local Currency
Long-Term IDR B
Rating Outlooks Long-Term Foreign Currency IDR RWN Long-Term Local Currency IDR Stable
RWN – Rating Watch Negative.
Financial Data
Cresud S.A.C.I.F. y A.
(USD Mil.) 6/30/12 6/30/11 Revenue 641.1 533.5 EBITDA 207.7 231.0 Cash Flow from Operations (CFFO) 124.9 95.1 Cash and Marketable Securities 110.0 171.8 Total Debt 858.4 827.9 Total Debt/ EBITDA (x) 4.1 3.6 Net Debt/EBITDA (x) 3.6 2.8 CFFO/Net Debt (x) 0.2 0.1
Analysts Fernando Torres +54 11 5235-8124 [email protected]
Gabriela Catri +54 11 5235-8129 [email protected]

Latin America High Yield 101
November 8, 2012
Corporates
Recovery Rating
The recovery ratings for Cresud’s capital markets debt instruments reflect Fitch’s expectation
that the company’s creditors would have an average recovery of between 30% and 50%. This
recovery was capped at the ‘RR4’ level, which is the common recovery ceiling for debt issued
in Argentina. Absent this cap, Fitch’s bespoke analysis indicates that the leverage of the
company would lead to a recovery of approximately 65%.
In deriving a distressed enterprise valuation to determine the recovery under this scenario,
Fitch discounts the company’s LTM EBITDA to a level that would cover operating leases,
interest expenses, and maintenance capital expenditures. Fitch has applied a 4.0x distressed
EBITDA multiple, which is consistent with the value observed in the Buenos Aires’ stock
exchange during the last year.
Recovery Analysis Cresud S.A.C.I.F y A. (USD Mil.)
Going Concern Enterprise Value Liquidation Value Advance RateAvailable to
CreditorsJune 30, 2012 LTM EBITDA 208 Cash 110.0 0 —Discount (%) 25 A/R 140.9 80 113Post-Restructuring EBITDA Estimation 156 Inventory 194.7 50 97Multiple (x) 4.0 Net PPE 1,138.8 20 228Going Concern Enterprise Value 623 Total 438 Post-Restructuring EBITDA Estimation Guidelines Interest Expense 92Rent Expense —Estimated Maintenance Capital Expenditures 50Total 142
Enterprise Value for Claims Distribution Concession Payment Availability Table Greater of Going Concern Enterprise or Liquidation Value 623 Adjusted Enterprise Value for Claims 561Less Administrative Claims (10%) 62 Less Secured Debt Recovery —Adjusted Enterprise Value for Claims 561 Remaining Recovery for Unsecured Claims 561 Concession Allocation (5%) 28 Value to be Distributed to Senior Unsecured Claims 533Distribution of Value
Secured Priority LienValue
Recovered Recovery (%)Recovery
Rating Notching RatingSenior Secured 0.0 — 0 — — —Secured 0.0 — 0 — — —
Unsecured Priority LienValue
Recovered Recovery (%)Concession
Allocation (%) Recovery
Ratinga Notching RatingSenior Unsecured 858 561 65 100 RR4 — BaCresud’s recovery rating is capped at the level of ‘RR4’ due to concerns about the low probability of high recoveries for bondholders of corporates domiciled in Argentina. The amount of concession payments is highly dependent on circumstances, but Fitch typically allows up to 5% of the recovery value available to senior unsecured creditors to be allocated to concession payments. Source: Fitch Ratings.
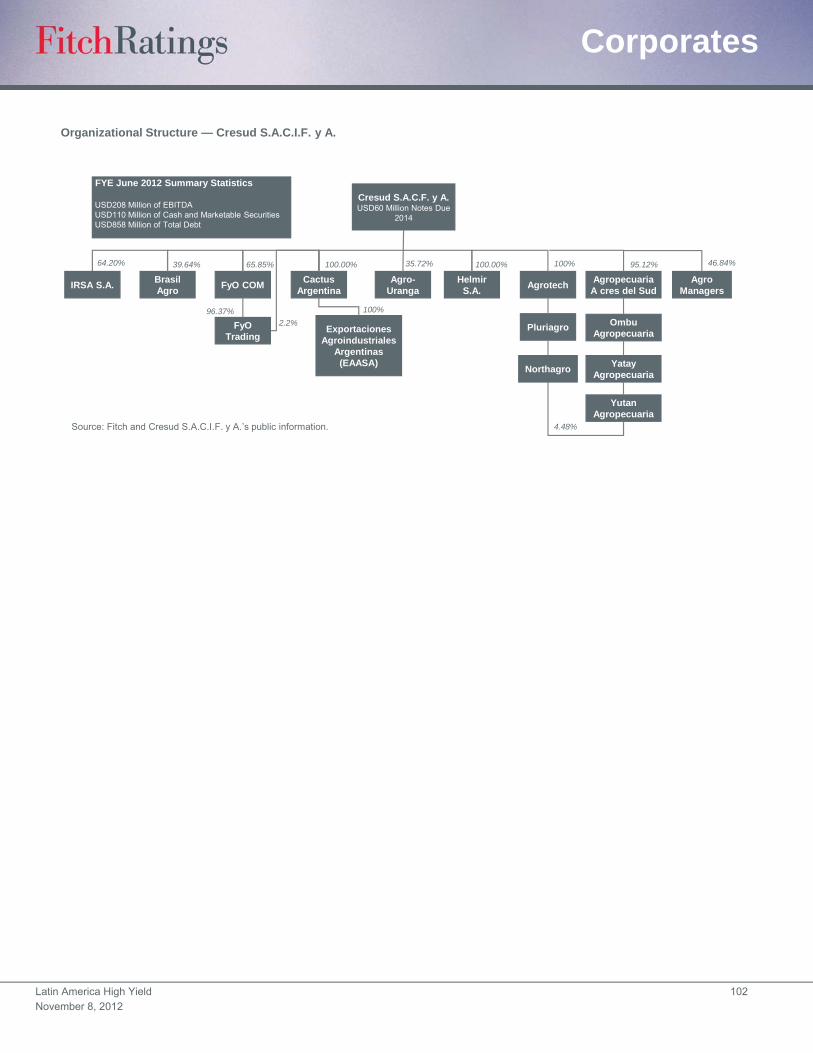
Latin America High Yield 102
November 8, 2012
Corporates
46.84%
Organizational Structure — Cresud S.A.C.I.F. y A.
Source: Fitch and Cresud S.A.C.I.F. y A.’s public information.
Cresud S.A.C.F. y A.USD60 Million Notes Due
2014
64.20%
IRSA S.A.Brasil Agro
FYE June 2012 Summary Statistics
USD208 Million of EBITDAUSD110 Million of Cash and Marketable SecuritiesUSD858 Million of Total Debt
FyO COM
FyO Trading
Cactus Argentina
Agro-Uranga
Helmir S.A.
AgrotechAgropecuaria
A cres del SudAgro
Managers
Exportaciones Agroindustriales
Argentinas (EAASA)
39.64% 65.85% 100.00% 35.72% 100.00% 100% 95.12%
2.2%
100%96.37%
Pluriagro
Northagro
OmbuAgropecuaria
YatayAgropecuaria
YutanAgropecuaria
4.48%

Latin America High Yield 103
November 8, 2012
Corporates
Debt and Covenant Synopsis Cresud S.A.C.I.F. y A. (Foreign Currency Notes)
Overview Issuer Cresud S.A.C.I.F. y A. Guarantors N.A. Document Date Aug. 29, 2011 Maturity Date Sept. 7, 2014 Description of Debt Senior Unsecured Notes Financial Covenants Consolidated Net Debt/ EBITDA (Maximum) N.A. Interest Coverage (Minimum) N.A.
Acquisitions/Divestitures Change of Control Provision Change of control clause at 100% of principal. Sale of Assets Restriction If the issuer at any time ceases to beneficially own, directly or indirectly, at least 45% of the voting power of the Voting Stock
of IRSA or ceases to have the right to appoint at least the majority of the members of the board of directors of IRSA, then, each holder will have the right to require that the issuer purchase all of the holder’s notes at a purchase price equal to 100% of the principal amount.
Debt Restriction Additional Debt Restriction The issuer may only incur additional indebtedness if, and immediately after giving pro forma effect to the incurrence, the ratio
of (i) the amount of the issuer's unconsolidated short-term indebtedness, to (ii) its total assets, as specified in the issuer’s most recently available basic quarterly financial statements prior to the date of such incurrence, is lower than 0.35x.
Other Transactions with Affiliates Transactions with affiliates are permitted as long as: 1) the terms of the transaction are not substantially less favorable than
those that could be achieved with a nonrelated party; 2) the terms of such transactions are in compliance with the applicable laws, regulations, and pronouncements.
Limitation on Secured Debt Restrictions on merger or consolidation of issuer. Exceptions include the merger of other entities with the issuer provided that surviving entity will be the issuer.
N.A. Not applicable. Disclaimer: The covenant summaries reflect Fitch’s interpretation and synopsis of information contained in publicly available documents identified in the “Document Date and Location” section of each covenant summary table. Fitch cannot ensure that the information contained in such documents is either accurate or complete, or that the covenant summaries, or any particular covenant summary, accurately or completely reflect the key terms of any such document. The information presented in the covenant summaries is provided “as is” without any representation or warranty and is not a substitute for information provided to investors by an issuer and its agents in connection with a sale of securities. Source: Company and Fitch Ratings.
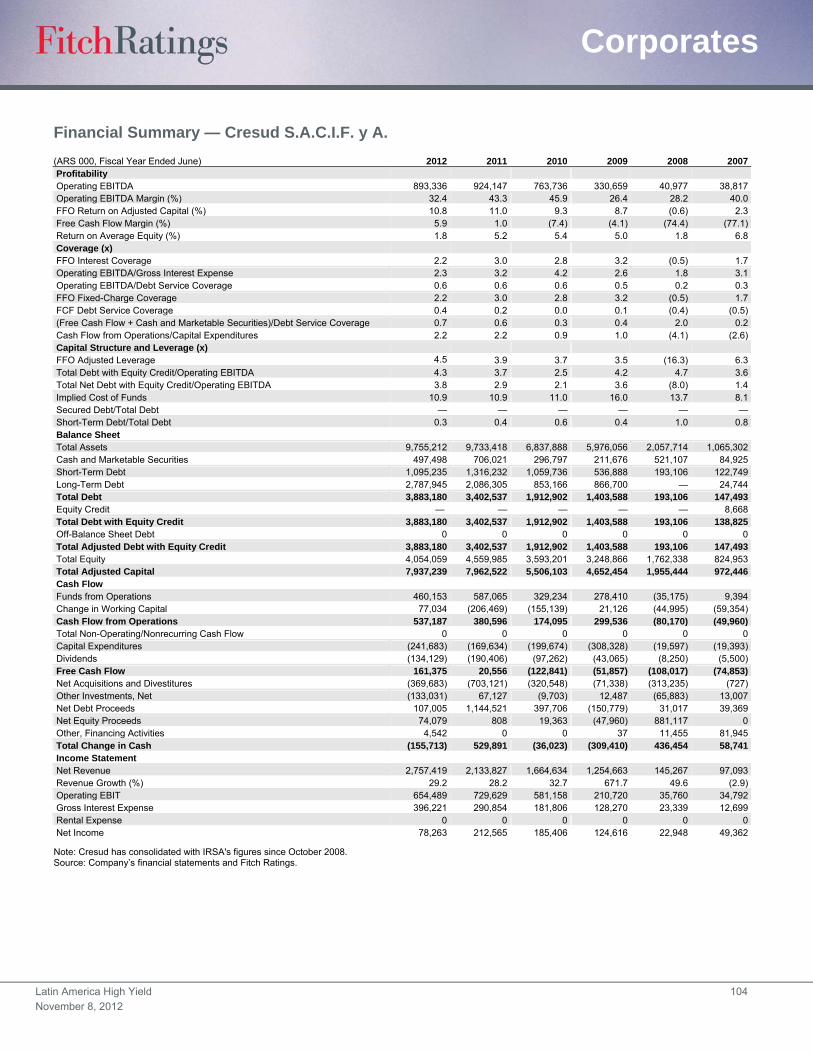
Latin America High Yield 104
November 8, 2012
Corporates
Financial Summary — Cresud S.A.C.I.F. y A.
(ARS 000, Fiscal Year Ended June) 2012 2011 2010 2009 2008 2007 Profitability
Operating EBITDA 893,336 924,147 763,736 330,659 40,977 38,817 Operating EBITDA Margin (%) 32.4 43.3 45.9 26.4 28.2 40.0 FFO Return on Adjusted Capital (%) 10.8 11.0 9.3 8.7 (0.6) 2.3 Free Cash Flow Margin (%) 5.9 1.0 (7.4) (4.1) (74.4) (77.1) Return on Average Equity (%) 1.8 5.2 5.4 5.0 1.8 6.8 Coverage (x) FFO Interest Coverage 2.2 3.0 2.8 3.2 (0.5) 1.7 Operating EBITDA/Gross Interest Expense 2.3 3.2 4.2 2.6 1.8 3.1 Operating EBITDA/Debt Service Coverage 0.6 0.6 0.6 0.5 0.2 0.3 FFO Fixed-Charge Coverage 2.2 3.0 2.8 3.2 (0.5) 1.7 FCF Debt Service Coverage 0.4 0.2 0.0 0.1 (0.4) (0.5) (Free Cash Flow + Cash and Marketable Securities)/Debt Service Coverage 0.7 0.6 0.3 0.4 2.0 0.2 Cash Flow from Operations/Capital Expenditures 2.2 2.2 0.9 1.0 (4.1) (2.6) Capital Structure and Leverage (x) FFO Adjusted Leverage 4.5 3.9 3.7 3.5 (16.3) 6.3 Total Debt with Equity Credit/Operating EBITDA 4.3 3.7 2.5 4.2 4.7 3.6 Total Net Debt with Equity Credit/Operating EBITDA 3.8 2.9 2.1 3.6 (8.0) 1.4 Implied Cost of Funds 10.9 10.9 11.0 16.0 13.7 8.1 Secured Debt/Total Debt — — — — — — Short-Term Debt/Total Debt 0.3 0.4 0.6 0.4 1.0 0.8 Balance Sheet Total Assets 9,755,212 9,733,418 6,837,888 5,976,056 2,057,714 1,065,302 Cash and Marketable Securities 497,498 706,021 296,797 211,676 521,107 84,925 Short-Term Debt 1,095,235 1,316,232 1,059,736 536,888 193,106 122,749 Long-Term Debt 2,787,945 2,086,305 853,166 866,700 — 24,744 Total Debt 3,883,180 3,402,537 1,912,902 1,403,588 193,106 147,493 Equity Credit — — — — — 8,668 Total Debt with Equity Credit 3,883,180 3,402,537 1,912,902 1,403,588 193,106 138,825 Off-Balance Sheet Debt 0 0 0 0 0 0 Total Adjusted Debt with Equity Credit 3,883,180 3,402,537 1,912,902 1,403,588 193,106 147,493 Total Equity 4,054,059 4,559,985 3,593,201 3,248,866 1,762,338 824,953 Total Adjusted Capital 7,937,239 7,962,522 5,506,103 4,652,454 1,955,444 972,446 Cash Flow Funds from Operations 460,153 587,065 329,234 278,410 (35,175) 9,394 Change in Working Capital 77,034 (206,469) (155,139) 21,126 (44,995) (59,354) Cash Flow from Operations 537,187 380,596 174,095 299,536 (80,170) (49,960) Total Non-Operating/Nonrecurring Cash Flow 0 0 0 0 0 0 Capital Expenditures (241,683) (169,634) (199,674) (308,328) (19,597) (19,393) Dividends (134,129) (190,406) (97,262) (43,065) (8,250) (5,500) Free Cash Flow 161,375 20,556 (122,841) (51,857) (108,017) (74,853) Net Acquisitions and Divestitures (369,683) (703,121) (320,548) (71,338) (313,235) (727) Other Investments, Net (133,031) 67,127 (9,703) 12,487 (65,883) 13,007 Net Debt Proceeds 107,005 1,144,521 397,706 (150,779) 31,017 39,369 Net Equity Proceeds 74,079 808 19,363 (47,960) 881,117 0 Other, Financing Activities 4,542 0 0 37 11,455 81,945 Total Change in Cash (155,713) 529,891 (36,023) (309,410) 436,454 58,741 Income Statement Net Revenue 2,757,419 2,133,827 1,664,634 1,254,663 145,267 97,093 Revenue Growth (%) 29.2 28.2 32.7 671.7 49.6 (2.9) Operating EBIT 654,489 729,629 581,158 210,720 35,760 34,792 Gross Interest Expense 396,221 290,854 181,806 128,270 23,339 12,699 Rental Expense 0 0 0 0 0 0 Net Income 78,263 212,565 185,406 124,616 22,948 49,362
Note: Cresud has consolidated with IRSA's figures since October 2008. Source: Company’s financial statements and Fitch Ratings.
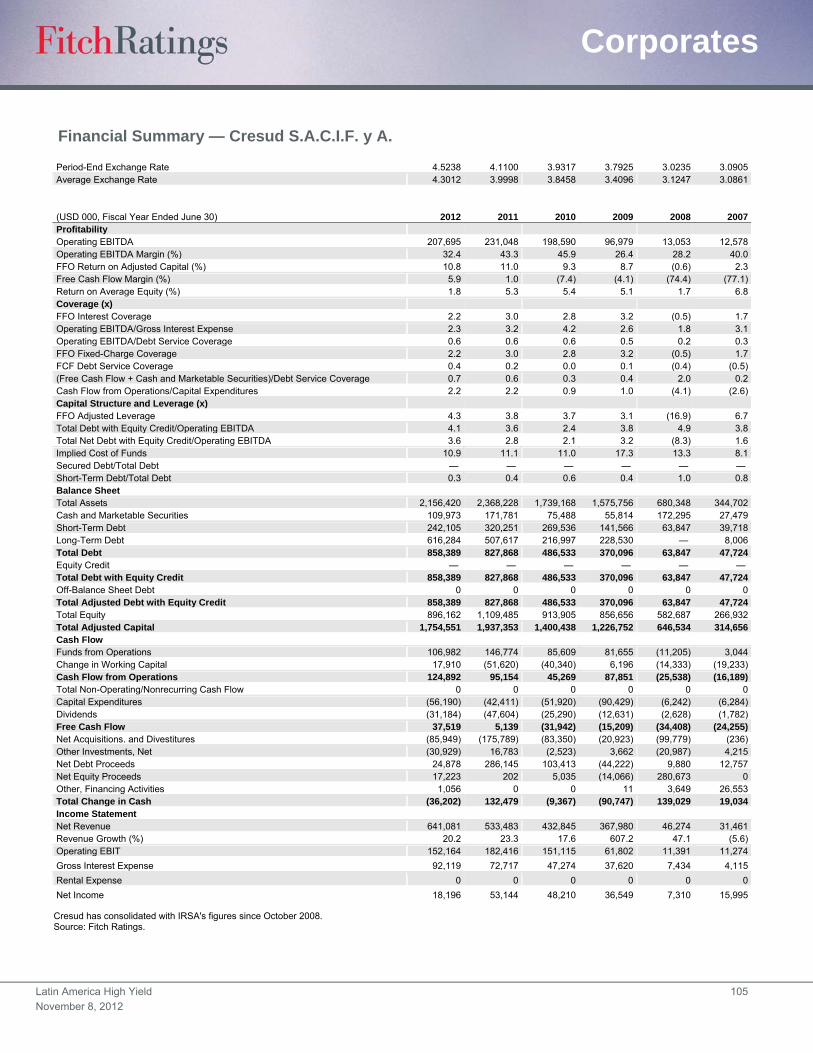
Latin America High Yield 105
November 8, 2012
Corporates
Financial Summary — Cresud S.A.C.I.F. y A. Period-End Exchange Rate 4.5238 4.1100 3.9317 3.7925 3.0235 3.0905 Average Exchange Rate 4.3012 3.9998 3.8458 3.4096 3.1247 3.0861 (USD 000, Fiscal Year Ended June 30) 2012 2011 2010 2009 2008 2007 Profitability Operating EBITDA 207,695 231,048 198,590 96,979 13,053 12,578 Operating EBITDA Margin (%) 32.4 43.3 45.9 26.4 28.2 40.0 FFO Return on Adjusted Capital (%) 10.8 11.0 9.3 8.7 (0.6) 2.3 Free Cash Flow Margin (%) 5.9 1.0 (7.4) (4.1) (74.4) (77.1) Return on Average Equity (%) 1.8 5.3 5.4 5.1 1.7 6.8 Coverage (x) FFO Interest Coverage 2.2 3.0 2.8 3.2 (0.5) 1.7 Operating EBITDA/Gross Interest Expense 2.3 3.2 4.2 2.6 1.8 3.1 Operating EBITDA/Debt Service Coverage 0.6 0.6 0.6 0.5 0.2 0.3 FFO Fixed-Charge Coverage 2.2 3.0 2.8 3.2 (0.5) 1.7 FCF Debt Service Coverage 0.4 0.2 0.0 0.1 (0.4) (0.5) (Free Cash Flow + Cash and Marketable Securities)/Debt Service Coverage 0.7 0.6 0.3 0.4 2.0 0.2 Cash Flow from Operations/Capital Expenditures 2.2 2.2 0.9 1.0 (4.1) (2.6) Capital Structure and Leverage (x) FFO Adjusted Leverage 4.3 3.8 3.7 3.1 (16.9) 6.7 Total Debt with Equity Credit/Operating EBITDA 4.1 3.6 2.4 3.8 4.9 3.8 Total Net Debt with Equity Credit/Operating EBITDA 3.6 2.8 2.1 3.2 (8.3) 1.6 Implied Cost of Funds 10.9 11.1 11.0 17.3 13.3 8.1 Secured Debt/Total Debt — — — — — — Short-Term Debt/Total Debt 0.3 0.4 0.6 0.4 1.0 0.8 Balance Sheet Total Assets 2,156,420 2,368,228 1,739,168 1,575,756 680,348 344,702 Cash and Marketable Securities 109,973 171,781 75,488 55,814 172,295 27,479 Short-Term Debt 242,105 320,251 269,536 141,566 63,847 39,718 Long-Term Debt 616,284 507,617 216,997 228,530 — 8,006 Total Debt 858,389 827,868 486,533 370,096 63,847 47,724 Equity Credit — — — — — — Total Debt with Equity Credit 858,389 827,868 486,533 370,096 63,847 47,724 Off-Balance Sheet Debt 0 0 0 0 0 0 Total Adjusted Debt with Equity Credit 858,389 827,868 486,533 370,096 63,847 47,724 Total Equity 896,162 1,109,485 913,905 856,656 582,687 266,932 Total Adjusted Capital 1,754,551 1,937,353 1,400,438 1,226,752 646,534 314,656 Cash Flow Funds from Operations 106,982 146,774 85,609 81,655 (11,205) 3,044 Change in Working Capital 17,910 (51,620) (40,340) 6,196 (14,333) (19,233) Cash Flow from Operations 124,892 95,154 45,269 87,851 (25,538) (16,189) Total Non-Operating/Nonrecurring Cash Flow 0 0 0 0 0 0 Capital Expenditures (56,190) (42,411) (51,920) (90,429) (6,242) (6,284) Dividends (31,184) (47,604) (25,290) (12,631) (2,628) (1,782) Free Cash Flow 37,519 5,139 (31,942) (15,209) (34,408) (24,255) Net Acquisitions. and Divestitures (85,949) (175,789) (83,350) (20,923) (99,779) (236) Other Investments, Net (30,929) 16,783 (2,523) 3,662 (20,987) 4,215 Net Debt Proceeds 24,878 286,145 103,413 (44,222) 9,880 12,757 Net Equity Proceeds 17,223 202 5,035 (14,066) 280,673 0 Other, Financing Activities 1,056 0 0 11 3,649 26,553 Total Change in Cash (36,202) 132,479 (9,367) (90,747) 139,029 19,034 Income Statement Net Revenue 641,081 533,483 432,845 367,980 46,274 31,461 Revenue Growth (%) 20.2 23.3 17.6 607.2 47.1 (5.6) Operating EBIT 152,164 182,416 151,115 61,802 11,391 11,274
Gross Interest Expense 92,119 72,717 47,274 37,620 7,434 4,115
Rental Expense 0 0 0 0 0 0
Net Income 18,196 53,144 48,210 36,549 7,310 15,995
Cresud has consolidated with IRSA's figures since October 2008. Source: Fitch Ratings.
Latin America High Yield 106
November 8, 2012
Corporates
Digicel Group Limited And Subsidiaries Full Rating Report
Key Rating Drivers
High Leverage but Solid Operations: Digicel Group Limited’s (DGL) ratings are supported by
its position as the leading provider of wireless services in most of its markets in the Caribbean
and its strong operating track record. The ratings are constrained by high leverage and the
company’s exposure to low-rated countries, as about 40% of its cash flow is generated in
Jamaica and Haiti.
Acquisitions Improving Competitive Position: The recent acquisitions of Voila in Haiti and
the transaction with America Movil, where the El Salvador division is pending regulatory approval,
will strengthen the company’s competitive position in its top markets, Jamaica and Haiti. In
addition, the company has a minority stake in M-Via (rebranded to Boom Financial), a 51% stake
in Nextar, and a 100% ownership stake in Data Nets, based in Papua New Guinea (PNG).
Jamaica’s New Regulation and Taxes Manageable: Leverage is not expected to materially
change considering the effect on EBITDA of new regulation and taxes in Jamaica. This effect is
expected to be offset by continued growth from Haiti and PNG.
Broadband Strategy: Digicel is pursuing service offerings using Wimax, HSPA+, or 4G
networks for delivering broadband services in the markets where the company participates.
These investments will take advantage of the low fixed-line penetration rates. These initiatives
underpin revenue from value-added services as they accounted for 20% of revenues in the
quarter ended June 30, 2012.
Lower Capex: The capex-to-revenue ratio approached 17.5% during fiscal 2012 and is
expected to trend towards 10% in the next few years. The decline in the capex ratio should
have a positive effect on free cash flow amid a stable dividend policy of USD40 million per year.
DGL paid a USD300 million special dividend during the first quarter of fiscal 2013.
Parent Subsidiary Rating Linkage: Under Fitch’s approach to rating entities within a
corporate group structure, the issuer default ratings (IDRs) of DGL, Digicel Limited (DL), and
Digicel International Finance Limited (DIFL) are the same. The degree of linkage between the
parent company and its subsidiaries is considered strong.
Recovery Prospects: For issue ratings, Fitch rates debt at DIFL one notch higher than DL,
reflecting its above-average recovery prospects. DL’s ratings reflect the increased burden the
DGL subordinated notes place on the operating assets and the loss of financial flexibility. The
ratings of DGL incorporate their subordination to debt at DIFL and DL, as well as the
subordinated notes’ below-average recovery prospects in the event of default.
What Could Trigger a Rating Action
Increased Leverage/Refinancing Risk: A negative rating action could be triggered if
consolidated leverage at DGL approaches 6.0x. The inability to refinance sizeable bullet
maturities in advance — especially those due in 2014 or 2015 — could also lead to a rating
action. Short-term upside potential is limited. Positive factors for credit quality would be a
sustained reduction in leverage at DGL to about 4.0x or below and an increase in free cash
flow generation.
Ratings
Foreign Currency
Long-Term IDR B
Local Currency
Long-Term IDR B
Secured (DIFL) B+/RR3
Senior Unsecured (DL) B/RR4
Subordinated (DGL) B–/RR5
IDR – Issuer default rating. DIFL – Digicel International Finance Ltd. DL – Digicel Ltd. DGL – Digicel Group Ltd.
Rating Outlooks Long-Term Foreign Currency IDR Stable Long-Term Local Currency IDR Stable
Financial Data Digicel Group Limited
(USD 000) 6/30/12 3/31/12
Revenue 2,481,860 2,408,679 Operating EBITDAR 1,097,533 1,070,825 Operating EBITDAR/ Revenues (%) 44.2 44.5 Cash Flow from Operations 478,778 505,244 Free Cash Flow (260,567) 82,620 Operating EBITDAR/Fixed Charges (x) 2.4 2.3 Total Adjusted Debt with Equity Credit/Operating EBITDAR (x) 4.7 4.8
Analysts Sergio Rodriguez, CFA +52 81 8399-9100 [email protected]
John C. Culver, CFA +1 312 368-3216 [email protected]
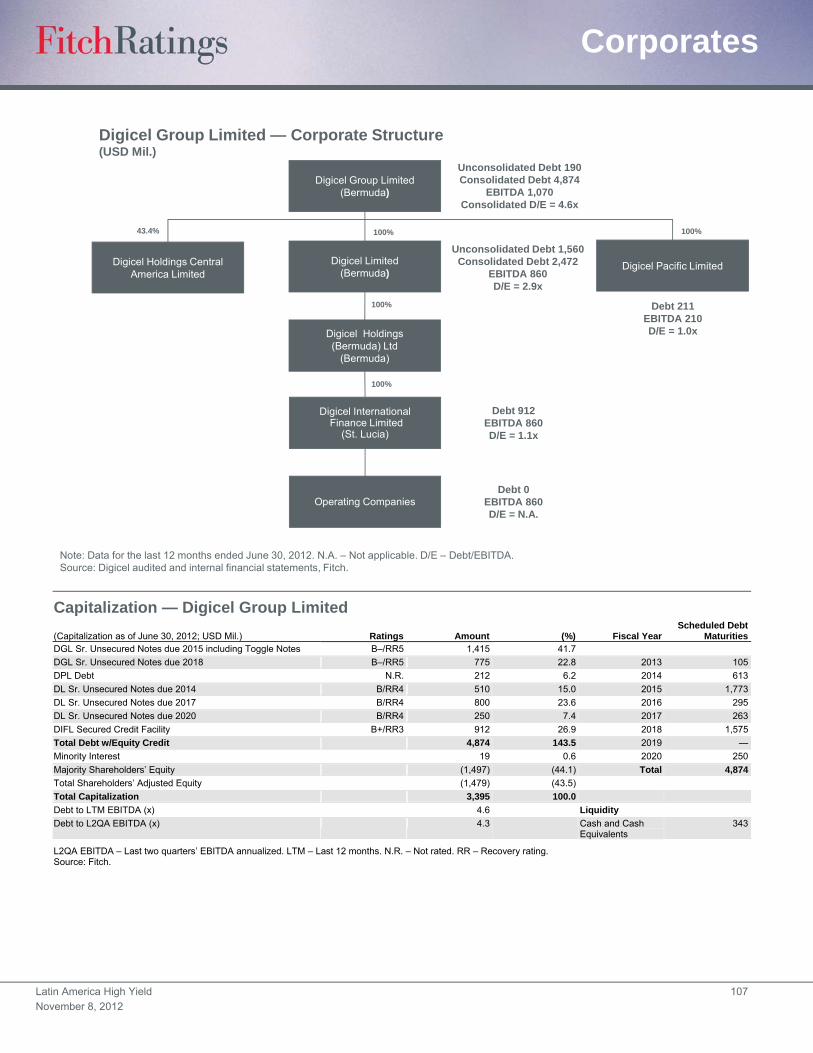
Latin America High Yield 107
November 8, 2012
Corporates
Capitalization — Digicel Group Limited
(Capitalization as of June 30, 2012; USD Mil.) Ratings Amount (%) Fiscal YearScheduled Debt
MaturitiesDGL Sr. Unsecured Notes due 2015 including Toggle Notes B–/RR5 1,415 41.7
DGL Sr. Unsecured Notes due 2018 B–/RR5 775 22.8 2013 105
DPL Debt N.R. 212 6.2 2014 613
DL Sr. Unsecured Notes due 2014 B/RR4 510 15.0 2015 1,773
DL Sr. Unsecured Notes due 2017 B/RR4 800 23.6 2016 295
DL Sr. Unsecured Notes due 2020 B/RR4 250 7.4 2017 263
DIFL Secured Credit Facility B+/RR3 912 26.9 2018 1,575
Total Debt w/Equity Credit 4,874 143.5 2019 —
Minority Interest 19 0.6 2020 250
Majority Shareholders’ Equity (1,497) (44.1) Total 4,874
Total Shareholders’ Adjusted Equity (1,479) (43.5)
Total Capitalization 3,395 100.0
Debt to LTM EBITDA (x) 4.6 Liquidity
Debt to L2QA EBITDA (x) 4.3 Cash and Cash Equivalents
343
L2QA EBITDA – Last two quarters’ EBITDA annualized. LTM – Last 12 months. N.R. – Not rated. RR – Recovery rating. Source: Fitch.
Digicel Limited(Bermuda)
Digicel InternationalFinance Limited
(St. Lucia)
Digicel Holdings (Bermuda) Ltd
(Bermuda)
100%
100%
Digicel Group Limited — Corporate Structure(USD Mil.)
Digicel Group Limited(Bermuda)
Note: Data for the last 12 months ended June 30, 2012. N.A. – Not applicable. D/E – Debt/EBITDA.Source: Digicel audited and internal financial statements, Fitch.
Operating Companies
Digicel Holdings CentralAmerica Limited
Digicel Pacific Limited
43.4%
Unconsolidated Debt 190Consolidated Debt 4,874
EBITDA 1,070Consolidated D/E = 4.6x
Unconsolidated Debt 1,560Consolidated Debt 2,472
EBITDA 860D/E = 2.9x
Debt 211EBITDA 210D/E = 1.0x
Debt 912EBITDA 860D/E = 1.1x
100% 100%
Debt 0EBITDA 860D/E = N.A.
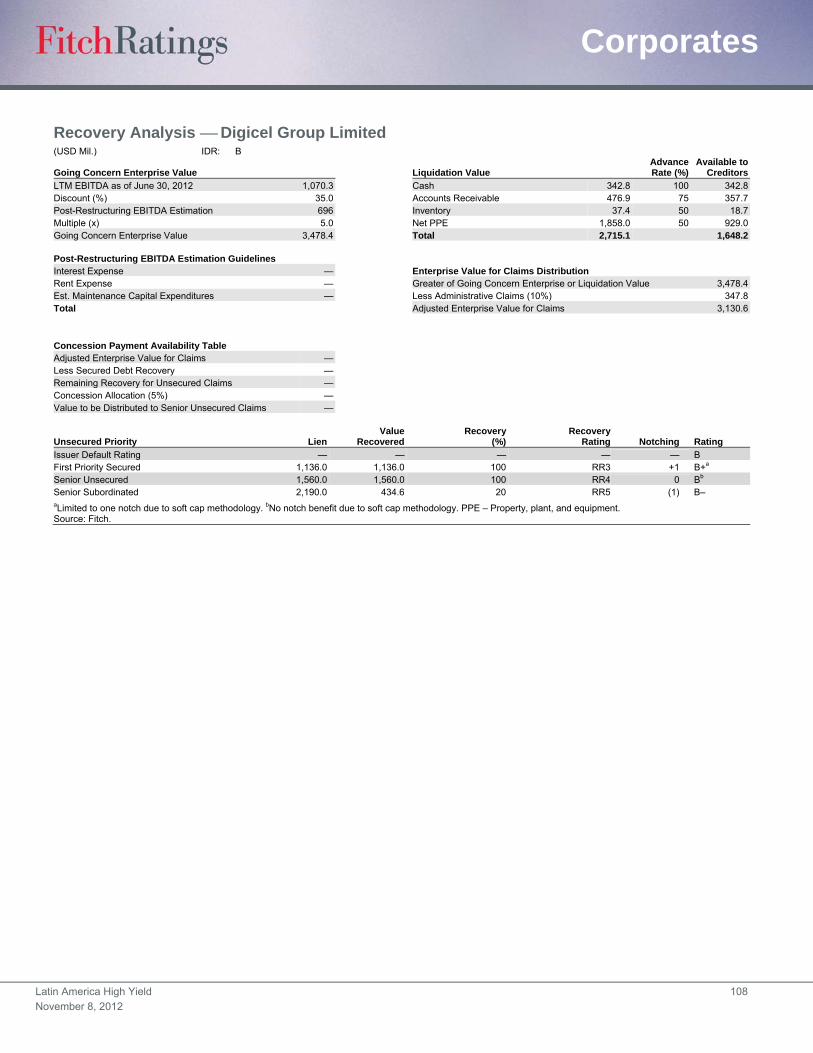
Latin America High Yield 108
November 8, 2012
Corporates
Recovery Analysis Digicel Group Limited (USD Mil.) IDR: B
Going Concern Enterprise Value Liquidation Value AdvanceRate (%)
Available toCreditors
LTM EBITDA as of June 30, 2012 1,070.3 Cash 342.8 100 342.8Discount (%) 35.0 Accounts Receivable 476.9 75 357.7Post-Restructuring EBITDA Estimation 696 Inventory 37.4 50 18.7Multiple (x) 5.0 Net PPE 1,858.0 50 929.0Going Concern Enterprise Value 3,478.4 Total 2,715.1 1,648.2 Post-Restructuring EBITDA Estimation Guidelines Interest Expense — Enterprise Value for Claims Distribution Rent Expense — Greater of Going Concern Enterprise or Liquidation Value 3,478.4Est. Maintenance Capital Expenditures — Less Administrative Claims (10%) 347.8Total Adjusted Enterprise Value for Claims 3,130.6 Concession Payment Availability Table Adjusted Enterprise Value for Claims — Less Secured Debt Recovery — Remaining Recovery for Unsecured Claims — Concession Allocation (5%) — Value to be Distributed to Senior Unsecured Claims —
Unsecured Priority LienValue
RecoveredRecovery
(%)Recovery
Rating Notching Rating
Issuer Default Rating — — — — — B First Priority Secured 1,136.0 1,136.0 100 RR3 +1 B+a Senior Unsecured 1,560.0 1,560.0 100 RR4 0 Bb Senior Subordinated 2,190.0 434.6 20 RR5 (1) B– aLimited to one notch due to soft cap methodology. bNo notch benefit due to soft cap methodology. PPE – Property, plant, and equipment. Source: Fitch.
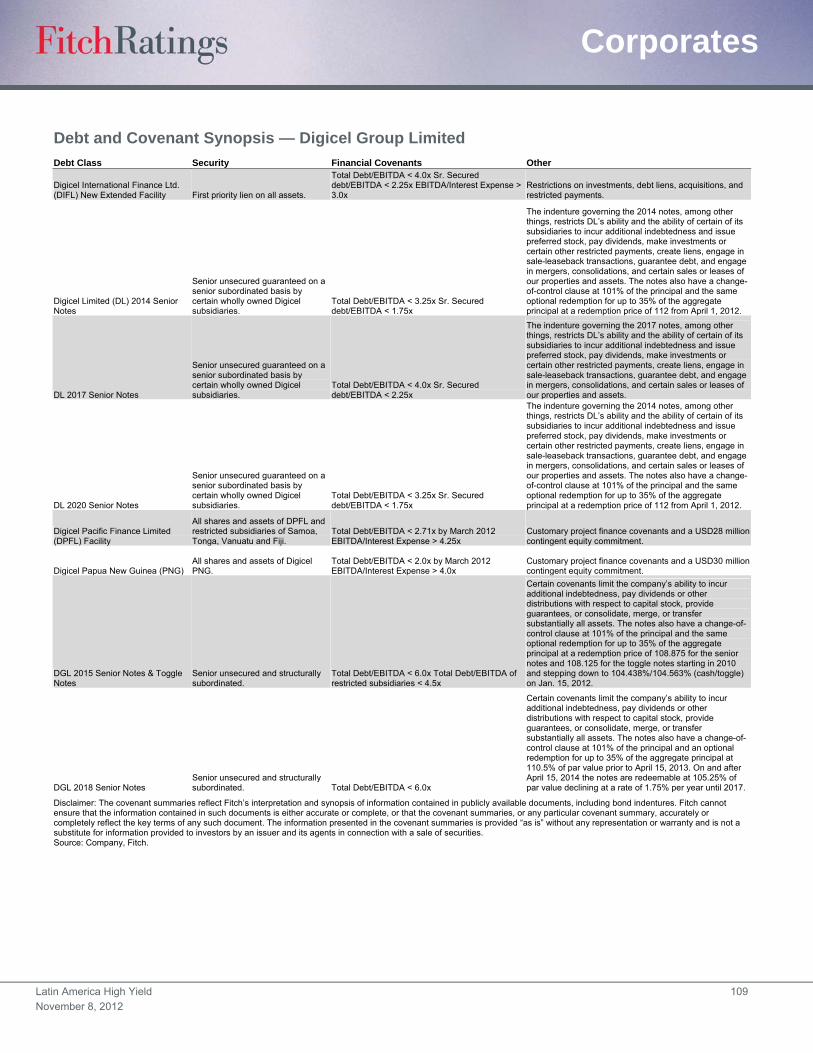
Latin America High Yield 109
November 8, 2012
Corporates
Debt and Covenant Synopsis — Digicel Group Limited Debt Class Security Financial Covenants Other
Digicel International Finance Ltd. (DIFL) New Extended Facility First priority lien on all assets.
Total Debt/EBITDA < 4.0x Sr. Secured debt/EBITDA < 2.25x EBITDA/Interest Expense > 3.0x
Restrictions on investments, debt liens, acquisitions, and restricted payments.
Digicel Limited (DL) 2014 Senior Notes
Senior unsecured guaranteed on a senior subordinated basis by certain wholly owned Digicel subsidiaries.
Total Debt/EBITDA < 3.25x Sr. Secured debt/EBITDA < 1.75x
The indenture governing the 2014 notes, among other things, restricts DL’s ability and the ability of certain of its subsidiaries to incur additional indebtedness and issue preferred stock, pay dividends, make investments or certain other restricted payments, create liens, engage in sale-leaseback transactions, guarantee debt, and engage in mergers, consolidations, and certain sales or leases of our properties and assets. The notes also have a change-of-control clause at 101% of the principal and the same optional redemption for up to 35% of the aggregate principal at a redemption price of 112 from April 1, 2012.
DL 2017 Senior Notes
Senior unsecured guaranteed on a senior subordinated basis by certain wholly owned Digicel subsidiaries.
Total Debt/EBITDA < 4.0x Sr. Secured debt/EBITDA < 2.25x
The indenture governing the 2017 notes, among other things, restricts DL’s ability and the ability of certain of its subsidiaries to incur additional indebtedness and issue preferred stock, pay dividends, make investments or certain other restricted payments, create liens, engage in sale-leaseback transactions, guarantee debt, and engage in mergers, consolidations, and certain sales or leases of our properties and assets.
DL 2020 Senior Notes
Senior unsecured guaranteed on a senior subordinated basis by certain wholly owned Digicel subsidiaries.
Total Debt/EBITDA < 3.25x Sr. Secured debt/EBITDA < 1.75x
The indenture governing the 2014 notes, among other things, restricts DL’s ability and the ability of certain of its subsidiaries to incur additional indebtedness and issue preferred stock, pay dividends, make investments or certain other restricted payments, create liens, engage in sale-leaseback transactions, guarantee debt, and engage in mergers, consolidations, and certain sales or leases of our properties and assets. The notes also have a change-of-control clause at 101% of the principal and the same optional redemption for up to 35% of the aggregate principal at a redemption price of 112 from April 1, 2012.
Digicel Pacific Finance Limited (DPFL) Facility
All shares and assets of DPFL and restricted subsidiaries of Samoa, Tonga, Vanuatu and Fiji.
Total Debt/EBITDA < 2.71x by March 2012 EBITDA/Interest Expense > 4.25x
Customary project finance covenants and a USD28 million contingent equity commitment.
Digicel Papua New Guinea (PNG) All shares and assets of Digicel PNG.
Total Debt/EBITDA < 2.0x by March 2012 EBITDA/Interest Expense > 4.0x
Customary project finance covenants and a USD30 million contingent equity commitment.
DGL 2015 Senior Notes & Toggle Notes
Senior unsecured and structurally subordinated.
Total Debt/EBITDA < 6.0x Total Debt/EBITDA of restricted subsidiaries < 4.5x
Certain covenants limit the company’s ability to incur additional indebtedness, pay dividends or other distributions with respect to capital stock, provide guarantees, or consolidate, merge, or transfer substantially all assets. The notes also have a change-of-control clause at 101% of the principal and the same optional redemption for up to 35% of the aggregate principal at a redemption price of 108.875 for the senior notes and 108.125 for the toggle notes starting in 2010 and stepping down to 104.438%/104.563% (cash/toggle) on Jan. 15, 2012.
DGL 2018 Senior Notes Senior unsecured and structurally subordinated. Total Debt/EBITDA < 6.0x
Certain covenants limit the company’s ability to incur additional indebtedness, pay dividends or other distributions with respect to capital stock, provide guarantees, or consolidate, merge, or transfer substantially all assets. The notes also have a change-of-control clause at 101% of the principal and an optional redemption for up to 35% of the aggregate principal at 110.5% of par value prior to April 15, 2013. On and after April 15, 2014 the notes are redeemable at 105.25% of par value declining at a rate of 1.75% per year until 2017.
Disclaimer: The covenant summaries reflect Fitch’s interpretation and synopsis of information contained in publicly available documents, including bond indentures. Fitch cannot ensure that the information contained in such documents is either accurate or complete, or that the covenant summaries, or any particular covenant summary, accurately or completely reflect the key terms of any such document. The information presented in the covenant summaries is provided “as is” without any representation or warranty and is not a substitute for information provided to investors by an issuer and its agents in connection with a sale of securities. Source: Company, Fitch.

Latin America High Yield 110
November 8, 2012
Corporates
Financial Summary Digicel Group Limited (USD Mil., Year Ended June 30) LTM 6/30/12 2012 2011 2010 2009
Profitability
Operating EBITDA 1,070,281 1,041,572 918,725 752,506 752,506
Operating EBITDAR 1,097,533 1,070,825 938,258 773,741 773,741
Operating EBITDA Margin (%) 43.1 43.2 43.9 43.1 43.1
Operating EBITDAR Margin (%) 44.2 44.5 44.8 44.3 44.3
FFO Return on Adjusted Capital (%) 0.28 0.25 0.24 0.26 0.26
Free Cash Flow Margin (%) (10.5) 3.4 6.4 15.5 15.5
Return on Average Equity (%) 1.1 (4.1) (3.7) 12.2 12.2
Coverage (x)
FFO Interest Coverage 2.4 2.4 2.2 2.6 2.6
Operating EBITDA/Gross Interest Expense 2.7 2.6 2.4 2.8 2.8
Operating EBITDAR/Interest Expense + Rents 2.6 2.5 2.4 2.7 2.7
Operating EBITDA/Debt Service Coverage 1.7 1.7 1.2 1.7 1.7
Operating EBITDAR/Debt Service Coverage 1.7 1.7 1.2 1.7 1.7
FFO Fixed-Charge Coverage 2.4 2.3 2.2 2.5 2.5
FCF Debt Service Coverage 0.2 0.8 0.7 1.2 1.2
(FCF + Cash and Marketable Securities)/Debt Service Coverage 0.8 1.9 1.5 3.7 3.7
Cash Flow from Operations/Capital Expenditures 1.1 1.2 1.5 2.7 2.7
Leverage (x)
FFO Adjusted Leverage 5.1 5.2 5.5 5.5 5.5
Total Debt with Equity Credit/Operating EBITDA 4.6 4.7 4.9 5.0 5.0
Total Net Debt with Equity Credit/Operating EBITDA 4.2 4.1 4.3 3.7 3.7
Total Adjusted Debt/Operating EBITDAR 4.7 4.8 5.0 5.1 5.1
Total Adjusted Net Debt/Operating EBITDAR 4.3 4.2 4.3 3.8 3.8
Implied Cost of Funds (%) 8.5 8.4 9.0 7.6 7.6
Secured Debt/Total Debt — — — — —
Short-Term Debt/Total Debt 0.0 0.0 0.1 0.0 0.0
Balance Sheet
Total Assets 4,370,699 4,662,259 4,219,283 3,188,219 3,188,219
Cash and Marketable Securities 342,792 656,604 613,335 1,040,848 1,040,848
Short-Term Debt 227,536 210,548 387,528 166,050 166,050
Long-Term Debt 4,659,290 4,673,624 4,140,669 3,626,948 3,626,948
Total Debt 4,886,826 4,884,172 4,528,197 3,792,998 3,792,998
Equity Credit — — — — —
Total Debt with Equity Credit 4,886,826 4,884,172 4,528,197 3,792,998 3,792,998
Off-Balance Sheet Debt 218,016 234,024 156,264 169,880 169,880
Total Adjusted Debt with Equity Credit 5,104,842 5,118,196 4,684,461 3,962,878 3,962,878
Total Equity (1,478,954) (1,162,797) (1,153,591) (1,173,058) (1,173,058)
Total Adjusted Capital 3,625,888 3,955,399 3,530,870 2,789,820 2,789,820
Cash Flow
Funds from Operations 575,640 552,863 456,536 431,142 431,142
Change in Working Capital (96,862) (47,619) (24,804) 4,042 4,042
Cash Flow from Operations 478,778 505,244 431,732 435,184 435,184
Total Non-Operating/Nonrecurring Cash Flow 0 0 0 0 0
Capital Expenditures (428,469) (421,748) (294,585) (159,592) (159,592)
Common Dividends (425,876) (115,876) (45,322) (44,728) (44,728)
Free Cash Flow (260,567) 82,620 133,918 270,854 270,854
Net Acquisitions and Divestitures (376,710) (362,733) (766,647) (273,716) (273,716)
Other Investments, Net 138,765 114,638 (109,119) 23,250 23,250
Net Debt Proceeds 214,873 320,861 367,478 585,426 585,426
Net Equity Proceeds 0 0 0 500 500
Other (Investments and Financial) (6,627) 2,883 (11,050) (16,048) (16,048)
Total Change in Cash (405,266) 43,269 (427,513) 550,276 550,276
Income Statement
Revenue 2,481,860 2,408,679 2,092,869 1,747,415 1,747,415
Revenue Growth (%) 14.1 15.1 19.8 0.9 0.9
Operating EBIT 611,780 616,021 558,838 464,693 464,693
Gross Interest Expense 398,552 394,397 375,040 264,890 264,890
Rental Expense 27,252 29,253 19,533 21,235 21,235
Net Income (13,685) 47,233 43,158 (131,679) (131,679)
Source: Fitch.

Latin America High Yield 111
November 8, 2012
Corporates
Empresa Generadora de Electricidad Haina, S.A. (Haina) Full Rating Report
Key Rating Drivers
High Risk Sector: The Dominican Republic power sector is characterized by low collections
from end users and high electricity losses. Such conditions have undermined distribution
companies’ (DISCOs) cash flow generation, leaving them dependent on government subsidies
to honor their accounts payable to the Dominican generation companies. This links the credit
quality of the distribution and generation companies in the country to that of the sovereign.
Transition Risk Diminishes: The incumbent party’s electoral victory in the presidential
elections held during May 2012 partially diminishes the political uncertainty that had prevailed
during the first half of the year. For Empresa Generadora de Electricidad Haina, S.A. (Haina),
the results lowered the risk of noncontinuous policies aimed at strengthening the financial
viability of the Dominican electricity sector, as agreed to under the last IMF Standby agreement,
which expired in February 2012. Key political measures needed to achieve a financially viable
sector in the medium term include a gradual adjustment to tariffs, increases in the DISCOs’
cash recovery index (CRI) to 70% from the historical lows of 50%, and the reduction of days
receivables from generating companies to a 60-day average.
Competitive Generation Assets: Haina’s ratings are supported by its diversified portfolio of generation assets, including wind generation, the use of various sources of fuel in its plants, and its strong market position and operational efficiency. These plants use fuel oil, diesel, and coal. This diversification provides the company with different positions on the dispatch merit list. Haina’s operational efficiency compares favorably with other generating companies in the country, registering an average heat rate of 9.526 British thermal units (Btu) per kilowatt-hour (kWh). Its most efficient unit registers a 7.800 Btu/kWh heat rate burning heavy fuel oil, also known as fuel oil No. 6.
Strong Credit Metrics: Haina’s credit metrics are strong relative to other ‘B’ rated companies. For the LTM ended March 31, 2012, the company reported an EBITDA of USD119 million (USD112 million in fiscal 2011) and had an 18.4% EBITDA margin. Respectively, leverage and debt service coverage stood at 2.5x and 1.7x in relation to EBITDA as of March 31, 2012.
Volatile Cash Flow Generation and Collection: For the LTM ended March 31, 2012, the company generated USD82 million of CFFO, an increase from USD41 million in 2011. Like other generators, the company struggles to collect receivables from distribution companies. At the end of first-quarter 2012, days receivable outstanding totaled 120 days, which is equivalent to four invoice periods. The collection rate was 54% during this period. With USD149 million of cash on hand, liquidity is high at 3x short-term debt.
What Could Trigger a Rating Action
Key Rating Drivers: Lower dependence of the sector on government subsidies could lead to a
rating upgrade. The ratings would also be positively affected by a positive rating action on the
sovereign.
Ratings
Foreign Currency
Long-Term FC IDR B
Long-Term LC IDR B
Senior Unsecured B
FC – Foreign currency. LC – Local currency. IDR – Issuer default rating.
Rating Outlook Long-Term LC/FC IDR Positive
Financial Data
Haina S.A.
(USD Mil.) LTM
3/31/12 12/31/11 Revenue 648 618
EBITDA 119 112
EBITDA Margin (%) 18.4 18.2
FFO 99 83 CFFO 82 41 FCF (24) (10) FFO Interest Coverage (x) 5.5 5.4 Total Debt 301 281 Total Debt/ EBITDA (x) 2.5 2.5 EBITDA/Debt Service Coverage (x) 1.7 1.7
Analysts Julio Ugueto +58 212 286-3356 [email protected]
Lucas Aristizabal +1 312 368-3260 [email protected]

Latin America High Yield 112
November 8, 2012
Corporates
Recovery Analysis
Haina’s issuance has been assigned a recovery rating of ‘RR4’. The recovery was based upon
the treatment of Haina as a going concern since a liquidation scenario is considered highly
unlikely. The ratings have been capped at ‘RR4’ due to concerns about the low probability of
high recoveries for bondholders of corporates domiciled in the Dominican Republic.
Haina’s debt issuance is not guaranteed by any specific asset but rather by all of the
company’s assets with no subordination with respect to any instrument. Fitch currently
maintains a positive outlook for the sovereign, and as such we do not foresee a bankruptcy
scenario for Haina in the near future, unless a low probability event such as a severe fiscal
crisis materializes that would severely impact the company’s cash flow.
The distressed EBITDA of Haina was calculated to cover the company’s fixed charges and
critical maintenance capex. This EBITDA was multiplied by a conservative 5x multiple to arrive
at a distressed company valuation. This distressed valuation would be associated with a
severe fiscal crisis that would lead to a sustained cash flow drain for all generating companies
in the country and contemplates the low probability event of a nonfriendly renegotiation
scenario of the company’s PPA’s with distribution companies to the detriment of Haina. In this
hypothetical scenario, it would be reasonable to expect a low demand for the company’s assets
under a competitive bidding process, further supporting the distressed valuation commented
above.
Recovery Analysis Empresa Generadora de Electricidad Haina, S.A. (USD Mil.) IDR: B Going Concern Enterprise Value LTM EBITDA as of March 31, 2012 119.0 Discount (%) 63.0 Distressed EBITDA 44.0 Market Multiple (x) 5.0 Enterprise Value 220.0 Post-Restructuring EBITDA Estimation Guidelines Interest Expense 22 Enterprise Value for Claims Distribution Rent Expense — Greater of Going Concern Enterprise or Liquidation Value 220.0Est. Maintenance Capital Expenditures 10 Less Administrative Claims (10%) 22.0Principal Amortization (Next 12 Months) 12 Adjusted Enterprise Value for Claims 198.0
Unsecured Priority Amount Outstanding
and Available R/C Value
RecoveredRecovery Rate (%)
Recovery Rating Notching Rating
Issuer Default Rating — — — — — B Senior Unsecured 227.0 198.0 87 RR2 +2 BB– Subordinated — — — — — —
Junior Subordinated — — — — — —
Source: Fitch.
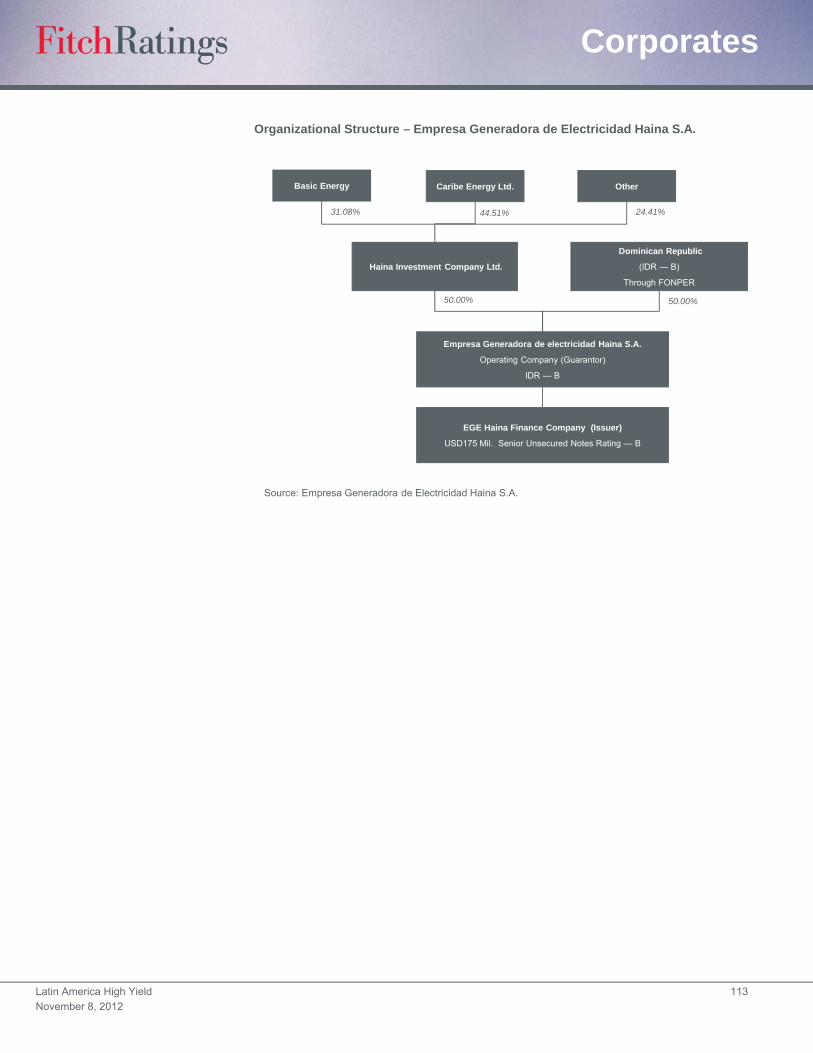
Latin America High Yield 113
November 8, 2012
Corporates
Caribe Energy Ltd.
Empresa Generadora de electricidad Haina S.A.
Operating Company (Guarantor)
IDR — B
Source: Empresa Generadora de Electricidad Haina S.A.
Basic Energy Other
Haina Investment Company Ltd.
Dominican Republic
(IDR — B)
Through FONPER
EGE Haina Finance Company (Issuer)
USD175 Mil. Senior Unsecured Notes Rating — B
31.08% 44.51% 24.41%
50.00% 50.00%
Organizational Structure – Empresa Generadora de Electricidad Haina S.A.
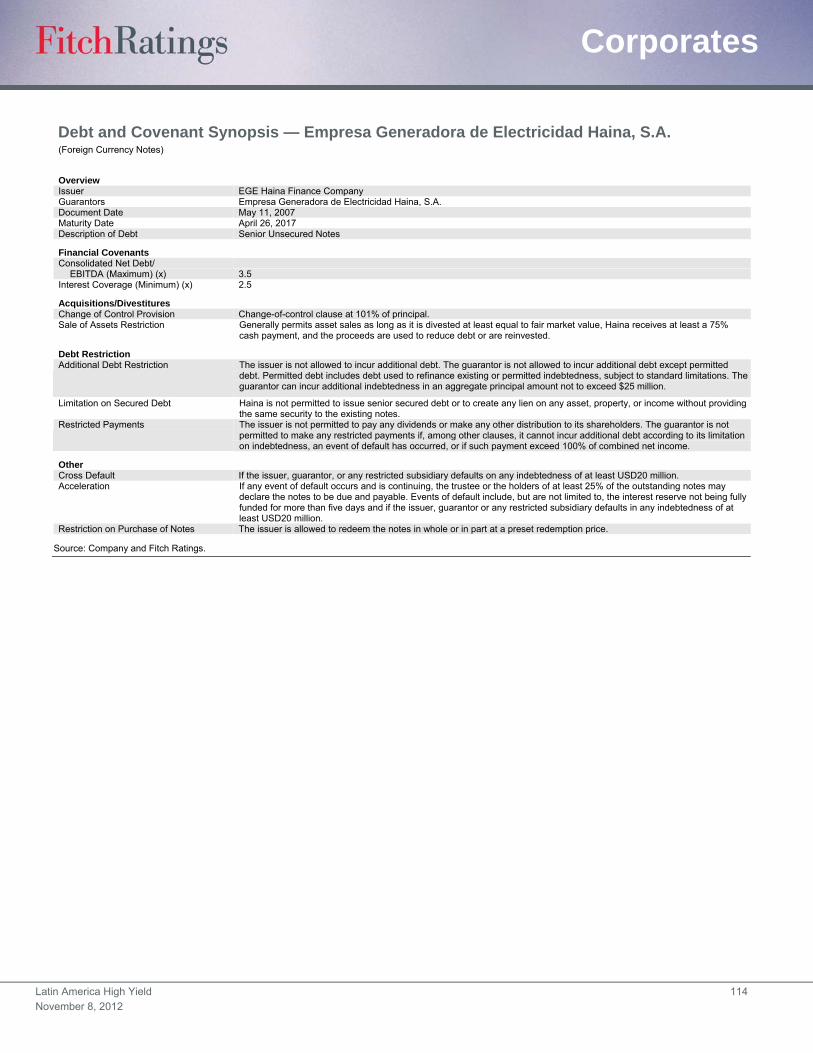
Latin America High Yield 114
November 8, 2012
Corporates
Debt and Covenant Synopsis — Empresa Generadora de Electricidad Haina, S.A. (Foreign Currency Notes)
Overview Issuer EGE Haina Finance Company Guarantors Empresa Generadora de Electricidad Haina, S.A. Document Date May 11, 2007 Maturity Date April 26, 2017 Description of Debt Senior Unsecured Notes
Financial Covenants Consolidated Net Debt/
EBITDA (Maximum) (x) 3.5 Interest Coverage (Minimum) (x) 2.5
Acquisitions/Divestitures Change of Control Provision Change-of-control clause at 101% of principal. Sale of Assets Restriction Generally permits asset sales as long as it is divested at least equal to fair market value, Haina receives at least a 75%
cash payment, and the proceeds are used to reduce debt or are reinvested.
Debt Restriction Additional Debt Restriction The issuer is not allowed to incur additional debt. The guarantor is not allowed to incur additional debt except permitted
debt. Permitted debt includes debt used to refinance existing or permitted indebtedness, subject to standard limitations. The guarantor can incur additional indebtedness in an aggregate principal amount not to exceed $25 million.
Limitation on Secured Debt Haina is not permitted to issue senior secured debt or to create any lien on any asset, property, or income without providing the same security to the existing notes.
Restricted Payments The issuer is not permitted to pay any dividends or make any other distribution to its shareholders. The guarantor is not permitted to make any restricted payments if, among other clauses, it cannot incur additional debt according to its limitation on indebtedness, an event of default has occurred, or if such payment exceed 100% of combined net income.
Other Cross Default If the issuer, guarantor, or any restricted subsidiary defaults on any indebtedness of at least USD20 million. Acceleration If any event of default occurs and is continuing, the trustee or the holders of at least 25% of the outstanding notes may
declare the notes to be due and payable. Events of default include, but are not limited to, the interest reserve not being fully funded for more than five days and if the issuer, guarantor or any restricted subsidiary defaults in any indebtedness of at least USD20 million.
Restriction on Purchase of Notes The issuer is allowed to redeem the notes in whole or in part at a preset redemption price.
Source: Company and Fitch Ratings.

Latin America High Yield 115
November 8, 2012
Corporates
Financial Summary Empresa Generadora de Electricidad Haina, S.A. (USD Mil., As of Dec. 31) LTM 3/31/12 2011 2010 2009 2008
Profitability
Operating EBITDA 118,846 112,243 78,649 44,555 74,174
Operating EBITDAR 118,846 112,243 78,649 44,555 74,174
Operating EBITDA Margin (%) 18.4 18.2 18.6 14.5 16.1
Operating EBITDAR Margin (%) 18.4 18.2 18.6 14.5 16.1
FFO Return on Adjusted Capital (%) 17.4 15.6 16.0 9.1 18.0
Free Cash Flow Margin (%) (3.7) (1.7) 12.5 (14.1) (6.7)
Return on Average Equity (%) 18.3 18.7 13.6 4.7 12.6
Coverage (x)
FFO Interest Coverage 5.5 5.4 4.2 1.7 3.7
Operating EBITDA/Gross Interest Expense 5.4 5.9 3.9 1.7 3.1
Operating EBITDAR/Interest Expense + Rents 5.4 5.9 3.9 1.7 3.1
Operating EBITDA/Debt Service Coverage 1.7 1.7 2.0 1.4 2.9
Operating EBITDAR/Debt Service Coverage 1.7 1.7 2.0 1.4 2.9
FFO Fixed-Charge Coverage 5.5 5.4 4.2 1.7 3.7
FCF Debt Service Coverage 0.0 0.1 1.8 (0.5) (0.3)
(FCF + Cash and Marketable Securities)/Debt Service Coverage 2.1 2.9 4.6 0.7 0.6
Cash Flow from Operations/Capital Expenditures 0.9 1.1 2.7 (2.9) 0.4
Leverage (x)
FFO Adjusted Leverage 2.5 2.8 2.4 4.5 2.0
Total Debt with Equity Credit/Operating EBITDA 2.5 2.5 2.6 4.5 2.4
Total Net Debt with Equity Credit/Operating EBITDA 1.3 0.9 1.2 3.7 2.1
Total Adjusted Debt/Operating EBITDAR 2.5 2.5 2.6 4.5 2.4
Total Adjusted Net Debt/Operating EBITDAR 1.3 0.9 1.2 3.7 2.1
Implied Cost of Funds (%) 8.6 7.8 9.9 13.6 13.1
Secured Debt/Total Debt — — — — —
Short-Term Debt/Total Debt 0.2 0.2 0.09 0.03 0.01
Balance Sheet
Total Assets 824,452 741,466 583,385 554,309 584,234
Cash and Marketable Securities 149,333 183,879 110,924 39,548 22,340
Short-Term Debt 47,700 47,656 19,600 6,000 1,703
Long-Term Debt 253,311 233,750 186,967 196,367 175,000
Total Debt 301,011 281,406 206,567 202,367 176,703
Equity Credit — — — — —
Total Debt with Equity Credit 301,011 281,406 206,567 202,367 176,703
Off-Balance Sheet Debt 0 0 0 0 0
Total Adjusted Debt with Equity Credit 301,011 281,406 206,567 202,367 176,703
Total Equity 394,305 375,160 324,181 291,804 316,687
Total Adjusted Capital 695,316 656,566 530,748 494,171 493,390
Cash Flow
Funds from Operations 99,035 83,227 64,707 19,021 65,116
Change in Working Capital (16,588) (42,154) 35,110 (36,323) (58,979)
Cash Flow from Operations 82,447 41,073 99,817 (17,302) 6,137
Total Non-Operating/Nonrecurring Cash Flow 0 0 0 0 0
Capital Expenditures (92,450) (37,539) (37,099) (5,881) (17,098)
Common Dividends (13,999) (13,999) (9,997) (20,003) (20,000)
Free Cash Flow (24,002) (10,465) 52,721 (43,186) (30,961)
Net Acquisitions and Divestitures 14 60 0 0 0
Other Investments, Net 15,649 9,035 14,488 32,978 16,986
Net Debt Proceeds 90,243 74,840 4,200 27,737 (10,738)
Net Equity Proceeds 0 0 0 0 0
Other (Investments and Financing) (5,579) (514) (30) (322) 0
Total Change in Cash 76,325 72,956 71,379 17,207 (24,713)
Income Statement
Revenue 647,558 617,540 422,509 307,198 460,567
Revenue Growth (%) 4.9 46.2 37.5 (33.3) 0.3
Operating EBIT 101,435 95,895 62,567 29,015 58,870
Gross Interest Expense 22,026 18,922 20,304 25,837 23,792
Rental Expense 0 0 0 0 0
Net Income 67,458 65,470 41,975 14,403 38,934
Source: Fitch.
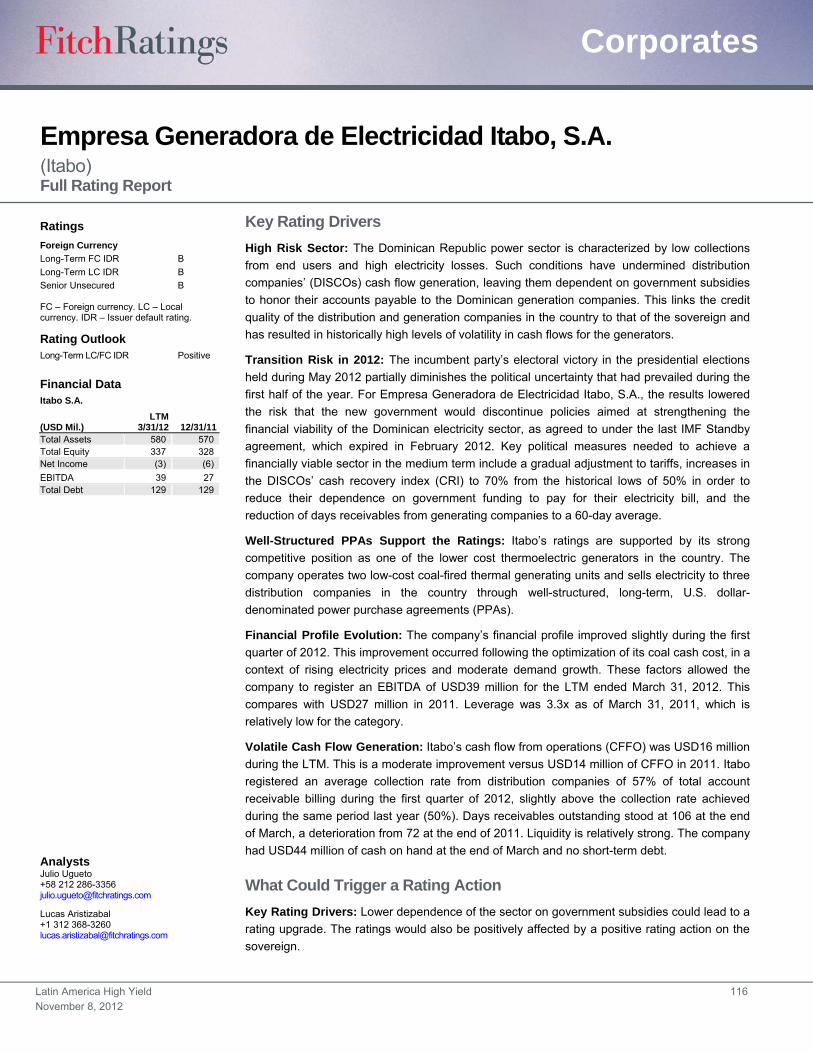
Latin America High Yield 116
November 8, 2012
Corporates
Empresa Generadora de Electricidad Itabo, S.A. (Itabo) Full Rating Report
Key Rating Drivers
High Risk Sector: The Dominican Republic power sector is characterized by low collections
from end users and high electricity losses. Such conditions have undermined distribution
companies’ (DISCOs) cash flow generation, leaving them dependent on government subsidies
to honor their accounts payable to the Dominican generation companies. This links the credit
quality of the distribution and generation companies in the country to that of the sovereign and
has resulted in historically high levels of volatility in cash flows for the generators.
Transition Risk in 2012: The incumbent party’s electoral victory in the presidential elections
held during May 2012 partially diminishes the political uncertainty that had prevailed during the
first half of the year. For Empresa Generadora de Electricidad Itabo, S.A., the results lowered
the risk that the new government would discontinue policies aimed at strengthening the
financial viability of the Dominican electricity sector, as agreed to under the last IMF Standby
agreement, which expired in February 2012. Key political measures needed to achieve a
financially viable sector in the medium term include a gradual adjustment to tariffs, increases in
the DISCOs’ cash recovery index (CRI) to 70% from the historical lows of 50% in order to
reduce their dependence on government funding to pay for their electricity bill, and the
reduction of days receivables from generating companies to a 60-day average.
Well-Structured PPAs Support the Ratings: Itabo’s ratings are supported by its strong
competitive position as one of the lower cost thermoelectric generators in the country. The
company operates two low-cost coal-fired thermal generating units and sells electricity to three
distribution companies in the country through well-structured, long-term, U.S. dollar-
denominated power purchase agreements (PPAs).
Financial Profile Evolution: The company’s financial profile improved slightly during the first
quarter of 2012. This improvement occurred following the optimization of its coal cash cost, in a
context of rising electricity prices and moderate demand growth. These factors allowed the
company to register an EBITDA of USD39 million for the LTM ended March 31, 2012. This
compares with USD27 million in 2011. Leverage was 3.3x as of March 31, 2011, which is
relatively low for the category.
Volatile Cash Flow Generation: Itabo’s cash flow from operations (CFFO) was USD16 million
during the LTM. This is a moderate improvement versus USD14 million of CFFO in 2011. Itabo
registered an average collection rate from distribution companies of 57% of total account
receivable billing during the first quarter of 2012, slightly above the collection rate achieved
during the same period last year (50%). Days receivables outstanding stood at 106 at the end
of March, a deterioration from 72 at the end of 2011. Liquidity is relatively strong. The company
had USD44 million of cash on hand at the end of March and no short-term debt.
What Could Trigger a Rating Action
Key Rating Drivers: Lower dependence of the sector on government subsidies could lead to a
rating upgrade. The ratings would also be positively affected by a positive rating action on the
sovereign.
Ratings
Foreign Currency
Long-Term FC IDR B
Long-Term LC IDR B
Senior Unsecured B
FC – Foreign currency. LC – Local currency. IDR – Issuer default rating.
Rating Outlook Long-Term LC/FC IDR Positive
Financial Data Itabo S.A.
(USD Mil.) LTM
3/31/12 12/31/11 Total Assets 580 570 Total Equity 337 328 Net Income (3) (6)
EBITDA 39 27 Total Debt 129 129
Analysts Julio Ugueto +58 212 286-3356 [email protected]
Lucas Aristizabal +1 312 368-3260 [email protected]
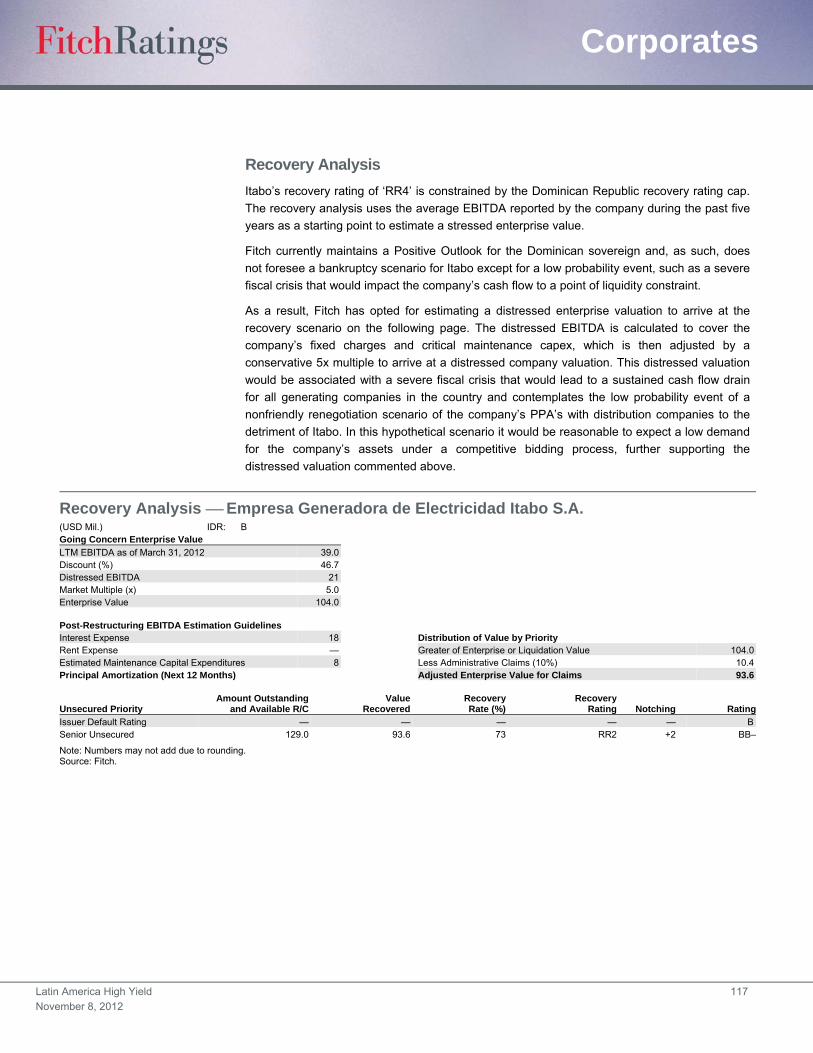
Latin America High Yield 117
November 8, 2012
Corporates
Recovery Analysis
Itabo’s recovery rating of ‘RR4’ is constrained by the Dominican Republic recovery rating cap.
The recovery analysis uses the average EBITDA reported by the company during the past five
years as a starting point to estimate a stressed enterprise value.
Fitch currently maintains a Positive Outlook for the Dominican sovereign and, as such, does
not foresee a bankruptcy scenario for Itabo except for a low probability event, such as a severe
fiscal crisis that would impact the company’s cash flow to a point of liquidity constraint.
As a result, Fitch has opted for estimating a distressed enterprise valuation to arrive at the
recovery scenario on the following page. The distressed EBITDA is calculated to cover the
company’s fixed charges and critical maintenance capex, which is then adjusted by a
conservative 5x multiple to arrive at a distressed company valuation. This distressed valuation
would be associated with a severe fiscal crisis that would lead to a sustained cash flow drain
for all generating companies in the country and contemplates the low probability event of a
nonfriendly renegotiation scenario of the company’s PPA’s with distribution companies to the
detriment of Itabo. In this hypothetical scenario it would be reasonable to expect a low demand
for the company’s assets under a competitive bidding process, further supporting the
distressed valuation commented above.
Recovery Analysis Empresa Generadora de Electricidad Itabo S.A. (USD Mil.) IDR: B Going Concern Enterprise Value
LTM EBITDA as of March 31, 2012 39.0 Discount (%) 46.7 Distressed EBITDA 21 Market Multiple (x) 5.0 Enterprise Value 104.0 Post-Restructuring EBITDA Estimation Guidelines Interest Expense 18 Distribution of Value by Priority Rent Expense — Greater of Enterprise or Liquidation Value 104.0Estimated Maintenance Capital Expenditures 8 Less Administrative Claims (10%) 10.4Principal Amortization (Next 12 Months) Adjusted Enterprise Value for Claims 93.6
Unsecured Priority Amount Outstanding
and Available R/C Value
RecoveredRecovery Rate (%)
RecoveryRating Notching Rating
Issuer Default Rating — — — — — BSenior Unsecured 129.0 93.6 73 RR2 +2 BB–
Note: Numbers may not add due to rounding. Source: Fitch.
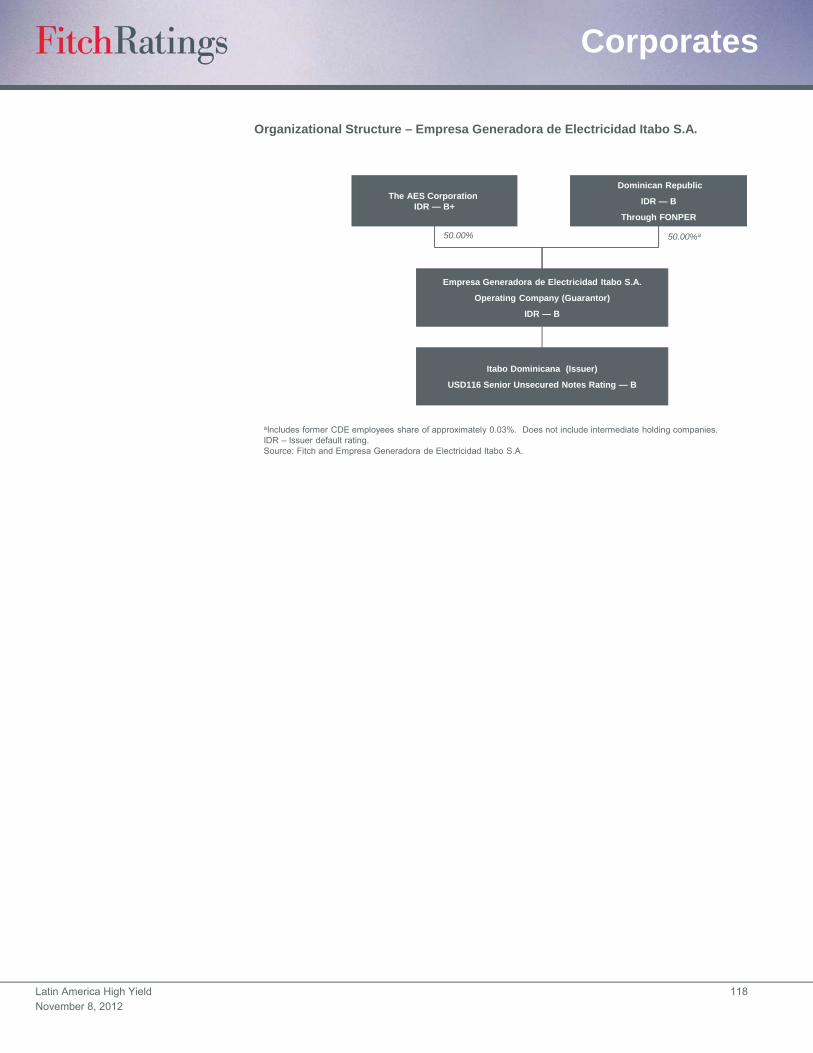
Latin America High Yield 118
November 8, 2012
Corporates
Empresa Generadora de Electricidad Itabo S.A.
Operating Company (Guarantor)
IDR — B
aIncludes former CDE employees share of approximately 0.03%. Does not include intermediate holding companies. IDR – Issuer default rating.Source: Fitch and Empresa Generadora de Electricidad Itabo S.A.
The AES Corporation IDR — B+
Dominican Republic
IDR — B
Through FONPER
Itabo Dominicana (Issuer)
USD116 Senior Unsecured Notes Rating — B
50.00% 50.00%a
Organizational Structure – Empresa Generadora de Electricidad Itabo S.A.

Latin America High Yield 119
November 8, 2012
Corporates
Debt and Covenant Synopsis — Empresa Generadora de Electricidad Itabo, S.A. (Foreign Currency Notes)
Overview Issuer Itabo Dominicana Guarantors Empresa Generadora de Electricidad Itabo, S.A. (Itabo) Document Date Nov. 12, 2010 Maturity Date Nov. 12, 2020 Description of Debt Senior Unsecured Notes
Financial Covenants Consolidated Net Debt/
EBITDA (Maximum) (x) 3.5 Interest Coverage (Minimum) (x) 2.5
Acquisitions/Divestitures Change-of-Control Provision Change-of-control clause at 101% of principal. Sale of Assets Restriction Generally permits asset sales as long as it is divested at least equal to fair market value, it received at least 75% cash
payment, and if the proceeds are used to reduce debt or are reinvested.
Debt Restriction Additional Debt Restriction The issuer is not allowed to incur additional debt. The guarantor is not allowed to incur additional debt except permitted debt.
Permitted debt includes debt used to refinance existing or permitted indebtedness, subject to standard limitations. The guarantor can incur additional indebtedness in an aggregate principal amount not to exceed USD35 million.
Limitation on Secured Debt Itabo is not permitted to issue senior secured debt or to create any lien on any asset, property, or income without providing the same security to the existing notes.
Restricted Payments The issuer is not permitted to pay any dividends or make any other distribution to its shareholders. The guarantor is not permitted to make any restricted payments if, among other clauses, it cannot incur additional debt according to its limitation on indebtedness, an event of default has occurred, or if such payment exceeds 100% of combined net income.
Other Cross Default None. Acceleration If any event of default occurs and is continuing, the trustee or the holders of at least 25% of the outstanding notes may
declare the notes to be due and payable. Events of default include, but are not limited to, the interest reserve not being fully funded for more than five days and if the issuer, guarantor, or any restricted subsidiary defaults in any indebtedness of at least USD20.0 million.
Restriction on Purchase of Notes The issuer is allowed to redeem the notes in whole or in part at a preset redemption price.
Source: Company and Fitch Ratings.

Latin America High Yield 120
November 8, 2012
Corporates
Financial Summary Empresa Generadora de Electricidad Itabo, S.A. (USD Mil., As of Dec. 31) LTM 3/31/12 2011 2010 2009 2008
Profitability
Operating EBITDA 39,140 27,050 (5,243) 70,484 73,461
Operating EBITDAR 39,140 27,050 (5,243) 70,484 73,461
Operating EBITDA Margin (%) 15.3 10.9 (2.6) 32.9 29.2
Operating EBITDAR Margin (%) 15.3 10.9 (2.6) 32.9 29.2
FFO Return on Adjusted Capital (%) 9.6 9.9 17.6 36.3 1.3
Free Cash Flow Margin (%) (6.8) (7.5) (3.1) 16.9 (0.2)
Return on Average Equity (%) (1.0) (1.8) (24.0) 10.4 14.1
Coverage (x)
FFO Interest Coverage 2.5 3.0 4.5 7.2 0.3
Operating EBITDA/Gross Interest Expense 2.2 1.8 (0.3) 3.2 4.2
Operating EBITDAR/Interest Expense + Rents 2.2 1.8 (0.3) 3.2 4.2
Operating EBITDA/Debt Service Coverage 2.2 1.8 (0.3) 3.2 4.2
Operating EBITDAR/Debt Service Coverage 2.2 1.8 (0.3) 3.2 4.2
FFO Fixed-Charge Coverage 2.5 3.0 4.5 7.2 0.3
FCF Debt Service Coverage 0.0 (0.2) 0.7 2.7 1.0
(FCF + Cash and Marketable Securities)/Debt Service Coverage 2.5 3.3 4.6 6.3 2.2
Cash Flow from Operations/Capital Expenditures 0.5 0.5 2.8 6.4 0.9
Leverage (x)
FFO Adjusted Leverage 2.9 2.9 1.6 0.8 21.9
Total Debt with Equity Credit/Operating EBITDA 3.3 4.8 (24.5) 1.8 1.7
Total Net Debt with Equity Credit/Operating EBITDA 2.2 2.8 (10.9) 0.7 1.4
Total Adjusted Debt/Operating EBITDAR 3.3 4.8 (24.5) 1.8 1.7
Total Adjusted Net Debt/Operating EBITDAR 2.2 2.8 (10.9) 0.7 1.4
Implied Cost of Funds (%) 0.1 0.1 0.3 0.2 0.1
Secured Debt/Total Debt — — — — —
Short-Term Debt/Total Debt
Balance Sheet
Total Assets 579,941 569,910 573,293 503,710 505,639
Cash and Marketable Securities 44,436 52,892 71,482 79,150 20,792
Short-Term Debt — — — — —
Long-Term Debt 128,852 128,792 128,564 125,000 125,000
Total Debt 128,852 128,792 128,564 125,000 125,000
Equity Credit — — — — —
Total Debt with Equity Credit 128,852 128,792 128,564 125,000 125,000
Off-Balance Sheet Debt 0 0 0 0 0
Total Adjusted Debt with Equity Credit 128,852 128,792 128,564 125,000 125,000
Total Equity 337,475 328,022 335,688 305,389 310,924
Total Adjusted Capital 466,327 456,814 464,252 430,389 435,924
Cash Flow
Funds from Operations 26,853 29,911 63,480 134,635 (11,905)
Change in Working Capital (10,518) (15,952) (20,650) (75,304) 15,831
Cash Flow from Operations 16,335 13,959 42,830 59,331 3,926
Total Non-Operating/Nonrecurring Cash Flow 0 0 0 0 0
Capital Expenditures (31,914) (30,702) (15,258) (9,280) (4,410)
Common Dividends (1,725) (1,725) (33,775) (13,790) 0
Free Cash Flow (17,304) (18,468) (6,203) 36,261 (484)
Net Acquisitions and Divestitures 2,105 361 226 850 20,100
Other Investments, Net 330 (56) 1,986 21,269 (3,453)
Net Debt Proceeds 0 0 (1,629) 0 0
Net Equity Proceeds 0 0 0 0 0
Other (Investments. and Financing) (427) (427) (2,243) (16) (20)
Total Change in Cash (15,296) (18,590) (7,863) 58,364 16,143
Income Statement
Revenue 255,531 247,619 199,485 214,370 251,778
Revenue Growth (%) — 24.1 (6.9) (14.9) 25.6
Operating EBIT 16,208 4,111 (28,712) 51,028 54,080
Gross Interest Expense 18,095 15,112 18,217 21,747 17,622
Rental Expense 0 0 0 0 0
Net Income (3,193) (5,963) (40,239) 32,003 42,095
Source: Fitch.
Latin America High Yield 121
November 8, 2012
Corporates
Gol Linhas Aereas Inteligentes S.A. Full Rating Report
Key Rating Drivers
Liquidity Trend: At the end of June 2012, Gol Linhas Aereas Inteligentes S.A. (GOL) had
BRL1.7 billion of cash and marketable securities, equivalent to 21% of the company’s LTM
June 2012 revenue. During LTM June 2012, GOL’s FCF was negative BRL969 million. This
figure is equivalent to about 57% and 19% of the company’s cash position and on-balance debt,
respectively, at the end of June 2012. Potential liquidity deterioration during the second quarter
of 2012, driven by continued negative free cash flow (FCF) that resulted in lower cash balance
or incremental debt, is GOL’s main credit concern.
High Financial Leverage: The company’s net leverage, as measured by the total adjusted net
debt/EBITDAR ratio, reached 13.2x by the end of June 2012. This represents a sharp increase
versus the 8.9x and 4.6x levels reached by the end of December 2011 and June 2011,
respectively.
Market Position and Limited Diversification: GOL maintained an important market share in
the Brazilian domestic market of 39.6% (including recently acquired Webjet S.A.), measured by
revenue passenger kilometers (RPK), at the end of August 2012. The ratings consider the
company’s business model, which is primarily oriented to the domestic passenger market, and
has limited product and geographic diversification.
Capacity Management: Considering capacity from acquired Webjet S.A., GOL reached a total
capacity of 32.5 billion, measured by available seat kilometers (ASK), during the January–
August 2012 period. GOL’s management is likely to be conservative during the second half of
2012 in an effort to boost profitability and cash flow. This should result in 2012 growth rates for
the company’s capacity in the range of –2% to –4%, which is expected to be positive in terms
of the company’s yields.
Macro and Business Environment: The ratings factor in the high degree of sensitivity of
GOL’s financial performance based on several factors not controlled by the company, such as
competition, performance of the local currency, and fuel price trends. These factors should
continue to put pressure on the company’s margins in the short to medium term, which could
offset the actions taken by management — in terms of capacity management and ex-fuel cost
reduction — to improve its free cash flow generation during 2012.
Subordination of Unsecured Debt Incorporated: The ‘B/RR5’ rating of the company’s
unsecured public debt reflects below-average recovery prospects in the event of a default due
to the subordination of the unsecured debt to secured debt related to aircraft finance.
What Could Trigger a Rating Action
Liquidity Trend Is Main Rating Driver: The Negative Outlook incorporates Fitch’s concern
regarding a potential scenario of continued negative trends in the company’s FCF that could
result in liquidity deterioration during the second half of 2012. A deterioration of the company’s
liquidity position would likely result in downgrades of the company’s ratings. Conversely, better
operational performance during 2012 could warrant a change in the Rating Outlook to Stable.
Ratings
GOL
Foreign Currency
Long-Term IDR B+
Senior Unsecured B/RR5
Local Currency
Long-Term IDR B+
National
Long-Term Rating BBB(bra)
VRG Linhas Aereas S.A. (VRG)
Foreign Currency
Long-Term IDR B+
Local Currency
Long-Term IDR B+
National
Long-Term Rating BBB(bra)
Senior Unsecured BBB–(bra)
GOL Finance
Foreign Currency
Long-Term IDR B+
Senior Unsecured B/RR5
Local Currency
Long-Term IDR B+
IDR Issuer default rating.
Rating Outlooks Long-Term Foreign Currency IDR Negative Long-Term Local Currency IDR Negative National Long-Term Rating Negative
Financial Data
Gol Linhas Aereas Inteligentes S.A. (Consolidated)
(BRL Mil.) 6/30/12 12/31/11
Revenue 8,074 7,539 EBITDAR 569 707 EBITDAR Margin (%) 7.0 9.4 Cash 1,703 2,240 Short-Term Debt 606 1,552 Total On-Balance Debt 5,233 4,992 Total Adjusted Debt 9,196 8,527 Gross Adjusted Leverage (x) 16.2 12.1 Net Adjusted Leverage (x) 13.2 8.9 FCF (969) (1,324) FCF Margin (%) (12.0) (17.6)
Analysts José Vértiz +1 212 908-0641 [email protected]
Debora Jalles +55 21 4503-2629 [email protected]
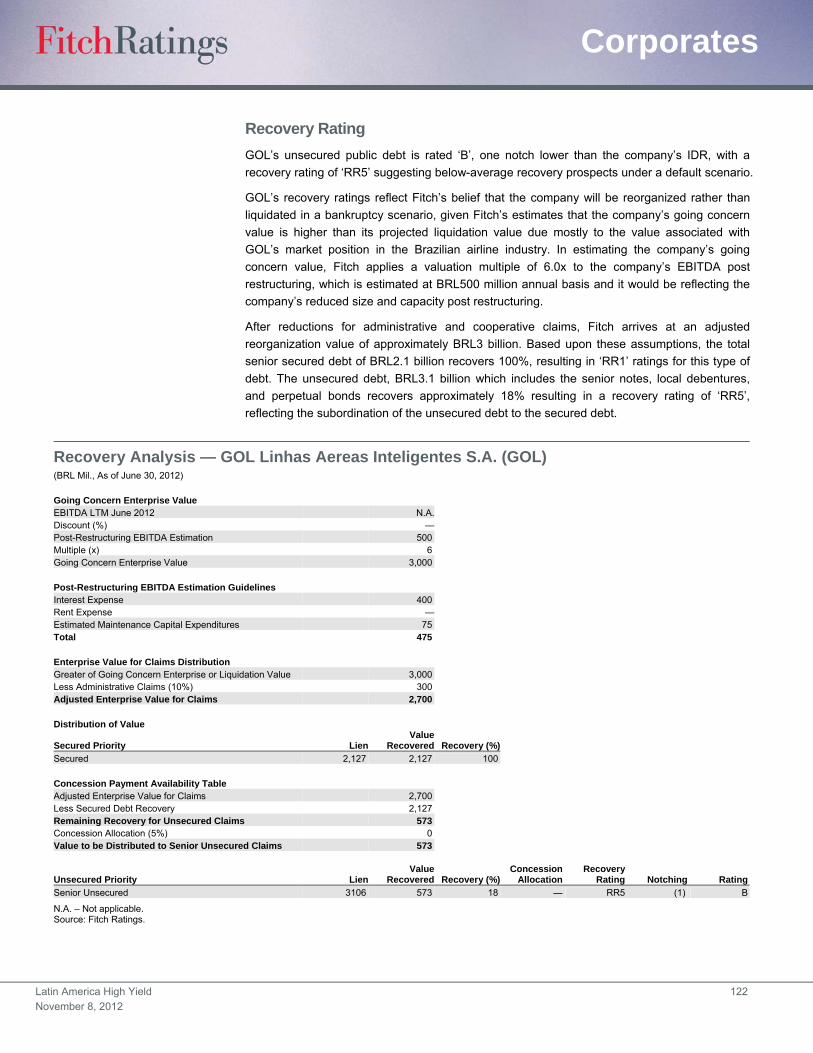
Latin America High Yield 122
November 8, 2012
Corporates
Recovery Rating
GOL’s unsecured public debt is rated ‘B’, one notch lower than the company’s IDR, with a
recovery rating of ‘RR5’ suggesting below-average recovery prospects under a default scenario.
GOL’s recovery ratings reflect Fitch’s belief that the company will be reorganized rather than
liquidated in a bankruptcy scenario, given Fitch’s estimates that the company’s going concern
value is higher than its projected liquidation value due mostly to the value associated with
GOL’s market position in the Brazilian airline industry. In estimating the company’s going
concern value, Fitch applies a valuation multiple of 6.0x to the company’s EBITDA post
restructuring, which is estimated at BRL500 million annual basis and it would be reflecting the
company’s reduced size and capacity post restructuring.
After reductions for administrative and cooperative claims, Fitch arrives at an adjusted
reorganization value of approximately BRL3 billion. Based upon these assumptions, the total
senior secured debt of BRL2.1 billion recovers 100%, resulting in ‘RR1’ ratings for this type of
debt. The unsecured debt, BRL3.1 billion which includes the senior notes, local debentures,
and perpetual bonds recovers approximately 18% resulting in a recovery rating of ‘RR5’,
reflecting the subordination of the unsecured debt to the secured debt.
Recovery Analysis — GOL Linhas Aereas Inteligentes S.A. (GOL) (BRL Mil., As of June 30, 2012) Going Concern Enterprise Value EBITDA LTM June 2012 N.A. Discount (%) — Post-Restructuring EBITDA Estimation 500 Multiple (x) 6 Going Concern Enterprise Value 3,000
Post-Restructuring EBITDA Estimation Guidelines Interest Expense 400 Rent Expense — Estimated Maintenance Capital Expenditures 75 Total 475
Enterprise Value for Claims Distribution Greater of Going Concern Enterprise or Liquidation Value 3,000 Less Administrative Claims (10%) 300 Adjusted Enterprise Value for Claims 2,700
Distribution of Value
Secured Priority LienValue
Recovered Recovery (%)
Secured 2,127 2,127 100
Concession Payment Availability Table Adjusted Enterprise Value for Claims 2,700 Less Secured Debt Recovery 2,127 Remaining Recovery for Unsecured Claims 573 Concession Allocation (5%) 0 Value to be Distributed to Senior Unsecured Claims 573
Unsecured Priority LienValue
Recovered Recovery (%)Concession
AllocationRecovery
Rating Notching Rating
Senior Unsecured 3106 573 18 — RR5 (1) B
N.A. – Not applicable. Source: Fitch Ratings.
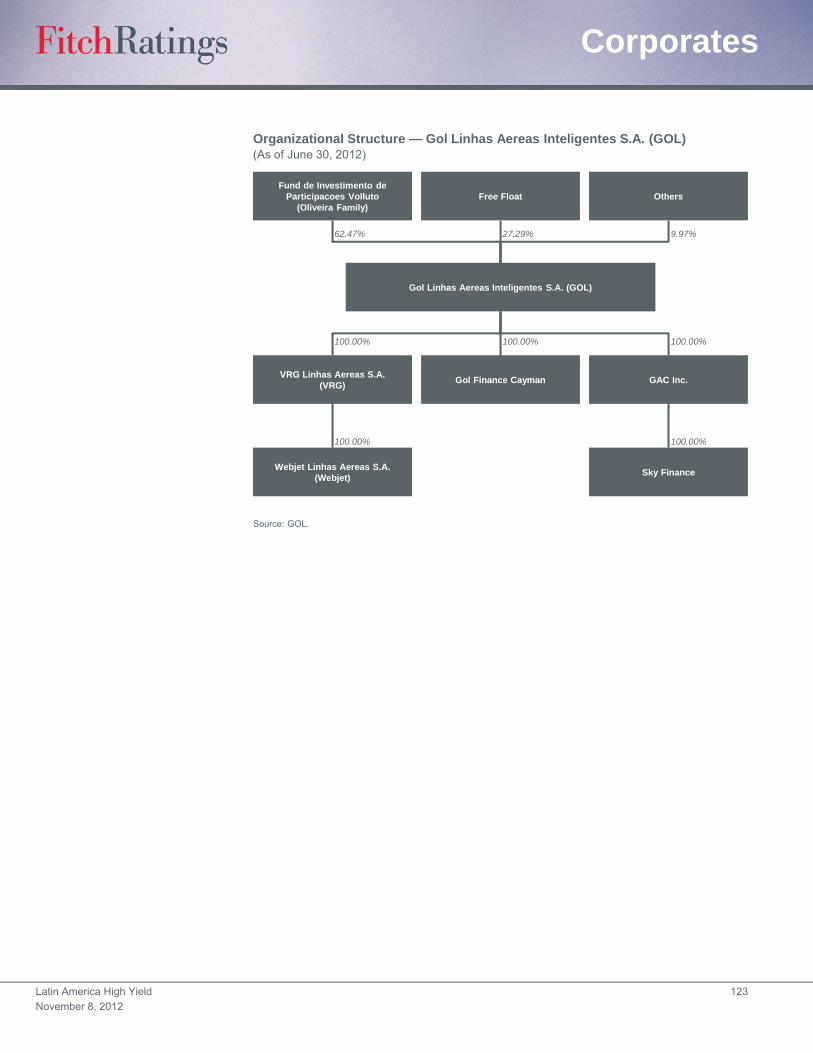
Latin America High Yield 123
November 8, 2012
Corporates
Organizational Structure — Gol Linhas Aereas Inteligentes S.A. (GOL)(As of June 30, 2012)
Source: GOL.
Fund de Investimento de Participacoes Volluto
(Oliveira Family) Free Float Others
Gol Linhas Aereas Inteligentes S.A. (GOL)
VRG Linhas Aereas S.A. (VRG)
Gol Finance Cayman GAC Inc.
Webjet Linhas Aereas S.A. (Webjet)
Sky Finance
62.47% 27.29% 9.97%
100.00% 100.00% 100.00%
100.00% 100.00%
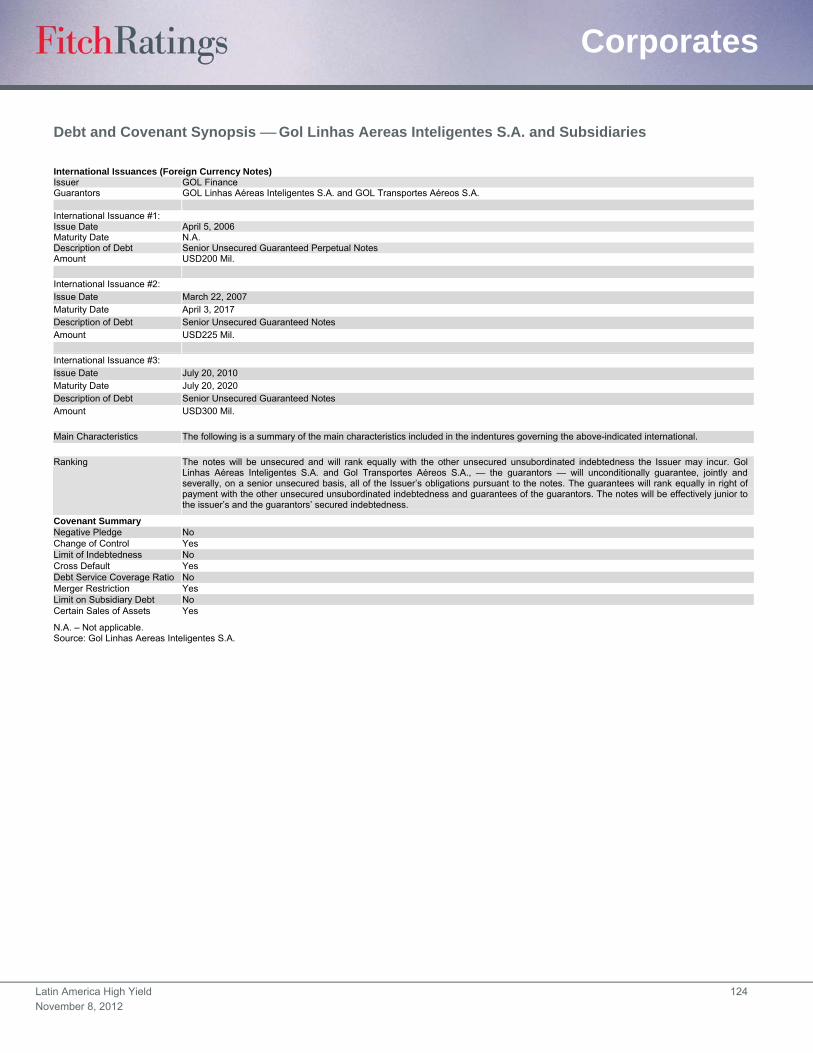
Latin America High Yield 124
November 8, 2012
Corporates
Debt and Covenant Synopsis Gol Linhas Aereas Inteligentes S.A. and Subsidiaries
International Issuances (Foreign Currency Notes) Issuer GOL Finance Guarantors GOL Linhas Aéreas Inteligentes S.A. and GOL Transportes Aéreos S.A. International Issuance #1: Issue Date April 5, 2006 Maturity Date N.A. Description of Debt Senior Unsecured Guaranteed Perpetual Notes Amount USD200 Mil. International Issuance #2: Issue Date March 22, 2007 Maturity Date April 3, 2017 Description of Debt Senior Unsecured Guaranteed Notes Amount USD225 Mil. International Issuance #3: Issue Date July 20, 2010 Maturity Date July 20, 2020 Description of Debt Senior Unsecured Guaranteed Notes Amount USD300 Mil. Main Characteristics The following is a summary of the main characteristics included in the indentures governing the above-indicated international. Ranking The notes will be unsecured and will rank equally with the other unsecured unsubordinated indebtedness the Issuer may incur. Gol
Linhas Aéreas Inteligentes S.A. and Gol Transportes Aéreos S.A., — the guarantors — will unconditionally guarantee, jointly and severally, on a senior unsecured basis, all of the Issuer’s obligations pursuant to the notes. The guarantees will rank equally in right of payment with the other unsecured unsubordinated indebtedness and guarantees of the guarantors. The notes will be effectively junior to the issuer’s and the guarantors’ secured indebtedness.
Covenant Summary Negative Pledge No Change of Control Yes Limit of Indebtedness No Cross Default Yes Debt Service Coverage Ratio No Merger Restriction Yes Limit on Subsidiary Debt No Certain Sales of Assets Yes
N.A. – Not applicable. Source: Gol Linhas Aereas Inteligentes S.A.

Latin America High Yield 125
November 8, 2012
Corporates
Debt and Covenant Synopsis Gol Linhas Aereas Inteligentes S.A. and Subsidiaries
Local Debentures Issuer VRG Linhas Aéreas Guarantors GOL Linhas Aéreas Inteligentes S.A. Local Issuance #1 Issue Date May 13, 2009 Maturity Date Sept. 13, 2015 Description of Debt 4th Issue of Simple, Nonconvertible Debentures – Unsecured Debt Collateral N.A. Amount BRL 600 Mil. Local Issuance #2 Issue Date June 20, 2011 Maturity Date June 10, 2017 Description of Debt 5th Issue of Simple, Nonconvertible Debentures – Unsecured Debt Collateral N.A. Amount BRL 500 Mil. Other Loans and Financings BNDES Loan BRL15.5 Mil. outstanding as of June 30, 2012 IFC Loan BRL25.6 Mil. outstanding as of June 2012 Covenants Status (Debentures, Loans and Financings)
The following information has been extracted from the notes in the company’s financial statements. VRG has restrictive covenants (covenants) in its financing agreements with the following financial institutions: IFC, Bradesco and Banco do Brasil (Debentures IV and V, respectively). The restrictive covenants measures for these loans are: (1) net financial debt/ EBITDAR, (2) current assets/current liabilities, (3) EBITDA/debt service, and (4) debt coverage ratio. On Dec. 31, 2011, the company and its subsidiaries did not reach the minimum standards established for the financing from the IFC, BNDES and the debentures IV and V, bond to EBITDA due to accumulated losses in the year ended Dec. 31, 2011. VRG issued to BNDES a letter of guarantee of BRL15.5 million, whose amount exceeds the current debt, and is not therefore subject to liquidity problems in case it is required to settle such debts.
Restrictive Covenants The following is a summary of the main restrictive covenants that apply for the VRG debentures (4th and 5th) and the BNDES and IFC loans above-indicated.
Net Financial Debt / EBITDAR Level as of June 30, 2012: 13x In Compliance (Jun 2012) No Waiver Yes, until December 2012 Current Assets / Current Liabilities Level as of June 30, 2012: 1.0x In Compliance (Jun 2012) No Waiver Yes, until December 2012 Debt Coverage Ratio. Level as of June 30, 2012: 0.95x In Compliance (Jun 2012) No Waiver Yes, until December 2012 EBITDA/Debt Service Level as of June 30, 2012: 0.95x In Compliance (Jun 2012) No Waiver Yes, until December 2012
N.A. – Not applicable. Source: Gol Linhas Aereas Inteligentes S.A.
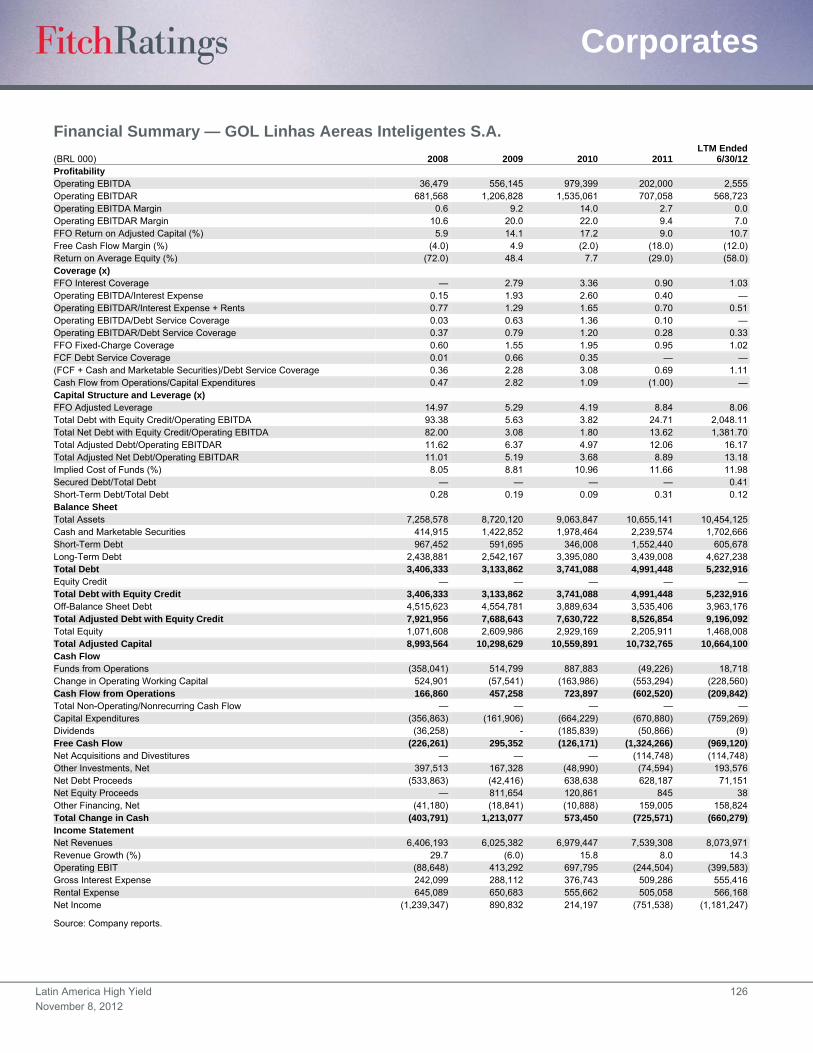
Latin America High Yield 126
November 8, 2012
Corporates
Financial Summary — GOL Linhas Aereas Inteligentes S.A.
(BRL 000) 2008 2009 2010 2011LTM Ended
6/30/12Profitability Operating EBITDA 36,479 556,145 979,399 202,000 2,555Operating EBITDAR 681,568 1,206,828 1,535,061 707,058 568,723Operating EBITDA Margin 0.6 9.2 14.0 2.7 0.0 Operating EBITDAR Margin 10.6 20.0 22.0 9.4 7.0 FFO Return on Adjusted Capital (%) 5.9 14.1 17.2 9.0 10.7 Free Cash Flow Margin (%) (4.0) 4.9 (2.0) (18.0) (12.0)Return on Average Equity (%) (72.0) 48.4 7.7 (29.0) (58.0)Coverage (x) FFO Interest Coverage — 2.79 3.36 0.90 1.03 Operating EBITDA/Interest Expense 0.15 1.93 2.60 0.40 —Operating EBITDAR/Interest Expense + Rents 0.77 1.29 1.65 0.70 0.51 Operating EBITDA/Debt Service Coverage 0.03 0.63 1.36 0.10 —Operating EBITDAR/Debt Service Coverage 0.37 0.79 1.20 0.28 0.33 FFO Fixed-Charge Coverage 0.60 1.55 1.95 0.95 1.02 FCF Debt Service Coverage 0.01 0.66 0.35 — —(FCF + Cash and Marketable Securities)/Debt Service Coverage 0.36 2.28 3.08 0.69 1.11 Cash Flow from Operations/Capital Expenditures 0.47 2.82 1.09 (1.00) —Capital Structure and Leverage (x) FFO Adjusted Leverage 14.97 5.29 4.19 8.84 8.06 Total Debt with Equity Credit/Operating EBITDA 93.38 5.63 3.82 24.71 2,048.11 Total Net Debt with Equity Credit/Operating EBITDA 82.00 3.08 1.80 13.62 1,381.70 Total Adjusted Debt/Operating EBITDAR 11.62 6.37 4.97 12.06 16.17 Total Adjusted Net Debt/Operating EBITDAR 11.01 5.19 3.68 8.89 13.18 Implied Cost of Funds (%) 8.05 8.81 10.96 11.66 11.98 Secured Debt/Total Debt — — — — 0.41 Short-Term Debt/Total Debt 0.28 0.19 0.09 0.31 0.12 Balance Sheet Total Assets 7,258,578 8,720,120 9,063,847 10,655,141 10,454,125 Cash and Marketable Securities 414,915 1,422,852 1,978,464 2,239,574 1,702,666 Short-Term Debt 967,452 591,695 346,008 1,552,440 605,678 Long-Term Debt 2,438,881 2,542,167 3,395,080 3,439,008 4,627,238 Total Debt 3,406,333 3,133,862 3,741,088 4,991,448 5,232,916 Equity Credit — — — — —Total Debt with Equity Credit 3,406,333 3,133,862 3,741,088 4,991,448 5,232,916 Off-Balance Sheet Debt 4,515,623 4,554,781 3,889,634 3,535,406 3,963,176 Total Adjusted Debt with Equity Credit 7,921,956 7,688,643 7,630,722 8,526,854 9,196,092 Total Equity 1,071,608 2,609,986 2,929,169 2,205,911 1,468,008 Total Adjusted Capital 8,993,564 10,298,629 10,559,891 10,732,765 10,664,100 Cash Flow Funds from Operations (358,041) 514,799 887,883 (49,226) 18,718 Change in Operating Working Capital 524,901 (57,541) (163,986) (553,294) (228,560)Cash Flow from Operations 166,860 457,258 723,897 (602,520) (209,842)Total Non-Operating/Nonrecurring Cash Flow — — — — —Capital Expenditures (356,863) (161,906) (664,229) (670,880) (759,269)Dividends (36,258) - (185,839) (50,866) (9)Free Cash Flow (226,261) 295,352 (126,171) (1,324,266) (969,120)Net Acquisitions and Divestitures — — — (114,748) (114,748)Other Investments, Net 397,513 167,328 (48,990) (74,594) 193,576 Net Debt Proceeds (533,863) (42,416) 638,638 628,187 71,151 Net Equity Proceeds — 811,654 120,861 845 38 Other Financing, Net (41,180) (18,841) (10,888) 159,005 158,824 Total Change in Cash (403,791) 1,213,077 573,450 (725,571) (660,279)Income Statement Net Revenues 6,406,193 6,025,382 6,979,447 7,539,308 8,073,971 Revenue Growth (%) 29.7 (6.0) 15.8 8.0 14.3 Operating EBIT (88,648) 413,292 697,795 (244,504) (399,583)Gross Interest Expense 242,099 288,112 376,743 509,286 555,416 Rental Expense 645,089 650,683 555,662 505,058 566,168 Net Income (1,239,347) 890,832 214,197 (751,538) (1,181,247)
Source: Company reports.

Latin America High Yield 127
November 8, 2012
Corporates
Grupo FAMSA S.A.B. de C.V. Full Rating Report
Key Rating Drivers
Declining U.S. Performance Forces Closures: Driven by poorly performing West Coast
stores, Grupo FAMSA S.A.B. de C.V.’s (Famsa) same-store sales (SSS) of U.S. operations
has declined since 2008, notching double-digit decreases in the last two years, resulting in
negative EBITDA of MXN202 million for 2011. Management plans to wind down all West Coast
operations by the end of 2012. This will likely improve leverage levels by increasing EBITDA
and/or reducing indebtedness.
Low SSS Constrains Revenues: SSS of Mexican operations (including financial revenues)
underperformed that of Famsa’s ANTAD (National Retailers Association of Mexico) peers over
the last few quarters. As of second-quarter 2012, on a LTM basis, consolidated revenues
decreased 5.7%, while EBITDA grew 4.4%.
Retail Strengths and Banking Subsidiary Support Ratings: Famsa’s ratings reflect its retail
operation strengths, including market position in Mexico, geographic and product diversity, and
broadly stable operating cash flow. Famsa’s sales benefit from financing provided by its
banking subsidiary, Banco Ahorro Famsa (BAF, or the Bank), which is rated ‘BBB–(mex)’ by
Fitch Ratings.
BAF’s Asset Quality Remains Weak: The quality of BAF’s loan portfolio, which is mainly
composed of consumer loans (73.5% of total assets), has deteriorated as borrowers’ payment
capacity has suffered from adverse economic conditions. Asset quality remains weak despite
ample past due loans coverage ratios (143.7% in 2011). The bank’s commercial loan portfolio,
which is highly concentrated, grew 22.7% in 2011.
Leverage Is High: LTM consolidated total debt-to-EBITDA and adjusted debt-to-EBITDAR
ratios (excluding bank deposits) have stayed broadly stable at 3.0x and 4.2x, respectively.
Including bank deposit leverage, these ratios are high at 8.9x and 8.3x, respectively.
What Could Trigger a Rating Action
Improved Sales: Going forward, Fitch would favorably view an increase in SSS, an improved
mix of sales, or an upgrade of BAF.
Decreases in EBITDA: Conversely, Fitch would unfavorably view a decrease in EBITDA
generation by Famsa’s retail operation, failure to deleverage after FAMSA USA’s downsizing,
or an increase in short-term debt as a percentage of total (nondepositary) debt.
Liquidity and Debt Structure
Wieldy Short-Term Debt: Short-term debt as of June 30, 2012 was about MXN2.1 billion
(excluding BAF’s customer deposits), a manageable figure when taking into account the
company’s cash flow generation, cash holdings of about MXN1.8 billion (approximately
MXN1.4 billion outside of BAF, a regulated banking entity), and track record of successfully
refinancing short-term debt. The company has not issued dividends over last few years and
projects about MXN350 million of capex for 2012.
Ratings
Foreign Currency
Long-Term IDR B+
Senior Unsecured due 2015 B+
Local Currency
Long-Term IDR B+
National
Long-Term Rating BBB(mex)
Short-Term Rating F3(mex)
MXN 1 Billion Cebures due 2014 BBB(mex)
MXN1 Billion Short-Term Cebures Program F3(mex)
Rating Outlooks Long-Term Foreign Currency IDR Stable Long-Term Local Currency IDR Stable National Long-Term Rating Stable
Financial Data Grupo Famsa, S.A.B. de C.V.
(MXN Mil.) 6/30/12 2011
Revenue 14,518 15,295 EBITDA 1,932 1,698 Total Debt 17,176 16,252 Gross Interest Expense 1,268 1,213 Debt/EBITDA (x) 8.9 9.6 EBITDA/ Gross Interest Expense (x) 1.5 1.4
Analysts Miguel Guzmán Betancourt +52 81 8399-9100 [email protected]
Indalecio Riojas +52 81 8399-9100 [email protected]
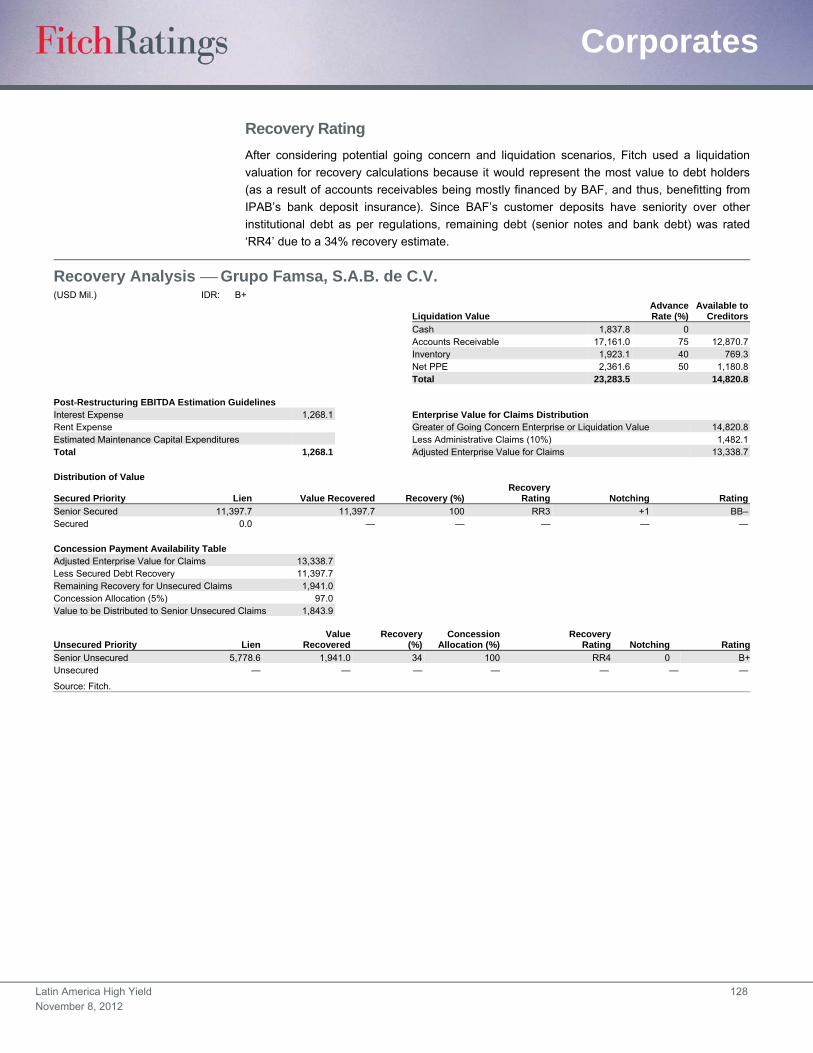
Latin America High Yield 128
November 8, 2012
Corporates
Recovery Rating
After considering potential going concern and liquidation scenarios, Fitch used a liquidation
valuation for recovery calculations because it would represent the most value to debt holders
(as a result of accounts receivables being mostly financed by BAF, and thus, benefitting from
IPAB’s bank deposit insurance). Since BAF’s customer deposits have seniority over other
institutional debt as per regulations, remaining debt (senior notes and bank debt) was rated
‘RR4’ due to a 34% recovery estimate.
Recovery Analysis Grupo Famsa, S.A.B. de C.V. (USD Mil.) IDR: B+
Liquidation Value AdvanceRate (%)
Available toCreditors
Cash 1,837.8 0 Accounts Receivable 17,161.0 75 12,870.7 Inventory 1,923.1 40 769.3 Net PPE 2,361.6 50 1,180.8 Total 23,283.5 14,820.8 Post-Restructuring EBITDA Estimation Guidelines Interest Expense 1,268.1 Enterprise Value for Claims Distribution Rent Expense Greater of Going Concern Enterprise or Liquidation Value 14,820.8Estimated Maintenance Capital Expenditures Less Administrative Claims (10%) 1,482.1Total 1,268.1 Adjusted Enterprise Value for Claims 13,338.7 Distribution of Value
Secured Priority Lien Value Recovered Recovery (%)Recovery
Rating Notching Rating
Senior Secured 11,397.7 11,397.7 100 RR3 +1 BB–Secured 0.0 — — — — — Concession Payment Availability Table Adjusted Enterprise Value for Claims 13,338.7 Less Secured Debt Recovery 11,397.7 Remaining Recovery for Unsecured Claims 1,941.0 Concession Allocation (5%) 97.0 Value to be Distributed to Senior Unsecured Claims 1,843.9
Unsecured Priority Lien Value
RecoveredRecovery
(%)Concession
Allocation (%)Recovery
Rating Notching Rating
Senior Unsecured 5,778.6 1,941.0 34 100 RR4 0 B+Unsecured — — — — — — —
Source: Fitch.

Latin America High Yield 129
November 8, 2012
Corporates
Organizational Structure — Grupo Famsa S.A.B. de C.V.(MXN Mil., As of 2Q12)
Source: Grupo Famsa S.A.B. de C.V.
Grupo Famsa, S.A.B. de C.V.
Senior Notes due 2015 2,682Cebures Issues 2,000Other Issuances 536Bank Debt 449
Famsa USA
Deutche Bank 53.6Banco Ahorro Famsa
Bank Deposits 11,398 Bank Debt 58
99.99% 100.00%

Latin America High Yield 130
November 8, 2012
Corporates
Debt and Covenant Synopsis — Grupo Famsa, S.A.B. de C.V. (Foreign Currency Notes) Overview Issuer Grupo Famsa, S.A.B. de C.V. Guarantors All major subsidiaries except Banco Ahorro FAMSA, S.A. de C.V. Document Date July 20, 2010 Maturity Date July 20, 2015 Description of Debt USD200 million aggregate principal amount of 11% senior notes. Acquisitions/Divestitures Change-of-Control Provision
If a change of control occurs, each holder of notes may require the issuer to repurchase all or a portion of its notes at a purchase price equal to 101.0% of the principal amount, plus accrued and unpaid interest through the date of purchase.
Limitation on Assets Sale
Under the terms of the indenture, Famsa and its restricted subsidiaries will not realize an asset sale unless: 1. Famsa or the applicable restricted subsidiary receives consideration at the time of the asset sale at least equal to the fair market
value of the assets sold; and 2. At least 75% of the consideration received for the assets sold by Famsa or the restricted subsidiary, in the asset sale shall be in the
form of cash received at the time of the sale. Notwithstanding, Famsa shall not consummate an asset sale with respect to the capital stock or assets of a bank regulated subsidiary. A disposition of accounts receivable is not considered an asset sale.
Limitation on Indebtedness
Famsa will not incur any indebtedness, except if the consolidated leverage ratio is not greater than (1) 3.5 to 1.0, if such incurrence occurs prior to May 1, 2013, or (2) 3.25 to 1.0, if such incurrence occurs on or after May 1, 2013. Notwithstanding the paragraph above, Famsa and its restricted subsidiaries, as applicable, may incur the following indebtedness:
1. Indebtedness in respect of the notes (including any note guarantee in respect thereof) excluding additional notes; 2. Guarantees by Famsa or any subsidiary guarantor of indebtedness of Famsa; provided that, if any such guarantee is of
subordinated indebtedness, then the note guarantee of such subsidiary guarantor shall be senior to such subsidiary guarantor’s guarantee; and
3. Indebtedness incurred by Famsa or any subsidiary guarantor under the credit facilities an aggregate principal amount outstanding at any one time not to exceed the greater of (x).
Limitation on Guarantees
Famsa will not permit any restricted subsidiary that is not a subsidiary guarantor to guarantee any indebtedness of the company, unless an effective provision is made to secure the notes, on an equal and ratable basis with such guarantee or lien.
Limitation on Restricted Payments
Famsa and its restricted subsidiaries will not make restricted payments if: 1. A default shall have occurred and be continuing; 2. Famsa is not able to incur at least USD1.00 of additional indebtedness. 3. The aggregate amount of the proposed restricted payments exceeds the sum of:
a. 50% of Famsa’s cumulative consolidated net income plus b. 100% of the aggregate net cash proceeds received by Famsa from any:
i. Contribution to equity capital not representing an interest in disqualified capital stock or issuance and sale of qualified capital stock of Famsa, in each case, subsequent to the issue date, or
ii. Issuance and sale subsequent to the issue of any indebtedness of Famsa or any restricted subsidiary that has been converted into or exchanged for qualified capital stock of Famsa.
Limitation on Merger, Consolidation, and Sale of Assets
Upon any merger or any transfer of assets of Famsa and its restricted subsidiaries in accordance with this covenant, in which Famsa is not the continuing corporation, the surviving entity formed by such consolidation, will succeed Famsa under the indenture and the notes with the same effect as if such surviving entity had been named as such.
Limitation on Transactions with Affiliates.
Famsa and its restricted subsidiaries will not enter into any transaction or series of related transactions (including, without limitation, the (purchase, sale, lease, etc.), unless:
1. The terms of such affiliate transaction are no less favorable than those that could reasonably be expected to be obtained in a comparable transaction at such time on an arm’s-length basis from a person that is not a Famsa affiliate;
2. In the event that such affiliate transaction involves aggregate payments, or transfers of property or services with a fair market value, in excess of USD15.0 million, the terms of such affiliate transaction will be approved by a majority of the members of Famsa’s board of directors.
3. In the event that such affiliate transaction involves aggregate payments, or transfers of property or services with a fair market value, in excess of USD25.0 million, Famsa will obtain a favorable opinion as to the fairness of such affiliate transaction to the company and the relevant restricted subsidiary (if any) from a financial point of view from an independent financial advisor and file the same with the trustee.
Source: Issuer.

Latin America High Yield 131
November 8, 2012
Corporates
Financial Summary Grupo Famsa, S.A.B. de C.V. (MXN 000, Years Ended Dec. 31) LTM 6/30/12 2011 2010 2009 2008
Profitability
Operating EBITDA 1,931,665 1,697,602 1,701,666 1,554,429 1,456,029
Operating EBITDAR 2,759,783 2,589,378 2,595,699 2,475,328 2,261,029
Operating EBITDA Margin (%) 0.1 0.1 0.1 0.1 0.1
Operating EBITDAR Margin (%) 0.2 0.2 0.2 0.2 0.2
FFO Return on Adjusted Capital (%) 0.1 0.1 0.1 0.1 0.2
Free Cash Flow Margin (%) (0.1) (0.1) (0.2) (0.1) (0.2)
Return on Average Equity (%) 0.1 0.0 0.1 0.0 0.1
Coverage (x)
FFO Interest Coverage 2.5 2.7 1.5 1.6 3.5
Operating EBITDA/Gross Interest Expense 1.5 1.4 1.6 1.4 1.7
Operating EBITDAR/Interest Expense + Rents 1.3 1.2 1.3 1.2 1.3
Operating EBITDA/Debt Service Coverage 0.1 0.1 0.1 0.1 0.1
Operating EBITDAR/Debt Service Coverage 0.2 0.2 0.2 0.2 0.2
FFO Fixed-Charge Coverage 1.9 2.0 1.3 1.3 2.3
FCF Debt Service Coverage (0.0) (0.1) (0.2) (0.1) (0.1)
(FCF + Cash and Marketable Securities)/Debt Service Coverage 0.1 0.0 (0.1) 0.1 0.0
Cash Flow from Operations/Capital Expenditures (10.6) (5.8) (14.3) (6.8) (2.3)
Leverage (x)
FFO Adjusted Leverage 5.7 5.4 7.9 6.5 4.1
Total Debt with Equity Credit/Operating EBITDA 8.9 9.6 8.0 7.3 6.9
Total Net Debt with Equity Credit/Operating EBITDA 7.9 8.7 7.3 6.2 5.9
Total Adjusted Debt/Operating EBITDAR 8.3 8.7 7.6 7.2 6.9
Total Adjusted Net Debt/Operating EBITDAR 7.7 8.1 7.2 6.5 6.3
Implied Cost of Funds (%) 0.1 0.1 0.1 0.1 0.1
Secured Debt/Total Debt — — — — —
Short-Term Debt/Total Debt 0.8 0.8 0.8 0.9 1.0
Balance Sheet
Total Assets 28,021,785 28,293,707 25,668,055 22,604,443 21,007,574
Cash and Marketable Securities 1,837,782 1,451,355 1,114,459 1,706,086 1,448,535
Short-Term Debt 13,483,198 12,449,563 11,101,913 10,266,716 10,054,377
Long-Term Debt 3,693,086 3,802,680 2,486,348 1,009,640 —
Total Debt 17,176,284 16,252,243 13,588,261 11,276,356 10,054,377
Equity Credit — — — — —
Total Debt with Equity Credit 17,176,284 16,252,243 13,588,261 11,276,356 10,054,377
Off-Balance Sheet Debt 5,796,826 6,242,432 6,258,231 6,446,293 5,635,000
Total Adjusted Debt with Equity Credit 22,973,110 22,494,675 19,846,492 17,722,649 15,689,377
Total Equity 8,566,524 9,202,749 8,986,100 8,367,366 7,294,969
Total Adjusted Capital 31,539,634 31,697,424 28,832,592 26,090,015 22,984,346
Cash Flow
Funds from Operations 1,908,138 2,089,020 539,230 667,170 2,149,876
Change in Working Capital (3,614,471) (3,808,310) (3,349,890) (2,580,349) (3,738,293)
Cash Flow from Operations (1,706,333) (1,719,290) (2,810,660) (1,913,179) (1,588,417)
Total Non-Operating/Nonrecurring Cash Flow — — — — —
Capital Expenditures (160,894) (294,653) (196,466) (280,742) (700,682)
Common Dividends — — — — —
Free Cash Flow (1,867,227) (2,013,943) (3,007,126) (2,193,921) (2,289,099)
Net Acquisitions and Divestitures 38,895 5,081 5,000 11,234 12,485
Other Investments, Net 2,014 1,376 — — —
Net Debt Proceeds 593,468 815,606 2,410,499 1,236,705 272,657
Net Equity Proceeds — — — 1,203,533 —
Other (Investments and Financing) 1,672,706 1,528,776 — — 2,858,299
Total Change in Cash 439,856 336,896 (591,627) 257,551 854,342
Income Statement
Revenue 14,518,433 15,294,907 14,992,877 14,946,922 14,762,221
Revenue Growth (%) (6) 2 0 1 4
Operating EBIT 1,559,880 1,292,299 1,306,870 1,123,162 1,036,640
Gross Interest Expense 1,268,103 1,213,079 1,088,829 1,125,446 871,166
Rental Expense 828,118 891,776 894,033 920,899 805,000
Net Income 447,005 105,501 705,624 97,355 560,865
Source: Fitch.
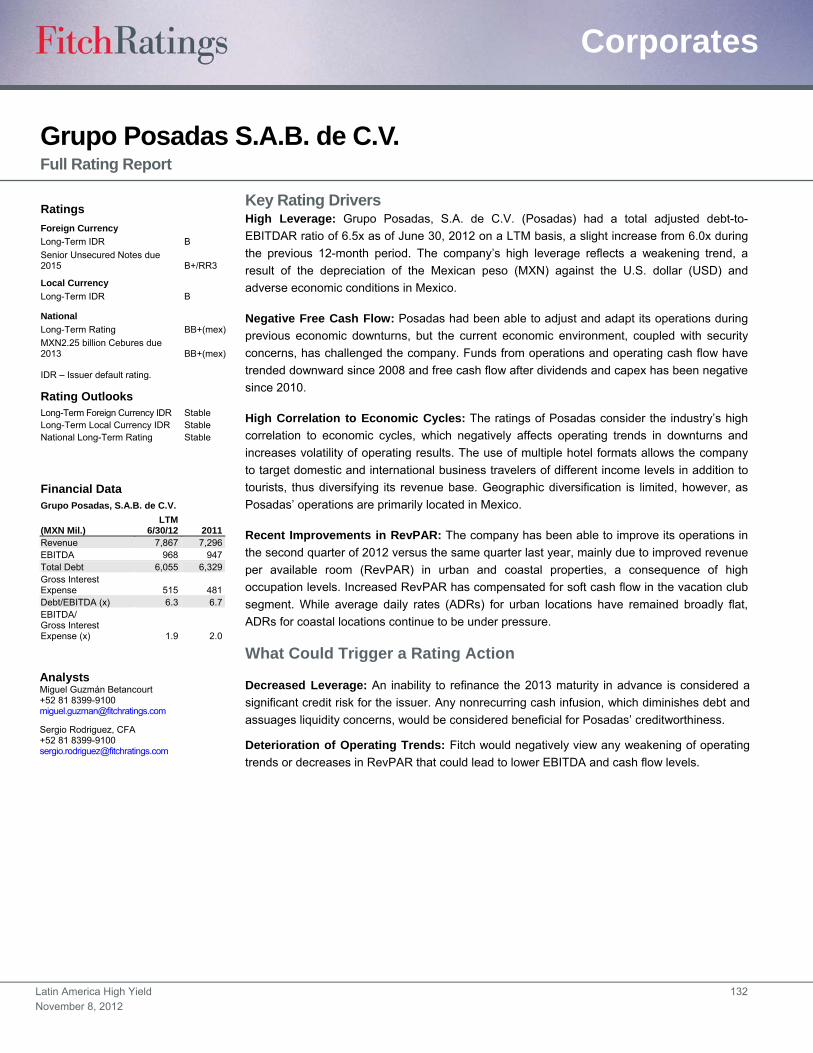
Latin America High Yield 132
November 8, 2012
Corporates
Grupo Posadas S.A.B. de C.V. Full Rating Report
Key Rating Drivers High Leverage: Grupo Posadas, S.A. de C.V. (Posadas) had a total adjusted debt-to-
EBITDAR ratio of 6.5x as of June 30, 2012 on a LTM basis, a slight increase from 6.0x during
the previous 12-month period. The company’s high leverage reflects a weakening trend, a
result of the depreciation of the Mexican peso (MXN) against the U.S. dollar (USD) and
adverse economic conditions in Mexico.
Negative Free Cash Flow: Posadas had been able to adjust and adapt its operations during
previous economic downturns, but the current economic environment, coupled with security
concerns, has challenged the company. Funds from operations and operating cash flow have
trended downward since 2008 and free cash flow after dividends and capex has been negative
since 2010.
High Correlation to Economic Cycles: The ratings of Posadas consider the industry’s high
correlation to economic cycles, which negatively affects operating trends in downturns and
increases volatility of operating results. The use of multiple hotel formats allows the company
to target domestic and international business travelers of different income levels in addition to
tourists, thus diversifying its revenue base. Geographic diversification is limited, however, as
Posadas’ operations are primarily located in Mexico.
Recent Improvements in RevPAR: The company has been able to improve its operations in
the second quarter of 2012 versus the same quarter last year, mainly due to improved revenue
per available room (RevPAR) in urban and coastal properties, a consequence of high
occupation levels. Increased RevPAR has compensated for soft cash flow in the vacation club
segment. While average daily rates (ADRs) for urban locations have remained broadly flat,
ADRs for coastal locations continue to be under pressure.
What Could Trigger a Rating Action
Decreased Leverage: An inability to refinance the 2013 maturity in advance is considered a
significant credit risk for the issuer. Any nonrecurring cash infusion, which diminishes debt and
assuages liquidity concerns, would be considered beneficial for Posadas’ creditworthiness.
Deterioration of Operating Trends: Fitch would negatively view any weakening of operating
trends or decreases in RevPAR that could lead to lower EBITDA and cash flow levels.
Ratings
Foreign Currency
Long-Term IDR B
Senior Unsecured Notes due 2015 B+/RR3
Local Currency
Long-Term IDR B
National
Long-Term Rating BB+(mex)
MXN2.25 billion Cebures due 2013 BB+(mex)
IDR – Issuer default rating.
Rating Outlooks Long-Term Foreign Currency IDR Stable Long-Term Local Currency IDR Stable National Long-Term Rating Stable
Financial Data Grupo Posadas, S.A.B. de C.V.
(MXN Mil.) LTM
6/30/12 2011 Revenue 7,867 7,296 EBITDA 968 947 Total Debt 6,055 6,329 Gross Interest Expense 515 481 Debt/EBITDA (x) 6.3 6.7 EBITDA/ Gross Interest Expense (x) 1.9 2.0
Analysts Miguel Guzmán Betancourt +52 81 8399-9100 [email protected]
Sergio Rodriguez, CFA +52 81 8399-9100 [email protected]
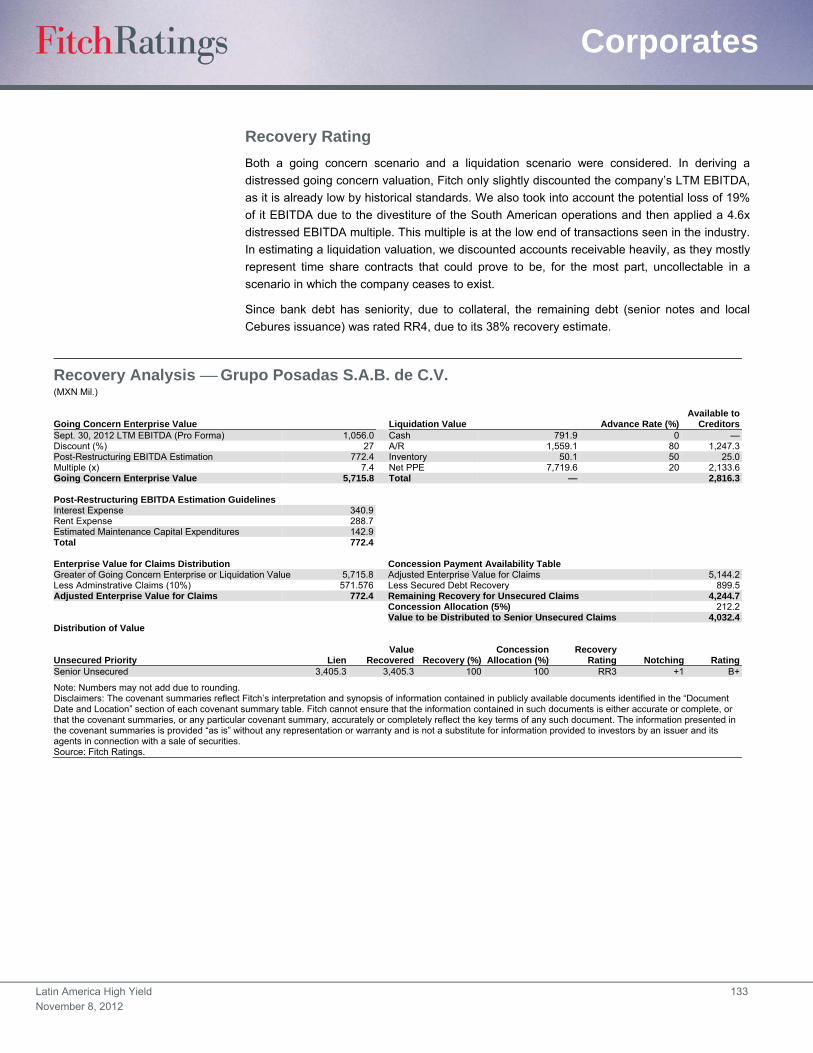
Latin America High Yield 133
November 8, 2012
Corporates
Recovery Rating
Both a going concern scenario and a liquidation scenario were considered. In deriving a
distressed going concern valuation, Fitch only slightly discounted the company’s LTM EBITDA,
as it is already low by historical standards. We also took into account the potential loss of 19%
of it EBITDA due to the divestiture of the South American operations and then applied a 4.6x
distressed EBITDA multiple. This multiple is at the low end of transactions seen in the industry.
In estimating a liquidation valuation, we discounted accounts receivable heavily, as they mostly
represent time share contracts that could prove to be, for the most part, uncollectable in a
scenario in which the company ceases to exist.
Since bank debt has seniority, due to collateral, the remaining debt (senior notes and local
Cebures issuance) was rated RR4, due to its 38% recovery estimate.
Recovery Analysis Grupo Posadas S.A.B. de C.V. (MXN Mil.)
Going Concern Enterprise Value Liquidation Value Advance Rate (%)Available to
CreditorsSept. 30, 2012 LTM EBITDA (Pro Forma) 1,056.0 Cash 791.9 0 —Discount (%) 27 A/R 1,559.1 80 1,247.3Post-Restructuring EBITDA Estimation 772.4 Inventory 50.1 50 25.0Multiple (x) 7.4 Net PPE 7,719.6 20 2,133.6Going Concern Enterprise Value 5,715.8 Total — 2,816.3 Post-Restructuring EBITDA Estimation Guidelines Interest Expense 340.9Rent Expense 288.7Estimated Maintenance Capital Expenditures 142.9Total 772.4
Enterprise Value for Claims Distribution Concession Payment Availability Table Greater of Going Concern Enterprise or Liquidation Value 5,715.8 Adjusted Enterprise Value for Claims 5,144.2Less Adminstrative Claims (10%) 571.576 Less Secured Debt Recovery 899.5Adjusted Enterprise Value for Claims 772.4 Remaining Recovery for Unsecured Claims 4,244.7 Concession Allocation (5%) 212.2 Value to be Distributed to Senior Unsecured Claims 4,032.4Distribution of Value
Unsecured Priority LienValue
Recovered Recovery (%)Concession
Allocation (%)Recovery
Rating Notching RatingSenior Unsecured 3,405.3 3,405.3 100 100 RR3 +1 B+
Note: Numbers may not add due to rounding. Disclaimers: The covenant summaries reflect Fitch’s interpretation and synopsis of information contained in publicly available documents identified in the “Document Date and Location” section of each covenant summary table. Fitch cannot ensure that the information contained in such documents is either accurate or complete, or that the covenant summaries, or any particular covenant summary, accurately or completely reflect the key terms of any such document. The information presented in the covenant summaries is provided “as is” without any representation or warranty and is not a substitute for information provided to investors by an issuer and its agents in connection with a sale of securities. Source: Fitch Ratings.
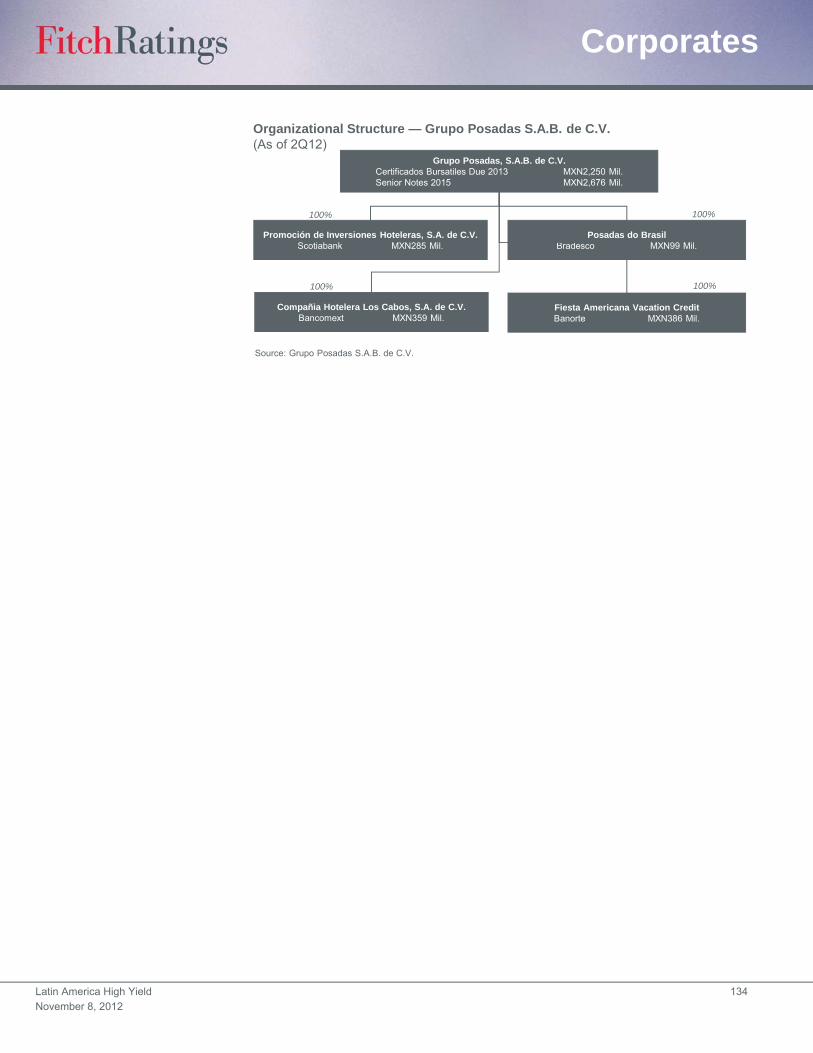
Latin America High Yield 134
November 8, 2012
Corporates
Organizational Structure — Grupo Posadas S.A.B. de C.V.(As of 2Q12)
Source: Grupo Posadas S.A.B. de C.V.
Grupo Posadas, S.A.B. de C.V.Certificados Bursatiles Due 2013 MXN2,250 Mil.Senior Notes 2015 MXN2,676 Mil.
Promoción de Inversiones Hoteleras, S.A. de C.V.Scotiabank MXN285 Mil.
Posadas do BrasilBradesco MXN99 Mil.
100% 100%
Compañia Hotelera Los Cabos, S.A. de C.V.Bancomext MXN359 Mil.
Fiesta Americana Vacation CreditBanorte MXN386 Mil.
100% 100%

Latin America High Yield 135
November 8, 2012
Corporates
Debt and Covenant Synopsis Grupo Posadas, S.A.B. de C.V. (Foreign Currency Notes)
Overview Issuer Grupo Posadas, S.A.B. de C.V. Guarantors All major subsidiaries except Fondo Inmobiliario Posadas, S.A. de C.V. Document Date Feb. 5, 2010 Maturity Date Jan. 15, 2015 Description of Debt USD200 million aggregate principal amount of 9.250% senior notes. Financial Covenants Consolidated Leverage (Maximum) N.A. Interest Coverage (Minimum) N.A. Acquisitions/Divestitures Change-of-Control Provision If Posadas experiences a change of control, holders of the notes may require them to repurchase all or part of the notes at 101% of
their principal amount, plus accrued and unpaid interest and any additional amounts until the redemption date. Limitation on Assets Sale Under the terms of the indenture, Posadas will not, and will not permit any restricted subsidiary to consummate any asset sale, unless:
1) The consideration received by Posadas or such restricted subsidiary is at least equal to the fair market value of the assets sold or disposed of as determined in good faith by Posadas’ board of directors (including as to the value of all noncash consideration);
2) Except in the case of any sale of time share, full or fractional ownership or membership interests in the ordinary course of the vacation club business, at least 75% of the consideration received by Posadas or such restricted subsidiary, as the case may be, from such asset sale shall be in the form of cash or temporary cash investments and is received at the time of such disposition;
3) An amount equal to 100% of the net cash proceeds from such asset sale is either applied to a) the repayment of indebtedness of the issuer or any restricted subsidiary, which is secured by a permitted lien (with a corresponding reduction in the commitment with respect thereto) or b) the investment in or acquisition of assets related to a permitted business, in each case, within 365 days from the later of the date of such asset sale or the receipt of the net cash proceeds.
Limitation on Indebtedness 1) Under the terms of the indenture, Posadas will not, and will not permit any of its restricted subsidiaries to, directly or indirectly, incur anyindebtedness provided, however, that Posadas may incur indebtedness and any restricted subsidiary may incur indebtedness if on the date of the incurrence of such indebtedness, the consolidated interest coverage ratio would be greater than 2.5 to 1.0.
2) For purposes of determining compliance with any U.S. dollar-denominated restriction on the incurrence of indebtedness, the U.S. dollar-equivalent principal amount of indebtedness denominated in a non-U.S. currency will be calculated based on the relevant currency exchange rate in effect on the date such indebtedness was incurred or, in the case of revolving credit indebtedness, first committed; provided that if such indebtedness is incurred to refinance other indebtedness denominated in a non-U.S. currency, and such refinancing would cause the applicable U.S. dollar-denominated restriction to be exceeded if calculated at the relevant currency exchange rate in effect on the date of such refinancing, such U.S. dollar-denominated restriction will be deemed not to have been exceeded so long as the principal amount of such refinancing indebtedness does not exceed the principal amount of such indebtedness being refinanced.
3) For purposes of determining any particular amount of indebtedness: a) guarantees, liens, or obligations with respect to letters of credit supporting indebtedness otherwise included in the determination of such particular amount shall not be included and b) any liens granted pursuant to the equal and ratable provisions of the indenture shall not be treated as indebtedness. For purposes of determining compliance with this covenant, in the event that an item of Indebtedness meets the criteria of more than one of the types of indebtedness described herein, Posadas, in its sole discretion, shall classify, and from time to time may reclassify, such item of Indebtedness.
Limitation on Restricted Payments
Posadas will not, and will not cause or permit any of the restricted subsidiaries to, directly or indirectly: 1) Declare or pay any dividend or make any distribution other than a) dividends or distributions payable in qualified capital
sock of Posadas and b) in the case of restricted subsidiaries, dividends, or distributions to Posadas or any other restricted subsidiary and pro rata dividends or distributions payable to the other holders of the same class of capital stock of such restricted subsidiary on or in respect of shares of its capital stock to holders of such capital stock;
2) Purchase, redeem, or otherwise acquire or retire for value any capital stock of Posadas or acquire shares of any class of such capital stock other than capital stock owned by Posadas or any wholly owned restricted subsidiary (other than in exchange for its capital stock) which is not disqualified stock;
3) Make any principal payment on, purchase, redeem, prepay, decrease, or otherwise acquire or retire for value, prior to any scheduled final maturity, scheduled repayment or scheduled sinking fund payment (other than the purchase, redemption, prepayment, or other acquisition of any such subordinated indebtedness in anticipation of any such sinking fund obligation, principal installment or final maturity, in each case, due within one year of such purchase, redemption, prepayment, or other acquisition), any indebtedness that is subordinate or junior in right of payment to the notes or the guarantees; or
4) Make any investment (other than permitted investments), if at the time of such restricted payment or immediately after giving effect thereto a default or an event of default shall have occurred and be continuing.
N.A. Not applicable. Continued on the next page. Disclaimers: The covenant summaries reflect Fitch’s interpretation and synopsis of information contained in publicly available documents identified in the “Document Date and Location” section of each covenant summary table. Fitch cannot ensure that the information contained in such documents is either accurate or complete, or that the covenant summaries, or any particular covenant summary, accurately or completely reflect the key terms of any such document. The information presented in the covenant summaries is provided “as is” without any representation or warranty and is not a substitute for information provided to investors by an issuer and its agents in connection with a sale of securities. Source: Company and Fitch Ratings.

Latin America High Yield 136
November 8, 2012
Corporates
Debt and Covenant Synopsis Grupo Posadas, S.A.B. de C.V. (Continued) (Foreign Currency Notes)
Acceleration If an event of default occurs and is continuing under the indenture, either the trustee or the holders of at least 25% in aggregate principal amount of the notes then outstanding, by written notice to Posadas (and to the trustee if such notice is given by the holders), may, and the trustee at the request of such holders shall, declare the principal of, and accrued interest (together with any additional amounts) on the notes to be immediately due and payable. Upon such a declaration of acceleration, such principal and accrued interest shall be immediately due and payable.
Limitation on Transactions with Affiliates
Posadas will not, and will not permit any of its restricted subsidiaries to, directly or indirectly, enter into or permit to exist any transaction or series of related transactions (including, without limitation, the purchase, sale, lease, or exchange of any property or the rendering of any service) with, or for the benefit of, any affiliate of posadas (each an “Affiliate Transaction”), other than:
1) Affiliate transactions permitted; and 2) Certain affiliate transactions meeting the following requirements:
a) The terms of such affiliate transaction are no less favorable than those that could reasonably be expected to be
obtained in a comparable transaction at such time on an arm’s-length basis from a person that is not an affiliate of Posadas;
b) In the event that such affiliate transaction involves aggregate payments, or transfers of property or services with a fair market value, in excess of USD5.0 million (or the equivalent in other currencies), the terms of such affiliate transaction shall be approved by a majority of the members of the board of directors of Posadas or such restricted subsidiary, as the case may be, such approval to be evidenced by a board resolution stating that such members of the board of directors have determined that such transaction complies with clause (a) immediately above;
c) In the event that such affiliate transaction involves aggregate payments, or transfers of property or services with a fair market value, in excess of USD15.0 million (or the equivalent in other currencies), the terms of such Affiliate Transaction will be set forth in an Officers’ Certificate delivered to the trustee stating that such transaction complies with clauses (a) and (b) immediately above; and d) in the event that such Affiliate transaction involves aggregate payments, or transfers of property or services with a fair market value, in excess of USD20.0 million (or the equivalent in other currencies), the issuer will, prior to the consummation thereof, obtain a favorable opinion as to the fairness of such affiliate transaction to the issuer and any such restricted subsidiary, if any, from a financial point of view from an independent financial advisor and file the same with Trustee.
Limits on Consolidations or Mergers
Posadas will not: 1) In one or more related transactions, consolidate with or merge into or reorganize with or into, or directly or indirectly,
transfer, convey, sell, lease, or otherwise dispose of all or substantially all of its properties and assets as an entirety to, any other person or
2) Permit any guarantor to, in one or more related transactions, consolidate with or merge into or reorganize with or into, or directly or indirectly, transfer, convey, sell, lease, or otherwise dispose of all or substantially all of its properties and assets as an entirety to, any other person in each case.
Optional Redemption They may redeem the notes, in whole or in part, at a redemption price based on a “make-whole” premium. Prior to Jan. 15, 2013, they may redeem up to 35% of the aggregate principal amount of the notes with the proceeds from certain qualified equity offerings.
N.A. Not applicable. Disclaimers: The covenant summaries reflect Fitch’s interpretation and synopsis of information contained in publicly available documents identified in the “Document Date and Location” section of each covenant summary table. Fitch cannot ensure that the information contained in such documents is either accurate or complete, or that the covenant summaries, or any particular covenant summary, accurately or completely reflect the key terms of any such document. The information presented in the covenant summaries is provided “as is” without any representation or warranty and is not a substitute for information provided to investors by an issuer and its agents in connection with a sale of securities. Source: Company and Fitch Ratings.

Latin America High Yield 137
November 8, 2012
Corporates
Financial Summary Grupo Posadas, S.A.B. de C.V. (MXN Mil., As of Dec. 31) LTM 6/30/12 2011 2010 2009 2008
Profitability
Operating EBITDA 968 947 1,022 1,243 1,531
Operating EBITDAR 1,357 1,324 1,382 1,621 1,864
Operating EBITDA Margin (%) 12.3 13.0 15.6 17.5 22.2
Operating EBITDAR Margin (%) 17.2 18.1 21.2 22.9 27.1
FFO Return on Adjusted Capital (%) 6.4 8.3 9.4 11.2 18.1
Free Cash Flow Margin (%) (4.4) (3.9) (2.8) 9.8 20.3
Return on Average Equity (%) (10.4) (16.9) 1.0 5.9 (12.8)
Coverage (x)
FFO Interest Coverage 1.2 1.5 1.9 3.1 5.0
Operating EBITDA/Gross Interest Expense 1.9 2.0 2.3 3.3 3.6
Operating EBITDAR/Interest Expense + Rents 1.5 1.5 1.7 2.2 2.5
Operating EBITDA/Debt Service Coverage 0.3 0.9 1.5 0.9 1.0
Operating EBITDAR/Debt Service Coverage 0.4 0.9 1.4 1.0 1.0
FFO Fixed-Charge Coverage 1.1 1.3 1.5 2.0 3.2
FCF Debt Service Coverage 0.1 0.2 0.4 0.8 1.2
(FCF + Cash and Marketable Securities)/Debt Service Coverage 0.2 0.6 1.3 1.3 1.8
Cash Flow from Operations/Capital Expenditures (3.7) (1.4) 1.2 6.1 4.6
Leverage (x)
FFO Adjusted Leverage 8.8 8.8 7.6 5.9 3.7
Total Debt with Equity Credit/Operating EBITDA 6.3 6.7 5.7 4.0 3.5
Total Net Debt with Equity Credit/Operating EBITDA 5.8 6.2 5.1 3.5 3.0
Total Adjusted Debt/Operating EBITDAR 6.5 7.5 6.8 5.5 4.8
Total Adjusted Net Debt/Operating EBITDAR 6.1 7.1 6.4 5.1 4.4
Implied Cost of Funds (%) 8.7 7.9 8.4 7.3 8.7
Secured Debt/Total Debt — — — — —
Short-Term Debt/Total Debt 0.4 0.1 0.0 0.2 0.2
Balance Sheet
Total Assets 16,455 12,695 13,334 13,261 13,652
Cash and Marketable Securities 473 422 575 658 831
Short-Term Debt 2,645 554 211 940 1,057
Long-Term Debt 3,410 5,775 5,609 4,018 4,307
Total Debt 6,055 6,329 5,820 4,958 5,364
Equity Credit — — — — —
Total Debt with Equity Credit 6,055 6,329 5,820 4,958 5,364
Off-Balance Sheet Debt 2,723 3,549 3,595 4,013 3,662
Total Adjusted Debt with Equity Credit 8,778 9,878 9,415 8,971 9,026
Total Equity 6,818 3,615 3,670 4,586 4,398
Total Adjusted Capital 15,596 13,493 13,085 13,557 13,424
Cash Flow
Funds from Operations 97 261 422 769 1,681
Change in Working Capital (363) (418) (134) 84 325
Cash Flow from Operations (266) (157) 288 853 2,006
Total Non-Operating/Nonrecurring Cash Flow — — — — —
Capital Expenditures (71) (116) (238) (139) (433)
Common Dividends (12) (12) (232) (23) (174)
Free Cash Flow (578) (285) (182) 691 1,399
Net Acquisitions and Divestitures (36) (36) — — —
Other Investments, Net 192 116 (351) (443) (547)
Net Debt Proceeds (774) (11) 1,018 (10) 42
Net Equity Proceeds 889 42 — (1) —
Other (Investments and Financing) 1 18 (611) (410) (444)
Total Change in Cash 196) (156) (126) (173) 450
Income Statement
Revenue 7,867 7,296 6,531 7,083 6,884
Revenue Growth (%) 13.8 11.7 (7.8) 2.9 15.2
Operating EBIT 542 546 590 806 1,125
Gross Interest Expense 515 481 452 375 420
Rental Expense 389 377 360 378 333
Net Income (573) (616) 40 267 (622)
Source: Fitch.
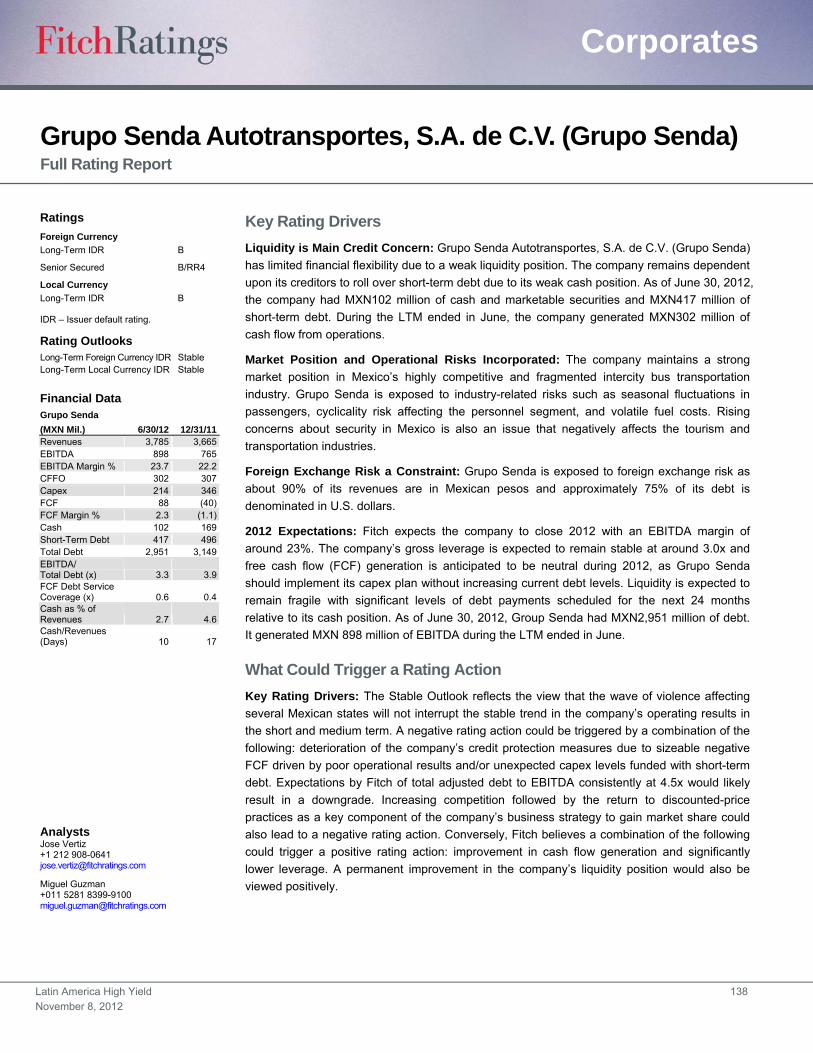
Latin America High Yield 138
November 8, 2012
Corporates
Grupo Senda Autotransportes, S.A. de C.V. (Grupo Senda) Full Rating Report
Key Rating Drivers
Liquidity is Main Credit Concern: Grupo Senda Autotransportes, S.A. de C.V. (Grupo Senda)
has limited financial flexibility due to a weak liquidity position. The company remains dependent
upon its creditors to roll over short-term debt due to its weak cash position. As of June 30, 2012,
the company had MXN102 million of cash and marketable securities and MXN417 million of
short-term debt. During the LTM ended in June, the company generated MXN302 million of
cash flow from operations.
Market Position and Operational Risks Incorporated: The company maintains a strong
market position in Mexico’s highly competitive and fragmented intercity bus transportation
industry. Grupo Senda is exposed to industry-related risks such as seasonal fluctuations in
passengers, cyclicality risk affecting the personnel segment, and volatile fuel costs. Rising
concerns about security in Mexico is also an issue that negatively affects the tourism and
transportation industries.
Foreign Exchange Risk a Constraint: Grupo Senda is exposed to foreign exchange risk as
about 90% of its revenues are in Mexican pesos and approximately 75% of its debt is
denominated in U.S. dollars.
2012 Expectations: Fitch expects the company to close 2012 with an EBITDA margin of
around 23%. The company’s gross leverage is expected to remain stable at around 3.0x and
free cash flow (FCF) generation is anticipated to be neutral during 2012, as Grupo Senda
should implement its capex plan without increasing current debt levels. Liquidity is expected to
remain fragile with significant levels of debt payments scheduled for the next 24 months
relative to its cash position. As of June 30, 2012, Group Senda had MXN2,951 million of debt.
It generated MXN 898 million of EBITDA during the LTM ended in June.
What Could Trigger a Rating Action
Key Rating Drivers: The Stable Outlook reflects the view that the wave of violence affecting
several Mexican states will not interrupt the stable trend in the company’s operating results in
the short and medium term. A negative rating action could be triggered by a combination of the
following: deterioration of the company’s credit protection measures due to sizeable negative
FCF driven by poor operational results and/or unexpected capex levels funded with short-term
debt. Expectations by Fitch of total adjusted debt to EBITDA consistently at 4.5x would likely
result in a downgrade. Increasing competition followed by the return to discounted-price
practices as a key component of the company’s business strategy to gain market share could
also lead to a negative rating action. Conversely, Fitch believes a combination of the following
could trigger a positive rating action: improvement in cash flow generation and significantly
lower leverage. A permanent improvement in the company’s liquidity position would also be
viewed positively.
Ratings
Foreign Currency
Long-Term IDR B
Senior Secured B/RR4
Local Currency
Long-Term IDR B
IDR – Issuer default rating.
Rating Outlooks Long-Term Foreign Currency IDR Stable Long-Term Local Currency IDR Stable
Financial Data Grupo Senda
(MXN Mil.) 6/30/12 12/31/11 Revenues 3,785 3,665 EBITDA 898 765 EBITDA Margin % 23.7 22.2 CFFO 302 307 Capex 214 346 FCF 88 (40) FCF Margin % 2.3 (1.1) Cash 102 169 Short-Term Debt 417 496 Total Debt 2,951 3,149 EBITDA/ Total Debt (x) 3.3 3.9 FCF Debt Service Coverage (x) 0.6 0.4 Cash as % of Revenues 2.7 4.6 Cash/Revenues (Days) 10 17
Analysts Jose Vertiz +1 212 908-0641 [email protected]
Miguel Guzman +011 5281 8399-9100 [email protected]
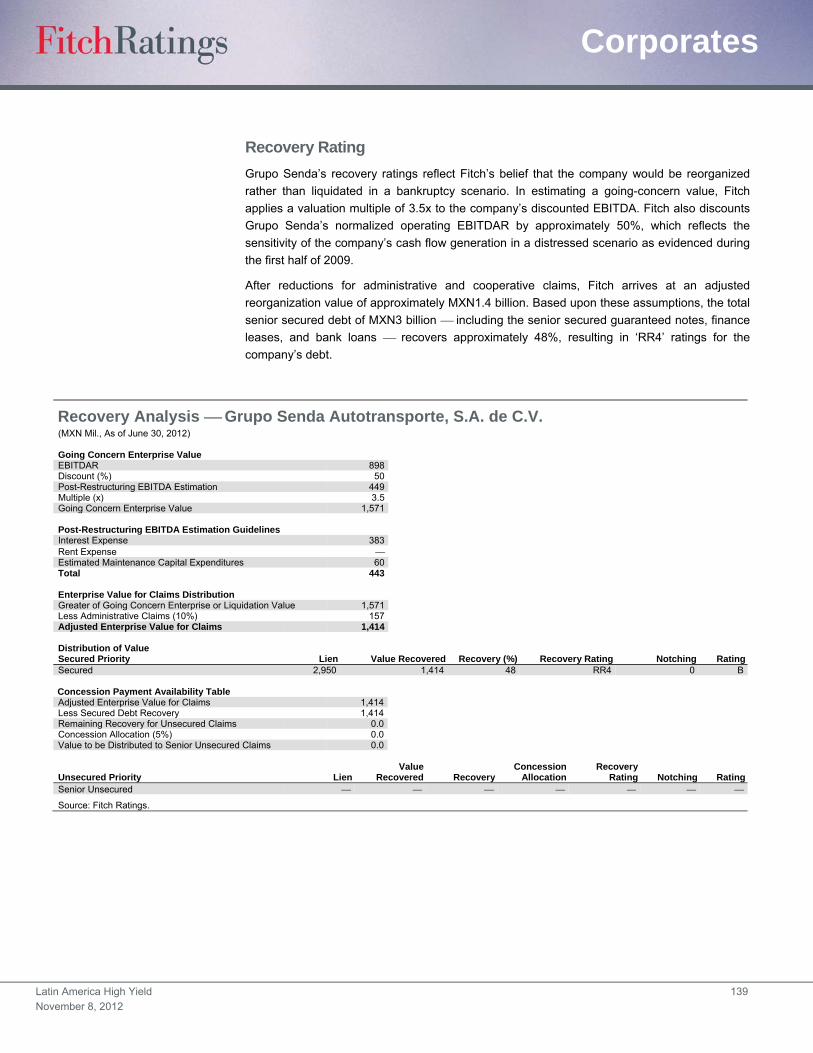
Latin America High Yield 139
November 8, 2012
Corporates
Recovery Rating
Grupo Senda’s recovery ratings reflect Fitch’s belief that the company would be reorganized
rather than liquidated in a bankruptcy scenario. In estimating a going-concern value, Fitch
applies a valuation multiple of 3.5x to the company’s discounted EBITDA. Fitch also discounts
Grupo Senda’s normalized operating EBITDAR by approximately 50%, which reflects the
sensitivity of the company’s cash flow generation in a distressed scenario as evidenced during
the first half of 2009.
After reductions for administrative and cooperative claims, Fitch arrives at an adjusted
reorganization value of approximately MXN1.4 billion. Based upon these assumptions, the total
senior secured debt of MXN3 billion including the senior secured guaranteed notes, finance
leases, and bank loans recovers approximately 48%, resulting in ‘RR4’ ratings for the
company’s debt.
Recovery Analysis Grupo Senda Autotransporte, S.A. de C.V. (MXN Mil., As of June 30, 2012) Going Concern Enterprise Value EBITDAR 898 Discount (%) 50 Post-Restructuring EBITDA Estimation 449 Multiple (x) 3.5 Going Concern Enterprise Value 1,571 Post-Restructuring EBITDA Estimation Guidelines Interest Expense 383 Rent Expense Estimated Maintenance Capital Expenditures 60 Total 443 Enterprise Value for Claims Distribution Greater of Going Concern Enterprise or Liquidation Value 1,571Less Administrative Claims (10%) 157Adjusted Enterprise Value for Claims 1,414
Distribution of Value Secured Priority Lien Value Recovered Recovery (%) Recovery Rating Notching RatingSecured 2,950 1,414 48 RR4 0 B
Concession Payment Availability Table Adjusted Enterprise Value for Claims 1,414Less Secured Debt Recovery 1,414Remaining Recovery for Unsecured Claims 0.0Concession Allocation (5%) 0.0Value to be Distributed to Senior Unsecured Claims 0.0
Unsecured Priority LienValue
Recovered RecoveryConcession
AllocationRecovery
Rating Notching RatingSenior Unsecured
Source: Fitch Ratings.
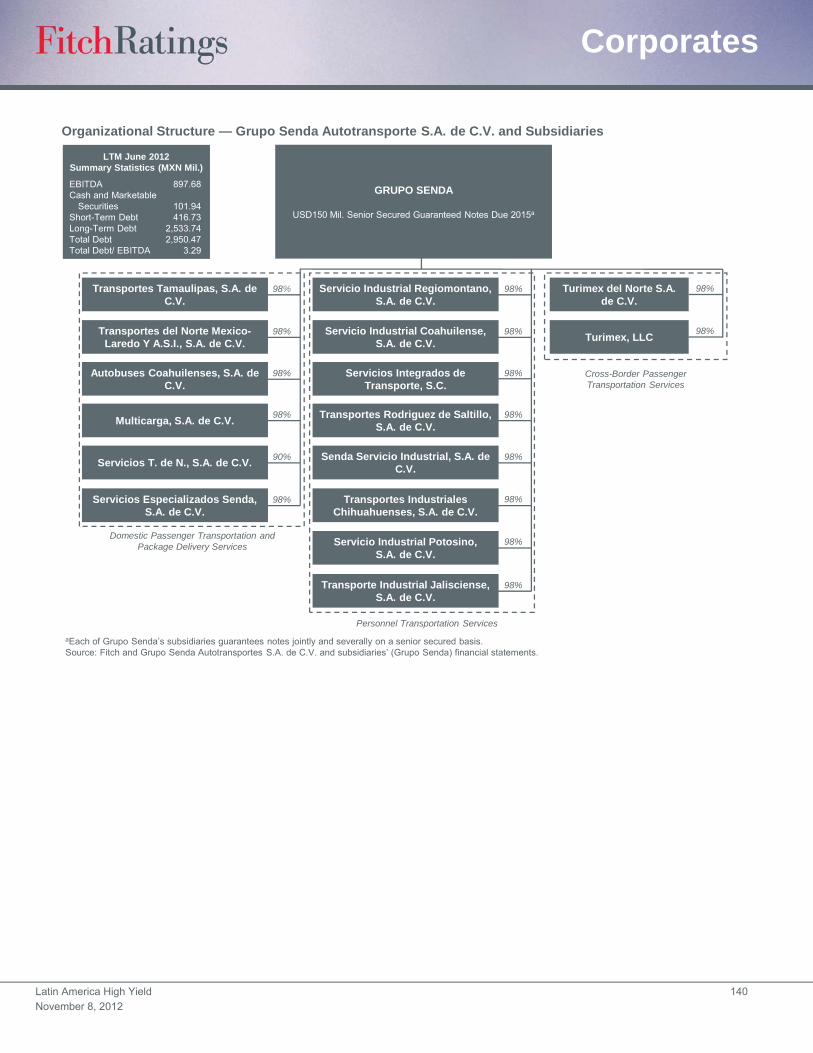
Latin America High Yield 140
November 8, 2012
Corporates
Organizational Structure — Grupo Senda Autotransporte S.A. de C.V. and Subsidiaries
aEach of Grupo Senda’s subsidiaries guarantees notes jointly and severally on a senior secured basis.Source: Fitch and Grupo Senda Autotransportes S.A. de C.V. and subsidiaries’ (Grupo Senda) financial statements.
GRUPO SENDA
USD150 Mil. Senior Secured Guaranteed Notes Due 2015a
LTM June 2012Summary Statistics (MXN Mil.)
EBITDACash and Marketable
SecuritiesShort-Term DebtLong-Term DebtTotal DebtTotal Debt/ EBITDA
897.68
101.94416.73
2,533.742,950.47
3.29
Servicio Industrial Regiomontano,S.A. de C.V.
Transportes Tamaulipas, S.A. de C.V.
Turimex del Norte S.A. de C.V.
Servicio Industrial Coahuilense, S.A. de C.V.
Transportes del Norte Mexico-Laredo Y A.S.I., S.A. de C.V.
Turimex, LLC
Servicios Integrados de Transporte, S.C.
Autobuses Coahuilenses, S.A. de C.V.
Transportes Rodriguez de Saltillo, S.A. de C.V.
Multicarga, S.A. de C.V.
Senda Servicio Industrial, S.A. de C.V.
Servicios T. de N., S.A. de C.V.
Transportes Industriales Chihuahuenses, S.A. de C.V.
Servicios Especializados Senda,S.A. de C.V.
98%
Servicio Industrial Potosino,S.A. de C.V.
Transporte Industrial Jalisciense,S.A. de C.V.
98%
98%
98%
98%
90%
98%
98%
98%
98%
98%
98%
98%
98%
98%
98%
Domestic Passenger Transportation and Package Delivery Services
Personnel Transportation Services
Cross-Border Passenger Transportation Services
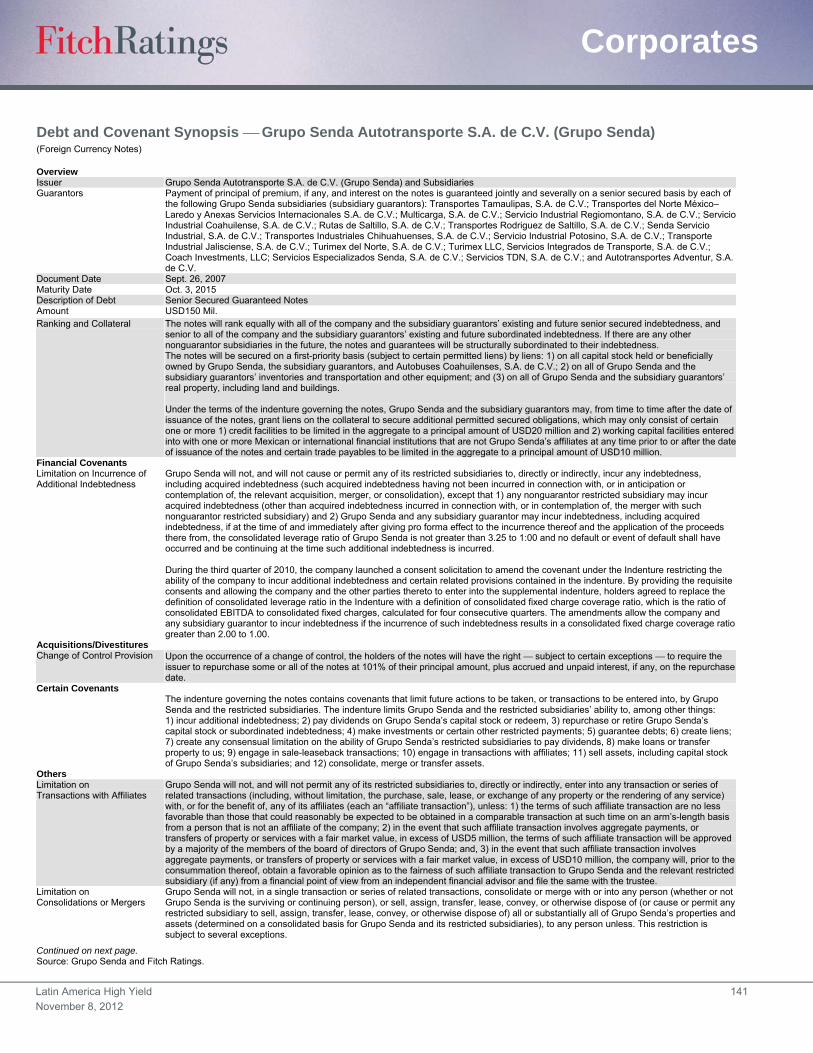
Latin America High Yield 141
November 8, 2012
Corporates
Debt and Covenant Synopsis Grupo Senda Autotransporte S.A. de C.V. (Grupo Senda) (Foreign Currency Notes)
Overview Issuer Grupo Senda Autotransporte S.A. de C.V. (Grupo Senda) and Subsidiaries Guarantors Payment of principal of premium, if any, and interest on the notes is guaranteed jointly and severally on a senior secured basis by each of
the following Grupo Senda subsidiaries (subsidiary guarantors): Transportes Tamaulipas, S.A. de C.V.; Transportes del Norte México–Laredo y Anexas Servicios Internacionales S.A. de C.V.; Multicarga, S.A. de C.V.; Servicio Industrial Regiomontano, S.A. de C.V.; Servicio Industrial Coahuilense, S.A. de C.V.; Rutas de Saltillo, S.A. de C.V.; Transportes Rodriguez de Saltillo, S.A. de C.V.; Senda Servicio Industrial, S.A. de C.V.; Transportes Industriales Chihuahuenses, S.A. de C.V.; Servicio Industrial Potosino, S.A. de C.V.; Transporte Industrial Jalisciense, S.A. de C.V.; Turimex del Norte, S.A. de C.V.; Turimex LLC, Servicios Integrados de Transporte, S.A. de C.V.; Coach Investments, LLC; Servicios Especializados Senda, S.A. de C.V.; Servicios TDN, S.A. de C.V.; and Autotransportes Adventur, S.A. de C.V.
Document Date Sept. 26, 2007 Maturity Date Oct. 3, 2015 Description of Debt Senior Secured Guaranteed Notes Amount USD150 Mil. Ranking and Collateral The notes will rank equally with all of the company and the subsidiary guarantors’ existing and future senior secured indebtedness, and
senior to all of the company and the subsidiary guarantors’ existing and future subordinated indebtedness. If there are any other nonguarantor subsidiaries in the future, the notes and guarantees will be structurally subordinated to their indebtedness. The notes will be secured on a first-priority basis (subject to certain permitted liens) by liens: 1) on all capital stock held or beneficially owned by Grupo Senda, the subsidiary guarantors, and Autobuses Coahuilenses, S.A. de C.V.; 2) on all of Grupo Senda and the subsidiary guarantors’ inventories and transportation and other equipment; and (3) on all of Grupo Senda and the subsidiary guarantors’ real property, including land and buildings. Under the terms of the indenture governing the notes, Grupo Senda and the subsidiary guarantors may, from time to time after the date of issuance of the notes, grant liens on the collateral to secure additional permitted secured obligations, which may only consist of certain one or more 1) credit facilities to be limited in the aggregate to a principal amount of USD20 million and 2) working capital facilities entered into with one or more Mexican or international financial institutions that are not Grupo Senda’s affiliates at any time prior to or after the date of issuance of the notes and certain trade payables to be limited in the aggregate to a principal amount of USD10 million.
Financial Covenants Limitation on Incurrence of Additional Indebtedness
Grupo Senda will not, and will not cause or permit any of its restricted subsidiaries to, directly or indirectly, incur any indebtedness, including acquired indebtedness (such acquired indebtedness having not been incurred in connection with, or in anticipation or contemplation of, the relevant acquisition, merger, or consolidation), except that 1) any nonguarantor restricted subsidiary may incur acquired indebtedness (other than acquired indebtedness incurred in connection with, or in contemplation of, the merger with such nonguarantor restricted subsidiary) and 2) Grupo Senda and any subsidiary guarantor may incur indebtedness, including acquired indebtedness, if at the time of and immediately after giving pro forma effect to the incurrence thereof and the application of the proceeds there from, the consolidated leverage ratio of Grupo Senda is not greater than 3.25 to 1:00 and no default or event of default shall have occurred and be continuing at the time such additional indebtedness is incurred. During the third quarter of 2010, the company launched a consent solicitation to amend the covenant under the Indenture restricting the ability of the company to incur additional indebtedness and certain related provisions contained in the indenture. By providing the requisite consents and allowing the company and the other parties thereto to enter into the supplemental indenture, holders agreed to replace the definition of consolidated leverage ratio in the Indenture with a definition of consolidated fixed charge coverage ratio, which is the ratio of consolidated EBITDA to consolidated fixed charges, calculated for four consecutive quarters. The amendments allow the company and any subsidiary guarantor to incur indebtedness if the incurrence of such indebtedness results in a consolidated fixed charge coverage ratio greater than 2.00 to 1.00.
Acquisitions/Divestitures Change of Control Provision Upon the occurrence of a change of control, the holders of the notes will have the right subject to certain exceptions to require the
issuer to repurchase some or all of the notes at 101% of their principal amount, plus accrued and unpaid interest, if any, on the repurchase date.
Certain Covenants The indenture governing the notes contains covenants that limit future actions to be taken, or transactions to be entered into, by Grupo
Senda and the restricted subsidiaries. The indenture limits Grupo Senda and the restricted subsidiaries’ ability to, among other things: 1) incur additional indebtedness; 2) pay dividends on Grupo Senda’s capital stock or redeem, 3) repurchase or retire Grupo Senda’s capital stock or subordinated indebtedness; 4) make investments or certain other restricted payments; 5) guarantee debts; 6) create liens; 7) create any consensual limitation on the ability of Grupo Senda’s restricted subsidiaries to pay dividends, 8) make loans or transfer property to us; 9) engage in sale-leaseback transactions; 10) engage in transactions with affiliates; 11) sell assets, including capital stock of Grupo Senda’s subsidiaries; and 12) consolidate, merge or transfer assets.
Others Limitation on Transactions with Affiliates
Grupo Senda will not, and will not permit any of its restricted subsidiaries to, directly or indirectly, enter into any transaction or series of related transactions (including, without limitation, the purchase, sale, lease, or exchange of any property or the rendering of any service) with, or for the benefit of, any of its affiliates (each an “affiliate transaction”), unless: 1) the terms of such affiliate transaction are no less favorable than those that could reasonably be expected to be obtained in a comparable transaction at such time on an arm’s-length basis from a person that is not an affiliate of the company; 2) in the event that such affiliate transaction involves aggregate payments, or transfers of property or services with a fair market value, in excess of USD5 million, the terms of such affiliate transaction will be approved by a majority of the members of the board of directors of Grupo Senda; and, 3) in the event that such affiliate transaction involves aggregate payments, or transfers of property or services with a fair market value, in excess of USD10 million, the company will, prior to the consummation thereof, obtain a favorable opinion as to the fairness of such affiliate transaction to Grupo Senda and the relevant restricted subsidiary (if any) from a financial point of view from an independent financial advisor and file the same with the trustee.
Limitation on Consolidations or Mergers
Grupo Senda will not, in a single transaction or series of related transactions, consolidate or merge with or into any person (whether or not Grupo Senda is the surviving or continuing person), or sell, assign, transfer, lease, convey, or otherwise dispose of (or cause or permit any restricted subsidiary to sell, assign, transfer, lease, convey, or otherwise dispose of) all or substantially all of Grupo Senda’s properties and assets (determined on a consolidated basis for Grupo Senda and its restricted subsidiaries), to any person unless. This restriction is subject to several exceptions.
Continued on next page. Source: Grupo Senda and Fitch Ratings.
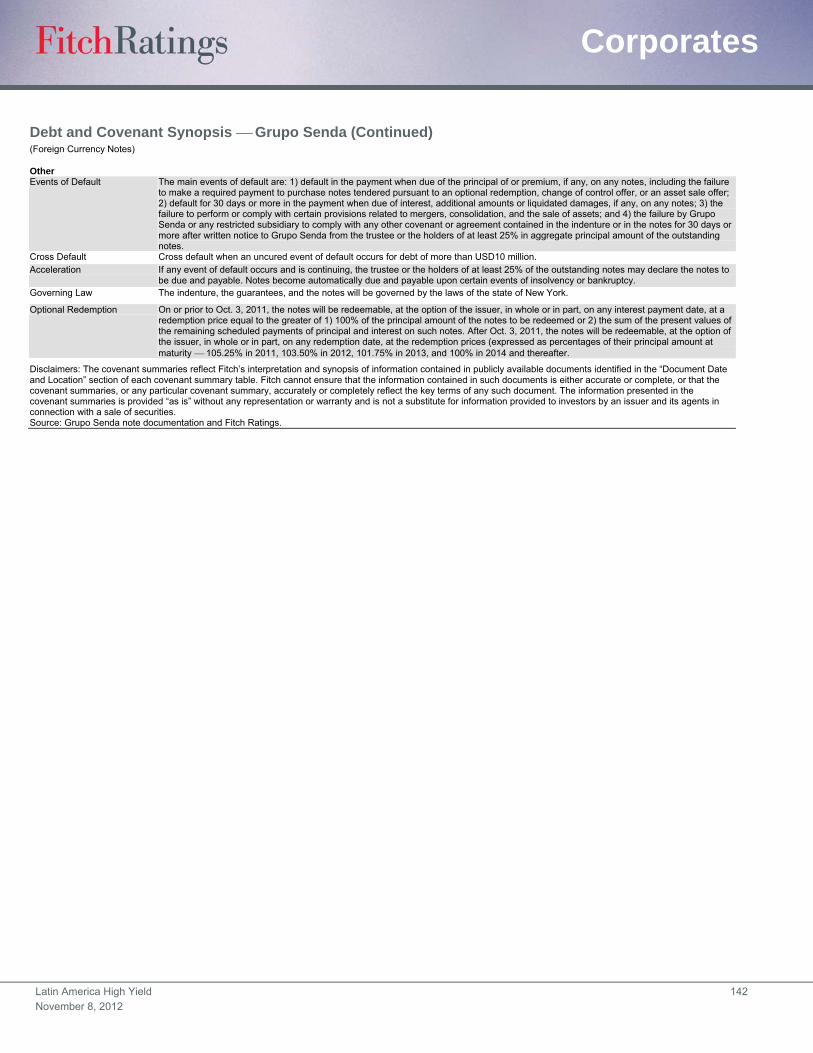
Latin America High Yield 142
November 8, 2012
Corporates
Debt and Covenant Synopsis Grupo Senda (Continued) (Foreign Currency Notes)
Other Events of Default The main events of default are: 1) default in the payment when due of the principal of or premium, if any, on any notes, including the failure
to make a required payment to purchase notes tendered pursuant to an optional redemption, change of control offer, or an asset sale offer; 2) default for 30 days or more in the payment when due of interest, additional amounts or liquidated damages, if any, on any notes; 3) the failure to perform or comply with certain provisions related to mergers, consolidation, and the sale of assets; and 4) the failure by Grupo Senda or any restricted subsidiary to comply with any other covenant or agreement contained in the indenture or in the notes for 30 days or more after written notice to Grupo Senda from the trustee or the holders of at least 25% in aggregate principal amount of the outstanding notes.
Cross Default Cross default when an uncured event of default occurs for debt of more than USD10 million. Acceleration If any event of default occurs and is continuing, the trustee or the holders of at least 25% of the outstanding notes may declare the notes to
be due and payable. Notes become automatically due and payable upon certain events of insolvency or bankruptcy. Governing Law The indenture, the guarantees, and the notes will be governed by the laws of the state of New York.
Optional Redemption On or prior to Oct. 3, 2011, the notes will be redeemable, at the option of the issuer, in whole or in part, on any interest payment date, at a redemption price equal to the greater of 1) 100% of the principal amount of the notes to be redeemed or 2) the sum of the present values of the remaining scheduled payments of principal and interest on such notes. After Oct. 3, 2011, the notes will be redeemable, at the option of the issuer, in whole or in part, on any redemption date, at the redemption prices (expressed as percentages of their principal amount at maturity 105.25% in 2011, 103.50% in 2012, 101.75% in 2013, and 100% in 2014 and thereafter.
Disclaimers: The covenant summaries reflect Fitch’s interpretation and synopsis of information contained in publicly available documents identified in the “Document Date and Location” section of each covenant summary table. Fitch cannot ensure that the information contained in such documents is either accurate or complete, or that the covenant summaries, or any particular covenant summary, accurately or completely reflect the key terms of any such document. The information presented in the covenant summaries is provided “as is” without any representation or warranty and is not a substitute for information provided to investors by an issuer and its agents in connection with a sale of securities. Source: Grupo Senda note documentation and Fitch Ratings.

Latin America High Yield 143
November 8, 2012
Corporates
Financial Summary Grupo Senda Autotransporte, S.A. de C.V. (Grupo Senda) LTM Ended
(MXN 000) 2008 2009 2010 2011 6/30/12Profitability Operating EBITDA 611,438 527,568 765,133 812,577 897,677Operating EBITDAR 611,438 527,568 765,133 812,577 897,677Operating EBITDA Margin 19.72 16.76 21.81 22.17 23.72Operating EBITDAR Margin 19.72 16.76 21.81 22.17 23.72FFO Return on Adjusted Capital (%) 12.14 9.94 19.84 20.94 21.59Free Cash Flow Margin (%) (6.00) (6.00) 7.10 (1.00) 2.32Return on Average Equity (%) (41.00) (37.00) (1.00) (55.00) (32.01)Coverage (x) FFO Interest Coverage 1.40 0.92 1.77 1.91 1.94Operating EBITDA/Interest Expense 1.69 1.36 2.03 2.10 2.34Operating EBITDAR/Interest Expense + Rents 1.69 1.36 2.03 2.10 2.34Operating EBITDA/Debt Service Coverage 0.77 0.69 1.02 0.92 1.12Operating EBITDAR/Debt Service Coverage 0.77 0.69 1.02 0.92 1.12FFO Fixed-Charge Coverage 1.40 0.92 1.77 1.91 1.94FCF Debt Service Coverage 0.23 0.27 0.84 0.39 0.59(FCF + Cash and Marketable Securities)/Debt Service Coverage 0.47 0.46 1.02 0.59 0.72Cash Flow from Operations/Capital Expenditures 0.43 (2.00) 4.00 0.89 1.41Capital Structure and Leverage (x) FFO Adjusted Leverage 5.96 8.08 4.03 4.25 3.96Total Debt with Equity Credit/Operating EBITDA 4.94 5.49 3.52 3.88 3.29Total Net Debt with Equity Credit/Operating EBITDA 4.63 5.21 3.35 3.67 3.17Total Adjusted Debt/Operating EBITDAR 4.94 5.49 3.52 3.88 3.29Total Adjusted Net Debt/Operating EBITDAR 4.63 5.21 3.35 3.67 3.17Implied Cost of Funds (%) 13.11 13.13 13.5 13.27 13.61Secured Debt/Total Debt Short-Term Debt/Total Debt 0.14 0.13 0.14 0.16 0.14Balance Sheet Total Assets 4,622,169 4,111,073 3,994,662 4,167,989 4,102,580Cash and Marketable Securities 191,581 146,392 132,826 168,808 101,942Short-Term Debt 431,846 375,179 370,229 495,491 416,729Long-Term Debt 2,588,235 2,521,336 2,326,021 2,653,689 2,533,742Total Debt 3,020,081 2,896,515 2,696,250 3,149,180 2,950,471Equity Credit Total Debt with Equity Credit 3,020,081 2,896,515 2,696,250 3,149,180 2,950,471Off-Balance Sheet Debt Total Adjusted Debt with Equity Credit 3,020,081 2,896,515 2,696,250 3,149,180 2,950,471Total Equity 1,154,169 707,812 679,173 387,965 498,438Total Adjusted Capital 4,174,250 3,604,327 3,375,423 3,537,145 3,448,909Cash Flow Funds from Operations 144,475 (30,134) 291,958 352,813 361,486Change in Operating Working Capital (8,228) (95,165) 40,091 (45,947) (59,368)Cash Flow from Operations 136,247 (125,299) 332,049 306,866 302,118Total Non-Operating/Nonrecurring Cash Flow Capital Expenditures (318,674) (56,434) (82,993) (346,321) (214,155)Dividends Free Cash Flow (182,427) (181,733) 249,056 (39,455) 87,963Net Acquisitions and Divestitures Other Investments, Net Net Debt Proceeds 39,451 (13,389) (262,622) 75,437 (116,960)Net Equity Proceeds Other Financing, Net 120,618 149,933 Total Change in Cash (22,358) (45,189) (13,566) 35,982 (28,997)Income Statement Net Revenues 3,101,126 3,147,789 3,508,730 3,664,654 3,784,747Revenue Growth (%) 4.47 1.50 11.47 4.44 4.75Operating EBIT 277,964 161,611 432,046 482,996 568,970Gross Interest Expense 362,445 388,463 377,634 387,851 383,186Rental Expense Net Income (552,222) (343,772) (6,033) (290,982) (189,719)
Source: Company reports.

Latin America High Yield 144
November 8, 2012
Corporates
Industrias Metalurgicas Pescarmona S.A.I.C y F. (IMPSA) Full Rating Report
Key Rating Drivers
Growing Business Presence in Brazil: Industrias Metalurgicas Pescarmona S.A.I.C y F.
(IMPSA) is a manufacturing company based in Argentina, with growing operations in Brazil. For
the last 11 months ended December 2011, 53% of revenues and 38% of EBITDA came from
Brazil. The growth of its business in Brazil has reduced IMPSA’s exposure to more volatile
markets such as Argentina and has increased its access to multiple funding sources. This
increase in funding sources has reduced concerns about IMPSA’s need to finance its working
capital needs in Argentina should trading conditions in that market deteriorate. It has also
enabled the company’s foreign currency rating to exceed the ‘B’ country ceiling of Argentina.
Positive Business Fundamentals: IMPSA’s ‘B+’ ratings reflect the positive trend for the
company’s long-term business fundamentals due to sustained global demand for hydro and
wind power generating equipment. As of June 2012, IMPSA’s backlog was USD 3.6 billion with
79% in wind manufacturing, 61% in projects with third parties, and 43% in Brazil. The actual
backlog shows an improvement from the USD3.16 billion during January 2011. Given the long-
term production cycle of IMPSA’s developments (usually in the range of four years for hydro
and 12–18 months for wind farms), this backlog level provides some certainty to the company’s
cash generation in the medium term.
Backlog Concentration Poses Risk: Backlog concentration for this industry is high, with five
projects representing 56% of total backlog at June 2012. The main project in the hydro
equipment business unit is the Belo Monte hydro project in Brazil, whereas the main projects in
the wind equipment unit are Arauco IV (Argentina) and Ceara III (Brazil).
Negative Free Cash Flow: The company’s free cash flow (FCF) is anticipated to remain
negative during 2012 and 2013 due to high capital expenditure levels and growing working
capital needs. Investments in the construction of wind farms are estimated at approximately
USD450 million for fiscal year-end 2012 and USD560 million for fiscal year-end 2013. Much of
the cash deficit will be funded with nonrecourse project financing to develop wind farm projects
in Brazil.
What Could Trigger a Rating Action
Changes in Financing Strategy: The company’s ratings could be downgraded or a Negative
Outlook could be assigned if recourse financing increases above levels anticipated by Fitch, or
if IMPSA changes its existing strategy of financing the development of wind farms with debt
from nonrecourse project financing.
Operating Issues: Any material performance problems that threaten future projects and cash
flow, or a failure to comply with the terms for the operation of the wind farms (for which long-
term PPAs have been signed with Eletrobras and the CCEE and are financed by BNDES)
could also result in a Negative Outlook or downgrade. A sharp decline in demand for wind
farms would also be negative.
Ratings
Foreign Currency
Long-Term IDR B+
Senior Unsecured B+/RR4
Local Currency
Long-Term IDR B+
Rating Outlooks Long-Term Foreign Currency IDR Stable Long-Term Local Currency IDR Stable
Financial Data
Industrias Metalurgicas Pescarmona S.A.I.C y F.
(USD Mil.) 6/30/12
6 Months 12/31/11
11 Months Revenue 451.6 1,150.5
EBITDA 107.6 200.0 Cash Flow from Operations (143.8) (318.0) Cash and Marketable Securities 60.8 95.8 Total Recourse Debt 957.8 835.4 Total Recourse Debt/EBITDA (x) 4.6 3.8 Net Recourse Debt/EBITDA (x) 4.3 3.4
Note: IMPSA changed to IFRS in April 2011 and changed the fiscal year end to December. Figures as of December 2011 are 11 months and as of June 2012 are six-month figures. Ratios have been calculated by annualizing income statement and cash flow items of 11months and six months, respectively.
Analysts Gabriela Catri +54 11 5235-8129 [email protected]
Fernando Torres +54 11 5235-8124 [email protected]
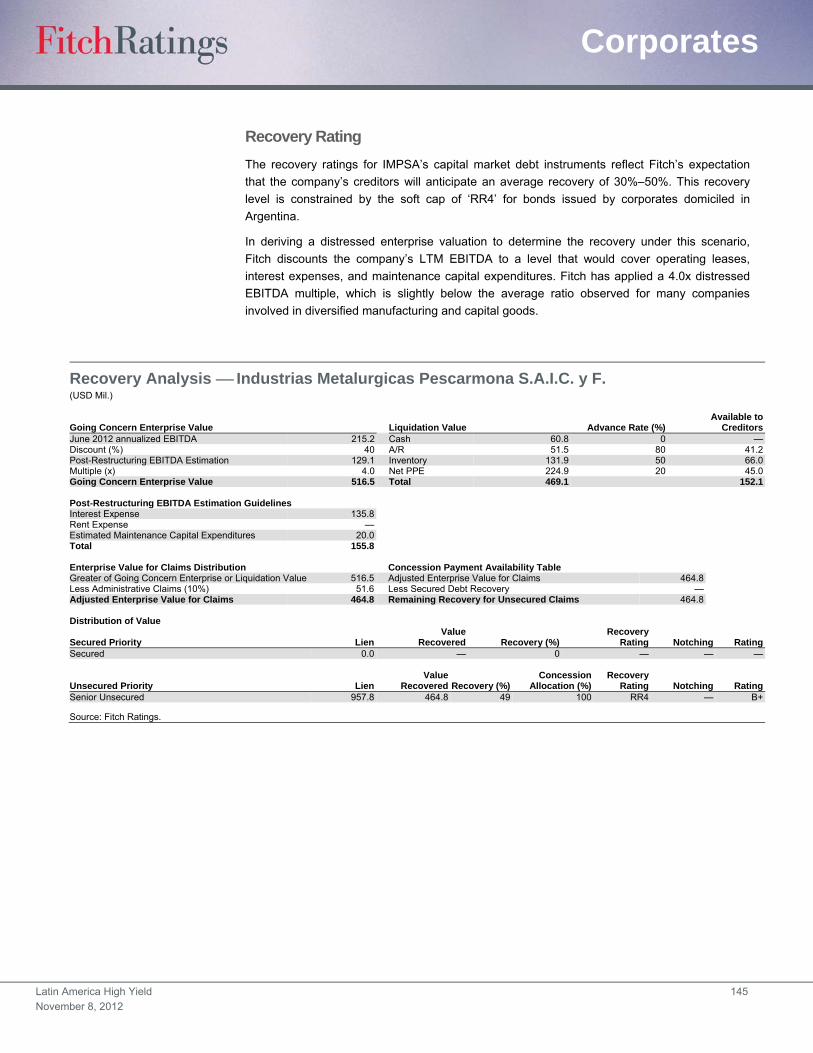
Latin America High Yield 145
November 8, 2012
Corporates
Recovery Rating
The recovery ratings for IMPSA’s capital market debt instruments reflect Fitch’s expectation
that the company’s creditors will anticipate an average recovery of 30%–50%. This recovery
level is constrained by the soft cap of ‘RR4’ for bonds issued by corporates domiciled in
Argentina.
In deriving a distressed enterprise valuation to determine the recovery under this scenario,
Fitch discounts the company’s LTM EBITDA to a level that would cover operating leases,
interest expenses, and maintenance capital expenditures. Fitch has applied a 4.0x distressed
EBITDA multiple, which is slightly below the average ratio observed for many companies
involved in diversified manufacturing and capital goods.
Recovery Analysis Industrias Metalurgicas Pescarmona S.A.I.C. y F. (USD Mil.)
Going Concern Enterprise Value Liquidation Value Advance Rate (%)Available to
CreditorsJune 2012 annualized EBITDA 215.2 Cash 60.8 0 —Discount (%) 40 A/R 51.5 80 41.2Post-Restructuring EBITDA Estimation 129.1 Inventory 131.9 50 66.0Multiple (x) 4.0 Net PPE 224.9 20 45.0Going Concern Enterprise Value 516.5 Total 469.1 152.1 Post-Restructuring EBITDA Estimation Guidelines Interest Expense 135.8Rent Expense —Estimated Maintenance Capital Expenditures 20.0Total 155.8
Enterprise Value for Claims Distribution Concession Payment Availability Table Greater of Going Concern Enterprise or Liquidation Value 516.5 Adjusted Enterprise Value for Claims 464.8Less Administrative Claims (10%) 51.6 Less Secured Debt Recovery —Adjusted Enterprise Value for Claims 464.8 Remaining Recovery for Unsecured Claims 464.8 Distribution of Value
Secured Priority LienValue
Recovered Recovery (%)Recovery
Rating Notching RatingSecured 0.0 — 0 — — —
Unsecured Priority LienValue
Recovered Recovery (%)Concession
Allocation (%) Recovery
Rating Notching RatingSenior Unsecured 957.8 464.8 49 100 RR4 — B+
Source: Fitch Ratings.
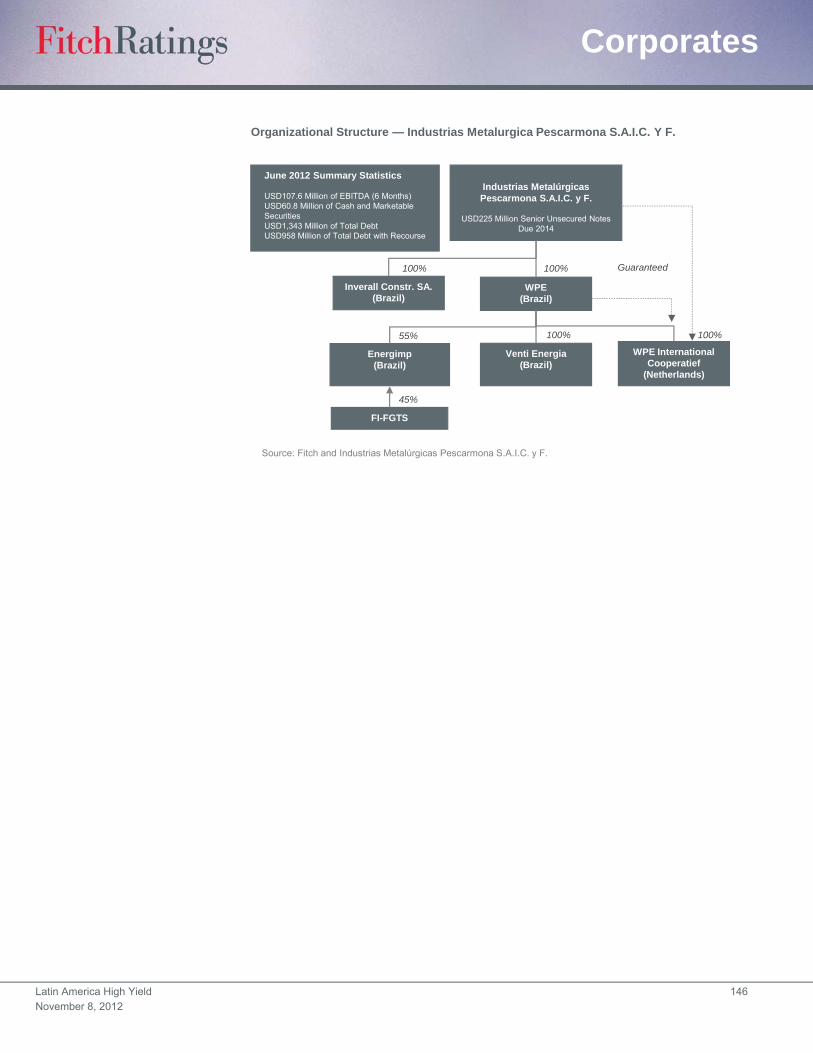
Latin America High Yield 146
November 8, 2012
Corporates
Organizational Structure — Industrias Metalurgica Pescarmona S.A.I.C. Y F.
Industrias Metalúrgicas Pescarmona S.A.I.C. y F.
USD225 Million Senior Unsecured Notes Due 2014
Inverall Constr. SA. (Brazil)
WPE(Brazil)
Energimp(Brazil)
Venti Energia(Brazil)
Source: Fitch and Industrias Metalúrgicas Pescarmona S.A.I.C. y F.
WPE International Cooperatief
(Netherlands)
FI-FGTS
100%
100% 100%
100%
55%
45%
Guaranteed
June 2012 Summary Statistics
USD107.6 Million of EBITDA (6 Months)USD60.8 Million of Cash and Marketable SecuritiesUSD1,343 Million of Total DebtUSD958 Million of Total Debt with Recourse
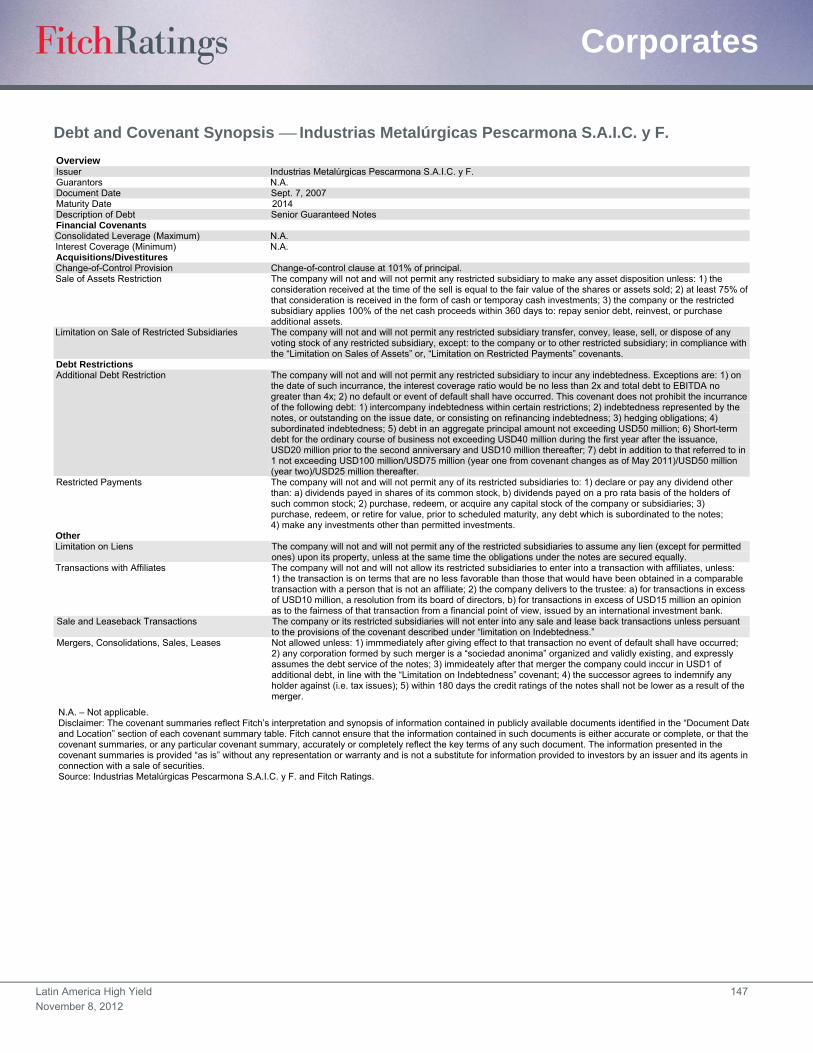
Latin America High Yield 147
November 8, 2012
Corporates
Debt and Covenant Synopsis Industrias Metalúrgicas Pescarmona S.A.I.C. y F.
Overview Issuer Industrias Metalúrgicas Pescarmona S.A.I.C. y F. Guarantors N.A. Document Date Sept. 7, 2007 Maturity Date 2014 Description of Debt Senior Guaranteed Notes Financial Covenants Consolidated Leverage (Maximum) N.A. Interest Coverage (Minimum) N.A. Acquisitions/Divestitures Change-of-Control Provision Change-of-control clause at 101% of principal. Sale of Assets Restriction The company will not and will not permit any restricted subsidiary to make any asset disposition unless: 1) the
consideration received at the time of the sell is equal to the fair value of the shares or assets sold; 2) at least 75% of that consideration is received in the form of cash or temporay cash investments; 3) the company or the restricted subsidiary applies 100% of the net cash proceeds within 360 days to: repay senior debt, reinvest, or purchase additional assets.
Limitation on Sale of Restricted Subsidiaries The company will not and will not permit any restricted subsidiary transfer, convey, lease, sell, or dispose of any voting stock of any restricted subsidiary, except: to the company or to other restricted subsidiary; in compliance with the “Limitation on Sales of Assets” or, “Limitation on Restricted Payments” covenants.
Debt Restrictions Additional Debt Restriction The company will not and will not permit any restricted subsidiary to incur any indebtedness. Exceptions are: 1) on
the date of such incurrance, the interest coverage ratio would be no less than 2x and total debt to EBITDA no greater than 4x; 2) no default or event of default shall have occurred. This covenant does not prohibit the incurrance of the following debt: 1) intercompany indebtedness within certain restrictions; 2) indebtedness represented by the notes, or outstanding on the issue date, or consisting on refinancing indebtedness; 3) hedging obligations; 4) subordinated indebtedness; 5) debt in an aggregate principal amount not exceeding USD50 million; 6) Short-term debt for the ordinary course of business not exceeding USD40 million during the first year after the issuance, USD20 million prior to the second anniversary and USD10 million thereafter; 7) debt in addition to that referred to in 1 not exceeding USD100 million/USD75 million (year one from covenant changes as of May 2011)/USD50 million (year two)/USD25 million thereafter.
Restricted Payments The company will not and will not permit any of its restricted subsidiaries to: 1) declare or pay any dividend other than: a) dividends payed in shares of its common stock, b) dividends payed on a pro rata basis of the holders of such common stock; 2) purchase, redeem, or acquire any capital stock of the company or subsidiaries; 3) purchase, redeem, or retire for value, prior to scheduled maturity, any debt which is subordinated to the notes; 4) make any investments other than permitted investments.
Other Limitation on Liens The company will not and will not permit any of the restricted subsidiaries to assume any lien (except for permitted
ones) upon its property, unless at the same time the obligations under the notes are secured equally. Transactions with Affiliates The company will not and will not allow its restricted subsidiaries to enter into a transaction with affiliates, unless:
1) the transaction is on terms that are no less favorable than those that would have been obtained in a comparable transaction with a person that is not an affiliate; 2) the company delivers to the trustee: a) for transactions in excess of USD10 million, a resolution from its board of directors, b) for transactions in excess of USD15 million an opinion as to the fairness of that transaction from a financial point of view, issued by an international investment bank.
Sale and Leaseback Transactions The company or its restricted subsidiaries will not enter into any sale and lease back transactions unless persuant to the provisions of the covenant described under “limitation on Indebtedness.”
Mergers, Consolidations, Sales, Leases Not allowed unless: 1) immmediately after giving effect to that transaction no event of default shall have occurred; 2) any corporation formed by such merger is a “sociedad anonima” organized and validly existing, and expressly assumes the debt service of the notes; 3) immideately after that merger the company could inccur in USD1 of additional debt, in line with the “Limitation on Indebtedness” covenant; 4) the successor agrees to indemnify any holder against (i.e. tax issues); 5) within 180 days the credit ratings of the notes shall not be lower as a result of the merger.
N.A. – Not applicable. Disclaimer: The covenant summaries reflect Fitch’s interpretation and synopsis of information contained in publicly available documents identified in the “Document Dateand Location” section of each covenant summary table. Fitch cannot ensure that the information contained in such documents is either accurate or complete, or that the covenant summaries, or any particular covenant summary, accurately or completely reflect the key terms of any such document. The information presented in the covenant summaries is provided “as is” without any representation or warranty and is not a substitute for information provided to investors by an issuer and its agents in connection with a sale of securities. Source: Industrias Metalúrgicas Pescarmona S.A.I.C. y F. and Fitch Ratings.
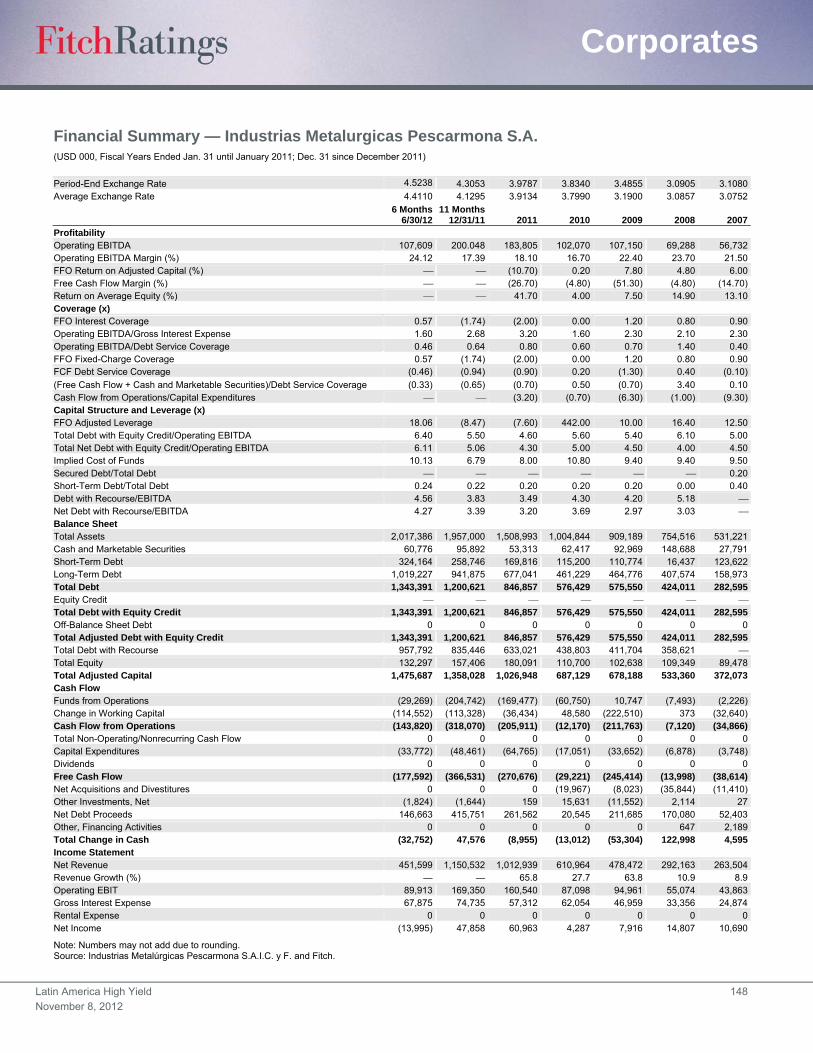
Latin America High Yield 148
November 8, 2012
Corporates
Financial Summary — Industrias Metalurgicas Pescarmona S.A. (USD 000, Fiscal Years Ended Jan. 31 until January 2011; Dec. 31 since December 2011)
Period-End Exchange Rate 4.5238 4.3053 3.9787 3.8340 3.4855 3.0905 3.1080Average Exchange Rate 4.4110 4.1295 3.9134 3.7990 3.1900 3.0857 3.0752
6 Months
6/30/1211 Months
12/31/11 2011 2010 2009 2008 2007Profitability Operating EBITDA 107,609 200.048 183,805 102,070 107,150 69,288 56,732 Operating EBITDA Margin (%) 24.12 17.39 18.10 16.70 22.40 23.70 21.50 FFO Return on Adjusted Capital (%) (10.70) 0.20 7.80 4.80 6.00 Free Cash Flow Margin (%) (26.70) (4.80) (51.30) (4.80) (14.70)Return on Average Equity (%) 41.70 4.00 7.50 14.90 13.10 Coverage (x) FFO Interest Coverage 0.57 (1.74) (2.00) 0.00 1.20 0.80 0.90 Operating EBITDA/Gross Interest Expense 1.60 2.68 3.20 1.60 2.30 2.10 2.30 Operating EBITDA/Debt Service Coverage 0.46 0.64 0.80 0.60 0.70 1.40 0.40 FFO Fixed-Charge Coverage 0.57 (1.74) (2.00) 0.00 1.20 0.80 0.90 FCF Debt Service Coverage (0.46) (0.94) (0.90) 0.20 (1.30) 0.40 (0.10)
(Free Cash Flow + Cash and Marketable Securities)/Debt Service Coverage (0.33) (0.65) (0.70) 0.50 (0.70) 3.40 0.10 Cash Flow from Operations/Capital Expenditures (3.20) (0.70) (6.30) (1.00) (9.30)Capital Structure and Leverage (x) FFO Adjusted Leverage 18.06 (8.47) (7.60) 442.00 10.00 16.40 12.50 Total Debt with Equity Credit/Operating EBITDA 6.40 5.50 4.60 5.60 5.40 6.10 5.00 Total Net Debt with Equity Credit/Operating EBITDA 6.11 5.06 4.30 5.00 4.50 4.00 4.50 Implied Cost of Funds 10.13 6.79 8.00 10.80 9.40 9.40 9.50 Secured Debt/Total Debt 0.20 Short-Term Debt/Total Debt 0.24 0.22 0.20 0.20 0.20 0.00 0.40 Debt with Recourse/EBITDA 4.56 3.83 3.49 4.30 4.20 5.18 Net Debt with Recourse/EBITDA 4.27 3.39 3.20 3.69 2.97 3.03 Balance Sheet Total Assets 2,017,386 1,957,000 1,508,993 1,004,844 909,189 754,516 531,221 Cash and Marketable Securities 60,776 95,892 53,313 62,417 92,969 148,688 27,791 Short-Term Debt 324,164 258,746 169,816 115,200 110,774 16,437 123,622 Long-Term Debt 1,019,227 941,875 677,041 461,229 464,776 407,574 158,973 Total Debt 1,343,391 1,200,621 846,857 576,429 575,550 424,011 282,595 Equity Credit Total Debt with Equity Credit 1,343,391 1,200,621 846,857 576,429 575,550 424,011 282,595 Off-Balance Sheet Debt 0 0 0 0 0 0 0 Total Adjusted Debt with Equity Credit 1,343,391 1,200,621 846,857 576,429 575,550 424,011 282,595 Total Debt with Recourse 957,792 835,446 633,021 438,803 411,704 358,621 Total Equity 132,297 157,406 180,091 110,700 102,638 109,349 89,478 Total Adjusted Capital 1,475,687 1,358,028 1,026,948 687,129 678,188 533,360 372,073 Cash Flow Funds from Operations (29,269) (204,742) (169,477) (60,750) 10,747 (7,493) (2,226)Change in Working Capital (114,552) (113,328) (36,434) 48,580 (222,510) 373 (32,640)Cash Flow from Operations (143,820) (318,070) (205,911) (12,170) (211,763) (7,120) (34,866)Total Non-Operating/Nonrecurring Cash Flow 0 0 0 0 0 0 0 Capital Expenditures (33,772) (48,461) (64,765) (17,051) (33,652) (6,878) (3,748)Dividends 0 0 0 0 0 0 0 Free Cash Flow (177,592) (366,531) (270,676) (29,221) (245,414) (13,998) (38,614)Net Acquisitions and Divestitures 0 0 0 (19,967) (8,023) (35,844) (11,410)Other Investments, Net (1,824) (1,644) 159 15,631 (11,552) 2,114 27 Net Debt Proceeds 146,663 415,751 261,562 20,545 211,685 170,080 52,403 Other, Financing Activities 0 0 0 0 0 647 2,189 Total Change in Cash (32,752) 47,576 (8,955) (13,012) (53,304) 122,998 4,595 Income Statement Net Revenue 451,599 1,150,532 1,012,939 610,964 478,472 292,163 263,504 Revenue Growth (%) — — 65.8 27.7 63.8 10.9 8.9 Operating EBIT 89,913 169,350 160,540 87,098 94,961 55,074 43,863 Gross Interest Expense 67,875 74,735 57,312 62,054 46,959 33,356 24,874 Rental Expense 0 0 0 0 0 0 0 Net Income (13,995) 47,858 60,963 4,287 7,916 14,807 10,690
Note: Numbers may not add due to rounding. Source: Industrias Metalúrgicas Pescarmona S.A.I.C. y F. and Fitch.

Latin America High Yield 149
November 8, 2012
Corporates
Financial Summary Industrias Metalurgicas Pescarmona S.A. (ARS 000, Fiscal Years Ended Jan. 31 until January 2011; Dec. 31 since December 2011)
6 Months 6/30/12
11 Months 12/31/11 2011 2010 2009 2008 2007
Profitability Operating EBITDA 474,664 861.266 719,302 391,337 341,809 213,801 174,461 Operating EBITDA Margin (%) 24.1 17.4 18.1 16.7 22.4 23.7 21.5 FFO Return on Adjusted Capital (%) (10.7) 0.2 7.8 4.8 6.0 Free Cash Flow Margin (%) (26.7) (4.8) (51.3) (4.8) (14.7)Return on Average Equity (%) 41.6 4.2 7.3 14.8 13.0 Coverage (x) FFO Interest Coverage 0.6 (1.7) (2.0) 0.0 1.2 0.8 0.9 Operating EBITDA/Gross Interest Expense 1.6 2.7 3.2 1.6 2.3 2.1 2.3 Operating EBITDA/Debt Service Coverage 0.5 0.6 0.8 0.6 0.6 1.4 0.4 FFO Fixed-Charge Coverage 0.6 (1.7) (2.0) 0.0 1.2 0.8 0.9 FCF Debt Service Coverage (0.5) (0.9) (0.9) 0.2 (1.2) 0.4 (0.1)(Free Cash Flow + Cash and Marketable Securities)/Debt Service Coverage (0.3) (0.7) (0.7) 0.5 (0.6) 3.4 0.1 Cash Flow from Operations/Capital Expenditures (3.2) (0.7) (6.3) (1.0) (9.3)Capital Structure and Leverage (x) FFO Adjusted Leverage 18.1 (8.5) (7.7) 442.0 10.9 16.4 12.6 Total Debt with Equity Credit/Operating EBITDA 6.4 5.5 4.7 5.6 5.9 6.1 5.0 Total Net Debt with Equity Credit/Operating EBITDA 6.1 5.1 4.0 4.4 5.0 4.9 4.0Implied Cost of Funds 10.1 8.2 7.3 8.0 11.3 9.0 9.4Secured Debt/Total Debt 0.2Short-Term Debt/Total Debt 0.2 0.2 0.2 0.2 0.2 0 0.4Debt with Recourse/EBITDA 4.6 3.8 3.5 4.3 4.2 5.2 Net Debt with Recourse/EBITDA 4.3 3.4 3.2 3.7 3.3 3.0 Balance Sheet Total Assets 9,126,251 8,425,474 6,003,831 3,852,570 3,168,977 2,331,831 1,651,034 Cash and Marketable Securities 274,940 412,844 212,117 239,306 324,043 459,520 86,374 Short-Term Debt 1,466,453 1,113,981 675,646 441,677 386,103 50,798 384,216 Long-Term Debt 4,610,779 4,055,053 2,693,744 1,768,353 1,619,978 1,259,608 494,087 Total Debt 6,077,232 5,169,034 3,369,390 2,210,030 2,006,081 1,310,406 878,303 Equity Credit Total Debt with Equity Credit 6,077,232 5,169,034 3,369,390 2,210,030 2,006,081 1,310,406 878,303 Off-Balance Sheet Debt 0 0 0 0 0 0 0 Total Adjusted Debt with Equity Credit 6,077,232 5,169,034 3,369,390 2,210,030 2,006,081 1,310,406 878,303 Total Debt with Recourse 4,332,860 3,596,846 2,511,827 1,682,369 1,434,996 1,108,319 Total Equity 598,483 677,682 716,528 424,423 357,745 337,944 278,098 Total Adjusted Capital 6,675,715 5,846,716 4,085,918 2,634,453 2,363,826 1,648,350 1,156,401 Cash Flow Funds from Operations (127,564) (881,476) (663,231) (232,915) 34,283 (23,120) (6,846)Change in Working Capital (499,263) (487,910) (142,580) 186,255 (709,806) 1,150 (100,375)Cash Flow from Operations (626,827) (1,369,386) (805,811) (46,660) (675,523) (21,970) (107,221)Total Non-Operating/Nonrecurring Cash Flow 0 0 0 0 0 0 0 Capital Expenditures (147,190) (208,639) (253,452) (65,375) (107,349) (21,224) (11,526)Dividends 0 0 0 0 0 0 0 Free Cash Flow (774,017) (1,578,025) (1,059,263) (112,035) (782,872) (43,194) (118,747)Net Acquisitions and Divestitures 0 0 0 (76,554) (25,592) (110,605) (35,089)Other Investments, Net (7,948) (7,076) 622 59,930 (36,852) 6,524 83 Net Debt Proceeds 639,217 1,789,931 1,023,596 78,770 675,275 524,815 161,151 Net Equity Proceeds 0 0 0 0 0 0 0 Other, Financing Activities 0 0 0 0 0 1,996 6,732 Total Change in Cash (142,748) 204,830 (35,045) (49,889) (170,041) 379,536 14,130 Income Statement Net Revenue 1,968,2479 4,953,384 3,964,037 2,342,436 1,526,327 901,527 810,326 Revenue Growth (%) — — 69.2 53.5 69.3 11.3 14.2Operating EBIT 391,876 729,102 628,256 333,935 302,925 169,943 134,889 Gross Interest Expense 295,827 321,755 224,286 237,915 149,798 102,928 76,492 Rental Expense 0 0 0 0 0 0 0 Net Income (60,995) 206,041 238,573 16,435 25,252 45,691 32,873
Note: Numbers may not add due to rounding. Source: Industrias Metalúrgicas Pescarmona S.A.I.C. y F. and Fitch.

Latin America High Yield 150
November 8, 2012
Corporates
IRSA Inversiones y Representaciones S.A. Full Rating Report
Key Rating Drivers
Exposure to Argentina’s Volatile Economy: IRSA Inversiones y Representaciones S.A.’s (IRSA)
local currency issuer default rating is constrained at ‘BB–’ by above-average risks associated with
real estate development in Argentina. These risks include sharp downturns in economic activity and
devaluation risk, as most of its cash flow is denominated in Argentine pesos and a substantial part of
its debt is in U.S. dollars. This is partially mitigated by IRSA’s dollar-denominated asset portfolio,
investments in assets outside of Argentina, and a long-term debt profile.
Transfer and Convertibility Risk: IRSA’s foreign currency issuer default rating (IDR) continues
to be constrained at ‘B’ due to the ‘B’ country ceiling assigned to Argentina by Fitch. Timely
payment of U.S. dollar debt obligations could be constrained by the imposition of transfer or
convertibility (T&C) restrictions in the event of a sovereign stress. The ‘B+/RR3’ rating of the
company’s foreign debt obligations reflects Fitch’s opinion that if IRSA missed the timely payment
of debt obligations due to government restrictions, lenders would have above-average recovery
prospects due to the strong standalone business and financial profile of the company.
Rating Linkage to APSA: Despite lower leverage at Alto Palermo S.A. (APSA), the local
currency IDR’s of APSA and IRSA have been linked at ‘BB–’. This linkage reflects factors that
align the credit quality of the companies, such as strong strategic ties, and the fact that APSA’s
upstream dividends represent a relevant part of IRSA’s cash flow generation.
Strong Business Position: The company’s ‘BB–’ local currency IDR reflects its strong
performance and positive operating trends. IRSA has a leading position in the shopping center
segment within the city of Buenos Aires through its subsidiary, APSA (95.6% owned). The
shopping centers segment accounted for 75% of its consolidated operating EBITDA. IRSA is
also the leader in the development and management of office buildings in Buenos Aires
(14% of consolidated operating EBITDA). The balance of IRSA’s operating results is derived
from three premium hotels, as well as its residential property development division.
Strong Asset Portfolio: The ‘BB–’ local currency IDR rating reflects a moderate level of debt, as
well as a manageable liquidity position due to unencumbered assets and land that could be sold.
For the real estate industry, the emphasis of Fitch’s methodology is on portfolio quality, diversity,
and size. IRSA’s assets portfolio is strong with USD1.2 billion of undepreciated book capital as of
June 30, 2012. These assets are mostly unencumbered, as secured debt represents less than 5%
of total debt. Leverage, measured by net debt as a percentage of undepreciated book capital, was
40% at June 30, 2012. This percentage would be lower at market values.
What Could Trigger a Rating Action
Aggressive Growth Threatening Capital Structure: The Stable Outlook reflects Fitch’s
expectations that IRSA will manage its balance sheet to a targeted total debt-to-EBITDA ratio
of less than 3.5x. Any significant increase in IRSA’s targeted leverage ratio would weaken
credit quality and could result in a negative rating action.
Changes in Argentina’s Country Ceiling: IRSA’s foreign currency IDR could be affected by
an upgrade or downgrade of the Argentine country ceiling of ‘B’.
Ratings
Foreign Currency
Long-Term IDR B
Senior Unsecured B+/RR3
Local Currency
Long-Term IDR BB–
IDR – Issuer default rating.
Rating Outlooks Long-Term Foreign Currency IDR RWN Long-Term Local Currency IDR Stable
RWN – Rating Watch Negative.
Financial Data
IRSA
(USD Mil.) 6/30/12 6/30/11 Revenue 364.4 360.5 EBITDA 212.0 190.0 Cash Flow from Operations (CFFO) 149.4 110.2 Cash and Marketable Securities 84.1 92.0 Total Debt 583.9 593.8 Total Debt/ EBITDA (x) 2.8 3.1 Net Debt/ EBITDA (x) 2.4 2.6 CFFO/ Net Debt (x) 0.3 0.2
Analysts Gabriela Catri +54 11 5235-8129 [email protected]
Jose Vertiz +1 212 908-0641 [email protected]
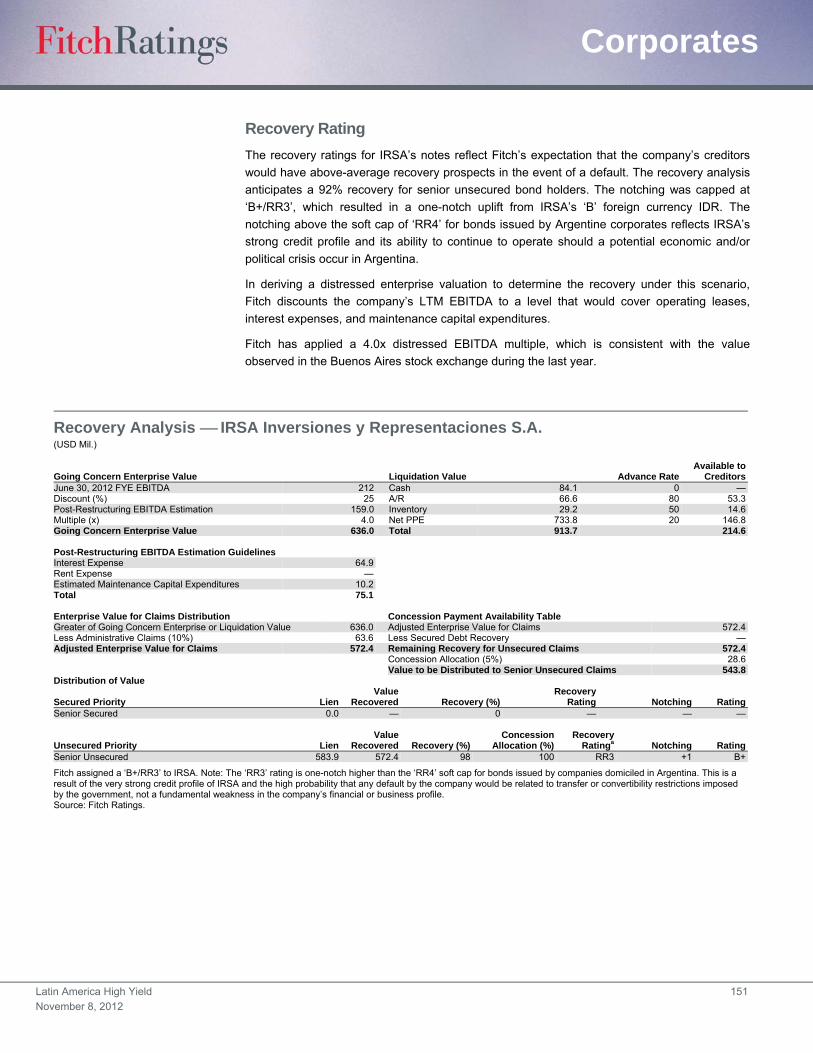
Latin America High Yield 151
November 8, 2012
Corporates
Recovery Rating
The recovery ratings for IRSA’s notes reflect Fitch’s expectation that the company’s creditors
would have above-average recovery prospects in the event of a default. The recovery analysis
anticipates a 92% recovery for senior unsecured bond holders. The notching was capped at
‘B+/RR3’, which resulted in a one-notch uplift from IRSA’s ‘B’ foreign currency IDR. The
notching above the soft cap of ‘RR4’ for bonds issued by Argentine corporates reflects IRSA’s
strong credit profile and its ability to continue to operate should a potential economic and/or
political crisis occur in Argentina.
In deriving a distressed enterprise valuation to determine the recovery under this scenario,
Fitch discounts the company’s LTM EBITDA to a level that would cover operating leases,
interest expenses, and maintenance capital expenditures.
Fitch has applied a 4.0x distressed EBITDA multiple, which is consistent with the value
observed in the Buenos Aires stock exchange during the last year.
Recovery Analysis IRSA Inversiones y Representaciones S.A. (USD Mil.)
Going Concern Enterprise Value Liquidation Value Advance RateAvailable to
CreditorsJune 30, 2012 FYE EBITDA 212 Cash 84.1 0 —Discount (%) 25 A/R 66.6 80 53.3Post-Restructuring EBITDA Estimation 159.0 Inventory 29.2 50 14.6Multiple (x) 4.0 Net PPE 733.8 20 146.8Going Concern Enterprise Value 636.0 Total 913.7 214.6 Post-Restructuring EBITDA Estimation Guidelines Interest Expense 64.9Rent Expense —Estimated Maintenance Capital Expenditures 10.2Total 75.1
Enterprise Value for Claims Distribution Concession Payment Availability Table Greater of Going Concern Enterprise or Liquidation Value 636.0 Adjusted Enterprise Value for Claims 572.4Less Administrative Claims (10%) 63.6 Less Secured Debt Recovery —Adjusted Enterprise Value for Claims 572.4 Remaining Recovery for Unsecured Claims 572.4 Concession Allocation (5%) 28.6 Value to be Distributed to Senior Unsecured Claims 543.8Distribution of Value
Secured Priority LienValue
Recovered Recovery (%)Recovery
Rating Notching RatingSenior Secured 0.0 — 0 — — —
Unsecured Priority LienValue
Recovered Recovery (%)Concession
Allocation (%)Recovery
Ratinga Notching RatingSenior Unsecured 583.9 572.4 98 100 RR3 +1 B+
Fitch assigned a ‘B+/RR3’ to IRSA. Note: The ‘RR3’ rating is one-notch higher than the ‘RR4’ soft cap for bonds issued by companies domiciled in Argentina. This is a result of the very strong credit profile of IRSA and the high probability that any default by the company would be related to transfer or convertibility restrictions imposed by the government, not a fundamental weakness in the company’s financial or business profile. Source: Fitch Ratings.
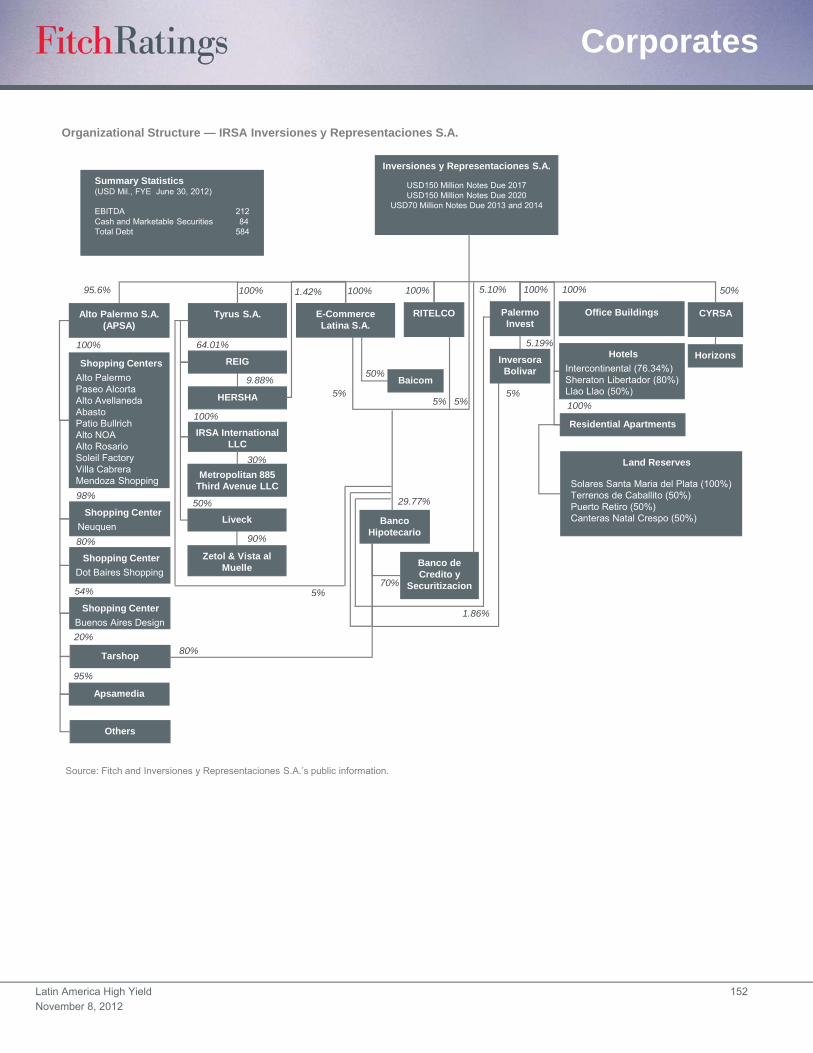
Latin America High Yield 152
November 8, 2012
Corporates
Organizational Structure — IRSA Inversiones y Representaciones S.A.
Inversiones y Representaciones S.A.
USD150 Million Notes Due 2017USD150 Million Notes Due 2020
USD70 Million Notes Due 2013 and 2014
Tyrus S.A. E-Commerce Latina S.A.
Shopping Center
Neuquen
Source: Fitch and Inversiones y Representaciones S.A.’s public information.
Shopping Centers
Alto PalermoPaseo AlcortaAlto AvellanedaAbastoPatio BullrichAlto NOAAlto RosarioSoleil FactoryVilla CabreraMendoza Shopping
70%
100%
100%
29.77%
95.6% 50%
Summary Statistics(USD Mil., FYE June 30, 2012)
EBITDA 212Cash and Marketable Securities 84Total Debt 584
Alto Palermo S.A. (APSA)
REIG
HERSHA
IRSA International LLC
Others
Apsamedia
Tarshop
Shopping Center
Dot Baires Shopping
Shopping Center
Buenos Aires Design
RITELCO
Metropolitan 885 Third Avenue LLC
Liveck
Zetol & Vista al Muelle
Baicom
Palermo Invest
Inversora Bolivar
Office Buildings
98%
80%
54%
20%
95%
9.88%
64.01%
100%
30%
50%
90%
50%
100%
Banco Hipotecario
Banco de Credito y
Securitizacion
CYRSA
HorizonsHotels
Intercontinental (76.34%)Sheraton Libertador (80%)Llao Llao (50%)
1.42%
Land Reserves
Solares Santa Maria del Plata (100%)Terrenos de Caballito (50%)Puerto Retiro (50%)Canteras Natal Crespo (50%)
Residential Apartments
5.19%
100%100%
5%
100% 100%
5% 5%
5.10%
1.86%
5%
80%
5%
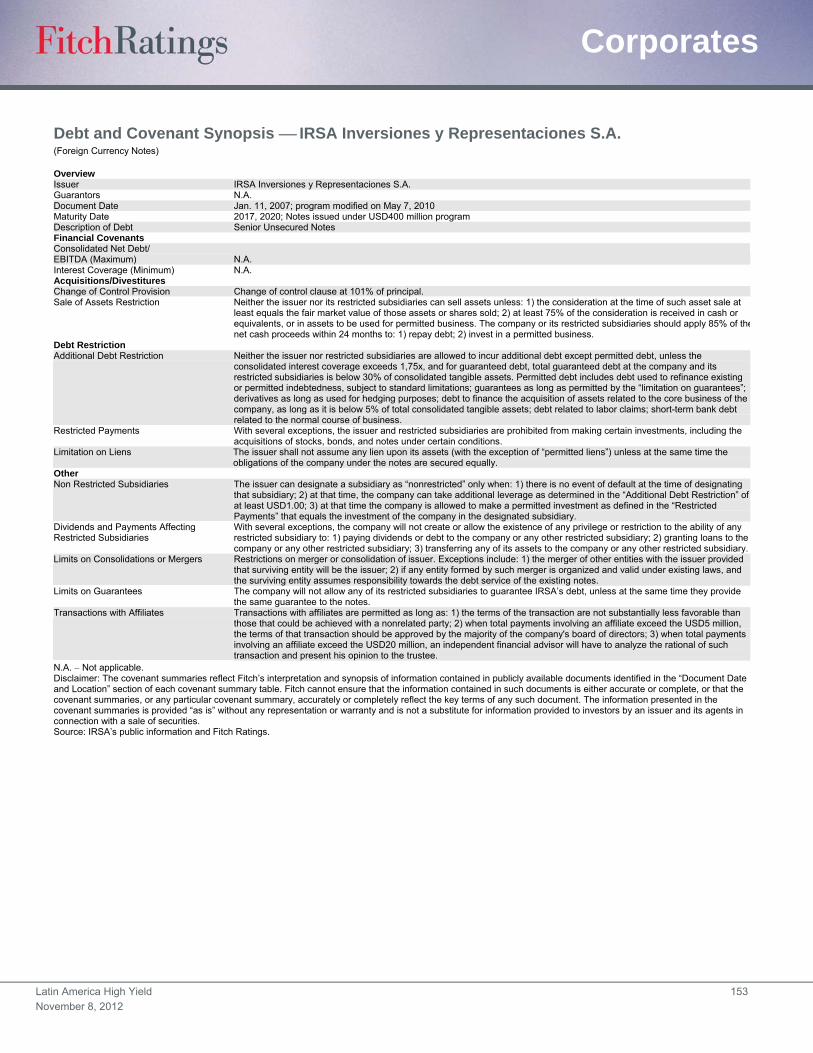
Latin America High Yield 153
November 8, 2012
Corporates
Debt and Covenant Synopsis IRSA Inversiones y Representaciones S.A. (Foreign Currency Notes)
Overview Issuer IRSA Inversiones y Representaciones S.A. Guarantors N.A. Document Date Jan. 11, 2007; program modified on May 7, 2010 Maturity Date 2017, 2020; Notes issued under USD400 million program Description of Debt Senior Unsecured Notes Financial Covenants Consolidated Net Debt/ EBITDA (Maximum) N.A. Interest Coverage (Minimum) N.A. Acquisitions/Divestitures Change of Control Provision Change of control clause at 101% of principal. Sale of Assets Restriction Neither the issuer nor its restricted subsidiaries can sell assets unless: 1) the consideration at the time of such asset sale at
least equals the fair market value of those assets or shares sold; 2) at least 75% of the consideration is received in cash or equivalents, or in assets to be used for permitted business. The company or its restricted subsidiaries should apply 85% of thenet cash proceeds within 24 months to: 1) repay debt; 2) invest in a permitted business.
Debt Restriction Additional Debt Restriction Neither the issuer nor restricted subsidiaries are allowed to incur additional debt except permitted debt, unless the
consolidated interest coverage exceeds 1,75x, and for guaranteed debt, total guaranteed debt at the company and its restricted subsidiaries is below 30% of consolidated tangible assets. Permitted debt includes debt used to refinance existing or permitted indebtedness, subject to standard limitations; guarantees as long as permitted by the “limitation on guarantees”; derivatives as long as used for hedging purposes; debt to finance the acquisition of assets related to the core business of the company, as long as it is below 5% of total consolidated tangible assets; debt related to labor claims; short-term bank debt related to the normal course of business.
Restricted Payments With several exceptions, the issuer and restricted subsidiaries are prohibited from making certain investments, including the acquisitions of stocks, bonds, and notes under certain conditions.
Limitation on Liens The issuer shall not assume any lien upon its assets (with the exception of “permitted liens”) unless at the same time the obligations of the company under the notes are secured equally.
Other Non Restricted Subsidiaries The issuer can designate a subsidiary as “nonrestricted” only when: 1) there is no event of default at the time of designating
that subsidiary; 2) at that time, the company can take additional leverage as determined in the “Additional Debt Restriction” of at least USD1.00; 3) at that time the company is allowed to make a permitted investment as defined in the “Restricted Payments” that equals the investment of the company in the designated subsidiary.
Dividends and Payments Affecting Restricted Subsidiaries
With several exceptions, the company will not create or allow the existence of any privilege or restriction to the ability of any restricted subsidiary to: 1) paying dividends or debt to the company or any other restricted subsidiary; 2) granting loans to the company or any other restricted subsidiary; 3) transferring any of its assets to the company or any other restricted subsidiary.
Limits on Consolidations or Mergers Restrictions on merger or consolidation of issuer. Exceptions include: 1) the merger of other entities with the issuer provided that surviving entity will be the issuer; 2) if any entity formed by such merger is organized and valid under existing laws, and the surviving entity assumes responsibility towards the debt service of the existing notes.
Limits on Guarantees The company will not allow any of its restricted subsidiaries to guarantee IRSA’s debt, unless at the same time they provide the same guarantee to the notes.
Transactions with Affiliates Transactions with affiliates are permitted as long as: 1) the terms of the transaction are not substantially less favorable than those that could be achieved with a nonrelated party; 2) when total payments involving an affiliate exceed the USD5 million, the terms of that transaction should be approved by the majority of the company's board of directors; 3) when total payments involving an affiliate exceed the USD20 million, an independent financial advisor will have to analyze the rational of such transaction and present his opinion to the trustee.
N.A. Not applicable. Disclaimer: The covenant summaries reflect Fitch’s interpretation and synopsis of information contained in publicly available documents identified in the “Document Date and Location” section of each covenant summary table. Fitch cannot ensure that the information contained in such documents is either accurate or complete, or that the covenant summaries, or any particular covenant summary, accurately or completely reflect the key terms of any such document. The information presented in the covenant summaries is provided “as is” without any representation or warranty and is not a substitute for information provided to investors by an issuer and its agents in connection with a sale of securities. Source: IRSA’s public information and Fitch Ratings.
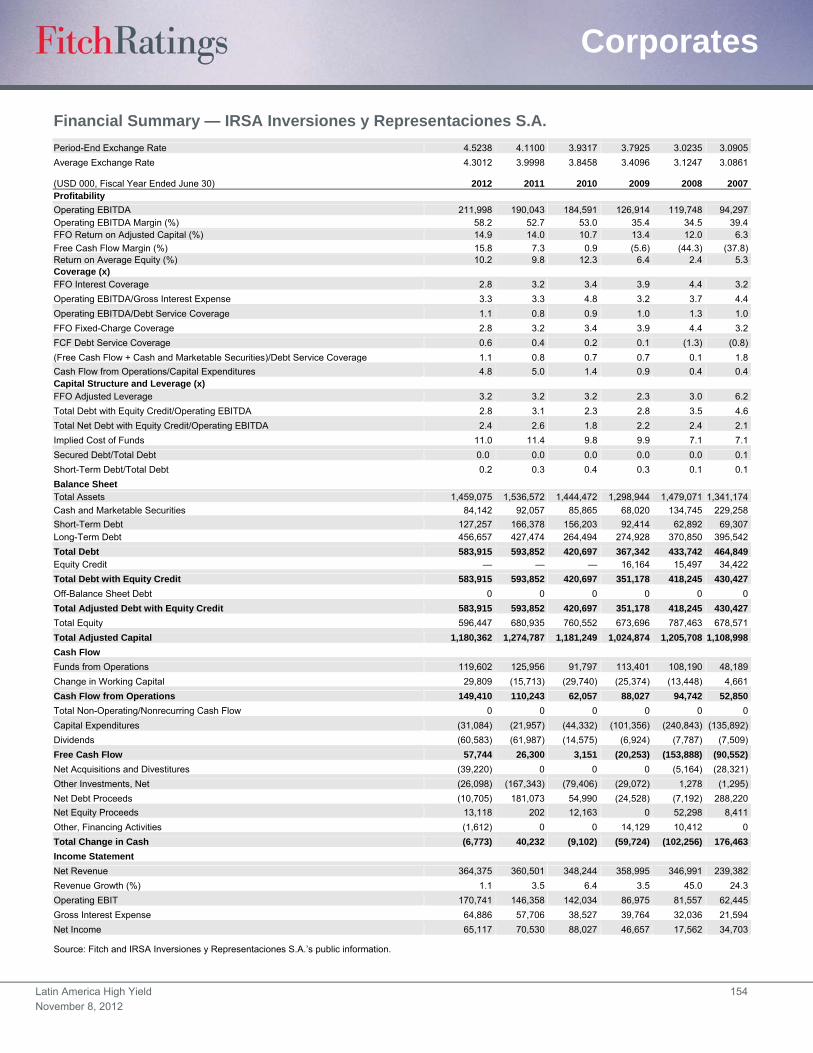
Latin America High Yield 154
November 8, 2012
Corporates
Financial Summary — IRSA Inversiones y Representaciones S.A.
Period-End Exchange Rate 4.5238 4.1100 3.9317 3.7925 3.0235 3.0905
Average Exchange Rate 4.3012 3.9998 3.8458 3.4096 3.1247 3.0861
(USD 000, Fiscal Year Ended June 30) 2012 2011 2010 2009 2008 2007Profitability
Operating EBITDA 211,998 190,043 184,591 126,914 119,748 94,297Operating EBITDA Margin (%) 58.2 52.7 53.0 35.4 34.5 39.4FFO Return on Adjusted Capital (%) 14.9 14.0 10.7 13.4 12.0 6.3
Free Cash Flow Margin (%) 15.8 7.3 0.9 (5.6) (44.3) (37.8)Return on Average Equity (%) 10.2 9.8 12.3 6.4 2.4 5.3Coverage (x) FFO Interest Coverage 2.8 3.2 3.4 3.9 4.4 3.2
Operating EBITDA/Gross Interest Expense 3.3 3.3 4.8 3.2 3.7 4.4
Operating EBITDA/Debt Service Coverage 1.1 0.8 0.9 1.0 1.3 1.0
FFO Fixed-Charge Coverage 2.8 3.2 3.4 3.9 4.4 3.2
FCF Debt Service Coverage 0.6 0.4 0.2 0.1 (1.3) (0.8)
(Free Cash Flow + Cash and Marketable Securities)/Debt Service Coverage 1.1 0.8 0.7 0.7 0.1 1.8
Cash Flow from Operations/Capital Expenditures 4.8 5.0 1.4 0.9 0.4 0.4Capital Structure and Leverage (x) FFO Adjusted Leverage 3.2 3.2 3.2 2.3 3.0 6.2
Total Debt with Equity Credit/Operating EBITDA 2.8 3.1 2.3 2.8 3.5 4.6
Total Net Debt with Equity Credit/Operating EBITDA 2.4 2.6 1.8 2.2 2.4 2.1
Implied Cost of Funds 11.0 11.4 9.8 9.9 7.1 7.1
Secured Debt/Total Debt 0.0 0.0 0.0 0.0 0.0 0.1
Short-Term Debt/Total Debt 0.2 0.3 0.4 0.3 0.1 0.1
Balance Sheet Total Assets 1,459,075 1,536,572 1,444,472 1,298,944 1,479,071 1,341,174
Cash and Marketable Securities 84,142 92,057 85,865 68,020 134,745 229,258
Short-Term Debt 127,257 166,378 156,203 92,414 62,892 69,307 Long-Term Debt 456,657 427,474 264,494 274,928 370,850 395,542
Total Debt 583,915 593,852 420,697 367,342 433,742 464,849 Equity Credit — — — 16,164 15,497 34,422
Total Debt with Equity Credit 583,915 593,852 420,697 351,178 418,245 430,427
Off-Balance Sheet Debt 0 0 0 0 0 0
Total Adjusted Debt with Equity Credit 583,915 593,852 420,697 351,178 418,245 430,427
Total Equity 596,447 680,935 760,552 673,696 787,463 678,571
Total Adjusted Capital 1,180,362 1,274,787 1,181,249 1,024,874 1,205,708 1,108,998
Cash Flow
Funds from Operations 119,602 125,956 91,797 113,401 108,190 48,189
Change in Working Capital 29,809 (15,713) (29,740) (25,374) (13,448) 4,661
Cash Flow from Operations 149,410 110,243 62,057 88,027 94,742 52,850
Total Non-Operating/Nonrecurring Cash Flow 0 0 0 0 0 0
Capital Expenditures (31,084) (21,957) (44,332) (101,356) (240,843) (135,892)
Dividends (60,583) (61,987) (14,575) (6,924) (7,787) (7,509)
Free Cash Flow 57,744 26,300 3,151 (20,253) (153,888) (90,552)
Net Acquisitions and Divestitures (39,220) 0 0 0 (5,164) (28,321)
Other Investments, Net (26,098) (167,343) (79,406) (29,072) 1,278 (1,295)
Net Debt Proceeds (10,705) 181,073 54,990 (24,528) (7,192) 288,220
Net Equity Proceeds 13,118 202 12,163 0 52,298 8,411
Other, Financing Activities (1,612) 0 0 14,129 10,412 0
Total Change in Cash (6,773) 40,232 (9,102) (59,724) (102,256) 176,463
Income Statement
Net Revenue 364,375 360,501 348,244 358,995 346,991 239,382
Revenue Growth (%) 1.1 3.5 6.4 3.5 45.0 24.3
Operating EBIT 170,741 146,358 142,034 86,975 81,557 62,445
Gross Interest Expense 64,886 57,706 38,527 39,764 32,036 21,594
Net Income 65,117 70,530 88,027 46,657 17,562 34,703
Source: Fitch and IRSA Inversiones y Representaciones S.A.’s public information.
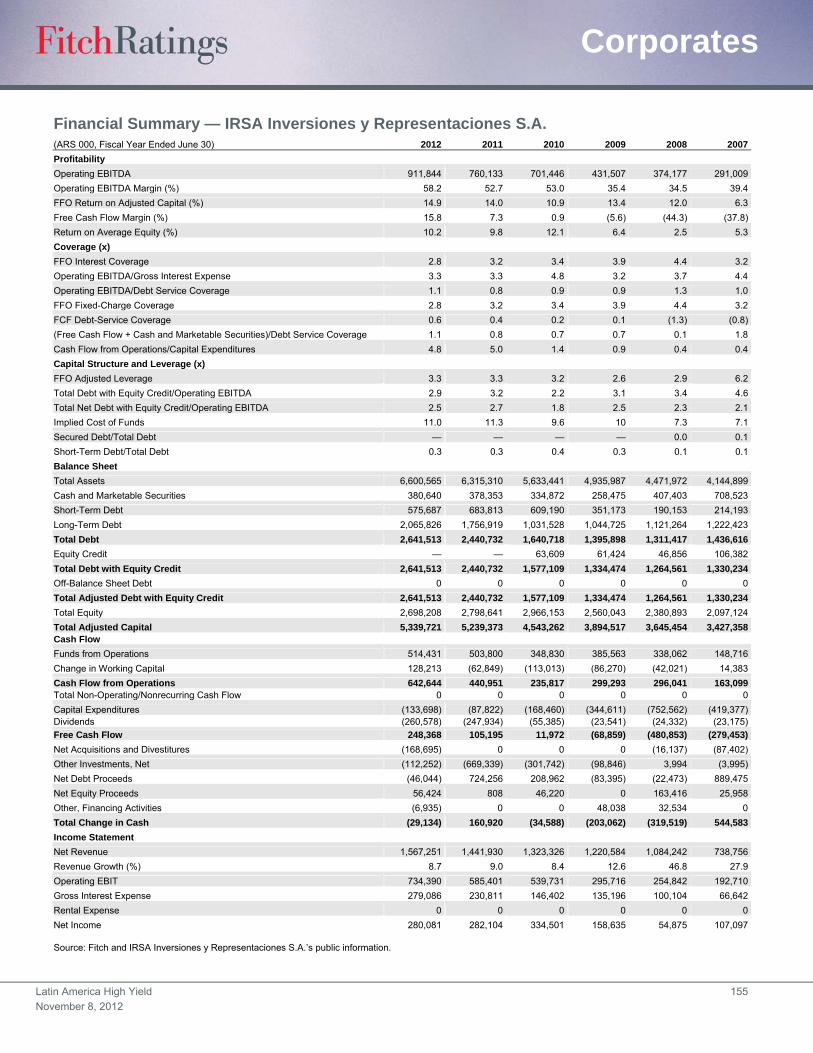
Latin America High Yield 155
November 8, 2012
Corporates
Financial Summary — IRSA Inversiones y Representaciones S.A. (ARS 000, Fiscal Year Ended June 30) 2012 2011 2010 2009 2008 2007
Profitability
Operating EBITDA 911,844 760,133 701,446 431,507 374,177 291,009
Operating EBITDA Margin (%) 58.2 52.7 53.0 35.4 34.5 39.4
FFO Return on Adjusted Capital (%) 14.9 14.0 10.9 13.4 12.0 6.3
Free Cash Flow Margin (%) 15.8 7.3 0.9 (5.6) (44.3) (37.8)
Return on Average Equity (%) 10.2 9.8 12.1 6.4 2.5 5.3
Coverage (x)
FFO Interest Coverage 2.8 3.2 3.4 3.9 4.4 3.2
Operating EBITDA/Gross Interest Expense 3.3 3.3 4.8 3.2 3.7 4.4
Operating EBITDA/Debt Service Coverage 1.1 0.8 0.9 0.9 1.3 1.0
FFO Fixed-Charge Coverage 2.8 3.2 3.4 3.9 4.4 3.2
FCF Debt-Service Coverage 0.6 0.4 0.2 0.1 (1.3) (0.8)
(Free Cash Flow + Cash and Marketable Securities)/Debt Service Coverage 1.1 0.8 0.7 0.7 0.1 1.8
Cash Flow from Operations/Capital Expenditures 4.8 5.0 1.4 0.9 0.4 0.4
Capital Structure and Leverage (x)
FFO Adjusted Leverage 3.3 3.3 3.2 2.6 2.9 6.2
Total Debt with Equity Credit/Operating EBITDA 2.9 3.2 2.2 3.1 3.4 4.6
Total Net Debt with Equity Credit/Operating EBITDA 2.5 2.7 1.8 2.5 2.3 2.1
Implied Cost of Funds 11.0 11.3 9.6 10 7.3 7.1
Secured Debt/Total Debt — — — — 0.0 0.1
Short-Term Debt/Total Debt 0.3 0.3 0.4 0.3 0.1 0.1
Balance Sheet
Total Assets 6,600,565 6,315,310 5,633,441 4,935,987 4,471,972 4,144,899
Cash and Marketable Securities 380,640 378,353 334,872 258,475 407,403 708,523
Short-Term Debt 575,687 683,813 609,190 351,173 190,153 214,193
Long-Term Debt 2,065,826 1,756,919 1,031,528 1,044,725 1,121,264 1,222,423
Total Debt 2,641,513 2,440,732 1,640,718 1,395,898 1,311,417 1,436,616
Equity Credit — — 63,609 61,424 46,856 106,382
Total Debt with Equity Credit 2,641,513 2,440,732 1,577,109 1,334,474 1,264,561 1,330,234
Off-Balance Sheet Debt 0 0 0 0 0 0
Total Adjusted Debt with Equity Credit 2,641,513 2,440,732 1,577,109 1,334,474 1,264,561 1,330,234
Total Equity 2,698,208 2,798,641 2,966,153 2,560,043 2,380,893 2,097,124
Total Adjusted Capital 5,339,721 5,239,373 4,543,262 3,894,517 3,645,454 3,427,358 Cash Flow
Funds from Operations 514,431 503,800 348,830 385,563 338,062 148,716
Change in Working Capital 128,213 (62,849) (113,013) (86,270) (42,021) 14,383
Cash Flow from Operations 642,644 440,951 235,817 299,293 296,041 163,099 Total Non-Operating/Nonrecurring Cash Flow 0 0 0 0 0 0
Capital Expenditures (133,698) (87,822) (168,460) (344,611) (752,562) (419,377)Dividends (260,578) (247,934) (55,385) (23,541) (24,332) (23,175)
Free Cash Flow 248,368 105,195 11,972 (68,859) (480,853) (279,453)
Net Acquisitions and Divestitures (168,695) 0 0 0 (16,137) (87,402)
Other Investments, Net (112,252) (669,339) (301,742) (98,846) 3,994 (3,995)
Net Debt Proceeds (46,044) 724,256 208,962 (83,395) (22,473) 889,475
Net Equity Proceeds 56,424 808 46,220 0 163,416 25,958
Other, Financing Activities (6,935) 0 0 48,038 32,534 0
Total Change in Cash (29,134) 160,920 (34,588) (203,062) (319,519) 544,583
Income Statement
Net Revenue 1,567,251 1,441,930 1,323,326 1,220,584 1,084,242 738,756
Revenue Growth (%) 8.7 9.0 8.4 12.6 46.8 27.9
Operating EBIT 734,390 585,401 539,731 295,716 254,842 192,710
Gross Interest Expense 279,086 230,811 146,402 135,196 100,104 66,642
Rental Expense 0 0 0 0 0 0
Net Income 280,081 282,104 334,501 158,635 54,875 107,097
Source: Fitch and IRSA Inversiones y Representaciones S.A.’s public information.
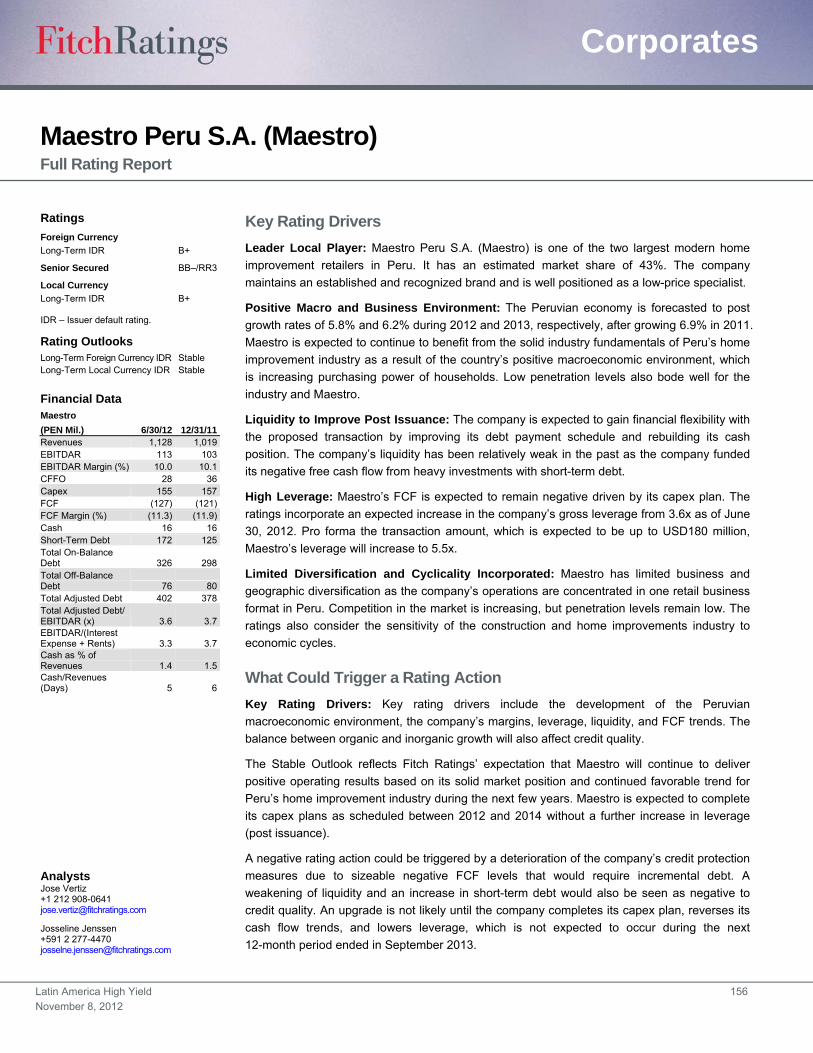
Latin America High Yield 156
November 8, 2012
Corporates
Maestro Peru S.A. (Maestro) Full Rating Report
Key Rating Drivers
Leader Local Player: Maestro Peru S.A. (Maestro) is one of the two largest modern home
improvement retailers in Peru. It has an estimated market share of 43%. The company
maintains an established and recognized brand and is well positioned as a low-price specialist.
Positive Macro and Business Environment: The Peruvian economy is forecasted to post
growth rates of 5.8% and 6.2% during 2012 and 2013, respectively, after growing 6.9% in 2011.
Maestro is expected to continue to benefit from the solid industry fundamentals of Peru’s home
improvement industry as a result of the country’s positive macroeconomic environment, which
is increasing purchasing power of households. Low penetration levels also bode well for the
industry and Maestro.
Liquidity to Improve Post Issuance: The company is expected to gain financial flexibility with
the proposed transaction by improving its debt payment schedule and rebuilding its cash
position. The company’s liquidity has been relatively weak in the past as the company funded
its negative free cash flow from heavy investments with short-term debt.
High Leverage: Maestro’s FCF is expected to remain negative driven by its capex plan. The
ratings incorporate an expected increase in the company’s gross leverage from 3.6x as of June
30, 2012. Pro forma the transaction amount, which is expected to be up to USD180 million,
Maestro’s leverage will increase to 5.5x.
Limited Diversification and Cyclicality Incorporated: Maestro has limited business and
geographic diversification as the company’s operations are concentrated in one retail business
format in Peru. Competition in the market is increasing, but penetration levels remain low. The
ratings also consider the sensitivity of the construction and home improvements industry to
economic cycles.
What Could Trigger a Rating Action
Key Rating Drivers: Key rating drivers include the development of the Peruvian
macroeconomic environment, the company’s margins, leverage, liquidity, and FCF trends. The
balance between organic and inorganic growth will also affect credit quality.
The Stable Outlook reflects Fitch Ratings’ expectation that Maestro will continue to deliver
positive operating results based on its solid market position and continued favorable trend for
Peru’s home improvement industry during the next few years. Maestro is expected to complete
its capex plans as scheduled between 2012 and 2014 without a further increase in leverage
(post issuance).
A negative rating action could be triggered by a deterioration of the company’s credit protection
measures due to sizeable negative FCF levels that would require incremental debt. A
weakening of liquidity and an increase in short-term debt would also be seen as negative to
credit quality. An upgrade is not likely until the company completes its capex plan, reverses its
cash flow trends, and lowers leverage, which is not expected to occur during the next
12-month period ended in September 2013.
Ratings
Foreign Currency
Long-Term IDR B+
Senior Secured BB–/RR3
Local Currency
Long-Term IDR B+
IDR – Issuer default rating.
Rating Outlooks Long-Term Foreign Currency IDR Stable Long-Term Local Currency IDR Stable
Financial Data Maestro
(PEN Mil.) 6/30/12 12/31/11 Revenues 1,128 1,019 EBITDAR 113 103 EBITDAR Margin (%) 10.0 10.1 CFFO 28 36 Capex 155 157 FCF (127) (121) FCF Margin (%) (11.3) (11.9) Cash 16 16 Short-Term Debt 172 125 Total On-Balance Debt 326 298 Total Off-Balance Debt 76 80 Total Adjusted Debt 402 378 Total Adjusted Debt/ EBITDAR (x) 3.6 3.7 EBITDAR/(Interest Expense + Rents) 3.3 3.7 Cash as % of Revenues 1.4 1.5 Cash/Revenues (Days) 5 6
Analysts Jose Vertiz +1 212 908-0641 [email protected]
Josseline Jenssen +591 2 277-4470 [email protected]
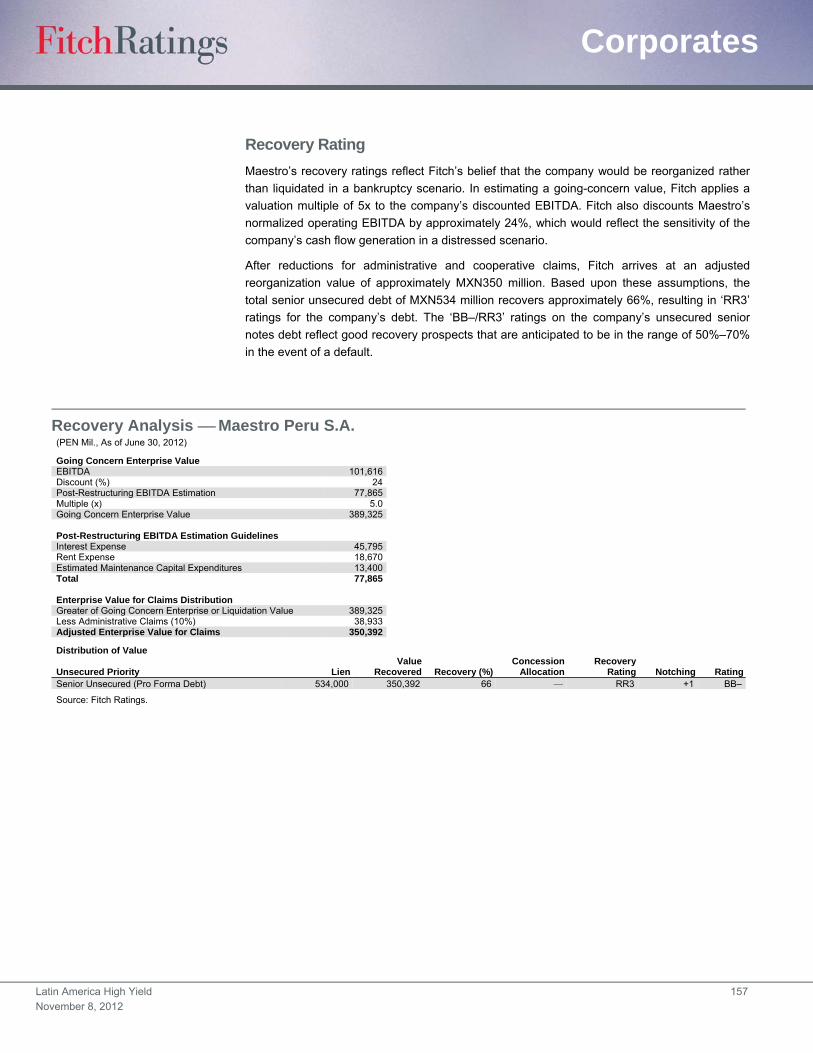
Latin America High Yield 157
November 8, 2012
Corporates
Recovery Rating
Maestro’s recovery ratings reflect Fitch’s belief that the company would be reorganized rather
than liquidated in a bankruptcy scenario. In estimating a going-concern value, Fitch applies a
valuation multiple of 5x to the company’s discounted EBITDA. Fitch also discounts Maestro’s
normalized operating EBITDA by approximately 24%, which would reflect the sensitivity of the
company’s cash flow generation in a distressed scenario.
After reductions for administrative and cooperative claims, Fitch arrives at an adjusted
reorganization value of approximately MXN350 million. Based upon these assumptions, the
total senior unsecured debt of MXN534 million recovers approximately 66%, resulting in ‘RR3’
ratings for the company’s debt. The ‘BB–/RR3’ ratings on the company’s unsecured senior
notes debt reflect good recovery prospects that are anticipated to be in the range of 50%–70%
in the event of a default.
Recovery Analysis Maestro Peru S.A. (PEN Mil., As of June 30, 2012)
Going Concern Enterprise Value EBITDA 101,616 Discount (%) 24 Post-Restructuring EBITDA Estimation 77,865 Multiple (x) 5.0 Going Concern Enterprise Value 389,325 Post-Restructuring EBITDA Estimation Guidelines Interest Expense 45,795 Rent Expense 18,670 Estimated Maintenance Capital Expenditures 13,400 Total 77,865 Enterprise Value for Claims Distribution Greater of Going Concern Enterprise or Liquidation Value 389,325Less Administrative Claims (10%) 38,933Adjusted Enterprise Value for Claims 350,392
Distribution of Value
Unsecured Priority LienValue
Recovered Recovery (%)Concession
AllocationRecovery
Rating Notching RatingSenior Unsecured (Pro Forma Debt) 534,000 350,392 66 RR3 +1 BB–
Source: Fitch Ratings.
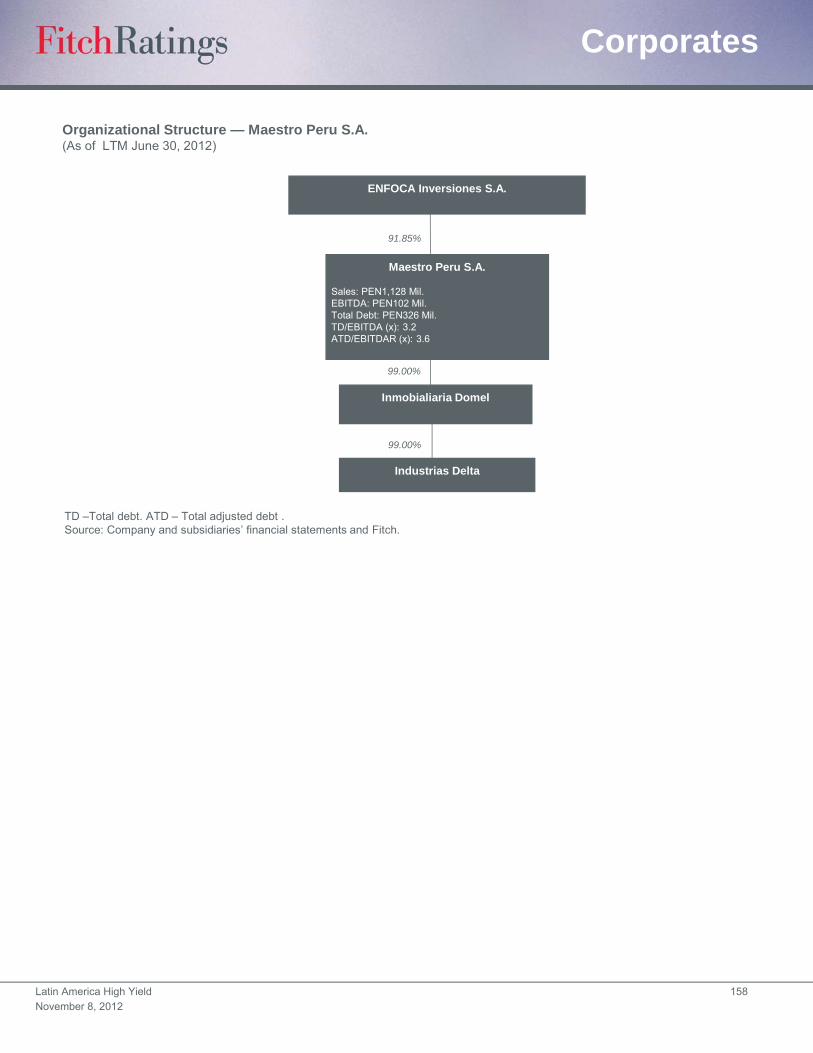
Latin America High Yield 158
November 8, 2012
Corporates
Organizational Structure — Maestro Peru S.A.(As of LTM June 30, 2012)
TD –Total debt. ATD – Total adjusted debt .Source: Company and subsidiaries’ financial statements and Fitch.
99%
ENFOCA Inversiones S.A.
Maestro Peru S.A.
Sales: PEN1,128 Mil. EBITDA: PEN102 Mil.Total Debt: PEN326 Mil.TD/EBITDA (x): 3.2ATD/EBITDAR (x): 3.6
Inmobialiaria Domel
91.85%
Industrias Delta
99.00%
99.00%
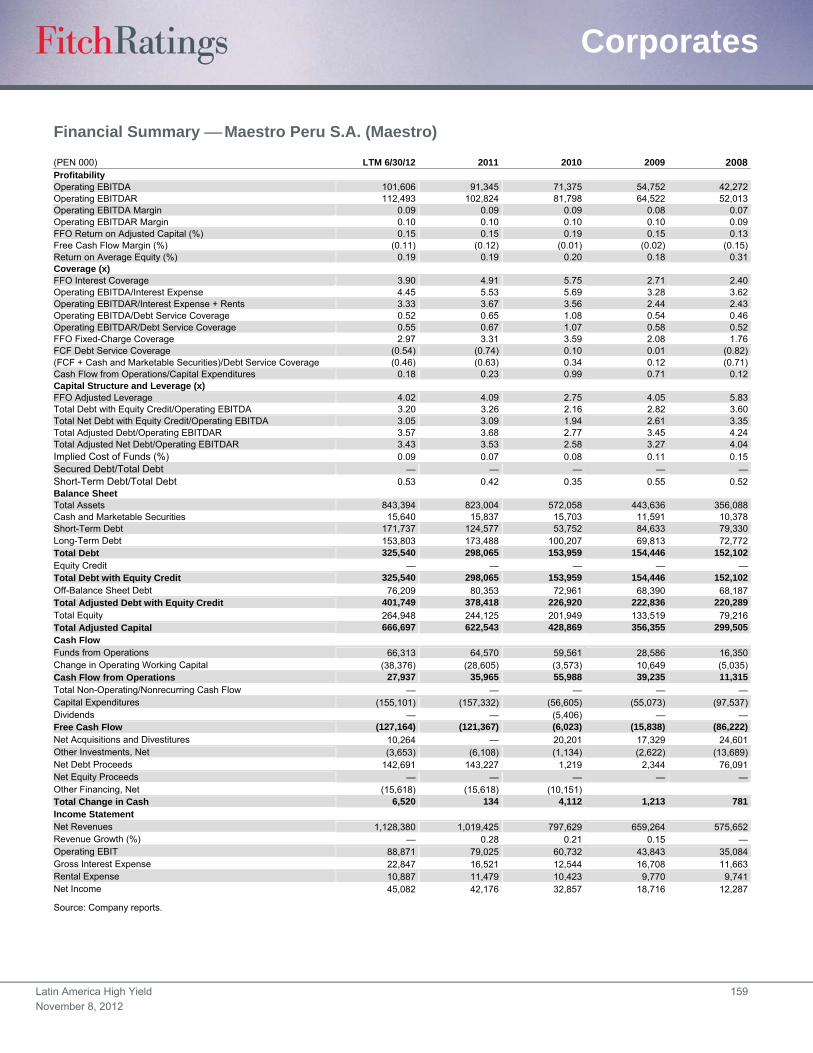
Latin America High Yield 159
November 8, 2012
Corporates
Financial Summary Maestro Peru S.A. (Maestro)
(PEN 000) LTM 6/30/12 2011 2010 2009 2008Profitability Operating EBITDA 101,606 91,345 71,375 54,752 42,272Operating EBITDAR 112,493 102,824 81,798 64,522 52,013Operating EBITDA Margin 0.09 0.09 0.09 0.08 0.07Operating EBITDAR Margin 0.10 0.10 0.10 0.10 0.09FFO Return on Adjusted Capital (%) 0.15 0.15 0.19 0.15 0.13Free Cash Flow Margin (%) (0.11) (0.12) (0.01) (0.02) (0.15)Return on Average Equity (%) 0.19 0.19 0.20 0.18 0.31Coverage (x) FFO Interest Coverage 3.90 4.91 5.75 2.71 2.40Operating EBITDA/Interest Expense 4.45 5.53 5.69 3.28 3.62Operating EBITDAR/Interest Expense + Rents 3.33 3.67 3.56 2.44 2.43Operating EBITDA/Debt Service Coverage 0.52 0.65 1.08 0.54 0.46Operating EBITDAR/Debt Service Coverage 0.55 0.67 1.07 0.58 0.52FFO Fixed-Charge Coverage 2.97 3.31 3.59 2.08 1.76FCF Debt Service Coverage (0.54) (0.74) 0.10 0.01 (0.82)(FCF + Cash and Marketable Securities)/Debt Service Coverage (0.46) (0.63) 0.34 0.12 (0.71)Cash Flow from Operations/Capital Expenditures 0.18 0.23 0.99 0.71 0.12Capital Structure and Leverage (x) FFO Adjusted Leverage 4.02 4.09 2.75 4.05 5.83Total Debt with Equity Credit/Operating EBITDA 3.20 3.26 2.16 2.82 3.60Total Net Debt with Equity Credit/Operating EBITDA 3.05 3.09 1.94 2.61 3.35Total Adjusted Debt/Operating EBITDAR 3.57 3.68 2.77 3.45 4.24Total Adjusted Net Debt/Operating EBITDAR 3.43 3.53 2.58 3.27 4.04Implied Cost of Funds (%) 0.09 0.07 0.08 0.11 0.15Secured Debt/Total Debt — — — — —Short-Term Debt/Total Debt 0.53 0.42 0.35 0.55 0.52Balance Sheet Total Assets 843,394 823,004 572,058 443,636 356,088Cash and Marketable Securities 15,640 15,837 15,703 11,591 10,378Short-Term Debt 171,737 124,577 53,752 84,633 79,330Long-Term Debt 153,803 173,488 100,207 69,813 72,772Total Debt 325,540 298,065 153,959 154,446 152,102Equity Credit — — — — —Total Debt with Equity Credit 325,540 298,065 153,959 154,446 152,102Off-Balance Sheet Debt 76,209 80,353 72,961 68,390 68,187Total Adjusted Debt with Equity Credit 401,749 378,418 226,920 222,836 220,289Total Equity 264,948 244,125 201,949 133,519 79,216Total Adjusted Capital 666,697 622,543 428,869 356,355 299,505Cash Flow Funds from Operations 66,313 64,570 59,561 28,586 16,350Change in Operating Working Capital (38,376) (28,605) (3,573) 10,649 (5,035)Cash Flow from Operations 27,937 35,965 55,988 39,235 11,315Total Non-Operating/Nonrecurring Cash Flow — — — — —Capital Expenditures (155,101) (157,332) (56,605) (55,073) (97,537)Dividends — — (5,406) — —Free Cash Flow (127,164) (121,367) (6,023) (15,838) (86,222)Net Acquisitions and Divestitures 10,264 — 20,201 17,329 24,601Other Investments, Net (3,653) (6,108) (1,134) (2,622) (13,689)Net Debt Proceeds 142,691 143,227 1,219 2,344 76,091Net Equity Proceeds — — — — —Other Financing, Net (15,618) (15,618) (10,151) Total Change in Cash 6,520 134 4,112 1,213 781Income Statement Net Revenues 1,128,380 1,019,425 797,629 659,264 575,652Revenue Growth (%) — 0.28 0.21 0.15 —Operating EBIT 88,871 79,025 60,732 43,843 35,084Gross Interest Expense 22,847 16,521 12,544 16,708 11,663Rental Expense 10,887 11,479 10,423 9,770 9,741Net Income 45,082 42,176 32,857 18,716 12,287
Source: Company reports.
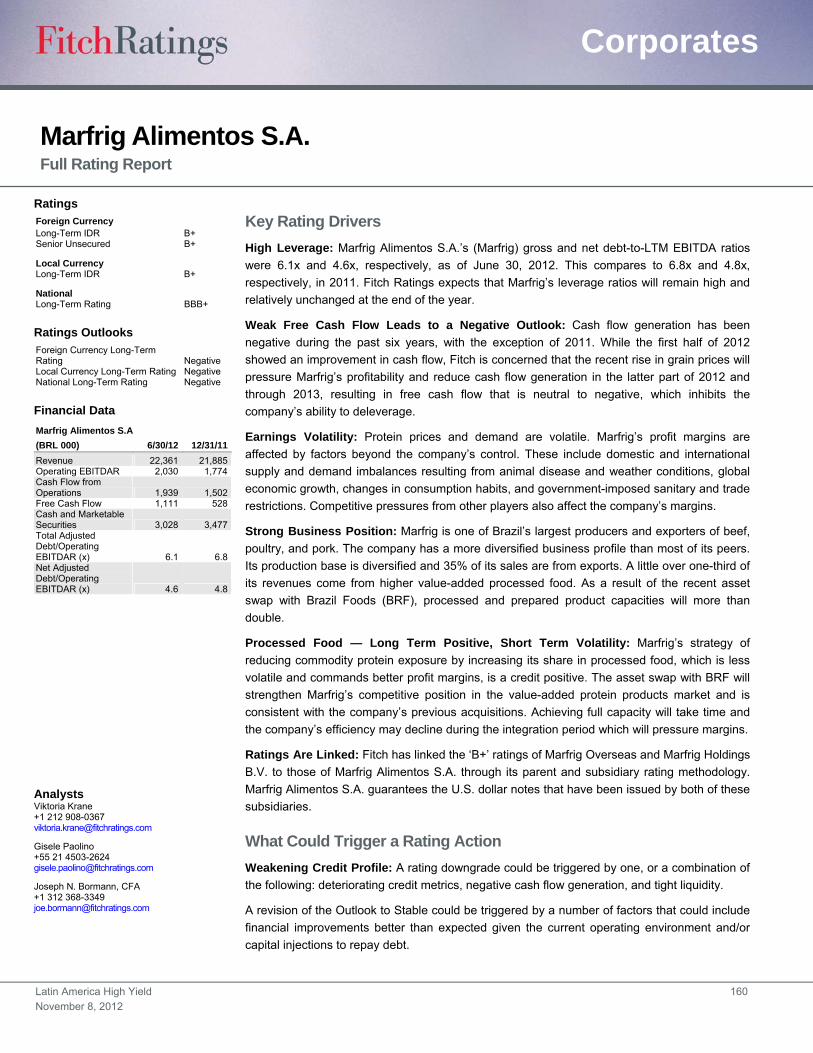
Latin America High Yield 160
November 8, 2012
Corporates
Marfrig Alimentos S.A. Full Rating Report
Key Rating Drivers
High Leverage: Marfrig Alimentos S.A.’s (Marfrig) gross and net debt-to-LTM EBITDA ratios
were 6.1x and 4.6x, respectively, as of June 30, 2012. This compares to 6.8x and 4.8x,
respectively, in 2011. Fitch Ratings expects that Marfrig’s leverage ratios will remain high and
relatively unchanged at the end of the year.
Weak Free Cash Flow Leads to a Negative Outlook: Cash flow generation has been
negative during the past six years, with the exception of 2011. While the first half of 2012
showed an improvement in cash flow, Fitch is concerned that the recent rise in grain prices will
pressure Marfrig’s profitability and reduce cash flow generation in the latter part of 2012 and
through 2013, resulting in free cash flow that is neutral to negative, which inhibits the
company’s ability to deleverage.
Earnings Volatility: Protein prices and demand are volatile. Marfrig’s profit margins are
affected by factors beyond the company’s control. These include domestic and international
supply and demand imbalances resulting from animal disease and weather conditions, global
economic growth, changes in consumption habits, and government-imposed sanitary and trade
restrictions. Competitive pressures from other players also affect the company’s margins.
Strong Business Position: Marfrig is one of Brazil’s largest producers and exporters of beef,
poultry, and pork. The company has a more diversified business profile than most of its peers.
Its production base is diversified and 35% of its sales are from exports. A little over one-third of
its revenues come from higher value-added processed food. As a result of the recent asset
swap with Brazil Foods (BRF), processed and prepared product capacities will more than
double.
Processed Food — Long Term Positive, Short Term Volatility: Marfrig’s strategy of
reducing commodity protein exposure by increasing its share in processed food, which is less
volatile and commands better profit margins, is a credit positive. The asset swap with BRF will
strengthen Marfrig’s competitive position in the value-added protein products market and is
consistent with the company’s previous acquisitions. Achieving full capacity will take time and
the company’s efficiency may decline during the integration period which will pressure margins.
Ratings Are Linked: Fitch has linked the ‘B+’ ratings of Marfrig Overseas and Marfrig Holdings
B.V. to those of Marfrig Alimentos S.A. through its parent and subsidiary rating methodology.
Marfrig Alimentos S.A. guarantees the U.S. dollar notes that have been issued by both of these
subsidiaries.
What Could Trigger a Rating Action
Weakening Credit Profile: A rating downgrade could be triggered by one, or a combination of
the following: deteriorating credit metrics, negative cash flow generation, and tight liquidity.
A revision of the Outlook to Stable could be triggered by a number of factors that could include
financial improvements better than expected given the current operating environment and/or
capital injections to repay debt.
Ratings Foreign Currency Long-Term IDR B+ Senior Unsecured B+
Local Currency Long-Term IDR B+
National Long-Term Rating BBB+
Ratings Outlooks
Foreign Currency Long-Term Rating Negative Local Currency Long-Term Rating Negative National Long-Term Rating Negative
Financial Data
Marfrig Alimentos S.A
(BRL 000) 6/30/12 12/31/11
Revenue 22,361 21,885 Operating EBITDAR 2,030 1,774 Cash Flow from Operations 1,939 1,502 Free Cash Flow 1,111 528 Cash and Marketable Securities 3,028 3,477 Total Adjusted Debt/Operating EBITDAR (x) 6.1 6.8 Net Adjusted Debt/Operating EBITDAR (x) 4.6 4.8
Analysts Viktoria Krane +1 212 908-0367 [email protected]
Gisele Paolino +55 21 4503-2624 [email protected]
Joseph N. Bormann, CFA +1 312 368-3349 [email protected]

Latin America High Yield 161
November 8, 2012
Corporates
Recovery Worksheet
Marfrig’s recovery rating of ‘RR4’ indicates that the company’s creditors would have average
recovery prospects in the range of 31%–50% of current principal and related interest in the
event of default.
Fitch has performed a liquidation analysis in the event of bankruptcy. Fitch has also estimated
the enterprise valuation in the event of financial distress. This analysis considers that any debt
default by Marfrig would likely be the result of a sudden deterioration in the business
environment either by import ban on Brazilian meat due to health considerations by a
considerable number of export countries, or by a sharp reduction in meat consumption due to
economic distress abroad. It also considers that company operations will remain valuable, but
at a relatively low multiple of 5x. The bespoke Marfrig recovery analysis suggests a higher
recovery level for the senior unsecured debt that would be consistent with very high recovery
levels. Fitch has capped the company’s recovery at RR4 due to concerns about recovery
prospects for companies domiciled in Brazil.
Recovery Analysis Marfrig Alimentos S.A. (BRL Mil.)
IDR: B+
Going Concern Enterprise Value Liquidation Value Advance Rate
(%)Available to
CreditorsJune 30, 2012 LTM EBITDA 2,030.1 Cash 3,028.4 0 Discount (%) 25 Accounts Receivable 1,105.6 80 884.5 Post-Restructuring EBITDA Estimation 1,522.6 Inventory 2,414.9 50 1,207.4 Multiple (x) 5.0 Net PPE 7,618.3 25 1,904.6 Going Concern Enterprise Value 7,612.9 Total 14,167.1 3,996.5
Post-Restructuring EBITDA Estimation Guidelines Interest Expense (1,300.0) Rent Expense Estimated Maintenance Capital Expenditures (300.0) Total (1,600.0)
Enterprise Value for Claims Distribution Concession Payment Availability Table Greater of Going Concern Enterprise or Liquidation Value 7,612.9 Adjusted Enterprise Value for Claims 6,851.6 Less Administrative Claims (10%) 761.3 Less Secured Debt Recovery 544.8 Adjusted Enterprise Value for Claims 6,851.6 Remaining Recovery for Unsecured Claims 6,306.8 Distribution of Value
Secured Priority LienValue
Recovered Recovery (%)Recovery
Rating Notching Rating Senior Secured 0.0 0 — Secured 544.8 544.8 100 RR1 +3 BB+
Unsecured Priority Lien Value
Recovered Recovery (%)Concession
Allocation (%) Recovery
Rating Notching RatingSenior Unsecured 3,193.0 3,193.0 100 100 RR1 +3 BB+Unsecured 7,157.4 2,798.5 39 0 RR4 0 B+Convertible Debentures 594.0 0 0 RR6 2 BJunior Subordinated 0.0 0 0
Source: Fitch.
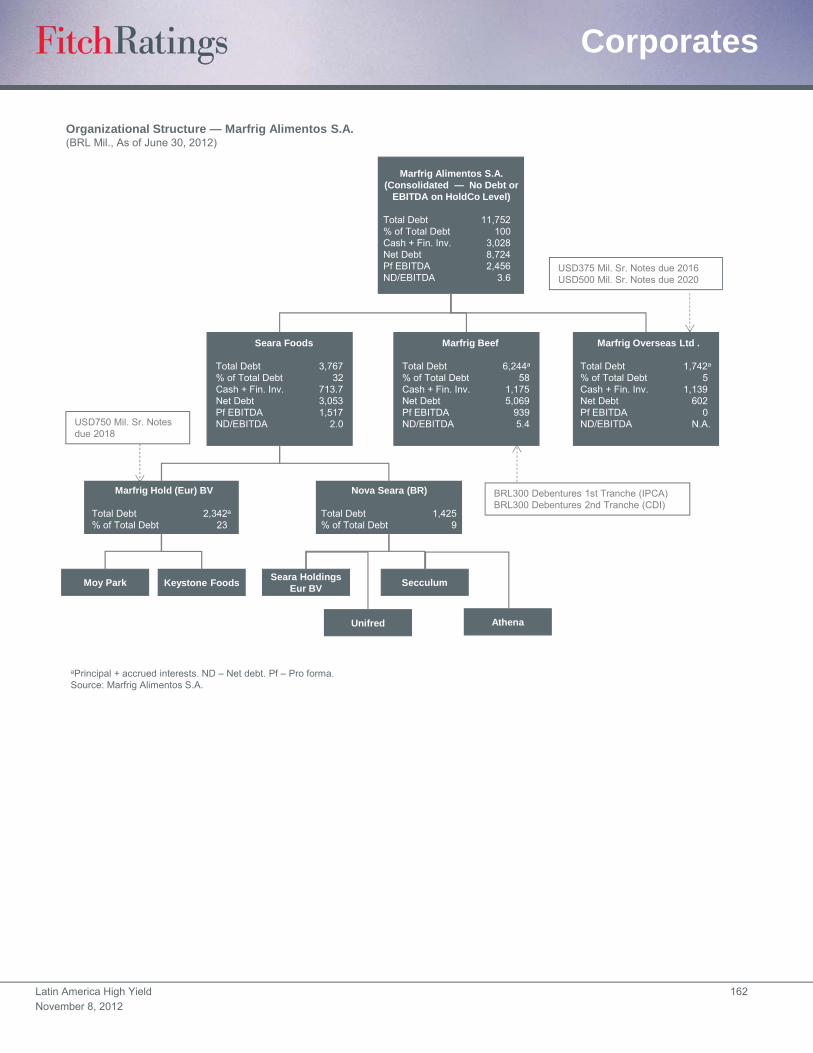
Latin America High Yield 162
November 8, 2012
Corporates
Organizational Structure — Marfrig Alimentos S.A.(BRL Mil., As of June 30, 2012)
aPrincipal + accrued interests. ND – Net debt. Pf – Pro forma.Source: Marfrig Alimentos S.A.
Marfrig Alimentos S.A.(Consolidated — No Debt or
EBITDA on HoldCo Level)
Total Debt 11,752% of Total Debt 100Cash + Fin. Inv. 3,028Net Debt 8,724Pf EBITDA 2,456ND/EBITDA 3.6
Seara Foods
Total Debt 3,767% of Total Debt 32Cash + Fin. Inv. 713.7Net Debt 3,053Pf EBITDA 1,517ND/EBITDA 2.0
Marfrig Hold (Eur) BV
Total Debt 2,342a
% of Total Debt 23
Nova Seara (BR)
Total Debt 1,425% of Total Debt 9
Marfrig Beef
Total Debt 6,244a
% of Total Debt 58Cash + Fin. Inv. 1,175Net Debt 5,069Pf EBITDA 939ND/EBITDA 5.4
Marfrig Overseas Ltd .
Total Debt 1,742a
% of Total Debt 5Cash + Fin. Inv. 1,139Net Debt 602Pf EBITDA 0ND/EBITDA N.A.
Seara Holdings Eur BV
Keystone FoodsMoy Park
Unifred
Secculum
Athena
USD375 Mil. Sr. Notes due 2016 USD500 Mil. Sr. Notes due 2020
BRL300 Debentures 1st Tranche (IPCA) BRL300 Debentures 2nd Tranche (CDI)
USD750 Mil. Sr. Notes due 2018
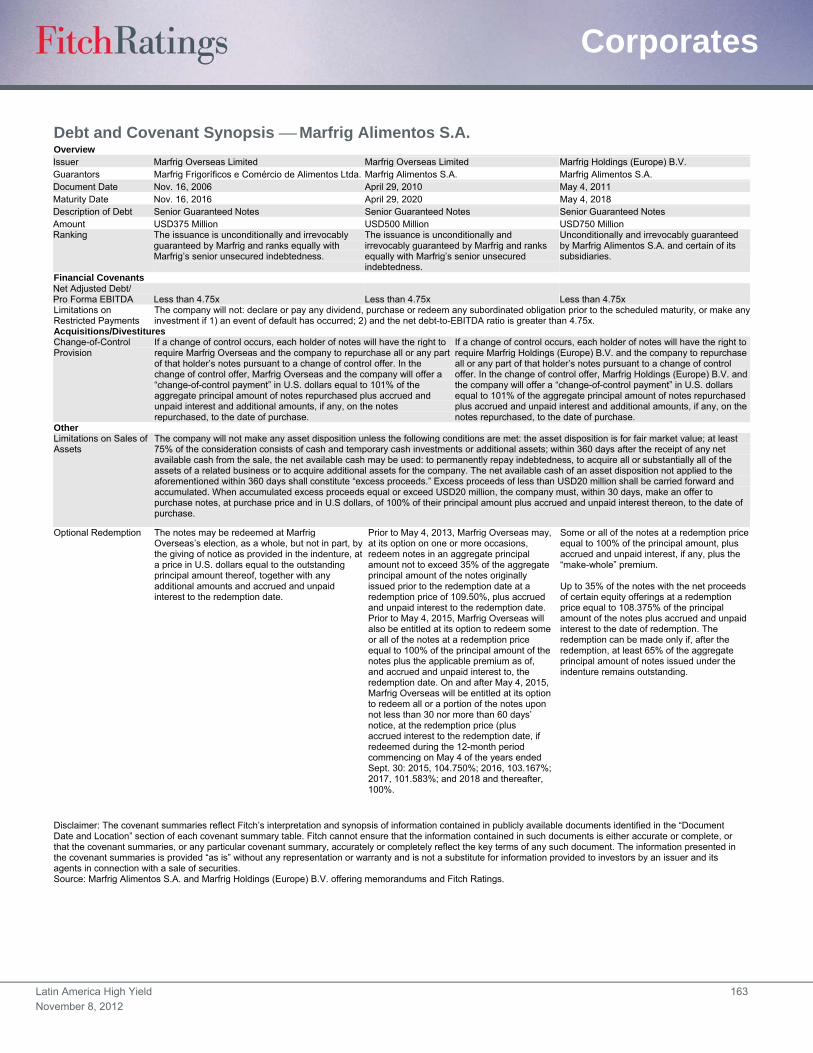
Latin America High Yield 163
November 8, 2012
Corporates
Debt and Covenant Synopsis Marfrig Alimentos S.A. Overview Issuer Marfrig Overseas Limited Marfrig Overseas Limited Marfrig Holdings (Europe) B.V. Guarantors Marfrig Frigoríficos e Comércio de Alimentos Ltda. Marfrig Alimentos S.A. Marfrig Alimentos S.A. Document Date Nov. 16, 2006 April 29, 2010 May 4, 2011 Maturity Date Nov. 16, 2016 April 29, 2020 May 4, 2018 Description of Debt Senior Guaranteed Notes Senior Guaranteed Notes Senior Guaranteed Notes Amount USD375 Million USD500 Million USD750 Million Ranking The issuance is unconditionally and irrevocably
guaranteed by Marfrig and ranks equally with Marfrig’s senior unsecured indebtedness.
The issuance is unconditionally and irrevocably guaranteed by Marfrig and ranks equally with Marfrig’s senior unsecured indebtedness.
Unconditionally and irrevocably guaranteed by Marfrig Alimentos S.A. and certain of its subsidiaries.
Financial Covenants Net Adjusted Debt/ Pro Forma EBITDA Less than 4.75x Less than 4.75x Less than 4.75x Limitations on Restricted Payments
The company will not: declare or pay any dividend, purchase or redeem any subordinated obligation prior to the scheduled maturity, or make any investment if 1) an event of default has occurred; 2) and the net debt-to-EBITDA ratio is greater than 4.75x.
Acquisitions/Divestitures Change-of-Control Provision
If a change of control occurs, each holder of notes will have the right to require Marfrig Overseas and the company to repurchase all or any part of that holder’s notes pursuant to a change of control offer. In the change of control offer, Marfrig Overseas and the company will offer a “change-of-control payment” in U.S. dollars equal to 101% of the aggregate principal amount of notes repurchased plus accrued and unpaid interest and additional amounts, if any, on the notes repurchased, to the date of purchase.
If a change of control occurs, each holder of notes will have the right to require Marfrig Holdings (Europe) B.V. and the company to repurchase all or any part of that holder’s notes pursuant to a change of control offer. In the change of control offer, Marfrig Holdings (Europe) B.V. and the company will offer a “change-of-control payment” in U.S. dollars equal to 101% of the aggregate principal amount of notes repurchased plus accrued and unpaid interest and additional amounts, if any, on the notes repurchased, to the date of purchase.
Other Limitations on Sales of Assets
The company will not make any asset disposition unless the following conditions are met: the asset disposition is for fair market value; at least 75% of the consideration consists of cash and temporary cash investments or additional assets; within 360 days after the receipt of any net available cash from the sale, the net available cash may be used: to permanently repay indebtedness, to acquire all or substantially all of the assets of a related business or to acquire additional assets for the company. The net available cash of an asset disposition not applied to the aforementioned within 360 days shall constitute “excess proceeds.” Excess proceeds of less than USD20 million shall be carried forward and accumulated. When accumulated excess proceeds equal or exceed USD20 million, the company must, within 30 days, make an offer to purchase notes, at purchase price and in U.S dollars, of 100% of their principal amount plus accrued and unpaid interest thereon, to the date of purchase.
Optional Redemption The notes may be redeemed at Marfrig Overseas’s election, as a whole, but not in part, by the giving of notice as provided in the indenture, at a price in U.S. dollars equal to the outstanding principal amount thereof, together with any additional amounts and accrued and unpaid interest to the redemption date.
Prior to May 4, 2013, Marfrig Overseas may, at its option on one or more occasions, redeem notes in an aggregate principal amount not to exceed 35% of the aggregate principal amount of the notes originally issued prior to the redemption date at a redemption price of 109.50%, plus accrued and unpaid interest to the redemption date. Prior to May 4, 2015, Marfrig Overseas will also be entitled at its option to redeem some or all of the notes at a redemption price equal to 100% of the principal amount of the notes plus the applicable premium as of, and accrued and unpaid interest to, the redemption date. On and after May 4, 2015, Marfrig Overseas will be entitled at its option to redeem all or a portion of the notes upon not less than 30 nor more than 60 days’ notice, at the redemption price (plus accrued interest to the redemption date, if redeemed during the 12-month period commencing on May 4 of the years ended Sept. 30: 2015, 104.750%; 2016, 103.167%; 2017, 101.583%; and 2018 and thereafter, 100%.
Some or all of the notes at a redemption price equal to 100% of the principal amount, plus accrued and unpaid interest, if any, plus the “make-whole” premium. Up to 35% of the notes with the net proceeds of certain equity offerings at a redemption price equal to 108.375% of the principal amount of the notes plus accrued and unpaid interest to the date of redemption. The redemption can be made only if, after the redemption, at least 65% of the aggregate principal amount of notes issued under the indenture remains outstanding.
Disclaimer: The covenant summaries reflect Fitch’s interpretation and synopsis of information contained in publicly available documents identified in the “Document Date and Location” section of each covenant summary table. Fitch cannot ensure that the information contained in such documents is either accurate or complete, or that the covenant summaries, or any particular covenant summary, accurately or completely reflect the key terms of any such document. The information presented in the covenant summaries is provided “as is” without any representation or warranty and is not a substitute for information provided to investors by an issuer and its agents in connection with a sale of securities. Source: Marfrig Alimentos S.A. and Marfrig Holdings (Europe) B.V. offering memorandums and Fitch Ratings.
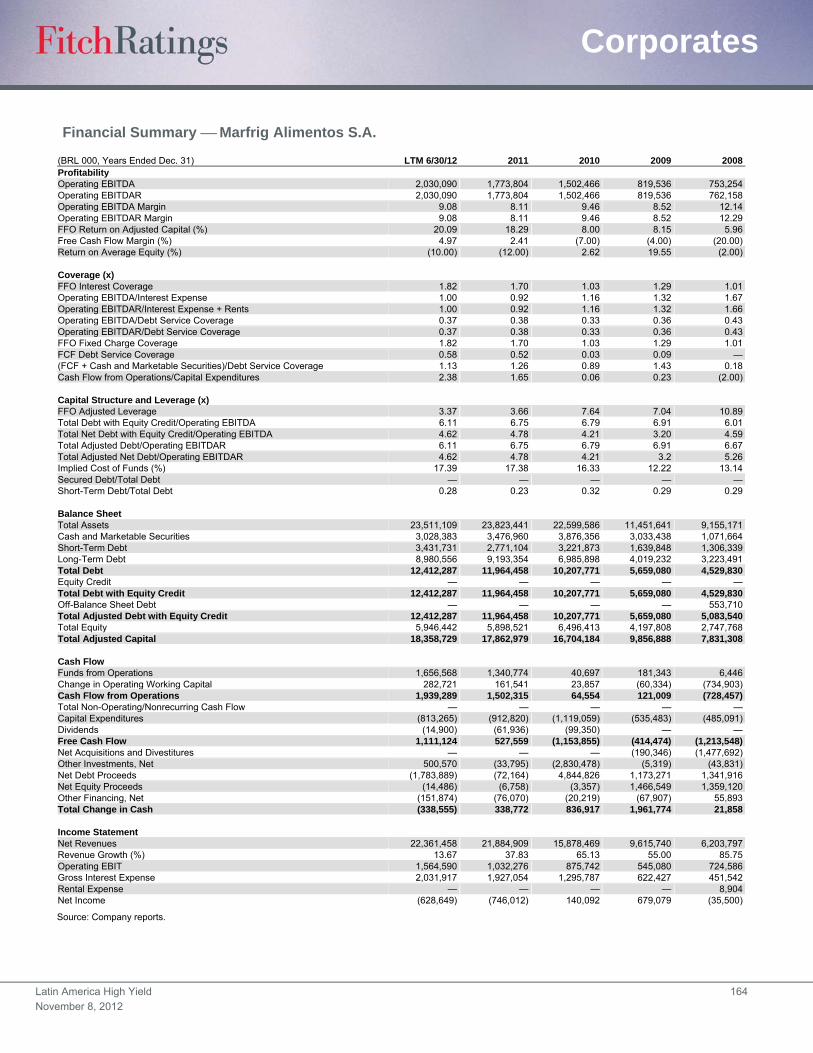
Latin America High Yield 164
November 8, 2012
Corporates
Financial Summary Marfrig Alimentos S.A. (BRL 000, Years Ended Dec. 31) LTM 6/30/12 2011 2010 2009 2008Profitability Operating EBITDA 2,030,090 1,773,804 1,502,466 819,536 753,254Operating EBITDAR 2,030,090 1,773,804 1,502,466 819,536 762,158Operating EBITDA Margin 9.08 8.11 9.46 8.52 12.14Operating EBITDAR Margin 9.08 8.11 9.46 8.52 12.29FFO Return on Adjusted Capital (%) 20.09 18.29 8.00 8.15 5.96Free Cash Flow Margin (%) 4.97 2.41 (7.00) (4.00) (20.00)Return on Average Equity (%) (10.00) (12.00) 2.62 19.55 (2.00) Coverage (x) FFO Interest Coverage 1.82 1.70 1.03 1.29 1.01Operating EBITDA/Interest Expense 1.00 0.92 1.16 1.32 1.67Operating EBITDAR/Interest Expense + Rents 1.00 0.92 1.16 1.32 1.66Operating EBITDA/Debt Service Coverage 0.37 0.38 0.33 0.36 0.43Operating EBITDAR/Debt Service Coverage 0.37 0.38 0.33 0.36 0.43FFO Fixed Charge Coverage 1.82 1.70 1.03 1.29 1.01FCF Debt Service Coverage 0.58 0.52 0.03 0.09 —(FCF + Cash and Marketable Securities)/Debt Service Coverage 1.13 1.26 0.89 1.43 0.18Cash Flow from Operations/Capital Expenditures 2.38 1.65 0.06 0.23 (2.00) Capital Structure and Leverage (x) FFO Adjusted Leverage 3.37 3.66 7.64 7.04 10.89Total Debt with Equity Credit/Operating EBITDA 6.11 6.75 6.79 6.91 6.01Total Net Debt with Equity Credit/Operating EBITDA 4.62 4.78 4.21 3.20 4.59Total Adjusted Debt/Operating EBITDAR 6.11 6.75 6.79 6.91 6.67Total Adjusted Net Debt/Operating EBITDAR 4.62 4.78 4.21 3.2 5.26Implied Cost of Funds (%) 17.39 17.38 16.33 12.22 13.14Secured Debt/Total Debt — — — — —Short-Term Debt/Total Debt 0.28 0.23 0.32 0.29 0.29 Balance Sheet Total Assets 23,511,109 23,823,441 22,599,586 11,451,641 9,155,171Cash and Marketable Securities 3,028,383 3,476,960 3,876,356 3,033,438 1,071,664Short-Term Debt 3,431,731 2,771,104 3,221,873 1,639,848 1,306,339Long-Term Debt 8,980,556 9,193,354 6,985,898 4,019,232 3,223,491Total Debt 12,412,287 11,964,458 10,207,771 5,659,080 4,529,830Equity Credit — — — — —Total Debt with Equity Credit 12,412,287 11,964,458 10,207,771 5,659,080 4,529,830Off-Balance Sheet Debt — — — — 553,710Total Adjusted Debt with Equity Credit 12,412,287 11,964,458 10,207,771 5,659,080 5,083,540Total Equity 5,946,442 5,898,521 6,496,413 4,197,808 2,747,768Total Adjusted Capital 18,358,729 17,862,979 16,704,184 9,856,888 7,831,308 Cash Flow Funds from Operations 1,656,568 1,340,774 40,697 181,343 6,446Change in Operating Working Capital 282,721 161,541 23,857 (60,334) (734,903)Cash Flow from Operations 1,939,289 1,502,315 64,554 121,009 (728,457)Total Non-Operating/Nonrecurring Cash Flow — — — — —Capital Expenditures (813,265) (912,820) (1,119,059) (535,483) (485,091)Dividends (14,900) (61,936) (99,350) — —Free Cash Flow 1,111,124 527,559 (1,153,855) (414,474) (1,213,548)Net Acquisitions and Divestitures — — — (190,346) (1,477,692)Other Investments, Net 500,570 (33,795) (2,830,478) (5,319) (43,831)Net Debt Proceeds (1,783,889) (72,164) 4,844,826 1,173,271 1,341,916Net Equity Proceeds (14,486) (6,758) (3,357) 1,466,549 1,359,120Other Financing, Net (151,874) (76,070) (20,219) (67,907) 55,893Total Change in Cash (338,555) 338,772 836,917 1,961,774 21,858 Income Statement Net Revenues 22,361,458 21,884,909 15,878,469 9,615,740 6,203,797Revenue Growth (%) 13.67 37.83 65.13 55.00 85.75Operating EBIT 1,564,590 1,032,276 875,742 545,080 724,586Gross Interest Expense 2,031,917 1,927,054 1,295,787 622,427 451,542Rental Expense — — — — 8,904Net Income (628,649) (746,012) 140,092 679,079 (35,500)
Source: Company reports.
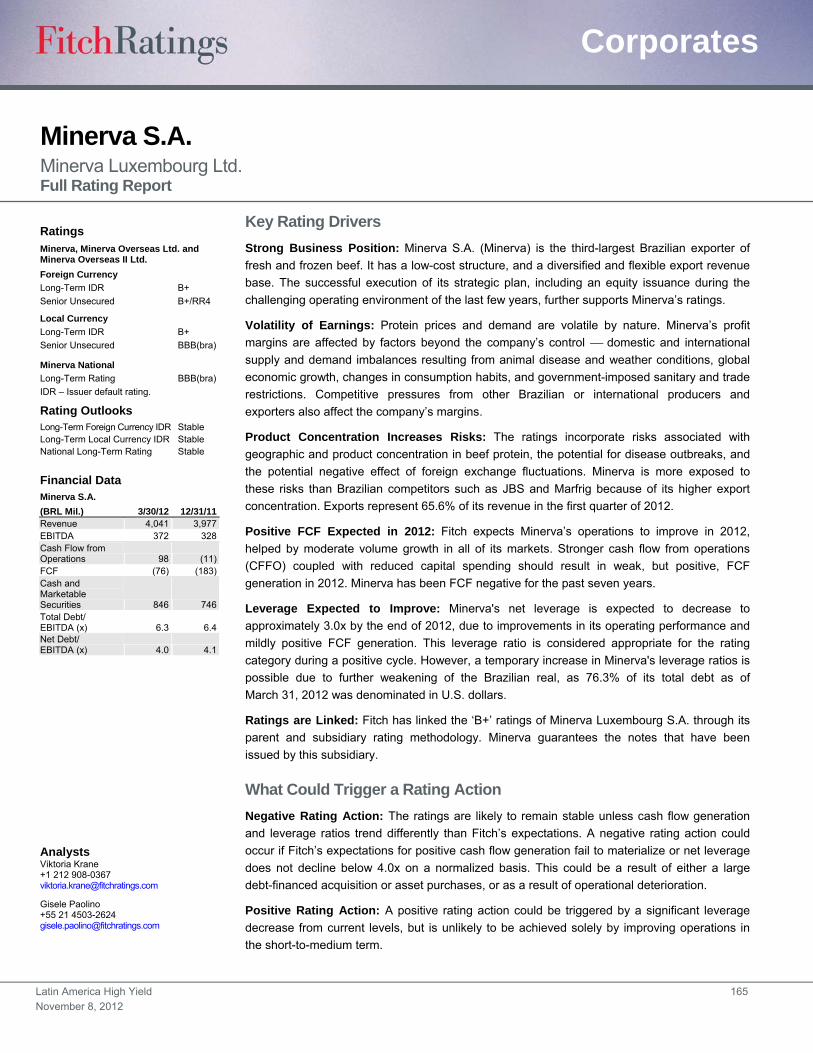
Latin America High Yield 165
November 8, 2012
Corporates
Minerva S.A. Minerva Luxembourg Ltd. Full Rating Report
Key Rating Drivers
Strong Business Position: Minerva S.A. (Minerva) is the third-largest Brazilian exporter of
fresh and frozen beef. It has a low-cost structure, and a diversified and flexible export revenue
base. The successful execution of its strategic plan, including an equity issuance during the
challenging operating environment of the last few years, further supports Minerva’s ratings.
Volatility of Earnings: Protein prices and demand are volatile by nature. Minerva’s profit
margins are affected by factors beyond the company’s control domestic and international
supply and demand imbalances resulting from animal disease and weather conditions, global
economic growth, changes in consumption habits, and government-imposed sanitary and trade
restrictions. Competitive pressures from other Brazilian or international producers and
exporters also affect the company’s margins.
Product Concentration Increases Risks: The ratings incorporate risks associated with
geographic and product concentration in beef protein, the potential for disease outbreaks, and
the potential negative effect of foreign exchange fluctuations. Minerva is more exposed to
these risks than Brazilian competitors such as JBS and Marfrig because of its higher export
concentration. Exports represent 65.6% of its revenue in the first quarter of 2012.
Positive FCF Expected in 2012: Fitch expects Minerva’s operations to improve in 2012,
helped by moderate volume growth in all of its markets. Stronger cash flow from operations
(CFFO) coupled with reduced capital spending should result in weak, but positive, FCF
generation in 2012. Minerva has been FCF negative for the past seven years.
Leverage Expected to Improve: Minerva's net leverage is expected to decrease to
approximately 3.0x by the end of 2012, due to improvements in its operating performance and
mildly positive FCF generation. This leverage ratio is considered appropriate for the rating
category during a positive cycle. However, a temporary increase in Minerva's leverage ratios is
possible due to further weakening of the Brazilian real, as 76.3% of its total debt as of
March 31, 2012 was denominated in U.S. dollars.
Ratings are Linked: Fitch has linked the ‘B+’ ratings of Minerva Luxembourg S.A. through its
parent and subsidiary rating methodology. Minerva guarantees the notes that have been
issued by this subsidiary.
What Could Trigger a Rating Action
Negative Rating Action: The ratings are likely to remain stable unless cash flow generation
and leverage ratios trend differently than Fitch’s expectations. A negative rating action could
occur if Fitch’s expectations for positive cash flow generation fail to materialize or net leverage
does not decline below 4.0x on a normalized basis. This could be a result of either a large
debt-financed acquisition or asset purchases, or as a result of operational deterioration.
Positive Rating Action: A positive rating action could be triggered by a significant leverage
decrease from current levels, but is unlikely to be achieved solely by improving operations in
the short-to-medium term.
Ratings Minerva, Minerva Overseas Ltd. and Minerva Overseas II Ltd.
Foreign Currency
Long-Term IDR B+
Senior Unsecured B+/RR4
Local Currency
Long-Term IDR B+
Senior Unsecured BBB(bra)
Minerva National
Long-Term Rating BBB(bra)
IDR – Issuer default rating.
Rating Outlooks Long-Term Foreign Currency IDR Stable Long-Term Local Currency IDR Stable National Long-Term Rating Stable
Financial Data Minerva S.A.
(BRL Mil.) 3/30/12 12/31/11 Revenue 4,041 3,977 EBITDA 372 328 Cash Flow from Operations 98 (11) FCF (76) (183) Cash and Marketable Securities 846 746 Total Debt/ EBITDA (x) 6.3 6.4 Net Debt/ EBITDA (x) 4.0 4.1
Analysts Viktoria Krane +1 212 908-0367 [email protected]
Gisele Paolino +55 21 4503-2624 [email protected]
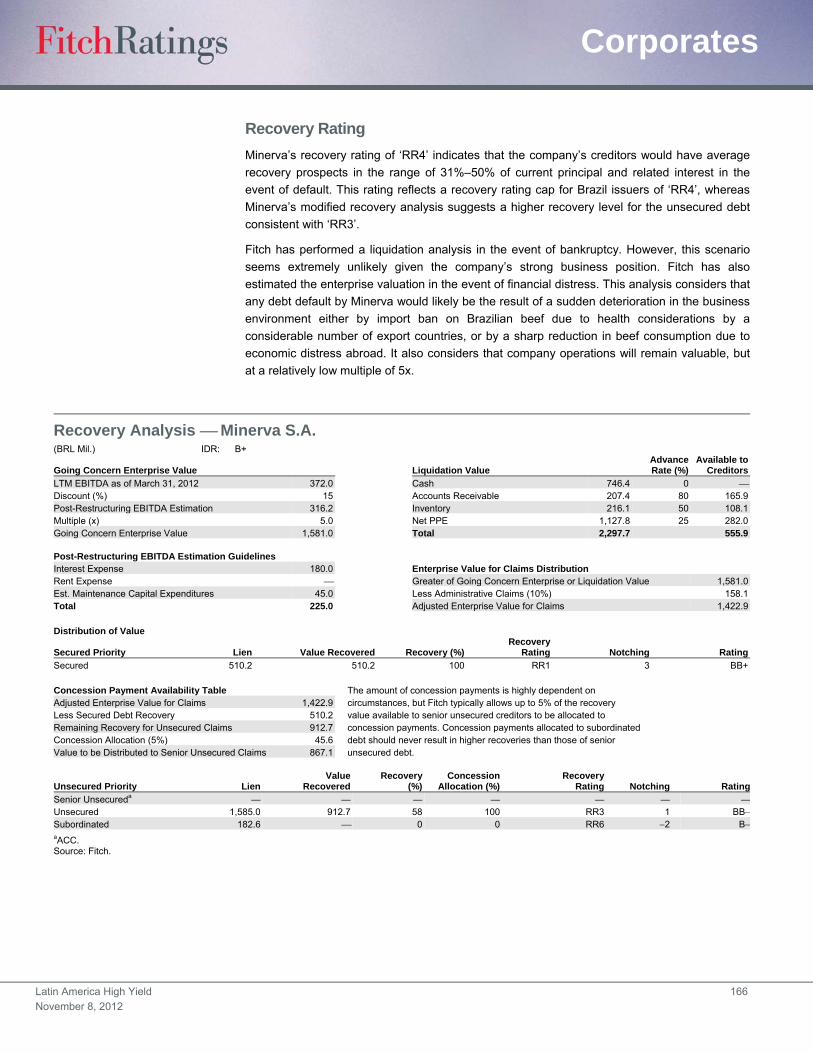
Latin America High Yield 166
November 8, 2012
Corporates
Recovery Rating
Minerva’s recovery rating of ‘RR4’ indicates that the company’s creditors would have average
recovery prospects in the range of 31%–50% of current principal and related interest in the
event of default. This rating reflects a recovery rating cap for Brazil issuers of ‘RR4’, whereas
Minerva’s modified recovery analysis suggests a higher recovery level for the unsecured debt
consistent with ‘RR3’.
Fitch has performed a liquidation analysis in the event of bankruptcy. However, this scenario
seems extremely unlikely given the company’s strong business position. Fitch has also
estimated the enterprise valuation in the event of financial distress. This analysis considers that
any debt default by Minerva would likely be the result of a sudden deterioration in the business
environment either by import ban on Brazilian beef due to health considerations by a
considerable number of export countries, or by a sharp reduction in beef consumption due to
economic distress abroad. It also considers that company operations will remain valuable, but
at a relatively low multiple of 5x.
Recovery Analysis Minerva S.A. (BRL Mil.) IDR: B+
Going Concern Enterprise Value Liquidation Value AdvanceRate (%)
Available toCreditors
LTM EBITDA as of March 31, 2012 372.0 Cash 746.4 0 Discount (%) 15 Accounts Receivable 207.4 80 165.9 Post-Restructuring EBITDA Estimation 316.2 Inventory 216.1 50 108.1 Multiple (x) 5.0 Net PPE 1,127.8 25 282.0 Going Concern Enterprise Value 1,581.0 Total 2,297.7 555.9 Post-Restructuring EBITDA Estimation Guidelines Interest Expense 180.0 Enterprise Value for Claims Distribution Rent Expense Greater of Going Concern Enterprise or Liquidation Value 1,581.0 Est. Maintenance Capital Expenditures 45.0 Less Administrative Claims (10%) 158.1Total 225.0 Adjusted Enterprise Value for Claims 1,422.9 Distribution of Value
Secured Priority Lien Value Recovered Recovery (%)Recovery
Rating Notching Rating
Secured 510.2 510.2 100 RR1 3 BB+ Concession Payment Availability Table The amount of concession payments is highly dependent on Adjusted Enterprise Value for Claims 1,422.9 circumstances, but Fitch typically allows up to 5% of the recovery Less Secured Debt Recovery 510.2 value available to senior unsecured creditors to be allocated to Remaining Recovery for Unsecured Claims 912.7 concession payments. Concession payments allocated to subordinated Concession Allocation (5%) 45.6 debt should never result in higher recoveries than those of senior Value to be Distributed to Senior Unsecured Claims 867.1 unsecured debt.
Unsecured Priority Lien Value
RecoveredRecovery
(%)Concession
Allocation (%)Recovery
Rating Notching Rating
Senior Unsecureda — — — — — — —Unsecured 1,585.0 912.7 58 100 RR3 1 BBSubordinated 182.6 0 0 RR6 2 BaACC. Source: Fitch.
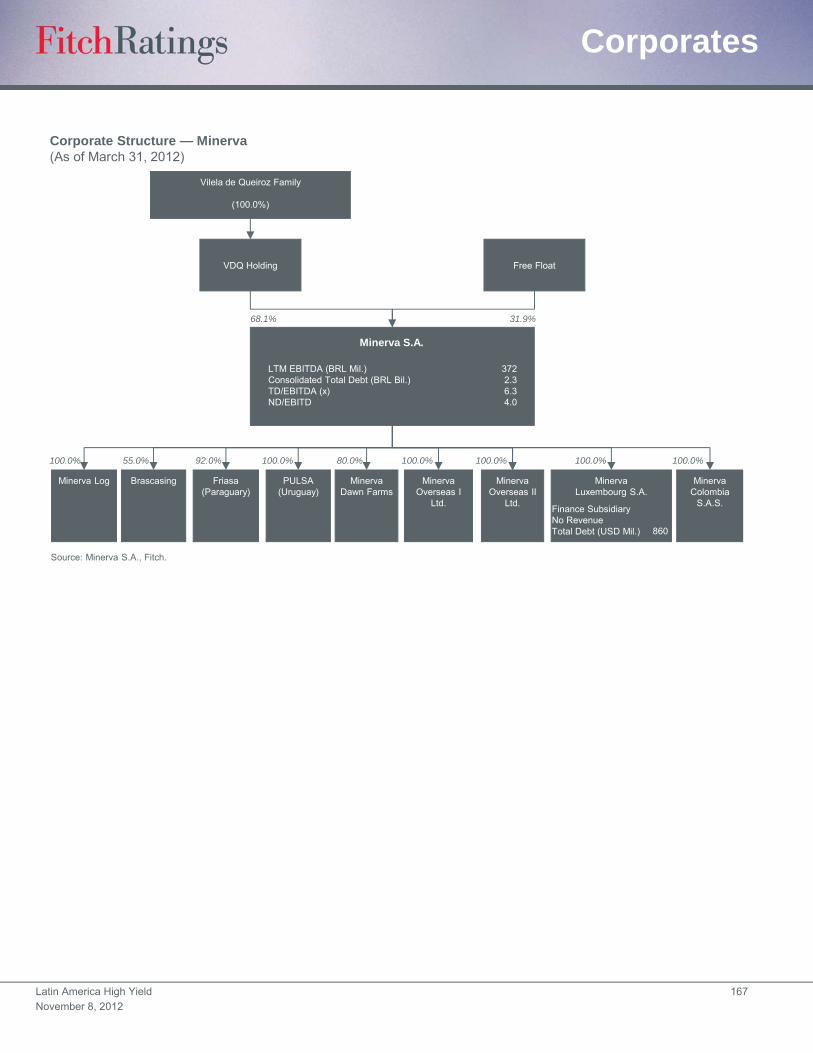
Latin America High Yield 167
November 8, 2012
Corporates
Corporate Structure — Minerva(As of March 31, 2012)
Source: Minerva S.A., Fitch.
Minerva Log
Vilela de Queiroz Family
(100.0%)
100.0%
Minerva Colombia
S.A.S.
Minerva Luxembourg S.A.
Minerva Overseas II
Ltd.
Minerva Overseas I
Ltd.
Minerva Dawn Farms
PULSA(Uruguay)
Friasa(Paraguary)
Brascasing
VDQ Holding Free Float
100.0%100.0%100.0%80.0%100.0%92.0%55.0%100.0%
68.1% 31.9%
LTM EBITDA (BRL Mil.)Consolidated Total Debt (BRL Bil.)TD/EBITDA (x)ND/EBITD
3722.36.34.0
Finance SubsidiaryNo RevenueTotal Debt (USD Mil.) 860
Minerva S.A.
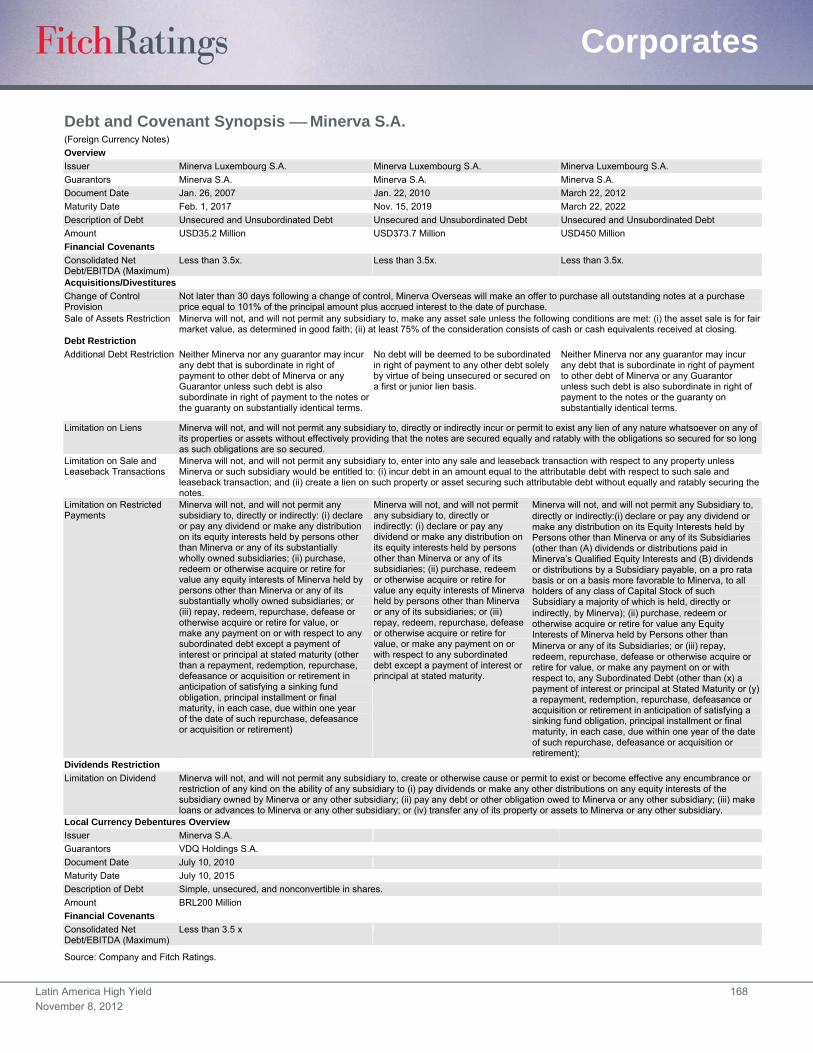
Latin America High Yield 168
November 8, 2012
Corporates
Debt and Covenant Synopsis Minerva S.A. (Foreign Currency Notes)
Overview
Issuer Minerva Luxembourg S.A. Minerva Luxembourg S.A. Minerva Luxembourg S.A.
Guarantors Minerva S.A. Minerva S.A. Minerva S.A.
Document Date Jan. 26, 2007 Jan. 22, 2010 March 22, 2012
Maturity Date Feb. 1, 2017 Nov. 15, 2019 March 22, 2022
Description of Debt Unsecured and Unsubordinated Debt Unsecured and Unsubordinated Debt Unsecured and Unsubordinated Debt
Amount USD35.2 Million USD373.7 Million USD450 Million
Financial Covenants
Consolidated Net Debt/EBITDA (Maximum)
Less than 3.5x. Less than 3.5x. Less than 3.5x.
Acquisitions/Divestitures Change of Control Provision
Not later than 30 days following a change of control, Minerva Overseas will make an offer to purchase all outstanding notes at a purchase price equal to 101% of the principal amount plus accrued interest to the date of purchase.
Sale of Assets Restriction Minerva will not, and will not permit any subsidiary to, make any asset sale unless the following conditions are met: (i) the asset sale is for fair market value, as determined in good faith; (ii) at least 75% of the consideration consists of cash or cash equivalents received at closing.
Debt Restriction
Additional Debt Restriction Neither Minerva nor any guarantor may incur any debt that is subordinate in right of payment to other debt of Minerva or any Guarantor unless such debt is also subordinate in right of payment to the notes or the guaranty on substantially identical terms.
No debt will be deemed to be subordinated in right of payment to any other debt solely by virtue of being unsecured or secured on a first or junior lien basis.
Neither Minerva nor any guarantor may incur any debt that is subordinate in right of payment to other debt of Minerva or any Guarantor unless such debt is also subordinate in right of payment to the notes or the guaranty on substantially identical terms.
Limitation on Liens Minerva will not, and will not permit any subsidiary to, directly or indirectly incur or permit to exist any lien of any nature whatsoever on any of its properties or assets without effectively providing that the notes are secured equally and ratably with the obligations so secured for so long as such obligations are so secured.
Limitation on Sale and Leaseback Transactions
Minerva will not, and will not permit any subsidiary to, enter into any sale and leaseback transaction with respect to any property unless Minerva or such subsidiary would be entitled to: (i) incur debt in an amount equal to the attributable debt with respect to such sale and leaseback transaction; and (ii) create a lien on such property or asset securing such attributable debt without equally and ratably securing the notes.
Limitation on Restricted Payments
Minerva will not, and will not permit any subsidiary to, directly or indirectly: (i) declare or pay any dividend or make any distribution on its equity interests held by persons other than Minerva or any of its substantially wholly owned subsidiaries; (ii) purchase, redeem or otherwise acquire or retire for value any equity interests of Minerva held by persons other than Minerva or any of its substantially wholly owned subsidiaries; or (iii) repay, redeem, repurchase, defease or otherwise acquire or retire for value, or make any payment on or with respect to any subordinated debt except a payment of interest or principal at stated maturity (other than a repayment, redemption, repurchase, defeasance or acquisition or retirement in anticipation of satisfying a sinking fund obligation, principal installment or final maturity, in each case, due within one year of the date of such repurchase, defeasance or acquisition or retirement)
Minerva will not, and will not permit any subsidiary to, directly or indirectly: (i) declare or pay any dividend or make any distribution on its equity interests held by persons other than Minerva or any of its subsidiaries; (ii) purchase, redeem or otherwise acquire or retire for value any equity interests of Minerva held by persons other than Minerva or any of its subsidiaries; or (iii) repay, redeem, repurchase, defease or otherwise acquire or retire for value, or make any payment on or with respect to any subordinated debt except a payment of interest or principal at stated maturity.
Minerva will not, and will not permit any Subsidiary to, directly or indirectly:(i)declare or pay any dividend or make any distribution on its Equity Interests held by Persons other than Minerva or any of its Subsidiaries (other than (A) dividends or distributions paid in Minerva’s Qualified Equity Interests and (B) dividends or distributions by a Subsidiary payable, on a pro rata basis or on a basis more favorable to Minerva, to all holders of any class of Capital Stock of such Subsidiary a majority of which is held, directly or indirectly, by Minerva); (ii)purchase, redeem or otherwise acquire or retire for value any Equity Interests of Minerva held by Persons other than Minerva or any of its Subsidiaries; or (iii)repay, redeem, repurchase, defease or otherwise acquire or retire for value, or make any payment on or with respect to, any Subordinated Debt (other than (x) a payment of interest or principal at Stated Maturity or (y) a repayment, redemption, repurchase, defeasance or acquisition or retirement in anticipation of satisfying a sinking fund obligation, principal installment or final maturity, in each case, due within one year of the date of such repurchase, defeasance or acquisition or retirement);
Dividends Restriction
Limitation on Dividend Minerva will not, and will not permit any subsidiary to, create or otherwise cause or permit to exist or become effective any encumbrance or restriction of any kind on the ability of any subsidiary to (i) pay dividends or make any other distributions on any equity interests of the subsidiary owned by Minerva or any other subsidiary; (ii) pay any debt or other obligation owed to Minerva or any other subsidiary; (iii) make loans or advances to Minerva or any other subsidiary; or (iv) transfer any of its property or assets to Minerva or any other subsidiary.
Local Currency Debentures Overview
Issuer Minerva S.A.
Guarantors VDQ Holdings S.A. Document Date July 10, 2010
Maturity Date July 10, 2015
Description of Debt Simple, unsecured, and nonconvertible in shares.
Amount BRL200 Million
Financial Covenants
Consolidated Net Debt/EBITDA (Maximum)
Less than 3.5 x
Source: Company and Fitch Ratings.

Latin America High Yield 169
November 8, 2012
Corporates
Financial Summary Minerva S.A. (BRL Mil., As of Dec. 31) LTM 3/31/12 2011 2010 2009 2008Profitability Operating EBITDA 371,983 327,725 245,665 184,573 153,376 Operating EBITDAR 371,983 327,725 245,665 184,573 153,376 Operating EBITDA Margin (%) 9.2 8.2 7.2 7.1 7.2Operating EBITDAR Margin (%) 9.2 8.2 7.2 7.1 7.2FFO Return on Adjusted Capital (%) 21.9 13.1 2.1 1.9 6.1Free Cash Flow Margin (%) (1.9) (4.6) (4.2) (4.2) (21.9)Return on Average Equity (%) (6.0) 6.1 4.3 19.5 (51.0)Coverage (x) FFO Interest Coverage 1.2 1.1 0.3 0.3 1.0Operating EBITDA/Gross Interest Expense 0.7 1.0 1.5 1.8 1.5Operating EBITDAR/Interest Expense + Rents 0.7 1.0 1.5 1.8 1.5Operating EBITDA/Debt-Service Coverage 0.4 0.4 0.6 0.5 0.3Operating EBITDAR/Debt-Service Coverage 0.4 0.4 0.6 0.5 0.3FFO Fixed Charge Coverage 1.2 1.1 0.3 0.3 1.0FCF Debt Service Coverage 0.6 0.2 0.1 0.0 (0.8)(FCF + Cash and Marketable Securities)/Debt Service Coverage 1.6 1.0 1.5 1.1 0.2Cash Flow from Operations/Capital Expenditures 0.7 (0.1) 0.3 0.2 (0.3)Leverage (x) FFO Adjusted Leverage 3.5 5.5 36.6 36.6 13.4Total Debt with Equity Credit/Operating EBITDA 6.3 6.4 6.7 6.6 9.2Total Net Debt with Equity Credit/Operating EBITDA 4.0 4.1 4.3 4.3 6.2Total Adjusted Debt/Operating EBITDAR 6.3 6.4 6.7 6.6 9.2Total Adjusted Net Debt/Operating EBITDAR 4.0 4.1 4.3 4.3 6.2Implied Cost of Funds (%) 0.3 0.2 0.1 0.1 0.1Secured Debt/Total Debt Short-Term Debt/Total Debt 0.1 0.3 0.1 0.2 0.3Balance Sheet Total Assets 3,619,125 3,499,191 2,628,350 2,072,813 2,018,221 Cash and Marketable Securities 846,276 746,382 576,464 424,009 466,540 Short-Term Debt 282,669 541,568 236,891 291,071 357,840 Long-Term Debt 2,053,283 1,561,081 1,402,508 932,302 1,052,083 Total Debt 2,335,952 2,102,649 1,639,399 1,223,373 1,409,923 Equity Credit — — — — — Total Debt with Equity Credit 2,335,952 2,102,649 1,639,399 1,223,373 1,409,923 Off-Balance Sheet Debt Total Adjusted Debt with Equity Credit 2,335,952 2,102,649 1,639,399 1,223,373 1,409,923 Total Equity 714,268 819,405 540,273 527,339 314,373 Total Adjusted Capital 3,050,220 2,922,054 2,179,672 1,750,712 1,724,296 Cash Flow Funds from Operations 100,050 46,185 (122,546) (71,382) 2,648 Change in Working Capital (1,178) (56,771) 191,427 100,657 (116,747)Cash Flow from Operations 98,872 (10,586) 68,881 29,275 (114,099)Total Non-Operating/Nonrecurring Cash Flow Capital Expenditures (151,715) (160,850) (206,122) (138,595) (351,013)Common Dividends (23,524) (11,762) (6,555) Free Cash Flow (76,367) (183,198) (143,796) (109,320) (465,112)Net Acquisitions and Divestitures (17,805) (166,166) Other Investments, Net 50,031 (305) Net Debt Proceeds 280,317 271,080 464,393 (65,641) 570,544 Net Equity Proceeds (4,455) 8,946 3,914 158,999 Other (Investments and Financing) 72,115 90,895 (5,890) (26,264) (15,338)Total Change in Cash 303,836 169,918 152,455 (42,531) 90,094 Income Statement - - - - - Revenue 4,040,658 3,976,977 3,408,205 2,602,119 2,120,800 Revenue Growth (%) 8.9 16.7 31.0 22.7 45.0Operating EBIT 326,684 282,346 216,846 142,310 127,000 Gross Interest Expense 568,862 335,365 167,281 104,800 102,349 Rental Expense Net Income (37,704) 41,715 22,898 81,992 (215,546)Net Income 72 23 82 (216)
Source: Fitch.
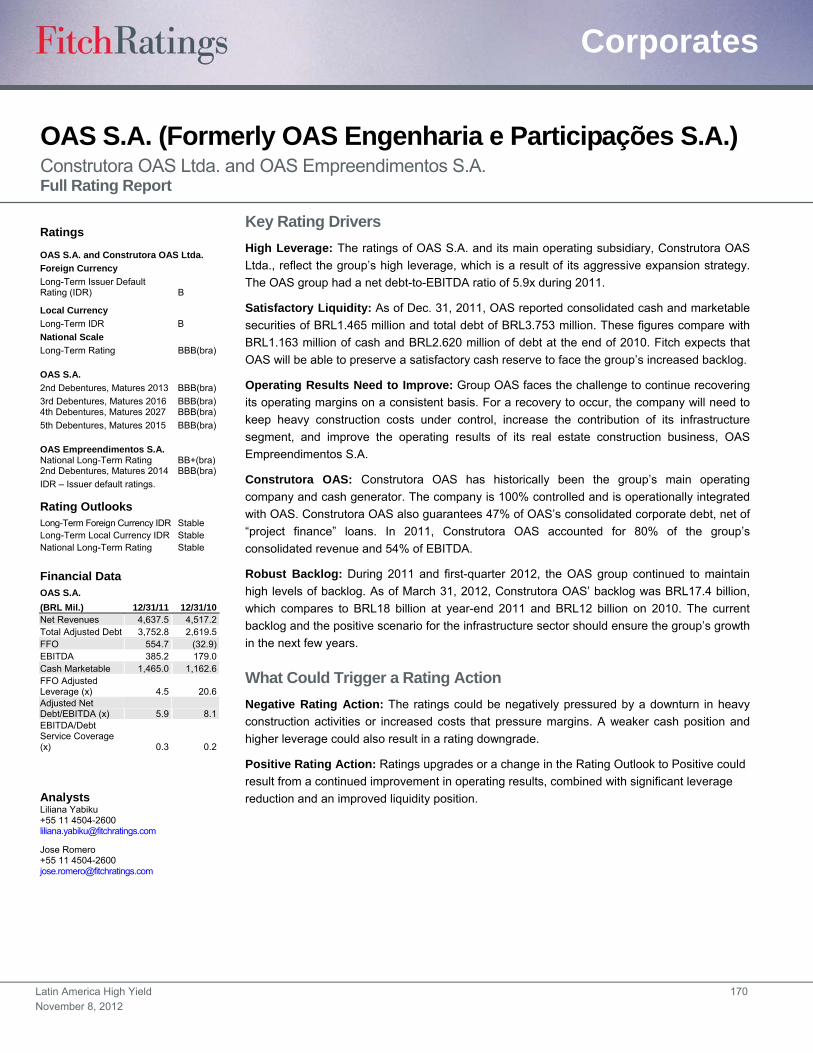
Latin America High Yield 170
November 8, 2012
Corporates
OAS S.A. (Formerly OAS Engenharia e Participações S.A.) Construtora OAS Ltda. and OAS Empreendimentos S.A. Full Rating Report
Key Rating Drivers
High Leverage: The ratings of OAS S.A. and its main operating subsidiary, Construtora OAS
Ltda., reflect the group’s high leverage, which is a result of its aggressive expansion strategy.
The OAS group had a net debt-to-EBITDA ratio of 5.9x during 2011.
Satisfactory Liquidity: As of Dec. 31, 2011, OAS reported consolidated cash and marketable
securities of BRL1.465 million and total debt of BRL3.753 million. These figures compare with
BRL1.163 million of cash and BRL2.620 million of debt at the end of 2010. Fitch expects that
OAS will be able to preserve a satisfactory cash reserve to face the group’s increased backlog.
Operating Results Need to Improve: Group OAS faces the challenge to continue recovering
its operating margins on a consistent basis. For a recovery to occur, the company will need to
keep heavy construction costs under control, increase the contribution of its infrastructure
segment, and improve the operating results of its real estate construction business, OAS
Empreendimentos S.A.
Construtora OAS: Construtora OAS has historically been the group’s main operating
company and cash generator. The company is 100% controlled and is operationally integrated
with OAS. Construtora OAS also guarantees 47% of OAS’s consolidated corporate debt, net of
“project finance” loans. In 2011, Construtora OAS accounted for 80% of the group’s
consolidated revenue and 54% of EBITDA.
Robust Backlog: During 2011 and first-quarter 2012, the OAS group continued to maintain
high levels of backlog. As of March 31, 2012, Construtora OAS’ backlog was BRL17.4 billion,
which compares to BRL18 billion at year-end 2011 and BRL12 billion on 2010. The current
backlog and the positive scenario for the infrastructure sector should ensure the group’s growth
in the next few years.
What Could Trigger a Rating Action
Negative Rating Action: The ratings could be negatively pressured by a downturn in heavy
construction activities or increased costs that pressure margins. A weaker cash position and
higher leverage could also result in a rating downgrade.
Positive Rating Action: Ratings upgrades or a change in the Rating Outlook to Positive could
result from a continued improvement in operating results, combined with significant leverage
reduction and an improved liquidity position.
Ratings
OAS S.A. and Construtora OAS Ltda.
Foreign Currency
Long-Term Issuer Default Rating (IDR) B
Local Currency
Long-Term IDR B
National Scale
Long-Term Rating BBB(bra)
OAS S.A.
2nd Debentures, Matures 2013 BBB(bra)
3rd Debentures, Matures 2016 4th Debentures, Matures 2027
BBB(bra) BBB(bra)
5th Debentures, Matures 2015 BBB(bra)
OAS Empreendimentos S.A. National Long-Term Rating 2nd Debentures, Matures 2014
BB+(bra) BBB(bra)
IDR – Issuer default ratings.
Rating Outlooks Long-Term Foreign Currency IDR Stable Long-Term Local Currency IDR Stable National Long-Term Rating Stable
Financial Data OAS S.A.
(BRL Mil.) 12/31/11 12/31/10 Net Revenues 4,637.5 4,517.2 Total Adjusted Debt 3,752.8 2,619.5 FFO 554.7 (32.9) EBITDA 385.2 179.0 Cash Marketable 1,465.0 1,162.6 FFO Adjusted Leverage (x) 4.5 20.6 Adjusted Net Debt/EBITDA (x) 5.9 8.1 EBITDA/Debt Service Coverage (x) 0.3 0.2
Analysts Liliana Yabiku +55 11 4504-2600 [email protected]
Jose Romero +55 11 4504-2600 [email protected]
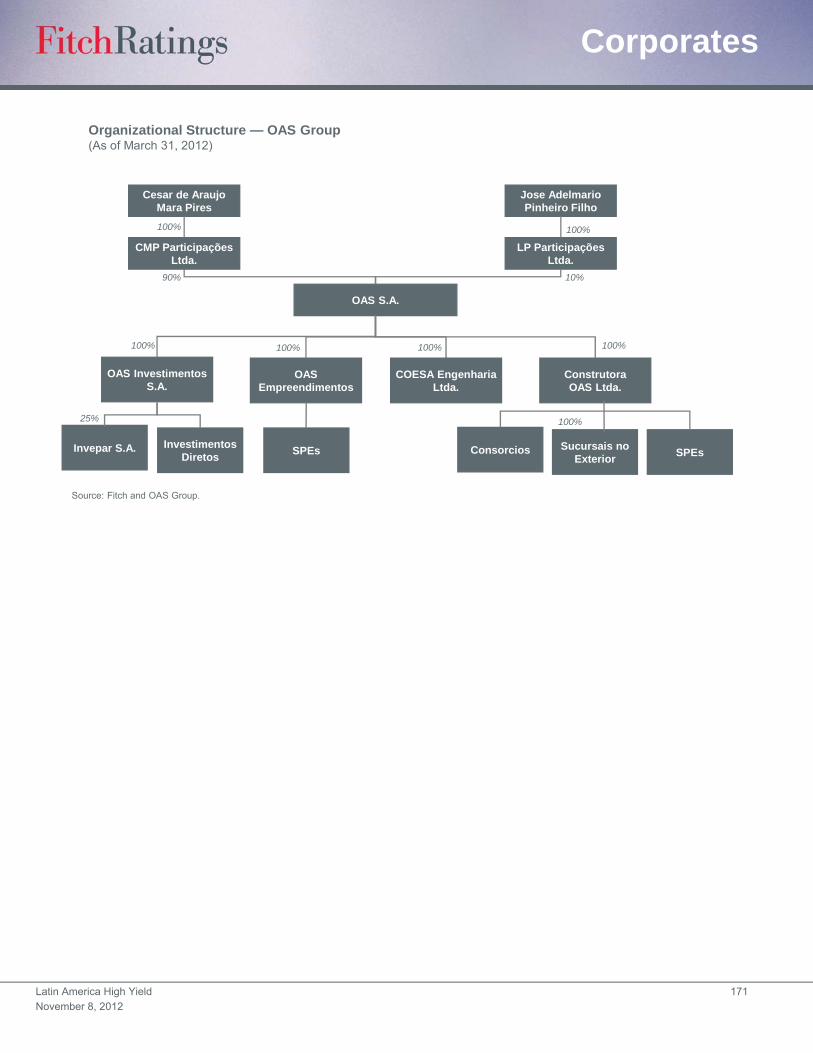
Latin America High Yield 171
November 8, 2012
Corporates
Organizational Structure — OAS Group(As of March 31, 2012)
Source: Fitch and OAS Group.
100%
OAS S.A.
Cesar de Araujo Mara Pires
CMP ParticipaçõesLtda.
Jose Adelmario Pinheiro Filho
LP ParticipaçõesLtda.
OAS Empreendimentos
COESA EngenhariaLtda.
OAS InvestimentosS.A.
ConstrutoraOAS Ltda.
Invepar S.A.
90%
100%
10%
100% 100%
25%
100%
Investimentos Diretos
SPEs Consorcios Sucursais no Exterior
SPEs
100%
100%

Latin America High Yield 172
November 8, 2012
Corporates
Debt and Covenant Synopsis First Debenture Issued by OAS S.A.
Overview Issuer OAS S.A. Guarantors Construtora OAS Ltda. Issue Date Oct. 29, 2010 Documents Date Debenture Deed: Oct. 18, 2010 Maturity Date Oct. 29, 2018 Description of Debt First Debenture Simple, Not Convertible Amount BRL400 Million Provider of Pledge of Shares OAS Investimentos S.A.: 8,531,973 voting shares and 17,063,946 preferential shares of Investimentos e Participações em
Infra-Estrutura S.A. INVEPAR. Principal Repayment (Date/% of Total)
Oct. 29 of the following years: 2013 (16.6666%); 2014 (16.6666%); 2015 (16.6666%); 2016 (16.6666%); 2017 (16.6666%); and 2018 (16.6670%).
Financial Covenants Consolidated Net Debt/ EBITDA (Maximum) Net debt/EBITDA of Construtora OAS not to exceed 3.0x on annual consolidated financial statements. Issuer Financial Covenant Net debt/total assets of OAS S.A. not to exceed 60% on annual consolidated financial statements. Other Relevant Early Maturity Events 1. Nonpayment of any financial obligation of this issue by the issuer or guarantors at the respective maturity dates;
2. Noncompliance of any obligation within the established period that may lead to early maturity of any debt obligation of the issuer or guarantor equal to or above BRL20 million;
3. Change or transfer of direct or indirect shareholding control of the issuer reducing to less than 50% plus one share of its voting control or result, by any reason, in the current controlling shareholders not exercising effective control;
4. Split, merger, or incorporation or any form of corporate reorganization involving the issuer or guarantors without the previous knowledge and approval by the debenture holders, unless the operation exclusively involves the issuer and/or guarantors and their subsidiaries and will not result in change of shareholding control of the issuer and/or guarantors;
5. Noncompliance of any financial obligation of the issuer or guarantors of amount equal or above BRL20 million, or equivalent in other currency, or any other obligation that may lead to an early maturity of any financial obligation of the issuer or guarantors of an amount equal or above BRL20 million or equivalent in other currency;
6. Protests against the issuer or guarantors equal or above BRL20 million or equivalent in other currency, unless not legitimate, cancelled, or suspended by judicial decision;
7. Noncompliance of judicial decision against the issuer or guarantors including fiscal executions of an amount equal or above BRL20 million or equivalent in other currencies;
8. Confiscation or pledge of assets of the issuer or guarantors of amount equal or above BRL20 million or equivalent in other currency, unless, legally contested or suspended, within 15 days of the event, or substituted by a guarantee that does not affect or bind the issuer assets;
9. Governmental fiscal or environmental penalties of amount equal or above BRL10 million, unless legally contested within the established period; not legitimated by the issuer and guarantor or cancelled.
Continued on the next page. Disclaimers: The covenant summaries reflect Fitch’s interpretation and synopsis of information contained in publicly available documents identified in the “Document Date and Location” section of each covenant summary table. Fitch cannot ensure that the information contained in such documents is either accurate or complete, or that the covenant summaries, or any particular covenant summary, accurately or completely reflect the key terms of any such document. The information presented in the covenant summaries is provided “as is” without any representation or warranty and is not a substitute for information provided to investors by an issuer and its agents in connection with a sale of securities. Source: OAS S.A. and Fitch Ratings.

Latin America High Yield 173
November 8, 2012
Corporates
Debt and Covenant Synopsis Second Debenture Issued by OAS S.A. (Continued)
Overview Issuer OAS S.A. Guarantors Construtora OAS Ltda Issue Date June 25, 2011 Documents Date Debenture Deed: May 25, 2011 Maturity Date June 25, 2013 Description of Debt Second Debenture Simple, Not Convertible Amount BRL200 Million Principal Repayment (Date/% of Total)
Dec. 25, 2012 (14.28%); Jan. 25, 2013 (14.28%); Feb. 25, 2013 (14.28%); March 25, 2013 (14.28%); April 25, 2013 (14.28%); May 25, 2013(14.28%) and June 25, 2013 (14.32%)
Financial Covenants Consolidated Net Debt/ EBITDA (Maximum) Net debt/EBITDA of Construtora OAS not to exceed 3.0x on annual consolidated financial statements. Issuer Financial Covenant Net debt/total assets of OAS S.A. not to exceed 60% on annual consolidated financial statements. Other Relevant Early Maturity Events 1. Nonpayment, by the issuer, of any financial obligation due to the debenture holders at the respective due dates;
2. Noncompliance, by the issuer, of any nonfinancial obligation as per the debenture deed within the established period or, if not established, within seven working days;
3. Change or transfer of direct or indirect shareholding control of the issuer reducing to less than 50% plus one share of its voting control or result, by any reason, in the current controlling shareholders not exercising effective control;
4. Split, merger or incorporation, or any form of corporate reorganization involving the issuer or the guarantor without the previous knowledge and approval by the debenture holders;
5. Noncompliance of any financial obligation of the issuer or guarantors of an amount equal to or above BRL20 million, or equivalent in other currency, or any other obligation that may lead to an early maturity of any financial obligation of the issuer or guarantors of amount equal or above BRL20 million or equivalent in other currency;
6. Protests against the issuer or guarantors equal to or above BRL20 million or equivalent in other currency, unless not legitimate, cancelled, or suspended by judicial decision;
7. Noncompliance of judicial decision against the issuer or guarantors including fiscal executions, of an amount equal to or above BRL20 million or equivalent in other currencies;
8. Confiscation or pledge of assets of the issuer or guarantors of amount equal or above BRL20 million or equivalent in other currency, unless, legally contested or suspended, within 15 days of the event, or substituted by a guarantee that does not affect or bind the issuer assets;
9. Governmental fiscal or environmental penalties of an amount equal or above BRL10 million, unless legally contested within the established period; not legitimated by the issuer and guarantor or cancelled.
Continued on the next page. Disclaimer: The covenant summaries reflect Fitch’s interpretation and synopsis of information contained in publicly available documents identified in the “Document Date and Location” section of each covenant summary table. Fitch cannot ensure that the information contained in such documents is either accurate or complete, or that the covenant summaries, or any particular covenant summary, accurately or completely reflect the key terms of any such document. The information presented in the covenant summaries is provided “as is” without any representation or warranty and is not a substitute for information provided to investors by an issuer and its agents in connection with a sale of securities. Source: OAS S.A. and Fitch Ratings.
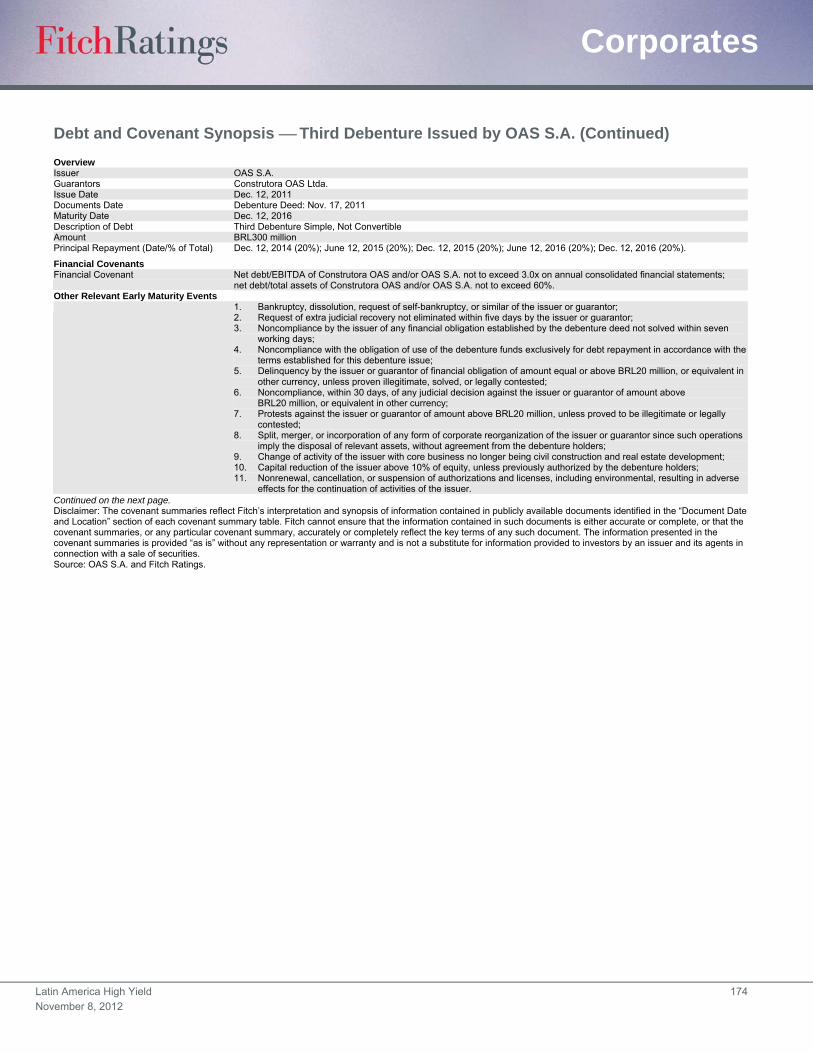
Latin America High Yield 174
November 8, 2012
Corporates
Debt and Covenant Synopsis Third Debenture Issued by OAS S.A. (Continued)
Overview Issuer OAS S.A. Guarantors Construtora OAS Ltda. Issue Date Dec. 12, 2011 Documents Date Debenture Deed: Nov. 17, 2011 Maturity Date Dec. 12, 2016 Description of Debt Third Debenture Simple, Not Convertible Amount BRL300 million Principal Repayment (Date/% of Total) Dec. 12, 2014 (20%); June 12, 2015 (20%); Dec. 12, 2015 (20%); June 12, 2016 (20%); Dec. 12, 2016 (20%).
Financial Covenants Financial Covenant Net debt/EBITDA of Construtora OAS and/or OAS S.A. not to exceed 3.0x on annual consolidated financial statements;
net debt/total assets of Construtora OAS and/or OAS S.A. not to exceed 60%. Other Relevant Early Maturity Events 1. Bankruptcy, dissolution, request of self-bankruptcy, or similar of the issuer or guarantor;
2. Request of extra judicial recovery not eliminated within five days by the issuer or guarantor; 3. Noncompliance by the issuer of any financial obligation established by the debenture deed not solved within seven
working days; 4. Noncompliance with the obligation of use of the debenture funds exclusively for debt repayment in accordance with the
terms established for this debenture issue; 5. Delinquency by the issuer or guarantor of financial obligation of amount equal or above BRL20 million, or equivalent in
other currency, unless proven illegitimate, solved, or legally contested; 6. Noncompliance, within 30 days, of any judicial decision against the issuer or guarantor of amount above
BRL20 million, or equivalent in other currency; 7. Protests against the issuer or guarantor of amount above BRL20 million, unless proved to be illegitimate or legally
contested; 8. Split, merger, or incorporation of any form of corporate reorganization of the issuer or guarantor since such operations
imply the disposal of relevant assets, without agreement from the debenture holders; 9. Change of activity of the issuer with core business no longer being civil construction and real estate development; 10. Capital reduction of the issuer above 10% of equity, unless previously authorized by the debenture holders; 11. Nonrenewal, cancellation, or suspension of authorizations and licenses, including environmental, resulting in adverse
effects for the continuation of activities of the issuer. Continued on the next page. Disclaimer: The covenant summaries reflect Fitch’s interpretation and synopsis of information contained in publicly available documents identified in the “Document Date and Location” section of each covenant summary table. Fitch cannot ensure that the information contained in such documents is either accurate or complete, or that the covenant summaries, or any particular covenant summary, accurately or completely reflect the key terms of any such document. The information presented in the covenant summaries is provided “as is” without any representation or warranty and is not a substitute for information provided to investors by an issuer and its agents in connection with a sale of securities. Source: OAS S.A. and Fitch Ratings.
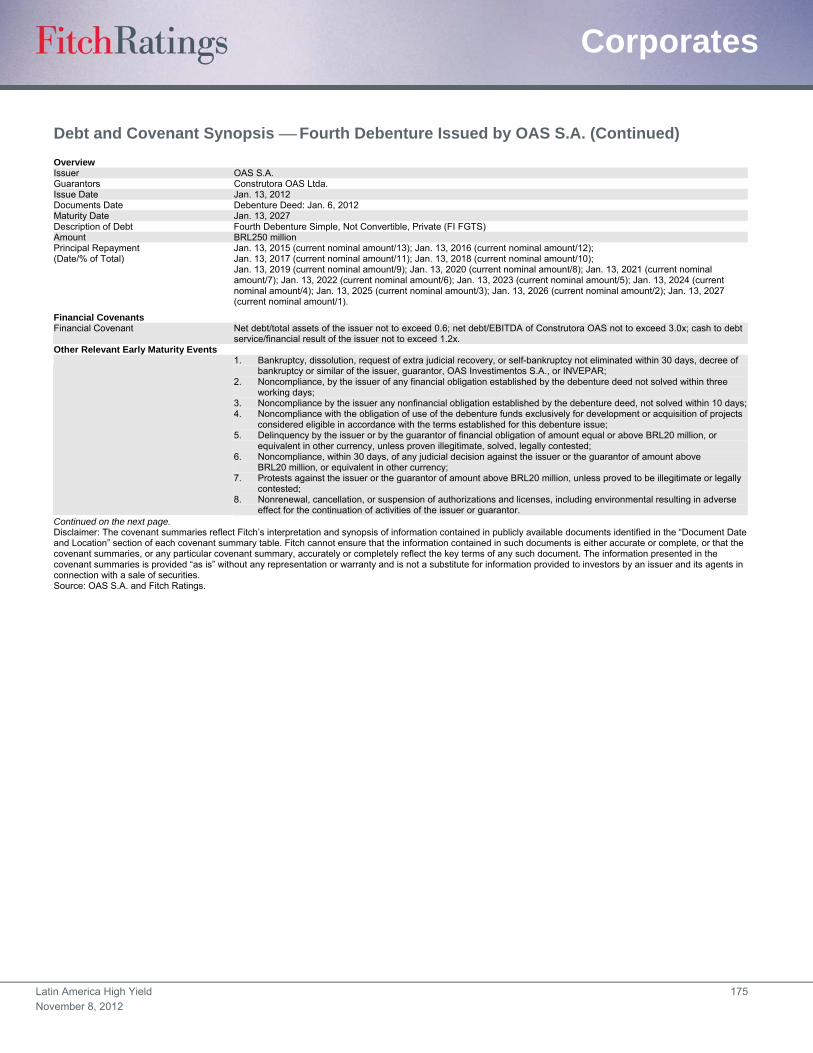
Latin America High Yield 175
November 8, 2012
Corporates
Debt and Covenant Synopsis Fourth Debenture Issued by OAS S.A. (Continued)
Overview Issuer OAS S.A. Guarantors Construtora OAS Ltda. Issue Date Jan. 13, 2012 Documents Date Debenture Deed: Jan. 6, 2012 Maturity Date Jan. 13, 2027 Description of Debt Fourth Debenture Simple, Not Convertible, Private (FI FGTS) Amount BRL250 million Principal Repayment (Date/% of Total)
Jan. 13, 2015 (current nominal amount/13); Jan. 13, 2016 (current nominal amount/12); Jan. 13, 2017 (current nominal amount/11); Jan. 13, 2018 (current nominal amount/10); Jan. 13, 2019 (current nominal amount/9); Jan. 13, 2020 (current nominal amount/8); Jan. 13, 2021 (current nominal amount/7); Jan. 13, 2022 (current nominal amount/6); Jan. 13, 2023 (current nominal amount/5); Jan. 13, 2024 (current nominal amount/4); Jan. 13, 2025 (current nominal amount/3); Jan. 13, 2026 (current nominal amount/2); Jan. 13, 2027 (current nominal amount/1).
Financial Covenants Financial Covenant Net debt/total assets of the issuer not to exceed 0.6; net debt/EBITDA of Construtora OAS not to exceed 3.0x; cash to debt
service/financial result of the issuer not to exceed 1.2x. Other Relevant Early Maturity Events 1. Bankruptcy, dissolution, request of extra judicial recovery, or self-bankruptcy not eliminated within 30 days, decree of
bankruptcy or similar of the issuer, guarantor, OAS Investimentos S.A., or INVEPAR; 2. Noncompliance, by the issuer of any financial obligation established by the debenture deed not solved within three
working days; 3. Noncompliance by the issuer any nonfinancial obligation established by the debenture deed, not solved within 10 days;4. Noncompliance with the obligation of use of the debenture funds exclusively for development or acquisition of projects
considered eligible in accordance with the terms established for this debenture issue; 5. Delinquency by the issuer or by the guarantor of financial obligation of amount equal or above BRL20 million, or
equivalent in other currency, unless proven illegitimate, solved, legally contested; 6. Noncompliance, within 30 days, of any judicial decision against the issuer or the guarantor of amount above
BRL20 million, or equivalent in other currency; 7. Protests against the issuer or the guarantor of amount above BRL20 million, unless proved to be illegitimate or legally
contested; 8. Nonrenewal, cancellation, or suspension of authorizations and licenses, including environmental resulting in adverse
effect for the continuation of activities of the issuer or guarantor. Continued on the next page. Disclaimer: The covenant summaries reflect Fitch’s interpretation and synopsis of information contained in publicly available documents identified in the “Document Date and Location” section of each covenant summary table. Fitch cannot ensure that the information contained in such documents is either accurate or complete, or that the covenant summaries, or any particular covenant summary, accurately or completely reflect the key terms of any such document. The information presented in the covenant summaries is provided “as is” without any representation or warranty and is not a substitute for information provided to investors by an issuer and its agents in connection with a sale of securities. Source: OAS S.A. and Fitch Ratings.
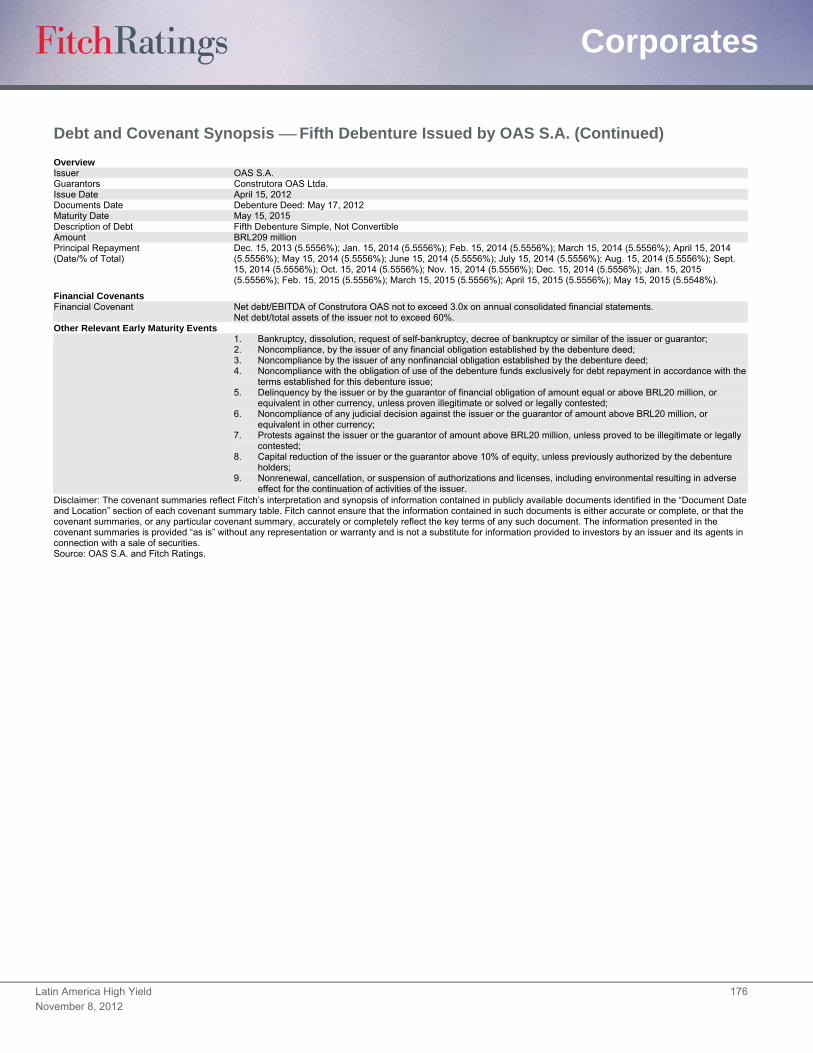
Latin America High Yield 176
November 8, 2012
Corporates
Debt and Covenant Synopsis Fifth Debenture Issued by OAS S.A. (Continued)
Overview Issuer OAS S.A. Guarantors Construtora OAS Ltda. Issue Date April 15, 2012 Documents Date Debenture Deed: May 17, 2012 Maturity Date May 15, 2015 Description of Debt Fifth Debenture Simple, Not Convertible Amount BRL209 million Principal Repayment (Date/% of Total)
Dec. 15, 2013 (5.5556%); Jan. 15, 2014 (5.5556%); Feb. 15, 2014 (5.5556%); March 15, 2014 (5.5556%); April 15, 2014 (5.5556%); May 15, 2014 (5.5556%); June 15, 2014 (5.5556%); July 15, 2014 (5.5556%); Aug. 15, 2014 (5.5556%); Sept. 15, 2014 (5.5556%); Oct. 15, 2014 (5.5556%); Nov. 15, 2014 (5.5556%); Dec. 15, 2014 (5.5556%); Jan. 15, 2015 (5.5556%); Feb. 15, 2015 (5.5556%); March 15, 2015 (5.5556%); April 15, 2015 (5.5556%); May 15, 2015 (5.5548%).
Financial Covenants Financial Covenant Net debt/EBITDA of Construtora OAS not to exceed 3.0x on annual consolidated financial statements.
Net debt/total assets of the issuer not to exceed 60%. Other Relevant Early Maturity Events 1. Bankruptcy, dissolution, request of self-bankruptcy, decree of bankruptcy or similar of the issuer or guarantor;
2. Noncompliance, by the issuer of any financial obligation established by the debenture deed; 3. Noncompliance by the issuer of any nonfinancial obligation established by the debenture deed; 4. Noncompliance with the obligation of use of the debenture funds exclusively for debt repayment in accordance with the
terms established for this debenture issue; 5. Delinquency by the issuer or by the guarantor of financial obligation of amount equal or above BRL20 million, or
equivalent in other currency, unless proven illegitimate or solved or legally contested; 6. Noncompliance of any judicial decision against the issuer or the guarantor of amount above BRL20 million, or
equivalent in other currency; 7. Protests against the issuer or the guarantor of amount above BRL20 million, unless proved to be illegitimate or legally
contested; 8. Capital reduction of the issuer or the guarantor above 10% of equity, unless previously authorized by the debenture
holders; 9. Nonrenewal, cancellation, or suspension of authorizations and licenses, including environmental resulting in adverse
effect for the continuation of activities of the issuer. Disclaimer: The covenant summaries reflect Fitch’s interpretation and synopsis of information contained in publicly available documents identified in the “Document Date and Location” section of each covenant summary table. Fitch cannot ensure that the information contained in such documents is either accurate or complete, or that the covenant summaries, or any particular covenant summary, accurately or completely reflect the key terms of any such document. The information presented in the covenant summaries is provided “as is” without any representation or warranty and is not a substitute for information provided to investors by an issuer and its agents in connection with a sale of securities. Source: OAS S.A. and Fitch Ratings.

Latin America High Yield 177
November 8, 2012
Corporates
Debt and Covenant Synopsis First Debenture Issued by OAS Empreendimentos S.A.
Overview Issuer First Debenture Issued by OAS Empreendimentos S.A. Guarantors OAS S.A. Issue Date Nov. 3, 2010 Documents Date Debenture Deed: Nov. 3, 2009 Maturity Date Nov. 3, 2014 Description of Debt First Debenture Simple, Not Convertible Amount BRL300 Million Real Guarantees Fiduciary lien on shares of single-purposes companies (SPCs) constituted for real estate projects eligible for the transaction
and on financial assets related to the debentures; mortgage of real estate assets acquired with the debenture funds; fiduciary assignment of credit rights represented by eligible receivables and funds as per the terms of the debenture deed.
Principal Repayment (Date/% of Total) Nov. 3, 2012 (20%); May 3, 2013 (20%); Nov. 3, 2013 (20%); May 3, 2014 (20%); Nov. 3, 2014 (20%). Other Relevant Early Maturity Events 1. Bankruptcy, dissolution, request of self-bankruptcy not eliminated within 60 days, decree of bankruptcy or similar of the
issuer, guarantor, or any relevant subsidiary; 2. Request of extra judicial recovery by the issuer, guarantor or any relevant subsidiary; 3. Disposal, providing of guarantee to third party of any asset linked to the real guarantee agreement without previous
agreement from the debenture holders, unless associated to obligation from judicial determination; 4. Noncompliance, by the issuer, guarantor, or relevant subsidiary of any financial obligation established by the
debenture deed not solved within two working days; 5. Noncompliance by the issuer or relevant subsidiary of any nonfinancial obligation established by the debenture deed,
not solved within 30 days; 6. Noncompliance with the obligation of use of the debenture funds exclusively for development or acquisition of projects
considered eligible in accordance with the terms established for this debenture issue; 7. Delinquency by the issuer or by any relevant subsidiary of financial obligation of amount equal or above BRL5 million,
or equivalent in other currency, unless proven illegitimate or solved or legally contested within 30 days; 8. Delinquency by the guarantor of any debt or financial obligation of amount equal or above BRL15 million, or equivalent
in other currency, unless solved or legally contested within 30 days; 9. Noncompliance, within 30 days, of any judicial decision against the issuer or any relevant subsidiary of amount above
BRL5 million, or equivalent in other currency; 10. Protests against the issuer or relevant subsidiary not solved or declared nonlegitimate within 30 days, of amount above
BRL5 million, unless proved to be illegitimate or legally contested; 11. Split, merger, or incorporation or any form of corporate reorganization of the issuer since such operations imply the
disposal of relevant assets, without agreement from the debenture holders; 12. Change of activity of the issuer with core business no longer being civil construction and real estate development; 13. Capital reduction of the issuer above BRL5 million, unless previously authorized by the debenture holders; 14. Nonrenewal, cancellation, or suspension of authorizations and licenses, including environmental resulting in adverse
effect for the continuation of activities of the Issuer or relevant subsidiaries; 15. More than two notches downgrading of the original national scale ‘BBB’ risk classification in November 2009, unless
the issuer presents within 30 days new guarantees subject to approval by the debenture holders in a way as to maintain a risk classification equivalent to ‘BB+’ on the national scale, which, if not obtained, the issuer will have additional 30 days to the redemption and cancellation of the total debenture issue;
16. Sale of the direct or indirect shareholding control of the issuer or the single-purpose companies, which form part of the real guarantees of the debenture issue without previous authorization from the debenture holders.
Continued on the next page. Disclaimers: The covenant summaries reflect Fitch’s interpretation and synopsis of information contained in publicly available documents identified in the “Document Date and Location” section of each covenant summary table. Fitch cannot ensure that the information contained in such documents is either accurate or complete, or that the covenant summaries, or any particular covenant summary, accurately or completely reflect the key terms of any such document. The information presented in the covenant summaries is provided “as is” without any representation or warranty and is not a substitute for information provided to investors by an issuer and its agents in connection with a sale of securities. Source: OAS Empreendimentos and Fitch Ratings.
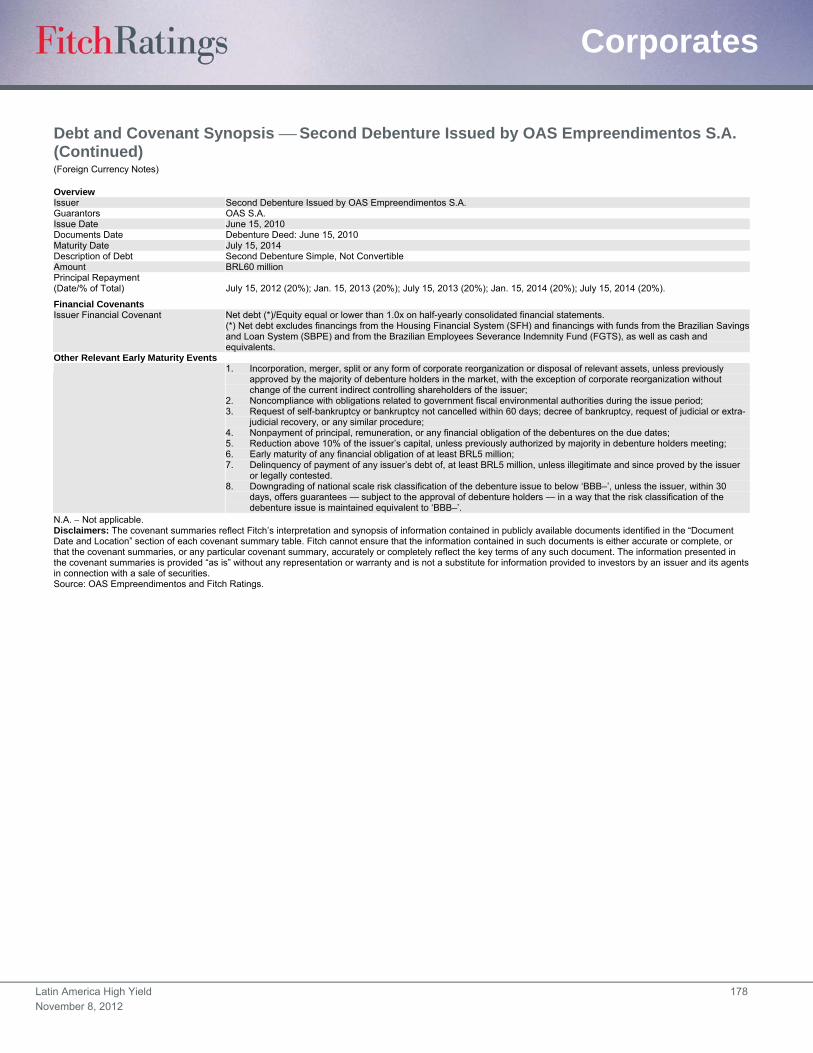
Latin America High Yield 178
November 8, 2012
Corporates
Debt and Covenant Synopsis Second Debenture Issued by OAS Empreendimentos S.A. (Continued) (Foreign Currency Notes)
Overview Issuer Second Debenture Issued by OAS Empreendimentos S.A. Guarantors OAS S.A. Issue Date June 15, 2010 Documents Date Debenture Deed: June 15, 2010 Maturity Date July 15, 2014 Description of Debt Second Debenture Simple, Not Convertible Amount BRL60 million Principal Repayment (Date/% of Total) July 15, 2012 (20%); Jan. 15, 2013 (20%); July 15, 2013 (20%); Jan. 15, 2014 (20%); July 15, 2014 (20%).
Financial Covenants Issuer Financial Covenant Net debt (*)/Equity equal or lower than 1.0x on half-yearly consolidated financial statements.
(*) Net debt excludes financings from the Housing Financial System (SFH) and financings with funds from the Brazilian Savings and Loan System (SBPE) and from the Brazilian Employees Severance Indemnity Fund (FGTS), as well as cash and equivalents.
Other Relevant Early Maturity Events 1. Incorporation, merger, split or any form of corporate reorganization or disposal of relevant assets, unless previously
approved by the majority of debenture holders in the market, with the exception of corporate reorganization without change of the current indirect controlling shareholders of the issuer;
2. Noncompliance with obligations related to government fiscal environmental authorities during the issue period; 3. Request of self-bankruptcy or bankruptcy not cancelled within 60 days; decree of bankruptcy, request of judicial or extra-
judicial recovery, or any similar procedure; 4. Nonpayment of principal, remuneration, or any financial obligation of the debentures on the due dates; 5. Reduction above 10% of the issuer’s capital, unless previously authorized by majority in debenture holders meeting; 6. Early maturity of any financial obligation of at least BRL5 million; 7. Delinquency of payment of any issuer’s debt of, at least BRL5 million, unless illegitimate and since proved by the issuer
or legally contested. 8. Downgrading of national scale risk classification of the debenture issue to below ‘BBB–’, unless the issuer, within 30
days, offers guarantees — subject to the approval of debenture holders — in a way that the risk classification of the debenture issue is maintained equivalent to ‘BBB–’.
N.A. Not applicable. Disclaimers: The covenant summaries reflect Fitch’s interpretation and synopsis of information contained in publicly available documents identified in the “Document Date and Location” section of each covenant summary table. Fitch cannot ensure that the information contained in such documents is either accurate or complete, or that the covenant summaries, or any particular covenant summary, accurately or completely reflect the key terms of any such document. The information presented in the covenant summaries is provided “as is” without any representation or warranty and is not a substitute for information provided to investors by an issuer and its agents in connection with a sale of securities. Source: OAS Empreendimentos and Fitch Ratings.
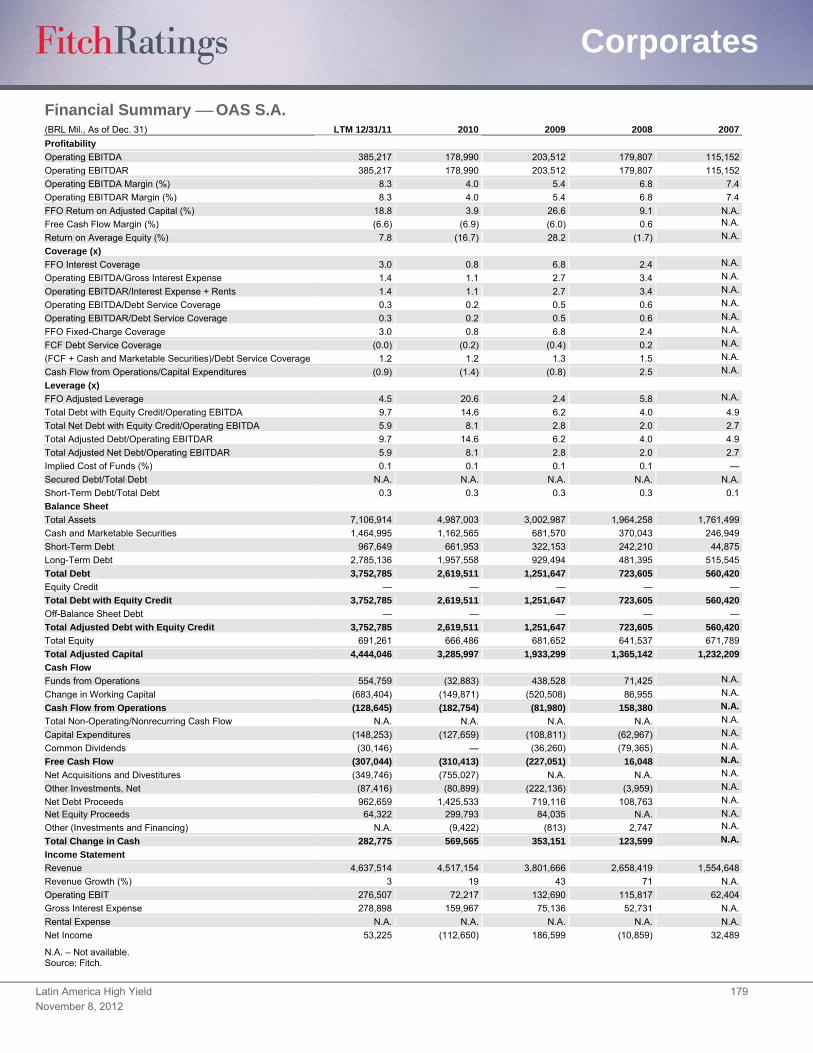
Latin America High Yield 179
November 8, 2012
Corporates
Financial Summary OAS S.A. (BRL Mil., As of Dec. 31) LTM 12/31/11 2010 2009 2008 2007
Profitability
Operating EBITDA 385,217 178,990 203,512 179,807 115,152
Operating EBITDAR 385,217 178,990 203,512 179,807 115,152
Operating EBITDA Margin (%) 8.3 4.0 5.4 6.8 7.4
Operating EBITDAR Margin (%) 8.3 4.0 5.4 6.8 7.4
FFO Return on Adjusted Capital (%) 18.8 3.9 26.6 9.1 N.A.
Free Cash Flow Margin (%) (6.6) (6.9) (6.0) 0.6 N.A.
Return on Average Equity (%) 7.8 (16.7) 28.2 (1.7) N.A.
Coverage (x)
FFO Interest Coverage 3.0 0.8 6.8 2.4 N.A.
Operating EBITDA/Gross Interest Expense 1.4 1.1 2.7 3.4 N.A.
Operating EBITDAR/Interest Expense + Rents 1.4 1.1 2.7 3.4 N.A.
Operating EBITDA/Debt Service Coverage 0.3 0.2 0.5 0.6 N.A.
Operating EBITDAR/Debt Service Coverage 0.3 0.2 0.5 0.6 N.A.
FFO Fixed-Charge Coverage 3.0 0.8 6.8 2.4 N.A.
FCF Debt Service Coverage (0.0) (0.2) (0.4) 0.2 N.A.
(FCF + Cash and Marketable Securities)/Debt Service Coverage 1.2 1.2 1.3 1.5 N.A.
Cash Flow from Operations/Capital Expenditures (0.9) (1.4) (0.8) 2.5 N.A.
Leverage (x)
FFO Adjusted Leverage 4.5 20.6 2.4 5.8 N.A.
Total Debt with Equity Credit/Operating EBITDA 9.7 14.6 6.2 4.0 4.9
Total Net Debt with Equity Credit/Operating EBITDA 5.9 8.1 2.8 2.0 2.7
Total Adjusted Debt/Operating EBITDAR 9.7 14.6 6.2 4.0 4.9
Total Adjusted Net Debt/Operating EBITDAR 5.9 8.1 2.8 2.0 2.7
Implied Cost of Funds (%) 0.1 0.1 0.1 0.1 —
Secured Debt/Total Debt N.A. N.A. N.A. N.A. N.A.
Short-Term Debt/Total Debt 0.3 0.3 0.3 0.3 0.1
Balance Sheet
Total Assets 7,106,914 4,987,003 3,002,987 1,964,258 1,761,499
Cash and Marketable Securities 1,464,995 1,162,565 681,570 370,043 246,949
Short-Term Debt 967,649 661,953 322,153 242,210 44,875
Long-Term Debt 2,785,136 1,957,558 929,494 481,395 515,545
Total Debt 3,752,785 2,619,511 1,251,647 723,605 560,420
Equity Credit — — — — —
Total Debt with Equity Credit 3,752,785 2,619,511 1,251,647 723,605 560,420
Off-Balance Sheet Debt — — — — —
Total Adjusted Debt with Equity Credit 3,752,785 2,619,511 1,251,647 723,605 560,420
Total Equity 691,261 666,486 681,652 641,537 671,789
Total Adjusted Capital 4,444,046 3,285,997 1,933,299 1,365,142 1,232,209
Cash Flow
Funds from Operations 554,759 (32,883) 438,528 71,425 N.A.
Change in Working Capital (683,404) (149,871) (520,508) 86,955 N.A.
Cash Flow from Operations (128,645) (182,754) (81,980) 158,380 N.A.
Total Non-Operating/Nonrecurring Cash Flow N.A. N.A. N.A. N.A. N.A.
Capital Expenditures (148,253) (127,659) (108,811) (62,967) N.A.
Common Dividends (30,146) — (36,260) (79,365) N.A.
Free Cash Flow (307,044) (310,413) (227,051) 16,048 N.A.
Net Acquisitions and Divestitures (349,746) (755,027) N.A. N.A. N.A.
Other Investments, Net (87,416) (80,899) (222,136) (3,959) N.A.
Net Debt Proceeds 962,659 1,425,533 719,116 108,763 N.A.
Net Equity Proceeds 64,322 299,793 84,035 N.A. N.A.
Other (Investments and Financing) N.A. (9,422) (813) 2,747 N.A.
Total Change in Cash 282,775 569,565 353,151 123,599 N.A.
Income Statement
Revenue 4,637,514 4,517,154 3,801,666 2,658,419 1,554,648
Revenue Growth (%) 3 19 43 71 N.A.
Operating EBIT 276,507 72,217 132,690 115,817 62,404
Gross Interest Expense 278,898 159,967 75,136 52,731 N.A.
Rental Expense N.A. N.A. N.A. N.A. N.A.
Net Income 53,225 (112,650) 186,599 (10,859) 32,489
N.A. – Not available. Source: Fitch.
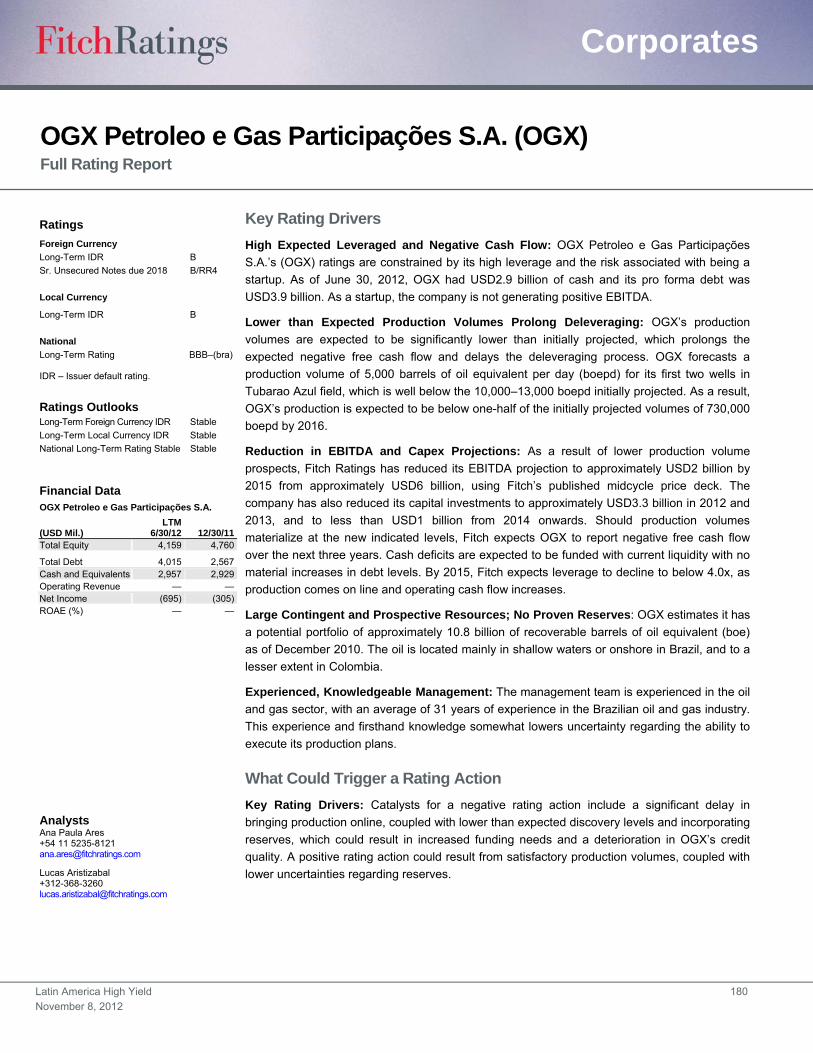
Latin America High Yield 180
November 8, 2012
Corporates
OGX Petroleo e Gas Participações S.A. (OGX) Full Rating Report
Key Rating Drivers
High Expected Leveraged and Negative Cash Flow: OGX Petroleo e Gas Participações
S.A.’s (OGX) ratings are constrained by its high leverage and the risk associated with being a
startup. As of June 30, 2012, OGX had USD2.9 billion of cash and its pro forma debt was
USD3.9 billion. As a startup, the company is not generating positive EBITDA.
Lower than Expected Production Volumes Prolong Deleveraging: OGX’s production
volumes are expected to be significantly lower than initially projected, which prolongs the
expected negative free cash flow and delays the deleveraging process. OGX forecasts a
production volume of 5,000 barrels of oil equivalent per day (boepd) for its first two wells in
Tubarao Azul field, which is well below the 10,000–13,000 boepd initially projected. As a result,
OGX’s production is expected to be below one-half of the initially projected volumes of 730,000
boepd by 2016.
Reduction in EBITDA and Capex Projections: As a result of lower production volume
prospects, Fitch Ratings has reduced its EBITDA projection to approximately USD2 billion by
2015 from approximately USD6 billion, using Fitch’s published midcycle price deck. The
company has also reduced its capital investments to approximately USD3.3 billion in 2012 and
2013, and to less than USD1 billion from 2014 onwards. Should production volumes
materialize at the new indicated levels, Fitch expects OGX to report negative free cash flow
over the next three years. Cash deficits are expected to be funded with current liquidity with no
material increases in debt levels. By 2015, Fitch expects leverage to decline to below 4.0x, as
production comes on line and operating cash flow increases.
Large Contingent and Prospective Resources; No Proven Reserves: OGX estimates it has
a potential portfolio of approximately 10.8 billion of recoverable barrels of oil equivalent (boe)
as of December 2010. The oil is located mainly in shallow waters or onshore in Brazil, and to a
lesser extent in Colombia.
Experienced, Knowledgeable Management: The management team is experienced in the oil
and gas sector, with an average of 31 years of experience in the Brazilian oil and gas industry.
This experience and firsthand knowledge somewhat lowers uncertainty regarding the ability to
execute its production plans.
What Could Trigger a Rating Action
Key Rating Drivers: Catalysts for a negative rating action include a significant delay in
bringing production online, coupled with lower than expected discovery levels and incorporating
reserves, which could result in increased funding needs and a deterioration in OGX’s credit
quality. A positive rating action could result from satisfactory production volumes, coupled with
lower uncertainties regarding reserves.
Ratings
Foreign Currency
Long-Term IDR B
Sr. Unsecured Notes due 2018 B/RR4
Local Currency
Long-Term IDR B
National
Long-Term Rating BBB–(bra)
IDR – Issuer default rating.
Ratings Outlooks
Long-Term Foreign Currency IDR Stable
Long-Term Local Currency IDR Stable
National Long-Term Rating Stable Stable
Financial Data OGX Petroleo e Gas Participações S.A.
(USD Mil.) LTM
6/30/12 12/30/11 Total Equity 4,159 4,760
Total Debt 4,015 2,567 Cash and Equivalents 2,957 2,929 Operating Revenue — — Net Income (695) (305) ROAE (%) — —
Analysts Ana Paula Ares +54 11 5235-8121 [email protected]
Lucas Aristizabal +312-368-3260 [email protected]

Latin America High Yield 181
November 8, 2012
Corporates
Recovery Rating
The recovery ratings for OGX’s capital market debt instruments reflect Fitch’s expectation that
the company’s creditors would have an average recovery, constrained by the soft cap of ‘RR4’
for bonds issued by Brazilian corporates.
Using Fitch’s notching methodology, bondholder recovery value was assessed using the
liquidation value of reserves, in line with Fitch’s sector-specific rating recovery methodology for
oil and gas, detailed in the special report, “U.S. Exploration and Production Recovery Rating
Methodology,” published March 20, 2008. Under this scenario, Fitch used a USD10/boe
reserve value for the company’s prospective resources.
Fitch has considered, for the purpose of the recovery analysis, potential proved reserves
equivalent to 1 billion barrels of oil equivalent given that the company is in its developmental
phase and there are no proven certified reserves up to date. This translates into a gross
liquidation value of USD10 billion prior to administrative claims and concession payments to
junior claimants. The 1 billion boe of potential reserves represents approximately 10% of OGX
estimated prospective resources of 10.8 billion boe as of December 2010.
Recovery Analysis OGX Petroleo e Gas Participações S.A. (OGX) (Mil.) IDR: B
Going Concern Enterprise Value Liquidation Value AdvanceRate (%)
Available toCreditors
LTM EBITDA as of June 30, 2012 — Cash — 0 —Discount (%) — Accounts Receivable — 80 —Post-Restructuring EBITDA Estimation — Inventory — 50 —Multiple (x) — Value of 1P Oil Reserves 10,000 100 10,000Going Concern Enterprise Value — Total 10,000 10,000 Post-Restructuring EBITDA Estimation Guidelines Interest Expense — Enterprise Value for Claims Distribution Rent Expense — Greater of Going Concern Enterprise or Liquidation Value 10,000Estimated Maintenance Capital Expenditures — Less Administrative Claims (10%) 1000Total Adjusted Enterprise Value for Claims 9,000 Distribution of Value
Secured Priority Lien Value Recovered Recovery (%)Recovery
Rating Notching Rating
Senior Secured — — — — — —Secured — — — — — — Concession Payment Availability Table The amount of concession payments is highly dependent on Adjusted Enterprise Value for Claims 9,000 circumstances, but Fitch typically allows up to 5% of the recovery Less Secured Debt Recovery — value available to senior unsecured creditors to be allocated to Remaining Recovery for Unsecured Claims 9,000 concession payments. Concession payments allocated to subordinated Concession Allocation (5%) 450 debt should never result in higher recoveries than those of senior Value to be Distributed to Senior Unsecured Claims 8,550 unsecured debt.
Unsecured Priority Lien Value
RecoveredRecovery
(%)Concession
Allocation (%)Recovery
Rating Notching Rating
Senior Unsecured 4,015 4,015 100 100 RR4 0 BUnsecured — — — — — — —
Source: Fitch.

Latin America High Yield 182
November 8, 2012
Corporates
Debt and Covenant Synopsis OGX Petroleo e Gas Participações S.A. (OGX) (Foreign Currency Notes)
Overview Issuer OGX Austria GmbH OGX Austria GmbH Guarantors OGX and OGX Petroleo e Gas Ltda. OGX and OGX Petroleo e Gas Ltda. Document Date May 26, 2011 March 27, 2012 Maturity Date 2018 2022 Description of Debt Senior Unsecured Notes Senior Unsecured Notes
Financial Covenants Consolidated Leverage (Maximum)
Net debt to EBITDA equal or lower than 3.5x or total debt higher than USD4 billion.
Net debt to EBITDA equal or lower than 3.5x or total debt higher than USD4 billion.
Interest Coverage (Minimum) N.A. N.A.
Acquisitions/Divestitures Change of Control Provision Change of control clause at 101% of principal plus accrued and unpaid
interest. Change of control clause at 101% of principal plus accrued and unpaid interest.
Sale of Assets Restriction The issuer and its restricted subsidiaries cannot sell assets unless the asset sale is for fair market value and at least 75% is paid in cash (some exceptions are contemplated). If, following 365 days upon receipt, proceeds from asset sales have not been applied to purchase the notes or repay debt, proceeds of less than USD50 million will be accumulated or proceeds equal or in excess of such amount will be applied to make an offer to purchase the notes at 100% of principal plus accrued interest.
The issuer and its restricted subsidiaries cannot sell assets unless the asset sale is for fair market value and at least 75% is paid in cash (some exceptions are contemplated). If, following 365 days upon receipt, proceeds from asset sales have not been applied to purchase the notes or repay debt, proceeds of less than USD50 million will be accumulated or proceeds equal or in excess of such amount will be applied to make an offer to purchase the notes at 100% of principal plus accrued interest.
Debt Restriction Additional Debt Restriction The issuer and restricted subsidiaries may incur permitted debt, subject
to standard limitations, provided that following such transaction total net debt does not exceed USD4 billion and net debt to EBITDA does not exceed 3.5x.
The issuer and restricted subsidiaries may incur permitted debt, subject to standard limitations, provided that following such transaction total net debt does not exceed USD4 billion and net debt to EBITDA does not exceed 3.5x.
Limitation on Secured Debt The issuer and its restricted subsidiaries are allowed to incur customary permitted liens, related to the normal course of business. These include a debt not to exceed the greater of USD1.5 billion and 15% of consolidated assets.
The issuer and its restricted subsidiaries are allowed to incur customary permitted liens, related to the normal course of business. These include a debt not to exceed the greater of USD1.5 billion and 15% of consolidated assets.
Restricted Payments The issuer and its restricted subsidiaries are allowed to make restricted payments if, among other things: no event of default occurs or is continuing, the issuer could incur in additional debt after such transaction, total restricted payments since the notes issuance do not exceed a certain amount, and the restricted payment does not exceed the greater of USD300 million and 3% of consolidated assets. Dividend payments are limited to 25% of consolidated net income and the minimum legally required dividend.
The issuer and its restricted subsidiaries are allowed to make restricted payments if, amongst other things: no event of default occurs or is continuing, the issuer could incur in additional debt after such transaction, and total restricted payments since the notes issuance do not exceed a certain amount. Dividend payments are limited to 25% of consolidated net income and the minimum legally required dividend.
Other Cross Default Default by the company or significant subsidiary on principal or interest of
USD100 million or more, acceleration of a debt prior to its maturity in the same amount.
Default by the company or significant subsidiary on principal or interest of USD75 million or more, acceleration of a debt prior to its maturity in the same amount.
Acceleration If any event of default occurs and is continuing, the trustee or the holders of at least 25% of the outstanding notes may declare the notes to be due and payable. Notes become automatically due and payable upon certain events of insolvency or bankruptcy.
If any event of default occurs and is continuing, the trustee or the holders of at least 25% of the outstanding notes may declare the notes to be due and payable. Notes become automatically due and payable upon certain events of insolvency or bankruptcy.
Restriction on Purchase of Notes
On or after June 1, 2015, the issuer may elect to redeem the notes in whole or in part at the following prices, expressed as a percentage of nominal value: 2015: 104,25%, 2016:102,125%, 2017 and thereafter 100%. Before June 1, 2015, the issuer may also redeem the notes in whole or in part based on a make-whole premium plus accrued and unpaid interest. The redemption price will equal 100% of principal amount plus the greater of: 1) 1% of the outstanding amount of the notes and 2) the excess of the present value of the redemption Price at 2015 over the outstanding principal amount of the notes. Any redemption of the notes will be subject to either (1) there being at least USD150 million in aggregate principal amount of notes outstanding after such redemption or (2) the issuer redeeming all the then outstanding principal amount of the notes. In the event of changes in the withholding taxes laws, the issuer may redeem the outstanding notes in whole, but not in part, at 100% of the principal amount thereof plus accrued and unpaid interest to the redemption date.
On or after April 1, 2017, the issuer may elect to redeem the notes in whole or in part at the following prices, expressed as percentage of nominal value: 2017: 104.188%, 2018:102,792%, 2019: 101,396, 2020 and thereafter 100%. Before April 1, 2017, the issuer may also redeem the notes in whole or in part based on a make-whole premium plus accrued and unpaid interest. The redemption Price will equal 100% of principal amount plus the greater of: 1) 1% of the outstanding amount of the notes and 2) the excess of the present value of the redemption Price at 2017 over the outstanding principal amount of the notes. Any redemption of the notes will be subject to either (1) there being at least USD150 million in aggregate principal amount of notes outstanding after such redemption or (2) the issuer redeeming all the then outstanding principal amount of the notes. In the event of changes in the withholding taxes laws, the issuer may redeem the outstanding notes in whole, but not in part, at 100% of the principal amount thereof plus accrued and unpaid interest to the redemption date.
N.A. Not applicable. Continued on next page. Disclaimers: The covenant summaries reflect Fitch’s interpretation and synopsis of information contained in publicly available documents identified in the “Document Date and Location” section of each covenant summary table. Fitch cannot ensure that the information contained in such documents is either accurate or complete, or that the covenant summaries, or any particular covenant summary, accurately or completely reflect the key terms of any such document. The information presented in the covenant summaries is provided “as is” without any representation or warranty and is not a substitute for information provided to investors by an issuer and its agents in connection with a sale of securities. Source: Company and Fitch Ratings.
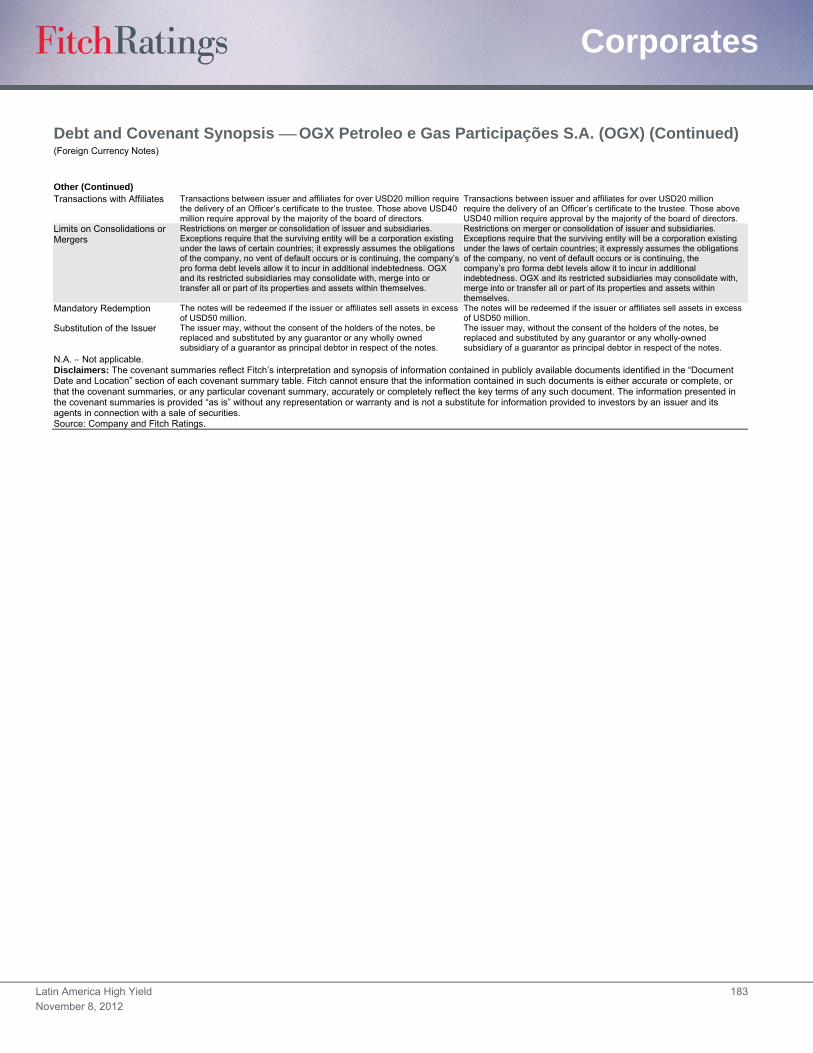
Latin America High Yield 183
November 8, 2012
Corporates
Debt and Covenant Synopsis OGX Petroleo e Gas Participações S.A. (OGX) (Continued) (Foreign Currency Notes)
Other (Continued) Transactions with Affiliates Transactions between issuer and affiliates for over USD20 million require
the delivery of an Officer’s certificate to the trustee. Those above USD40 million require approval by the majority of the board of directors.
Transactions between issuer and affiliates for over USD20 million require the delivery of an Officer’s certificate to the trustee. Those above USD40 million require approval by the majority of the board of directors.
Limits on Consolidations or Mergers
Restrictions on merger or consolidation of issuer and subsidiaries. Exceptions require that the surviving entity will be a corporation existing under the laws of certain countries; it expressly assumes the obligations of the company, no vent of default occurs or is continuing, the company’s pro forma debt levels allow it to incur in additional indebtedness. OGX and its restricted subsidiaries may consolidate with, merge into or transfer all or part of its properties and assets within themselves.
Restrictions on merger or consolidation of issuer and subsidiaries. Exceptions require that the surviving entity will be a corporation existing under the laws of certain countries; it expressly assumes the obligations of the company, no vent of default occurs or is continuing, the company’s pro forma debt levels allow it to incur in additional indebtedness. OGX and its restricted subsidiaries may consolidate with, merge into or transfer all or part of its properties and assets within themselves.
Mandatory Redemption The notes will be redeemed if the issuer or affiliates sell assets in excess of USD50 million.
The notes will be redeemed if the issuer or affiliates sell assets in excess of USD50 million.
Substitution of the Issuer The issuer may, without the consent of the holders of the notes, be replaced and substituted by any guarantor or any wholly owned subsidiary of a guarantor as principal debtor in respect of the notes.
The issuer may, without the consent of the holders of the notes, be replaced and substituted by any guarantor or any wholly-owned subsidiary of a guarantor as principal debtor in respect of the notes.
N.A. Not applicable. Disclaimers: The covenant summaries reflect Fitch’s interpretation and synopsis of information contained in publicly available documents identified in the “Document Date and Location” section of each covenant summary table. Fitch cannot ensure that the information contained in such documents is either accurate or complete, or that the covenant summaries, or any particular covenant summary, accurately or completely reflect the key terms of any such document. The information presented in the covenant summaries is provided “as is” without any representation or warranty and is not a substitute for information provided to investors by an issuer and its agents in connection with a sale of securities. Source: Company and Fitch Ratings.
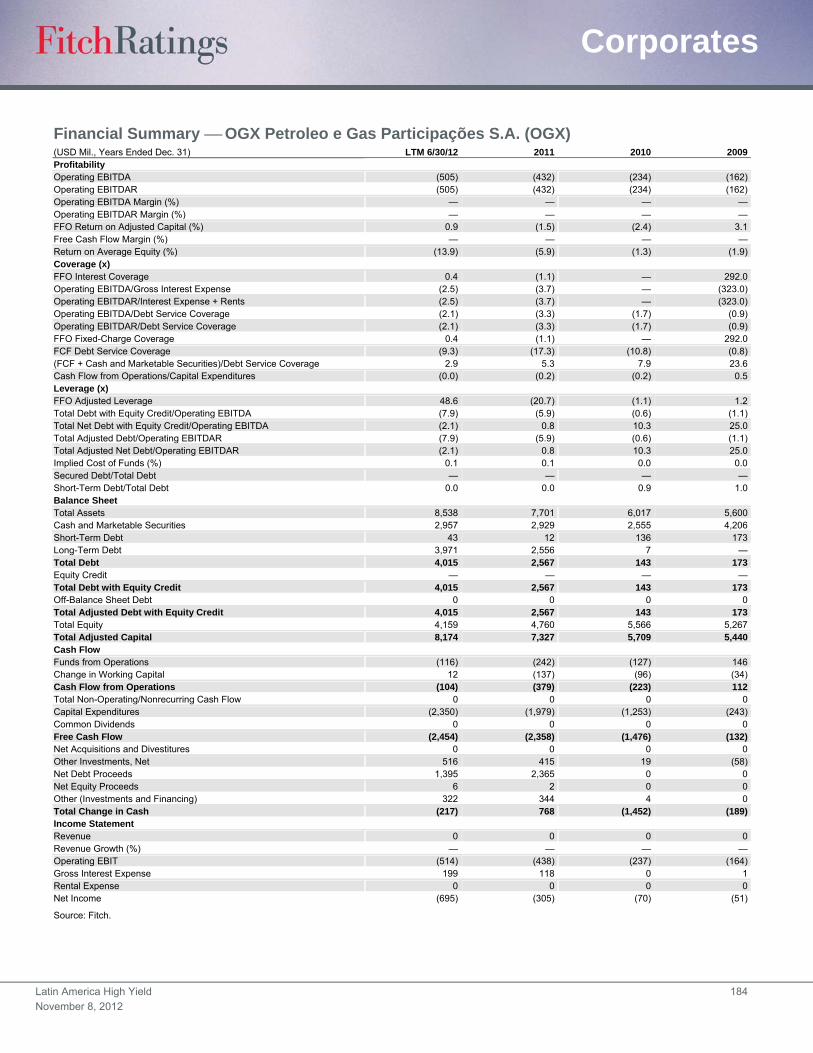
Latin America High Yield 184
November 8, 2012
Corporates
Financial Summary OGX Petroleo e Gas Participações S.A. (OGX) (USD Mil., Years Ended Dec. 31) LTM 6/30/12 2011 2010 2009Profitability Operating EBITDA (505) (432) (234) (162)Operating EBITDAR (505) (432) (234) (162)Operating EBITDA Margin (%) — — — —Operating EBITDAR Margin (%) — — — —FFO Return on Adjusted Capital (%) 0.9 (1.5) (2.4) 3.1Free Cash Flow Margin (%) — — — —Return on Average Equity (%) (13.9) (5.9) (1.3) (1.9)Coverage (x) FFO Interest Coverage 0.4 (1.1) — 292.0 Operating EBITDA/Gross Interest Expense (2.5) (3.7) — (323.0)Operating EBITDAR/Interest Expense + Rents (2.5) (3.7) — (323.0)Operating EBITDA/Debt Service Coverage (2.1) (3.3) (1.7) (0.9)Operating EBITDAR/Debt Service Coverage (2.1) (3.3) (1.7) (0.9)FFO Fixed-Charge Coverage 0.4 (1.1) — 292.0 FCF Debt Service Coverage (9.3) (17.3) (10.8) (0.8)(FCF + Cash and Marketable Securities)/Debt Service Coverage 2.9 5.3 7.9 23.6 Cash Flow from Operations/Capital Expenditures (0.0) (0.2) (0.2) 0.5 Leverage (x) FFO Adjusted Leverage 48.6 (20.7) (1.1) 1.2 Total Debt with Equity Credit/Operating EBITDA (7.9) (5.9) (0.6) (1.1)Total Net Debt with Equity Credit/Operating EBITDA (2.1) 0.8 10.3 25.0 Total Adjusted Debt/Operating EBITDAR (7.9) (5.9) (0.6) (1.1)Total Adjusted Net Debt/Operating EBITDAR (2.1) 0.8 10.3 25.0 Implied Cost of Funds (%) 0.1 0.1 0.0 0.0 Secured Debt/Total Debt — — — —Short-Term Debt/Total Debt 0.0 0.0 0.9 1.0 Balance Sheet Total Assets 8,538 7,701 6,017 5,600 Cash and Marketable Securities 2,957 2,929 2,555 4,206 Short-Term Debt 43 12 136 173 Long-Term Debt 3,971 2,556 7 —Total Debt 4,015 2,567 143 173 Equity Credit — — — —Total Debt with Equity Credit 4,015 2,567 143 173 Off-Balance Sheet Debt 0 0 0 0 Total Adjusted Debt with Equity Credit 4,015 2,567 143 173 Total Equity 4,159 4,760 5,566 5,267 Total Adjusted Capital 8,174 7,327 5,709 5,440 Cash Flow Funds from Operations (116) (242) (127) 146 Change in Working Capital 12 (137) (96) (34)Cash Flow from Operations (104) (379) (223) 112 Total Non-Operating/Nonrecurring Cash Flow 0 0 0 0 Capital Expenditures (2,350) (1,979) (1,253) (243)Common Dividends 0 0 0 0 Free Cash Flow (2,454) (2,358) (1,476) (132)Net Acquisitions and Divestitures 0 0 0 0 Other Investments, Net 516 415 19 (58)Net Debt Proceeds 1,395 2,365 0 0 Net Equity Proceeds 6 2 0 0 Other (Investments and Financing) 322 344 4 0 Total Change in Cash (217) 768 (1,452) (189)Income Statement Revenue 0 0 0 0 Revenue Growth (%) — — — —Operating EBIT (514) (438) (237) (164)Gross Interest Expense 199 118 0 1 Rental Expense 0 0 0 0 Net Income (695) (305) (70) (51)
Source: Fitch.
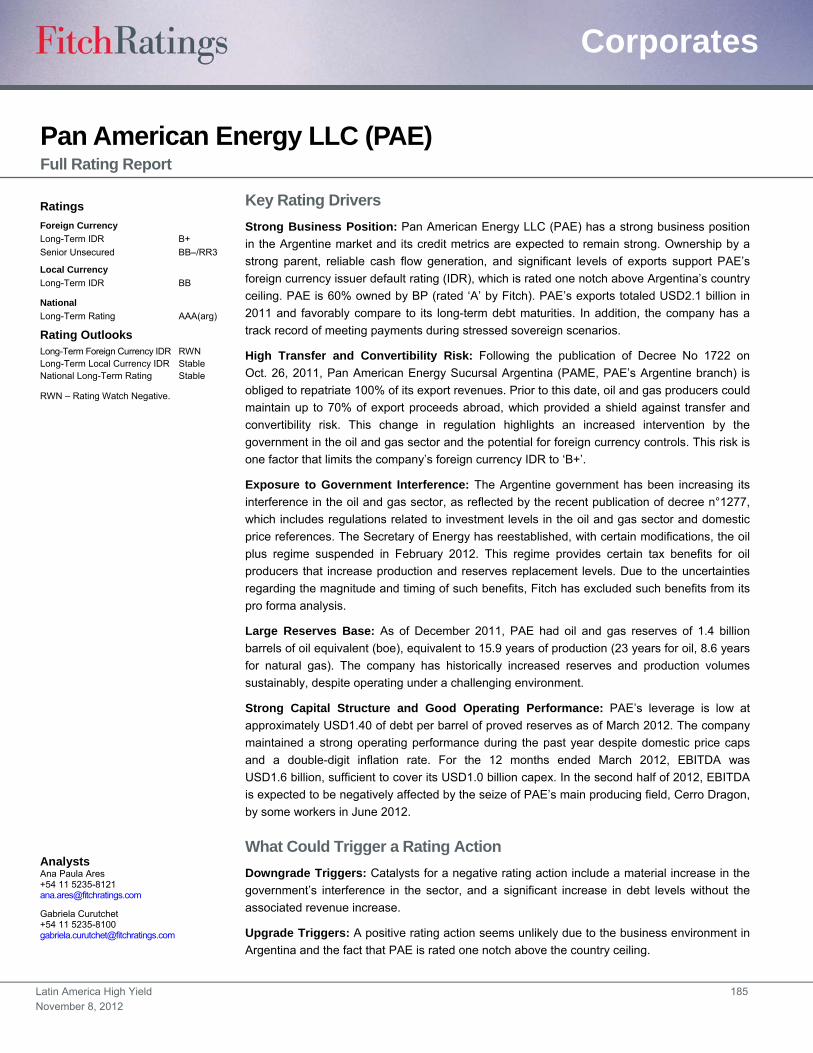
Latin America High Yield 185
November 8, 2012
Corporates
Pan American Energy LLC (PAE) Full Rating Report
Key Rating Drivers
Strong Business Position: Pan American Energy LLC (PAE) has a strong business position
in the Argentine market and its credit metrics are expected to remain strong. Ownership by a
strong parent, reliable cash flow generation, and significant levels of exports support PAE’s
foreign currency issuer default rating (IDR), which is rated one notch above Argentina’s country
ceiling. PAE is 60% owned by BP (rated ‘A’ by Fitch). PAE’s exports totaled USD2.1 billion in
2011 and favorably compare to its long-term debt maturities. In addition, the company has a
track record of meeting payments during stressed sovereign scenarios.
High Transfer and Convertibility Risk: Following the publication of Decree No 1722 on
Oct. 26, 2011, Pan American Energy Sucursal Argentina (PAME, PAE’s Argentine branch) is
obliged to repatriate 100% of its export revenues. Prior to this date, oil and gas producers could
maintain up to 70% of export proceeds abroad, which provided a shield against transfer and
convertibility risk. This change in regulation highlights an increased intervention by the
government in the oil and gas sector and the potential for foreign currency controls. This risk is
one factor that limits the company’s foreign currency IDR to ‘B+’.
Exposure to Government Interference: The Argentine government has been increasing its
interference in the oil and gas sector, as reflected by the recent publication of decree n°1277,
which includes regulations related to investment levels in the oil and gas sector and domestic
price references. The Secretary of Energy has reestablished, with certain modifications, the oil
plus regime suspended in February 2012. This regime provides certain tax benefits for oil
producers that increase production and reserves replacement levels. Due to the uncertainties
regarding the magnitude and timing of such benefits, Fitch has excluded such benefits from its
pro forma analysis.
Large Reserves Base: As of December 2011, PAE had oil and gas reserves of 1.4 billion
barrels of oil equivalent (boe), equivalent to 15.9 years of production (23 years for oil, 8.6 years
for natural gas). The company has historically increased reserves and production volumes
sustainably, despite operating under a challenging environment.
Strong Capital Structure and Good Operating Performance: PAE’s leverage is low at
approximately USD1.40 of debt per barrel of proved reserves as of March 2012. The company
maintained a strong operating performance during the past year despite domestic price caps
and a double-digit inflation rate. For the 12 months ended March 2012, EBITDA was
USD1.6 billion, sufficient to cover its USD1.0 billion capex. In the second half of 2012, EBITDA
is expected to be negatively affected by the seize of PAE’s main producing field, Cerro Dragon,
by some workers in June 2012.
What Could Trigger a Rating Action
Downgrade Triggers: Catalysts for a negative rating action include a material increase in the
government’s interference in the sector, and a significant increase in debt levels without the
associated revenue increase.
Upgrade Triggers: A positive rating action seems unlikely due to the business environment in
Argentina and the fact that PAE is rated one notch above the country ceiling.
Ratings
Foreign Currency
Long-Term IDR B+
Senior Unsecured BB–/RR3
Local Currency
Long-Term IDR BB
National
Long-Term Rating AAA(arg)
Rating Outlooks Long-Term Foreign Currency IDR RWN Long-Term Local Currency IDR Stable National Long-Term Rating Stable
RWN – Rating Watch Negative.
Analysts Ana Paula Ares +54 11 5235-8121 [email protected]
Gabriela Curutchet +54 11 5235-8100 [email protected]
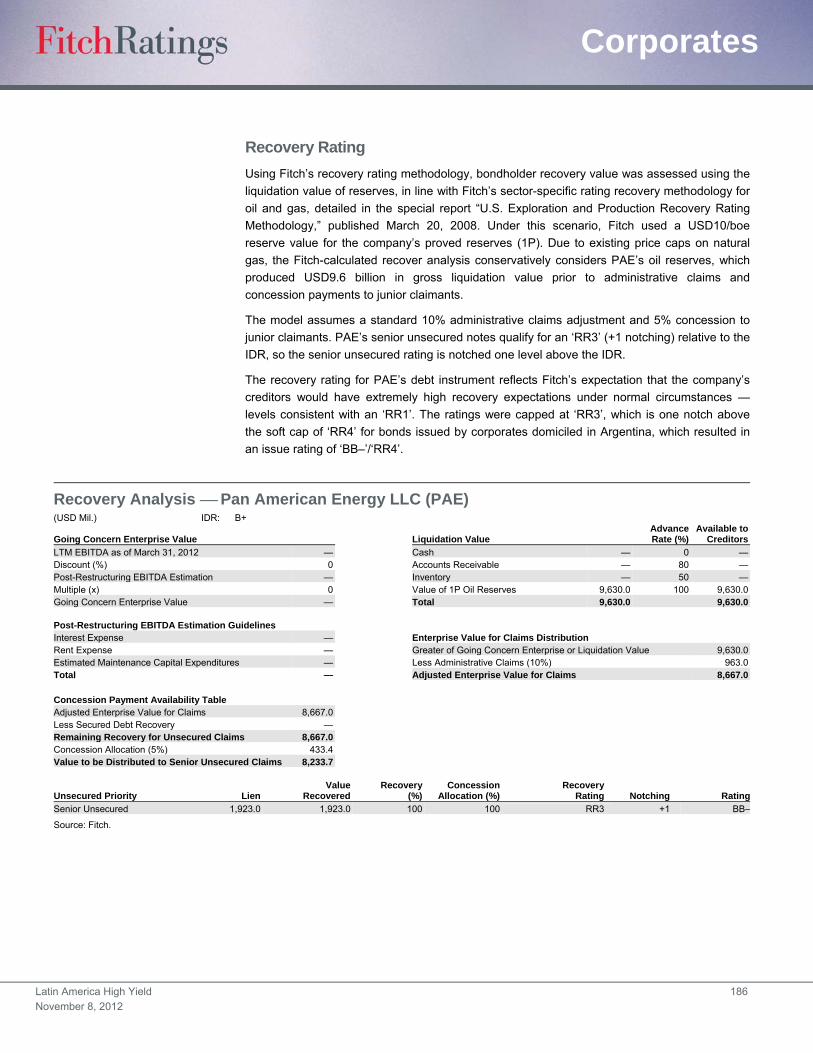
Latin America High Yield 186
November 8, 2012
Corporates
Recovery Rating
Using Fitch’s recovery rating methodology, bondholder recovery value was assessed using the
liquidation value of reserves, in line with Fitch’s sector-specific rating recovery methodology for
oil and gas, detailed in the special report “U.S. Exploration and Production Recovery Rating
Methodology,” published March 20, 2008. Under this scenario, Fitch used a USD10/boe
reserve value for the company’s proved reserves (1P). Due to existing price caps on natural
gas, the Fitch-calculated recover analysis conservatively considers PAE’s oil reserves, which
produced USD9.6 billion in gross liquidation value prior to administrative claims and
concession payments to junior claimants.
The model assumes a standard 10% administrative claims adjustment and 5% concession to
junior claimants. PAE’s senior unsecured notes qualify for an ‘RR3’ (+1 notching) relative to the
IDR, so the senior unsecured rating is notched one level above the IDR.
The recovery rating for PAE’s debt instrument reflects Fitch’s expectation that the company’s
creditors would have extremely high recovery expectations under normal circumstances —
levels consistent with an ‘RR1’. The ratings were capped at ‘RR3’, which is one notch above
the soft cap of ‘RR4’ for bonds issued by corporates domiciled in Argentina, which resulted in
an issue rating of ‘BB–’/‘RR4’.
Recovery Analysis Pan American Energy LLC (PAE) (USD Mil.) IDR: B+
Going Concern Enterprise Value Liquidation Value AdvanceRate (%)
Available toCreditors
LTM EBITDA as of March 31, 2012 — Cash — 0 —Discount (%) 0 Accounts Receivable — 80 —Post-Restructuring EBITDA Estimation — Inventory — 50 —Multiple (x) 0 Value of 1P Oil Reserves 9,630.0 100 9,630.0Going Concern Enterprise Value — Total 9,630.0 9,630.0 Post-Restructuring EBITDA Estimation Guidelines Interest Expense — Enterprise Value for Claims Distribution Rent Expense — Greater of Going Concern Enterprise or Liquidation Value 9,630.0Estimated Maintenance Capital Expenditures — Less Administrative Claims (10%) 963.0Total — Adjusted Enterprise Value for Claims 8,667.0 Concession Payment Availability Table Adjusted Enterprise Value for Claims 8,667.0 Less Secured Debt Recovery — Remaining Recovery for Unsecured Claims 8,667.0 Concession Allocation (5%) 433.4 Value to be Distributed to Senior Unsecured Claims 8,233.7
Unsecured Priority Lien Value
RecoveredRecovery
(%)Concession
Allocation (%)Recovery
Rating Notching Rating
Senior Unsecured 1,923.0 1,923.0 100 100 RR3 +1 BB–
Source: Fitch.
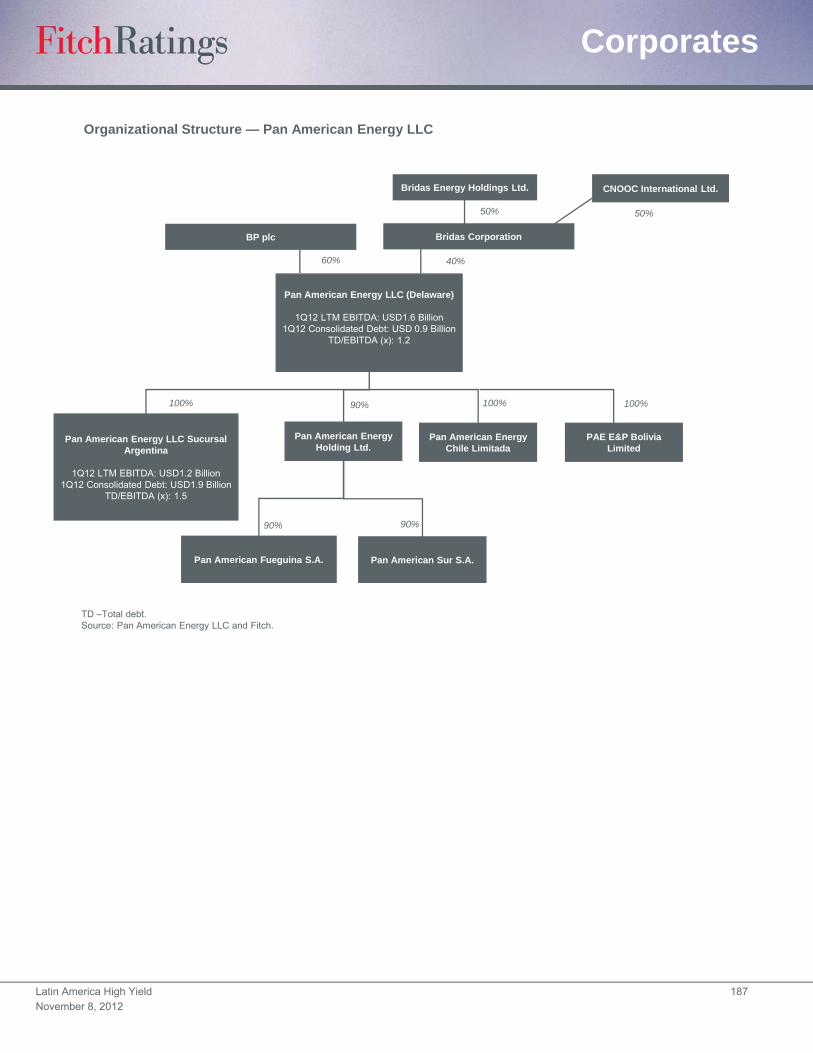
Latin America High Yield 187
November 8, 2012
Corporates
Organizational Structure — Pan American Energy LLC
TD –Total debt. Source: Pan American Energy LLC and Fitch.
Pan American Energy LLC (Delaware)
1Q12 LTM EBITDA: USD1.6 Billion1Q12 Consolidated Debt: USD 0.9 Billion
TD/EBITDA (x): 1.2
Pan American Energy Chile Limitada
Pan American Energy LLC SucursalArgentina
1Q12 LTM EBITDA: USD1.2 Billion1Q12 Consolidated Debt: USD1.9 Billion
TD/EBITDA (x): 1.5
Pan American Fueguina S.A.
Pan American Energy Holding Ltd.
90% 100%
Pan American Sur S.A.
100%
1Q12: EBITDA xx Million90% 90%
BP plc Bridas Corporation
Bridas Energy Holdings Ltd. CNOOC International Ltd.
60% 40%
50% 50%
PAE E&P Bolivia Limited
100%
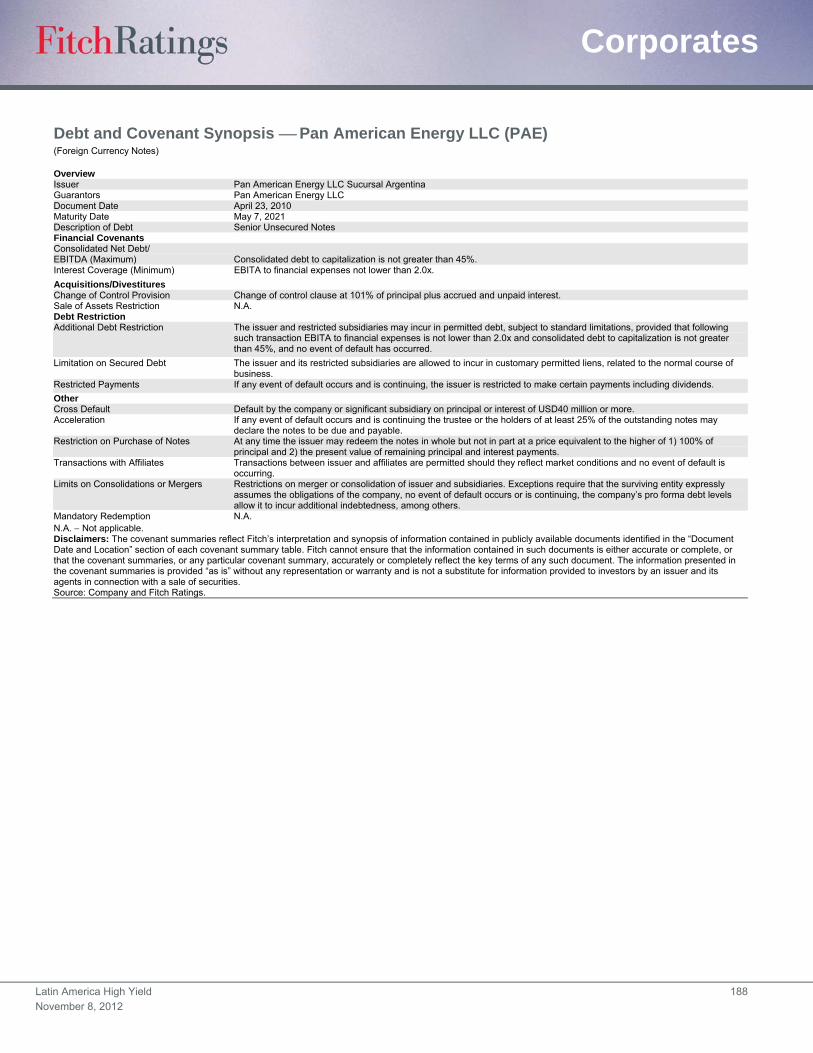
Latin America High Yield 188
November 8, 2012
Corporates
Debt and Covenant Synopsis Pan American Energy LLC (PAE) (Foreign Currency Notes)
Overview Issuer Pan American Energy LLC Sucursal Argentina Guarantors Pan American Energy LLC Document Date April 23, 2010 Maturity Date May 7, 2021 Description of Debt Senior Unsecured Notes Financial Covenants Consolidated Net Debt/ EBITDA (Maximum) Consolidated debt to capitalization is not greater than 45%. Interest Coverage (Minimum) EBITA to financial expenses not lower than 2.0x.
Acquisitions/Divestitures Change of Control Provision Change of control clause at 101% of principal plus accrued and unpaid interest. Sale of Assets Restriction N.A. Debt Restriction Additional Debt Restriction The issuer and restricted subsidiaries may incur in permitted debt, subject to standard limitations, provided that following
such transaction EBITA to financial expenses is not lower than 2.0x and consolidated debt to capitalization is not greater than 45%, and no event of default has occurred.
Limitation on Secured Debt The issuer and its restricted subsidiaries are allowed to incur in customary permitted liens, related to the normal course of business.
Restricted Payments If any event of default occurs and is continuing, the issuer is restricted to make certain payments including dividends.
Other Cross Default Default by the company or significant subsidiary on principal or interest of USD40 million or more. Acceleration If any event of default occurs and is continuing the trustee or the holders of at least 25% of the outstanding notes may
declare the notes to be due and payable. Restriction on Purchase of Notes At any time the issuer may redeem the notes in whole but not in part at a price equivalent to the higher of 1) 100% of
principal and 2) the present value of remaining principal and interest payments. Transactions with Affiliates Transactions between issuer and affiliates are permitted should they reflect market conditions and no event of default is
occurring. Limits on Consolidations or Mergers Restrictions on merger or consolidation of issuer and subsidiaries. Exceptions require that the surviving entity expressly
assumes the obligations of the company, no event of default occurs or is continuing, the company’s pro forma debt levels allow it to incur additional indebtedness, among others.
Mandatory Redemption N.A.
N.A. Not applicable. Disclaimers: The covenant summaries reflect Fitch’s interpretation and synopsis of information contained in publicly available documents identified in the “Document Date and Location” section of each covenant summary table. Fitch cannot ensure that the information contained in such documents is either accurate or complete, or that the covenant summaries, or any particular covenant summary, accurately or completely reflect the key terms of any such document. The information presented in the covenant summaries is provided “as is” without any representation or warranty and is not a substitute for information provided to investors by an issuer and its agents in connection with a sale of securities. Source: Company and Fitch Ratings.
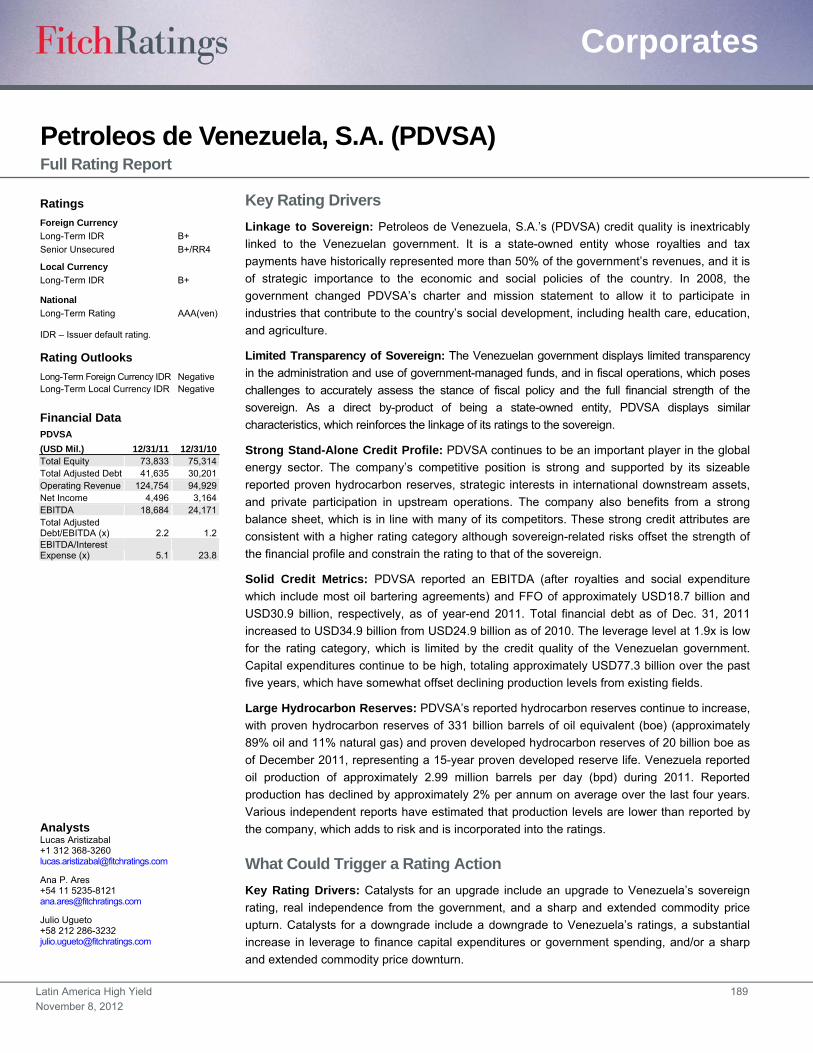
Latin America High Yield 189
November 8, 2012
Corporates
Petroleos de Venezuela, S.A. (PDVSA) Full Rating Report
Key Rating Drivers
Linkage to Sovereign: Petroleos de Venezuela, S.A.’s (PDVSA) credit quality is inextricably
linked to the Venezuelan government. It is a state-owned entity whose royalties and tax
payments have historically represented more than 50% of the government’s revenues, and it is
of strategic importance to the economic and social policies of the country. In 2008, the
government changed PDVSA’s charter and mission statement to allow it to participate in
industries that contribute to the country’s social development, including health care, education,
and agriculture.
Limited Transparency of Sovereign: The Venezuelan government displays limited transparency
in the administration and use of government-managed funds, and in fiscal operations, which poses
challenges to accurately assess the stance of fiscal policy and the full financial strength of the
sovereign. As a direct by-product of being a state-owned entity, PDVSA displays similar
characteristics, which reinforces the linkage of its ratings to the sovereign.
Strong Stand-Alone Credit Profile: PDVSA continues to be an important player in the global
energy sector. The company’s competitive position is strong and supported by its sizeable
reported proven hydrocarbon reserves, strategic interests in international downstream assets,
and private participation in upstream operations. The company also benefits from a strong
balance sheet, which is in line with many of its competitors. These strong credit attributes are
consistent with a higher rating category although sovereign-related risks offset the strength of
the financial profile and constrain the rating to that of the sovereign.
Solid Credit Metrics: PDVSA reported an EBITDA (after royalties and social expenditure
which include most oil bartering agreements) and FFO of approximately USD18.7 billion and
USD30.9 billion, respectively, as of year-end 2011. Total financial debt as of Dec. 31, 2011
increased to USD34.9 billion from USD24.9 billion as of 2010. The leverage level at 1.9x is low
for the rating category, which is limited by the credit quality of the Venezuelan government.
Capital expenditures continue to be high, totaling approximately USD77.3 billion over the past
five years, which have somewhat offset declining production levels from existing fields.
Large Hydrocarbon Reserves: PDVSA’s reported hydrocarbon reserves continue to increase,
with proven hydrocarbon reserves of 331 billion barrels of oil equivalent (boe) (approximately
89% oil and 11% natural gas) and proven developed hydrocarbon reserves of 20 billion boe as
of December 2011, representing a 15-year proven developed reserve life. Venezuela reported
oil production of approximately 2.99 million barrels per day (bpd) during 2011. Reported
production has declined by approximately 2% per annum on average over the last four years.
Various independent reports have estimated that production levels are lower than reported by
the company, which adds to risk and is incorporated into the ratings.
What Could Trigger a Rating Action
Key Rating Drivers: Catalysts for an upgrade include an upgrade to Venezuela’s sovereign
rating, real independence from the government, and a sharp and extended commodity price
upturn. Catalysts for a downgrade include a downgrade to Venezuela’s ratings, a substantial
increase in leverage to finance capital expenditures or government spending, and/or a sharp
and extended commodity price downturn.
Ratings
Foreign Currency
Long-Term IDR B+
Senior Unsecured B+/RR4
Local Currency
Long-Term IDR B+
National
Long-Term Rating AAA(ven)
IDR – Issuer default rating.
Rating Outlooks
Long-Term Foreign Currency IDR Negative Long-Term Local Currency IDR Negative
Financial Data PDVSA
(USD Mil.) 12/31/11 12/31/10 Total Equity 73,833 75,314 Total Adjusted Debt 41,635 30,201 Operating Revenue 124,754 94,929 Net Income 4,496 3,164 EBITDA 18,684 24,171 Total Adjusted Debt/EBITDA (x) 2.2 1.2 EBITDA/Interest Expense (x) 5.1 23.8
Analysts Lucas Aristizabal +1 312 368-3260 [email protected]
Ana P. Ares +54 11 5235-8121 [email protected]
Julio Ugueto +58 212 286-3232 [email protected]
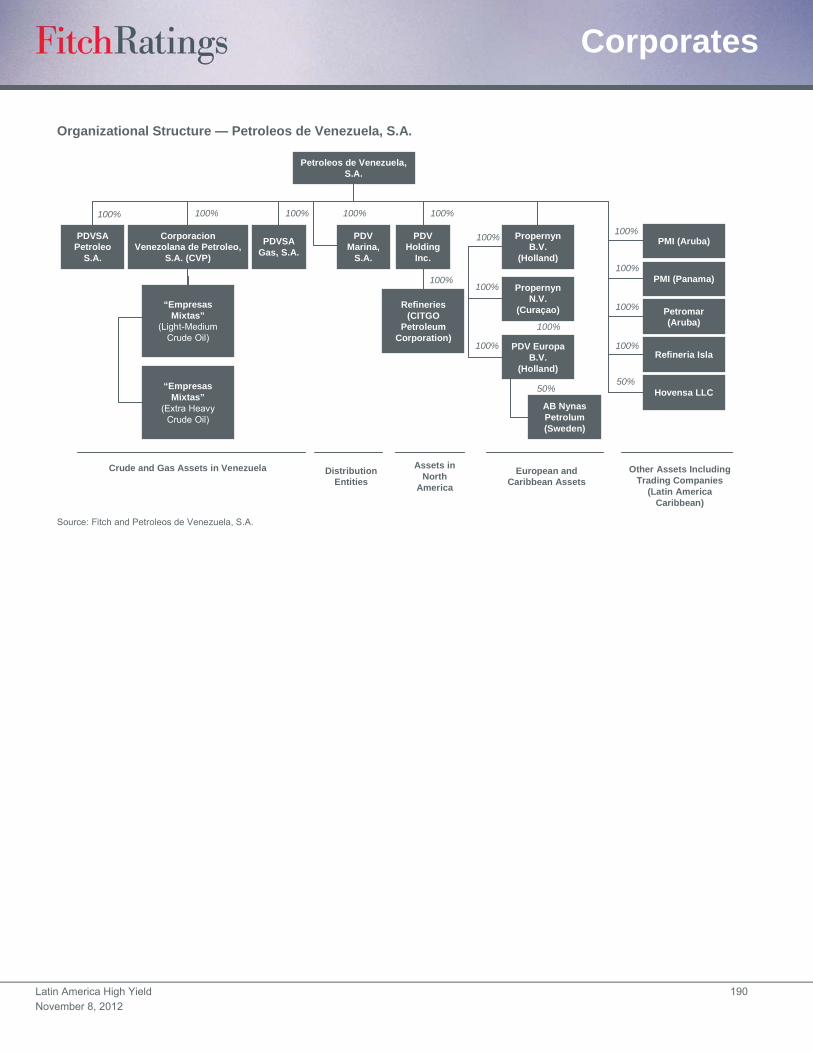
Latin America High Yield 190
November 8, 2012
Corporates
Organizational Structure — Petroleos de Venezuela, S.A.
Source: Fitch and Petroleos de Venezuela, S.A.
100%
Petroleos de Venezuela, S.A.
PDVSA Petroleo
S.A.
CorporacionVenezolana de Petroleo,
S.A. (CVP)
PDVSA Gas, S.A.
PDV Marina,
S.A.
PDV Holding
Inc.
Refineries (CITGO
Petroleum Corporation)
PropernynB.V.
(Holland)
PropernynN.V.
(Curaçao)
PDV EuropaB.V.
(Holland)
AB NynasPetrolum(Sweden)
PMI (Aruba)
PMI (Panama)
Petromar(Aruba)
Refineria Isla
Hovensa LLC
“EmpresasMixtas”
(Light-Medium Crude Oil)
“EmpresasMixtas”
(Extra HeavyCrude Oil)
50%
100% 100% 100% 100% 100%
100%
100%
100%
100%
100%
100%
100%
100%
50%
Crude and Gas Assets in Venezuela Distribution Entities
Assets in North
America
European and Caribbean Assets
Other Assets Including Trading Companies
(Latin America Caribbean)
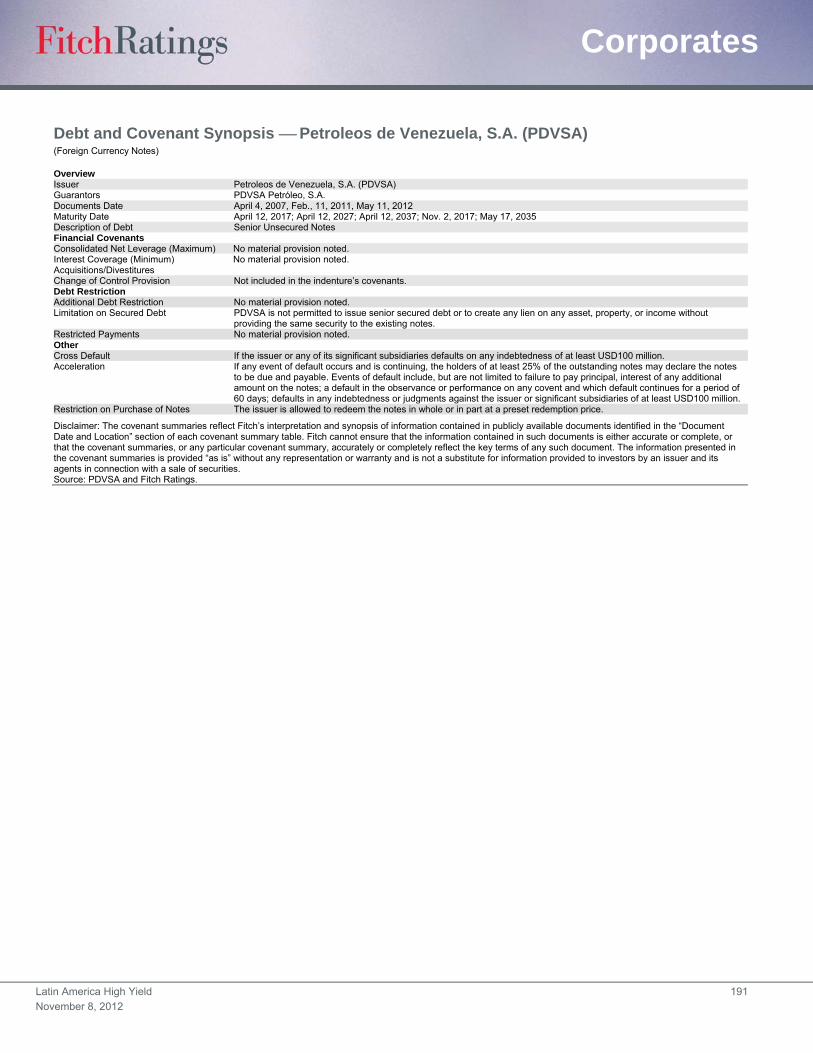
Latin America High Yield 191
November 8, 2012
Corporates
Debt and Covenant Synopsis Petroleos de Venezuela, S.A. (PDVSA) (Foreign Currency Notes)
Overview Issuer Petroleos de Venezuela, S.A. (PDVSA) Guarantors PDVSA Petróleo, S.A. Documents Date April 4, 2007, Feb., 11, 2011, May 11, 2012Maturity Date April 12, 2017; April 12, 2027; April 12, 2037; Nov. 2, 2017; May 17, 2035Description of Debt Senior Unsecured NotesFinancial Covenants Consolidated Net Leverage (Maximum) No material provision noted.Interest Coverage (Minimum) No material provision noted.Acquisitions/Divestitures Change of Control Provision Not included in the indenture’s covenants. Debt Restriction Additional Debt Restriction No material provision noted.Limitation on Secured Debt PDVSA is not permitted to issue senior secured debt or to create any lien on any asset, property, or income without
providing the same security to the existing notes.Restricted Payments No material provision noted.Other Cross Default If the issuer or any of its significant subsidiaries defaults on any indebtedness of at least USD100 million.Acceleration If any event of default occurs and is continuing, the holders of at least 25% of the outstanding notes may declare the notes
to be due and payable. Events of default include, but are not limited to failure to pay principal, interest of any additional amount on the notes; a default in the observance or performance on any covent and which default continues for a period of 60 days; defaults in any indebtedness or judgments against the issuer or significant subsidiaries of at least USD100 million.
Restriction on Purchase of Notes The issuer is allowed to redeem the notes in whole or in part at a preset redemption price.
Disclaimer: The covenant summaries reflect Fitch’s interpretation and synopsis of information contained in publicly available documents identified in the “Document Date and Location” section of each covenant summary table. Fitch cannot ensure that the information contained in such documents is either accurate or complete, or that the covenant summaries, or any particular covenant summary, accurately or completely reflect the key terms of any such document. The information presented in the covenant summaries is provided “as is” without any representation or warranty and is not a substitute for information provided to investors by an issuer and its agents in connection with a sale of securities. Source: PDVSA and Fitch Ratings.
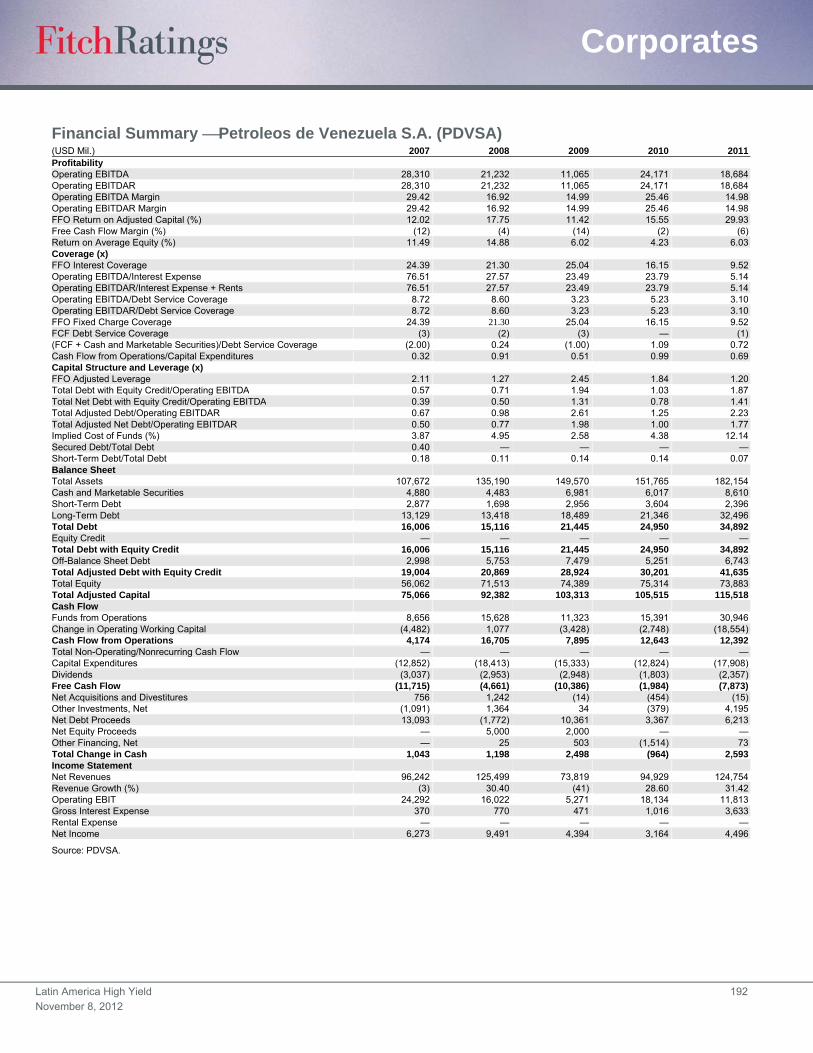
Latin America High Yield 192
November 8, 2012
Corporates
Financial Summary Petroleos de Venezuela S.A. (PDVSA) (USD Mil.) 2007 2008 2009 2010 2011Profitability Operating EBITDA 28,310 21,232 11,065 24,171 18,684Operating EBITDAR 28,310 21,232 11,065 24,171 18,684Operating EBITDA Margin 29.42 16.92 14.99 25.46 14.98Operating EBITDAR Margin 29.42 16.92 14.99 25.46 14.98FFO Return on Adjusted Capital (%) 12.02 17.75 11.42 15.55 29.93Free Cash Flow Margin (%) (12) (4) (14) (2) (6)Return on Average Equity (%) 11.49 14.88 6.02 4.23 6.03Coverage (x) FFO Interest Coverage 24.39 21.30 25.04 16.15 9.52Operating EBITDA/Interest Expense 76.51 27.57 23.49 23.79 5.14Operating EBITDAR/Interest Expense + Rents 76.51 27.57 23.49 23.79 5.14Operating EBITDA/Debt Service Coverage 8.72 8.60 3.23 5.23 3.10Operating EBITDAR/Debt Service Coverage 8.72 8.60 3.23 5.23 3.10FFO Fixed Charge Coverage 24.39 21.30 25.04 16.15 9.52FCF Debt Service Coverage (3) (2) (3) — (1)(FCF + Cash and Marketable Securities)/Debt Service Coverage (2.00) 0.24 (1.00) 1.09 0.72Cash Flow from Operations/Capital Expenditures 0.32 0.91 0.51 0.99 0.69Capital Structure and Leverage (x) FFO Adjusted Leverage 2.11 1.27 2.45 1.84 1.20Total Debt with Equity Credit/Operating EBITDA 0.57 0.71 1.94 1.03 1.87Total Net Debt with Equity Credit/Operating EBITDA 0.39 0.50 1.31 0.78 1.41Total Adjusted Debt/Operating EBITDAR 0.67 0.98 2.61 1.25 2.23Total Adjusted Net Debt/Operating EBITDAR 0.50 0.77 1.98 1.00 1.77Implied Cost of Funds (%) 3.87 4.95 2.58 4.38 12.14Secured Debt/Total Debt 0.40 — — — —Short-Term Debt/Total Debt 0.18 0.11 0.14 0.14 0.07Balance Sheet Total Assets 107,672 135,190 149,570 151,765 182,154Cash and Marketable Securities 4,880 4,483 6,981 6,017 8,610Short-Term Debt 2,877 1,698 2,956 3,604 2,396Long-Term Debt 13,129 13,418 18,489 21,346 32,496Total Debt 16,006 15,116 21,445 24,950 34,892Equity Credit — — — — —Total Debt with Equity Credit 16,006 15,116 21,445 24,950 34,892Off-Balance Sheet Debt 2,998 5,753 7,479 5,251 6,743Total Adjusted Debt with Equity Credit 19,004 20,869 28,924 30,201 41,635Total Equity 56,062 71,513 74,389 75,314 73,883Total Adjusted Capital 75,066 92,382 103,313 105,515 115,518Cash Flow Funds from Operations 8,656 15,628 11,323 15,391 30,946Change in Operating Working Capital (4,482) 1,077 (3,428) (2,748) (18,554)Cash Flow from Operations 4,174 16,705 7,895 12,643 12,392Total Non-Operating/Nonrecurring Cash Flow — — — — —Capital Expenditures (12,852) (18,413) (15,333) (12,824) (17,908)Dividends (3,037) (2,953) (2,948) (1,803) (2,357)Free Cash Flow (11,715) (4,661) (10,386) (1,984) (7,873)Net Acquisitions and Divestitures 756 1,242 (14) (454) (15)Other Investments, Net (1,091) 1,364 34 (379) 4,195Net Debt Proceeds 13,093 (1,772) 10,361 3,367 6,213Net Equity Proceeds — 5,000 2,000 — —Other Financing, Net — 25 503 (1,514) 73Total Change in Cash 1,043 1,198 2,498 (964) 2,593Income Statement Net Revenues 96,242 125,499 73,819 94,929 124,754Revenue Growth (%) (3) 30.40 (41) 28.60 31.42Operating EBIT 24,292 16,022 5,271 18,134 11,813Gross Interest Expense 370 770 471 1,016 3,633Rental Expense — — — — —Net Income 6,273 9,491 4,394 3,164 4,496
Source: PDVSA.
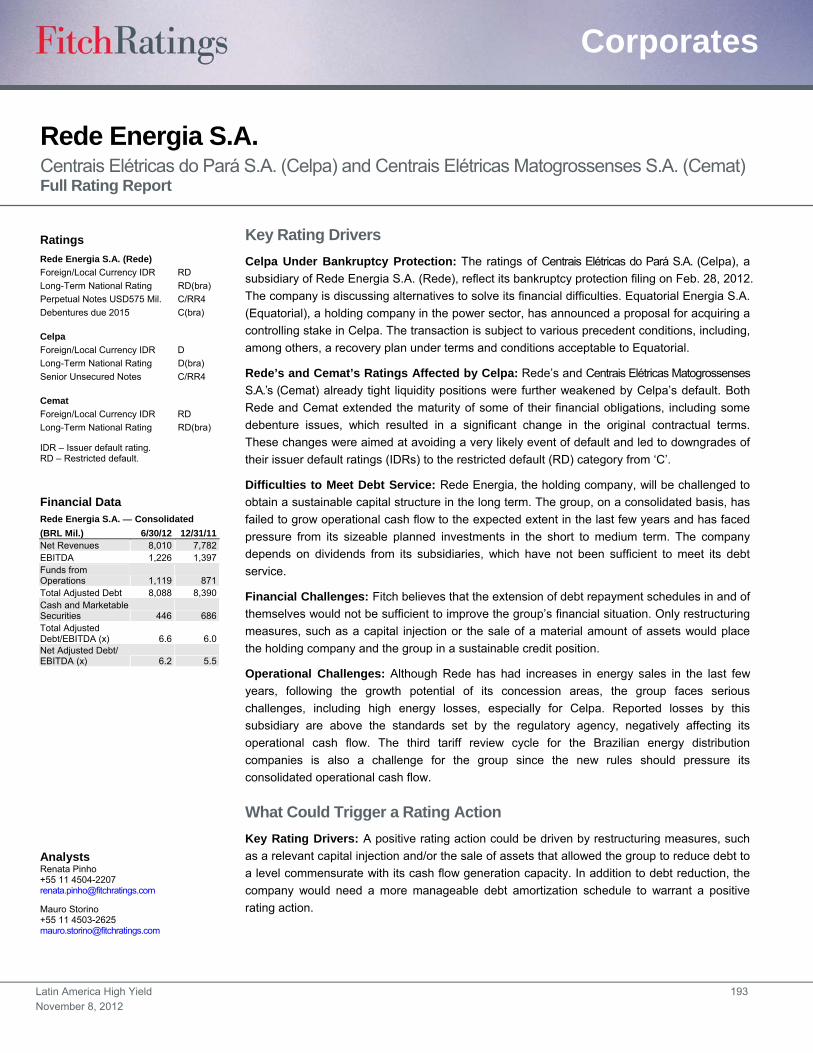
Latin America High Yield 193
November 8, 2012
Corporates
Rede Energia S.A. Centrais Elétricas do Pará S.A. (Celpa) and Centrais Elétricas Matogrossenses S.A. (Cemat) Full Rating Report
Key Rating Drivers
Celpa Under Bankruptcy Protection: The ratings of Centrais Elétricas do Pará S.A. (Celpa), a
subsidiary of Rede Energia S.A. (Rede), reflect its bankruptcy protection filing on Feb. 28, 2012.
The company is discussing alternatives to solve its financial difficulties. Equatorial Energia S.A.
(Equatorial), a holding company in the power sector, has announced a proposal for acquiring a
controlling stake in Celpa. The transaction is subject to various precedent conditions, including,
among others, a recovery plan under terms and conditions acceptable to Equatorial.
Rede’s and Cemat’s Ratings Affected by Celpa: Rede’s and Centrais Elétricas Matogrossenses
S.A.’s (Cemat) already tight liquidity positions were further weakened by Celpa’s default. Both
Rede and Cemat extended the maturity of some of their financial obligations, including some
debenture issues, which resulted in a significant change in the original contractual terms.
These changes were aimed at avoiding a very likely event of default and led to downgrades of
their issuer default ratings (IDRs) to the restricted default (RD) category from ‘C’.
Difficulties to Meet Debt Service: Rede Energia, the holding company, will be challenged to
obtain a sustainable capital structure in the long term. The group, on a consolidated basis, has
failed to grow operational cash flow to the expected extent in the last few years and has faced
pressure from its sizeable planned investments in the short to medium term. The company
depends on dividends from its subsidiaries, which have not been sufficient to meet its debt
service.
Financial Challenges: Fitch believes that the extension of debt repayment schedules in and of
themselves would not be sufficient to improve the group’s financial situation. Only restructuring
measures, such as a capital injection or the sale of a material amount of assets would place
the holding company and the group in a sustainable credit position.
Operational Challenges: Although Rede has had increases in energy sales in the last few
years, following the growth potential of its concession areas, the group faces serious
challenges, including high energy losses, especially for Celpa. Reported losses by this
subsidiary are above the standards set by the regulatory agency, negatively affecting its
operational cash flow. The third tariff review cycle for the Brazilian energy distribution
companies is also a challenge for the group since the new rules should pressure its
consolidated operational cash flow.
What Could Trigger a Rating Action
Key Rating Drivers: A positive rating action could be driven by restructuring measures, such
as a relevant capital injection and/or the sale of assets that allowed the group to reduce debt to
a level commensurate with its cash flow generation capacity. In addition to debt reduction, the
company would need a more manageable debt amortization schedule to warrant a positive
rating action.
Ratings
Rede Energia S.A. (Rede)
Foreign/Local Currency IDR RD
Long-Term National Rating RD(bra)
Perpetual Notes USD575 Mil. C/RR4
Debentures due 2015 C(bra)
Celpa
Foreign/Local Currency IDR D
Long-Term National Rating D(bra)
Senior Unsecured Notes C/RR4
Cemat
Foreign/Local Currency IDR RD
Long-Term National Rating RD(bra)
IDR – Issuer default rating. RD – Restricted default.
Financial Data Rede Energia S.A. Consolidated
(BRL Mil.) 6/30/12 12/31/11 Net Revenues 8,010 7,782 EBITDA 1,226 1,397 Funds from Operations 1,119 871 Total Adjusted Debt 8,088 8,390 Cash and Marketable Securities 446 686 Total Adjusted Debt/EBITDA (x) 6.6 6.0 Net Adjusted Debt/ EBITDA (x) 6.2 5.5
Analysts Renata Pinho +55 11 4504-2207 [email protected]
Mauro Storino +55 11 4503-2625 [email protected]

Latin America High Yield 194
November 8, 2012
Corporates
Recovery Rating
Fitch has performed a liquidation analysis for Rede in the event of bankruptcy. It has also
estimated the enterprise valuation in the event of financial distress. Under this scenario, a
conservative multiple of EBITDA of 5.0x was applied.
The bespoke analysis suggests a higher recovery level of ‘RR3’ for the unsecured debt. The
rating has been capped at ‘RR4’, which is the recovery rating cap for Brazilian issuers. The cap
reflects concern about the bankruptcy laws and the application of the law. A recovery rating of
‘RR4’ indicates that Rede’s creditors should have average recovery prospects in the range of
31%–50% of current principal and related interest in the event of default.
Recovery Analysis Rede Energia S.A. (BRL Mil.)
Going Concern Enterprise Value Liquidation Value Advance RateAvailable to
CreditorsJune 30, 2012 LTM EBITDA 1,226.5 Cash 446.0 0 —Discount (%) 0.0 A/R 1,830.0 80 1,464.0Post-Restructuring EBITDA Estimation 1,226.5 Inventory 54.0 50 27.0Multiple (x) 5.0 Net PPE 2,304.0 20 460.8Going Concern Enterprise Value 6,132.5 Total 4,634.0 1,951.8 Post-Restructuring EBITDA Estimation Guidelines Interest Expense 1,231.8Rent Expense —Estimated Maintenance Capital Expenditures 600.0Total 1,831.8
Enterprise Value for Claims Distribution Concession Payment Availability Table Greater of Going Concern Enterprise or Liquidation Value 6,132.5 Adjusted Enterprise Value for Claims 5,690.3Less Administrative Claims (10%) 613.2 Less Secured Debt Recovery 1,818.0Adjusted Enterprise Value for Claims 5,519.3 Remaining Recovery for Unsecured Claims 3,872.3 Concession Allocation (5%) 193.6 Value to be Distributed to Senior Unsecured Claims 3,678.6Distribution of Value
Secured Priority Lien Value
Recovered Recovery (%)Recovery
Rating Notching RatingSecured 1,911.0 1,911.0 100 RR1 +4 N.A.
Unsecured Priority Lien Value
Recovered Recovery (%)Concession
Allocation (%)Recovery
Ratinga Notching RatingSenior Unsecured 6,177.0 3,608 58 100 RR4 — RDaThe Rede’s recovery rating has been capped at ‘RR4’. RD – Restricted default. Source: Fitch Ratings.
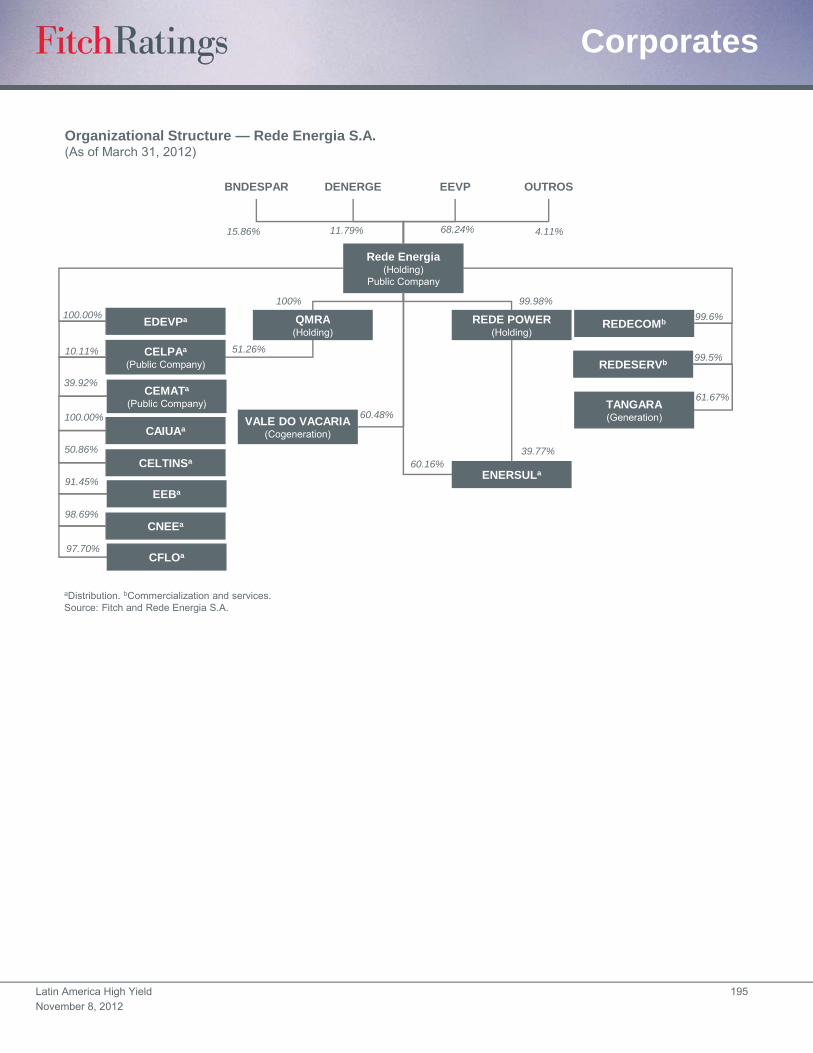
Latin America High Yield 195
November 8, 2012
Corporates
Organizational Structure — Rede Energia S.A.(As of March 31, 2012)
aDistribution. bCommercialization and services.Source: Fitch and Rede Energia S.A.
Rede Energia(Holding)
Public Company
QMRA(Holding)
99.98%
EDEVPa
CELPAa
(Public Company)
CEMATa
(Public Company)
CAIUAa
CELTINSa
EEBa
CNEEa
REDE POWER(Holding)
ENERSULa
REDECOMb
REDESERVb
TANGARA(Generation)VALE DO VACARIA
(Cogeneration)
CFLOa
39.77%60.16%
60.48%
100%
99.6%
99.5%
61.67%
51.26%
100.00%
10.11%
39.92%
100.00%
50.86%
91.45%
98.69%
97.70%
BNDESPAR DENERGE EEVP OUTROS
15.86% 11.79% 68.24% 4.11%
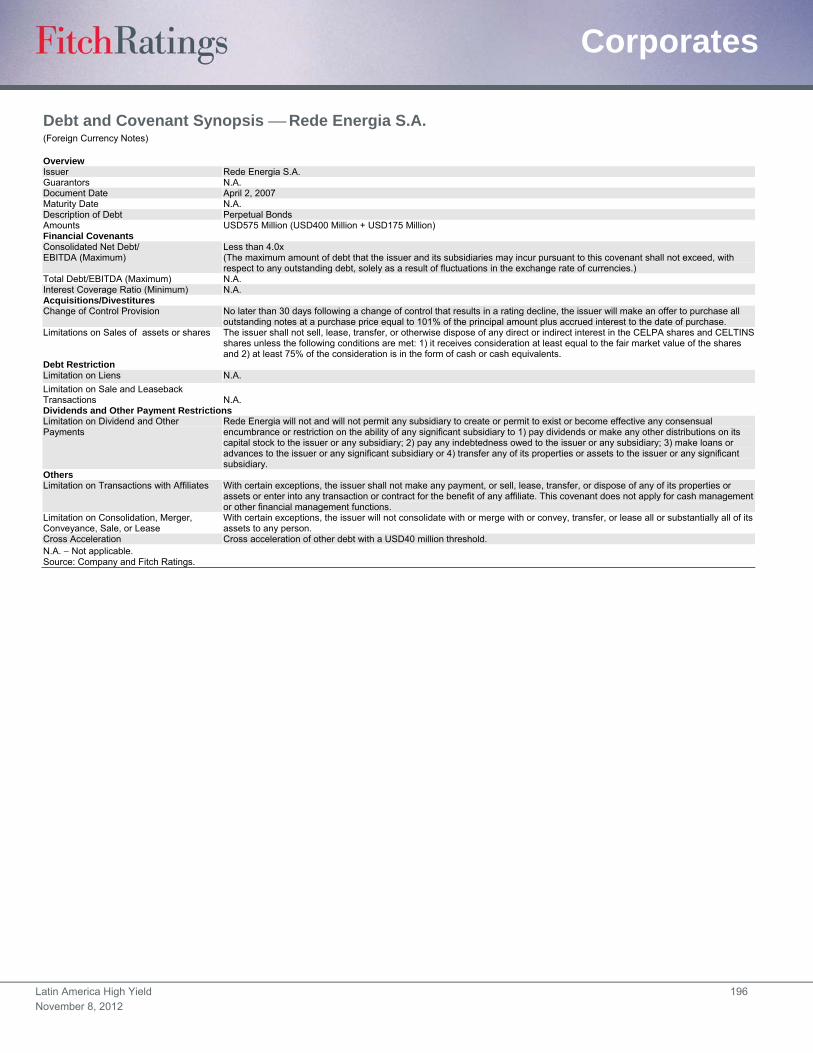
Latin America High Yield 196
November 8, 2012
Corporates
Debt and Covenant Synopsis Rede Energia S.A. (Foreign Currency Notes)
Overview Issuer Rede Energia S.A. Guarantors N.A. Document Date April 2, 2007 Maturity Date N.A. Description of Debt Perpetual Bonds Amounts USD575 Million (USD400 Million + USD175 Million) Financial Covenants Consolidated Net Debt/ EBITDA (Maximum)
Less than 4.0x (The maximum amount of debt that the issuer and its subsidiaries may incur pursuant to this covenant shall not exceed, with respect to any outstanding debt, solely as a result of fluctuations in the exchange rate of currencies.)
Total Debt/EBITDA (Maximum) N.A. Interest Coverage Ratio (Minimum) N.A. Acquisitions/Divestitures Change of Control Provision No later than 30 days following a change of control that results in a rating decline, the issuer will make an offer to purchase all
outstanding notes at a purchase price equal to 101% of the principal amount plus accrued interest to the date of purchase. Limitations on Sales of assets or shares The issuer shall not sell, lease, transfer, or otherwise dispose of any direct or indirect interest in the CELPA shares and CELTINS
shares unless the following conditions are met: 1) it receives consideration at least equal to the fair market value of the shares and 2) at least 75% of the consideration is in the form of cash or cash equivalents.
Debt Restriction Limitation on Liens N.A.
Limitation on Sale and Leaseback Transactions N.A. Dividends and Other Payment Restrictions Limitation on Dividend and Other Payments
Rede Energia will not and will not permit any subsidiary to create or permit to exist or become effective any consensual encumbrance or restriction on the ability of any significant subsidiary to 1) pay dividends or make any other distributions on its capital stock to the issuer or any subsidiary; 2) pay any indebtedness owed to the issuer or any subsidiary; 3) make loans or advances to the issuer or any significant subsidiary or 4) transfer any of its properties or assets to the issuer or any significant subsidiary.
Others Limitation on Transactions with Affiliates With certain exceptions, the issuer shall not make any payment, or sell, lease, transfer, or dispose of any of its properties or
assets or enter into any transaction or contract for the benefit of any affiliate. This covenant does not apply for cash management or other financial management functions.
Limitation on Consolidation, Merger, Conveyance, Sale, or Lease
With certain exceptions, the issuer will not consolidate with or merge with or convey, transfer, or lease all or substantially all of its assets to any person.
Cross Acceleration Cross acceleration of other debt with a USD40 million threshold. N.A. Not applicable. Source: Company and Fitch Ratings.
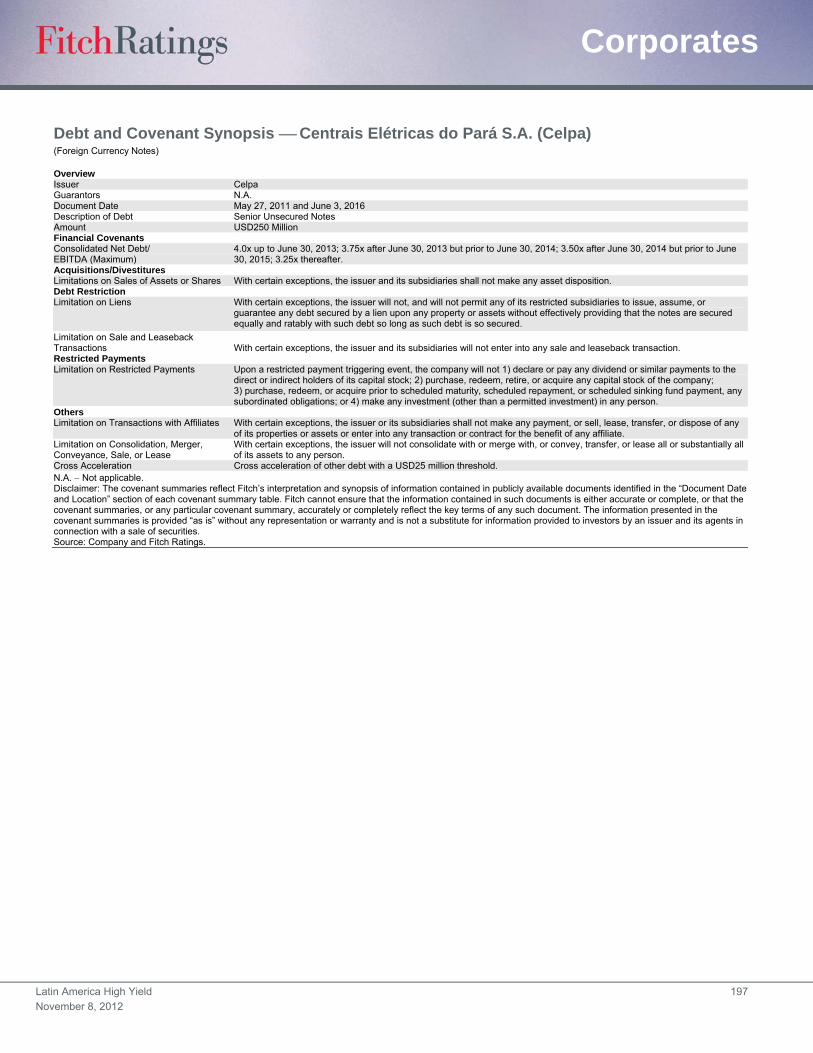
Latin America High Yield 197
November 8, 2012
Corporates
Debt and Covenant Synopsis Centrais Elétricas do Pará S.A. (Celpa) (Foreign Currency Notes)
Overview Issuer Celpa Guarantors N.A. Document Date May 27, 2011 and June 3, 2016 Description of Debt Senior Unsecured Notes Amount USD250 Million Financial Covenants Consolidated Net Debt/ EBITDA (Maximum)
4.0x up to June 30, 2013; 3.75x after June 30, 2013 but prior to June 30, 2014; 3.50x after June 30, 2014 but prior to June 30, 2015; 3.25x thereafter.
Acquisitions/Divestitures Limitations on Sales of Assets or Shares With certain exceptions, the issuer and its subsidiaries shall not make any asset disposition. Debt Restriction Limitation on Liens With certain exceptions, the issuer will not, and will not permit any of its restricted subsidiaries to issue, assume, or
guarantee any debt secured by a lien upon any property or assets without effectively providing that the notes are secured equally and ratably with such debt so long as such debt is so secured.
Limitation on Sale and Leaseback Transactions With certain exceptions, the issuer and its subsidiaries will not enter into any sale and leaseback transaction. Restricted Payments Limitation on Restricted Payments Upon a restricted payment triggering event, the company will not 1) declare or pay any dividend or similar payments to the
direct or indirect holders of its capital stock; 2) purchase, redeem, retire, or acquire any capital stock of the company; 3) purchase, redeem, or acquire prior to scheduled maturity, scheduled repayment, or scheduled sinking fund payment, any subordinated obligations; or 4) make any investment (other than a permitted investment) in any person.
Others Limitation on Transactions with Affiliates With certain exceptions, the issuer or its subsidiaries shall not make any payment, or sell, lease, transfer, or dispose of any
of its properties or assets or enter into any transaction or contract for the benefit of any affiliate. Limitation on Consolidation, Merger, Conveyance, Sale, or Lease
With certain exceptions, the issuer will not consolidate with or merge with, or convey, transfer, or lease all or substantially all of its assets to any person.
Cross Acceleration Cross acceleration of other debt with a USD25 million threshold. N.A. Not applicable. Disclaimer: The covenant summaries reflect Fitch’s interpretation and synopsis of information contained in publicly available documents identified in the “Document Date and Location” section of each covenant summary table. Fitch cannot ensure that the information contained in such documents is either accurate or complete, or that the covenant summaries, or any particular covenant summary, accurately or completely reflect the key terms of any such document. The information presented in the covenant summaries is provided “as is” without any representation or warranty and is not a substitute for information provided to investors by an issuer and its agents in connection with a sale of securities. Source: Company and Fitch Ratings.
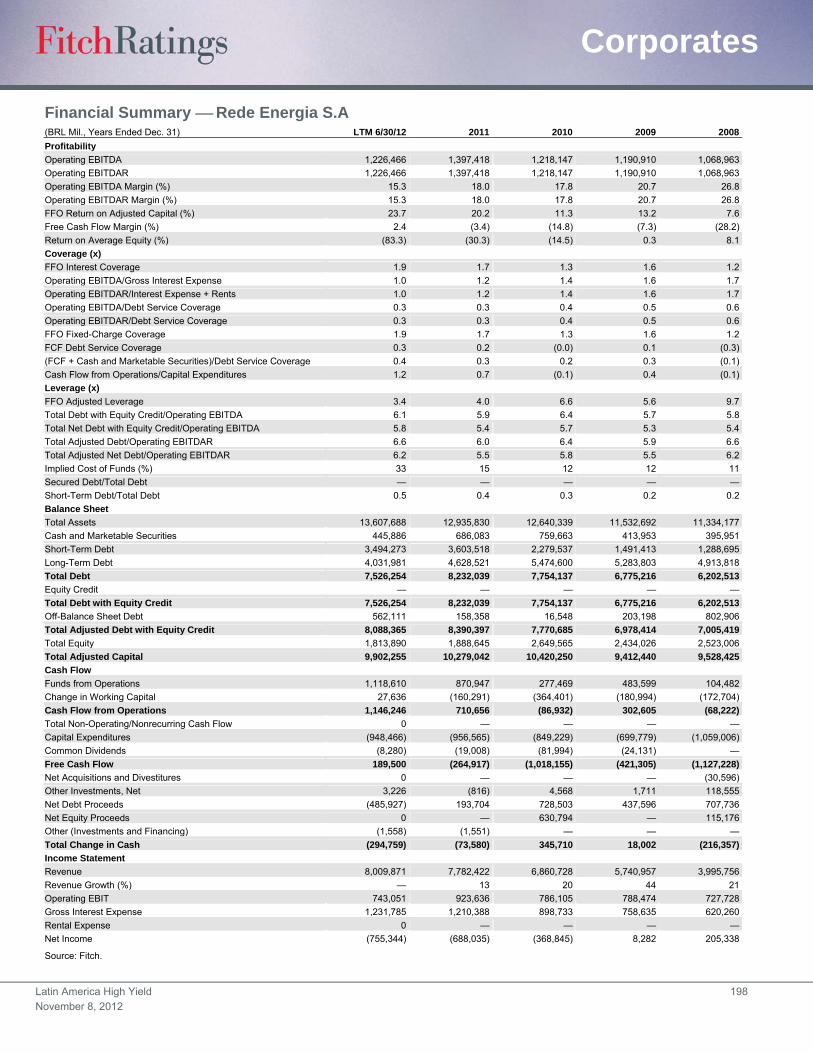
Latin America High Yield 198
November 8, 2012
Corporates
Financial Summary Rede Energia S.A (BRL Mil., Years Ended Dec. 31) LTM 6/30/12 2011 2010 2009 2008
Profitability
Operating EBITDA 1,226,466 1,397,418 1,218,147 1,190,910 1,068,963
Operating EBITDAR 1,226,466 1,397,418 1,218,147 1,190,910 1,068,963
Operating EBITDA Margin (%) 15.3 18.0 17.8 20.7 26.8
Operating EBITDAR Margin (%) 15.3 18.0 17.8 20.7 26.8
FFO Return on Adjusted Capital (%) 23.7 20.2 11.3 13.2 7.6
Free Cash Flow Margin (%) 2.4 (3.4) (14.8) (7.3) (28.2)
Return on Average Equity (%) (83.3) (30.3) (14.5) 0.3 8.1
Coverage (x)
FFO Interest Coverage 1.9 1.7 1.3 1.6 1.2
Operating EBITDA/Gross Interest Expense 1.0 1.2 1.4 1.6 1.7
Operating EBITDAR/Interest Expense + Rents 1.0 1.2 1.4 1.6 1.7
Operating EBITDA/Debt Service Coverage 0.3 0.3 0.4 0.5 0.6
Operating EBITDAR/Debt Service Coverage 0.3 0.3 0.4 0.5 0.6
FFO Fixed-Charge Coverage 1.9 1.7 1.3 1.6 1.2
FCF Debt Service Coverage 0.3 0.2 (0.0) 0.1 (0.3)
(FCF + Cash and Marketable Securities)/Debt Service Coverage 0.4 0.3 0.2 0.3 (0.1)
Cash Flow from Operations/Capital Expenditures 1.2 0.7 (0.1) 0.4 (0.1)
Leverage (x)
FFO Adjusted Leverage 3.4 4.0 6.6 5.6 9.7
Total Debt with Equity Credit/Operating EBITDA 6.1 5.9 6.4 5.7 5.8
Total Net Debt with Equity Credit/Operating EBITDA 5.8 5.4 5.7 5.3 5.4
Total Adjusted Debt/Operating EBITDAR 6.6 6.0 6.4 5.9 6.6
Total Adjusted Net Debt/Operating EBITDAR 6.2 5.5 5.8 5.5 6.2
Implied Cost of Funds (%) 33 15 12 12 11
Secured Debt/Total Debt — — — — —
Short-Term Debt/Total Debt 0.5 0.4 0.3 0.2 0.2
Balance Sheet
Total Assets 13,607,688 12,935,830 12,640,339 11,532,692 11,334,177
Cash and Marketable Securities 445,886 686,083 759,663 413,953 395,951
Short-Term Debt 3,494,273 3,603,518 2,279,537 1,491,413 1,288,695
Long-Term Debt 4,031,981 4,628,521 5,474,600 5,283,803 4,913,818
Total Debt 7,526,254 8,232,039 7,754,137 6,775,216 6,202,513
Equity Credit — — — — —
Total Debt with Equity Credit 7,526,254 8,232,039 7,754,137 6,775,216 6,202,513
Off-Balance Sheet Debt 562,111 158,358 16,548 203,198 802,906
Total Adjusted Debt with Equity Credit 8,088,365 8,390,397 7,770,685 6,978,414 7,005,419
Total Equity 1,813,890 1,888,645 2,649,565 2,434,026 2,523,006
Total Adjusted Capital 9,902,255 10,279,042 10,420,250 9,412,440 9,528,425
Cash Flow
Funds from Operations 1,118,610 870,947 277,469 483,599 104,482
Change in Working Capital 27,636 (160,291) (364,401) (180,994) (172,704)
Cash Flow from Operations 1,146,246 710,656 (86,932) 302,605 (68,222)
Total Non-Operating/Nonrecurring Cash Flow 0 — — — —
Capital Expenditures (948,466) (956,565) (849,229) (699,779) (1,059,006)
Common Dividends (8,280) (19,008) (81,994) (24,131) —
Free Cash Flow 189,500 (264,917) (1,018,155) (421,305) (1,127,228)
Net Acquisitions and Divestitures 0 — — — (30,596)
Other Investments, Net 3,226 (816) 4,568 1,711 118,555
Net Debt Proceeds (485,927) 193,704 728,503 437,596 707,736
Net Equity Proceeds 0 — 630,794 — 115,176
Other (Investments and Financing) (1,558) (1,551) — — —
Total Change in Cash (294,759) (73,580) 345,710 18,002 (216,357)
Income Statement
Revenue 8,009,871 7,782,422 6,860,728 5,740,957 3,995,756
Revenue Growth (%) — 13 20 44 21
Operating EBIT 743,051 923,636 786,105 788,474 727,728
Gross Interest Expense 1,231,785 1,210,388 898,733 758,635 620,260
Rental Expense 0 — — — —
Net Income (755,344) (688,035) (368,845) 8,282 205,338
Source: Fitch.
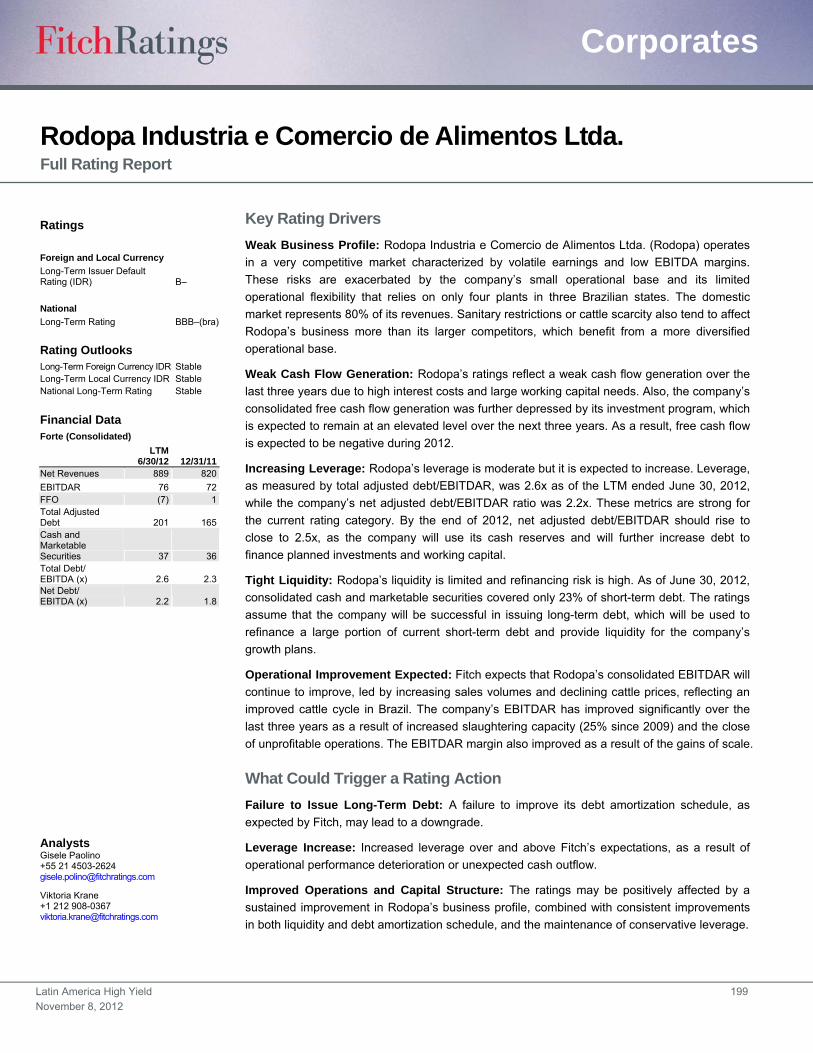
Latin America High Yield 199
November 8, 2012
Corporates
Rodopa Industria e Comercio de Alimentos Ltda. Full Rating Report
Key Rating Drivers
Weak Business Profile: Rodopa Industria e Comercio de Alimentos Ltda. (Rodopa) operates
in a very competitive market characterized by volatile earnings and low EBITDA margins.
These risks are exacerbated by the company’s small operational base and its limited
operational flexibility that relies on only four plants in three Brazilian states. The domestic
market represents 80% of its revenues. Sanitary restrictions or cattle scarcity also tend to affect
Rodopa’s business more than its larger competitors, which benefit from a more diversified
operational base.
Weak Cash Flow Generation: Rodopa’s ratings reflect a weak cash flow generation over the
last three years due to high interest costs and large working capital needs. Also, the company’s
consolidated free cash flow generation was further depressed by its investment program, which
is expected to remain at an elevated level over the next three years. As a result, free cash flow
is expected to be negative during 2012.
Increasing Leverage: Rodopa’s leverage is moderate but it is expected to increase. Leverage,
as measured by total adjusted debt/EBITDAR, was 2.6x as of the LTM ended June 30, 2012,
while the company’s net adjusted debt/EBITDAR ratio was 2.2x. These metrics are strong for
the current rating category. By the end of 2012, net adjusted debt/EBITDAR should rise to
close to 2.5x, as the company will use its cash reserves and will further increase debt to
finance planned investments and working capital.
Tight Liquidity: Rodopa’s liquidity is limited and refinancing risk is high. As of June 30, 2012,
consolidated cash and marketable securities covered only 23% of short-term debt. The ratings
assume that the company will be successful in issuing long-term debt, which will be used to
refinance a large portion of current short-term debt and provide liquidity for the company’s
growth plans.
Operational Improvement Expected: Fitch expects that Rodopa’s consolidated EBITDAR will
continue to improve, led by increasing sales volumes and declining cattle prices, reflecting an
improved cattle cycle in Brazil. The company’s EBITDAR has improved significantly over the
last three years as a result of increased slaughtering capacity (25% since 2009) and the close
of unprofitable operations. The EBITDAR margin also improved as a result of the gains of scale.
What Could Trigger a Rating Action
Failure to Issue Long-Term Debt: A failure to improve its debt amortization schedule, as
expected by Fitch, may lead to a downgrade.
Leverage Increase: Increased leverage over and above Fitch’s expectations, as a result of
operational performance deterioration or unexpected cash outflow.
Improved Operations and Capital Structure: The ratings may be positively affected by a
sustained improvement in Rodopa’s business profile, combined with consistent improvements
in both liquidity and debt amortization schedule, and the maintenance of conservative leverage.
Ratings
Foreign and Local Currency
Long-Term Issuer Default Rating (IDR) B–
National
Long-Term Rating BBB–(bra)
Rating Outlooks Long-Term Foreign Currency IDR Stable Long-Term Local Currency IDR Stable National Long-Term Rating Stable
Financial Data Forte (Consolidated)
LTM
6/30/12 12/31/11 Net Revenues 889 820
EBITDAR 76 72 FFO (7) 1 Total Adjusted Debt 201 165 Cash and Marketable Securities 37 36 Total Debt/ EBITDA (x) 2.6 2.3 Net Debt/ EBITDA (x) 2.2 1.8
Analysts Gisele Paolino +55 21 4503-2624 [email protected]
Viktoria Krane +1 212 908-0367 [email protected]

Latin America High Yield 200
November 8, 2012
Corporates
Organizational Structure
Bindilatti Family
100%
Forte Empreendimentos e Participações Ltda.
Rodopa Indústria Comércio de Alimentos Ltda.
Rodopa Finance Curtume Cassilândia Ltda. Lidera
Source: Rodopa.
100%
50%
99%
94%
6%
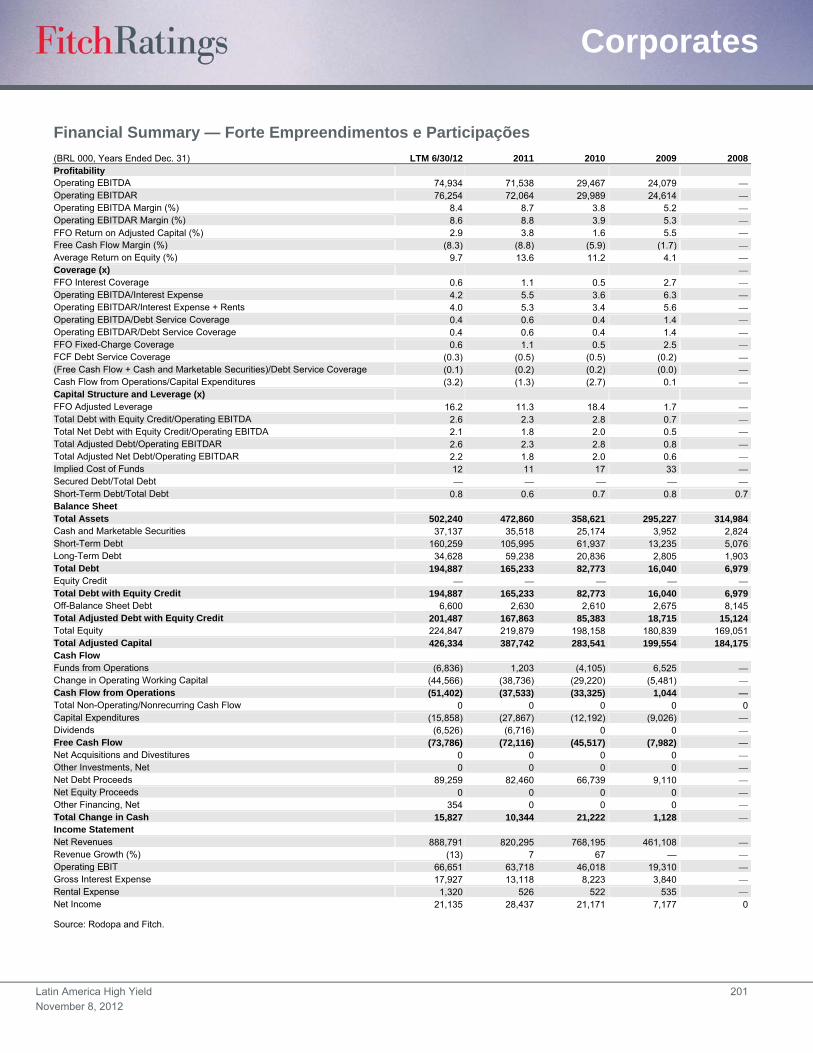
Latin America High Yield 201
November 8, 2012
Corporates
Financial Summary — Forte Empreendimentos e Participações
(BRL 000, Years Ended Dec. 31) LTM 6/30/12 2011 2010 2009 2008Profitability Operating EBITDA 74,934 71,538 29,467 24,079 Operating EBITDAR 76,254 72,064 29,989 24,614 Operating EBITDA Margin (%) 8.4 8.7 3.8 5.2 Operating EBITDAR Margin (%) 8.6 8.8 3.9 5.3 FFO Return on Adjusted Capital (%) 2.9 3.8 1.6 5.5 Free Cash Flow Margin (%) (8.3) (8.8) (5.9) (1.7) Average Return on Equity (%) 9.7 13.6 11.2 4.1 Coverage (x) FFO Interest Coverage 0.6 1.1 0.5 2.7 Operating EBITDA/Interest Expense 4.2 5.5 3.6 6.3 Operating EBITDAR/Interest Expense + Rents 4.0 5.3 3.4 5.6 Operating EBITDA/Debt Service Coverage 0.4 0.6 0.4 1.4 Operating EBITDAR/Debt Service Coverage 0.4 0.6 0.4 1.4 FFO Fixed-Charge Coverage 0.6 1.1 0.5 2.5 FCF Debt Service Coverage (0.3) (0.5) (0.5) (0.2) (Free Cash Flow + Cash and Marketable Securities)/Debt Service Coverage (0.1) (0.2) (0.2) (0.0) Cash Flow from Operations/Capital Expenditures (3.2) (1.3) (2.7) 0.1 Capital Structure and Leverage (x) FFO Adjusted Leverage 16.2 11.3 18.4 1.7 Total Debt with Equity Credit/Operating EBITDA 2.6 2.3 2.8 0.7 Total Net Debt with Equity Credit/Operating EBITDA 2.1 1.8 2.0 0.5 Total Adjusted Debt/Operating EBITDAR 2.6 2.3 2.8 0.8 Total Adjusted Net Debt/Operating EBITDAR 2.2 1.8 2.0 0.6 Implied Cost of Funds 12 11 17 33 Secured Debt/Total Debt Short-Term Debt/Total Debt 0.8 0.6 0.7 0.8 0.7Balance Sheet Total Assets 502,240 472,860 358,621 295,227 314,984Cash and Marketable Securities 37,137 35,518 25,174 3,952 2,824Short-Term Debt 160,259 105,995 61,937 13,235 5,076Long-Term Debt 34,628 59,238 20,836 2,805 1,903Total Debt 194,887 165,233 82,773 16,040 6,979Equity Credit Total Debt with Equity Credit 194,887 165,233 82,773 16,040 6,979Off-Balance Sheet Debt 6,600 2,630 2,610 2,675 8,145Total Adjusted Debt with Equity Credit 201,487 167,863 85,383 18,715 15,124Total Equity 224,847 219,879 198,158 180,839 169,051Total Adjusted Capital 426,334 387,742 283,541 199,554 184,175Cash Flow Funds from Operations (6,836) 1,203 (4,105) 6,525 Change in Operating Working Capital (44,566) (38,736) (29,220) (5,481) Cash Flow from Operations (51,402) (37,533) (33,325) 1,044 Total Non-Operating/Nonrecurring Cash Flow 0 0 0 0 0Capital Expenditures (15,858) (27,867) (12,192) (9,026) Dividends (6,526) (6,716) 0 0 Free Cash Flow (73,786) (72,116) (45,517) (7,982) Net Acquisitions and Divestitures 0 0 0 0 Other Investments, Net 0 0 0 0 Net Debt Proceeds 89,259 82,460 66,739 9,110 Net Equity Proceeds 0 0 0 0 Other Financing, Net 354 0 0 0 Total Change in Cash 15,827 10,344 21,222 1,128 Income Statement Net Revenues 888,791 820,295 768,195 461,108 Revenue Growth (%) (13) 7 67 — Operating EBIT 66,651 63,718 46,018 19,310 Gross Interest Expense 17,927 13,118 8,223 3,840 Rental Expense 1,320 526 522 535 Net Income 21,135 28,437 21,171 7,177 0
Source: Rodopa and Fitch.
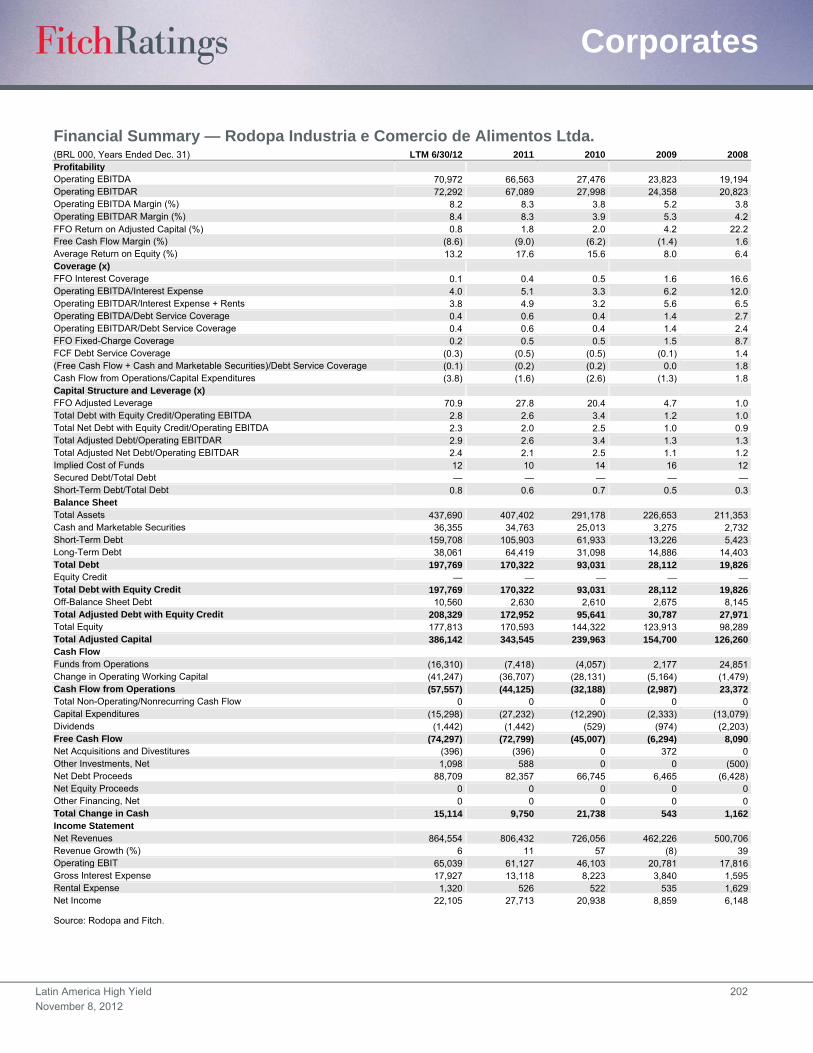
Latin America High Yield 202
November 8, 2012
Corporates
Financial Summary — Rodopa Industria e Comercio de Alimentos Ltda. (BRL 000, Years Ended Dec. 31) LTM 6/30/12 2011 2010 2009 2008Profitability Operating EBITDA 70,972 66,563 27,476 23,823 19,194Operating EBITDAR 72,292 67,089 27,998 24,358 20,823Operating EBITDA Margin (%) 8.2 8.3 3.8 5.2 3.8Operating EBITDAR Margin (%) 8.4 8.3 3.9 5.3 4.2 FFO Return on Adjusted Capital (%) 0.8 1.8 2.0 4.2 22.2 Free Cash Flow Margin (%) (8.6) (9.0) (6.2) (1.4) 1.6 Average Return on Equity (%) 13.2 17.6 15.6 8.0 6.4 Coverage (x) FFO Interest Coverage 0.1 0.4 0.5 1.6 16.6 Operating EBITDA/Interest Expense 4.0 5.1 3.3 6.2 12.0 Operating EBITDAR/Interest Expense + Rents 3.8 4.9 3.2 5.6 6.5 Operating EBITDA/Debt Service Coverage 0.4 0.6 0.4 1.4 2.7 Operating EBITDAR/Debt Service Coverage 0.4 0.6 0.4 1.4 2.4 FFO Fixed-Charge Coverage 0.2 0.5 0.5 1.5 8.7 FCF Debt Service Coverage (0.3) (0.5) (0.5) (0.1) 1.4 (Free Cash Flow + Cash and Marketable Securities)/Debt Service Coverage (0.1) (0.2) (0.2) 0.0 1.8 Cash Flow from Operations/Capital Expenditures (3.8) (1.6) (2.6) (1.3) 1.8 Capital Structure and Leverage (x) FFO Adjusted Leverage 70.9 27.8 20.4 4.7 1.0Total Debt with Equity Credit/Operating EBITDA 2.8 2.6 3.4 1.2 1.0Total Net Debt with Equity Credit/Operating EBITDA 2.3 2.0 2.5 1.0 0.9Total Adjusted Debt/Operating EBITDAR 2.9 2.6 3.4 1.3 1.3Total Adjusted Net Debt/Operating EBITDAR 2.4 2.1 2.5 1.1 1.2Implied Cost of Funds 12 10 14 16 12Secured Debt/Total Debt — — — — —Short-Term Debt/Total Debt 0.8 0.6 0.7 0.5 0.3Balance Sheet Total Assets 437,690 407,402 291,178 226,653 211,353Cash and Marketable Securities 36,355 34,763 25,013 3,275 2,732Short-Term Debt 159,708 105,903 61,933 13,226 5,423Long-Term Debt 38,061 64,419 31,098 14,886 14,403Total Debt 197,769 170,322 93,031 28,112 19,826Equity Credit — Total Debt with Equity Credit 197,769 170,322 93,031 28,112 19,826Off-Balance Sheet Debt 10,560 2,630 2,610 2,675 8,145Total Adjusted Debt with Equity Credit 208,329 172,952 95,641 30,787 27,971Total Equity 177,813 170,593 144,322 123,913 98,289Total Adjusted Capital 386,142 343,545 239,963 154,700 126,260Cash Flow Funds from Operations (16,310) (7,418) (4,057) 2,177 24,851 Change in Operating Working Capital (41,247) (36,707) (28,131) (5,164) (1,479)Cash Flow from Operations (57,557) (44,125) (32,188) (2,987) 23,372 Total Non-Operating/Nonrecurring Cash Flow 0 0 0 0 0 Capital Expenditures (15,298) (27,232) (12,290) (2,333) (13,079)Dividends (1,442) (1,442) (529) (974) (2,203)Free Cash Flow (74,297) (72,799) (45,007) (6,294) 8,090 Net Acquisitions and Divestitures (396) (396) 0 372 0 Other Investments, Net 1,098 588 0 0 (500)Net Debt Proceeds 88,709 82,357 66,745 6,465 (6,428)Net Equity Proceeds 0 0 0 0 0 Other Financing, Net 0 0 0 0 0 Total Change in Cash 15,114 9,750 21,738 543 1,162 Income Statement Net Revenues 864,554 806,432 726,056 462,226 500,706Revenue Growth (%) 6 11 57 (8) 39Operating EBIT 65,039 61,127 46,103 20,781 17,816Gross Interest Expense 17,927 13,118 8,223 3,840 1,595Rental Expense 1,320 526 522 535 1,629Net Income 22,105 27,713 20,938 8,859 6,148
Source: Rodopa and Fitch.
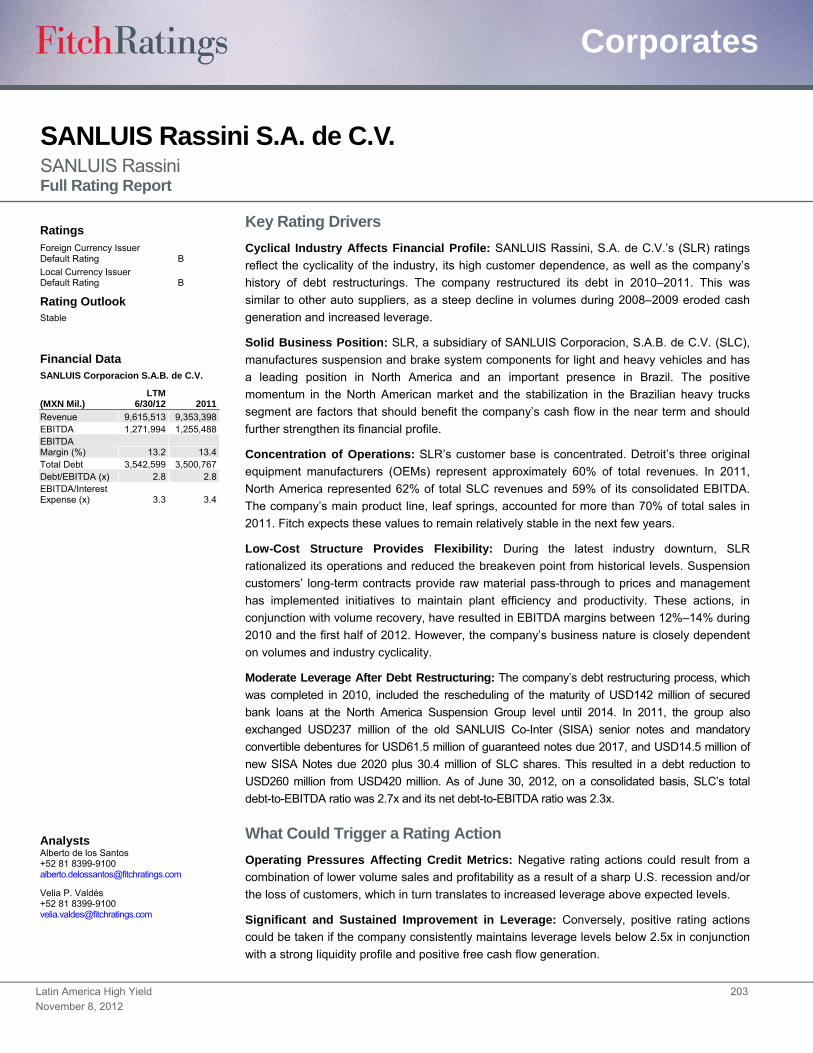
Latin America High Yield 203
November 8, 2012
Corporates
SANLUIS Rassini S.A. de C.V. SANLUIS Rassini Full Rating Report
Key Rating Drivers
Cyclical Industry Affects Financial Profile: SANLUIS Rassini, S.A. de C.V.’s (SLR) ratings
reflect the cyclicality of the industry, its high customer dependence, as well as the company’s
history of debt restructurings. The company restructured its debt in 2010–2011. This was
similar to other auto suppliers, as a steep decline in volumes during 2008–2009 eroded cash
generation and increased leverage.
Solid Business Position: SLR, a subsidiary of SANLUIS Corporacion, S.A.B. de C.V. (SLC),
manufactures suspension and brake system components for light and heavy vehicles and has
a leading position in North America and an important presence in Brazil. The positive
momentum in the North American market and the stabilization in the Brazilian heavy trucks
segment are factors that should benefit the company’s cash flow in the near term and should
further strengthen its financial profile.
Concentration of Operations: SLR’s customer base is concentrated. Detroit’s three original
equipment manufacturers (OEMs) represent approximately 60% of total revenues. In 2011,
North America represented 62% of total SLC revenues and 59% of its consolidated EBITDA.
The company’s main product line, leaf springs, accounted for more than 70% of total sales in
2011. Fitch expects these values to remain relatively stable in the next few years.
Low-Cost Structure Provides Flexibility: During the latest industry downturn, SLR
rationalized its operations and reduced the breakeven point from historical levels. Suspension
customers’ long-term contracts provide raw material pass-through to prices and management
has implemented initiatives to maintain plant efficiency and productivity. These actions, in
conjunction with volume recovery, have resulted in EBITDA margins between 12%–14% during
2010 and the first half of 2012. However, the company’s business nature is closely dependent
on volumes and industry cyclicality.
Moderate Leverage After Debt Restructuring: The company’s debt restructuring process, which
was completed in 2010, included the rescheduling of the maturity of USD142 million of secured
bank loans at the North America Suspension Group level until 2014. In 2011, the group also
exchanged USD237 million of the old SANLUIS Co-Inter (SISA) senior notes and mandatory
convertible debentures for USD61.5 million of guaranteed notes due 2017, and USD14.5 million of
new SISA Notes due 2020 plus 30.4 million of SLC shares. This resulted in a debt reduction to
USD260 million from USD420 million. As of June 30, 2012, on a consolidated basis, SLC’s total
debt-to-EBITDA ratio was 2.7x and its net debt-to-EBITDA ratio was 2.3x.
What Could Trigger a Rating Action
Operating Pressures Affecting Credit Metrics: Negative rating actions could result from a
combination of lower volume sales and profitability as a result of a sharp U.S. recession and/or
the loss of customers, which in turn translates to increased leverage above expected levels.
Significant and Sustained Improvement in Leverage: Conversely, positive rating actions
could be taken if the company consistently maintains leverage levels below 2.5x in conjunction
with a strong liquidity profile and positive free cash flow generation.
Ratings Foreign Currency Issuer Default Rating B
Local Currency Issuer Default Rating B
Rating Outlook Stable
Financial Data SANLUIS Corporacion S.A.B. de C.V.
(MXN Mil.) LTM
6/30/12 2011
Revenue 9,615,513 9,353,398 EBITDA 1,271,994 1,255,488 EBITDA Margin (%) 13.2 13.4 Total Debt 3,542,599 3,500,767 Debt/EBITDA (x) 2.8 2.8 EBITDA/Interest Expense (x) 3.3 3.4
Analysts Alberto de los Santos +52 81 8399-9100 [email protected]
Velia P. Valdés +52 81 8399-9100 [email protected]

Latin America High Yield 204
November 8, 2012
Corporates
Organizational Structure — SANLUIS Corporation, S.A.B. de C.V. (USD Mil., As of June 31, 2012)
RCA – Restructured credit agreement. Note: Total consolidated debt is USD253.5 million.Source: Company filings, Fitch Ratings.
SANLUIS Corporation, S.A.B. de C.V.
100%
North America Suspension Group
RCA due 2014 124.9
SANLUIS Rassini, S.A. de C.V. (SLR)
Brazil SuspensionGroup
SANLUIS Co-Inter S.A. (SISA)
Suspension Group Brake Group
Revolving 21.8
51%
100%
100%
100%
100%
Euro Commercial Paper 5.4 Eurobond 2.37% Sr. Notes due 2017 65.8Total Debt 73.5
WC LinesTerm Loan 2013 19
7% Notes due 2020 14.3

Latin America High Yield 205
November 8, 2012
Corporates
Financial Summary SANLUIS Corporation, S.A. de C.V. (MXN Mil., Fiscal Years End Dec. 31) LTM 6/30/12 2011 2010 2009 2008
Profitability
Operating EBITDA 1,271,994.0 1,255,488 1,057,592 502,823 434,287
Operating EBITDAR 1,271,994.0 1,255,488 1,057,592 502,823 434,287
Operating EBITDA Margin (%) 13.23 13.40 13.90 9.20 6.20
Operating EBITDAR Margin (%) 13.23 13.40 13.90 9.20 6.20
FFO Return on Adjusted Capital 23.79 18.20 20.60 13.30 5.10
Free Cash Flow Margin (%) 6.05 2.80 3.90 (0.80) 2.60
Return on Average Equity (%) 7.32 54.80 29.30 (22.50) (27.10) Coverage (x)
FFO Interest Coverage 3.9 2.9 2.7 1.7 0.7
Operating EBITDA/Gross Interest Expense 3.3 3.4 2.6 1.4 1.2
Operating EBITDAR/Interest Expense + Rents 3.3 3.4 2.6 1.4 1.2
Operating EBITDA/Debt Service Coverage 1.2 1.3 0.4 0.2 0.6
Operating EBITDAR/Debt Service Coverage 1.2 1.3 0.4 0.2 0.6
FFO Fixed-Charge Coverage 3.9 2.9 2.7 1.7 0.7
FCF Debt Service Coverage 0.9 0.7 0.2 0.1 0.8
(FCF + Cash and Marketable Securities)/Debt Service Coverage 1.4 1.0 0.3 0.2 1.3
Cash Flow from Operations/Capital Expenditures 2.8 2.3 2.9 0.7 1.9 Leverage (x)
FFO Adjusted Leverage 2.3 3.3 4.1 4.9 12.5
Total Debt with Equity Credit/Operating EBITDA 2.8 2.8 4.3 6.1 7.2
Total Net Debt with Equity Credit/Operating EBITDA 2.4 2.6 4.0 5.7 6.5
Total Adjusted Debt/Operating EBITDAR 2.8 2.8 4.3 6.1 7.2
Total Adjusted Net Debt/Operating EBITDAR 2.4 2.6 4.0 5.7 6.5
Implied Cost of Funds (%) 11.8 9.1 10.9 12.0 12.4
Secured Debt/Total Debt Short-Term Debt/Total Debt 0.2 0.2 0.6 0.9 0.1 Balance Sheet
Total Assets 8,940,453 8,368,745 7,539,293 7,129,619 7,060,969
Cash and Marketable Securities 507,245 297,232 259,129 173,171 323,500
Short-Term Debt 682,248 577,999 2,574,292 2,840,659 324,890
Long-Term Debt 2,860,351 2,922,768 1,926,792 202,802 2,817,622
Total Debt 3,542,599 3,500,767 4,501,084 3,043,461 3,142,512
Equity Credit Total Debt with Equity Credit 3,542,599 3,500,767 4,501,084 3,043,461 3,142,512
Off-Balance Sheet Debt 0 0 0 0 0
Total Adjusted Debt with Equity Credit 3,542,599 3,500,767 4,501,084 3,043,461 3,142,512
Total Equity 2,797,306 2,346,960 778,915 1,572,536 1,781,108
Total Adjusted Capital 6,339,905 5,847,727 5,279,999 4,615,997 4,923,620 Cash Flow
Funds from Operations 1,119,703 699,063 677,264 244,775 (106,498)
Change in Working Capital (215,339) (224,122) (221,585) (135,105) 503,951
Cash Flow from Operations 904,364 474,941 455,679 109,670 397,453
Total Non-Operating/Nonrecurring Cash Flow 0 0 0 0 0
Capital Expenditures (322,993) (210,282) (159,537) (152,116) (213,548)
Common Dividends 0 0 0 0 0
Free Cash Flow 581,371 264,659 296,142 (42,446) 183,905
Net Acquisitions. and Divestitures 0 0 0 0 0
Other Investments, Net (53,068) 871 11,384 26,917 19,919
Net Debt Proceeds (37,415) (15,639) (38,858) (114,690) (134,367)
Net Equity Proceeds 667 667 0 0 0
Other (Investments and Financing) (226,535) (212,455) (182,710) (20,110) (64,876)
Total Change in Cash 265,020 38,103 85,958 (150,329) 4,581
Continued on next page. Source: Company filings and Fitch calculations.
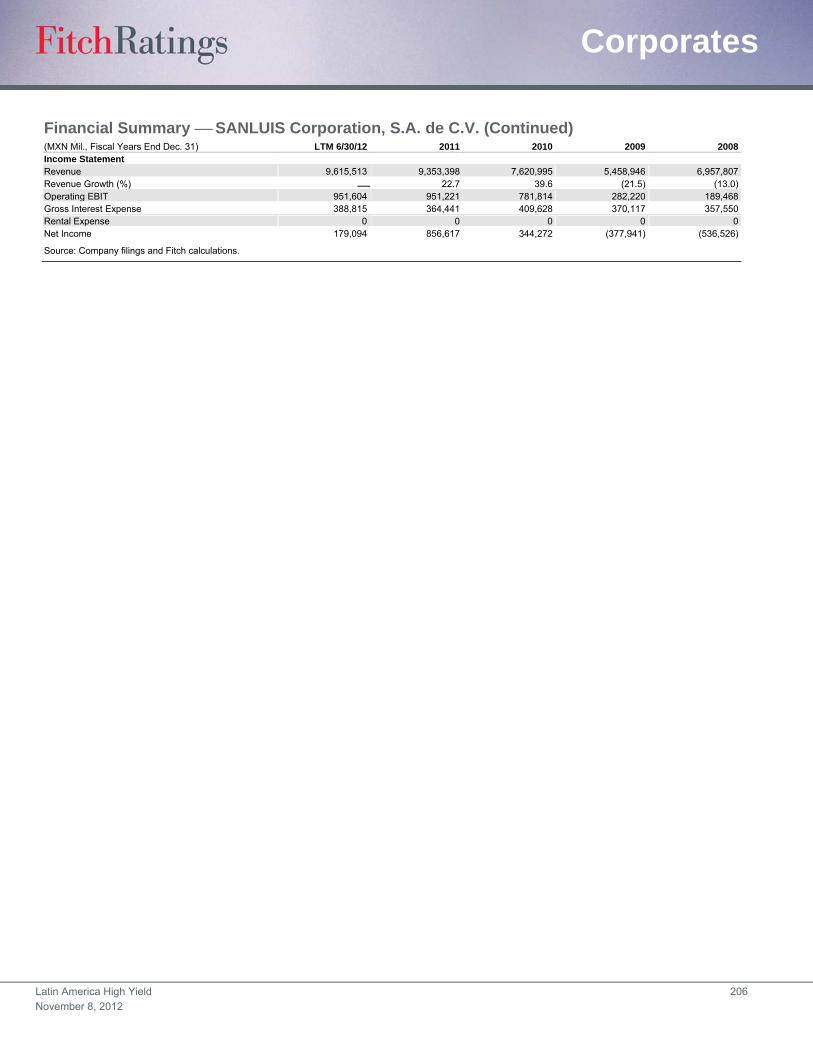
Latin America High Yield 206
November 8, 2012
Corporates
Financial Summary SANLUIS Corporation, S.A. de C.V. (Continued) (MXN Mil., Fiscal Years End Dec. 31) LTM 6/30/12 2011 2010 2009 2008Income Statement Revenue 9,615,513 9,353,398 7,620,995 5,458,946 6,957,807Revenue Growth (%) — 22.7 39.6 (21.5) (13.0)Operating EBIT 951,604 951,221 781,814 282,220 189,468Gross Interest Expense 388,815 364,441 409,628 370,117 357,550Rental Expense 0 0 0 0 0Net Income 179,094 856,617 344,272 (377,941) (536,526)
Source: Company filings and Fitch calculations.

Latin America High Yield 207
November 8, 2012
Corporates
Servicios Corporativos Javer, S.A.P.I. de C.V. Full Rating Report
Key Rating Drivers
High Leverage: Javer’s total adjusted debt has increased in the past 18 months by 45% to
MXN3.8 billion from MXN2.6 billion. The increase primarily reflected the company’s large
investments during 2011 in working capital, as the company increased the size of its inventories.
Positively, Javer has no significant debt payments due during the next two years.
Modest Change in FCF in 2012: Javer’s cash flow has begun to improve following its build-up
of working capital during 2011 that resulted in a negative FCF of MXN390 million. During the LTM
ended June 30, 2012, Javer’s FCF was positive MXN125 million. This was a result of slower
growth in units, an improvement in the collection process, and more moderate requirements in
inventories.
Recovery in Margins Expected in the Second Half of 2012: Javer’s EBITDA margin was
15% during the first half of 2012, which is below its normal average. The decline in margins was
due to its product mix being more oriented to the low-income segment in order to take advantage
of available subsidies through CONAVI. Margins are expected to improve for the second half of
the year, as the company product mix shifts slightly to higher end customers.
Sector’s Mortgage Origination Remains Stable: INFONAVIT’s total number of loans granted
was 276,856 during the first half of 2012, which represents 57% of INFONAVIT’s 2012 target.
Two factors that could limit the sector’s growth during the second half of 2012 are the
availability of subsidies, as 72% of the annual target amount was already allocated by CONAVI
and FOMHAPO during the first-half 2012, and potential delays in the origination process due to
new procedures being implemented (scoring system and credit bureau) by the government
agencies for mortgage origination.
Large Regional Player with Limited Diversification: Javer is one of the five largest players
in the Mexican homebuilding industry with total annual units sold around 18,000 units. The
company’s operations in the state of Nuevo Leon represent about 75% of its unit sales. This
concentration increases Javer’s dependence upon specific local and municipal governments to
secure land and permits. Positively, the company accounts for about 15% of the mortgages
granted by Instituto del Fondo Nacional para la Vivienda de los Trabajadores (Infonavit) in
Nuevo Leon.
What Could Trigger a Rating Action
FCF Generation Is Main Driver: Javer’s leverage increased significantly in 2011. The
Negative Outlook reflects the view that continued high and negative FCF levels — similar to the
levels reached during 2011 — in 2012 would fail to reduce leverage levels to those consistent
with the rating category. Weaker liquidity, as reflected by a decreased cash position or higher
short-term debt levels, would be seen as negative to credit quality and could also lead to a
downgrade. Additional threats to the rating category include a decline in government funding
programs or an erosion of the company’s market position. Conversely, better operational
performance, resulting in the expectation that total adjusted debt to EBITDA would remain
below 4.0x over time, could trigger a revision of the Rating Outlook to Stable
Ratings
Foreign Currency
Long-Term IDR B
Senior Unsecured B+/RR3
Local Currency
Long-Term IDR B
Rating Outlooks Long-Term Foreign Currency IDR Negative Long-Term Local Currency IDR Negative National Long-Term Rating Negative
Financial Data Servicios Corporativos Javer, S.A.P.I. de C.V.
(MXN Mil.) 6/30/12 12/31/11 Revenue 5,394 4,719 EBITDA 982 902 EBITDA Margin (%) 18.2 19.1 FCF 125 (390) FCF Margin (%) 2.3 (8.3) Cash 363 416 Short-Term Debt 57 108 Total Adjusted Debt 3,764 3,865 Total Adjusted Debt/EBITDA (x) 3.8 4.3 Total Adjusted Net Debt/EBITDA (x) 3.5 3.8
Analysts José Vértiz +1 212 908-0641 [email protected]
Indalecio Riojas +52 81 8399-9108 [email protected]

Latin America High Yield 208
November 8, 2012
Corporates
Recovery Rating
Javer’s recovery ratings reflect Fitch’s belief that under a bankruptcy scenario the company’s
enterprise value, and hence recovery rates for its creditors, would be maximized through a
liquidation scenario rather than a restructuring scenario (as a going concern).
Under this scenario, Fitch applies the industry’s standard discount rates to the company’s cash,
accounts receivable, and net PP&E of 0%, 80%, and 20%, respectively. In the case of
inventories, the industry’s standard discount rate is 55%. However, for this specific case Fitch
utilizes 45%, which reflects the fact that approximately 50% of the company’s long-term
inventories included land from third parties being held through land trust agreements.
The ‘B+/RR3’ rating assigned to the senior notes reflects good recovery prospects in the range
of 50%–70% given default.
Recovery Analysis Servicios Corporativos Javer, S.A.P.I. de C.V. (MXN Mil., As of June 30, 2012)
Enterprise Value (As of June 30, 2012) Liquidation Value Balance Recovery Rates (%)Available to
CreditorEBITDA 982 Cash 363 0 EBITDA Discount (%) 40 Accounts Receivable 1,753 80 1,402Distressed EBITDA 589 Inventory 3,685 45 1,658Market Multiple 3.5 PP&E, Net 267 20 53Enterprise Value 2,061 Total 6,067 3,114
Interest Expense Rent Expense Maintenance Capital Expenditures Principal Amortization (Next 12 Months) Distribution of Value by Priority Greater of Enterprise or Liquidation Value 3,114 Less Administrative Claims 311 Less Concession Payments 0.0 Adjusted Value 2,802
Amount Outstanding
and Available R/C Value Recovered Recovery Rate (%) ‘RR’ Rating Notching Credit
Ratings Issuer Default Rating B Senior Unsecured 3,579 2,617 73 RR3 1 B+
Note: According to Fitch Ratings’ country-specific treatment of recovery ratings, Mexico has a soft cap at ‘RR3’, which results in a maximum one-notch benefit over the issuer default rating. Source: Javer’s financial statements and Fitch Ratings.

Latin America High Yield 209
November 8, 2012
Corporates
Organizational Structure — Servicios Corporativos Javer, S.A.P.I. de C.V. (Javer) (As of June 30, 2012)
aEach of Javer’s subsidiaries guarantees the notes jointly and severally on a senior unsecured basis. Source: Javer.
Proyectos del Noreste,S.A. de C.V.
38.0%
Promotora de Proyectos Inmobiliarios Turin,
S.A. de C.V.
Southern Cross Designees (40.7%),
Evercore Designee (10.7%), and Arzentia (8.5%)
Servicios Corporativos Javer, S.A.P.I. de C.V. (Javer)
USD270 Mil. Senior Notes Due 2021a
2.0% 60.0%
Urbanizaciones Javer S.A. de C.V.
Servicios Administrativos Javer, S.A. de C.V.
Construccion de Viviendas Javer
S.A. de C.V.
Impulsora de Viviendas Javer S.A. de C.V., SOFOM,
E.N.R.
99.9% 99.9% 99.9% 99.9%
Hogares Javer, S.A. de C.V.
Casas Consentidas Javer, S.A. de C.V.,
SOFOM E.N.R.
Casas Javer S.A. de C.V.
99.9%99.9%99.9%

Latin America High Yield 210
November 8, 2012
Corporates
Debt and Covenant Synopsis Servicios Corporativos Javer, S.A.P.I. de C.V. (Javer) (Foreign Currency Notes)
Overview Issuer Servicios Corporativos Javer, S.A.P.I. de C.V. (Javer) Guarantors Payment of principal of, premium, if any, and interest on the notes is guaranteed jointly and severally on a senior unsecured basis by each
of the following Javer subsidiaries (Guarantors): Servicios Administrativos Javer, S.A. de C.V.; Casas Javer, S.A. de C.V.; Hogares Javer, S.A. de C.V.; Viviendas Javer, S.A. de C.V.: Construcción de Viviendas Javer, S.A. de C.V.: Urbanizaciones Javer, S.A. de C.V., Impulsora de Viviendas del Noreste, S.A. de C.V.: Impulsora de Viviendas Javer, S.A. de C.V.: SOFOM, E.N.R., Desarrollos Integrales Javer S.A de C.V.; and Casas Consentidas Javer, S.A. de C.V., SOFOM, E.N.R.
Document Date April 6, 2011 Maturity Date April 6, 2021 Description of Debt Senior Notes Amount USD270 Million Ranking The notes and the guarantees rank equally in right of payment with all of the company and the subsidiary guarantors’ existing and future
senior indebtedness; and senior in right of payment to all of the company and the subsidiary guarantors’ existing and future subordinated indebtedness. The notes and the guarantees will effectively rank junior in right of payment to all of the company and the subsidiary guarantors’ existing and future secured indebtedness with respect and up to the value of the assets securing such indebtedness. The notes and the guarantees will be structurally subordinated to all indebtedness (including trade payables) of the company’s non-guarantor subsidiaries. Furthermore, the notes and the guarantees will rank junior in right of payment to all obligations preferred by statute (such as tax or labor obligations).
Financial Covenants Limitation on Incurrence of Additional Indebtedness
The company may incur in additional indebtedness if, among other conditions provided in the new indenture, the consolidated fixed coverage ratio is greater than 2.25 to 1.00. Permitted indebtedness includes indebtedness incurred by the company or any subsidiary guarantor under credit facilities (including construction bridge loans and other seller financing) in an aggregate principal amount at any time outstanding not to exceed the greater of USD50.0 million or 10.0% of consolidated tangible assets.
Acquisitions/Divestitures Change of Control Provision Upon the occurrence of a change of control, the holders of the notes will have the right subject to certain exceptions to require the
issuer to repurchase some or all of the notes at 101% of their principal amount, plus accrued and unpaid interest, if any, on the repurchase date. In connection with the company’s change of control occurred during 2009, the company completed a consent solicitation pursuant to a consent solicitation statement dated Oct. 28, 2009, requesting that holders of the outstanding notes as of a record date waive the change of control provisions of and consent to an amendment to the indenture governing the outstanding notes (together, the “Waiver and Amendment”). After receiving valid consents from holders of a majority in aggregate principal amount of the outstanding notes, the Waiver and Amendment was affected through the execution of a supplemental indenture, dated as of Nov. 9, 2009, to the indenture.
Certain Covenants The indenture contains certain covenants that, among other things, limit the company’s ability and the ability of its subsidiaries to: (1) incur
additional indebtedness; (2) pay dividends on the company’s capital stock or redeem, repurchase, or retire the company’s capital stock or subordinated indebtedness; (3) make investments; (4) create liens; (5) create any consensual limitation on the ability of the company’s restricted subsidiaries to pay dividends, make loans, or transfer property to the company; (6) engage in transactions with affiliates; (7) sell assets, including capital stock of the company’s subsidiaries; and (8) consolidate, merge, or transfer assets. If the notes obtain investment-grade ratings from the rating agencies and no default has occurred and is continuing, the foregoing covenants will cease to be in effect with the exception of covenants that contain limitations on liens and on, among other things, certain consolidations, mergers, and transfer of assets for so long as each of the foregoing rating agencies maintains its investment grade rating. These covenants are subject to important exceptions and qualifications.
Others Limitation on Transactions with Affiliates
The company will not, and will not permit any of its restricted subsidiaries to, directly or indirectly, enter into any transaction or series of related transactions (including, without limitation, the purchase, sale, lease, or exchange of any property or the rendering of any service) with, or for the benefit of, any of its affiliates (each an “affiliate transaction”), unless: (1) the terms of such affiliate transaction are no less favorable than those that could reasonably be expected to be obtained in a comparable transaction at such time on an arm’s-length basis from a person that is not an affiliate of the company; (2) in the event that such affiliate transaction involves aggregate payments or transfers of property or services with a fair market value, in excess of USD5 million, the terms of such affiliate transaction will be approved by a majority of the members of the board of directors of the company; and (3) in the event that such affiliate transaction involves aggregate payments, or transfers of property or services with a fair market value, in excess of USD15 million, the company will, prior to the consummation thereof, obtain a favorable opinion as to the fairness of such affiliate transaction to the company and the relevant restricted subsidiary (if any) from a financial point of view from an independent financial advisor and file the same with the trustee. This restriction is subject to important exceptions and qualifications.
Limitation on Consolidations or Mergers
Javer will not, in a single transaction or series of related transactions, consolidate or merge with or into any person (whether or not the company is the surviving or continuing person), or sell, assign, transfer, lease, convey or otherwise dispose of (or cause or permit any restricted subsidiary to sell, assign, transfer, lease, convey or otherwise dispose of) all or substantially all of the company’s properties and assets (determined on a consolidated basis for the company and its restricted subsidiaries), to any person. This restriction is subject to several exceptions.
Events of Default The main events of default are: (1) default in the payment when due of the principal of or premium, if any, on any notes, including the failure to make a required payment to purchase notes tendered pursuant to an optional redemption, change of control offer or an asset sale offer; (2) default for 30 days or more in the payment when due of interest, additional amounts or liquidated damages, if any, on any notes; (3) the failure to perform or comply with any of the provisions described under “Certain Covenants — Merger, Consolidation, and Sale of Assets”; and (4) the failure by the company or any restricted subsidiary to comply with any other covenant or agreement contained in the indenture or in the notes for 45 days or more after written notice to the company from the trustee or the holders of at least 25% in aggregate principal amount of the outstanding notes.
Continued on next page. Disclaimer: The covenant summaries reflect Fitch’s interpretation and synopsis of information contained in publicly available documents identified in the “Document Date and Location” section of each covenant summary table. Fitch cannot ensure that the information contained in such documents is either accurate or complete, or that the covenant summaries, or any particular covenant summary, accurately or completely reflect the key terms of any such document. The information presented in the covenant summaries is provided “as is” without any representation or warranty and is not a substitute for information provided to investors by an issuer and its agents in connection with a sale of securities. Source: Servicios Corporativos Javer, S.A.P.I. de C.V. and Fitch Ratings.

Latin America High Yield 211
November 8, 2012
Corporates
Debt and Covenant Synopsis Servicios Corporativos Javer, S.A.P.I. de C.V. (Javer) (Continued) (Foreign Currency Notes)
Others (Continued) Cross Default Cross default when an uncured event of default occurs for debt of more than USD15 million. Acceleration If any event of default occurs and is continuing, the trustee or the holders of at least 25% of the outstanding notes may declare the notes to
be due and payable. Notes become automatically due and payable upon certain events of insolvency or bankruptcy. Governing Law The indenture, the guarantees, and the notes will be governed by the laws of the state of New York. Optional Redemption The company may, at its option, at any time on or prior to August 2014, use the net cash proceeds of certain equity offerings to redeem in
the aggregate up to 35.0% of the aggregate principal amount of the notes, including any additional notes the company may issue in the future under the indenture, at a redemption price equal to % of the principal amount thereof, provided, that: (1) After giving effect to any such redemption at least 65.0% of the aggregate principal amount of the notes (including any additional notes) issued under the indenture remains outstanding; and (2) the company makes such redemption not more than 90 days after the consummation of such equity offering.
Disclaimer: The covenant summaries reflect Fitch’s interpretation and synopsis of information contained in publicly available documents identified in the “Document Date and Location” section of each covenant summary table. Fitch cannot ensure that the information contained in such documents is either accurate or complete, or that the covenant summaries, or any particular covenant summary, accurately or completely reflect the key terms of any such document. The information presented in the covenant summaries is provided “as is” without any representation or warranty and is not a substitute for information provided to investors by an issuer and its agents in connection with a sale of securities. Source: Servicios Corporativos Javer, S.A.P.I. de C.V. and Fitch Ratings.
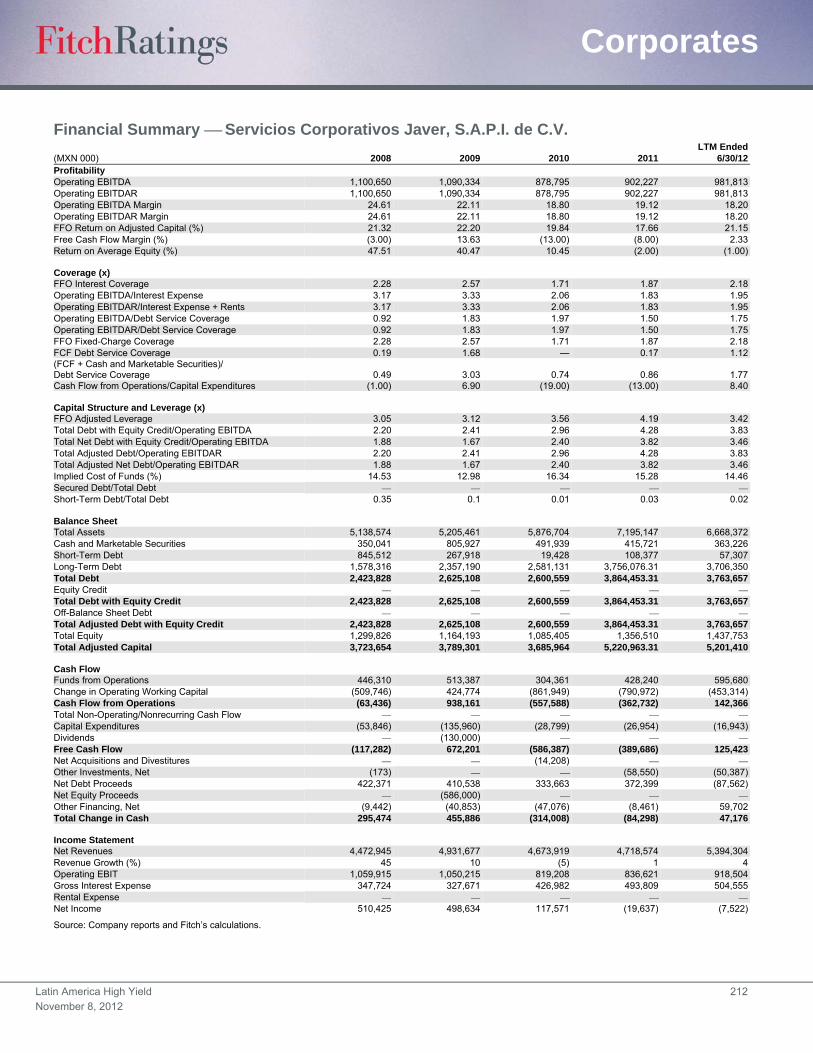
Latin America High Yield 212
November 8, 2012
Corporates
Financial Summary Servicios Corporativos Javer, S.A.P.I. de C.V. LTM Ended
(MXN 000) 2008 2009 2010 2011 6/30/12Profitability Operating EBITDA 1,100,650 1,090,334 878,795 902,227 981,813Operating EBITDAR 1,100,650 1,090,334 878,795 902,227 981,813Operating EBITDA Margin 24.61 22.11 18.80 19.12 18.20 Operating EBITDAR Margin 24.61 22.11 18.80 19.12 18.20 FFO Return on Adjusted Capital (%) 21.32 22.20 19.84 17.66 21.15 Free Cash Flow Margin (%) (3.00) 13.63 (13.00) (8.00) 2.33 Return on Average Equity (%) 47.51 40.47 10.45 (2.00) (1.00) Coverage (x) FFO Interest Coverage 2.28 2.57 1.71 1.87 2.18 Operating EBITDA/Interest Expense 3.17 3.33 2.06 1.83 1.95 Operating EBITDAR/Interest Expense + Rents 3.17 3.33 2.06 1.83 1.95 Operating EBITDA/Debt Service Coverage 0.92 1.83 1.97 1.50 1.75 Operating EBITDAR/Debt Service Coverage 0.92 1.83 1.97 1.50 1.75 FFO Fixed-Charge Coverage 2.28 2.57 1.71 1.87 2.18 FCF Debt Service Coverage 0.19 1.68 — 0.17 1.12 (FCF + Cash and Marketable Securities)/ Debt Service Coverage 0.49 3.03 0.74 0.86 1.77 Cash Flow from Operations/Capital Expenditures (1.00) 6.90 (19.00) (13.00) 8.40 Capital Structure and Leverage (x) FFO Adjusted Leverage 3.05 3.12 3.56 4.19 3.42Total Debt with Equity Credit/Operating EBITDA 2.20 2.41 2.96 4.28 3.83Total Net Debt with Equity Credit/Operating EBITDA 1.88 1.67 2.40 3.82 3.46Total Adjusted Debt/Operating EBITDAR 2.20 2.41 2.96 4.28 3.83Total Adjusted Net Debt/Operating EBITDAR 1.88 1.67 2.40 3.82 3.46Implied Cost of Funds (%) 14.53 12.98 16.34 15.28 14.46Secured Debt/Total Debt Short-Term Debt/Total Debt 0.35 0.1 0.01 0.03 0.02 Balance Sheet Total Assets 5,138,574 5,205,461 5,876,704 7,195,147 6,668,372Cash and Marketable Securities 350,041 805,927 491,939 415,721 363,226Short-Term Debt 845,512 267,918 19,428 108,377 57,307Long-Term Debt 1,578,316 2,357,190 2,581,131 3,756,076.31 3,706,350Total Debt 2,423,828 2,625,108 2,600,559 3,864,453.31 3,763,657Equity Credit Total Debt with Equity Credit 2,423,828 2,625,108 2,600,559 3,864,453.31 3,763,657Off-Balance Sheet Debt Total Adjusted Debt with Equity Credit 2,423,828 2,625,108 2,600,559 3,864,453.31 3,763,657Total Equity 1,299,826 1,164,193 1,085,405 1,356,510 1,437,753Total Adjusted Capital 3,723,654 3,789,301 3,685,964 5,220,963.31 5,201,410 Cash Flow Funds from Operations 446,310 513,387 304,361 428,240 595,680 Change in Operating Working Capital (509,746) 424,774 (861,949) (790,972) (453,314)Cash Flow from Operations (63,436) 938,161 (557,588) (362,732) 142,366 Total Non-Operating/Nonrecurring Cash Flow Capital Expenditures (53,846) (135,960) (28,799) (26,954) (16,943)Dividends (130,000) Free Cash Flow (117,282) 672,201 (586,387) (389,686) 125,423 Net Acquisitions and Divestitures (14,208) Other Investments, Net (173) (58,550) (50,387)Net Debt Proceeds 422,371 410,538 333,663 372,399 (87,562)Net Equity Proceeds (586,000) Other Financing, Net (9,442) (40,853) (47,076) (8,461) 59,702 Total Change in Cash 295,474 455,886 (314,008) (84,298) 47,176 Income Statement Net Revenues 4,472,945 4,931,677 4,673,919 4,718,574 5,394,304 Revenue Growth (%) 45 10 (5) 1 4 Operating EBIT 1,059,915 1,050,215 819,208 836,621 918,504 Gross Interest Expense 347,724 327,671 426,982 493,809 504,555 Rental Expense Net Income 510,425 498,634 117,571 (19,637) (7,522)
Source: Company reports and Fitch’s calculations.
Latin America High Yield 213
November 8, 2012
Corporates
Sidetur Siderurgica del Turbio, S.A. Full Rating Report
Key Rating Drivers
Ongoing Expropriation Process: Siderurgica del Turbio, S.A.’s (Sidetur) ratings reflect the
ongoing developments and uncertainty surrounding the expropriation of Sidetur’s steel mills, in
particular the unknown dollar value that it will receive from the Venezuelan government for
those assets. The ratings also take into consideration the uncertainty surrounding the
timeliness of payment from the government, which could inadvertently lead to the change-of-
control clause being triggered.
Higher than Average Recoveries: Recovery in the event of default could be above the ‘RR4’
level due to Sivensa’s strong reputation and conservative management, as well as the low level
of debt in relation to the amount of funds the company is likely to receive from the government.
The recovery was capped at the ‘RR4’ level due to concerns about creditor rights in Venezuela,
as well as the application and legal enforceability of any claim. Please refer to Fitch’s criteria
report, “Country-Specific Treatment of Recovery Ratings,” dated June 15, 2012 for more
guidance on Fitch’s application of national recovery ratings.
Shrinking Volumes Offset by Better Product Mix: Sidetur’s revenues and EBITDA reduced
significantly as a result of lower sales volumes and price controls to USD355 million and
USD62 million in fiscal 2011 from USD647 million and USD119 million in fiscal 2009,
respectively. For the LTM to March 31, 2012, the company’s revenues improved to
USD451 million, and EBITDA showed improvement due to better product mix with a higher
amount of unregulated rebar products at USD74 million, with an EBITDA margin of 16%.
Low Leverage Maintained: In spite of this decline in revenues, the company’s leverage
remained low with its total-debt-to-LTM EBITDA ratio currently at 1.1x and 0.7x on a net cash
basis, as of March 31, 2012. This compares favorably to 2.8x and 1.2x, respectively, in fiscal
2011. Total debt as of the same period was USD80 million compared to USD90 million in fiscal
2010, mainly comprising the outstanding portion of the USD100 million senior unsecured notes
issued by Sidetur through its 100% owned subsidiary, Sidetur Finance B.V. in 2006.
Minimal Cash Position: Sidetur’s cash position is at a historical low. Fitch partly attributes this
to a change in cash management strategy related to the company’s expropriation. The
company held USD32 million of cash and marketable securities as of March 31, 2012, a
significant reduction on USD149 million held in fiscal 2008. USD7 million of the latest cash
position was restricted cash, which guarantees a quote of capital and interest of the bonds.
Sidetur has a manageable debt maturity schedule of USD5 million a year until 2016, providing
headroom.
What Could Trigger a Rating Action
Expropriation of Company Assets: Sidetur’s ratings are dependent on the unfolding events
surrounding the expropriation process. Sidetur’s ratings incorporate the expectation that the
government of Venezuela works to avoid a situation whereby an international default occurs as
a result of the nationalization process of Sidetur’s assets. Sidetur’s ratings therefore reflect
Fitch’s current expectation of the unsecured notes at Sidetur Finance B.V. being prepaid.
Ratings
Foreign Currency
Long-Term Foreign Currency IDR B–
Long-Term Local Currency IDR B–
Sidetur Finance B.V. B–/RR4
National
Long-Term Rating BB+(ven)
National Short Term Rating F2(ven)
IDR – Issuer default rating.
Rating Outlooks Long-Term Foreign Currency IDR Negative Long-Term Local Currency IDR Negative
Financial Data Sidetur
(LTM) 3/31/12 9/30/11 Total Equity (USD Mil.) 137 125 Total Debt (USD Mil.) 80 83 Operating Revenue (USD Mil.) 451 355 Net Income (USD Mil.) 47 37 FCF Margin (%) 3.0 (2.0) ROAE (%) 35.0 28.0 Total Debt to EBITDA (x) 1.1 1.3
Analysts Jay Djemal +1 312 368-3134 [email protected]
Julio Ugueto +58 212 286-3232 [email protected]
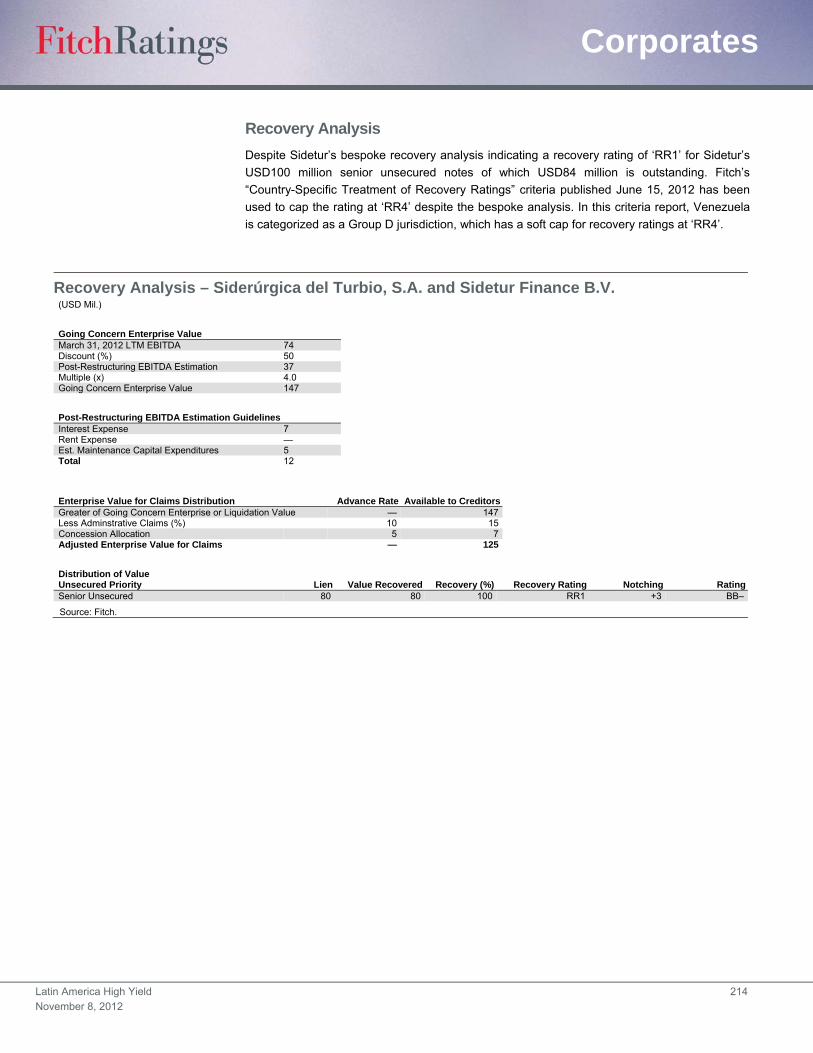
Latin America High Yield 214
November 8, 2012
Corporates
Recovery Analysis
Despite Sidetur’s bespoke recovery analysis indicating a recovery rating of ‘RR1’ for Sidetur’s
USD100 million senior unsecured notes of which USD84 million is outstanding. Fitch’s
“Country-Specific Treatment of Recovery Ratings” criteria published June 15, 2012 has been
used to cap the rating at ‘RR4’ despite the bespoke analysis. In this criteria report, Venezuela
is categorized as a Group D jurisdiction, which has a soft cap for recovery ratings at ‘RR4’.
Recovery Analysis – Siderúrgica del Turbio, S.A. and Sidetur Finance B.V. (USD Mil.)
Going Concern Enterprise Value March 31, 2012 LTM EBITDA 74 Discount (%) 50 Post-Restructuring EBITDA Estimation 37 Multiple (x) 4.0 Going Concern Enterprise Value 147
Post-Restructuring EBITDA Estimation Guidelines Interest Expense 7 Rent Expense — Est. Maintenance Capital Expenditures 5 Total 12
Enterprise Value for Claims Distribution Advance Rate Available to CreditorsGreater of Going Concern Enterprise or Liquidation Value — 147Less Adminstrative Claims (%) 10 15Concession Allocation 5 7Adjusted Enterprise Value for Claims — 125
Distribution of Value Unsecured Priority Lien Value Recovered Recovery (%) Recovery Rating Notching RatingSenior Unsecured 80 80 100 RR1 +3 BB–
Source: Fitch.
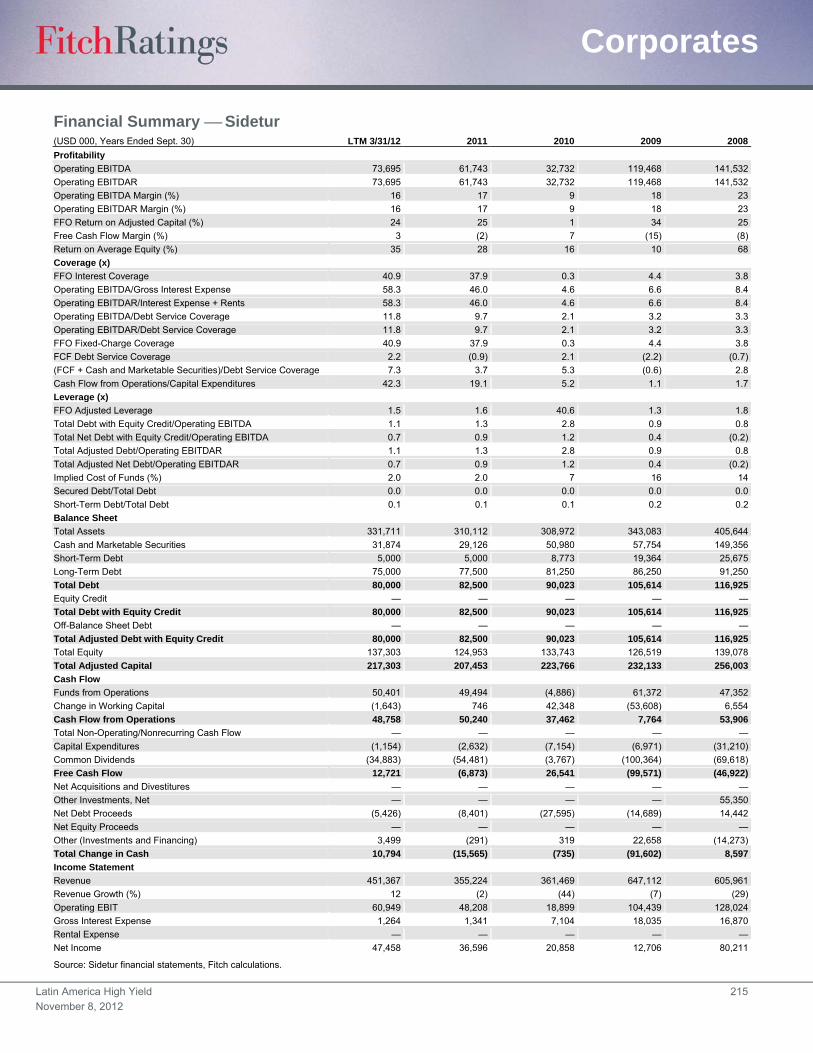
Latin America High Yield 215
November 8, 2012
Corporates
Financial Summary Sidetur (USD 000, Years Ended Sept. 30) LTM 3/31/12 2011 2010 2009 2008
Profitability
Operating EBITDA 73,695 61,743 32,732 119,468 141,532
Operating EBITDAR 73,695 61,743 32,732 119,468 141,532
Operating EBITDA Margin (%) 16 17 9 18 23
Operating EBITDAR Margin (%) 16 17 9 18 23
FFO Return on Adjusted Capital (%) 24 25 1 34 25
Free Cash Flow Margin (%) 3 (2) 7 (15) (8)
Return on Average Equity (%) 35 28 16 10 68
Coverage (x)
FFO Interest Coverage 40.9 37.9 0.3 4.4 3.8
Operating EBITDA/Gross Interest Expense 58.3 46.0 4.6 6.6 8.4
Operating EBITDAR/Interest Expense + Rents 58.3 46.0 4.6 6.6 8.4
Operating EBITDA/Debt Service Coverage 11.8 9.7 2.1 3.2 3.3
Operating EBITDAR/Debt Service Coverage 11.8 9.7 2.1 3.2 3.3
FFO Fixed-Charge Coverage 40.9 37.9 0.3 4.4 3.8
FCF Debt Service Coverage 2.2 (0.9) 2.1 (2.2) (0.7)
(FCF + Cash and Marketable Securities)/Debt Service Coverage 7.3 3.7 5.3 (0.6) 2.8
Cash Flow from Operations/Capital Expenditures 42.3 19.1 5.2 1.1 1.7
Leverage (x)
FFO Adjusted Leverage 1.5 1.6 40.6 1.3 1.8
Total Debt with Equity Credit/Operating EBITDA 1.1 1.3 2.8 0.9 0.8
Total Net Debt with Equity Credit/Operating EBITDA 0.7 0.9 1.2 0.4 (0.2)
Total Adjusted Debt/Operating EBITDAR 1.1 1.3 2.8 0.9 0.8
Total Adjusted Net Debt/Operating EBITDAR 0.7 0.9 1.2 0.4 (0.2)
Implied Cost of Funds (%) 2.0 2.0 7 16 14
Secured Debt/Total Debt 0.0 0.0 0.0 0.0 0.0
Short-Term Debt/Total Debt 0.1 0.1 0.1 0.2 0.2
Balance Sheet
Total Assets 331,711 310,112 308,972 343,083 405,644
Cash and Marketable Securities 31,874 29,126 50,980 57,754 149,356
Short-Term Debt 5,000 5,000 8,773 19,364 25,675
Long-Term Debt 75,000 77,500 81,250 86,250 91,250
Total Debt 80,000 82,500 90,023 105,614 116,925
Equity Credit — — — — —
Total Debt with Equity Credit 80,000 82,500 90,023 105,614 116,925
Off-Balance Sheet Debt — — — — —
Total Adjusted Debt with Equity Credit 80,000 82,500 90,023 105,614 116,925
Total Equity 137,303 124,953 133,743 126,519 139,078
Total Adjusted Capital 217,303 207,453 223,766 232,133 256,003
Cash Flow
Funds from Operations 50,401 49,494 (4,886) 61,372 47,352
Change in Working Capital (1,643) 746 42,348 (53,608) 6,554
Cash Flow from Operations 48,758 50,240 37,462 7,764 53,906
Total Non-Operating/Nonrecurring Cash Flow — — — — —
Capital Expenditures (1,154) (2,632) (7,154) (6,971) (31,210)
Common Dividends (34,883) (54,481) (3,767) (100,364) (69,618)
Free Cash Flow 12,721 (6,873) 26,541 (99,571) (46,922)
Net Acquisitions and Divestitures — — — — —
Other Investments, Net — — — — 55,350
Net Debt Proceeds (5,426) (8,401) (27,595) (14,689) 14,442
Net Equity Proceeds — — — — —
Other (Investments and Financing) 3,499 (291) 319 22,658 (14,273)
Total Change in Cash 10,794 (15,565) (735) (91,602) 8,597
Income Statement
Revenue 451,367 355,224 361,469 647,112 605,961
Revenue Growth (%) 12 (2) (44) (7) (29)
Operating EBIT 60,949 48,208 18,899 104,439 128,024
Gross Interest Expense 1,264 1,341 7,104 18,035 16,870
Rental Expense — — — — —
Net Income 47,458 36,596 20,858 12,706 80,211
Source: Sidetur financial statements, Fitch calculations.
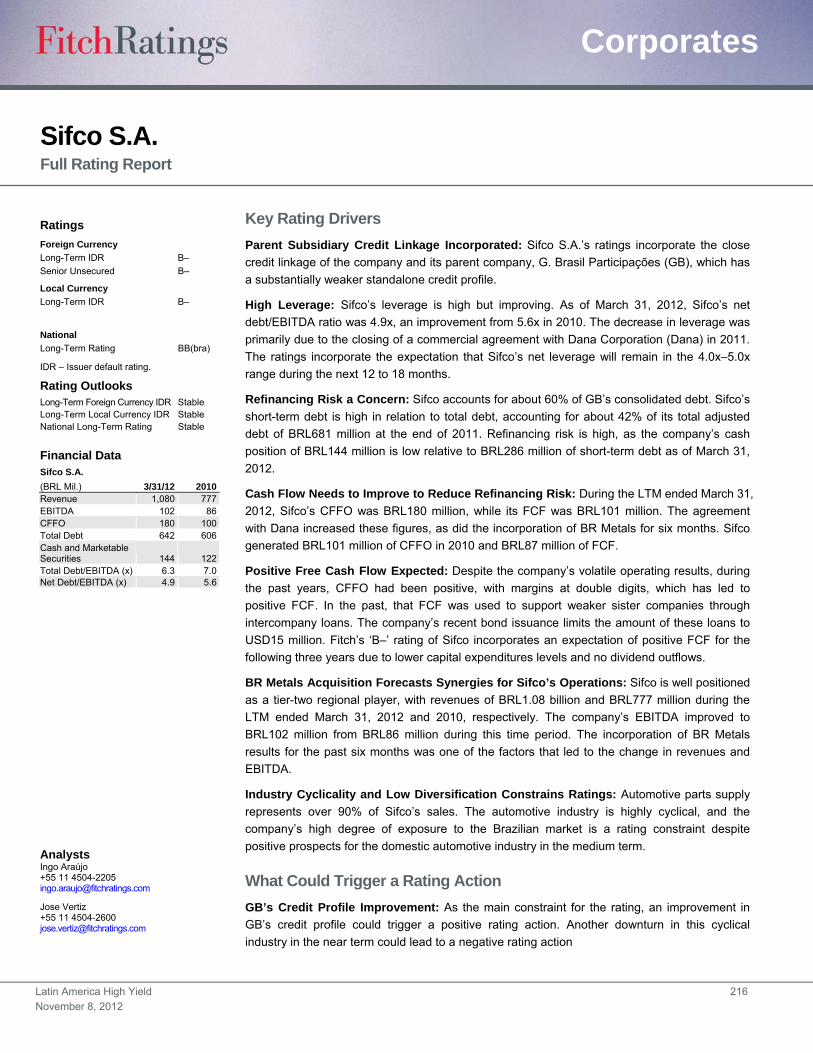
Latin America High Yield 216
November 8, 2012
Corporates
Sifco S.A. Full Rating Report
Key Rating Drivers
Parent Subsidiary Credit Linkage Incorporated: Sifco S.A.’s ratings incorporate the close
credit linkage of the company and its parent company, G. Brasil Participações (GB), which has
a substantially weaker standalone credit profile.
High Leverage: Sifco’s leverage is high but improving. As of March 31, 2012, Sifco’s net
debt/EBITDA ratio was 4.9x, an improvement from 5.6x in 2010. The decrease in leverage was
primarily due to the closing of a commercial agreement with Dana Corporation (Dana) in 2011.
The ratings incorporate the expectation that Sifco’s net leverage will remain in the 4.0x–5.0x
range during the next 12 to 18 months.
Refinancing Risk a Concern: Sifco accounts for about 60% of GB’s consolidated debt. Sifco’s
short-term debt is high in relation to total debt, accounting for about 42% of its total adjusted
debt of BRL681 million at the end of 2011. Refinancing risk is high, as the company’s cash
position of BRL144 million is low relative to BRL286 million of short-term debt as of March 31,
2012.
Cash Flow Needs to Improve to Reduce Refinancing Risk: During the LTM ended March 31,
2012, Sifco’s CFFO was BRL180 million, while its FCF was BRL101 million. The agreement
with Dana increased these figures, as did the incorporation of BR Metals for six months. Sifco
generated BRL101 million of CFFO in 2010 and BRL87 million of FCF.
Positive Free Cash Flow Expected: Despite the company’s volatile operating results, during
the past years, CFFO had been positive, with margins at double digits, which has led to
positive FCF. In the past, that FCF was used to support weaker sister companies through
intercompany loans. The company’s recent bond issuance limits the amount of these loans to
USD15 million. Fitch’s ‘B–’ rating of Sifco incorporates an expectation of positive FCF for the
following three years due to lower capital expenditures levels and no dividend outflows.
BR Metals Acquisition Forecasts Synergies for Sifco’s Operations: Sifco is well positioned
as a tier-two regional player, with revenues of BRL1.08 billion and BRL777 million during the
LTM ended March 31, 2012 and 2010, respectively. The company’s EBITDA improved to
BRL102 million from BRL86 million during this time period. The incorporation of BR Metals
results for the past six months was one of the factors that led to the change in revenues and
EBITDA.
Industry Cyclicality and Low Diversification Constrains Ratings: Automotive parts supply
represents over 90% of Sifco’s sales. The automotive industry is highly cyclical, and the
company’s high degree of exposure to the Brazilian market is a rating constraint despite
positive prospects for the domestic automotive industry in the medium term.
What Could Trigger a Rating Action
GB’s Credit Profile Improvement: As the main constraint for the rating, an improvement in
GB’s credit profile could trigger a positive rating action. Another downturn in this cyclical
industry in the near term could lead to a negative rating action
Ratings
Foreign Currency
Long-Term IDR B–
Senior Unsecured B–
Local Currency
Long-Term IDR B–
National
Long-Term Rating BB(bra)
IDR – Issuer default rating.
Rating Outlooks Long-Term Foreign Currency IDR Stable Long-Term Local Currency IDR Stable National Long-Term Rating Stable
Financial Data Sifco S.A.
(BRL Mil.) 3/31/12 2010 Revenue 1,080 777 EBITDA 102 86 CFFO 180 100 Total Debt 642 606 Cash and Marketable Securities 144 122 Total Debt/EBITDA (x) 6.3 7.0 Net Debt/EBITDA (x) 4.9 5.6
Analysts Ingo Araújo +55 11 4504-2205 [email protected]
Jose Vertiz +55 11 4504-2600 [email protected]

Latin America High Yield 217
November 8, 2012
Corporates
Recovery Rating
Sifco’s recovery rating of ‘RR4’ indicates an anticipated recovery for the company’s creditors in
the range of 31%—50% of current principal and related interest in the event of default. The
assigned recovery rating considers recovery of cash that is pledged in escrow accounts and
fixed assets liens.
Fitch has performed a liquidation analysis in the event of a bankruptcy, although this scenario
seems unlikely. In deriving a distressed enterprise valuation to determine the recovery under
this scenario, Fitch discounts the company’s LTM EBITDA to a level that would cover operating
leases, interest expenses, and maintenance capital expenditures. Fitch has applied a 5.1x
distressed EBITDA multiple. This multiple is slightly more conservative than the current 5.8x
multiple for U.S. auto suppliers.
Recovery Analysis Sifco S.A. (BRL Mil.)
Going Concern Enterprise Value Liquidation Value Advance RateAvailable to
CreditorsMarch 30, 2012 LTM EBITDA 102,398 Cash 143,974.0 15 21,596Discount (%) 25 A/R 142,745.0 80 114,196Post-Restructuring EBITDA Estimation 76,798 Inventory 98,416.0 50 49,208Multiple (x) 5.1 Net PPE 556,427.0 45 250,392Going Concern Enterprise Value 391,672 Total 941,562.0 435,392 Post-Restructuring EBITDA Estimation Guidelines Interest Expense 76,414Rent Expense —Estimated Maintenance Capital Expenditures 15,000Total 91,414 Enterprise Value for Claims Distribution Concession Payment Availability Table Greater of Going Concern Enterprise or Liquidation Value 435,392 Adjusted Enterprise Value for Claims 391,853Less Administrative Claims (10%) 43,539 Less Secured Debt Recovery 271,261Adjusted Enterprise Value for Claims 391,853 Remaining Recovery for Unsecured Claims 120,592 Concession Allocation (0%) — Value to be Distributed to Senior Unsecured Claims 120,592Distribution of Value
Secured Priority LienValue
Recovered Recovery (%)Recovery
Rating Notching RatingSenior Secured 0.0 — 0 — — —Secured 271,261.0 271,261.0 100 RR1 +3 BB–
Unsecured Priority LienValue
Recovered Recovery (%)Concession
Allocation (%) Recovery
Rating Notching RatingSenior Unsecured 370,845.0 120,592 33 0 RR4 0 B–
Source: Fitch Ratings.
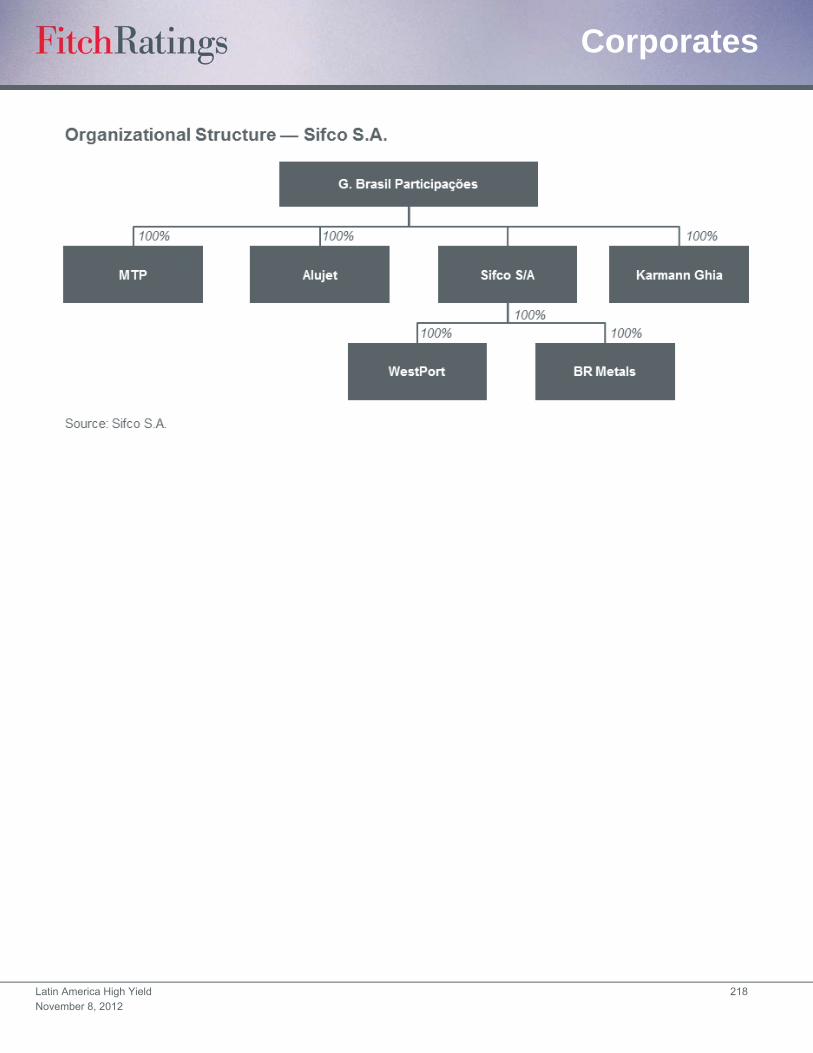
Latin America High Yield 218
November 8, 2012
Corporates
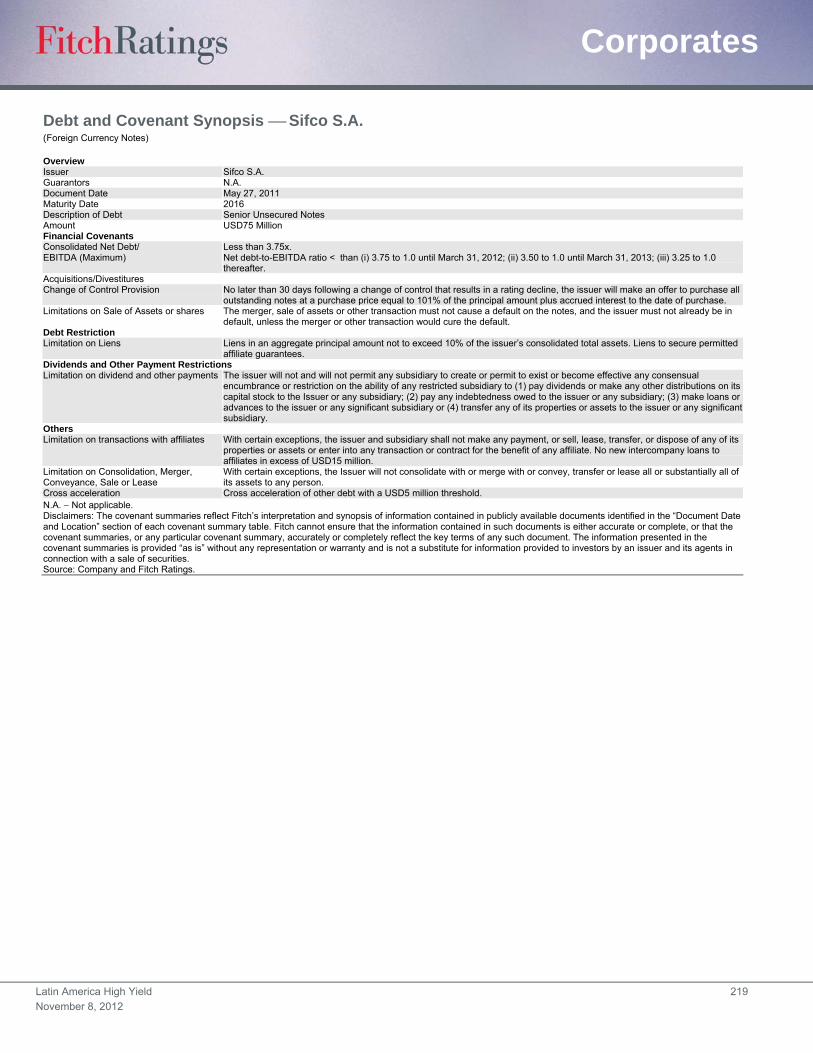
Latin America High Yield 219
November 8, 2012
Corporates
Debt and Covenant Synopsis Sifco S.A. (Foreign Currency Notes)
Overview Issuer Sifco S.A. Guarantors N.A. Document Date May 27, 2011 Maturity Date 2016 Description of Debt Senior Unsecured Notes Amount USD75 Million Financial Covenants Consolidated Net Debt/ EBITDA (Maximum)
Less than 3.75x. Net debt-to-EBITDA ratio < than (i) 3.75 to 1.0 until March 31, 2012; (ii) 3.50 to 1.0 until March 31, 2013; (iii) 3.25 to 1.0 thereafter.
Acquisitions/Divestitures Change of Control Provision No later than 30 days following a change of control that results in a rating decline, the issuer will make an offer to purchase all
outstanding notes at a purchase price equal to 101% of the principal amount plus accrued interest to the date of purchase. Limitations on Sale of Assets or shares The merger, sale of assets or other transaction must not cause a default on the notes, and the issuer must not already be in
default, unless the merger or other transaction would cure the default. Debt Restriction Limitation on Liens Liens in an aggregate principal amount not to exceed 10% of the issuer’s consolidated total assets. Liens to secure permitted
affiliate guarantees. Dividends and Other Payment Restrictions Limitation on dividend and other payments The issuer will not and will not permit any subsidiary to create or permit to exist or become effective any consensual
encumbrance or restriction on the ability of any restricted subsidiary to (1) pay dividends or make any other distributions on its capital stock to the Issuer or any subsidiary; (2) pay any indebtedness owed to the issuer or any subsidiary; (3) make loans or advances to the issuer or any significant subsidiary or (4) transfer any of its properties or assets to the issuer or any significant subsidiary.
Others Limitation on transactions with affiliates With certain exceptions, the issuer and subsidiary shall not make any payment, or sell, lease, transfer, or dispose of any of its
properties or assets or enter into any transaction or contract for the benefit of any affiliate. No new intercompany loans to affiliates in excess of USD15 million.
Limitation on Consolidation, Merger, Conveyance, Sale or Lease
With certain exceptions, the Issuer will not consolidate with or merge with or convey, transfer or lease all or substantially all of its assets to any person.
Cross acceleration Cross acceleration of other debt with a USD5 million threshold. N.A. Not applicable. Disclaimers: The covenant summaries reflect Fitch’s interpretation and synopsis of information contained in publicly available documents identified in the “Document Date and Location” section of each covenant summary table. Fitch cannot ensure that the information contained in such documents is either accurate or complete, or that the covenant summaries, or any particular covenant summary, accurately or completely reflect the key terms of any such document. The information presented in the covenant summaries is provided “as is” without any representation or warranty and is not a substitute for information provided to investors by an issuer and its agents in connection with a sale of securities. Source: Company and Fitch Ratings.

Latin America High Yield 220
November 8, 2012
Corporates
Financial Summary Sifco S.A. (BRL 000, Years Ended Dec. 31) LTM 3/30/12 2011 2010 2009 2008
Profitability Operating EBITDA 102,398 104,596 86,205 37,088 86,211Operating EBITDAR 102,398 104,596 86,205 37,088 86,211Operating EBITDA Margin (%) 9.5 9.8 11.1 8.5 13.8 Operating EBITDAR Margin (%) 9.5 9.8 11.1 8.5 13.8 FFO Return on Adjusted Capital (%) 20.4 19.8 18.0 10.9 21.6 Free Cash Flow Margin (%) 9.4 13.6 11.2 16.7 4.3 Average Return on Equity (%) (14.3) (0.4) 8.6 26.7 (4.0)
Coverage (x) FFO Interest Coverage 2.2 2.4 2.9 3.4 6.3Operating EBITDA/Interest Expense 1.3 1.4 1.7 2.1 4.7Operating EBITDAR/Interest Expense + Rents 1.3 1.4 1.7 2.1 4.7Operating EBITDA/Debt Service Coverage 0.3 0.3 0.3 0.4 0.8Operating EBITDAR/Debt Service Coverage 0.3 0.3 0.3 0.4 0.8FFO Fixed-Charge Coverage 2.2 2.4 2.9 3.4 6.3FCF Debt Service Coverage 0.5 0.6 0.5 1.0 0.4(Free Cash Flow + Cash and Marketable Securities)/Debt Service Coverage 0.9 1.1 0.9 1.9 1.0Cash Flow from Operations/Capital Expenditures 2.3 3.5 7.4 5.2 1.6
Capital Structure and Leverage (x) FFO Adjusted Leverage 3.8 3.9 4.2 6.5 2.6Total Debt with Equity Credit/Operating EBITDA 6.3 6.5 7.0 10.3 3.5Total Net Debt with Equity Credit/Operating EBITDA 4.9 4.9 5.6 8.0 2.8Total Adjusted Debt/Operating EBITDAR 6.3 6.5 7.0 10.3 3.5Total Adjusted Net Debt/Operating EBITDAR 4.9 4.9 5.6 8.0 2.8Implied Cost of Funds (%) 12 11 10 5 7Secured Debt/Total Debt Short-Term Debt/Total Debt 0.4 0.4 0.4 0.2 0.3
Balance Sheet Total Assets 1,491,355 1,510,217 1,046,040 723,445 732,947Cash and Marketable Securities 143,974 166,625 122,084 85,727 58,710Short-Term Debt 285,758 288,104 237,764 74,650 90,318Long-Term Debt 356,348 393,217 368,282 307,643 213,667Total Debt 642,106 681,321 606,046 382,293 303,985Equity Credit Total Debt with Equity Credit 642,106 681,321 606,046 382,293 303,985Off-Balance Sheet Debt 0 0 0 0 0Total Adjusted Debt with Equity Credit 642,106 681,321 606,046 382,293 303,985Total Equity 190,795 205,387 196,231 156,722 227,780Total Adjusted Capital 832,901 886,708 802,277 539,015 531,765
Cash Flow Funds from Operations 93,831 102,268 93,838 41,269 96,731 Change in Operating Working Capital 86,499 102,189 6,962 48,454 (15,308)Cash Flow from Operations 180,330 204,457 100,800 89,723 81,423 Total Non-Operating/Nonrecurring Cash Flow 0 0 0 0 0 Capital Expenditures (78,912) (58,835) (13,690) (17,366) (52,330)Dividends 0 0 0 0 (2,500)Free Cash Flow 101,418 145,622 87,110 72,357 26,593 Net Acquisitions. and Divestitures (214) (214) 0 0 0 Other Investments, Net (80,205) (121,138) 0 (6,245) (1,396)Net Debt Proceeds (64,290) 19,257 (52,887) (1,681) 25,293 Net Equity Proceeds 0 0 0 (36,360) 0 Other Financing, Net 2,529 2,307 21 (1,054) (6,042)Total Change in Cash (40,762) 45,834 34,244 27,017 44,448
Income Statement Net Revenues 1,080,268 1,071,495 777,334 434,171 624,368Revenue Growth (%) 38 79 (30) 12Operating EBIT 55,497 62,735 63,708 (46,039) 70,016 Gross Interest Expense 76,414 73,720 50,645 17,551 18,300 Rental Expense 0 0 0 0 0 Net Income (13,684) (877) 15,228 51,288 (9,067)
Source: Fitch Ratings.
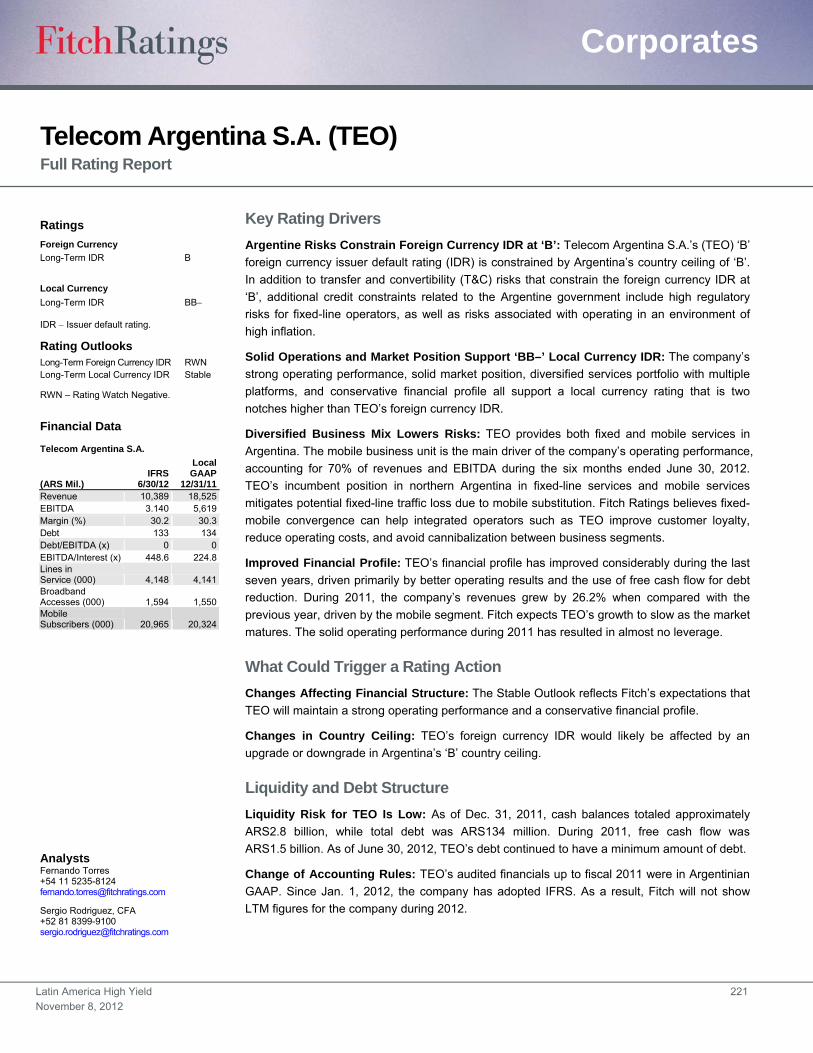
Latin America High Yield 221
November 8, 2012
Corporates
Telecom Argentina S.A. (TEO) Full Rating Report
Key Rating Drivers
Argentine Risks Constrain Foreign Currency IDR at ‘B’: Telecom Argentina S.A.’s (TEO) ‘B’
foreign currency issuer default rating (IDR) is constrained by Argentina’s country ceiling of ‘B’.
In addition to transfer and convertibility (T&C) risks that constrain the foreign currency IDR at
‘B’, additional credit constraints related to the Argentine government include high regulatory
risks for fixed-line operators, as well as risks associated with operating in an environment of
high inflation.
Solid Operations and Market Position Support ‘BB–’ Local Currency IDR: The company’s
strong operating performance, solid market position, diversified services portfolio with multiple
platforms, and conservative financial profile all support a local currency rating that is two
notches higher than TEO’s foreign currency IDR.
Diversified Business Mix Lowers Risks: TEO provides both fixed and mobile services in
Argentina. The mobile business unit is the main driver of the company’s operating performance,
accounting for 70% of revenues and EBITDA during the six months ended June 30, 2012.
TEO’s incumbent position in northern Argentina in fixed-line services and mobile services
mitigates potential fixed-line traffic loss due to mobile substitution. Fitch Ratings believes fixed-
mobile convergence can help integrated operators such as TEO improve customer loyalty,
reduce operating costs, and avoid cannibalization between business segments.
Improved Financial Profile: TEO’s financial profile has improved considerably during the last
seven years, driven primarily by better operating results and the use of free cash flow for debt
reduction. During 2011, the company’s revenues grew by 26.2% when compared with the
previous year, driven by the mobile segment. Fitch expects TEO’s growth to slow as the market
matures. The solid operating performance during 2011 has resulted in almost no leverage.
What Could Trigger a Rating Action
Changes Affecting Financial Structure: The Stable Outlook reflects Fitch’s expectations that
TEO will maintain a strong operating performance and a conservative financial profile.
Changes in Country Ceiling: TEO’s foreign currency IDR would likely be affected by an
upgrade or downgrade in Argentina’s ‘B’ country ceiling.
Liquidity and Debt Structure
Liquidity Risk for TEO Is Low: As of Dec. 31, 2011, cash balances totaled approximately
ARS2.8 billion, while total debt was ARS134 million. During 2011, free cash flow was
ARS1.5 billion. As of June 30, 2012, TEO’s debt continued to have a minimum amount of debt.
Change of Accounting Rules: TEO’s audited financials up to fiscal 2011 were in Argentinian
GAAP. Since Jan. 1, 2012, the company has adopted IFRS. As a result, Fitch will not show
LTM figures for the company during 2012.
Ratings
Foreign Currency
Long-Term IDR B
Local Currency
Long-Term IDR BB
IDR Issuer default rating.
Rating Outlooks Long-Term Foreign Currency IDR RWN Long-Term Local Currency IDR Stable
RWN – Rating Watch Negative.
Financial Data
Telecom Argentina S.A.
(ARS Mil.) IFRS
6/30/12
Local GAAP
12/31/11 Revenue 10,389 18,525 EBITDA 3.140 5,619 Margin (%) 30.2 30.3 Debt 133 134 Debt/EBITDA (x) 0 0 EBITDA/Interest (x) 448.6 224.8 Lines in Service (000) 4,148 4,141 Broadband Accesses (000) 1,594 1,550 Mobile Subscribers (000) 20,965 20,324
Analysts Fernando Torres +54 11 5235-8124 [email protected]
Sergio Rodriguez, CFA +52 81 8399-9100 [email protected]
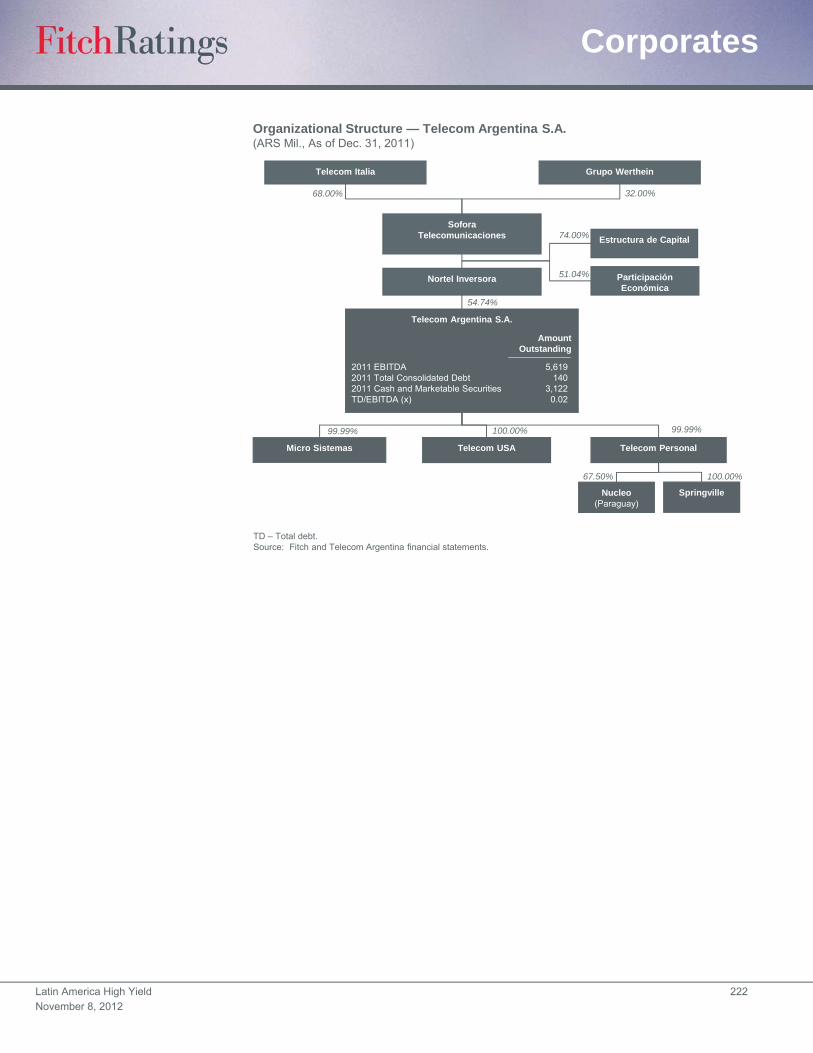
Latin America High Yield 222
November 8, 2012
Corporates
Organizational Structure — Telecom Argentina S.A.(ARS Mil., As of Dec. 31, 2011)
TD – Total debt. Source: Fitch and Telecom Argentina financial statements.
68.00%
Estructura de Capital
32.00%
Telecom Italia Grupo Werthein
Micro Sistemas Telecom USA Telecom Personal
Nucleo(Paraguay)
Springville
51.04%
99.99%
54.74%
67.50%
100.00%
Participación Económica
100.00%
99.99%
SoforaTelecomunicaciones
Nortel Inversora
74.00%
Telecom Argentina S.A.
2011 EBITDA 5,6192011 Total Consolidated Debt 1402011 Cash and Marketable Securities 3,122TD/EBITDA (x) 0.02
AmountOutstanding
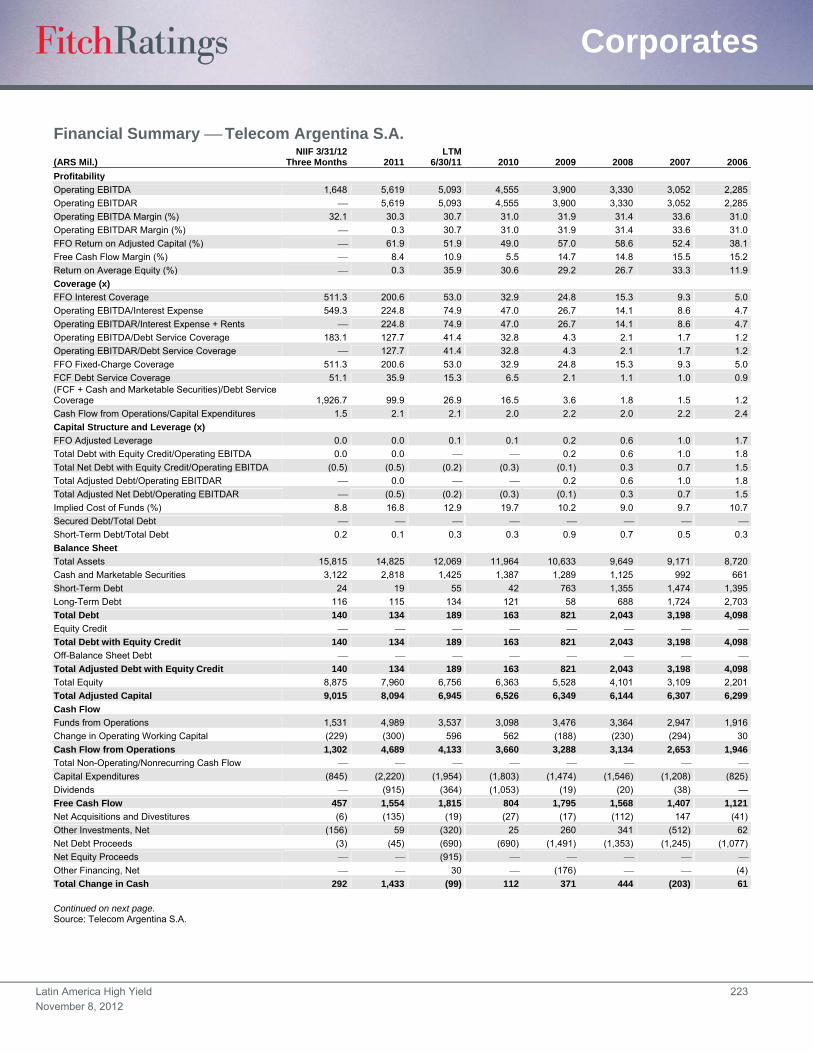
Latin America High Yield 223
November 8, 2012
Corporates
Financial Summary Telecom Argentina S.A.
(ARS Mil.) NIIF 3/31/12
Three Months 2011LTM
6/30/11 2010 2009 2008 2007 2006
Profitability
Operating EBITDA 1,648 5,619 5,093 4,555 3,900 3,330 3,052 2,285
Operating EBITDAR 5,619 5,093 4,555 3,900 3,330 3,052 2,285
Operating EBITDA Margin (%) 32.1 30.3 30.7 31.0 31.9 31.4 33.6 31.0
Operating EBITDAR Margin (%) 0.3 30.7 31.0 31.9 31.4 33.6 31.0
FFO Return on Adjusted Capital (%) 61.9 51.9 49.0 57.0 58.6 52.4 38.1
Free Cash Flow Margin (%) 8.4 10.9 5.5 14.7 14.8 15.5 15.2
Return on Average Equity (%) 0.3 35.9 30.6 29.2 26.7 33.3 11.9
Coverage (x)
FFO Interest Coverage 511.3 200.6 53.0 32.9 24.8 15.3 9.3 5.0
Operating EBITDA/Interest Expense 549.3 224.8 74.9 47.0 26.7 14.1 8.6 4.7
Operating EBITDAR/Interest Expense + Rents 224.8 74.9 47.0 26.7 14.1 8.6 4.7
Operating EBITDA/Debt Service Coverage 183.1 127.7 41.4 32.8 4.3 2.1 1.7 1.2
Operating EBITDAR/Debt Service Coverage 127.7 41.4 32.8 4.3 2.1 1.7 1.2
FFO Fixed-Charge Coverage 511.3 200.6 53.0 32.9 24.8 15.3 9.3 5.0
FCF Debt Service Coverage 51.1 35.9 15.3 6.5 2.1 1.1 1.0 0.9 (FCF + Cash and Marketable Securities)/Debt Service Coverage 1,926.7 99.9 26.9 16.5 3.6 1.8 1.5 1.2
Cash Flow from Operations/Capital Expenditures 1.5 2.1 2.1 2.0 2.2 2.0 2.2 2.4
Capital Structure and Leverage (x)
FFO Adjusted Leverage 0.0 0.0 0.1 0.1 0.2 0.6 1.0 1.7
Total Debt with Equity Credit/Operating EBITDA 0.0 0.0 0.2 0.6 1.0 1.8
Total Net Debt with Equity Credit/Operating EBITDA (0.5) (0.5) (0.2) (0.3) (0.1) 0.3 0.7 1.5
Total Adjusted Debt/Operating EBITDAR 0.0 0.2 0.6 1.0 1.8
Total Adjusted Net Debt/Operating EBITDAR (0.5) (0.2) (0.3) (0.1) 0.3 0.7 1.5
Implied Cost of Funds (%) 8.8 16.8 12.9 19.7 10.2 9.0 9.7 10.7
Secured Debt/Total Debt Short-Term Debt/Total Debt 0.2 0.1 0.3 0.3 0.9 0.7 0.5 0.3
Balance Sheet
Total Assets 15,815 14,825 12,069 11,964 10,633 9,649 9,171 8,720
Cash and Marketable Securities 3,122 2,818 1,425 1,387 1,289 1,125 992 661
Short-Term Debt 24 19 55 42 763 1,355 1,474 1,395
Long-Term Debt 116 115 134 121 58 688 1,724 2,703
Total Debt 140 134 189 163 821 2,043 3,198 4,098
Equity Credit Total Debt with Equity Credit 140 134 189 163 821 2,043 3,198 4,098
Off-Balance Sheet Debt Total Adjusted Debt with Equity Credit 140 134 189 163 821 2,043 3,198 4,098
Total Equity 8,875 7,960 6,756 6,363 5,528 4,101 3,109 2,201
Total Adjusted Capital 9,015 8,094 6,945 6,526 6,349 6,144 6,307 6,299
Cash Flow
Funds from Operations 1,531 4,989 3,537 3,098 3,476 3,364 2,947 1,916
Change in Operating Working Capital (229) (300) 596 562 (188) (230) (294) 30
Cash Flow from Operations 1,302 4,689 4,133 3,660 3,288 3,134 2,653 1,946
Total Non-Operating/Nonrecurring Cash Flow Capital Expenditures (845) (2,220) (1,954) (1,803) (1,474) (1,546) (1,208) (825)
Dividends (915) (364) (1,053) (19) (20) (38) —
Free Cash Flow 457 1,554 1,815 804 1,795 1,568 1,407 1,121
Net Acquisitions and Divestitures (6) (135) (19) (27) (17) (112) 147 (41)
Other Investments, Net (156) 59 (320) 25 260 341 (512) 62
Net Debt Proceeds (3) (45) (690) (690) (1,491) (1,353) (1,245) (1,077)
Net Equity Proceeds (915) Other Financing, Net 30 (176) (4)
Total Change in Cash 292 1,433 (99) 112 371 444 (203) 61
Continued on next page. Source: Telecom Argentina S.A.
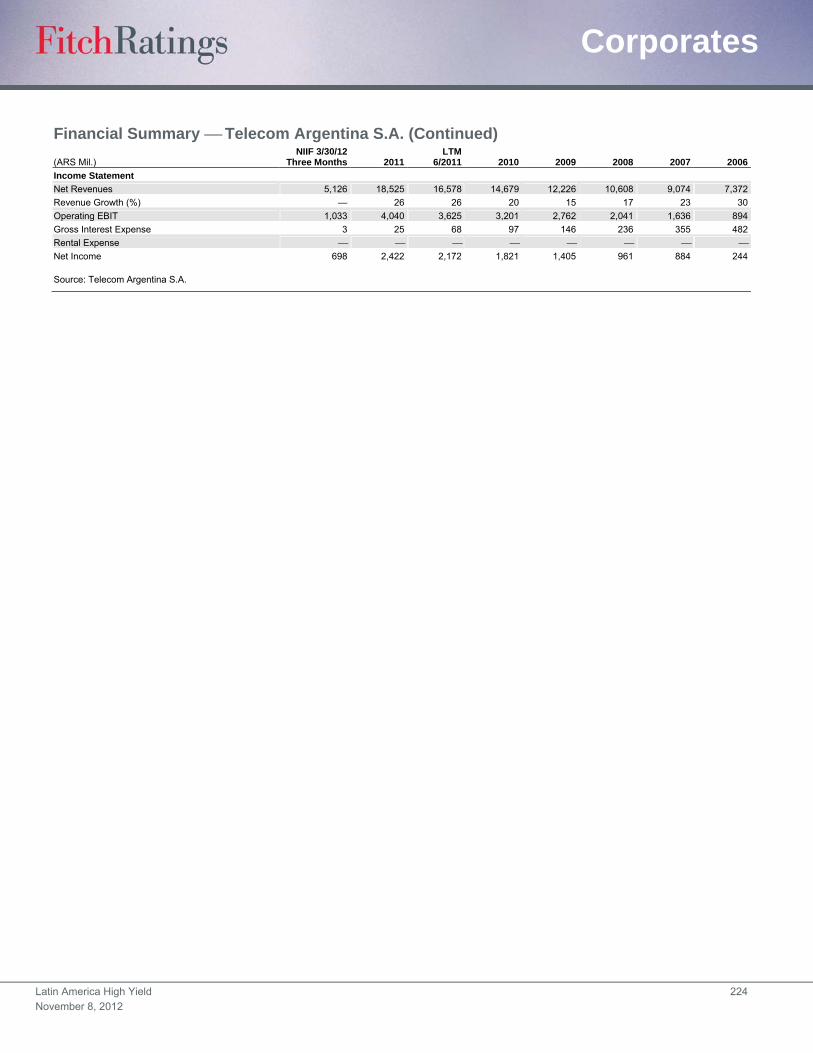
Latin America High Yield 224
November 8, 2012
Corporates
Financial Summary Telecom Argentina S.A. (Continued)
(ARS Mil.) NIIF 3/30/12
Three Months 2011LTM
6/2011 2010 2009 2008 2007 2006
Income Statement
Net Revenues 5,126 18,525 16,578 14,679 12,226 10,608 9,074 7,372
Revenue Growth (%) — 26 26 20 15 17 23 30
Operating EBIT 1,033 4,040 3,625 3,201 2,762 2,041 1,636 894
Gross Interest Expense 3 25 68 97 146 236 355 482
Rental Expense Net Income 698 2,422 2,172 1,821 1,405 961 884 244
Source: Telecom Argentina S.A.

Latin America High Yield 225
November 8, 2012
Corporates
Transportadora de Gas del Norte S.A. (TGN) Full Rating Report
Key Rating Drivers
High Leverage: Fitch Ratings anticipates that TGN’s ability to meet interest payments on its
restructured debt will be extremely limited due to its weak operating profile. TGN continues to
exhibit high leverage as reflected by its pro forma debt-to-EBITDA ratio of 21.4x following the
debt restructuring completed in August 2012. New notes for USD201 million were issued as
part of the restructuring, and total debt was reduced to USD257 million from USD473.5 million.
Weak Operating Profile: The company’s ability to generate cash has been severely affected
by a frozen tariff structure since 1999 compounded by inflation, limitation on natural gas
exports, and peso depreciation. Operational cash flow is expected to be modestly positive in
2012 as the company will receive approximately USD47 million from the settlement of export
related contracts. Invoices will materially decrease in 2013 and 2014 as a result, and
operational cash flow is expected to turn negative. Negative cash generation is expected to
increase in magnitude in the absence of a tariff increase or any additional source of funds.
Uncertain Regulatory Environment: Tariffs have remained frozen since 1999. Although the
government ratified a 20% tariff increase in April 2010, the regulatory entity has failed to
approve the new tariff scheme. In the event that this tariff increase is retrospectively invoiced
by TGN, the monies received would be administered by a special fund and would be used to
finance the company’s capital expenditure. A third-party designated by the regulator has been
overviewing the company’s operations since 2008.
Debt in Default: Approximately USD41.3 million of TGN’s 2012 notes have not been tendered
in the company’s exchange offering and remain in default. The amount of defaulted notes
increases to USD56.6 million after including penalties and capital interest. The ‘C’ rating on the
2012 notes reflects the expectation of below-average recovery prospects given the default. TGN
recently announced its intention to restructure the debt in default.
What Could Trigger a Rating Action
Implementation of Tariff Increases: A successfully implemented tariff increase, along with a
tangible, positive impact on TGN’s operations, could result in a Positive Outlook or rating
upgrade.
Weaker Financial Performance: A further deterioration in TGN’s operating profile, additional
government intervention in the sector or in the company, and/or failure to fulfill its debt
obligations could result in a Negative Outlook or rating action.
Ratings
Foreign Currency
Long-Term IDR CCC
Senior Unsecured USD170.45 Notes
CCC/ RR4
Senior Unsecured USD56.8 Notes
CCC/ RR4
USD250 Mil. Notes C/RR5
USD250 Mil. Notes C/RR5
Local Currency
Long-Term IDR CCC
National
Long-Term Rating CCC(arg)
USD170.45 Mil. Notes CCC(arg)
USD56.8Mil. Debt Program CCC(arg)
USD250 Mil. Notes D(arg)
USD250 Mil. Notes D(arg)
Equity Level 4
IDR – Issuer default rating.
Financial Data Transportadora de Gas del Norte S.A.
(ARS Mil.) 6/30/12 12/31/11 Total Equity 1,004 1,145 Total Debt 2,142 1,942 Operating Revenue 418 406 Net Income (262) (154) Net Debt/ EBITDA (x) 26.0. 16.3.
Analyst Ana Paula Ares +54 11 5235-8121 [email protected]
Gabriela Curutchet +54 11 5235-8100 [email protected]

Latin America High Yield 226
November 8, 2012
Corporates
Recovery Analysis
Fitch expects a higher recovery value under a liquidation scenario, as opposed to a going-
concern sale for TGN. Fitch’s recovery analysis applies a 50% discount rate to the company’s
accounts receivables to reflect the deterioration in the credit quality of some counterparties,
particularly natural gas distribution companies. Fitch has also adjusted the discount rate for net
PP&E to 20%, as the value of the assets is expected to decrease in the event of liquidation.
The recovery analysis assumes a standard 10% administrative claims adjustment and 5%
concession to junior claimants. Fitch has included the post-restructuring bonds in this scenario,
including the maximum allowed interest capitalization and the bonds that remain in default.
TGN’s new notes are better positioned than the notes in default as they have been restructured.
The recovery rating for TGN’s new debt instrument reflects Fitch’s expectation that the
company’s creditors would have an average recovery consistent with a recovery rating of ‘RR4’.
The ‘RR4’ indicates a recovery prospect of 31%–50% of current principal and related interest.
It is difficult to anticipate the recovery value for bondholders that did not participate in the debt
restructuring but, in the event of liquidation, the company’s assets should have some value.
Fitch expects that creditors will have a below-average recovery consistent with an ‘RR5’, which
indicates a probability of recovery of 11%–30% of current principal and related interest for the
notes that are still in default.
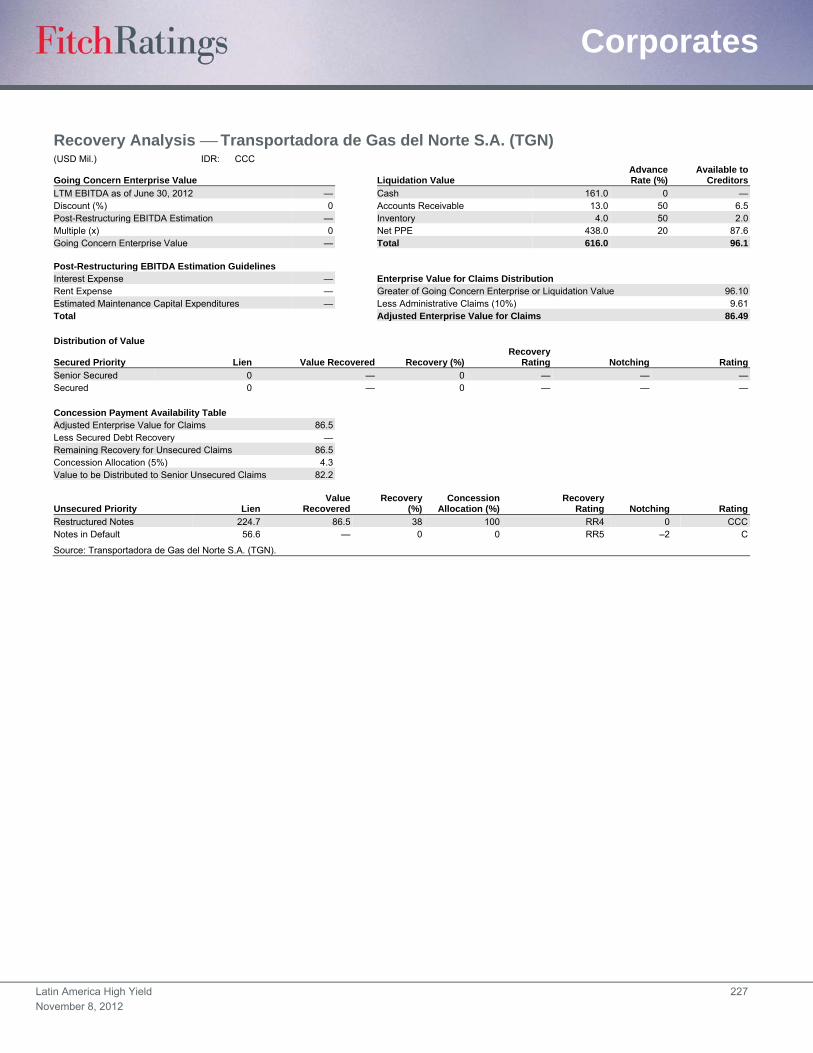
Latin America High Yield 227
November 8, 2012
Corporates
Recovery Analysis Transportadora de Gas del Norte S.A. (TGN) (USD Mil.) IDR: CCC
Going Concern Enterprise Value Liquidation Value AdvanceRate (%)
Available toCreditors
LTM EBITDA as of June 30, 2012 — Cash 161.0 0 —Discount (%) 0 Accounts Receivable 13.0 50 6.5Post-Restructuring EBITDA Estimation — Inventory 4.0 50 2.0Multiple (x) 0 Net PPE 438.0 20 87.6Going Concern Enterprise Value — Total 616.0 96.1 Post-Restructuring EBITDA Estimation Guidelines Interest Expense — Enterprise Value for Claims Distribution Rent Expense — Greater of Going Concern Enterprise or Liquidation Value 96.10Estimated Maintenance Capital Expenditures — Less Administrative Claims (10%) 9.61Total Adjusted Enterprise Value for Claims 86.49 Distribution of Value
Secured Priority Lien Value Recovered Recovery (%)Recovery
Rating Notching Rating
Senior Secured 0 — 0 — — —Secured 0 — 0 — — — Concession Payment Availability Table Adjusted Enterprise Value for Claims 86.5 Less Secured Debt Recovery — Remaining Recovery for Unsecured Claims 86.5 Concession Allocation (5%) 4.3 Value to be Distributed to Senior Unsecured Claims 82.2
Unsecured Priority Lien Value
RecoveredRecovery
(%)Concession
Allocation (%)Recovery
Rating Notching Rating
Restructured Notes 224.7 86.5 38 100 RR4 0 CCCNotes in Default 56.6 — 0 0 RR5 –2 C
Source: Transportadora de Gas del Norte S.A. (TGN).
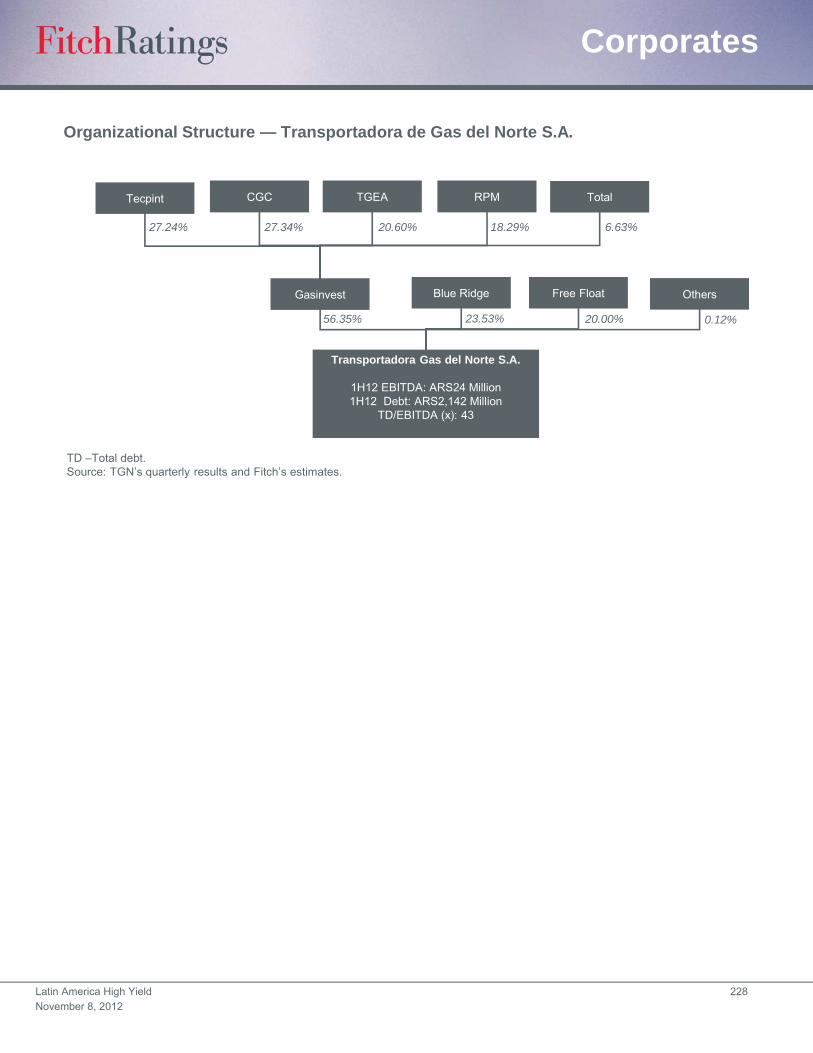
Latin America High Yield 228
November 8, 2012
Corporates
Organizational Structure — Transportadora de Gas del Norte S.A.
TD –Total debt. Source: TGN’s quarterly results and Fitch’s estimates.
Transportadora Gas del Norte S.A.
1H12 EBITDA: ARS24 Million1H12 Debt: ARS2,142 Million
TD/EBITDA (x): 43
Blue Ridge
56.35% 23.53%
Free Float OthersGasinvest
20.00% 0.12%
Tecpint RPMTGEACGC Total
18.29%20.60%27.34%27.24% 6.63%
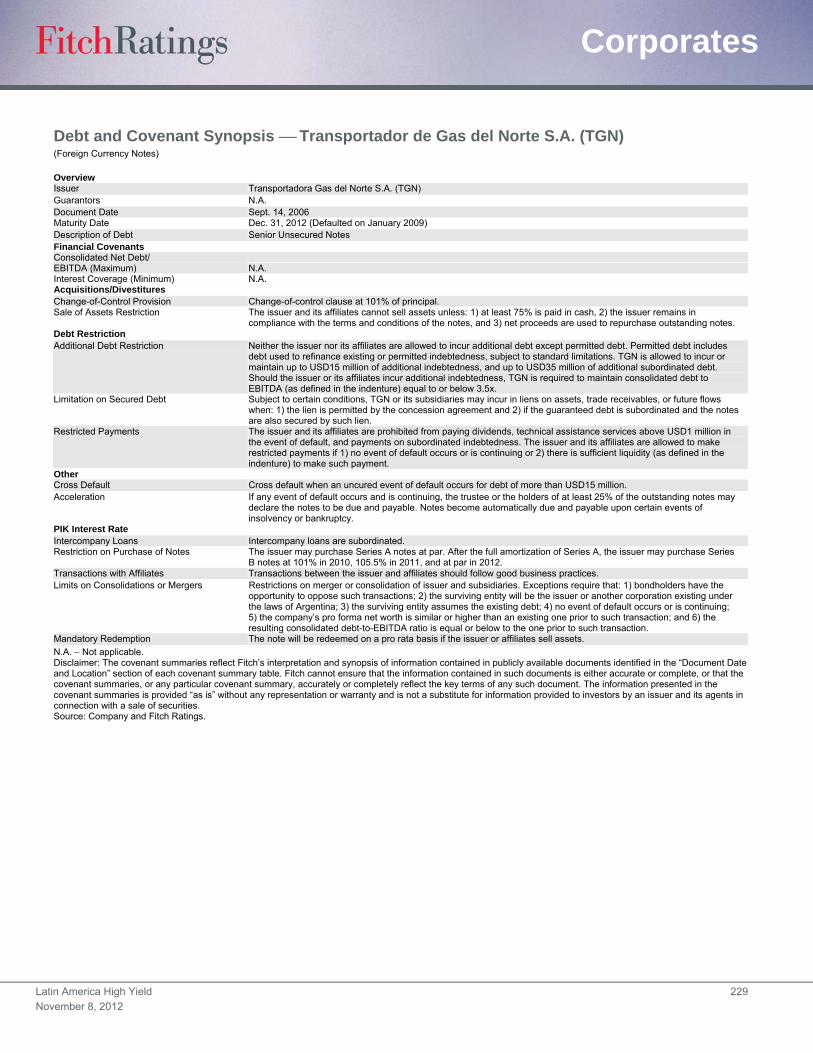
Latin America High Yield 229
November 8, 2012
Corporates
Debt and Covenant Synopsis Transportador de Gas del Norte S.A. (TGN) (Foreign Currency Notes)
Overview Issuer Transportadora Gas del Norte S.A. (TGN) Guarantors N.A. Document Date Sept. 14, 2006 Maturity Date Dec. 31, 2012 (Defaulted on January 2009) Description of Debt Senior Unsecured Notes Financial Covenants Consolidated Net Debt/ EBITDA (Maximum) N.A. Interest Coverage (Minimum) N.A. Acquisitions/Divestitures Change-of-Control Provision Change-of-control clause at 101% of principal. Sale of Assets Restriction The issuer and its affiliates cannot sell assets unless: 1) at least 75% is paid in cash, 2) the issuer remains in
compliance with the terms and conditions of the notes, and 3) net proceeds are used to repurchase outstanding notes. Debt Restriction Additional Debt Restriction Neither the issuer nor its affiliates are allowed to incur additional debt except permitted debt. Permitted debt includes
debt used to refinance existing or permitted indebtedness, subject to standard limitations. TGN is allowed to incur or maintain up to USD15 million of additional indebtedness, and up to USD35 million of additional subordinated debt. Should the issuer or its affiliates incur additional indebtedness, TGN is required to maintain consolidated debt to EBITDA (as defined in the indenture) equal to or below 3.5x.
Limitation on Secured Debt Subject to certain conditions, TGN or its subsidiaries may incur in liens on assets, trade receivables, or future flows when: 1) the lien is permitted by the concession agreement and 2) if the guaranteed debt is subordinated and the notes are also secured by such lien.
Restricted Payments The issuer and its affiliates are prohibited from paying dividends, technical assistance services above USD1 million in the event of default, and payments on subordinated indebtedness. The issuer and its affiliates are allowed to make restricted payments if 1) no event of default occurs or is continuing or 2) there is sufficient liquidity (as defined in the indenture) to make such payment.
Other Cross Default Cross default when an uncured event of default occurs for debt of more than USD15 million. Acceleration If any event of default occurs and is continuing, the trustee or the holders of at least 25% of the outstanding notes may
declare the notes to be due and payable. Notes become automatically due and payable upon certain events of insolvency or bankruptcy.
PIK Interest Rate Intercompany Loans Intercompany loans are subordinated. Restriction on Purchase of Notes The issuer may purchase Series A notes at par. After the full amortization of Series A, the issuer may purchase Series
B notes at 101% in 2010, 105.5% in 2011, and at par in 2012. Transactions with Affiliates Transactions between the issuer and affiliates should follow good business practices. Limits on Consolidations or Mergers Restrictions on merger or consolidation of issuer and subsidiaries. Exceptions require that: 1) bondholders have the
opportunity to oppose such transactions; 2) the surviving entity will be the issuer or another corporation existing under the laws of Argentina; 3) the surviving entity assumes the existing debt; 4) no event of default occurs or is continuing; 5) the company’s pro forma net worth is similar or higher than an existing one prior to such transaction; and 6) the resulting consolidated debt-to-EBITDA ratio is equal or below to the one prior to such transaction.
Mandatory Redemption The note will be redeemed on a pro rata basis if the issuer or affiliates sell assets.
N.A. Not applicable. Disclaimer: The covenant summaries reflect Fitch’s interpretation and synopsis of information contained in publicly available documents identified in the “Document Date and Location” section of each covenant summary table. Fitch cannot ensure that the information contained in such documents is either accurate or complete, or that the covenant summaries, or any particular covenant summary, accurately or completely reflect the key terms of any such document. The information presented in the covenant summaries is provided “as is” without any representation or warranty and is not a substitute for information provided to investors by an issuer and its agents in connection with a sale of securities. Source: Company and Fitch Ratings.
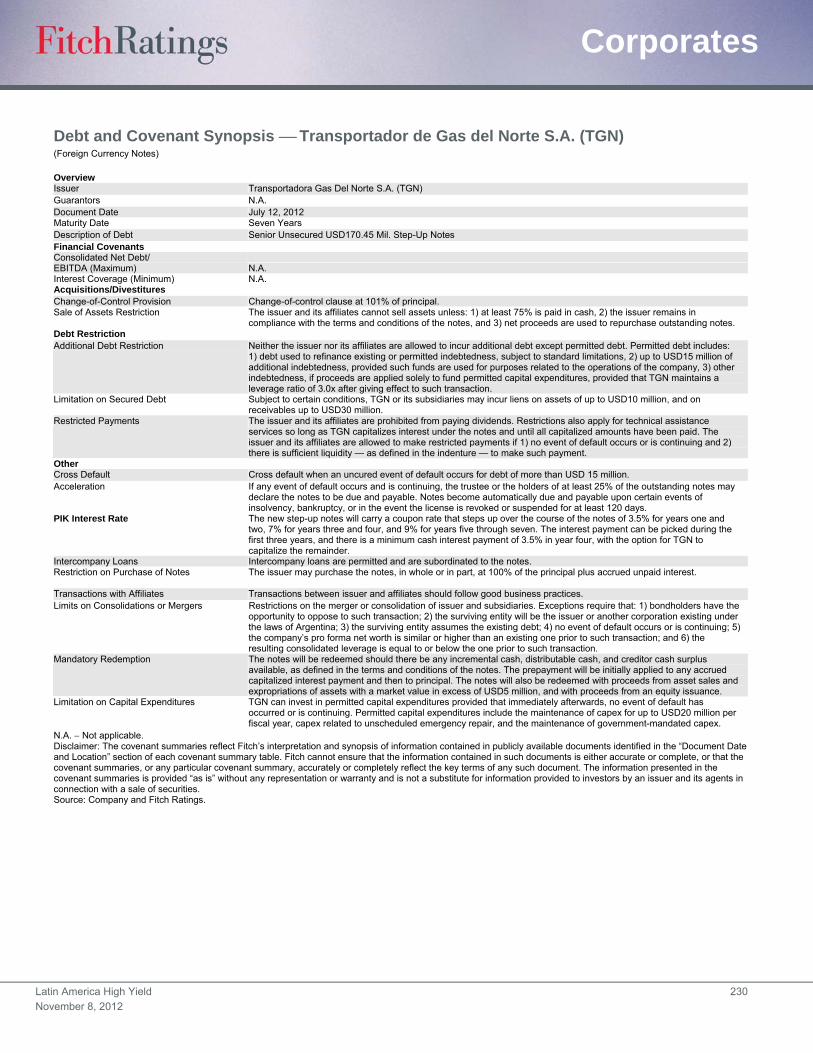
Latin America High Yield 230
November 8, 2012
Corporates
Debt and Covenant Synopsis Transportador de Gas del Norte S.A. (TGN) (Foreign Currency Notes)
Overview Issuer Transportadora Gas Del Norte S.A. (TGN) Guarantors N.A. Document Date July 12, 2012 Maturity Date Seven Years Description of Debt Senior Unsecured USD170.45 Mil. Step-Up Notes Financial Covenants Consolidated Net Debt/ EBITDA (Maximum) N.A. Interest Coverage (Minimum) N.A. Acquisitions/Divestitures Change-of-Control Provision Change-of-control clause at 101% of principal. Sale of Assets Restriction The issuer and its affiliates cannot sell assets unless: 1) at least 75% is paid in cash, 2) the issuer remains in
compliance with the terms and conditions of the notes, and 3) net proceeds are used to repurchase outstanding notes. Debt Restriction Additional Debt Restriction Neither the issuer nor its affiliates are allowed to incur additional debt except permitted debt. Permitted debt includes:
1) debt used to refinance existing or permitted indebtedness, subject to standard limitations, 2) up to USD15 million of additional indebtedness, provided such funds are used for purposes related to the operations of the company, 3) other indebtedness, if proceeds are applied solely to fund permitted capital expenditures, provided that TGN maintains a leverage ratio of 3.0x after giving effect to such transaction.
Limitation on Secured Debt Subject to certain conditions, TGN or its subsidiaries may incur liens on assets of up to USD10 million, and on receivables up to USD30 million.
Restricted Payments The issuer and its affiliates are prohibited from paying dividends. Restrictions also apply for technical assistance services so long as TGN capitalizes interest under the notes and until all capitalized amounts have been paid. The issuer and its affiliates are allowed to make restricted payments if 1) no event of default occurs or is continuing and 2) there is sufficient liquidity — as defined in the indenture — to make such payment.
Other Cross Default Cross default when an uncured event of default occurs for debt of more than USD 15 million. Acceleration If any event of default occurs and is continuing, the trustee or the holders of at least 25% of the outstanding notes may
declare the notes to be due and payable. Notes become automatically due and payable upon certain events of insolvency, bankruptcy, or in the event the license is revoked or suspended for at least 120 days.
PIK Interest Rate The new step-up notes will carry a coupon rate that steps up over the course of the notes of 3.5% for years one and two, 7% for years three and four, and 9% for years five through seven. The interest payment can be picked during the first three years, and there is a minimum cash interest payment of 3.5% in year four, with the option for TGN to capitalize the remainder.
Intercompany Loans Intercompany loans are permitted and are subordinated to the notes. Restriction on Purchase of Notes The issuer may purchase the notes, in whole or in part, at 100% of the principal plus accrued unpaid interest.
Transactions with Affiliates Transactions between issuer and affiliates should follow good business practices. Limits on Consolidations or Mergers Restrictions on the merger or consolidation of issuer and subsidiaries. Exceptions require that: 1) bondholders have the
opportunity to oppose to such transaction; 2) the surviving entity will be the issuer or another corporation existing under the laws of Argentina; 3) the surviving entity assumes the existing debt; 4) no event of default occurs or is continuing; 5) the company’s pro forma net worth is similar or higher than an existing one prior to such transaction; and 6) the resulting consolidated leverage is equal to or below the one prior to such transaction.
Mandatory Redemption The notes will be redeemed should there be any incremental cash, distributable cash, and creditor cash surplus available, as defined in the terms and conditions of the notes. The prepayment will be initially applied to any accrued capitalized interest payment and then to principal. The notes will also be redeemed with proceeds from asset sales and expropriations of assets with a market value in excess of USD5 million, and with proceeds from an equity issuance.
Limitation on Capital Expenditures TGN can invest in permitted capital expenditures provided that immediately afterwards, no event of default has occurred or is continuing. Permitted capital expenditures include the maintenance of capex for up to USD20 million per fiscal year, capex related to unscheduled emergency repair, and the maintenance of government-mandated capex.
N.A. Not applicable. Disclaimer: The covenant summaries reflect Fitch’s interpretation and synopsis of information contained in publicly available documents identified in the “Document Date and Location” section of each covenant summary table. Fitch cannot ensure that the information contained in such documents is either accurate or complete, or that the covenant summaries, or any particular covenant summary, accurately or completely reflect the key terms of any such document. The information presented in the covenant summaries is provided “as is” without any representation or warranty and is not a substitute for information provided to investors by an issuer and its agents in connection with a sale of securities. Source: Company and Fitch Ratings.
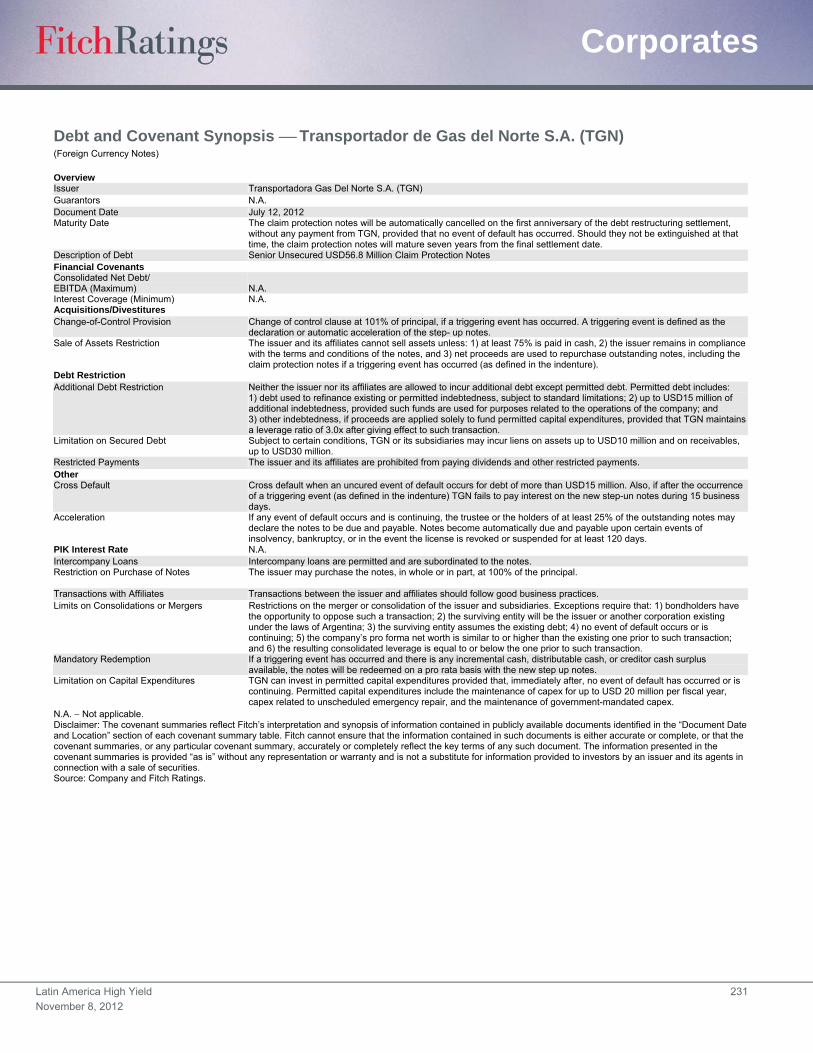
Latin America High Yield 231
November 8, 2012
Corporates
Debt and Covenant Synopsis Transportador de Gas del Norte S.A. (TGN) (Foreign Currency Notes)
Overview Issuer Transportadora Gas Del Norte S.A. (TGN) Guarantors N.A. Document Date July 12, 2012 Maturity Date The claim protection notes will be automatically cancelled on the first anniversary of the debt restructuring settlement,
without any payment from TGN, provided that no event of default has occurred. Should they not be extinguished at that time, the claim protection notes will mature seven years from the final settlement date.
Description of Debt Senior Unsecured USD56.8 Million Claim Protection Notes Financial Covenants Consolidated Net Debt/ EBITDA (Maximum) N.A. Interest Coverage (Minimum) N.A. Acquisitions/Divestitures Change-of-Control Provision Change of control clause at 101% of principal, if a triggering event has occurred. A triggering event is defined as the
declaration or automatic acceleration of the step- up notes. Sale of Assets Restriction The issuer and its affiliates cannot sell assets unless: 1) at least 75% is paid in cash, 2) the issuer remains in compliance
with the terms and conditions of the notes, and 3) net proceeds are used to repurchase outstanding notes, including the claim protection notes if a triggering event has occurred (as defined in the indenture).
Debt Restriction Additional Debt Restriction Neither the issuer nor its affiliates are allowed to incur additional debt except permitted debt. Permitted debt includes:
1) debt used to refinance existing or permitted indebtedness, subject to standard limitations; 2) up to USD15 million of additional indebtedness, provided such funds are used for purposes related to the operations of the company; and 3) other indebtedness, if proceeds are applied solely to fund permitted capital expenditures, provided that TGN maintains a leverage ratio of 3.0x after giving effect to such transaction.
Limitation on Secured Debt Subject to certain conditions, TGN or its subsidiaries may incur liens on assets up to USD10 million and on receivables, up to USD30 million.
Restricted Payments The issuer and its affiliates are prohibited from paying dividends and other restricted payments. Other Cross Default Cross default when an uncured event of default occurs for debt of more than USD15 million. Also, if after the occurrence
of a triggering event (as defined in the indenture) TGN fails to pay interest on the new step-un notes during 15 business days.
Acceleration If any event of default occurs and is continuing, the trustee or the holders of at least 25% of the outstanding notes may declare the notes to be due and payable. Notes become automatically due and payable upon certain events of insolvency, bankruptcy, or in the event the license is revoked or suspended for at least 120 days.
PIK Interest Rate N.A. Intercompany Loans Intercompany loans are permitted and are subordinated to the notes. Restriction on Purchase of Notes The issuer may purchase the notes, in whole or in part, at 100% of the principal.
Transactions with Affiliates Transactions between the issuer and affiliates should follow good business practices. Limits on Consolidations or Mergers Restrictions on the merger or consolidation of the issuer and subsidiaries. Exceptions require that: 1) bondholders have
the opportunity to oppose such a transaction; 2) the surviving entity will be the issuer or another corporation existing under the laws of Argentina; 3) the surviving entity assumes the existing debt; 4) no event of default occurs or is continuing; 5) the company’s pro forma net worth is similar to or higher than the existing one prior to such transaction; and 6) the resulting consolidated leverage is equal to or below the one prior to such transaction.
Mandatory Redemption If a triggering event has occurred and there is any incremental cash, distributable cash, or creditor cash surplus available, the notes will be redeemed on a pro rata basis with the new step up notes.
Limitation on Capital Expenditures TGN can invest in permitted capital expenditures provided that, immediately after, no event of default has occurred or is continuing. Permitted capital expenditures include the maintenance of capex for up to USD 20 million per fiscal year, capex related to unscheduled emergency repair, and the maintenance of government-mandated capex.
N.A. Not applicable. Disclaimer: The covenant summaries reflect Fitch’s interpretation and synopsis of information contained in publicly available documents identified in the “Document Date and Location” section of each covenant summary table. Fitch cannot ensure that the information contained in such documents is either accurate or complete, or that the covenant summaries, or any particular covenant summary, accurately or completely reflect the key terms of any such document. The information presented in the covenant summaries is provided “as is” without any representation or warranty and is not a substitute for information provided to investors by an issuer and its agents in connection with a sale of securities. Source: Company and Fitch Ratings.

Latin America High Yield 232
November 8, 2012
Corporates
Financial Summary Transportador de Gas del Norte S.A. (TGN) Period-End Exchange Rate (ARS/USD) 4.5238 4.3053 3.9787 3.799 3.4538
Period Average Exchange Rate (ARS/USD) 4.3011 4.1295 3.9134 3.7279 3.1631
(ARS Mil., Years Ended Dec. 31) LTM 6/30/12 2011 2010 2009 2008
Profitability
Operating EBITDA 11,475 18,347 48,429 71,076 89,953
Operating EBITDA Margin (%) 11.8 18.6 38.3 49.9 56.4
FFO Return on Adjusted Capital (%) 21.0 15.8 16.4 16.8 13.5
Free Cash Flow Margin (%) 88.2 41.0 37.4 34.4 28.3
Return on Average Equity (%) (22.9) (12.6) 5.7 (4.0) (2.7)
Coverage (x)
FFO Interest Coverage 3.4 2.7 3.5 4.1 4.4
Operating EBITDA/Interest Expense 0.3 0.4 1.4 2.4 3.8
Operating EBITDA/Debt Service Coverage 0.0 0.0 0.1 0.2 0.2
FFO Fixed-Charge Coverage 3.4 2.7 3.5 4.1 4.4
FCF Debt Service Coverage 0.3 0.2 0.2 0.2 0.2
(FCF + Cash and Marketable Securities)/Debt Service Coverage 0.6 0.5 0.5 0.4 0.3
Cash Flow from Operations/Capital Expenditures 6.9 3.7 3.4 3.3 4.1
Capital Structure and Leverage (x)
FFO Adjusted Leverage 3.1 3.8 3.3 3.2 3.3
Total Debt with Equity Credit/Operating EBITDA 41.3 24.6 8.5 5.3 3.9
Total Net Debt with Equity Credit/Operating EBITDA 26.0 16.3 6.0 4.2 3.4
Implied Cost of Funds (%) 10.0 10.1 8.9 8.0 6.7
Secured Debt/Total Debt — — — — —
Short-Term Debt/Total Debt 1.0 1.0 1.0 1.0 1.0
Balance Sheet
Total Assets 765,608 779,888 800,842 757,594 764,159
Cash and Marketable Securities 175,143 152,657 123,270 80,098 44,583
Short-Term Debt 473,531 451,149 411,438 378,867 351,197
Long-Term Debt — — — — —
Total Debt 473,531 451,149 411,438 378,867 351,197
Equity Credit — — — — —
Total Debt with Equity Credit 473,531 451,149 411,438 378,867 351,197
Off-Balance Sheet Debt — — — — —
Total Adjusted Debt with Equity Credit 473,531 451,149 411,438 378,867 351,197
Total Equity 222,127 266,106 326,676 322,896 370,093
Total Adjusted Capital 695,658 717,255 738,114 701,763 721,290
Cash Flow
Funds from Operations 108,275 74,676 88,180 90,719 82,045
Change in Operating Working Capital (7,895) (19,460) (20,859) (20,851) (22,460)
Cash Flow from Operations 100,380 55,215 67,321 69,868 59,585
Total Non-Operating/Nonrecurring Cash Flow 0 0 0 0 0
Capital Expenditures (14,615) (14,808) (19,942) (20,863) (14,400)
Dividends 0 0 0 0 0
Free Cash Flow 85,766 40,407 47,379 49,005 45,185
Net Acquisitions and Divestitures 0 0 0 0 0
Other Investments, Net (66,953) (58,310) (44,823) (3,078) 0
Net Debt Proceeds 0 0 0 0 (17,261)
Net Equity Proceeds 0 0 0 0 0
Other Financing, Net (196) 0 (60) (8,698) 159
Total Change in Cash 18,617 (17,903) 2,497 37,229 28,083
Income Statement
Net Revenues 97,189 98,541 126,550 142,430 159,491
Revenue Growth (%) — (22.1) (11.1) (10.7) (4.1)
Operating EBIT (19,999) (13,886) 14,836 37,257 50,843
Gross Interest Expense 45,133 43,440 35,058 29,237 23,916
Rental Expense 0 0 0 0 0
Net Income (60,805) (37,312) 18,670 (13,827) (10,602)
Source: Fitch.
Latin America High Yield 233
November 8, 2012
Corporates
Transportadora de Gas del Sur S.A. (TGS) Full Rating Report
Key Rating Drivers
Foreign Currency IDR Constrained: TGS’ foreign currency issuer default rating (IDR) is
constrained by Argentina’s country ceiling of ‘B’ and its recovery rating of ‘RR4’ is constrained
by the soft cap of ‘RR4’ for bonds issued by Argentine corporates. Country ceilings capture the
risk of exchange controls being imposed that would prevent or materially impede the private
sector’s ability to convert local currency and transfer the proceeds to nonresident creditors
transfer and convertibility risk (T&C) risk.
High Regulatory Risk: The weak regulatory framework has affected TGS’ original business
model. The company’s core business, its natural gas transportation unit, has been operating
with frozen tariffs since 1999, reducing its share of EBITDA to approximately 35%. Its liquefied
natural gas (LNG) processing unit represents the remaining 65%. The company’s credit quality
would come under additional pressure, should unfavorable regulatory and operating events
affect TGS’ LNG business unit. Recently, a court suspended the application of an increase in a
tariff charge to be paid by natural gas processors.
Conservative Leverage Is a Key Credit Consideration: TGS’ conservative capital structure
mitigates some existing operational and regulatory risks. As of June 2012, debt was
USD378 million, with a debt to EBITDA of 2.1x, which is low for the credit category. Debt is
concentrated in the long term with no debt maturities until May 2014. Until then, the company’s
annual debt service consists of approximately USD30 million in interest payments.
Satisfactory Operating Performance: Despite frozen tariffs for its pipeline business and
rising inflation, TGS has maintained good cash generation levels, which mostly reflect high
international prices for LNG. To a lesser extent an increase in 2011 of its pipeline utilization
factor increased to 81% also helped cash flow. For the LTM ended June 30, 2012 TGS’
EBITDA was 182 million, similar to 2011. Near-term capital expenditures are expected to
remain at approximately USD40 million, which should allow the company to generate
USD40 million to USD55 million of free cash flow and maintain considerable financial flexibility
for the rating category.
What Could Trigger a Rating Action
Natural Gas Unavailability: A prolonged unavailability of natural gas for TGS’ LNG business
could result in a negative rating action. Gas shortages are the result of the redirection of natural
gas for residential consumption. Gas shortages are somewhat mitigated through the
company’s strategy to pursue gas contracts with producers. The maintenance of frozen tariffs
also constitutes one of TGS’ main risks.
Sharp and Sustained Decrease in LNG Prices: A sharp and sustained decrease in LNG
prices could be a catalyst for a negative rating action.
Change in Sovereign Credit Quality: TGS’ ratings would be affected by an upgrade or
downgrade of Argentina’s country ceiling.
Ratings
Foreign Currency
Long-Term IDR B
Senior Unsecured notes due 2017 B/RR4
Local Currency
Long-Term IDR B+
IDR – Issuer default rating.
Rating Outlooks Long-Term Foreign Currency IDR RWN Long-Term Local Currency IDR Stable
RWN – Rating Watch Negative.
Financial Data Transportadora de Gas del Sur S.A.
(USD Mil.) LTM
6/30/12 12/31/11 Revenue 497 449 EBITDA 182 187 CFFO 123 107 Cash and Marketable Securities 150 107 Total Debt 378 378 Total Debt/ EBITDA (x) 2.1 2.0 Net Debt/ EBITDA (x) 1.2 1.4
Analysts Ana Paula Ares +54 11 5235-8121 [email protected]
Gabriela Curutchet +54 11 5235-8100 [email protected]
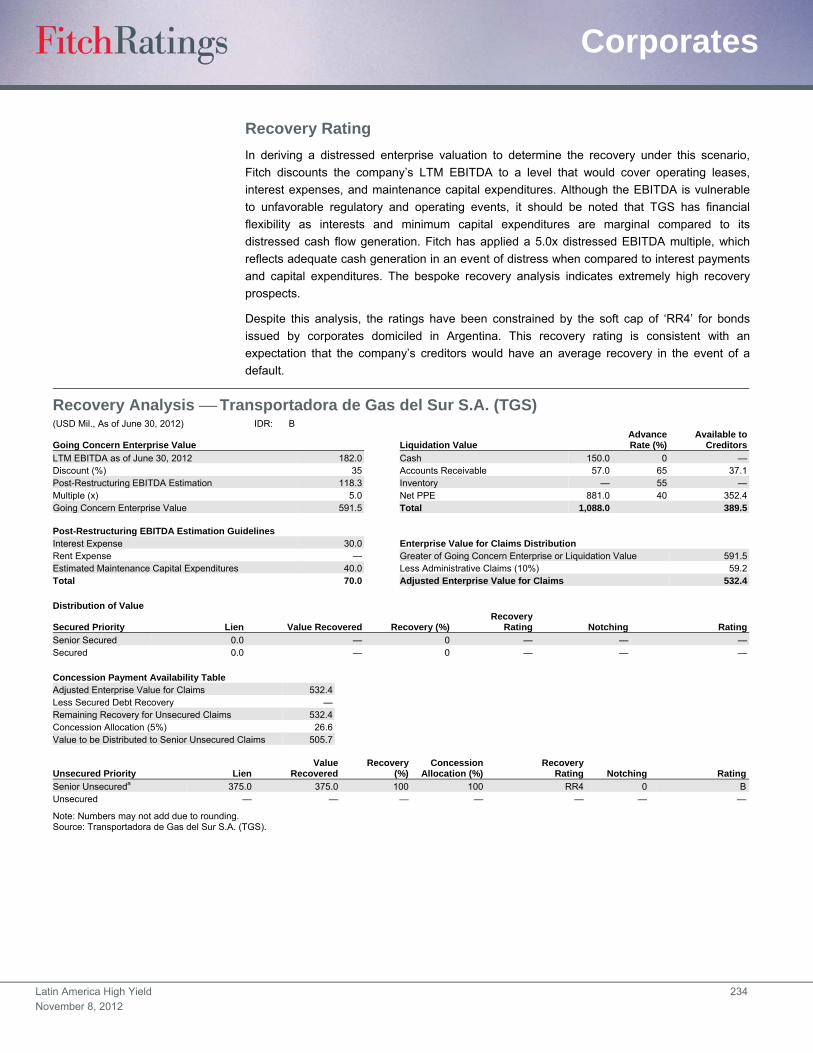
Latin America High Yield 234
November 8, 2012
Corporates
Recovery Rating
In deriving a distressed enterprise valuation to determine the recovery under this scenario,
Fitch discounts the company’s LTM EBITDA to a level that would cover operating leases,
interest expenses, and maintenance capital expenditures. Although the EBITDA is vulnerable
to unfavorable regulatory and operating events, it should be noted that TGS has financial
flexibility as interests and minimum capital expenditures are marginal compared to its
distressed cash flow generation. Fitch has applied a 5.0x distressed EBITDA multiple, which
reflects adequate cash generation in an event of distress when compared to interest payments
and capital expenditures. The bespoke recovery analysis indicates extremely high recovery
prospects.
Despite this analysis, the ratings have been constrained by the soft cap of ‘RR4’ for bonds
issued by corporates domiciled in Argentina. This recovery rating is consistent with an
expectation that the company’s creditors would have an average recovery in the event of a
default.
Recovery Analysis Transportadora de Gas del Sur S.A. (TGS) (USD Mil., As of June 30, 2012) IDR: B
Going Concern Enterprise Value Liquidation Value AdvanceRate (%)
Available toCreditors
LTM EBITDA as of June 30, 2012 182.0 Cash 150.0 0 —Discount (%) 35 Accounts Receivable 57.0 65 37.1Post-Restructuring EBITDA Estimation 118.3 Inventory — 55 —Multiple (x) 5.0 Net PPE 881.0 40 352.4Going Concern Enterprise Value 591.5 Total 1,088.0 389.5 Post-Restructuring EBITDA Estimation Guidelines Interest Expense 30.0 Enterprise Value for Claims Distribution Rent Expense — Greater of Going Concern Enterprise or Liquidation Value 591.5Estimated Maintenance Capital Expenditures 40.0 Less Administrative Claims (10%) 59.2Total 70.0 Adjusted Enterprise Value for Claims 532.4 Distribution of Value
Secured Priority Lien Value Recovered Recovery (%)Recovery
Rating Notching Rating
Senior Secured 0.0 — 0 — — —Secured 0.0 — 0 — — — Concession Payment Availability Table Adjusted Enterprise Value for Claims 532.4 Less Secured Debt Recovery — Remaining Recovery for Unsecured Claims 532.4 Concession Allocation (5%) 26.6 Value to be Distributed to Senior Unsecured Claims 505.7
Unsecured Priority Lien Value
RecoveredRecovery
(%)Concession
Allocation (%)Recovery
Rating Notching Rating
Senior Unsecureda 375.0 375.0 100 100 RR4 0 BUnsecured — — — — — — —
Note: Numbers may not add due to rounding. Source: Transportadora de Gas del Sur S.A. (TGS).

Latin America High Yield 235
November 8, 2012
Corporates
Organizational Structure — Transportadora de Gas del Sur (TGS)(As of LTM June 30, 2012)
TD – Total debt. ND – Net debt.Source: Transener and subsidiaries’ financial statements, Fitch.
Transportadora de Gas del Sur S.A.
EBITDA: USD182 MillionConsolidated Total Debt: USD378 MillionTD/EBITDA: 2.1xND/EBITD: 1.2x
100%
Telcosur S.A.
Petrobras Group
Public FloatCIESA
49%51%
CIESA Trust Pampa Energia
50% 40% 10%
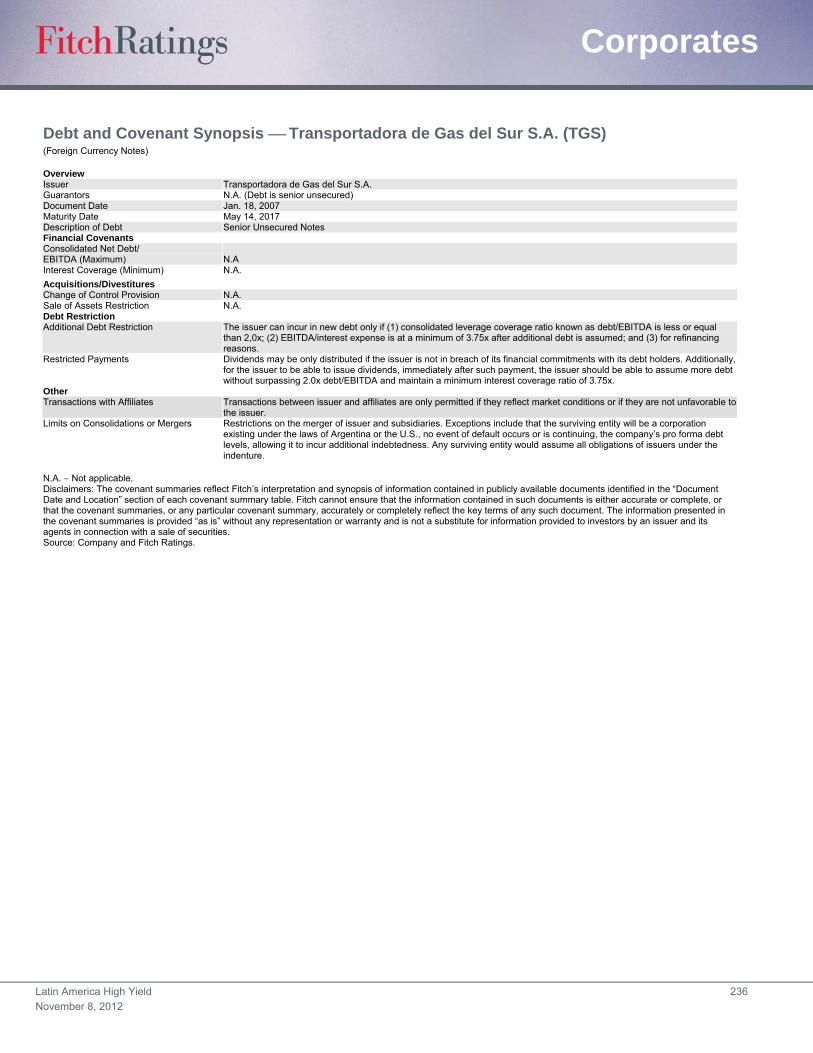
Latin America High Yield 236
November 8, 2012
Corporates
Debt and Covenant Synopsis Transportadora de Gas del Sur S.A. (TGS) (Foreign Currency Notes)
Overview Issuer Transportadora de Gas del Sur S.A. Guarantors N.A. (Debt is senior unsecured) Document Date Jan. 18, 2007 Maturity Date May 14, 2017 Description of Debt Senior Unsecured Notes Financial Covenants Consolidated Net Debt/ EBITDA (Maximum) N.A Interest Coverage (Minimum) N.A.
Acquisitions/Divestitures Change of Control Provision N.A. Sale of Assets Restriction N.A. Debt Restriction Additional Debt Restriction The issuer can incur in new debt only if (1) consolidated leverage coverage ratio known as debt/EBITDA is less or equal
than 2,0x; (2) EBITDA/interest expense is at a minimum of 3.75x after additional debt is assumed; and (3) for refinancing reasons.
Restricted Payments Dividends may be only distributed if the issuer is not in breach of its financial commitments with its debt holders. Additionally, for the issuer to be able to issue dividends, immediately after such payment, the issuer should be able to assume more debt without surpassing 2.0x debt/EBITDA and maintain a minimum interest coverage ratio of 3.75x.
Other Transactions with Affiliates Transactions between issuer and affiliates are only permitted if they reflect market conditions or if they are not unfavorable to
the issuer. Limits on Consolidations or Mergers Restrictions on the merger of issuer and subsidiaries. Exceptions include that the surviving entity will be a corporation
existing under the laws of Argentina or the U.S., no event of default occurs or is continuing, the company’s pro forma debt levels, allowing it to incur additional indebtedness. Any surviving entity would assume all obligations of issuers under the indenture.
N.A. Not applicable. Disclaimers: The covenant summaries reflect Fitch’s interpretation and synopsis of information contained in publicly available documents identified in the “Document Date and Location” section of each covenant summary table. Fitch cannot ensure that the information contained in such documents is either accurate or complete, or that the covenant summaries, or any particular covenant summary, accurately or completely reflect the key terms of any such document. The information presented in the covenant summaries is provided “as is” without any representation or warranty and is not a substitute for information provided to investors by an issuer and its agents in connection with a sale of securities. Source: Company and Fitch Ratings.

Latin America High Yield 237
November 8, 2012
Corporates
Financial Summary Transportadora de Gas del Sur S.A. (TGS) Period-End Exchange Rate 4.5238 4.3053 3.9787 3.7990 3.4700
Average Exchange Rate 4.3012 4.1295 3.9134 3.7279 3.1800
(ARS 000, Fiscal Years Ended Dec. 31) 6/30/12a 2011 2010 2009 2008
Profitability Operating EBITDA 784,354 773,923 578,689 770,961 636,200
Operating EBITDA Margin (%) 36.7 41.7 35.0 48.2 44.8
FFO Return on Adjusted Capital (%) 16.6 17.9 7.4 17.0 16.0
Free Cash Flow Margin (%) 16.7 (38.0) 8.9 20.8 23.2
Return on Average Equity (%) 9.5 8.8 3.1 5.7 5.8
Coverage (x)
FFO Interest Coverage 4.1 4.4 2.8 5.3 5.1
Operating EBITDA/Interest Expense 5.2 5.4 4.5 5.1 4.5
Operating EBITDA/ Debt-Service Coverage 4.7 4.8 4.0 4.6 4.1
FFO Fixed-Charge Coverage 4.1 4.4 2.8 5.3 5.1
FCF Debt Service Coverage 3.0 (3.5) 1.9 2.9 3.0
(FCF + Cash and Marketable Securities)/Debt Service Coverage 7.1 (0.6) 9.5 9.1 6.9
Cash Flow from Operations/Capital Expenditures 3.1 2.6 2.2 3.4 2.6
Capital Structure and Leverage (x)
FFO Adjusted Leverage 2.7 2.5 4.2 1.9 2.0
Total Debt with Equity Credit/Operating EBITDA 2.2 2.1 2.6 2.0 2.2
Total Net Debt with Equity Credit/Operating EBITDA 1.3 1.5 0.7 0.6 1.3
Implied Cost of Funds (%) 9.2 9.2 8.5 10.3 9.4
Secured Debt/Total Debt — — — — —
Short-Term Debt/Total Debt 0.0 0.0 0.0 0.0 0.0
Balance Sheet
Total Assets 5,155,273 5,024,166 5,611,345 5,619,190 5,033,324
Cash and Marketable Securities 680,646 459,292 1,089,480 1,025,142 604,690
Short-Term Debt 16,668 15,846 14,661 14,983 13,932
Long-Term Debt 1,693,207 1,609,799 1,487,119 1,502,330 1,398,465
Total Debt 1,709,875 1,625,645 1,501,780 1,517,313 1,412,397
Equity Credit — — — — —
Total Debt with Equity Credit 1,709,875 1,625,645 1,501,780 1,517,313 1,412,397
Off-Balance Sheet Debt — — — — —
Total Adjusted Debt with Equity Credit 1,709,875 1,625,645 1,501,780 1,517,313 1,412,397
Total Equity 2,054,064 1,953,492 3,293,020 3,221,109 3,072,729
Total Adjusted Capital 3,763,939 3,579,137 4,794,800 4,738,422 4,485,126
Cash Flow
Funds from Operations 474,214 497,906 227,511 654,353 577,127
Change in Operating Working Capital 54,984 (57,470) 92,999 (142,716) 4,954
Cash Flow from Operations 529,198 440,436 320,510 511,637 582,081
Total Non-Operating/Nonrecurring Cash Flow — — — — —
Capital Expenditures (172,260) (168,299) (143,770) (149,147) (220,792)
Dividends — (976,000) (30,325) (30,000) (32,000)
Free Cash Flow 356,938 (703,863) 146,415 332,490 329,289
Net Acquisitions and Divestitures — — 926 — —
Other Investments, Net (109,382) (109,073) — — 28,386
Net Debt Proceeds — — (83,003) (25,497) (191,486)
Net Equity Proceeds — — — — —
Other Financing, Net 70,108 70,108 — 113,459 47,183
Total Change in Cash 317,664 (742,828) 64,338 420,452 213,372
Income Statement
Net Revenues 2,138,724 1,853,875 1,653,001 1,600,648 1,419,202
Revenue Growth (%) 27 13 12 13 13
Operating EBIT 557,155 552,493 363,393 561,517 431,432
Gross Interest Expense 150,769 144,517 128,806 151,416 140,944
Rental Expense — — — — —
Net Income 212,514 230,679 102,236 178,380 175,091
aJune 30, 2012 six-month figures. Note: Numbers may not add due to rounding. Source: Fitch.
Latin America High Yield 238
November 8, 2012
Corporates
Urbi Desarrollos Urbanos, S.A. B. de C.V. Full Rating Report
Key Rating Drivers
High Rate of Cash Burn: Urbi Desarrollos Urbanos, S.A.B. de C.V. (Urbi) exhibited a negative
FCF of MXN5.8 billion during the LTM ended June 30, 2012, mainly due to a MXN7 billion
working capital outflow during the period. This level of negative FCF represents 35% and 98%
of the company’s LTM revenue and cash position, respectively.
Tightening Liquidity: The continued decline in Urbi’s cash on balance sheet will result in a
higher short-term debt position for the company. Liquidity could significantly deteriorate during
the next few quarters should the current trend continue. As of June 30, 2012, Urbi maintained
an adequate cash position of MXN5.5 billion, while its short-term debt was MXN3.5 billion,
comprised mostly of bank loans.
Higher Leverage: Urbi funded its cash flow shortfall with additional debt. The company had
MXN19.4 billion of debt at June 30, 2012, an increase from MXN10.9 billion at the end of 2010.
This resulted in an increase in the company’s total debt/EBITDA ratio to 4.4x as of
June 30, 2012 from 2.7x as of Dec. 31, 2010, and an increase in its net debt/EBITDA ratio to
3.0x from 1.2x during this time period.
2012 Growth Expectations Adjusted Down: Fitch Ratings expects Urbi’s 2012 revenues to
decline between 10% and 15% from 2011 levels. After poor FCF generation in second-quarter
2012, the company has announced its intention to reduce growth and improve FCF generation.
Large Player in Fragmented Industry: The ratings reflect Urbi’s business position as one of
the three largest players in the Mexican homebuilding industry, with important participation in
government-related mortgage funding programs.
Business Strategy Incorporated: The ratings are constrained by Urbi’s high working capital
requirements that reflect its business strategy of covering the affiliated and non-affiliated
segments, as well as increasing exposure with corporate clients that require collection periods
of between nine and 36 months. They also reflect the company’s track record of growing
inorganically through opportunistic acquisitions of housing projects in progress (HPPs).
Negative Outlook due to Liquidity Concerns: Urbi’s Negative Rating Outlook reflects the
potential deterioration in its liquidity position should the current cash flow trends continue. The
company’s cash-to- short-term debt ratio is sufficient at 1.7x, but its CFFO plus cash-to-short-
term debt coverage is just 0.1x due to negative CFFO of MXN5.7 billion for the LTM to June 30,
2012.
What Could Trigger a Rating Action
FCF Generation Is the Main Rating Driver: The ratings are expected to be driven by the
company’s ability to generate FCF and trends in its liquidity. A negative rating action could be
triggered by a deterioration of the company’s credit ratios due to continued sizeable negative
FCF. A continued negative FCF margin during the next few quarters similar to the levels
observed during LTM to June 30, 2012 will likely result in a downgrade. An upgrade is not likely
until the company reverses its current cash flow trends and lowers its leverage.
Ratings
Foreign Currency
Long-Term IDR B
Senior Unsecured B/RR4
Local Currency
Long-Term IDR B
National
Long-Term Rating BBB(mex)
Short-Term Rating F3(mex)
Senior Unsecured BBB(mex)
Rating Outlooks Long-Term Foreign Currency IDR Negative Long-Term Local Currency IDR Negative National Long-Term Rating Negative
Financial Data
Urbi Desarrollos Urbanos, S.A. B. de C.V.
(MXN Mil.) 6/30/12 12/31/11 Revenue 16,592 16,328 EBITDA 4,475 4,360 EBITDAR Margin (%) 27.0 26.7 FCF (5,792) (4,070) FCF Margin (%) (34.9) (24.9) Cash 5,902 5,529 Short-Term Debt 3,543 6,445 Total Debt 19,482 14,921 Total Debt/ EBITDA (x) 4.4 3.4
Analysts José Vértiz +1 212 908-0641 [email protected]
Indalecio Riojas +52 81 8399-9108 [email protected]
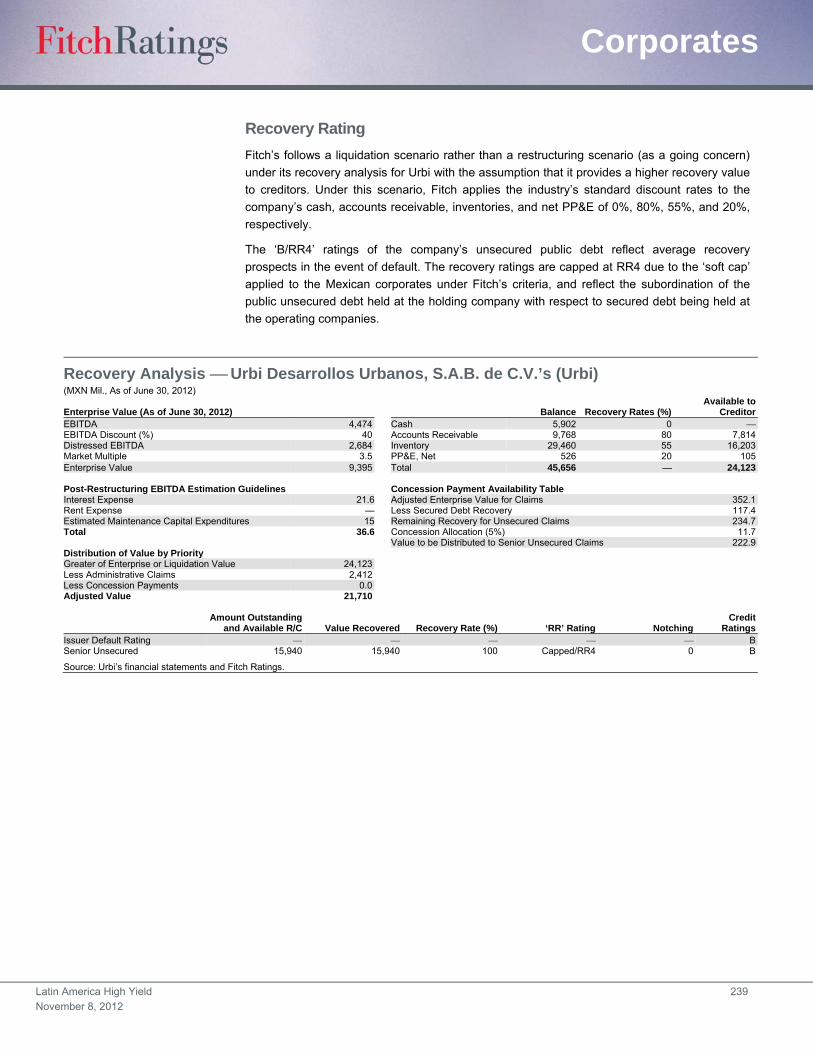
Latin America High Yield 239
November 8, 2012
Corporates
Recovery Rating
Fitch’s follows a liquidation scenario rather than a restructuring scenario (as a going concern)
under its recovery analysis for Urbi with the assumption that it provides a higher recovery value
to creditors. Under this scenario, Fitch applies the industry’s standard discount rates to the
company’s cash, accounts receivable, inventories, and net PP&E of 0%, 80%, 55%, and 20%,
respectively.
The ‘B/RR4’ ratings of the company’s unsecured public debt reflect average recovery
prospects in the event of default. The recovery ratings are capped at RR4 due to the ‘soft cap’
applied to the Mexican corporates under Fitch’s criteria, and reflect the subordination of the
public unsecured debt held at the holding company with respect to secured debt being held at
the operating companies.
Recovery Analysis Urbi Desarrollos Urbanos, S.A.B. de C.V.’s (Urbi) (MXN Mil., As of June 30, 2012)
Enterprise Value (As of June 30, 2012) Balance Recovery Rates (%)Available to
CreditorEBITDA 4,474 Cash 5,902 0 EBITDA Discount (%) 40 Accounts Receivable 9,768 80 7,814Distressed EBITDA 2,684 Inventory 29,460 55 16,203Market Multiple 3.5 PP&E, Net 526 20 105Enterprise Value 9,395 Total 45,656 24,123
Post-Restructuring EBITDA Estimation Guidelines Concession Payment Availability Table Interest Expense 21.6 Adjusted Enterprise Value for Claims 352.1Rent Expense — Less Secured Debt Recovery 117.4Estimated Maintenance Capital Expenditures 15 Remaining Recovery for Unsecured Claims 234.7Total 36.6 Concession Allocation (5%) 11.7 Value to be Distributed to Senior Unsecured Claims 222.9Distribution of Value by Priority Greater of Enterprise or Liquidation Value 24,123 Less Administrative Claims 2,412 Less Concession Payments 0.0 Adjusted Value 21,710
Amount Outstanding
and Available R/C Value Recovered Recovery Rate (%) ‘RR’ Rating Notching Credit
Ratings Issuer Default Rating BSenior Unsecured 15,940 15,940 100 Capped/RR4 0 B
Source: Urbi’s financial statements and Fitch Ratings.
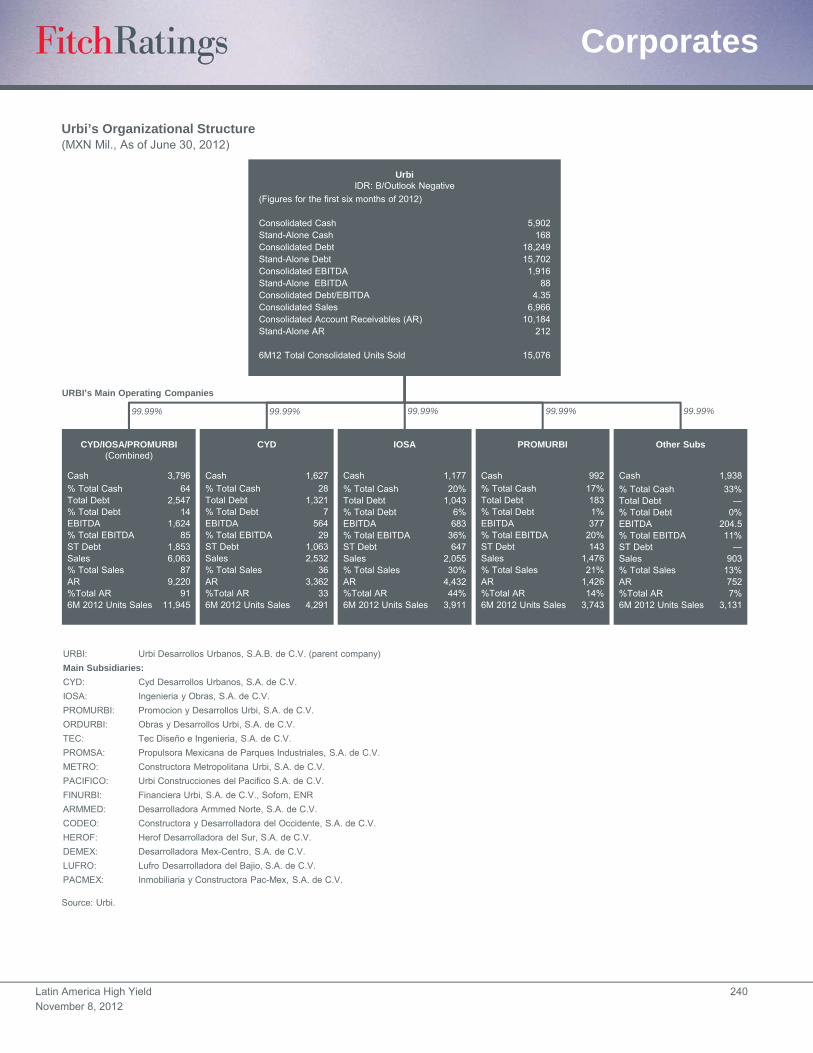
Latin America High Yield 240
November 8, 2012
Corporates
Urbi’s Organizational Structure(MXN Mil., As of June 30, 2012)
Source: Urbi.
UrbiIDR: B/Outlook Negative
(Figures for the first six months of 2012)
Consolidated Cash 5,902 Stand-Alone Cash 168 Consolidated Debt 18,249 Stand-Alone Debt 15,702 Consolidated EBITDA 1,916 Stand-Alone EBITDA 88 Consolidated Debt/EBITDA 4.35 Consolidated Sales 6,966 Consolidated Account Receivables (AR) 10,184 Stand-Alone AR 212
6M12 Total Consolidated Units Sold 15,076
CYD/IOSA/PROMURBI(Combined)
CYD IOSA PROMURBI Other Subs
Cash 3,796
% Total Cash 64Total Debt 2,547 % Total Debt 14EBITDA 1,624 % Total EBITDA 85ST Debt 1,853 Sales 6,063 % Total Sales 87AR 9,220 %Total AR 916M 2012 Units Sales 11,945
Cash 1,627
% Total Cash 28Total Debt 1,321 % Total Debt 7EBITDA 564 % Total EBITDA 29ST Debt 1,063 Sales 2,532 % Total Sales 36AR 3,362 %Total AR 336M 2012 Units Sales 4,291
Cash 1,177
% Total Cash 20%Total Debt 1,043 % Total Debt 6%EBITDA 683 % Total EBITDA 36%ST Debt 647 Sales 2,055 % Total Sales 30%AR 4,432 %Total AR 44%6M 2012 Units Sales 3,911
Cash 992
% Total Cash 17%Total Debt 183 % Total Debt 1%EBITDA 377 % Total EBITDA 20%ST Debt 143 Sales 1,476 % Total Sales 21%AR 1,426 %Total AR 14%6M 2012 Units Sales 3,743
Cash 1,938
% Total Cash 33%Total Debt —% Total Debt 0%EBITDA 204.5% Total EBITDA 11%ST Debt —Sales 903% Total Sales 13%AR 752%Total AR 7%6M 2012 Units Sales 3,131
99.99% 99.99% 99.99% 99.99%99.99%
URBI’s Main Operating Companies
URBI: Urbi Desarrollos Urbanos, S.A.B. de C.V. (parent company)
Main Subsidiaries:
CYD: Cyd Desarrollos Urbanos, S.A. de C.V.
IOSA: Ingenieria y Obras, S.A. de C.V.
PROMURBI: Promocion y Desarrollos Urbi, S.A. de C.V.
ORDURBI: Obras y Desarrollos Urbi, S.A. de C.V.
TEC: Tec Diseño e Ingenieria, S.A. de C.V.
PROMSA: Propulsora Mexicana de Parques Industriales, S.A. de C.V.
METRO: Constructora Metropolitana Urbi, S.A. de C.V.
PACIFICO: Urbi Construcciones del Pacifico S.A. de C.V.
FINURBI: Financiera Urbi, S.A. de C.V., Sofom, ENR
ARMMED: Desarrolladora Armmed Norte, S.A. de C.V.
CODEO: Constructora y Desarrolladora del Occidente, S.A. de C.V.
HEROF: Herof Desarrolladora del Sur, S.A. de C.V.
DEMEX: Desarrolladora Mex-Centro, S.A. de C.V.
LUFRO: Lufro Desarrolladora del Bajio, S.A. de C.V.
PACMEX: Inmobiliaria y Constructora Pac-Mex, S.A. de C.V.
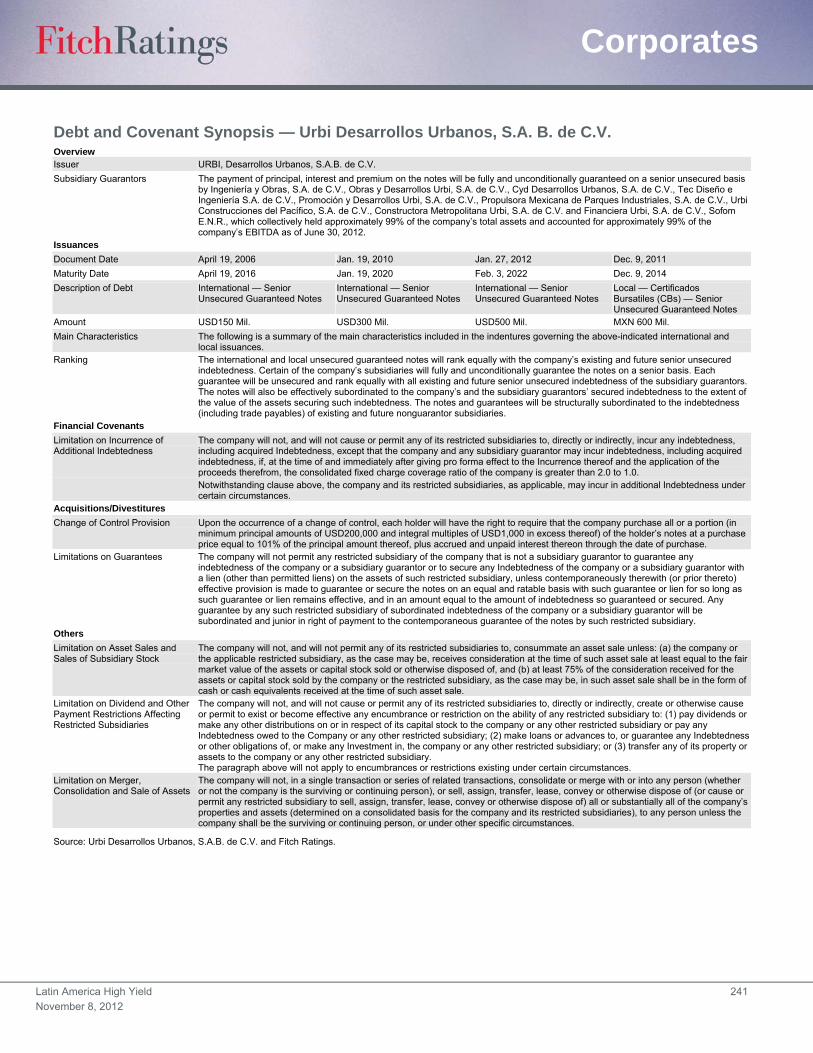
Latin America High Yield 241
November 8, 2012
Corporates
Debt and Covenant Synopsis — Urbi Desarrollos Urbanos, S.A. B. de C.V. Overview Issuer URBI, Desarrollos Urbanos, S.A.B. de C.V.
Subsidiary Guarantors The payment of principal, interest and premium on the notes will be fully and unconditionally guaranteed on a senior unsecured basis by Ingeniería y Obras, S.A. de C.V., Obras y Desarrollos Urbi, S.A. de C.V., Cyd Desarrollos Urbanos, S.A. de C.V., Tec Diseño e Ingeniería S.A. de C.V., Promoción y Desarrollos Urbi, S.A. de C.V., Propulsora Mexicana de Parques Industriales, S.A. de C.V., Urbi Construcciones del Pacífico, S.A. de C.V., Constructora Metropolitana Urbi, S.A. de C.V. and Financiera Urbi, S.A. de C.V., Sofom E.N.R., which collectively held approximately 99% of the company’s total assets and accounted for approximately 99% of the company’s EBITDA as of June 30, 2012.
Issuances
Document Date April 19, 2006 Jan. 19, 2010 Jan. 27, 2012 Dec. 9, 2011
Maturity Date April 19, 2016 Jan. 19, 2020 Feb. 3, 2022 Dec. 9, 2014
Description of Debt International — Senior Unsecured Guaranteed Notes
International — Senior Unsecured Guaranteed Notes
International — Senior Unsecured Guaranteed Notes
Local — Certificados Bursatiles (CBs) — Senior Unsecured Guaranteed Notes
Amount USD150 Mil. USD300 Mil. USD500 Mil. MXN 600 Mil.
Main Characteristics The following is a summary of the main characteristics included in the indentures governing the above-indicated international and local issuances.
Ranking The international and local unsecured guaranteed notes will rank equally with the company’s existing and future senior unsecured indebtedness. Certain of the company’s subsidiaries will fully and unconditionally guarantee the notes on a senior basis. Each guarantee will be unsecured and rank equally with all existing and future senior unsecured indebtedness of the subsidiary guarantors. The notes will also be effectively subordinated to the company’s and the subsidiary guarantors’ secured indebtedness to the extent of the value of the assets securing such indebtedness. The notes and guarantees will be structurally subordinated to the indebtedness (including trade payables) of existing and future nonguarantor subsidiaries.
Financial Covenants
Limitation on Incurrence of Additional Indebtedness
The company will not, and will not cause or permit any of its restricted subsidiaries to, directly or indirectly, incur any indebtedness, including acquired Indebtedness, except that the company and any subsidiary guarantor may incur indebtedness, including acquired indebtedness, if, at the time of and immediately after giving pro forma effect to the Incurrence thereof and the application of the proceeds therefrom, the consolidated fixed charge coverage ratio of the company is greater than 2.0 to 1.0.
Notwithstanding clause above, the company and its restricted subsidiaries, as applicable, may incur in additional Indebtedness under certain circumstances.
Acquisitions/Divestitures
Change of Control Provision Upon the occurrence of a change of control, each holder will have the right to require that the company purchase all or a portion (in minimum principal amounts of USD200,000 and integral multiples of USD1,000 in excess thereof) of the holder’s notes at a purchase price equal to 101% of the principal amount thereof, plus accrued and unpaid interest thereon through the date of purchase.
Limitations on Guarantees The company will not permit any restricted subsidiary of the company that is not a subsidiary guarantor to guarantee any indebtedness of the company or a subsidiary guarantor or to secure any Indebtedness of the company or a subsidiary guarantor with a lien (other than permitted liens) on the assets of such restricted subsidiary, unless contemporaneously therewith (or prior thereto) effective provision is made to guarantee or secure the notes on an equal and ratable basis with such guarantee or lien for so long as such guarantee or lien remains effective, and in an amount equal to the amount of indebtedness so guaranteed or secured. Any guarantee by any such restricted subsidiary of subordinated indebtedness of the company or a subsidiary guarantor will be subordinated and junior in right of payment to the contemporaneous guarantee of the notes by such restricted subsidiary.
Others
Limitation on Asset Sales and Sales of Subsidiary Stock
The company will not, and will not permit any of its restricted subsidiaries to, consummate an asset sale unless: (a) the company or the applicable restricted subsidiary, as the case may be, receives consideration at the time of such asset sale at least equal to the fair market value of the assets or capital stock sold or otherwise disposed of, and (b) at least 75% of the consideration received for the assets or capital stock sold by the company or the restricted subsidiary, as the case may be, in such asset sale shall be in the form of cash or cash equivalents received at the time of such asset sale.
Limitation on Dividend and Other Payment Restrictions Affecting Restricted Subsidiaries
The company will not, and will not cause or permit any of its restricted subsidiaries to, directly or indirectly, create or otherwise cause or permit to exist or become effective any encumbrance or restriction on the ability of any restricted subsidiary to: (1) pay dividends or make any other distributions on or in respect of its capital stock to the company or any other restricted subsidiary or pay any Indebtedness owed to the Company or any other restricted subsidiary; (2) make loans or advances to, or guarantee any Indebtedness or other obligations of, or make any Investment in, the company or any other restricted subsidiary; or (3) transfer any of its property or assets to the company or any other restricted subsidiary. The paragraph above will not apply to encumbrances or restrictions existing under certain circumstances.
Limitation on Merger, Consolidation and Sale of Assets
The company will not, in a single transaction or series of related transactions, consolidate or merge with or into any person (whether or not the company is the surviving or continuing person), or sell, assign, transfer, lease, convey or otherwise dispose of (or cause or permit any restricted subsidiary to sell, assign, transfer, lease, convey or otherwise dispose of) all or substantially all of the company’s properties and assets (determined on a consolidated basis for the company and its restricted subsidiaries), to any person unless the company shall be the surviving or continuing person, or under other specific circumstances.
Source: Urbi Desarrollos Urbanos, S.A.B. de C.V. and Fitch Ratings.
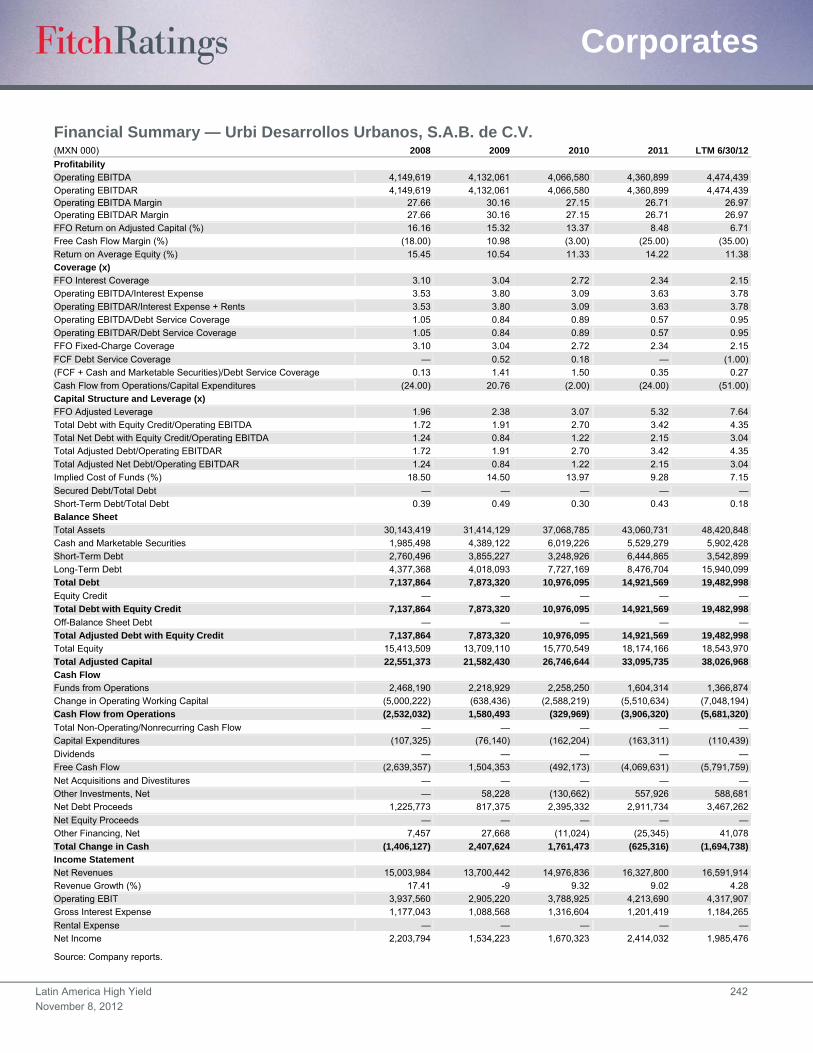
Latin America High Yield 242
November 8, 2012
Corporates
Financial Summary — Urbi Desarrollos Urbanos, S.A.B. de C.V. (MXN 000) 2008 2009 2010 2011 LTM 6/30/12
Profitability
Operating EBITDA 4,149,619 4,132,061 4,066,580 4,360,899 4,474,439
Operating EBITDAR 4,149,619 4,132,061 4,066,580 4,360,899 4,474,439 Operating EBITDA Margin 27.66 30.16 27.15 26.71 26.97 Operating EBITDAR Margin 27.66 30.16 27.15 26.71 26.97
FFO Return on Adjusted Capital (%) 16.16 15.32 13.37 8.48 6.71
Free Cash Flow Margin (%) (18.00) 10.98 (3.00) (25.00) (35.00)
Return on Average Equity (%) 15.45 10.54 11.33 14.22 11.38
Coverage (x)
FFO Interest Coverage 3.10 3.04 2.72 2.34 2.15
Operating EBITDA/Interest Expense 3.53 3.80 3.09 3.63 3.78
Operating EBITDAR/Interest Expense + Rents 3.53 3.80 3.09 3.63 3.78
Operating EBITDA/Debt Service Coverage 1.05 0.84 0.89 0.57 0.95
Operating EBITDAR/Debt Service Coverage 1.05 0.84 0.89 0.57 0.95
FFO Fixed-Charge Coverage 3.10 3.04 2.72 2.34 2.15
FCF Debt Service Coverage — 0.52 0.18 — (1.00)
(FCF + Cash and Marketable Securities)/Debt Service Coverage 0.13 1.41 1.50 0.35 0.27
Cash Flow from Operations/Capital Expenditures (24.00) 20.76 (2.00) (24.00) (51.00)
Capital Structure and Leverage (x)
FFO Adjusted Leverage 1.96 2.38 3.07 5.32 7.64
Total Debt with Equity Credit/Operating EBITDA 1.72 1.91 2.70 3.42 4.35
Total Net Debt with Equity Credit/Operating EBITDA 1.24 0.84 1.22 2.15 3.04
Total Adjusted Debt/Operating EBITDAR 1.72 1.91 2.70 3.42 4.35
Total Adjusted Net Debt/Operating EBITDAR 1.24 0.84 1.22 2.15 3.04
Implied Cost of Funds (%) 18.50 14.50 13.97 9.28 7.15
Secured Debt/Total Debt — — — — —
Short-Term Debt/Total Debt 0.39 0.49 0.30 0.43 0.18
Balance Sheet
Total Assets 30,143,419 31,414,129 37,068,785 43,060,731 48,420,848
Cash and Marketable Securities 1,985,498 4,389,122 6,019,226 5,529,279 5,902,428
Short-Term Debt 2,760,496 3,855,227 3,248,926 6,444,865 3,542,899
Long-Term Debt 4,377,368 4,018,093 7,727,169 8,476,704 15,940,099
Total Debt 7,137,864 7,873,320 10,976,095 14,921,569 19,482,998
Equity Credit — — — — —
Total Debt with Equity Credit 7,137,864 7,873,320 10,976,095 14,921,569 19,482,998
Off-Balance Sheet Debt — — — — —
Total Adjusted Debt with Equity Credit 7,137,864 7,873,320 10,976,095 14,921,569 19,482,998
Total Equity 15,413,509 13,709,110 15,770,549 18,174,166 18,543,970
Total Adjusted Capital 22,551,373 21,582,430 26,746,644 33,095,735 38,026,968
Cash Flow
Funds from Operations 2,468,190 2,218,929 2,258,250 1,604,314 1,366,874
Change in Operating Working Capital (5,000,222) (638,436) (2,588,219) (5,510,634) (7,048,194)
Cash Flow from Operations (2,532,032) 1,580,493 (329,969) (3,906,320) (5,681,320)
Total Non-Operating/Nonrecurring Cash Flow — — — — —
Capital Expenditures (107,325) (76,140) (162,204) (163,311) (110,439)
Dividends — — — — —
Free Cash Flow (2,639,357) 1,504,353 (492,173) (4,069,631) (5,791,759)
Net Acquisitions and Divestitures — — — — —
Other Investments, Net — 58,228 (130,662) 557,926 588,681
Net Debt Proceeds 1,225,773 817,375 2,395,332 2,911,734 3,467,262
Net Equity Proceeds — — — — —
Other Financing, Net 7,457 27,668 (11,024) (25,345) 41,078
Total Change in Cash (1,406,127) 2,407,624 1,761,473 (625,316) (1,694,738)
Income Statement
Net Revenues 15,003,984 13,700,442 14,976,836 16,327,800 16,591,914
Revenue Growth (%) 17.41 -9 9.32 9.02 4.28
Operating EBIT 3,937,560 2,905,220 3,788,925 4,213,690 4,317,907
Gross Interest Expense 1,177,043 1,088,568 1,316,604 1,201,419 1,184,265
Rental Expense — — — — —
Net Income 2,203,794 1,534,223 1,670,323 2,414,032 1,985,476
Source: Company reports.

Latin America High Yield 243
November 8, 2012
Corporates
Virgolino de Oliveira S.A. Açúcar e Álcool Full Rating Report
Key Rating Drivers
High Leverage: Virgolino de Oliveira S.A. Açúcar e Álcool’s (GVO) ratings reflect its high
leverage and tight liquidity position. For the LTM ended on April 30, 2012, GVO’s consolidated
net adjusted debt/EBITDAR ratio, considering dividends received from Copersucar, was 5.0x,
slightly above Fitch’s expectations of between 4.3x and 4.5x for this period. This increased
leverage resulted from pressure on free cash flow (FCF) due to higher capital expenditures
during the last harvest, including crop expansion. The strong U.S. dollar versus the Brazilian
real also had a negative impact on foreign exchange variation and GVO’s debt.
Strengthened Business Profile: GVO’s strategic shareholding in Copersucar (10.36% of its
total capital) fundamentally supports its ratings and mitigates the risks derived from its middle-
tier business position within the industry. GVO transfers 100% of its production to Copersucar,
through a long-term exclusivity contract, mitigating demand risk. Prices are linked to the
average sugar and ethanol market prices plus a premium, which is possible due to logistics
savings and scale gains obtained through the partnership with Copersucar. GVO is
remunerated by Copersucar based on the realized production (on a monthly basis) during the
year, independently of the moment the sale to the final customer occurs.
Weak but Improving Liquidity: GVO’s liquidity remains weak despite the long-term bond
issued in February 2012. As of April 30, 2012, the group reported a cash position of
BRL406 million, which covered only 64% of its short-term adjusted debt. Partially mitigating
refinancing risk, GVO’s financial profile benefits from a significant working capital financing line
in the amount of up to 40% of its annual revenues, equivalent to approximately BRL400 million,
granted by Copersucar. This credit line is subject to certain limits in terms of revenues, and it is
linked to guarantees on inventories and/or bank guarantees.
Adequate Business Model: GVO’s business profile is positive, based on the favorable
location of its mills, its diversified production base, and operational flexibility. The group
consists of four industrial units located in the State of São Paulo, conveniently located near the
main consumer markets and export channels. GVO has an installed crushing capacity for
12 million tons of sugar cane, with flexibility to reach up to 60% of total capacity for sugar or
ethanol. The group benefits from sugar cane supply from its own and leased land for around
54% of its needs. The remaining 46% is supplied by third parties through long-term contracts,
and there is no supply concentration above 5%.
Industry Risks: The high volatile sugar and ethanol industry fundamentals; exposure to
climatic conditions;, and challenges related to the ethanol industry’s dynamics in Brazil,
currently strongly linked to gasoline regulated prices and government policies related to this
issue, are further considered in the ratings.
What Could Trigger a Rating Action
Lower Cash Flow Generation: Negative rating actions could be driven by lower than
expected operational cash flow generation or deterioration of GVO’s operating margins.
Deleveraging Movement: Improvement in the group’s liquidity position coupled with a better
balanced debt maturity profile and lower leverage levels could lead to a positive rating action.
Ratings
Virgolino de Oliveira S.A. Acúcar e Álcool
Foreign Currency
Long-Term IDR B
Local Currency
Long-Term IDR B
National Scale
Long-Term BBB(bra)
First Debenture Issuance due 2014 BBB(bra)
Virgolino de Oliveira Finance S.A.
Foreign Currency
Long-Term IDR B
Local Currency
Long-Term IDR B
USD300 Million Senior Unsecured Notes B/RR4
IDR – Issuer default rating.
Rating Outlooks Long-Term Foreign Currency IDR Stable Long-Term Local Currency IDR Stable
Financial Data
Virgolino de Oliveira S.A. Acúcar e Álcool
(BRL Mil.) 4/30/12 4/30/11 Net Revenues 1,053 1,015 EBITDA 323 265 EBITDA Margin (%) 30.7 26.1 Funds from Operations 144 305 Total Debt 2,181 1,393 Total Adjusted Debta 2,514 1,616 Cash and Equivalents 406 86 Total Debt/ EBITDA (x) 6.7 5.3 Net Debt/ EBITDA (x) 5.5 4.9 Total Adjusted Debt/ EBITDAR (x) 6.4 5.2 Net Adjusted Debt/ EBITDAR + Dividends (x) 5.0 4.8
aIncluding off-balance obligations related to leased land (period of 12 months).
Analysts Renata Pinho +55 11 4504-2207 [email protected]
Gisele Paolino +55 21 4503-2624 [email protected]
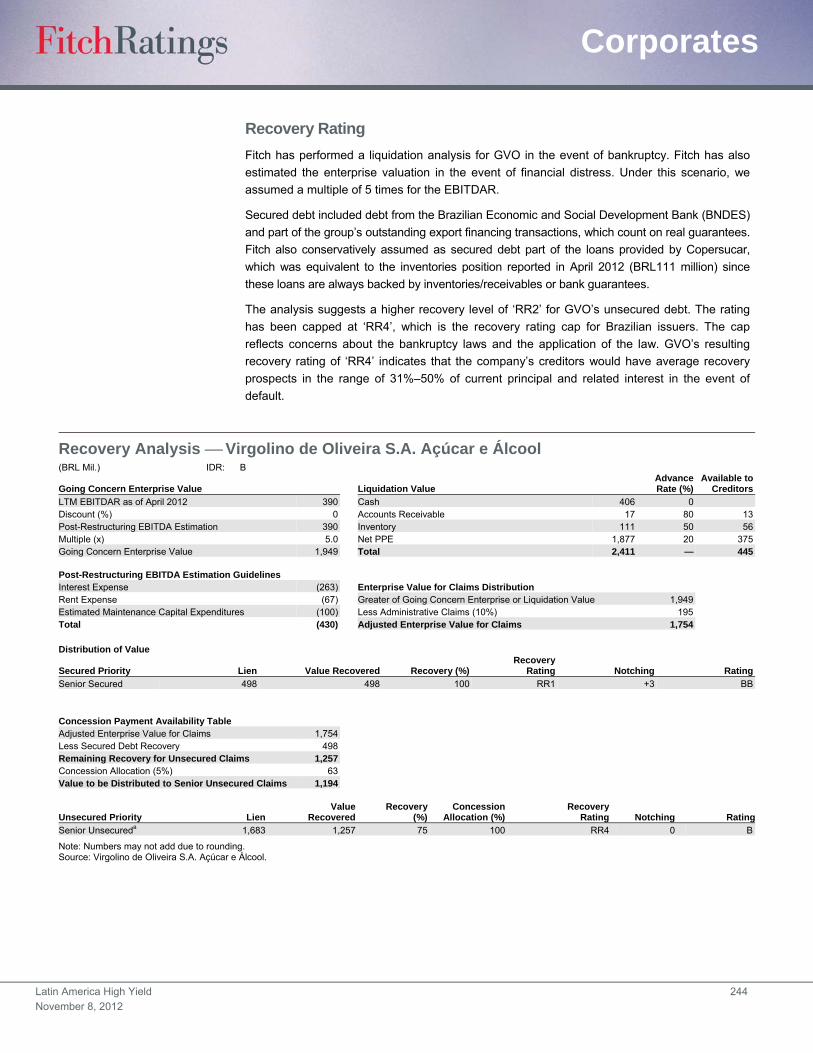
Latin America High Yield 244
November 8, 2012
Corporates
Recovery Rating
Fitch has performed a liquidation analysis for GVO in the event of bankruptcy. Fitch has also
estimated the enterprise valuation in the event of financial distress. Under this scenario, we
assumed a multiple of 5 times for the EBITDAR.
Secured debt included debt from the Brazilian Economic and Social Development Bank (BNDES)
and part of the group’s outstanding export financing transactions, which count on real guarantees.
Fitch also conservatively assumed as secured debt part of the loans provided by Copersucar,
which was equivalent to the inventories position reported in April 2012 (BRL111 million) since
these loans are always backed by inventories/receivables or bank guarantees.
The analysis suggests a higher recovery level of ‘RR2’ for GVO’s unsecured debt. The rating
has been capped at ‘RR4’, which is the recovery rating cap for Brazilian issuers. The cap
reflects concerns about the bankruptcy laws and the application of the law. GVO’s resulting
recovery rating of ‘RR4’ indicates that the company’s creditors would have average recovery
prospects in the range of 31%–50% of current principal and related interest in the event of
default.
Recovery Analysis Virgolino de Oliveira S.A. Açúcar e Álcool (BRL Mil.) IDR: B
Going Concern Enterprise Value Liquidation Value AdvanceRate (%)
Available toCreditors
LTM EBITDAR as of April 2012 390 Cash 406 0Discount (%) 0 Accounts Receivable 17 80 13Post-Restructuring EBITDA Estimation 390 Inventory 111 50 56Multiple (x) 5.0 Net PPE 1,877 20 375Going Concern Enterprise Value 1,949 Total 2,411 — 445 Post-Restructuring EBITDA Estimation Guidelines Interest Expense (263) Enterprise Value for Claims Distribution Rent Expense (67) Greater of Going Concern Enterprise or Liquidation Value 1,949Estimated Maintenance Capital Expenditures (100) Less Administrative Claims (10%) 195Total (430) Adjusted Enterprise Value for Claims 1,754 Distribution of Value
Secured Priority Lien Value Recovered Recovery (%)Recovery
Rating Notching Rating
Senior Secured 498 498 100 RR1 +3 BB Concession Payment Availability Table Adjusted Enterprise Value for Claims 1,754 Less Secured Debt Recovery 498 Remaining Recovery for Unsecured Claims 1,257 Concession Allocation (5%) 63 Value to be Distributed to Senior Unsecured Claims 1,194
Unsecured Priority Lien Value
RecoveredRecovery
(%)Concession
Allocation (%)Recovery
Rating Notching Rating
Senior Unsecureda 1,683 1,257 75 100 RR4 0 B
Note: Numbers may not add due to rounding. Source: Virgolino de Oliveira S.A. Açúcar e Álcool.

Latin America High Yield 245
November 8, 2012
Corporates
Organizational Structure — Virgolino de Oliveira Group(As of April 30, 2012)
Source: Virgolino de Oliveira S.A.
Oliveira Family
Agropecuária Virgolino de Oliveira S.A.
Açucareira Virgolino de Oliveira S.A.
Virgolino de Oliveira Finance S.A.
Agropecuária Terras Novas S.A.
Agropecuária NossaSenhora do Carmo S.A.
Virgolino de Oliveira S.A. Açúcar e Álcool
38.22%
100%
61.78%
99.85% 99.35% 99.94% 100%
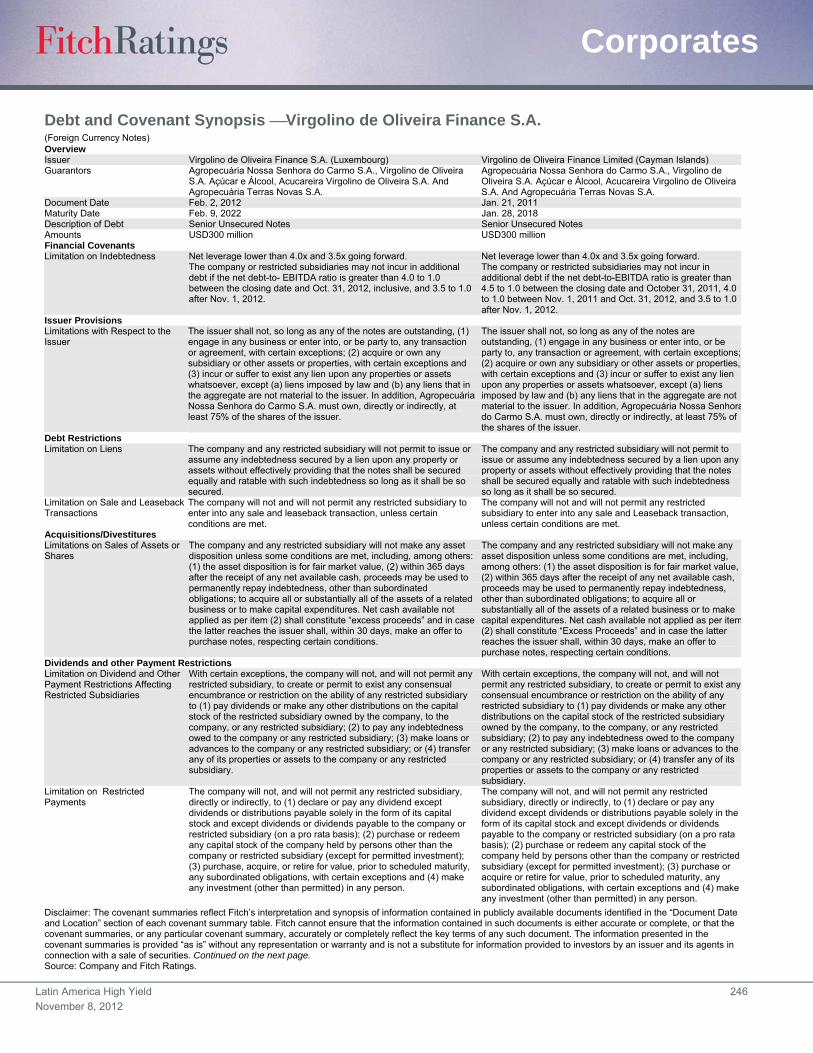
Latin America High Yield 246
November 8, 2012
Corporates
Debt and Covenant Synopsis Virgolino de Oliveira Finance S.A. (Foreign Currency Notes) Overview Issuer Virgolino de Oliveira Finance S.A. (Luxembourg) Virgolino de Oliveira Finance Limited (Cayman Islands) Guarantors Agropecuária Nossa Senhora do Carmo S.A., Virgolino de Oliveira
S.A. Açúcar e Álcool, Acucareira Virgolino de Oliveira S.A. And Agropecuária Terras Novas S.A.
Agropecuária Nossa Senhora do Carmo S.A., Virgolino de Oliveira S.A. Açúcar e Álcool, Acucareira Virgolino de Oliveira S.A. And Agropecuária Terras Novas S.A.
Document Date Feb. 2, 2012 Jan. 21, 2011 Maturity Date Feb. 9, 2022 Jan. 28, 2018 Description of Debt Senior Unsecured Notes Senior Unsecured Notes Amounts USD300 million USD300 million Financial Covenants Limitation on Indebtedness Net leverage lower than 4.0x and 3.5x going forward.
The company or restricted subsidiaries may not incur in additional debt if the net debt-to- EBITDA ratio is greater than 4.0 to 1.0 between the closing date and Oct. 31, 2012, inclusive, and 3.5 to 1.0 after Nov. 1, 2012.
Net leverage lower than 4.0x and 3.5x going forward. The company or restricted subsidiaries may not incur in additional debt if the net debt-to-EBITDA ratio is greater than 4.5 to 1.0 between the closing date and October 31, 2011, 4.0 to 1.0 between Nov. 1, 2011 and Oct. 31, 2012, and 3.5 to 1.0 after Nov. 1, 2012.
Issuer Provisions Limitations with Respect to the Issuer
The issuer shall not, so long as any of the notes are outstanding, (1) engage in any business or enter into, or be party to, any transaction or agreement, with certain exceptions; (2) acquire or own any subsidiary or other assets or properties, with certain exceptions and (3) incur or suffer to exist any lien upon any properties or assets whatsoever, except (a) liens imposed by law and (b) any liens that in the aggregate are not material to the issuer. In addition, Agropecuária Nossa Senhora do Carmo S.A. must own, directly or indirectly, at least 75% of the shares of the issuer.
The issuer shall not, so long as any of the notes are outstanding, (1) engage in any business or enter into, or be party to, any transaction or agreement, with certain exceptions; (2) acquire or own any subsidiary or other assets or properties, with certain exceptions and (3) incur or suffer to exist any lien upon any properties or assets whatsoever, except (a) liens imposed by law and (b) any liens that in the aggregate are not material to the issuer. In addition, Agropecuária Nossa Senhorado Carmo S.A. must own, directly or indirectly, at least 75% of the shares of the issuer.
Debt Restrictions Limitation on Liens The company and any restricted subsidiary will not permit to issue or
assume any indebtedness secured by a lien upon any property or assets without effectively providing that the notes shall be secured equally and ratable with such indebtedness so long as it shall be so secured.
The company and any restricted subsidiary will not permit to issue or assume any indebtedness secured by a lien upon any property or assets without effectively providing that the notes shall be secured equally and ratable with such indebtedness so long as it shall be so secured.
Limitation on Sale and Leaseback Transactions
The company will not and will not permit any restricted subsidiary to enter into any sale and leaseback transaction, unless certain conditions are met.
The company will not and will not permit any restricted subsidiary to enter into any sale and Leaseback transaction, unless certain conditions are met.
Acquisitions/Divestitures Limitations on Sales of Assets or Shares
The company and any restricted subsidiary will not make any asset disposition unless some conditions are met, including, among others: (1) the asset disposition is for fair market value, (2) within 365 days after the receipt of any net available cash, proceeds may be used to permanently repay indebtedness, other than subordinated obligations; to acquire all or substantially all of the assets of a related business or to make capital expenditures. Net cash available not applied as per item (2) shall constitute “excess proceeds” and in case the latter reaches the issuer shall, within 30 days, make an offer to purchase notes, respecting certain conditions.
The company and any restricted subsidiary will not make any asset disposition unless some conditions are met, including, among others: (1) the asset disposition is for fair market value, (2) within 365 days after the receipt of any net available cash, proceeds may be used to permanently repay indebtedness, other than subordinated obligations; to acquire all or substantially all of the assets of a related business or to make capital expenditures. Net cash available not applied as per item(2) shall constitute “Excess Proceeds” and in case the latter reaches the issuer shall, within 30 days, make an offer to purchase notes, respecting certain conditions.
Dividends and other Payment Restrictions Limitation on Dividend and Other Payment Restrictions Affecting Restricted Subsidiaries
With certain exceptions, the company will not, and will not permit any restricted subsidiary, to create or permit to exist any consensual encumbrance or restriction on the ability of any restricted subsidiary to (1) pay dividends or make any other distributions on the capital stock of the restricted subsidiary owned by the company, to the company, or any restricted subsidiary; (2) to pay any indebtedness owed to the company or any restricted subsidiary; (3) make loans or advances to the company or any restricted subsidiary; or (4) transfer any of its properties or assets to the company or any restricted subsidiary.
With certain exceptions, the company will not, and will not permit any restricted subsidiary, to create or permit to exist any consensual encumbrance or restriction on the ability of any restricted subsidiary to (1) pay dividends or make any other distributions on the capital stock of the restricted subsidiary owned by the company, to the company, or any restricted subsidiary; (2) to pay any indebtedness owed to the company or any restricted subsidiary; (3) make loans or advances to the company or any restricted subsidiary; or (4) transfer any of its properties or assets to the company or any restricted subsidiary.
Limitation on Restricted Payments
The company will not, and will not permit any restricted subsidiary, directly or indirectly, to (1) declare or pay any dividend except dividends or distributions payable solely in the form of its capital stock and except dividends or dividends payable to the company or restricted subsidiary (on a pro rata basis); (2) purchase or redeem any capital stock of the company held by persons other than the company or restricted subsidiary (except for permitted investment); (3) purchase, acquire, or retire for value, prior to scheduled maturity, any subordinated obligations, with certain exceptions and (4) make any investment (other than permitted) in any person.
The company will not, and will not permit any restricted subsidiary, directly or indirectly, to (1) declare or pay any dividend except dividends or distributions payable solely in the form of its capital stock and except dividends or dividends payable to the company or restricted subsidiary (on a pro rata basis); (2) purchase or redeem any capital stock of the company held by persons other than the company or restricted subsidiary (except for permitted investment); (3) purchase or acquire or retire for value, prior to scheduled maturity, any subordinated obligations, with certain exceptions and (4) make any investment (other than permitted) in any person.
Disclaimer: The covenant summaries reflect Fitch’s interpretation and synopsis of information contained in publicly available documents identified in the “Document Date and Location” section of each covenant summary table. Fitch cannot ensure that the information contained in such documents is either accurate or complete, or that the covenant summaries, or any particular covenant summary, accurately or completely reflect the key terms of any such document. The information presented in the covenant summaries is provided “as is” without any representation or warranty and is not a substitute for information provided to investors by an issuer and its agents in connection with a sale of securities. Continued on the next page. Source: Company and Fitch Ratings.
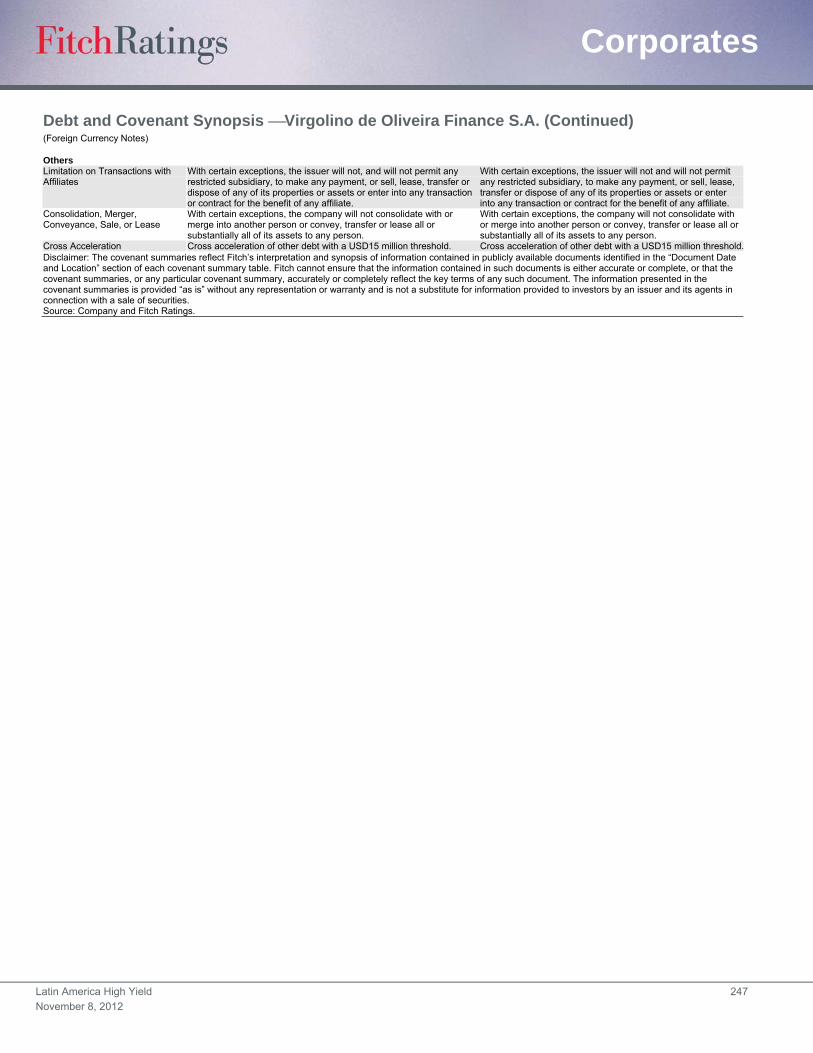
Latin America High Yield 247
November 8, 2012
Corporates
Debt and Covenant Synopsis Virgolino de Oliveira Finance S.A. (Continued) (Foreign Currency Notes)
Others Limitation on Transactions with Affiliates
With certain exceptions, the issuer will not, and will not permit any restricted subsidiary, to make any payment, or sell, lease, transfer or dispose of any of its properties or assets or enter into any transaction or contract for the benefit of any affiliate.
With certain exceptions, the issuer will not and will not permit any restricted subsidiary, to make any payment, or sell, lease, transfer or dispose of any of its properties or assets or enter into any transaction or contract for the benefit of any affiliate.
Consolidation, Merger, Conveyance, Sale, or Lease
With certain exceptions, the company will not consolidate with or merge into another person or convey, transfer or lease all or substantially all of its assets to any person.
With certain exceptions, the company will not consolidate with or merge into another person or convey, transfer or lease all or substantially all of its assets to any person.
Cross Acceleration Cross acceleration of other debt with a USD15 million threshold. Cross acceleration of other debt with a USD15 million threshold.Disclaimer: The covenant summaries reflect Fitch’s interpretation and synopsis of information contained in publicly available documents identified in the “Document Date and Location” section of each covenant summary table. Fitch cannot ensure that the information contained in such documents is either accurate or complete, or that the covenant summaries, or any particular covenant summary, accurately or completely reflect the key terms of any such document. The information presented in the covenant summaries is provided “as is” without any representation or warranty and is not a substitute for information provided to investors by an issuer and its agents in connection with a sale of securities. Source: Company and Fitch Ratings.

Latin America High Yield 248
November 8, 2012
Corporates
Financial Summary Virgolino de Oliveira S.A. Açúcar e Álcool (BRL Mil., As of April 30) LTM 4/30/12 2011 2010 2009 2008
Profitability
Operating EBITDA 323,117 264,549 311,891 94,788 62,446
Operating EBITDAR 389,817 309,098 359,391 127,572 88,846
Operating EBITDA Margin (%) 30.7 26.1 30.1 14.3 15.6
Operating EBITDAR Margin (%) 37.0 30.5 34.7 19.3 22.3
FFO Return on Adjusted Capital (%) 16.5 28.3 22.3 10.7 N.A.
Free Cash Flow Margin (%) (18.0) 4.7 10.5 (17.0) N.A.
Return on Average Equity (%) (20.0) 12.7 3.6 (19.6) N.A.
Coverage (x)
FFO Interest Coverage 1.5 2.2 1.9 N.A. N.A.
Operating EBITDA/Gross Interest Expense 1.2 1.1 1.6 N.A. N.A.
Operating EBITDAR/Interest Expense + Rents 1.2 1.0 1.5 N.A. N.A.
Operating EBITDA/Debt Service Coverage 0.4 0.4 0.4 N.A. N.A.
Operating EBITDAR/Debt Service Coverage 0.4 0.4 0.4 N.A. N.A.
FFO Fixed-Charge Coverage 1.4 2.0 1.7 N.A. N.A.
FCF Debt Service Coverage 0.1 0.4 0.4 N.A. N.A.
(FCF + Cash and Marketable Securities)/Debt Service Coverage 0.5 0.6 0.5 N.A. N.A.
Cash Flow from Operations/Capital Expenditures 0.4 1.2 1.9 0.5 0.2
Leverage (x)
FFO Adjusted Leverage 5.3 2.7 3.5 7.2 N.A.
Total Debt with Equity Credit/Operating EBITDA 6.7 5.3 4.0 13.9 16.6
Total Net Debt with Equity Credit/Operating EBITDA 5.5 4.9 3.8 12.7 15.1
Total Adjusted Debt/Operating EBITDAR 6.4 5.2 4.1 11.6 14.0
Total Adjusted Net Debt/Operating EBITDAR 5.4 5.0 4.0 10.7 13.0
Implied Cost of Funds (%) 0.1 0.2 0.2 N.A. N.A.
Secured Debt/Total Debt — — — — —
Short-Term Debt/Total Debt 0.3 0.3 0.5 0.5 0.4
Balance Sheet
Total Assets 2,773,214 2,268,347 2,233,871 2,320,134 1,425,181
Cash and Marketable Securities 405,746 85,598 40,349 111,104 90,622
Short-Term Debt 635,079 429,871 574,102 627,221 415,258
Long-Term Debt 1,545,501 963,185 666,697 685,648 618,515
Total Debt 2,180,580 1,393,056 1,240,799 1,312,869 1,033,773
Equity Credit — — — — —
Total Debt with Equity Credit 2,180,580 1,393,056 1,240,799 1,312,869 1,033,773
Off-Balance Sheet Debt 333,500 222,745 237,500 163,920 211,200
Total Adjusted Debt with Equity Credit 2,514,080 1,615,801 1,478,299 1,476,789 1,244,973
Total Equity 364,979 502,519 432,577 441,910 260,051
Total Adjusted Capital 2,879,059 2,118,320 1,910,876 1,918,699 1,505,024
Cash Flow
Funds from Operations 143,781 304,713 179,630 172,312 143,781
Change in Working Capital (10,567) (37,716) 55,240 (47,234) (10,567)
Cash Flow from Operations 133,214 266,997 234,870 125,078 133,214
Total Non-Operating/Nonrecurring Cash Flow — — — — —
Capital Expenditures (323,087) (219,761) (125,938) (237,295) (323,087)
Common Dividends — — — — —
Free Cash Flow (189,873) 47,236 108,932 (112,217) (189,873)
Net Acquisitions and Divestitures — — — — —
Other Investments, Net 28,381 9,522 4,015 (20) 28,381
Net Debt Proceeds 481,640 (11,509) (183,702) 108,958 481,640
Net Equity Proceeds N.A. N.A. N.A. 23,761 N.A.
Other (Investments and Financing) — — — — —
Total Change in Cash 320,148 45,249 (70,755) 20,482 N.A.
Income Statement
Revenue 1,052,795 1,014,544 1,036,728 661,856 399,267
Revenue Growth (%) 4 (2) 57 66 N.A.
Operating EBIT 126,817 204,044 184,091 33,813 2,636
Gross Interest Expense 263,465 249,891 198,555 N.A. N.A.
Rental Expense 66,700 44,549 47,500 32,784 26,400
Net Income (86,901) 59,297 15,625 (68,727) (46,574)
N.A. – Not applicable. Source: Fitch.
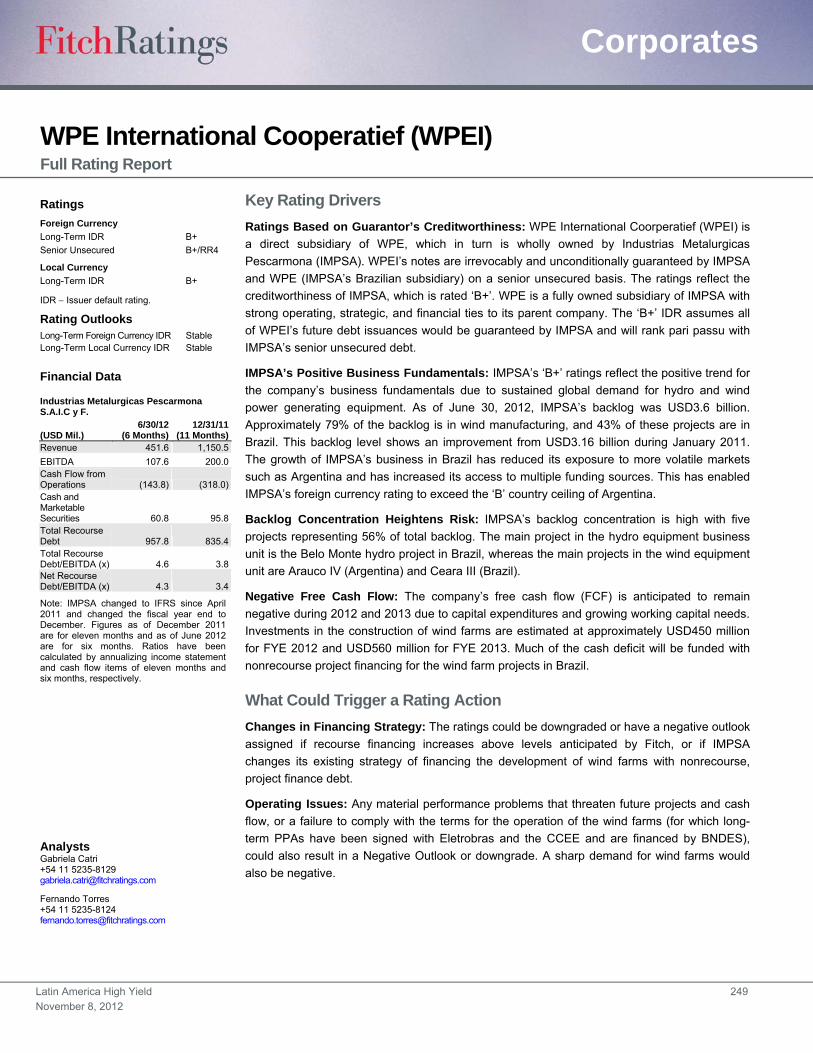
Latin America High Yield 249
November 8, 2012
Corporates
WPE International Cooperatief (WPEI) Full Rating Report
Key Rating Drivers
Ratings Based on Guarantor’s Creditworthiness: WPE International Coorperatief (WPEI) is
a direct subsidiary of WPE, which in turn is wholly owned by Industrias Metalurgicas
Pescarmona (IMPSA). WPEI’s notes are irrevocably and unconditionally guaranteed by IMPSA
and WPE (IMPSA’s Brazilian subsidiary) on a senior unsecured basis. The ratings reflect the
creditworthiness of IMPSA, which is rated ‘B+’. WPE is a fully owned subsidiary of IMPSA with
strong operating, strategic, and financial ties to its parent company. The ‘B+’ IDR assumes all
of WPEI’s future debt issuances would be guaranteed by IMPSA and will rank pari passu with
IMPSA’s senior unsecured debt.
IMPSA’s Positive Business Fundamentals: IMPSA’s ‘B+’ ratings reflect the positive trend for
the company’s business fundamentals due to sustained global demand for hydro and wind
power generating equipment. As of June 30, 2012, IMPSA’s backlog was USD3.6 billion.
Approximately 79% of the backlog is in wind manufacturing, and 43% of these projects are in
Brazil. This backlog level shows an improvement from USD3.16 billion during January 2011.
The growth of IMPSA’s business in Brazil has reduced its exposure to more volatile markets
such as Argentina and has increased its access to multiple funding sources. This has enabled
IMPSA’s foreign currency rating to exceed the ‘B’ country ceiling of Argentina.
Backlog Concentration Heightens Risk: IMPSA’s backlog concentration is high with five
projects representing 56% of total backlog. The main project in the hydro equipment business
unit is the Belo Monte hydro project in Brazil, whereas the main projects in the wind equipment
unit are Arauco IV (Argentina) and Ceara III (Brazil).
Negative Free Cash Flow: The company’s free cash flow (FCF) is anticipated to remain
negative during 2012 and 2013 due to capital expenditures and growing working capital needs.
Investments in the construction of wind farms are estimated at approximately USD450 million
for FYE 2012 and USD560 million for FYE 2013. Much of the cash deficit will be funded with
nonrecourse project financing for the wind farm projects in Brazil.
What Could Trigger a Rating Action
Changes in Financing Strategy: The ratings could be downgraded or have a negative outlook
assigned if recourse financing increases above levels anticipated by Fitch, or if IMPSA
changes its existing strategy of financing the development of wind farms with nonrecourse,
project finance debt.
Operating Issues: Any material performance problems that threaten future projects and cash
flow, or a failure to comply with the terms for the operation of the wind farms (for which long-
term PPAs have been signed with Eletrobras and the CCEE and are financed by BNDES),
could also result in a Negative Outlook or downgrade. A sharp demand for wind farms would
also be negative.
Ratings
Foreign Currency
Long-Term IDR B+
Senior Unsecured B+/RR4
Local Currency
Long-Term IDR B+
IDR Issuer default rating.
Rating Outlooks Long-Term Foreign Currency IDR Stable Long-Term Local Currency IDR Stable
Financial Data
Industrias Metalurgicas Pescarmona S.A.I.C y F.
(USD Mil.) 6/30/12
(6 Months) 12/31/11
(11 Months) Revenue 451.6 1,150.5
EBITDA 107.6 200.0 Cash Flow from Operations (143.8) (318.0) Cash and Marketable Securities 60.8 95.8 Total Recourse Debt 957.8 835.4 Total Recourse Debt/EBITDA (x) 4.6 3.8 Net Recourse Debt/EBITDA (x) 4.3 3.4
Note: IMPSA changed to IFRS since April 2011 and changed the fiscal year end to December. Figures as of December 2011 are for eleven months and as of June 2012 are for six months. Ratios have been calculated by annualizing income statement and cash flow items of eleven months and six months, respectively.
Analysts Gabriela Catri +54 11 5235-8129 [email protected]
Fernando Torres +54 11 5235-8124 [email protected]
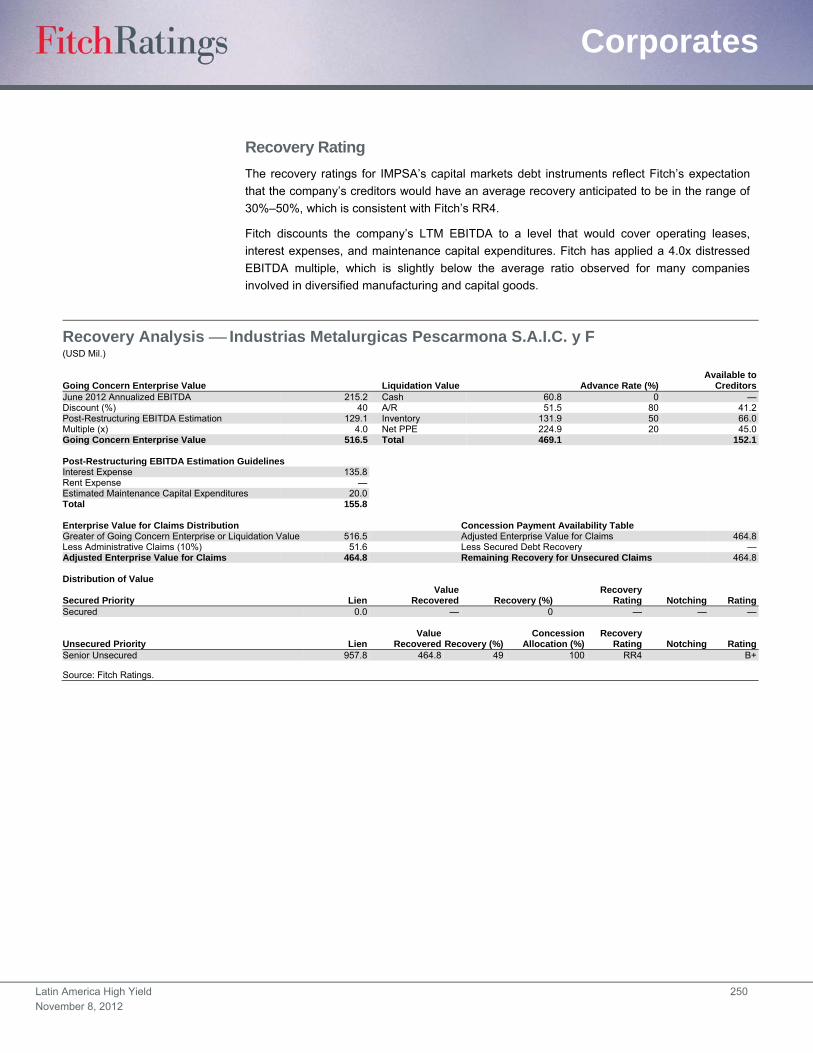
Latin America High Yield 250
November 8, 2012
Corporates
Recovery Rating
The recovery ratings for IMPSA’s capital markets debt instruments reflect Fitch’s expectation
that the company’s creditors would have an average recovery anticipated to be in the range of
30%–50%, which is consistent with Fitch’s RR4.
Fitch discounts the company’s LTM EBITDA to a level that would cover operating leases,
interest expenses, and maintenance capital expenditures. Fitch has applied a 4.0x distressed
EBITDA multiple, which is slightly below the average ratio observed for many companies
involved in diversified manufacturing and capital goods.
Recovery Analysis Industrias Metalurgicas Pescarmona S.A.I.C. y F (USD Mil.)
Going Concern Enterprise Value Liquidation Value Advance Rate (%)Available to
CreditorsJune 2012 Annualized EBITDA 215.2 Cash 60.8 0 —Discount (%) 40 A/R 51.5 80 41.2Post-Restructuring EBITDA Estimation 129.1 Inventory 131.9 50 66.0Multiple (x) 4.0 Net PPE 224.9 20 45.0Going Concern Enterprise Value 516.5 Total 469.1 152.1 Post-Restructuring EBITDA Estimation Guidelines Interest Expense 135.8Rent Expense —Estimated Maintenance Capital Expenditures 20.0Total 155.8
Enterprise Value for Claims Distribution Concession Payment Availability Table Greater of Going Concern Enterprise or Liquidation Value 516.5 Adjusted Enterprise Value for Claims 464.8Less Administrative Claims (10%) 51.6 Less Secured Debt Recovery —Adjusted Enterprise Value for Claims 464.8 Remaining Recovery for Unsecured Claims 464.8 Distribution of Value
Secured Priority LienValue
Recovered Recovery (%)Recovery
Rating Notching RatingSecured 0.0 — 0 — — —
Unsecured Priority LienValue
Recovered Recovery (%)Concession
Allocation (%) Recovery
Rating Notching RatingSenior Unsecured 957.8 464.8 49 100 RR4 B+
Source: Fitch Ratings.

Latin America High Yield 251
November 8, 2012
Corporates
Organizational Structure — WPE International Cooperatief
Industrias Metalúrgicas Pescarmona S.A.I.C. y F.
Inverall Constr. S.A. (Brazil)
WPE(Brazil)
Energimp(Brazil)
Venti Energia(Brazil)
Source: Fitch and Industrias Metalúrgicas Pescarmona S.A.I.C. y F.
WPE International Cooperatief
(Netherlands)
USD390 Million Senior Unsecured Notes Due
2020
FI-FGTS
100%
100% 100%
100%
55%
45%
Guaranteed
June 2012 Summary Statistics
USD107.6 Million of EBITDA (6 Months)USD60.8 Million of Cash and Marketable
SecuritiesUSD1,343 Million of Total DebtUSD958 Million of Total Debt with Recourse
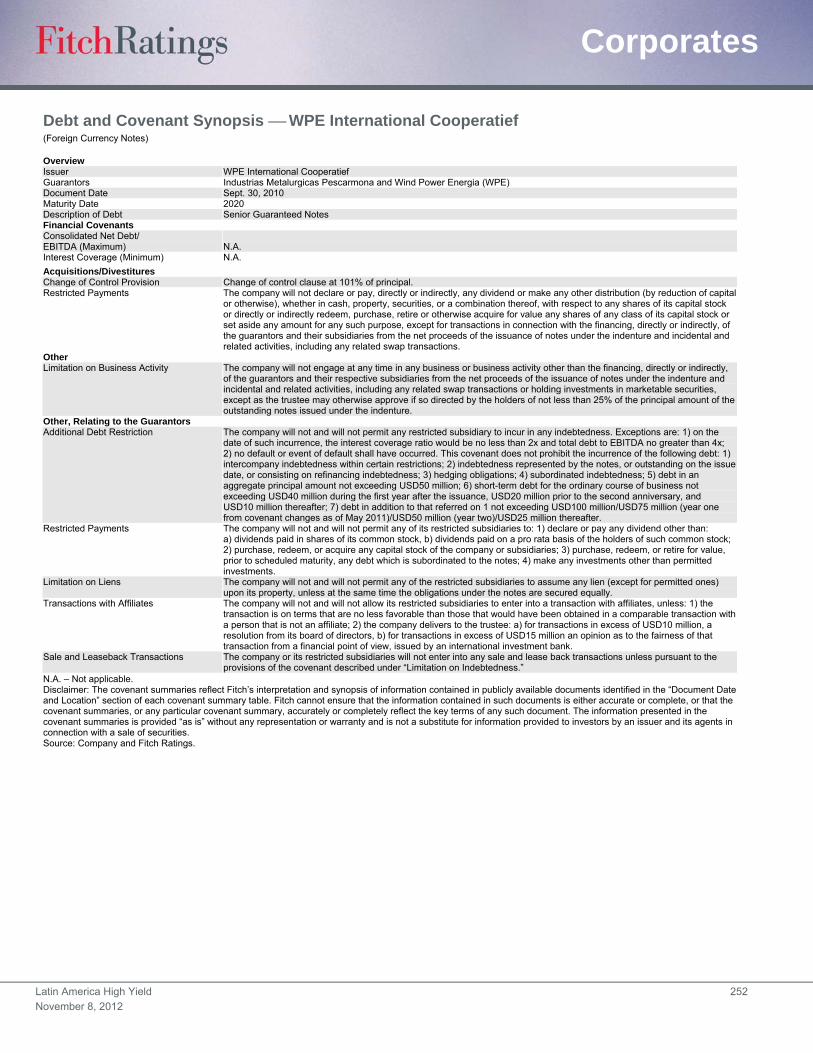
Latin America High Yield 252
November 8, 2012
Corporates
Debt and Covenant Synopsis WPE International Cooperatief (Foreign Currency Notes)
Overview Issuer WPE International Cooperatief Guarantors Industrias Metalurgicas Pescarmona and Wind Power Energia (WPE) Document Date Sept. 30, 2010 Maturity Date 2020 Description of Debt Senior Guaranteed Notes Financial Covenants Consolidated Net Debt/ EBITDA (Maximum) N.A. Interest Coverage (Minimum) N.A.
Acquisitions/Divestitures Change of Control Provision Change of control clause at 101% of principal. Restricted Payments The company will not declare or pay, directly or indirectly, any dividend or make any other distribution (by reduction of capital
or otherwise), whether in cash, property, securities, or a combination thereof, with respect to any shares of its capital stock or directly or indirectly redeem, purchase, retire or otherwise acquire for value any shares of any class of its capital stock or set aside any amount for any such purpose, except for transactions in connection with the financing, directly or indirectly, of the guarantors and their subsidiaries from the net proceeds of the issuance of notes under the indenture and incidental and related activities, including any related swap transactions.
Other Limitation on Business Activity The company will not engage at any time in any business or business activity other than the financing, directly or indirectly,
of the guarantors and their respective subsidiaries from the net proceeds of the issuance of notes under the indenture and incidental and related activities, including any related swap transactions or holding investments in marketable securities, except as the trustee may otherwise approve if so directed by the holders of not less than 25% of the principal amount of the outstanding notes issued under the indenture.
Other, Relating to the Guarantors Additional Debt Restriction The company will not and will not permit any restricted subsidiary to incur in any indebtedness. Exceptions are: 1) on the
date of such incurrence, the interest coverage ratio would be no less than 2x and total debt to EBITDA no greater than 4x; 2) no default or event of default shall have occurred. This covenant does not prohibit the incurrence of the following debt: 1) intercompany indebtedness within certain restrictions; 2) indebtedness represented by the notes, or outstanding on the issue date, or consisting on refinancing indebtedness; 3) hedging obligations; 4) subordinated indebtedness; 5) debt in an aggregate principal amount not exceeding USD50 million; 6) short-term debt for the ordinary course of business not exceeding USD40 million during the first year after the issuance, USD20 million prior to the second anniversary, and USD10 million thereafter; 7) debt in addition to that referred on 1 not exceeding USD100 million/USD75 million (year one from covenant changes as of May 2011)/USD50 million (year two)/USD25 million thereafter.
Restricted Payments The company will not and will not permit any of its restricted subsidiaries to: 1) declare or pay any dividend other than: a) dividends paid in shares of its common stock, b) dividends paid on a pro rata basis of the holders of such common stock; 2) purchase, redeem, or acquire any capital stock of the company or subsidiaries; 3) purchase, redeem, or retire for value, prior to scheduled maturity, any debt which is subordinated to the notes; 4) make any investments other than permitted investments.
Limitation on Liens The company will not and will not permit any of the restricted subsidiaries to assume any lien (except for permitted ones) upon its property, unless at the same time the obligations under the notes are secured equally.
Transactions with Affiliates The company will not and will not allow its restricted subsidiaries to enter into a transaction with affiliates, unless: 1) the transaction is on terms that are no less favorable than those that would have been obtained in a comparable transaction with a person that is not an affiliate; 2) the company delivers to the trustee: a) for transactions in excess of USD10 million, a resolution from its board of directors, b) for transactions in excess of USD15 million an opinion as to the fairness of that transaction from a financial point of view, issued by an international investment bank.
Sale and Leaseback Transactions The company or its restricted subsidiaries will not enter into any sale and lease back transactions unless pursuant to the provisions of the covenant described under “Limitation on Indebtedness.”
N.A. – Not applicable. Disclaimer: The covenant summaries reflect Fitch’s interpretation and synopsis of information contained in publicly available documents identified in the “Document Date and Location” section of each covenant summary table. Fitch cannot ensure that the information contained in such documents is either accurate or complete, or that the covenant summaries, or any particular covenant summary, accurately or completely reflect the key terms of any such document. The information presented in the covenant summaries is provided “as is” without any representation or warranty and is not a substitute for information provided to investors by an issuer and its agents in connection with a sale of securities. Source: Company and Fitch Ratings.
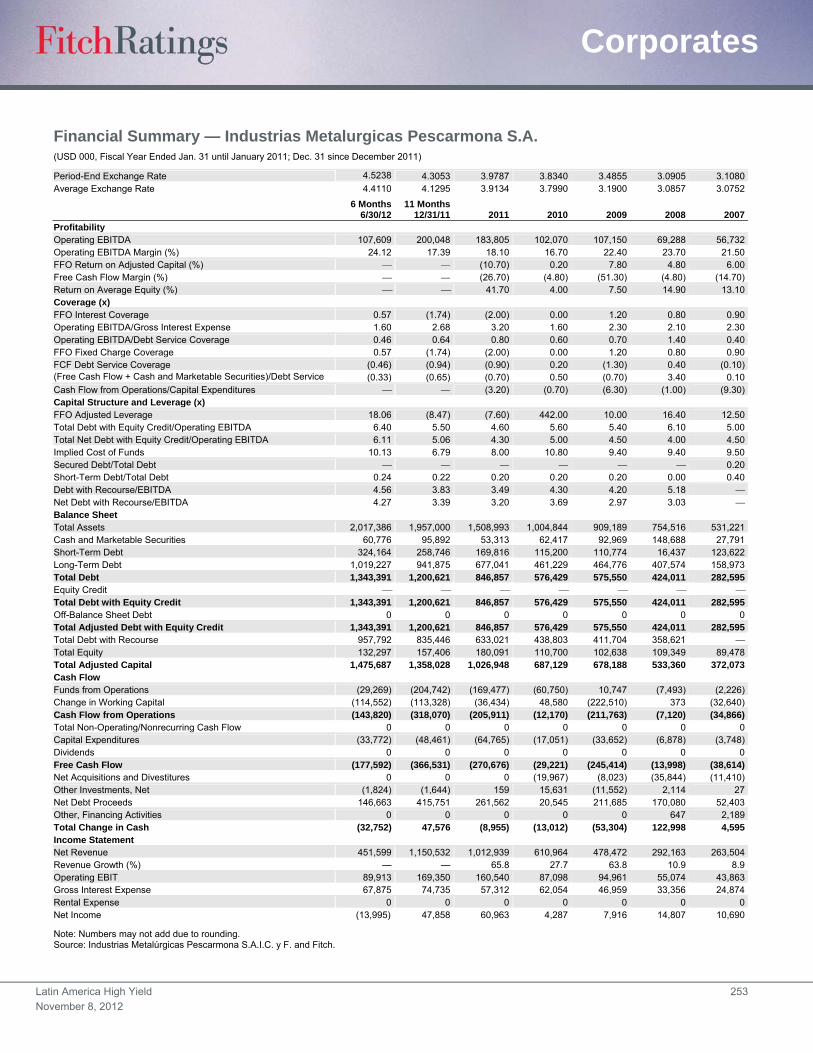
Latin America High Yield 253
November 8, 2012
Corporates
Financial Summary — Industrias Metalurgicas Pescarmona S.A. (USD 000, Fiscal Year Ended Jan. 31 until January 2011; Dec. 31 since December 2011)
Period-End Exchange Rate 4.5238 4.3053 3.9787 3.8340 3.4855 3.0905 3.1080Average Exchange Rate 4.4110 4.1295 3.9134 3.7990 3.1900 3.0857 3.0752
6 Months
6/30/1211 Months
12/31/11 2011 2010 2009 2008 2007Profitability Operating EBITDA 107,609 200,048 183,805 102,070 107,150 69,288 56,732 Operating EBITDA Margin (%) 24.12 17.39 18.10 16.70 22.40 23.70 21.50 FFO Return on Adjusted Capital (%) (10.70) 0.20 7.80 4.80 6.00 Free Cash Flow Margin (%) (26.70) (4.80) (51.30) (4.80) (14.70)Return on Average Equity (%) 41.70 4.00 7.50 14.90 13.10 Coverage (x) FFO Interest Coverage 0.57 (1.74) (2.00) 0.00 1.20 0.80 0.90 Operating EBITDA/Gross Interest Expense 1.60 2.68 3.20 1.60 2.30 2.10 2.30 Operating EBITDA/Debt Service Coverage 0.46 0.64 0.80 0.60 0.70 1.40 0.40 FFO Fixed Charge Coverage 0.57 (1.74) (2.00) 0.00 1.20 0.80 0.90 FCF Debt Service Coverage (0.46) (0.94) (0.90) 0.20 (1.30) 0.40 (0.10)(Free Cash Flow + Cash and Marketable Securities)/Debt Service (0.33) (0.65) (0.70) 0.50 (0.70) 3.40 0.10 Cash Flow from Operations/Capital Expenditures (3.20) (0.70) (6.30) (1.00) (9.30)Capital Structure and Leverage (x) FFO Adjusted Leverage 18.06 (8.47) (7.60) 442.00 10.00 16.40 12.50 Total Debt with Equity Credit/Operating EBITDA 6.40 5.50 4.60 5.60 5.40 6.10 5.00 Total Net Debt with Equity Credit/Operating EBITDA 6.11 5.06 4.30 5.00 4.50 4.00 4.50 Implied Cost of Funds 10.13 6.79 8.00 10.80 9.40 9.40 9.50 Secured Debt/Total Debt 0.20 Short-Term Debt/Total Debt 0.24 0.22 0.20 0.20 0.20 0.00 0.40 Debt with Recourse/EBITDA 4.56 3.83 3.49 4.30 4.20 5.18 Net Debt with Recourse/EBITDA 4.27 3.39 3.20 3.69 2.97 3.03 Balance Sheet Total Assets 2,017,386 1,957,000 1,508,993 1,004,844 909,189 754,516 531,221 Cash and Marketable Securities 60,776 95,892 53,313 62,417 92,969 148,688 27,791 Short-Term Debt 324,164 258,746 169,816 115,200 110,774 16,437 123,622 Long-Term Debt 1,019,227 941,875 677,041 461,229 464,776 407,574 158,973 Total Debt 1,343,391 1,200,621 846,857 576,429 575,550 424,011 282,595 Equity Credit Total Debt with Equity Credit 1,343,391 1,200,621 846,857 576,429 575,550 424,011 282,595 Off-Balance Sheet Debt 0 0 0 0 0 0 0 Total Adjusted Debt with Equity Credit 1,343,391 1,200,621 846,857 576,429 575,550 424,011 282,595 Total Debt with Recourse 957,792 835,446 633,021 438,803 411,704 358,621 Total Equity 132,297 157,406 180,091 110,700 102,638 109,349 89,478 Total Adjusted Capital 1,475,687 1,358,028 1,026,948 687,129 678,188 533,360 372,073 Cash Flow Funds from Operations (29,269) (204,742) (169,477) (60,750) 10,747 (7,493) (2,226)Change in Working Capital (114,552) (113,328) (36,434) 48,580 (222,510) 373 (32,640)Cash Flow from Operations (143,820) (318,070) (205,911) (12,170) (211,763) (7,120) (34,866)Total Non-Operating/Nonrecurring Cash Flow 0 0 0 0 0 0 0 Capital Expenditures (33,772) (48,461) (64,765) (17,051) (33,652) (6,878) (3,748)Dividends 0 0 0 0 0 0 0 Free Cash Flow (177,592) (366,531) (270,676) (29,221) (245,414) (13,998) (38,614)Net Acquisitions and Divestitures 0 0 0 (19,967) (8,023) (35,844) (11,410)Other Investments, Net (1,824) (1,644) 159 15,631 (11,552) 2,114 27 Net Debt Proceeds 146,663 415,751 261,562 20,545 211,685 170,080 52,403 Other, Financing Activities 0 0 0 0 0 647 2,189 Total Change in Cash (32,752) 47,576 (8,955) (13,012) (53,304) 122,998 4,595 Income Statement Net Revenue 451,599 1,150,532 1,012,939 610,964 478,472 292,163 263,504 Revenue Growth (%) — — 65.8 27.7 63.8 10.9 8.9 Operating EBIT 89,913 169,350 160,540 87,098 94,961 55,074 43,863 Gross Interest Expense 67,875 74,735 57,312 62,054 46,959 33,356 24,874 Rental Expense 0 0 0 0 0 0 0 Net Income (13,995) 47,858 60,963 4,287 7,916 14,807 10,690
Note: Numbers may not add due to rounding. Source: Industrias Metalúrgicas Pescarmona S.A.I.C. y F. and Fitch.

Latin America High Yield 254
November 8, 2012
Corporates
Financial Summary Industrias Metalurgicas Pescarmona S.A. (ARS 000, Fiscal Year Ended Jan. 31 until January 2011; Dec. 31 since December 2011)
6 Months 6/30/12
11 Months 12/31/11 2011 2010 2009 2008 2007
Profitability Operating EBITDA 474,664 861.266 719,302 391,337 341,809 213,801 174,461 Operating EBITDA Margin (%) 24.1 17.4 18.1 16.7 22.4 23.7 21.5 FFO Return on Adjusted Capital (%) (10.7) 0.2 7.8 4.8 6.0 Free Cash Flow Margin (%) (26.7) (4.8) (51.3) (4.8) (14.7)Return on Average Equity (%) 41.6 4.2 7.3 14.8 13.0 Coverage (x) FFO Interest Coverage 0.6 (1.7) (2.0) 0 1.2 0.8 0.9 Operating EBITDA/Gross Interest Expense 1.6 2.7 3.2 1.6 2.3 2.1 2.3 Operating EBITDA/Debt Service Coverage 0.5 0.6 0.8 0.6 0.6 1.4 0.4 FFO Fixed Charge Coverage 0.6 (1.7) (2.0) 0 1.2 0.8 0.9 FCF Debt Service Coverage (0.5) (0.9) (0.9) 0.2 (1.2) 0.4 (0.1)(Free Cash Flow + Cash and Marketable Securities)/Debt Service Coverage (0.3) (0.7) (0.7) 0.5 (0.6) 3.4 0.1 Cash Flow from Operations/Capital Expenditures (3.2) (0.7) (6.3) (1.0) (9.3)Capital Structure and Leverage (x) FFO Adjusted Leverage 18.1 (8.5) (7.7) 442.0 10.9 16.4 12.6 Total Debt with Equity Credit/Operating EBITDA 6.4 5.5 4.7 5.6 5.9 6.1 5.0 Total Net Debt with Equity Credit/Operating EBITDA 6.1 5.1 4.0 4.4 5.0 4.9 4.0Implied Cost of Funds 10.1 8.2 7.3 8.0 11.3 9.0 9.4Secured Debt/Total Debt 0.2Short-Term Debt/Total Debt 0.2 0.2 0.2 0.2 0.2 0 0.4Debt with Recourse/EBITDA 4.6 3.8 3.5 4.3 4.2 5.2 Net Debt with Recourse/EBITDA 4.3 3.4 3.2 3.7 3.3 3.0 Balance Sheet Total Assets 9,126,251 8,425,474 6,003,831 3,852,570 3,168,977 2,331,831 1,651,034 Cash and Marketable Securities 274,940 412,844 212,117 239,306 324,043 459,520 86,374 Short-Term Debt 1,466,453 1,113,981 675,646 441,677 386,103 50,798 384,216 Long-Term Debt 4,610,779 4,055,053 2,693,744 1,768,353 1,619,978 1,259,608 494,087 Total Debt 6,077,232 5,169,034 3,369,390 2,210,030 2,006,081 1,310,406 878,303 Equity Credit Total Debt with Equity Credit 6,077,232 5,169,034 3,369,390 2,210,030 2,006,081 1,310,406 878,303 Off-Balance Sheet Debt 0 0 0 0 0 0 0 Total Adjusted Debt with Equity Credit 6,077,232 5,169,034 3,369,390 2,210,030 2,006,081 1,310,406 878,303 Total Debt with Recourse 4,332,860 3,596,846 2,511,827 1,682,369 1,434,996 1,108,319 Total Equity 598,483 677,682 716,528 424,423 357,745 337,944 278,098 Total Adjusted Capital 6,675,715 5,846,716 4,085,918 2,634,453 2,363,826 1,648,350 1,156,401 Cash Flow Funds from Operations (127,564) (881,476) (663,231) (232,915) 34,283 (23,120) (6,846)Change in Working Capital (499,263) (487,910) (142,580) 186,255 (709,806) 1,150 (100,375)Cash Flow from Operations (626,827) (1,369,386) (805,811) (46,660) (675,523) (21,970) (107,221)Total Non-Operating/Non-Recurring Cash Flow 0 0 0 0 0 0 0 Capital Expenditures (147,190) (208,639) (253,452) (65,375) (107,349) (21,224) (11,526)Dividends 0 0 0 0 0 0 0 Free Cash Flow (774,017) (1,578,025) (1,059,263) (112,035) (782,872) (43,194) (118,747)Net Acquisitions and Divestitures 0 0 0 (76,554) (25,592) (110,605) (35,089)Other Investments, Net (7,948) (7,076) 622 59,930 (36,852) 6,524 83 Net Debt Proceeds 639,217 1,789,931 1,023,596 78,770 675,275 524,815 161,151 Net Equity Proceeds 0 0 0 0 0 0 0 Other, Financing Activities 0 0 0 0 0 1,996 6,732 Total Change in Cash (142,748) 204,830 (35,045) (49,889) (170,041) 379,536 14,130 Income Statement Net Revenue 1,968,2479 4,953,384 3,964,037 2,342,436 1,526,327 901,527 810,326 Revenue Growth (%) — — 69.2 53.5 69.3 11.3 14.2Operating EBIT 391,876 729,102 628,256 333,935 302,925 169,943 134,889 Gross Interest Expense 295,827 321,755 224,286 237,915 149,798 102,928 76,492 Rental Expense 0 0 0 0 0 0 0 Net Income (60,995) 206,041 238,573 16,435 25,252 45,691 32,873
Note: Numbers may not add due to rounding. Source: Industrias Metalúrgicas Pescarmona S.A.I.C. y F. and Fitch.
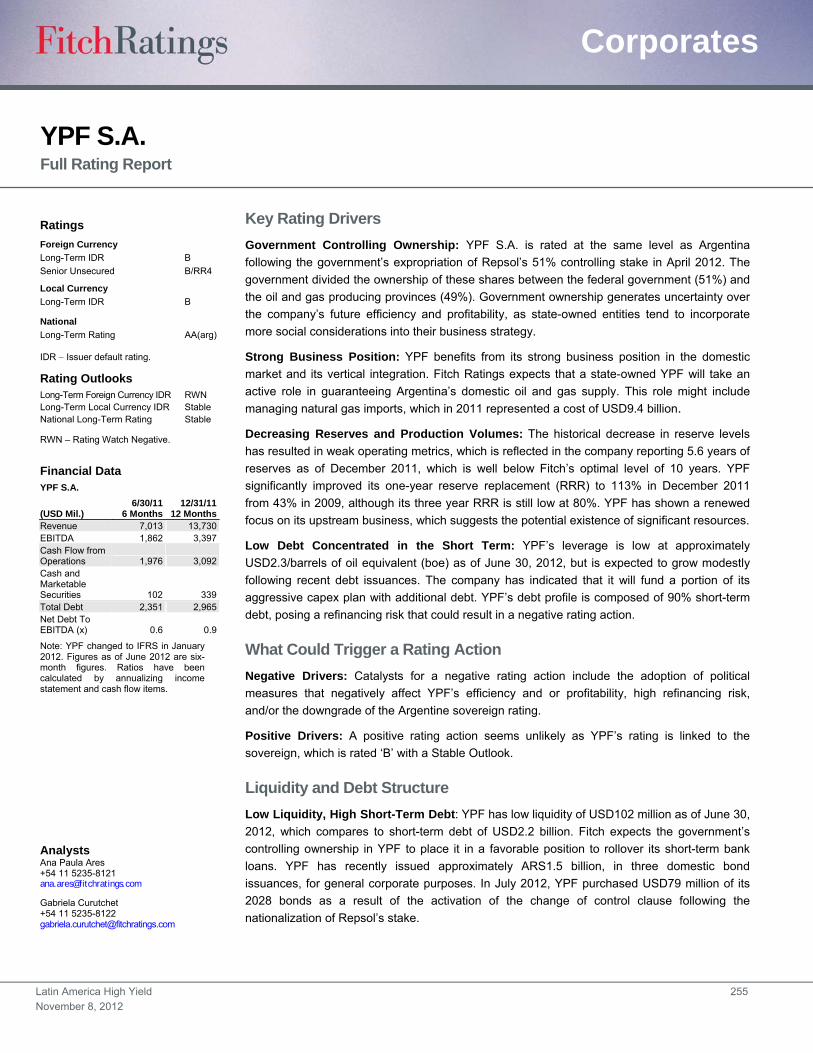
Latin America High Yield 255
November 8, 2012
Corporates
YPF S.A. Full Rating Report
Key Rating Drivers
Government Controlling Ownership: YPF S.A. is rated at the same level as Argentina
following the government’s expropriation of Repsol’s 51% controlling stake in April 2012. The
government divided the ownership of these shares between the federal government (51%) and
the oil and gas producing provinces (49%). Government ownership generates uncertainty over
the company’s future efficiency and profitability, as state-owned entities tend to incorporate
more social considerations into their business strategy.
Strong Business Position: YPF benefits from its strong business position in the domestic
market and its vertical integration. Fitch Ratings expects that a state-owned YPF will take an
active role in guaranteeing Argentina’s domestic oil and gas supply. This role might include
managing natural gas imports, which in 2011 represented a cost of USD9.4 billion.
Decreasing Reserves and Production Volumes: The historical decrease in reserve levels
has resulted in weak operating metrics, which is reflected in the company reporting 5.6 years of
reserves as of December 2011, which is well below Fitch’s optimal level of 10 years. YPF
significantly improved its one-year reserve replacement (RRR) to 113% in December 2011
from 43% in 2009, although its three year RRR is still low at 80%. YPF has shown a renewed
focus on its upstream business, which suggests the potential existence of significant resources.
Low Debt Concentrated in the Short Term: YPF’s leverage is low at approximately
USD2.3/barrels of oil equivalent (boe) as of June 30, 2012, but is expected to grow modestly
following recent debt issuances. The company has indicated that it will fund a portion of its
aggressive capex plan with additional debt. YPF’s debt profile is composed of 90% short-term
debt, posing a refinancing risk that could result in a negative rating action.
What Could Trigger a Rating Action
Negative Drivers: Catalysts for a negative rating action include the adoption of political
measures that negatively affect YPF’s efficiency and or profitability, high refinancing risk,
and/or the downgrade of the Argentine sovereign rating.
Positive Drivers: A positive rating action seems unlikely as YPF’s rating is linked to the
sovereign, which is rated ‘B’ with a Stable Outlook.
Liquidity and Debt Structure
Low Liquidity, High Short-Term Debt: YPF has low liquidity of USD102 million as of June 30,
2012, which compares to short-term debt of USD2.2 billion. Fitch expects the government’s
controlling ownership in YPF to place it in a favorable position to rollover its short-term bank
loans. YPF has recently issued approximately ARS1.5 billion, in three domestic bond
issuances, for general corporate purposes. In July 2012, YPF purchased USD79 million of its
2028 bonds as a result of the activation of the change of control clause following the
nationalization of Repsol’s stake.
Ratings
Foreign Currency
Long-Term IDR B
Senior Unsecured B/RR4
Local Currency
Long-Term IDR B
National
Long-Term Rating AA(arg)
IDR Issuer default rating.
Rating Outlooks Long-Term Foreign Currency IDR RWN Long-Term Local Currency IDR Stable National Long-Term Rating Stable
RWN – Rating Watch Negative.
Financial Data YPF S.A.
(USD Mil.) 6/30/11
6 Months 12/31/11
12 Months Revenue 7,013 13,730 EBITDA 1,862 3,397 Cash Flow from Operations 1,976 3,092 Cash and Marketable Securities 102 339 Total Debt 2,351 2,965 Net Debt To EBITDA (x) 0.6 0.9
Note: YPF changed to IFRS in January 2012. Figures as of June 2012 are six-month figures. Ratios have been calculated by annualizing income statement and cash flow items.
Analysts Ana Paula Ares +54 11 5235-8121 [email protected]
Gabriela Curutchet +54 11 5235-8122 [email protected]
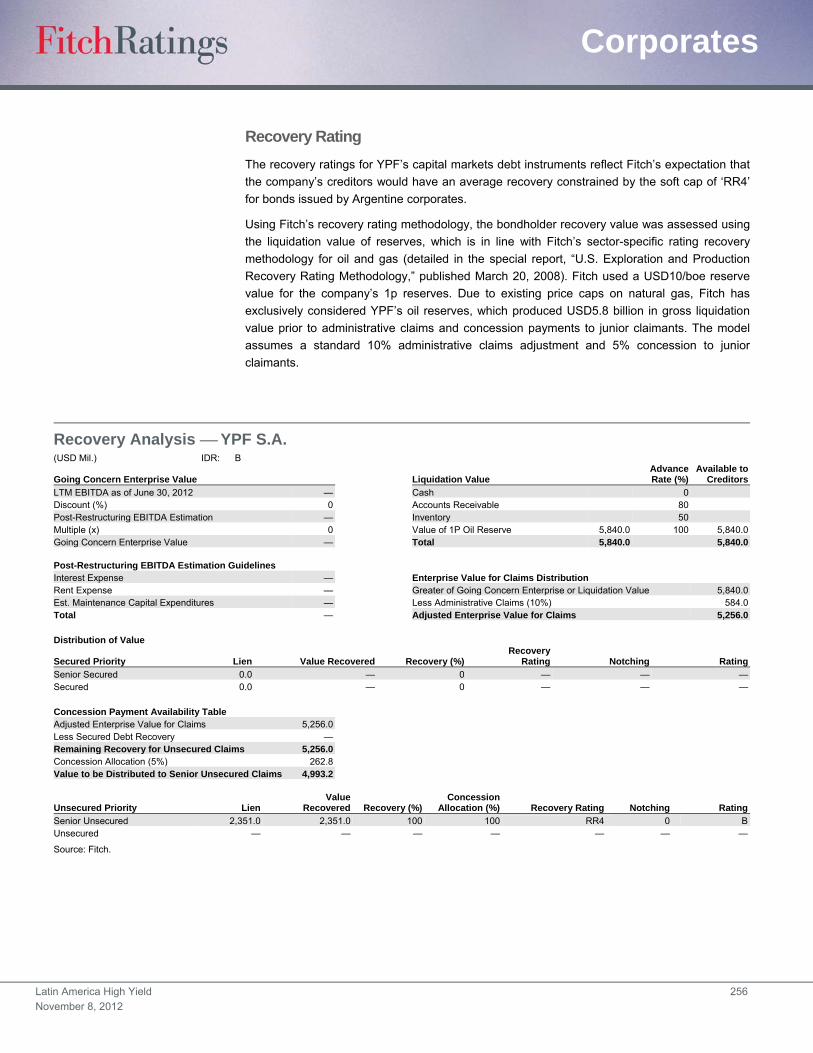
Latin America High Yield 256
November 8, 2012
Corporates
Recovery Rating
The recovery ratings for YPF’s capital markets debt instruments reflect Fitch’s expectation that
the company’s creditors would have an average recovery constrained by the soft cap of ‘RR4’
for bonds issued by Argentine corporates.
Using Fitch’s recovery rating methodology, the bondholder recovery value was assessed using
the liquidation value of reserves, which is in line with Fitch’s sector-specific rating recovery
methodology for oil and gas (detailed in the special report, “U.S. Exploration and Production
Recovery Rating Methodology,” published March 20, 2008). Fitch used a USD10/boe reserve
value for the company’s 1p reserves. Due to existing price caps on natural gas, Fitch has
exclusively considered YPF’s oil reserves, which produced USD5.8 billion in gross liquidation
value prior to administrative claims and concession payments to junior claimants. The model
assumes a standard 10% administrative claims adjustment and 5% concession to junior
claimants.
Recovery Analysis YPF S.A. (USD Mil.) IDR: B
Going Concern Enterprise Value Liquidation Value AdvanceRate (%)
Available toCreditors
LTM EBITDA as of June 30, 2012 — Cash 0Discount (%) 0 Accounts Receivable 80Post-Restructuring EBITDA Estimation — Inventory 50Multiple (x) 0 Value of 1P Oil Reserve 5,840.0 100 5,840.0Going Concern Enterprise Value — Total 5,840.0 5,840.0 Post-Restructuring EBITDA Estimation Guidelines Interest Expense — Enterprise Value for Claims Distribution Rent Expense — Greater of Going Concern Enterprise or Liquidation Value 5,840.0Est. Maintenance Capital Expenditures — Less Administrative Claims (10%) 584.0Total — Adjusted Enterprise Value for Claims 5,256.0 Distribution of Value
Secured Priority Lien Value Recovered Recovery (%)Recovery
Rating Notching Rating
Senior Secured 0.0 — 0 — — —Secured 0.0 — 0 — — — Concession Payment Availability Table Adjusted Enterprise Value for Claims 5,256.0 Less Secured Debt Recovery — Remaining Recovery for Unsecured Claims 5,256.0 Concession Allocation (5%) 262.8 Value to be Distributed to Senior Unsecured Claims 4,993.2
Unsecured Priority Lien Value
Recovered Recovery (%)Concession
Allocation (%) Recovery Rating Notching Rating
Senior Unsecured 2,351.0 2,351.0 100 100 RR4 0 BUnsecured — — — — — — —
Source: Fitch.

Latin America High Yield 257
November 8, 2012
Corporates
Organizational Structure — YPF S.A. (As of June 30, 2012)
Source: Fitch and YPF S.A.
30%
Summary Consolidated Statistics
EBITDA USD1.9 Billion Total Debt USD2.4 BillionTotal Debt/EBITDA 0.6x Net Debt/EBITDA 0.6x
YPF S.A.(Argentina)
Terminales Maritimas Patagonicas S.A.
(Argentina)
A-Evangelista S.A.(Argentina)
Refineria del Norte S.A.(Argentina)
Operadora de Estaciones de Servicios
S.A. (Argentina)
Oleoductos del Valle S.A.
(Argentina)
Profertil S.A. (Argentina)
Oiltanking Ebytem S.A. (Argentina)
Oleoducto Trasandino S.A.
(Argentina)
Gas Argentino S.A.
(Argentina)
Pluspetrol Energy S.A. (Argentina)
Poligas Lujan S.A.C.I.
(Argentina)
YPF Inversora Energetica S.A.
(Argentina)
Metrogas S.A.(Argentina)
Compania Mega S.A.(Argentina)
Gasoducto del Pacifico
(Argentina)
Inversora Dock Sud S.A.
(Argentina)
Central Dock Sud S.A.
(Argentina)
YPF Holdings Inc.
(USA)
YPF International S.A.
(Bolivia)
Oleoducto Trasandino Chile
S.A. (Chile)
50%
99.99%
33.15%
37%
36%
18%
50%99.91%
Metroenergia S.A.
(Argentina)
50.50%
99.99%
45.337%
45%
70%
95%
2.27%
9.98%
10%
38%
69.83%
42.86%
99.99%
100%
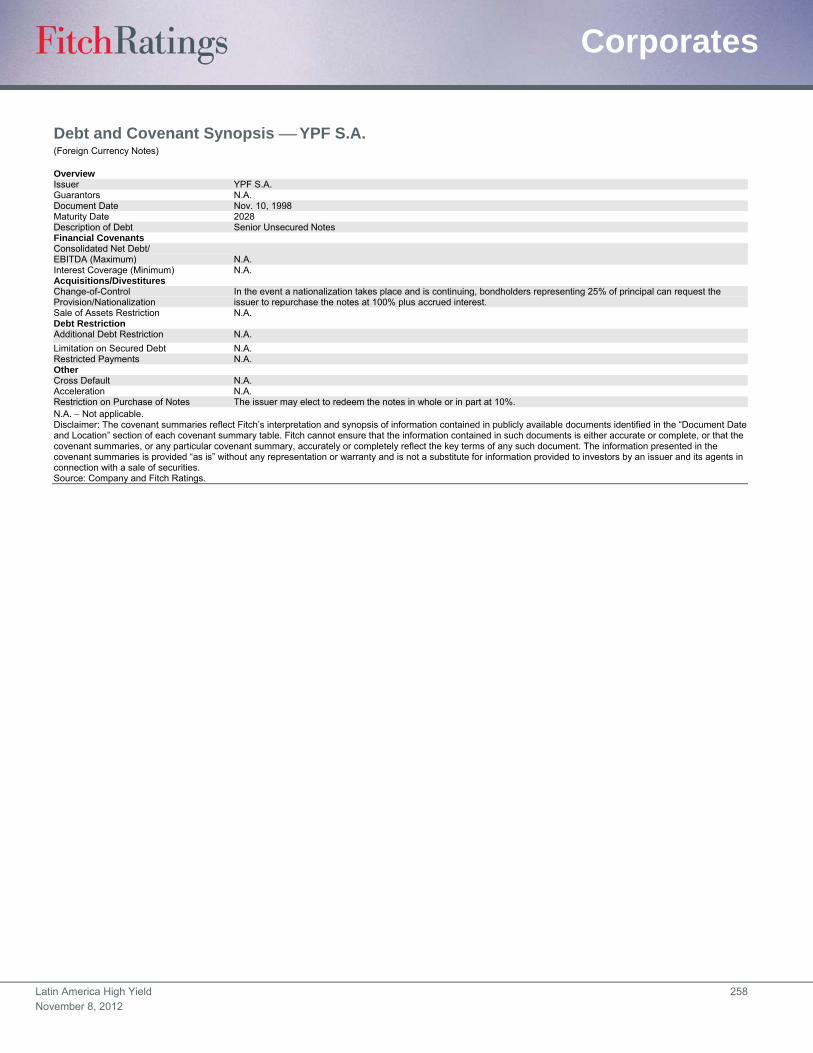
Latin America High Yield 258
November 8, 2012
Corporates
Debt and Covenant Synopsis YPF S.A. (Foreign Currency Notes)
Overview Issuer YPF S.A. Guarantors N.A. Document Date Nov. 10, 1998 Maturity Date 2028 Description of Debt Senior Unsecured Notes Financial Covenants Consolidated Net Debt/ EBITDA (Maximum) N.A. Interest Coverage (Minimum) N.A. Acquisitions/Divestitures Change-of-Control Provision/Nationalization
In the event a nationalization takes place and is continuing, bondholders representing 25% of principal can request the issuer to repurchase the notes at 100% plus accrued interest.
Sale of Assets Restriction N.A. Debt Restriction Additional Debt Restriction N.A.
Limitation on Secured Debt N.A. Restricted Payments N.A. Other Cross Default N.A. Acceleration N.A. Restriction on Purchase of Notes The issuer may elect to redeem the notes in whole or in part at 10%. N.A. Not applicable. Disclaimer: The covenant summaries reflect Fitch’s interpretation and synopsis of information contained in publicly available documents identified in the “Document Date and Location” section of each covenant summary table. Fitch cannot ensure that the information contained in such documents is either accurate or complete, or that the covenant summaries, or any particular covenant summary, accurately or completely reflect the key terms of any such document. The information presented in the covenant summaries is provided “as is” without any representation or warranty and is not a substitute for information provided to investors by an issuer and its agents in connection with a sale of securities. Source: Company and Fitch Ratings.

Latin America High Yield 259
November 8, 2012
Corporates
Financial Summary YPF S.A. (ARS Mil., Years Ended Dec. 31) Period-End Exchange Rate 4.5238 4.3053 3.9787 3.7990 3.4700Average Exchange Rate 4.3012 4.1295 3.9134 3.7279 3.1800
6/30/12a 2011 2010 2009 2008
Profitability
Operating EBITDA 8,167 14,029 14,748 11,831 11,440
Operating EBITDA Margin (%) 26.4 24.7 33.4 34.5 32.8
FFO Return on Adjusted Capital (%) — 42.6 48.7 40.7 51.3
Free Cash Flow Margin (%) — (9.0) (1.0) (3.3) (7.9)
Return on Average Equity (%) — 28.0 30.5 17.8 15.7
Coverage (x)
FFO Interest Coverage 13.7 12.3 14.0 10.9 25.9
Operating EBITDA/Gross Interest Expense 11.9 12.8 15.8 12.3 23.3
Operating EBITDA/Debt Service Coverage 1.4 1.5 2.1 2.1 3.1
FFO Fixed-Charge Coverage 13.7 12.3 14.0 10.9 25.9
FCF Debt Service Coverage 0.4 (0.4) 0.1 — (0.6)
(FCF + Cash and Marketable Securities)/Debt Service Coverage 0.4 (0.3) 0.4 0.4 (0.3)
Cash Flow from Operations/Capital Expenditures 1.2 1.0 1.5 1.7 1.9
Leverage (x)
FFO Adjusted Leverage 0.6 1.0 0.6 0.7 0.4
Total Debt with Equity Credit/Operating EBITDA 0.7 0.9 0.5 0.6 0.4
Total Net Debt with Equity Credit/Operating EBITDA 0.6 0.8 0.4 0.4 0.3
Implied Cost of Funds (%) 12.7 10.7 12.7 17.0 18.0
Secured Debt/Total Debt — — — — —
Short-Term Debt/Total Debt 0.9 0.6 0.8 0.7 0.7
Balance Sheet
Total Assets 66,151 55,399 46,589 40,283 39,079
Cash and Marketable Securities 460 1,461 2,527 2,145 1,216
Short-Term Debt 9,892 8,113 6,176 4,679 3,219
Long-Term Debt 743 4,654 1,613 2,140 1,260
Total Debt 10,635 12,767 7,789 6,819 4,479
Equity Credit — 0 — — —
Total Debt with Equity Credit 10,635 12,767 7,789 6,819 4,479
Off-Balance Sheet Debt 0 0 — — —
Total Adjusted Debt with Equity Credit 10,635 12,767 7,789 6,819 4,479
Total Equity 27,219 18,735 19,040 18,881 20,356
Total Adjusted Capital 37,854 31,502 26,829 25,700 24,835
Cash Flow
Funds from Operations 8,754 12,333 12,123 9,513 12,244
Change in Working Capital (40) 437 603 (99) 1,314
Cash Flow from Operations 8,714 12,770 12,726 9,414 13,558
Total Non-Operating/Nonrecurring Cash Flow 0 0 — — —
Capital Expenditures (7,308) (12,289) (8,729) (5,636) (7,035)
Common Dividends 0 (5,565) (4,444) (4,897) (9,287)
Free Cash Flow 1,406 (5,084) (447) (1,119) (2,764)
Net Acquisitions and Divestitures 0 0 — — —
Other Investments, Net 0 11 105 33 (8)
Net Debt Proceeds (2,058) 3,994 724 2,016 3,140
Net Equity Proceeds — 0 — — —
Other (Investments and Financing) 0 0 — — —
Total Change in Cash (652) (1,079) 382 930 368
Income Statement
Revenue 30,934 56,697 44,162 34,320 34,875
Revenue Growth (%) — 28.4 29 (2) 20
Operating EBIT 4,452 8,563 9,475 6,999 6,665
Gross Interest Expense 688 1,095 931 958 492
Rental Expense — 0 — — —
Net Income 2,127 5,296 5,790 3,486 3,640aJune 30, 2012 six-month figures. Note: 1) YPF changed to IFRS in January 2012. Figures as of June 2012 are six-month figures. Ratios have been calculated by annualizing. 2) Numbers may not add due to rounding. Source: Fitch.

Latin America High Yield 260
November 8, 2012
Corporates
Latin America Corporate Finance Team Directory
United States Fitch Ratings Daniel R. Kastholm Group Head, Latin America Corporates [email protected] +1 312 368-2070 Joe Bormann Basic Industries, Beverage [email protected] +1 312 368-3349 Jose Vertiz Property/Real Estate, Homebuilding [email protected] +1 212 908-0641 Viktoria Krane Food, Beverage & Tobacco, Beverage [email protected] +1 212 908-0367 Lucas Aristizabal Utilities, Energy (Oil & Gas) [email protected] +1 312 368-3260 Jay Djemal Metals & Mining [email protected] +1 312 368-3134 Yolanda Torres Analyst [email protected] +1 312 606-2301 Argentina Fitch Argentina Calificadora de Riesgos S.A. Cecilia Minguillón Sr. Director of Argentinian Corporates, Energy (Oil & Gas), Utilities [email protected] +54 11 5235-8123 Ana Paula Ares Energy (Oil & Gas), Utilities [email protected] +54 11 5235-8121 Gabriela Catri Infrastructure, Building Material, Construction [email protected] +54 11 5235-8129 Fernando Torres Metal & Mining, Building Material & Construction [email protected] +54 11 5235-8124 Juan Martin Berrondo Electric-Corporate [email protected] +54 11 5235-8127 Gabriela Curutchet Associate Director [email protected] +54 11 5235-8100 Brazil Fitch Ratings Brazil Ltda. Ricardo Carvalho Sr. Director of Brazilian Corporates, Utilities [email protected] +55 21 4503-2627 Jose Romero Homebuilding, Building Products [email protected] +55 11 4504-2603 Mauro Storino Telecom & Media, Utilities [email protected] +55 21 4503-2625 Fernanda Rezende Homebuilding, Retail, Pulp & Paper [email protected] +55 11 4504-2618 Renata Maria Pinho Electric-Corporate [email protected] +55 11 4504-2207 Gisele Paolino Transportation, Retail [email protected] +55 21 4503-2624 Débora Jalles Basic Materials, Airlines [email protected] +55 21 4503-2629 Gustavo Mueller Water/Wastewater Utility [email protected] +55 21 4503-2632 Liliana Yabiku Building Materials & Construction [email protected] +55 11 4504-2208 Ingo Bruno Santos de Araujo Transportation [email protected] +55 11 4504-2205 Pedro Carvalho Research Assistant [email protected] +55 21 4503-2602 Central America Fitch Costa Rica Calificadora de Riesgos, S.A. Vanessa Villalobos Utilities, Retail, Building Materials [email protected] +506 2 296-9182 x29 Allan Lewis Electric-Corporate [email protected] +506 2 296-9182 x22 Chile Fitch Chile Clasificadora de Riesgos Limitada Rina Jarufe Sr. Director of Chilean Corporates [email protected] +56 2 499-3310 Alejandra Fernandez Building Materials & Construction [email protected] +56 2 499-3323 Paula Garcia-Uriburu Natural Resources [email protected] +56 2 499-3316 Monica Coeymans Forestry Products, Food & Beverage [email protected] +56 2 499-3314 Francisco Mercadal Food, Beverage, & Tobacco [email protected] +56 2 499-3340 Andrea Jimenez Property/Real Estate, Retailing [email protected] +56 2 499-3322 Jorge Fiegelist Associate Director [email protected] +56 2 499-3341 Valentina Pardo Food, Beverage, & Tobacco [email protected] +56 2 499-3300 Josseline Jenssen Energy (Oil & Gas), Utilities [email protected] +59 12 277-4470 Andrea Rojas Research Assistant [email protected] +56 2 499-3337 Colombia Fitch Ratings Colombia Glaucia Calp Sr. Director of Colombia Corporates, Utilities [email protected] +57 1 326-9999 x1110 Natalia O’Byrne Telecommunications, Retail, Water/Waste Utilities [email protected] +57 1 326-9999 x1100 Maria Pia Medrano Electric-Corporate, Health Care [email protected] +57 1 326-9999 x1130 Jorge Yanes Telecommunications [email protected] +57 1 326-9999 x1170 Julian Robayo Water/Waste Utility [email protected] +57 1 326-9999 x 1120 Mario Irreno Cardenas Water/Waste Utility, Health Care [email protected] +57 1 326-9999 x1002 Andres Ricardo Serrano Health Care [email protected] +57 1 326-9999 x1190 Manuel Solorzano Research Assistant [email protected] +57 1 326-9999 Mexico Fitch Mexico S.A. de C.V.
Alberto Moreno Sr. Director & Co-Head of Mexican Corporates, Diversified Manufacturing, Media [email protected] +52 81 8399-9100 x133
Sergio Rodríguez Sr. Director & Co-Head of Mexican Corporates, Telecom [email protected] +52 81 8399-9100 x135Rogelio Gonzalez Food & Beverage, Auto & Related [email protected] +52 81 8399-9100 x134Miguel Guzman Betancourt Retailing [email protected] +52 81 8399-9100 x 144Indalecio Riojas Garza Natural Gas & Propane [email protected] +52 81 8399-9100 x108Alberto de los Santos Food, Beverage, & Tobacco, Auto & Related [email protected] +52 81 8399-9100 x110Velia Valdez Analyst [email protected] +52 81 8399-9100 x149Venezuela Fitch Venezuela, Sociedad Calificadora de Riesgos, S.A.Julio Ugueto Food, Beverage, & Tobacco, Homebuilding [email protected] +58 212 286-3356
Jose Luis Rivas Telecom, Building Materials, Property & Real Estate, Energy (Oil & Gas) [email protected] +58 212 286-3356
Latin America High Yield 261
November 8, 2012
Corporates
ALL FITCH CREDIT RATINGS ARE SUBJECT TO CERTAIN LIMITATIONS AND DISCLAIMERS. PLEASE READ THESELIMITATIONS AND DISCLAIMERS BY FOLLOWING THIS LINK:HTTP://FITCHRATINGS.COM/UNDERSTANDINGCREDITRATINGS. IN ADDITION, RATING DEFINITIONS AND THETERMS OF USE OF SUCH RATINGS ARE AVAILABLE ON THE AGENCY'S PUBLIC WEB SITE ATWWW.FITCHRATINGS.COM. PUBLISHED RATINGS, CRITERIA, AND METHODOLOGIES ARE AVAILABLE FROMTHIS SITE AT ALL TIMES. FITCH'S CODE OF CONDUCT, CONFIDENTIALITY, CONFLICTS OF INTEREST, AFFILIATEFIREWALL, COMPLIANCE, AND OTHER RELEVANT POLICIES AND PROCEDURES ARE ALSO AVAILABLE FROMTHE CODE OF CONDUCT SECTION OF THIS SITE. Copyright © 2012 by Fitch, Inc., Fitch Ratings Ltd. and its subsidiaries. One State Street Plaza, NY, NY 10004.Telephone: 1-800-753-4824, (212) 908-0500. Fax: (212) 480-4435. Reproduction or retransmission in whole or in part is prohibited exceptby permission. All rights reserved. In issuing and maintaining its ratings, Fitch relies on factual information it receives fromissuers and underwriters and from other sources Fitch believes to be credible. Fitch conducts a reasonable investigation of thefactual information relied upon by it in accordance with its ratings methodology, and obtains reasonable verification of thatinformation from independent sources, to the extent such sources are available for a given security or in a given jurisdiction.The manner of Fitch’s factual investigation and the scope of the third-party verification it obtains will vary depending on thenature of the rated security and its issuer, the requirements and practices in the jurisdiction in which the rated security is offeredand sold and/or the issuer is located, the availability and nature of relevant public information, access to the management of theissuer and its advisers, the availability of pre-existing third-party verifications such as audit reports, agreed-upon proceduresletters, appraisals, actuarial reports, engineering reports, legal opinions and other reports provided by third parties, theavailability of independent and competent third-party verification sources with respect to the particular security or in theparticular jurisdiction of the issuer, and a variety of other factors. Users of Fitch’s ratings should understand that neither anenhanced factual investigation nor any third-party verification can ensure that all of the information Fitch relies on in connectionwith a rating will be accurate and complete. Ultimately, the issuer and its advisers are responsible for the accuracy of theinformation they provide to Fitch and to the market in offering documents and other reports. In issuing its ratings Fitch must relyon the work of experts, including independent auditors with respect to financial statements and attorneys with respect to legaland tax matters. Further, ratings are inherently forward-looking and embody assumptions and predictions about future eventsthat by their nature cannot be verified as facts. As a result, despite any verification of current facts, ratings can be affected byfuture events or conditions that were not anticipated at the time a rating was issued or affirmed. The information in this report is provided “as is” without any representation or warranty of any kind. A Fitch rating is an opinionas to the creditworthiness of a security. This opinion is based on established criteria and methodologies that Fitch iscontinuously evaluating and updating. Therefore, ratings are the collective work product of Fitch and no individual, or group ofindividuals, is solely responsible for a rating. The rating does not address the risk of loss due to risks other than credit risk,unless such risk is specifically mentioned. Fitch is not engaged in the offer or sale of any security. All Fitch reports have sharedauthorship. Individuals identified in a Fitch report were involved in, but are not solely responsible for, the opinions stated therein.The individuals are named for contact purposes only. A report providing a Fitch rating is neither a prospectus nor a substitute forthe information assembled, verified and presented to investors by the issuer and its agents in connection with the sale of thesecurities. Ratings may be changed or withdrawn at anytime for any reason in the sole discretion of Fitch. Fitch does notprovide investment advice of any sort. Ratings are not a recommendation to buy, sell, or hold any security. Ratings do notcomment on the adequacy of market price, the suitability of any security for a particular investor, or the tax-exempt nature ortaxability of payments made in respect to any security. Fitch receives fees from issuers, insurers, guarantors, other obligors,and underwriters for rating securities. Such fees generally vary from US$1,000 to US$750,000 (or the applicable currencyequivalent) per issue. In certain cases, Fitch will rate all or a number of issues issued by a particular issuer, or insured orguaranteed by a particular insurer or guarantor, for a single annual fee. Such fees are expected to vary from US$10,000 toUS$1,500,000 (or the applicable currency equivalent). The assignment, publication, or dissemination of a rating by Fitch shallnot constitute a consent by Fitch to use its name as an expert in connection with any registration statement filed under theUnited States securities laws, the Financial Services and Markets Act of 2000 of the United Kingdom, or the securities laws ofany particular jurisdiction. Due to the relative efficiency of electronic publishing and distribution, Fitch research may be availableto electronic subscribers up to three days earlier than to print subscribers.
New YorkOne State Street PlazaNew York, NY 10004USA+1 212 908 0500+1 800 75 FITCH
London30 North ColonnadeCanary WharfLondon E14 5GNUK+44 20 3530 1000
Fitch GroupFitch Ratings www.fitchratings.comFitch Solutions www.fitchsolutions.com
Corporate Headquarters
Related Documents