Fisheries Research Services (Funder) (2007) Spatially resolved monthly riverine fluxes of oxidised nitrogen (nitrate and nitrite) to the European shelf seas, 1960-2005. [Report] , This version is available at https://strathprints.strath.ac.uk/18588/ Strathprints is designed to allow users to access the research output of the University of Strathclyde. Unless otherwise explicitly stated on the manuscript, Copyright © and Moral Rights for the papers on this site are retained by the individual authors and/or other copyright owners. Please check the manuscript for details of any other licences that may have been applied. You may not engage in further distribution of the material for any profitmaking activities or any commercial gain. You may freely distribute both the url ( https://strathprints.strath.ac.uk/ ) and the content of this paper for research or private study, educational, or not-for-profit purposes without prior permission or charge. Any correspondence concerning this service should be sent to the Strathprints administrator: [email protected] The Strathprints institutional repository (https://strathprints.strath.ac.uk ) is a digital archive of University of Strathclyde research outputs. It has been developed to disseminate open access research outputs, expose data about those outputs, and enable the management and persistent access to Strathclyde's intellectual output.

Welcome message from author
This document is posted to help you gain knowledge. Please leave a comment to let me know what you think about it! Share it to your friends and learn new things together.
Transcript
Fisheries Research Services (Funder) (2007) Spatially resolved monthly
riverine fluxes of oxidised nitrogen (nitrate and nitrite) to the European
shelf seas, 1960-2005. [Report] ,
This version is available at https://strathprints.strath.ac.uk/18588/
Strathprints is designed to allow users to access the research output of the University of
Strathclyde. Unless otherwise explicitly stated on the manuscript, Copyright © and Moral Rights
for the papers on this site are retained by the individual authors and/or other copyright owners.
Please check the manuscript for details of any other licences that may have been applied. You
may not engage in further distribution of the material for any profitmaking activities or any
commercial gain. You may freely distribute both the url (https://strathprints.strath.ac.uk/) and the
content of this paper for research or private study, educational, or not-for-profit purposes without
prior permission or charge.
Any correspondence concerning this service should be sent to the Strathprints administrator:
The Strathprints institutional repository (https://strathprints.strath.ac.uk) is a digital archive of University of Strathclyde research
outputs. It has been developed to disseminate open access research outputs, expose data about those outputs, and enable the
management and persistent access to Strathclyde's intellectual output.
SPATIALLY RESOLV ED MONTHLY RIVERI NE FLUXE S OF OXI DISED NITROGEN (NITRATE AND NITRITE) TO THE EUR OPEAN SHELF SEAS, 1960-2005
M Heath
February 2007
Fisheries Research Services Marine Laboratory Victoria Road Aberdeen AB11 9DB
SPATIALLY RESOLVED MONTHLY RIVERINE FLUXES OF OXIDISED NITROGEN (NITRATE AND NITRITE) TO THE EUROPEAN SHELF SEAS,
1960-2005
February 2007
M Heath
Fisheries Research Services, Marine Laboratory 375 Victoria Road, Aberdeen, AB11 9DB
SUMMARY This report documents the methodology develop ed for statistically modelling the spati al and temporal patterns of oxidised nitrog en (nitrate plus nitrite) riverine fluxes into the coastal waters of northwestern Europe, over the period 1960-2005. The purpose of the study was to provide boundary data for a modelling study of new primary production in European waters. For the UK and Irelan d, monthly freshwater discharges to a set of gr id cells aro und the coastline were modelled from rainfall data and calibrated f rom detailed analyses performed for a subset of years with contrasting climatology. The mean and long-term trends in nitrate and nitrite content of t he river discharges we re modelled from Harmonised Monitoring Scheme data and flux estimates f or each of the years o f contrast ing climateolo gy. Th e product of the discharg e rate and n itrogen content provided estimates of the monthl y flux to each grid cell. Scandinavian inputs of nitrate and nitrite to the North Sea, Skagerrak and Kattega t were assembled from a composite of st atistically modelled freshwater discharge, and recent estimates of nitrogen flux from national monitoring agencies. Fluxes of nitrate and n itrite from the rivers flowing into the North Sea from Germany, Netherlands and Belgiu m during 1960-2005 were assembled from previous analyses by researchers at the University of Hamburg. Nitrate and nitrite fluxes from French rivers flowing into the English Channel, in particular the Seine, were indirectly derived by correlation with the River Scheldt, calibrated from published estimates of annual fluxes. The results show the total oxidised nitrogen inp ut to Europ ean shelf seas increasing fro m approximately 0.6Mt pa. in the 1960’s to 1.2Mt pa. in the mid-1980’s. Recent estimates of the annual f lux since 2000 have been approximately 1.1Mt pa. Around 60-70% of the total annual flux to the northwest European shelf enters via the North Sea. Winter input ra tes are approximately twice those in the summer in all areas except the Skagerrak/Kattegat.

INTRODUCTION The Oslo and Paris Commission for the Protec tion of the marine Environment of t he North-East Atlantic (OSPAR) sets out guidelines for the monit oring and annual reporting of nutrients and other cont aminant fluxes to the se a in Riverine Inputs an d Direct Discharges (RID) (OSPAR 1998). However, the spatial resolution req uired for this reporting is coarse (e.g. North Sea, Atlantic), and an nually integ rated. Such resolution is inadequ ate for establishing external boundary conditions for marine ecosystem modelling initiatives, which typically require a minimum of monthly temporal resolution and some degree of sub-regional spatial resolution. For this purpose it is necessary to revert to the more basic national data. The main problem then is that the accessibility, resolution and extent of these data are highly variable. The North Sea Task F orce modelling group (A nonymous 1992), addre ssed the problem of estimating spatially and temporally resolved nutrient fluxes to the North Sea, and were able to derive values for some of the major rivers for the year 1985. The se were su bsequently extended to daily resolved time series for the period 1977 to 1993 for the major continental European rivers using river flow and nutrient concentration data by Lenhart et al. (1996), and updated to the period 1977 to 19 98 by Lenhart and Pätsch (2001). Pätsch an d Radach (1997) described the application of the European Regional Seas Ecosystem Model (ERSEM; Baretta-Bekker 1995, B aretta-Bekker and Baretta 1997) t o simulating long-term trends in eutrophication status of the North Sea, for whi ch they ext ended the continental European river series back to 1955, and crudely estimated daily inputs to the North Sea from UK rivers flowing into the North Sea. Rece ntly, Pätsch and Lenhart (2004) updated the daily time series for the continental rivers forward to 2002. Heath et al. (2002) expanded the North Sea ERSEM to cover the entire European shelf from northern France to north of the Shetland Isla nds, and west of Ireland to the Skagerrak (referred to as ERSEM model “sc278”; 49°20’ N, 12°00’W; 61°40’N, 11°45’E). The region was discretized to an average spatial resolution of approxi mately 60km with a grid of 278 cells, and the of nutrients from the land estimated for all coastal cells for each of three years of contrasting climatology (1984, 1987 and 199 0). The me thodology for estimating nutrient fluxes varied from regi on to region, depending on the availability of data. For Scotland, England and Wales, de tailed flow a nd nutrient concentration data for in dividual rivers were available for each o f the specified years, and t hese were used together with a GI S-based land use model (Appendix 2) to simu late the daily (monthly for England and Wales) fluxes to every adjoining coasta l cell from t he entire land catchment area, according the OSPAR principles (Appendix 1) f or calculating riverine fluxes. For th e Irish Republic, only lo ng term monthly average flows and annual compositional data could be obtained, whilst for Northern Ireland, year-specific flo w but no c omposition data were available. Out of thes e, it wa s possible to estimate monthly resolution nutrient fluxes to coastal cells only for 1990 . Dai ly fluxes from the major ri vers flowing out of Germany, Neth erland and Belgium we re taken from the da ta sets which were eventually published by Pätsch and L enhart (2004). For Denmark, a crude scaling of fluxes from north ern German rivers was applied, though this resulted in an underest imate. Norwegian mon thly fluxes to the North Sea and Skagerrak cells were crudely estimated from p ublished annual inputs assuming a constant rate of input throughout the year. No estimates could be compiled for inputs from France or Sweden. Here, the objective was to estimate monthly integrated fluxes of oxidised inorganic nitrogen (nitrate + nitrite) to each coastal cell, for all years between 1960 and 2005 rather than simply a few specific years. Even for th e regions b est endowed with acce ssible r iver flow and concentration data (oth er than the major rivers flowing out of German y, Netherlan ds and Belgium), this interval of years far e xceeded the availability of data. He nce, an alte rnative approach was developed, which involved estimating freshwater dischar ge to each coastal cell from a statistical model based on monthly precipitation data. To this was app lied the

mean input per unit freshwater discharge volume over t he years 1984, 1987 and 1990 implied by the data of Heath et al. (2002). This was further adjusted according to a n annual river water concentration anomaly derived from a second statistical model of such monitoring data as existed for the land catchment of each coastal cell.
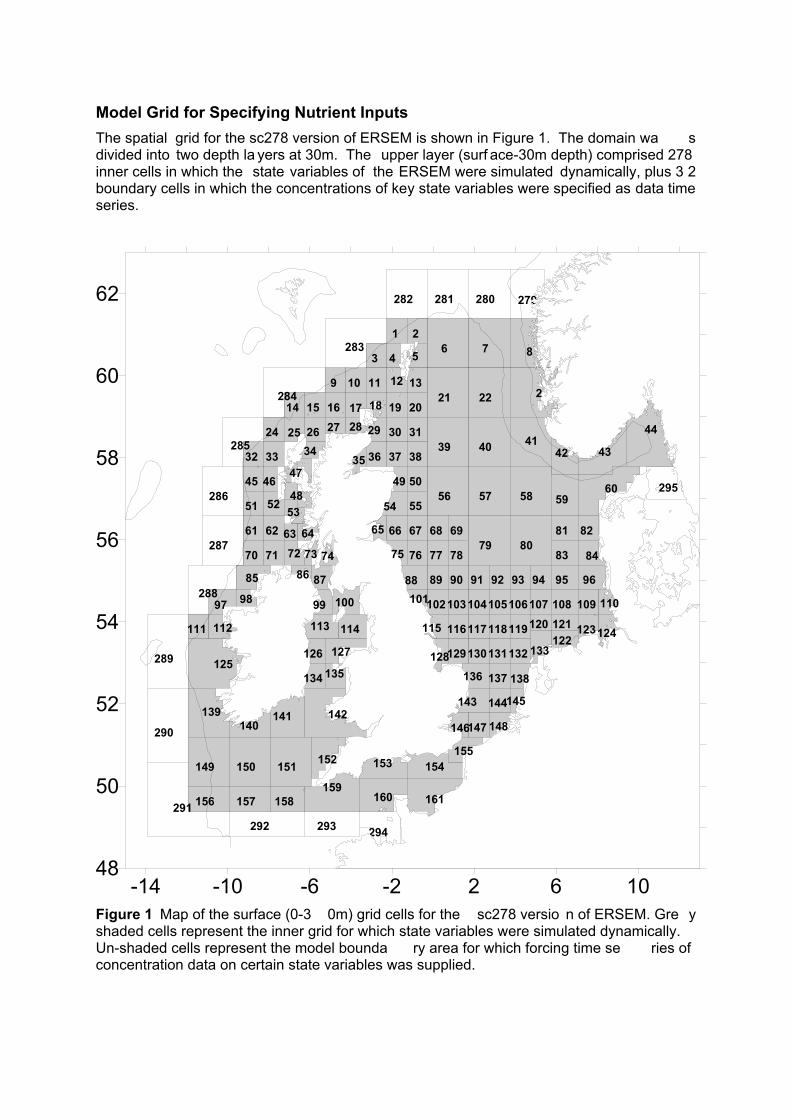
Model Grid for Specifying Nutrient Inputs The spatial grid for the sc278 version of ERSEM is shown in Figure 1. The domain wa s divided into two depth la yers at 30m. The upper layer (surf ace-30m depth) comprised 278 inner cells in which the state variables of the ERSEM were simulated dynamically, plus 3 2 boundary cells in which the concentrations of key state variables were specified as data time series.
-14 -10 -6 -2 2 6 1048
50
52
54
56
58
60
62 279280281282
283
284
285
286
287
288
289
290
291292 293 294
295
1 2
3 4 5 6 7 8
9 10 11 12 13
14 15 16 17 18 19 2021 22 2
24 25 26 27 28 29 30 31
32 33 3435 36 37 38
39 40 4142 43
44
45 4647
4849 50
51 5253 54 55
56 57 58 5960
61 62 63 64 65 66 67 68 69
70 71 72 73 74 75 76 77 7879 80
81 82
83 84
85 86 87 88 89 90 91 92 93 94 95 96
97 98 99 100 101102103104105106107 108 109 110
111 112 113 114 115 116117118119120 121122
123124
125126 127 128129130131132 133
134 135 136 137 138
139140
141 142143 144145
146147 148
149 150 151 152 153 154155
156 157 158159
160 161
Figure 1 Map of the surface (0-3 0m) grid cells for the sc278 versio n of ERSEM. Gre y shaded cells represent the inner grid for which state variables were simulated dynamically. Un-shaded cells represent the model bounda ry area for which forcing time se ries of concentration data on certain state variables was supplied.

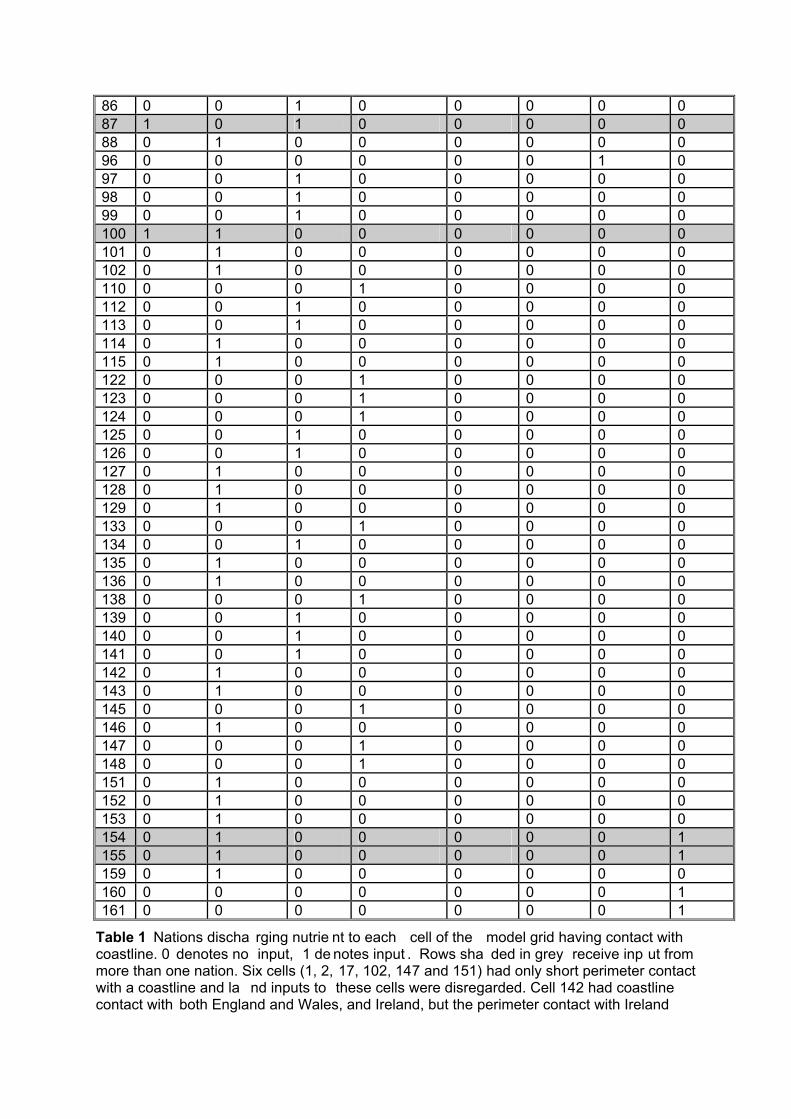
Of the 278 i nner cells of the model, 87 had contact with the coastline , and hence potentially received inputs of nutrient from land runoff and discharges to the sea. Nations contributing to each cell are shown in Figure 2 and Table 1. Note that some cells received input from on e than one nation.
Cell Scotland England & Wales Ireland
Germany, Netherlands & Belgium Norway Sweden Denmark France
1 1 0 0 0 0 0 0 0 2 1 0 0 0 0 0 0 0 4 1 0 0 0 0 0 0 0 5 1 0 0 0 0 0 0 0 8 0 0 0 0 1 0 0 0 12 1 0 0 0 0 0 0 0 13 1 0 0 0 0 0 0 0 17 1 0 0 0 0 0 0 0 18 1 0 0 0 0 0 0 0 23 0 0 0 0 1 0 0 0 25 1 0 0 0 0 0 0 0 26 1 0 0 0 0 0 0 0 27 1 0 0 0 0 0 0 0 28 1 0 0 0 0 0 0 0 29 1 0 0 0 0 0 0 0 33 1 0 0 0 0 0 0 0 34 1 0 0 0 0 0 0 0 35 1 0 0 0 0 0 0 0 36 1 0 0 0 0 0 0 0 37 1 0 0 0 0 0 0 0 41 0 0 0 0 1 0 0 0 42 0 0 0 0 1 0 0 0 43 0 0 0 0 1 0 0 0 44 0 0 0 0 1 1 0 0 46 1 0 0 0 0 0 0 0 47 1 0 0 0 0 0 0 0 48 1 0 0 0 0 0 0 0 49 1 0 0 0 0 0 0 0 52 1 0 0 0 0 0 0 0 53 1 0 0 0 0 0 0 0 54 1 0 0 0 0 0 0 0 60 0 0 0 0 0 0 1 0 64 1 0 0 0 0 0 0 0 65 1 0 0 0 0 0 0 0 71 0 0 1 0 0 0 0 0 72 1 0 1 0 0 0 0 0 73 1 0 0 0 0 0 0 0 74 1 0 0 0 0 0 0 0 75 1 1 0 0 0 0 0 0 82 0 0 0 0 0 0 1 0 84 0 0 0 0 0 0 1 0 85 0 0 1 0 0 0 0 0
86 0 0 1 0 0 0 0 0 87 1 0 1 0 0 0 0 0 88 0 1 0 0 0 0 0 0 96 0 0 0 0 0 0 1 0 97 0 0 1 0 0 0 0 0 98 0 0 1 0 0 0 0 0 99 0 0 1 0 0 0 0 0 100 1 1 0 0 0 0 0 0 101 0 1 0 0 0 0 0 0 102 0 1 0 0 0 0 0 0 110 0 0 0 1 0 0 0 0 112 0 0 1 0 0 0 0 0 113 0 0 1 0 0 0 0 0 114 0 1 0 0 0 0 0 0 115 0 1 0 0 0 0 0 0 122 0 0 0 1 0 0 0 0 123 0 0 0 1 0 0 0 0 124 0 0 0 1 0 0 0 0 125 0 0 1 0 0 0 0 0 126 0 0 1 0 0 0 0 0 127 0 1 0 0 0 0 0 0 128 0 1 0 0 0 0 0 0 129 0 1 0 0 0 0 0 0 133 0 0 0 1 0 0 0 0 134 0 0 1 0 0 0 0 0 135 0 1 0 0 0 0 0 0 136 0 1 0 0 0 0 0 0 138 0 0 0 1 0 0 0 0 139 0 0 1 0 0 0 0 0 140 0 0 1 0 0 0 0 0 141 0 0 1 0 0 0 0 0 142 0 1 0 0 0 0 0 0 143 0 1 0 0 0 0 0 0 145 0 0 0 1 0 0 0 0 146 0 1 0 0 0 0 0 0 147 0 0 0 1 0 0 0 0 148 0 0 0 1 0 0 0 0 151 0 1 0 0 0 0 0 0 152 0 1 0 0 0 0 0 0 153 0 1 0 0 0 0 0 0 154 0 1 0 0 0 0 0 1 155 0 1 0 0 0 0 0 1 159 0 1 0 0 0 0 0 0 160 0 0 0 0 0 0 0 1 161 0 0 0 0 0 0 0 1
Table 1 Nations discha rging nutrie nt to each cell of the model grid having contact with coastline. 0 denotes no input, 1 de notes input . Rows sha ded in grey receive inp ut from more than one nation. Six cells (1, 2, 17, 102, 147 and 151) had only short perimeter contact with a coastline and la nd inputs to these cells were disregarded. Cell 142 had coastline contact with both England and Wales, and Ireland, but the perimeter contact with Ireland

was small and Irish in put to cell 142 was disregarded. A further 3 cells (110, 123) had significant perimeter contact with the coastline, but do data could be located to reso lve any nutrient inputs.
-12 -8 -4 0 4 8 1249
51
53
55
57
59
61 1 2
17
102 110
123
147
151
160
4 5 8
12 13
1823
25 26 27 28 29
33 3435 36 37
4142 43
44
4647
4849
5253 54
60
64 65
71 72 73 74 75
82
84
85 86 87 88 96
97 98 99 100 101
112 113 114 115122 124
125126 127 128129 133
134 135 136 138
139140
141 142143 145
146 148
152 153 154155
159161
Figure 2 Map of the model grid cells having contact with coastline. Data were successfu lly compiled for each of the grey shaded cells. No data could be compiled for the un-shaded cells.

Extension of the Nutrient Load Esti mates for 1984, 1987 an d 1990 fro m Heath et al. (2002) to a Monthly Resolution Time Series, 1960-2005 Monthly ri verine nutrie nt fluxes to coastal cells from Germany, Netherlands and Belgium during 1960-2002 were readily compiled by merging the da ta from 1955-1993 from Pätsch and Radach 1997 (http://www.ifm.un i-hamburg.de/~wwwem/dow/ERSEM/ERSEM.ZIP), and the data from 1977-2002 from Päts ch and Lenhart 200 4 (ftp://ftp.ifm.zmaw.de/pub/data/riverload/). The series was extended to 2005 by su bstituting 1999 data for 2003, 2000 data for 2004 and 2001 data for 2005. By t his means, the inputs to coastal cells 122, 124, 133, 138, 145, 148 were derived. No data on German inputs to cells 110 and 123 could be estimated by this means sin ce none of the rivers include d in the original data sets discharged to these cells. 1960-2005 riverine inputs from all ot her nations required extensive new data analysis. For Scotland, England, Wales, Ireland and Norwa y this analysis involved statistica l modelling of volume discharge and nutrient con centrations. For Swede n, Denmark and France, inputs were derived by scaling Norwegian, German or Belgian inputs according to various data. General Methodology for Statistical Modelling of Long-Term Data Series on Riverine Fluxes to the Coastal Zone The exact d etails of the methodology used to generate monthly resolution data series of riverine fluxes of oxidised nitrogen (nitrate + nitrite) from 1960 onwards, varied between regions de pending on the accessability and quality of the available data from each contributing nation. Th e general a pproach is described below, follow ed by the d etails f or each national data set. General Methodology for Statistical Modelling of Freshwater Discharge to each Coastal Cell Gauged flow data for UK rivers in the NRFA database are sparse prior to the mid-1970’s. Hence, the conventional OSPAR approach for deriving monthly i ntegrated freshwater discharge v olumes from the catch ment of each coasta l cell, was not feasible . I nstead, a General Ad ditive Mode lling (GAM) approach was used to statistica lly derive monthly discharge volumes from monthly precipitation data. For the catchment basin corresponding to each coastal cell, monthly fre shwater discharge data were assembled from variou s sources a nd a GAM fitted with e xplanatory variables being the correspondin g monthly p recipitation data at the monitoring site most appropriate for the catchment, and a cyclical a nnual func tion (cosine) as an analo gue of the seasonal changes in evapo-transpiration and retention of water. The GAM was then used to predict the monthly time series of freshwater discharg e from the 1960-2005 monthly pre cipitation data for the same site. General Methodology for Esti mating Oxidi sed Nitrogen (nitrate+nitrite) Flux from Freshwater Discharge Data For each coastal cell, best est imates of n itrate + nitrite f lux to the coastal zon e were assembled from national assessment reports and other sources. These varied in re solution from annual to daily, but were typica lly for only a few years o ut of the 1960-2005 sequence. For these specific years (referred t o as reference years), the mean input per unit volume of freshwater discharge was estimated, to monthly resolution where possible but often only as an annual average. Th is average input rate (per unit volume) was th en applied to each month in the 1960-2005 series of freshwater discharges f rom the GAM model b ased o n
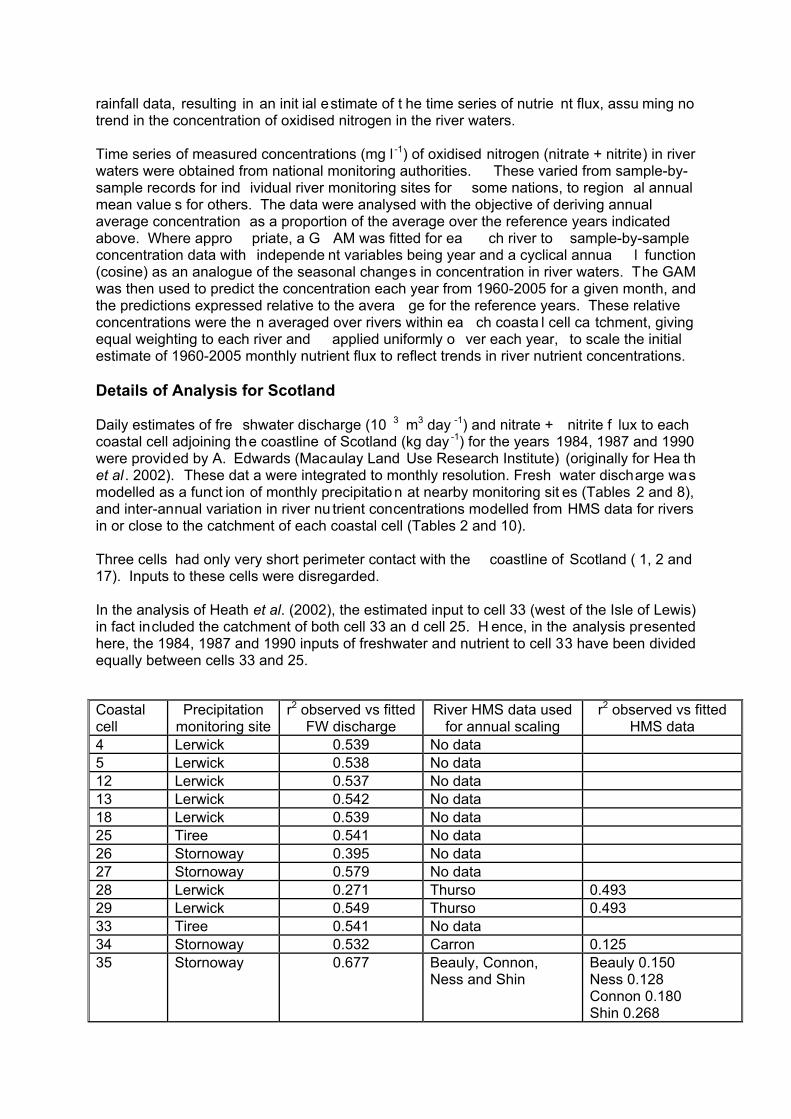
rainfall data, resulting in an init ial estimate of t he time series of nutrie nt flux, assu ming no trend in the concentration of oxidised nitrogen in the river waters. Time series of measured concentrations (mg l -1) of oxidised nitrogen (nitrate + nitrite) in river waters were obtained from national monitoring authorities. These varied from sample-by-sample records for ind ividual river monitoring sites for some nations, to region al annual mean value s for others. The data were analysed with the objective of deriving annual average concentration as a proportion of the average over the reference years indicated above. Where appro priate, a G AM was fitted for ea ch river to sample-by-sample concentration data with independe nt variables being year and a cyclical annua l function (cosine) as an analogue of the seasonal changes in concentration in river waters. The GAM was then used to predict the concentration each year from 1960-2005 for a given month, and the predictions expressed relative to the avera ge for the reference years. These relative concentrations were the n averaged over rivers within ea ch coasta l cell ca tchment, giving equal weighting to each river and applied uniformly o ver each year, to scale the initial estimate of 1960-2005 monthly nutrient flux to reflect trends in river nutrient concentrations. Details of Analysis for Scotland Daily estimates of fre shwater discharge (10 3 m3 day -1) and nitrate + nitrite f lux to each coastal cell adjoining the coastline of Scotland (kg day -1) for the years 1984, 1987 and 1990 were provided by A. Edwards (Macaulay Land Use Research Institute) (originally for Hea th et al . 2002). These dat a were integrated to monthly resolution. Fresh water discharge was modelled as a funct ion of monthly precipitatio n at nearby monitoring sit es (Tables 2 and 8), and inter-annual variation in river nu trient concentrations modelled from HMS data for rivers in or close to the catchment of each coastal cell (Tables 2 and 10). Three cells had only very short perimeter contact with the coastline of Scotland ( 1, 2 and 17). Inputs to these cells were disregarded. In the analysis of Heath et al. (2002), the estimated input to cell 33 (west of the Isle of Lewis) in fact included the catchment of both cell 33 an d cell 25. H ence, in the analysis presented here, the 1984, 1987 and 1990 inputs of freshwater and nutrient to cell 33 have been divided equally between cells 33 and 25. Coastal cell
Precipitation monitoring site
r2 observed vs fitted FW discharge
River HMS data used for annual scaling
r2 observed vs fitted HMS data
4 Lerwick 0.539 No data 5 Lerwick 0.538 No data 12 Lerwick 0.537 No data 13 Lerwick 0.542 No data 18 Lerwick 0.539 No data 25 Tiree 0.541 No data 26 Stornoway 0.395 No data 27 Stornoway 0.579 No data 28 Lerwick 0.271 Thurso 0.493 29 Lerwick 0.549 Thurso 0.493 33 Tiree 0.541 No data 34 Stornoway 0.532 Carron 0.125 35 Stornoway 0.677 Beauly, Connon,
Ness and Shin Beauly 0.150 Ness 0.128 Connon 0.180 Shin 0.268

36 Braemar 0.622 Findhorn, Lossie and
Spey Findhorn 0.088 Lossie 0.074 Spey 0.079
37 Braemar 0.630 Deveron 0.523 46 Tiree 0.540 No data 47 Stornoway 0.709 Carron 0.125 48 Stornoway 0.668 Carron 0.125 49 Braemar 0.667 Don, Ythan Don 0.581
Ythan 0.640 52 Tiree 0.530 No data 53 Tiree 0.530 No data 54 Braemar 0.782 Dee and South Esk Dee 0.351
S. Esk 0.197 64 Tiree 0.48 Lochy 0.184 65 Braemar 0.749 Earn, Eden, Forth,
Leith, Leven and Tay, Earn 0.120 Eden 0.421 Forth 0.441 Leith 0.280 Leven 0.576 Tay 0.139
72 Tiree 0.480 No data 73 Paisley 0.906 No data 74 Paisley 0.870 Clyde, Irvine and
Leven (Clyde) Clyde 0.246 Irvine 0.420 Leven 0.180
75 Paisley 0.572 Eye and Tweed Eye 0.470 Tweed 0.061
87 Paisley 0.759 Ayr 0.238 100 Paisley 0.831 Cree and Esk Cree 0.320
Esk 0.345 Table 2 Coastal cells, r ainfall monitoring sites, and Harmonised Monitoring Scheme (HMS) river water chemistry monitoring sit es used in the statist ical modelling of Scottish nitrogen fluxes. Examples of the relatio nship between modelled nitrate plus nitrite flux to coastal ce lls, and the monthly values estimated by A. Edwards (for Heath et al., 2002) are shown in Figure 3.

Figure 3 Modelled and ‘observed’ fluxes of nitrate + nitrite (kg month-1) for four of the coastal cells aroun d Scotland. ‘Observed ’ values are as estimated by A. Edwards (ML URI) for Heath et al. (2002). Details of Analysis for England and Wales Monthly estimates of fre shwater discharge (10 3 m3 month-1) and nitrate + nitrite f lux to each coastal cell adjoining the coastline of England and Wales ( kg month -1) for the years 1984, 1987 and 1990 were provided by A. Edwards (Macaulay Land Use Research Institute) (originally f or Heath et al . 200 2). Freshwater discharge was modelled as a fu nction of monthly precipitation at nearby mo nitoring sites (Tables 3 and 8). Int erannual variation in river nutrient concentr ations (rela tive to the average for 1984, 198 7 and 199 0) in the catchment of each coastal cell was derived from the regional mean annual nitrat e + nitrite concentrations in the rivers within each of the Water Authority regions in England and Wales (Tables 3 and 10). Two cells h ad only very short perimeter contact with the coastline of England a nd Wales (102 and 151). Inputs to these cells were disregarded. Coastal cell Precipitation
monitoring site r2 observed vs fitted
FW discharge Water authority regional data used for
annual scaling 75 Newtonrigg 0.724 North East
Cell 65 (Forth/Tay plume)
0
1000000
000000
000000
000000
000000
000000
0 12 24 36 48 60 72 84
Months from January 1984
Nitro
gen
flux
kg/m
onth
2
3
4
5
6
Modelled Observed
Cell 74 (Clyde)
0
500000
1000000
1500000
2000000
2500000
0 12 24 36 48 60 72 84
Months from January 1984
Nitro
gen
flux
kg/m
onth
Modelled Observed
Cell 47 (Inner Hebrides)
0
00000
00000
00000
00000
00000
00000
00000
0 12 24 36 48 60 72 84
Months from January 1984
Nitro
gen
flux
kg/m
onth
7
6
5
4
3
2
1
Modelled Observed
Cell 35 (Inverness Firth)
0
200000
400000
600000
800000
1000000
1200000
1400000
1600000
0 12 24 36 48 60 72 84
Months from January 1984
Nitro
gen
flux
kg/m
onth
Modelled Observed
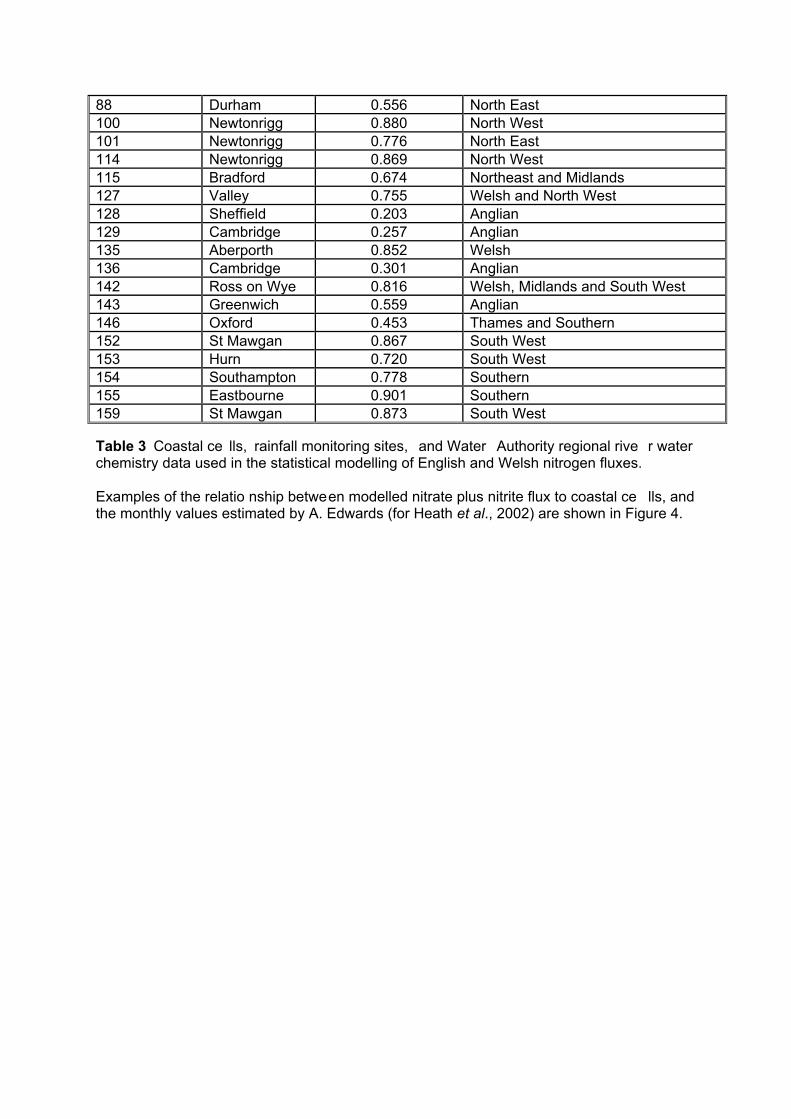
88 Durham 0.556 North East 100 Newtonrigg 0.880 North West 101 Newtonrigg 0.776 North East 114 Newtonrigg 0.869 North West 115 Bradford 0.674 Northeast and Midlands 127 Valley 0.755 Welsh and North West 128 Sheffield 0.203 Anglian 129 Cambridge 0.257 Anglian 135 Aberporth 0.852 Welsh 136 Cambridge 0.301 Anglian 142 Ross on Wye 0.816 Welsh, Midlands and South West 143 Greenwich 0.559 Anglian 146 Oxford 0.453 Thames and Southern 152 St Mawgan 0.867 South West 153 Hurn 0.720 South West 154 Southampton 0.778 Southern 155 Eastbourne 0.901 Southern 159 St Mawgan 0.873 South West Table 3 Coastal ce lls, rainfall monitoring sites, and Water Authority regional rive r water chemistry data used in the statistical modelling of English and Welsh nitrogen fluxes. Examples of the relatio nship between modelled nitrate plus nitrite flux to coastal ce lls, and the monthly values estimated by A. Edwards (for Heath et al., 2002) are shown in Figure 4.
Cell 115 (Humber plume)
0
2000000
4000000
6000000
8000000
10000000
12000000
14000000
0 12 24 36 48 60 72 84
Months from January 1984
Nitr
ogen
flux
kg/
mon
th
Modelled Observed
Cell 128 (Wash)
0
5000000
10000000
15000000
20000000
25000000
30000000
0 12 24 36 48 60 72 84
Months from January 1984
Nitr
ogen
flux
kg/
mon
th
Modelled Observed
Cell 146 (Thames)
0100000020000003000000400000050000006000000700000080000009000000
10000000
0 12 24 36 48 60 72 84
Months from January 1984
Nitr
ogen
flux
kg/
mon
th
Modelled Observed
Cell 142 (Bristol Channel)
0
5000000
10000000
15000000
20000000
25000000
30000000
0 12 24 36 48 60 72 84
Months from January 1984
Nitr
ogen
flux
kg/
mon
th
Modelled Observed
Cell 153 (Solent)
0100000020000003000000400000050000006000000700000080000009000000
10000000
0 12 24 36 48 60 72 84
Months from January 1984
Nitr
ogen
flux
kg/
mon
th
Modelled Observed
Cell 114 (Liverpool Bay)
0500000
10000001500000200000025000003000000350000040000004500000
0 12 24 36 48 60 72 84
Months from January 1984
Nitro
gen
flux
kg/m
onth
Modelled Observed
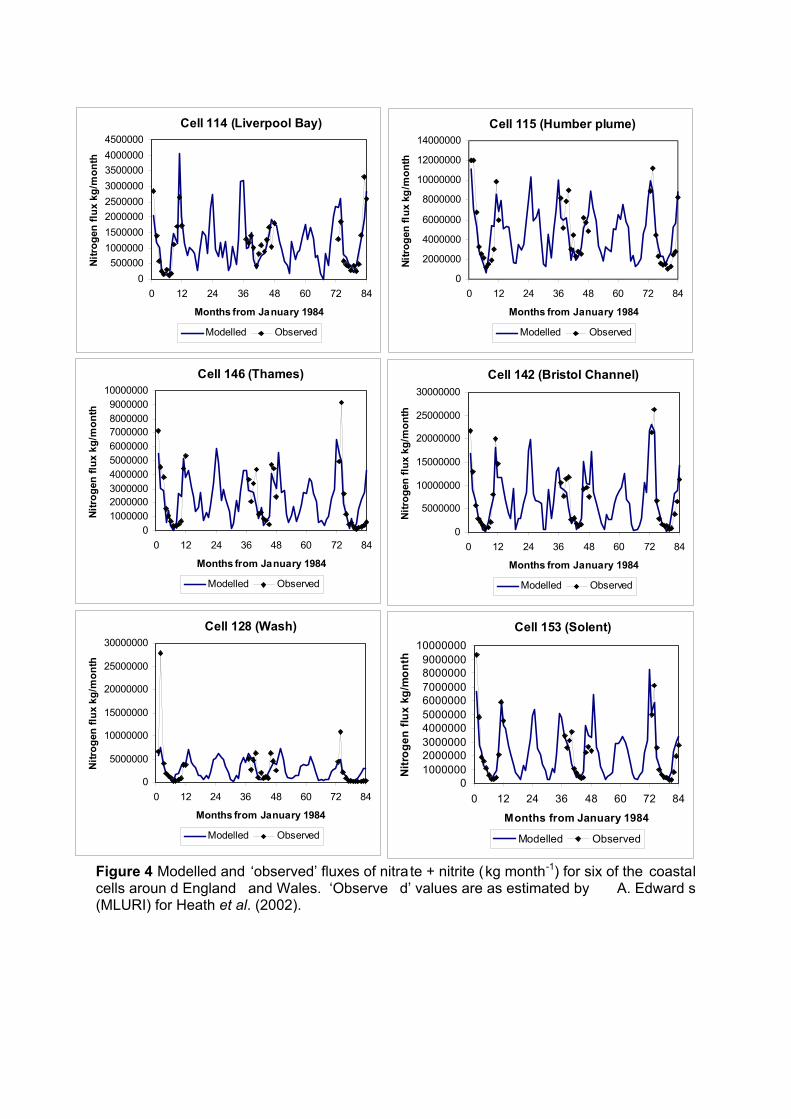
Figure 4 Modelled and ‘observed’ fluxes of nitra te + nitrite (kg month-1) for six of the coastal cells aroun d England and Wales. ‘Observe d’ values are as estimated by A. Edward s (MLURI) for Heath et al. (2002).

Details of Analysis for Northern Ireland and the Irish Republic Monthly estimates of fre shwater discharge (10 3 m3 month-1) and nitrate + nitrite f lux to each coastal cell adjoining the coastline of Northern Ireland and the Irish Republic (kg month-1) for 1990 were provided by A. Edward s (Macaulay Land Use Research Institute) (orig inally for Heath et al. 2002). 1961-1990 monthly a verage precipitation, but no year-b y-year monthly data, for the Irish Republic were available from the Irish Met eorological Service (Table 10) . These dat a were correlated with the equivalent monthly averages f or Armagh and for Cardiff and St Mawgan in southwest Britain, and for the Northern Ireland regional average precipitation derived from a model at the Hadley Centre. The results showed that precipitation data for Armagh, St Mawgan and the Northern Ireland region, probably represented reasonable surrogates for the time series of precip itation at Irish Republic sites (Table 4). Freshwater dischar ge was therefore modelled as a function of monthly precipitation at Armagh, St Mawgan as over the Northern Ireland region as appropriate for each catchment. NI-regional Armagh Cardiff St MawganBelmullet 0.986 0.910 0.939 0.930 Birr 0.897 0.949 0.746 0.739 Casement 0.807 0.877 0.684 0.688 Claremorris 0.990 0.939 0.924 0.921 Clones 0.970 0.977 0.846 0.836 Cork 0.865 0.755 0.897 0.907 Dublin 0.857 0.910 0.726 0.724 Kilkenny 0.949 0.900 0.894 0.895 Malin 0.973 0.896 0.922 0.903 Mullingar 0.971 0.961 0.870 0.862 Rosslare 0.940 0.856 0.958 0.970 Shannon 0.972 0.909 0.954 0.951 Valentia 0.959 0.855 0.965 0.966
Table 4 C orrelation coefficient s between the series of 1961-1990 monthly average precipitation (mm month-1) at monitoring sites in the Irish Republic (rows) and various data sets for Northern Ireland and southwest Britain (colums). Shaded cells indicate the maximum value in each row. Data on riverine nutrie nt concentr ations in N orthern Ireland and th e Irish Rep ublic were scant. No data collected by the competent monitoring authority in Northern Ireland could be located, but data from 3 rivers in the region collected by the Cen tre for Ecology an d Hydrology, Lancaster, from 1995 – 2003 were found to be available (Table 12). Similarly, for the Irish Republic, sam pling data could not be located, bu t graphs of variations in annual average nitrate concent ration between 1981 and 2002 in the major rive rs of south-eastern Ireland were found in an assessment report, and digitised (Table 12). Annual mean data for each southeastern Irish river were fi rst scaled relative to 1990, and then averaged for each year, giving equal weighting to each river. The annual mean data for each North ern Irish river were scaled relative to 1995, and then averaged for each year (Table 5). Based on these data, relative (to 1990) nutrient concentrations in southeastern Ireland were assumed constant fro m 1960-1981 and fro m 2002-2005, and to vary according to the reported data for the p eriod 1981-2002. In Northern Irish rivers, the relative (to 1990) nutrient concentration was assumed to be as in southeastern Irish rivers from 1960 t o 1995. From 1995 onwards, t he concentr ation relativ e to 1995 was further scaled by the ratio 1995:1990 relative concentration in southeastern Irish rivers.

For coastal cells adjoining the west coat of the Irish Republic there were no riverine nutrient concentration data available. In the absence of information it was assu med that th ere was no trend in these catchments. Cell 142 ha d a short p erimeter contact with t he coastline of the Irish Republic, but input across this boundary was disregarded since no major rivers discharged into the celll. Coastal cell Precipitation monitoring site R2 observed vs
fitted FW discharge River nutrient data used for
annual scaling 71 Northern Ireland regional 0.822 Bush, Garvery, Faughan 72 Northern Ireland regional 0.822 Bush, Garvery, Faughan 85 Northern Ireland regional 0.822 Bush, Garvery, Faughan 86 Northern Ireland regional 0.822 Bush, Garvery, Faughan 87 Northern Ireland regional 0.822 Bush, Garvery, Faughan 97 Northern Ireland regional 0.822 No data 98 Northern Ireland regional 0.822 No data 99 Armagh 0.815 Bush, Garvery, Faughan
112 Northern Ireland regional 0.822 No data 113 Armagh 0.815 Bush, Garvery, Faughan 125 Northern Ireland regional 0.822 Barrow, Nore, Slaney, Suir 126 Armagh 0.815 Barrow, Nore, Slaney, Suir 134 St Mawgan 0.801 Barrow, Nore, Slaney, Suir 139 St Mawgan 0.801 No data 140 St Mawgan 0.801 Barrow, Nore, Slaney, Suir 141 St Mawgan 0.801 Barrow, Nore, Slaney, Suir
Table 5 Coastal cells, r ainfall monitoring data, and river water chemistry data used in the statistical modelling of nitrogen fluxes from Northern Ireland and the Irish Republic. Examples of the relatio nship between modelled nitrate plus nitrite flux to coastal ce lls, and the monthly values estimated by A. Edwards (for Heath et al., 2002) are shown in Figure 5.

Figure 5 Modelled and ‘observed’ fluxes of nitrate + nitrite (kg month-1) for four of the coastal cells around Northern Ireland and the Irish Republic. ‘Obser ved’ values are as estimated by A. Edwards (MLURI) for Heath et al. (2002).
Cell 113 (Dublin Bay)
0
200000
400000
600000
800000
1000000
1200000
1400000
0 12 24 36 48 60 72 84
Months from January 1984
Nitr
ogen
flux
kg/
mon
th
Modelled Observed
Cell 125 (Western Ireland)
0500000
100000015000002000000250000030000003500000400000045000005000000
0 12 24 36 48 60 72 84
Months from January 1984
Nitr
ogen
flux
kg/
mon
th
Modelled Observed
Cell 71 (Malin Head)
0
200000
400000
600000
800000
1000000
1200000
0 12 24 36 48 60 72 84
Months from January 1984
Nitr
ogen
flux
kg/
mon
th
Modelled Observed
Cell 141 (Cork)
0
1000000
2000000
3000000
4000000
5000000
6000000
7000000
0 12 24 36 48 60 72 84
Months from January 1984
Nitr
ogen
flux
kg/
mon
th
Modelled Observed
Details of Analysis for Norway Area-averaged monthly rainfall data for three regions in southern Norway were o btained from the Norwegian Meteorologica l Institute ( Table 10). The runoff from these areas contributed to 6 coasta l cells, forming two of the coastal regions defined by No wegian authorities for discharge assessments (North Sea: Lindesnes-Stad, and Skagerrak: Swedish border-Lindesnes) (Table 11). Seven majo r monitored rivers flow into the Nor th Sea and Skagerrak assessment regions (North Sea: Orreelva a nd Suldalslagen, Skagerrak: Otra, Skienselva, Numedals laagen, Drammenselva and Glomma (Table 11). However, the Orreelva and Suldalslagen are small and make up only a small fraction o f the total freshwater discharge to the North Se a region, whilst the other 5 rivers contribute most of the discharge to the Skagerrak. Average monthly freshwater dischar ge rates we re available only for the rivers flo wing into the Skagerrak. Data for the Otra river were us ed as a surr ogate for the seasonal pattern of discharge fr om the catchment of the North Sea cells. A GAM was fitted to the average monthly rive r discharge data based on the average mont hly rainfall in the corresponding monitoring area (Table 6). The fitted GAM was then used to predict an index of the monthly freshwater discharge to each coastal cell from 1960-2005. This index was raised to the total discharge ( 103 m3 mon th-1) by reference to th e mean annual total r unoff to ea ch of th e coastal assessment regions (Weideborg et al., 2001).

Norwegian assessments of annual nitrate + nitrite flux to ea ch coastal assessment region in 2004 (Borgvang et al ., 2006; Table 13) were apportioned to coastal cells, and the average annual inpu t rate (kg ( 103 m3)-1) derived by reference to the sum o ver 2004 of the total freshwater discharge volume to c orresponding cells predicted from the GAM. Nitrogen concentrations in samples collected at monitori ng sites along each of the major rivers were reported to show no significant tre nd over the period 1990-2004 (Borgvang et al ., 2006; Table 12), so the rate of nitrate + nit rite input per unit volu me of discharge was assumed to be constant over the period 1960-2005, and no year-specific scaling was applied (Table 6).
Coastal cell
Norwegian coastal region
containing each cell
Precipitation monitoring
area draining into coastal cell
River used to represent
seasonality of FW discharge
r2 observed vs fitted
FW discharge
Proportion of inputs to Norwegian
coastal region
entering via each
cell
Factor to raise river
FW discharge
to total entering coastal
cell
2004 NOx input to cell (t yr-1)
8 North Sea Vestlandet Otra 0.813 0.33 11.85 3833 23 North Sea Vestlandet Otra 0.813 0.34 12.21 3949 41 North Sea Vestlandet Otra 0.813 0.17 5.93 1916 42 North Sea Vestlandet Otra 0.813 0.17 5.93 1916 43 Skagerrak Agder Otra 0.589 0.10 1.23 1829 44 Skagerrak Austlandet Skienselva
Numedalslaagen Drammenselva Glomma
0.766 0.90 1.23 16922
Table 6 Coastal ce lls and regio ns, rainfall monitoring regions, and river data used to estimate Norwegian riverine fluxes of oxidised nitrogen. Details of Analysis for Sweden Sweden contributed to coastal cell 44 of the m odel area, a long with N orway. To estimate the monthly 1960-2005 Swedish input of nitrate and nitrite to coastal cell 44, it was assumed that the tre nd and sea sonality were related to the Norwegian input. A linear re gression relationship was theref ore established, expre ssing the an nual Swedish flux (sca led from Swedish authority estimated of total nitrogen flu x to the Ska gerrak and Kattegat combined; Table 13), in terms of t he correspo nding annu al integral o f the estimated Norwegian flux (Swedish annual flux = -9543.48 + 0.5965 * Norwegian annual flux (t yr-1), r2 = 0. 46). The fitted annual Swedish flux was then expressed as a year-specific ratio Swedish:Norwegian flux, which was applied uniformly over each year of the monthly 1960-2005 time series o f Norwegian fluxes. Swedish authorities have reported annual total nitrogen fluxes to the Skagerrak and Kattegat combined from 1969-2001 (Table 1 3). 33% of this was est imated to be input to co astal cell 44, based on the approximate rel ative coastline length. Based on sample-by-sample analysis of water samples from the major Swe dish rivers f lowing into the Skagerrak and Kattegat (Table 12), th e proportion of total nitr ogen represented by nitrate and nit rite was 54%.

Details of Analysis for Germany, Netherlands and Belgium Nine coast al cells were located adjacent to the North Sea coastlines of G ermany, Netherlands and Belgium. Major rivers flow into 6 of these, and daily nutrient fluxes for 1955-1993 were available from Pätsch a nd Radach (1997), and for 1977-2 002 from Pätsch and Lenhart (2004). These data sets were blended together to produce a monthly resolution series from 1960-2002. The rivers discharging to each coastal cell in the two data sets are shown in T able 7. Th e concordance between the two sets was che cked for ea ch cell by comparing the sum for all contribu ting rivers averaged over the commo n period 1977-1993. This factor, which in all cases was between 0.98 and 1.05, was applied to the 19 55-1993 data set to achieve matching with the more recent series. The data were combined by assuming values from the 1955-1993 series between January 1960 and December 1976, and from the more recent series therafter. The combined series were extended to Dece mber 2005, by substituting 1999 dat a for 2003, 2000 data f or 2004, and 2001 data for 2005. Coastal cell Rivers in the 1955-1993
dataset of Pätsch and Radach 1997Rivers in the 1977-2002
dataset of Pätsch and Lenhart 2004 110 none none 122 Ems Ems 123 none none 124 Elbe, Weser, Jade Elbe, Weser 133 Lysselo, Lysselw, Lauer Ijssel 138 Ijmuiden Nordzeekanaal 145 Rhine, Meuse Nieuwewaterweg, Haringvlet 147 none none 148 Scheldt, Yzer Scheldt
Table 7 Co astal cells, and corresp onding rivers in two da ta sets of n utrient fluxe s from Germany, Netherlands and Belgium. Details of Analysis for Denmark Estimating nutrient fluxes from Denmark was p roblematic. There are few major waterwa ys draining the land catchment and the inputs are diffuse. Th e approach used for the UK and Norway was not possible due to inaccessibility of data. In stead, fluxes were estimated by correlating such data as could be located with the time series from a nearby catchment. Pätsch and Radach (1997) crudely estimated the annual nu trient inputs from all land-based sources to t he equivalent of coasta l cell 82 in the current g rid setup for the years 1955 to 1993, but were unable to estimate t he seasonal variations, and assumed a linear change in daily input between years. Correlation between the crude estimate of mo nthly flux of nitrate + nit rite from Denmark to cell 82 (Pät sch and Radach, 1997) and the compiled mo nthly fluxes from Germany to coastal cell 124, which is close st to the Danish-German bo rder, was r 2 = 0.3 . A linear regression predicting Danish flux in terms of German flux to cell 124 was: Danish flux to cell 82 = 28194 + 0.00123* German flux to cell 124 (kg month-1). This approach provided some crude basis for establishing a trend and seasonality for Danish nitrate + nitrite fluxes, but not the absolute level of input. The Danish Environmental Protection Agency (DMU) has p ublished annual estimates of the total flux of dissolved inorganic nit rogen from river, diffuse and point sources to coastal
waters, for the years 1989 to 2 001 (Table 13). For 2001, the total input has been apportioned between various sea areas (24% of total to the North Sea, and 3% to the Skagerrak. Pätsch and Radach (1997) estimated nitrate + nitrite to constituted 36% of the total inorganic nitrogen input from Denmark. To establish the absolute level of input to each of the coastal cells in t he model grid, it was assumed that the Danish nutrient flux to th e North Sea was distribu ted equally across 3 coastal cells o f the model (82, 94 and 96), and the Skagerrak input to cell 60. Comparing the crude estimate of ann ual Danish flux to cell 82 for the years 1989-2001, derived by scaling t he German flux to cell 124, with th e independent values fro m DMU, indicated a scaling factor of 5.218 t o convert t he crude estimate to a realistic le vel for that cell. The re sulting time series of an nual scaled values was highly correlated with the independent estimates from the DMU (r2 = 0.58, for the period 1994-2001 (0.26 for the period 1989-2001)). In 2001, the ratio of Danish nitroge n flux to the Skagerrak relative to that for the North Se a was 0.131: 1. Assumin g that this ratio remained constant over time, the scaling factor t o estimate flux to the Skagerrak (cell 60) from the crude estimate to cell 82 was 2.057. Details of Analysis for France Four coasta l cells o f the model ha d French coastline boundaries (ce lls 160, 161, 154 and 155). Of these, the ma jor input is to cell 161 which receives material from the River Seine and various other smaller rivers. H owever, details of freshwater and n utrient inputs to the coastal zone from France are extremely scarce. Annual data reports to OSPAR on Riverine Inputs and Direct Discharges often contain no information from France (e.g. OSPAR 2004a). No raw data on monthly rainfall, river discharge, river nutrient conce ntrations or monthly inputs to the coastal zone could be located. Ho wever, various pu blications provided information which allowed a correlative approa ch to be de veloped, similar to that used to estimate Danish input s. The appr oach conce ntrated on r esolving the flux from the Rive r Seine, this being the largest discharg e on the region, and relating fluxes to other cells to the Seine input. Lacroix et al. (2004) showed plots of daily flow r ates for various contin ental European rivers including th e Seine. T here was a clear corre lation betwe en the flow of the Seine and Scheldt rivers, which h ave similar catchments. The a im was therefo re to derive a sca ling factor for estimating the nitrate + nitrite flux from the Seine, based on that from the Scheldt. The average flow rate o f the Scheldt during 1977-2002, according to the data of Pätsch and Lenhart (2004), was 137.16 m3 s-1, whilst Cugier et al. (2005) quote the mean flow rate of the Seine to be 450 m 3 s-1. Hence, a scaling factor of 3.281 was applied to the monthly freshwater discharge of the Scheldt to estimate the discharge of the Seine. For comparison, Aminot et al. (1998) quoted the discharge of the Seine to be 348, 408 and 669 m3 s-1 (mean 475 m 3 s-1) in the years 1992, 1993 and 1994 r espectively. The corre sponding estimates from rescaling the River Scheldt flow rate were 443, 486 and 557 m3 s-1, (mean 495 m3 s-1). The annual average input of nitrate + nitrite per unit volume of freshwater discharge from the Scheldt (kg (103 m3)-1) was calculated for the y ears 1977-2002 from the data of Pätsch and Lenhart (2004). The equivalent rate for the Seine was calculated from data presented by Aminot et al (1997) on the annual flux of nitrate + nitrite fro m the River Seine (t yr-1) between 1976 and 1994, and the corresp onding volume dischar ges derived as above. These indicated th at, over th e period 1 977-1994, t he oxidised nitrogen content of t he Seine discharge (kg (10 3 m3)-1) was higher than that of the Scheldt by an average factor (r eferred to as the Seine:Scheldt concentration ratio) of 1.32 (maxi mum 2.20 in 1 978, minimum 0.91 in 1993).
Further information on o xidised nitrogen concent rations in the River Seine were located at the Centre d’Enseignement dt de Recherche Eau Ville Environment, in a document by M Poulin (2001) ( http://www.enpc.fr/cereve/HomePages/thevenot/piren-models.pdf) relating to the PIREN project on ecological modelling of the Seine (Chesterikov et al 1998). Annual average nitrate concen trations (mg l -1) in the Seine during the years 1901-1 992 were digitised from the diagram on p31. During the period of overlap with the Aminot et al. (1997) the concent ration from the Poulin data was inversely correlated with the Seine:Scheldt concentration ratio (r = -0.65). In ot her words, despite the increasing nitrate concen trations in Seine river waters since 1960, concentration in the Scheldt must have been in creasing more quickly, so that the Seine:Scheldt ratio declined. Based on the correlat ion with S eine river nitrate con centrations, estimates of the Seine:Scheldt concentration ratio were derived for the period 1960 to 1976 and 1995-1996 by linear regression (Seine:Scheldt r atio = 2.336 – 0.064 * Seine nitrate concentration). For the years 1 977-1994, the values d erived directly from the data of Aminot et al (1997) were used. For the period 1 997-2005, values were randomly assigned in a range between the minimum and maximum values during the years 1991-1996. Finally, the annual scaling factor to estimate nitrate+nit rite flux fro m the River Seine t o coastal cell 161 from the flux by the River Scheldt to coastal cell 148, was the product of the freshwater volume scaling factor (3.281) and th e year-specific Seine:Scheldt conce ntration ratio. Th is factor was applied equ ally to the monthly Scheldt fluxes for each year in th e 1960-2005 series. A number o f smaller rivers also flo w into the Bay of the Seine (cell 161) (Orne, Vire and Dives, Touques). Cugier et al (2005) stated that input from these rivers combined amounts to approximately 10% o f that from the Seine. Hence, the estimates of monthly flux from the Seine were raised by a factor of 1.1 to account for these additional rivers. Few nutrient or hydrological data cou ld be found for the rivers flowing int o cells 154 and 155 or 160. Ho wever, data submitted by France t o the Fifth North Sea Conference (The North Sea Secretariat 2002), included an nual flow rates (million m3 yr -1) and fluxes of nitrate and nitrite (tonnes nitrogen yr-1) for nu merous French rivers during 1989-2000. Each of these rivers was t herefore assigned to one of the 4 coastal cells adjoinin g the French coastline, and the total annual flux of nitrate and nitrit e estimated by summi ng the fluxes for the individual rivers: Cell 154: Somme, Canche and Authie Cell 155: Aa, Slack, Wimereux and Liane Cell 160: Saire and Divette Cell 161: Seine, Touques, Dives, Orne, Seulles, Vire, Andelle and Eure. Averaged over the years 1990-1999, when data were available for all of the rivers, the ratios of mean flu xes to each cell relativ e to that for cell 161, w ere: cell 15 4: 0.0785; cell 155: 0.0388; cell 160, 0.00383. For cell 154, this ratio is similar to the ratio of catchment areas of the Somme and Seine rivers (5560 and 78650 km2 respectively, i.e. ratio = 0.0709). These mean proportions of nitr ate + nitrite flux were applied to the time series of monthly inputs to cell 161 to derive estimates of the corresponding fluxes to cells 154, 155 and 160. Summary of Results The results for each nat ion and coastal cell were combined into a single file. This involved merging 86 separate files, defining the monthly fluxes to 79 coastal cells, 7 of which had input from 2 nations.

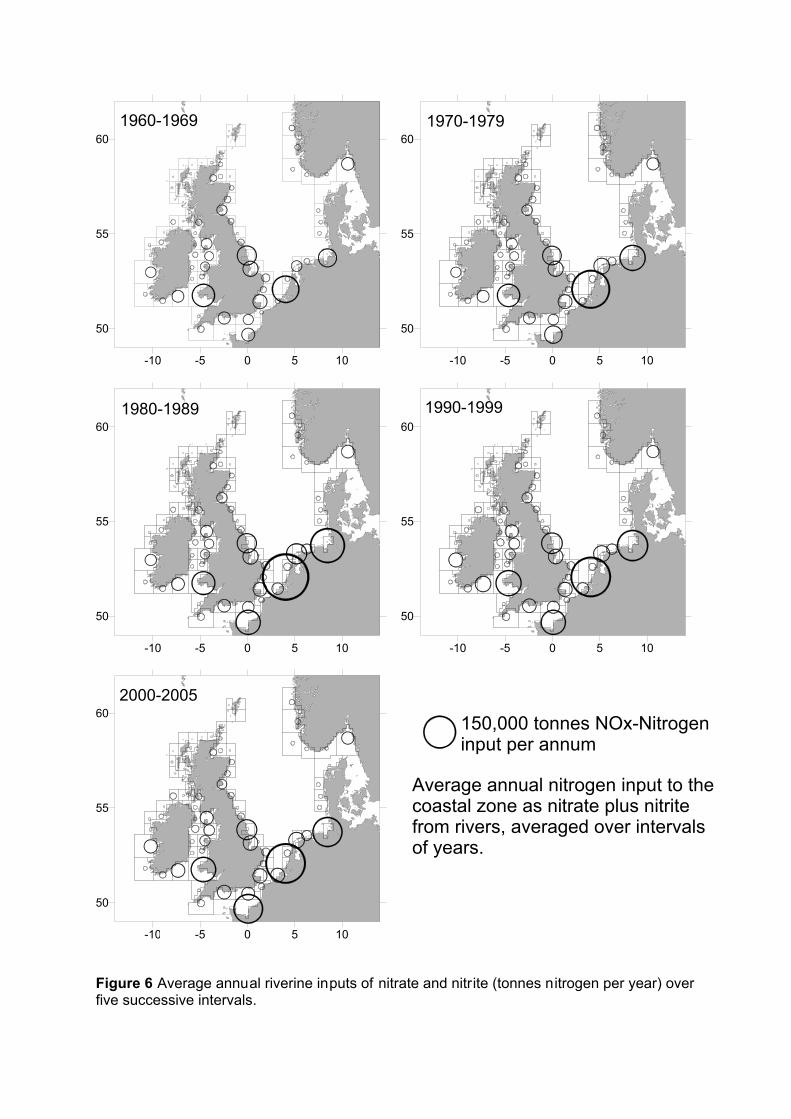
The data are available as a comma-separated ASCII file at: \\193.63.46.53\shared\Marine ecosystems\BioOceanog\Data Archive\Nutrient inputs\RID-nitrate\ Spatial Summary of Annual Fluxes The annual flux (tonnes NOx per ye ar), averaged over 10-year intervals (1960-1969 , 1970-1979, 1980-1989, 1990-1999, 2000-2005) are shown in Fig ure 6. In each decad e, the larges fluxes have been from the major continental rivers flowing int o the south ern North Sea.
-10 -5 0 5 10
50
55
60
-10 -5 0 5 10
50
55
60
-10 -5 0 5 10
50
55
60
-10 -5 0 5 10
50
55
60
-10 -5 0 5 10
50
55
60 150,000 tonnes NOx-Nitrogeninput per annum
Average annual nitrogen input to thecoastal zone as nitrate plus nitritefrom rivers, averaged over intervalsof years.
1960-1969 1970-1979
1980-1989 1990-1999
2000-2005
Figure 6 Average annual riverine inputs of nitrate and nitrite (tonnes nitrogen per year) over five successive intervals.

Regional Summary by Year and Month Each of the coastal cells was assigned to one of five regions (Table 8). Cell Contributing nations Region 4 Scotland North Sea 5 Scotland North Sea 8 Norway North Sea 12 Scotland North Sea 13 Scotland North Sea 18 Scotland North Sea 23 Norway North Sea 25 Scotland West of UK 26 Scotland West of UK 27 Scotland West of UK 28 Scotland West of UK 29 Scotland North Sea 33 Scotland West of UK 34 Scotland West of UK 35 Scotland North Sea 36 Scotland North Sea 37 Scotland North Sea 41 Norway North Sea 42 Norway North Sea 43 Norway Skagerrak/Kattegat 44 Norway and Sweden Skagerrak/Kattega 46 Scotland West of UK 47 Scotland West of UK 48 Scotland West of UK 49 Scotland North Sea 52 Scotland West of UK 53 Scotland West of UK 54 Scotland North Sea 60 Denmark Skagerrak/Kattega 64 Scotland West of UK 65 Scotland North Sea 71 Ireland West of UK 72 Scotland and Ireland West of UK 73 Scotland West of UK 74 Scotland Clyde/Irish Sea/Celtic Sea 75 Scotland and E&W North Sea 82 Denmark North Sea 84 Denmark North Sea 85 Ireland West of UK 86 Ireland West of UK 87 Scotland and Ireland Clyde/Irish Sea/Celtic Sea 88 E&W North Sea 96 Denmark North Sea 97 Ireland West of UK 98 Ireland West of UK 99 Ireland Clyde/Irish Sea/Celtic Sea 100 Scotland and E&W Clyde/Irish Sea/Celtic Sea
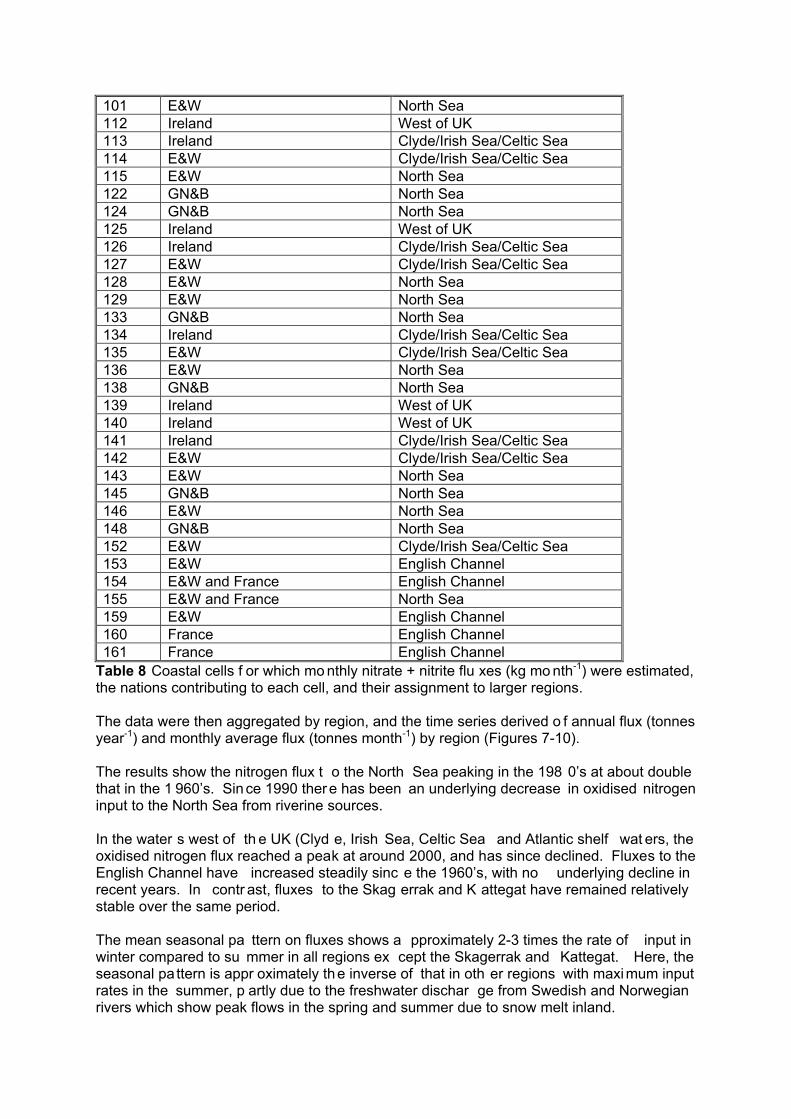
101 E&W North Sea 112 Ireland West of UK 113 Ireland Clyde/Irish Sea/Celtic Sea 114 E&W Clyde/Irish Sea/Celtic Sea 115 E&W North Sea 122 GN&B North Sea 124 GN&B North Sea 125 Ireland West of UK 126 Ireland Clyde/Irish Sea/Celtic Sea 127 E&W Clyde/Irish Sea/Celtic Sea 128 E&W North Sea 129 E&W North Sea 133 GN&B North Sea 134 Ireland Clyde/Irish Sea/Celtic Sea 135 E&W Clyde/Irish Sea/Celtic Sea 136 E&W North Sea 138 GN&B North Sea 139 Ireland West of UK 140 Ireland West of UK 141 Ireland Clyde/Irish Sea/Celtic Sea 142 E&W Clyde/Irish Sea/Celtic Sea 143 E&W North Sea 145 GN&B North Sea 146 E&W North Sea 148 GN&B North Sea 152 E&W Clyde/Irish Sea/Celtic Sea 153 E&W English Channel 154 E&W and France English Channel 155 E&W and France North Sea 159 E&W English Channel 160 France English Channel 161 France English Channel
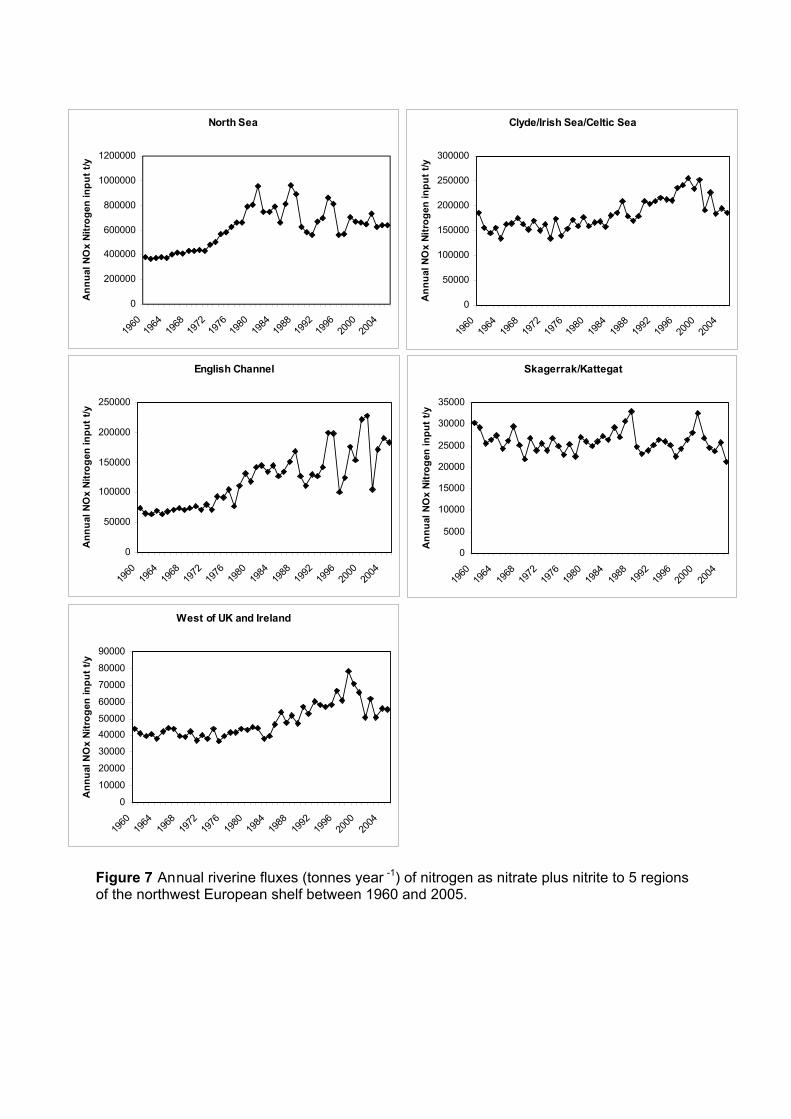
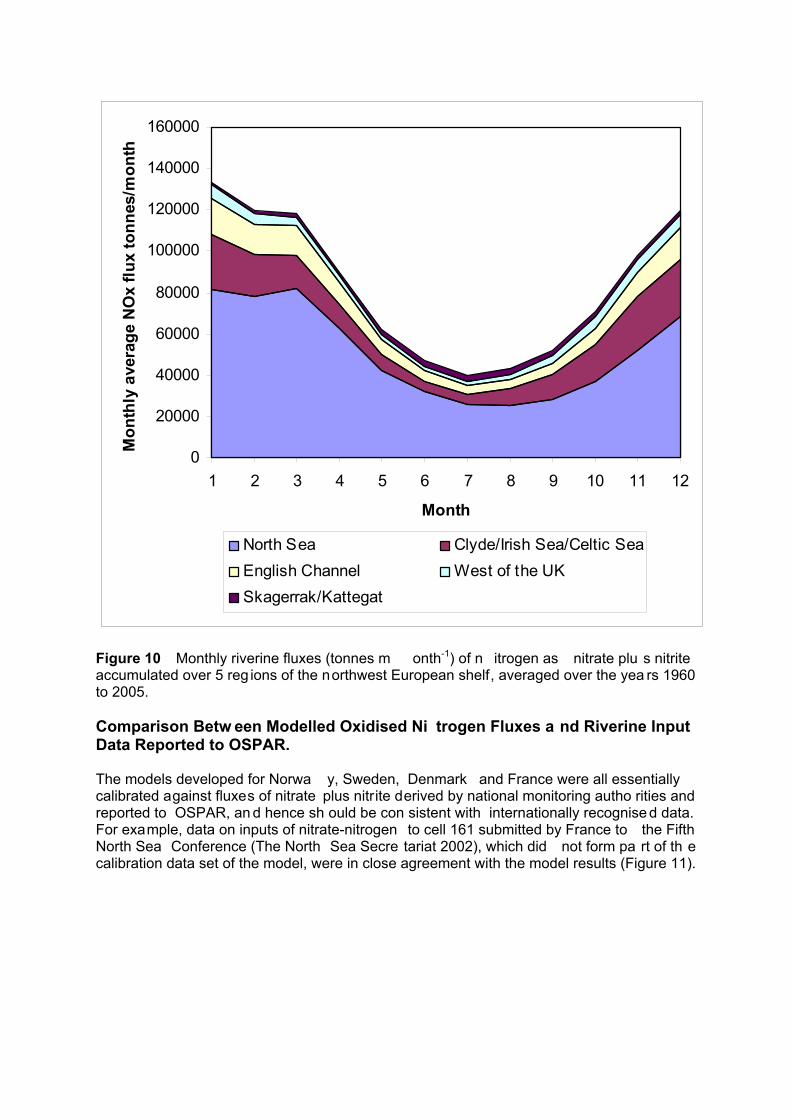
Table 8 Coastal cells f or which mo nthly nitrate + nitrite flu xes (kg mo nth-1) were estimated, the nations contributing to each cell, and their assignment to larger regions. The data were then aggregated by region, and the time series derived o f annual flux (tonnes year-1) and monthly average flux (tonnes month-1) by region (Figures 7-10). The results show the nitrogen flux t o the North Sea peaking in the 198 0’s at about double that in the 1 960’s. Since 1990 there has been an underlying decrease in oxidised nitrogen input to the North Sea from riverine sources. In the water s west of th e UK (Clyd e, Irish Sea, Celtic Sea and Atlantic shelf wat ers, the oxidised nitrogen flux reached a peak at around 2000, and has since declined. Fluxes to the English Channel have increased steadily sinc e the 1960’s, with no underlying decline in recent years. In contr ast, fluxes to the Skag errak and K attegat have remained relatively stable over the same period. The mean seasonal pa ttern on fluxes shows a pproximately 2-3 times the rate of input in winter compared to su mmer in all regions ex cept the Skagerrak and Kattegat. Here, the seasonal pa ttern is appr oximately the inverse of that in oth er regions with maximum input rates in the summer, p artly due to the freshwater dischar ge from Swedish and Norwegian rivers which show peak flows in the spring and summer due to snow melt inland.
North Sea
0
200000
400000
600000
800000
Figure 7 Annual riverine fluxes (tonnes year -1) of nitrogen as nitrate plus nitrite to 5 regions of the northwest European shelf between 1960 and 2005.
1000000
000
1960
1964
1968
1972
1976
1980
1984
1988
1992
1996
2000
2004
Ann
ual N
Ox
Nitr
ogen
inpu
t t/y
1200
Clyde/Irish Sea/Celtic Sea
0
50000
100000
150000
200000
250000
300000
1960
1964
1968
1972
1976
1980
1984
1988
1992
1996
2000
2004
Ann
ual N
Ox
Nitr
ogen
inpu
t t/y
English Channel
0
50000
00
00
00
00
1960
1964
1968
1972
1976
1980
1984
1988
1992
1996
2000
2004
Ann
ual N
Ox
Nitr
ogen
inpu
t t/y
2500
2000
1500
1000
Skagerrak/Kattegat
0
5000
10000
15000
20000
25000
30000
35000
1960
1964
1968
1972
1976
1980
1984
1988
1992
1996
2000
2004
Ann
ual N
Ox
Nitr
ogen
inpu
t t/y
West of UK and Ireland
0
0
0
0
00
0
0
0
0
1960
1964
1968
1972
1976
1980
1984
1988
1992
1996
2000
2004
Ann
ual N
Ox
Nitr
ogen
inpu
t t/y
8000
7000
6000
50004000
3000
2000
1000
9000
0
200000
400000
600000
800000
1000000
1200000
1400000
1600000
1960
1963
1966
1969
1972
1975
1978
1981
1984
1987
1990
1993
1996
1999
2002
2005
Rive
rine
flux
of N
Ox-
nitr
ogen
t/ye
ar
North Sea Clyde/Irish Sea/Celtic SeaEnglish Channel West of UK and IrelandSkagerrak/Kattegat
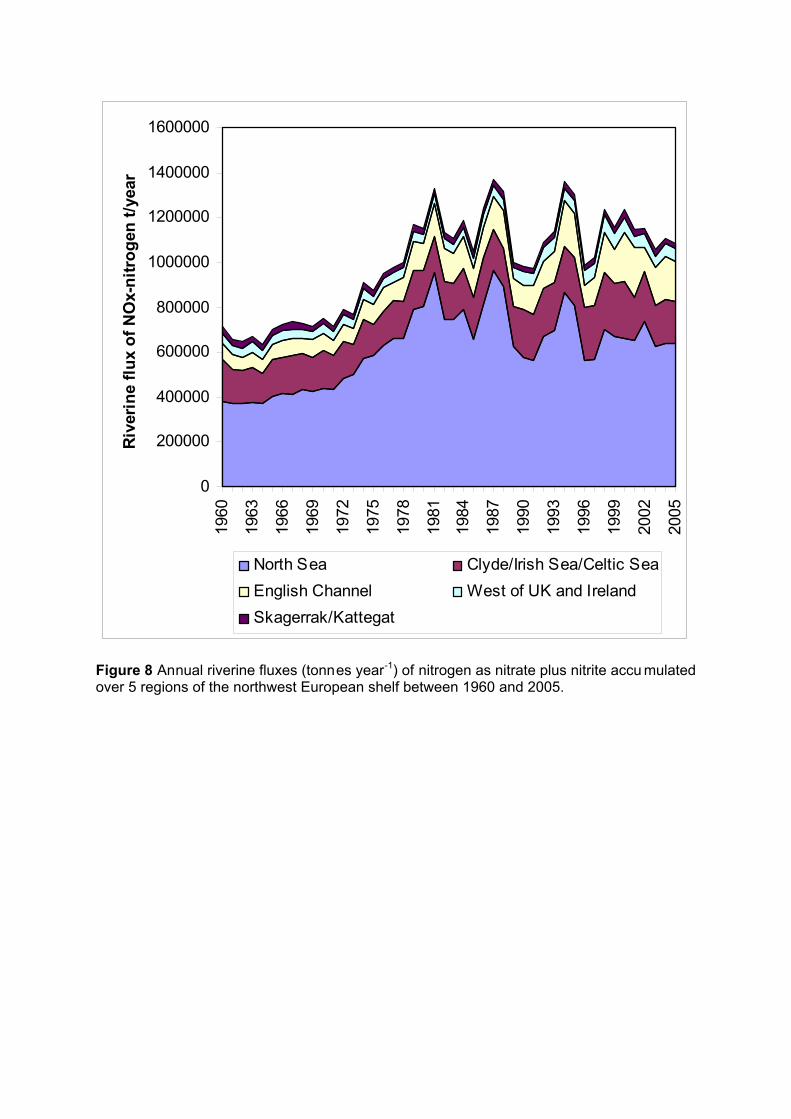
Figure 8 Annual riverine fluxes (tonnes year-1) of nitrogen as nitrate plus nitrite accu mulated over 5 regions of the northwest European shelf between 1960 and 2005.

North Sea
0
10000
20000
30000
40000
50000
60000
70000
80000
90000
1 2 3 4 5 6 7 8 9 10 11 12
Month
Mon
thly
ave
rage
NO
x flu
x t/m
onth
Clyde/Irish Sea/Celtic Sea
0
5000
10000
15000
20000
25000
30000
1 2 3 4 5 6 7 8 9 10 11 12
Month
Mon
thly
ave
rage
NO
x flu
x t/m
onth
English Channel
02000
400060008000
Figure 9 Monthly riveri ne fluxes (t onnes month -1) of nitrogen as nitrate plus nitrite to 5 regions of the northwest European shelf averaged over the years 1960 to 2005.
10000
000
00
1 2 3 4 5 6 7 8 9 10 11 12
Month
Mon
thly
ave
rage
NO
x flu
x t/m
onth
18002000
160014001200
West of UK and Ireland
0
1000
2000
3000
4000
5000
6000
7000
1 2 3 4 5 6 7 8 9 10 11 12
Month
Mon
thly
ave
rage
NO
x flu
x t/m
onth
Skagerrak/Kattegat
0
500
1 2 3 4 5 6 7 8 9 10 11 12
Month
Mon
thly
ave
rage
NO
x flu
x t/m
onth
3000
2500
2000
1500
1000
3500
0
20000
40000
60000
80000
100000
120000
140000
160000
1 2 3 4 5 6 7 8 9 10 11 12
Month
Mon
thly
ave
rage
NO
x flu
x to
nnes
/mon
th
North Sea Clyde/Irish Sea/Celtic SeaEnglish Channel West of the UKSkagerrak/Kattegat
Figure 10 Monthly riverine fluxes (tonnes m onth-1) of n itrogen as nitrate plu s nitrite accumulated over 5 reg ions of the northwest European shelf, averaged over the yea rs 1960 to 2005. Comparison Betw een Modelled Oxidised Ni trogen Fluxes a nd Riverine Input Data Reported to OSPAR. The models developed for Norwa y, Sweden, Denmark and France were all essentially calibrated against fluxes of nitrate plus nitrite derived by national monitoring autho rities and reported to OSPAR, an d hence sh ould be con sistent with internationally recognise d data. For example, data on inputs of nitrate-nitrogen to cell 161 submitted by France to the Fifth North Sea Conference (The North Sea Secre tariat 2002), which did not form pa rt of th e calibration data set of the model, were in close agreement with the model results (Figure 11).

020000400006000080000
100000120000140000160000180000
1960
1964
1968
1972
1976
1980
1984
1988
1992
1996
2000
2004
Annu
al fl
ux to
nnes
y-1
Model OSPAR reported
Figure 11 Model predictions of th e annual flux of nitrate+nitrite to co astal cell 16 1 (tonnes year-1) compared to annual fluxes reported by France to the Fifth North Sea Conference. However, OSPAR data submitted by the UK did not play any part in the calibration of the model. The models for Scotland, England, Wales and Northern Ireland were calibrated against the f luxes estimated for each coastal cell by Edwards (for Heath et al., 2002) which do not form part of the UK submission to OSPAR. The 2006 O SPAR Assessment and Monitoring Report on riverine and direct discharges to the sea contains UK-wide estimates riverine inputs of nitrate (plus nitrite) to the sea. These were consistently approximately hal f of the UK-wide values predicted b y the sum o f models for Scotland, England and Wales and Northern Ireland presented here (Figure 12).
0
100000
200000
300000
400000
500000
600000
1960
1965
1970
1975
1980
1985
1990
1995
2000
2005
tonn
es p
er y
ear
Model NOx OSPAR NOx
Figure 12 UK (Scotland, England, Wales and Northern Ireland) flux for ni trate plus nit rite to the sea, pr edicted fro m the model result s, and as rep orted by the national authority to OSPAR. Repored values from OSPAR 2006).
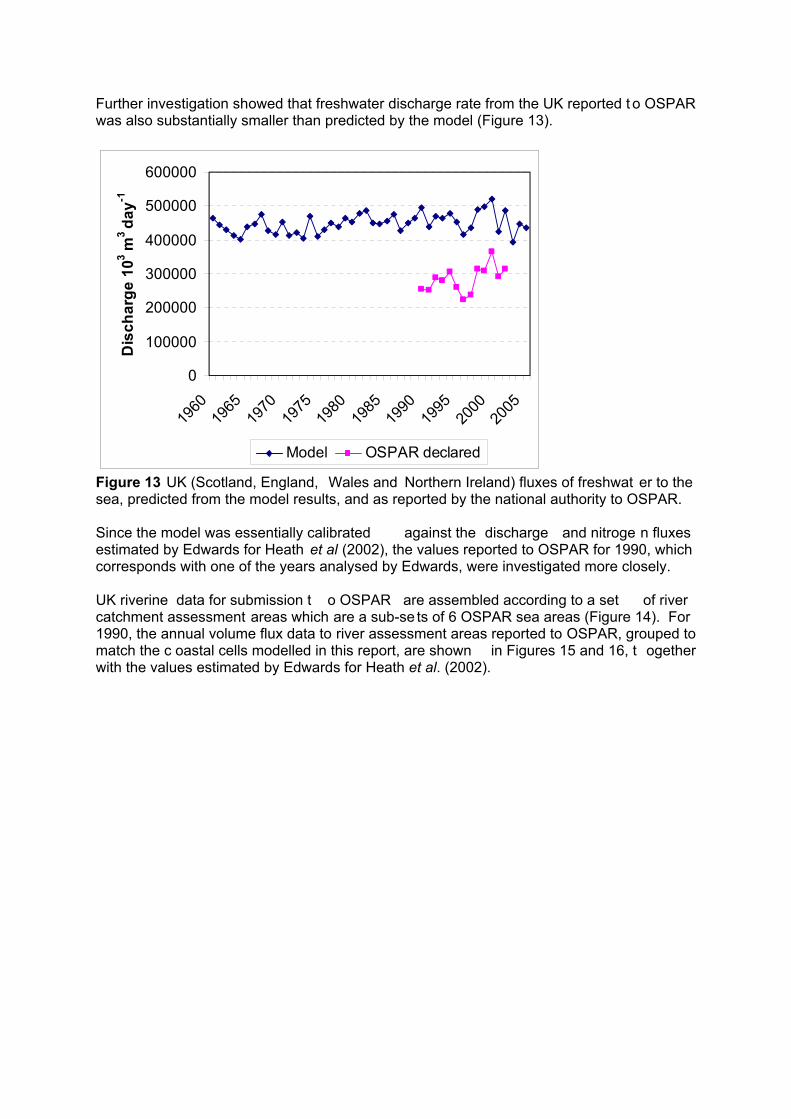
Further investigation showed that freshwater discharge rate from the UK reported t o OSPAR was also substantially smaller than predicted by the model (Figure 13).
0
100000
200000
300000
400000
500000
600000
1960
1965
1970
1975
1980
1985
1990
1995
2000
2005
Dis
char
ge 1
03 m3
day-1
Model OSPAR declared
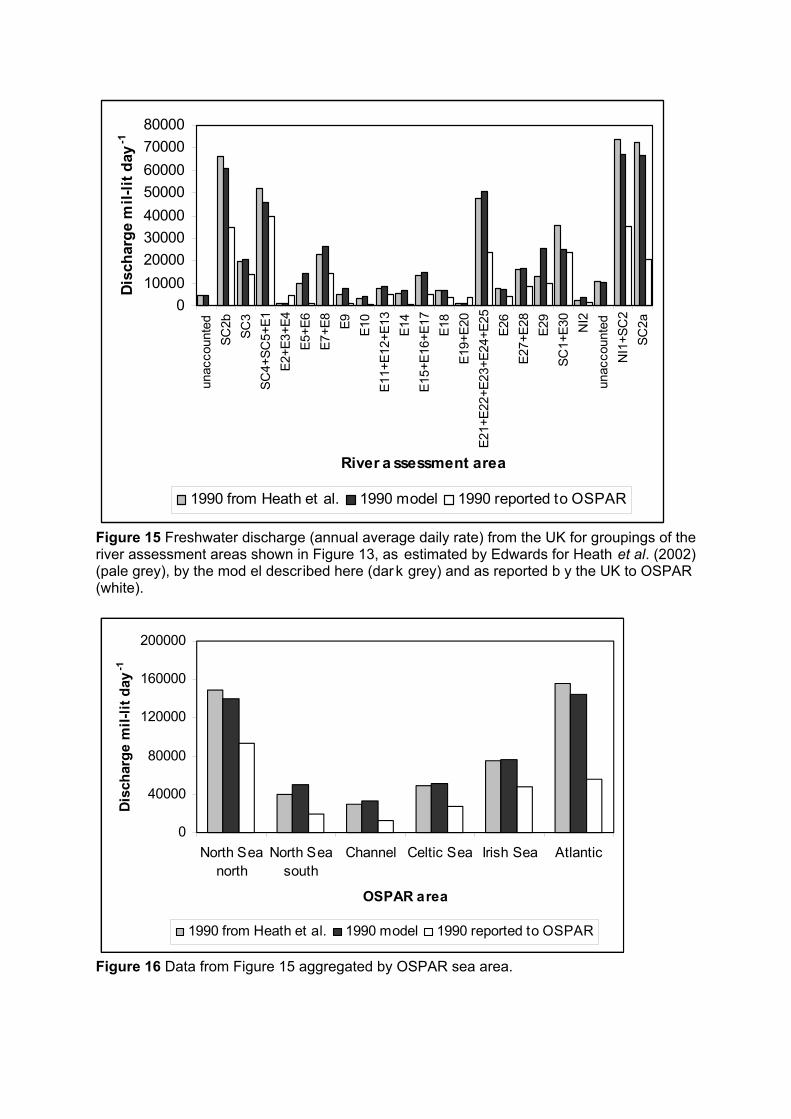
Figure 13 UK (Scotland, England, Wales and Northern Ireland) fluxes of freshwat er to the sea, predicted from the model results, and as reported by the national authority to OSPAR. Since the model was essentially calibrated against the discharge and nitroge n fluxes estimated by Edwards for Heath et al (2002), the values reported to OSPAR for 1990, which corresponds with one of the years analysed by Edwards, were investigated more closely. UK riverine data for submission t o OSPAR are assembled according to a set of river catchment assessment areas which are a sub-se ts of 6 OSPAR sea areas (Figure 14). For 1990, the annual volume flux data to river assessment areas reported to OSPAR, grouped to match the c oastal cells modelled in this report, are shown in Figures 15 and 16, t ogether with the values estimated by Edwards for Heath et al. (2002).

Figure 14 River catchment assessment areas (SC1-SC5, E1-E30 and NI1-NI2) used in th e compilation of discharge and nutrient inputs reported to OSPAR.
01000020000300004000050000600007000080000
unac
coun
ted
SC2b
SC3
SC4+
SC5+
E1E2
+E3+
E4E5
+E6
E7+E
8E9 E1
0E1
1+E1
2+E1
3E1
4E1
5+E1
6+E1
7E1
8E1
9+E2
0E2
1+E2
2+E2
3+E2
4+E2
5E2
6E2
7+E2
8E2
9SC
1+E3
0N
I2un
acco
unte
dN
I1+S
C2
SC2a
River a ssessment area
Dis
char
ge m
il-lit
day
-1
1990 from Heath et al. 1990 model 1990 reported to OSPAR
Figure 15 Freshwater discharge (annual average daily rate) from the UK for groupings of the river assessment areas shown in Figure 13, as estimated by Edwards for Heath et al. (2002) (pale grey), by the mod el described here (dark grey) and as reported b y the UK to OSPAR (white).
0
40000
80000
120000
160000
200000
North Seanorth
North Seasouth
Channel Celtic Sea Irish Sea Atlantic
OSPAR area
Dis
char
ge m
il-lit
day
-1
1990 from Heath et al. 1990 model 1990 reported to OSPAR
Figure 16 Data from Figure 15 aggregated by OSPAR sea area.
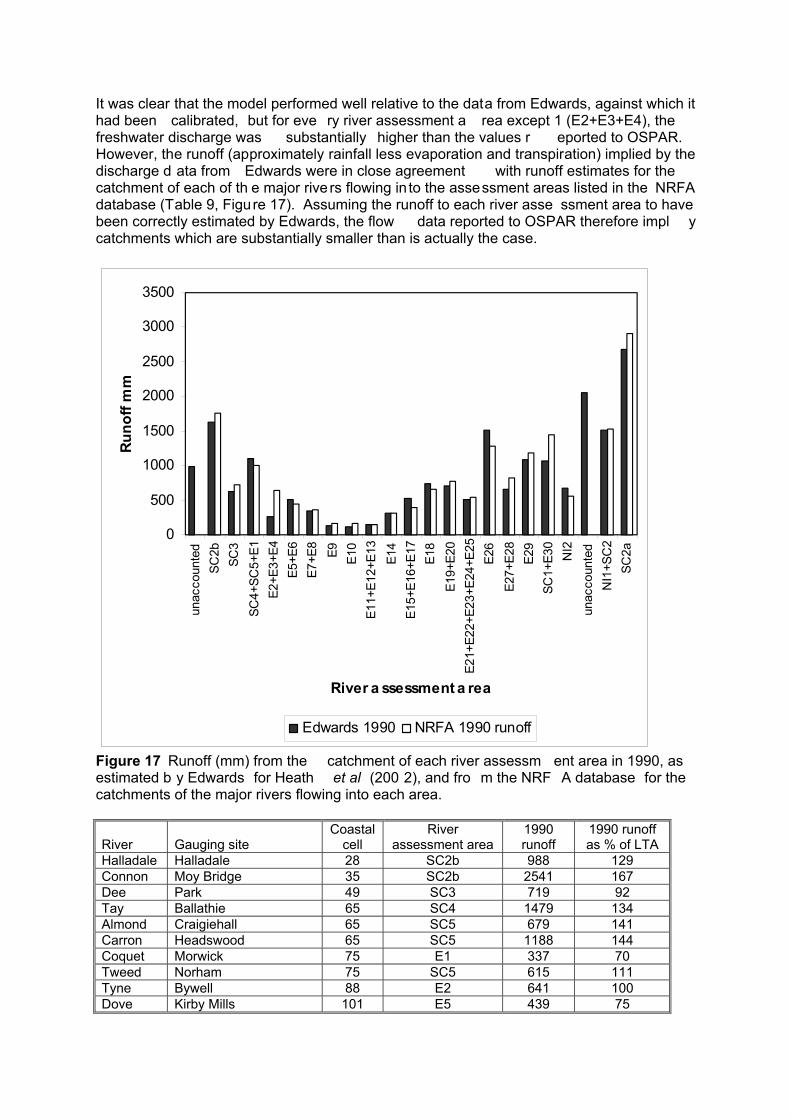
It was clear that the model performed well relative to the data from Edwards, against which it had been calibrated, but for eve ry river assessment a rea except 1 (E2+E3+E4), the freshwater discharge was substantially higher than the values r eported to OSPAR. However, the runoff (approximately rainfall less evaporation and transpiration) implied by the discharge d ata from Edwards were in close agreement with runoff estimates for the catchment of each of th e major rive rs flowing in to the assessment areas listed in the NRFA database (Table 9, Figure 17). Assuming the runoff to each river asse ssment area to have been correctly estimated by Edwards, the flow data reported to OSPAR therefore impl y catchments which are substantially smaller than is actually the case.
0
500
1000
1500
2000
2500
3000
3500
unac
coun
ted
SC2b
SC3
SC4+
SC5+
E1E2
+E3+
E4E5
+E6
E7+E
8E9 E1
0E1
1+E1
2+E1
3E1
4E1
5+E1
6+E1
7E1
8E1
9+E2
0E2
1+E2
2+E2
3+E2
4+E2
5E2
6E2
7+E2
8E2
9SC
1+E3
0N
I2un
acco
unte
dN
I1+S
C2
SC2a
River a ssessment a rea
Runo
ff m
m
Edwards 1990 NRFA 1990 runoff
Figure 17 Runoff (mm) from the catchment of each river assessm ent area in 1990, as estimated b y Edwards for Heath et al (200 2), and fro m the NRF A database for the catchments of the major rivers flowing into each area.
River Gauging site Coastal
cell River
assessment area 1990 runoff
1990 runoff as % of LTA
Halladale Halladale 28 SC2b 988 129 Connon Moy Bridge 35 SC2b 2541 167 Dee Park 49 SC3 719 92 Tay Ballathie 65 SC4 1479 134 Almond Craigiehall 65 SC5 679 141 Carron Headswood 65 SC5 1188 144 Coquet Morwick 75 E1 337 70 Tweed Norham 75 SC5 615 111 Tyne Bywell 88 E2 641 100 Dove Kirby Mills 101 E5 439 75

Ouse Skelton 128 E7a 454 98 Trent Colwick 128 E7a 280 78 Glen Kates Br and King St Br 128 E9 44 39 Babingley Castle Rising 128 E9 161 46 Bure Ingworth 136 E10 164 77 Thames Kingston 146 E12 140 66 Uck Isfield 154 E14 317 80 Stour Throup 153 E16 368 96 Itchen Highbridge+Allbrook 153 E15 428 92 Fal Tregony 159 E18 654 90 Taw Umberleigh 152 E20 653 95 Camel Denby 152 E19 886 101 Severn Bewdley 142 E23 402 89 Teme Tenbury 142 E23 344 86 Rhymney Llanederyn 142 E23 860 90 Dyfi Dyfi Bridge 135 E26 1499 99 Ystwyth Pont Llolwyn 135 E26 1062 97 Elwy Pont-y-Gwyddel 127 E27 709 104 Dee Manley Hall 127 E27 947 99 Ribble Salmesbury 114 E29 882 96 Kent Sedgwick 114 E29 1484 113 Weaver Ashbrook 127 E28 273 94 Derwent Camerton 100 E30 1329 109 Cree Newton Stewart 100 SC1 1564 119 Laggan Newforge 99 NI2 578 109 Clanrye Mounthill Bridge 99 NI2 526 91 Bush Seneirl Bridge 86 NI1 898 137 Levem Linbranne 74 SC2 2174 130 Ewe Poolewe 34 SC2a 2841 138 Carron New Kelso 47 SC2a 3376 136 Inver Little Assynt 34 SC2a 2502 131
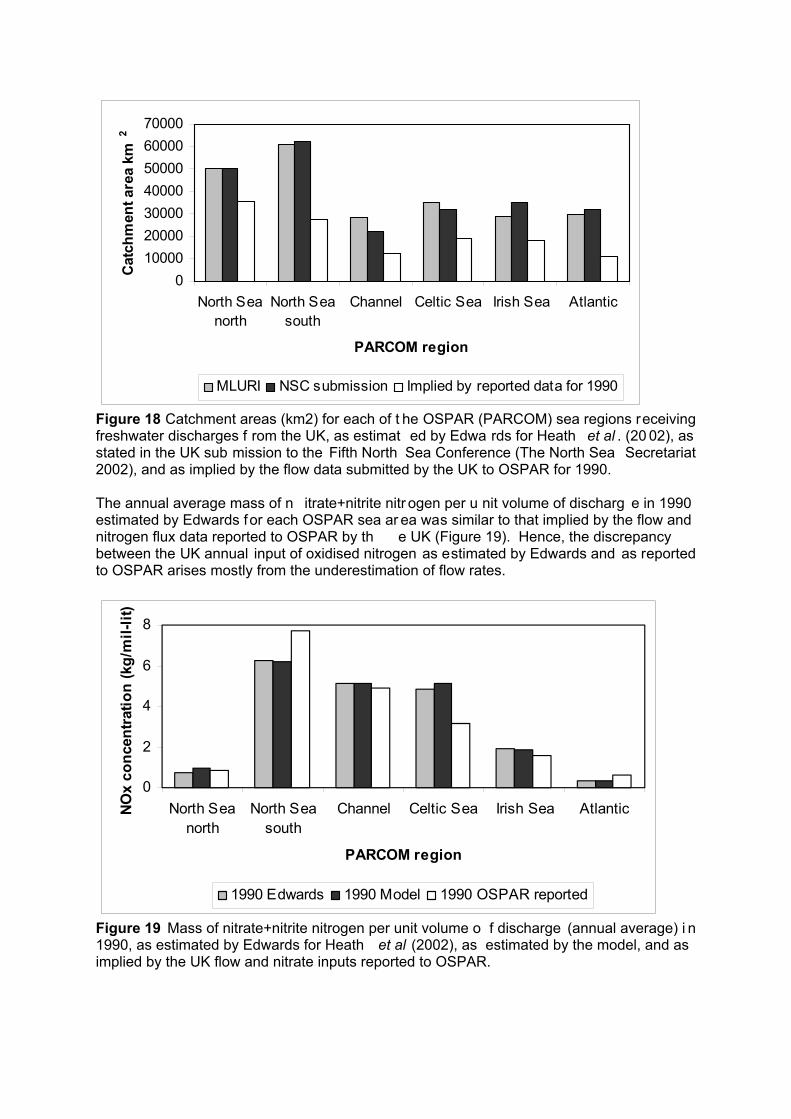
Table 9 Catchment runoff data for 1990, for major rivers flowing into e ach river assessment area, obtained from the NRFA database (http://www.nwl.ac.uk/ih/nrfa/webdata/index.html). In fact, UK submission s to OSPAR acknowledge that riverine disch arges from the un -gauged parts of each catchment are not accou nted for in the submitted data, whereas un-gauged discharges were carefully accounted for by Edwards in the data provided for Heath et al. (2002) (see Appendix 2). So, we should expect there to be a difference between the two sets of data. The UK submission to O SPAR in 2 006 (OSPAR 2006a) states that “riverine inputs cover some 80% of t he land mass “ and, “the total inputs reported have not been proportioned up t o give a 100 % estimated value”. In fact, t he results presented here imply that UK-wide the flow data reported to OSPAR repre sent runoff f rom only 53 % of the total land area. This proportion varies between 38% for the Atlantic catchment, and 71% for the northern North Se a catchment (Northern North Sea 71%, Southern North Sea 45% , Channel 43%, Celtic Sea 55%, Irish Sea 63%, Atlantic 38%) (Figure 18).
010000200003000040000500006000070000
North Seanorth
North Seasouth
Channel Celtic Sea Irish Sea Atlantic
PARCOM region
Cat
chm
ent a
rea
km2
MLURI NSC submission Implied by reported data for 1990
Figure 18 Catchment areas (km2) for each of t he OSPAR (PARCOM) sea regions receiving freshwater discharges f rom the UK, as estimat ed by Edwa rds for Heath et al . (20 02), as stated in the UK sub mission to the Fifth North Sea Conference (The North Sea Secretariat 2002), and as implied by the flow data submitted by the UK to OSPAR for 1990. The annual average mass of n itrate+nitrite nitr ogen per u nit volume of discharg e in 1990 estimated by Edwards for each OSPAR sea ar ea was similar to that implied by the flow and nitrogen flux data reported to OSPAR by th e UK (Figure 19). Hence, the discrepancy between the UK annual input of oxidised nitrogen as estimated by Edwards and as reported to OSPAR arises mostly from the underestimation of flow rates.
0
2
4
6
8
North Seanorth
North Seasouth
Channel Celtic Sea Irish Sea Atlantic
PARCOM region
NOx
conc
entr
atio
n (k
g/m
il-lit
)
1990 Edwards 1990 Model 1990 OSPAR reported
Figure 19 Mass of nitrate+nitrite nitrogen per unit volume o f discharge (annual average) i n 1990, as estimated by Edwards for Heath et al (2002), as estimated by the model, and as implied by the UK flow and nitrate inputs reported to OSPAR.
Having acknowledged the lack of accounting fo r discharge from the un -gauged part of the catchment, the 2006 UK submissions to OSPAR stat es that “as direct inputs account for all significant inputs downstream of the monitoring st ations, it is con sidered that, overall, the 90% coverage target has been met “. However, direct inputs of nitrate-nitrogen reported for 1990 amounted to 23,200 tonnes UK-wide, whi ch brings the UK estima te of input up to only 58% of the riverine flux estimated by Ed wards. Clearly, nut rients exported with freshwater discharged from the un-gauged portions of the catchments are not a trivial component of the total input to the sea and cannot be ignored. We conclud e that their omission accounts for the discrepancy between the model results described here and the UK data available fro m OSPAR. Shortcoming and Benefits of the Modelling Approach The major shortcoming of the approach describ ed here are that different methods had to be applied for different re gions depe nding on th e availabilit y of raw d ata. There is litt le uniformity a cross the n ations involved regarding public a ccess to f low and concentration data. The statistical approach to estimating freshwater discharge to the sea from rainfall d ata has a clear logical ba sis, but cannot be expect ed to repr esent inter annual variations in evaporation and transpiration losses of water from the catchments which will lead to variation in the relation ship betwee n rainfall a nd runoff. Similarly, the represent ation of variations in the concen tration of nit rate+nitrite in discharge d waters is crude, assu ming a stable sea sonality an d year-to-year change s which a re parameterised from highl y aggregated data. But, given the state of data and the resources available for the task, the approach ta ken here a ppears to h ave been successf ul. Certainly, there is a g ood fit between the model and the available calibrat ion data (e.g. Figures 3, 4 and 5) and where available, validation data (Figure 11). The assembly of compre hensive, spatially resolved time series data sets describing t he flux of nutrients from the la nd to the sea is de sperately needed for progr ess with e cosystem modelling st udies desig ned to provide asse ssments of the eutrophication statu s of shelf waters. OSPAR and other modelling groups have regularly struggled with the assembly o f such data (Pätsch and Radach 1997, OSPAR 2 006b). Statistical recon struction techniques such as de scribed her e probably represent a practical solution to this proble m since mechanistic estimations such as prescribed by OSPAR HARP-NUT Guidelines are unlikely to be feasible for years prior to 1990 when available data are sparse. Acknowledgements Thanks to Johannes Pätsch at Ifm Hamburg for making available the data on nutrient inputs to German, Dutch and Belgian coastal waters. The work was part funded by a contract from the EU-JRC Ispra Exploratory Research Project “Comparing spatial, long-term and seasonal changes in potential new production with fish biomass in the tempera te seas of the North East Atlantic Continental Shelf”.

REFERENCES Ærtebjerg, G., Anders en, J.H. & Schou Hansen, O. [Eds.] 2003. Nutrients and Eutrophication in Danish Marine Waters. A Challenge for Science and Mana gement. National Environmenta l Research Institute. Internet: http://www.dmu.dk/1_Viden/2_Miljoetilstand/3_vand/4_eutrophication/default.htm Aminot, A., Guillaud, J.-F., Andrieux-Loyer, F., Kerouel, R. and Cann, P. 1998. Apports de nutriments et development phytoplanctonique en vaie de Seine. Oceanologica Acta 21, 923-935. http://www.ifremer.fr/docelec/liste-en.jsp?onglet=simple&argument=Aminot&periode=annee&limite=0&tri=date&format=notice&pos=4
Aminot, A., Guillaud, J.-F. and Kero uel, R. 1997. la baie de Seine: hydrologie, nutriment e t chlorophylle (1978-1994). IFREMER Reperes Ocean 14,148pp. http://www.ifremer.fr/docelec/liste-en.jsp?onglet=simple&argument=Aminot&periode=annee&limite=0&tri=date&format=notice&pos=5
Anonymous, 1992. Guidance document for the NSTF modelling workshop, 6-8 Ma y 1992. den Haag. Directorate general Rijkswaterstaad. 41pp. Baretta-Bekker, J.G. [Ed.] 1995. European Regional Seas Ecosystem Model I. Neth. J. Se a Res. 33 (3/4). Special Issue. 483pp Baretta-Bekker, J.G. an d Baretta, J.W. [Eds.] 1 997. European Region al Seas Ecosystem Model II. J. Sea Res. 38 (3/4). Special Issue. 438pp Borgvand, S.A. 2006. Riverine inputs and dire ct discharges to Norwegian coasta l waters – 2004. (Norwegian Pollution Control Authority Report TA-2147/2006). Study und ertaken by the Norwegian Institute for Water Research – NIVA http://www.sft.no/publikasjoner/vann/2147/ta2147.pdf
Chesterikov, A., Thévenot, D.R., Mouchel, J.M., Poulin, M., Garban, B. and Olivon D. 1998. Chap. 7. Le fleuve dans la ville. in "L a Seine en son Bassin : Fonctionnement écologique et activités humaines", M. Meybeck éditeur, Elsevier, Paris, 301-344.
Cugier, P., Menesguen, A. and Guillaud, J.F . 2005. Three-dimensional (3D) ecological modelling of the Bay of Seine (English Channel, France). J. Sea Res. 54, 104-124.
Edwards AC, Cook Y, Smart R, Wade AJ. 2000. Concentrations of nitrogen and phosphorus in streams draining the mixed land-use Dee Catchment, north-east Scotland. J. Appl. Ecol. Suppl. 1. 37: 159-170 Ferrier RC, Edwards AC, Hirst D, Littlewood I G, Watts CD, Morris R. 2001.Water quality of Scottish rivers: spatial and temporal trends. Sci. Total Environ. 265 (1-3): 327-342. Heath, M.R., Edwards, A.C., Pätsch, J. and Turrell, W.R. 2 002. Modelling the beha viour of nutrients in the coasta l waters of Scotland. Fisheries R esearch Services Repo rt 10/02. 107pp. http://www.frs-scotland.gov.uk/FRS.Web/Uploads/Documents/ersem_report_final.pdf

Lacroix, G., Ruddick, K., Ozer, J. and Lancelot, C. 2004. Modelling the impact of the Scheldt and Rhine/Meuse plumes on the sa linity distribution in Belgian waters (southern North Sea). J. Sea Res. 52, 1491-63.
LCS 1988. Land Cover of Scotland, Macaulay Institute, Aberdeen.
Lenhart, H.J., Pätsch, J., Radach, G., 1996. Daily nutrient loads for the European continental rivers during 1977-199 3. Technical Report, Berichte des Zentru m für Mee res- und Klimaforschung B 22, 1-159.
Lenhart, H.J., Pätsch, J. 2001. Daily nutrient loads for the European continental rivers during 1977-1998. Technical Report, Berichte des Zen trum für Me eres- und Klimaforschung B 40, 146pp
OSPAR 1998. Principles of the Comprehensive Study on Riverine Inputs a nd Direct Discharges (RID). OSPAR report 1998-5. 17pp. OSPAR 2004a. Data report on t he comprehensive stu dy of riverine inputs a nd direct discharges (RID) in 2002. OSPAR Assessment and Monitoring Series 2004. 194pp. OSPAR 20 04b. OSPAR Guidelines for Harmonised Quantification and Reporting Procedures for Nutrients (HARP-NUT). Draft Guideline 6: Quantification and Rep orting of Nitrogen and Phosphorus Losse s from Diffuse Anthropogenic So urces, and Natural Background Losses. Ref. 2004-02. 72pp. OSPAR 2004c. OSPAR Guidelines for Harmonised Quantification and Reporting Procedures for Nutrients (HARP-NUT). Guideline 9: Quantificatio n and reporting of the retention of nitrogen and phosphorus in river catchments. Ref. 2004-02. 12pp. OSPAR 2006a. Data report on t he comprehensive stu dy of riverine inputs a nd direct discharges (RID) in 2004. OSPAR Assessment and Monitoring Series 2006. 186pp. OSPAR 20 06b. Interi m Report on the Use of Eutrophication Mo delling for Predicting Expected Eutrophication Status of the OSPAR Maritime Area following the Imple mentation of Agreed Measures. OSPAR Eutrophication Series 286/2006. 12pp. Pätsch, J. and Lenhar t, H.J. 200 4. Daily lo ads of n utrients, tota l alkalinity, dissolved inorganic ca rbon and dissolved organic carbon of the European continental rivers for the years 1977-2002. Technical Report, Berichte des Zentrum für Meeres- und Klimaforschung B 48, 159pp. Pätsch, J. and Radach, G. 1997. Long-term simulation of the eutrophication o fth e North Sea: temporal development of nutrients, chlo rophtyll and primary produ ction in comparison to observations. J. Sea Res. 38 (3-4), 275-310. The North Sea Secretariat, 2002. The Progress Report on the Fifth North Sea Conf erence. Compilation of submitted inputs to the progress report of th e Fifth North Sea Conf erence. Further reductions of nutrient inp uts to the North Sea. Part II: Inputs of nutrients using HARP-NUT Guidelines. Toner, P., Bowman, J., Clabby, K., Lucey, J., McGarrigle, M., Concannon, C., Cle naghan, C., Cunningham, P., Delaney, J., O’Boyle, S., MacCarthaigh, M., Carig, M. and Quinn, R. 2005. Water quality in Ireland 2001-2003. Environmen tal Protection Agency, Count y Wexford, Ireland. Report 06/05/1000. 232pp.

Weideborg, M., Arctander Kik, E., Thoresen, H., Stang, P., Kelley, A. And Terje Ne dlend, K. 2001. OSPAR Commission. Annual report on direct and riverine inputs to Norwegian coastal waters during the year 1999. A. Principles, results an d discussio n. Norwegian Water Technology Centre - Aquateam Report 00-052. 41pp. http://www.sft.no/publikasjoner/overvaking/1793/ta1793.pdf

TABLE 10 - Sources of precipitation data (mm per month) Nation Source Description SitesScotland UK Meteorological Office
http://www.metoffice.gov.uk/climate/uk/stationdata/index.html Monthly int egrated precipitation at selected sit es (mm/mo nth), 1960-2005.
Braemar Lerwick Leuchars Paisley Stornoway Tiree
England and Wales
UK Meteorological Office http://www.metoffice.gov.uk/climate/uk/stationdata/index.html
Monthly int egrated precipitation at selected sit es (mm/mo nth), 1960-2005.
Aberporth Armagh Bradford Cambridge Cardiff Durham Eastbourne Greenwich Hurn Newtonrigg Oxford Ringway RossonWye Shawbury Sheffield Southampton StMawgan SuttonBonnington Valley Yoevileton
Northern Ireland
UK Meteorological Office http://www.metoffice.gov.uk/climate/uk/stationdata/index.html
Monthly int egrated precipitation at selected sit es (mm/mo nth), 1960-2005.
Armagh Northern Ireland

http://www.metoffice.gov.uk/climate/uk/2003/february.html http://www.metoffice.gov.uk/climate/uk/seriesstatistics/nirain.txt
Monthly i ntegrated precipita tion (mm/month) averaged over the region taking account of topographic, coastal an d urban effects, 196 0-2005.
regional average monthly rainfall
Irish Republic
The Irish Meteorological Service http://www.met.ie/climate/rainfall.asp
1961-1990 monthly a verage rainfall (mm/month).
Belmullet Birr Casement Claremorris Clones Cork Dublin Kilkenny Malin Mullingar Rosslare Shannon Valentia
Norway Norwegian Meteorological Institute http://met.no/met/ver_100/nedbor_100/geografisk/normalar.html http://met.no/met/ver_100/nedbor_100/geografisk/index.html
1961-1990 regional monthly average rainfall (mm/month). Monthly rainfall from 1900-2006 as a percentage of the 1961-19 90 average for each region.
Austlandet Agder Vestlandet Austlandet Agder Vestlandet
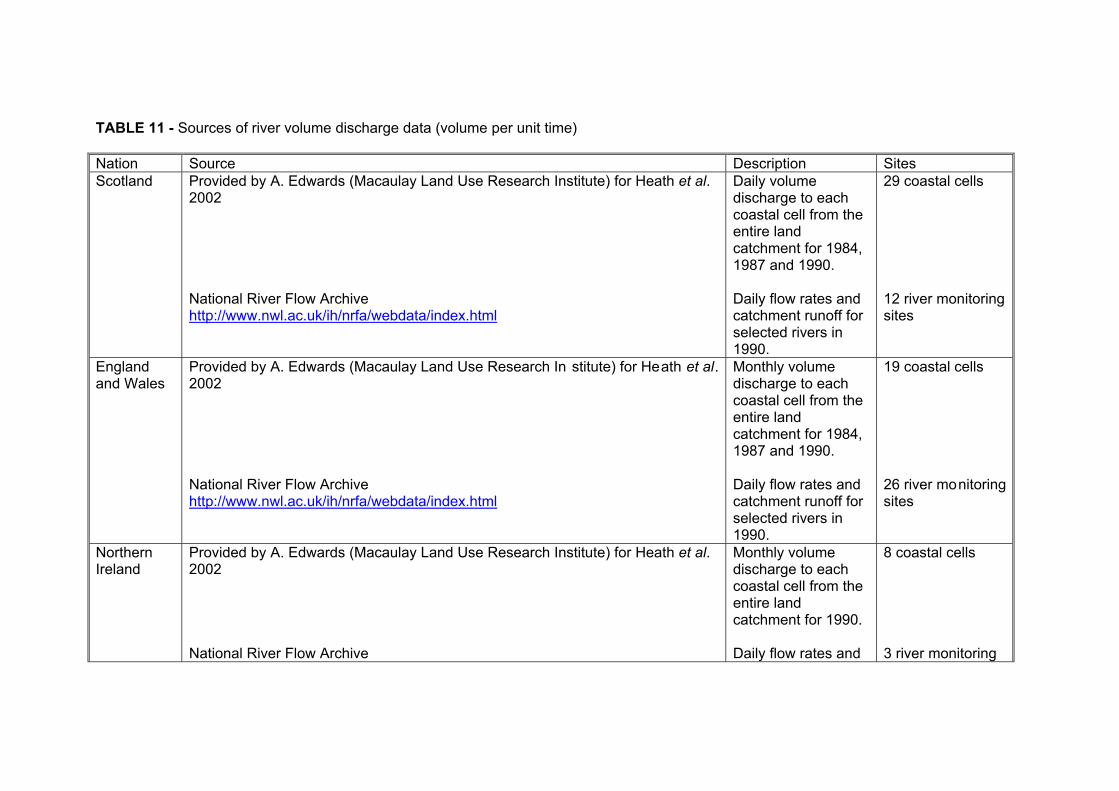
TABLE 11 - Sources of river volume discharge data (volume per unit time) Nation Source Description SitesScotland Provided by A. Edwards (Macaulay Land Use Research Institute) for Heath et al.
2002 National River Flow Archive http://www.nwl.ac.uk/ih/nrfa/webdata/index.html
Daily volume discharge to each coastal cell from the entire land catchment for 1984, 1987 and 1990. Daily flow rates and catchment runoff for selected rivers in 1990.
29 coastal cells 12 river monitoring sites
England and Wales
Provided by A. Edwards (Macaulay Land Use Research In stitute) for Heath et al. 2002 National River Flow Archive http://www.nwl.ac.uk/ih/nrfa/webdata/index.html
Monthly volume discharge to each coastal cell from the entire land catchment for 1984, 1987 and 1990. Daily flow rates and catchment runoff for selected rivers in 1990.
19 coastal cells 26 river monitoring sites
Northern Ireland
Provided by A. Edwards (Macaulay Land Use Research Institute) for Heath et al. 2002 National River Flow Archive
Monthly volume discharge to each coastal cell from the entire land catchment for 1990. Daily flow rates and
8 coastal cells 3 river monitoring

http://www.nwl.ac.uk/ih/nrfa/webdata/index.html catchment runoff for selected rivers in 1990.
sites
Irish Republic
Provided by A. Edwards (Macaulay Land Use Research Institute) for Heath et al. 2002
Monthly volume discharge to each coastal cell from the entire land catchment for 1990.
8 coastal cells
Norway Norwegian Pollution Control Authority http://www.sft.no/publikasjoner/vann/2147/ta2147.pdfBorgvand, S.A. (2006). Riverine inputs and direct discharges to Norwegian coastal waters – 2004. (TA-2147/2006). Study undertaken by the Norwegian Institute for Water Research – NIVA Norwegian Water Technology Centre Report 00-052 http://www.sft.no/publikasjoner/overvaking/1793/ta1793.pdfWeideborg et al (2001). OSPAR Commission. Annual report on direct and riverine inputs to Norwegian coastal waters during the year 1999. A. Principles, results and discussion. Aquateam Report 00-052. 41pp.
1974-2003 average monthly river flow. Long-term average flow for Norwegian rivers. Average annual freshwater discharge to Norwegian coastal regions.
Otra Skienselva Numedalslaagen Drammenselva Glomma Otra Skienselva Numedalslaagen Drammenselva Glomma Orreelva Suldalslagen Skagerrak: Swedish border to Lindesnes; North Sea: Lindesnes to Stad
Denmark Danmarks Miljoundersogelser (National Environmental research Institute Denmark), Vandlob og kilder 2000. Faglig rapport fra DMU, nr 378. 118pp. http://www2.dmu.dk/1_viden/2_publikationer/3_fagrapporter/rapporter/FR378.pdf
1971-2000 monthly average volume discharge to coastal regions around Denmark.
North Sea Skagerrak Kattegat
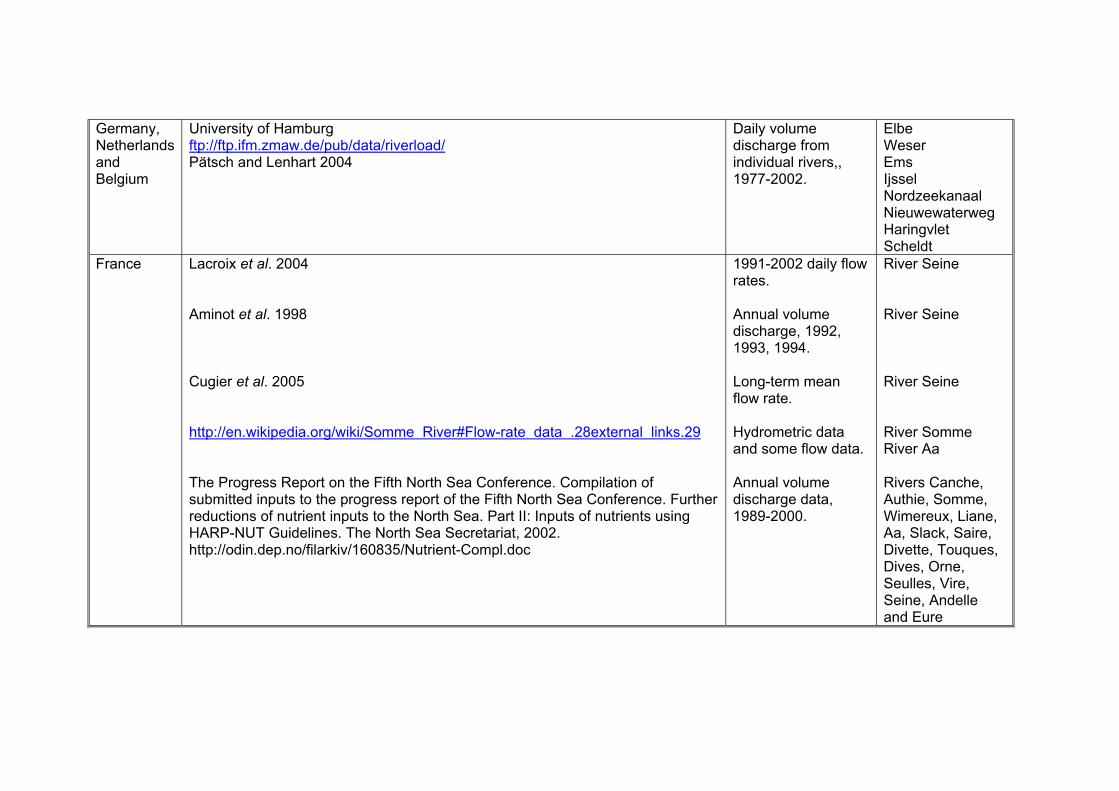
Germany, Netherlands and Belgium
University of Hamburg ftp://ftp.ifm.zmaw.de/pub/data/riverload/Pätsch and Lenhart 2004
Daily volume discharge from individual rivers,, 1977-2002.
Elbe Weser Ems Ijssel Nordzeekanaal Nieuwewaterweg Haringvlet Scheldt
France Lacroix et al. 2004 Aminot et al. 1998 Cugier et al. 2005 http://en.wikipedia.org/wiki/Somme River#Flow-rate data .28external links.29 The Progress Report on the Fifth North Sea Conference. Compilation of submitted inputs to the progress report of the Fifth North Sea Conference. Further reductions of nutrient inputs to the North Sea. Part II: Inputs of nutrients using HARP-NUT Guidelines. The North Sea Secretariat, 2002. http://odin.dep.no/filarkiv/160835/Nutrient-Compl.doc
1991-2002 daily flow rates. Annual volume discharge, 1992, 1993, 1994. Long-term mean flow rate. Hydrometric data and some flow data. Annual volume discharge data, 1989-2000.
River Seine River Seine River Seine River Somme River Aa Rivers Canche, Authie, Somme, Wimereux, Liane, Aa, Slack, Saire, Divette, Touques, Dives, Orne, Seulles, Vire, Seine, Andelle and Eure

TABLE 12 - Sources of river nutrient concentration data (mg nitrogen per litre) Nation Source Description SitesScotland Scottish Environmental Protection Agency
http://www.sepa.org.uk/data/hm/hm.asp Sample-by-sample data on nitrate and nitrite (mg l-1)from 1975 onwards (start date varies between rivers), at the most downstream sampling site on each river.
Ayr Beauly Carron Clyde Connon Cree Dee Deveron Don Earn Eden Esk Eye Findhorn Forth Irvine Leith Leven Leven(Clyde) Lochy Lossie N-Esk Ness S-Esk Shin Spey Tay Teith Thurso

Tweed Tyne Ythan
England and Wales
Department of Environment Fisheries and Rural Affairs http://www.defra.gov.uk/environment/statistics/inlwater/iwnutrient.htm#iwtb09b
1980-2004 annual average of all site means in each water authority region, each being given equal weight, irrespective of the number of samples taken.
North West North East Midlands Anglian Thames Southern North West Welsh
Northern Ireland
Environmental Change Network database, Centre for Ecology and Hydrology , Lancaster http://www.ecn.ac.uk/Database/get_sandm.asp?st=R
Quarterly and/or annual average nutrient concentrations in individual rivers, 1994-2003.
Bush Garvery Faughan
Irish Republic
Environmental protection Agency, Ireland http://www.epa.ie/NewsCentre/ReportsPublications/Water/FileUpload,6708,en.pdfToner, P. et al. (2005). Water Quality in Ireland 2001-2003, page 32
1980-2002 annual average nitrate mgl-1 Barrow Nore Slaney Suir
Norway Norwegian Pollution Control Authority http://www.sft.no/publikasjoner/vann/2147/ta2147.pdfBorgvand, S.A. (2006). Riverine inputs and direct discharges to Norwegian coastal waters – 2004. (TA-2147/2006). Study undertaken by the Norwegian Institute for Water Research - NIVA
Annual average concentration of nitrate and total nitrogen in Norwegian rivers.
Otra Skienselva Numedalslaagen Drammenselva Glomma
Sweden Department of Environmental Assessment
http://info1.ma.slu.se/ma/www_ma.acgi$Project?ID=StationsMap&P=FLODMYNN&M=default
1967-2005, sample-by-sample, tota l nitrogen, nitrate and nitr ite at monit oring sites on rivers flowing into the Skagerrak and Kattegat.
Munkendal Alelyckan Asbro Halmstad
France Centre d’Enseignement dt de Recherche Eau Ville Environment http://www.enpc.fr/cereve/HomePages/thevenot/piren-
Annual average nitrate concentrations, 1900-1992.
River Seine

models.pdf

TABLE 13 - Sources of river nutrient flux data (mass of nitrogen per unit time) Nation Source Description SitesScotland Provided by A. Edwards (Macaulay Land Use Research
Institute) for Heath et al. 2002 Daily mass of nitrate and nitrite discharged to each coastal cell from the entire land catchment for 1984, 1987 and 1990.
29 coastal cells
England and Wales
Provided by A. Edwards (Macaulay Land Use Research Institute) for Heath et al. 2002
Monthly mass of nitrate and nitrite discharged to each coastal cell from the entire land catchment for 1984, 1987 and 1990.
19 coastal cells
Northern Ireland
Provided by A. Edwards (Macaulay Land Use Research Institute) for Heath et al. 2002
Monthly mass of nitrate and nitrite discharged to each coastal cell from the entire land catchment for 1990.
8 coastal cells
Irish Republic
Provided by A. Edwards (Macaulay Land Use Research Institute) for Heath et al. 2002
Monthly mass of nitrate and nitrite discharged to each coastal cell from the entire land catchment for 1990.
8 coastal cells
Norway Norwegian Pollution Control Authority http://www.sft.no/publikasjoner/vann/2147/ta2147.pdfBorgvand, S.A. (2006). Riverine inputs and direct discharges to Norwegian coastal waters – 2004. (TA-2147/2006). Study undertaken by the Norwegian Institute for Water Research - NIVA
2004 annual input of nitrate from Norwegian rivers to coastal assessment regions. Observed and flow normalised annual nitrogen inputs to the coastal zone from individual Norwegian rivers, 1991-2004.
Skagerrak region North Sea region Otra Skienselva Numedalslaagen Drammenselva Glomma
Sweden Swedish Environmental Protection Agency http://www.internat.naturvardsverket.se/index.php3?main=/documents/pollutants/overgod/eutro/flode.html
1969-2001 annual nitrogen input to the Skagerrak and Kattegat.
Southern Sweden
Denmark Ærtebjerg, et al. 2003 http://www2.dmu.dk/1_Viden/2_Miljoetilstand/3_vand/4_eutrophication/inputs.asp
2001 nitrog en mass in put from Denmark to coastal regions.
North Sea
Skagerrak Germany, Netherlands and
University of Hamburg http://www.ifm.uni-
Daily mass of nutrients input to the coastal zone from individual rivers, 1955-1993.
Elbe, Weser Jade

Belgium hamburg.de/~wwwem/dow/ERSEM/ERSEM.ZIPPätsch and Radach 1997 ftp://ftp.ifm.zmaw.de/pub/data/riverload/Pätsch and Lenhart 2004
Daily mass of nutrients input to the coastal zone from individual rivers, 1977-2002.
Ems Lysselo Lysselw Lauer Ijmuiden Rhine Meuse Scheldt Yzer Elbe Weser Ems Ijssel Nordzeekanaal Nieuwewaterweg Haringvlet Scheldt
France Aminot et al. 1997 Cugier et al. 2005 The Progress Report on the Fifth North Sea Conference. Compilation of submitted inputs to the progress report of the Fifth North Sea Conference. Further reductions of nutrient inputs to the North Sea. Part II: Inputs of nutrients using HARP-NUT Guidelines. The North Sea Secretariat, 2002.
1976-1994 annual mass of nitrate and nitrite input to the Bay of the Seine. Average annual mass of nitrogen input to the Bay of the Seine. Annual mass of nitrate and nitrite discharges by various rivers, 1989-2000.
River Seine Rivers Seine, Orne, Vire and Douve Rivers Canche, Authie, Somme, Wimereux, Liane, Aa, Slack, Saire, Divette,

http://odin.dep.no/filarkiv/160835/Nutrient-Compl.doc Touques, Dives,Orne, Seulles, Vire, Seine, Andelle and Eure
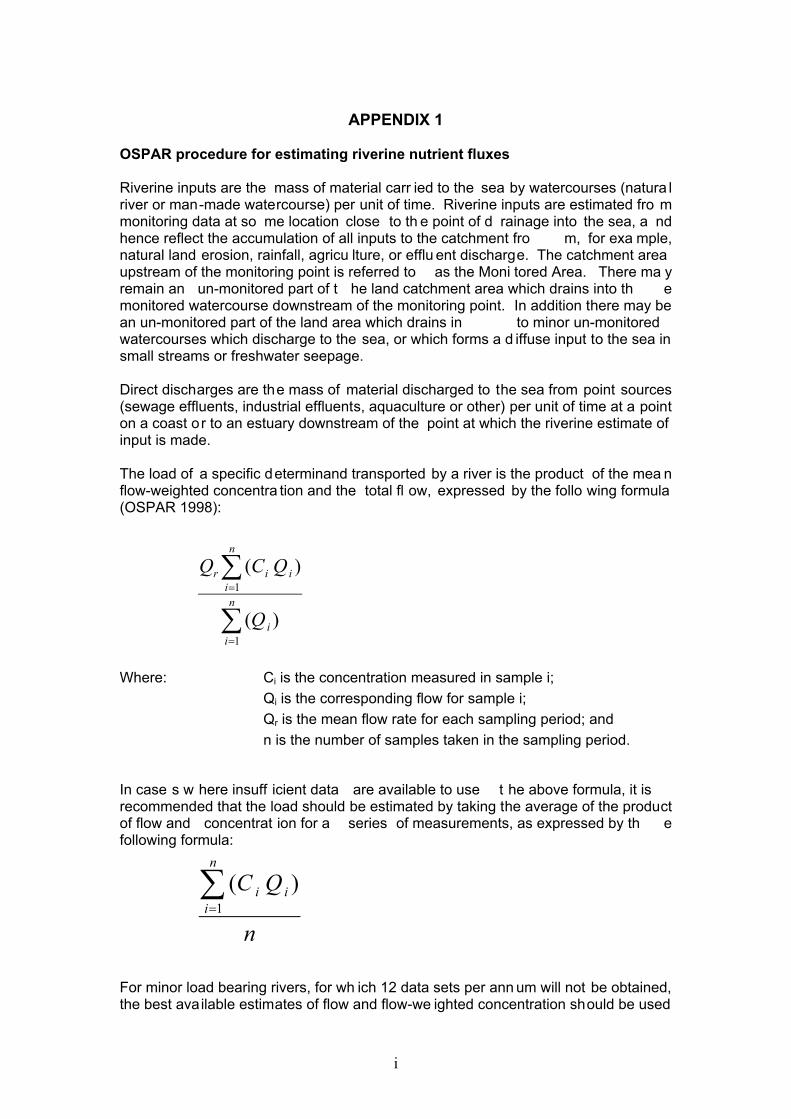
APPENDIX 1
OSPAR procedure for estimating riverine nutrient fluxes Riverine inputs are the mass of material carr ied to the sea by watercourses (natura l river or man-made watercourse) per unit of time. Riverine inputs are estimated fro m monitoring data at so me location close to th e point of d rainage into the sea, a nd hence reflect the accumulation of all inputs to the catchment fro m, for exa mple, natural land erosion, rainfall, agricu lture, or efflu ent discharge. The catchment area upstream of the monitoring point is referred to as the Moni tored Area. There ma y remain an un-monitored part of t he land catchment area which drains into th e monitored watercourse downstream of the monitoring point. In addition there may be an un-monitored part of the land area which drains in to minor un-monitored watercourses which discharge to the sea, or which forms a d iffuse input to the sea in small streams or freshwater seepage. Direct discharges are the mass of material discharged to the sea from point sources (sewage effluents, industrial effluents, aquaculture or other) per unit of time at a point on a coast or to an estuary downstream of the point at which the riverine estimate of input is made. The load of a specific determinand transported by a river is the product of the mea n flow-weighted concentra tion and the total fl ow, expressed by the follo wing formula (OSPAR 1998):
∑
∑
=
=n
ii
n
iiir
Q
QCQ
1
1
)(
)(
Where: Ci is the concentration measured in sample i; Qi is the corresponding flow for sample i; Qr is the mean flow rate for each sampling period; and n is the number of samples taken in the sampling period.
In case s w here insuff icient data are available to use t he above formula, it is recommended that the load should be estimated by taking the average of the product of flow and concentrat ion for a series of measurements, as expressed by th e following formula:
n
QCn
iii∑
=1)(
For minor load bearing rivers, for wh ich 12 data sets per ann um will not be obtained, the best available estimates of flow and flow-we ighted concentration should be used
i

to estimate contaminant loads. Tributaries which discharg e directly into the salin e estuaries o f major river systems may fall into this cate gory. In the absence of estimates of flow and fl ow-weighted concentra tion, estimates of contaminant loads based on per capita or per hectare calculations may be used.
Quantification of losses of nitrogen and phosph orus from unmonitored areas can b e achieved by the application of OSPAR HARP-NUT draft Guideline 6 (OSPAR 2004b) in respect of diffuse losses of nitrogen and phosphorus, or the extrapolation of diffuse losses monitored in a neighbouring area wi th similar physical con ditions (soil, climate, topography) and land-use conditions; and the summation of all monitored or estimated discharges fr om point sources in a complimentary catchment, using a retention coefficient where appropriate (cf. OSPAR HARP NUT Guideline 9; OSPAR 2004c).
ii

APPENDIX 2
Description of the esti mation of nitrate + nitrite fluxes from Scotland, England and Wales to coastal cells for th e years 1984, 1987 and 1990, from Heath et al. (2002) (Carried out b y A Edw ards, Macaul ay land Use Research Institute, Aberdeen).
UK data on riverine co ncentrations of nutrients and conta minants are collected a s part of the Harmonised Monitoring Scheme (HMS), which is separate from th e monitoring of river flows (National River Flow Archive, NRFA), though in many cases the monitoring location s coincide. Ad ministratively, the data for Scotland are collected and archived separately from those for England and Wales.
Delineation of drainage area boundaries for each ERSEM coastal box Apportioning the land a rea draining into each coastal cell was achieved by using a combination of visual int erpretation of OS maps and a Digital Elevation Model. The final designations for Scotland, England and Wales as a whole, which for the purpose of this repor t are identified as basin s are shown in Figure A2.1. Note that for some cells (e.g. cell 100), where the drainage basin straddles both Scotland and England, the basin has been divided into two parts along the national boundary.
Figure A2.1 Land area of the UK (excluding Northern Ireland) divided into th e drainage basins corresponding to each of the coastal cells of the ERSEM model.
iii

Some of th e physical attributes of the Scottish basins ha ve been summarised i n Table A2.1. Land cover statistics (L CS, 1988) were ascribed to ea ch basin broadly defining the proportions of agricult ural (arable and improved grassla nd) and no n-agricultural (including moorland, urban, forest ry and rou gh grass) land. Twelve basins area s are so lely located o n the mainla nd a further 8 consist of combined mainland/island while 10 consist of only islands, these account for 63 % , 28 % and 9 % of the total land area respectively (Table A2.1). Table A2.1 Estimated Scottish land areas draining into individual coast al cells and the proportion of agricultural land (arable and improved grazing). ERSEM cell ID associa ted with land drainage basin
Area (km2)
Percentage Agricultural
4 655.8 13.6 5 587.2 14.7 12 74.3 33.9 13 142.4 18.7 18 269.2 61.9 19 7.9 20.8 25 300 4.7 26 366.6 0.8 27 953.9 1.4 28 1882.5 12.3 29 1247.6 47.6 32 8.6 0.0 33 802.1 4.7 34 2033.4 3.3 35 10739.2 12.0 36 4548.9 29.8 37 115.6 85.0 46 758.6 17.5 47 4894.0 3.4 48 904.4 1.6 49 1301.7 86.5 52 91.6 12.9 53 1636.1 3.6 54 5411.3 39.5 64 4810.6 2.4 65 11860.3 38.6 72 621.1 16.4 73 1082.3 13.0 74 8166.8 32.0 75 4503.4 47.3 87 1308.0 41.9 100 6753.0 33.4 Total 78838.2 25.7
Estimation of daily discharge for each coastal cell Daily and monthly flows (m 3s-1) were compiled for rivers rep resented in the National Flow Archives (NRFA - Yearbooks, 1984, 1987 and 1990) and each river catchment ascribed to the appropriate coasta l cell. Where more than one gauged catchment
iv
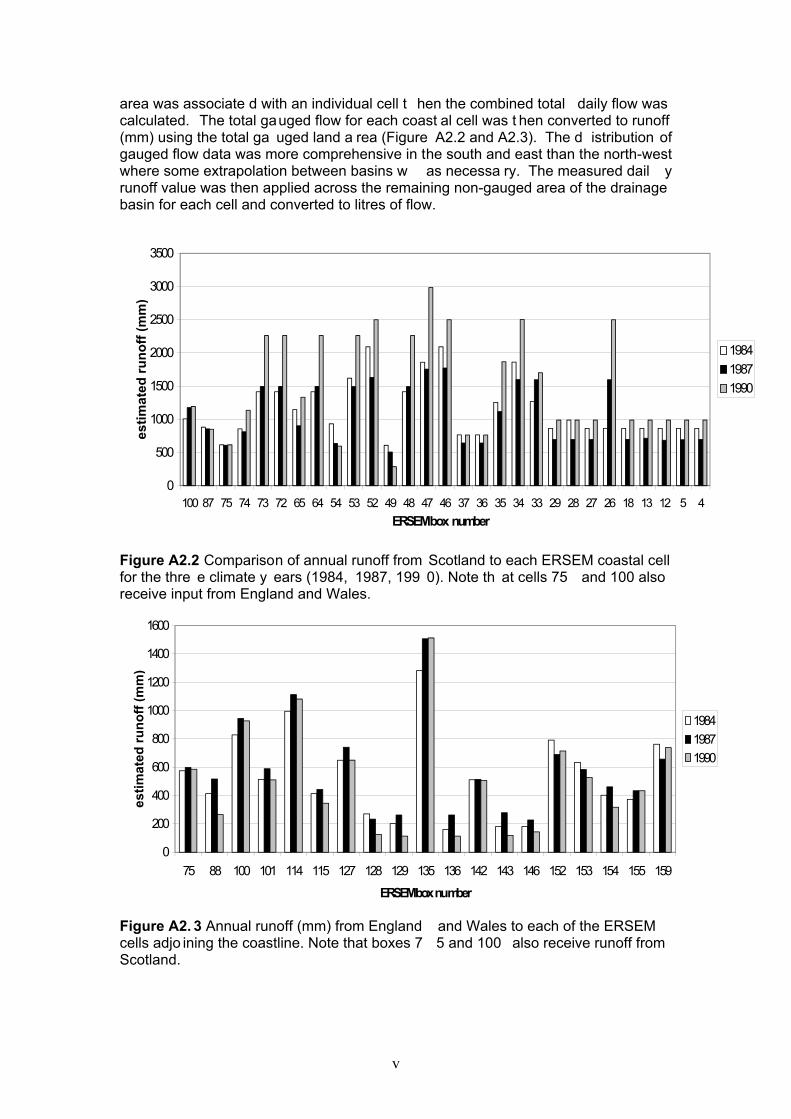
area was associate d with an individual cell t hen the combined total daily flow was calculated. The total gauged flow for each coast al cell was t hen converted to runoff (mm) using the total ga uged land a rea (Figure A2.2 and A2.3). The d istribution of gauged flow data was more comprehensive in the south and east than the north-west where some extrapolation between basins w as necessa ry. The measured dail y runoff value was then applied across the remaining non-gauged area of the drainage basin for each cell and converted to litres of flow.
0
500
1000
1500
2000
2500
3000
3500
100 87 75 74 73 72 65 64 54 53 52 49 48 47 46 37 36 35 34 33 29 28 27 26 18 13 12 5 4ERSEM box number
estim
ated
runo
ff (m
m)
198419871990
Figure A2.2 Comparison of annual runoff from Scotland to each ERSEM coastal cell for the thre e climate y ears (1984, 1987, 199 0). Note th at cells 75 and 100 also receive input from England and Wales.
0
200
400
600
800
1000
1200
1400
1600
75 88 100 101 114 115 127 128 129 135 136 142 143 146 152 153 154 155 159
ERSEM box number
estim
ated
runo
ff (m
m)
198419871990
Figure A2. 3 Annual runoff (mm) from England and Wales to each of the ERSEM cells adjo ining the coastline. Note that boxes 7 5 and 100 also receive runoff from Scotland.
v
Estimation of daily elemental fluxes from each ERSEM cell The only nationally available r iver compositio nal data set is th e Harmonised Monitoring Scheme (HMS), which consists o f approximat ely monthly samples p er year for some 58 catch ments in Scotland and an equivalent number in England a nd Wales. In general the HMS sites are located at the lowest non-tidal points Note not all HMS site s and NRF A are common. In th e majority of case s flow at the time of sampling or a daily average flow is included for each water sample. Not all elements are of equal reliability (see Ferrier et al., 2001 for a recent review of the data) Calculation of flow weighted concentrations (FWC) All available data for the individual years 1984, 1987 and 1990 were collated, an d flow weighted average annual concentrations of suspended solids, nitrate+nitrite, ammonium, orthophosphate, silicate and disso lved organic carbon (not available fo r all sites) calculated for each river catchment in the HMS (sum of i nstantaneous loads/total flow). Note – the choice was made to treat the years separa tely because they were selected to b e ‘extreme’ cases and it was consid ered that this m ay affect the subsequent relationships with la nd cover. One important lim itation is that spot samples tend to be biased to lower f low conditions, but this is com pensated to some degree by using daily flows and a flow weighted mean concentration. Relationships between land cover and FWC Land cover attributes were ascrib ed to each HMS ri ver catchment area. For Scotland, t he proportions of ‘Agricultural’, ‘Non-agricultur al’ and ‘Fo restry/rough grass’ for all HMS catchments are shown in Fig ure A2.4. The HMS catchments as a whole acco unt for approximately 5 0% of the total Scottish land area (Figure A2.5, A2.6) altho ugh importantly they do cover a wide rang e of land use conditions (ranging from 0 – 95% agriculture). The relatio nships between FWC and proportio n of agricultur al land (Ed wards et al ., 2000) were found to be statist ically significan t (Figure A2.7). Using these regression equatio ns and the proportion of agricultura l land in the catchment of each coastal cell (Table A2.1), individual average FWC were produced. These FWC were used i n combination with daily river flows to produce a daily elemental flux for each cell.
vi

Agricultural
0 10 20 30 40 50 60 70 80 90 100
Non-agricultural
0
10
20
30
40
50
60
70
80
90
100
Forestry/rough grass
0
10
20
30
40
50
60
70
80
90
100
Figure A2.4 Comparison of main la nd cover att ributes for the Scottish Harmonised Monitoring Scheme (HMS) sites. The catch ments shown in Figure 2.4 (each represented by circular symbol in the tr iangular diagram) were charact erised by the percentage contributions of agricu ltural, non-a gricultural, and forestry/rough grass land usage
Figure A2. 5 Extent of Scottish Harmonised Monitoring Scheme catchments (in green) in relation to the land area of Scotland.
vii
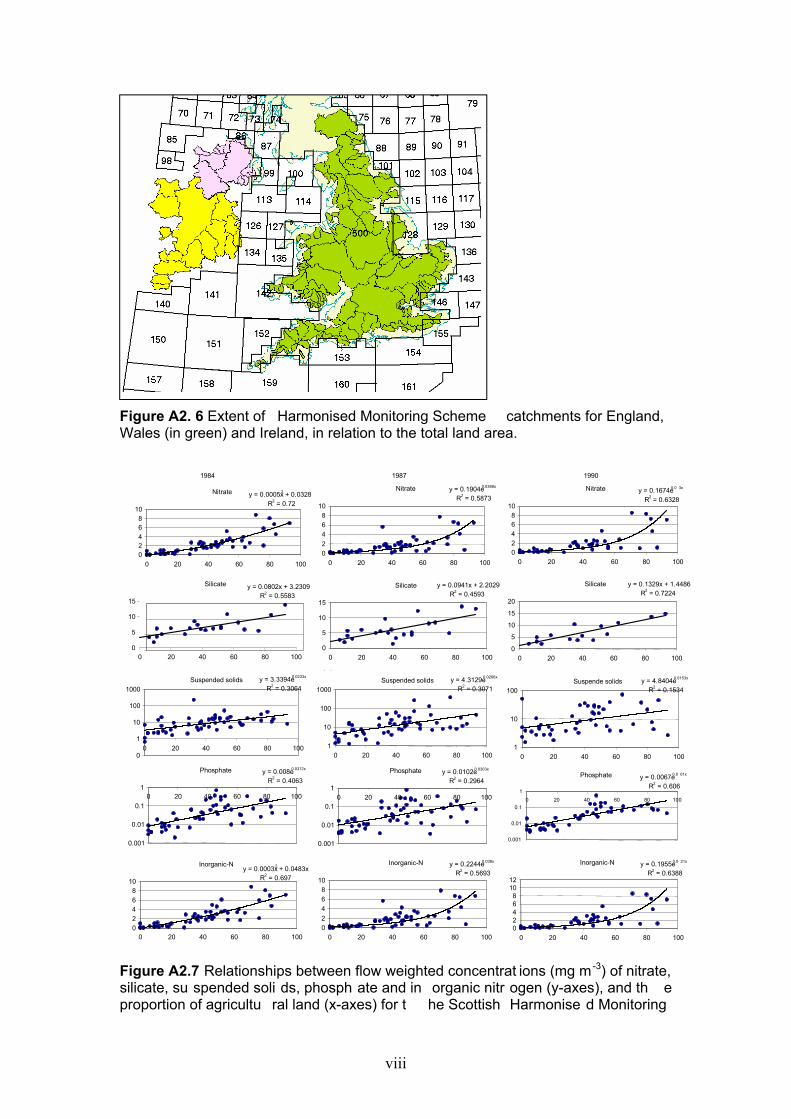
Figure A2. 6 Extent of Harmonised Monitoring Scheme catchments for England, Wales (in green) and Ireland, in relation to the total land area.
1984 1987 1990
S SS S
Nitrate y = 0.0005x2 + 0.0328R2 = 0.72
02468
10
0 20 40 60 80 100
Silicate y = 0.0802x + 3.2309R2 = 0.5583
0
5
10
15
0 20 40 60 80 100
Phosphate y = 0.008e0.0372x
R2 = 0.4063
0.001
0.01
0.1
10 20 40 60 80 100
Suspended solids y = 3.3394e0.0233x
R2 = 0.3064
0
1
10
100
1000
0 20 40 60 80 100
Inorganic-Ny = 0.0003x2 + 0.0483x
R2 = 0.697
02468
10
0 20 40 60 80 100
Nitrate y = 0.1904e0.0388x
R2 = 0.5873
02468
10
0 20 40 60 80 100
Silicate y = 0.0941x + 2.2029R2 = 0.4593
0
5
10
15
0 20 40 60 80 100
Phosphate y = 0.0102e0.0303x
R2 = 0.2964
0.001
0.01
0.1
10 20 40 60 80 100
Inorganic-N y = 0.2244e0.038x
R2 = 0.5693
02468
10
0 20 40 60 80 100
Suspended solids y = 4.3129e0.0266x
R2 = 0.3071
1
10
100
1000
0 20 40 60 80 100
Nitrate y = 0.1674e0.0 3x
R2 = 0.6328
02468
10
0 20 40 60 80 100
Silicate y = 0.1329x + 1.4486R2 = 0.7224
0
5
10
15
20
0 20 40 60 80 100
Phosphate y = 0.0067e0.0 01x
R2 = 0.606
0.001
0.01
0.1
10 20 40 60 80 100
Inorganic-N y = 0.1955e0.0 21x
R2 = 0.6388
02468
1012
0 20 40 60 80 100
Suspende solids y = 4.8404e0.0153x
R2 = 0.1534
1
10
100
0 20 40 60 80 100
Figure A2.7 Relationships between flow weighted concentrat ions (mg m -3) of nitrate, silicate, su spended soli ds, phosph ate and in organic nitr ogen (y-axes), and th e proportion of agricultu ral land (x-axes) for t he Scottish Harmonise d Monitoring
viii

Scheme catchments. L eft column, 1984; centr e column, 1 987; right column, 1990. Coefficients of the fitted relationships and r2 values are shown for each graph.
Description of the esti mation of nitrate + nitrite inputs from Northern Ireland and the Irish Republic to coastal cells for 1984, 1987 and 1990, from Heath et al. (2002) (Carried out b y A Edw ards, Macaul ay land Use Research Institute, Aberdeen). The drainage areas for each coastal cell adjoining the Irish coastline were estimated from ordinance survey maps. For the Ir ish Republic, long-t erm annual flows for the largest rivers and compositional d ata were obtained fro m the Irish Environme ntal Protection Agency. Fl ow data, b ut no detailed compositional data, for Northern Ireland rivers were obtained from NRFA annual reports. In the absence of nutrient concentr ation data f or Northern Ireland rivers, these wer e assumed to be the sa me as for Irish Republic rivers flowing into nearby ERSEM boxes. Of the three climate yea rs under investigation, d ata for calculating monthly nutrient fluxes were available o nly for 1990 . Hence a crude extrapolation wa s required t o estimate the fluxes for 1 984 and 1987. Fluxes for 1984 were estimatin g by applying the month-specific ratio of 1984:1990 runoff to coastal ERSEM boxes adjoining the western seaboard of En gland, Wales and Scot land. The e quivalent procedure was employed to estimate 1987 fluxes.
ix
Related Documents