FRI—UW—8615 December 1986 PUGET SOUND DREDGE DISPOSAL ANALYSIS (PSDDA) DISPOSAL SITE INVESTIGATIONS: PHASE 1 TRAWL STUDIES IN SARATOGA PASSAGE, PORT GARDNER, ELLIOTT BAY AND COMMENCEMENT BAY, WASHINGTON Principal Investigators Paul A. Dinnel, David A. Armstrong, Bruce S. Miller, Robert F. Donnelly Fisheries Research Institute, School of Fisheries University of Washington, Seattle Part I Crab and Shrimp Studies by Paul A. Dinnel, David A. Armstrong, and Anthony Whiley Part II Demersal Fish Studies by Robert F. Donnelly, Bruce S. Miller, Robert R. Lauth, and Shelley C. Clarke FINAL REPORT 31 December 1986 for Washington Sea Grant Program in Cooperation with Seattle District, U.S. Army Corps of Engineers Seattle, Washington Approved: Submitted 31 December 1986 ___ ‘4’, ~~j~pbert Franiis, Director

Welcome message from author
This document is posted to help you gain knowledge. Please leave a comment to let me know what you think about it! Share it to your friends and learn new things together.
Transcript

FRI—UW—8615December 1986
PUGET SOUND DREDGE DISPOSAL ANALYSIS (PSDDA)DISPOSAL SITE INVESTIGATIONS: PHASE 1 TRAWL STUDIES IN SARATOGA
PASSAGE, PORT GARDNER, ELLIOTT BAY AND COMMENCEMENT BAY, WASHINGTON
Principal Investigators
Paul A. Dinnel, David A. Armstrong, Bruce S. Miller, Robert F. DonnellyFisheries Research Institute, School of Fisheries
University of Washington, Seattle
Part I
Crab and Shrimp Studies
by
Paul A. Dinnel, David A. Armstrong, and Anthony Whiley
Part II
Demersal Fish Studies
by
Robert F. Donnelly, Bruce S. Miller, Robert R. Lauth, and Shelley C. Clarke
FINAL REPORT
31 December 1986
for
Washington Sea Grant Program in Cooperation withSeattle District, U.S. Army Corps of Engineers
Seattle, Washington
Approved:
Submitted 31 December 1986 ___ ‘4’,~~j~pbert Franiis, Director
TABLE OF CONTENTS
Page
LIST OF FIGURES iv
LIST OF TABLES viii
LIST OF APPENDICES ix
ACKNOWLEDGEMENTS xiv
EXECUTIVE SUMMARY xv
PART I: Crab and Shrimp Studies 1
INTRODUCTION 1
METHODS 2
Beam Trawl 2
Otter Trawl 2
Sample Sites and Stations 4
RESULTS 11
Dungeness Crab 11
Shrimp 24
DISCUSSION AND CONCLUSIONS 40
Dungeness Crab 40
Shrimp 44
PART II: Demersal Fish Studies 51
INTRODUCTION 51
MATERIALS AND METHODS 52
Laboratory Processing of Fish 58
Flatfish Diseases 58
Environmental Measurements 59
Data Analysis 59
RESULTS 60
11
Commencement Bay.62
Elliott Bay 72
Saratoga Passage 77
Port Gardner 82
DISCUSSION AND CONCLUSIONS 88
The Research Otter Trawl for Documenting
Fish Assemblage 88
Commencement Bay 92
Elliott Bay 93
Saratoga Passage 95
Port Gardner 96
LITERATURE CITED 98
APPENDIX 104
Part I 104
Part II 151
111
LIST OF FIGURES
Part I
No. Page
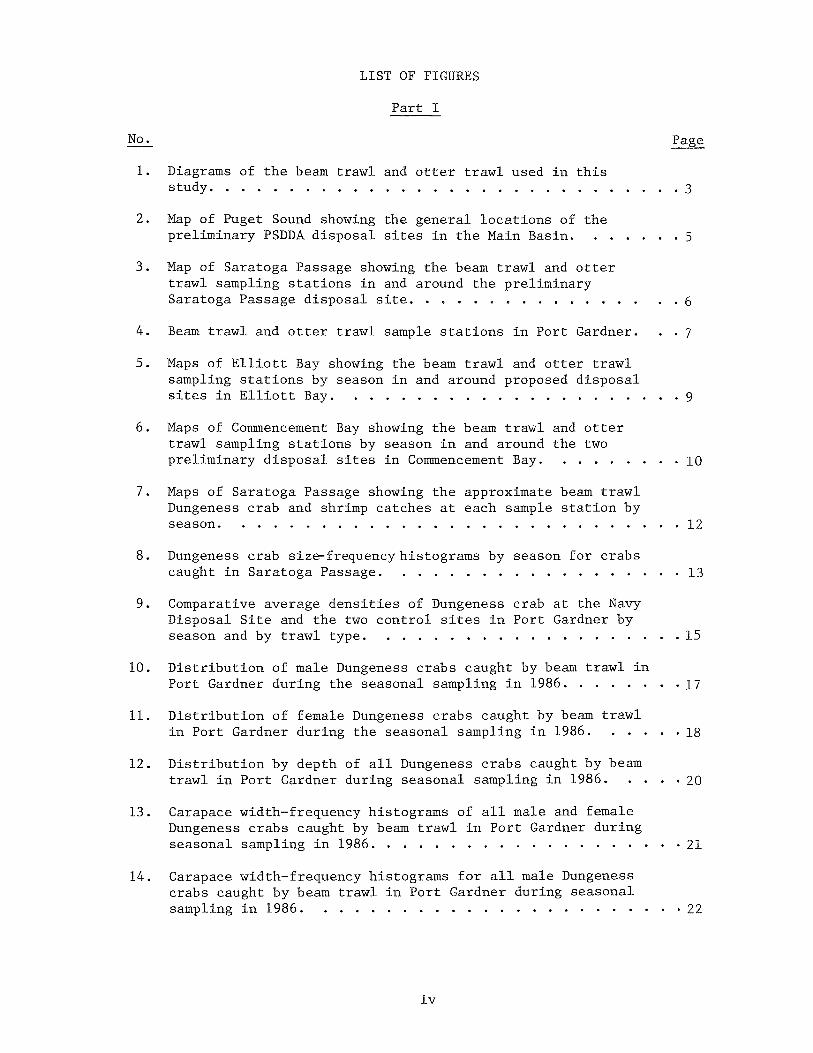
1. Diagrams of the beam trawl and otter trawl used in thisstudy
2. Map of Puget Sound showing the general locations of thepreliminary PSDDA disposal sites in the Main Basin 5
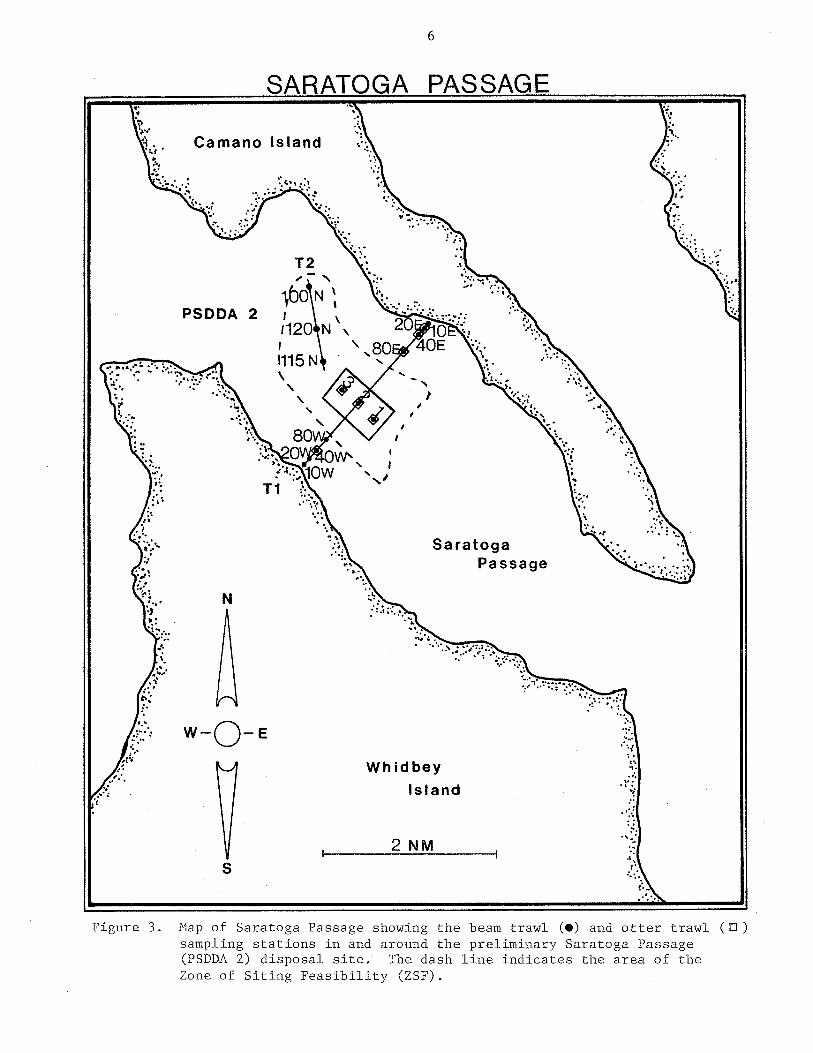
3. Map of Saratoga Passage showing the beam trawl and ottertrawl sampling stations in and around the preliminarySaratoga Passage disposal site 6
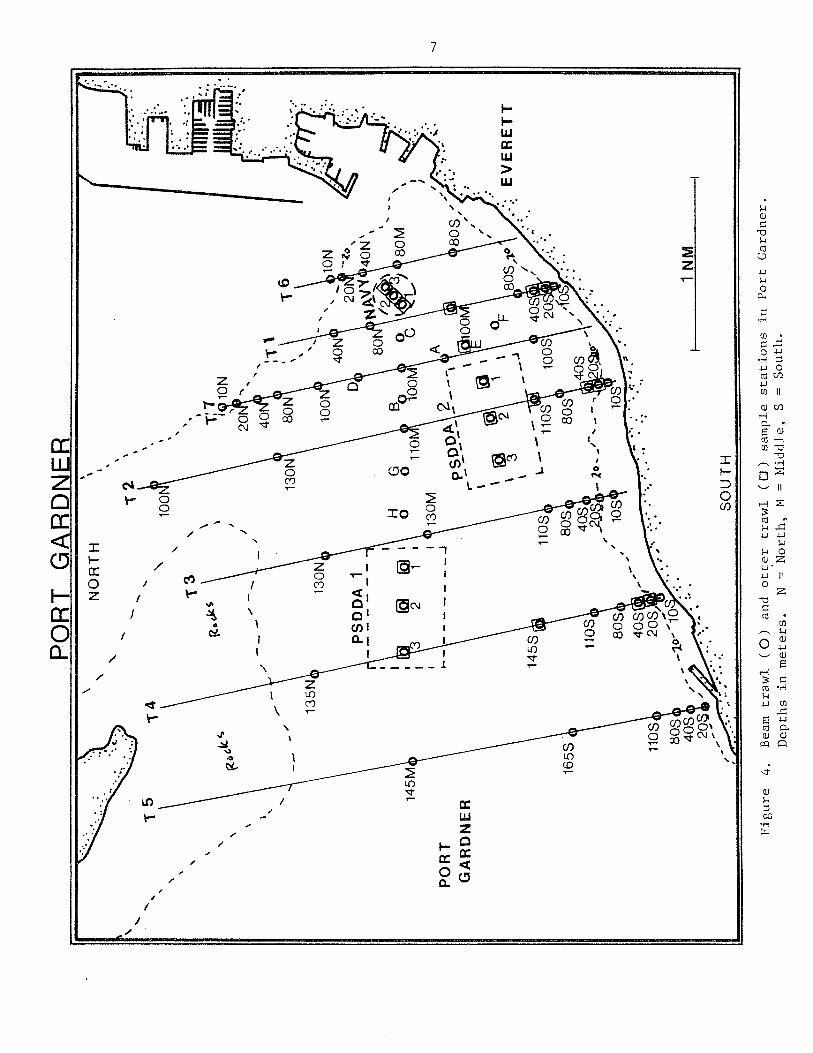
4. Beam trawl and otter trawl sample stations in Port Gardner.
5. Maps of Elliott Bay showing the beam trawl and otter trawlsampling stations by season in and around proposed disposalsites in Elliott Bay 9
6. Maps of Commencement Bay showing the beam trawl and ottertrawl sampling stations by season in and around the twopreliminary disposal sites in Commencement Bay 10
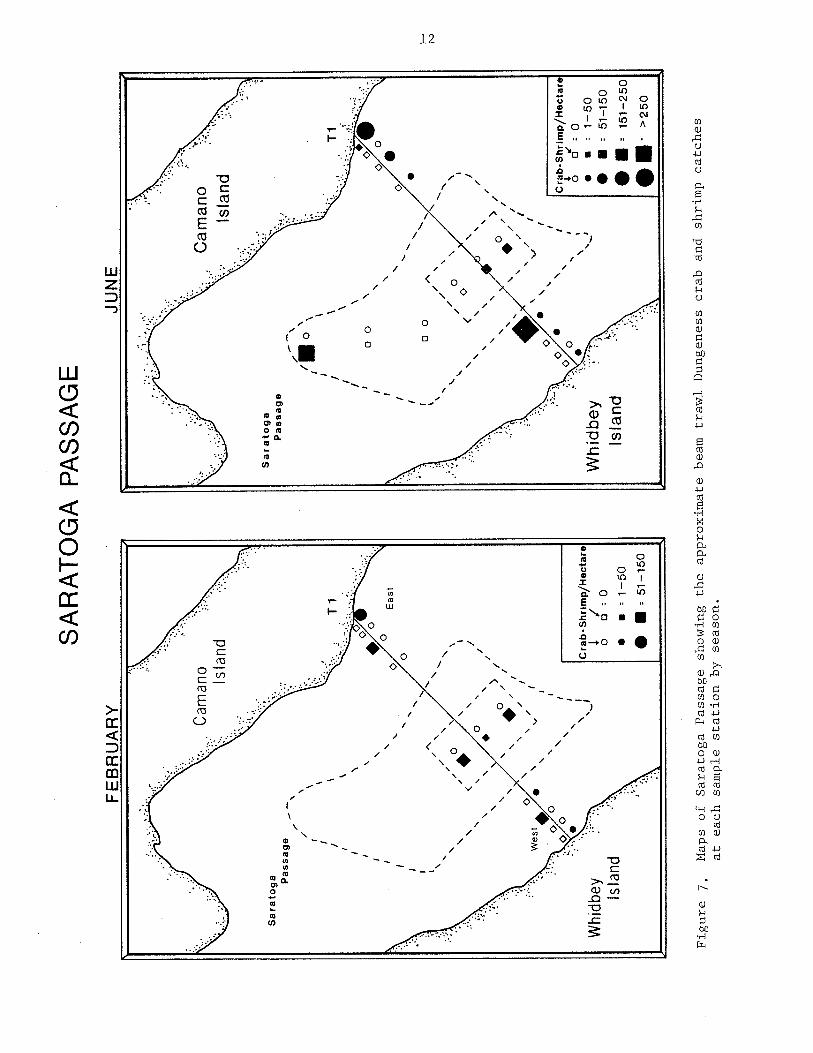
7. Maps of Saratoga Passage showing the approximate beam trawlDungeness crab and shrimp catches at each sample station byseason 12
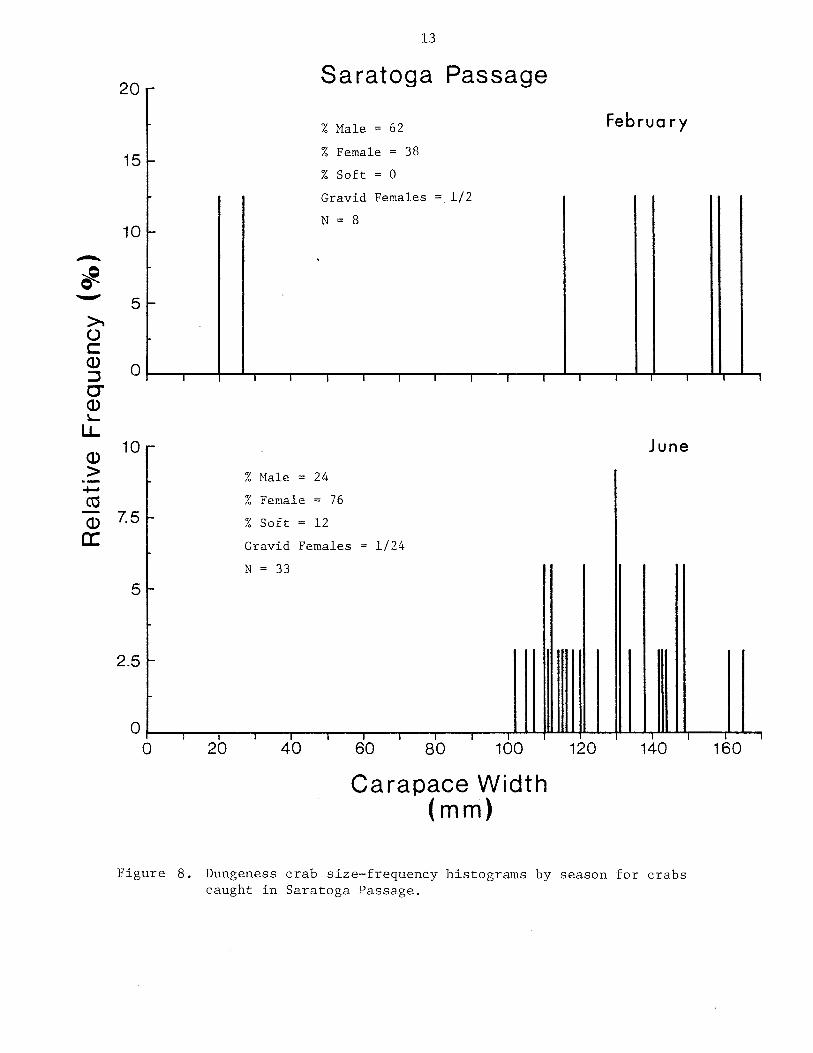
8. Dungeness crab size-frequency histograms by season for crabscaught in Saratoga Passage 13
9. Comparative average densities of Dungeness crab at the NavyDisposal Site and the two control sites in Port Gardner byseason and by trawl type 15
10. Distribution of male Dungeness crabs caught by beam trawl inPort Gardner during the seasonal sampling in 1986 17
11. Distribution of female Dungeness crabs caught by beam trawlin Port Gardner during the seasonal sampling in 1986 18
12. Distribution by depth of all Dungeness crabs caught by beamtrawl in Port Gardner during seasonal sampling in 1986 20
13. Carapace width—frequency histograms of all male and femaleDungeness crabs caught by beam trawl in Port Gardner duringseasonal sampling in 1986 21
14. Carapace width—frequency histograms for all male Dungenesscrabs caught by beam trawl in Port Gardner during seasonalsampling in 1986 22
iv

No. Page
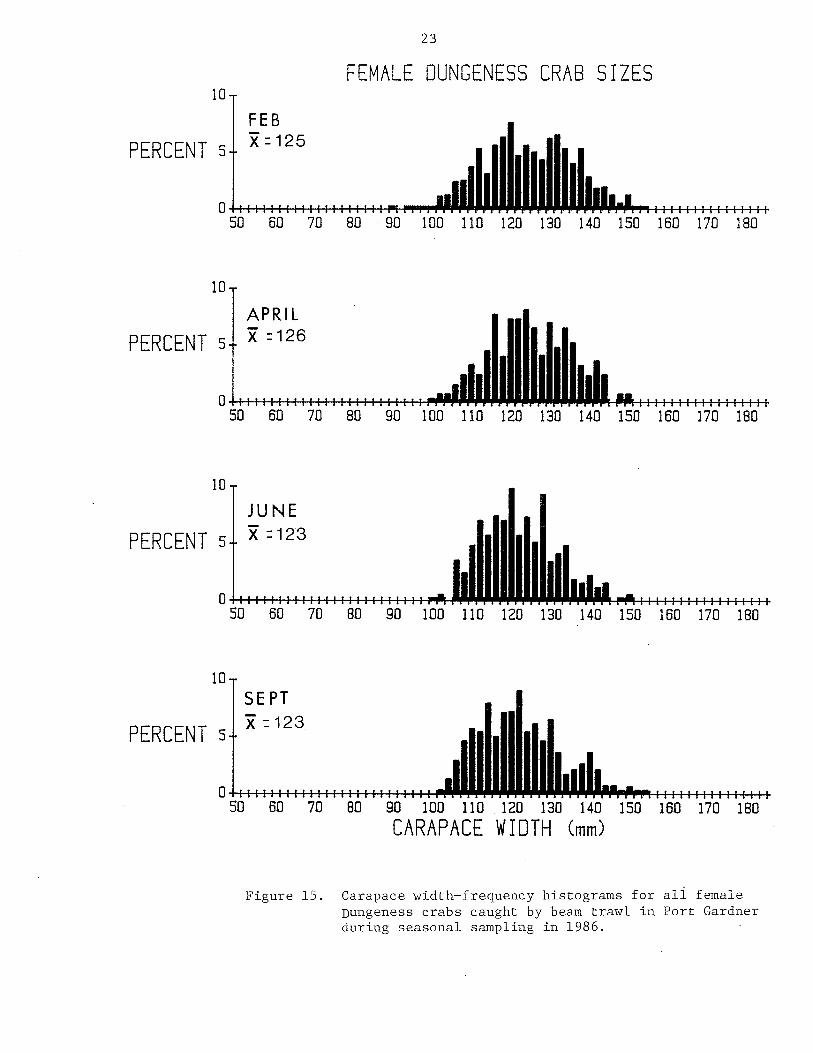
15. Carapace width—frequency histograms for all female Dungenesscrabs caught by beam trawl in Port Gardner during seasonalsampling in 1986 23
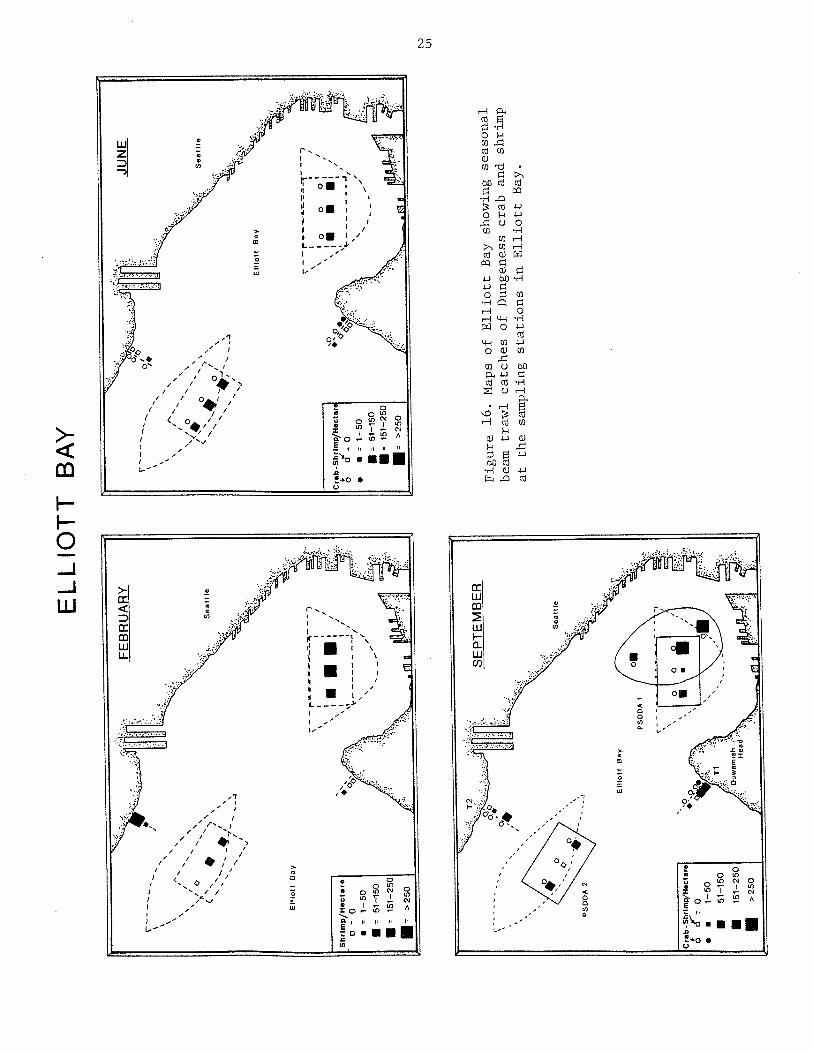
16. Maps of Elliott Bay showing seasonal beam trawl catches ofDungeness crab and shrimp at the sampling stations in ElliottBay 25
17. Beam and otter trawl shrimp catches by species and by seasonfor PSDDA Site 2 in Saratoga Passage 27
18. Distribution of shrimp (all species combined) caught by beamtrawl in Port Gardner during seasonal sampling in 1986 29
19. Distribution by depth of shrimp (all species combined) caughtby beam trawl in Port Gardner during seasonal sampling in1986 30
20. Number of shrimp caught per hectare by both beam and ottertrawls in the three preliminary disposal sites in PortGardner during seasonal sampling in 1986 31
21. Beam and otter trawl shrimp catches by site, by species and byseason for the two Elliott Bay proposed disposal sites 33
22. Maps of Commencement Bay showing beam trawl catches ofshrimp at the sampling stations in Commencement Bay 34
23. Beam and otter trawl shrimp catches by site, by species and byseason for the proposed disposal sites in Commencement Bay. . . 35
24. Distribution by depth and by species for all beam trawl—caught shrimp, all areas (except Port Gardner) and seasonscombined 37
25. Average carapace lengths by species and by depth ranges forall shrimp caught, all seasons and areas (except PortGardner) combined 38
26. Length—frequency histograms for all spot prawn and side—stripe shrimp caught during the three sampling seasons, allareas (except Port Gardner) combined 39
27. Length—frequency histograms for all coonstripe and humpbackshrimp caught during the three sampling seasons, all areas(except Port Gardner) combined 41
28. Length—frequency histograms for all smooth pink and pinkshrimp caught during the three sampling seasons, all areas(except Port Gardner) combined 42
V

No. Page
29. Annual commercial shrimp landing from Puget Sound (includingHood Canal) from 1935 to 1982 46
30. Map of Western Washington showing areas of commercial shrimpproduction from late 1800’s to mid—1930’s 47
Part II
1. Map of Commencement Bay showing locations sampled for bottom—fish on June 13 (summer) and September 8 (autumn) 54
2. Map of Elliott Bay showing locations sampled for bottomfish onJuly 3 (summer) and September 9 (autumn) 55
3. Map of Saratoga Passage showing locations sampled for bottom—fish on July 1 (summer) 56
4. Map of Port Gardner showing the station sampled for bottom—fish 57
5. Number (abundance) of fish caught in Commencement Bay, shownby station and season 63
6. Biomass (in grams) of fish caught in Commencement Bay, shownby station and season 63
7. Number (abundance) of English sole, Dover sole, and ratfishcaught in Commencement Bay during summer and autumn, shownby station 65
8. Biomass (in grams) of English sole, Dover sole, and ratfishcaught in Commencement Bay during summer and autumn 66
9. Species richness (total number of species) of fish caught inCommencement Bay, shown by station and season 67
10. Species diversity (H’) of fish caught in Commencement Bay,shown by station and season 67
11. Length frequency of English sole, shown by sex, caught inCommencement Bay during summer and autumn at 40 m 68
12. Length frequency of English sole, shown by sex, caught inCommencement Bay during autumn at 20 m 69
13. Number (abundance) of fish caught in Elliott Bay shown bystation and season 73
14. Biomass (in grams) of fish caught in Elliott Bay, shown bystation and season 73
vi
No. Page
15. Number (abundance) of English sole, Dover sole, slendersole, ratfish and blackbelly eelpout caught in Elliott Bayduring summer and autumn, shown by station 74
16. Biomass (in grams) of English sole, Dover sole, slendersole, ratfish and blackbelly eelpout caught in Elliott Bayduring summer and autumn, shown by station 75
17. Species richness (total number of species) of fish caughtin Elliott Bay, shown by station and season 76
18. Species diversity (H’) of fish caught in Elliott Bay, shownby station and season 76
19. Length frequency of English sole, shown by sex, caught atPSDDA 2, reference 1, during autumn in Elliott Bay 78
20. Number (abundance) of fish caught in Saratoga Passage duringsummer, shown by station 81
21. Biomass (in grams) of fish caught in Saratoga Passage duringsummer, shown by station 81
22. Number (abundance) of English sole, Dover sole, slendersole, Pacific hake and ratfish caught in Saratoga Passageduring summer, shown by station 83
23. Biomass (in grams) of English sole, Dover sole, slendersole, Pacific hake and ratfish caught in Saratoga Passageduring summer, shown by station 83
24. Species richness (total number of species) of fish caughtin Saratoga Passage during summer, shown by station 84
25. Species diversity (H’) of fish caught in Saratoga Passageduring summer, shown by station 84
26. Number (abundance) of fish caught in Port Gardner, shownby station and season 86
27. Biomass (in grams) of fish caught in Port Gardner, shownby station and season 87
28. Species diversity of fish (H’) caught in Port Gardner, shownby station and season 89
vii

LIST OF TABLES
Part I
No. Page
1. Average shrimp catches, lengths and weights (wet biomass)for all shrimp caught by otter trawl in the proposed PSODAdisposal sites in Saratoga Passage, Port Gardner, ElliottBay and Commencement Bay during all sample months(combined), 1986 45
2. Estimated average shrimp catches per hectare from ottertrawis conducted in selected areas of Hood Canal and PugetSound from 1967 to 1979 49
3. Shrimp weights per hectare from the Elliott Bay preliminarydisposal sites as estimated from the otter trawl catches inJune and September 1986 50
Part II
1. List of bottomfish species caught by otter trawl duringthis study 61
2. Percent incidence and sample size of blood worm Philometrasp. infection in flatfish caught in Commencement Bay, shownby species, station and season 70
3. Environmental measurements of temperature, salinity, andwater clarity in Commencement Bay during autumn by station. . 71
4. Percent incidence and sample size of blood worm Philometrasp. infection in flatfish caught in Elliott Bay, shown byspecies, station and season 79
5. Environmental measurements of water temperature, dissolvedoxygen, salinity and water clarity in Elliott Bay, by stationand season 80
6. Percent incidence and sample size of bloodworm Philonietra sp.infection in flatfish caught at Saratoga Passage duringsummer, shown by station and species 85
7. Percent incidence and sample size of bloodworm Philometra sp.infection in flatfish, shown by species, station and seasonat Port Gardner 90
8. Measurements of temperature, salinity and water clarity bystation and season at Port Gardner 91
viii

LIST OF APPENDICES
Part I
AppendixTable No. Page
1. Saratoga Passage beam trawl station location data 105
2. Summary of Port Gardner beam trawl station location data . 106
3. Elliott Bay beam trawl station location data 109
4. Commencement Bay beam trawl station location data 110
5. Dungeness crab catches per hectare in Saratoga Passageduring February and June 1986 112
6. Beam trawl shrimp catches per hectare in Saratoga Passageduring February and June 1986, and in Elliott and Commencementbays during February, June and September 1986 113
7. Number of shrimp caught per hectare by otter trawl in SaratogaPassage in June, and in Elliott and Commencement bays in Juneand September 1986 115
8. Beam trawl catches of Dungeness crab from Port Gardner duringwinter 117
9. Dungeness crab densities per hectare calculated from beamtrawl catches in Port Gardner during April 1986 121
10. Dungeness crab densities per hectare calculated from beamtrawl catches in Port Gardner during June 1986 . 125
11. Dungeness crab densities per hectare calculated from beamtrawl catches in Port Gardner during September 1986 130
12. Dungeness crab densities per hectare calculated from beamtrawl catches at extra stations in Port Gardner duringSeptember 1986 134
13. Commercial shrimp densities per hectare in Port Gardnercalculated from beam trawl catches in February and April1986 135
14. Densities per hectare of Dungeness crabs and commercialshrimp calculated from otter trawl catches from the Februaryand April cruises in Port Gardner 139
15. Dungeness crab densities per hectare calculated from ottertrawl catches in Port Gardner in June and early July 1986. . 141
ix

AppendixTable No. Page
16. Commercial shrimp densities per hectare calculated from beamand otter trawls in Port Gardner in June and early July1986 143
17. Shrimp densities per hectare calculated from both beam andotter trawl catches in Port Gardner during September 1986. . • 147
18. Shrimp densities per hectare calculated from both beam andotter trawl catches at extra stations in Port Gardner duringSeptember 1986 150
Part II
Appendix
APPENDIX A Analysis of fish data collected by beam trawls inCommencement Bay, Elliott Bay, and Saratoga Passageduring 1986 152
Table 1. Abundance, biomass, species richness and speciesdiversity of fish caught by beam trawl in Commencement Bay during summer 1986 154
Table 2. Abundance, biomass, species richness and speciesdiversity of fish caught by beam trawl in ElliottBay by season 154
Table 3. Abundance, biomass, species richness and speciesdiversity of fish caught by beam trawl in SaratogaPassage during summer 155
APPENDIX B Length—frequency histograms of abundant,non—commercially or recreationally important fishcaught in Commencement Bay and Elliott Bay 156
Figure 1. Length frequency of otter trawl caught ratfish,shown by sex and life history stage, during summerat 156 m in Commencement Bay 157
Figure 2. Length frequency of otter trawl caught ratfish,shown by sex, during summer at PSDDA 1 in Commencement Bay 157
Figure 3. Length frequency of otter trawl caught ratfish,shown by sex and life history stage, during autumnat PSDDA 1 in Commencement Bay 158
Figure 4. Length frequency of otter trawl caught ratfish,shown by sex and life history stage, during summerat PSDDA 1 reference site in Elliott Bay 158
x

Appendix Page
Figure 5. Length frequency of otter trawl caught ratfish,shown by sex, during autumn at PSDDA 2, referencesite 1 in Elliott Bay 159
Figure 6. Length frequency of otter trawl caught ratfish,shown by sex and life history stage, duringautumn at PSDDA 2, reference site 2 in ElliottBay 159
Figure 7. Length frequency of otter trawl caught slendersole, shown by sex and life history stage, duringautumn at PSDDA 1 in Elliott Bay 160
Figure 8. Length frequency of otter trawl caught slendersole males during summer at PSDDA 2 in ElliottBay 160
Figure 9. Length frequency of otter trawl caught slendersole, shown by sex, during autumn at PSDDA 2 inElliott Bay 161
APPENDIX C Abundance and biomass (and range at multiple samplestations) of otter trawl caught fish by station andspecies in Commencement Bay, Elliott Bay, andSaratoga Passage 162
Table 1. Abundance and range at multiple sample stations ofotter trawl—caught fish by station and species inCommencement Bay on June 13, 1986 163
Table 2. Biomass (in grams) and range at multiple samplestations of otter trawl—caught fish by station andspecies in Commencement Bay on June 13, 1986 165
Table 3. Abundance and range at multiple sample stations ofotter trawl—caught fish by station and species inCommencement Bay on September 8, 1986 167
Table 4. Biomass (in grams) and range at multiple samplestations of otter trawl—caught fish by station andspecies in Commencement Bay on September 8, 1986. 169
Table 5. Abundance and range of multiple sample stations forotter trawl—caught fish by station and species inElliott Bay on July 3, 1986 171
Table 6. Biomass (in grams) and range at multiple samplestations for otter trawl—caught fish by station andspecies in Elliott Bay on July 3, 1986 172
xi

Appendix Page
Table 7. Abundance and range at multiple sample stationsof otter trawl—caught fish by station and speciesin Saratoga Passage on July 1, 1986 173
Table 8. Biomass (in grams) and range at multiple samplestations of otter trawl caught fish by station andspecies in Saratoga Passage on July 1, 1986 175
Table 9. Number (abundance) of fish, biomass (in grams) andrange at Navy and PSDDA sites of otter trawl caughtfish by station and species in Port Gardner onFebruary 12 and 13, 1986 177
Table 10. Number (abundance) of fish, biomass (in grams) andrange at Navy and PSDDA sites for otter trawlcaught fish, by station and species in Port Gardneron April 18 and 21, 1986 179
Table 11. Number (abundance) of fish, biomass (in grams) andrange at Navy and PSDDA sites for otter trawlcaught fish by station and species in Port Gardneron June 30 and July 2, 1986 181
Table 12. Number (abundance) of fish, biomass (in grams) andrange at Navy and PSDDA sites for otter trawlcaught fish by station and species in Port Gardneron September 11 and 15, 1986 183
APPENDIX D Abundance and biomass (and range of multiple samplestations) of beam trawl—caught fish by station andspecies in Commencement Bay, Elliott Bay andSaratoga Passage 185
Table 1. Abundance and range of multiple sample stations ofbeam trawl—caught fish by station and species inCommencement Bay during July 1986 186
Table 2. Biomass (in grams) and range at multiple samplestations of beam trawl—caught fish by station andspecies in Commencement Bay during July 1986 187
Table 3. Abundance and range at multiple sample stations ofbeam trawl—caught fish by station and species inElliott Bay during June 1986 188
Table 4. Biomass (in grams) and range at multiple samplestations of beam trawl—caught fish by station andspecies in Elliott Bay during June 1986 189
xii

Appendix Page
Table 5. Abundance and range at multiple sample stationsof beam trawl—caught fish by station and speciesat Elliott Bay during September 1986 190
Table 6. Biomass (in grams) and range at multiple samplestations of beam trawl—caught fish by station andspecies in Elliott Bay during September 1986 191
Table 7. Abundance and range of multiple sample stations ofbeam trawl—caught fish by station and species inSaratoga Passage during June 1986 192
Table 8. Biomass (in grams) and range at. multiple samplestations of beam trawl—caught fish by station andspecies in Saratoga Passage during June 1986 193
APPENDIX E Number of flatfish per hectare caught by otter trawl inCommencement Bay, Elliott Bay, Saratoga Passage, andPort Gardner, shown by season, station and species. 194
Table 1. Number of each flatfish species per hectare caught byotter trawl at each station in Commencement Bayduring summer and autumn 1986 195
Table 2. Number of each flatfish species per hectare caught byotter trawl at each station in Elliott Bay duringsummer and autumn 1986 196
Table 3. Number of each flatfish species per hectare caught byotter trawl at each station in Saratoga Passage duringsummer 1986 197
Table 4. Number of each flatfish species per hectare caught byotter trawl at each station in Port Gardner duringwinter 1986 198
Table 5. Number of each flatfish species per hectare caught byotter trawl at each station in Port Gardner duringspring 1986 199
Table 6. Number of each flatfish species per hectare caught byotter trawl at each station in Port Gardner duringsummer 1986 200
Table 7. Number of each flatfish species caught by otter trawlat each station in Port Gardner during autumn1986 201
xiii

ACKNOWLEDGMENTS
The work was supported by the Washington Sea Grant Program in cooperation
with the Seattle District, U.S. Army Corps of Engineers. We appreciate the
valuable assistance of Louie Echols, Washington Sea Grant Program; Frank
Urabeck, Warren Baxter, Steve Martin and David Kendall of the U.S. Army Corps
of Engineers; and members of the PSDDA Disposal Site Work Group (DSWG). All
trawl work was conducted on board the R.V. Kittiwake skippered by Charles
Eaton. Assistance in the field and laboratory was provided by Russ McMillan,
Tom Wainwright, Greg Jensen, Dan Doty, Debbie Dole, Loann Hallurn, and Sandy
O’Neil. Carol Sisley, Carla Norwood and Kathy Boaz provided assistance with
report preparation.
xiv

EXECUTIVE SUMMARY
The multi—agency Puget Sound Dredge Disposal Analysis (PSDDA)
Program has been delegated the task of evaluating, selecting, monitoring
and managing sites within the inland waters of Washington State for
long—term, unconfined disposal of uncontaminated dredged materials. The
Disposal Site Work Group (DSWG) of PSDDA was assigned the responsibility
of selecting unconfined, open water disposal sites in central Puget
Sound. DSWG selected seven preliminary disposal sites within five Zones
of Siting Feasibility (ZSF’s) in central Puget Sound (Saratoga Passage,
Port Gardner, Elliott Bay and Commencement Bay) based on 19 selection
factors covering physical parameters, human uses and historical
biological resource data. Final site selection is now dependent, in
part, on site—specific trawl investigations for biological resources in
and around each of the five ZSF’s.
This document is the final technical report detailing the results
of trawl studies conducted in each of the five ZSF’s during 1986. This
report is divided into two parts: Part I summarizes the results of
trawling conducted with a small 3—ni research beam trawl especially
useful for capturing Dungeness crab, shrimp and small bottomfish.
Part II details the results of trawling conducted with a research
(7.6 m) otter trawl primarily designed to capture bottomfish of all
sizes.
Initial trawis in central Puget Sound identified three faunal
groups of specific importance to Puget Sound commercial and sport
fisheries: Dungeness crab, pandalid shrimp, and bottomfish (especially
flatfish, Pacific hake, cod, and rockfish). Each of these resources has
been analyzed in this report to provide the best possible biological
xv

data base for the final site selection process and to provide a
“baselin&’ of information for future monitoring of these disposal sites.
It should be noted that the Port Gardner data presented in this report
are essentially abstracted from cruise reports from a closely related
project (Navy Homeport Project). The final analyses of the Port Gardner
data will be available at a later date.
Generally, Dungeness crab were found to be absent from Commencement
Bay, of only minor concern in Elliott Bay and Saratoga Passage, and a
major resource (especially females) in Port Gardner, where this species
will be of primary concern in site selection and future monitoring.
Shrimp were ubiquitous throughout the areas sampled. Shrimp
populations were highly variable depending on such factors as site,
species, depth, season and habitat type. Shrimp populations were
generally insignificant as commercial or sport resources in all of the
five ZSF’s with the possible exception of the inner Elliott Bay ZSF.
Shrimp in this particular area may prove to be a siting concern, although
this area is also heavily impacted by gilinet fishing for salmon, ship
navigation and anchorage, and toxic contaminants in the nearby Duwamish
Waterways.
Bottomfish were sampled by a research trawl and it is important to
understand that the data generated are not comparable to that generated
by commercial trawls, upon which the Washington Department of Fisheries
bases its “flatfish index.~’
Bottomfish were low in abundance, biomass and species diversity at
the Commencement Bay PSDDA sites. In contrast, bottomfish were highest
in abundance, biomass and species diversity at the PSDDA sites in
xvi

Elliott Bay, when compared with the other locations sampled in Elliott
Bay. Saratoga Passage PSDDA sites were not adequately sampled to make
a concluding statement, but WDF studies have previously indicated they
may be an important area to some commercial fishes. Preliminary analysis
of Port Gardner bottomfish indicates that biomass and abundance
decrease with depth and towards the mouth of Port Gardner, and are at
maximum values during the winter.
xvii

PUGET SOUND DREDGE DISPOSAL ANALYSIS (P5DDA)DISPOSAL SITE INVESTIGATIONS
PART I
Crab and Shrimp Studies
by
Paul A. Dinnel, David A. Armstrong, and Anthony Whiley
INTRODUCTION
In January 1986, the Disposal Site Work Group (DSWG) of the Puget Sound
Dredge Disposal Analysis (PSDDA) team, selected preliminary preferred and
alternative sites for the unconfined disposal of dredged materials in the main
basin of Puget Sound (Phase I area). Initial site selections were based on
information gathered from limited field studies conducted within the ZSF’s
(Zones of Siting Feasibility) and existing information from each ZSF.
Selection of final preferred and alternative disposal sites required more
detailed evaluations of important physical factors and biological resources in
and around the identified sites. One of the key factors in choosing final
sites will be an evaluation of important benthic and epibenthic fisheries
resources including Dungeness crab (Cancer magister), commercial (Pandalid)
shrimp and bottomfish.
The purpose of this report is to describe the findings of the trawling
studies conducted in and around each of the preliminary PSDDA disposal sites
during February, April, June and September of 1986. The trawls conducted
during these seasons consisted of beam trawls known to be effective for
capturing Dungeness crab but which also sampled shrimp and smaller bottomfish
incidental to crabs. Demersal fauna were additionally sampled by a medium-
2
sized otter trawl especially effective in capturing larger bottomfish and
shrimp.
METHODS
Beam Trawl
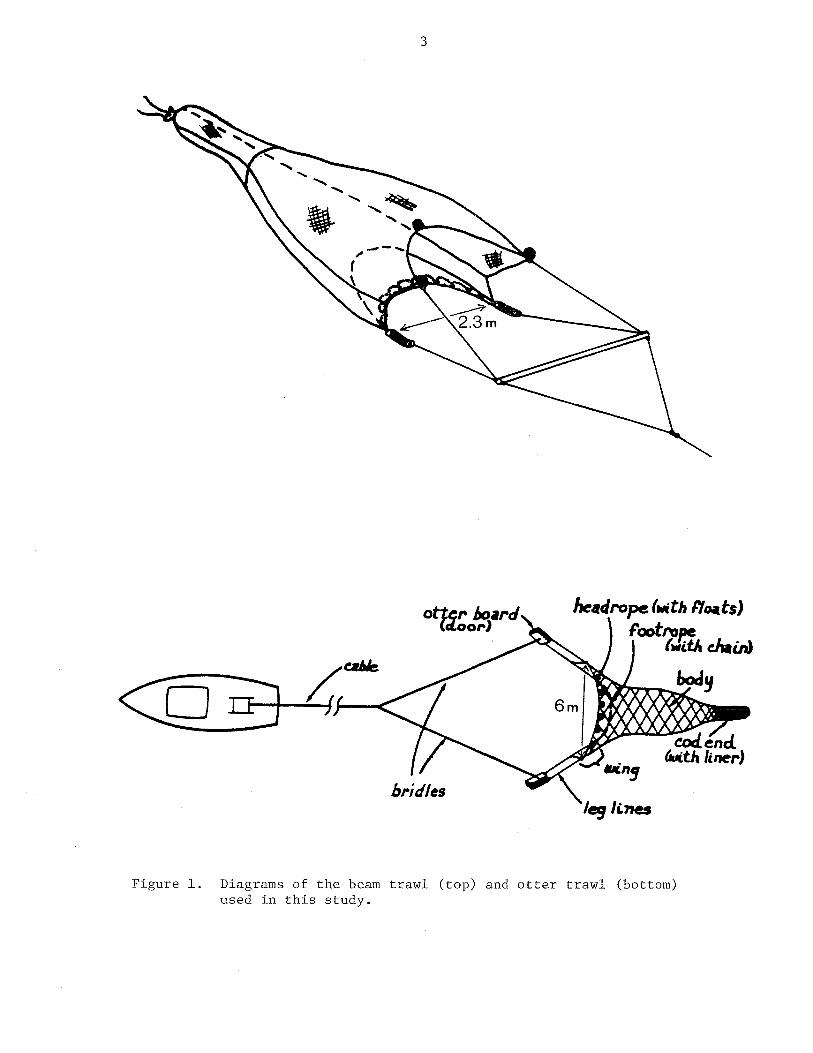
All trawling was conducted aboard the 16 m research vessel Kittiwake.
Dungeness crabs were sampled with a 3 m beam trawl (Figure 1, top; Qunderson
and Ellis 1986) previously used elsewhere in Puget Sound (Dinnel et al. 1985a,
1985b, 1986; Weitkamp et al. 1986). The beam trawl was towed at each station
approximately 232 meters (1/8 nautical mile) at a target ground speed and time
of 2.5 km/hr (1 .5 knots) for 5.5 minutes which yielded an area swept by the
net (opening = 2.3 meters) of 534 m2. All crabs caught in the trawl were
measured, sexed, and assessed for molt condition (degree of shell softness)
and reproductive condition (females with or without eggs) and returned to the
water. Catches of shrimp and fish from the beam trawls were preserved for
later processing in the laboratory.
Otter Trawl
Bottomfish and shrimp were sampled with a 7.6 m otter trawl (Figure 1,
bottom) designed for the Southern California Coastal Water Research Project
(Mearns and Allen 1978). The otter trawl was towed approximately 370 m (i/snautical mile) at a target ground speed and time of 4.2 km/hr (2.5 knots) for
5.3 minutes which yielded an area swept by the net (opening = 6 m) of 2,220
m2. Incidentally caught crabs were processed on board as described above and
returned to the water. Bottomfish and shrimp were identified and counted on
board ship, and then at the end of the day, frozen for later processing in the
laboratory. Laboratory processing for shrimp included identification to
3
Figure 1. Diagrams of the beam trawl (top) and otter trawl (bottom)used in this study~
he4drope (wEth i’Yomts)
cI~w)
brWles1~flg
Ie9 Is.nes
4
species (commercial species only), measurement of carapace lengths and
assessments of reproductive condition (shrimp with or without eggs).
Bottomfish processing included identification to species, measurements for
length and weight, and a check for obvious external abnormalities or parasites
(primarily flatfish). See Part II for further discussion of the bottomfish
methods and results.
Sample Sites and Stations
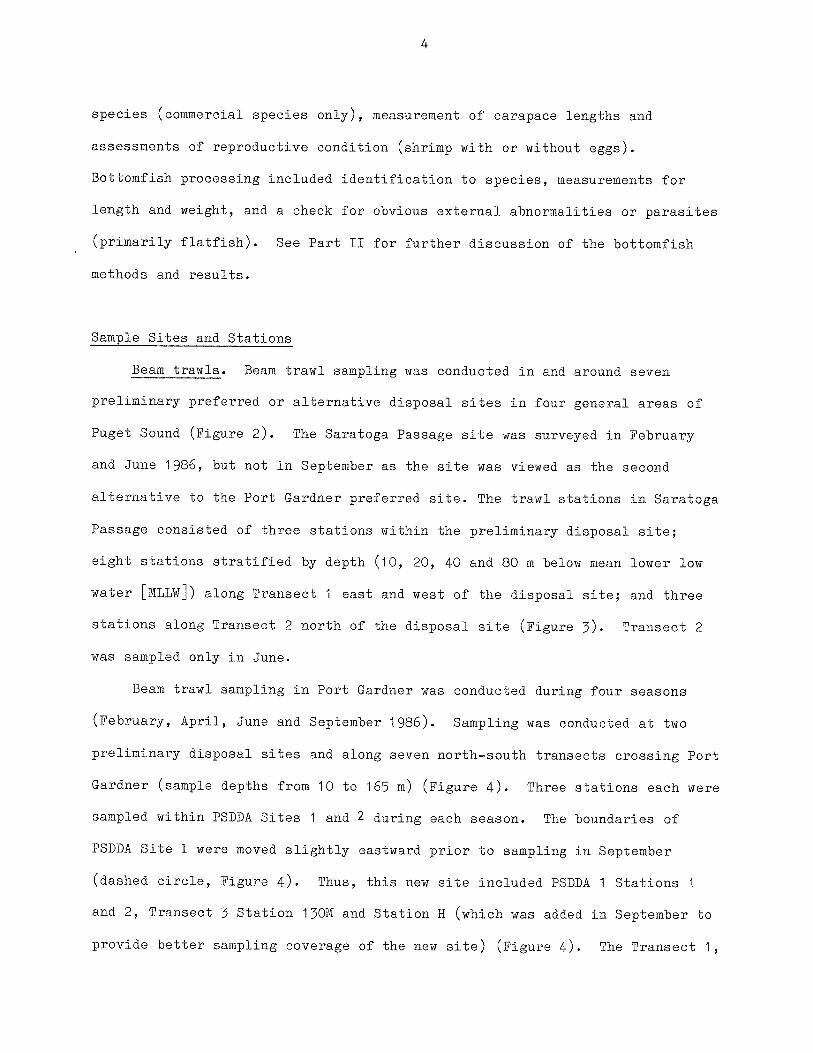
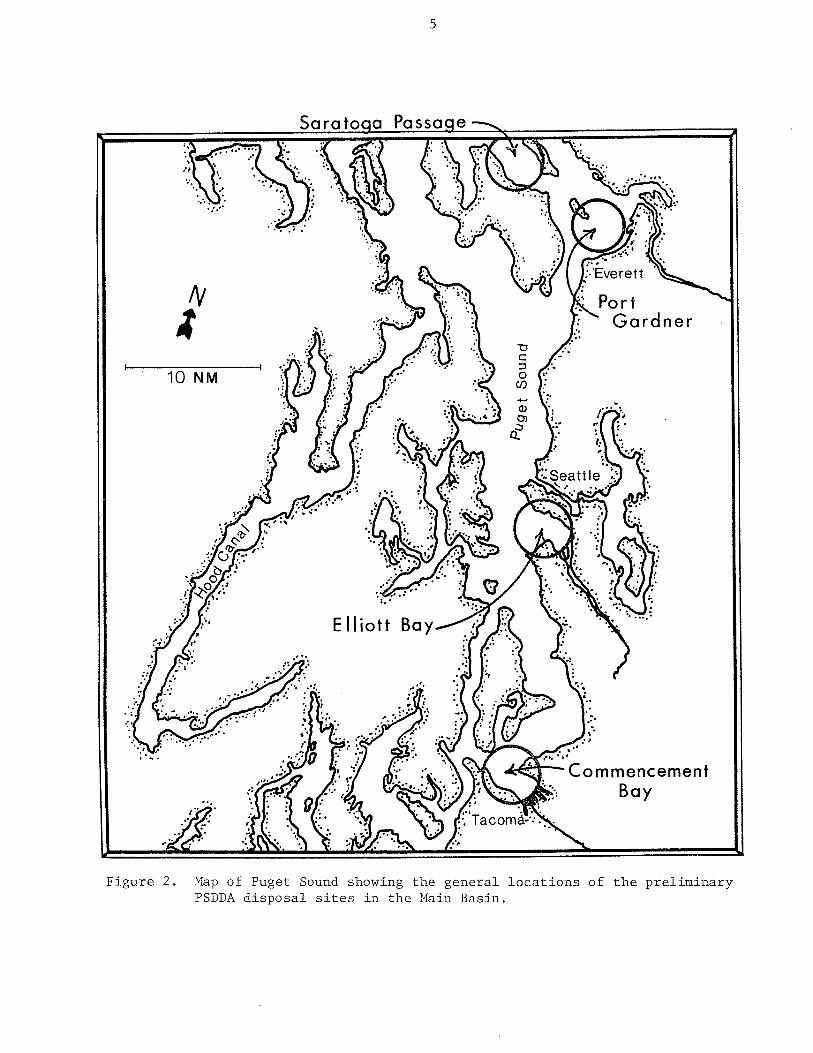
Beam trawls. Beam trawl sampling was conducted in and around seven
preliminary preferred or alternative disposal sites in four general areas of
Puget Sound (Figure 2). The Saratoga Passage site was surveyed in February
and June 1986, but not in September as the site was viewed as the second
alternative to the Port Gardner preferred site. The trawl stations in Saratoga
Passage consisted of three stations within the preliminary disposal site;
eight stations stratified by depth (10, 20, 40 and 80 m below mean lower low
water [MLLW]) along Transect 1 east and west of the disposal site; and three
stations along Transect 2 north of the disposal site (Figure 3). Transect 2
was sampled only in June.
Beam trawl sampling in Port Gardner was conducted during four seasons
(February, April, June and September 1986). Sampling was conducted at two
preliminary disposal sites and along seven north—south transects crossing Port
Gardner (sample depths from 10 to 165 m) (Figure 4). Three stations each were
sampled within PSDDA Sites 1 and 2 during each season. The boundaries of
PSDDA Site 1 were moved slightly eastward prior to sampling in September
(dashed circle, Figure 4). Thus, this new site included PSDDA 1 Stations 1
and 2, Transect 3 Station 130M and Station H (which was added in September to
provide better sampling coverage of the new site) (Figure 4). The Transect 1,
I-,.
0 fr~ 0 t”J
frh
00
~daQ
00
Ort
~c1
~0
00
0 (I)CI
)
H’
0 H’
rt0
CD H’
CD
CD
CD
H’
~i) 0 C) CD rt 0 CI) 0 r-t CD CD CD CD
Lu
6
PSDDA 2
SaratogaPassage
w-Q-E
WhidbeyIsland
2NM
Figure 3. Map of Saratoga Passage showing the beam trawl (.) and otter trawl (D)sampling stations in and around the preliminary Saratoga Passage(PSDDA 2) disposal site. The dash line indicates the area of theZone of Siting Feasibility (ZSF).
PO
RT
GA
RD
NE
R
-I
—
NO
RT
H
SO
UT
H
EV
ER
ET
T
Fig
ure
4.B
eam
tra
wl
(0)
and
ott
er
tra
wl
(0)
sam
ple
sta
tio
ns
inP
ort
Ga
rdn
er.
De
pth
sin
me
ters
.N
=N
ort
h,
MM
idd
le,
S=
So
uth
.

8
40N Station was dropped from the sampling array after February 1986 due to
repeated gear damage at this location. Some additional beam trawl stations
(A—H; Figure 4) were also added in June and September to provide better
sampling coverage of the inner portion of the bay in relation to another
proposed (NAVY) disposal site (Dinnel et al. 1987).
Beam trawl sampling in Elliott Bay was conducted during three seasons
(February, June and September 1986) at two preliminary disposal sites and
along two nearshore transects (10, 20, 40 and 80 m depths) (Figure 5). Three
stations were sampled within PSDDA Site 1 in inner Elliott Bay during February
and June. The location of PSDDA Site 1 was relocated slightly eastward prior
to the September trawls; hence, two additional stations (Stations 4 and 5;
Figure 5) were added to better characterize the resources within the new site.
Three stations were trawled within PSDDA Site 2 (off Fourmile Rock) during all
three seasons. The 40 m depth along Transect 2 off Fourmile Rock was deleted
due to a rough bottom and repeated gear damage.
Beam trawl sampling in Commencement Bay was conducted during three
seasons (February, June and September 1986) at two preliminary PSDDA disposal
sites and along two transects stratified by depth (10, 20, 40, 80 and 120 m
below MLLW) (Figure 6). Three trawis each were made in PSDDA Sites 1 and 2 in
February. By June, PSDDA Site 2 had been relocated to the north of PSDDA Site
1 based on information about relative deposition/erosion potential from the
depositional analysis procedure. This new site (called PSDDA Site 2B in this
report, Figure 5) was trawled together with PSDDA Site 1 in June. PSDDA Sites
1 and 2B were again sampled in September except that a slight shift of PSDDA
Site 1 eastward resulted in the addition of one new station (PSDDA Site 1,
Station 4; Figure 6) during this season. As was the case in Elliott Bay,
rough bottom conditions resulted in the deletion of the 80 m station on the

EL
LIO
TT
BA
Y
Fig
ure
5.M
aps
of
Ellio
ttB
aysh
ow
ing
the
beam
tra
wl
(•)
and
ott
er
tra
wl
(a)
sa
mp
ling
sta
tio
ns
byse
aso
nin
and
aro
un
dth
etw
op
rop
ose
dD
isp
osa
lS
ite
sin
Ellio
ttB
ay.
The
da
she
dlin
ea
rea
sin
dic
ate
the
Zon
eso
fS
itin
gF
ea
sib
ility
(ZS
F).
The
do
tte
dlin
ew
ith
inPS
DD
AS
ite
1(S
ep
tem
be
r)w
asth
esite
orig
ina
lly
se
lecte
dw
ith
inZS
F1
and
the
so
lid
lin
ea
rea
show
sth
ea
pp
roxim
ate
loca
tio
no
fth
en
ew
lylo
ca
ted
site
.

10
COMMENCEMENT BAY
Figure 6. Maps of Commencement Bayshowing the beam trawl (•)and otter trawl (D) samplingstations by season in andaround the two preliminarydisposal sites in CommencementBay. The dashed line areashows the Zone of SitingFeasibility (ZSF). The dottedline areas show areas ofprior locations for thepreliminary disposal sitesand the solid lines show thepresent disposal site locations.

11
west end of Transect 1.
The exact locations, depths and trawl directions for all trawl stations
are recorded in Appendix Tables 1-4.
Otter trawls. Otter trawling was conducted at selected beam trawl
stations in Saratoga Passage in June, in Port Gardner in February, April, June
and September, and in Elliott and Commencement bays in June and September.
See Part II of this report for further discussion of the otter trawl work and
the results of the beam trawl fish catches.
RESULTS
Dungeness Crab
Saratoga Passage. The overall average beam trawl catches of Dungeness
crab in Saratoga Passage were 1.2 and 42.8 crab/hectare (ha) for the February
and June cruises, respectively. Dungeness crab were never caught within the
preliminary PSDDA disposal site or at the deep Transect 2 stations north of
the PSDDA site (Figure 7). All Dungeness crab were caught along Transect 1 on
both east and west sides of Saratoga Passage. Station 1OE (10 meters deep —
east side) had the highest catches of Dungeness crab in both February and
June. Only one Dungeness crab was caught by the otter trawl in June, this
being at Station 20E on the Camano Island side of Saratoga Passage. Dungeness
crab catches for both trawl types and for both seasons are summarized in
Appendix Table 5.
Histograms of Dungeness crab carapace width-frequencies show that about
95% of the crabs caught were mature animals ranging in size from 100 to 165 mm
carapace width (cw) (Figure 8). Only two juvenile (20—30 mm) crabs were
caught, this being in February. These two individuals undoubtedly belonged to
SA
RA
TOG
AP
AS
SA
GE
Map
so
fS
ara
tog
aP
ass
ag
esh
ow
ing
the
ap
pro
xim
ate
beam
tra
wl
Du
ng
en
ess
cra
ban
dsh
rim
pca
tch
es
at
ea
chsa
mp
lesta
tio
nb
yse
aso
n.
Fig
ure
7.
13
20 - Saratoga Passage% Male = 62 February% Female 38
% Soft = 0
Gravid Females = 1/2
N=810
5>~0
ci) I, ___ _______________ ___
D ~ — i i i i I --—r0~ci)
U10- June
% Male = 24I.
% Female = 76
- % Soft = 12
Gravid Females = 1/24
N = 33
5-
2.5
0 I I I I I I —
0 20 40 60 80 100 120 140 160
Carapace Width(mm)
Figure 8. Dungeness crab size—frequency histograms by season for crabscaught in Saratoga Passage.
14
the 1985 year group. Soft crabs (indicative of recent molting) were only
found in June (12%) and only one gravid female was caught during each season.
Occasional rock crabs (Cancer productus and C. gracilis) were also caught
by beam trawl in Saratoga Passage. Once again, these crabs were all caught at
the inshore stations of Transect 1.
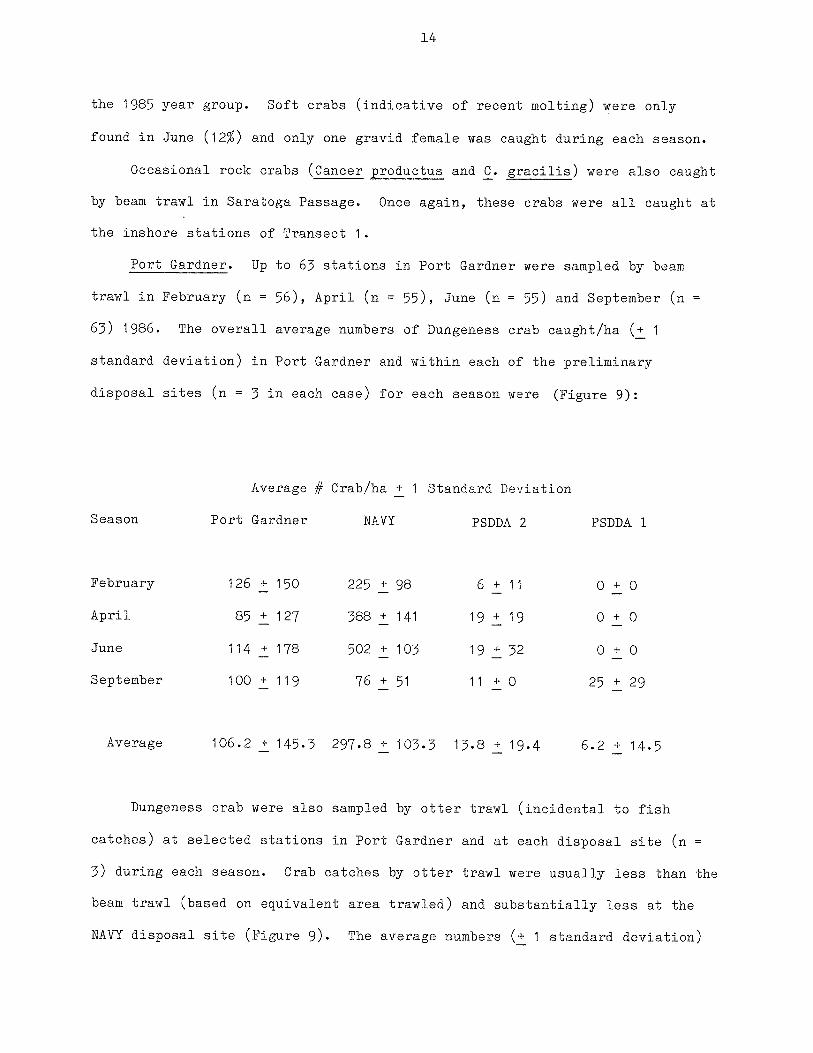
Port Gardner. Up to 65 stations in Port Gardner were sampled by beam
trawl in February (n = 56), April (n = 55), June (n = 55) and September (n
65) 1986. The overall average numbers of Dungeness crab caught/ha (÷ 1
standard deviation) in Port Gardner and within each of the preliminary
disposal sites (n = 5 in each case) for each season were (Figure 9):
Average # Crab/ha + 1 Standard Deviation
Season Port Gardner NAVY PSDDA 2 PSDDA 1
February 126 ± 150 225 ± 98 6 ± 11 0 ± 0
April 85±127 588±141 19+19 0±0
June 114 ± 178 502 ± 105 19 ± 52 0 ± 0
September 100 ± 119 76 ± 51 11 ÷ 0 25 ± 29
Average 106.2 ÷ 145.5 297.8 ÷ 105.3 15.8 ± 19.4 6.2 ÷ 14.5
Dungeness crab were also sampled by otter trawl (incidental to fish
catches) at selected stations in Port Gardner and at each disposal site (n
3) during each season. Crab catches by otter trawl were usually less than the
beam trawl (based on equivalent area trawled) and substantially less at the
NAVY disposal site (Figure 9). The average numbers (+ 1 standard deviation)

15
0
NAVY DISPOSALSITE
BEAMTRAWL _____
SITE 2 SITE 1
Figure 9. Comparative average densities of Dungeness crab atthe Navy Disposal Site and the two control sites inPort Gardner by season and by trawl type.
DUNGENESS CRAB
400
OTTERTRAWL______
300
200
100
0
400
300
200
100
0
400
300
200
100
0
400
300
200
100
uJ
C.)ILlI
LU0~
>-
C’,zUi
UiCD
Ui>
PSDDA PSDDA

16
of Dungeness crab caught/ha at the three disposal sites for each season were:
Average # Crab/ha ± 1 Standard Deviation
Season NAVY PSDDA 2 PSDDA 1
February 21 ± 10 0 ± 0 2 ± 3
April 15÷6 0±0 0±0
June 9±9 1±2 0±0
September 2 ± 3 20 ± 7 12 ± 4
Average 11.8 ± 7.5 5.2 ± 3.6 3.5 ± 2.5
Dungeness crab catches for the beam trawl in Port Gardner are summarized in
Appendix Tables 8-12. The otter trawl crab catches are summarized in Appendix
Tables 14, 15 and 17.
Based on the beam trawl sampling efforts, the average annual abundance of
Dungeness crabs in Port Gardner was estimated to be 106 crab/ha within our
sampling grid. The estimated relative abundances at PSDDA Sites 1 (= Control
1) and 3 (= Control 2) were only 13% and 6%, respectively, of this average
annual abundance for Port Gardner.
The distributions of male and female crabs illustrated in Figures 10 and
11 show that males were relatively scarce. Typically the males accounted for
only 10% of the total crab catch and were generally found at the shallower
stations (averge depth of capture for males 29 m). Female crabs were much
more plentiful, were found in abundance at deeper depths (down to~—’100 m;
average capture depth = 63 m), and especially preferred the “nearshore slope”
area of Port Gardner instead of the deep, flat areas in the middle of the bay.

Dis
trib
utio
no
fm
ale
Du
ng
en
ess
cra
bs
cau
gh
tb
ybe
amtr
aw
lin
Po
rtG
ard
ne
rd
urin
gth
ese
aso
na
lsa
mp
ling
in1
98
6.
—4
Fig
ure
10.

FE
MA
LEC
RA
B
PS
OD
A1
1
Po
rt-~
.~
Ga
rdn
er
o0
0•
~.~
150
25
0
~1
” ••-.••
••.f
lo••
•.•
•••~
:°
••~
.
•‘o
•
•0
•~•
psp
P~
-~’
•to
•.~
it0
•~~
•—
AP
RIL
Po
rtG
ard
ne
r
PS
DD
A1
xxi
NO
RT
H
•
.
JUN
E
c$•~-”~
0
NO
RT
H
SE
PT
EM
BE
R0
0
Po
rtG
ard
ne
ro
PS
OD
A1
0
0
Fig
ure
11
.D
istr
ibu
tio
no
ffe
ma
leD
un
ge
ne
sscra
bs
flau
gh
tb
ybe
amtr
aw
lin
Po
rtG
ard
ne
rd
urin
gth
ese
aso
na
lsa
mp
ling
in1
98
6.
19
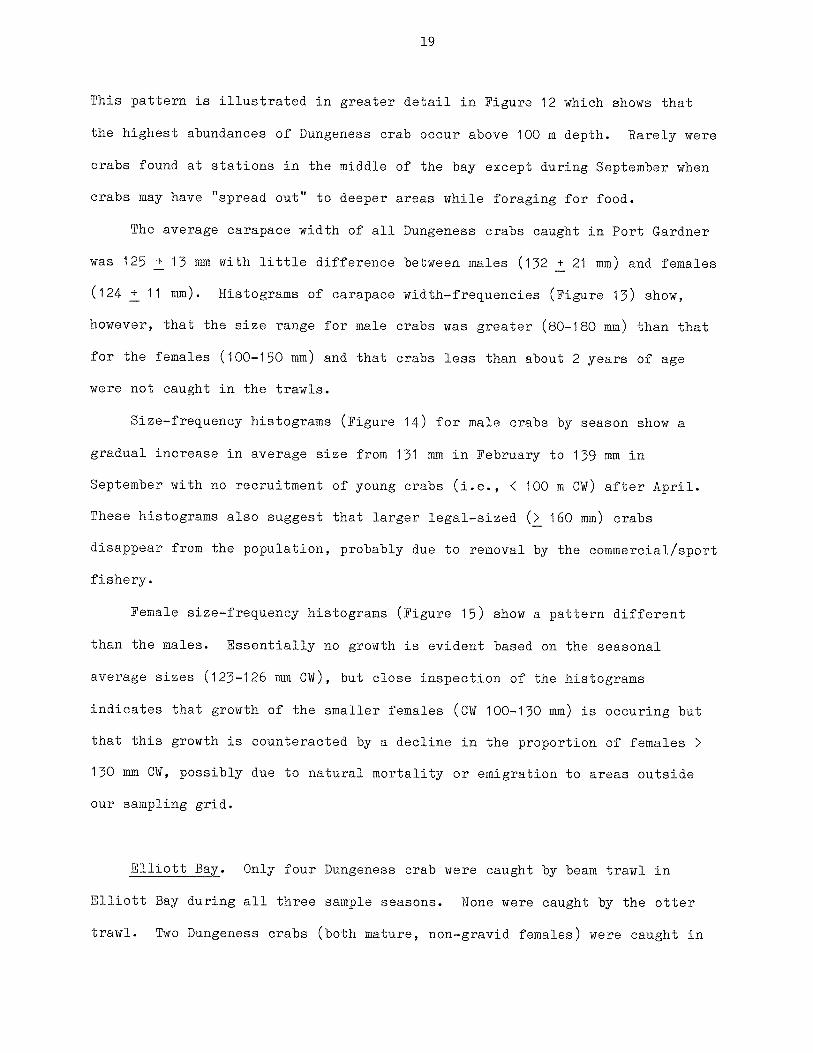
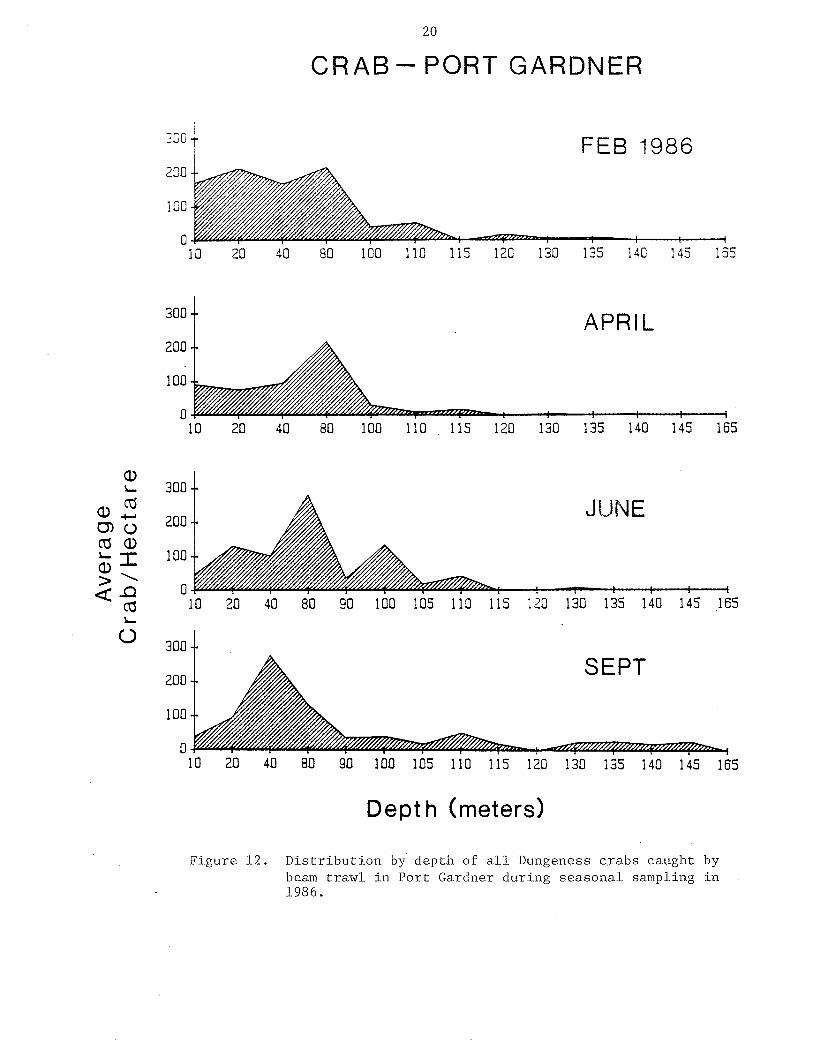
This pattern is illustrated in greater detail in Figure 12 which shows that
the highest abundances of Dungeness crab occur above 100 m depth. Rarely were
crabs found at stations in the middle of the bay except during September when
crabs may have “spread out” to deeper areas while foraging for food.
The average carapace width of all Dungeness crabs caught in Port Gardner
was 125 ± 13 mm with little difference between males (132 ÷ 21 mm) and females
(124 ± 11 nun). Histograms of carapace width—frequencies (Figure 13) show,
however, that the size range for male crabs was greater (80-180 mm) than that
for the females (100—150 mm) and that crabs less than about 2 years of age
were not caught in the trawls.
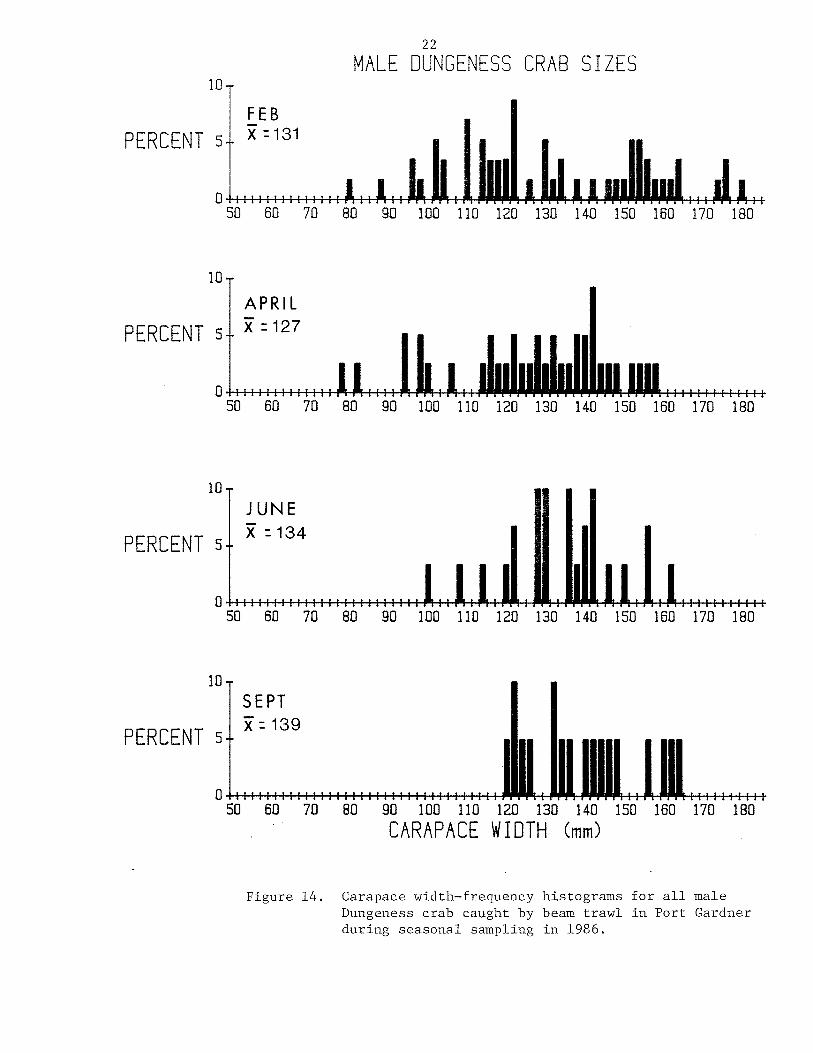
Size—frequency histograms (Figure 14) for male crabs by season show a
gradual increase in average size from 131 mm in February to 139 mm in
September with no recruitment of young crabs (i.e., < 100 m ow) after April.
These histograms also suggest that larger legal—sized (> 160 mm) crabs
disappear from the population, probably due to removal by the commercial/sport
fishery.
Female size—frequency histograms (Figure is) show a pattern different
than the males. Essentially no growth is evident based on the seasonal
average sizes (123—126 mm ow), but close inspection of the histograms
indicates that growth of the smaller females (ow 100-130 mm) is occuring but
that this growth is counteracted by a decline in the proportion of females >
130 mm OW, possibly due to natural mortality or emigration to areas outside
our sampling grid.
Elliott Bay. Only four Dungeness crab were caught by beam trawl in
Elliott Bay during all three sample seasons. Hone were caught by the otter
trawl. Two Dungeness crabs (both mature, non—gravid females) were caught in
20
ci)0)
I)>
I.
C)
I
ct3
(-)
Figure 12. Distribution by depth of all Dungeness crabs caught bybeam trawl in Port Gardner during seasonal sampling in1986.
CRAB—PORT GARDNER
200
100
a
FEB 1986
20
300
40 80 100 110 115 120 130 135 140 145 165
200
100
0
APRIL
10 20 40 80 100 1 115 120
300
200
100
JUNE
300
80 90 100 105 110 115 20 130 135 140 145 165
200
100
0
SEPT
10 20 40
Depth (meters)

PORT
GARD
NER
DUNG
ENES
SCR
ARW
IDTH
S
MA
LE6
~z1
32
PERC
ENT~ ~
020
4060
8010
012
014
016
018
0
CARA
PACE
WID
TH(m
m)
9
FE
MA
LE6
~z1
24
PERC
ENT~ 0
iiiill!illill
iiill!
Iiiiiiiiill
i1
11
11
IIiiii
iiit
i::
::::
::::
~tiii
ill
11
11
11
11
II
020
4060
8010
012
014
016
018
0
CARA
PACE
WID
TH(m
m)
Fig
ure
13
.C
ara
pa
cew
idth
—fr
eq
ue
ncy
his
tog
ram
so
fa
llm
ale
and
fem
ale
Du
ng
en
ess
cra
bs
cau
gh
tb
ybe
amtr
aw
lin
Po
rtG
ard
ne
rd
urin
gse
aso
na
lsa
mp
ling
in1
98
6.
10
5
050 60
Carapace width—frequencyDungeness crab caught byduring seasonal sampling in 1986.
140 150 160 170 180
PERCENTFEBx:131
22
MALE OUNGENESS CRAB SIZES
iLIiijImI...iIa70 80 90 100 110 120
APRILX : 127
130 140 150 160 170 180
II_I I ~1.i, .i
C
liiiUI
10
PERCENT s
0
10
PERCENT 5
a
10
PERCENT s
a
0 60 70 80 90 100 110
JUNE)( :134
1..1.1.1
120 130 140 150 160 170 180
LII.IiIIii. [.1100 110 120 13060 70 80 90
SEPT~:139
50 60 70
Figure 14.
80 90 100 110CARAPACE
IL+÷120 130 140 150
WIDTH (mm)160 170 180
histograms for all malebeam trawl in Port Gardner
23
10~FEMALE OUNGENESS CRAB SIZES
10
FEB~:125
tmIt1Il1t1,JIHIIM~p
60 70 80 90 100
I
110 120 130
I—
— liii
PERCENT sAPRIL)( :126
10~
PERCENT 5
JUNEX :~23
SEPT~:123
Ittilil!
Figure 15.
120 130 140 150 160 170 180WIOTH (mm)
Carapace width—frequency histograms for all female~ungeness crabs caught by beam trawl in Port Gardnerduring seasonal sampling in 1986.
PERCENT 5 I I
140 150 160 170 180
0 60 70 80 90 100-I
110 120 130 140 1 5~0
10
PERCENT 5
n
160 170 180
50 60 70I ~1
L ......
18080 90 100 110 120 130 140 150 160 170
II
II
IiLWjJj1~j1b1I IlIItIttIIItIt
60 70 80 90 100 110
CARAPACE

24
June at the 10 and 20 m stations of Transect 1 off Duwamish Head (Figure 16).
Two mature males were caught in September, also at the 10 m station of
Transect 1. Occasional rock crabs were also caught at the shallower stations
of Transects 1 and 2.
Commencement Bay. No Dungeness crab were caught in Commencement Bay by
either trawl gear. Occasional rock crabs were again caught at the shallower
stations (10—40 m) in all three seasons.
Shrimp
Catch data were collected on six species of Pandalid shrimp of commercial
or sport value. These six species were: Spot prawn, Pandalus platyceros;
Coonstripe shrimp, P. danae; Humpback shrimp, P. hypsinotus; Flexed shrimp, P.
goniurus; Pink shrimp, P. borealis; Smooth pink shrimp, P. jordani; and
sidestripe shrimp, Pandalopsis dispar (Butler 1980).
Saratoga Passage. The overall average number of shrimp caught by the
beam trawl in Saratoga Passage in February and June was essentially the same
at 51.9 and 56.2 shrimp/ha, respectively. The largest shrimp catch (300
shrimp/ha) was at the 80 m station on the Whidbey Island side of Transect 1 in
June, followed by the 100 m station (243 shrimp/ha) on Transect 2, also in
June (Figure 7). The two most abundant shrimp species were the pink and
smooth pink shrimps (Appendix Table 6).
The average shrimp catch within the preliminary PSDDA disposal site was
46.8 and 68.7 shrimp/ha for February and June, respectively. Sidestripe
shrimp were the most abundant shrimp species caught by the beam trawl in the
disposal site in February, while pink shrimp were the most common species in
EL
LIO
TT
BA
Y
Fig
ure
16
.M
aps
of
Ellio
ttB
aysh
ow
ing
se
aso
na
lbe
amtr
aw
lca
tch
es
of
Du
ng
en
ess
cra
ban
dsh
rim
pa
tth
esa
mp
ling
sta
tio
ns
inE
llio
ttB
ay.
U,
26
June (Figure 9; Appendix Table 6). However, the otter trawl in June caught
more sidestripe shrimp than pink shrimp and caught a total of 126.2 shrimp/ha
for all species combined (Figure 17; Appendix Table 7).
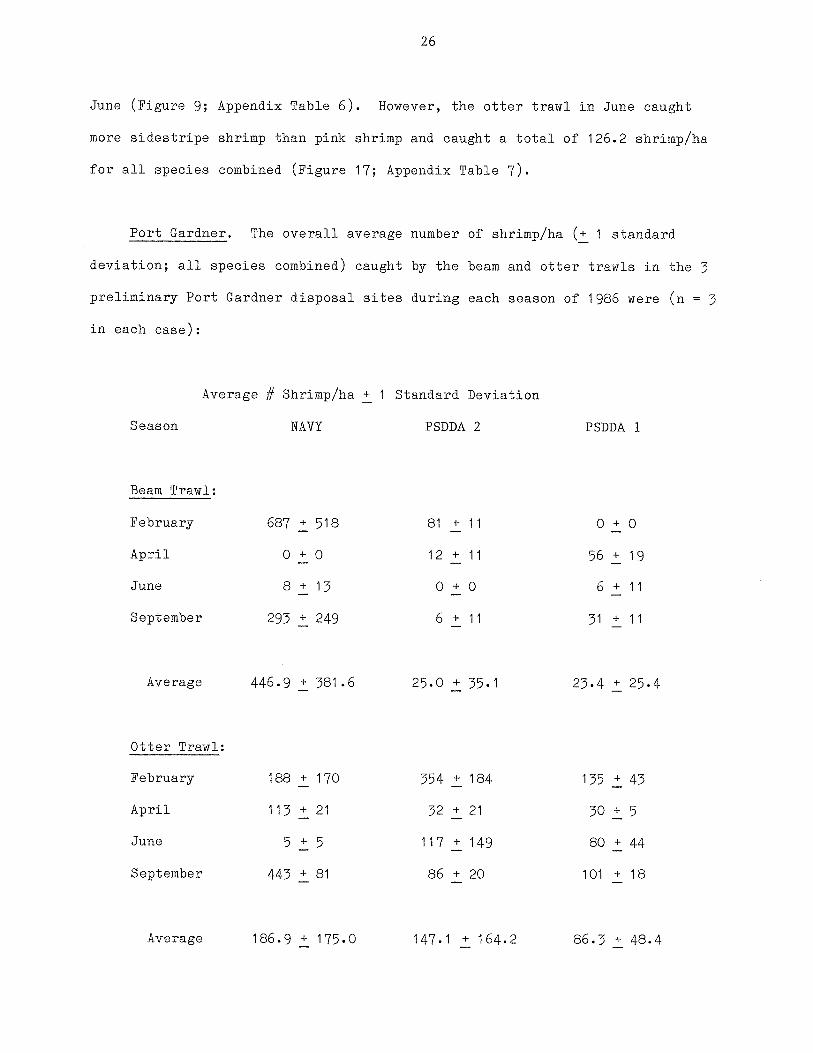
Port Gardner. The overall average number of shrimp/ha (÷ 1 standard
deviation; all species combined) caught by the beam and otter trawls in the 3
preliminary Port Gardner disposal sites during each season of 1986 were (n = 3
in each case):
Average # Shrimp/ha ± 1 Standard Deviation
Season NAVY PSDDA 2 PSDDA 1
Beam Trawl:
February 687 ± 518 81 ± 11 0 ± 0
April 0+0 12+11 56+19
June 8+13 0±0 6±11
September 293 ± 249 6 ÷ 11 31 ± 11
Average 446.9 + 381.6 25.0 ÷ 35.1 23.4 ± 25.4
Otter Trawl:
February 188 + 170 354 ÷ 184 135 ± 43
April 113±21 52±21 30±5
June 5±5 117±149 80±44
September 443 ± 81 86 ± 20 101 ± 18
Average 186.9 ± 175.0 147.1 ± 164.2 86.3 ÷ 48.4

27
Figure 17. Beam and otter trawl shrimp catches by species and byseason for PSDDA Site 2 in Saratoga Passage. The barsare the average catches for the thred stations withinthe Disposal Site. N.S. = not sampled.
SARATOGA PASSAGE
Ucc
0UizI0
00~
ccI(I)
10080604020
0
1601208040
01601208040
0
400300200100
0
20151050
400
300
200
100
0
BeamTrawl
Li0 He r
Trawl
. Spot Prawn
. 0 0 0
. Sidestripe
:_
. Smooth Pink
0 0. Pink
— — II
. Humpback
~ 0 0 0All Shrimp
BNS •fl NSNS
FEB JUNE
1986
SEPT
28
For each gear type, the pattern of relative shrimp densities between the three
disposal sites (based on annual averages) was NAVY > PSODA 2 > PSDDA 1.
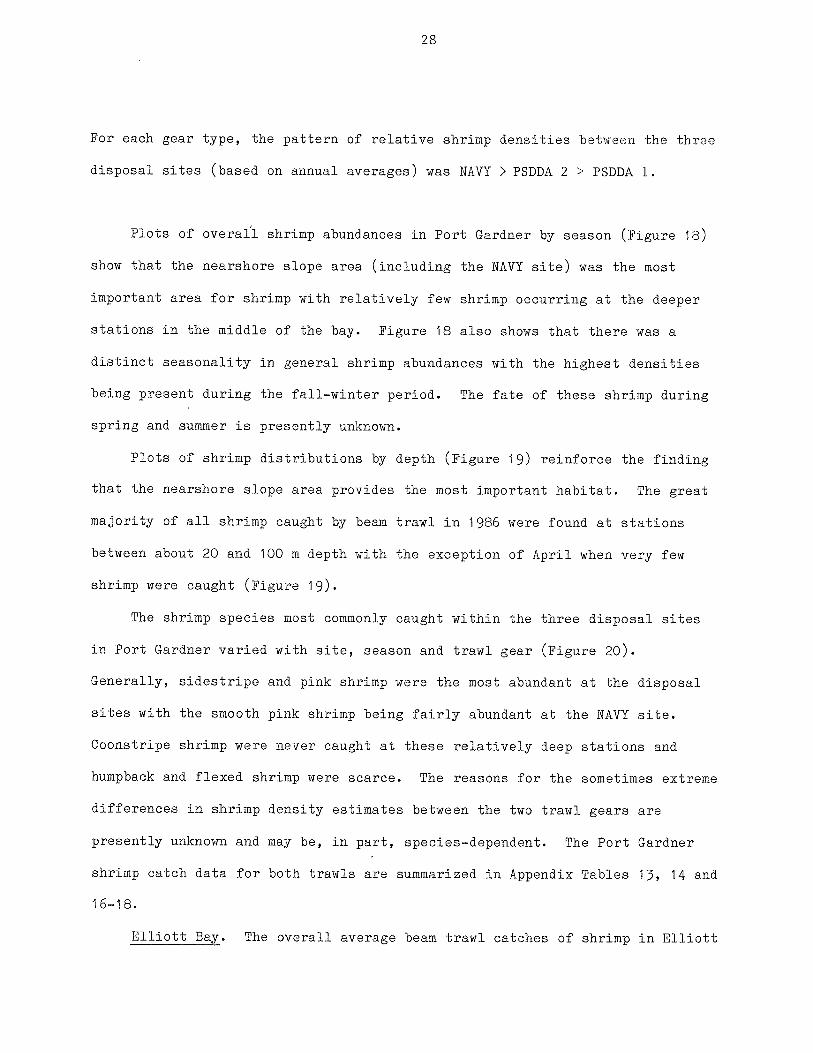
Plots of overañ shrimp abundances in Port Gardner by season (Figure 18)
show that the nearshore slope area (including the NAVY site) was the most
important area for shrimp with relatively few shrimp occurring at the deeper
stations in the middle of the bay. Figure 18 also shows that there was a
distinct seasonality in general shrimp abundances with the highest densities
being present during the fall-winter period. The fate of these shrimp during
spring and summer is presently unknown.
Plots of shrimp distributions by depth (Figure 19) reinforce the finding
that the nearshore slope area provides the most important habitat. The great
majority of all shrimp caught by beam trawl in 1986 were found at stations
between about 20 and 100 m depth with the exception of April when very few
shrimp were caught (Figure 19).
The shrimp species most commonly caught within the three disposal sites
in Port Gardner varied with site, season and trawl gear (Figure 20).
Generally, sidestripe and pink shrimp were the most abundant at the disposal
sites with the smooth pink shrimp being fairly abundant at the NAVY site.
Coonstripe shrimp were never caught at these relatively deep stations and
humpback and flexed shrimp were scarce. The reasons for the sometimes extreme
differences in shrimp density estimates between the two trawl gears are
presently unknown and may be, in part, species-dependent. The Port Gardner
shrimp catch data for both trawls are summarized in Appendix Tables 13, 14 and
16—18.
Elliott Bay. The overall average beam trawl catches of shrimp in Elliott

SH
RIM
P—
PO
RT
GA
RD
NE
R
Fig
ure
18,
Dis
trib
utio
no
fsh
rim
p(a
llsp
ecie
sco
mb
ine
d)
cau
gh
tb
ybe
amtr
aw
lin
Po
rtG
ard
ne
rd
urin
gse
aso
na
lsa
mp
ling
in1
98
6.

500400300200100
0
600500400300200100
0~
600L. 500
400l)~3 300
II-~ 600
500400300200100
0
Depth (meters)
Figure 19, Distribution by depth of shrimp (all species combined)caught by beam trawl in Port Gardner during seasonalsampling in 1986.
30
SHRIMP—PORT GARDNER
FEB 1986
10 20 40 80 100 110 115 120 130 135 140 145 165
APRIL
10 20 40 80 100 110 115 120 130 135 140 145 165
JUNE
823
10 20 40 80 90 100 105 110 115 120 130 135 140 145 165
SEPT
10 20 40 80 90 100 105 110 115 120 130 135 140 145 165

PO
RT
GA
RD
NE
R
w I () LU I I C.)
C.)
0~ cc I C,)
20PS
DD
A2
Sp
ot
Pra
wn
10
00
00
00
400
Sid
estr
ip.
30
02
00 0
—O
fl
-~
100
soo
Sm
oo
thP
ink
60
04
00
20
0A
LL
O0
20
0P
ink
150~
100 0
—ri
0r—
~0
,0
r—~
8H
um
pb
ack
6 4 2A
LL
00 8
Fle
xe
d6 4 2 0
01
10
11
00
00
All
Sh
rim
p8
00
60
0
40
0
20
0 0—
—pii
—
PSD
DA
1S
po
tP
raw
n
5.
AL
LO
0S
ide
str
ipe
0r1
0—
_r—
ir1
Sm
oo
thP
ink
AL
LO
CP
ink
O0
r—~
——
08
Hu
mp
ba
ck
AL
L0
8F
lexe
d6 4
.
co
Fi
00
00
All
Sh
rim
p
o~
ri—
——
FEB
AP
RIL
JUN
ES
EP
T
Num
ber
of
shrim
pca
ug
ht
pe
rh
ecta
reb
yb
oth
beam
and
ott
er
tra
wis
inth
eth
ree
pre
lim
ina
ryd
isp
osa
lsite
sin
Po
rtG
ard
ne
rd
urin
gse
aso
na
lsa
mp
ling
in1
98
6.
20 15 10
400
30
020
010
0 0
80
06
00
40
02
00
20
0
150
100
FEB
AP
RIL
JUN
ES
EP
T
80
0
60
0
40
0
20
0
FEB
AP
RIL
JUN
ES
EP
T
Bea
mT
raw
l[~
]Ott
er
Tra
wl
Fig
ure
20
.
32
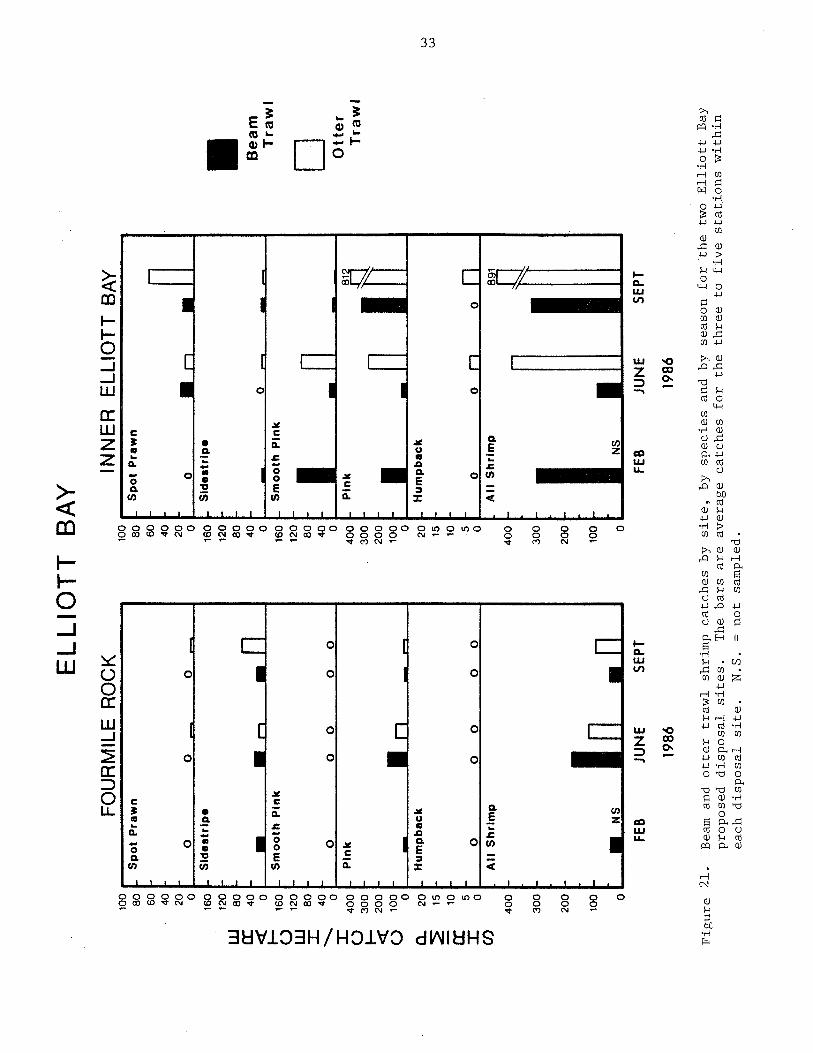
Bay during February, June and September were 131, 66 and 135 shrimp/ha,
respectively. Generally, shrimp were most abundant in the beam trawis at
PSDDA Site 1 (inner Elliott Bay) in February; most abundant at PSDDA Site 2
(Fourmile Rock) in June; and substantially more abundant at PSDDA Site 1 in
September (Figures 8 and 10; Appendix Table 6) Sidestripe and pink shrimp
were the most abundant shrimp in the beam trawls at the Fourmile Rock site
while pink and smooth pink shrimp were most common at the inner bay disposal
site (Figure 21). The otter trawl catches generally showed the same pattern
of shrimp distribution except that spot prawn catches were higher than for the
beam trawl at the inner bay site in September and a few humpback shrimp were
caught in June and September (Figure 21; Appendix Table 7).
A “t”—test was conducted to compare the mean catches of shrimp between
the two Elliott Bay disposal sites (data from all seasons combined; Log~Q
transformation of catches). The results showed that shrimp were caught in
significantly higher numbers (p = 0.0009) when data from both types of trawl
gear were combined, but that the level of significance was marginal for each
gear type alone (p = 0.054 for the beam trawl shrimp catches and p = 0.050 for
the otter trawl catches).
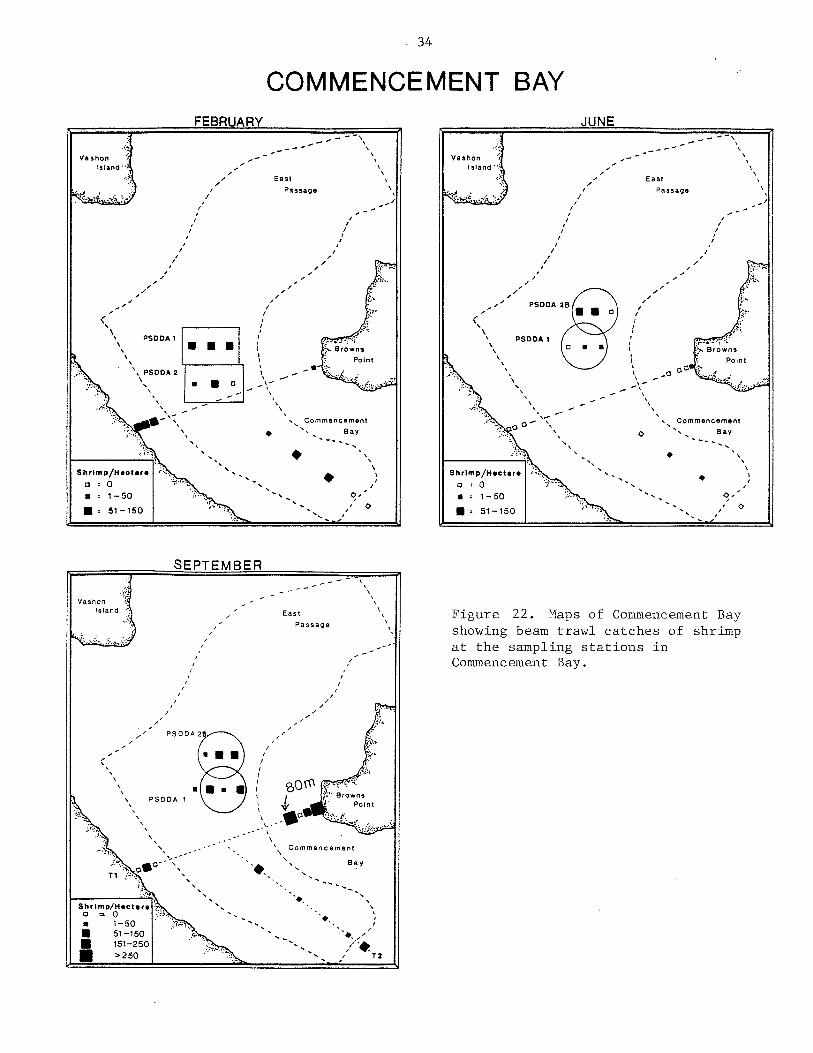
Commencement Bay. The overall average beam trawl shrimp catches in
Commencement Bay in February, June and September 1986 were 49, 29 and 128
shrimp/ha, respectively. The two largest shrimp catches in Commencement Bay
were off Browns Point in September where coonstripe shrimp were plentiful
(1,067/ha) at the 10 m station and pink shrimp were relatively abundant
(502/ha) at the 80 m station (Figure 22; Appendix Table 6).
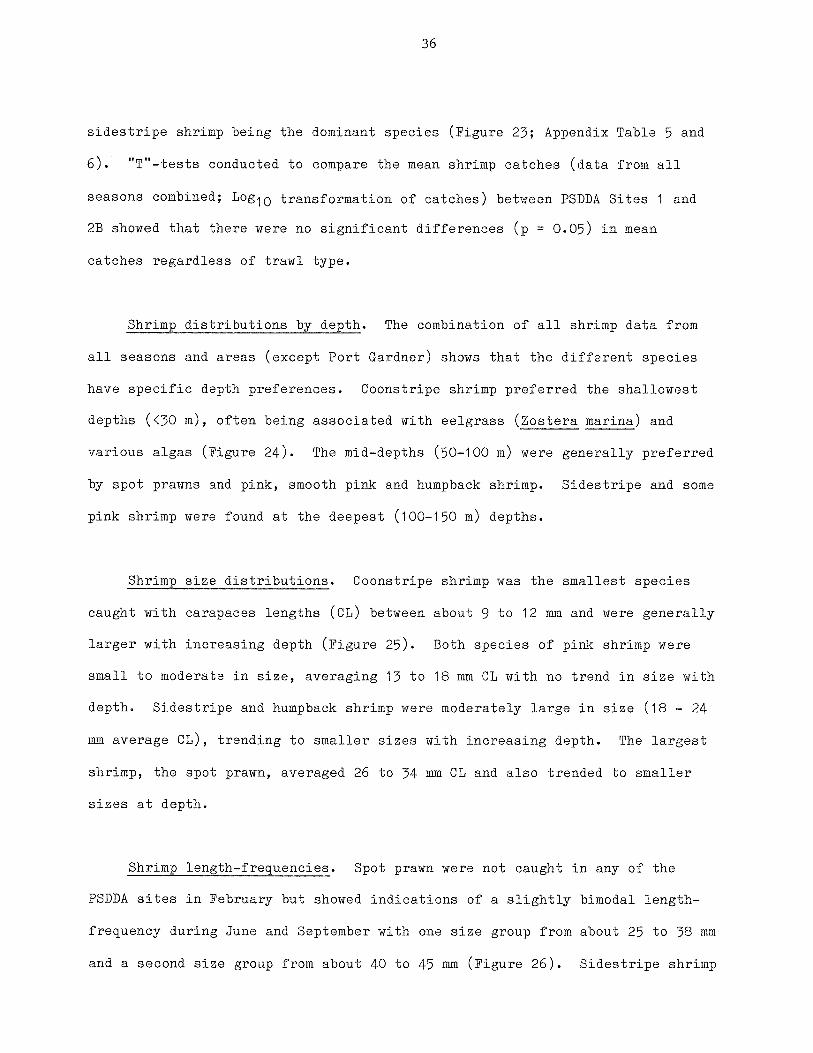
Shrimp catches were very low at the PSDDA 2 site which was only sampled
in February (Figure 23). Beam trawl and otter trawl shrimp catches at PSDDA
Sites 1 and 2B were almost identical in both June and September with pink and
EL
LIO
TT
BA
Y
Fig
ure
21
.B
eam
and
ott
er
tra
wl
shrim
pca
tch
es
by
site
,b
ysp
ecie
san
db
yp
rop
ose
dd
isp
osa
lsite
s.
The
ba
rsa
rea
vera
ge
ca
tch
es
for
the
ea
chd
isp
osa
lsite
.N
.S.
=n
ot
sam
ple
d.
sea
son
for
the
two
Ellio
ttB
ayth
ree
tofive
sta
tio
ns
with
in
FOU
RM
ILE
RO
CK
INN
ER
ELL
IOTT
BAY
Ui cr 1— 0 UiI I 0 I 0 I C
l)
100
100
80S
po
tP
raw
n80
60-
6040
4020
200
00
—0
016
0.
Sid
ea
trip
e16
012
0-
120
8080
40-
400
Br—
i0
160
.S
mo
oth
Pin
k16
012
0-
120
80.
8040
-40
00
00
0o
400
Pin
k40
03
00
30
020
020
010
010
00
—--
0
20H
um
pb
ack
2015
1510
-10
5-
.50
00
00
0A
llS
hrim
p40
040
0
300
300
200
200
io:-
•N
SIn
10:
Be
am
Tra
wl
LI Ott
er
Tra
wl
Sp
ot
Pra
wn
~o
liii
.S
ido
str
ip.
—0
~—
,
,S
mo
oth
Pin
k
•1
—-
.P
ink
j~1
~~
~iiI
riH
um
pb
ack
ao
no
fl
All
Sh
rim
p89
1
LN
SL
LFE
BJU
NE
SEPT
FEB
JUN
E
1986
1986
SEPT
34
COMMENCEMENT BAY
Figure 22. Maps of Commencement Bayshowing beam trawl catches of shrimpat the sampling stations inCommencement Bay.

CO
MM
EN
CE
ME
NT
BA
Y 100
60 60 40 20 0
160
120
80 40 016
012
08
040
040
03
00
200
100 0 20 15 10 5 0
40
0
30
0
200
100 0
Fig
ure
23
.B
eam
and
ott
er
tra
wl
shrim
psite
sin
Com
men
cem
ent
Ba
y.w
ith
ine
ach
dis
po
sa
lsite
.
ca
tch
es
by
site
,b
ysp
ecie
san
db
yse
aso
nfo
rth
ep
rop
ose
dd
isp
osa
lT
heb
ars
are
the
ave
rag
eca
tch
es
for
the
thre
eto
fou
rsta
tio
ns
N.S
.=
no
tsa
mp
led
.
PS
DD
A1
PS
DD
A2
PS
DD
A2B
LU cr 0 LU z z 0 I— () a cc z C’)
100 80 60 40 20 0
160
120
80 40 016
012
08
0 40 0
40
030
020
010
0 0
20 15 10 5 0
40
0
300
200
100 0
100
80 60 40 20 0
160
120
80 40 016
012
08
040 0
400
30
020
010
0 0
20 15 10 5 0
40
0
Sp
ot
Pra
wn
pS
ld.s
trip
.
Sm
oo
thP
ink
0
Pin
k
Hu
mp
ba
ck
0
All
Sh
rim
p
•M
SM
SN
SN
SN
5
FEB
JUNE
SEPT
1986
S Bea
mT
raw
l
Ott
er
Tra
wl
.S
po
tP
raw
n
.0
0.
Sid
.str
lp.
.0
~.
Sm
oo
thP
ink
~0
00
0~
Pin
k
Hu
mp
ba
ck
00
00
All
Sh
rim
p
~N
SN
SI.
_
300
200
FEB
JUNE
1986
100 0
SEPT
FEB
JUNE
1986
SEPT
36
sidestripe shrimp being the dominant species (Figure 23; Appendix Table 5 and
6). “T”—tests conducted to compare the mean shrimp catches (data from all
seasons combined; Log10 transformation of catches) between PSDDA Sites 1 and
2B showed that there were no significant differences (p = 0.05) in mean
catches regardless of trawl type.
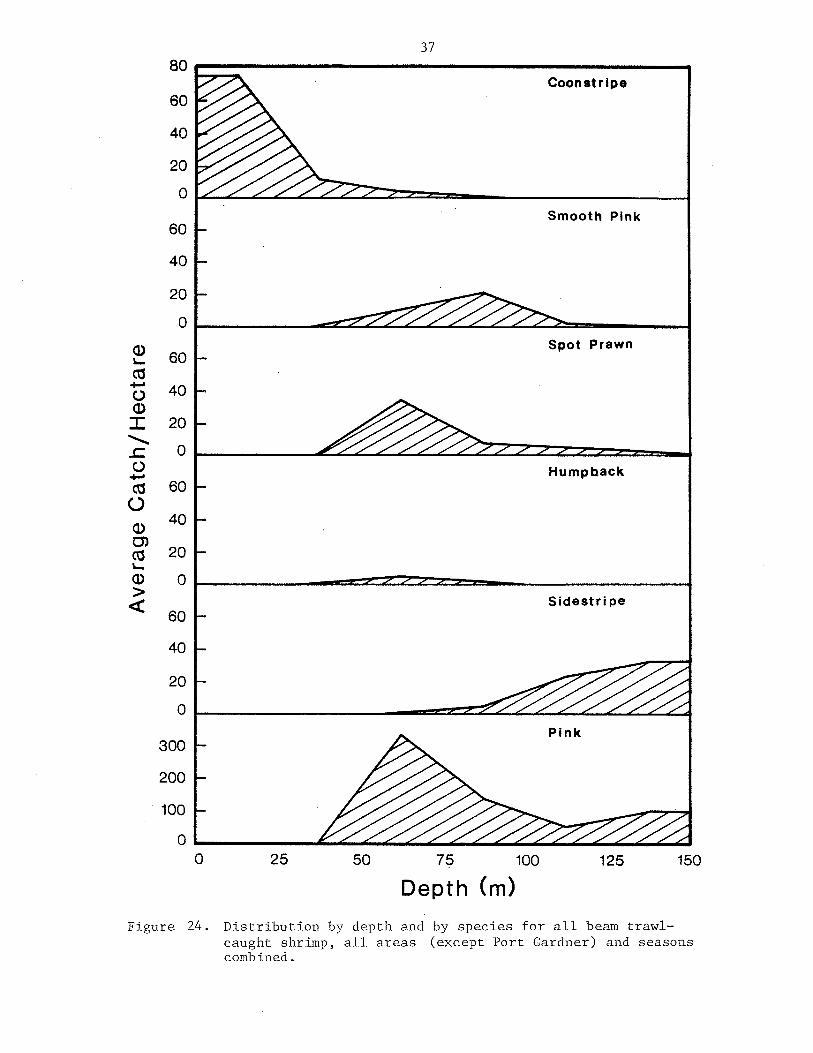
Shrimp distributions by depth. The combination of all shrimp data from
all seasons and areas (except Port Gardner) shows that the different species
have specific depth preferences. Coonstripe shrimp preferred the shallowest
depths (<30 m), often being associated with eelgrass (Zostera marina) and
various algas (Figure 24). The mid-depths (50—100 m) were generally preferred
by spot prawns and pink, smooth pink and humpback shrimp. Sidestripe and some
pink shrimp were found at the deepest (100—iso m) depths.
Shrimp size distributions. Coonstripe shrimp was the smallest species
caught with carapaces lengths (CL) between about 9 to 12 mm and were generally
larger with increasing depth (Figure 25). Both species of pink shrimp were
small to moderate in size, averaging 13 to 18 mm CL with no trend in size with
depth. Sidestripe and humpback shrimp were moderately large in size (18 - 24
mm average CL), trending to smaller sizes with increasing depth. The largest
shrimp, the spot prawn, averaged 26 to 34 mm CL and also trended to smaller
sizes at depth.
Shrimp length-frequencies. Spot prawn were not caught in any of the
PSDDA sites in February but showed indications of a slightly bimodal length—
frequency during June and September with one size group from about 25 to 38 mm
and a second size group from about 40 to 45 mm (Figure 26). Sidestripe shrimp
37
60
40
20
0
60
40
20
0
(‘34-a0‘1)I 20
-~ 00
4-a
c~ 60C)
40
c~ 20
0 0>
60
40
20
0
300
200
100
0 125 150
Depth (m)
Figure 24. Distribution by depth and by species for all beam trawl—caught shrimp, all areas (except Port Gardner) and seasonscombined.
80
025 50 75 100

38
D)Ca)-J
a)C-)
a
C’,
0a)0)C’,
a)>
I I I I
0-15 16-30 31-70 71-95
Depth Range (m)
Figure 25, Average carapace lengths by species and by depth ranges for allshrimp caught, all seasons and areas (except Port Gardner)
35
30
25
20
15
10
5
p
96-120 >120
combined.

FEb
SE
pT
Ca
rap
ace
Leng
thF
igu
re2
6.
Le
ng
th—
fre
qu
en
cyh
isto
gra
ms
for
all
sp
ot
pra
wn
and
sid
estr
ipe
shrim
pca
ug
ht
du
rin
gth
eth
ree
sam
plin
gse
aso
ns,
all
are
as
(exce
pt
Po
rtG
ard
ne
r)co
mb
ine
d.
Sid
est
ripe
IIII
>~ ci ci) a) LL ci) > ci)
40-
Spo
tP
raw
n3
0-
20 10
~
0N
on
eC
au
gh
tI
•I
I‘
40
~
30
20JU
NE
10
~
0,
IIIII
1111
1
40
30
~
20
-
1~
.•
•IIiIW
kII~1
1Iilij
•I
~•
-I
IIi,Iih
11
..
~Ii.
II
II
010
20
30
40
0I
I
20
30
10 (mm
)
40

40
length-frequency patterns suggested a single size group in both February (16.-
24 mm) and June (20-30 mm) and a bimodal pattern in September (10—15 mm and
20—30 nun) (Figure 26). Coonstripe shrimp length—frequencies suggested a
single size group in February and June (8-18 nun) and recruitment of young
shrimp in September (6-10 mm) (Figure 27). Relatively few humpback shrimp
were caught, but those that were suggested a single size group with sizes
between 22—30 mm (Figure 27). Smooth pink shrimp length-frequencies gave a
suggestion of a slight bimodal size distribution with size groups from 10—14
mm and 17-20 mm in February with both groups growing progressively larger in
June and September (Figure 28). Pink shrimp also showed a bimodal size
distribution with size groups from 9-13 mm and 15-20 mm in February. The
distinction of the two apparent size groups was less clear in June and
September but there was a hint of new recruitment in September with shrimp
between 9—12 mm (Figure 28).
DISCUSSION AND CONCLUSIONS
Dungeness Crab
Dungeness crab were completely absent from all trawls conducted in
Commencement Bay in 1986. Although an occasional Dungeness crab has been
caught in other trawling operations in the shallow waterways (C. Eaton, pers.
comm.), it is clear that this species will not be a factor in siting a
disposal site in Commencement Bay.
Only four Dungeness crab were caught in Elliott Bay, all by beam trawl at
the shallow stations on the Duwamish Head Transect (Figure 16). Commercial
crabbing operations were also observed in shallow water areas between Fourmile
Rock and West Point. However, the scarcity of Dungeness crabs in the trawls
and the total lack of crabs in the trawls from the preliminary disposal sites

>~ C.)
C ci) D ci) U- ci) > ci) Ix
40
-
30
-
20 10 0
20 10 0
Hum
pbac
k
Non
eC
au
qh
t
Fig
ure
27
.L
en
gth
—fr
eq
ue
ncy
his
tog
ram
sfo
ra
llco
on
str
ipe
and
hum
pbac
ksa
mp
ling
sea
son
s,a
lla
rea
s(e
xce
pt
Po
rtG
ard
ne
r)co
mb
ine
d.
shrim
pca
ug
ht
du
rin
gth
eth
ree
Coo
nstr
ipe
III•—
r—•
•‘
40 30
20 10 0
40
30
I-
—-.
II
•~
FEb
JUN
E
SE
pT
Ca
rap
ace
010
203
04
00
1020
30
40
Leng
th(m
m)

0 c ci) ci) LI ci) >
__
__
__
__
__
__
__
_
ci) ci:
Ca
rap
ace
Leng
th(m
m)
Fig
ure
28
.L
en
gth
~-f
req
ue
ncy
his
tog
ram
sfo
ra
llsm
oo
thp
ink
and
pin
ksh
rim
pca
ug
ht
du
rin
gth
eth
ree
sa
mp
ling
sea
son
s,a
lla
rea
s(e
xce
pt
Po
rtG
ard
ne
r)co
mb
ine
d.
Sm
ooth
Pin
k
IId
Pin
k
II>~
I—
II
•I
40
-
30
-
20 10
-
0.
40 30
20 10 0
40
30
-
20
-
10 0
FEb
JUN
E
SEpT
I.1
fflui
h11.
I1~
I•
I•
I
010
2030
400
1020
30
40
43
indicates that this species is also not a factor in selecting a final Elliott
Bay disposal site location.
Dungeness crab were moderately abundant in the beam trawl catches from
Saratoga Passage (Figure 7); however, all crabs were caught along the
shoreward slope areas at depths <80 m. No crabs were caught in the
preliminary disposal area nor in the deeper water areas north of the disposal
site. Hence, the present location of the proposed disposal site is probably
in the best location for avoiding impacts to crab. However, evidence from the
trawls in Port Gardner suggests that some Dungeness crab move into deep water
(i.e., 100-150 m) during the late summer to early fall period. Trawls were
not made in Saratoga Pass during this period. Thus, care should be exercised
about any assumptions that crab are absent year-round.
Dungeness crab were found to be a very important resource in Port
Gardner, consistently averging about 100 crab/ha for all seasons sampled. Of
the crabs caught in the trawls, almost 90% were mature females, 78% of which
were gravid during the February sampling. Thus, Port Gardner appears to be an
important habitat area for the mature females.
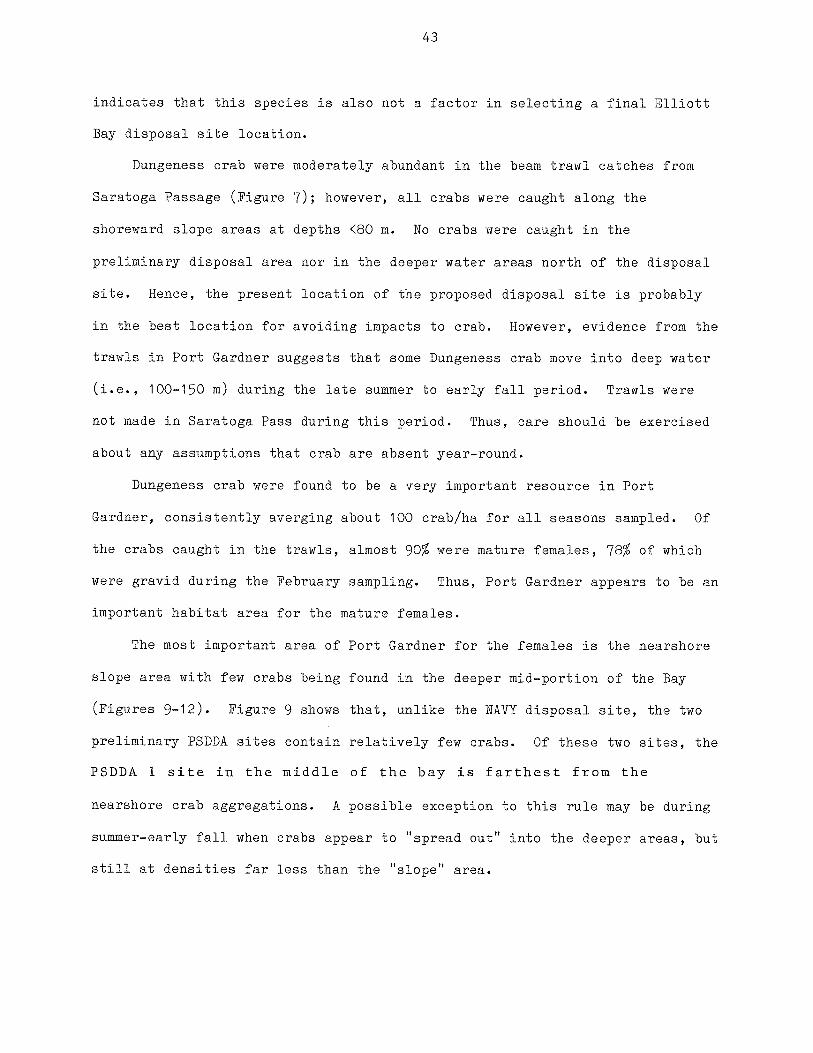
The most important area of Port Gardner for the females is the nearshore
slope area with few crabs being found in the deeper mid-portion of the Bay
(Figures 9—12). Figure 9 shows that, unlike the NAVY disposal site, the two
preliminary PSDDA sites contain relatively few crabs. Of these two sites, the
PSDDA 1 site in the middle of the bay is farthest from the
nearshore crab aggregations. A possible exception to this rule may be during
summer—early fall when crabs appear to “spread out” into the deeper areas, but
still at densities far less than the “slope” area.
44
Shrimp
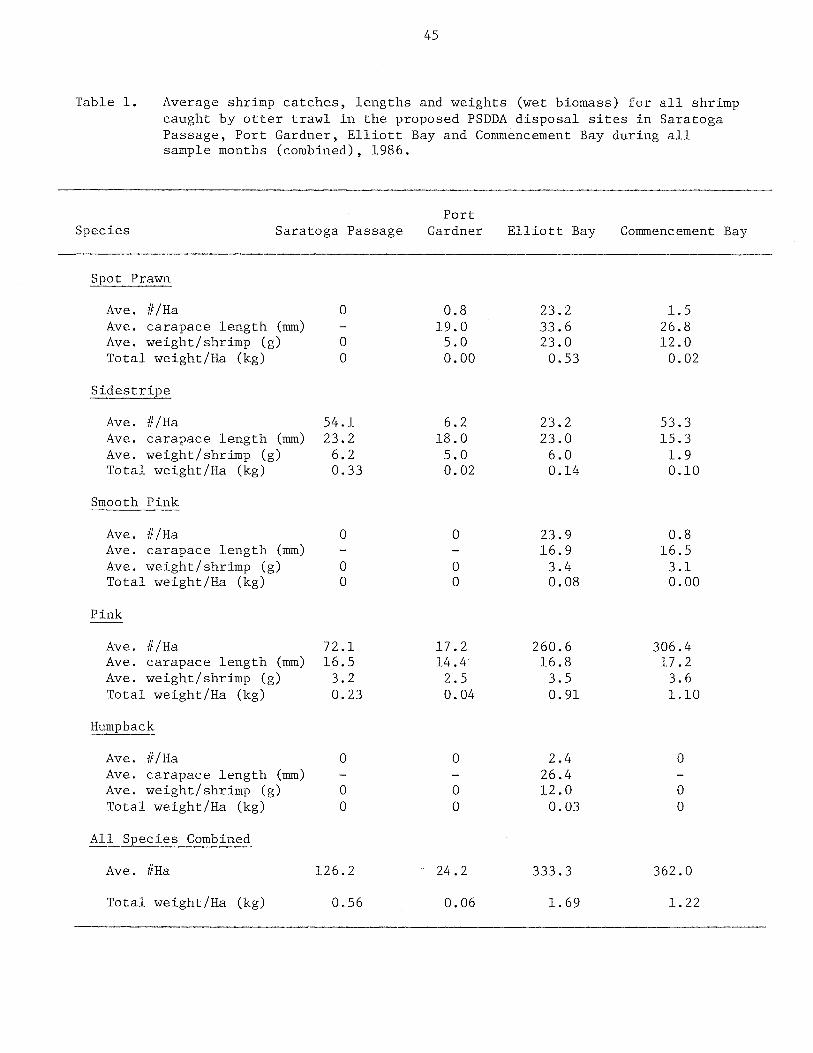
Commercially important species of shrimp were caught in all of the
preliminary PSDDA disposal sites. Summaries of the shrimp catches within the
disposal sites of each area (Table 1) show that the average shrimp catches by
weight for the combined otter trawl catches were 0.56, 0.06, 1.69 and 1.22
kg/ha for Saratoga Passage, Port Gardner, Elliott Bay and Commencement Bay,
respectively.
Historically, shrimp have been the basis of a viable trawl fishery in
Puget Sound and Hood Canal. Annual landings of shrimp exceeded 400,000 pounds
during several years between 1904 and 1915 and averaged about 50,000 pounds
during the 1920’s and 1950’s (Smith 1957). The averge landings between 1955
and 1982 have been highly variable (s to 144 thousand pounds) and averaged
58,000 pounds (Figure 29).
The historical shrimping grounds fished from the late 1800’s through the
1930’s included each of the areas in which a PSDDA disposal site is proposed
(Figure 30). Saratoga Passage and Elliott Bay are shown as historical spot
prawn shrimping areas while Commencement Bay was trawled for smooth pink
shrimp. Our present trawls caught spot prawn in Elliott and Commencement Bays
but no spot prawn in Saratoga Passage. Relatively few smooth pink shrimp were
caught but the closely related pink shrimp was caught in small numbers in
Saratoga Passage and in moderate numbers in Elliott and Commencement Bays
(Table 1).
Some perspective on the relative importance of shrimp resources in the
preliminary disposal sites can be attained by comparing the average otter
trawl catches in these sites with otter trawl catches of shrimp in other areas
of Puget Sound and Hood Canal. Chew (unpublished data) conducted shrimp
surveys during the winter of each year from 1967 to 1979 at about ten sites in
45
Table 1. Average shrimp catches, lengths and weights (wet biomass) for all shrimpcaught by otter trawl in the proposed PSDDA disposal sites in SaratogaPassage, Port Gardner, Elliott Bay and Commencement Bay during allsample months (combined), 1986.
PortSpecies Saratoga Passage Gardner Elliott. Bay Commencement Bay
Spot Prawn
Ave. #/Ha 0 0.8 23.2 1.5Ave. carapace length (mm) — 19.0 33.6 26.8Ave. weight/shrimp (g) 0 5.0 23.0 12.0Total weight/Ha (kg) 0 0.00 0.53 0.02
Sidestripe
Ave. lI/Ha 54.1 6.2 23.2 53.3Ave. carapace length (mm) 23.2 18.0 23.0 15.3Ave. weight/shrimp (g) 6.2 5.0 6.0 1.9Total weight/Ha (kg) 0.33 0.02 0.14 0.10
Smooth Pink
Ave. lI/Ha 0 0 23.9 0.8Ave. carapace length (mm) — — 16.9 16.5Ave. weight/shrimp (g) 0 0 3.4 3.1Total weight/Ha (kg) 0 0 0.08 0.00
Pink
Ave. lI/Ha 72.1 17.2 260.6 306.4Ave. carapace length (mm) 16.5 14.4 16.8 17.2Ave. weight/shrimp (g) 3.2 2.5 3.5 3.6Total weight/Ha (kg) 0,23 0.04 0.91 1.10
Humpback
Ave. lI/Ha 0 0 2,4 0Ave. carapace length (mm) — — 26.4 —
Ave. weight/shrimp (g) 0 0 12.0 0Total weight/Ha (kg) 0 0 0.03 0
All Species Combined
126.2 24.2 333.3 362.0Ave. lIHa
Total weight/Ha (kg) 0,56 0.06 1.69 1.22

THOU
SAND
POUN
DS
PUCE
TSO
UND
SHRI
MP
LAND
INOS
YEAR
Fig
ure
29
.
I 140
120
100 80.
60
3540
5560
6570
7580
An
nu
al
com
me
rcia
lsh
rim
pla
nd
ing
fro
mP
ug
et
Sou
nd(in
clu
din
gH
ood
Ca
na
l)fr
om
1935
to1
98
2.
Da
tafr
om
WD
F(1
97
4an
d1
98
2).

47
_______ Spot
Figure 30. Map of Western Washington showing areas of commercial shrimpproduction from late 1800ts to mid—1930!s. The Humpback shrimp
VANCOUVER I5LAND
CLALLA~1
J~rrER5oN
MA5ON
GRAV5HARBORCOUNTY COUNTY
Humpback [II I I I I I~ Smooth Pink
is Pandalus hypsinotus. From Smith (1937).
48
Hood Canal and Puget Sound. Summaries of Chew’s data show that the average
shrimp catches/ha in four areas of Hood Canal and three areas of Puget Sound
all (except Seabeck, Hood Canal) exceeded the average catches in any of the
preliminary PSDDA disposal sites (Tables 1 and 2). The one disposal site that
appeared to have a potential for commercial shrimp harvesting was the inner
Elliott Bay site where spot prawn, sidestripe, pink and smooth pink shrimp
were caught in reasonable numbers (Figure 10, Appendix Table 7). Table 3
provides a breakdown of relative shrimp densities within the two preliminary
PSDDA sites in Elliott Bay and shows that the inner Elliott Bay site contained
about 3 to 7 times the density of shrimp that were caught at the Four—mile
Rock site (data from June and September otter trawis). However, this area is
also severely impacted by Indian salmon fishing, ship navigation lanes and
anchorage areas as well as toxic contaminants in the sediments of the nearby
Duwamish Waterways; hence, the value of these shrimp to a fishery is suspect.
The potential value of the reproductive capacity of these stocks for supplying
new recruits to other productive areas of Puget Sound is not presently known
but cannot be ruled out in the decision making process. The Commencement Bay
disposal sites also contained some sidestripe and pink shrimp, but both sites
contained essentially equal populations, hence, not affording a choice between
these two sites based on this factor.

49
Table 2. Estimated average shrimp catches/Ha from otter trawisconducted in selected areas of Hood Canal and Puget Soundfrom 1967 to 1979. These estimates are derived fromunpublished data collected and summarized by Dr. KennethChew, School of Fisheries, University of Washington.
Location/Depth (m) Number of trawis Catch/Ha (kg)
Dabob Bay
20—45 33 2.945—70 26 2.770 — 125 24 3.5
Pleasant Harbor
35-65 5 2.965-90 8 10.0
Seabeck
45-SO 3 0.8
Potlatch
70-90 4 6.8
Port Susan
25 — 70 9 12.880 — 120 7 5.7
Tulalip
50—80 3 13.580- 120 4 11.8
Carr Inlet
45 — 80 4 15.180 — 135 3 2.4
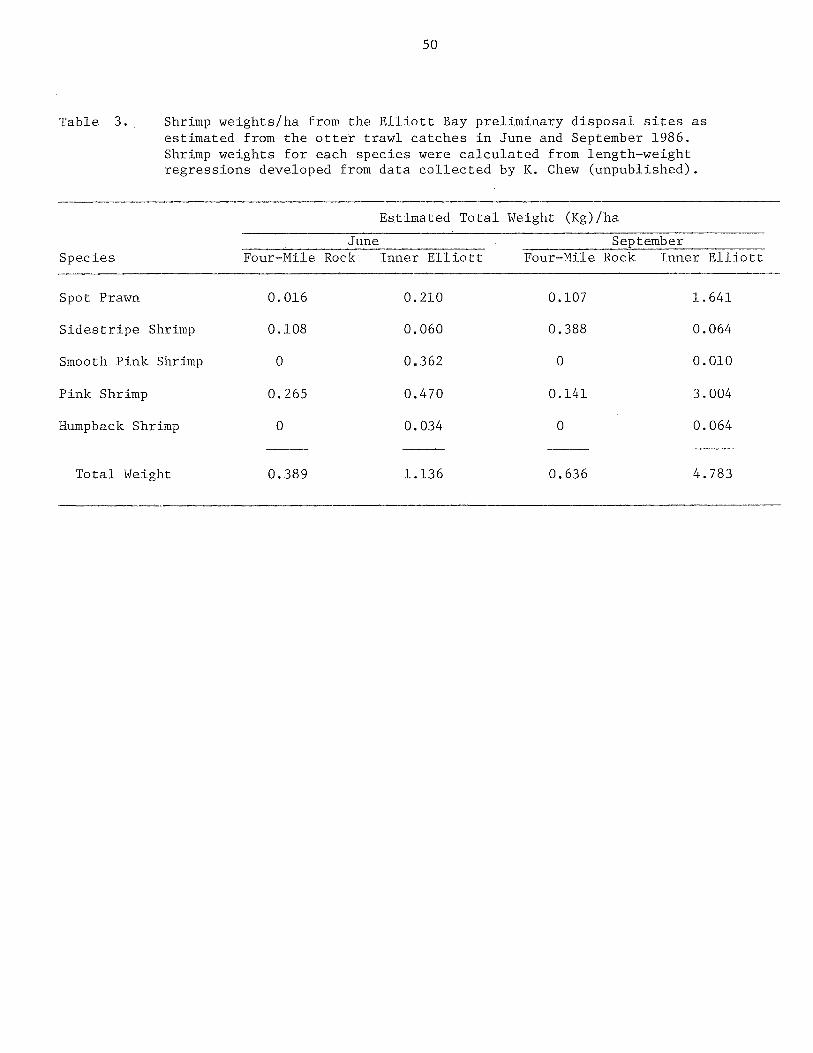
50
Table 3. Shrimp weights/ha from the Elliott Bay preliminary disposal sites asestimated from the otter trawl catches in June and September 1986.Shrimp weights for each species were calculated from length—weightregressions developed from data collected by K. Chew (unpublished).
Estimated Total Weight (Kg)/ha
• June SeptemberSpecies Four—Mile Rock Inner Elliott Four—Mile Rock Inner Elliott
Spot Prawn 0.016 0.210 0.107 1.641
Sidestripe Shrimp 0,108 0.060 0.388 0.064
Smooth Pink Shrimp 0 0,362 0 0.010
Pink Shrimp 0.265 0.470 0.141 3.004
Humpback Shrimp 0 0.034 0 0.064
Total Weight 0.389 1.136 0.636 4.783
51
Part II
Demersal Fish Studies
by
Robert F. Donnelly, Bruce S. Miller, Robert R. Lauth, and Shelley C. Clarke
INTRODUCTION
This study investigated fish assemblages at preliminary Puget Sound
Dredge Disposal Analysis (PSDDA) disposal sites in the main basin of Puget
Sound and evaluates these assemblages prior to actual disposal of dredged
materials. Information obtained will be used in the final site selection
process and can be used as baseline data to monitor changes in fish
assemblages following disposal activities.
Disposal of dredged materials can affect fish habitats in many ways.
Sediment type has been shown to be particularly important for spawning (Morton
1977). Alteration of substrate particle composition by dredged materials and
consequent alteration of spawning grounds could be detrimental to the
abundance of certain fish species.
Dredged materials can alter the species composition of fish at
disposal sites by causing changes in the benthic community upon which the fish
feed (Lunz and Kendall 1982). A Rhode Island dredged materials disposal study
(Saila et al. 1972) suggests that covering the bottom with a uniform sediment
type would decrease the diversity of prey organisms and possibly decrease the
diversity of fish species. Desbruyeres et al. [1980, in Thistle (1981)] found
five times greater benthic faunal density six months after a disturbance at
2160 m; however, the fauna in the disturbed area was taxonomically different
from the surrounding fauna. At a deepwater disposal site in Puget Sound,
Bingham (1978) showed a similar effect. Nine months after disposal, diversity
52
of prey organisms was greater at the disposal site than at reference areas.
A disturbance caused by an oil spill in shallow water actually resulted in a
biomass increase six months to one year after the spill (Orensanz and Gallucci
1982). The work of Grassle (1977), however, cautions that the recovery after
disturbance may be depth dependent. Grassle’s study found that a deepsea site
(1760 m deep) had a colonization rate two orders of magnitude lower than a
comparable intertidal site.
Although it is important to be aware of the potential changes, it is
difficult to accurately predict what impact the disposal of dredged materials
will have on fish assemblages due to the individual nature of each disposal
site. Therefore, it is important to identify areas where fish resource
conservation is essential from a commercial or ecological perspective before a
decision is made regarding disposal. This report documents the benthic fish
assemblages of the preliminary main basin PSSDA disposal sites and adjacent
reference areas, and can aid in selection of sites where disposal of dredged
materials will have a minimal impact.
MATERIALS AND METHODS
Bottomfish (benthic and demersal fishes) were sampled in Commencement
Bay, Elliott Bay, Saratoga Passage and Port Gardner during 1986. Commencement
Bay was sampled on June 13 and September 8; Elliott Bay was sampled on July 3
and September 9; and Saratoga Passage was sampled once on July 1. Port Gardner
was sampled during four seasons on February 12 and 13, April 18 and 21, June
30 and July 2, and September 11 and 15. Marine environmental data (salinity,
dissolved oxygen, water temperature and water clarity) were also collected.
A 7.6—rn, single wire otter trawl (Mearns and Allen 1978) was the primary

53
sampling gear for bottomfish. The body of the net was made of 3.5 mm stretch
mesh and the cod end of 0.5 cm stretch mesh covered with 2.5 mm stretch mesh
to prevent chafing. The net was deployed from the 16—m research vessel
Kittiwake. The effective fishing width of the otter trawl was 6 m. Each
sample consisted of one otter trawl haul towed for a distance of 370 m at a
target ground speed of 4.2 km per hour. The total area swept (sampled) was
2,220 m2. Fish were also collected incidentally by the beam trawl used to
sample crabs (see Appendix A). The beam trawl is described elsewhere in the
crab and shrimp section (Part I) of this report.
Sampling was conducted both inside and outside of each preliminary PSDDA
site (Figures 1—4). Three replicate samples were collected inside each PSDDA
site and NAVY site (Port Gardner only) during each sampling cruise. One
sample was taken from each station outside of the PSDDA sites and at each of
the U.S. Army Corps of Engineerst established reference stations (Clarke 1986)
during each cruise. Reference stations were not sampled in Commencement Bay.
PSDDA sites and reference stations were the only locations sampled in Elliott
Bay (Fig. 2). In Commencement Bay, Saratoga Passage and Port Gardner the
PSDDA site(s), the reference station(s) and several additional stations
stratified by depth were sampled.
Each trawl catch was brought onboard and fish were sorted by species and
life history stage (adult or juvenile), counted and recorded; miscellaneous
observations (e.g., spawning condition) were also recorded. The catch was
then placed into plastic bags, labeled, put into ice chests and covered with
ice. The samples were transported to the University of Washington and placed
into a 0°C freezer until processed.
Surface water temperature, salinity and dissolved oxygen samples were
taken from a bucket of water collected from the surface waters. Bottom water

54
Figure 1. Map of Commencement Bay showing locations sampled forbottomfish (~) on June 13 (summer) and September 8(autumn). The large area enclosed by the dashed lineis the zone of siting feasibility (zSF). Circular areasenclosed by solid lines are the preliminary PSDDA sites.
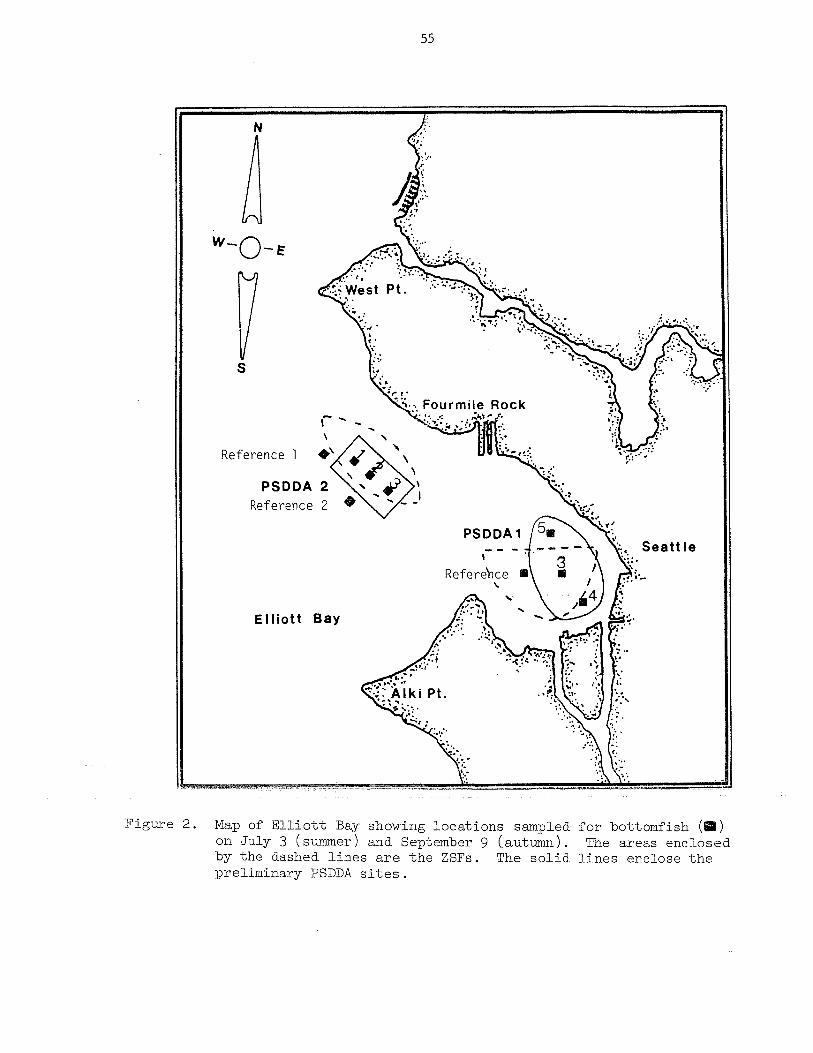
55
Figure 2. Map of Elliott Bay showing locations sampledon July 3 (summer) and September 9 (autumn).by the dashed lines are the ZSFs. The solidpreliminary PSDDA sites.
for bottomfish (~)The areas enclosed
lines enclose the

56
Figure 3. Map of Saratoga Passage showing locations sampled for bottom—fish (~) on July 1 (sunimer). The area enclosed by thedashed line is the ZSF. The rectangular area enclosed bythe solid line is the PSDDA site.
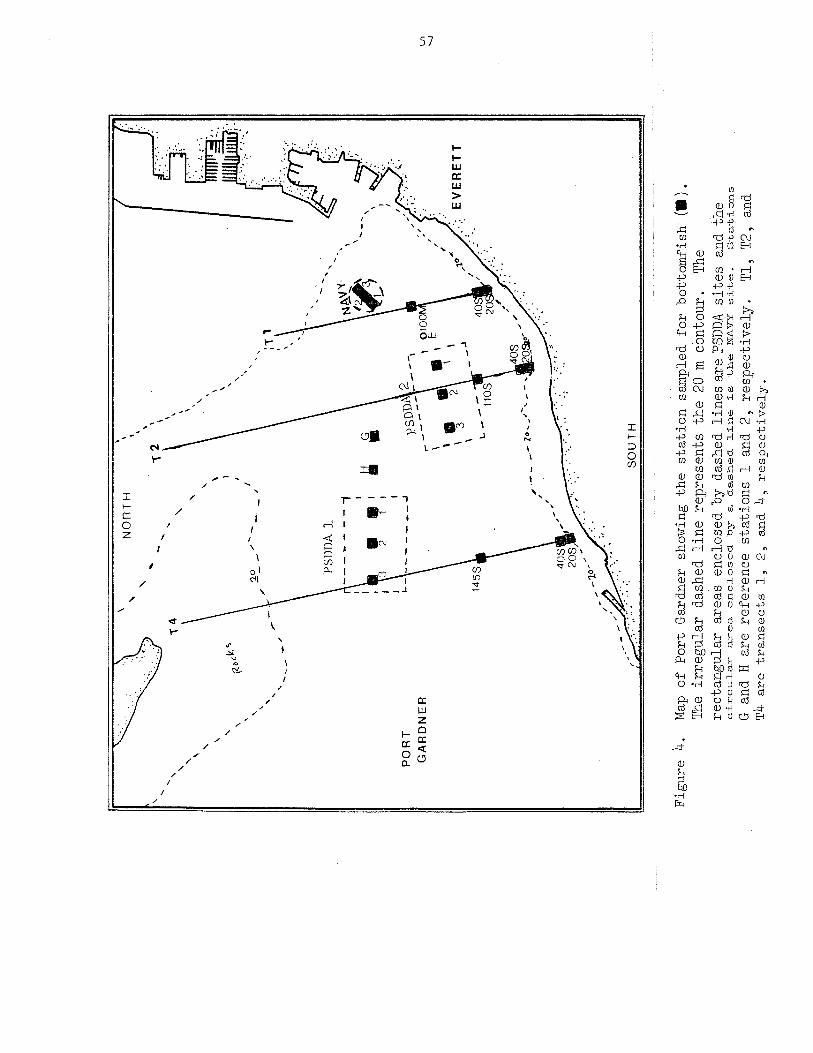
Fig
ure
4~M
apo
fP
ort
Gar
dner
show
ing
the
sta
tio
nsa
mpl
edfo
rb
ott
om
fish
(S).
The
irre
gu
lar
dash
edlin
ere
pres
ents
the
20ni
con
tou
r.Th
ere
cta
ng
ula
rar
eas
en
clo
sed
byda
shed
line
sar
ePS
DDA
site
san
dth
ecircu
lar
are
ae
nclo
se
db
ya
cla
sh
ed
lin
eis
bh
eN
AV
Ysib
e.
Sta
bio
ns
Gan
dH
are
refe
ren
cest
atio
ns
1an
d2,
resp
ect
ive
ly.
Tl,
T2,
and
T~4
are
tra
nse
cts
1,
2,
an
d~
,re
sp
ective
ly.
U,

58
temperature, salinity and dissolved oxygen samples were taken from water
collected approximately I m above the bottom with a Scott—Richards water
bottle. Water temperatures were measured with a hand—held thermometer and
recorded in the field. Water samples for salinity determination were placed
into bottles for later measurement in the laboratory. Water samples for
dissolved oxygen determination were placed into acid washed glass bottles,
fixative added, the bottles glass stoppered, and the contents later processed
in the laboratory. Water clarity measurements were taken with a Secchi disc
from the lee side of the vessel and recorded in the field.
Laboratory Processing of Fish
Fish samples were removed from the freezer and thawed. The contents were
separated by species and life history stage. Total length (mm) of each fish
and total weight (grams) of each life history stage were recorded on data
forms and then entered into electronic storage. Since the tips of ratfish
tails were often missing, a length from the snout to the posterior end of the
second dorsal fin, as well as total length (when possible), was recorded for
this species. Adult flatfish and ratfish were sexed.
Flatfish Diseases
Marine flatfishes in Puget Sound are known to be infected by blood worms
(the nematode,Philometra), skin tumors, liver tumors and fin erosion (Amish
1976; Angell et al. 1975; Miller and Wellings 1971; Wellings et al. 1976;
Malins et al. 1982).
Blood worms are clearly visible and typically located in the subcutaneous
areas near or at the base of the dorsal and anal fins (Amish 1976). Skin
tumors (Angell et al. 1975; McArn et al. 1968; Miller and Wellings 1971) are
59
found as two main stages: angioepithelial nodules and epidermal papillomas.
All flatfish were externally inspected for blood worms and skin tumors.
Liver tumors are thought to be indicators of pollution (Malins et al.
1962). In the advanced stage, liver tumors are characterized by small nodules
visible on the external surface of the liver. English sole caught in polluted
areas have often been shown to have liver tumors (Malins et al. 1982; Tetra
Tech 1985). Gross examination (non—microscopic) of the external surface of
the livers from about 20% of all flatfish caught was done in the laboratory.
Another disease associated with flatfish in polluted areas is fin
erosion. Fin erosion typically affects the dorsal and anal fins and is
characterized by partial destruction of the fin(s) in question. The severity
ranges from minor defects to extensive destruction of the fin(s) (Wellings et
al. 1976). All flatfish were examined in the field for fin erosion.
Environmental Measurements
Salinity samples were processed by the University of Washington, School
of Oceanography Technical Services group, by conductivity bridge (Paquette
1958). Dissolved oxygen samples were processed by the University of
Washington, School of Fisheries Environmental Laboratory, using titration
techniques described in Standard Methods (1980).
Data Analysis
Species richness, defined as the total number of species present at each
sample site or station, was determined for all stations in Commencement Bay,
Elliott Bay and Saratoga Passage.
Species diversity was calculated using the Shannon—Wiener species
diversity index H’ (Pielou 1978) as follows:

60
H’ = - Z P~ ~
where ~j was the proportion of the total sample that belonged to the ~th
species and n = the number of species. As a consequence of the formula, H’
increases with an increase in the number of species and/or as the individuals
caught become more evenly distributed across all species present.
Abundance and biomass averages were calculated for the combined PSDDA
site samples. “Replicate” samples were taken only at the proposed PSDDA sites
and the NAVY site in Port Gardner; all other stations were sampled once per
season. Length-frequency histograms were constructed for the most abundant
species from the Elliott Bay, Commencement Bay and Saratoga Passage otter
trawl data.
The number of flatfish caught per hectare was calculated for each site by
multiplying the abundance estimates for each flatfish species by the constant
4.5 [which is equal to 10,000 m2 (one hectare) divided by 2,220 m2 (the total
area swept by the otter trawl during each sample)]. Similarly, the reader can
also convert to biomass caught per hectare, or number caught per hectare, for
the remaining fish species by multiplying the given biomass or abundance
values by the constant 4.5.
RESULTS
A total of 55 species of fish were collected by otter trawl during this
study (Table 1). Common names are used throughout this report, although Table
1 lists both the common and scientific names of all fish caught. The
following results are from the otter trawl data only, since beam trawl results
(Appendix A) did not add significant additional information for the purpose of
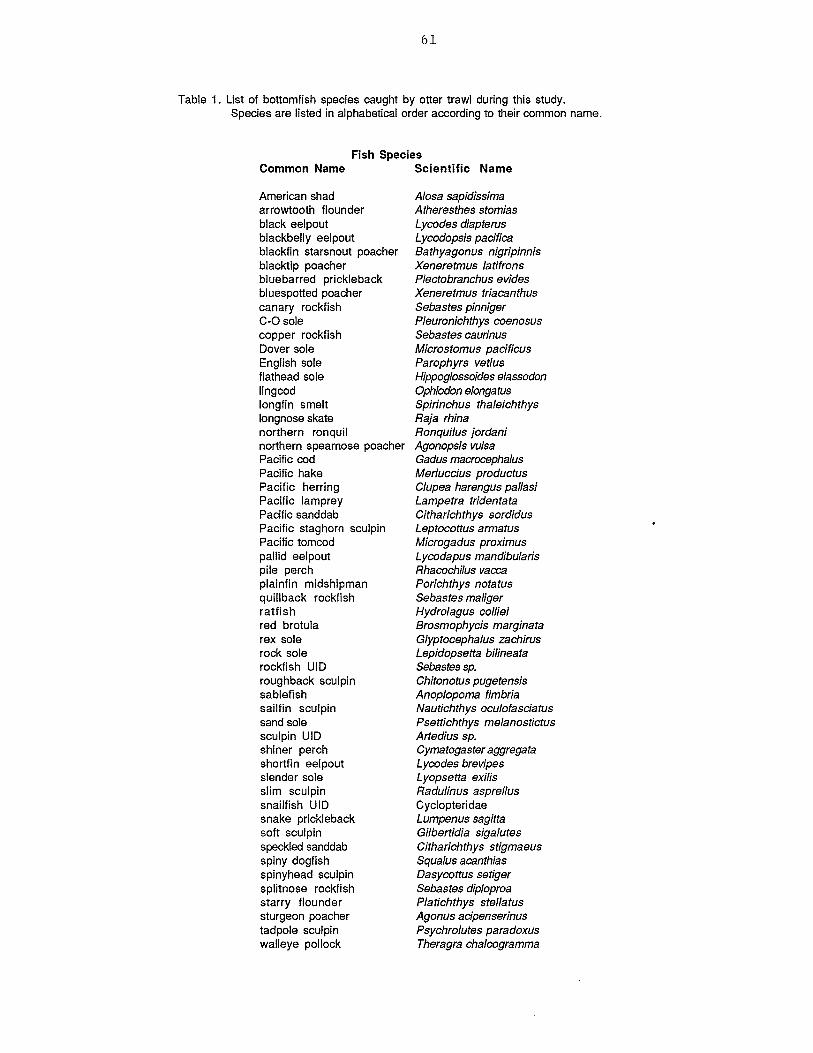
61
Table 1. List of bottomfish species caught by otter trawl during this study.Species are listed in alphabetical order according to their common name.
Fish SpeciesCommon Name Scientific Name
American shad Alosa sapidissimaarrowtooth flounder Atheresthes stomiasblack eelpout Lycodes diapterusblackbelly eelpout Lycodopsis pacificablackfin starsnout poacher Bathyagonus nigripinnisblacktip poacher Xeneretmus latifronsbluebarred prickleback Plectobranchus evidesbluespotted poacher Xeneretmus triacanthuscanary rockfish Sebastes pinnigerC-O sole Pleuronichthys coenosuscopper rockfish Sebastes caurinusDover sole Microstomus pacificusEnglish sole Parophyrs vetlusflathead sole Hippoglossoides elassodonlingcod Ophiodon elongatuslongfin smelt Spirinchus thaleichthyslongnose skate Raja rhinanorthern ronquil Ronqullus jordan!northern spearnose poacher Agonopsis vulsaPacific cod Gadus macrocephalusPacific hake Merluccius productusPacific herring Clupea harengus pallasiPacific lamprey Lampetra tridentataPacific sanddab Citharichthys sordidusPacific staghorn sculpin Leptocottus armatusPacific tomcod Microgadus proximuspallid eelpout Lycodapus mandibularispile perch Rhacochllus vaccaplainf in midshipman Porichthys notatusquillback rockfish Sebastes maligerratfish Hydrolagus collieired brotula Brosmophycis marginatarex sole Glyptocephalus zachirusrock sole Lepidopsetta bilineatarockfish UID Sebastes sp.roughback sculpin Chitonotus pugetensissablefish Anoplopoma fimbriasailfin sculpin Nautichthys oculofasciatussand sole Psettichthys melanostictussculpin UID Artediussp.shiner perch Cymatogasteraggregatashortfin eelpout Lycodes brevipesslender sole Lyopsetta exilisslim sculpin Radulinus asprellussnailfish UID Cyclopteridaesnake prickleback Lumpenus sagittasoft sculpin Gilbertidia sigalutesspeckled sanddab Citharichthys stigmaeusspiny dogfish Squalus acanthiasspinyhead sculpin Dasycottus setigersplitnose rockfish Sebastes diploproastarry flounder Platichthys stellatussturgeon poacher Agonus acipenserinustadpole sculpin Psychrolutes paradoxuswalleye pollock Theragra chalcogramma

62
final site selections. Abundance, biomass, species richness and species
diversity were used to characterize the fish assemblage at each PSDDA
location.
Flatfish caught per hectare was calculated (Appendix E) at the request of
the U.S. Army Corps of Engineers because 6 flatfish/hectare was recommended as
a preliminary criterion by Washington Department of Fisheries (WDF) as a
minimum number of flatfish needed to support a commercial fishery (WDF 1987).
However, it must be understood that the 7.6 m research otter trawl used in
this study, and by other research groups (e.g., Southern California Coastal
Water Research Project), is selective (as is all sampling gear) and it is
unknown how the 7.6 m trawl catches compare to the actual abundance of
flatfish present, or how the catches compare to the catches used by WDF to
compute the 6 flatfish/hectare criterion. For example, the 7.6 m research
trawl probably catches relatively more juveniles than adults compared to a
commercial trawl.
Commencement Bay
Abundance and biomass. Total abundance and biomass values showed
seasonal and depth differences between many of the catches (Figures 5 and 6).
The summer values were lower than the autumn values. The deeper stations,
which included the PSDDA sites, had the lowest values regardless of season.
Total abundance and biomass values were highest at 40 in then declined at 20 in
(Figures 5 and 6). English sole, Dover sole and ratfish were found in most
samples and generally the PSDDA sites contained the lowest abundance and
biomass of these three species when compared to the samples collected outside
the PSDDA sites. English sole abundance and biomass values were greatest at
40 m in both early summer and autumn, while at the deeper stations, including
the PSDDA sites, the English sole abundance and biomass values were lower than

63
Figure 5. Number (abundance) of fish caught in Commencement Bay, shown bystation and season. The values are based on a single sample,except for the PSDDA sites, which are the average of threesamples. NS,= n~ sampleth
40000
30000
• SUMMER
D AUTUMN
by station and season. The valuessample, except for the PSDDA sites,of three samples. NS not sampled.
• SUMMER
D AUTUMN
N0
0
f
F
SH
400
300
200
100
0
PSDDA 1(165 m)
PSDDA 2(165 m)
156 m
NS Li40 m 20 m
BIgOrM a 20000AmSsS
10000
0
Figure 6.
JL~~zi.156 m
NS~40 m 20 m
PSODA 1 PSDDA 2(165 m) (165 m)
Biomass (in grams) of fish caught in Commencement Bay, shownare based on a singlewhich are the average
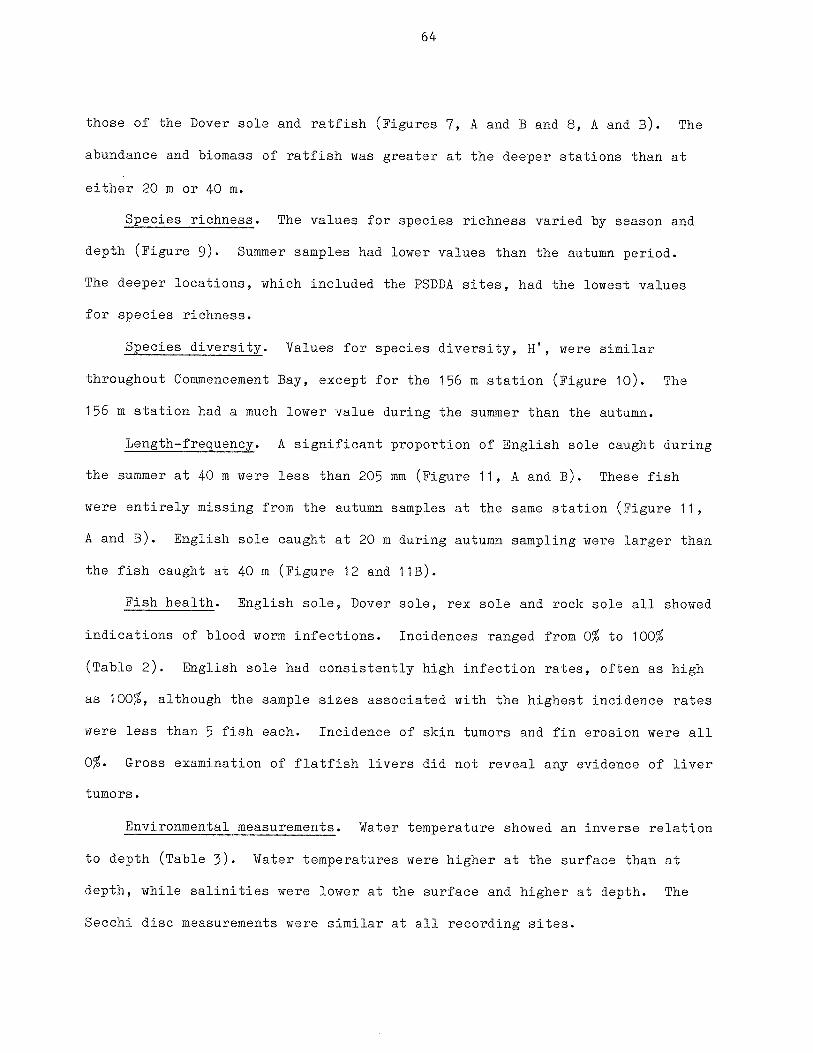
64
those of the Dover sole and ratfish (Figures 7, A and B and 8, A and B). The
abundance and biomass of ratfish was greater at the deeper stations than at
either 20 m or 40 m.
Species richness. The values for species richness varied by season and
depth (Figure 9). Summer samples had lower values than the autumn period.
The deeper locations, which included the PSDDA sites, had the lowest values
for species richness.
Species diversity. Values for species diversity, H’, were similar
throughout Commencement Bay, except for the 156 m station (Figure 10). The
156 m station had a much lower value during the summer than the autumn.
Length-frequency. A significant proportion of English sole caught during
the summer at 40 m were less than 205 mm (Figure 11, A and B). These fish
were entirely missing from the autumn samples at the same station (Figure 11,
A and B). English sole caught at 20 m during autumn sampling were larger than
the fish caught at 40 m (Figure 12 and 11B).
Fish health. English sole, Dover sole, rex sole and rock sole all showed
indications of blood worm infections. Incidences ranged from 0~ to 100~
(Table 2). English sole had consistently high infection rates, often as high
as 100~, although the sample sizes associated with the highest incidence rates
were less than 5 fish each. Incidence of skin tumors and fin erosion were all
0%. Gross examination of flatfish livers did not reveal any evidence of liver
tumors.
Environmental measurements. Water temperature showed an inverse relation
to depth (Table 3). Water temperatures were higher at the surface than at
depth, while salinities were lower at the surface and higher at depth. The
Secchi disc measurements were similar at all recording sites.

65
N0
0
F
SH
I -~
20 m
Figure 7. Number (abundance) of English sole, Dover sole and ratfishcaught in Coniinenceinent Bay during summer (A) and autumn (B),shown by station. The values are based on a single sample,except for the PSDDA sites, which are the average of threesamples. NS not sampled.
• English sole Summer
0 Dover sole Summer
[El Ratfish Summer
A
PSDDA 1(165 m)
200
150
100
50
0~—
200
150
100
50
0—
PSDDA 2(165 m)
NS
20 m
• English sole Autum~]
El Dover sole Autumn
El Ratfish Autumn
P ~~( Vt
156 m
N0
0
F
SH
B
PSDDA 1(165 m)
PSDDA 2(165 m)
156 m
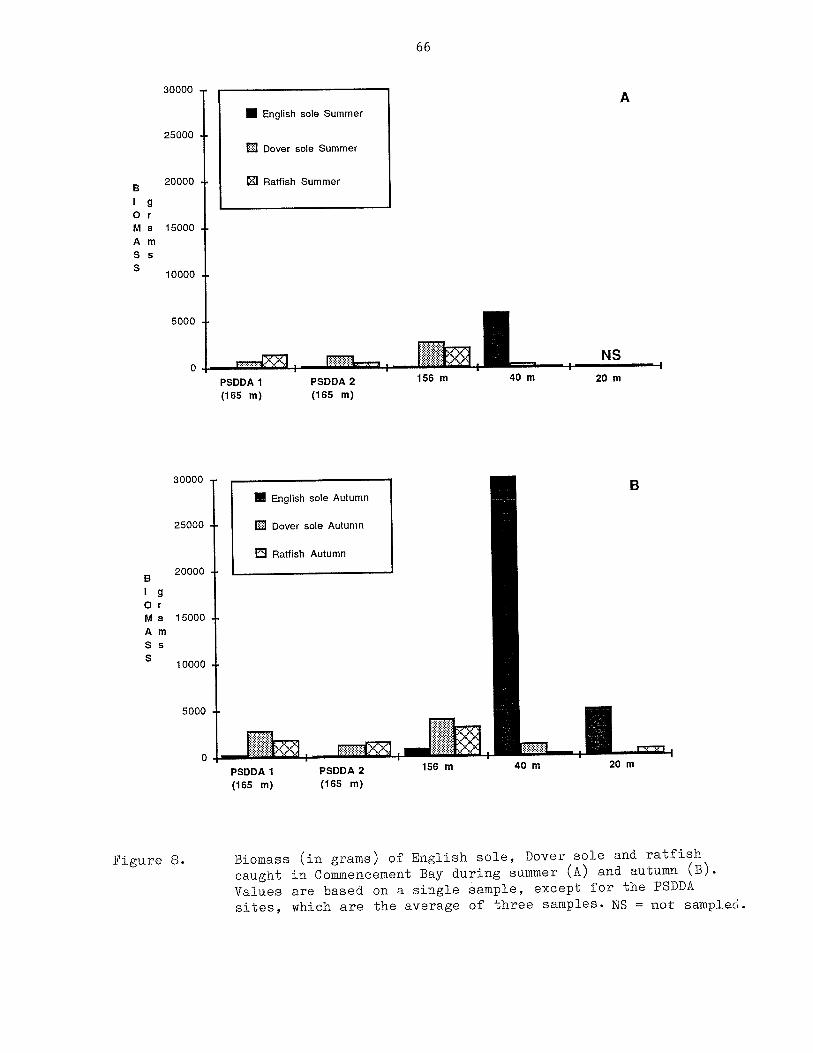
66
Figure 8. BiomasscaughtValuessites,
(in grams) of English sole, Dover sole and ratfishin Commencement Bay during summer (A) and autumn (B).are based on a single sample, except for the PSDDAwhich are the average of three samples. NS not sampled.
S English sole Summer
0 Dover sole Summer
0 Ratfish Summer
A
NS
20 mPSDDA 1(165 m)
BIgOrMaAmSsS
BIgOrMaAmSsS
30000
25000
20000
15000
10000
5000
0
30000
25000
20000
1 5000
10000
5000
0
PSDDA 2(165 m)
156 m 40 m
S English sole Autumn
0 Dover sole Autumn
~ Ratfish Autumn
B
20 mPSDDA 1 PSODA 2(165 m) (165 m)
156m 40m

67
SpEC
ES
R
CHNESS
Figure 9.
SpEC
ES
2.0
PSDDA 1(165 m)
Figure 10.
Species richness (total number of species) of fish caught inCommencement Bay, shown by station and season. NS = not sampled.
PSDDA 2(165 m)
Species diversity (H’) of fish caught in Commencement Bay,shown by station and season. NS = not sampled.
16
14
12
10
8
6
4
2
0
m SUMMER
D AUTUMN
PSODA 1 PSDDA 2(165 m) (165 m)
-~L
156m 40m 20m
1.8
1.6
1.4
1.2
1.0
0.8
0.6
0.4
0.2
0.0
D
VEBS
TY
• SUMMER
D AUTUMN
156 mNS
40 m 20 m

68
7
S English sole - male A6 EJ Englsih sole - female
5FREQUENCY
~ ;~ ‘ .. ]~~I_~
125 145 165 185 205 225 245 265 285 305 325 345 365 385 405LENGTH mm
16
S English sole - male B14 D English sole - female
12
FR 10EQU 8ENC 6Y
~~Ji I ii. I ~B, , , , , , ,
125 145 165 185 205 225 245 265 285 305 325 345 365 385 405LENGTH
Figure 11. Length frequency of English sole, shown by sex, caught inCommencement Bay during summer (A) and autumn (B) at 40 m.
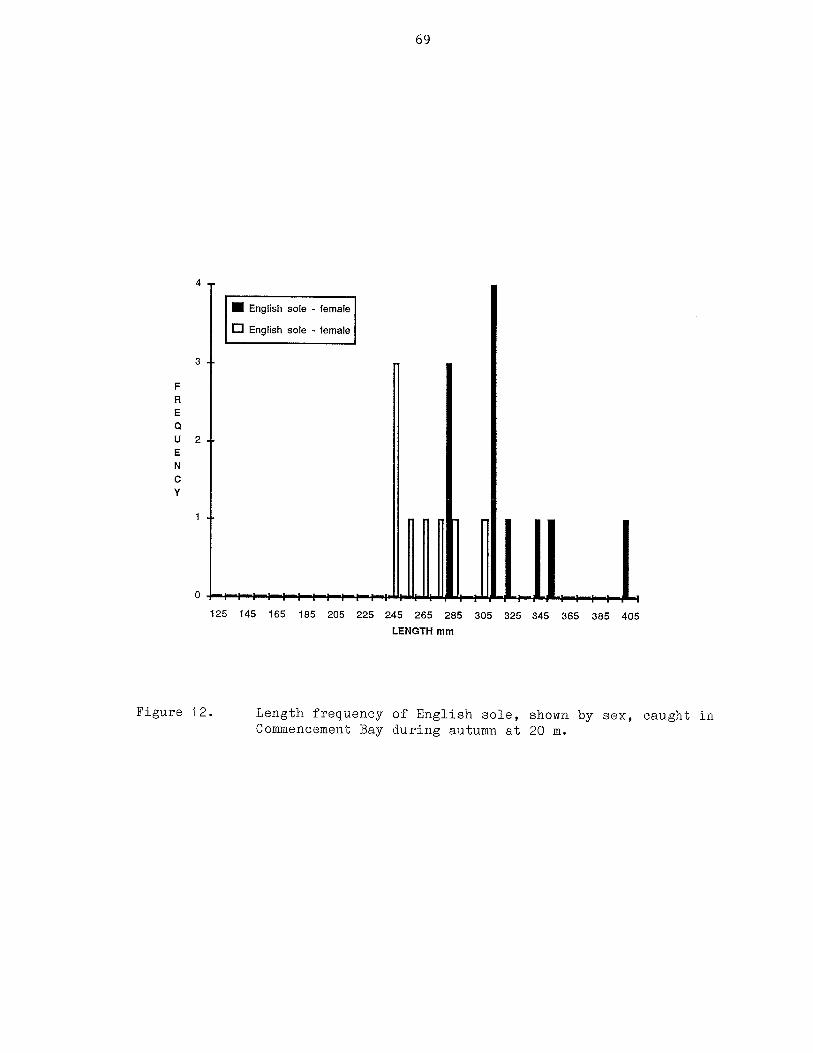
69
4
S English sole - female
EJ English sole - female
3
FRE0U 2ENCY ~ — ~ ~I- ~ 1r_,__~__r__
125 145 165 185 205 225 245 265 285 305 325 345 365 385 405
LENGTH mm
Figure 12. Length freq~uency of English sole, shown by sex, caught inCommencement Bay during autumn at 20 m.

Ta
ble
2.
Pe
rce
nt
incid
en
ce
and
sam
ple
siz
e(in
pa
ren
the
se
s)
of
blo
od
wor
m(P
hilo
me
tra
sp
.)in
fectio
nin
fla
tfis
hca
ug
ht
inC
omm
ence
men
tB
ay,
show
nb
ysp
ecie
s,
sta
tio
nan
dse
aso
n.
S=
sum
mer
,A
au
tum
n.
PSD
DA
1PS
DD
A2
(16
5m
)(1
65
m)
156
m40
m20
mS
AS
AS
AS
AS
A
En
glis
hso
le0(
2.)
10
0(1
)1
00
(4)
33
(3)
43
(40
)4
8(1
15
)5
8(1
9)
Do
ver
so
le0
(4)
0(3
)0
(5)
0(1
0)
0(6
)9
(11
)0
(5)
35
(5)
Sle
nd
er
so
le0
(3)
0(1
3)
0(2
)0
(4)
0(3
)0
(12
)
Roc
kso
le0
(2)
20
(10
)3
1(1
6)
Rex
so
le1
00
(1)
0(1
)0
(3)
0(5
)0
(7)
Arr
ow
too
thflo
un
de
r0
(1)
C—0
so
le0
(1)
0(1
)S
pe
ckle
dsa
nd
da
b0
(3)
C
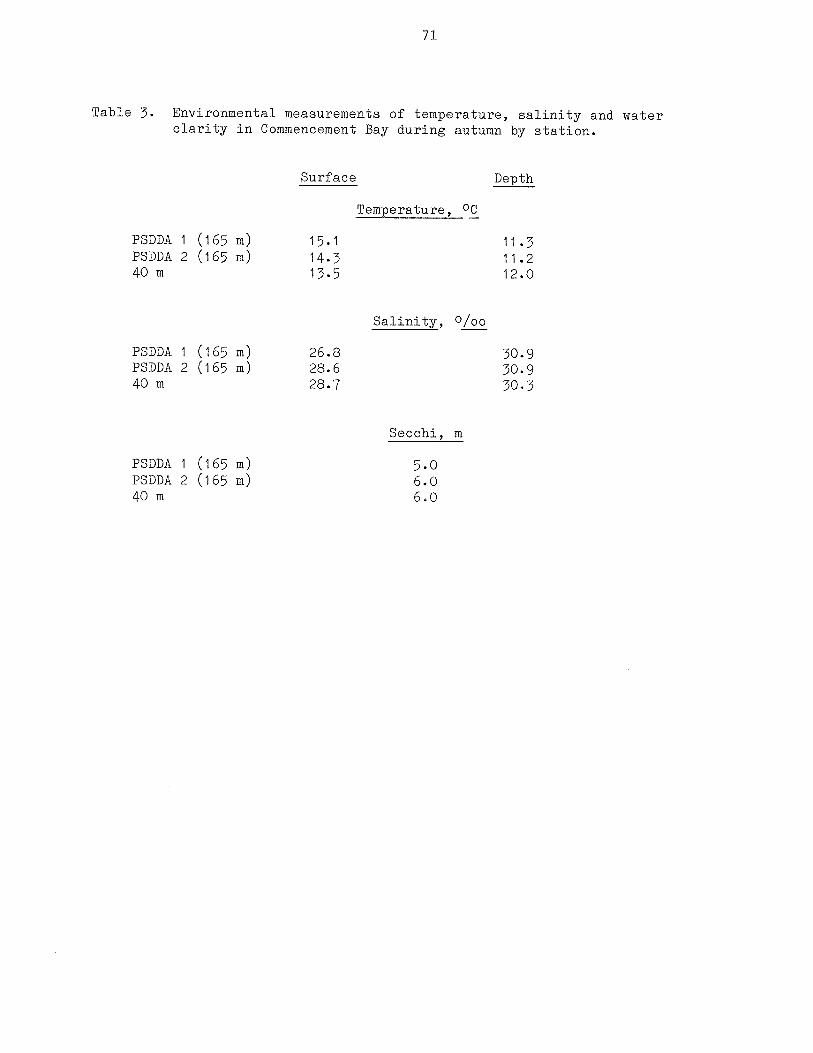
71
Table 3. Environmental measurements of temperature, salinity and waterclarity in Commencement Bay during autumn by station.
Surface Depth
Temperature, OC
PSDDA 1 (165 m) 15.1 11.3PSDDA 2 (165 m) 14.3 11.240 m 13.5 12.0
Salinity, O/oo
PSDDA 1 (165 m) 26.8 30.9PSDDA 2 (165 m) 28.6 30.940 m 28.7 30.3
Secchi, m
PSDDA 1 (165 m) 5.0PSDDA 2 (165 m) 6.040m 6.0

72
Elliott Bay
Abundance and biomass. The abundance and biomass values varied by
station and by season (Figures 13 and 14). Abundance and biomass values were
higher for autumn than for summer at all stations except PSDDA 1 Reference
station.
Six species of fish dominated the catches in Elliott Bay: English sole,
Dover sole, Pacific hake, slender sole, ratfish and blackbelly eelpout,
although not every species was found at each site (Figures 15, A and B and 16,
A and B). The PSDDA 1 site (inner Elliott Bay) was the shallowest and had the
largest abundance and biomass of Pacific hake, slender sole and blackbelly
eelpout. The PSDDA 2 site Fourmile Rock) had a greater abundance and biomass
of English sole, Dover sole and ratfish than the PSDDA 1 site. The PSDDA 2
site had lower abundance and biomass values compared with the values found at
the adjacent reference stations. Generally, abundance and biomass values
increased from the summer to the autumn sampling; specifically, English sole,
Dover sole, and ratfish. The shallower PSDDA 1 area had greater numbers of
the smaller fishes such as blackbelly eelpouts and slender sole in contrast to
the deeper PSDDA 2 area where the larger species dominated.
Species richness. The values for species richness varied by season and
depth (Figure 17). Species richness was generally lower during the summer
than the autumn, except for the PSDDA 1 reference station, where values were
the same. The PSDDA 1 site and the PSDDA 1 reference station generally had
larger values than the PSDDA 2 site and the PSDDA 2 reference stations, except
for the PSDDA 2 site during the autumn.
Species diversity. The values for species diversity, H’, generally
diminished from the inner bay PSDDA 1 site and reference station to the
Fourmile Rock PSDDA 2 site and reference station (Figure 18) irrespective of
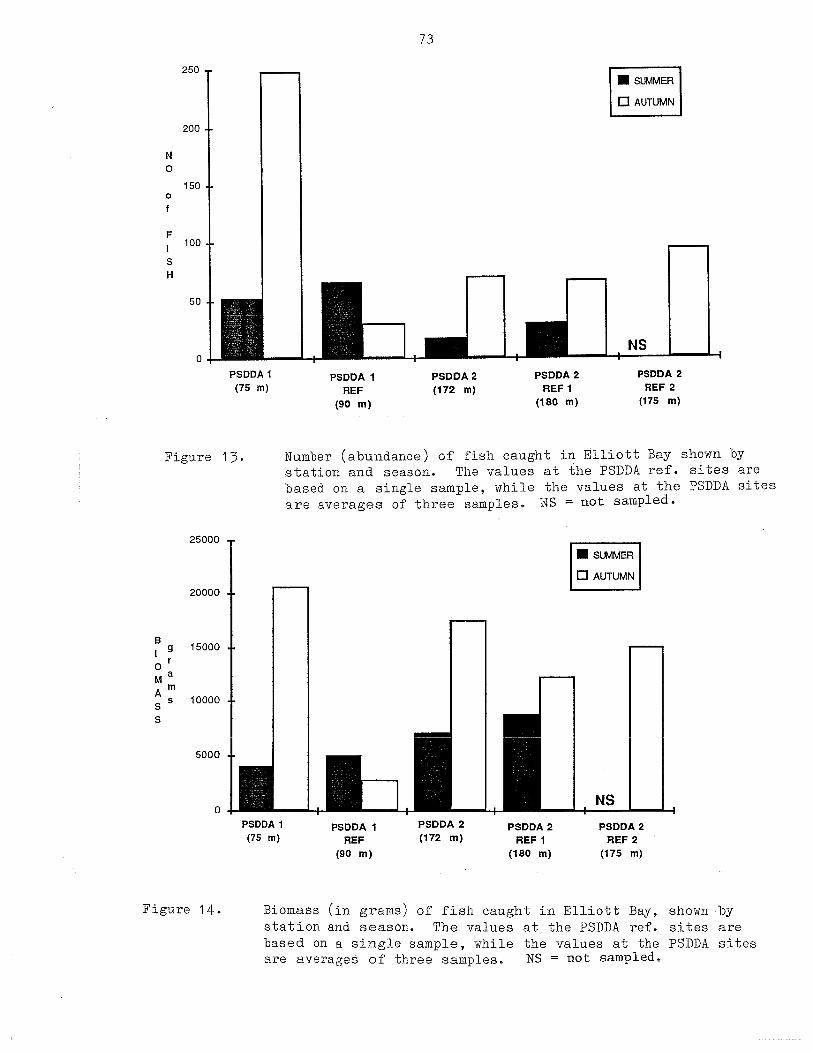
73
Figure 15. Number (abundance) of fish caught in Elliott Bay shown bystation and season. The values at the PSDDA ref. sites arebased on a single sample, while the values at the PSODA sitesare averages of three samples. NS = not sampled.
Biomass (in grams) of fish caught in Elliott Bay,station and season. The values at the PSDDA ref.based on a single sample, while the values at theare averages of three samples. NS not sampled.
250
200
150
100
50
N0
0
F
SI-I
• SUMMER
D AUTUMN
NS0 I
PSDDA 1(75 m)
.1PSDDA 1 PSDDA 2 PSDDA 2 PSODA 2
REF (172 m) REF1 REF2(90 m) (180 m) (175 m)
25000
20000
r g 15000
MaAm
s 10000
S
5000
Figure 14.
•EJ AUTUMN
NS0
PSDDA 1(75 m)
PSDDA 1 PSDDA 2 PSDDA 2 PSDDA 2REF (172 m) REF 1 REF 2
(90 m) (180 m) (175 m)
shownsitesPSDDA
byaresites

74
100 A• English sole Summer
900 Dover sole Summer
80 ~ Slender sole Summer
N 70 D Ratfish Summero 0 BB Eelpout Summer
600
50
F40
SH 30
20
1: r,_1~.LJ1 __~1~~1~] r~ NS
PSDDA 1 PSDDA 1 PSDDA 2 PSDDA 2 PSDDA 2(75 m) REF (172 m) REF 1 REF 2
(90 m) (180 m) (175 m)
100B
90 English sole Autumn
80 0 Dover sole Autumn
L~ Slender sole AutumnN 70o D Ratfish Autumn
60 0 BB Eelpout Autumn
50 R Pacific hake Autumn
F40
SH 30
~ ~ ~PSDDA 1 PSDDA 1 PSDDA 2 PSDDA 2 PSDDA 2
(75 m) REF (172 m) REF1 REF2
(90 m) (180 m) (175 m)
Figure 15. Number (abundance) of English sole, Dover sole, slender sole,ratfish and blackbelly eelpout (BB) caught in Elliott Bayduring summer (A) and autumn (B), shown by station. The valuesat the PSDDA ref. sites are based on a sin~le sample, while thevalues at the PSDDA sites are averages of three samples.NS not sampled.

75.
Figure 16. Biomass (in grams) of English sole, Dover sole, slender sole,ratfish and blackbelly eelpout (BB) caught in Elliott Bayduring summer (A) and autumn (B), shown by station. The valuesat the PSDDA ref. sites are based on a single sample, while thevalues at the PSDDA sites are averages of three samples.
S English sole Summer
0 Dover sole Summer
~ Slender sole Summer
0 Ratfish Summer
D BB Eelpout Summer
A
B1g
MaAmssS
B
MaAmssS
8000
7000
6000
5000
4000
3000
2000
1000
0
8000
7000
6000
5000
4000
3000
2000
1000
0
PSDDA 1 PSODA 1 PSDDA 2 PSDDA 2 PSDDA 2(75 m) REF (172 m) REF 1 REF 2
(90 m) (180 m) (175 m)
S English sole Autumn
0 Dover sole Autumn
~ Slender sole Autumn
0 Ratfish Autumn
D BB Eelpout Autumn
B
PSDDA 1(75 m)
PSDDA 1REF
(90 m)
PSDDA2 PSDDA2 PSDDA2(172 m) REF1 REF2
(180 m) (175 m)
NS not sampled
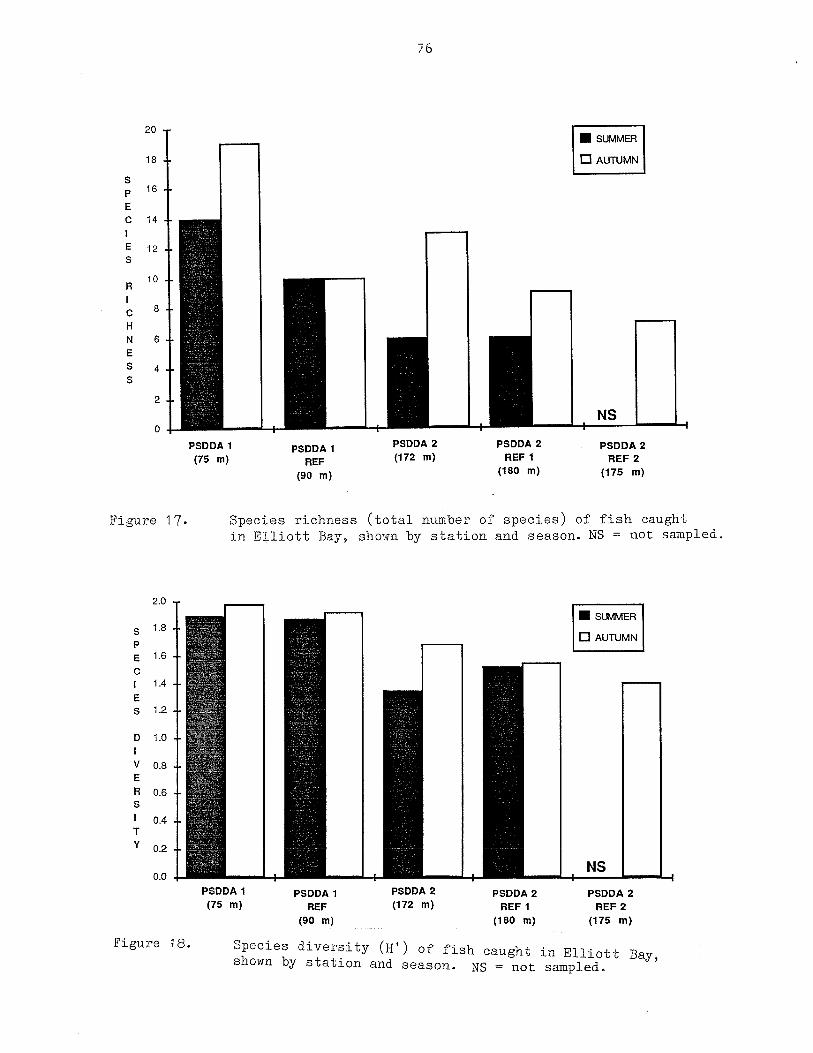
76
D
VERS
TY
• SUJIMER
D AUT~~j
• SUMMER
D AUTUMN
J
20
18
S16
EC 14
E 12S
R 10
c 8HN 6ES ~S
2
0
PSDDA 1 PSDDA 1(75 m) REF
(90 m)
Figure 17. Species richness (total number of species) of fish caughtin Elliott Bay, shown by station and season. NS = not sampled.
Sp ______________
EC
ES
PSDDA 2 PSDDA 2 PSDDA 2(172 m) REF 1 REF 2
(180 m) (175 m)
2.0
1.8
1.6
1.4
1.2
1.0
0.8
0.6
0.4
0.2
0.0PSODA 1(75 m)
PSDDA 1REF
(90 m)
PSDDA 2(172 m)
NS
PSDDA 2REF 1
(180 m)
Figure 18. Species diversity (H’) of fish caught in Elliott Bay,shown by station and season. NS = not sampled.
PSDDA 2REF 2
(175 m)

77
season.
Length-frequency. English sole data from the PSDDA 2 Reference Station 1
during autumn suggested a bimodal distribution of adults with no juveniles
present (Figure 19).
Fish health. English sole, Dover sole and flathead sole showed evidence
of blood worm infections (Table 4). Incidence in these three species ranged
from 0% to 42%. The PSDDA 2 area had the highest incidence of blood worm
infection in English sole and Dover sole with flathead sole showing only a
minor incidence. There were no indications of skin tumors or fin erosion.
Gross examination of flatfish livers did not show any indication of liver
tumors.
Environmental measurements. Temperature and dissolved oxygen values were
higher at the surface than at depth (Table 5), while salinity was lower at the
surface than at depth. Dissolved oxygen and Secchi disc measurements showed a
seasonal pattern: dissolved oxygen was slightly lower in autumn than in summer
and Secchi disc values were slightly higher in autumn than in summer.
Saratoga Passage
Abundance and biomass. Only one sample cruise on July 1 was conducted in
Saratoga Passage. Abundance and biomass showed variation by depth and by
station (Figures 20 and 21). Abundance relative to biomass was greater for
all stations except for the PSDDA site. The PSDDA site had an intermediate
abundance value and had the highest biomass value. The dominant species
included ratfish, English sole, Dover sole, slender sole and adult Pacific
hake. Pacific hake were found in the PSDDA site and the reference station,
while English sole were only found at the shallower locations. Dover sole
were confined to the 40 m west station. Ratfish and slender sole occurred at

78
8
7
6
F S English sole - maleR D English solo - femaleEaLJ4EN
Y
2
125 145 165 185 205 225 245 265 285 305 325 345 365 385
LENGTH
Figure 19. Length frequency of English sole, shown by sex, caught atPSDDA 2, reference 1, during autumn in Elliott Bay.

Ta
ble
4.
Pe
rce
nt
incid
en
ce
and
sam
ple
siz
e(in
pa
ren
the
se
s)
of
blo
od
wor
m(P
hilo
me
tra
sp
.)in
fectio
nin
fla
tfis
hca
ug
ht
inE
llio
ttB
ay,
show
nb
ysp
ecie
s,
sta
tio
nan
dse
aso
n.
Ssu
mm
er,
A=
au
tum
n.
PSD
DA
1PS
DD
A1
Re
fPS
DD
A2
PSD
DA
2R
ef
1PS
DD
A2
Re
f2
SA
SA
SA
SA
SA
(75
m)
(90
in)
(17
2m
)(1
80
in)
(17
5in
)
En
glis
hso
le0
(1)
0(2
)3
5(5
5)
0(1
)1
4(2
8)
42
(33
)D
ove
rso
le0
(13
)0
(7)
0(1
)0
(26
)5
(20
)0
(9)
0(2
)0
(3)
Sle
nd
er
so
le0
(80
)0
(14
8)
0(1
3)
0(6
2)
0(3
5)
0(2
8)
0(3
)0
(8)
0(9
)F
lath
ea
dso
le6
(54
)3
(73
)0
(15
)0
(17
)0
(5)
Roc
kso
le0
(5)
0(1
)0
(1)
Rex
so
le0
(9)
0(9
)0
(1)

80
Table 5. Environmental measurements of water temperature, dissolvedoxygen, salinity and water clarity in Elliott Bay, by stationand season.
Summer AutumnSurface Bottom Surface Bottom
Temperature, 0C
PSDDA 1 (75 m), 13.5 10.3 18.5 11.9PSDDA 2 (172 m) 13.9 11.0 12.9 —
Dissolved Oxygen, mg/l (% saturation)
PSDDA 1 (75 m) 9.72 (110%) 7.79 (84%) 8.36 (105%) 7.67 (92%)PSDDA 2 (172 m) 9.77 (113%) 7.65 (84%) 6.34 (73%) -—
Salinity, o/oo
PSDDA 1 (75 m) 28.1 29.9 28.9 30.7PSDDA 2 (172 m) 28.8 30.2 30.1
Secchi, m
Summer Autumn
PSDDA 1 (75 m) 4.0 7.0PSDDA 2 (172 m) 4.5

BIgOrMaAmSsS
20 T18
16
N 140
120
F8
SI-f
40 m W
81
6-
4-.
2-
0-
Figure 20. Number (abundance) of fish caught in Saratoga Passage duringsummer, shown by station. The values are based on a singlesample, except for the PSDDA site, which is the average ofthree samples.
4000
3000
2000
1000
0 - -
Figure 21. Biomass (in grams) of fish caught in Saratoga Passage duringsuraner, shown by station. The values are based on a singlesample, except for the PSDDA site, which is the average ofthree samples.
PSDDA(108 m)

82
the deeper (PSDDA) stations and intermediate depths (Figures 22 and 23).
Species richness. Values for species richness fluctuated by depth; the
highest values occurred at the PSDDA site reference station (Figure 24). All
other species richness values were lower and showed no discernible pattern.
Species diversity. Values for species diversity, H’, varied by depth,
the deeper stations, including PSDDA, had the highest values (Figure 25). No
pattern was apparent among the shallower stations.
Fish health. Incidence of blood worms, skin tumors and fin erosion were
all 0% (Table 6). No evidence of liver tumors was found based on gross
examination of flatfish livers.
Environmental measurements. No environmental measurements were collected
in Saratoga Passage because of weather conditions that forced an early
curtailment of sampling.
Port Gardner
Abundance and biomass. Abundance and biomass fluctuated by time of year,
depth, and station. The NAVY site generally had the largest number and
biornass of fish throughout the year. During the winter the 40 m depth had
numbers of fish comparable to the NAVY site; however, the biomass values were
lower. (Figures 26 and 27). PSDDA 1 and PSDDA 2 sites had low values for
abundance and biomass for all seasons except winter when abundance was at its
highest (compared with other seasons) and biomass values were second only to
the NAVY site (Figures 26 and 27). Five of the locations that were sampled
throughout the year were situated at depths of 100 m or more; these included:
PSDDA 1, PSDDA 2, lOOm M, llOm S and 145m S. The hOrn S and 145m S stations
had the lowest abundance and biomass values of the 5 deep locations.
Species diversity. Species diversity, H’, values showed seasonal and
depth differences between many stations, but showed no discernable pattern

83
Number (abundance) of English sole, Dover sole, slender sole,Pacific hake and ratfish caught in Saratoga Passage duringsummer, shown by station. The values are based on a singlesample, except for the PSDDA site, which is the average ofthree samples.
Biomass (in grams) of English sole, Dover sole, slender sole,Pacific hake and ratfish caught in Saratoga Passage duringsummer, shown by station. The values are based on a singlesample, except for the PSDDA site, which is the average ofthree samples.
ii IPSDDA
REF(100 m)
I80 m E20 m E 40 m E 40 m W
7,
• English sole Summer6
0 Dover sole Summer
N 5 0 Slender sole Summero ~ Pacific hake Summer
o 4 0 Raffish Summer
F 3
PSODA(108 m)
Figure 22.
900
800
700
8 600IgOr 500MaA m 400SaS 300
200
100
0
Figure 23.
S English sole Summer
0 Dover sole Summer
~ Slender sole Summer
~ Pacific hake Summer
0 Raffish Summer
PSDDA PSDDA(108 m) Ref
(100 m)
80 m E

SPEC
ES
R
CHNESS
SPEC
ES
D
VERS
TY
Species diversity (H’) of fish caughtduring summer, shown by station.
in Saratoga Passage
84
6
5
4
3
2
PSDDA(108 m) REF
(100 m)
Figure 24. Species richness (total number of species) of fish caught in
Saratoga Passage during summer, shown by station.
1.8
1.6
1.4
1.2
1.0
0.8
0.6
0.4
0.2
0.0
PSDDA(108 m)
Figure 25.
40 m E 40 m W
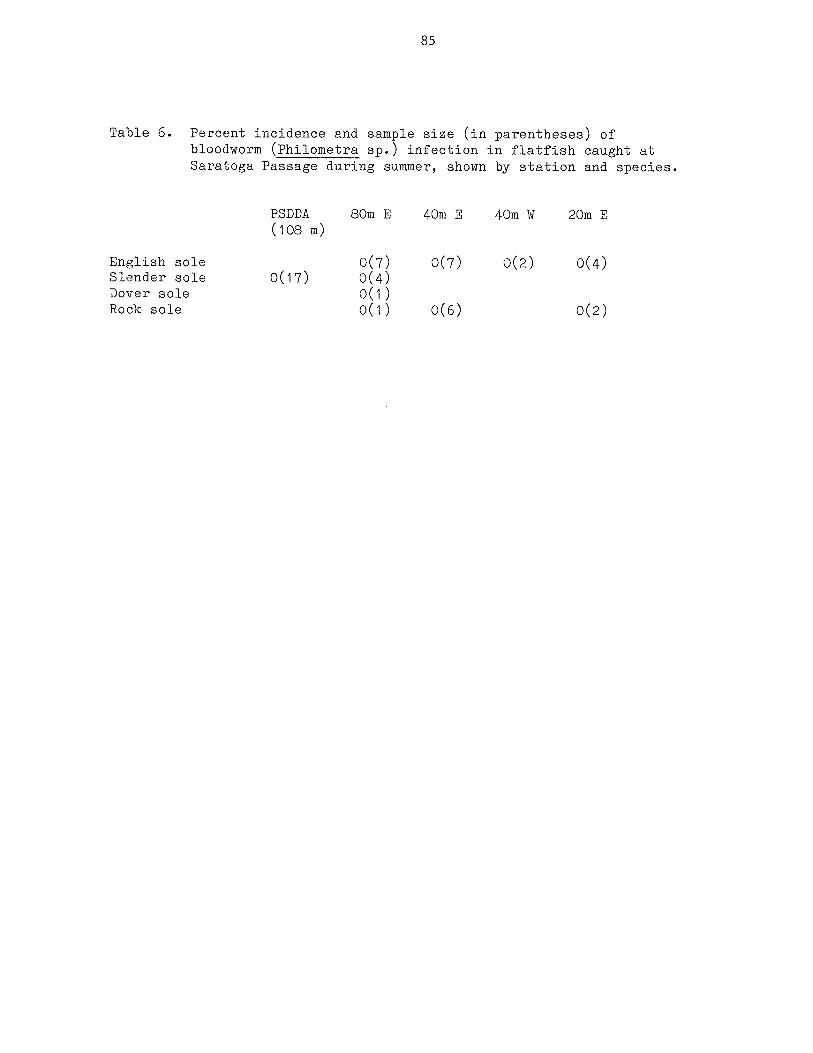
85
Table 6. Percent incidence and sample size (in parentheses) ofbloodworm (Philometra sp.) infection in flatfish caught atSaratoga Passage during summer, shown by station and species.
PSDDA 8Oiu E 40m B 40m W 20m B(108 m)
English sole 0(7) 0(7) 0(2) 0(4)Slender sole 0(17) 0(4)Dover sole 0(1)Rock sole 0(i) 0(6) 0(2)
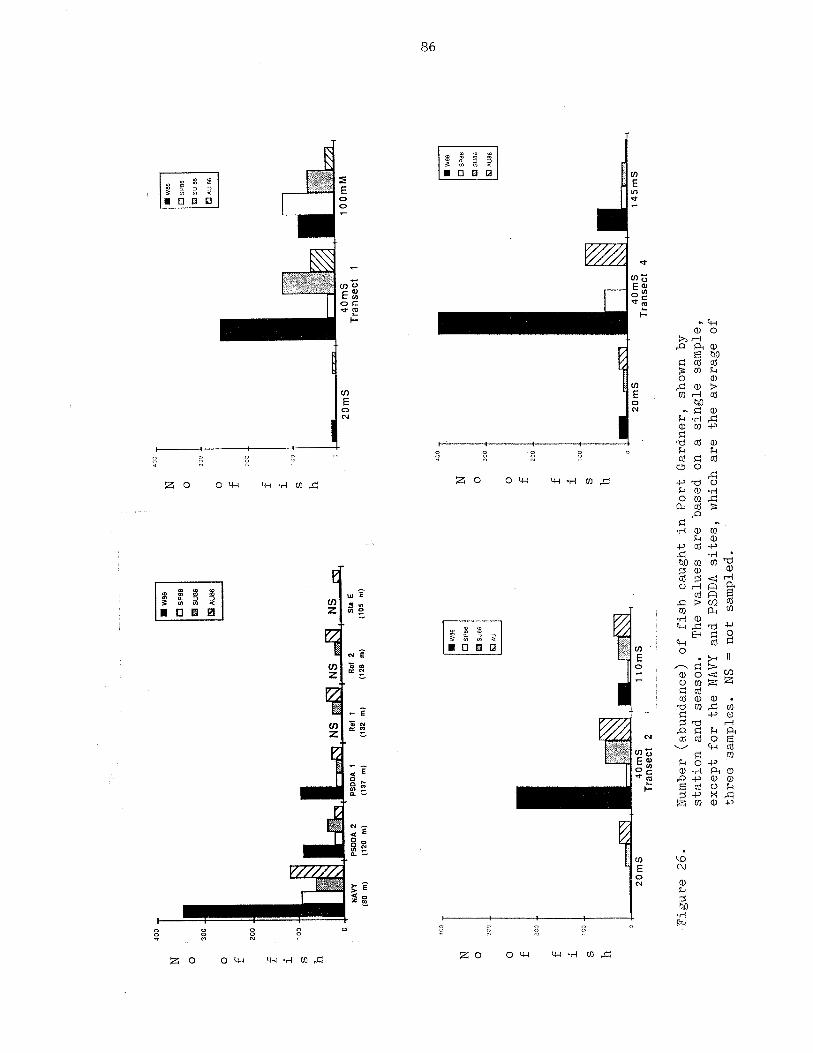
Fig
ure
26
.N
umbe
r(a
bu
nd
an
ce)
of
fish
cau
gh
tin
Po
rtG
ard
ne
r,sh
own
by
sta
tio
nan
dse
aso
n.
The
va
lue
sa
reb
ase
don
asin
gle
sam
ple
,e
xce
pt
for
the
NAV
Yan
dPS
DD
Asite
s,
wh
ich
are
the
ave
rag
eo
fth
ree
sam
ple
s.NS
=n
ot
sam
ple
d.
400
1Rw8
6N
jDSP
86
030
0
~S
~u
se
0 f2
00
~1~I_~k9,I
~j~
NS
~N
S
f i ~10
0
h
~N
S0
NAV
YPS
DD
A2
PSD
DA
1R
ef1
Ref
2St
eE
(80
m(
(120
m(
(137
m)
(132
m)
(128
m)
(105
m(
200
ave
00
88
6
~SU
86
N 0 0 f f 1 S h N 0 0 f f 1 S h
4Om
S10
0mM
Tran
sect
1
N 0 0 f f 1 S h
30
0
200 00
• 088
86
~SU
86
&3A
U
L,J
302
200 00
20m
S
008
86
~20
86
AU86
4Om
STr
anse
ct2
11
0m
S4
Om
S1
45
mS
Tran
sect
4
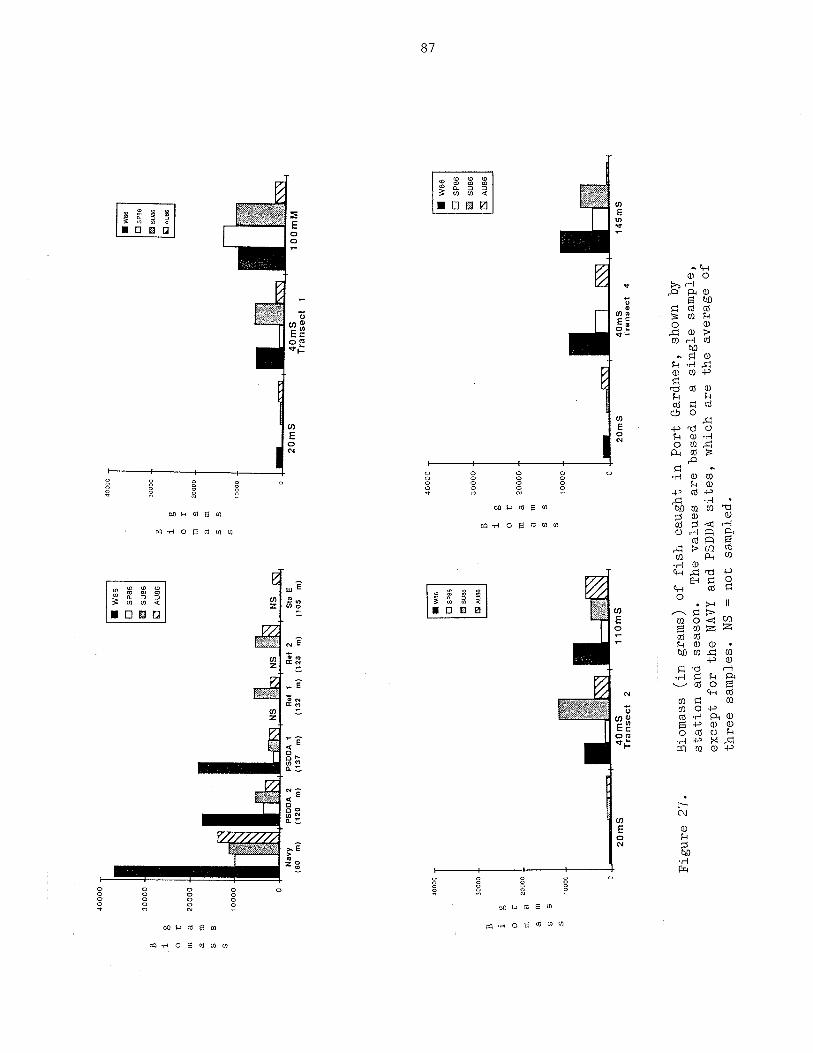
40
00
0
B ig 0r
ma
aa
SS
S
B ig
0r
ma
am
SS
S
30
00
0B 1 0 m a S S
g r a m S
20
00
0
•W
86
OS
P88
~S
U86
~A
UB
O
10
00
0
(80
•w
as spas
~SU
S6
Ro
t(1
32
2S
taE
m)
(10
5m
)2
Om
S4
Om
ST
ran
se
ct
1
4000
0
4000
0
3000
0
0000
0
0000
40
00
0
30
00
0
20
00
0
1000
0
3000
0
B ig
0T
aa
aa
SS
1000
0
UW
OS
~SP
86
~SU
86
~A
U~
2O
mS
•W
86
0S
P8S
~SU
BS
£SA
U86
4Om
ST
ran
se
ct
21
lOm
S
Fig
ure
27
.
2Om
S4O
mS
14
5m
ST
ran
se
ct
4
Bio
ma
ss(in
gra
ms)
of
fish
cau
gh
tin
Po
rtG
ard
ne
r,sh
own
bysta
tio
nan
dse
aso
n.
The
va
lue
sa
reb
ase
don
asin
gle
sam
ple
,e
xce
pt
for
the
NAV
Yan
dPS
DD
Asite
s,
wh
ich
are
the
ave
rag
eo
fth
ree
sam
ple
s.NS
=n
ot
sam
p1ed
~

88
(Figure 28).
Fish health. English sole, Dover sole, flathead sole, rex sole and rock
sole all showed indications of blood worm infections (Table 7). Incidence
varied between species, seasons, depth and station but did not show a
discernable pattern. One skin tumor was noted on a slender sole caught at
Station 100 mN. Incidence of fin errosion was 0%. Gross examination of
flatfish livers did not reveal any evidence of liver tumors.
Environmental measurements. Water temperatures during winter and autumn
were higher at the bottom than the surface (Table 8). Spring and summer water
temperatures were the reverse with the surface warmer than the bottom. In
general, salinities were lower at the surface than the bottom. Secchi disc
measurements showed that the best water clarity (higher Secchi disc
measurement) occurred in the winter while there were no differences between
the other seasons.
DISCUSSION AND CONCLUSIONS
The Research Otter Trawl For Documenting Fish Assemblage
The 7.6 m otter trawl has been the dominant sampling gear in Puget Sound
demersal fish research for about the last decade. This net is widely used by
many groups for similar research in other areas of the country.
Standardization of gear reduces the problems associated with comparing results
between studies. In addition, the small size of the net allows for ease of
use from a range of vessel sizes starting at about 6 m.
The 7.6 m otter trawl has limitations. The net is not fished
commercially and due to size, shape and other differences, catches are not
directly comparable to commercial otter trawl catches. Other limitations

S
peC
e8
V
e
S
V
S
peC
eS
DH
V
e
S
Y
n0
PSODA 2 PSODA 1 NAVY Ref 1 Ref 2 Sta E(120 m) (137 m) (80 m) (132 m) (128 m) (105 m)
2.5
2.0
1.5
1.0
0.5
0.0
2.5
2.0
1.5
1.0
0.5
0.0
Figure 28. Species diversity of fish (H1) caught in Port Gardner,shown by station and season. NS = not sampled.
205
Transect 1 Transect 2 Transect 4
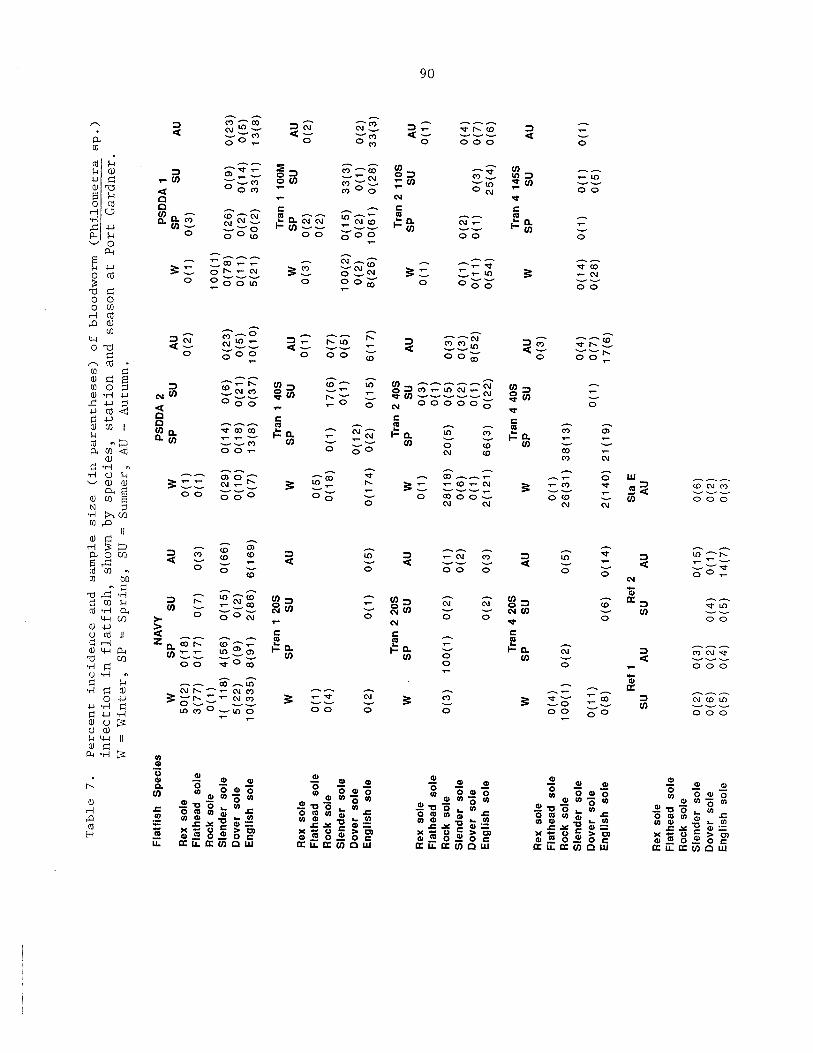
Ta
ble
7.
Pe
rce
nt
incid
en
ce
an
dsa
mp
lesiz
e(in
pa
ren
the
se
s)
of
blo
od
wo
rm(P
hilo
me
tra
sp
.)
infe
ctio
nin
fla
tfis
h,
show
nb
ysp
ecie
s,
sta
tio
nan
dse
aso
na
tP
ort
Ga
rdn
er.
W=
Win
ter,
SP=
Sp
rin
g,
SUS
umm
er,
AU—
Au
tum
n,
Fia
tfish
Spe
cies
NAV
YP
SD
DA
2P
SD
DA
1W
SP
SLJ
AUW
SPSU
AUW
SP
SUAU
Rex
sole
50
(2)
0(1
8)
0(1
)0
(2)
0(1
)0
(3)
Flat
head
sole
3(7
7)
0(1
7)
0(7
)0
(3)
0(1
)R
ock
sole
0(1
)1
00
(1)
Sle
nder
sole
1(11
8)4
(56
)0
(15
)0
(66
)0
(29
)0
(14
)0
(6)
0(2
3)
0(7
8)
0(2
6)
0(9
)0
(23
)D
over
sole
5(2
2)
0(9
)0
(2)
0(1
0)
0(1
8)
0(2
1)
0(5
)0
(11
)0
(2)
0(1
4)
0(5
)E
nglis
hso
le1
0(3
35
)8
(91
)2
(86
)6
(16
9)
0(7
)1
3(8
)0
(37
)1
0(1
0)
5(2
1)
50
(2)
33
(1)
13
(8)
Tran
120
STr
an1
40S
Tran
1lO
OM
WS
PSU
AUW
SPSU
AUW
SPSU
AUR
exso
le0
(1)
0(3
)0
(2)
0(2
)F
lath
ead
sole
0(1
)0
(5)
0(2
)R
ock
sole
0(4
)0
(18
)0
(1)
17
(6)
0(7
)S
lend
erso
le0
(1)
0(5
)1
00
(2)
0(1
5)
33
(3)
Dov
erso
le0
(12
)0
(2)
0(2
)0
(1)
0(2
)E
nglis
hso
le0
(2)
0(1
)0
(5)
0(1
74
)0
(2)
0(1
5)
6(1
7)
8(2
6)
10
(61
)0
(28
)3
3(3
)
Tran
220
STr
an2
40S
Tran
211
OS
WS
PSU
AUW
SPS
liAU
WSP
SUAU
Rex
sole
0(1
)0
(3)
0(1
)0
(1)
Fla
thea
dso
le0
(1)
Roc
kso
le0
(3)
10
0(1
)0
(2)
0(1
)2
8(1
8)
20
(5)
0(5
)0
(3)
Sle
nder
sole
0(2
)0
(6)
0(2
)0
(3)
0(1
)0
(2)
0(4
)D
over
sole
0(1
)0
(1)
8(5
2)
0(1
1)
0(1
)0
(3)
0(7
)E
nglis
hso
le0
(2)
0(3
)2
(12
1)
66
(3)
0(2
2)
0(5
4)
25
(4)
0(6
)
Tran
420
STr
an4
405
Tran
414
5SW
SP
SUAU
WSP
SUAU
WS
PSU
AUR
exso
le0
(3)
Fla
thea
dso
le0
(4)
0(1
)R
ock
sole
10
0(1
)0
(2)
0(5
)2
6(3
1)
38
(13
)S
lend
erso
le0
(4)
0(1
4)
0(1
)0
(1)
0(1
)D
over
sole
0(1
1)
0(1
)0
(7)
0(2
8)
0(5
)E
nglis
hso
le0
(8)
0(6
)0
(14
)2
(14
0)
21
(19
)1
7(6
)
Re
fiR
ef2
Sta
ESU
AUSU
AUAU
Rex
sole
Flat
head
sole
Roc
kso
leS
lend
erso
le0
(2)
0(3
)0
(15
)0
(6)
Dov
erso
le0
(6)
0(2
)0
(4)
0(1
)0
(2)
Eng
lish
sole
0(5
)0
(4)
0(5
)1
4(7
)0
(3)

91
Table 8. Measurements of temperature, salinity and water clarity bystation and season at Port Gardner. W = Winter, SP = Spring,SU = Summer, AU = Autumn3 NS = not sampled.
Site Surface BottomTemperature ~C
W SP SU AU W SP SU AUNAVY 7.0 10.5 11.9 14.0 7.5 9.5 11.0 12.0PSDDA 2 6.5 10.0 15.2 15.0 8.0 9.0 11.0 13.0PSDDA 1 6.0 10.2 15.0 14.4 7.5 9.3 9.9 12.0Tran 1 2OmS NS 10.8 18.1 15.0 NS 9.5 11.5 13.0Tran 2 4OmS 6.5 10.5 10.5 14.0 7.5 NS 11.5 12.0Tran 4 l45mS 6.0 10.5 12.0 NS 8.0 9.0 12.5 NS
Salinity 0/00NAVY 29.85 16.79 22.34 28.73 NS 29.73 NS 30.58PSDDA 2 21.23 18.53 23.58 NS NS 29.67 29.81 30.81PSDDA 1 NS 22.98 24.99 28.23 NS 29.85 24.99 30.56Tran 1 2OmS NS NS 19.58 28.32 NS 29.16 29.58 30.07Tran 2 4OmS NS NS 29.81 NS NS 29.53 29.77 30.33Tran 4 145mS 22.01 NS 23.58 NS NS 30.10 29.70 NS
Secchi Disc mNAVY 3.50 3.00 3.00 5.00PSDDA 2 5.50 4.25 4.50 4.00PSDDA 1 8.50 7.25 4.50 NSTran 1 2OmS NS 3.50 3.00 5.50Tran 2 40m5 3.50 3.00 3.00 5.00Tran 4 145mS 4.50 NS 3.50 NS
92
include: 1) current and wind conditions at the time of sampling, 2) gear
selectivity relative to each fish species and life history stage, and 5)
variability in area swept.
Commencement Bay
Several trawling studies have previously been conducted in Commencement
Bay. These studies concentrated their efforts in the nearshore areas (Becker
1984; Weitcamp and Schadt 1981; Tetra Tech 1985) and in the inner part of
Commencement Bay (e.g., the old flood channels of the Puyallup River (Malins
et al. 1982; Tetra Tech 1985; Weitkamp and Schadt 1981). Becker (1984) and
Tetra Tech (1985) used the same otter trawl as the present study; however,
sampling depths only reached 52 meters in contrast to the 175 meter depths of
the proposed PSDDA sites. Weitkamp and Schadt (1981) used a different smaller
otter trawl and again only sampled the nearshore shallow portions of
Commencement Bay.
Data from Commencement Bay indicate that three of the four indices of
site utilization by fish varied inversely with depth. As depth increased,
species richness, total abundance and total biomass decreased. No correlation
between depth and species diversity was evident. However, Tetra Tech (1985)
found the species diversity in the inner harbor waterways to be much higher
(3.5) compared to study. Results of this study suggest higher catches
occurring in deeper water during autumn, while Weitkamp and Schadt (1981)
found abundance in shallower areas was highest in summer and lower during
other seasons of the year. Becker (1984) found that Dover sole were located
at deeper stations while English sole were typically found in shallower
waters, similar to the findings of the present PSDDA study.
Fish health was generally good for the flatfish caught in Commencement
Bay during this study. The only disease found was blood worm infection in
93
English sole. Incidence for this disease reached 100% at some stations, but
the sample sizes were small (less than five individuals per sample) for
locations with high incidence rates. Low incidences (< 1%) of fin erosion and
skin tumors have been previously found in flatfish inhabiting the inner
(shallow) portions of Commencement Bay in areas known to be contaminated with
industrial wastes (Malins et al. 1982, Tetra Tech 1985). Histopathological
analyses of livers from flatfish found inhabiting these areas also revealed a
low incidence of liver tumors (Malins et al. 1982, Tetra Tech 1985).
Environmental measurements were only available for the autumn period.
Dissolved oxygen, temperature, salinity and Secchi disc measurements were all
within the ranges found in other parts of Puget Sound (Stober and Chew 1984).
The preliminary PSDDA sites in Commencement Bay had the greatest depth
and the lowest abundance, biomass and species richness measures of the
stations sampled during this study. The number of adult and juvenile flatfish
captured in the preliminary PSDDA sites was low in absolute terms and small
when compared to stations outside of the PSDDA sites.
Elliott Bay
Several studies have been conducted within and adjacent to Elliott Bay
(Bingham 1978; Miller et al. 1974; Miller et al. 1977; Miller 1980; Maims et
al. 1982; Stober and Chew 1984). Donnelly et al. (1984) and Bingham (1978)
were the only studies that sampled the same areas as the present PSDDA study.
The results of fish sampling in Elliott Bay revealed that the PSDDA sites
generally had higher values of species richness than their corresponding
reference stations. The PSDDA 2 (Fourmile Rock) site and the adjacent
reference stations exhibited a pattern much like PSDDA 1 (inner Elliott Bay):
summer season abundance, biomass and species richness figures were comparable,

94
whereas the autumn values of biomass and species richness for the PSDDA 2 site
exceeded the reference stations. Species diversity did not show any clear
pattern.
PSDDA 2 samples were taken in close proximity to samples collected for
the Renton Sewage Treatment Plant Project (Donnelly et al. 1984). Donnelly et
al. found biomass values higher at the deeper sites in contrast to this study
where the PSDDA 2 site had higher biomass values than the deeper reference
stations. Donnelly et al. (1984) also indicated that. species richness and
species diversity increased with depth to 50 m and then decreased. This would
suggest that the PSDDA 2 site would have higher species richness and species
diversity values than the PSDDA 2 reference stations. Indeed, PSDDA 2 values
were either comparable to, or exceeded, the reference station values for
species richness and species diversity. Neither study was conducted during
all four seasons, thus, results from this study should not be considered
indicative of conditions at the sample sites throughout the year.
The PSDDA 1 site was compared with a report on the effects of dredged
materials disposal on benthic invertebrates in inner Elliott Bay (Bingham
1978). The 1978 report found no substantial difference in infaunal
(invertebrate) species richness or biomass, but did find that the shallower
stations had the greatest species richness and biomass. The same observation
was made at the PSDDA 1 sites (for fish) where the deeper reference station
had lower species richness and biomass. Neither Bingham (1978) nor this study
found any clear trend in species diversity versus depth.
Fish health was generally good. Blood worm infection in English sole was
the only disease noted. The incidence was somewhat lower than the findings of
Donnelly et al. (1984). Donnelly et al. also noted the presence of other
diseases: skin tumors and fin erosion. Fin erosion, skin tumors and liver

95
tumors have been found in Elliott Bay, but typically near the inner shore and
the Duwamish River (Malins et al. 1982). The present study sites were located
in the deeper regions away from the shore of Elliott Bay and may explain why
the disease incidence was found to be lower than at previous inshore sampling
locations.
Environmental measurements were available for both seasons. The
dissolved oxygen values were all near saturation. Dissolved oxygen,
temperature, salinity and Secchi disc measurements were all within the values
found elsewhere in Puget Sound (Miller et al. 1977; Donnelly et al. 1984).
The preliminary PSDDA sites generally had the highest values for
abundance, biomass and species diversity of the locations sampled in Elliott
Bay. Dover sole and English sole, two commercially important flatfish, were
found in higher numbers and biomass at the PSDDA 2 site and adjacent reference
stations than at PSDDA 1. These results suggest that disposal of dredged
materials would have less impact on commercial flatfish at the PSDDA 1 site
than at PSDDA 2 site.
Saratoga Passage
The Saratoga Passage PSDDA site ecological measures were generally higher than
the adjacent, shallower stations. A tagging study done by Day (1976) suggests
that the deeper area of Saratoga Passage was a residence or spawning area for
English sole. Day captured English sole in the deep area of Saratoga Passage
where they were tagged and transported to other areas of Puget Sound. The
majority of tag recoveries were within the deep area of Saratoga Passage,
suggesting a homing ability to a preferred feeding location or possibly a
spawning area. No English sole were caught at the PSDDA site during the
sampling cruise; however, English sole were caught nearby at 80 m. Sampling
was too limited to make any concluding statement about the Saratoga Passage

96
PSDDA site.
No diseases were found in any flatfish.
Port Gardner
English (1979) and Washington Department of Ecology (1976) sampled bottom
fish at several depths along a transect line very close to Transect 2 of the
PSDDA study. During the PSDDA study the catches of English sole less than
150 mm were lower than those found by English (1979). Each study used
different capture gear; the earlier study used a 3 m beam trawl, while study
used the 7.6 m otter trawl. Other explanations for the abundance differences
may be biological or environmental in origin. Shephard et al. (1984)
indicated three major reasons for variation in stock size from one year to the
next: 1) annual changes in environmental conditions, 2) ecological
interactions during early life history, and 3) variations in adult spawning
abundance.
The results of the fish sampling in Port Gardner showed that the PSDDA
sites had low abundance and biomass values when compared to other stations for
spring, summer and autumn. In contrast, winter sampling at the PSDDA sites
produced abundance values higher than most stations except for the NAVY and
the 40 m depth. Furthermore, biomass values at the two PSDDA sites during the
winter were second only to the NAVY site. These data suggest that the larger,
older fish move into the preliminary PSDDA sites during the winter months and
disperse during the rest of year.
Species diversity did not show any trends that could be related to
differences between stations or sites.
Fish health was generally good. Malins et al (1982), using microscopic
examination of flatfish livers, found only low levels of nonspecific
degenerative/necrotic lesions and intracellular storage disorders in Port

97
Susan (adjacent to Port Gardner). Gross examination of livers for this study
showed no evidence of tumors.
Washington Department of Fisheries (WDF) allows an annual commercial
flatfish harvest during the spring and early summer in Port Gardner. The
fishing area includes not only Port Gardner, but the adjacent main basin and
the area adjoining Port Gardner to Saratoga Passage. Catches from the
combined area contribute about 9% to the total annual Puget Sound flatfish
harvest. Catches within Port Gardner itself contribute only a small portion
of the 9% (WDF personal communication).
The preliminary PSDDA sites may be subjected to low levels of commercial
trawling since they are located in the deeper portions of Port Gardner and,
for most of the year, had low values for abundance and biomass relative to
other stations. In contrast, winter abundance and biomass values at the
preliminary PSDDA sites were much higher and second only to the NAVY site.
The levels of abundance and biomass were very similar between the two PSDDA
sites during every season, thus equal consideration (relative to fish
resources) should be given to both preliminary PSDDA sites for disposal of
dredged materials. However, data from Transect 4, Station 145 5, which is
deeper and located more near the mouth of Port Gardner, show much lower
abundance and biomass values than the PSDDA sites. The fish data from Port
Gardner has not been fully compiled and analyzed, but when completed, will be
issued as part of the Port Gardner report to the U. S. Army Corps of Engineers.
98
LITERATURE CITED
Amish, R. 1976. Infestation of some Puget Sound demersal fishes by blood
worm, Philometra americana. M.S. Thesis, Univ. Washington, Seattle. 41
pp.
Angell, C. L., B. S. Miller, and S. R. Wellings. 1975. Epizootiology of
tumors in a population of juvenile English sole (Parophyrs vetulus) from
Puget Sound, Washington. J. Fish. Res. Board Canada 52:1723—1732.
Becker, D. 5. 1984. Resource partitioning by small—mouthed pleuronectids in
Puget Sound, Washington. Ph.D. Dissertation, Univ. Washington, Seattle.
139 pp.
Bingham, C. R. 1978. Aquatic disposal field investigations, Duwamish
Waterway disposal site, Puget Sound, Washington; Appendix 0: Benthic
community structural changes resulting from dredged material disposal,
Elliott Bay disposal site. U.S. Army Eng. Waterways Exp. Stn. Vicksburg,
MI, Tech. Rep. D—77—24.
Butler, T. H. 1980. Shrimps of the Pacific Coast of Canada. Can. Bull.
Fish. Aquatic Sci. 202:280 pp.
Chew, K. K. Unpublished. Shrimp trawl data collected from Hood Canal and
Puget Sound from 1967 to 1979. School of Fisheries, University of
Washington, Seattle.
Clarke, D. 0. 1986. Benthic resources assessment technique evaluation of
disposal sites in Puget Sound and adjacent waters. Environmental Lab,
U.S. Army Corps Engineers, Vicksburg, Mississippi. Unpublished
manuscript.

99
Day, D. 1976. Homing behavior and population stratification in Central Puget
Sound English sole (Parophrys vetulus). J. Fish. Res. Board Can. 33:278-
282.
Desbruyers, D., J. Y. Bervas, and A. Khripovnoff. 1980. Un cas de
colonisation rapide d’un sediment profond. Oceonol. Acta 3:285—291.
Dinnel, P. A., D. A. Armstrong, and C. Dungan. 1985a. Initiation of a
Dungeness crab, Cancer magister, habitat study in North Puget Sound. Pp.
327-337 In: Proceedings of the Symposium on Dungeness Crab Biology and
Management. Univ. Alaska, Alaska Sea Grant Rpt. No. 85-3.
Dinnel, P. A., D. A. Armstrong, and R.O. McMillan. 1985b. Survey of
Dungeness crab, Cancer magister, in Oak Harbor, Washington. Final Rpt.
to the Seattle District, U.S. Army Corps of Engineers by School of
Fisheries, Univ. Washington, Seattle. 23 pp.
Dinnel, P. A., D. A. Armstrong, and R.O. McMillan. 1986. Dungeness crab,
Cancer magister, distribution, recruitment, growth and habitat use in
Lummi Bay, Washington, Final Report to Lummi Indian Tribe by Fish. Res.
Institute, University of Washington, Seattle. FRI—Ui—8612. 61 pp.
Dinnel, P. A., D. A. Armstrong, B. S. Miller, and R. F. Donnelly. 1987. U. S.
Navy homeport disposal site investigations. Final Report to Seattle
District, U.S. Army Corps of Engineers by Fish. Res. Institute,
University of Washington, Seattle. (In preparation).
Donnelly, R., B. Miller, R. Lauth, and J. Shriner. 1984. Fish ecology. Vol.
VI, Section 7 In: Renton Sewage Treatment Plant Project: Seahurst
Baseline Study (Q. 3. Stober and K. K. Chew, Eds.). Final report by
University of Washington, Fish. Res. Institute to METRO. FRI—UW—8413.
276 pp.

100
Eaton, C. Skipper of Research Vessel Kittiwake, Seattle, Washington (personal
communication).
English, T. S. 1979. Biological systems acoustical assessments in Port
Gardner and adjacent waters. 1 Sept. 1976 to 30 June 1979. Annual Rpt.
to WDOE, Rep. A79-13. Univ. Washington, Dept. Oceanography. 86 pp.
Grassle, 3. F. 1977. Slow recolonization of deep-sea sediment. Nature,
London. 265:618—619.
Gunderson, D. R., and I. E. Ellis. 1986. Development of a plumb staff beam
trawl for sampling demersal fauna. Fisheries Research 4:35-41.
Lunz, J. D. and D. R.Kendall. 1982. Benthic resources assessment technique,
a method for quantifying the effects of benthic community changes of fish
resources. P. 1021—1027 In Conference Proceedings, Oceans 82.
Malins, D. C., B. B. McCain, D. W. Brown, A. K. Sparks, H. 0. Hodgins, and S.
L. Chan. 1982. Chemical contaminates and abnormalities in fish and
invertebrates from Puget Sound. NOAA Tech. Memo. OMPA—19, 168 pp.
McArn, 0. B., R. 0. Chuinard, B. S. Miller, R. E. Brooks, and S. R. Wellings.
1968. Pathology of skin tumors found on English sole and starry flounder
of Puget Sound, Washington. 3. Nat. Cancer Inst. 41:229—242.
Mearns, A. J., and M. 3. Allen. 1978. Use of small otter trawls in coastal
biological surveys. Contribution No. 66, South. Calif. Water Res.
Project. EPA-600/3-78-083.
Miller, B. S. 1980. Survey of resident marine fishes at Terminals 91 and 73
(Elliott Bay, Seattle, Washington). Univ. of Wash. Coil. of Fish. Tech.
Rept. FRI-UW-8014, 29 pp.
Miller, B. S.., B. B. McCain, R. C. Wingert, S. F. Borton, K. V. Pierce, and D.
T. Griggs. 1977. Ecological and disease studies of demersal fishes in
Puget Sound near METRO-operated sewage treatment plants and in the

101
Duwamish River. Puget Sound Interim Studies Rpt., Univ. of Wash. Coil.
of Fish. FRI-UW-7721, 164 pp.
Miller, B. S., and S. R. Wellings. 1971. Epizootiology of tumors on flathead
sole (Hippoglossoides elassodon) in East Sound, Orcas Island, Washington.
Trans. Am. Fish. Soc. 100:247—266.
Miller, B. S., R. C. Wingert, and S. F. Borton. 1974. Ecological survey of
demersal fishes in the Duwamish River and at West Point. Univ. of Wash.
Coil. of Fish. Tech. Rpt. FRI—UW—7509, 35 pp.
Morton, J. W. 1977. Ecological effects of dredging and dredge spoil
disposal: a literature review. U.S. Fish and Wildlife Serv., Washington,
D.C. Tech. Paper #94.
Orensanz, J. N. and V. F. Gallucci. 1982. Post catastrophic benthic
recovery: process and management implications. Monografias Biologicas
(2): 181—198.
Paquette, R. 0. 1958. A modification of the Wenrie—Smith—Soule salinity
bridge for the determination of salinity in seawater. Tech. Rpt. 61,
Dept. Ocean., Univ. Wash., Seattle.
Pielou, E. C. 1978. Population ecology and community ecology: principles and
methods. Gordon and Breach Sci. Pub., New York, 424 pp.
Saila, S. C., S. D. Pratt, and T. T. Polgar. 1972. Dredge spoil disposal in
Rhode Island Sound. Univ. Rhode Island. Mar. Tech. Rep. 2, 48 pp.
Shepherd, J. C., J. 0. Pope, and R. D. Cousens. 1984. Variations in fish
stocks and hypotheses concerning their links with climate. Rapp. P.—v.
Reun. Cons. mt. Explor. Mer. 185: 255—267.
Smith, R. T. 1937. Observations on the shrimp fishery in Puget Sound.
Washington Department of Fisheries Biol. Rpt. No. 36D, 11+ pp.
Standard Methods. 1980. Standard methods for the examination of water and
102
wastewater, 15th edition. APHA, AWWA, WPCF, Wash. D.C., 1,034 pp.
Stober, Q. J., and K. K. Chew. 1984. Renton Sewage Treatment Plant Project:
Duwamish Head. Final Report by Fisheries Research Institute to the
Municipality of Metropolitan Seattle, WA. Tech. Rpt. FRI—UW-8417, 370
pp.
Tetra Tech, Inc. 1985. Commencement Bay nearshore/tideflats remedial
investigation. Vol. 1. Washington State Department of Ecology and U.S.
Environmental Protection Agency.
Thistle, D. 1981. Natural physical disturbances and communities of marine
soft bottoms. Marine Ecology, Progress Series 6: 223—228.
Washington Department of Ecology. 1976. Ecological baseline and monitoring
study for Port Gardner and adjacent waters. A summary report for the
years 1972 through 1975. WDOE Olympia, WA., 545 pp.
WDF (Washington Department of Fisheries). 1974. 1974 Fisheries Statistical
Report. Olympia, WA., p. 63.
WDF (Washington Department of Fisheries). 1982. 1982 Fisheries Statistical
Report. Olympia, WA., p. 60.
WDF (Washington Department of Fisheries). 1987. Letter from Joseph Blum
(WDF) to Frank Urabeck (Army Corps of Engineers) dated 9 January 1987.
Weitkamp, D. E., D. McEntee, and R. Whitman. 1986. Dungeness crab survey of
Everett Harbor and vicinity, 1984-1985. Final Rpt. to U.S. Navy by
Parametrix, Inc., Bellevue, Washington, 29+ pp.
Weitkamp, D. E., and T. H. Schadt. 1981. Commencement Bay studies technical
studies: Volume III, fish and wetlands. Report to the U.S. Army Corps of
Engineers, Seattle District. Appendices, 75 pp.
Wellings, S. R., C. E. Alpers, B. B. McCain, and B. S. Miller. 1976. Fin
erosion disease of starry flounder (Platichthys stellatus) and English

.99~-LL~:ccP~~Tfl3pieo~sea4~Ta~uo~uzqse~
‘9flW0S‘JGATHT~l9TUiUAflC~inJOi2JetflSGGinUT(snlnq.GAsLxi~doiua)etos
EOT

Ifliva
xia~~aav
~UT

Ap
pe
nd
ixT
ab
le1
.S
ara
tog
aP
ass
ag
ebe
amtr
aw
lsta
tio
nlo
ca
tio
nd
ata
.T
hetr
aw
ld
ep
ths
are
ave
rag
es
fro
mth
ose
reco
rde
dfr
om
the
Fe
bru
ary
and
Jun
e,
1986
cru
ise
s.
All
tra
wls
we
re1
/8n
au
tica
lm
iles
(NM
)lo
ng
at
ap
pro
xim
ate
ly1
.5kn
ots
gro
un
dsp
ee
d.
F-’
C Li’
STA
RT
SET
OF
NET
TRAW
LD
EPTH
(m)
Ap
pro
xim
ate
De
pth
com
pass
Sta
tio
n(m
)R
ad
ar
Ran
ges
(NM
)an
dM
ark
ers
be
arin
gS
tart
tow
End
tow
PSD
DA
Site
:
Sta
tio
n1
113
2.4
Lo
we
llP
t./1
.25
Sa
rato
ga
Pt.
2000
108
106
Sta
tio
n2
106
1.4
E.
Pt.
/1.2
5S
.E
dge
Pt.
N.
of
Mab
ana
25
°11
011
8S
tatio
n3
109
1.1
E.
Pt.
/1.2
Pt.
of
Cam
ano
N.
of
Mab
ana
300
113
125
Tra
nse
ct
#1
:
low
ii1.
565
.E
dge
E.
Pt.
2900
1017
20W
201.
56S
.E
dge
E.
Pt.
2900
2418
40W
391
.55
E.
Pt.
2900
3746
80W
791.
55E
.P
t.28
5°80
6380
E80
2.25
S.
Edg
eL
ow
ell
Pt.
/l.6
3S
ara
tog
aP
t.28
0°80
7940
E39
2.2
05.
Edg
eL
ow
ell
Pt.
/1.7
1S
ara
tog
aP
t.28
0°45
4620
E21
2.25
S.
Edg
eL
ow
ell
Pt.
/l.8
1S
ara
tog
aP
t.26
0°20
391O
E11
2.13
Lo
we
llP
t.29
0°14
11
Tra
nse
ct#
2:
lOO
N10
21
.25.
Edg
eL
ow
ell
Pt.
/0.5
5P
t.N
.o
fM
aban
a26
0°10
210
011
5N11
71.
65L
ow
ell
Pt.
/1.1
5E
.P
t.24
0°12
112
112
0N12
11.
1S
.E
dge
Lo
we
llP
t./l.2
E.
Pt.
265°
122
116
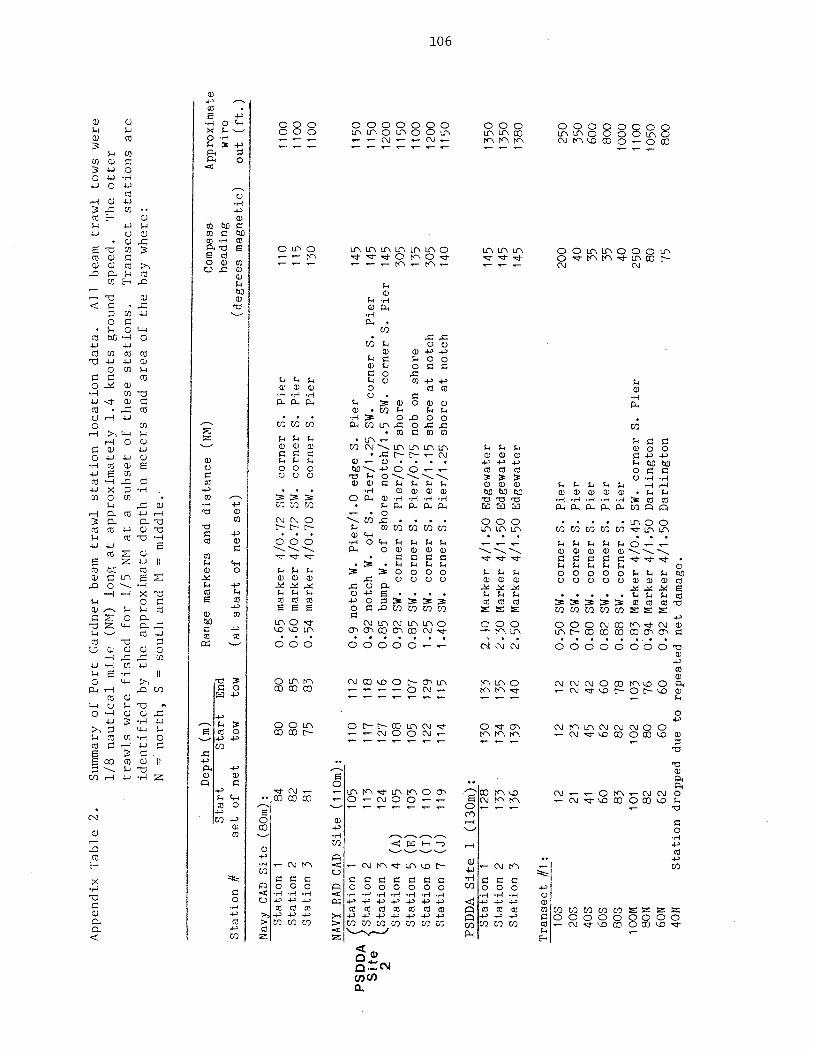
Ap
pe
nd
ixT
ab
le2
.S
um
ma
ryo
fP
ort
Ga
rdn
er
beam
tra
wl
sta
tio
nlo
ca
tio
nd
ata
,A
llbe
amtr
aw
lto
ws
we
re1
/8n
au
tica
lm
ile
(NM
)lo
ng
at
ap
pro
xim
ate
ly1
.4kn
ots
gro
un
dsp
ee
d.
Th
eo
tte
rtr
aw
lsw
ere
fish
ed
for
1/5
NM
at
asu
bse
to
fth
ese
sta
tio
ns.
Tra
nse
ct
sta
tio
ns
are
ide
ntifie
db
yth
ea
pp
roxim
ate
de
pth
inm
ete
rsa
nd
are
ao
fth
eb
ay
wh
ere
:N
=n
ort
h,
Sso
uth
an
dN
=m
idd
le.
Nav
yC
ADS
ite
(80
m):
Sta
tio
n1
Sta
tio
n2
Sta
tio
n3
Sta
rtE
ndto
wto
w
Com
pass
he
ad
ing
(de
gre
es
ma
gn
etic)
1100
1100
1100
Sta
rtS
tatio
n#
se
to
fn
et
De
pth
(m)
Ran
gem
ark
ers
and
dis
tan
ce
(NM
)
(at
sta
rto
fn
et
se
t)
8480
800
.65
8280
850
.60
8175
830
.54
PS
DD
AS
ite
2
Site
(liO
n):
ma
rke
rm
ark
er
ma
rke
r
4/0
.72
4/0
.72
4/0
.70
SW.
co
rne
rS
.P
ier
SW.
co
rne
rS
.P
ier
SW.
co
rne
rS
.P
ier
Ap
pro
xim
ate
wire
ou
t(ft
.)
105
110
112
0.9
no
tch
W.
Pie
r/i
.0ed
geS
.P
ier
113
117
118
0.9
2n
otc
hW
.o
fS
.P
ier/
1.2
5SW
.co
rne
rS
.P
ier
124
127
116
0.8
5bu
mp
W.
of
sho
ren
otc
h/i
.5SW
.co
rne
rS
.P
ier
(A)
105
108
110
0.9
2SW
.co
rne
rS
.P
ier/
0.7
5sh
ore
(5)
103
105
107
0.8
5SW
.co
rne
rS
.P
ier/
0.7
5no
bon
sho
re(I
)11
012
212
91
.25
SW.
co
rne
rS
.P
ier/
i.1
5sh
ore
at
no
tch
(J)
119
114
115
1.4
0SW
.co
rne
rS
.P
ier/
1.2
5sh
ore
at
no
tch
NAV
YR
ADC
AD(S
tatio
n1
~S
tatio
n2
(~S
tatio
n3
Sta
tio
n4
Sta
tio
n5
Sta
tio
n6
Sta
tio
n7
PS
DD
AS
ite
1S
tatio
n1
Sta
tio
n2
Sta
tio
n3
Tra
nse
ct
#1lo
s20
S40
S60
S80
S1O
OM 80N
60N
40N
130
133
2~
I013
413
52
.30
139
140
2.5
0
Ma
rke
r4
/1M
ark
er
4/i
Ma
rke
r4
/1
(13
0rn
):12
813
313
6 12 21 41 60 83 101 82 62
.50
Ed
ge
wa
ter
.50
Ed
ge
wa
ter
.50
Ed
ge
wa
ter
110
115
130
145
145
145
305
135
305
140
145
145
145
200 40 35 35 40
250
80 75
C
1212
0.5
0Sw
.co
rne
rS
.23
220
.70
SW.
co
rne
rS
.45
420
.80
SW.
co
rne
rS
.62
600
.82
SW.
co
rne
rS
.82
780
.88
SW.
co
rne
rS
.10
210
30
.83
Ma
rke
r4
/0.4
580
760
.94
Ma
rke
r4
/1.5
060
600
.92
Ma
rke
r4
/1.5
0S
tatio
nd
rop
pe
ddu
eto
rep
ea
ted
ne
tda
mag
e.
1150
1150
1200
1150
1100
1200
1150
1350
1350
1380 250
350
600
800
1000
1100
1050
80
0
Pie
rP
ier
Pie
rP
ier
Pie
rSW
.co
rne
rS
.P
ier
Da
rlin
gto
nD
arlin
gto
n
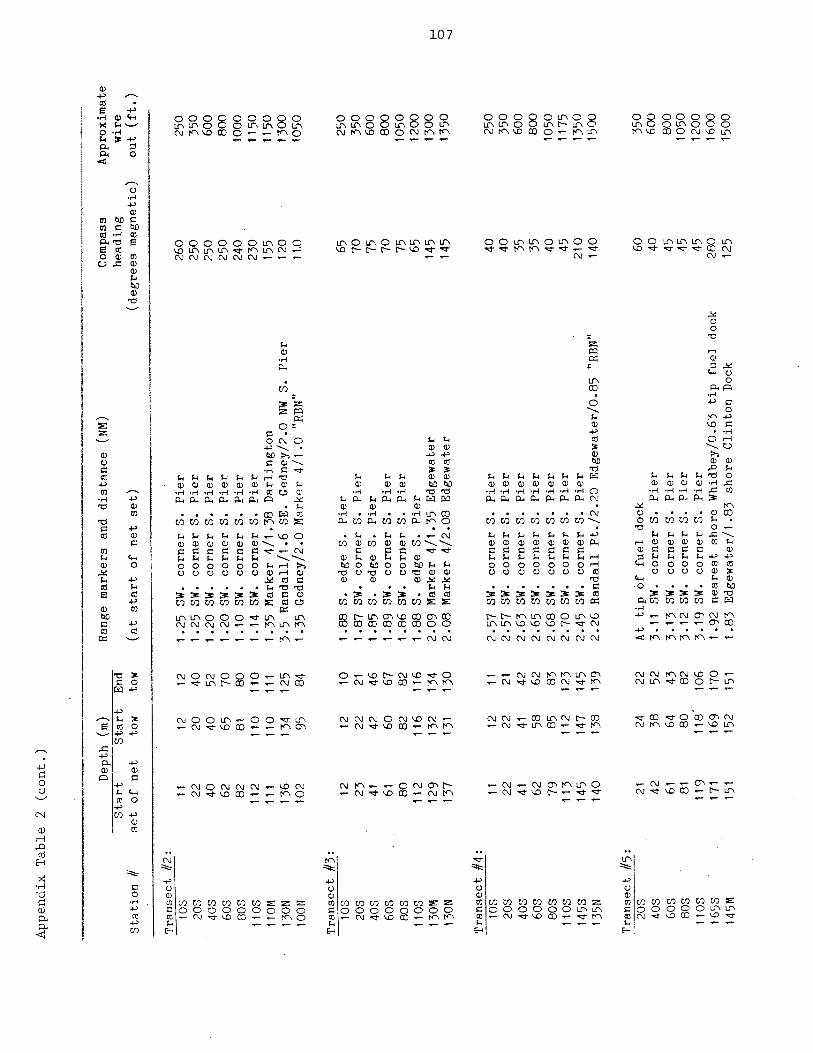
Ap
pe
nd
ixT
ab
le2
(co
nt.
)
De
pth
Cm
)S
tart
tow
Ap
pro
xim
ate
wire
ou
t(it.)
Tra
nse
ct
#3
:10
820
S40
S60
380
S11
OS
130M
130N
Tra
nse
ct
1/4:
105
205
403
603
80S
11O
S14
5S13
5N
Tra
nse
ct
#5
:20
340
560
380
311
0316
5314
5M
S.
edge
S.
Pie
rSW
.co
rne
rS
.P
ier
S.
edge
S.
Pie
rSW
.co
rne
rS
.P
ier
SW.
co
rne
rS
.P
ier
S.
ed
ge
S.
Pie
rM
ark
er
4/1
.35
Ed
ge
wa
ter
Ma
rke
r4
/2.0
8E
dg
ew
ate
r
At
tip
àf
fue
ld
ock
3.1
1SW
.co
rne
rS
.P
ier
3.1
33
.12
3.1
91
.92
1.8
3
65 70 75 70 75 65 145
145 40 40 35 35 40 45
210
140 60 40 45 45 45
280
125
250
350
600
800
1050
1200
1300
1350 250
350
600
800
1050
1175
1350
1500
350
600
80
010
5012
0016
0015
00
Sta
rtS
tatio
n#
se
to
fn
et
End tow
(at
sta
rto
fn
et
se
t)
Ran
gem
ark
ers
and
dis
tan
ce
(NM
)C
ompa
ssh
ea
din
g
Tra
nse
ct
#2
:10
520
S40
S60
$80
$lb
SIi
ON
130N
1OO
N
(de
gre
es
ma
gn
etic)
1.2
5SW
.co
rne
rS
.P
ier
1.2
5SW
.co
rne
rS
.P
ier
1.2
0SW
.co
rne
rS
.P
ier
1.2
0SW
.co
rne
rS.
Pie
r1.
10SW
.co
rne
rS
.P
ier
1.14
SW.
co
rne
rS.
Pie
r1
.35
Ma
rke
r4
/1.3
8D
arlin
gto
n3
.5R
an
da
ll/i
.6S
E.
Ge
dn
ey/
2.O
NWS
.P
ier
1.3
5G
ed
ne
y/2
.OM
ark
er
4/1
.0“R
BN
”
260
250
250
250
240
230
155
120
11.0
250
350
600
800
1000
1150
1150
1300
1050
11 22 40 62 82 112
111
136
102 12 23 41 61 80 112
129
137 11 22 41 62 79 113
145
140 21 42 61 81 119
171
151
12 20 40 65 81 110
110
134 95 12 22 42 60 82 116
132
131 12 22 41 58 85 112
147
138 24 38 64 80 118
169
152
12 40 52 70 80 110
111
125 84 10 21 46 67 82 116
134
130 11 21 42 62 83 123
145
139 22 52 43 82 106
170
151
1.8
81
.87
1.8
51
.89
1.8
61
.88
2.0
92
.08
2.5
72
.57
2.6
32
.65
2.6
82
.70
2.4
52
.26
SW.
co
rne
rS
.P
ier
SW.
co
rne
rS
.P
ier
SW.
co
rne
rS
.P
ier
SW.
co
rne
rS
.P
ier
SW.
co
rne
rS
.P
ier
SW.
co
rne
rS
.P
ier
SW.
co
rne
rS
.P
ier
Ra
nd
all
Pt.
/2.2
0E
dg
ew
ate
r/0
.85
“RB
N’
SW.
co
rne
rS
.P
ier
SW.
co
rne
rS
.P
ier
SW.
co
rne
rS
.P
ier
ne
are
st
sho
reW
hid
be
y/0
.63
tip
fue
ld
ock
Ed
ge
wa
ter/
1.8
3sh
ore
Clin
ton
Doc
k
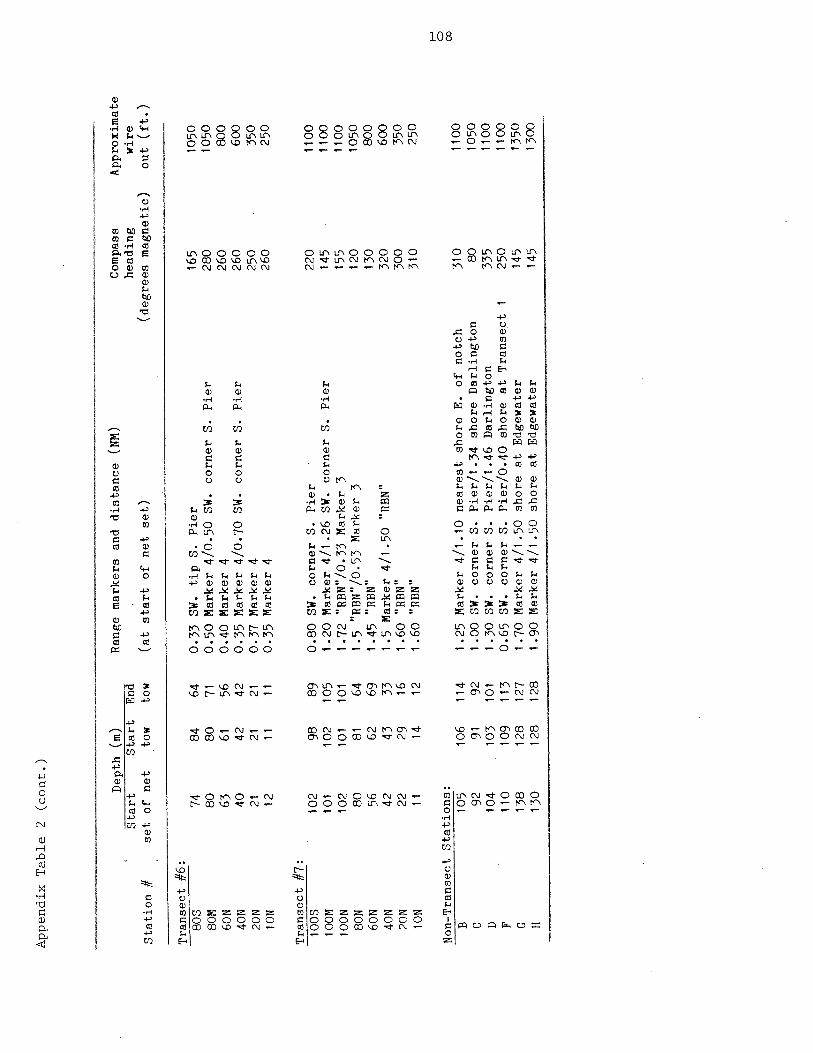
Ap
pe
nd
ixT
ab
le2
(co
nt.
)
Dep
thCm
)S
tart
tow
Com
pass
he
ad
ing
(de
gre
es
ma
gn
etic
)
Ap
pro
xim
ate
wire
ou
t(f
t.)
Tra
nse
ct_
#6
:80
S80
M60
N40
N20
NiO
N
Tra
nse
ct#7
:10
05IO
OMlO
ON
8ON
6ON
40N
2ON
iON
165
280
260
260
250
260
220
145
155
120
130
320
300
310
1050
1050 800
600
350
250
1100
1100
1100
1050 800
600
350
250
Sta
rtS
tatio
n#
set
of
ne
tEn
dto
w
Ran
gem
arke
rsan
dd
ista
nce
CNN)
(at
sta
rto
fn
et
se
t)
7484
640
.33
SW.
tip
S.
Pie
r80
8071
0.5
0M
ark
er
4/0
.50
SW.
corn
er
S.P
ier
6361
560
.40
Ma
rke
r4
4042
420
.35
Ma
rke
r4
/0.7
0SW
.co
rne
rS
.P
ier
2121
210
.37
Ma
rke
r4
1211
110
.35
Ma
rke
r4
102
9889
0.8
0SW
.co
rne
rS
.P
ier
101
102
105
1.2
0M
ark
er
4/1
.26
SW.
corn
er
S.
Pie
r10
210
110
11.
72~
RB
N’/0
.33
Ma
rke
r3
8081
641
.5‘R
BN
”/0
.53
Ma
rke
r3
5662
691
.45
‘RB
N”
4243
331
.5M
ark
er
4/1
.50
“RB
N”
2229
161
.60
“RB
N’
1114
121
.60
‘RBN
~’~
No
n-T
ran
sect
Sta
tio
ns:
C
B10
510
611
41.
25M
arke
r4
/1.1
0n
ea
rest
sho
reE
.o
fn
otc
h31
011
00C
9291
921
.00
Sw.
corn
er
S.
Pie
r/i
.34
sho
reD
arlin
gto
n80
1050
D10
410
310
11
.30
SW.
corn
er
S.
Pie
r/i
.46
Da
rlin
gto
n33
511
00F
110
109
113
0.6
5SW
.co
rne
rS.
Pie
r/0
.40
sho
rea
tT
ran
sect
125
011
00C
138
128
127
1.7
0M
arke
r4
/1.5
0sh
ore
at
Edg
ewat
er14
513
50Fl
130
128
128
1.9
0M
ark
er
4/1
.50
sho
rea
tE
dgew
ater
145
1300

Ap
pe
nd
ixT
ab
le3
.E
llio
ttB
aybe
amtr
aw
lsta
tio
nlo
ca
tio
nd
ata
.T
hetr
aw
ld
ep
ths
are
ave
rag
es
fro
mth
ose
reco
rde
dfr
om
the
Fe
bru
ary
,Ju
ne
and
Se
pte
mb
er,
1986
cru
ise
s.
All
tra
wls
we
re1
/8n
au
tica
lm
iles
(NM
)lo
ng
at
ap
pro
xim
ate
ly1.
5kn
ots
gro
un
dsp
ee
d.
Q
STAR
TSE
TO
FN
ETTR
AWL
DEP
TH(m
)
Ap
pro
xim
ate
De
pth
com
pass
Sta
tio
n(m
)R
ad
ar
Ran
ges
(NM
)an
dM
ark
ers
be
arin
gS
tart
tow
End
tow
Fo
urm
ileR
ock
:
Sta
tio
n1
178
1.0
5S
ho
re/i
.57
SWT
ipP
ier
917
90
168
160
Sta
tio
n2
168
0.8
1S
ho
re/1
.1SW
Tip
Pie
r91
23
5°
178
181
Sta
tio
n3
163
0.8
5S
ho
re/i
.0SW
Tip
Pie
r91
22
0°
185
188
Inn
er
Ellio
ttB
ay:
Sta
tio
n1
910
.7S
ho
reD
.H
ea
d/i
.2NW
Co
rne
r#4
61
80
°91
90S
tatio
n2
680
.84
Sh
ore
D.
He
ad
/i.0
NWC
orn
er
#46
16
0°
6262
Sta
tio
n3
780
.98
Sh
ore
D.
He
ad
/0.8
3NW
Co
rne
r#4
61
30
°78
73S
tatio
n4
660
.25
Tip
Tod
dD
ryd
ock/0
.84
NWC
orn
er
#46
65
°64
60S
tatio
n5
811
.6SW
Pie
r9
1/0
.95
Duw
.H
ead
(ne
are
st)
31
0°
9112
4
Tra
nse
ct
#1
lOS
120
.5N
otc
h/i
.28
Alk
i1
85
°12
1320
S21
0.5
No
tch
/i.2
3A
lki
19
0°
2120
40S
390
.5N
otc
h/i
.34
Alk
i1
85
°43
3780
S82
1.3
Alk
iP
t.1
75
°80
82
Tra
nse
ct
#2
:
iON
121.
1SW
Tip
Pie
r91
1000
20N
210
.9SW
Tip
Pie
r91
28
5°
2121
SON
870
.95
SWT
ipP
ier
9129
0~72
68

Ap
pe
nd
ixT
ab
le4
.C
omm
ence
men
tB
aybe
amtr
aw
lsta
tio
nlo
ca
tio
nd
ata
.T
hetr
aw
ld
ep
ths
are
ave
rag
es
fro
mth
ose
reco
rde
dfr
om
the
Fe
bru
ary
,Ju
ne
and
Se
pte
mb
er,
1986
cru
ise
s.
All
tra
wls
we
re1
/8n
au
tica
lm
iles
(NM
)lo
ng
at
ap
pro
xim
ate
ly1.
5kn
ots
gro
un
dsp
ee
d.
STA
RT
SET
OF
NET
TRAW
LD
EPTH
(m)
Ap
pro
xim
ate
De
pth
com
pass
Sta
tio
n(m
)R
ad
ar
Ran
ges
(NM
)an
dM
ark
ers
be
arin
gS
tart
tow
End
tow
PSD
DA
Site
1:
Sta
tio
n1
168
0.9
8A
sarc
oC
orn
er/
i.8
2N
eill/i
.35
Br.
Pt.
12
5°
169
166
Sta
tio
n2
169
1.1
8A
sarc
oC
orn
er/
2.O
Ne
ill/1
.15
Br.
Pt.
1400
169
168
Sta
tio
n3
173
1.4
Asa
rco
Co
rne
r/i
.8N
eill/1
.OB
r.P
t.14
0016
816
8S
tatio
n4
171
1.5
8A
sarc
oC
orn
er/
i.8
2N
eill/O
.82
Br.
Pt.
1300
169
167
PSD
DA
Site
2:
Sta
tio
n1
163
1.3
5A
sarc
oN
otc
h/O
.65
Sh
ore
30
5°
167
170
Sta
tio
n2
159
1.5
Asa
rco
No
tch
/2.6
3N
eill/1
.i5
Br.
Pt.
30
5°
166
166
Sta
tio
n3
158
1.6
5A
sarc
oN
otc
h/2
.62
Ne
ill/0
.93
Br.
Pt.
30
5°
166
166
PSD
DA
Site
2B:
Sta
tio
n1
175
1.2
5A
sarc
oC
orn
er/
i.5
Ne
ill/1
.3B
r.P
t.85
~17
417
3S
tatio
n2
175
1.5
Asa
rco
Co
rne
r/i.i2
Br.
Pt.
1000
175
174
Sta
tio
n3
175
1.7
4A
sarc
oC
orn
er/
i.0
Br.
Pt.
10
5°
175
173
Tra
nse
ct
#1
:
iOE
120
.08
Br.
Pt.
16
5°
ii15
20E
220
.09
Br.
Pt.
16
5°
2023
40E
400
.09
Abe
amB
r.P
t.1
65
°38
4880
E81
0.2
2A
beam
Br.
Pt.
18
0°
8675
40W
410
.5A
sarc
oC
orn
er
30
0°
6040
20W
210
.47
Asa
rco
Co
rne
r3
00
°22
20lo
w10
0.4
5A
sarc
oC
orn
er
29
0°
ii10
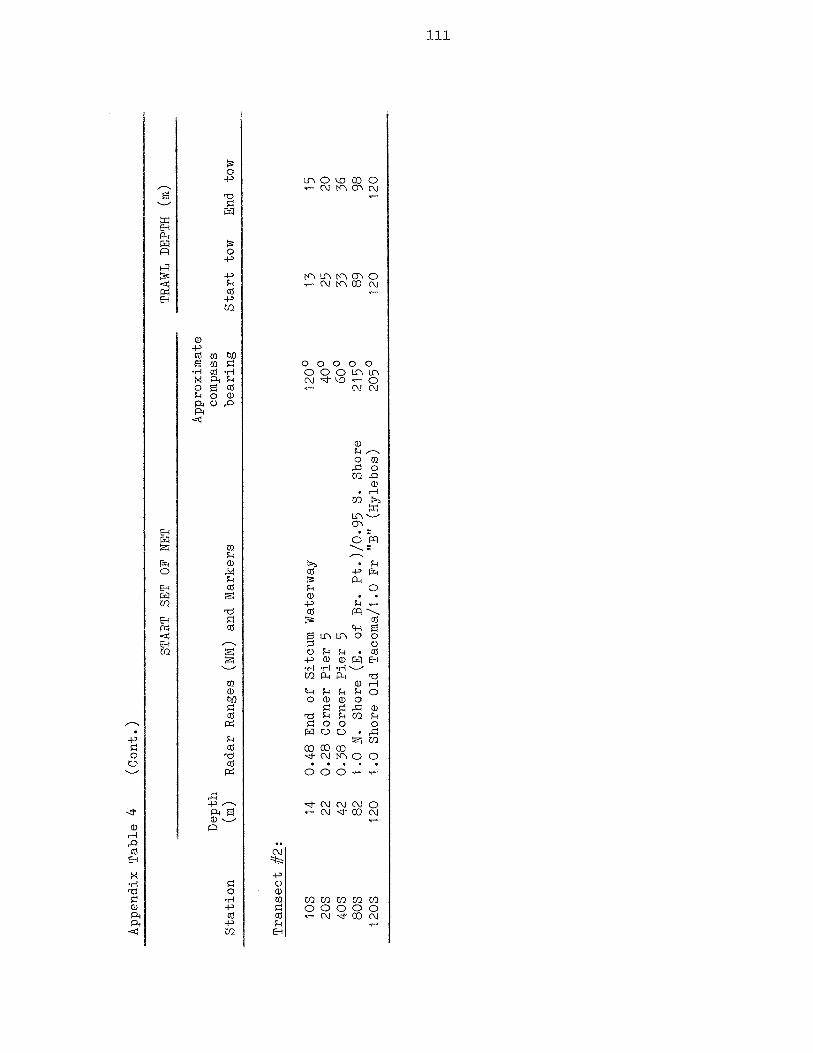
Ap
pe
nd
ixT
ab
le4
(Co
nt.
)
STAR
TSE
TO
FN
ETTR
AWL
DEP
TH(in
)
Ap
pro
xim
ate
De
pth
com
pass
Sta
tio
n(m
)R
ad
ar
Ran
ges
(NM
)an
dM
ark
ers
be
arin
gS
tart
tow
End
tow
Tra
nse
ct
#2
:
lOS
140
.48
End
of
Sitc
um
Wa
terw
ay
1200
1315
20S
220
.28
Co
rne
rP
ier
540
025
2040
S42
0.3
8C
orn
er
Pie
r5
600
3336
8OS
821
.0N
.S
ho
re(E
.o
fB
r.P
t.)/
O.9
5S
.S
ho
re2
15
°89
9812
0S12
01
.0S
ho
reO
ldT
aco
ma
/i.0
Fr
“B”
(Hyle
bo
s)
20
5°
120
120
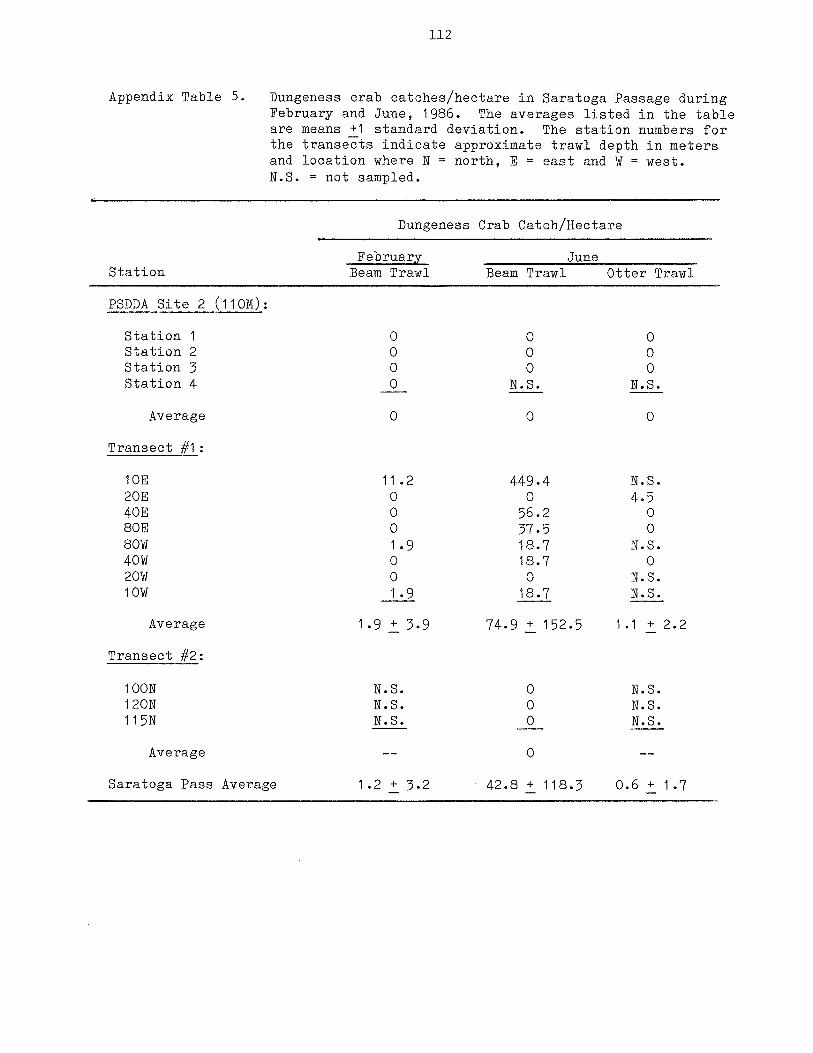
112
Appendix Table 5. Dungeness crab catches/hectare in Saratoga Passage duringFebruary and June, 1986. The averages listed in the tableare means +1 standard deviation. The station numbers forthe transects indicate approximate trawl depth in metersand location where N = north, E = east and W = west.N.S. = not sampled.
Dungeness Crab Catch/Hectare
February JuneStation Beam Trawl Beam Trawl Otter Trawl
PSDDA Site 2 (11OM):
Station 1 0 0 0Station 2 0 0 0Station 3 0 0 0Station 4 0 N.S. N.S.
Average 0 0 0
Transect #1:
1OE 11.2 449.4 N.S.20E 0 0 4.540E 0 56.2 080E 0 37.5 080W 1.9 18.7 N.S.40W 0 18.7 020W 0 0 N.S.lOW 1.9 18.7 N.S.
Average 1.9 ± 3.9 74.9 ± 152.5 1.1 ± 2.2
Transect #2:
lOON N.S. 0 N.S.120N N.S. 0 N.S.115N N.S. 0 N.S.
Average 0
Saratoga Pass Average 1.2 ± 5.2 42.8 ± 118.3 0.6 ± 1.7

Ap
pe
nd
ixT
ab
le6
.B
eam
tra
wl
shrim
pca
tch
es/h
ecta
rein
Sa
rato
ga
Pa
ssa
ge
du
rin
gF
eb
rua
ryan
dJu
ne
,1
98
6,
and
inE
llio
ttan
dC
omm
ence
men
tb
ays
du
rin
gF
eb
rua
ry,
Jun
ean
dS
ep
tem
be
r,1
98
6.
The
ave
rag
es
liste
din
the
tab
lea
rem
eans
±1
sta
nd
ard
de
via
tio
n.
The
sta
tio
nn
um
be
rsfo
rth
etr
an
se
cts
ind
ica
tea
pp
roxim
ate
de
pth
sin
me
ters
and
loca
tio
nw
he
reN
No
rth
,E
=E
ast,
W=
Wes
tan
dS
=S
ou
th.
N,S
.=
no
tsa
mp
led
.
FEBR
UAR
YJU
NE
Sm
ooth
Sm
ooth
Aro
a/S
tntio
nS
po
tS
ide
atr
ipe
00
0n
atr
ipe
pin
kP
ink
Rom
pkao
kA
llS
po
tS
ide
atr
ipe
00
0n
atr
ipe
pin
kP
ink
llnm
pkao
kA
ll
SAR
ATO
GA
PASS
AGE
PSSS
AS
ite
2(lIO
N):
Sta
tio
nI
01
8.7
09
.41
8.7
04
6.8
Sta
tio
n2
03
7.5
00
00
37
.5S
tatio
n3
03
7.5
00
18
.70
56
.2
Ave
rag
e0
31
.2•
10
.90
3.1
•5
.41
2.5
+1
0.8
04
6.8
+9
.4
Tra
na
eo
t#
1:
IOE
00
00
00
020
E0
00
00
00
40E
00
09
3.6
56
.20
14
9.8
80
k0
00
00
00
ROW
00
00
00
040
W0
00
93
.61
87
.30
28
0.9
20W
00
00
00
0lO
W0
00
00
00
00
01
8.7
74
.90
93
.60
37
.50
07
4.9
01
12
.40
00
00
0-
0
01
2.5
•2
1.7
06
.2•
10
.84
9.9
•4
3.2
06
8.7
•6
0.2
Tra
nn
eo
t#
2:
lOO
NN
.S.
1208
8.5
.ll5
N8
.5.
Sa
rato
ga
Ray
AV
erag
e0
8.5
•1
5.4
ELL
IOT
TRA
TF
oo
rnila
Roo
k(1
7014
):S
tatio
nI
00
Sta
tio
n2
05
6.2
Sta
tio
n3
01
8.7
Ave
rag
e0
25
.0+
28
.6
00
37
.50
00
00
00
00
00
00
00
00
37
.50
05
6.2
20
6.0
00
00
00
00
00
00
00
0
03
7.5
00
00
O0
02
99
.70
00
00
0
O3.
70
02
54
.70
24
.34
00
00
00
00
00
00
0~
01
7.9
+3
7.5
25
.5•
56
.40
51
.9+
88
.63
.4•
11
.34
.0•
10
.82
.7•
10
.05
.4•
15
.54
1.5
78
.50
56
.2+
99.1
0 0 0 0
00
00
05
6.2
01
8.7
32
.4
N.S
.
Inn
er
Ellio
ttB
ay(7
514)
:S
tatio
n1
0S
tatio
n2
0S
tatio
n3
0S
tatio
n4
11.5
.S
tatio
n5
~A
vera
g,
0
18
.70 0
6.2
•1
0.8
O3
7.5
02
62
.20
37
.5
01
12
.41
29
.7
00
05
6.2
07
4.9
04
3.7
~3
9.0
24
3.5
26
2.2
39
3.3
30
0.0
+8
1.6
0 0 0 0
18
7.3
00
03
55
.80
18
1.0
+1
78
.00
07
4.9
01
68
.5
2_1
87
.3
04
3.6
60
.2
O1
8.7
07
4.9
00
03
1.2
03
9.0
00
03
7.5
00
18
.70
0N
.S.
N.S
.
18
.7+
18
.80
Tra
nm
eo
tN
I10
520
S40
S80
S
Tra
nn
ao
t#
2:
ION
208
808
SEPT
EMBE
R
Sm
ooth
Sp
ot
Sid
en
trip
eC
oo
na
trip
ep
An
tP
ink
Rom
pkao
kAS
S
09
3.6
02
43
.40
18
7.3
01
74
.8+
75
.7
0 0 08
.5.
00
00
R.S
.
03
7.5
00
03
7.5
O2
5.0
02
1.7
00
00
00
00
00
01
8.7
00
0
31
8.4
00
03
18
.47
4.9
00
07
4.9
o9
3.6
09
3.6
18
.70
37
.50
07
5.0
00
18
.73
7.5
07
4.9
05
6.2
56
.20
__
__
_0
0
01
8.7
+1
8.8
43
.7+
47
.10
81
.2•
10
.81
5.0
•2
4.4
11
.2•
25
.1
00
00
00
00
00
00
00
00
18
.70
00
00
00
00
18
.70
18
.70
37
.4
00
18
.70
00
_9_
-~
37
.4
00
18
.71
8.7
00
11
2.4
01
8.7
00
07
8A
.50
18
.74
49
.40
07
4.9
07
.5•
10
.22
84
.63
29
.3
Ellio
ttB
ayA
vera
ge
08
.5•
17
.53
7.5
09
5.9
54
.5•
11
5.0
013
1.1
a1
44
.88
.6o
18.1
1.4
05
.24
4.7
*6
6.9
06
6.2
a7
6.7
—3
0.7
•7
8.2
——
—7
.2•
21
.0—
4.3
•11
.2—
—
05
6.2
00
07
4.9
04
3.7
+3
9.0
013
1.1
01
8.7
08
42
.71
8.7
54
3.0
07
4.9
3.7
+8
.4 32
2.0
+3
56
.9
00
00
00
00
00
00
00
00
00
55
.90
00
00
55
.95
6.2
0
8.7
•1
9.9
00
56
.20
00
56
.20
09
3.6
00
09
3.6
00
00
00
00
00
01
8.7
01
8.7
00
18
.70
00
11
.2+
27
.22
.5•
6.6
00
00
01
8.7
37
.40
93
.6
10
2.4
•2
21
.21
34
.8+
23
6.9
8.7
•1
8.6
1.7
•5
.0
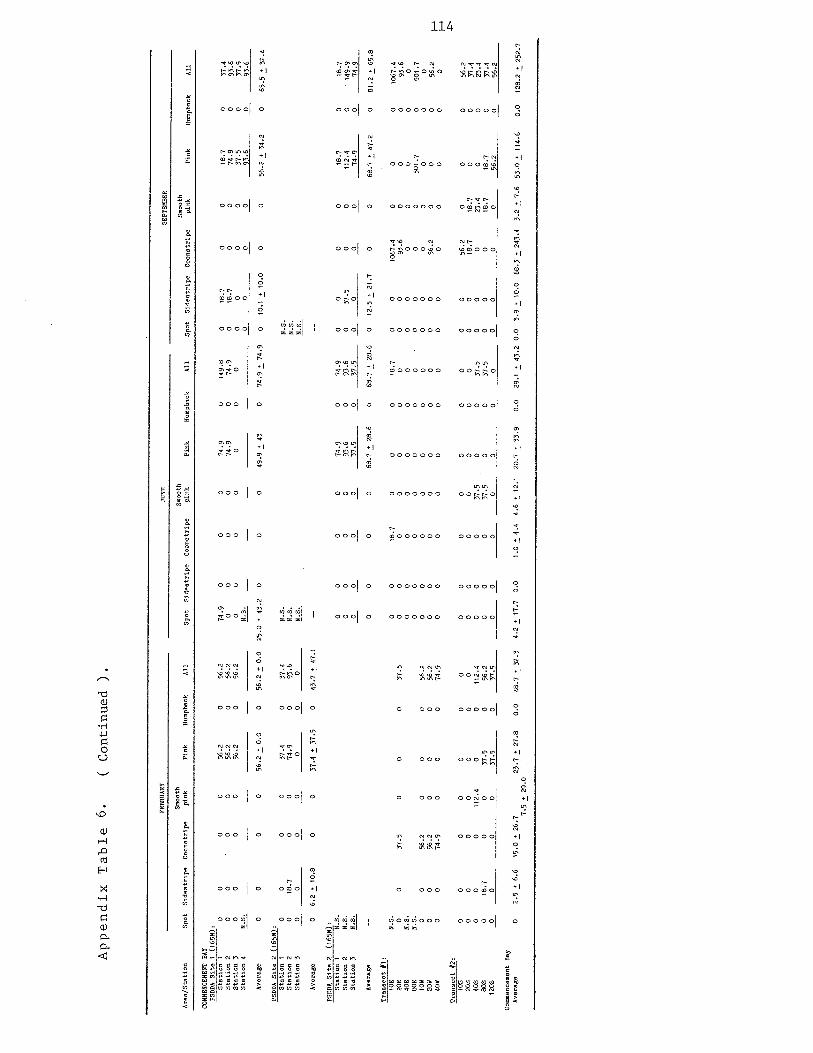
00000000jooo
oo0~000
0000
0
I,
0
—
~
00
0000
0
CD
x
CD
ON
C
CDCD-.
0jooooo0oo~.~no~.000
j’~’0~00000000~0
I~00000010000000
1+joo~oo00000ooo0000
0
~oo~0
~P~0
g00000coo0000
~
I.I,I.
~P~-.0
~0000000000000Ieee~I~~
~I°°°°°00000000coo0000
~00000oooooo~0eec0I000
I:~00000000boo0000
~-‘000000000000-~‘~~D-~0
‘-.0
~1°°°°°000000000000000
I~~~
~
P000o000000000000o0ooj...o0000
0ft.0
000000000000‘“o~o—oo~0II0P
—.0~0
‘~ooo~~o~ooo~~0000010000
~o~~o00000
I~~I~~
~000000000000010000
-.‘_,4
I.~~°~°Is-.~
~7TT
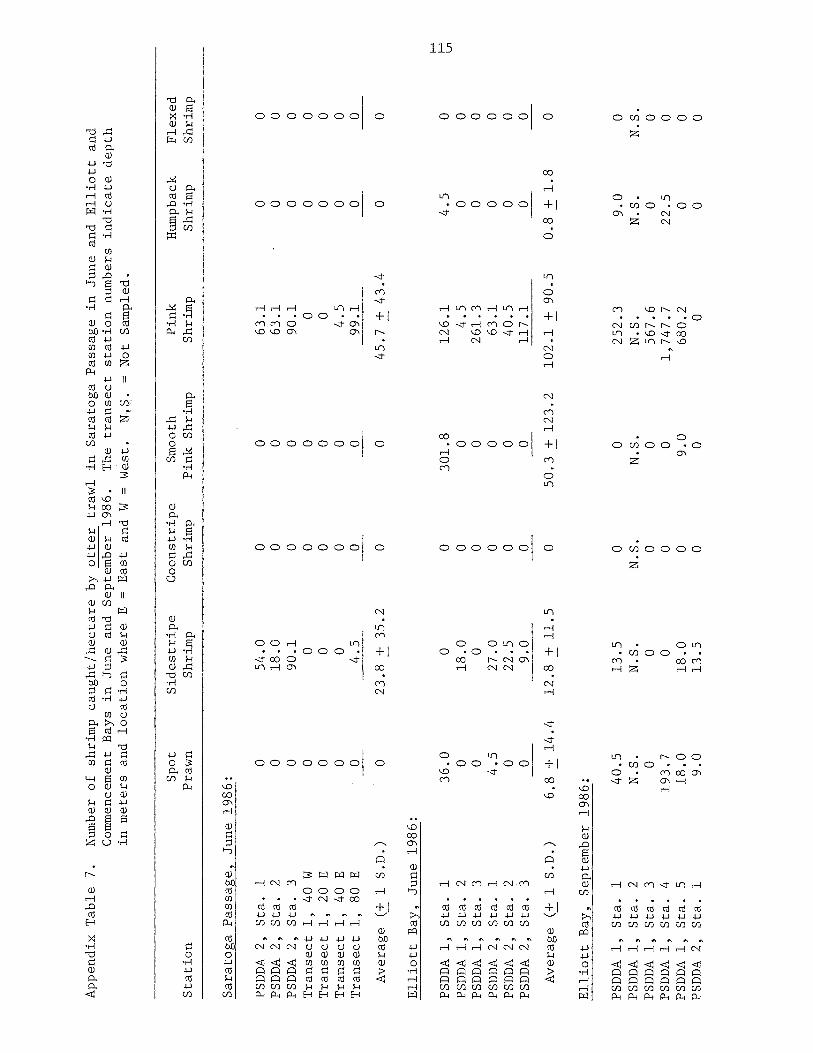
Ap
pe
nd
ixT
ab
le7
.N
umbe
ro
fsh
rim
pca
ug
ht/
he
cta
reb
yo
tte
rtr
aw
lin
Sa
rato
ga
Pa
ssa
ge
inJu
ne
and
Ellio
ttan
dC
omm
ence
men
tB
ays
inJu
ne
and
Se
pte
mb
er
19
86
.T
hetr
an
se
ct
sta
tio
nn
um
be
rsin
dic
ate
de
pth
inm
ete
rsan
dlo
ca
tio
nw
he
reE
=E
ast
and
W=
We
st.
N~
.N
ot
Sa
mp
led
.
Sp
ot
Sid
estr
ipe
Co
on
str
ipe
Sm
ooth
Pin
kH
umpb
ack
Fle
xe
dS
tatio
nP
raw
nS
hrim
pS
hrim
pP
ink
Sh
rim
pS
hrim
pS
hrim
pS
hrim
p
Sa
rato
ga
Pa
ssa
ge
,Ju
ne
19
86
:
Ellio
ttB
ay,
Jun
e1
98
6:
PSD
DA
1,
Sta
.1
PSD
DA
1,
Sta
.2
PSD
DA
1,
Sta
,3
PSD
DA
2,
Sta
.1
PSD
DA
2,
Sta
.2
PSD
DA
2,
Sta
.3
Ave
rag
e(±
1S
.D.)
12
6.1
4.5
4.5
26
1.3
63
.14
0.5
11
7.1
PSD
DA
2,
Sta
.1
05
4.0
00
63
.10
0PS
DD
A2
,S
ta.
20
18
.00
06
3.1
00
PSD
DA
2,
Sta
.3
09
0.1
00
90
.10
0T
ran
se
ct
1,
40W
00
00
00
0T
ran
se
ct
1,
20E
00
00
00
0T
ran
se
ct
1,
40E
00
00
4,5
00
Tra
nse
ct
1,
80E
04
.50
09
9.1
00
Ave
rag
e(±
1S
.D.)
02
3.8
±3
5.2
00
45
.7±
43
.40
36
.00
03
01
.80
18
.00
00
00
04
.52
7.0
00
02
2,5
00
09
.0-~
6.8
±1
4.4
12
.8±
11
.50
50
,3±
12
3.2
Li’
0 0 0 0 0 0 0 0
0 0 0 0 0
Ellio
ttB
ay,
Se
pte
mb
er
19
86
:
PSD
DA
1,
Sta
.1
40
.51
3.5
PSD
DA
1,
Sta
.2
N.S
.N
.S.
PSD
DA
1,
Sta
.3
00
PSD
DA
1,
Sta
,4
19
3.7
00
PSD
DA
1,
Sta
.5
18
.01
8.0
0PS
DD
A2
,S
ta.
19
.01
3.5
0
10
2.1
±9
0.5
0.8
±1
.8
00
25
2.3
9.0
0N
.S.
N.S
.N
.S.
N.S
.N
.S.
00
56
7.6
00
01
,74
7.7
22
.50
9.0
68
0.2
00
00
00

Ap
pe
nd
ixT
ab
le7
(co
ntin
ue
d): S
po
tS
ide
str
ipe
Co
on
str
ipe
Sm
ooth
Pin
kH
umpb
ack
Fle
xe
dS
tatio
nP
raw
nS
hrim
pS
hrim
pP
ink
Sh
rim
pS
hrim
pS
hrim
pS
hrim
p
PSD
DA
2,
Sta
.2
PSD
DA
2,
Sta
.3
Ave
rag
e(±
1S
.D.)
Com
men
cem
ent
Ba
y,Ju
ne
19
86
:
o0
o0
o1
.3±
3.4
45
.00
31
.50
47
4.9
±6
22
.84
.5±
8.6
Com
men
cem
ent
Ba
y,S
ep
tem
be
r1
98
6:
04
.51
03
.67
6.6
38
.0±
70
.13
2.2
±4
0.9
PSD
DA
1,
Sta
.1
4.5
9.0
04
.52
20
.70
PSD
DA
1,
Sta
.2
04
.50
03
42
.30
PSD
DA
1,
Sta
.3
00
04
.52
43
.20
PSD
DA
2B,
Sta
.1
04
.50
01
30
.60
PSD
DA
2B,
Sta
.2
02
2.5
00
10
8.1
0PS
DD
A2B
,S
ta.
30
13
.50
04
36
.90
Tra
nse
ct
1,
20E
00
00
00
Tra
nse
ct
1,
40E
00
00
00
Ave
rag
e0
.6±
1.6
6.8
+8
.0
0 0 0 0 0 0 0 0 0 0 0 00
1.1
±2
.11
85
.2±
15
6.0
0
PSD
DA
1,
Sta
.1
N.S
.N
.S.
N.S
.N
.S.
N.S
.N
.S.
N.S
.PS
DD
A1
,S
ta.
20
76
.60
03
10
.80
0PS
DD
A1
,S
ta.
39
,08
5.6
00
37
8.4
00
PSD
DA
1,
Sta
.4
09
4.6
00
41
4.4
00
PSD
DA
2B,
Sta
.1
09
9.1
00
38
7.4
00
PSD
DA
2B,
Sta
.2
4.5
67
.60
02
97
.30
0PS
DD
A2B
,S
ta.
30
16
2.2
00
40
9.9
00
Tra
nse
ct
1,
20E
00
00
00
0T
ran
se
ct
1,
40E
00
00
00
0
Ave
rag
e(±
1S
.D.)
1.7
±~
74
.1±
52
.10
02
74
.8±
17
4.8
00

App
endi
xT
able
8.Be
amtr
aw
lca
tche
so
fD
unge
ness
crab
(per
l000
m2)
from
Por
tG
ardn
erdu
ring
win
ter
(Feb
ruar
y4
-7,
1986
).
Dun
gene
ssC
rab/
1000
m2
~Fe
mal
esFe
mal
esS
tatio
n*
with
eggs
with
ou
teg
gsM
ales
All
crab
sCo
mm
ents
Nav
yD
ispo
sal
Site
:(8
0m)
Sta
tion
19.
41.
90
11.2
60g
al.
mud
,w
ood,
de
bris
Sta
tion
228
.10
028
.150
ga
l.m
ud,
woo
d,tr
ash
Sta
tion
324
.31.
91.
928
.130
ga
l.w
ood,
tra
sh
Ave
rage
20.6
±.9•
9+1
.3~
1.1
0.6
±1.
122
.5~
9.8
PSDD
AS
ite2
:(1
20m
)
Sta
tion
10
00
05
ga
l.w
ood,
de
bris
Sta
tion
20
00
02
ga
l.fish
,d
etr
itu
sS
tatio
n3
1.9
00
1.9
2g
al.
fish
,d
etr
itu
s
Ave
rage
0.6
±1.
10.
00.
00.
6±
1.1
PSDD
AS
ite1
:(1
60m
)
Sta
tion
10
00
01
ga
l.w
ood,
de
tritu
sS
tatio
n2
00
00
1g
al.
worm
tube
s,d
etr
itu
sS
tatio
n3
00
00
1g
al.
worm
tube
s
Ave
rage
0.0
0.0
0.0
0.0
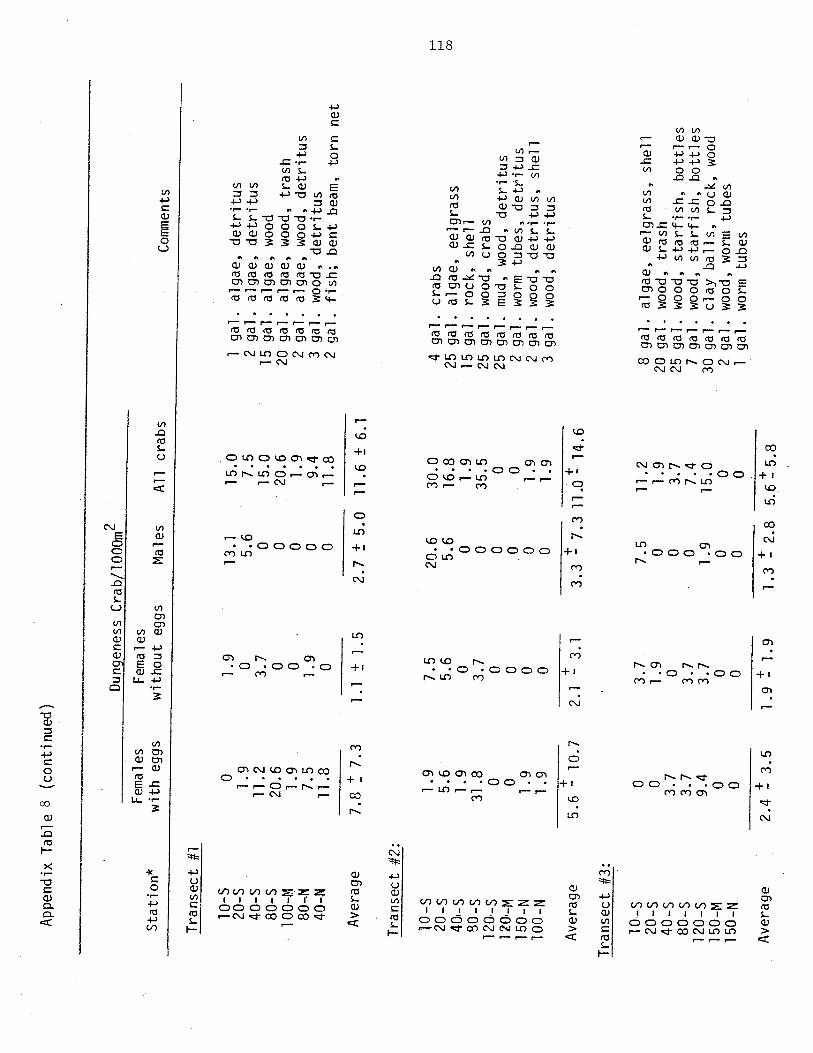
App
endi
xT
able
8(c
on
tinu
ed
)
2.4
±3
5
+2.
1-
3.1
1.9
±1.
9
Dun
gene
ssC
rab/
l000
m2
Fem
ales
Fem
ales
Sta
tion
*w
itheg
gsw
itho
ut
eggs
Mal
esA
llcr
abs
Com
men
ts
Tra
nsec
t#1
10-s
20-S
40-S
80-S
100-
M80
-N40
-N
Ave
rage
Tra
nsec
t#2
:
0 1.9
11.2
20.6
1.9
7.5
11.8
7.8
i:7.
3
1.9 0 3.7 0 0 1.9 0
1.1
±1.
5
13.1 5.6 0 0 0 0 0
15.0
7.5
15.0
20.6
1.9
9.4
11.8
alga
e,d
etr
itu
sal
gae,
de
tritu
sal
gae,
wood
alg
ae
,w
ood,
tra
shal
gae,
woo
d,d
etr
itu
sw
ood,
de
tritu
sfish
;be
ntbe
am,
torn
net
crab
s10
—S
1.9
7.5
20-S
5.6
5.6
40
-s1.
90
80—
S31
.83.
712
0-S
00
l20-
M0
0l5
0-N
1.9
010
0-N
1.9
0
1g
al.
2ga
l15
ga
l.20
ga
l.2
ga
l.3
ga
l.2
ga
l.
4g
al.
25g
al.
15g
al.
25g
al.
25g
al.
2g
al.
2g
al.
3g
al.
20.6
5.6 0 0 0 0 0
30.0
16.8
1.9
35.5 0 0 1.9
1.9
Ave
rage
Tra
nsec
t#3
:
20-S
40
-s80
-5l2
0-~
l50-
MiS
O-N
H H cc
2.7
±5.
011
.6±
6.1
alg
ae
,ee
lgra
ss~
rock
,sh
ell
woo
d,cr
abs
mud
,w
ood,
de
tritu
swo
rmtu
bes,
de
tritu
sw
ood,
de
tritu
s,
she
llw
ood,
de
tritu
s+
++
5.6
-10
.73.
3-
7.3
11
.0-
14.6
03.
77.
511
.28
ga
l.a
lga
e,
ee
lgra
ss,
she
ll0
1.9
01.
920
ga
l.w
ood,
tra
sh3.
70
03.
725
ga
l.w
ood,
sta
rfis
h,
bo
ttle
s3.
73.
70
7.4
7g
al.
woo
d,sta
rfis
h,
bo
ttle
s9.
43.
71.
915
.030
ga
l.cl
ay
ba
lls,
rock
,wo
od0
00
02
ga
l.w
ood,
worm
tube
s,0
00
01
ga
l.wo
rmtu
bes
1.3
i:2.
85.
6±
5.8
Ave
rage
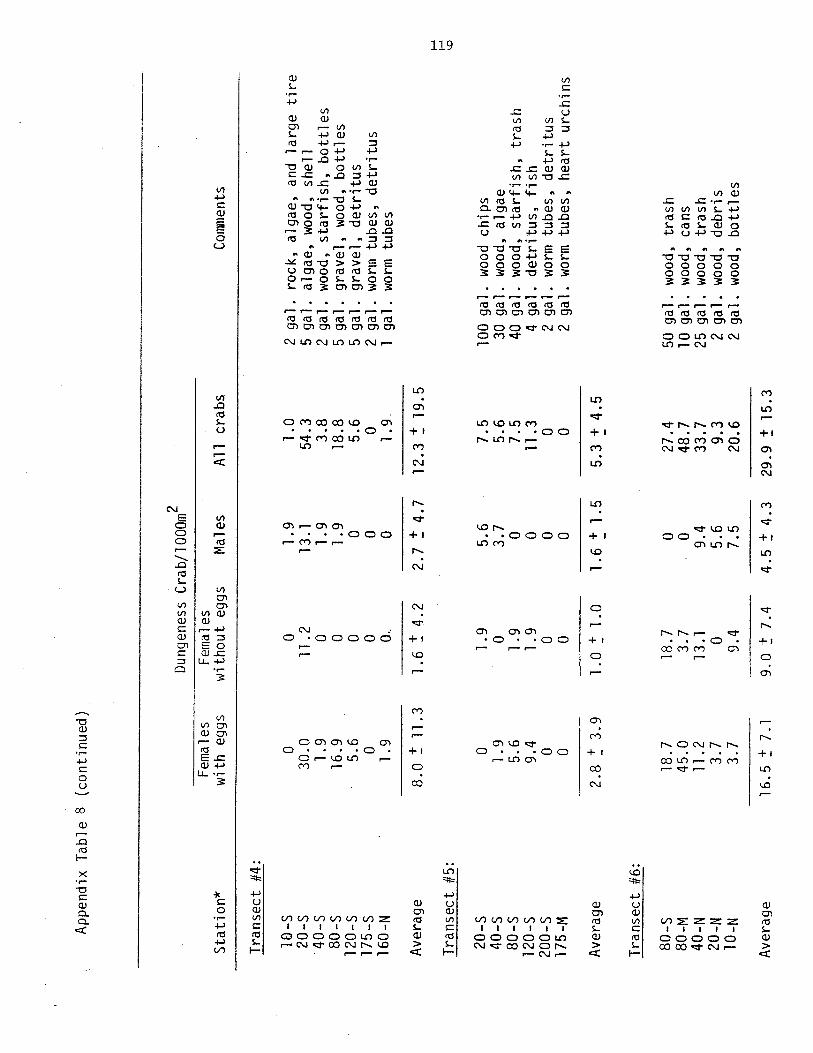
App
endi
xT
able
8(c
on
tinu
ed
)
Tra
nsec
t#5
:
wood
chip
sw
ood,
alga
ew
ood,
sta
rfis
h,
tra
shd
etr
itu
s,
fish
worm
tube
s,d
etr
itu
swo
rmtu
bes,
he
art
urc
hin
s
~D
unge
ness
Cra
b/l0
00ni
2Fe
mal
esFe
mal
esS
tatio
n*
with
eggs
with
ou
teg
gsM
ales
All
crab
sCo
mm
ents
Tra
nsec
t#4
:
10-S
20-S
40-S
80-5
120—
S17
5—s
160-
N
Ave
rage
030
.0 1.9
16.9 5.6 0 1.9
011
.2 0 0 0 0 0..
1.9
13.1 1.9
1.9 0 0 0
1.0
54.3 3.8
18.8 5.6 0 1.9.
2ga
l5
ga
l.2
ga
l.5
gal
5g
al.
2g
al.
1g
al.
8.0
±11
.31.
6±
4.2
2.7
±4.
712
.3±
19.5
rock
,al
gae,
and
larg
etire
alga
e,w
ood,
she
llw
ood,
sta
rfis
h,
bo
ttle
sg
rave
l,w
ood,
bo
ttle
sg
rave
l,d
etr
itu
swo
rmtu
bes,
de
tritu
swo
rmtu
bes
20-S
01.
95.
67.
540
-S1.
90
3.7
5.6
80-S
5.6
1.9
07.
512
0—S
9.4
1.9
011
.320
0-S
00
00
l75-
M0
00
0
Ave
rage
2.8
~3.
9
Tra
nsec
t#6
:
100 30 40 4 2 2
ga
l.g
al.
ga
l.g
al.
ga
l.g
al.
1.0
j1.
01.
6+
1.5
5.3
+4.
5
80-5
18.7
18.7
027
.480
_rvi
45.0
3.7
048
.740
-N11
.213
.19.
433
.720
-N3.
70
5.6
9.3
lU-N
3.7
9.4
7.5
20.6
Ave
rage
16.5
±7.
19.
0±
7.4
4.5
±4.
329
.9±
15.3
50g
al.
10g
al.
25ga
l.2
gal.
2ga
l.
woo
d,w
ood,
woo
d,w
ood,
wood
,
tra
shC
aflS
tra
shd
eb
ris
bo
ttle
s

App
endi
xT
able
8(c
on
tinu
ed
)
Dun
gene
ssC
rab/
1000
m2
Fem
ales
Fem
ales
Sta
tion
*w
itheg
gsw
itho
ut
eggs
Mal
esA
llcr
abs
Com
men
ts
Tra
nsec
t#7
:
100-
S9.
40
09.
415
ga
l.w
ood,
de
tritu
s,
cans
lOO
-M1.
90
01.
93
ga
l.w
orm
tube
s,w
ood
100-
N5.
60
05.
62
ga
l.w
ood,
de
bris
80-N
8.5
00
8.5
2g
al.
gra
vel,
crab
s40
-N54
.33.
71.
959
.920
ga
l.w
ood,
crab
s20
-N43
.17.
51.
952
.510
ga
l.w
ood,
crab
s10
—N
7.5
13.1
1.9
22.5
2g
al.
crab
s
Ave
rage
18.6
~20
.93.
5~
5.1
0.8
±1
.022
.9±
23.7
*S
tatio
nnu
mbe
rsfo
rth
etr
an
sect
sin
dic
ate
whe
reN
=nor
th,
S=s
outh
,an
dM
~mid
dle
dept
hin
met
ers
plus
loca
tion
r”J C
+Mea
nj
1st
anda
rdd
evi
atio
n.
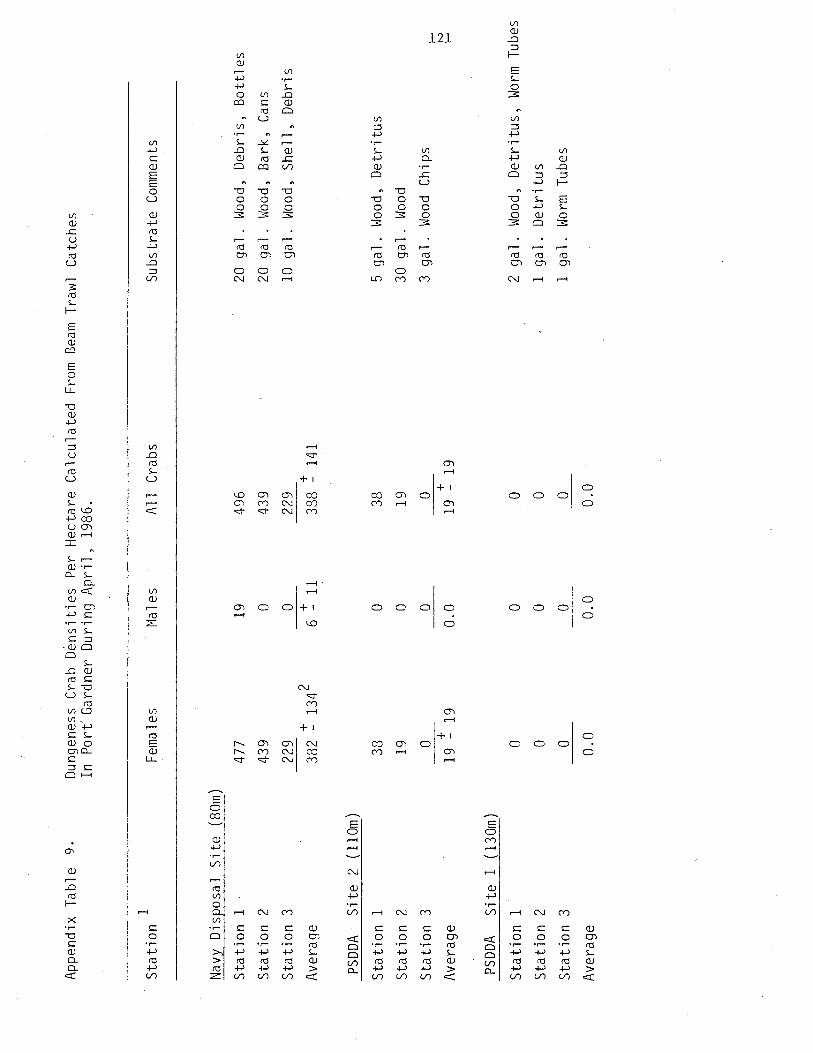
App
endi
xT
able
9.D
unge
ness
Cra
bD
en
sitie
sPe
rH
ecta
reC
alcu
late
dFr
omBe
amTr
awl
Cat
ches
InPo
rt~G
ardn
erD
urin
gA
pril
,19
86.
Sta
tion
1Fe
mal
esM
ales
All
Cra
bsS
ubst
rate
Com
men
ts
Nav
yD
ispo
sal
Site
(80m
)S
tatio
n1
477
1949
620
gal
.W
ood,
De
bris
,B
ott
les
Sta
tion
243
90
439
20g
al.
Woo
d,B
ark,
Cans
Sta
tion
322
90
229
10g
al.
Woo
d,S
he
ll,D
ebris
Ave
rage
382
~13
426
1138
814
1
PSDD
AS
ite2
(ilO
m)
Sta
tion
138
038
5ga
l.
Woo
d,D
etr
itus
Sta
tion
219
019
30ga
lW
ood
Sta
tion
30
00
3g
al.
Woo
dC
hips
Ave
rage
1919
0.0
1919
PSDD
AS
ite1
(130
m)
Sta
tion
10
00
2g
al.
Woo
d,D
etr
itus,
Wor
mTu
bes
Sta
tion
20
00
1g
al.
De
tritu
s
Sta
tion
30
00
1ga
l.
Wor
mTu
bes
Ave
rage
0.0
0.0
0.0

Tab
leA
ppen
dix
9.D
unge
ness
Cra
bD
en
sitie
sP
erH
ecta
reC
alcu
late
dFr
omBe
amTr
awl
Cat
ches
(co
ntin
ue
d)
InP
ort
Gar
dner
Dur
ing
Ap
ril,
1986
.
Sta
tion
Fem
ales
Mal
esA
llC
rabs
Com
men
ts
Tra
nsec
t#1
1g
al.
ULVA
,W
ood
Chi
ps
1g
al.
iJULP
~~W
ood
Chi
ps
6g
al.
iJ.L~
(~.
Woo
dC
hips
10g
al.~
Woo
d,B
ott
les
12g
al.
Woo
d,M
ud2
ga
l.D
etr
itus,
Woo
dC
hips
40-N
__
__
__
__
__
__
__
__
__
__
__
__
__
Ave
rage
Tra
nsec
t#2
10-S
5g
al.
Zos
tera
,UL
VA
20-S
20ga
l.
ULVA
40-S
4ga
l.
ULVA
,
80-S
8g
al.
Woo
d,
110-
S5
ga
l.W
ood,
110-
M2
ga
l.D
etr
itus
130-
N2
ga
l.W
ood,
De
tritu
s,Ca
ns
100-
N_
__
__
__
__
__
__
__
__
__
__
1ga
l.
Woo
d
Ave
rage10
-S38
3876
20-S
1919
38
40-S
190
19
80-S
950
95
100-
M0
00
80-N
570
N.S
.3N
.S.
N.S
.
38
~3
41
0~
164
8~
36
5719
76
570
57
380
38
760
76
00
0
00
0
00
0
190
19
31~
3O2
t7
N.S
1’J
Woo
d,S
hell
Deb
ris,
Cans
De
trit
us

Tab
leA
ppen
dix
9.D
unge
ness
Cra
bD
en
sitie
sP
erH
écta
reC
alcu
late
dFr
omBe
amTr
awl
Cat
ches
(co
ntin
ue
d)
InP
ort
Gar
dner
Dur
ing
Ap
ril,
1986
.
Sta
tion
Fem
ales
Mal
esA
llC
rabs
Com
men
ts
Tra
nsec
t#3
10-S
3819
576
ga
l.UL
VA,
Sh
ell,
Bo
ttle
s
20-S
380
3840
gal
.UL
VA,
Woo
d
40-S
115
011
530
ga
l.W
ood,
Roc
k,B
ott
les
80-S
950
957
ga
l.W
ood
110-
S0
00
20g
al.
Cla
yB
alls
,W
ood
130-
rio
00
1g
al.
De
tritu
s,W
orm
Tube
s
130-
N19
019
1ga
l.
Wor
mTu
bes
Ave
rage
44t
453
746
45
Tra
nsec
t#4
10-S
1938
572
ga
l.Z
oste
ra,
ULVA
,S
hell
20-5
00
0:
ga
l.~JJ
JL~,
Woo
d,S
hell
40-S
190
1950
ga
l.UL
VA,
Woo
d,B
ott
les
80-S
191
1921
03
ga
l.UL
VA,
Woo
d,Ca
ns
110-
S19
019
7g
al.
Roc
k,W
ood,
Gra
vel
145-
50
00
2g
al.
De
tritu
s,W
orm
Tube
s
135-
N0
—0
02
ga
l.W
ood,
De
tritu
s,W
orm
Tube
s
Ave
rage
35
t69
8~
15
44
~7
6
Tra
nsec
t#5
20—
S57
057
30g
al.
ULVA
,T
ire
,W
ood,
Sh
ell,
40-S
1919
3850
ga
l.W
ood
Chi
psG
rave
l
80-S
115
011
560
ga
l.R
ock,
Gra
vel,
Bo
ttle
s
110-
S0
00
3g
al.
Mud
,Pe
aG
rave
l,W
ood
165-
S0
00
2g
al.
Woo
dC
hips
,W
orm
Tube
s
145M
IL_
__
_2
ga
l.H
eart
Urc
hin
s,W
orm
Tube
sA
vera
ge32
±46
33
35±
46
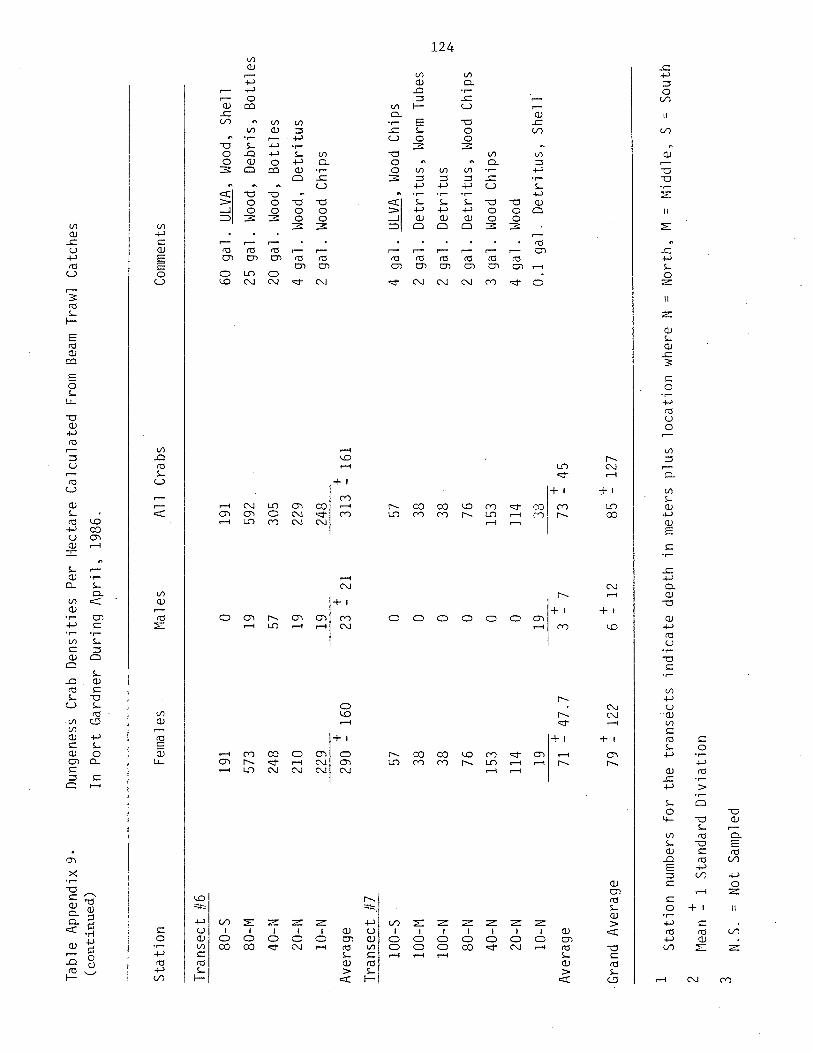
Tab
leA
ppen
dix
9.D
unge
ness
Cra
bD
en
sitie
sPe
rH
ecta
reC
alcu
late
dFr
omBe
amTr
awl
Cat
ches
(co
ntin
ue
d)
InP
ort
Gar
dner
Dur
ing
Ap
ril,
1986
.
Sta
tion
Fem
ales
Mal
esA
llC
rabs
Com
men
ts
Tra
nsec
t#6
80-S
191
019
160
ga
l.UL
VA,
Woo
d,S
hell
80-M
573
1959
225
ga
l.W
ood,
De
bris
,B
ott
les
40-N
248
5730
520
ga
l.W
ood,
Bo
ttle
s
20-N
210
1922
94
ga
l.W
ood,
De
tritu
s
10-N
229
1924
82
ga
l.W
ood
Chi
ps
Ave
rage
290
160
2321
313
161
Tra
nsec
t#7
100-
S57
057
4g
al.
ULVA
,W
ood
Chi
ps
100-
M38
038
2g
al.
De
tritu
s,W
orm
Tube
s
100-
N38
038
2g
al.
De
tritu
s
80-N
760
762
ga
l.D
etr
itus,
Woo
dC
hips
40-N
153
015
33
ga
l.W
ood
Chi
ps
20-N
114
011
44
ga
l.W
ood
10—
N19
1933
0.1
ga
l.D
etr
itus,
She
ll
Ave
rage
7147
.73
773
45
Gra
ndA
vera
ge79
122
612
8512
7’
1S
tatio
nnu
mbe
rsfo
rth
etr
an
s~ct
sin
dic
ate
dept
hin
met
ers
plus
loca
tion
whe
reN
=N
orth
,M
=M
iddl
e,S
Sou
th
2M
ean
1S
tand
ard
Div
iatio
n
N.S
.=
Not
Sam
pled

Ap
pe
nd
ixT
ab
le1
0.
Du
ng
en
ess
cra
bG
ard
ne
rd
urin
gd
en
sitie
sp
er
he
cta
reca
lcu
late
dfr
om
beam
tra
wl
ca
tch
es
inP
ort
Jun
e,
19
86
.
De
nsity/H
ecta
re1
Fe
ma
les
Ma
les
All
cra
bs
Su
bstr
ate
com
men
tsS
tatio
n
Na
vyD
isp
osa
lS
ite
(80
m)
Sta
tio
n1
Sta
tio
n2
Sta
tio
n3
375
543
431
245
0:~:
86
47 75 37
53÷
20
421
618
46
8
502
~10
3A
vera
ge
PSD
DA
Site
2(h
Orn
)
Sta
tio
n1
Sta
tio
n2
Sta
tio
n3
Ave
rag
e
40g
al.
50g
al.
10g
al.
1g
al.
1g
al.
1g
al.
woo
d,ca
ns,
cra
bs,
de
bris
woo
d,ca
ns,
cra
bs
woo
d,cra
bs,
de
bris
wo
od
,d
etr
itu
s
wor
mtu
be
s,
woo
d
woo
d,d
etr
itu
s
00
0
00
0
00
0
00
0
(13
0m
)PS
DD
AS
ite
1
Sta
tio
n1
Sta
tio
n2
Sta
tio
n3
Ave
rag
e
“3
0 0 0 0
0 0 0 0
0 0 0 0
2g
al.
wor
mtu
be
s,
de
trita
lke
lp
1g
al.
wor
mtu
be
s
2g
al.
wor
mtu
be
s
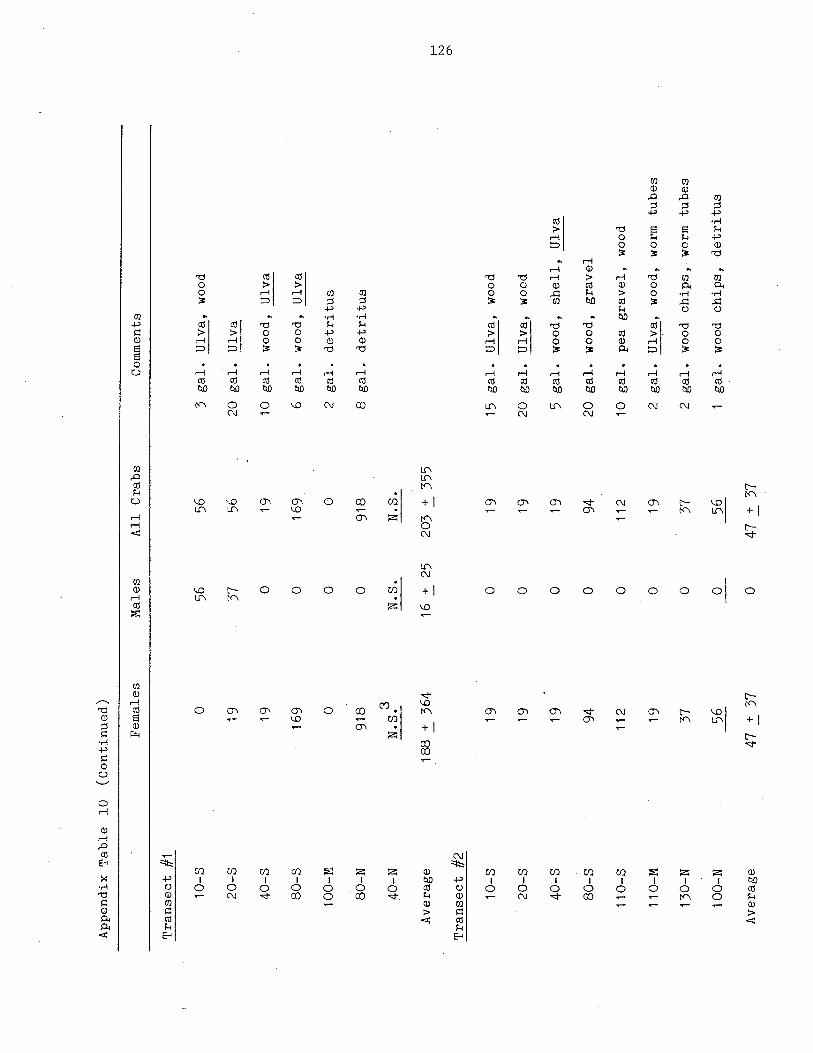
Ap
pe
nd
ixT
ab
le10
(Co
ntin
ue
d)
Fe
ma
les
Ma
les
All
Cra
bs
Com
men
ts
Tra
nse
ct
#1
10—
S0
5656
3g
al.
Ulv
a,
woo
d
20—
S19
3756
20g
al.
Ulv
a
40-S
190
1910
ga
l.w
ood,
Ulv
a
80-S
169
016
96
ga
l.w
ood,
Ulv
a
100-
M0
00
2g
al.
de
tritu
s
80—
N91
80
918
8g
al.
de
tritu
s
40-N
N.S
.3N
.S.
N.S
.
Ave
rag
e18
8÷
364
16+
2520
3+
355
Tra
nse
ct
#2
10
-519
019
15g
al.
Ulv
a,
woo
d
20
-S19
019
20g
al.
Ulv
a,
woo
d
40
-S19
019
5g
al.
woo
d,sh
ell,
Ulv
a
80—
594
094
20g
al.
wo
od
,g
rave
l
110—
511
20
112
10g
al.
pea
gra
ve
l,
110—
M19
019
2g
al.
IJlv
a,
woo
d,
130—
N37
037
2g
al.
woo
dch
ips,
10
0-N
560
561
ga
l.w
ood
ch
ips,
Ave
rag
e47
÷37
047
÷37
woo
d
wor
mtu
be
s
wor
mtu
be
s
de
tritu
s

Ap
pe
nd
ixT
ab
le10
(Co
ntin
ue
d)
Fe
ma
les
Tra
nse
ct
#3
Ma
les
All
cra
bs
Com
men
ts
10—
50
00
3g
al.
woo
d,U
lva
,sh
ell
20
-S37
037
25g
al.
woo
dch
ips,
Ulv
a
40—
S56
1975
15g
al.
woo
dch
ips
80—
S56
056
5g
al.
woo
dch
ips,
can
s,b
ott
les
110—
537
037
8g
al.
cla
yb
alls
130-
M0
00
1g
al.
woo
d,w
orm
tub
es
130—
N~0
00
2g
al.
wo
od
,w
orm
tub
es,
ke
lp
Ave
rag
e27
÷26
3+
729
±30
Tra
nse
ct
#4
10—
S19
3756
3g
al.
Ulv
a,
de
tritu
s
20—
S0
3737
15g
al.
woo
d,U
lva
,sh
ell
40—
S56
1975
30g
al.
woo
d,b
ott
les
80
-S75
075
4g
al.
woo
d,ca
ns
110—
S37
1956
2g
al.
pea
gra
ve
l,w
ood
145—
S0
00
2g
al.
wor
mtu
be
s,
woo
d
135—
N0
~0
01
ga
l.w
orm
tub
es,
he
art
urc
hin
s
Ave
rag
e27
±30
16+
1~1
43±
32

Ap
pe
nd
ixT
ab
le10
(Co
ntin
ue
d)
Fe
ma
les
Ma
les
All
cra
bs
Com
men
ts
Tra
nse
ct
#5
20—
S94
3713
1
40—
S75
075
80—
S56
056
110—
S19
019
16
5-S
00
0
20g
al.
pea
gra
ve
l,U
lva
40g
al.
woo
d,b
ott
les,
gra
ve
l,d
eb
ris
25g
al.
wo
od
,b
ott
les,
gra
ve
l
3g
al.
wor
mtu
be
s,
woo
d,pe
ag
rave
l
2g
al.
wor
mtu
be
s,
woo
d,h
ea
rtu
rch
ins
2g
al.
wor
mtu
be
s,
he
art
urc
hin
s14
5-M
00
0
Ave
rag
e41
+40
6÷
1547
±51
Tra
nse
ct
#6
80
-S56
1975
80—
M26
20
262
40
-N20
60
206
20
-N28
119
300
10
-N11
219
131
Ave
rag
e18
3±
9711
÷10
195
±92
50g
al.
15g
al.
20g
al.
4g
al.
3g
al.
woo
d
woo
d,ca
ns
woo
d
woo
dch
ips
bo
ttle
s,
woo
d
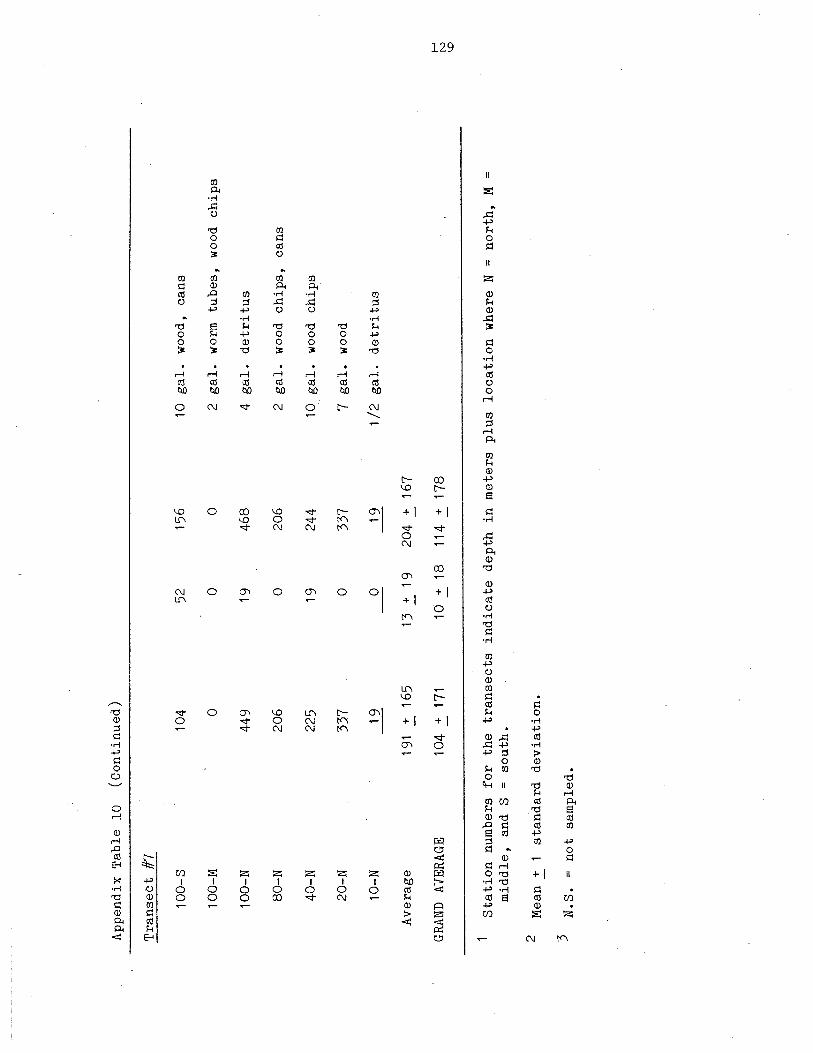
Ap
pe
nd
ixT
ab
le10
(Co
ntin
ue
d)
Tra
nse
ct
#7
100—
S10
452
156
10g
al.
wo
od
,ca
ns
100-
M0
00
2g
al.
wor
mtu
be
s,
woo
dch
ips
100—
N44
919
468
4g
al.
de
tritu
s
80—
N20
60
206
2g
al.
woo
dch
ips,
can
s
40—
N22
519
244
10g
al.
woo
dch
ips
20—
N33
70
337
7g
al.
woo
d
10—
N19
019
1/2
ga
l.d
etr
itu
s
Ave
rag
e19
1+
165
13+
1920
4+
167
GRAN
DA7
ERAG
E10
4+
171
10÷
1811
4+
178
1S
tatio
nn
um
be
rsfo
rth
etr
an
se
cts
ind
ica
ted
ep
thin
me
ters
plu
slo
ca
tio
nw
he
reN
no
rth
,M
=
mid
dle
,an
dS
so
uth
.
2M
ean
-~1
sta
nd
ard
de
via
tio
n.
-~N
.S.
=n
ot
sam
ple
d.

App
endi
xTa
ble
II.
Dunq
enes
scr
abde
nsiti
espe
rhe
ctar
eca
lcul
ated
from
beam
traw
lca
tche
sin
Por
tG
ardn
erdu
ring
Sept
embe
r,19
86.
Sta
tion
num
bers
for
the
tran
sect
sin
dica
tede
pth
inm
eter
spl
uslo
catio
nw
here
N=N
orth
,M
=Mid
dle,
and
S=So
uth.
The
aver
ages
are
mea
ns+
1st
anda
rdde
viat
ion.
Den
sity
/Hec
tare
Sta
tion
Fem
ales
Mal
esA
llC
rabs
Sub
stra
teCo
,mne
nts
Nav
yD
ispo
sal
Site
(80m
)
Sta
tion
1S
tatio
n2
Sta
tion
3
00
570
190
9520
ga
l.w
ood,
debr
is11
510
ga
l.w
ood,
debr
is19
1g
al.
woo
d,de
bris
15g
al.
wood
1g
al.
worm
tube
swo
odch
ips
2g
al.
woo
d,sh
ell
1g
al.
worm
tube
s,sh
ell
1g
al.
worm
tube
s,sh
ell
0.5
ga
l.wo
rmtu
bes,
wood
Ave
rage
Tra
nsec
t#1
25±
290
25
±2
9
10-S
20-S
40-S
00-S
100-
M80
-N40
-N
Ave
rage
1938
5719
191
024
819
950
00
—no
tsa
mpl
ed
57 76 191
267 95 0
114
±9~
Sta
tion
1S
tatio
n2
Sta
tion
3
Ave
rage
95 115 19
0 0 0
PSDD
A2
(hO
rn)
Sta
tion
1S
tatio
n2
Sta
tion
3
Ave
rage
PSDD
A1.
(130
m)
76
+5
10
76
+5
1
•19
019
190
190
00
13+
110
13±
11
C
0 57 19
3g
al.
alga
e,w
ood,
de
tritu
s
30g
al.
alga
e,wo
od15
ga
l.w
ood,
alga
e20
ga
l.w
ood,
debr
is5
ga
l.w
ood,
debr
is
102±
991
3±
16
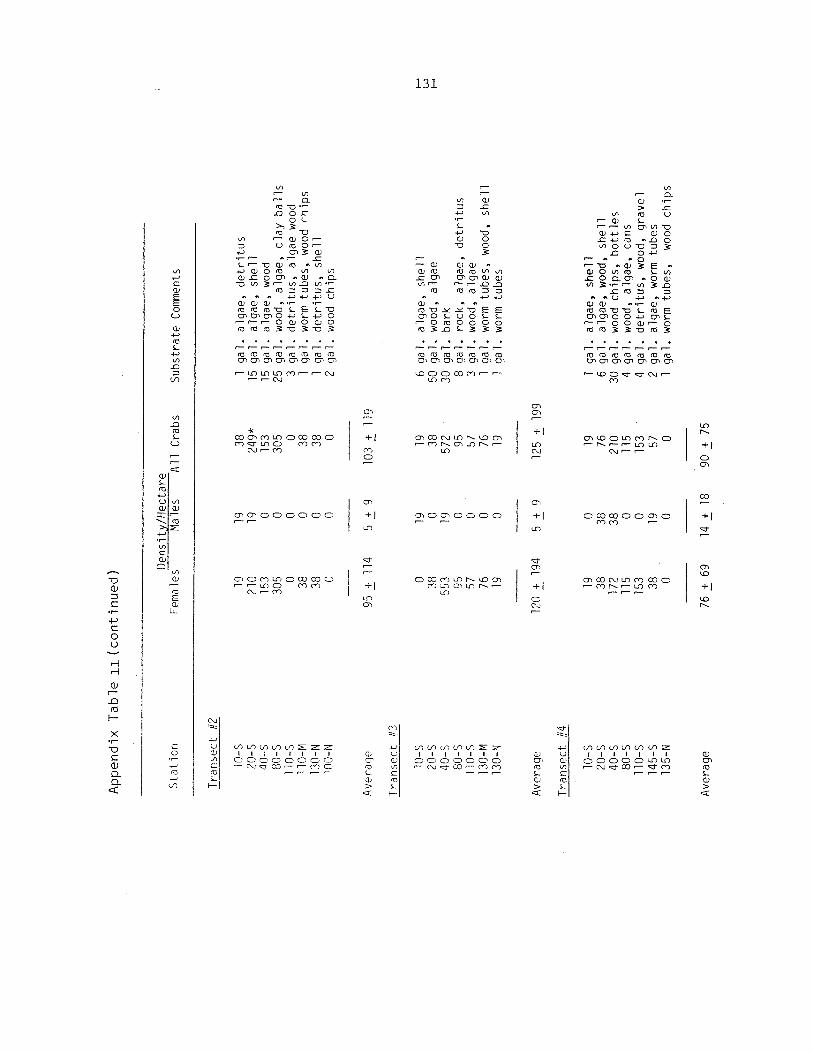
Ap
pe
nd
ixT
ab
leii
(co
ntin
ue
d)
Den
sity
/Hec
tare
Sta
tion
Fem
ales
Mal
esA
llC
rabs
Sub
stra
teCo
mm
ents
Tra
nsec
tff2
10—
S19
1938
1g
al.
alga
e,d
etr
itus
20—
S21
019
249*
15g
al.
alga
e,sh
ell
40—
S15
30
153
15g
al.
alga
e,wo
od80
-S30
50
305
25g
al.
woo
d,al
gae,
cla
yb
alls
110-
S0
00
3g
al.
de
tritu
s,al
gae
wood
ll0-M
380
381
ga
l.wo
rmtu
bes,
wood
rhip
s13
0—N
380
381
ga
l.d
etr
itu
s,
she
ll10
0-N
00
02
ga
l.wo
odch
ips
Ave
rage
95÷
114
5+
910
3±
119
Tra
nsec
tff3
10—
S0
1919
6g
al.
alga
e,sh
ell
20-5
380
3850
ga
l.w
ood,
alga
e40
—S
553
1957
230
ga
l.ba
rk80
-S95
095
8g
al.
rock
,al
gae,
de
tritu
s11
0—5
570
573
ga
l.w
ood,
alga
e13
0-M
760
761
ga
l.wo
rmtu
bes,
woo
d,sh
ell
130-
N19
019
1g
al.
worm
tube
s
Ave
rage
120
+19
45
±9
125
±19
9
Tra
nsec
tff4
10—
S19
019
1g
al.
alga
e,sh
ell
20—
538
3876
6g
al.
alga
e,w
ood,
she
ll40
-S17
238
210
30g
al.
wood
chip
s,b
ott
les
80—
S11
50
115
4g
al.
woo
d,al
gae,
cans
110—
515
30
153
4g
al.
de
tritu
s,w
ood,
grav
el14
5—S
3819
572
ga
l.al
gae,
worm
tube
s13
5-N
00
01
ga
l.wo
rmtu
bes,
wood
chip
s
Ave
rage
76+
6914
÷18
90÷
75

App
endi
xT
able
ii(c
on
tinu
ed
)
De
nsi
ty/H
ect
are
Sta
tion
Fem
ales
Mal
esA
llC
rabs
Sub
stra
teCo
mm
ents
Tra
nsec
t#5
20—
S76
5713
320
ga
l.al
gae,
gra
vel,
woo
d,sh
ell
40-S
496
5755
330
ga
l.w
ood,
rock
,al
gae
80—
S95
1911
440
ga
l.w
ood,
alga
e,ro
ck,
de
bris
110—
S15
30
153
3g
al.
woo
d,d
etr
itu
s16
5-S
00
01
ga
l.wo
rmtu
bes
145-
M0
00
1g
al.
worm
tube
s
Ave
rage
137
±18
622
÷28
159
±20
4
Tra
nsec
t#6
80-S
7619
9550
ga
l.al
gae,
woo
d,ca
ns80
-M19
10
191
20g
al.
woo
d,d
eb
ris,
cans
40-N
760
7610
ga
l.w
ood,
de
bris
20—
N19
019
2g
al.
woo
d,d
etr
itu
s10
-N38
038
1g
al.
de
tritu
s,
woo
d
Ave
rage
80±
674
±8
84
+6
7
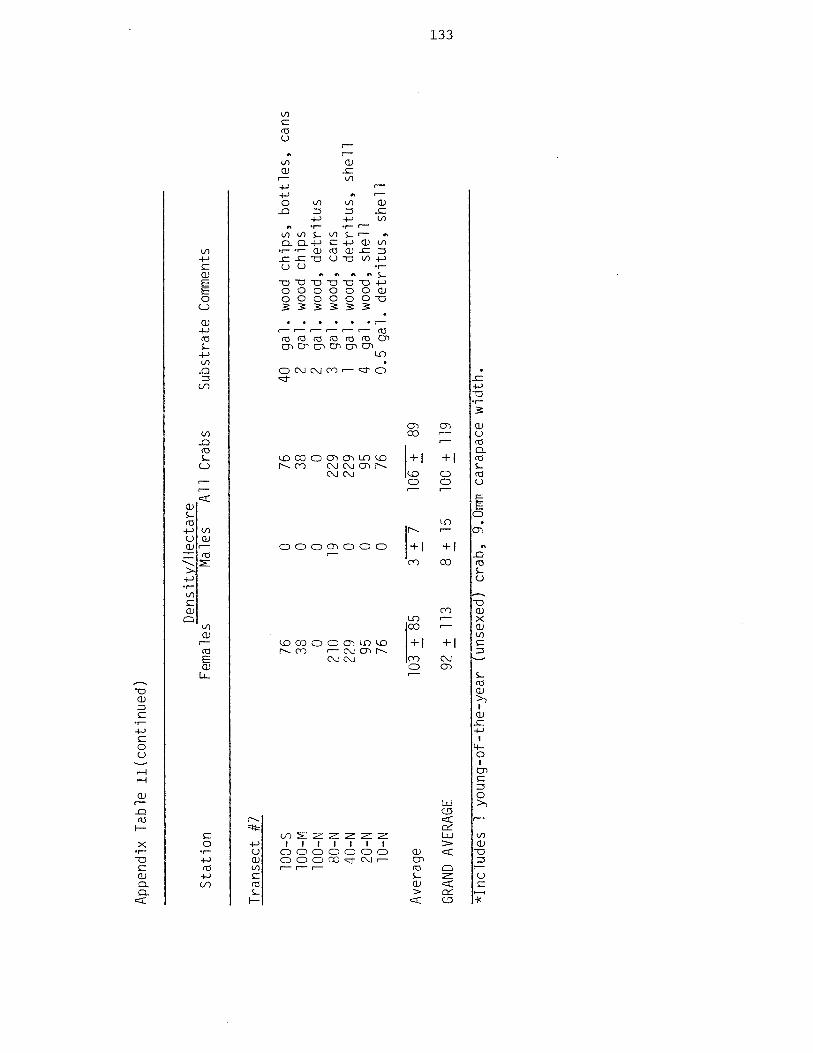
App
endi
xT
able
ii(co
ntin
ue
d)
Den
sity
/He
cta
reS
tatio
nFe
mal
esM
ales
All
Cra
bsS
ubst
rate
Com
men
ts
Tra
nsec
t#7
100—
S76
076
40g
al.
wood
chip
s,b
ott
les,
cans
lOO
-M38
038
2g
al.
wood
chip
s10
0-N
00
02
ga
l.w
ood,
de
tritu
s80
-N21
019
229
3g
al.
woo
d,ca
ns40
-N22
90
229
1g
al.
woo
d,d
etr
itu
s,
she
ll20
-N95
095
4g
al.
woo
d,sh
ell
10-N
760
760.
5g
al.
de
tritu
s,
she
ll
Ave
rage
103
±85
3±
710
6-I-
89
GRAN
DAV
ERAG
E92
+11
38
÷15
100
÷11
9
~Fri~
TiTJ
é~1
youn
g—of
—th
e-ye
ar(u
nsex
ed)
crab
,9.
0mm
cara
pace
wid
th.

App
endi
xT
able
12.
Dun
gene
sscr
abd
en
sitie
spe
rhe
ctar
eca
lcu
late
dfr
ombe
amtr
aw
lca
tche
sat
ext
rast
atio
ns
inP
ort
Gar
dner
du
ring
Sep
tem
ber,
1986
.Th
eav
erag
esar
em
eans
±1
stan
dard
de
via
tion
.
Den
sity
/He
cta
reS
tatio
nFe
mal
esM
ales
All
Cra
bsS
ubst
rate
Con
nien
ts
Eas
to
fPS
DDA
Site
1.
Sta
tion
G(1
30m
)S
tatio
nH
(130
m)
Bet
wee
nM
uki
lteo
and
Pic
nic
Poi
nt
Wes
to
fN
avy
Site
Sta
tion
A(1
05m
)19
019
8g
al.
wood
chip
sS
tatio
nB
(llO
m)
00
01
ga
l.wo
rmtu
bes,
wood
Sta
tion
C(
90m
)38
038
1g
al.
de
tritu
s,
wood
chip
sS
tatio
n0
(lO5m
)38
038
1g
al.
de
tritu
s,
wood
chip
sS
tatio
nE
(115
rn)
00
01
ga
l.wo
rmtu
bes,
wood
Sta
tion
F(h
Orn
)38
038
7g
al.
woo
d,d
eb
ris
Ave
rage
22±
190
22±
19
190
193
ga
l.w
ood,
she
ll0
00
4g
al.
woo
d,sh
ell
Sta
tion
1-
40m
190
193
ga
l.w
ood,
de
tritu
sS
tatio
n2
-40
m0
00
5g
al.
woo
d,al
gae
Sta
tion
3—
40m
00
05
ga
l.w
ood,
alga
e,b
ott
les
Sta
tion
4—
lOm
00
010
ga
l.sa
nd,
alga
eS
tatio
n4
-20
m38
038
3g
al.
alga
eS
tatio
n4
-40
m0
00
5g
al.
cla
yb
alls
,al
gae
Sta
tion
4-
80m
00
020
ga
l.cl
ay
ba
lls,
alga
e
8÷
158
+15
Ave
rage
0
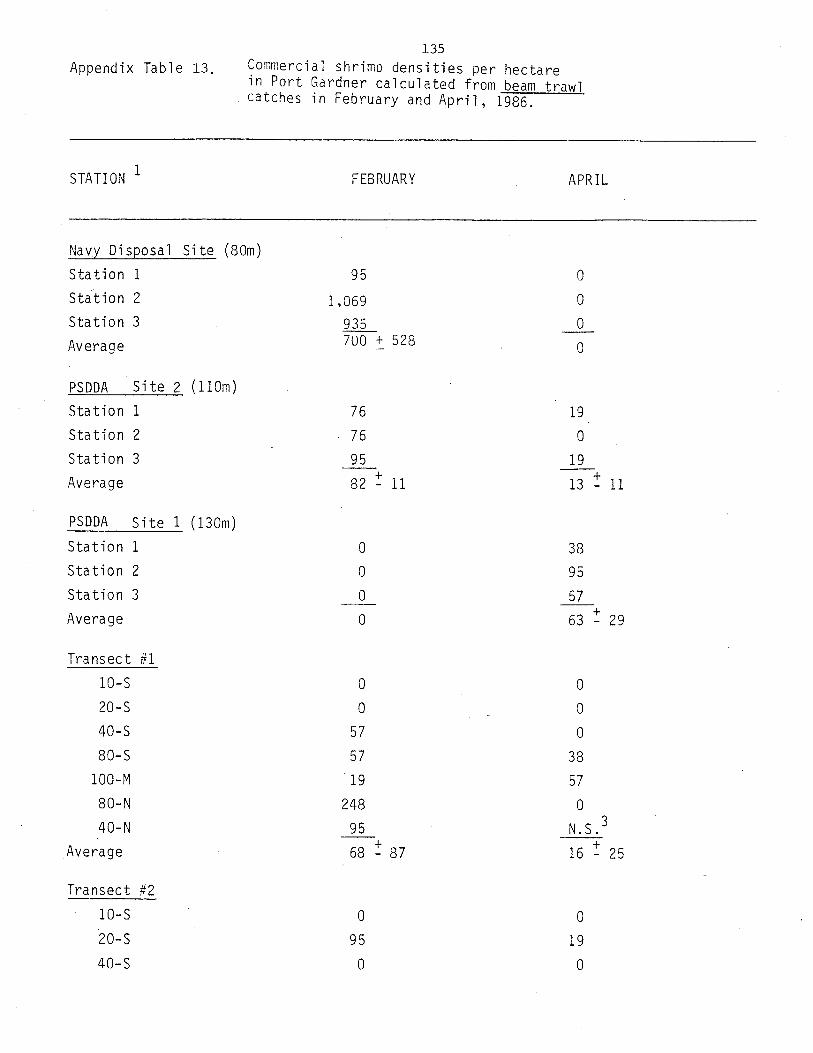
135Appendix Table 13. Commercial shrimp densities per hectare
in Port Gardner calculated from beam trawlcatches in February and April, 1986.
STATION 1 FEBRUARY APRIL
Navy Disposal Site (80m)
Station 1 95 0
Station 2 1,069 0
Station 3 935 0
Average 700 ~ 528 o
PSDDA Site 2 (ilOm)
Station 1 76 19
Station 2 76 0
Station 3 95 19
Average 82 11 13 11
PSDDA Site 1 (130m)
Station 1 0 38
Station 2 0 95
Station 3 0 57+Average 0 63 - 29
Transect #1
10-S 0 0
20-S 0 0
40-S 57 0
80-S 57 38
100-M 19 57
80-N 248 0
40-N 95 N.S.3
Average 68 87 16
Transect #2
10-S 0 0
20-S 95 19
40-S 0 0

136
Appendix Table 13. Commercial shrimp densities per hectarein Port Gardner calculated from beam trawl
(Cont’d.) catches in February and April, 1986.
STATION 1 FEBRUARY APRIL
Transect #2
80-S 229 0
110—S 57 191lO-M 38 19
130-N 76 19
100-N 267 19
Average 95 100 12 10
Transect #3
10-s 0 0
20-S. 0 0
40-S . 0 0
80-S . 0 0
110-S 134 57
130—M 76 .19
130-N 57 19
Average 38 53 14 21
Transect #4
10-S 95 0
20-S 0 . 0
40-S 19 0
80-S 191 0
110—S 115 115
• 145—S 76 38
135-N 95 0
Average - 84 63 22 + 43
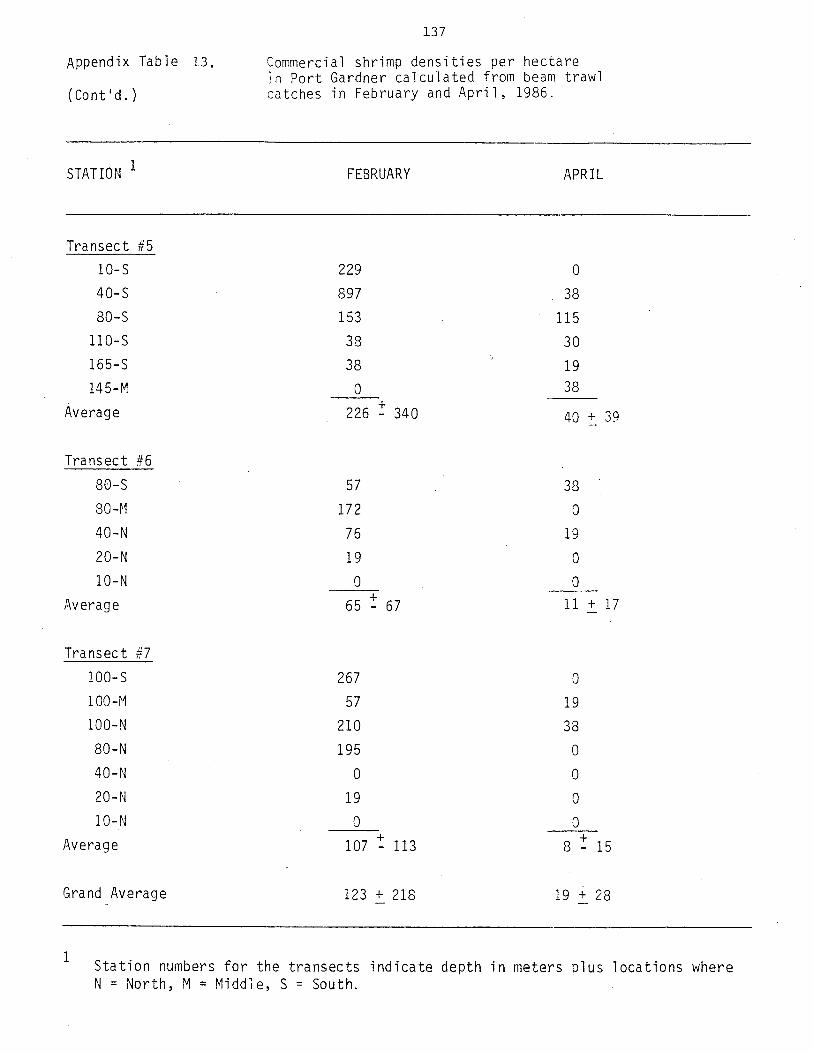
137
Appendix Table 13. Commercial shrimp densities per hectarein Port Gardner calculated from beam trawl
(Cont’d.) catches in February and April, 1986.
STATION 1 FEBRUARY APRIL
Transect #5
10-S 229 0
40-S 897 38
80—S 153 115
110-S 38 30
165-S 38 19
145-N 0 38
Average 226 340 40 ± 39
Transect #6
80-S 57 38
80-M 172 0
40-N 76 19
20-N 19 0
10-N 0 0.
Average 65 67 11 + 17
Transect #7
100-S 267 0
100-N 57 19
100-N 210 38
80-N 195 0
40-N 0 0
20-N 19 0
10-N 0 0
Average 107 113 8 15
Grand Average 123 + 218 19 + 28
1 Station numbers for the transects indicate depth in meters plus locations where
N North, M = Middle, S South.

peLdw~S~°NSN
UOL3~LALOp~A~pu~sI-
‘9861‘[pd~pu~A~AenJqe~UI(p1~uo~)[M~J~w~qwo~jP~P~flDLPDU~~P9~°dUL
a~r~~sei~isuepdwi~i~sL~D~WWODIe[qPJx~puedd~
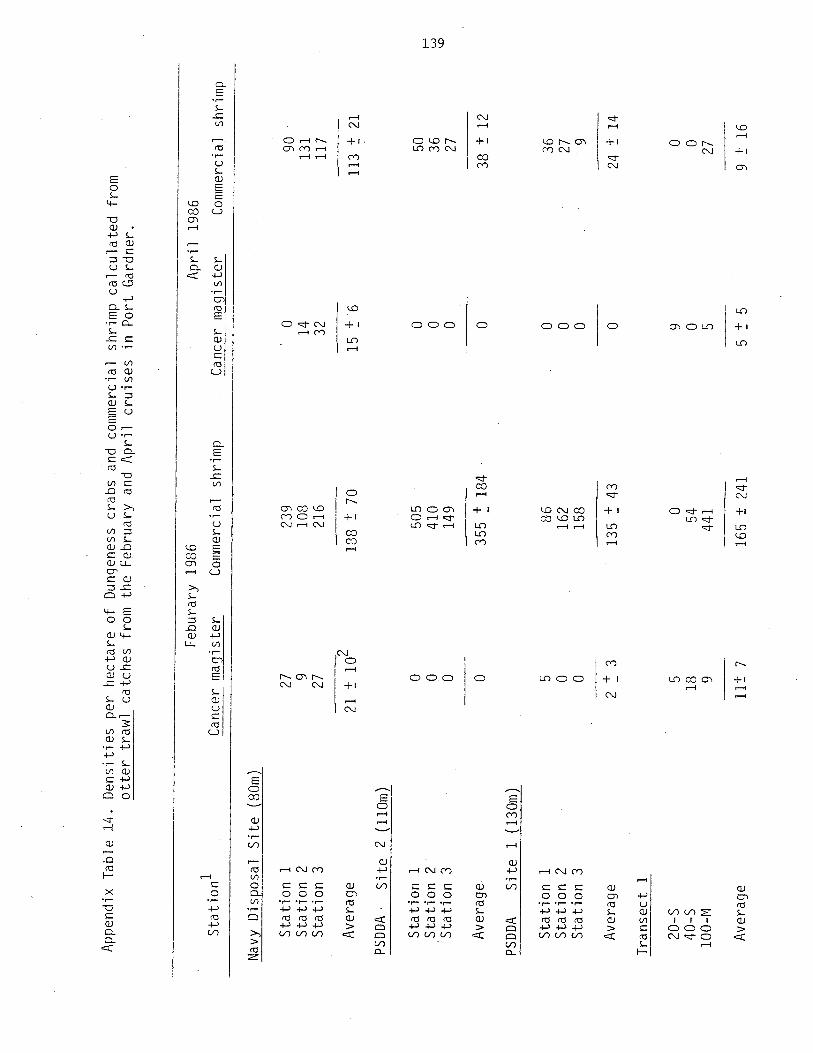
App
endi
xTa
ble
14.
De
nsi
ties
per
hect
are
of
Dun
gene
sscr
abs
and
com
mer
cial
shrim
pca
lcu
late
dfr
omo
tte
rtr
awl
catc
hes
from
the
Feb
ruar
yan
dA
pril
cru
ise
sin
Por
tG
ardn
er.
Feb
urar
y19
86A
pril
1986
Sta
tion
’C
ance
rm
apis
ter
Com
mer
cial
shrim
pC
ance
rm
agis
ter
Com
mer
cial
shrim
p
Nav
yD
ispo
sal
Site
(SO
m)
Sta
tion
1S
tatio
n2
Sta
tion
3
Ave
rage
Sta
tion
1S
tatio
n2
Sta
tion
3
Ave
rage
20-S
40-S
100-
N
27 9 27
21±
io2
5 18 9
239
108
216
188
±70
505
410
149 86 1,62
158
135
~43
0 54 441
0 14 32
15~
6
9 0 5
50 36 27
38±
12
36 27 9
24±
14
0 0 27
PSDD
AS
ite2
(hO
rn)
Sta
tion
1S
tatio
n2
Sta
tion
3
Ave
rage
.
PSDD
AS
ite1
(130
m)
90 131
117
113
±21
0 0 0 0 5 0 0
2t3
355
~18
4
Tra
nsec
t1
U)
0 0 0~
0 0 0 0 0
Ave
rage
11±
71
65
±2
41
5±
59
±16
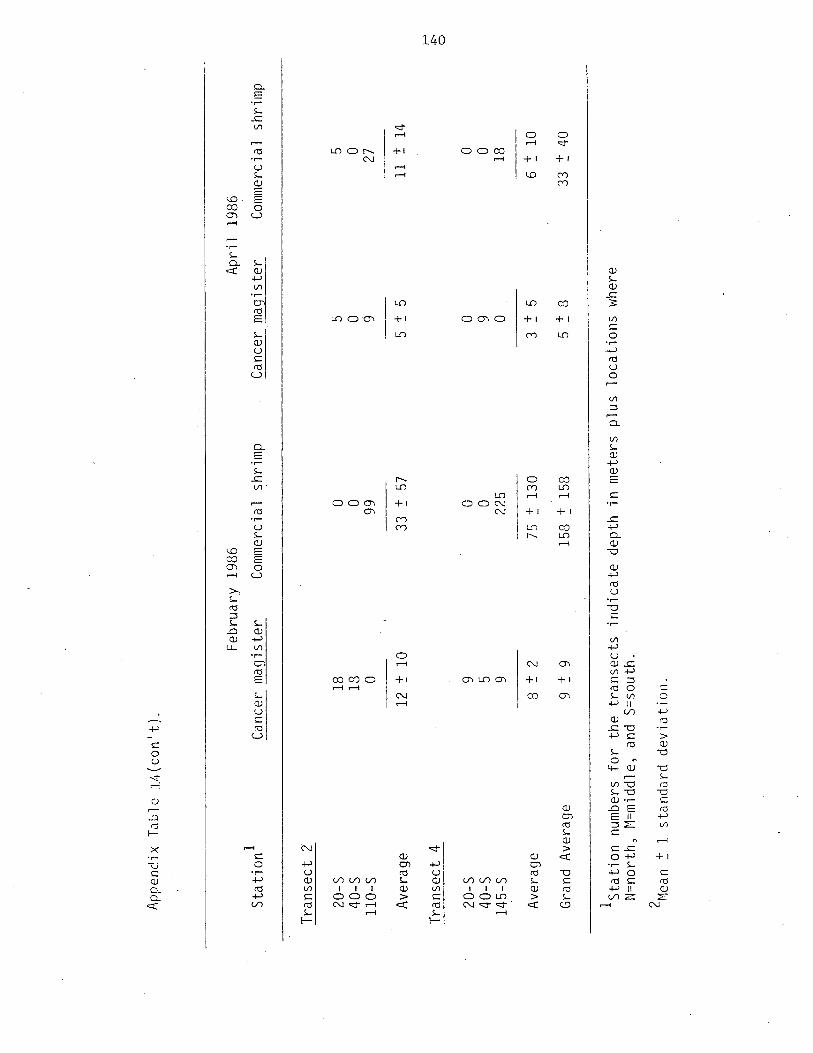
App
endi
xT
hble
14
(co
n’t).
Feb
ruar
y19
86A
pril
1986
Sta
tion
1C
ance
rm
agis
ter
Com
mer
cial
shrim
pC
ance
rm
agis
ter
Com
mer
cial
shrim
p
Tra
nsec
t2
20—
S18
05
540
-SiS
00
011
0—S
099
927
Ave
rage
12±
1033
±57
5±
5ii
±14
Tra
nsec
t4
C
20-S
90
00
40-5
50
90
145-
S9
225
018
Ave
rage
8±
275
±13
03
±5
6~
10
Gra
ndA
vera
ge9
±9
158
~15
85
~8
33±
40
‘Sta
tion
num
bers
for
the
tra
nse
cts
ind
ica
tede
pth
inm
eter
spl
uslo
catio
ns
whe
reN
=nor
th,
M=m
iddl
e,an
dS
=sou
th.
2Mea
n±
1st
anda
rdd
evi
atio
n.

Station1
Navy Site (8Cm)
Station 1
Station 2
Station 3
Average
PSODA Site
Station
Station
Station
Ave rage
PSDDA Site
Station
Station
Station
Average
Transect #1
20-S
40-S
100-M
Average
Transect #2 -
20-S
40-S
110—S
Average
9 0 9
14 4 18
0 0 0
7÷72 1±2 9+9
4 0 4
0 0 0
0 0 0
1÷2 0 1+2
1
0 0 0
2 0 0 0
3 -~ -~ -~
0 0 0
0 0 0
0 4 4
18 4 22
6÷10 3÷2 9~12
•0 0 0
4 0 4
14 0 14
6÷7 0 6÷7
141
Appendix Table 15. Dungeness crab densities per hectare calculated from ottertrawl catches in Port Gardner in June and early July,1986.
Density/HectareFemales Males All crabs
2 (11Cm)
2
3
(13Cm)

142
Appendix Table 15 (Continued)
Station Females Males All crabs
Transect #4
20-S 0 0 0
40-S 0 0 0
145-S 0 0 0
Average 0 0 0
Grand Average 4 ÷ 6 1 ÷ 2 4 ÷ 7
1 Station numbers for the transects indicate depth in meters plus
locations where S = south and M = middle.
2 Mean ÷ 1 standard deviation.

143
19 9
o 0
o 42
6±11 4:~_5
o 228
o 41
o 23
o 117+148
o 131
19 59
o 50
6÷11 80±44
0 N.S.
19 O~
19 0
75 N.S.
0 221
0 N.S.
____ N.S.
19÷29 ~74÷ 128
Appendix Table 16. Commercial shrimp densities per hectare calculatedfrom beam and otter trawis in Port Gardner in Juneand early July, 1986.
Density/HectareBeam trawl Otter trawlStation1
Navy Disposal Site (80m)
Station 1
Station 2
Station 3
Average
PSDDA Site 2 (hOrn)
Station 1
Station 2
Station 3
Average
PSDDA Site I (130m)
Station 1
Station 2
Station 3
Average
Transect #1
10-S
20—S
40-S
80-S
1 O0-M
80-N
40-N
Average

144
Appendix Table 16 (Continued)
Station Beam trawl Otter trawl
Transect #2
10-S 0 - N.S.
20—S 19 0
40—S 19 0
80-S 0 N.S.
110—S - 75 27
110-M 0 N.S.
130—M 0 N.S.
100-N 0 N.S.
Average 14 + 26 9 ~ 16
Transect #3
10-S 0 N.S.
20-S 0 N.S.
40-5 0 N.S.
80-S 0 N.S.
110-5 0 N.S.
130-M 19 N.S.
130-N - 0 N.S.
Average --
Transect #4
10-S 0 N,S.
20-S 0 0
40-S 0 4
80-S 0 N.S.
110-S 0 N.S.

145
Appendix Table 16 (Continued)
Station Beam trawl Otter trawl
Transect #4 — Continued V
145-S ~0 36
135—N N.S.
Average 5 j. 14 13 + 20
Transect #5
20-S 0 N.S.
40-S 787 N.S.
80-S 281 N.S.
110—S 19 N.S.
165—S 19 N.S.
145-M 0 N.S.
Average 184 ÷ 315
Transect #6
80—5 112 N.S.
80-M 19 N.S.
40-N 19 N.S.
20-N 0 V N.S.
10-N 0 NS
Average 30 + 47 V --
Transect #7
100-S 0 V N.S.
100-M 0 N.S.
100—N V 56 N.S.
80-N 19 V N.S.
40-N 0 N.S.
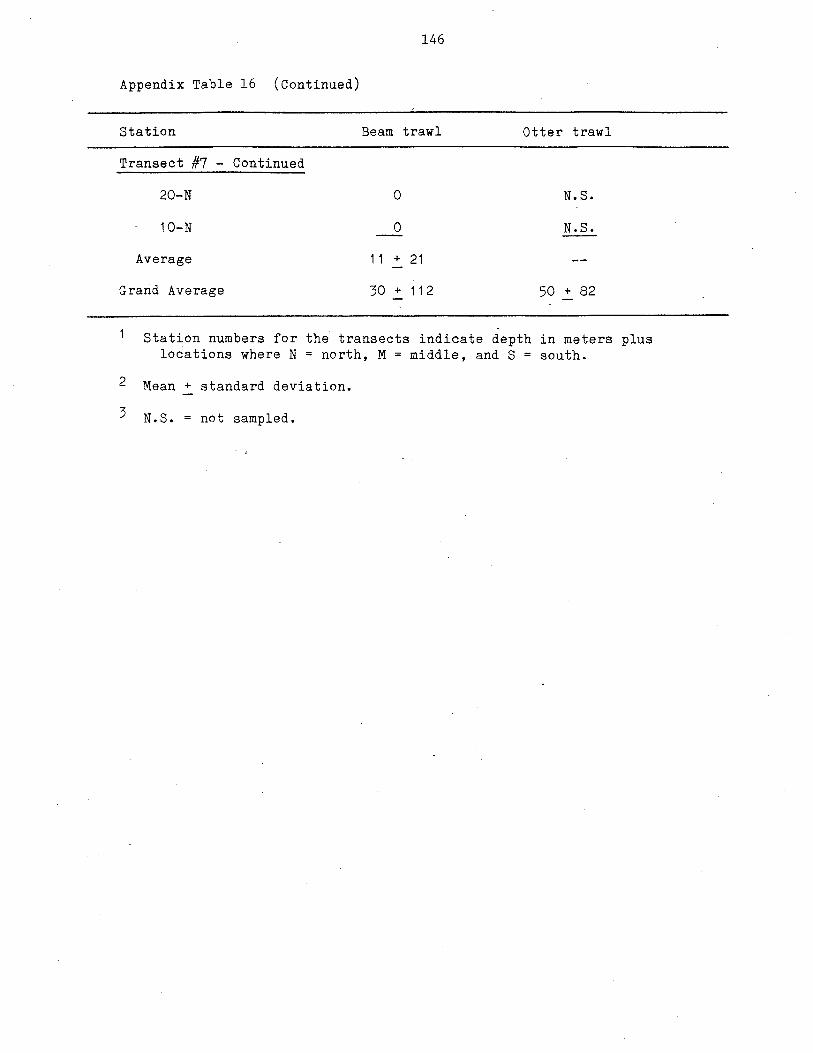
Appendix Table 16 (Continued)
146
1 Station numbers for the transects indicate depth in meters pluslocations where N north, M = middle, and S = south.
2 Mean + standard deviation.
N.S. = not sampled.
Station
Transect #7 — Continued
Beam trawl Otter trawl
20—N 0 N.S.
~ 10—N 0 N.S.
Average 11 4- 21 -—
Grand Average 30 ÷ 112 50 -~- 82

147
Appendix Table 17. Shrimp densities per hectare calculated from both beam andotter trawl catches in Port Gardner during September, 1986.Station numbers for the transects indicate depths in metersand location where N = North, S = South, E = East, and W =
West. The averages are means + 1 standard deviation.N.S. = not sampled. Estimated crab densities are also givenfor the otter trawl.
Beam Trawl Otter Trawl
Station Shrimp/hectare Shrimp/hectare Crab/hectare
Navy Disposal Site (80 m)
Station 1 581 387 5Station 2 169 536 0Station 3 131 405 0
Average 294 ÷ 250 443 + 81 2 ÷ 3
PSDDA~ Site 2 (110 m)
Station 1 19 77 14Station 2 0 72 18Station 3 0 108 27
Average 6 ± 11 86 ÷ 20 20 + 7
PSDDA Site 1 (130 m)
Station 1 19 81 9Station 2 38 104 14Station 3 38 117 5
Average 32 + 11 101 ± 18 12 + 4
Transect #1
10-S 0 N.S. N.S.20-S 375 0 040-S 1760 5 980-S 375 N.S. N.S.
100-N 187 198 080-N 131 N.S. N.S.40-N ~ N.S. N.S.
Average 471 + 648 68 ± 113 3 ± 5

148
Transect #2
1 0-S20-S40-S80-S
110—S1 l0-M1 30-N1 00-N
Transect #3
10—S20-S40-S80-S
110-S1 30-M1 30-N
Transect #4
10-S20—S40-S80-S
110-S145—S135—N
Transect #5
20-S40-S80-S
110-S165—S145-M
Average
0300356730
38193838
00
131206
387556
056
0755656
0
0150936131
075
N.S.68
N.S.N.S.N.S.
23 + 39
N.S.N.S.N.S.N.S.N.S.N.S.N.S.
NS.N.S.N.S.N.S.N.S.N.S.
N.S.1818
N.S.5
N.S.N.S.N.S.
14 ± 8
N.S.N.S.N.S.N.S.N.S.N.S.N.S.
N.S.95
N.S.N.S.
0N.S.
5+5
N.S.N.S.N.S.N.S.N.S.N.S.
Appendix Table 17 (cont.)
Beam Trawl Otter Trawl
Station Shrimp/hectare Shrimp/hectare Crab/hectare
N.S.00
190 + 258Average
Ave rage 72 ± 74
N.S.05
N.S.N.S.
45N.S.
17 + 2555 t~ 33
Average 215 ~i:~ 359
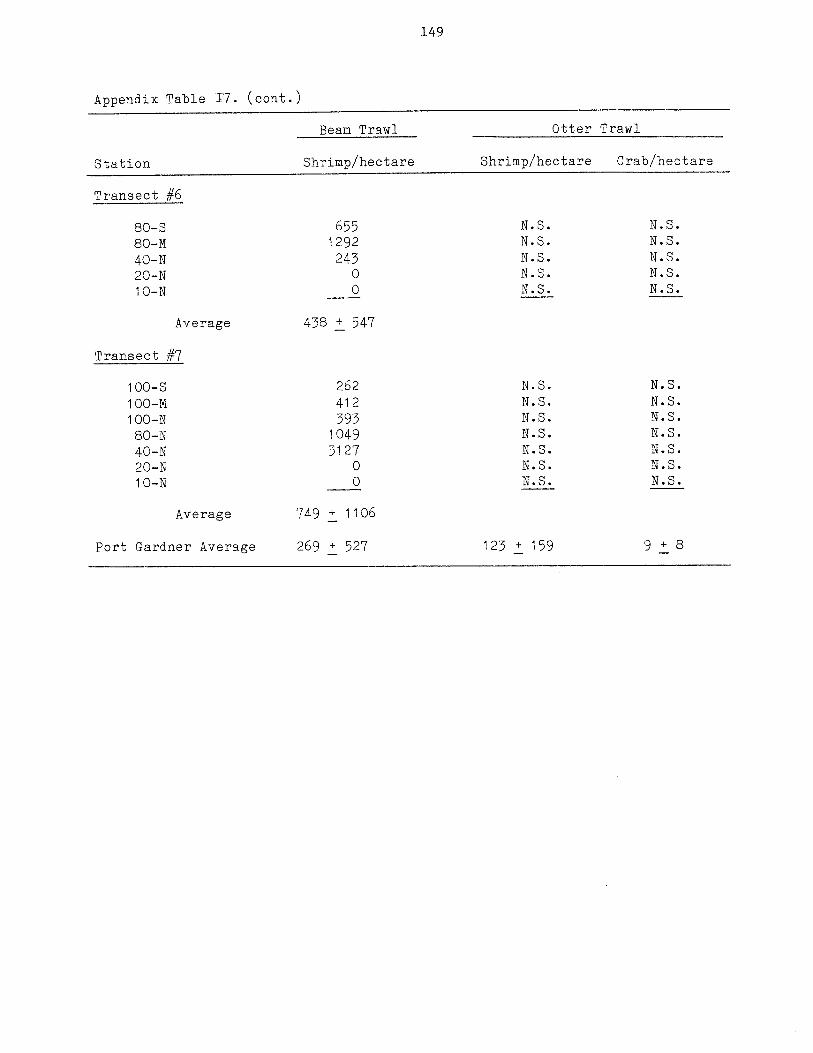
149
Transect #6
6551292
24300
N.S.N.S.N.S.N.S.N.S.
N.S.N.S.N.S.N.S.N.S.
Transect #7
100_S100-M100-N80-N40- N20-N10-N
262412393
10493127
00
749 :~:~ 1106
N.S.N.S.N.S.N.S.N.S.N.S.N.S.
N.S.N.S.N.S.N.S.N.S.N.S.N.S.
Appendix Table 17. (cant.)
Beam Trawl Otter Trawl
Station Shrimp/hectare Shrimp/hectare Crab/hectare
80-S80-M40-N20-N10-N
438 .i: 547Average
Average
Port Gardner Average 269 ± 527 123 ÷ 159 9+8
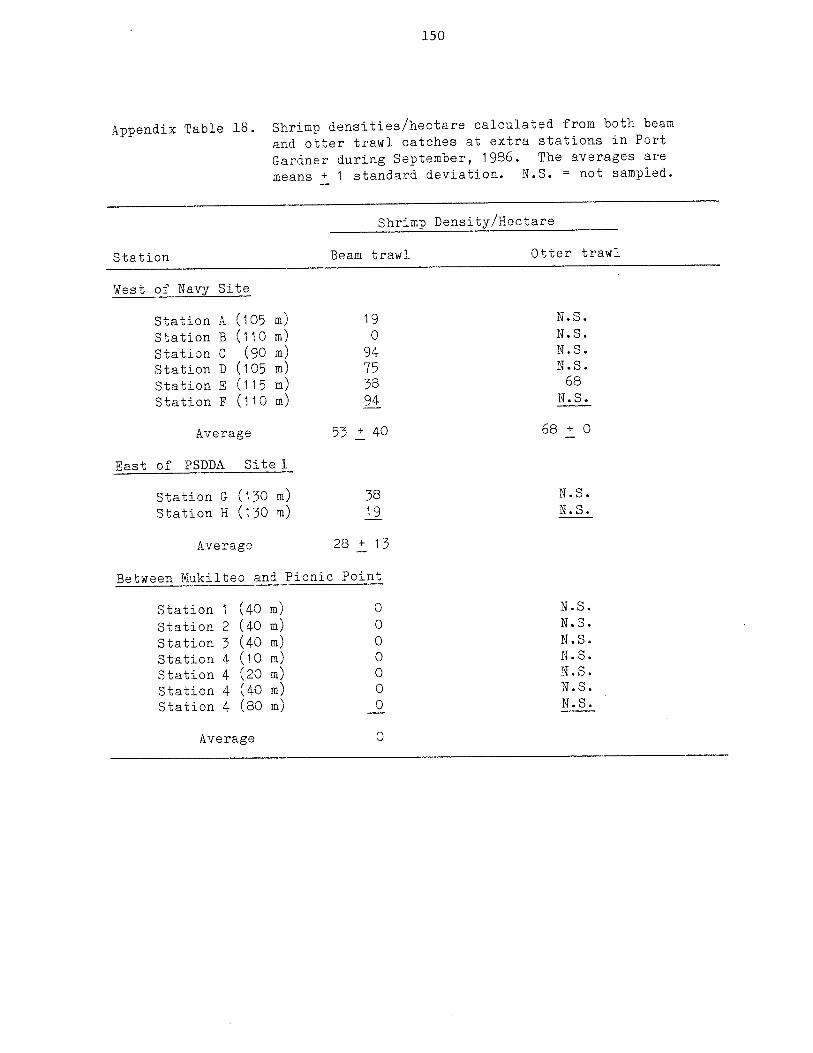
150
Appendix Table 16. Shrimp densities/heCtare calculated from both beamand otter trawl catches at extra stations in PortGardner during September, 1986. The averages aremeans ÷ 1 standard deviation. N.S. = not sampled.
Shrimp Density/Hectare
Station Beam trawl Otter trawl
West of Navy Site
Station A (105 m) 19 N.S.Station B (110 in) 0 N.S.Station C (90 m) 94 N.S.Station D (105 in) 75 N.S.Station E (115 m) 38 68Station F (110 m) 94 N.S.
Average 53 ÷ 40 68 ÷ 0
East of PSDDA Site 1
Station G (130 m) 38 N.S.Station H (130 in) 19 N.S.
Average 28 + 13
Between Mukilteo and Picnic Point
Station 1 (40 m) 0 N.S.Station 2 (40 m) 0 N.S.Station 3 (40 m) 0 N.S.Station 4 (10 m) 0 N.S.Station 4 (20 m) 0 N.S.Station 4 (40 m) 0 N.S.Station 4 (80 m) 0 N.S.
Average 0

IIniva
XI~IN~~dV
tci

152
APPENDIX A
Analyses of fish data collected by
beam trawla in Commencement Bay, Elliott Bay
and Saratoga Passage during 1986.

153
Commencement Bay
Abundance and biomass. The samples collected during the summer cruise
were the only ones available for analyses. Abundance values ranged from 1 to
43 individuals per location, while biomass values ranged from 45 to 4,191
grams per location (Appendix A, Table 1). At locations where fish were
captured, the two PSDDA sites had by far the lowest value of either measure.
Sample sizes were too small to determine dominant species at each site.
Species richness. Species richness values ranged from 1 to 8 showing a
similar pattern to the abundance and biomass results. The deeper PSDDA sites
had the lowest values. The 20 m station had a much higher value (Appendix A,
Table 1).
Species diversity. Species diversity values ranged from 0.0 to 0.71
(Appendix A, Table 1). The distribution of values among sites was identical
to species richness. The deeper PSDDA sites had the lowest values, while the
20-m station had the highest value.
Elliott Bay
Abundance and biomass. Total abundance ranged from 5 to 22 fish per
location, and total biomass ranged from 69 to 1 ,595 grams per location
(Appendix A, Table 2). The results did not suggest any patterns, seasonally
or by station.
Species
A, Table 2).
biomass, and
Species
(Appendix A,
location was
richness. Species richness values ranged from 2 to 6 (Appendix
The distribution among locations was similar to abundance and
no seasonal or location patterns were evident.
diversity. Species diversity values ranged from 0.2 to 0.9
Table 2), and as with species richness, no pattern by season or
apparent.

Ap
pe
nd
ixA
,T
ab
le2
.A
bu
nd
an
ce,
bio
ma
ss,
sp
ecie
srich
ne
ss
and
sp
ecie
sd
ive
rsity
of
fish
cau
gh
tb
ybe
amtr
aw
lin
Ellio
ttB
ayb
yse
aso
n.
Sp
eci
es
Sp
eci
es
Lo
ca
tio
nA
bu
nd
an
ceB
iom
ass
(gm
)rich
ne
ss
div
ers
ity
Sum
mer
Aut
umn
Sum
mer
Aut
umn
Sum
mer
Aut
umn
Sum
mer
Aut
umn
PSD
DA
1S
ite
82
2.3
60
2.2
41
6.5
56
0.6
30
.90
PSD
DA
1R
efe
ren
ceS
tatio
n7
315
95.0
68
.65
20
.64
0.2
2PS
DD
A2
Site
3.7
2.7
82
3.7
111
3—
6—
—0
.77
Ap
pe
nd
ixA
,T
ab
le1
.A
bu
nd
an
ce,
bio
ma
ss,
sp
ecie
srich
ne
ss
and
sp
ecie
sd
ive
rsity
of
fish
cau
gh
tb
ybe
amtr
aw
lin
Com
men
cem
ent
Bay
du
rin
gsu
mm
er,
19
86
.
Sp
eci
es
Sp
eci
es
Lo
ca
tio
nA
bu
nd
an
ceB
iom
ass
(gm
)rich
ne
ss
div
ers
ity
PSD
DA
1S
ite
121
21
0.0
PSD
DA
2S
ite
145
30
.47
20
mS
tatio
n43
4,1
91
80
.71
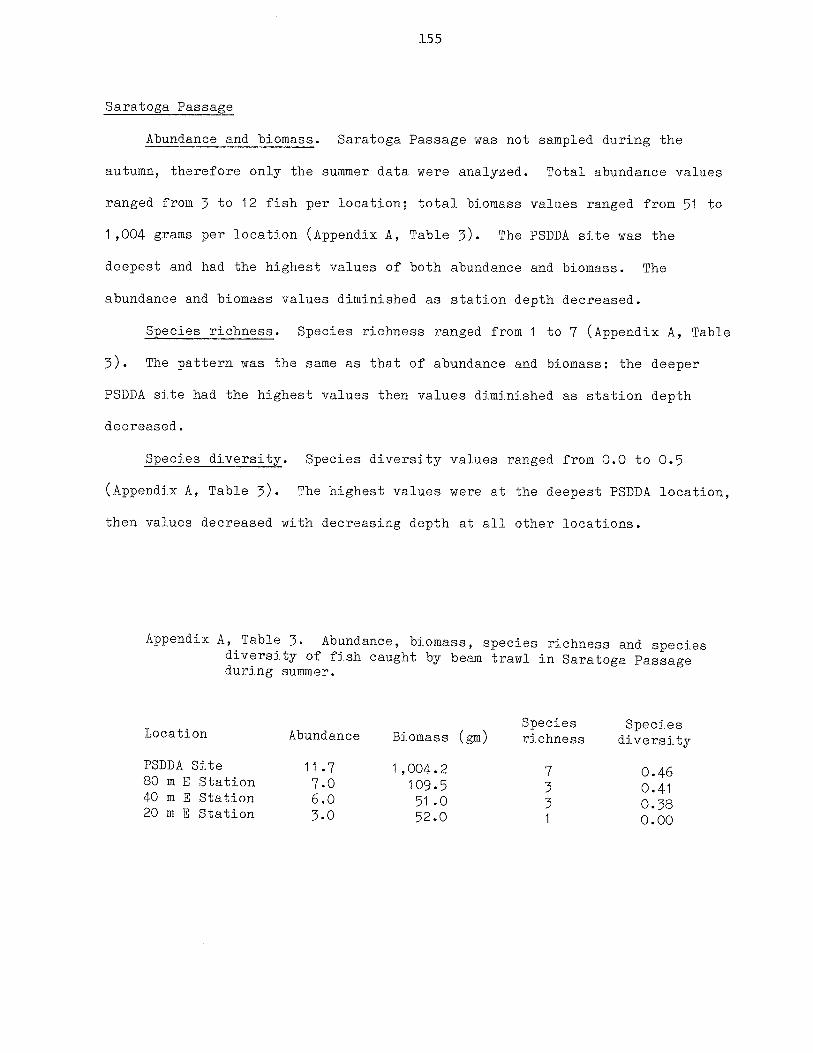
155
Saratoga Passage
Abundance and biomass. Saratoga Passage was not sampled during the
autumn, therefore only the summer data were analyzed. Total abundance values
ranged from 3 to 12 fish per location; total biomass values ranged from 51 to
1 ,004 grams per location (Appendix A, Table 3). The PSDDA site was the
deepest and had the highest values of both abundance and biomass. The
abundance and biomass values diminished as station depth decreased.
Species richness. Species richness ranged from 1 to 7 (Appendix A, Table
3). The pattern was the same as that of abundance and biomass: the deeper
PSDDA site had the highest values then values diminished as station depth
decreased.
Species diversity. Species diversity values ranged from 0.0 to 0.5
(Appendix A, Table 3). The highest values were at the deepest PSDDA location,
then values decreased with decreasing depth at all other locations.
Appendix A, Table 3. Abundance, biomass, species richness and speciesdiversity of fish caught by beam trawl in Saratoga Passageduring summer.
Species SpeciesLocation Abundance J3iomass (gm) richness diversity
PSDDA Site 11.7 1,004.2 7 0.4680 m E Station 7.0 109.5 3 0.4140 m S Station 6.0 51 .0 3 0.3820 m S Station 3.0 52.0 1 0.00

156
APPENDIX B
Length frequency histograms of abundant,
non-commercially or recreationally important,
fish caught in Commencement Bay and Elliott Bay.

157
5~
~ Patfish — male
4 ~ Ratfish femaleD Ratfish — juvenile
F _____________________
RE 3QUE~ 2C
1~~1Il I I —r— JI~I II I~II 1111111 I liii
75 95 115 135 155 175 195 215 235 255 275 295 315 335 355 375 395 415 435LENGTH mm
Appendix B, Figure 1, Length frequency of otter trawl caught ratfish,shown by sex and life history stage, during summer at156 m in Commencement Bay.
2 ____________________
~ Ratfish — female
~ Patfish — male
FREQUIEP1CV
0 III e ~—~—i——~-: it :i i I :+—~
75 95 115 135 155 175 195 215 235 255 275 295 315 335 355 375 395 415LENGTH
Appendix B, Figure 2. Length frequency of otter trawl caught ratfish,shown by sex, during summer at PSDDA 1 in Commencement Bay.
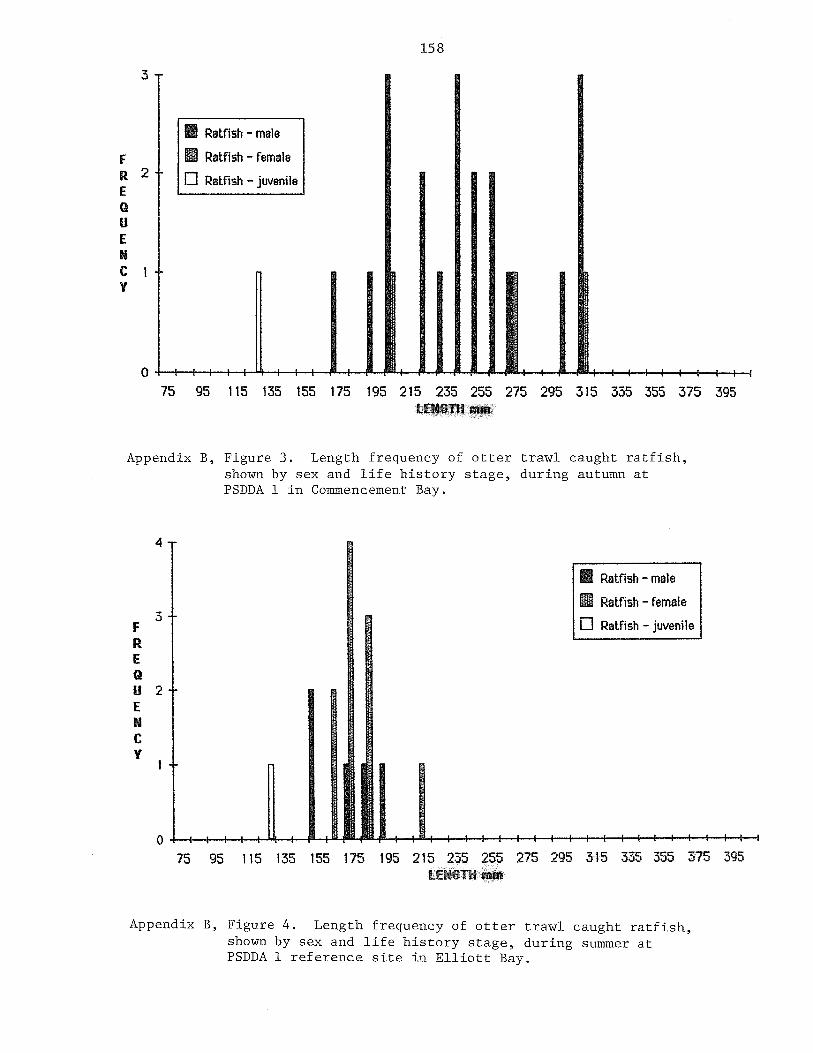
158
3
~ Ratfish — male
F ~ P.atfish — femaleR 2 ~ Ratfish — juvenile£QUE11CiV
0 1 1 I i i i I — +— — — — —
75 95 115 135 155 175 195 215 235 255 275 295 315 335 355 375 395LENGTH mm
Appendix B, Figure 3, Length frequency of otter trawl caught ratfish,shown by sex and life history stage, during autumn atPSODA 1 in Commencement Bay,
4~
~ Ratfish — male
~ Ratfish — female3~
F Ratfish — juvenileREQU2ENCV
0 .1 i I I—~ —i—il I I Iii ii I I IllIllIlIf I
75 95 115 135 155 175 195 215 235 255 275 295 315 335 355 375 395LENGTh mm
Appendix B, Figure 4. Length frequency of otter trawl caught ratfish,shown by sex and life history stage, during summer atPSDDA 1 reference site in Elliott Bay.

159
FREQUENCY
315 335 355 375 395 415 435 455
Appendix B, Figure 5. Length frequency of ottershown by sex, during autumn at PSDDAin Elliott Bay.
trawl caught ratfish,2, reference site 1
Figure 6, Length frequency of otter trawl caught ratfish,shown by sex and life history stage, during autumn atPSDDA 2, reference site 2 in Elliott Bay.
Ratfish — male
Patfish — female
4.0
3.5
3.0
2.5
2.0
1.5
1.0
0.5
0.0 I.Ih 11.75 95 115 135 155 175 195 215 235 255 275 295
E TN
3
Ratlish — male
~ Ratfish — female
— juvenileFREaUENCV
2
0
Appendix B,
75 95 115 135 155 175 195 215 235 255 275 295 315 335 355 375 395
LEN6TH mm
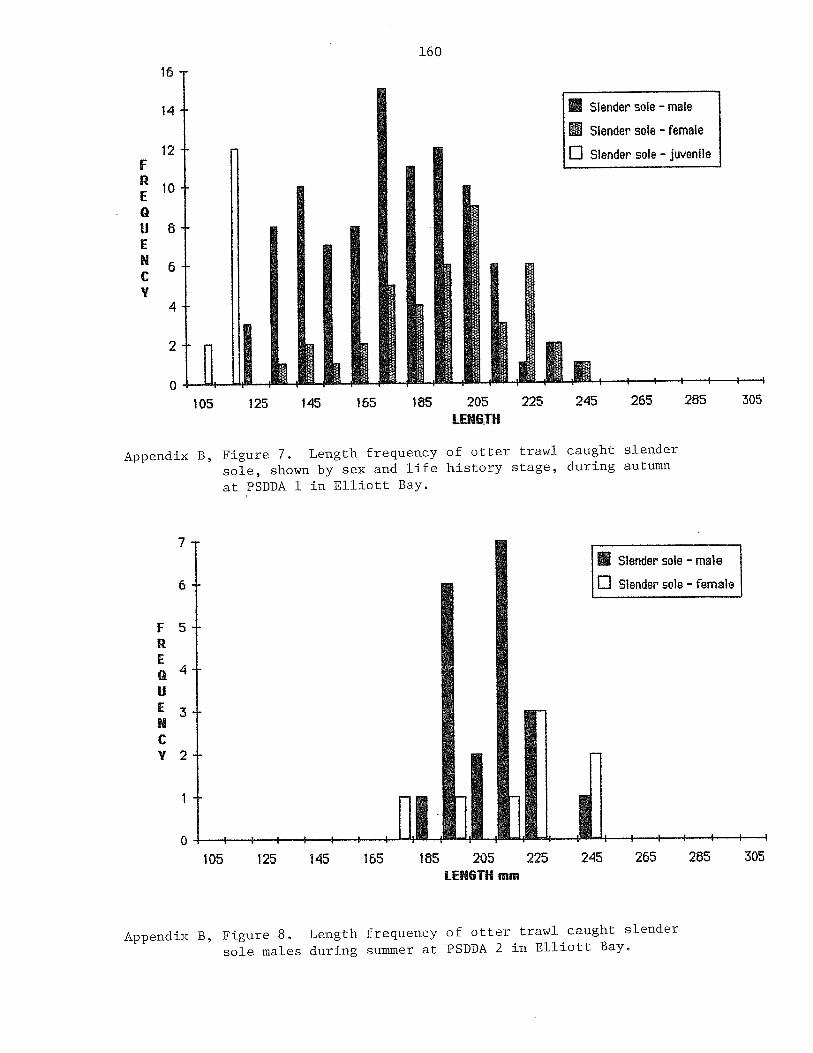
160
FREaUENCV
FREaUENCY
Appendix B, Figure 8, Length frequency of otter trawl caught slendersole males during summer at PSDDA 2 in Elliott Bays
Slender sole — male
~ Slender sole — female
D Slender sole — juvenile
16
14
12
10
8
6
4
2
0
Appendix B,
7
5
105 125 145 165 185 205 225 245 265 285 305LEK6TH
Figure 7. Length frequencysole, shown by sex and lifeat PSDDA 1 in Elliott Bay.
of otter trawlhistory stage,
caught slenderduring autumn
Slender sole — male
D Slander sole — female
5
4
3
2
1
0105 125 145 165 185 205 225 245 265 285 305
LENGTh mm

161
2
Appendix B, Figure 9. Length frequency of otter trawl caught slendersole, shown by sex, during autumn at PSDDA 2 in Elliott Bay.
.7
8
F5RE1k4UE3
CV
0
105 125 145 165 185 205 225 245 265 285 305LEN6TH mm

162
APPENDIX C
Abundance and biomass (and range at multiple
sample stations) of otter trawl caught fish
by station and species in Commencement Bay,
Elliott Bay, Saratoga Passage, and
Port Gardner

163
Appendix C, Table 1. Abundance and range at multiple sample stations of ottertrawl-caught fish by station and species in CommencementBay on June 13, 1986.
Location
Species PSDDA 1 PSDDA 1 PSDDA 2 PSDDA 2 20 ci 40 m 156 m(range) (range)
Spiny dogfish- adult 0.3 0-1 0.3 0-1juvenile
Longnose skateRatfish- adult 4.7 1—9 1.3 0-3 6.0
juvenile 1 .0Pacific herring 5.0Longfin smeltPlainfin midshipman- adult 1 .0
— juvenilePacific cod- adult 24.0
— juvenile 4.0Pacific hake— adult 0.3 0—1
— juvenilePacific tomcod— adult
— juvenileWalleye pollock— adult
— juvenileRed brotulaPallid eelpout 0.3 0—1Shortfin eelpoutBlack eelpout- adult
— juvenileBlackbelly eelpout— adult 1 .0
— juvenileShiner perch- adult
— juvenilePile perch- adult
— juvenileBluebarred pricklebackCopper rockfish- adult
— juvenileSplitnose rockfishQuillback rockfish- adult 0.3 0-1 3.0
‘I U — juvenile
Canary rockfishRockfish UID- juvenileSablefish— adult
— juvenileLingcodRoughback sculpinSpinyhead sculpinSoft sculpinTadpole sculpinNorthern spearnose poacher

164
Appendix C, Table 1. (Continued)
Location
Species PSDDA 1 PSDDA 1 PSDDA 2 PSDDA 2 20 m 40 in 156 in(range) (range)
Sturgeon poacherBluespotted poacherSnailfish UIDSpeckled sanddab— adult
— juvenileArrowtooth flounderRex sole— adult 6.0
— juvenileFlathead sole— adult
— juvenileRock sole— adult 2.0
— juvenileSlender sole— adult 1 .0 0—2 0.3 0—1
— juvenileDover sole— adult 1.3 1—2 1.0 0—3 5.0 6.0
— juvenileEnglish sole- adult 0.3 0-1 40.0
— juvenile0—0 sole— adult
H H — juvenile
Totals 6.9 5.5 91 13

165
Appendix C, Table 2. Biomass (in grams) and range at multiple sample stationsof otter trawl—caught fish by station and species inCommencement Bay on June 13, 1986.
Location
Species PSDDA 1 PSDDA 1 PSDDA 2 PSDDA 2 20 m 40 m 156 m(range) (range)
Spiny dogfish- adult 16.7 0—50 456.7 0-1,370j uv.
Longnose skateRatfish— adult 1 ,357.7 940—2,923 444.0 0—1 ,012 2,085.0
juvenile 6.0Pacific herring 45.0Longfin smeltPlainfin midshipman- adult 108.0
- juv.Pacific cod- adult 549.0
— juvenile 52.0Pacific hake— adult 13.5 0—40.5
— juvenilePacific tomcod— adult
H — juvenile
Walieye pollock— adult— juvenile
Red brotulaPallid eelpout 1.7 0-5.0Shortfin eelpoutBlack eelpout— adult
— juvenileBlackbelly eelpout— adult 9.0
II — juv.
Shiner perch— adult— juvenile
Pile perch- adult— juvenile
Bluebarred pricklebackCopper rockfish— adult
— juvenileSplitnose rockfishQuillback rockfish— adult 643.3 0—970 501 .0
- juv.Canary rockfishRockfish UID- juvenileSablefish— adult
‘I — juvenile
LingcodRoughback sculpinSpinyhead sculpinSoft sculpinTadpole sculpinNorthern spearnose poacher
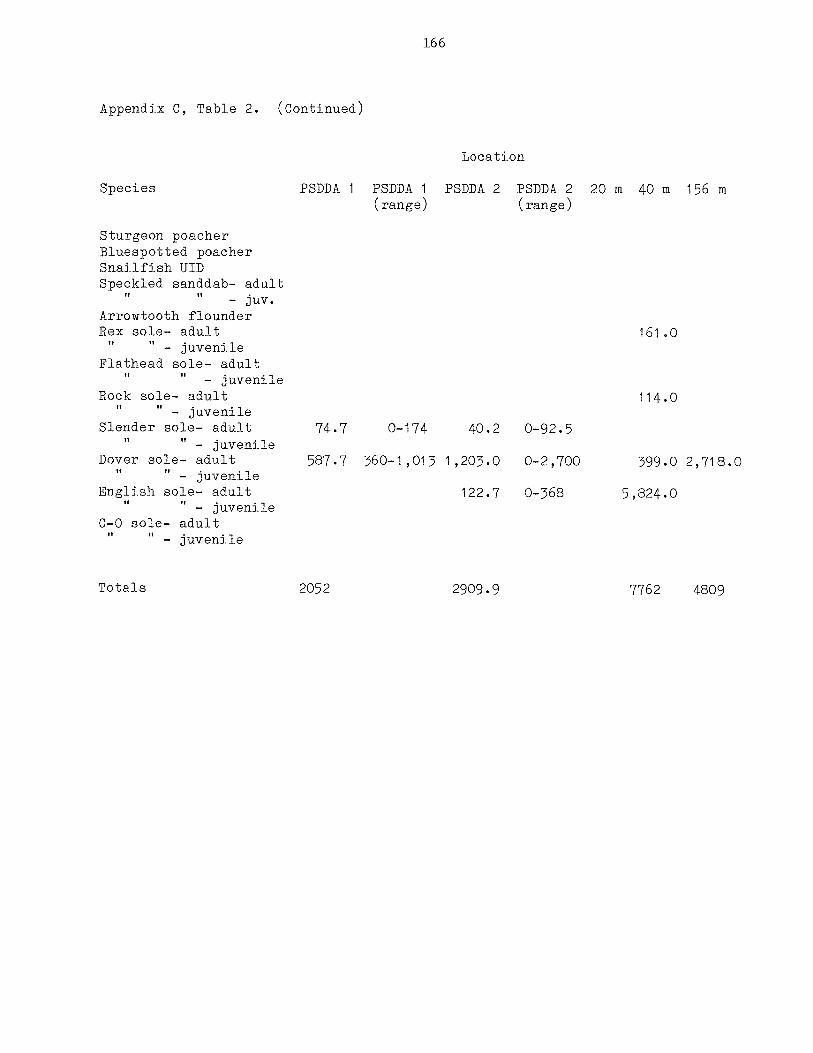
166
Appendix C, Table 2. (Continued)
Location
Species PSDDA 1 PSDDA 1 PSDDA 2 PSDDA 2 20 in 40 in 156 m(range) (range)
Sturgeon poacherBluespotted poacherSnailfish UIDSpeckled sanddab— adult
I, —
Arrowtooth flounderRex sole— adult 161 .0
— juvenileFlathead sole— adult
I’ — juvenile
Rock sole— adult 114.0— juvenile
Slender sole- adult 74.7 0-174 40.2 0-92.5— juvenile
Dover sole— adult 587.7 360—1,013 1,203.0 0—2,700 399.0 2,718.0H — juvenile
English sole— adult 122.7 0—368 5,824.0— juvenile
C—0 sole- adult— juvenile
Totals 2052 2909.9 7762 4809

167
Appendix C, Table 3. Abundance and range at multiple sample stations ofotter trawl—caught fish by station and species inCommencement Bay on September 8, 1986.
Location
Species PSDDA 1 PSDDA 1 PSDDA 2 PSDDA 2 20 m 40 m 156 m(range) (range)
Spiny dogfish- adultjuvenile
Longnose skateRatfish— adult 8.0 5—15 5.0 5—8 1 2 26
juvenile 0.5 0—1 7Pacific herringLongfin smelt 0.5 0-1Plainfin midshipman- adult 6
II — juvenile
Pacific cod— adult 0.7 0—1 0.3 0—1— juvenile
Pacific hake— adult 0.3 0—1— juvenile 0.5 0—1
Pacific tomcod— adult 7— juvenile 54
Walleye pollock— adult 0.7 0—2 0.7 0-1— juvenile
Red brotulaPallid eelpoutShortfin eelpoutBlack eelpout— adult 0.3 0—1
— juvenileBlackbelly eelpout— adult 7
B B — juvenile
Shiner perch— adult 2— juvenile
Pile perch- adultI’ — juvenile
Bluebarred pricklebackCopper rockfish— adult 2
I’ — juvenile
Splitnose rockfishQuiliback rockfish— adult 0.7 0—1 8 2
— juvenileCanary rockfishRockfish UID— juvenileSablefish- adult
— juvenileLingcodRoughback sculpin 16Spinyhead sculpin 0.7 0-1Soft sculpin 0.5 0—1Tadpole sculpinNorthern spearnose poacher
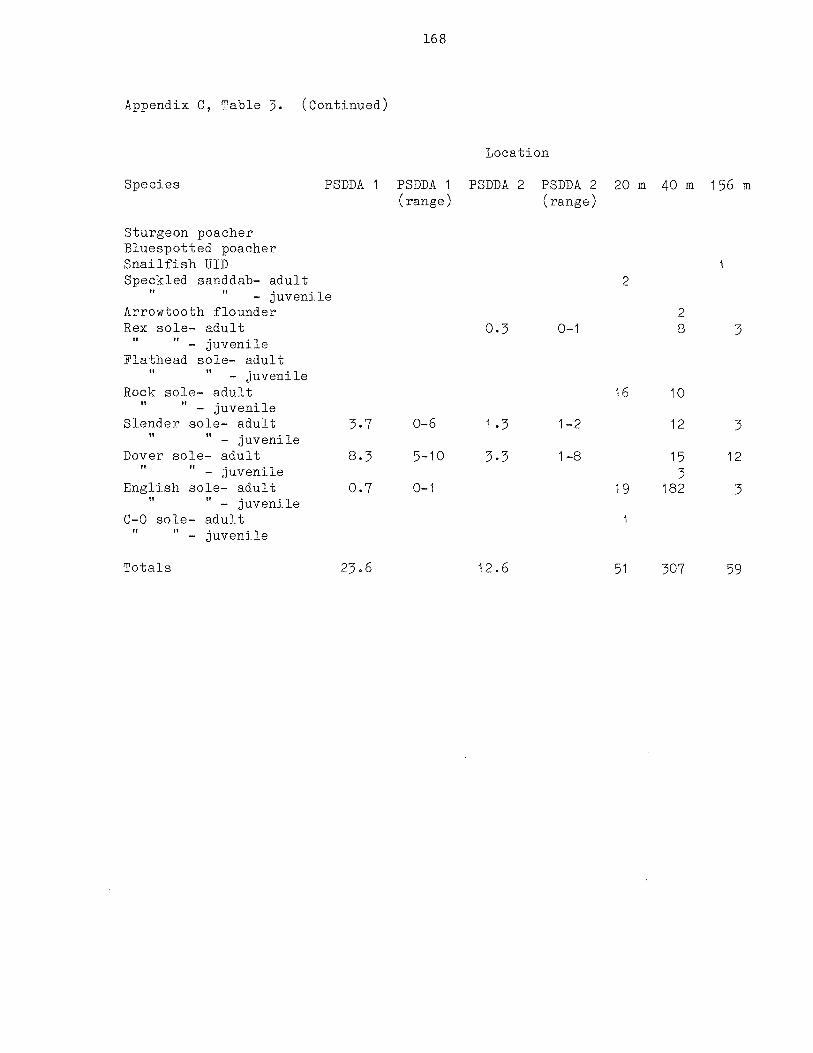
168
Appendix C, Table 3. (Continued)
Location
Species PSDDA 1 PSDDA 1 PSDDA 2 PSDDA 2 20 in 40 in 156 in
(range) (range)
Sturgeon poacherBluespotted poacherSnailfish UIDSpeckled sanddab— adult 2
— juvenileArrowtooth flounder 2Rex sole- adult 0.3 0-1 8 3
— juvenileFlathead sole— adult
— juvenileRock sole— adult 16 10
— juvenileSlender sole— adult 3.7 0—6 1.3 1—2 12 3
— juvenileDover sole— adult 8.3 5-10 3.3 1—8 15 12
— juvenile 3English sole— adult 0.7 0—1 19 182 3
— juvenileC—0 sole— adult 1
— juvenile
Totals 23.6 12.6 51 307 59
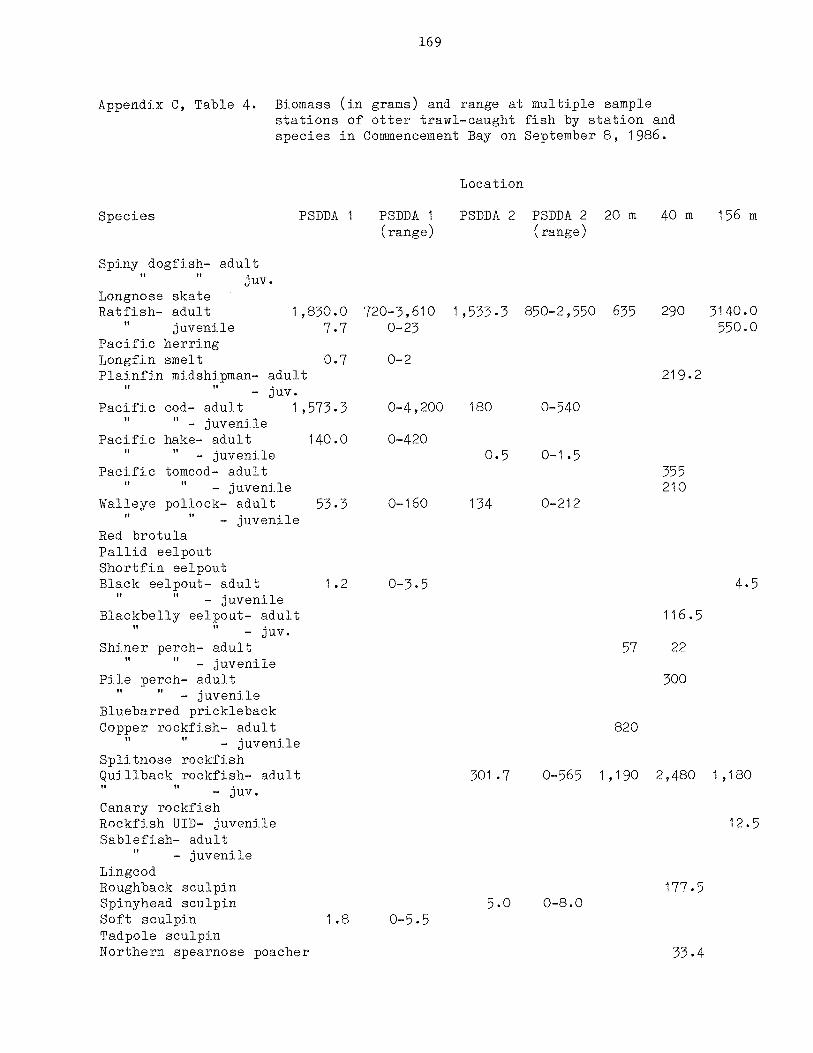
169
Appendix C, Table 4. Biomass (in grams) and range at multiple samplestations of otter trawl—caught fish by station andspecies in Commencement Bay on September 8, 1986.
Location
Species PSDDA 1 PSDDA 1 PSDDA 2 PSDDA 2 20 m 40 m 156 m(range) (range)
Spiny dogfish- adult‘I
Longnose skateRatfish- adult 1 ,830.0 720—3,610 1,533.3 850-2,550 635 290 3140.0
It juvenile 7.7 0—23 550.0
Pacific herringLongfin smelt 0.7 0-2Plainfin midshipman- adult 219.2
- juv.Pacific cod- adult 1 ,573.3 0—4,200 180 0-540
— juvenilePacific hake- adult 140.0 0-420
II — juvenile 0.5 0—1.5
Pacific tomcod- adult 355— juvenile 210
Walleye pollock— adult 53.3 0—160 134 0—212— juvenile
Red brotulaPallid eelpoutShortfin eelpoutBlack eelpout— adult 1 .2 0—3.5 4.5
— juvenileBlackbelly eelpout— adult 116.5
- juv.Shiner perch— adult 57 22
— juvenilePile perch- adult 300
— juvenileBluebarred pricklebackCopper rockfish— adult 820
— juvenileSplitnose rockfishQuillbackrockfish— adult 301.7 0—565 1,190 2,480 1,180
- juv.Canary rockfishRockfish UID- juvenile 12.5Sablefish— adult
I’ — juvenile
LingcodRoughback sculpin 177.5Spinyhead sculpin 5.0 0-8.0Soft sculpin 1.8 0—5.5Tadpole sculpinNorthern spearnose poacher 33.4

170
Appendix C, Table 4. (Continued)
Location
Species PSDDA 1 PSDDA 1 PSDDA 2 PSDDA 2 20 in 40 in 156 in(range) (range)
Sturgeon poacherBluespotted poacherSnailfish lID 5Speckled sanddab— adult 21
— juv.Arrowtooth flounder 330Rex sole— adult 36.3 0—109 308 285
— juvenileFlathead sole- adult
— juvenileRock sole- adult 490 519
— juvenileSlender sole— adult 170 65—360 129.3 98—190 443.7 110
— juvenileDover sole— adult 28,533 1,970—4,460 1,238.3 390—2,810 1,210 3975
— juvenile 50English sole— adult 190 0—290 4,890 29,865 855
— juvenileC—C sole— adult 240
— juvenile
Totals 6,821.3 3,558.4 8,343 36,929.3 10,117

171
Appendix C, Table 5. Abundance and range of multiple sample stations forotter trawl—caught fish by station and species inElliott Bay on July 3, 1986.
Spiny dogfish— adultjuvenile
Longnoae skateRatfish— adult
juvenilePacific herringLongfin smeltPlainfin midshipman- adult
— .Juv.Pacific cod- adult
— juvenilePacific hake— adult
— juvenilePacific toscod— adult
— juvenileWalleye pollock— adult
— juvenileRed brotulaPallid eelpoutShortf in eelpoutBlack eelpout— adult
— juvenileBlackbelly aelpout— adult
- .Juv.Shiner perch— adult
— juvenilePile perch— adult
— juvenileBluebarred pricklsbackCopper rockfiah— adult
— juvenileSplitnoae rockfiahQuillhack rockfiah— adult
— Juv.Canary rockfiahRockfiah RID— juvenileSablefish— adult
— juvenileLingcodRoughback aculpinSpinyhead aculpinSoft aculpinTadpole aculpinNorthern spearnoae poacherSturgeon poacherBlueapotted poacherSnailfiah RIDSpeckled sanddab— adult
- Juv.Arrowtooth flounderRex mole— adult
— juvenileFlathead aole— adult
— juvenileRock mole— adult
— juvenileSlender sole— adult
— juvenileDover sole— adult
— juvenileEnglish sole— adult
— juvenile0—0 sole- adult
— juvenile
2.3 4.7 0—5 0—11 16.0 2.00.3 0.7 0—1 0-2
0.3 0-10.3 0—1 1.0
1.0 4.01.0
2.0
PSDDA 2Reference site II
ART
36.04.0
Species PSDDA I
RangeSR AUT SR ART
1.0 15.3 0—3 2—42
PSDDA IReference mite
SR ART
1.0 10.0
6.0
0.3 0.7
2.0 17.01.0
0.3 5.3
5-8
0-1 0—1
0—5 2—440—3
0-1 0-12
2.0 2.0
1.0
2.013.7 93.3 3—22 67—137 13.0
1.3 0—4
2.7 9.7 0—5 8—13 3.0 1.0
6.0 2-12 1.0 3.0
0.3 1.3 0-1 0-4
PSDDA 2 PSDDA 2Reference site I
RangeSR ART SR ART SR ART
0.3 0-15.0 23.7 2-7 9-34 8.0 20.00.3 3.3 0-1 0—7 1.0
1.7 1—2
0.3 0.3 0—1 0-I2.0 0-6
1.3 0—2 3.0
0.7 1.3 0—2 0—4 7.0
2.0 0-5 1.0
1.00.7 0-2
0.7 0-1
1.0
7.0
0.3 0-1
6.0 9.3 4—9 2—15 3.0 8.0 9.0
4.3 6.7 3—6 4—11 9.0 2.0 3.0
0.3 16.3 0—I 0-29 1.0 28.0 33.0
0.3 0-10.3 0-I
1.3 2.31 .3
5.7 24.7
0.3
15.7 46.72.3 7.32.3 2.31.00.3
0-4 0-70—3
0—12 15—42
0—I
14—18 33—540—5 5—90-3 0-70-20-1
1.0
15.0
12.01.01.0
1.0
8.0
Totals 51.8 248.1 66.0 30.0 16.9 69.9 30.0 67.0 95.0

Biomass (in grams) and range at multiple sample stationsfor otter trawl—caught fish by station and species inElliott Bay on July 3~ 1986.
Species PSDDA I
Range311 SOT SO
P5BPS IReference Site
AUT SU AUT SR AUT
PSDDA 2 PSDDA 2Reference site I
RangeSO SOT SD API
Spiny dogfish— adultjuveni le
Longnoae skateRatfish— adult
juvenilePacific herringLongfin smeltPlainfin midshipman— adult
—joy-Pacific cod— adult
— juvenilePacific hake— adult
— juvenilePacific tomcod— adult
— juvenileWalleye pollock— adult
- juvenileRed brotulaPallid eelpoutShortfin eelpoutBlack eelpout— adult
— juvenileBlackbelly eelpout— adult
— Joy.Shiner perch— adult
— juvenilePile perch— adult
— juvenileBluebarred pricklebackCopper rockf jab— adult
— juvenileSplitnose rockfish
Quillback roetfish— adult- Joy.
Canary rockfishRockfiah DID— juvenileSablefish— adult
— juvenileLingcodRoughback sculpinSpinyhead aculpinSoft aculpinTadpole sculpinNorthern spearnose poacherSturgeon poacherBluespotted poacherSnailfish DIDSpeckled sanddab— adult
— Juv.Arrowtooth flounderRex sole- adult
— juvenileFlathead sole— adult
— juvenileRock sole— adult
— juvenileSlender sole— adult
— juvenileDover sole— adult
— juvenileRriglish sole— adult
— juvenileC—0 sole— adult
— juvenile
615.0 1,675.0 0-1,845.0
318.2 423.3 0—822.012.2 16.0 0—36.5
510.0—715 .0
0-1,090.0
490.0-10,210.0 443.0 510.0 108.50—37.5
3.00-45.0
0-2.50-4.0 2.5
292.0 550.01.5
110.0
172
Appendix C, Table 6.
270-4,230.0 448.5 1000.0
25.30—835.0 1195.5 550.0 1684.2 7066.7 1682.0—1707.50-48.0 15.8 100.0 0-47.5
137.7
130.412.522.7
621 .7
504.0
3,788.3
28.3
0-413.0
0-204.5
0-68.0
0-76.0590.0-11070.0 3704.0 4440.0
0—200.0 20.0
I 9583
126.74.0
3.6
410.0-4005.0
0-325.5 0-380.00—11.9
0-5.5
3.5 6.1 0—10.5 0—18.2
19.1 0—53.4
224.8 1,641.0 100.3—462.0 690.0-2,733.0 407.0 67.0
29.8 0-89.5
91.8 52.3 0-260.0 45.0—60.0 13.5 3.5
1,625.0 840.0-2,045.0 330.0 110.0 360,0 0-1080.0
666.7 4,916.7 0—2,000.0 0—14,750.0
866.7 0-1750.0
0.8I .3
9.0 0—276.7 0-20.0
103.0 205.0 0—309 0-615.0 88.5 3.7 0-11.08.0 0-15.0 110.0
410.8 2,850.3 0—774.5 1,860.0-4,315.0 1,481.0
48.3 0—145.0
854.2 1,770.0 461.5—1292.0 870.0—2320.0 441.0 445.0 893.9 613.3 200.0—443.0 170.0-1,020.017.2 56.5 0—39.5 32.0—72.0 6.5
280.7 361.7 143.0—435.0 0-1,085.0 138.5 4,277.0 2,533.3 491.0—2,132.0 980.0-5,300.05.3 0-9.0
57-7 0-173.0 100.3 3,810.0 0-301.0 0-6,280.0
18.5
25.0
206.0 745.0
4,291.0 620.05,280.0
252.0
Totals 3,969.9 20,630 4,993 2,801 7,003.2 17,496.8 8,790 12,255

173
Appendix C, Table 7. Abundance and range at multiple sample stations of ottertrawl-caught fish by station and species in SaratogaPassage on July 1, 1986.
Location
Species PSDDA PSDDA PSDDA 20m E 40m B 40m W 80m B(range) reference
Spiny dogfish— adult 0.5 0—1 5juvenile
Longnose skateRatfish— adult 1 1—1
juvenilePacific herringLongfin smeltPlainfin midshipman- adult
— juvenilePacific cod— adult
— juvenilePacific hake- adult 2.5 0-4 2
— juvenilePacific tomcod— adult
— juvenileWalleye pollock— adult
— juvenileRed brotulaPallid eelpoutShortfin eelpout 0.7 0-2Black eelpout- adult
— juvenileBlackbelly eelpout— adult 2
— juvenileShiner perch- adult
— juvenilePile perch— adult
— juvenileBluebarred pricklebackCopper rockfish- adult
— juvenileSplitnose rockfishQuillback rockfish- adult 0.5 0-1
— juvenileCanary rockfishRockfish UID- juvenileSablefish- adult
— juvenileLingcod 0,3 0—1Roughback sculpinSpinyhead sculpinSoft sculpinTadpole sculpin 5 0-9Northern spearnose poacher
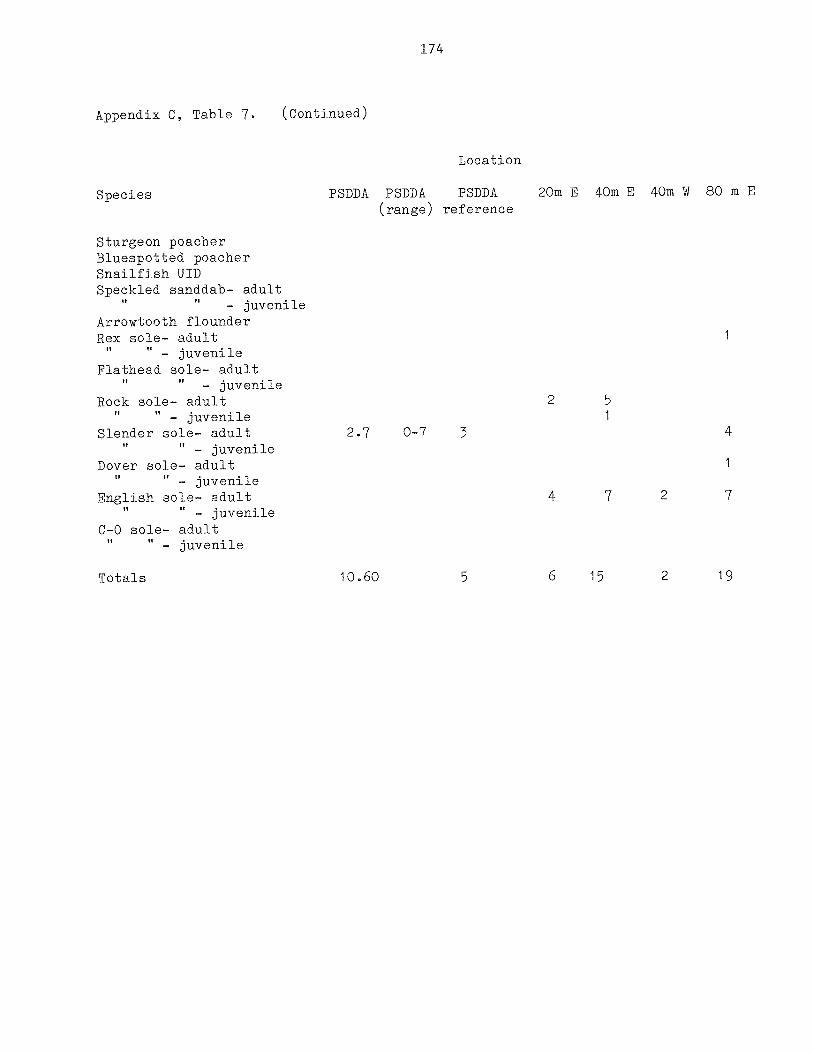
174
Appendix C, Table 7. (Continued)
Location
Species PSDDA PSDDA PSDDA 2Cm E 4Cm E 4Cm W 80 in E(range) reference
Sturgeon poacherBluespotted poacherSnailfish UIDSpeckled sanddab— adult
— juvenileArrowtooth flounderRex sole— adult
— juvenileFlathead sole— adult
— juvenileRock sole— adult 2 5
II — juvenile
Slender sole- adult 2.7 0-7 3 4— juvenile
Dover sole- adult— juvenile
English sole- adult 4 7 2 7— juvenile
C—C sole— adultII It — juvenile
Totals 10.60 5 6 15 2 19

175
Appendix C, Table 8. Biomass (in grams) and range at multiple sample stationsof otter trawl caught fish by station and species inSaratoga Passage on July 1 , 1986.
Location
PSDDASpecies PSDDA PSDDA Reference 20m E 40m B 40m W 80m B
(range)
Spiny dogfish- adult 351.7 0-1055 978juvenile
Longnose skateRatfish— adult 441.7 255—695 142
juvenilePacific herringLongfin smeltPlainfin midshipman- adult
— juvenilePacific cod— adult
— juvenilePacific hake- adult 741 .5 0—1 ,381 .5 678
— juvenilePacific tomcod— adult 1 .5
— juvenileWalleye pollock— adult
— juvenileRed brotulaPallid eelpoutShortfin eelpout 15.2 0—45.5Black eelpout— adult 56
— juvenileBlackbelly eelpout— adult
— juvenileShiner perch- adult
— juvenilePile perch— adult
— juvenileBluebarred pricklebackCopper rockfish- adult
— juvenileSplitnose rockfishQuillback rockfish- adult 34.7 0-104
— juvenileCanary rockfishRockfish UID- juvenileSablefish— adult
— juvenileLingcod 1,666.7 0-5,000Roughback sculpin 9.5Spinyhead sculpinSoft sculpinTadpole sculpin 119.0 0-357

176
Appendix C, Table 8. (Continued)
Location
PSDDASpecies PSDDA PSDDA Reference 2Orn E 40m E 40m W 8Oni E
(range)
Northern spearnose poacherSturgeon poacherBluespotted poacherSnailfish lIDSpeckled sanddab- ad~ilt
— juvenileArrowtooth flounderRex sole— adult loT
— juvenileFlathead sole— adult
I’ — juvenile
Rock sole- adult 65 448— juvenile 19
Slender sole— adult 97 0—245 120 142— juvenile
Dover sole— adult 142— juvenile
English sole— adult 424 863 137 417— juvenile
C—0 sole— adult— juvenile
Totals 3,467.5 798 498.5 1,3315 137 1,984

Ap
pe
nd
ixC
,T
ab
le9
.N
umbe
r(a
bu
nd
an
ce)
of
fish
,b
iom
ass
(in
gra
ms)
and
ran
ge
at
Nav
yan
dPS
DD
Asite
so
fo
tte
rtr
aw
lca
ug
ht
fish
by
sta
tio
nan
dsp
ecie
sin
Po
rtG
ard
ne
ron
Fe
bru
ary
12an
d1
3,
1986
(W86
)~
7.4
1690
440
312
01
30
219
8.1
134
.5
sort
Gar
dner
Por
tG
ardn
erP
ort
Gar
dner
Por
tG
ardn
erP
ort
Gar
dner
Por
tG
ardn
erW
86W
86W
86W
OO
W8
6W
OO
Fidn
spec
ies
NAV
YO
TPS
OD
A2
PSO
DA
ITr
anI
205
Tran
14O
STr
anI
1005
Sci
en
tific
Nam
eC
omm
onN
ame
Abu
rul
Ran
geS
iom
ase
Ran
geA
bund
Ran
geB
iom
ass
Ran
geA
bund
Ran
geB
iom
ase
Ran
geA
bund
Bio
maa
aA
bund
Bio
maa
aA
bund
Bio
mas
s
Lam
petra
tdde
nlal
aP
acifi
cla
mpr
ey0.
30-
13
0-9
Squ
aius
acan
o,ia
ssp
iny
dogf
ish
0.5
0-1
115
0-2
30
0.3
0-1
498.
30
-14
95
Raj
arh
ine
Iong
noce
skat
ei4
ydro
lagu
sco
lliel
ratfi
sh-
adul
t9.
72
-22
1348
.33
80
-24
20
332
2-4
469
67.5
59
20
-80
15
25.3
12-3
651
62.8
28
93
-87
40
3769
60-ji
Nef
lhle
0.7
0-2
11.2
0-3
3.6
95
-13
197.
514
5-25
09
0-2
796
.70
-29
0A
iosv
sapk
iissi
ma
Am
eiic
ansh
ad0.
30-
141
.50
-12
4.6
Clu
pea
palla
sii
Pac
ific
herr
ing
Por
ichi
hys
nola
lus
plai
ntin
mId
ship
man
0.3
0-1
350-
105.
10.
50
110
00
20
00.
30.
110
03
0G
aotis
mac
roce
phai
usPa
cific
cod
0.3
01
1333
.50
-40
00
.5M
icro
gadu
spro
xim
t,sPa
cific
iom
cod
-ad
ult
5.7
0-1
221
5.3
0-1
66
0.3
0-1
33.3
0-1
00
-juve
nile
3.7
2-5
48.1
20
.4-8
2.9
420
Mer
iucc
ius
pror
iucl
usPa
cific
hake
-ad
ult
482
4-5
830
48.3
14
25
-59
60
199
-29
6105
47
20
-74
90
18.3
5-3
965
91.7
11
50
-99
35
1016
00-J
uven
ile9.
70
-24
2006
.70
-28
5B
rosm
ophy
cis
mar
gina
tare
dbr
otul
aLy
coda
pus
man
dibu
laris
palli
dee
lpou
tLy
code
sdi
aple
nis
blac
kee
ipou
tLy
code
spa
cifie
sbi
ackb
eliy
eelp
out
8.7
1-16
96.8
16.9
-234
11
12.4
Cym
alog
asle
ragg
tega
tash
iner
perc
h-
adul
t67
.75
-18
716
93.5
12
0.5
-48
60
-juve
nile
10
-315
0-4
5D
amal
ichl
hys
Caer
epi
lepe
rch
-ad
ult
-ju
veni
leR
onqv
ilus
jord
ani
north
ern
ronq
ull
Lurn
penu
ssag
ilia
snak
epr
lckl
ebac
k0.
30-
15
0-1
5S
ebas
tesm
alig
erqu
lilba
ckro
ckfis
h2.
71-
449
1.7
150-
1035
21-
311
105
20
-17
00
10-
246
1.7
0-9
00
1228
02
860
Ano
plop
oma
timbr
iasa
hief
ish
Arte
dius
op.
scui
pin
Dao
ycol
luss
etlg
ersp
inyh
eads
culp
in0.
70
-235
0-1
05
0.3
01
8.3
02
5C
tdto
notu
opug
elen
sis
roug
hbac
ksc
tiple
Giib
erlid
iasi
galu
tes
soft
scul
pin
Icei
lnus
bore
alis
north
ern
scul
pin
Lept
ocof
fiis
arm
aluu
Paci
ficst
agho
rnsc
ulpi
nN
autic
hlhy
soc
uio(
asci
aius
sailt
insc
ulpi
nR
adul
inus
aspr
ellu
ssl
imsc
ulpi
nB
aihy
agon
usni
grip
inni
sbl
ackt
nst
arsn
out
poac
her
Xen
erel
mvs
lalif
rons
blac
ktp
poac
her
3.3
3-4
30.5
27
.9-3
51
0-2
160
-32
1.3
0-3
11.3
0-2
01
11.8
Xen
erel
mus
Ola
can(
hus
biue
spot
ted
poac
her
Cith
aric
hlhy
sup
.sa
ndda
b-
adul
t2
709
295
-juve
nile
i13
.26
95C
ilhar
icht
hys
sord
idus
Paci
ficsa
ndda
bC
ilhar
ichl
hys
stig
mae
ussp
eckl
edsa
ndda
b-
adul
t-—
nile
Ath
eres
thes
slom
jas
arro
wto
oth
floun
der
0.3
01
100
03
00
119
.5G
lypt
ocep
halu
szac
hiru
sre
oso
le-
adul
t2
0-3
240
0-3
75
0.5
0-1
120
24
0.3
0.1
8.3
02
5-
Juve
nile
Hip
pogl
osso
ides
eias
sodo
nfia
thea
dsol
e25
.717
-42
3328
.32
13
5-5
61
00.
50
-I80
0-1
60
120
05
500
Lepl
dops
ella
bThn
eata
rock
sole
-ad
ult
0.3
0-1
163.
40
-49
00.
30.
150
0-1
50
266
013
2080
-juve
nie
27.
85
23.1
Lyop
selta
exiis
slen
der
sole
-ad
ult
30.3
21
-45
2085
12
50
-30
40
14.5
8-21
692.
54
10
-97
526
24
-28
1301
.71
25
5-1
39
0-ju
veni
le9
0-3
17.7
0-41
Mic
rost
omus
paci
ficus
Dov
erso
le7.
33
-12
1686
91
0-2
57
55
3-7
1215
11
70
-12
60
3.7
0-11
818.
30
-24
55
Par
ophy
rsve
llus
Engl
ioh
sole
-ad
ult
111
58
-17
420
325
81
70
-34
75
53.
53
475
04
90
10
10
73
14
1860
79
5.3
80
51
320
1797
0-ju
veni
le0.
70-
18.
30
-13
.51
715
715
00P
ialic
hthy
sst
eila
lus
stor
ryflo
unde
rP
leur
snic
hihy
sco
enos
usC
Osd
eI
60P
selil
chth
ysm
eian
oslic
lus
sand
sole
118
0.1
118
.42
564
26NA
TOTA
L3
44
.83
69
76
891
73
61
94
.31
83
49
101
27
925
56
13
094
10
43
9

Ap
pe
nd
ixC
,T
ab
le9
(co
ntin
ue
d).
Por
tG
ardn
erP
ort
Gar
dner
Por
tG
ardn
erP
ort
Gar
dner
Por
tG
ardn
erP
ort
Gar
dner
WaS
W8
6W
86
Wa
sW
86
W86
Flab
Spe
cies
Tran
220
STr
an2
40$
Tran
211
05Tr
an4
20$
Tran
440
$Tr
an4
145$
Sci
en
tific
Nam
eC
omm
onN
ame
Abu
ndS
iom
asa
Abu
ndB
iom
ass
Abu
ndB
iom
ass
Abu
ndB
iom
asa
Abu
ndB
iom
ass
Abu
ndB
iom
ass
Lam
petra
tride
ntal
aP
acifi
cla
mpr
eySq
ualu
sac
antri
assp
iny
dogf
ish
Flaj
arh
ina
Iong
nouo
skat
eH
ydro
lagu
sco
lliel
ratta
h-
adul
t2
580
838
00-ju
veni
le‘
Alos
asa
pidi
ssim
aAm
eric
ansh
adC
lupe
apa
llasi
iP
acifi
che
rrin
gP
oric
hthy
sno
tatu
spl
ainf
inm
idsh
ipm
anG
adt.o
mac
roce
phal
usP
acifi
cco
dM
icro
gadu
spr
oxim
usP
acifi
cto
mco
d-
adul
t13
105
-juve
nile
1410
0M
erlu
cciu
spr
oduc
tus
Pac
ific
hake
-ad
ult
578
0I
410
-ju
veni
leB
rosm
ophy
cis
mar
ylna
tare
dbr
otul
aLy
coda
pus
man
dibu
laris
palli
dee
lpou
tLy
code
sdi
apte
nis
blac
kee
lpou
tLy
code
spac
ilica
blac
kbel
lyae
lpou
t1
102
50C
ymat
ogas
tera
ggre
gata
slen
orpe
rch
-ad
ult
230
120
-juve
nile
4125
534
200
Dam
atch
thys
vacc
api
lepe
rch
-ad
ult
710
512
922
10-ju
venI
le1
1026
310
Ron
qullu
sJo
rdan
!no
rther
nro
nqui
fLu
irpen
ussa
gitta
snak
epr
lckl
ebac
k36
1065
Seb
aste
amal
iger
quill
back
rock
fish
850
213
203
400
Ano
plop
oma
limbr
iasa
blef
ish
Arte
dius
op.
scul
pin
230
17
565
Das
ycot
tus
setig
ersp
lnyh
ead
scul
pin
Chi
tono
tus
puge
tens
isro
ughb
ack
scul
pin
Gilb
ertid
iaoi
galu
tes
soft
scul
pin
Icei
lnus
bore
alis
north
ern
scul
pin
Lept
ocot
tus
arm
atus
Pac
ific
stag
horn
scul
pln
722
52
380
Nau
ticht
hys
ocul
ofaa
ciat
ussa
ilfin
scul
pin
Rad
ulin
usas
prel
lus
slim
scul
pin
Bat
hyag
onus
nlgr
ipln
nis
blac
kfin
star
anou
tpo
ache
rX
ener
etm
usla
titio
nsbl
ackl
ippo
ache
r2
30X
ener
etm
uatri
acan
thus
blue
spot
ted
poac
her
Cith
atic
hthy
aop
.sa
ndda
b-
adul
t1
2712
300
418
0-
juve
nile
580
Cith
aric
hthy
sso
rdid
usPa
cific
sand
dab
115
Cith
aric
hthy
sst
igm
aeus
spec
kled
sand
dab
-ad
ult
2681
0-ju
veni
le1
25A
ther
esth
esst
omia
sar
row
loot
hflo
unde
r1
145
Gly
ptoc
epha
lus
zach
lrus
rea
sole
-ad
ult
155
113
0-
juve
nile
Hog
loss
rAde
sela
ssoc
ion
fath
ead
sole
431
01
110
Lepi
dops
etta
bilin
eata
rock
sole
-ad
ult
123
017
1480
2216
50-ju
veni
le2
81
51
59
145
Lyop
setta
exits
slen
der
sole
-ad
ult
640
190
361
014
830
-ju
veni
leM
icro
stom
uspa
cific
usD
over
sole
180
II31
9028
4900
Par
ophy
rsve
tlus
Eng
lish
sole
-ad
ult
6719
208
1710
140
1490
-juve
nile
5459
01
7.2
Pla
ticht
hys
stel
latu
sst
arry
floun
der
Pleu
ronl
chth
yoco
enos
usC
Ood
e1
50P
setti
chth
ysm
elan
oslic
tus
sand
sole
TOTA
L4
26a
242
54
35
3fi
77
80
201
24
a.2
44
78
59
562
10
45
5
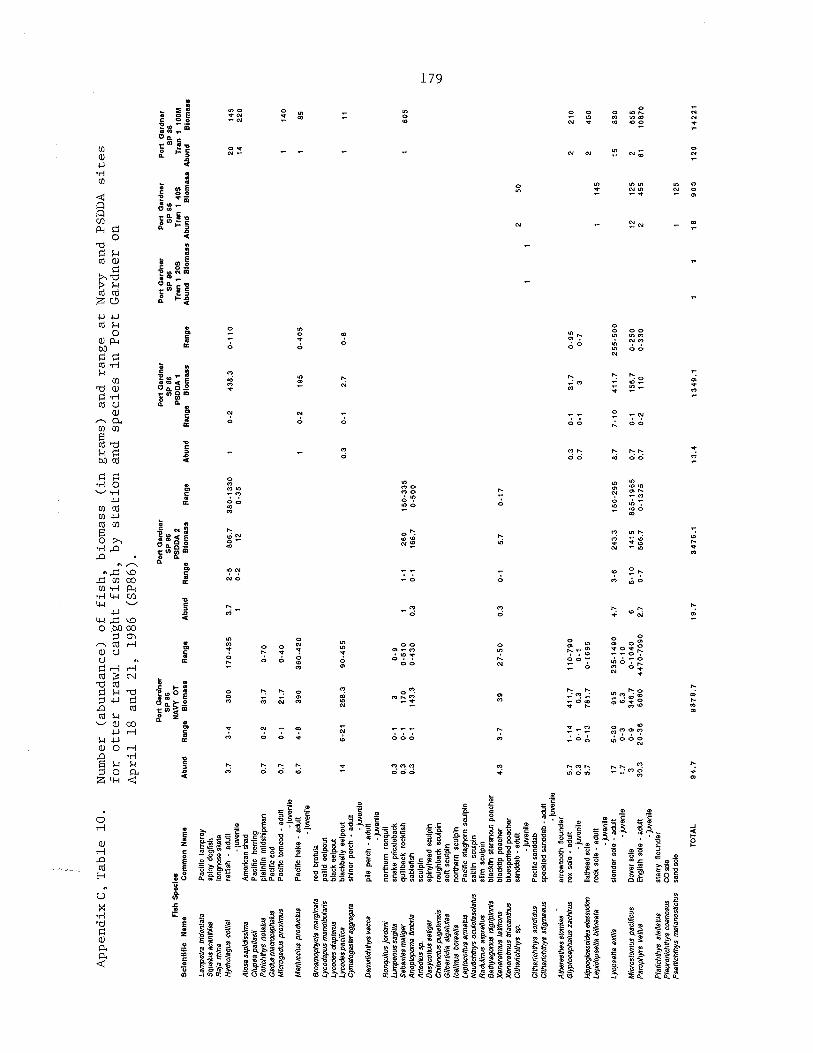
Fish
Spe
cies
Sci
en
tific
Nam
eC
omm
onN
ame
Lam
pelra
tride
ntal
aP
acifi
cla
mpr
eySq
uaki
sac
antrl
assp
iny
dogf
ish
Raj
ath
ina
long
nose
skat
eH
ydro
lagu
sco
lliei
raffi
sh-
adul
tju
veni
leAl
osa
sapi
diss
ima
Amer
ican
shad
ClLr
pea
palla
sil
Pac
ific
herr
ing
Por
icht
hys
nola
tus
plal
nfin
mid
ship
man
Gad
usm
acro
ceph
alus
Pad
ficco
dM
icro
gadu
spr
oxim
usP
acifi
cto
mco
d-
adul
t-ju
veni
leM
erlu
cciu
spr
oduc
tus
Paci
ficha
ke-
adul
tju
veni
leB
rosm
ophy
cis
mar
gina
tare
dbr
otul
aLy
coda
pus
man
dibr
iaris
palli
dea
lpou
tLy
code
sdl
aple
rus
blac
kee
lpou
tLy
code
spac
illca
blac
kbel
lyee
lpsu
tC
yrrra
toga
ster
aggr
egat
esh
iner
perc
h-
adul
t-ju
veni
leD
amal
ithth
ysva
cca
pile
perc
h-
adul
t-
juve
nile
Ron
qullu
sjo
rdan
ino
rther
nro
nqui
lLw
npen
ussa
gitta
snak
epr
ickl
ebac
kSe
bast
esm
alig
erqu
lilba
ckro
ckfis
hA
nopl
opom
afim
bria
sabl
efis
hA
rtedi
usrp
.sc
ulpi
nD
asyc
otlu
sse
llger
spin
yhea
dsc
ulpi
nC
hlto
notu
spug
eten
sis
roug
hbac
ksc
ulpi
nG
ilber
lidia
slga
lute
sso
ftsc
ulpl
nIc
elin
usbo
real
isno
rther
nsc
ulpi
nLa
pfo
cotlu
sar
mat
usP
acifi
cst
agho
rnsc
ulpi
nN
aulic
hthy
soc
ulof
asci
atus
sailf
insc
ulpi
nR
adul
inus
aspr
ellu
ssl
imsc
ulpi
nB
athy
agon
usni
grip
innl
sbl
ackf
lnst
arsn
out
poac
her
Xen
erel
mus
laifm
nsbl
ackt
ippo
ache
rX
ener
ebnu
sbl
acan
thus
bhie
spot
ted
poac
her
Cilh
aric
hlhy
sup
.sa
ndda
b-
adul
t-J
uven
ileC
ithar
ichl
hys
surd
idus
Paci
ficsa
ndda
bC
ithar
lcht
hys
sbgm
aeus
spec
lcle
dsa
ndda
b-ad
ult
juve
nile
Ath
eres
thes
stsm
las
arro
wto
sth
floun
der
Gly
ptoc
epha
lus
zach
lrus
rex
sole
-ad
ult
-ju
veni
leH
ippo
glos
scrid
esel
asso
don
fath
ead
sole
Lepi
dops
etta
bilin
eala
rock
sole
-ad
ult
juve
nile
Lyop
setta
exilis
slen
der
sole
-ad
ult
-ju
veni
leM
icro
stom
uspa
cific
usD
over
sole
Par
ophy
rsve
llus
Engl
ish
sole
-ad
ult
-ju
veni
leP
latic
hthy
sst
ella
ftrs
star
ryflo
unde
rP
leur
onic
hlhy
sco
enos
usC
Oer
ieP
selu
chth
ysm
elan
oslic
tus
sand
sole
0.3
0-1
30
-90.
30-
117
00
-51
00.
30-
114
3.3
0-4
30
5.7
1-14
411.
71
10
-79
00.
30-
10.
30-
15.
70
-13
781.
70
-16
95
2014
514
220
Ap
pe
nd
ixC
,T
ab
le1
0.
Nu
mb
er
(ab
un
da
nce
)o
ffish
,b
iom
ass
(in
gra
ms)
an
dra
ng
ea
tN
avy
an
dP
SD
DA
site
sfo
ro
tte
rtr
aw
lca
ug
ht
fish
,b
ysta
tio
nan
dsp
ecie
sin
Po
rtG
ard
ne
ron
Ap
ril
18an
d2
1,
1986
(SP
86
).
Por
tG
ardn
erP
ort
Gar
dner
Por
tG
ardn
erP
ort
Gar
dner
Por
tG
ardn
erP
ort
Gar
dner
SP88
SF
86SP
86S
F86
SP86
SF
86
NAV
YO
TPS
OD
A2
PSO
DA
1Tr
anI
20S
Tran
I40
ST
ran
IlO
OM
Abu
ndR
ange
Sia
mes
eR
ange
Abu
ndR
ange
Bio
mas
sR
ange
Abu
ndR
ange
Bio
mas
sR
ange
Abu
ndB
iom
ass
Abu
ndB
iom
asa
Abu
ndB
iom
ass
3.7
3-4
300
17
0-4
35
3.7
2-5
806.
73
80
-13
30
10-
243
8.3
0-1
10
10-
212
0-3
5
0.7
0-2
31.7
0-7
0
0.7
0-1
21.7
0-4
01
140
6.7
4-8
390
36
0-4
20
10
-219
50
-40
51
85
146-
2125
8.3
90
-45
50.
30-
12.
70
-81
11
11-
126
015
0-33
51
605
0.3
0-1
166.
70
-50
0
4.3
3-7
392
7-5
00.
30-
15.
70
-17
250
11
0.3
0-1
31.7
0-9
52
210
0.7
0-1
30-
72
450
114
5
175
-30
915
23
5-1
49
04.
73
-624
3.3
150-
295
8.7
7-1
041
1.7
25
5-5
00
1583
01.
70
-36.
30
-10
30
-934
6.7
0-1
04
06
5-1
014
158
85
-19
65
0.7
0-1
156.
70
-25
012
125
265
530
.32
0-3
660
604
47
0-7
09
02.
70
-756
6.7
0-1
37
50.
70
-211
00
-33
02
455
6110
870
112
5
TOTA
L9
4.7
98
78
.71
9.7
34
76
.11
3.4
13
49
.118
90
012
01
42
21
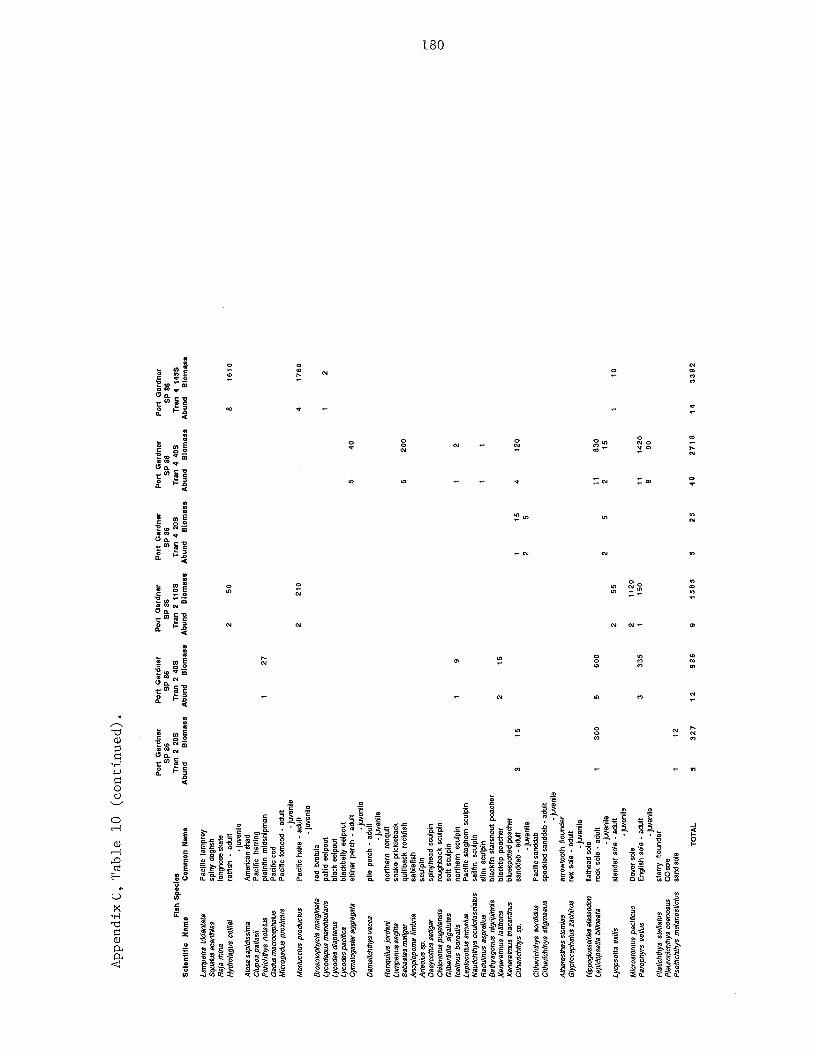
Ap
pe
nd
ixC
,T
ab
le10
(co
ntin
ue
d).
Fish
Spe
cies
Sci
en
tific
Nam
eC
omm
onN
ame
Lam
petra
idde
ntat
aP
acifi
cla
mpr
eySq
uatu
sac
anu’
rias
spin
ydo
gfis
hR
aja
thin
slo
ngno
sesk
ate
Hyd
rola
gus
colli
eira
tfish
-ad
ult
juve
nile
Alos
asa
pidi
ssim
aAm
eric
ansh
adC
iupe
apa
llasi
iP
acifi
che
rrin
gPo
rlctrt
hys
nola
lus
plai
ntin
mid
ship
man
Gad
usm
aas3
ceph
atis
Paci
ficco
dM
icro
godu
spr
oxim
usP
acifi
cto
nico
d-
adul
t-ju
verd
leM
erlu
cciu
spr
oduc
tus
Pac
ific
hake
-ad
ult
-ju
veni
leB
rosm
ophy
cis
mar
gina
tare
dbr
otul
aLy
coda
pus
man
dibu
laris
palli
dee
lpou
tLy
code
sdl
apte
rus
blac
kee
lpou
tLy
code
spac
iilca
blac
kbel
lyee
lpos
tC
ymat
ogas
tara
ggre
gata
shin
erpe
rch
-ad
ult
-ju
veni
leD
an7a
litht
hys
vacc
api
lepe
rch
-ad
ult
juve
nile
Ron
quilu
sjo
rdan
ino
rthem
ronq
uil
Lum
penu
ssa
gitta
snak
epr
ickl
ebac
kS
ebas
tesm
alig
erqu
iliba
ckro
cktis
hA
nopl
opom
aIir
nbria
sabt
efis
hA
rledi
us~
.sc
ulpl
nD
asyc
ottu
sse
tiger
spln
yhea
dsc
ulpi
nC
hito
nolu
spug
eten
sls
roug
hbac
ksc
ulpi
nG
ilber
tidia
siga
lute
sso
ftsc
ulpi
nIc
elir,
usbo
real
isno
rther
nsc
ulpi
nLe
ptsc
ottu
sar
mat
usP
acifi
cst
agho
rnsc
ulpl
nN
autic
hthy
soc
ulot
asci
alus
sailt
insc
ulpi
nR
adul
inus
aspr
ellu
ssl
imsc
slpi
nB
athy
agon
usni
grip
inni
sbl
ackf
lnot
arsn
out
poac
her
Xen
eret
mus
latit
rons
blsc
kbp
poac
her
Xen
eret
mus
biac
anih
usbl
uesp
otte
dpo
ache
rC
ithar
icht
hys
op.
sand
dab
-ad
ult
-ju
veni
leC
ithar
lcht
hys
sord
idus
Paci
ficsa
ndda
bC
ithar
icht
hys
stig
mse
ussp
eckl
edsa
ndda
b-ad
ult
juve
nile
Ath
eres
thes
slom
ias
arro
wto
oth
floun
der
Gly
ptoc
epha
lus
zach
irus
ran
sole
-ad
ult
-juve
nile
Hip
pogl
osso
ides
elas
sodo
nfa
thea
dso
leLe
pido
pset
tabi
linea
taro
ckod
e-
adul
t-ju
venl
eLy
opse
ttaex
ilissl
ende
rso
le-
adul
t-ju
veni
leM
icro
stom
uspa
cjfic
usD
over
sole
Par
ophy
rsca
llus
Eng
lish
sole
-ad
ult
-ju
veni
leP
latic
hthy
sst
ella
tus
star
ryflo
unde
rP
leur
onic
hlhy
sco
enos
usC
Onn
ieP
sets
chlh
ysm
elan
ostic
lus
sand
sole
Por
tG
ardn
erP
ort
Gar
dner
Por
tG
ardn
erP
ort
Gar
dner
Por
tG
ardn
erP
ort
Gar
dner
SP86
SP86
SP86
SP86
SP86
SP86
Tran
220
STr
act
24f
lSTr
an2
liES
Trac
t4
205
Trac
t4
40S
Trac
t4
1455
Abu
ndB
iom
ass
Abu
ndB
lom
ass
Abu
ndB
iom
ass
Abu
ndB
iom
ass
Abu
ndB
lom
ass
Abu
ndB
tom
ass
15
127
19
215
300
560
0
12
250
221
0
255
211
203
335
115
0
540
520
0
115
412
02
5
1183
02
52
15
1114
208
80
816
10
417
60
I2
110
l—~ co CO
TOTA
L8
32
712
88
69
15
85
525
482
71
814
33
82

Ap
pe
nd
ixC
,T
ab
le1
1.
Nu
mb
er
(ab
un
da
nce
)o
ffish
,b
iom
ass
(in
gra
ms)
an
dra
ng
ea
tN
avy
an
dP
SD
DA
site
sfo
ro
tte
rtr
aw
lca
ught
fish
bysta
tio
nan
dsp
eci
es
inP
ort
Gar
dner
onJu
ne30
and
Ju
ly2,
1986
(StJ
86).
Fish
Spe
cies
Sci
en
tific
Nam
e
Por
tG
ardn
erP
ort
Gar
dner
Por
tG
ardn
erP
ort
Gar
dner
SU
BS
SU
86S
U86
SU
BS
NAV
YO
TP
SD
DA
2P
SD
DA
1T
rw1
20$
Com
mon
Nam
eA
bund
Ran
geB
iom
ess
Ran
geA
bund
Ran
geB
iom
ass
Ran
geA
bund
Ran
geB
iom
ass
Ran
geA
bund
Bio
mas
s
Lam
pel
ralri
dent
ata
Pac
ific
lam
prey
Squ
aksa
can#
rias
spin
ydo
gfis
h3.
71-
710
92.5
58
0-1
70
2R
aja
chin
alo
ngno
sesk
ate
Hyd
rola
gus
coilf
elra
ttuh
-ad
ult
53
-923
39.7
37
6-5
33
81.
30-
441
8.3
0-1
25
51
0-2
316.
50
-71
2-ju
veni
le1
0-2
5.3
0-1
410
.31-
2714
8.3
21
-47
7Al
coa
sapi
dlss
ima
Amer
ican
shad
Clu
pea
palla
sil
Pac
ific
herr
ing
Poric
Mth
ysno
lalu
spl
aint
inm
idsh
ipm
anG
adw
maa
vcep
haiu
sPa
cific
cod
Mic
roga
dus
prox
imus
Paci
ficto
mco
d-
adul
t-ju
veni
leM
erlu
cciu
spr
oduc
lus
Pac
ific
hake
-ad
ult
7.3
5-9
890.
54
64
-12
00
0.7
0-1
166.
30
-31
8-
juve
nile
Bro
smop
hyci
sm
argi
nata
red
brot
ula
Lyco
dapu
sm
andi
bula
rispa
llid
eelp
out
Lyco
des
diap
teru
sbl
ack
eelp
out
0.3
0-I
9.3
0-2
8Ly
code
opac
ilica
btac
kbel
lyee
lpou
t5.
73
-10
223
11
9-4
08
C,p
nalo
gast
erag
greg
ata
shin
erpe
rch
-ad
ult
-ju
veni
leD
amal
icht
hys
vacc
api
lepe
rch
Ron
quilu
sJo
rdan
north
ern
ronq
ull
Lum
penu
ssa
gitta
snak
epr
ickl
ebac
k$e
bast
esm
alig
erqu
iltba
ckro
ckfia
h1.
70
-247
9.7
12
0-9
35
0.7
0-1
212.
30
-38
3A
nspi
opom
alir
nb,la
sahi
efis
hA
rtedi
us~
.sc
ulpi
nD
asyc
otlu
sse
liger
spin
yhea
dsc
ulpi
nC
hito
notu
spug
eten
sis
roug
hbac
ksc
tdpi
nG
ilber
tidia
siga
luto
sso
ftsc
tdpi
nIc
olin
usbo
real
isno
rther
nsc
ulpi
nLe
ptoc
otlu
sar
mat
usP
acifi
cst
agho
rnsc
ulpi
nN
autlc
hthy
soc
tiofa
scla
o,s
sailt
insc
iripi
nR
aciu
linus
aspr
eilu
ssli
msc
ulpi
nB
alhy
agon
usni
grip
inni
sbl
ackt
nst
arsn
out
poac
her
10-
220
.70
-34
Xen
eret
mus
lalif
rons
blac
ktp
poac
her
0.3
0-I
2.5
0-7
Xen
ereb
nus
lflac
anth
usbk
resp
ofle
dpo
ache
rC
ithar
lchl
hys
sp.
sand
dab
-ad
ult
-ju
veni
leC
ithar
icht
hys
sord
idus
Paci
ficsa
ndda
bC
ilhar
ichl
hys
slig
mae
ussp
eckl
edsa
ndda
b-a
dult
-juve
nile
Ath
eres
thes
slom
ias
arro
wto
oth
tinun
der
Gly
ploc
eplta
ius
zach
irus
rev
sole
-adu
lt-
juve
nile
Hjo
pogi
sssc
ides
eias
sodo
nfa
thea
dso
le2.
30
-739
80-
119
4Lo
pido
pset
labi
liiie
ata
rock
sole
-ad
ult
-ju
veni
leLy
opse
tlaex
ilissl
ende
rso
le-
adul
t5
3-7
314.
717
5-58
12
1-3
97.3
57
-12
92.
70-
610
80-
212
-juve
nile
0.3
0-1
20-
6M
icro
stsm
uspa
ciltc
usO
over
uole
-adu
lt0.
70-
117
9.5
0-4
02
6.7
3-11
1927
.21
41
5-2
35
54
2-5
1142
,74
72
-17
72
-juve
nile
0.3
0-1
20
-60,
70-
13.
30
-5P
arop
hyrs
vetlu
sE
nglis
hso
le-
adul
t28
.72
3-2
553
78.2
38
37
-70
34
12.3
2-3
224
87.2
30
6-6
72
93
2-4
658.
82
62
-10
88
-ju
veni
leP
latic
hlhy
sst
ella
tus
star
ryflo
unde
rPl
etKo
nich
thys
coen
osus
COru
leP
selti
chlh
ysm
elan
oslic
tus
sand
sole
Por
tG
ardn
erP
ort
Gar
dner
SU
BS
SU
BS
Trai
tI
40$
Tran
IlO
OM
Abu
ndB
iom
ass
Abu
ndB
iom
ass
288
31
707
819
41.5
1428
1
531
9.5
I54
.589
3719
495
1,5
I10
.5
241
61
104.
5
236
228
.5
133
623
9
211
51
51
6.2
158
2
249.
515
1315
.528
6475
.5
GD
I-’
TOTA
L6
1.4
11
30
43
3.9
52
55
.91
3.4
24
64
32
48
5.5
122
66
84
.563
11
20
3

Ap
pe
nd
ixC
,T
ab
le11
(co
ntin
ue
d).
Fish
Spe
cies
Sci
en
tific
Nam
eC
omm
onN
ame
Lam
petra
tride
ntat
aP
acifi
cla
mpr
eySq
ualu
sac
antil
assp
iny
dogf
ish
Raj
arh
ina
long
nose
skat
eH
ydro
lagu
sco
llie!
raffi
sh-
adul
t-
juve
nile
Alos
asa
pidi
ssim
aAm
eric
ansh
adC
lupe
apa
llasi
iP
acifi
che
rrin
gP
oric
hthy
sno
tatu
spl
ainh
inm
idsh
ipm
anG
adus
mac
roce
phal
usPa
ciltc
cod
Mic
mga
dus
prox
imus
Paci
ficto
mco
d-
adul
t-ju
veni
leM
erlu
cciu
spr
oduc
tus
Paci
ficha
ke-
adul
t-
juve
nile
Bro
smop
hyci
sm
argi
nata
red
brol
ula
Lyco
dapu
sm
arrd
ibul
aris
palli
dee
lpou
tLy
code
sdi
apta
ivs
blac
kee
lpou
tLy
code
spac
illca
blac
kbel
lyee
lpou
tC
just
atog
aste
ragg
rega
tash
iner
perc
h-
adul
t-
juve
nile
Dam
alic
hlhy
sva
cca
pile
perc
hR
orrq
uilu
sjo
rdan
!no
rther
nro
nqul
lLu
mpe
nus
sagi
ttasn
ake
prlc
kleb
ack
Seb
aste
smal
iger
qulll
back
rock
tish
Ano
plop
oma
limbr
iasa
blef
ish
Arle
dius
~.
scul
pin
Das
ycot
tus
sellg
ersp
lnyh
ead
scul
pin
Chi
tono
lusp
ugot
ensi
srs
ughb
ack
scul
pin
Gilb
erO
dia
siga
lute
sso
ftsc
ulpi
nIc
elin
usbo
real
isno
rther
nsc
ulpl
nLe
ptoc
otlu
sar
mal
usP
acifi
cst
agho
rnsc
ulpi
nN
autic
hlhy
soc
ulof
asci
atus
sailt
insc
ulpi
nR
adul
inus
aspr
ellu
ssl
imsc
ulpi
nB
athy
agon
usni
grip
inni
sbl
ackf
inst
arsn
out
poac
her
Xen
erel
mus
IaO
7ron
sbl
ackt
ippo
ache
rX
ener
etnr
usld
acan
lhus
blue
spol
ted
poac
her
Cilh
aflc
hthy
sop
.sa
ndda
b-
adul
t-
juve
nile
Cith
aric
hihy
sso
rdid
usPa
cific
sand
dab
Cith
adch
thys
sllg
rnae
ussp
ecki
edsa
ndda
b-a
dult
-ju
veni
leA
ther
esth
esst
omia
sar
row
loot
hflo
unde
rG
lypt
ocep
halu
sza
chiru
sre
xso
le-a
dult
-ju
veni
leH4
xpog
loss
oide
sel
amod
onta
thea
dso
leLe
pido
pset
tabi
linea
taro
ckso
le-
adul
t-
juve
nile
Lyop
setta
exilis
slen
der
sole
-ad
ult
-ju
veni
leM
icro
stom
uspa
cific
usD
over
sole
-ad
ult
-ju
veni
leP
arop
hyrs
vellu
sEn
glis
hso
lead
ult
-ju
veni
leP
latic
hthy
sst
ella
lzJS
star
ryflo
unde
rP
leur
onic
hlhy
sco
enos
usCO
sole
Pse
ttich
lhys
mel
anos
O’c
tus
sand
sole
Por
tG
erdn
erP
ort
Gar
dner
Por
tG
ardn
erP
ort
Gar
dner
Por
tG
ardn
erP
ort
Gar
dner
Por
tG
ardn
erP
ort
Gar
dner
SU
86SO
86SU
86S
o86
5086
SO86
SO86
SO86
Trai
t2
20S
Tra
it2
405
Trai
t2
lbS
Tran
420
STr
ait
440
STr
ait
414
5SPS
DD
AR
ef1
PS
DD
AR
ef2
Abu
ndB
lom
ass
Abu
ndB
iom
ess
Abu
ndS
iam
ese
Abu
ndB
tom
ase
Abu
ndB
iom
ass
Abu
ndB
tom
aee
Abu
ndB
iom
aee
Abu
ndB
iom
ese
476
2518
2115
116
002
522
139
703
1055
142
01
111
13
128
.51
148.
51
1500
1683
3
114
31
181
371
1
366
17
119
761
.5
142
11
270
136
0.5
143
123
1t2
0
I22
231
310
.5
317
4.5
16.
51
23.5
560
6.5
113
224
.5I
186
292
.5
150
316
31
67.5
415
636
1955
449
4.5
14
224
9.5
2218
70.5
447
56
439.
55
1540
510
50
125
9.5
l-~ CO
TOTA
L14
65
7.5
561
13
46
303
85
011
481
16
7.5
125
08
322
56
65
.515
55
88

Fish
Spe
cies
Sci
en
tific
Nam
eC
omm
onN
ame
Pac
ific
lam
prey
spin
ydo
gfis
hlo
ngno
sesk
ate
raffi
sh-
adul
t-
jLPjen
hleAm
eric
ansh
adP
acifi
che
rrin
gpl
ainf
inm
idsh
ipm
anP
aclfc
cod
Paci
ficto
mco
d-
adul
t-ju
veni
leP
acifi
cha
ke-
adul
t-
juve
nIle
red
brot
ula
palli
dee
ipou
tbl
ack
eeip
out
blac
kbei
lyee
ipou
tsh
iner
perc
h-
adul
t-ju
veni
lepi
lepe
rch
-ad
ult
-ju
veni
leR
onqu
ilus
Jord
an!
north
ern
ronq
uil
Lso~
penu
ssa
gitta
snak
epr
ickl
ebac
kSe
bast
osm
aiig
erqu
lilba
ckro
ckfis
hA
nypl
opom
atin
sbrla
sabl
efis
hA
rtodl
usop
.sc
uipi
nD
asyc
oiiu
sse
tiger
spin
yhea
dsc
ulpi
nC
hito
noiu
spug
elen
sis
roug
hbac
ksc
ulpi
nG
ilber
iidia
siga
luie
sso
ftsc
ulpi
nIc
eiln
usbo
real
isno
rther
nsc
uipi
nLo
pioc
otiu
san
natu
sP
acifi
cst
agho
rnsc
ulpi
nN
autlc
hthy
soc
ulof
ascl
atus
sailt
insc
ulpi
nR
adul
inus
aspr
eilu
ssl
imac
ulpl
nB
athy
agon
usni
grip
inni
sbl
ackf
inst
atsn
out
poac
her
Xer
iere
tmus
latif
rons
blac
klip
poac
her
Xen
vrei
mus
frlac
anlls
jsbl
uesp
otte
dpo
ache
rC
iihar
icht
hys
sp.
sand
dab
-ad
ult
-ju
veni
leC
ithar
icht
hys
sord
idus
Pac
ific
sand
dab
-ad
ult
-juve
nile
Clih
sflc
hthy
sst
igm
aeus
spec
kled
sand
dab
-ad
ult
-juve
nile
Athe
rest
hea
stom
las
arro
Wto
oth
floun
der
Gly
ptoc
epha
lus
zach
irus
rev
sole
-ad
ult
-ju
veni
leH
jopo
gios
scld
esel
asso
don
tath
ead
sole
Lepi
dops
eita
bilin
eata
rock
sole
-ad
ult
-ju
veni
eLy
opse
ttaex
ilissl
ende
rso
le-
adul
t-
juve
nile
Mic
rost
omus
paci
ftcus
Dov
erso
leP
arop
hyrs
vetlu
sE
nglis
hso
le-
adul
t-
juve
nIle
Pla
ticht
hys
stel
latu
sst
arry
floun
der
Ple
uron
icht
hys
coen
osus
COso
leP
setil
chth
ysm
eian
ostic
tus
sand
sole
6.7
0-1
541
1.7
0-7
25
0.7
30
-923
3.3
0-7
00
630
635
04
6~5
031
24li)
.)
Ap
pe
nd
ixC
,T
ab
le1
2.
Num
ber
(ab
un
da
nce
)o
ffish
,b
iom
ass
(in
gra
ms)
and
ran
ge
at
Nav
yan
dPS
DD
Asite
sfo
ro
tte
rtr
aw
lca
ught
fish
bysta
tio
nan
dsp
eci
es
inP
ort
Gar
dner
onS
ep
tem
be
r11
and
15,
1986
(AU
86).
Lam
petra
fride
nial
sS
quah
sac
anth
ias
Raj
arh
ina
Hyd
rola
gus
colli
e!
Alos
asa
pkiis
sim
aC
lupe
apa
iasl
iP
oric
hthy
sno
taiu
sG
aolu
xmac
roce
phsl
usM
ic-ro
gadu
spr
oxim
us
Mer
lucc
ius
prod
uctu
s
Bro
sn,o
phyc
ism
argi
nata
Lyco
dapu
sm
ar,d
ibul
aris
Lyco
des
diap
teni
sLy
code
spa
ciflc
aC
ymal
ogas
iera
ggre
gata
Dam
alic
hihy
sva
cca
Por
tG
ardn
erP
ort
Gar
dner
Por
tG
ardn
erP
ort
Gar
dner
Por
tG
ardn
erP
ort
Gar
dner
AU86
AU86
AU86
AU86
AU86
AU86
NAV
YO
TP
SD
DA
2PS
DD
AI
Tran
I20
STr
anI
40S
Tran
1lO
fiMA
bund
Ran
geB
iom
asa
Ran
geA
bund
Ran
geB
iom
aea
Ran
geA
bund
Ran
geB
iom
ass
Ran
geA
bund
Blo
maa
aA
bund
Bio
mas
sA
bund
Bio
maa
a
0.7
0-1
298.
30
-46
5
8.3
3-1
710
32.5
41
2-1
51
01
1-1
611.
710
5-88
01
0-2
498.
30
-13
90
18.3
3-3
648
9.2
137-
1090
0.3
0-1
4.8
0-1
42
80
0.3
0-1
990
0-2
97
00.
30-
10.
50-
112
602
40-
139
1.7
0-8
60
247
56.
35-
78.
57
-Il
0.3
0-1
30-
91
0-3
7.5
0-2
21.
30-
325
0-71
255
0.7
0-1
241.
70
-38
50.
30-
110
8.3
0-3
25
0.3
0-I
23.3
0-7
0
0-2
30.
70-
111
.30
-20
1.7
0-3
26.3
0-4
6
0.7
0-1
230
-40
335
1.3
0-2
385
0-6
10
0.7
0-2
7.8
113
.5
18
253
0.7
0-2
83.3
0-2
50
175
210
0
10
-284
.30
-11
05
760
239
2219
-26
1148
.79
50
-14
00
7.7
7-8
471.
74
25
-53
57.
72
-16
353.
26
9-7
50
490
IS
1.7
0-4
461.
70
-97
01.
70-
456
6.7
0-1
61
02
405
56.3
30
-72
9000
51
70
-10
97
03.
30-
667
1.7
0-1
34
52.
72-
676
1.7
54
0-9
60
551
017
370
348
0
415
TOTA
L1
18
.61
37
84
18.1
32
74
.224
23
56
89
60
581
86
820
22
77
.5

Ap
pe
nd
ixC
,T
ab
le12
(co
ntin
ue
d).
Fish
Spe
cies
Sci
en
tific
Nam
eC
omm
onN
ame
Lam
pet
ratri
dent
ala
Pac
ific
lam
prey
Squa
lus
acan
t’ias
spin
ydo
gfis
hR
ajar
hina
longn
ose
skat
eH
ydro
lagu
sco
uld
raIl
sh-
adul
t-
juve
nile
Alco
asa
pklis
oim
aAm
eric
ansh
adC
lupe
apa
llasi
iP
acifi
che
rrin
gP
cric
hthy
sno
tatu
spl
ainh
inm
idsh
ipm
anG
adus
maa
vcep
haki
oPa
cific
cod
Mic
roga
dus
prox
imus
Paci
ficto
mco
dad
ult
juve
nile
Mer
lucc
ius
prad
uctu
sPa
cific
hake
-ad
ult
-ju
veni
leB
rosm
ophy
cis
mar
gina
tare
dbr
otul
aLy
coda
pus
man
dibu
laris
palli
dee
lpou
tLy
code
sdi
apte
rus
blac
kee
lpou
tLy
code
spac
iflca
blac
kbel
lyee
lpou
tC
ymat
gsle
ra~g
rega
tash
iner
perc
h-
adul
t-ju
venI
le19
175
Dam
alic
hthy
sva
cca
pile
perc
h-
adul
t-
juve
nile
Ron
quilu
sjo
rdan
ino
rther
nro
nqui
lLu
mpe
nus
sagi
ttasn
ake
pric
kleb
ack
Seba
stes
mal
lger
quill
back
rock
fish
Ano
plop
oma
hmbr
lasa
blef
ish
Arte
dlus
up.
scul
pin
Das
ycot
tus
seSg
ersp
inyh
ead
scul
pin
Chl
tono
lusp
ugel
ensi
oro
ughb
ack
scul
pin
Gilb
erlid
iaoi
galu
tes
soft
scul
pin
Icel
inus
bore
alis
north
ern
scul
pin
Lept
ocot
luo
arm
atus
Pac
ific
stag
horn
scul
pin
Nau
tlchl
hyo
ocul
olas
ciat
ussa
ilfin
ocul
pin
Rad
ulin
usao
prel
lus
slim
scul
pin
Bat
hyag
onus
nlgr
ipin
nis
blac
ktn
star
snou
tpo
ache
rX
ener
etm
usla
tifro
nsbl
acki
lppo
ache
rX
ener
elm
usbi
acan
thus
blue
spot
ted
poac
her
Cilh
aric
hthy
asp
.oa
ndda
b-
adul
t-
juve
nile
Cith
aric
hlhy
sso
rdid
usPa
cific
oand
dab
-ad
ult
juve
nile
Cith
adch
thys
shEgm
aeus
spec
kled
oand
dab
-ad
ult
248
-juve
nil
117
Alh
eres
lhes
stom
las
arro
wto
oth
floun
der
Gly
ptoc
epha
lus
zach
irus
reu
sole
-ad
ult
-juve
nile
Hpi
pogi
oosc
ldes
elas
sodo
nfa
thea
dso
leLe
pido
poel
labi
li,te
ata
rock
sole
-ad
ult
-ju
veni
leLy
opse
ltaex
iliosl
ende
rso
lead
ult
-ju
veni
leM
icro
slom
uspa
cilic
usD
over
sole
Par
ophy
rsve
tlus
Eng
lish
sole
-ad
ult
-ju
veni
leP
lalic
hlhy
ssl
ella
luo
star
ryflo
unde
rPl
euro
rrlch
lhys
coen
osus
COso
leP
setli
chth
ysm
elax
ostic
tus
sand
sole
Por
tG
ardn
erP
ort
Gar
dner
Por
tG
ardn
erP
ort
Gar
dner
Por
tG
ardn
erP
ort
Gar
dner
Por
tG
ardn
erP
ort
Gar
dner
Por
tG
ardn
erAU
86AU
86AU
86AU
86AU
86AU
86AU
86AU
86AU
86Tr
an2
20S
Tran
240
STr
ait
2lb
STr
an4
20S
Tran
440
STr
an4
1455
PS
DD
AR
ef1
PSO
DA
Ref
2S
teS
Abu
ndB
lom
ass
Abu
ndB
iom
ees
Abu
ndB
iom
esa
Abu
ndB
iom
ess
Abu
ndB
iom
ass
Abu
ndB
iom
ess
Abu
ndB
iom
ess
Abu
ndB
iom
ess
Abu
ndB
iom
ess
282
51
510
140
0
131
53
510
818
0I
32
14.
5
369
5
28.
537
165
13
13.
52
1035
426
69
12.5
125
1614
11
252
271
332
21
221
15.
52
23.5
21
t23
485
176
131
176
26.
52
7
24.
5
13
230
138
123
.52
80
Ina
322
0
325
53
125
525
012
230
211
53
364
185
412
01
753
125
840
06
240
77.
57
575
139
.52
575
144
52
220
332
552
2685
691
513
1300
2817
554
1105
717
303
660
18.
5
TOTA
L29
692
683
18
739
49
34
.521
15
63
892
69
74
418
341
95
8.5
343
97
15
171
58
7.5
185
APPENDIX D
Abundance and biomass (and range of multiple
sample stations) of beam trawl-caught fish by
station and species in Commencement Bay,
Elliott Bay and Saratoga Passage.
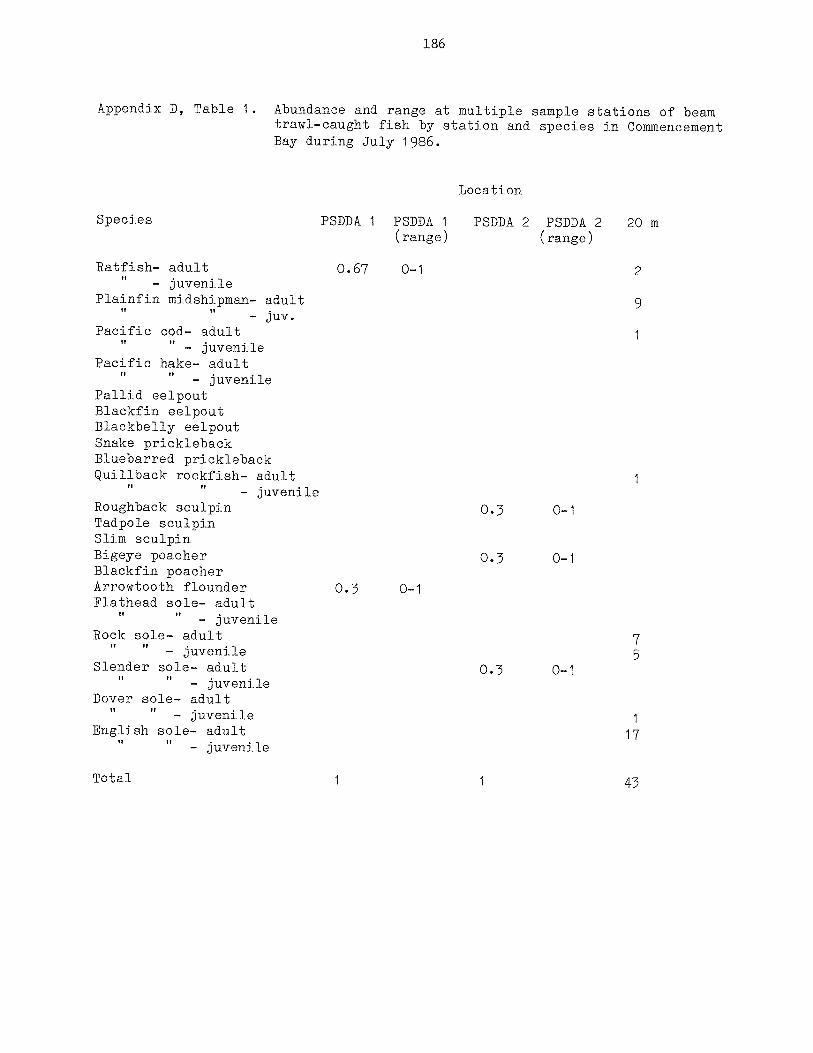
186
Appendix D, Table 1. Abundance and range at multiple sample stations of beamtrawl-caught fish by station and species in CommencementBay during July 1986.
Location
Species PSDDA 1 PSDDA 1 PSDDA 2 PSDDA 2 20 m(range) (range)
Ratfish- adult 0.67 0-1 2— juvenile
Plainfin midshipman- adult 9- juv,
Pacific cod— adult— juvenile
Pacific hake— adult— juvenile
Pallid eelpoutBlackfin eelpoutBlackbelly eelpoutSnake pricklebackBluebarred pricklebackQuiliback rockfish— adult
— juvenileRoughback sculpin 0.3 0-1Tadpole sculpinSlim sculpinBigeye poacher 0.3 0-1Blackfin poacherArrowtooth flounder 0.3 0—1Flathead sole- adult
— juvenileRock sole— adult 7
— juvenile 5Slender sole— adult 0.3 0—1
— juvenileDover sole— adult
— juvenileEnglish sole— adult 17
— juvenile
Total 1 43

187
Appendix D, Table 2. Biomass (in grams) and range at multiple samplestations of beam trawl—caught fish by station andspecies in Commencement Bay during July 1986.
Location
Species PSDDA 1 PSDDA 1 PSDDA 2 PSDDA 2 20 m(range) (range)
Ratfish- adult 143.7 0-381 770.0— juvenile
Plainfin midshipman- adult 406.5- Juv.
Pacific cod— adult 106.0— juvenile
Pacific hake- adultI’ — juvenile
Pallid eelpoutBlackfin eelpoutBlackbelly eelpoutSnake pricklebackBluebarred pricklebackQuillback rockfish— adult 175.0
— juvenileRoughback sculpin 3.3Tadpole sculpinSlim sculpinBigeye poacher 6.7 0—20Blackfin poacherArrowtooth flounder 68.5 0-205Flathead sole— adult
— juvenileRock sole- adult 304.5
— juvenile 52.5Slender sole— adult 35.0 0—105
— juvenileDover sole- adult
— juvenile 7.5English sole— adult 2,369.5
— juvenile
Total 212.0 45.0 4,191.5
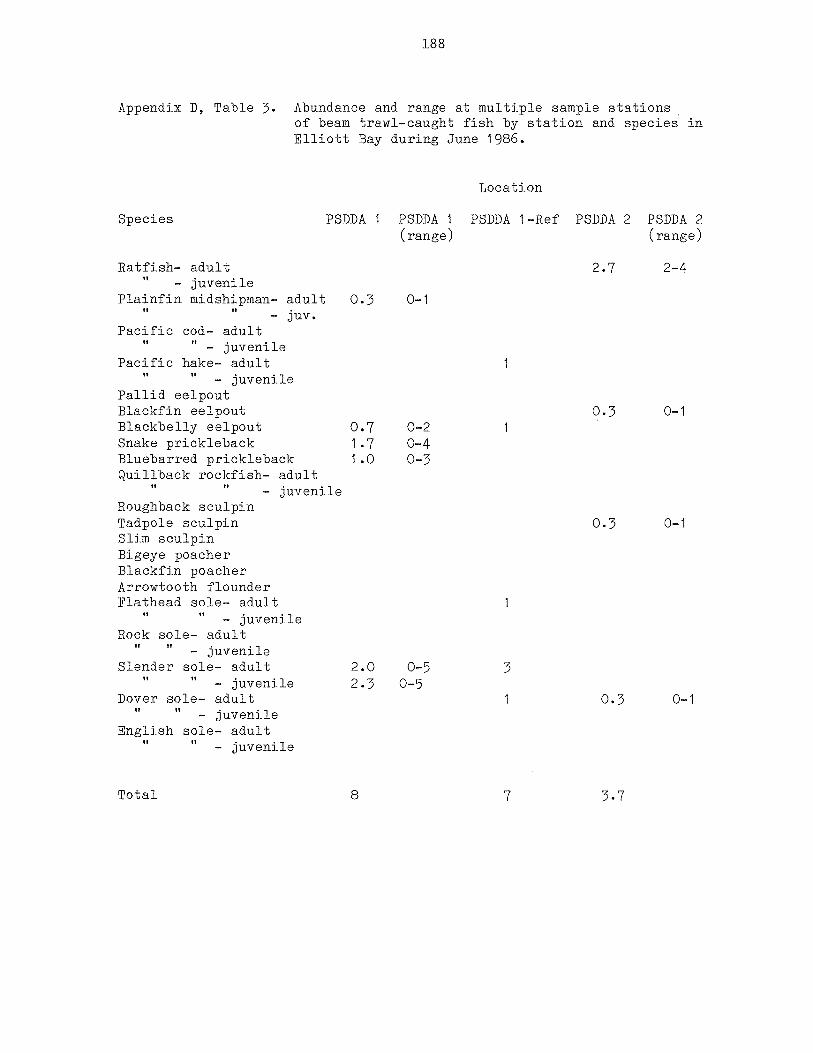
188
Appendix D, Table 3. Abundance and range at multiple sample stationsof beam trawl-caught fish by station and species inElliott Bay during June 1986.
Location
Species PSDDA 1 PSDDA 1 PSDDA 1-Ref PSDDA 2 PSDDA 2(range) (range)
Ratfish— adult 2.7 2—4— juvenile
Plainfin midshipman- adult 0.3 0-1- juv.
Pacific cod— adult— juvenile
Pacific hake- adult 1— juvenile
Pallid eelpoutBlackfin eelpout 0.3 0-1Blackbelly eelpout 0.7 0-2 1Snake prickleback 1 .7 0-4Bluebarred prickleback 1 .0 0-3Quillback rockfish- adult
— juvenileRoughback sculpinTadpole sculpin 0.3 0-1Slim sculpinBigeye poacherBlackfin poacherArrowtooth flounderFlathead sole— adult 1
— juvenileRock sole— adult
— juvenileSlender sole— adult 2.0 0—5 3
I’ — juvenile 2.3 0—5
Dover sole— adult 1 0.3 0—1— juvenile
English sole— adult— juvenile
Total 8 7 3.7

189
Appendix D, Table 4. Biomass (in grams) and range at multiple samplestations of beam trawl—caught fish by station andspecies in Elliott Bay during June 1986.
Location
Species PSDDA 1 PSDDA 1 PSDDA 1-Ref PSDDA 2 PSDDA 2(range) (range)
Ratfish- adult 632.3 386—1,102— juvenile
Plainfin midshipman— adult 4.3 0-13.0— juv,
Pacific cod— adult— juvenile
Pacific hake— adult 258.0— juvenile
Pallid eelpoutBlackfin eelpout 5.7 0—17Blackbelly eelpout 2.5 0—7.5 41.0Snake prickleback 5.4 0-13.1Bluebarred prickleback 4.4 0-13.3Quillback rockfish— adult
— juvenileRoughback sculpinTadpole sculpin 1 .0 0-3Slim sculpinBigeye poacherBlackfin poacherArrowtooth flounderFlathead sole- adult 147.0
I’ — juvenile
Rock sole— adultU U — juvenile
Slender sole— adult 58.3 0—153.0 191.0— juvenile 9.9 0—23.3
Dover sole- adult 950.0 184.7 0—554- juvenile
English sole— adult— juvenile
Total 602.2 1595.0 823.7

190
Appendix D, Table 5. Abundance and range at multiple sample stationsof beam trawl—caught fish by station and speciesat Elliott Bay during September 1986.
Location
Species PSDDA 1 PSDDA 1 PSDDA 1-Ref PSDDA 2 PSDDA 2(range) (range)
Ratfish- adult— juvenile 2 1 0—2
Plainfin midshipman- adult- Juv.
Pacific cod— adult— juvenile
Pacific hake- adult— juvenile
Pallid eelpout 0.5 0—1Blackfin eelpout 0.7 0-2Blackbelly eelpout 5.0 1—12Snake pricklebackBluebarred prickleback 5.3 0-5Quiliback rockfish- adult
— juvenileRoughback sculpinTadpole sculpinSlim sculpinBigeye poacherBlackfin poacherArrowtooth flounderFlathead sole— adult 1.3 0—3
— juvenileRock sole— adult
— juvenileSlender sole— adult 5.3 2—9 0.3 0—1
— juvenile 7.0 0—14 1Dover sole— adult 0.3 0-1 0.3 0—1
— juvenileEnglish sole— adult
— juvenile
Total 22.3 3 2.7

191
Appendix B, Table 6. Biomass (in grams) and range at multiple samplestations of beam trawl—caught fish by station andspecies in Elliott Bay during September 1986.
Location
Species PSDDA 1 PSDDA 1 PSDDA 1-Ref PSDDA 2 PSDDA 2(range) (range)
Ratfish- adultIt - juvenile 61 14.1 0—24.9
Plainfin midshipman- adultII — juv.
Pacific cod— adult— juvenile
Pacific hake- adult— juvenile
Pallid eelpout 1.7 0—5.2Blackfin eelpout 2.4 0—7.3Blackbelly eelpout 75.6 1.5—210Snake pricklebackBluebarred prickleback 15.9 14.5—17.9Quillback rockfish- adult
— juvenileRoughback sculpinTadpole sculpinSlim sculpinBigeye poacherBlackfin poacherArrowtooth flounderFlathead sole— adult 131 .3 0—330
— juvenileRock sole- adult
— juvenileSlender sole— adult 97.5 26.5—175 24.8 0—74.5
— juvenile 25.5 0—45.6 7.6Dover sole— adult 70.7 0—212 68.3 0—205
— juvenileEnglish sole— adult
— juvenile
Total 416.5 68.6 111.3
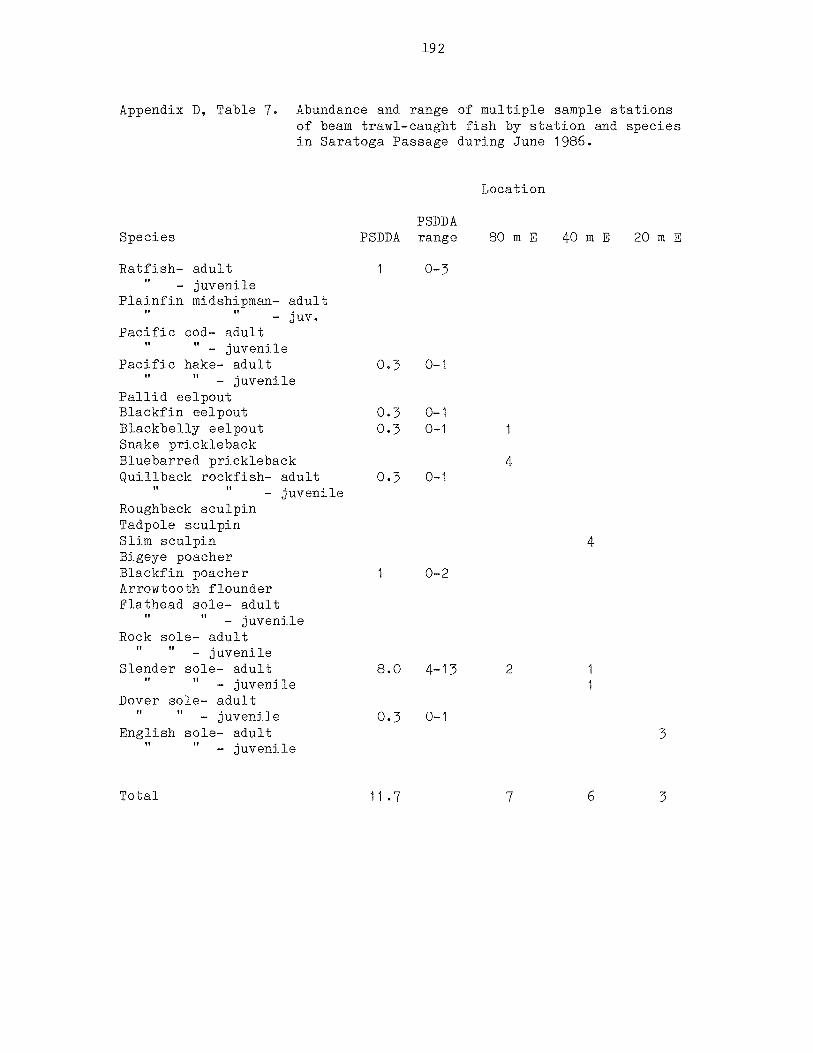
192
Appendix D, Table 7. Abundance and range of multiple sample stationsof beam trawl—caught fish by station and speciesin Saratoga Passage during June 1986.
Location
PSDDASpecies PSDDA range 80 m E 40 m E 20 rn E
Ratfish- adult 1 0—3— juvenile
Plainfin midshipman- adult- juv.
Pacific cod— adult— juvenile
Pacific hake- adult 0.3 0-1— juvenile
Pallid eelpoutBlackfin eelpout 0.3 0—1Blackbelly eelpout 0.3 0—1Snake pricklebackBluebarred prickleback 4Quillback rockfish- adult 0.3 0—1
— juvenileRoughback sculpinTadpole sculpinSlim sculpin 4Bigeye poacherBlackfin poacher 1 0—2Arrowtooth flounderFlathead sole- adult
— juvenileRock sole— adult
— juvenileSlender sole— adult 8.0 4—13 2
— juvenileDover sole— adult
— juvenile 0.3 0—1English sole— adult 3
— juvenile
Total 11.7 7 6 3

193
Appendix D, Table 8. Biomass (in grams) and range at multiple samplestations of beam trawl-caught fish by station andspecies in Saratoga Passage during June 1986.
Location
PSDDASpecies PSDDA (range) 80 m E 40 in E 20 in E
Ratfish— adult 421.7 0—1 ,265— juvenile
Plainfin midshipman- adult- juv.
Pacific cod— adult— juvenile
Pacific hake- adult 228.7 0—686— juvenile
Pallid eelpoutBlackfin eelpout 4.5 0—13Blackbelly eelpout 27.0Sna]ce pricklebackBluebarred prickleback 19.5Quillback rockfish— adult 65.3 0—196
— juvenileRoughback sculpinTadpole sculpinSlim sculpin 10.5Bigeye poacherBlackfin poacher 6.7 0—15Arrowtooth flounderFlathead sole- adult
— juvenileRock sole- adult
— juvenileSlender sole— adult 276.3 117—483 63.0 21.0
It It — juvenile 21.5
Dover sole— adult— juvenile 1.2 0—3.5
English sole- adult 52.0II — juvenile
Total 1,004.2 109.5 51.0 52.0

194
APPENDIX E
Number of flatfish per hectare
caught by otter trawl in Commencement
Bay, Elliott Bay, Saratoga Passage and
Port Gardner, shown by season, station
and species.

Ap
pe
nd
ixE
,T
ab
le1
.N
umbe
ro
fe
ach
fla
tfis
hsp
ecie
sp
er
he
cta
reca
ug
ht
by
ott
er
tra
wl
at
ea
chsta
tio
nin
Com
men
cem
ent
Bay
du
rin
gsu
mm
eran
da
utu
mn
,1
98
6.
PS
DD
A1
PS
DD
A2
20m
40
m1
56
mS
UB
6A
U8
6S
U86
AU
86S
U86
AU
86S
U86
AU
86S
U86
AU
B6
Fla
tfis
hS
peci
esF
ish
/Ha
Fis
h/H
aF
ish
/Ha
Fis
h/H
aF
ish
/Ha
Fis
h/H
aF
ish
/Ha
Fis
h/H
aF
ish
/Ha
Fis
h/H
a
spec
kled
sand
dab
-adu
lt9
arro
wto
oth
floun
der
1.35
279
13.5
rex
sole
-adu
lt36
flath
ead
sole
-adu
lt72
rock
sole
-ad
ult
slen
der
sole
-ad
ult
4.5
16.6
51.
355.
8554
13.5
Dov
erso
le-
adul
t5.
853
7.3
54.
514
.85
22.5
67.5
2754
-ju
veni
le13
.5U
i
Eng
lish
sole
-ad
ult
3.15
1.35
85.5
180
819
13.5
CO
sole
-ad
ult
4.5
TO
T.
FLA
TF
ISH
/Ha
10
.35
57
.15
7.2
22
.05
017
12
38
.51
04
427
94
.5

Ap
pe
nd
ixE
,T
ab
le2
.N
umbe
ro
fe
ach
fla
tfis
hsp
ecie
sp
er
he
cta
reca
ug
ht
by
ott
er
tra
wl
at
ea
chsta
tio
nin
Ellio
ttB
ayd
urin
gsu
mm
eran
da
utu
mn
,1
98
6.
PS
DD
A1
PS
DD
A1
Ref
PS
DD
A2
PS
DD
A2
Ref
1P
SD
DA
2R
ef2
SU
86A
US
6S
U86
AU
86S
U86
AU
86S
U86
AU
86A
U86
Fla
tfis
hS
peci
esF
ish
/Ha
Fis
h/H
aF
ish
/Ha
Fis
h/H
aF
ish
/Ha
Fis
h/H
aF
ish
/Ha
Fis
h/H
aF
ish
/Ha
rex
sole
-adu
lt5.
8510
.35
4.5
1.35
-juve
nile
5.85
flath
ead
sole
-adu
lt25
.65
111.
1567
.54.
5ro
ckso
le-
adul
t1.
35sl
ende
rso
le-
adul
t70
.65
21
0.1
554
3627
41
.85
13.5
3640
.5-ju
veni
le10
.35
32.8
54.
5D
over
sole
-ad
ult
10.3
510
.35
4.5
19.3
53
0.1
540
.59
13.5
-juve
nile
4.5
Eng
lish
sole
-ad
ult
1.35
1.35
73.3
54.
512
614
8.5
TO
T.
FLA
TF
ISH
/Ha
12
8.7
38
2.0
51
35
40
.54
7.7
14
6.7
58
.517
12
02
.5

Ap
pe
nd
ixE
,T
ab
le3
.N
umbe
ro
fe
ach
fla
tfis
hsp
ecie
sp
er
he
cta
reca
ug
ht
by
ott
er
tra
wl
at
ea
chsta
tio
nin
Sa
rato
ga
Pa
ssa
ge
du
rin
gsu
mm
er,
19
86
.
PSD
DA
PSD
DA
Ref
2Om
E4O
mE
40m
W8O
mE
SU
86
SU
86
SU
86S
U8
6S
U86
SU
86
Fla
tfis
hS
pe
cie
sF
ish
/Ha
Fis
h/H
aF
ish
/Ha
Fis
h/H
aF
ish
/Ha
Fis
h/H
a
rex
sole
-adu
lt4.
5fla
thea
dso
le-a
dult
rock
sole
-ad
ult
922
.5sl
ende
rso
le-
adul
t12
.15
13.5
4.5
18D
over
sole
-ad
ult
4.5
Engl
ish
sole
-ad
ult
1831
.59
31.5
TOT.
FLA
TFIS
H/H
a1
2.1
51
3.5
275
8.5
95
8.5

Ap
pe
nd
ixE
,T
ab
le4
.N
umbe
ro
fe
ach
fla
tfis
hsp
ecie
sp
er
he
cta
reca
ug
ht
by
ott
er
tra
wl
at
ea
chsta
tio
nin
Po
rtG
ard
ne
rd
urin
gw
inte
r,1
98
6.
Tra
nsec
t1
Tran
sect
1T
rans
ect
1Tr
anse
ct2
Tra
nsec
t2
Tran
sect
2Tr
anse
ct4
Tran
sect
4T
rans
ect
4N
avy
PS
DD
A2
PS
DD
A1
20
S4
09
lOO
M2
09
40
S1
10
82
0S
40
81
45
SC
omm
onN
ame
Fis
h/H
aF
ish/
Ha
Fis
h/H
aF
ish/
Ha
Fis
h/H
aF
ish/
Ha
Fis
h/H
aF
ish/
Ha
Fis
h/H
aF
ish/
Ha
Fis
h/H
aF
ish/
Ha
sarid
dab
-ad
ult
00
09
40.5
04.
554
018
00
-ju
veni
le0
00
4.5
370
00
022
.50
0Pa
ciiic
sand
dab
00
00
00
00
00
4.5
0sp
eckl
edsa
ndda
b-
adul
t0
00
00
00
00
011
70
-juve
nile
00
00
00
00
00
4.5
0ar
row
toot
hflo
unde
r0
01.
350
4.5
00
4.5
00
00
rex
solo
-ad
uft
92.
251.
350
09
04.
54.
50
00
-juve
nile
00
00
04.
50
00
00
0fla
thoa
dso
le11
5.65
2.25
04.
522
.50
00
018
4.5
0ro
ckso
lo-
adul
t1.
350
1.35
958
.50
4.5
76.5
00
990
-juve
nile
00
09
22.5
09
4.5
04.
540
.50
slen
der
sole
-ad
ult
136.
565
.25
117
00
4.5
027
4.5
13.5
063
-juve
nile
40.5
00
00
4.5
00
00
00
Dove
rso
le32
.85
22.5
16.6
50
09
04.
549
.50
012
6En
glis
hso
le-
adul
t49
9.5
15.7
531
.54.
576
.511
70
301.
536
063
00
-juve
nile
3.15
00
4.5
706.
50
024
30
4.5
00
star
ryflo
unde
r0
00
00
00
00
00
0DO
sole
00
00
4.5
00
00
4.5
00
sand
sole
00
00
00
00
00
00
TO
T.
FLA
TF
ISH
/He
83
8.5
10
81
69
24
59
73
14
8.5
18
72
09
4.5
85
.59
00
18
9
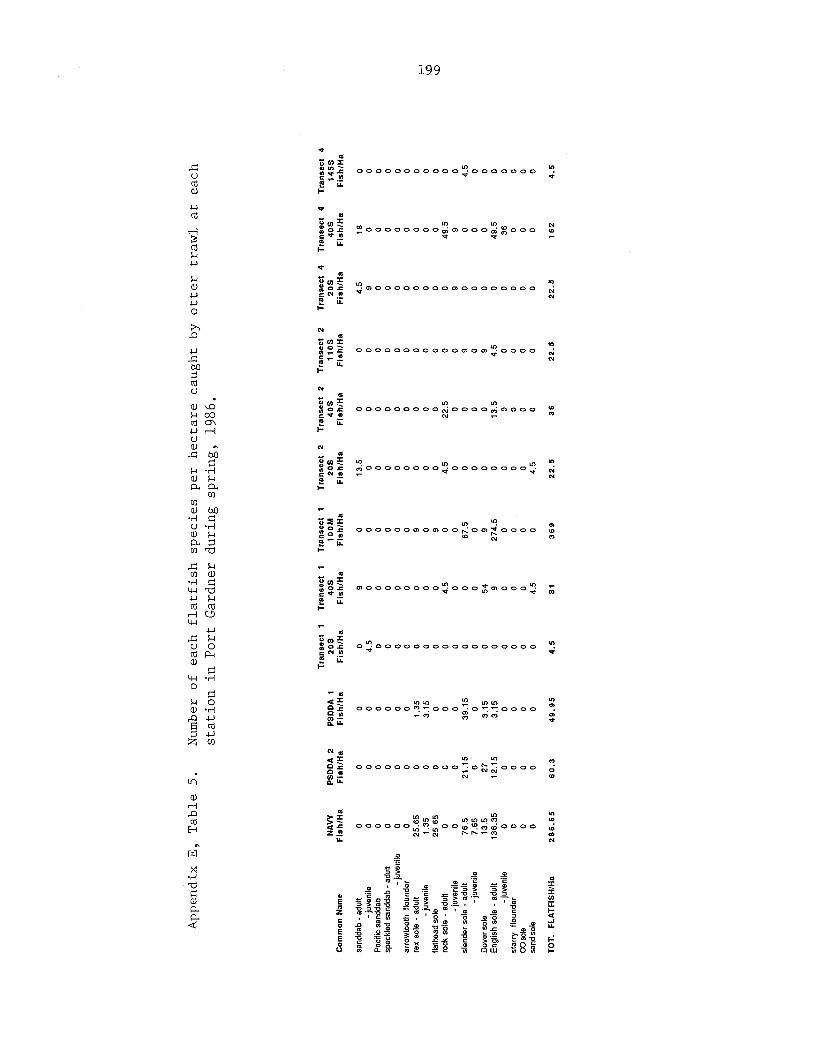
Ap
pe
nd
ixE
,T
ab
le5
.N
umbe
ro
fe
ach
fla
tfis
hsp
ecie
sp
er
he
cta
reca
ug
ht
by
ott
er
tra
wl
at
ea
chsta
tio
nin
Po
rtG
ard
ne
rd
urin
gsp
rin
g,
1986
.
Tra
nse
ctI
Tra
nse
ct1
Tra
nse
ct1
Tra
nse
ct2
Tra
nse
ct2
Tra
nse
ct2
Tra
nse
ct4
Tra
nse
ct4
Tra
nse
ct4
NA
VY
PS
DD
A2
PS
DD
A1
20
S4
05
lOO
M2
0S
40
51
10
52
05
40
S1
45
5C
omm
onN
ame
Fis
h/H
aF
ish
/Ha
Fis
h/H
aF
ish
/Ha
Fis
h/H
aF
ish
/Ha
Fis
h/H
aF
ish
/Ha
Fis
h/H
aF
ish
/Ha
Fis
h/H
aF
ish
/Ha
uand
dab
-ad
ult
00
00
90
13.5
00
4.5
180
-juvo
nilo
00
04.
50
00
00
90
0Pa
cific
sand
dab
00
00
00
00
00
00
spec
kled
sand
dab
-ad
ult
00
00
00
00
00
00
-juve
nile
00
00
00
00
00
00
arro
wto
oth
floun
der
00
00
00
00
00
00
rex
solo
-ad
ult
25
.65
01.
350
09
00
00
00
-juve
nile
1.35
03
.15
00
00
00
00
0ila
thoa
dso
le2
5.6
50
00
09
00
00
00
rock
solo
-ad
ult
00
00
4.5
04.
522
.50
049
.50
-juve
nile
00
00
00
00
09
90
slen
der
solo
-adu
lt76
.521
.15
39.1
50
067
.50
09
00
4.5
-juve
nile
7.65
00
00
00
00
00
0D
ovor
uole
13.5
273.
150
549
00
90
00
Engl
ish
sole
-ad
ult
13
6.3
51
2.1
53
.15
09
27
4.5
013
.54.
50
49
.50
-juve
nile
00
00
00
00
00
360
star
ryflo
unde
r0
00
00
00
00
00
0co
sole
00
00
00
00
00
00
sand
sole
00
00
4.5
04.
50
00
00
TO
T.
FLA
TF
ISH
/Hs
28
6.6
56
0.3
49
.95
4.5
813
69
22
.53
62
2.5
22
.51
62
4.5

Ap
pe
nd
ixE
,T
ab
le6
.N
umbe
ro
fe
ach
fla
tfis
hsp
ecie
sp
er
he
cta
reca
ug
ht
by
ott
er
tra
wl
at
ea
chsta
tio
nin
Po
rtG
ard
ne
rd
urin
gsu
mm
er,
19
86
.
Tra
nsec
t1
Tra
nsec
t1
Tra
nsec
t1
Tra
nsec
t2
Tra
nsec
t2
Tra
nsec
t2
Tra
nsec
t4
Tra
nsec
t4
Tra
nsec
t4
PS
DD
AP
SD
DA
Com
mon
Nam
eN
AVY
PS
DD
A2
PS
OD
A1
20S
405
lOO
M20
54
05
11
05
20S
40S
145S
Ref
1R
ef2
Fis
h/H
aF
ish
/Ha
Fis
h/H
aF
ish
/Ha
Fis
h/H
aF
ish
/He
Fis
hlH
aF
ish
/Ha
Fis
h/H
aF
ish
/Ha
Fis
h/H
aF
ish
/Ha
Fis
h/H
aF
ish
/Ha
sand
dab
-ac
ctt
00
00
4.5
04.
50
09
00
00
-juve
nile
00
00
00
00
013
.50
00
0P
acltc
sand
dab
00
00
00
00
00
00
00
spec
kled
sand
dab
-adu
lt0
00
00
00
00
00
00
0-ju
venf
e0
00
00
00
00
00
00
0ar
row
toot
hflo
unde
r0
00
00
00
00
00
00
0re
xso
le-a
dult
00
00
00
013
.50
00
00
0-ju
veni
le0
00
0I)
00
00
00
00
0fa
thea
dco
le10
.35
00
00
00
4.5
00
00
00
rock
sole
-ad
ult
00
00
270
4.5
22.5
00
00
00
-juve
nile
00
00
00
4.5
00
00
00
0sl
ende
rso
le-
adul
t22
.59
12.1
50
09
09
00
04.
59
0-ju
venf
e0
01.
350
4.5
4.5
00
00
00
00
Dov
erso
le-
adul
t3.
1530
.15
180
04.
50
4.5
120
4.5
1827
18-ju
veni
le0
1.35
3.15
00
00
00
00
4.5
00
Eng
lish
sole
-ad
ult
129.
1555
.35
13.5
4.5
67.5
126
999
1827
00
22.5
22.5
-juve
nile
00
00
00
00
00
00
00
star
ryfo
unde
r0
00
00
04.
50
00
00
00
CO
eds
00
00
00
00
00
00
00
sand
sole
00
00
00
00
00
00
00
TOT.
FLA
TFiS
H/H
a1
65
.15
99_O
S4
51
54_
a1
03
.51
44
271
53
304
95
4.5
275
8.5
40
.5
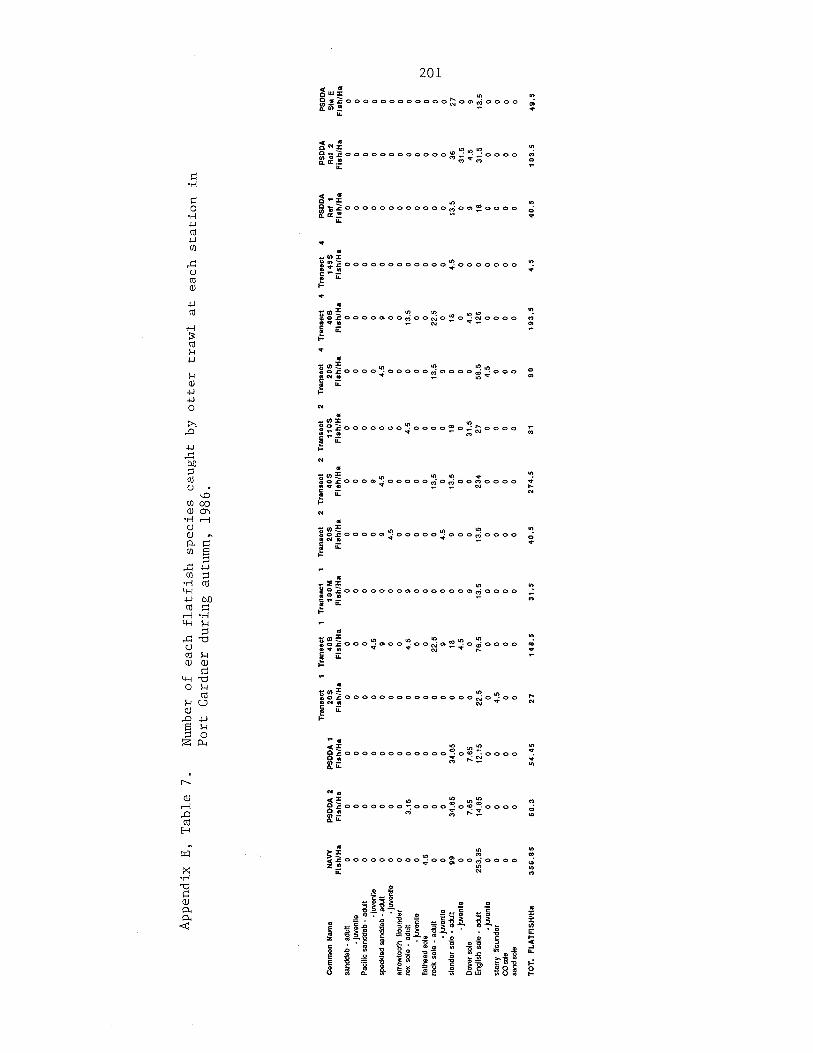
Ap
pe
nd
ixE
,T
ab
le7
.N
umbe
ro
fe
ach
fla
tfis
hsp
ecie
sca
ug
ht
by
ott
er
tra
wl
at
ea
chsta
tio
nin
Po
rtG
ard
ne
rd
urin
ga
utu
mn
,1
98
6.
Tra
nsec
tI
Tra
nsec
tI
Tra
nsec
t1
Tra
nsec
t2
Tra
nsec
t2
Tra
nsec
t2
Tra
nsec
t4
Tra
nsec
t4
Tra
nsec
t4
PS
DD
AP
SD
DA
P50
0AC
omm
onN
ame
NAV
YP
SD
DA
2P
SD
DA
12
00
40S
lOO
M20
540
Slb
S2
0$
405
14
55
Ref
1R
ef2
Sta
EF
ish
/Ha
Fis
h/H
aF
ish
/Ha
Fis
h/H
aF
ish
/Ha
Fis
h/H
aF
ish
/Ha
Fis
h/H
aF
ish
/Ha
Fis
h/H
aF
ish
/Ha
Fis
h/H
aF
ish
/Ha
Fis
h/H
aF
ish
/Ha
sand
dab-
adul
t0
00
00
00
00
00
00
00
-juve
nile
00
00
00
00
00
00
00
0P
acili
csa
ndda
b-
adul
t0
00
00
00
00
00
00
00
-juve
nIle
00
00
4.5
00
90
00
00
00
spec
kled
sand
dab
-ad
ult
00
00
90
94.
50
4.5
90
00
0-ju
veni
le0
00
00
04.
50
00
00
00
0ar
row
toot
hflo
unde
r0
00
00
00
00
00
00
00
rex
sole
adul
t0
3.15
00
4.5
90
04.
50
13.5
00
00
-juve
nile
00
00
00
00
00
00
00
0lla
thea
dsol
e4.
50
00
00
00
00
00
00
0ro
ckso
le-
adul
t0
00
022
.50
013
.50
13.5
22.5
00
00
-juve
nile
00
00
90
4.5
00
90
00
00
slen
der
sole
-ad
ult
9934
.65
34.6
50
180
913
.518
018
4.5
13.5
3627
-juve
nile
00
00
4.5
00
00
00
00
31.5
0D
over
sole
07.
657.
650
09
00
31.5
04.
50
94.
59
Engl
Ish
sole
-ad
ult
253.
3514
.85
12.1
522
.576
.513
.513
.523
427
58.5
126
018
31.5
13.5
-juve
nile
00
00
00
00
04.
50
00
00
star
ryS
ound
er0
00
4.5
00
00
00
00
00
0C
Oed
e0
00
00
00
00
00
00
00
sand
sole
00
00
00
00
00
00
00
0
TOT.
FLA
TFiS
H/H
a3
56
.85
60
.35
4.4
527
14
85
31
.54
0.5
27
4.5
8190
19
3.5
45
40
.51
03
54
8.5
Related Documents


